Zip Codes with the Highest Percentage of Population Employed in Food Preparation & Serving in Duncanville, TX
RELATED REPORTS & OPTIONS
Food Preparation & Serving
Duncanville
Compare Zip Codes
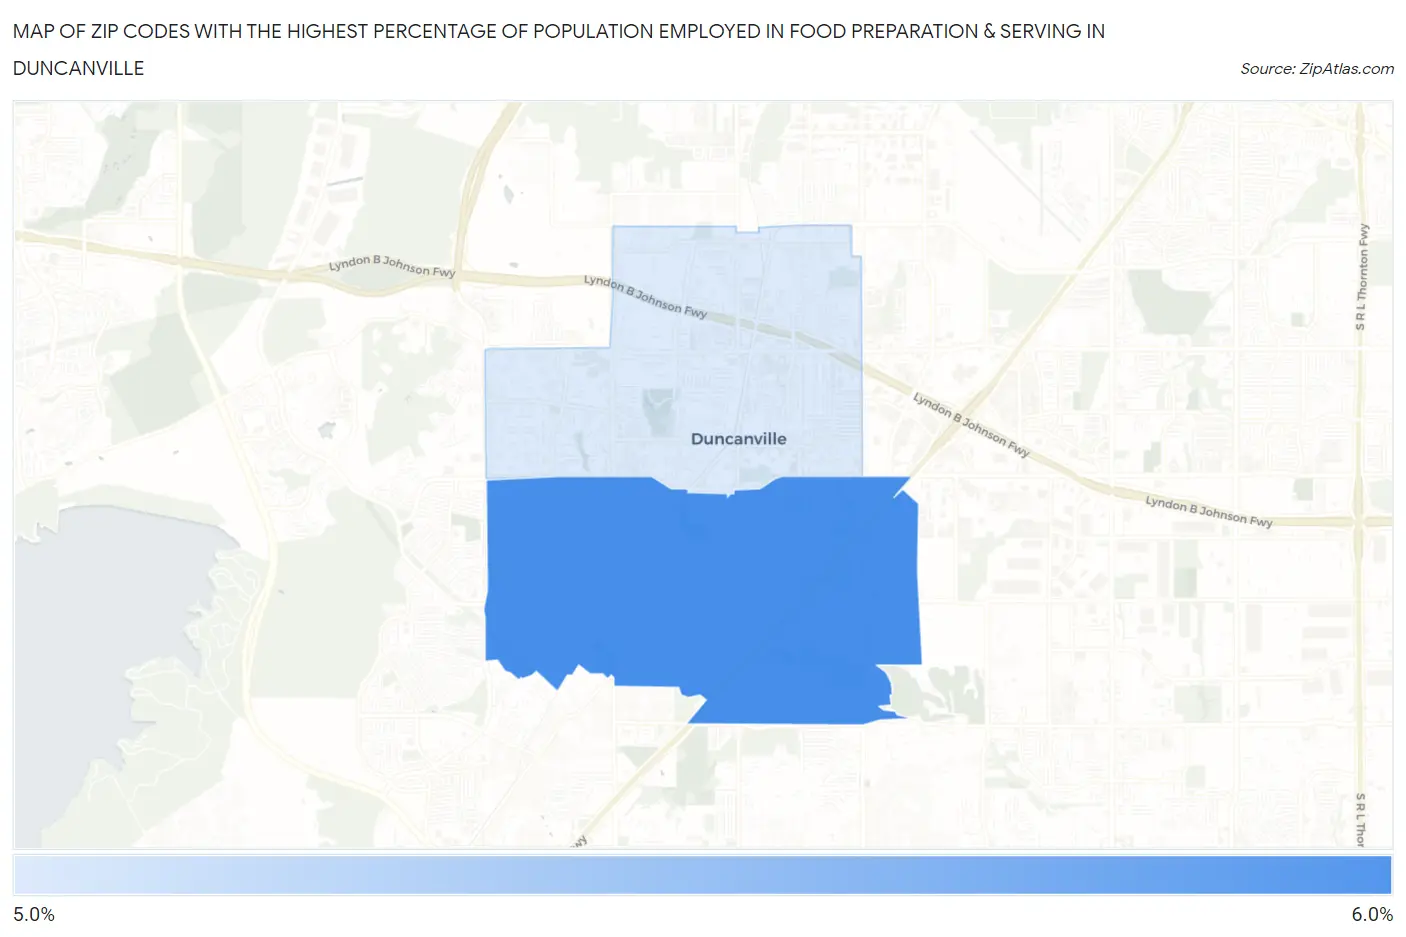
Map of Zip Codes with the Highest Percentage of Population Employed in Food Preparation & Serving in Duncanville
5.6%
5.9%
Zip Codes with the Highest Percentage of Population Employed in Food Preparation & Serving in Duncanville, TX
| Zip Code | % Employed | vs State | vs National | |
| 1. | 75137 | 5.9% | 5.4%(+0.562)#587 | 5.3%(+0.627)#9,630 |
| 2. | 75116 | 5.6% | 5.4%(+0.231)#652 | 5.3%(+0.296)#10,767 |
1
Common Questions
What are the Top Zip Codes with the Highest Percentage of Population Employed in Food Preparation & Serving in Duncanville, TX?
Top Zip Codes with the Highest Percentage of Population Employed in Food Preparation & Serving in Duncanville, TX are:
What zip code has the Highest Percentage of Population Employed in Food Preparation & Serving in Duncanville, TX?
75137 has the Highest Percentage of Population Employed in Food Preparation & Serving in Duncanville, TX with 5.9%.
What is the Percentage of Population Employed in Food Preparation & Serving in Duncanville, TX?
Percentage of Population Employed in Food Preparation & Serving in Duncanville is 5.7%.
What is the Percentage of Population Employed in Food Preparation & Serving in Texas?
Percentage of Population Employed in Food Preparation & Serving in Texas is 5.4%.
What is the Percentage of Population Employed in Food Preparation & Serving in the United States?
Percentage of Population Employed in Food Preparation & Serving in the United States is 5.3%.