Timpson, TX Map & Demographics
Timpson Map
Timpson Overview
$18,999
PER CAPITA INCOME
$50,500
AVG FAMILY INCOME
$37,500
AVG HOUSEHOLD INCOME
55.0%
WAGE / INCOME GAP [ % ]
45.0¢/ $1
WAGE / INCOME GAP [ $ ]
0.45
INEQUALITY / GINI INDEX
1,204
TOTAL POPULATION
565
MALE POPULATION
639
FEMALE POPULATION
88.42
MALES / 100 FEMALES
113.10
FEMALES / 100 MALES
37.1
MEDIAN AGE
3.6
AVG FAMILY SIZE
2.5
AVG HOUSEHOLD SIZE
447
LABOR FORCE [ PEOPLE ]
50.2%
PERCENT IN LABOR FORCE
3.1%
UNEMPLOYMENT RATE
Timpson Zip Codes
Timpson Area Codes
Income in Timpson
Income Overview in Timpson
Per Capita Income in Timpson is $18,999, while median incomes of families and households are $50,500 and $37,500 respectively.
| Characteristic | Number | Measure |
| Per Capita Income | 1,204 | $18,999 |
| Median Family Income | 272 | $50,500 |
| Mean Family Income | 272 | $59,012 |
| Median Household Income | 478 | $37,500 |
| Mean Household Income | 478 | $44,939 |
| Income Deficit | 272 | $0 |
| Wage / Income Gap (%) | 1,204 | 55.01% |
| Wage / Income Gap ($) | 1,204 | 44.99¢ per $1 |
| Gini / Inequality Index | 1,204 | 0.45 |
Earnings by Sex in Timpson
Average Earnings in Timpson are $20,500, $32,647 for men and $14,688 for women, a difference of 55.0%.
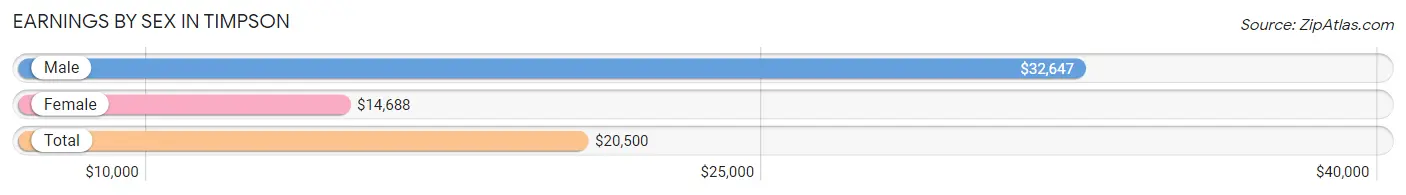
| Sex | Number | Average Earnings |
| Male | 274 (60.4%) | $32,647 |
| Female | 180 (39.7%) | $14,688 |
| Total | 454 (100.0%) | $20,500 |
Earnings by Sex by Income Bracket in Timpson
The most common earnings brackets in Timpson are $12,500 to $14,999 for men (67 | 24.4%) and $10,000 to $12,499 for women (32 | 17.8%).
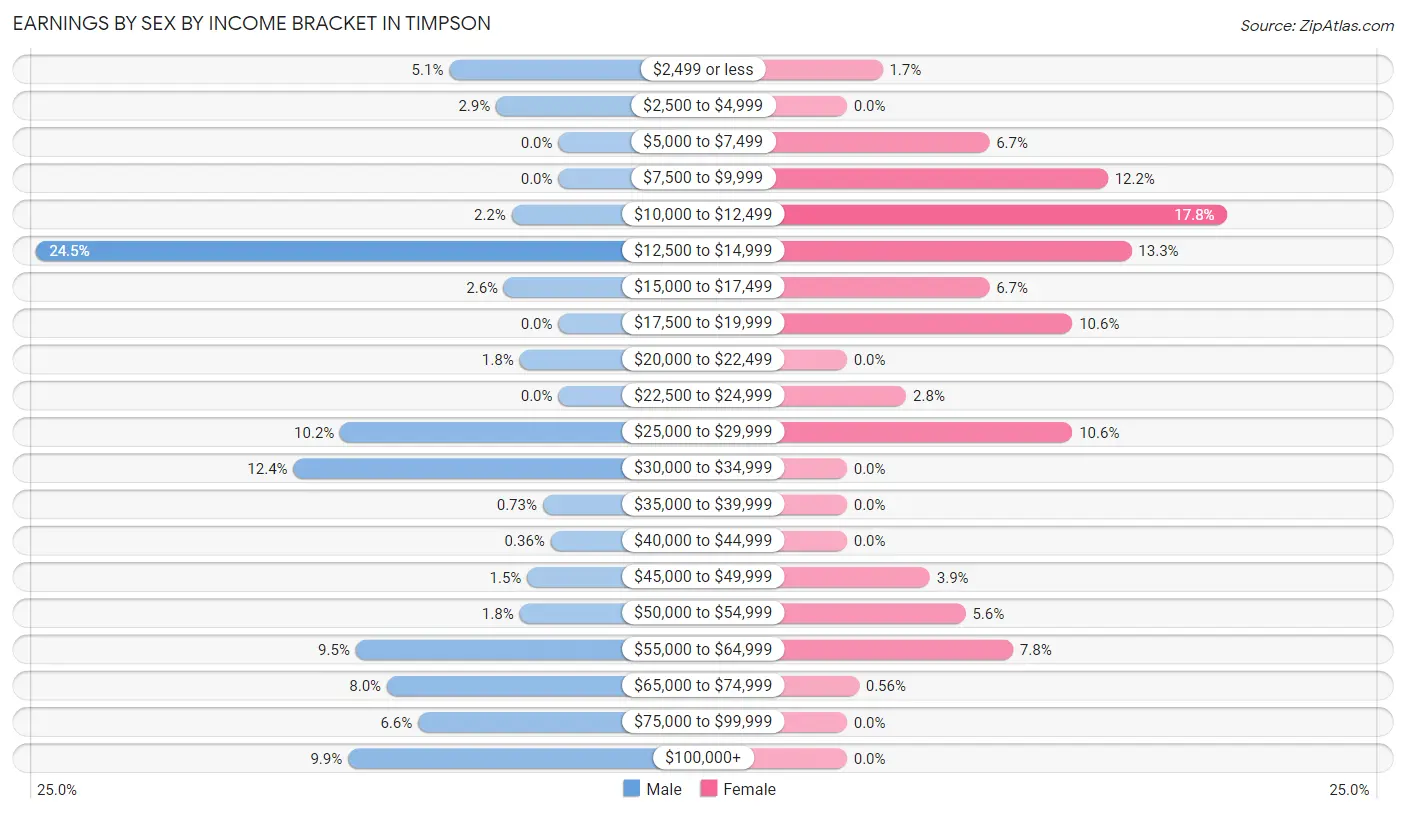
| Income | Male | Female |
| $2,499 or less | 14 (5.1%) | 3 (1.7%) |
| $2,500 to $4,999 | 8 (2.9%) | 0 (0.0%) |
| $5,000 to $7,499 | 0 (0.0%) | 12 (6.7%) |
| $7,500 to $9,999 | 0 (0.0%) | 22 (12.2%) |
| $10,000 to $12,499 | 6 (2.2%) | 32 (17.8%) |
| $12,500 to $14,999 | 67 (24.4%) | 24 (13.3%) |
| $15,000 to $17,499 | 7 (2.5%) | 12 (6.7%) |
| $17,500 to $19,999 | 0 (0.0%) | 19 (10.6%) |
| $20,000 to $22,499 | 5 (1.8%) | 0 (0.0%) |
| $22,500 to $24,999 | 0 (0.0%) | 5 (2.8%) |
| $25,000 to $29,999 | 28 (10.2%) | 19 (10.6%) |
| $30,000 to $34,999 | 34 (12.4%) | 0 (0.0%) |
| $35,000 to $39,999 | 2 (0.7%) | 0 (0.0%) |
| $40,000 to $44,999 | 1 (0.4%) | 0 (0.0%) |
| $45,000 to $49,999 | 4 (1.5%) | 7 (3.9%) |
| $50,000 to $54,999 | 5 (1.8%) | 10 (5.6%) |
| $55,000 to $64,999 | 26 (9.5%) | 14 (7.8%) |
| $65,000 to $74,999 | 22 (8.0%) | 1 (0.6%) |
| $75,000 to $99,999 | 18 (6.6%) | 0 (0.0%) |
| $100,000+ | 27 (9.9%) | 0 (0.0%) |
| Total | 274 (100.0%) | 180 (100.0%) |
Earnings by Sex by Educational Attainment in Timpson
Average earnings in Timpson are $34,596 for men and $14,545 for women, a difference of 58.0%. Men with an educational attainment of college or associate's degree enjoy the highest average annual earnings of $46,250, while those with bachelor's degree education earn the least with $33,676. Women with an educational attainment of bachelor's degree earn the most with the average annual earnings of $60,729, while those with high school diploma education have the smallest earnings of $10,536.
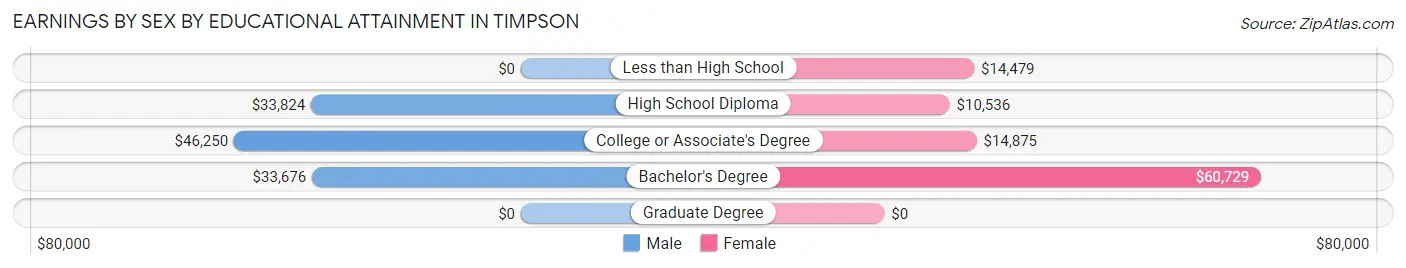
| Educational Attainment | Male Income | Female Income |
| Less than High School | - | - |
| High School Diploma | $33,824 | $10,536 |
| College or Associate's Degree | $46,250 | $14,875 |
| Bachelor's Degree | $33,676 | $60,729 |
| Graduate Degree | - | - |
| Total | $34,596 | $14,545 |
Family Income in Timpson
Family Income Brackets in Timpson
According to the Timpson family income data, there are 81 families falling into the $50,000 to $74,999 income range, which is the most common income bracket and makes up 29.8% of all families.
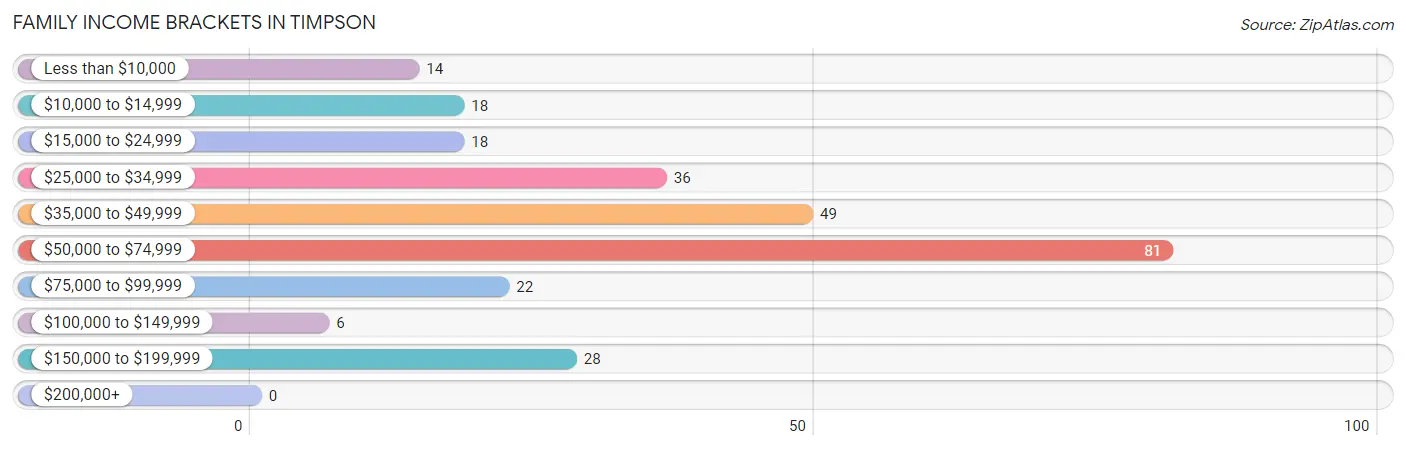
| Income Bracket | # Families | % Families |
| Less than $10,000 | 14 | 5.1% |
| $10,000 to $14,999 | 18 | 6.6% |
| $15,000 to $24,999 | 18 | 6.6% |
| $25,000 to $34,999 | 36 | 13.2% |
| $35,000 to $49,999 | 49 | 18.0% |
| $50,000 to $74,999 | 81 | 29.8% |
| $75,000 to $99,999 | 22 | 8.1% |
| $100,000 to $149,999 | 6 | 2.2% |
| $150,000 to $199,999 | 28 | 10.3% |
| $200,000+ | 0 | 0.0% |
Family Income by Famaliy Size in Timpson
5-person families (47 | 17.3%) account for the highest median family income in Timpson with $70,481 per family, while 2-person families (88 | 32.4%) have the highest median income of $19,766 per family member.
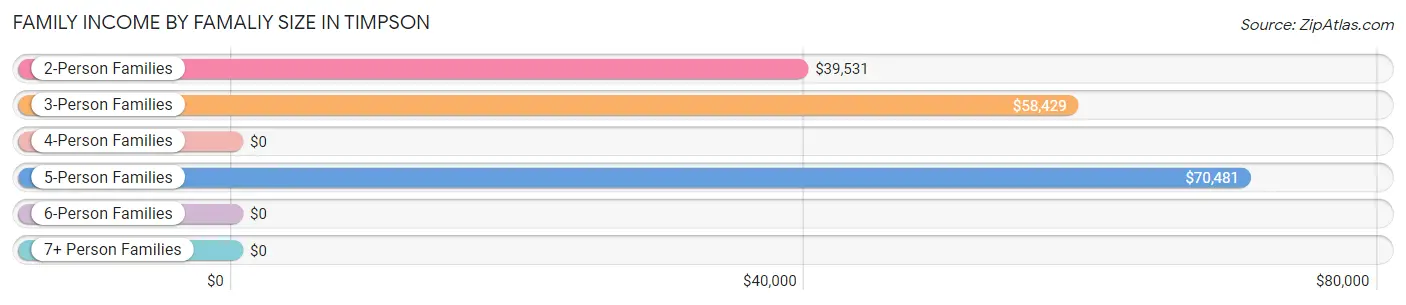
| Income Bracket | # Families | Median Income |
| 2-Person Families | 88 (32.4%) | $39,531 |
| 3-Person Families | 74 (27.2%) | $58,429 |
| 4-Person Families | 60 (22.1%) | $0 |
| 5-Person Families | 47 (17.3%) | $70,481 |
| 6-Person Families | 1 (0.4%) | $0 |
| 7+ Person Families | 2 (0.7%) | $0 |
| Total | 272 (100.0%) | $50,500 |
Family Income by Number of Earners in Timpson
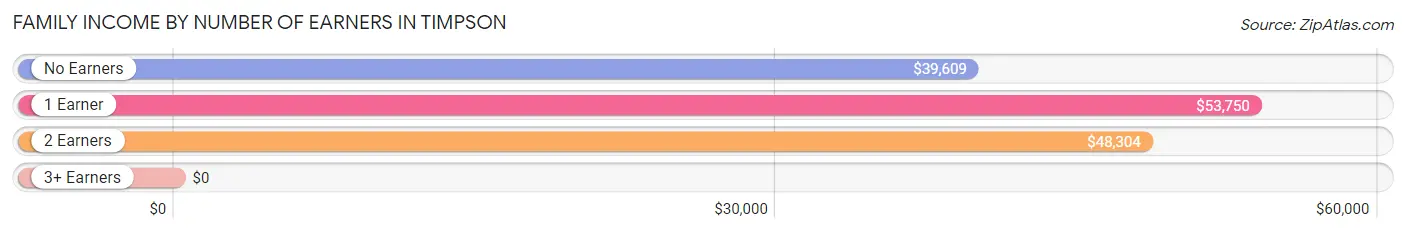
| Number of Earners | # Families | Median Income |
| No Earners | 49 (18.0%) | $39,609 |
| 1 Earner | 122 (44.9%) | $53,750 |
| 2 Earners | 89 (32.7%) | $48,304 |
| 3+ Earners | 12 (4.4%) | $0 |
| Total | 272 (100.0%) | $50,500 |
Household Income in Timpson
Household Income Brackets in Timpson
With 95 households falling in the category, the $50,000 to $74,999 income range is the most frequent in Timpson, accounting for 19.9% of all households.
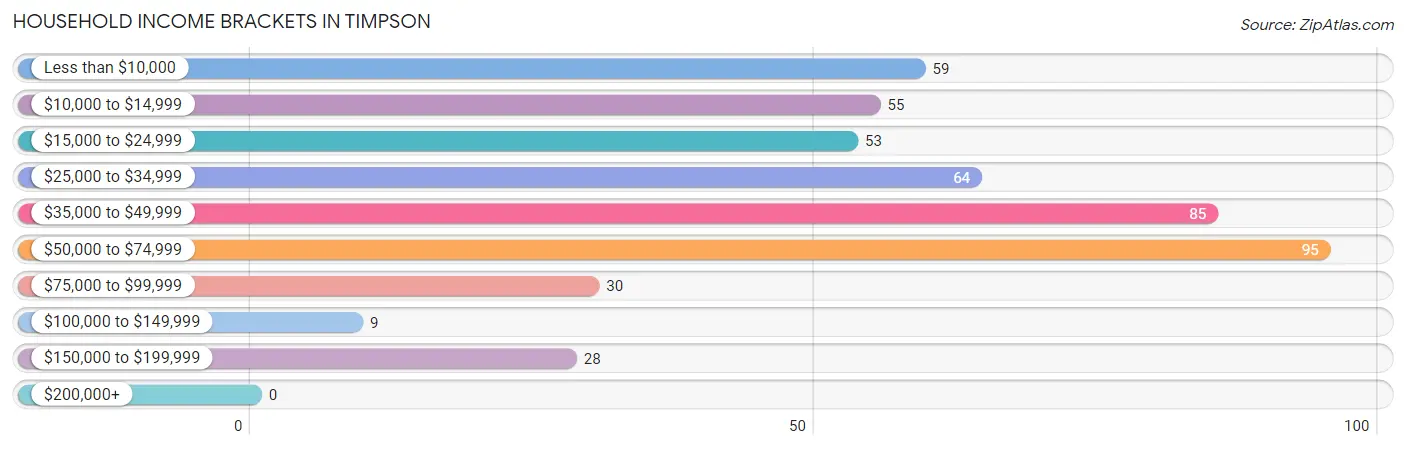
| Income Bracket | # Households | % Households |
| Less than $10,000 | 59 | 12.3% |
| $10,000 to $14,999 | 55 | 11.5% |
| $15,000 to $24,999 | 53 | 11.1% |
| $25,000 to $34,999 | 64 | 13.4% |
| $35,000 to $49,999 | 85 | 17.8% |
| $50,000 to $74,999 | 95 | 19.9% |
| $75,000 to $99,999 | 30 | 6.3% |
| $100,000 to $149,999 | 9 | 1.9% |
| $150,000 to $199,999 | 28 | 5.9% |
| $200,000+ | 0 | 0.0% |
Household Income by Householder Age in Timpson
The median household income in Timpson is $37,500, with the highest median household income of $46,875 found in the 45 to 64 years age bracket for the primary householder. A total of 184 households (38.5%) fall into this category. Meanwhile, the 15 to 24 years age bracket for the primary householder has the lowest median household income of $0, with 12 households (2.5%) in this group.
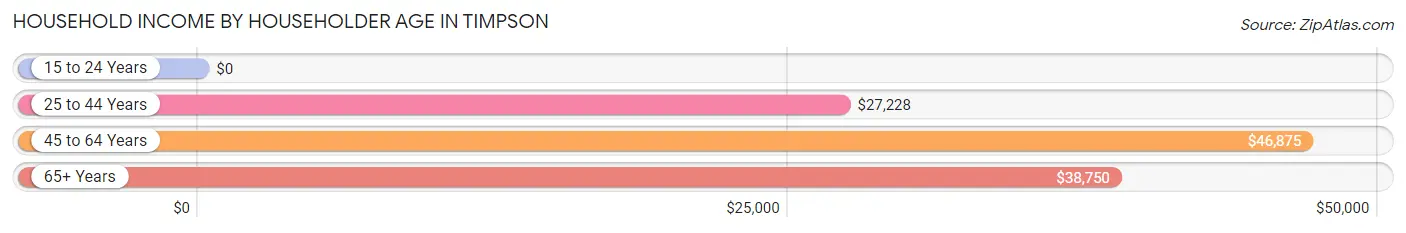
| Income Bracket | # Households | Median Income |
| 15 to 24 Years | 12 (2.5%) | $0 |
| 25 to 44 Years | 135 (28.2%) | $27,228 |
| 45 to 64 Years | 184 (38.5%) | $46,875 |
| 65+ Years | 147 (30.7%) | $38,750 |
| Total | 478 (100.0%) | $37,500 |
Poverty in Timpson
Income Below Poverty by Sex and Age in Timpson
With 21.6% poverty level for males and 36.0% for females among the residents of Timpson, 6 to 11 year old males and 15 year old females are the most vulnerable to poverty, with 39 males (60.0%) and 9 females (100.0%) in their respective age groups living below the poverty level.
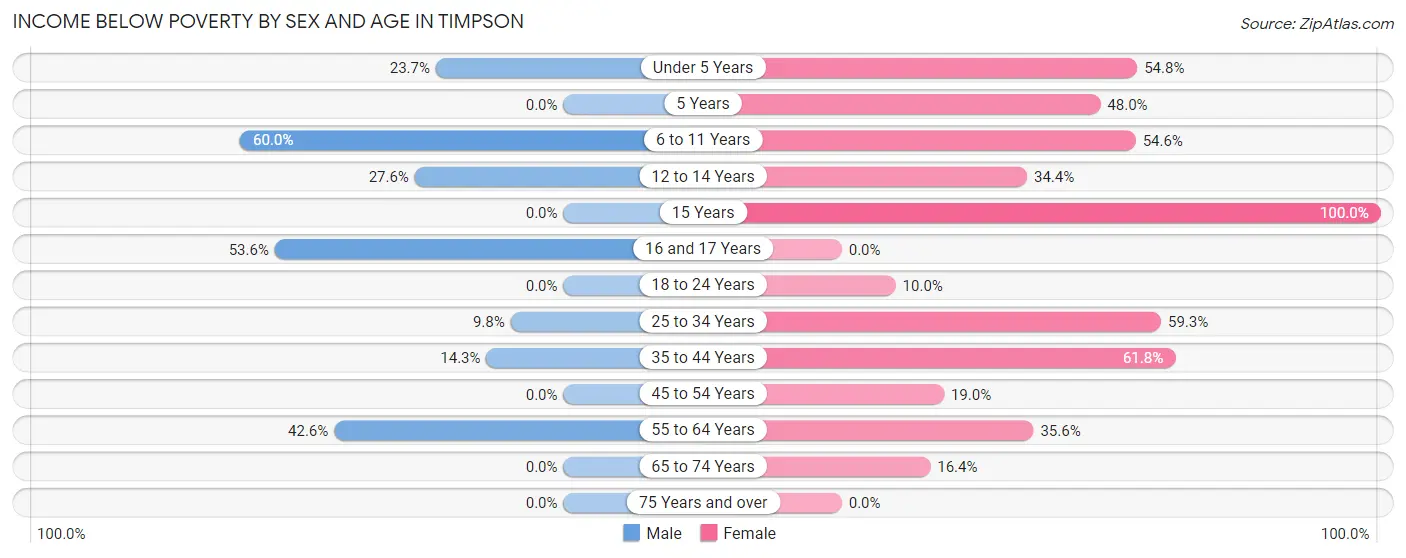
| Age Bracket | Male | Female |
| Under 5 Years | 9 (23.7%) | 34 (54.8%) |
| 5 Years | 0 (0.0%) | 12 (48.0%) |
| 6 to 11 Years | 39 (60.0%) | 24 (54.5%) |
| 12 to 14 Years | 8 (27.6%) | 11 (34.4%) |
| 15 Years | 0 (0.0%) | 9 (100.0%) |
| 16 and 17 Years | 15 (53.6%) | 0 (0.0%) |
| 18 to 24 Years | 0 (0.0%) | 2 (10.0%) |
| 25 to 34 Years | 5 (9.8%) | 32 (59.3%) |
| 35 to 44 Years | 6 (14.3%) | 47 (61.8%) |
| 45 to 54 Years | 0 (0.0%) | 11 (19.0%) |
| 55 to 64 Years | 40 (42.5%) | 37 (35.6%) |
| 65 to 74 Years | 0 (0.0%) | 11 (16.4%) |
| 75 Years and over | 0 (0.0%) | 0 (0.0%) |
| Total | 122 (21.6%) | 230 (36.0%) |
Income Above Poverty by Sex and Age in Timpson
According to the poverty statistics in Timpson, males aged 15 years and females aged 16 and 17 years are the age groups that are most secure financially, with 100.0% of males and 100.0% of females in these age groups living above the poverty line.
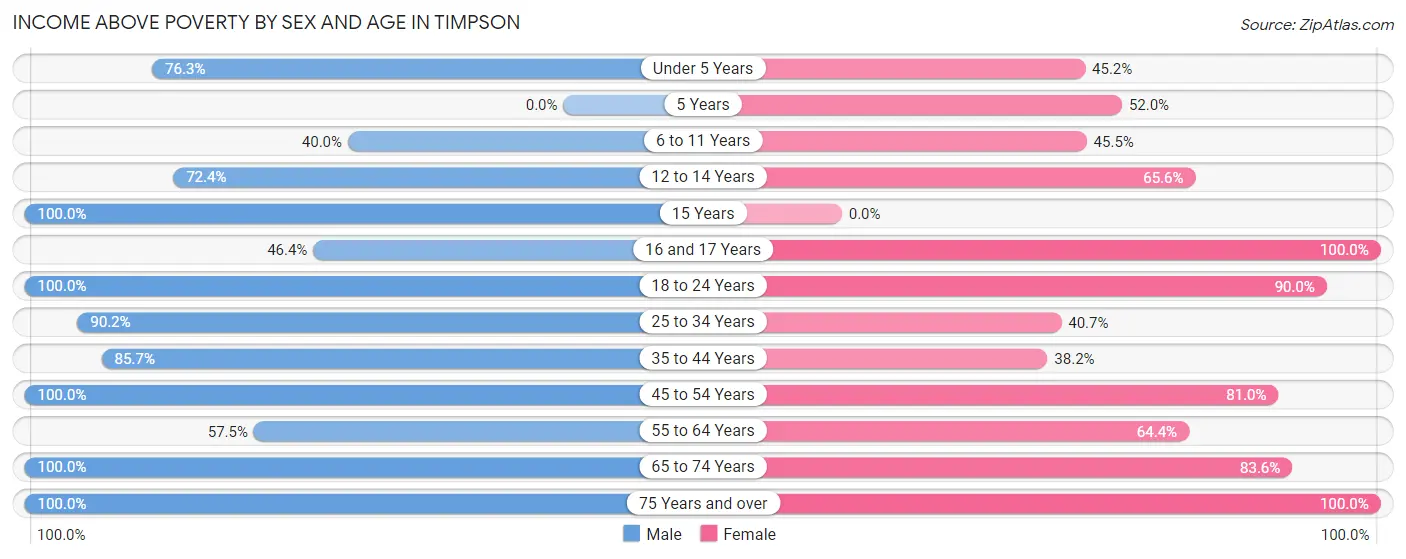
| Age Bracket | Male | Female |
| Under 5 Years | 29 (76.3%) | 28 (45.2%) |
| 5 Years | 0 (0.0%) | 13 (52.0%) |
| 6 to 11 Years | 26 (40.0%) | 20 (45.5%) |
| 12 to 14 Years | 21 (72.4%) | 21 (65.6%) |
| 15 Years | 9 (100.0%) | 0 (0.0%) |
| 16 and 17 Years | 13 (46.4%) | 26 (100.0%) |
| 18 to 24 Years | 104 (100.0%) | 18 (90.0%) |
| 25 to 34 Years | 46 (90.2%) | 22 (40.7%) |
| 35 to 44 Years | 36 (85.7%) | 29 (38.2%) |
| 45 to 54 Years | 58 (100.0%) | 47 (81.0%) |
| 55 to 64 Years | 54 (57.5%) | 67 (64.4%) |
| 65 to 74 Years | 41 (100.0%) | 56 (83.6%) |
| 75 Years and over | 6 (100.0%) | 62 (100.0%) |
| Total | 443 (78.4%) | 409 (64.0%) |
Income Below Poverty Among Married-Couple Families in Timpson
The poverty statistics for married-couple families in Timpson show that 10.7% or 16 of the total 149 families live below the poverty line. Families with 3 or 4 children have the highest poverty rate of 30.8%, comprising of 4 families. On the other hand, families with no children have the lowest poverty rate of 0.0%, which includes 0 families.
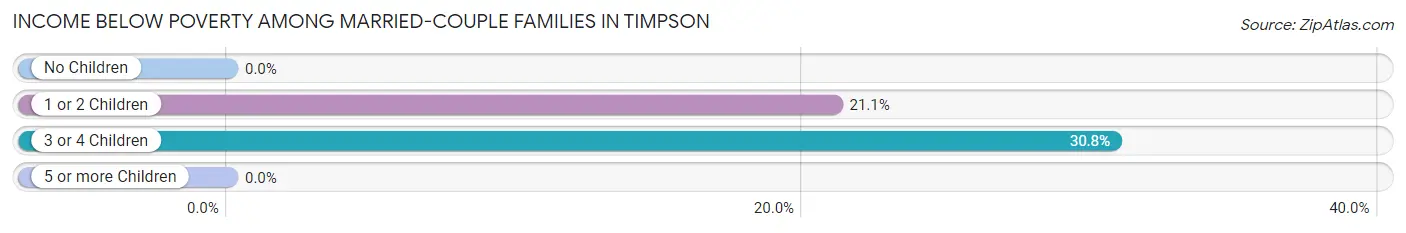
| Children | Above Poverty | Below Poverty |
| No Children | 79 (100.0%) | 0 (0.0%) |
| 1 or 2 Children | 45 (78.9%) | 12 (21.0%) |
| 3 or 4 Children | 9 (69.2%) | 4 (30.8%) |
| 5 or more Children | 0 (0.0%) | 0 (0.0%) |
| Total | 133 (89.3%) | 16 (10.7%) |
Income Below Poverty Among Single-Parent Households in Timpson
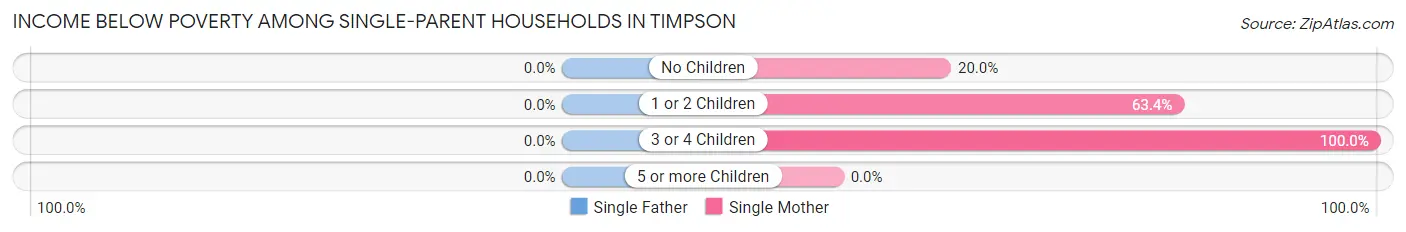
| Children | Single Father | Single Mother |
| No Children | 0 (0.0%) | 6 (20.0%) |
| 1 or 2 Children | 0 (0.0%) | 26 (63.4%) |
| 3 or 4 Children | 0 (0.0%) | 16 (100.0%) |
| 5 or more Children | 0 (0.0%) | 0 (0.0%) |
| Total | 0 (0.0%) | 48 (55.2%) |
Income Below Poverty Among Married-Couple vs Single-Parent Households in Timpson
The poverty data for Timpson shows that 16 of the married-couple family households (10.7%) and 48 of the single-parent households (39.0%) are living below the poverty level. Within the married-couple family households, those with 3 or 4 children have the highest poverty rate, with 4 households (30.8%) falling below the poverty line. Among the single-parent households, those with 3 or 4 children have the highest poverty rate, with 16 household (100.0%) living below poverty.
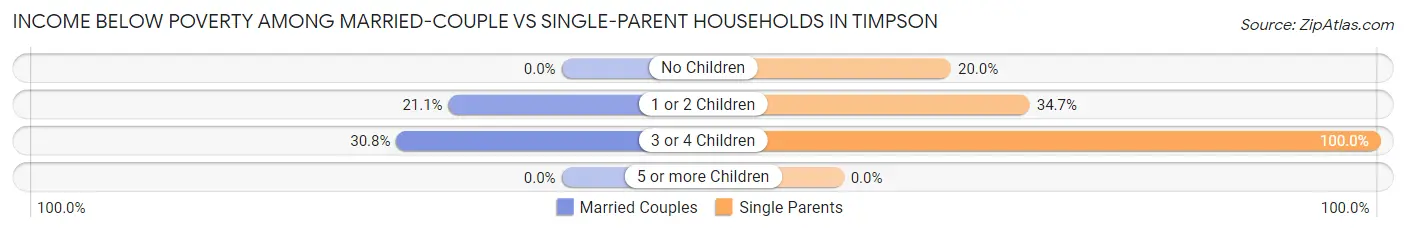
| Children | Married-Couple Families | Single-Parent Households |
| No Children | 0 (0.0%) | 6 (20.0%) |
| 1 or 2 Children | 12 (21.0%) | 26 (34.7%) |
| 3 or 4 Children | 4 (30.8%) | 16 (100.0%) |
| 5 or more Children | 0 (0.0%) | 0 (0.0%) |
| Total | 16 (10.7%) | 48 (39.0%) |
Race in Timpson
The most populous races in Timpson are White / Caucasian (695 | 57.7%), Black / African American (413 | 34.3%), and Two or more Races (79 | 6.6%).
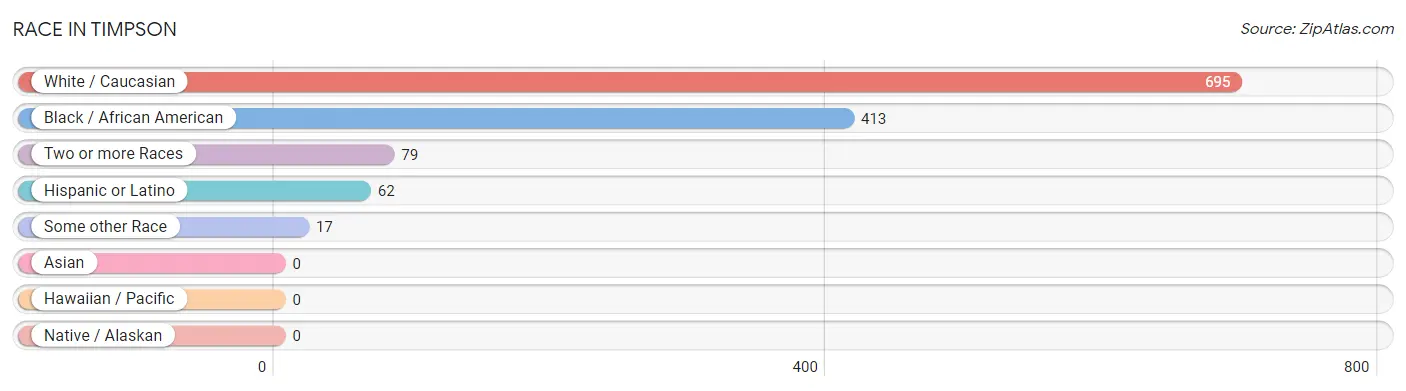
| Race | # Population | % Population |
| Asian | 0 | 0.0% |
| Black / African American | 413 | 34.3% |
| Hawaiian / Pacific | 0 | 0.0% |
| Hispanic or Latino | 62 | 5.1% |
| Native / Alaskan | 0 | 0.0% |
| White / Caucasian | 695 | 57.7% |
| Two or more Races | 79 | 6.6% |
| Some other Race | 17 | 1.4% |
| Total | 1,204 | 100.0% |
Ancestry in Timpson
The most populous ancestries reported in Timpson are American (286 | 23.7%), English (166 | 13.8%), Irish (130 | 10.8%), Mexican (62 | 5.1%), and French (43 | 3.6%), together accounting for 57.1% of all Timpson residents.
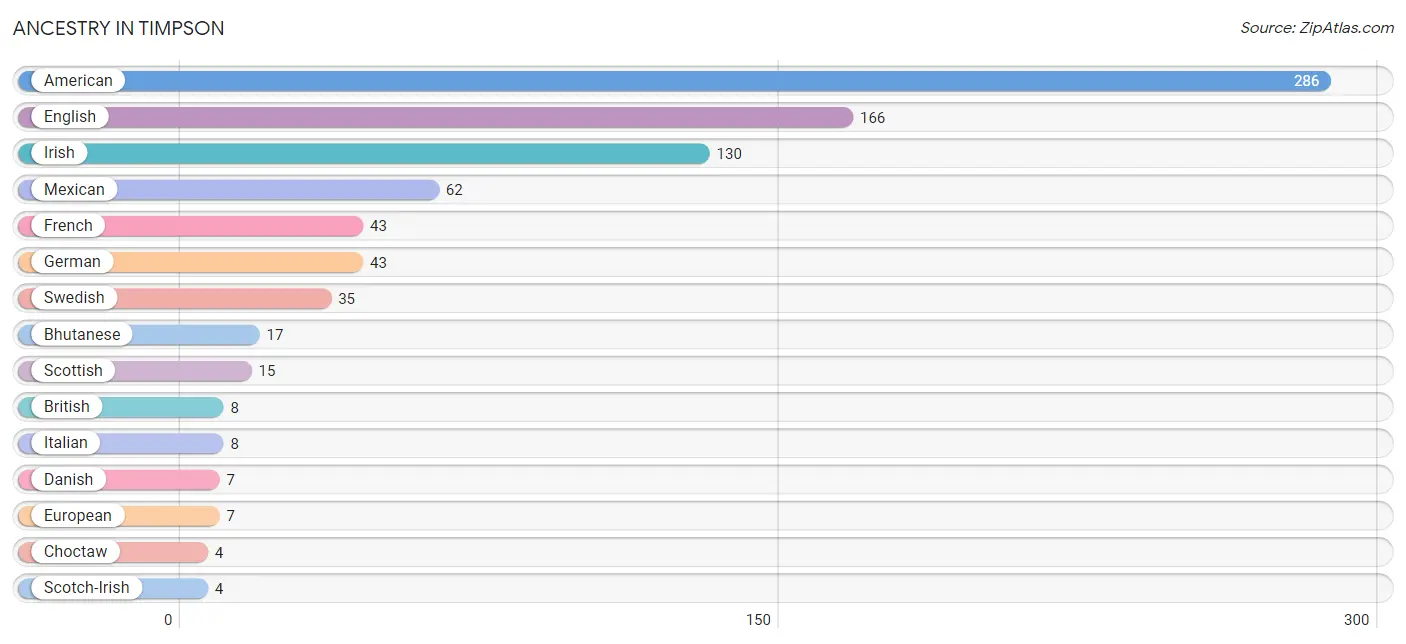
| Ancestry | # Population | % Population |
| American | 286 | 23.7% |
| Bhutanese | 17 | 1.4% |
| British | 8 | 0.7% |
| Choctaw | 4 | 0.3% |
| Danish | 7 | 0.6% |
| English | 166 | 13.8% |
| European | 7 | 0.6% |
| French | 43 | 3.6% |
| German | 43 | 3.6% |
| Irish | 130 | 10.8% |
| Italian | 8 | 0.7% |
| Mexican | 62 | 5.1% |
| Scotch-Irish | 4 | 0.3% |
| Scottish | 15 | 1.3% |
| Swedish | 35 | 2.9% |
| Welsh | 4 | 0.3% | View All 16 Rows |
Immigrants in Timpson
The most numerous immigrant groups reported in Timpson came from Central America (25 | 2.1%), Latin America (25 | 2.1%), and Mexico (25 | 2.1%), together accounting for 6.2% of all Timpson residents.
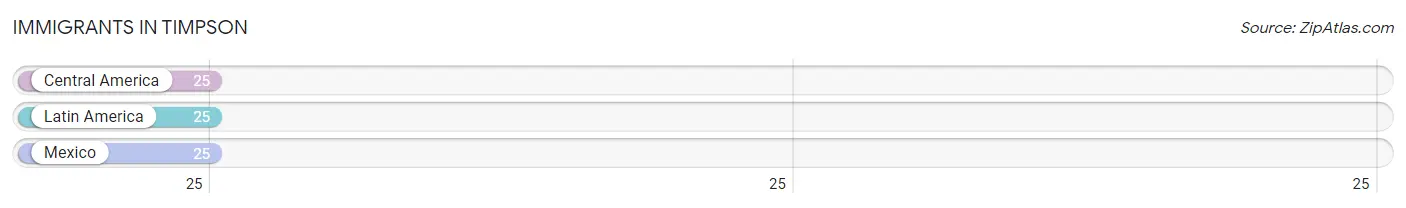
| Immigration Origin | # Population | % Population |
| Central America | 25 | 2.1% |
| Latin America | 25 | 2.1% |
| Mexico | 25 | 2.1% | View All 3 Rows |
Sex and Age in Timpson
Sex and Age in Timpson
The most populous age groups in Timpson are 15 to 19 Years (96 | 17.0%) for men and 35 to 39 Years (74 | 11.6%) for women.
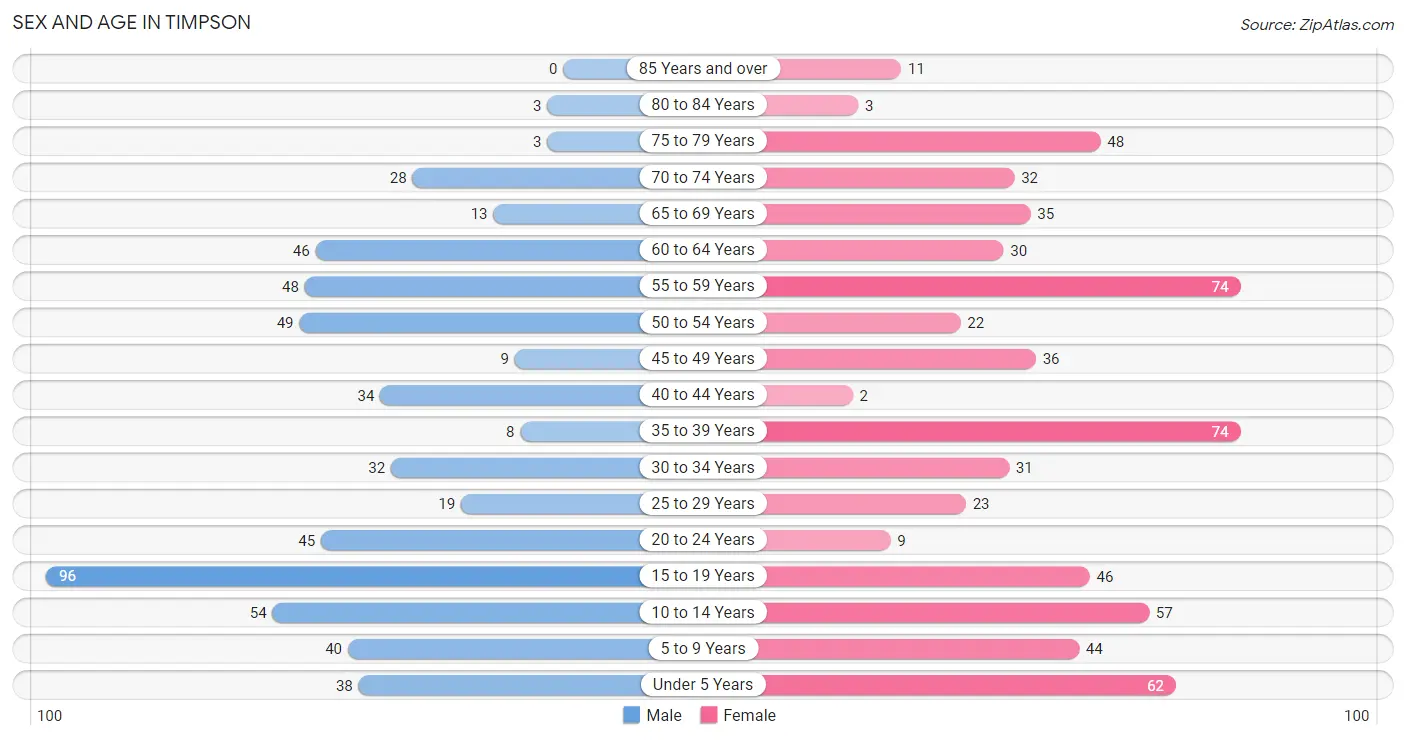
| Age Bracket | Male | Female |
| Under 5 Years | 38 (6.7%) | 62 (9.7%) |
| 5 to 9 Years | 40 (7.1%) | 44 (6.9%) |
| 10 to 14 Years | 54 (9.6%) | 57 (8.9%) |
| 15 to 19 Years | 96 (17.0%) | 46 (7.2%) |
| 20 to 24 Years | 45 (8.0%) | 9 (1.4%) |
| 25 to 29 Years | 19 (3.4%) | 23 (3.6%) |
| 30 to 34 Years | 32 (5.7%) | 31 (4.9%) |
| 35 to 39 Years | 8 (1.4%) | 74 (11.6%) |
| 40 to 44 Years | 34 (6.0%) | 2 (0.3%) |
| 45 to 49 Years | 9 (1.6%) | 36 (5.6%) |
| 50 to 54 Years | 49 (8.7%) | 22 (3.4%) |
| 55 to 59 Years | 48 (8.5%) | 74 (11.6%) |
| 60 to 64 Years | 46 (8.1%) | 30 (4.7%) |
| 65 to 69 Years | 13 (2.3%) | 35 (5.5%) |
| 70 to 74 Years | 28 (5.0%) | 32 (5.0%) |
| 75 to 79 Years | 3 (0.5%) | 48 (7.5%) |
| 80 to 84 Years | 3 (0.5%) | 3 (0.5%) |
| 85 Years and over | 0 (0.0%) | 11 (1.7%) |
| Total | 565 (100.0%) | 639 (100.0%) |
Families and Households in Timpson
Median Family Size in Timpson
The median family size in Timpson is 3.57 persons per family, with married-couple families (149 | 54.8%) accounting for the largest median family size of 3.83 persons per family. On the other hand, single female/mother families (87 | 32.0%) represent the smallest median family size with 3.13 persons per family.
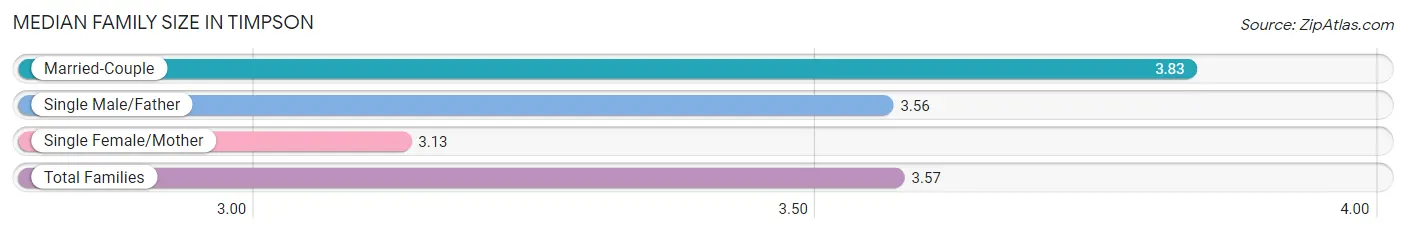
| Family Type | # Families | Family Size |
| Married-Couple | 149 (54.8%) | 3.83 |
| Single Male/Father | 36 (13.2%) | 3.56 |
| Single Female/Mother | 87 (32.0%) | 3.13 |
| Total Families | 272 (100.0%) | 3.57 |
Median Household Size in Timpson
The median household size in Timpson is 2.52 persons per household, with married-couple households (149 | 31.2%) accounting for the largest median household size of 3.89 persons per household. non-family households (206 | 43.1%) represent the smallest median household size with 1.09 persons per household.
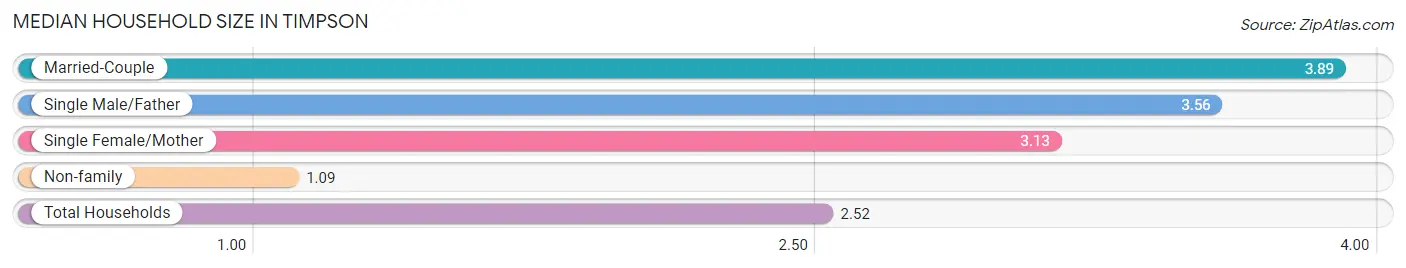
| Household Type | # Households | Household Size |
| Married-Couple | 149 (31.2%) | 3.89 |
| Single Male/Father | 36 (7.5%) | 3.56 |
| Single Female/Mother | 87 (18.2%) | 3.13 |
| Non-family | 206 (43.1%) | 1.09 |
| Total Households | 478 (100.0%) | 2.52 |
Household Size by Marriage Status in Timpson
Out of a total of 478 households in Timpson, 272 (56.9%) are family households, while 206 (43.1%) are nonfamily households. The most numerous type of family households are 3-person households, comprising 86, and the most common type of nonfamily households are 1-person households, comprising 188.
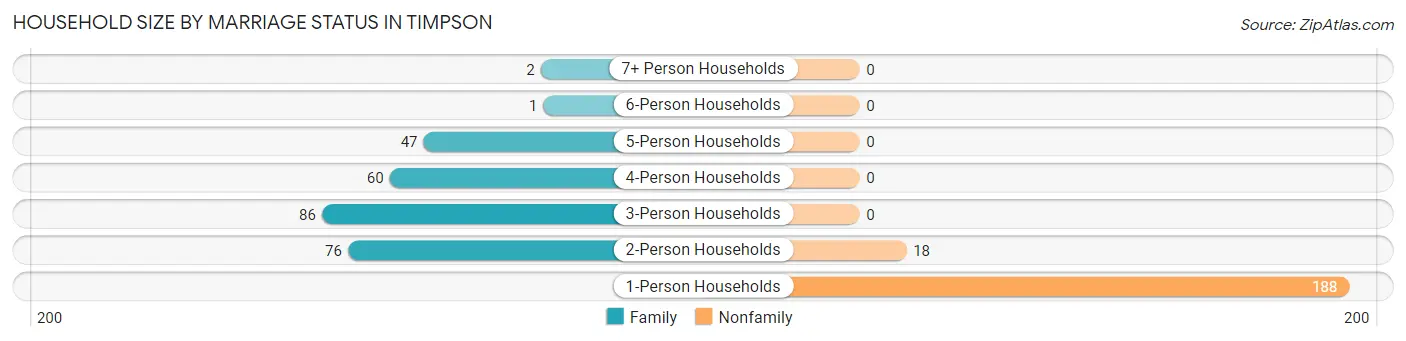
| Household Size | Family Households | Nonfamily Households |
| 1-Person Households | - | 188 (39.3%) |
| 2-Person Households | 76 (15.9%) | 18 (3.8%) |
| 3-Person Households | 86 (18.0%) | 0 (0.0%) |
| 4-Person Households | 60 (12.6%) | 0 (0.0%) |
| 5-Person Households | 47 (9.8%) | 0 (0.0%) |
| 6-Person Households | 1 (0.2%) | 0 (0.0%) |
| 7+ Person Households | 2 (0.4%) | 0 (0.0%) |
| Total | 272 (56.9%) | 206 (43.1%) |
Female Fertility in Timpson
Fertility by Age in Timpson
Average fertility rate in Timpson is 100.0 births per 1,000 women. Women in the age bracket of 35 to 50 years have the highest fertility rate with 134.0 births per 1,000 women. Women in the age bracket of 35 to 50 years acount for 68.2% of all women with births.
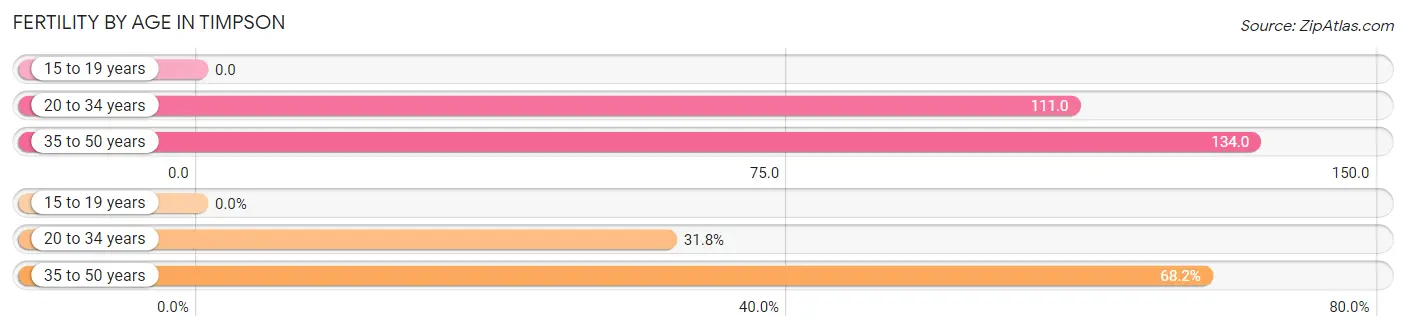
| Age Bracket | Women with Births | Births / 1,000 Women |
| 15 to 19 years | 0 (0.0%) | 0.0 |
| 20 to 34 years | 7 (31.8%) | 111.0 |
| 35 to 50 years | 15 (68.2%) | 134.0 |
| Total | 22 (100.0%) | 100.0 |
Fertility by Age by Marriage Status in Timpson
4.5% of women with births (22) in Timpson are married. The highest percentage of unmarried women with births falls into 20 to 34 years age bracket with 100.0% of them unmarried at the time of birth, while the lowest percentage of unmarried women with births belong to 35 to 50 years age bracket with 93.3% of them unmarried.
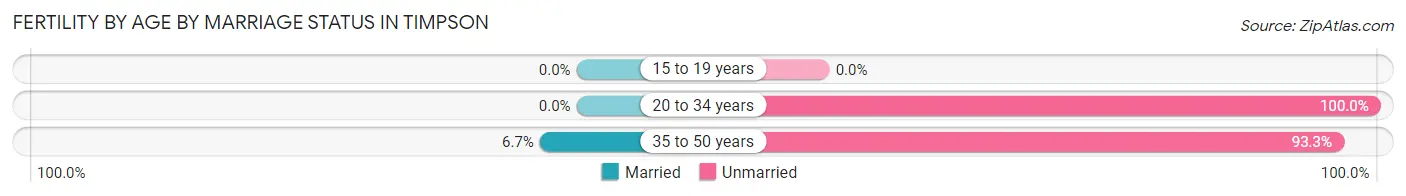
| Age Bracket | Married | Unmarried |
| 15 to 19 years | 0 (0.0%) | 0 (0.0%) |
| 20 to 34 years | 0 (0.0%) | 7 (100.0%) |
| 35 to 50 years | 1 (6.7%) | 14 (93.3%) |
| Total | 1 (4.5%) | 21 (95.5%) |
Fertility by Education in Timpson
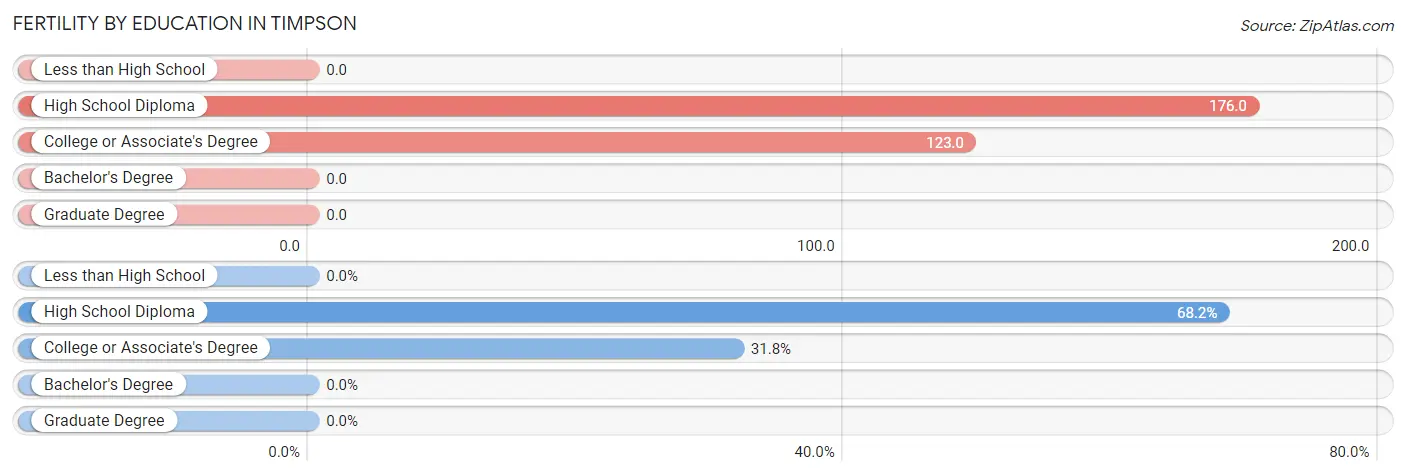
| Educational Attainment | Women with Births | Births / 1,000 Women |
| Less than High School | 0 (0.0%) | 0.0 |
| High School Diploma | 15 (68.2%) | 176.0 |
| College or Associate's Degree | 7 (31.8%) | 123.0 |
| Bachelor's Degree | 0 (0.0%) | 0.0 |
| Graduate Degree | 0 (0.0%) | 0.0 |
| Total | 22 (100.0%) | 100.0 |
Fertility by Education by Marriage Status in Timpson
95.5% of women with births in Timpson are unmarried. Women with the educational attainment of high school diploma are most likely to be married with 6.7% of them married at childbirth, while women with the educational attainment of college or associate's degree are least likely to be married with 100.0% of them unmarried at childbirth.
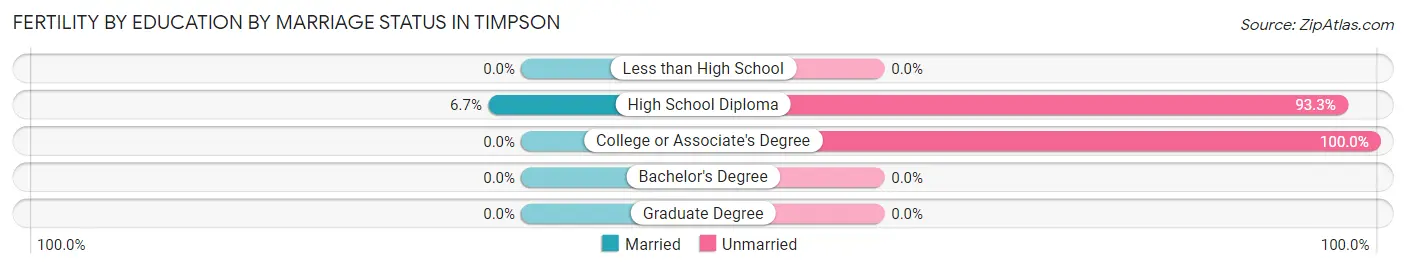
| Educational Attainment | Married | Unmarried |
| Less than High School | 0 (0.0%) | 0 (0.0%) |
| High School Diploma | 1 (6.7%) | 14 (93.3%) |
| College or Associate's Degree | 0 (0.0%) | 7 (100.0%) |
| Bachelor's Degree | 0 (0.0%) | 0 (0.0%) |
| Graduate Degree | 0 (0.0%) | 0 (0.0%) |
| Total | 1 (4.5%) | 21 (95.5%) |
Employment Characteristics in Timpson
Employment by Class of Employer in Timpson
Among the 433 employed individuals in Timpson, private company employees (256 | 59.1%), self-employed (not incorporated) (58 | 13.4%), and state government employees (57 | 13.2%) make up the most common classes of employment.
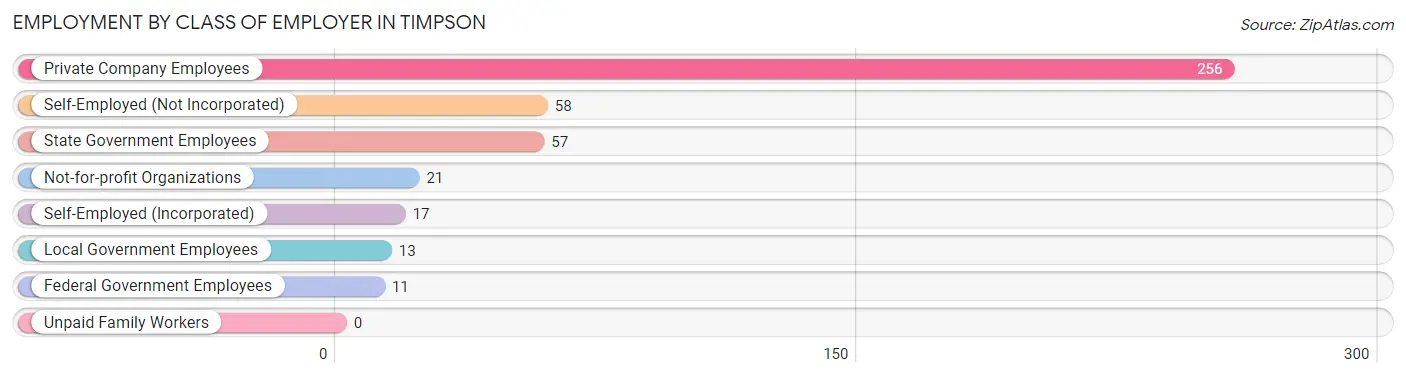
| Employer Class | # Employees | % Employees |
| Private Company Employees | 256 | 59.1% |
| Self-Employed (Incorporated) | 17 | 3.9% |
| Self-Employed (Not Incorporated) | 58 | 13.4% |
| Not-for-profit Organizations | 21 | 4.9% |
| Local Government Employees | 13 | 3.0% |
| State Government Employees | 57 | 13.2% |
| Federal Government Employees | 11 | 2.5% |
| Unpaid Family Workers | 0 | 0.0% |
| Total | 433 | 100.0% |
Employment Status by Age in Timpson
According to the labor force statistics for Timpson, out of the total population over 16 years of age (891), 50.2% or 447 individuals are in the labor force, with 3.1% or 14 of them unemployed. The age group with the highest labor force participation rate is 45 to 54 years, with 87.1% or 101 individuals in the labor force. Within the labor force, the 35 to 44 years age range has the highest percentage of unemployed individuals, with 16.3% or 14 of them being unemployed.
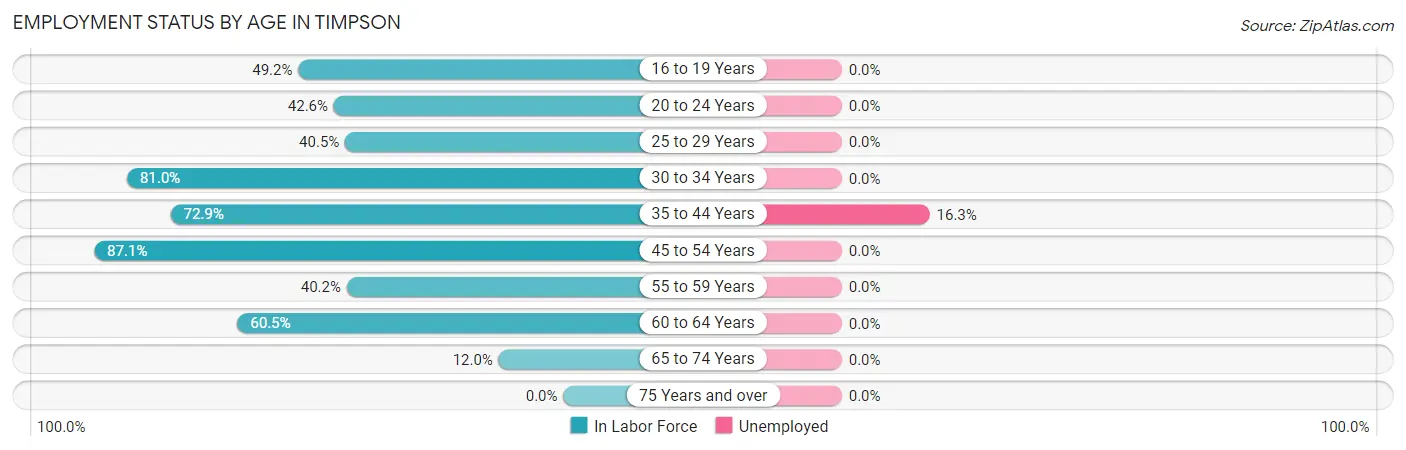
| Age Bracket | In Labor Force | Unemployed |
| 16 to 19 Years | 61 (49.2%) | 0 (0.0%) |
| 20 to 24 Years | 23 (42.6%) | 0 (0.0%) |
| 25 to 29 Years | 17 (40.5%) | 0 (0.0%) |
| 30 to 34 Years | 51 (81.0%) | 0 (0.0%) |
| 35 to 44 Years | 86 (72.9%) | 14 (16.3%) |
| 45 to 54 Years | 101 (87.1%) | 0 (0.0%) |
| 55 to 59 Years | 49 (40.2%) | 0 (0.0%) |
| 60 to 64 Years | 46 (60.5%) | 0 (0.0%) |
| 65 to 74 Years | 13 (12.0%) | 0 (0.0%) |
| 75 Years and over | 0 (0.0%) | 0 (0.0%) |
| Total | 447 (50.2%) | 14 (3.1%) |
Employment Status by Educational Attainment in Timpson
According to labor force statistics for Timpson, 65.2% of individuals (350) out of the total population between 25 and 64 years of age (537) are in the labor force, with 4.0% or 14 of them being unemployed. The group with the highest labor force participation rate are those with the educational attainment of bachelor's degree or higher, with 81.0% or 68 individuals in the labor force. Within the labor force, individuals with high school diploma education have the highest percentage of unemployment, with 12.3% or 14 of them being unemployed.
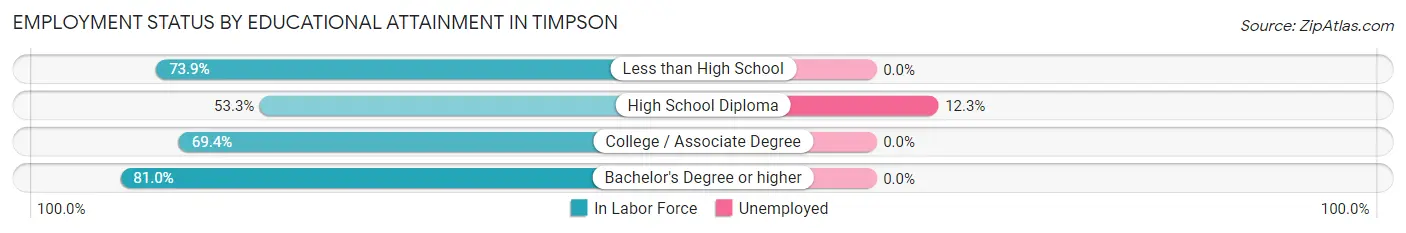
| Educational Attainment | In Labor Force | Unemployed |
| Less than High School | 34 (73.9%) | 0 (0.0%) |
| High School Diploma | 114 (53.3%) | 26 (12.3%) |
| College / Associate Degree | 134 (69.4%) | 0 (0.0%) |
| Bachelor's Degree or higher | 68 (81.0%) | 0 (0.0%) |
| Total | 350 (65.2%) | 21 (4.0%) |
Employment Occupations by Sex in Timpson
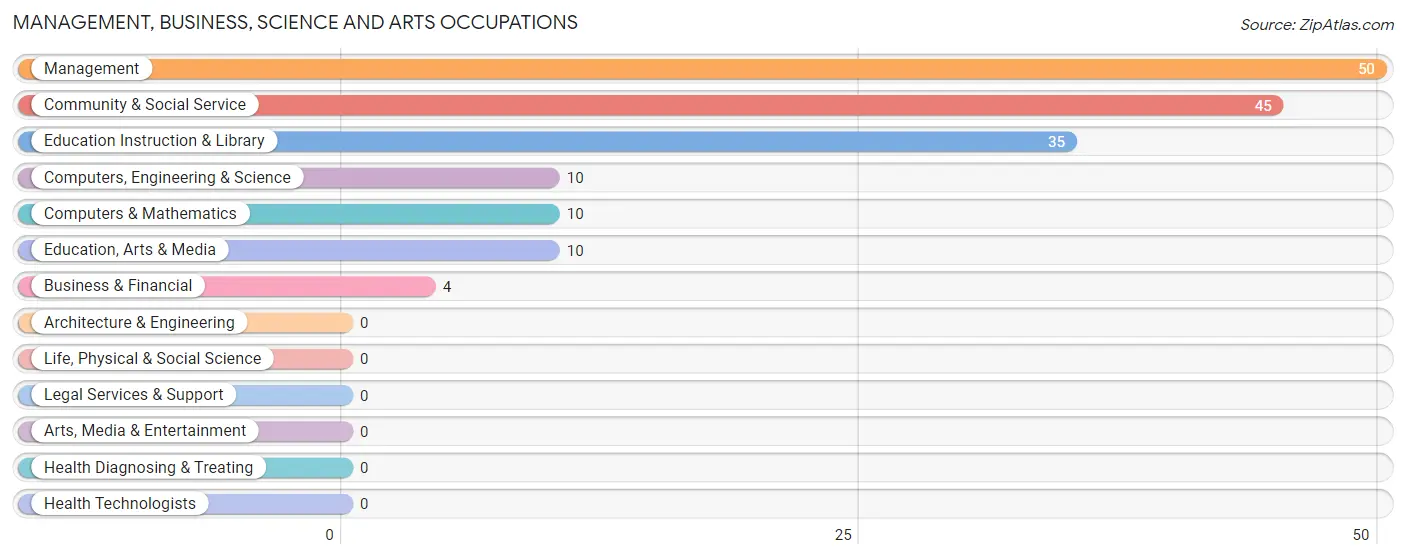
Management, Business, Science and Arts Occupations
The most common Management, Business, Science and Arts occupations in Timpson are Management (50 | 11.6%), Community & Social Service (45 | 10.4%), Education Instruction & Library (35 | 8.1%), Computers, Engineering & Science (10 | 2.3%), and Computers & Mathematics (10 | 2.3%).
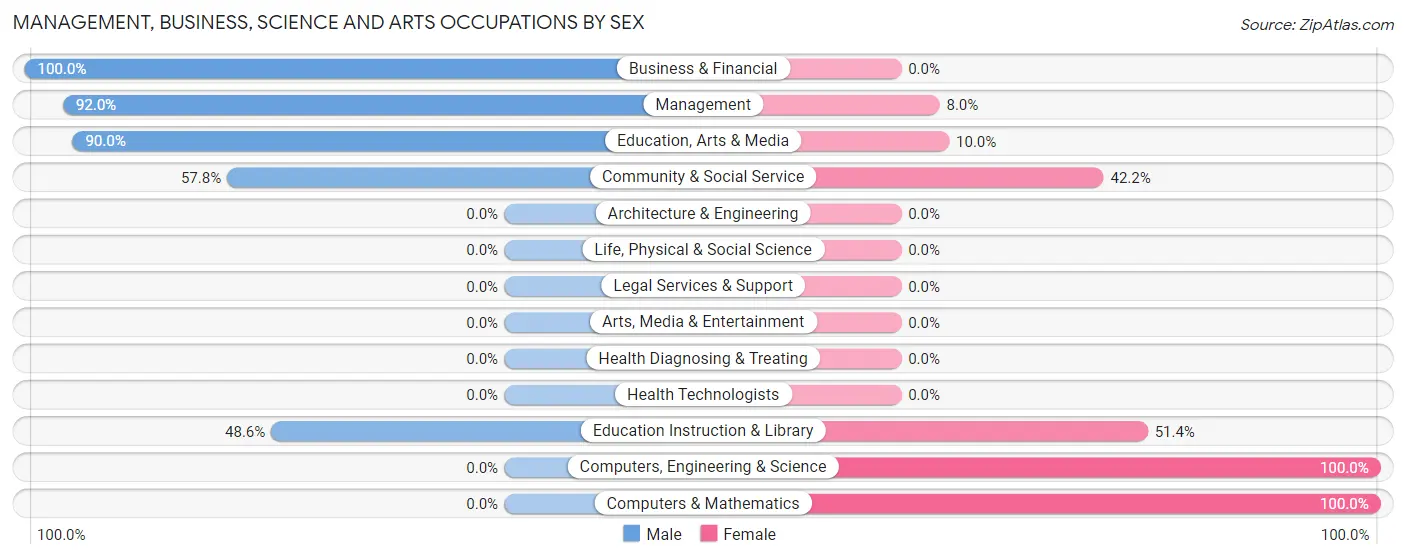
Management, Business, Science and Arts Occupations by Sex
Within the Management, Business, Science and Arts occupations in Timpson, the most male-oriented occupations are Business & Financial (100.0%), Management (92.0%), and Education, Arts & Media (90.0%), while the most female-oriented occupations are Computers, Engineering & Science (100.0%), Computers & Mathematics (100.0%), and Education Instruction & Library (51.4%).
| Occupation | Male | Female |
| Management | 46 (92.0%) | 4 (8.0%) |
| Business & Financial | 4 (100.0%) | 0 (0.0%) |
| Computers, Engineering & Science | 0 (0.0%) | 10 (100.0%) |
| Computers & Mathematics | 0 (0.0%) | 10 (100.0%) |
| Architecture & Engineering | 0 (0.0%) | 0 (0.0%) |
| Life, Physical & Social Science | 0 (0.0%) | 0 (0.0%) |
| Community & Social Service | 26 (57.8%) | 19 (42.2%) |
| Education, Arts & Media | 9 (90.0%) | 1 (10.0%) |
| Legal Services & Support | 0 (0.0%) | 0 (0.0%) |
| Education Instruction & Library | 17 (48.6%) | 18 (51.4%) |
| Arts, Media & Entertainment | 0 (0.0%) | 0 (0.0%) |
| Health Diagnosing & Treating | 0 (0.0%) | 0 (0.0%) |
| Health Technologists | 0 (0.0%) | 0 (0.0%) |
| Total (Category) | 76 (69.7%) | 33 (30.3%) |
| Total (Overall) | 270 (62.4%) | 163 (37.6%) |
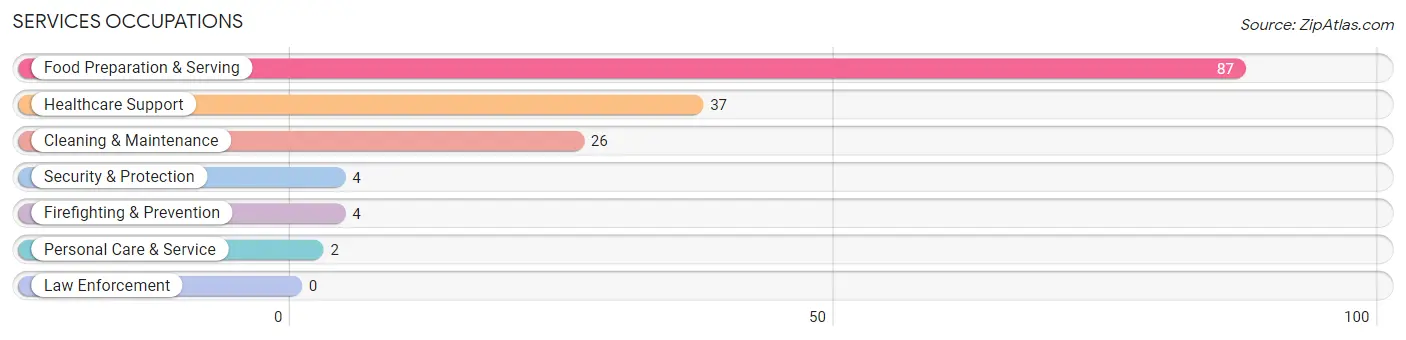
Services Occupations
The most common Services occupations in Timpson are Food Preparation & Serving (87 | 20.1%), Healthcare Support (37 | 8.6%), Cleaning & Maintenance (26 | 6.0%), Security & Protection (4 | 0.9%), and Firefighting & Prevention (4 | 0.9%).
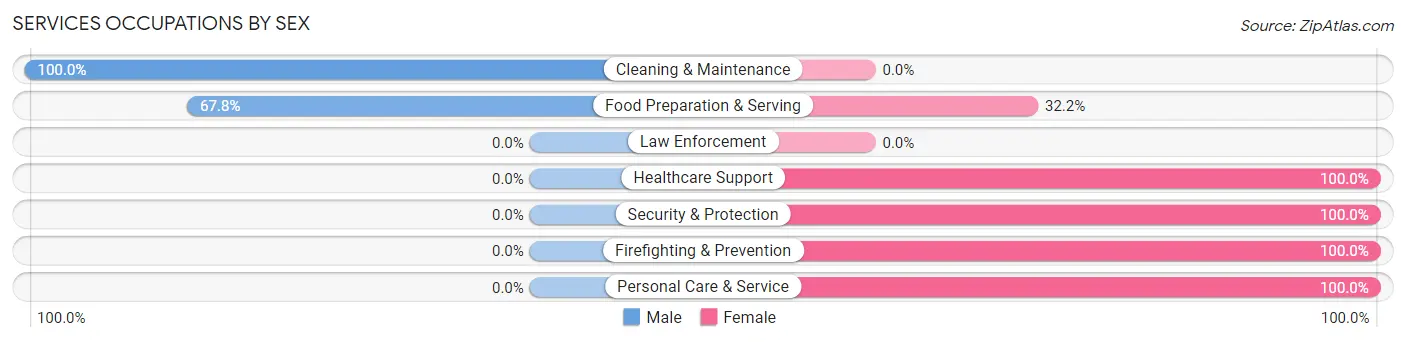
Services Occupations by Sex
Within the Services occupations in Timpson, the most male-oriented occupations are Cleaning & Maintenance (100.0%), and Food Preparation & Serving (67.8%), while the most female-oriented occupations are Healthcare Support (100.0%), Security & Protection (100.0%), and Firefighting & Prevention (100.0%).
| Occupation | Male | Female |
| Healthcare Support | 0 (0.0%) | 37 (100.0%) |
| Security & Protection | 0 (0.0%) | 4 (100.0%) |
| Firefighting & Prevention | 0 (0.0%) | 4 (100.0%) |
| Law Enforcement | 0 (0.0%) | 0 (0.0%) |
| Food Preparation & Serving | 59 (67.8%) | 28 (32.2%) |
| Cleaning & Maintenance | 26 (100.0%) | 0 (0.0%) |
| Personal Care & Service | 0 (0.0%) | 2 (100.0%) |
| Total (Category) | 85 (54.5%) | 71 (45.5%) |
| Total (Overall) | 270 (62.4%) | 163 (37.6%) |
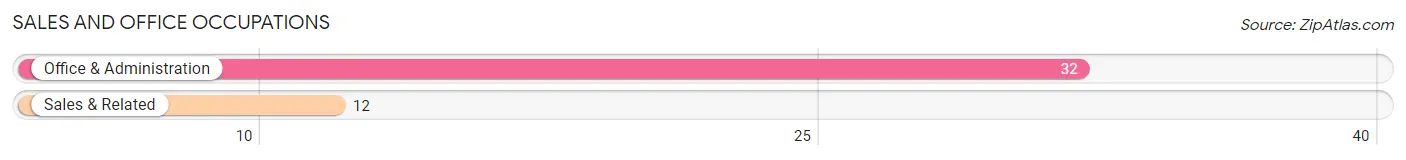
Sales and Office Occupations
The most common Sales and Office occupations in Timpson are Office & Administration (32 | 7.4%), and Sales & Related (12 | 2.8%).
Sales and Office Occupations by Sex
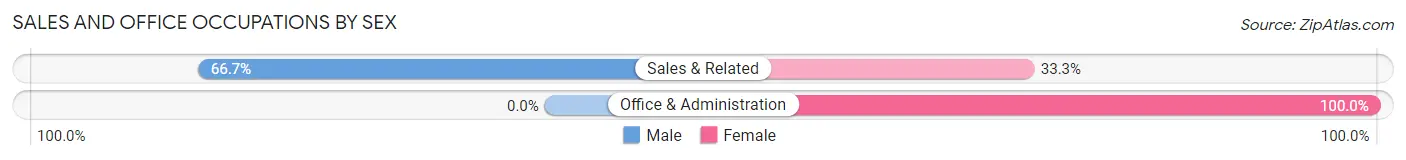
| Occupation | Male | Female |
| Sales & Related | 8 (66.7%) | 4 (33.3%) |
| Office & Administration | 0 (0.0%) | 32 (100.0%) |
| Total (Category) | 8 (18.2%) | 36 (81.8%) |
| Total (Overall) | 270 (62.4%) | 163 (37.6%) |
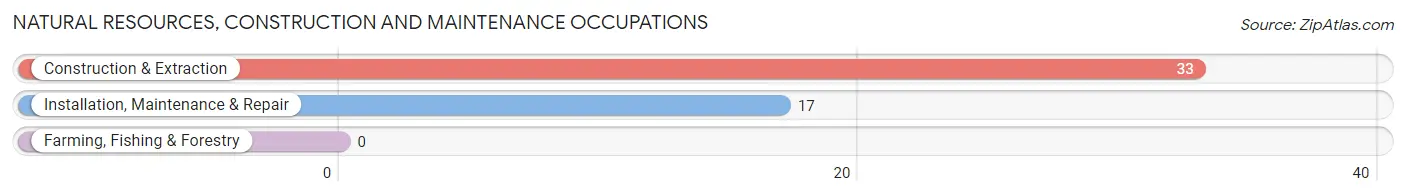
Natural Resources, Construction and Maintenance Occupations
The most common Natural Resources, Construction and Maintenance occupations in Timpson are Construction & Extraction (33 | 7.6%), and Installation, Maintenance & Repair (17 | 3.9%).
Natural Resources, Construction and Maintenance Occupations by Sex
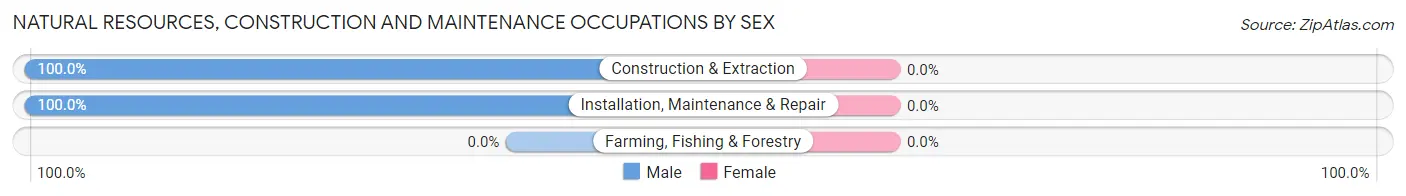
| Occupation | Male | Female |
| Farming, Fishing & Forestry | 0 (0.0%) | 0 (0.0%) |
| Construction & Extraction | 33 (100.0%) | 0 (0.0%) |
| Installation, Maintenance & Repair | 17 (100.0%) | 0 (0.0%) |
| Total (Category) | 50 (100.0%) | 0 (0.0%) |
| Total (Overall) | 270 (62.4%) | 163 (37.6%) |
Production, Transportation and Moving Occupations
The most common Production, Transportation and Moving occupations in Timpson are Production (48 | 11.1%), Material Moving (23 | 5.3%), and Transportation (3 | 0.7%).
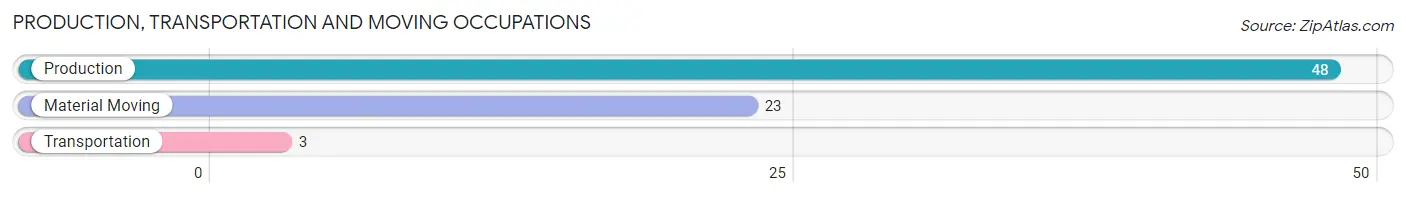
Production, Transportation and Moving Occupations by Sex
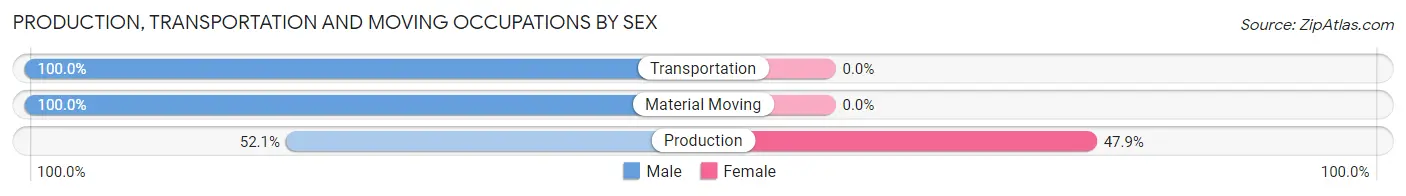
| Occupation | Male | Female |
| Production | 25 (52.1%) | 23 (47.9%) |
| Transportation | 3 (100.0%) | 0 (0.0%) |
| Material Moving | 23 (100.0%) | 0 (0.0%) |
| Total (Category) | 51 (68.9%) | 23 (31.1%) |
| Total (Overall) | 270 (62.4%) | 163 (37.6%) |
Employment Industries by Sex in Timpson
Employment Industries in Timpson
The major employment industries in Timpson include Accommodation & Food Services (80 | 18.5%), Educational Services (72 | 16.6%), Manufacturing (46 | 10.6%), Health Care & Social Assistance (41 | 9.5%), and Mining, Quarrying, & Extraction (25 | 5.8%).
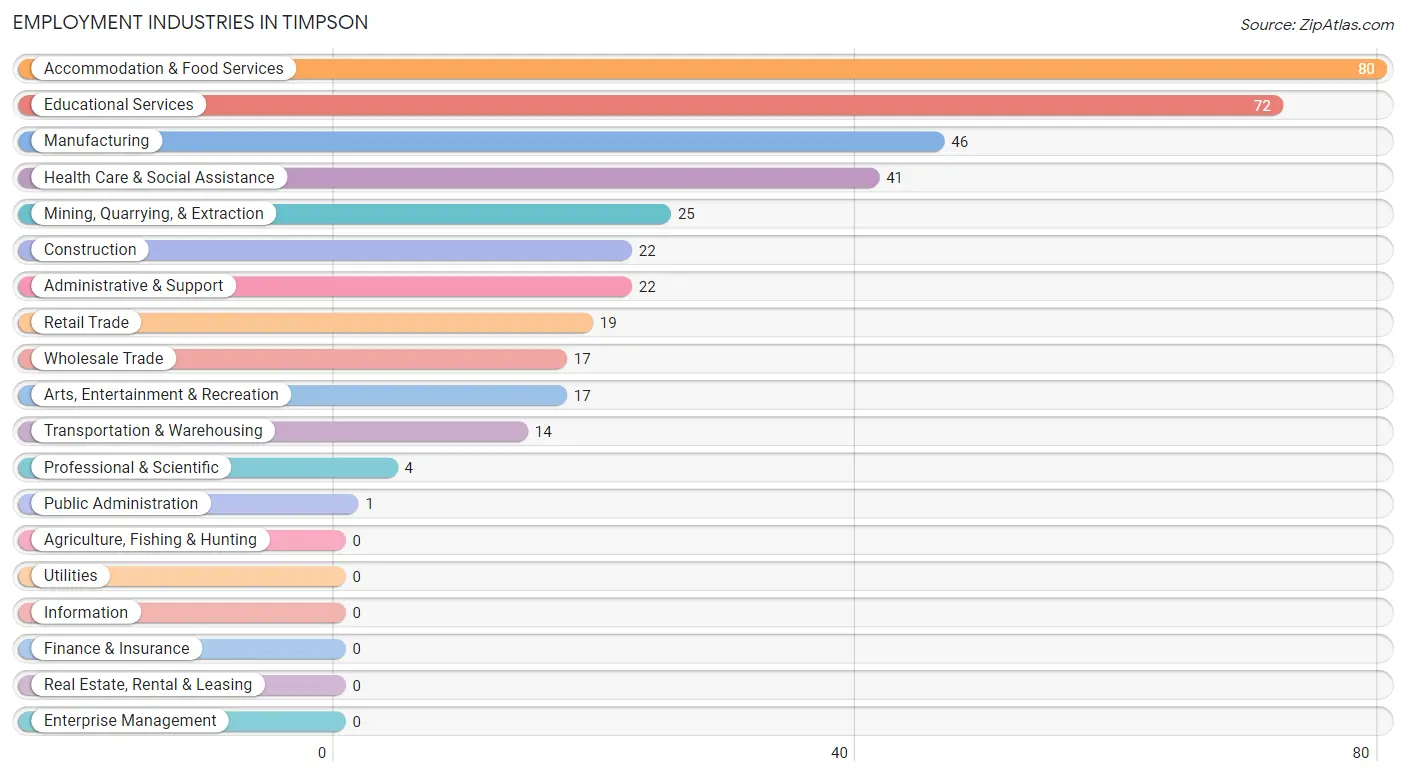
Employment Industries by Sex in Timpson
The Timpson industries that see more men than women are Mining, Quarrying, & Extraction (100.0%), Construction (100.0%), and Wholesale Trade (100.0%), whereas the industries that tend to have a higher number of women are Health Care & Social Assistance (100.0%), Public Administration (100.0%), and Transportation & Warehousing (71.4%).
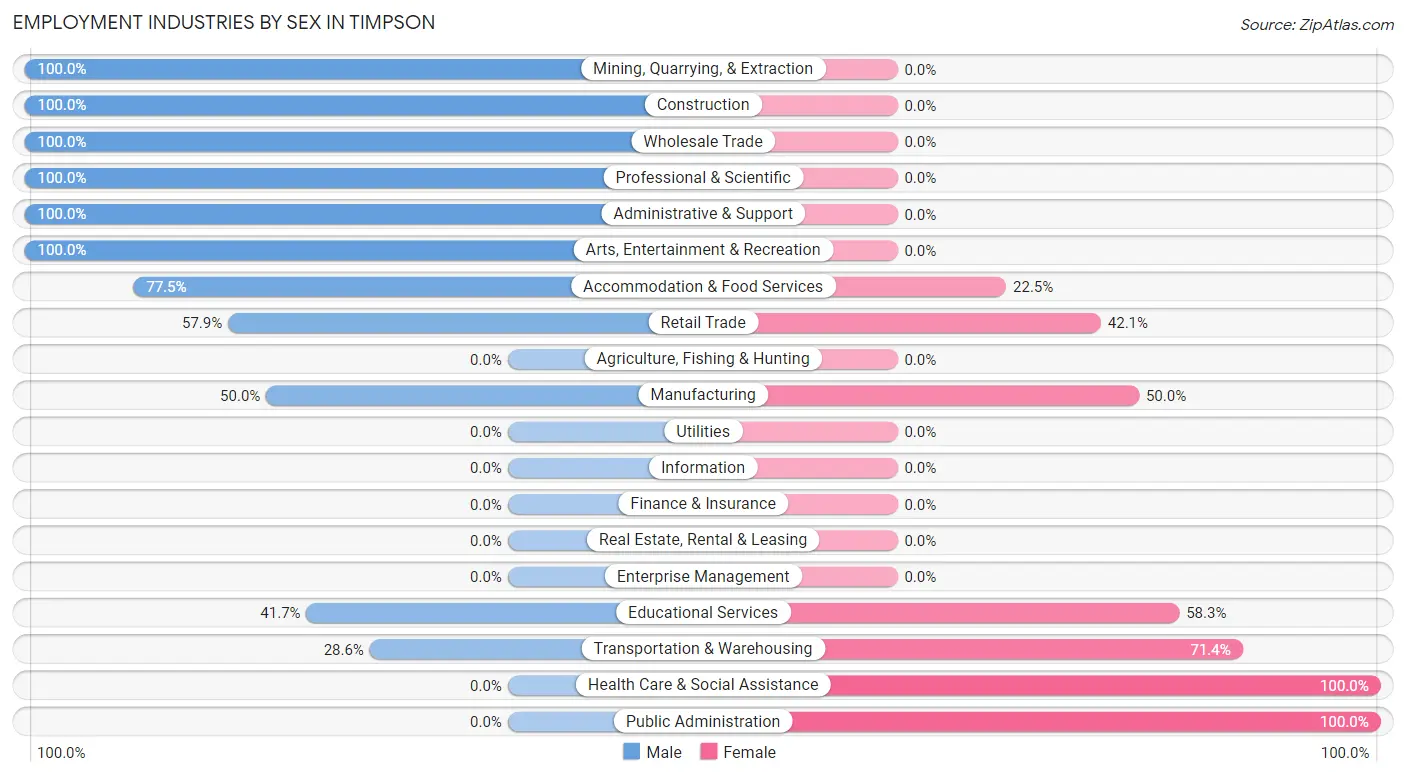
| Industry | Male | Female |
| Agriculture, Fishing & Hunting | 0 (0.0%) | 0 (0.0%) |
| Mining, Quarrying, & Extraction | 25 (100.0%) | 0 (0.0%) |
| Construction | 22 (100.0%) | 0 (0.0%) |
| Manufacturing | 23 (50.0%) | 23 (50.0%) |
| Wholesale Trade | 17 (100.0%) | 0 (0.0%) |
| Retail Trade | 11 (57.9%) | 8 (42.1%) |
| Transportation & Warehousing | 4 (28.6%) | 10 (71.4%) |
| Utilities | 0 (0.0%) | 0 (0.0%) |
| Information | 0 (0.0%) | 0 (0.0%) |
| Finance & Insurance | 0 (0.0%) | 0 (0.0%) |
| Real Estate, Rental & Leasing | 0 (0.0%) | 0 (0.0%) |
| Professional & Scientific | 4 (100.0%) | 0 (0.0%) |
| Enterprise Management | 0 (0.0%) | 0 (0.0%) |
| Administrative & Support | 22 (100.0%) | 0 (0.0%) |
| Educational Services | 30 (41.7%) | 42 (58.3%) |
| Health Care & Social Assistance | 0 (0.0%) | 41 (100.0%) |
| Arts, Entertainment & Recreation | 17 (100.0%) | 0 (0.0%) |
| Accommodation & Food Services | 62 (77.5%) | 18 (22.5%) |
| Public Administration | 0 (0.0%) | 1 (100.0%) |
| Total | 270 (62.4%) | 163 (37.6%) |
Education in Timpson
School Enrollment in Timpson
The most common levels of schooling among the 388 students in Timpson are high school (147 | 37.9%), middle school (91 | 23.4%), and elementary school (60 | 15.5%).
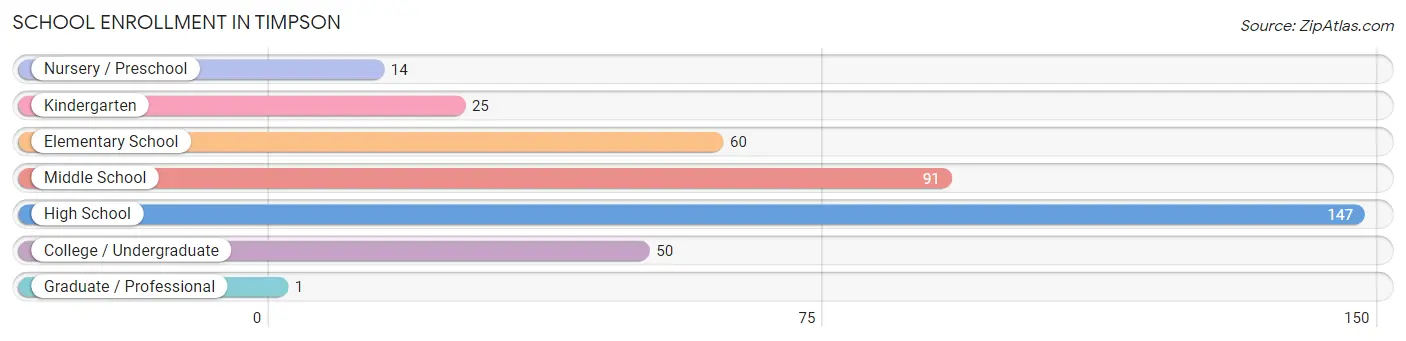
| School Level | # Students | % Students |
| Nursery / Preschool | 14 | 3.6% |
| Kindergarten | 25 | 6.4% |
| Elementary School | 60 | 15.5% |
| Middle School | 91 | 23.4% |
| High School | 147 | 37.9% |
| College / Undergraduate | 50 | 12.9% |
| Graduate / Professional | 1 | 0.3% |
| Total | 388 | 100.0% |
School Enrollment by Age by Funding Source in Timpson
Out of a total of 388 students who are enrolled in schools in Timpson, 3 (0.8%) attend a private institution, while the remaining 385 (99.2%) are enrolled in public schools. The age group of 15 to 17 year olds has the highest likelihood of being enrolled in private schools, with 3 (4.2% in the age bracket) enrolled. Conversely, the age group of 3 to 4 year olds has the lowest likelihood of being enrolled in a private school, with 1 (100.0% in the age bracket) attending a public institution.
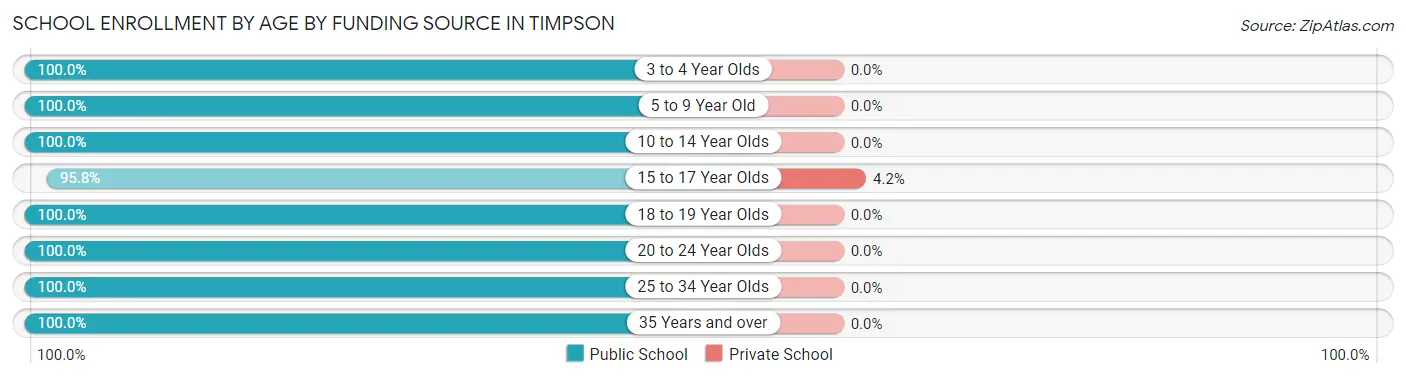
| Age Bracket | Public School | Private School |
| 3 to 4 Year Olds | 1 (100.0%) | 0 (0.0%) |
| 5 to 9 Year Old | 84 (100.0%) | 0 (0.0%) |
| 10 to 14 Year Olds | 111 (100.0%) | 0 (0.0%) |
| 15 to 17 Year Olds | 69 (95.8%) | 3 (4.2%) |
| 18 to 19 Year Olds | 68 (100.0%) | 0 (0.0%) |
| 20 to 24 Year Olds | 33 (100.0%) | 0 (0.0%) |
| 25 to 34 Year Olds | 17 (100.0%) | 0 (0.0%) |
| 35 Years and over | 2 (100.0%) | 0 (0.0%) |
| Total | 385 (99.2%) | 3 (0.8%) |
Educational Attainment by Field of Study in Timpson
Arts & humanities (35 | 28.2%), education (24 | 19.4%), literature & languages (18 | 14.5%), liberal arts & history (17 | 13.7%), and business (12 | 9.7%) are the most common fields of study among 124 individuals in Timpson who have obtained a bachelor's degree or higher.
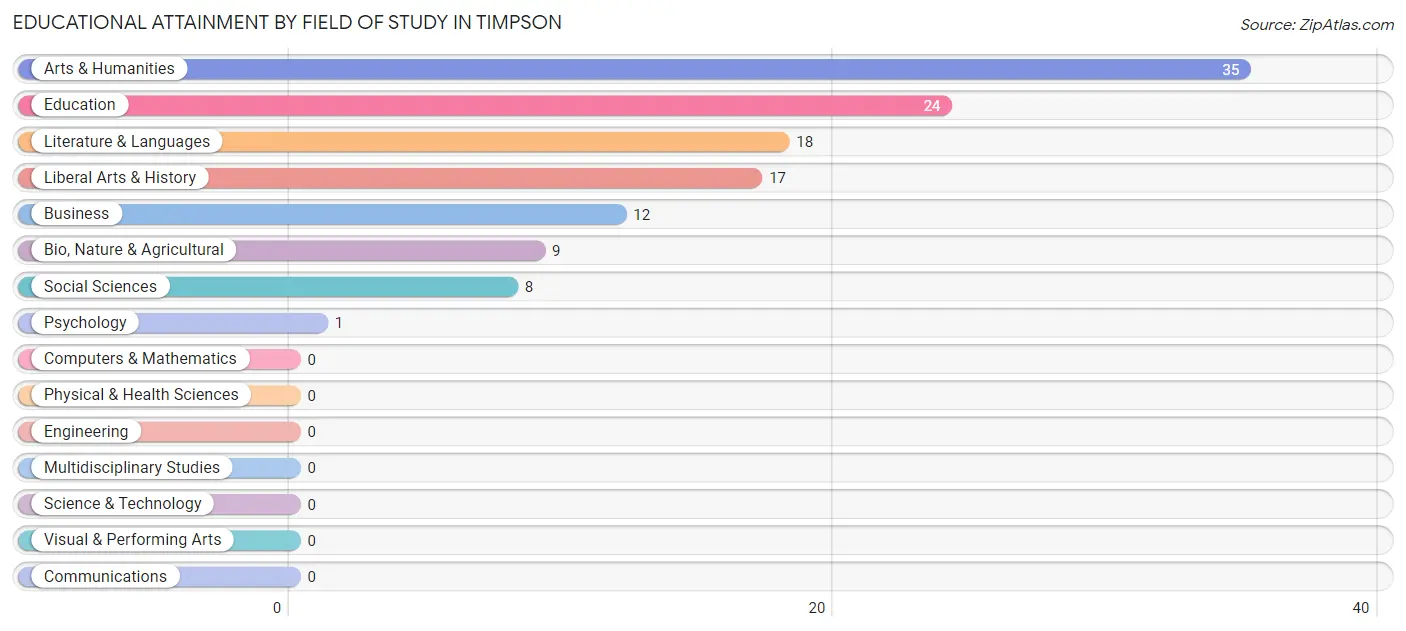
| Field of Study | # Graduates | % Graduates |
| Computers & Mathematics | 0 | 0.0% |
| Bio, Nature & Agricultural | 9 | 7.3% |
| Physical & Health Sciences | 0 | 0.0% |
| Psychology | 1 | 0.8% |
| Social Sciences | 8 | 6.5% |
| Engineering | 0 | 0.0% |
| Multidisciplinary Studies | 0 | 0.0% |
| Science & Technology | 0 | 0.0% |
| Business | 12 | 9.7% |
| Education | 24 | 19.4% |
| Literature & Languages | 18 | 14.5% |
| Liberal Arts & History | 17 | 13.7% |
| Visual & Performing Arts | 0 | 0.0% |
| Communications | 0 | 0.0% |
| Arts & Humanities | 35 | 28.2% |
| Total | 124 | 100.0% |
Transportation & Commute in Timpson
Vehicle Availability by Sex in Timpson
The most prevalent vehicle ownership categories in Timpson are males with 2 vehicles (182, accounting for 67.4%) and females with 2 vehicles (67, making up 111.7%).
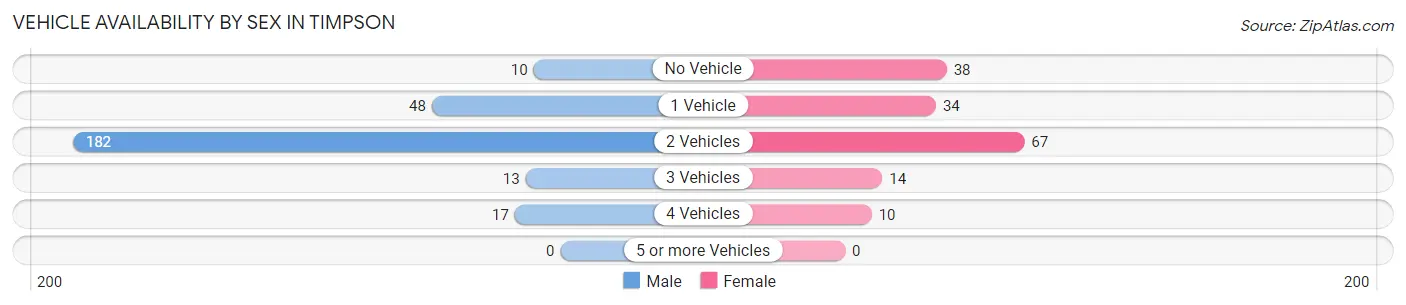
| Vehicles Available | Male | Female |
| No Vehicle | 10 (3.7%) | 38 (23.3%) |
| 1 Vehicle | 48 (17.8%) | 34 (20.9%) |
| 2 Vehicles | 182 (67.4%) | 67 (41.1%) |
| 3 Vehicles | 13 (4.8%) | 14 (8.6%) |
| 4 Vehicles | 17 (6.3%) | 10 (6.1%) |
| 5 or more Vehicles | 0 (0.0%) | 0 (0.0%) |
| Total | 270 (100.0%) | 163 (100.0%) |
Commute Time in Timpson
The most frequently occuring commute durations in Timpson are 5 to 9 minutes (111 commuters, 27.0%), 20 to 24 minutes (53 commuters, 12.9%), and 15 to 19 minutes (49 commuters, 11.9%).
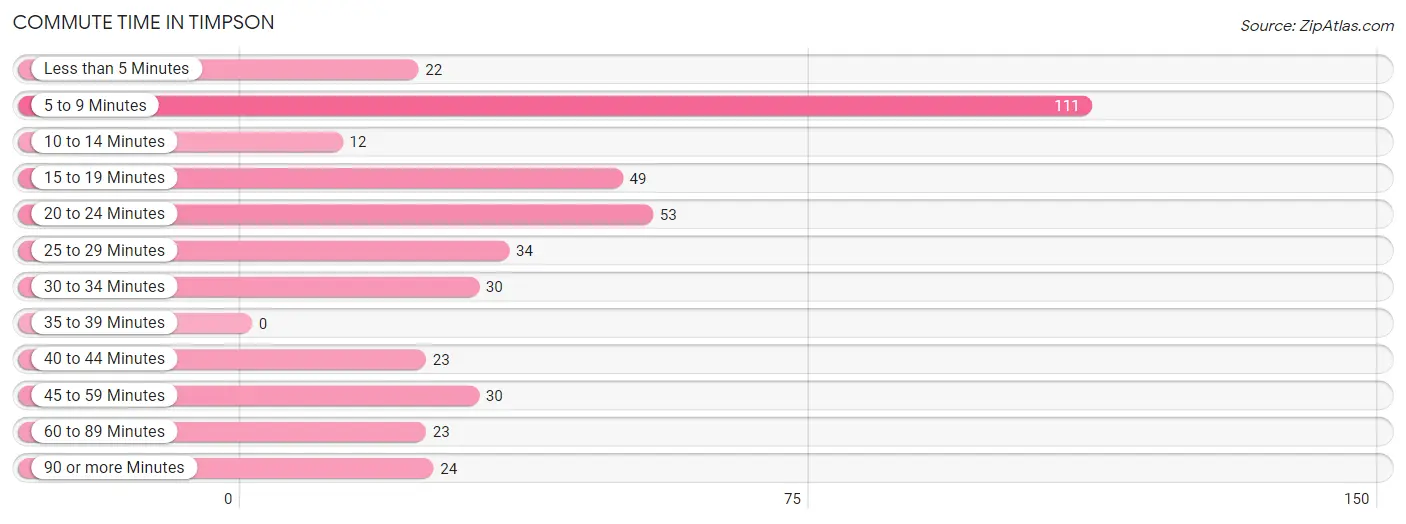
| Commute Time | # Commuters | % Commuters |
| Less than 5 Minutes | 22 | 5.3% |
| 5 to 9 Minutes | 111 | 27.0% |
| 10 to 14 Minutes | 12 | 2.9% |
| 15 to 19 Minutes | 49 | 11.9% |
| 20 to 24 Minutes | 53 | 12.9% |
| 25 to 29 Minutes | 34 | 8.3% |
| 30 to 34 Minutes | 30 | 7.3% |
| 35 to 39 Minutes | 0 | 0.0% |
| 40 to 44 Minutes | 23 | 5.6% |
| 45 to 59 Minutes | 30 | 7.3% |
| 60 to 89 Minutes | 23 | 5.6% |
| 90 or more Minutes | 24 | 5.8% |
Commute Time by Sex in Timpson
The most common commute times in Timpson are 5 to 9 minutes (93 commuters, 34.4%) for males and 40 to 44 minutes (23 commuters, 16.3%) for females.
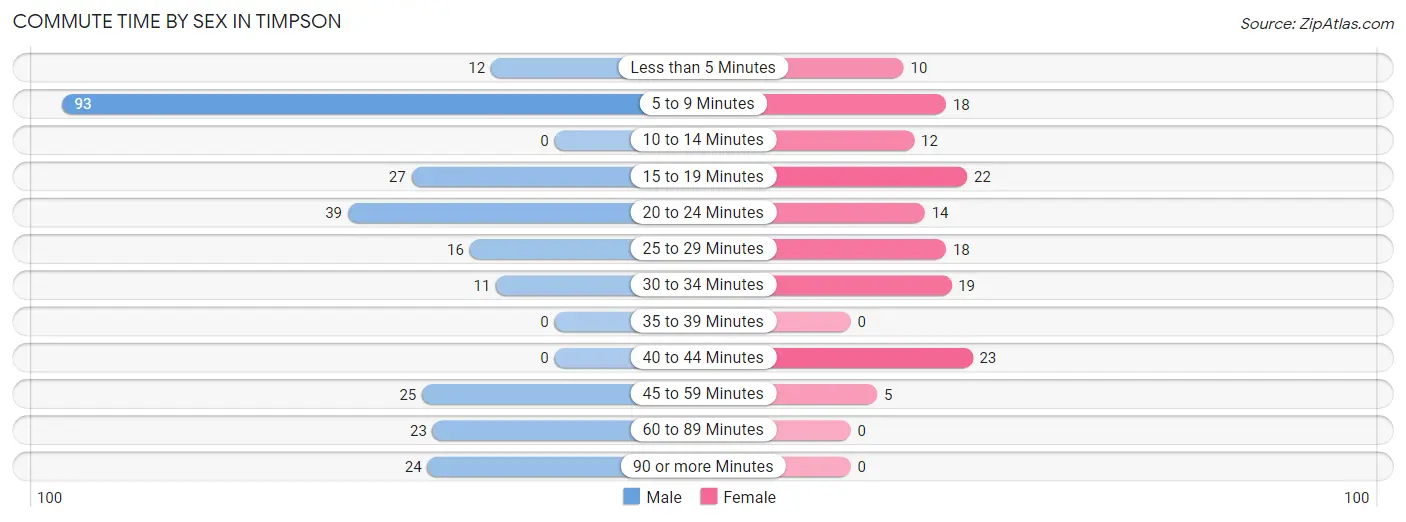
| Commute Time | Male | Female |
| Less than 5 Minutes | 12 (4.4%) | 10 (7.1%) |
| 5 to 9 Minutes | 93 (34.4%) | 18 (12.8%) |
| 10 to 14 Minutes | 0 (0.0%) | 12 (8.5%) |
| 15 to 19 Minutes | 27 (10.0%) | 22 (15.6%) |
| 20 to 24 Minutes | 39 (14.4%) | 14 (9.9%) |
| 25 to 29 Minutes | 16 (5.9%) | 18 (12.8%) |
| 30 to 34 Minutes | 11 (4.1%) | 19 (13.5%) |
| 35 to 39 Minutes | 0 (0.0%) | 0 (0.0%) |
| 40 to 44 Minutes | 0 (0.0%) | 23 (16.3%) |
| 45 to 59 Minutes | 25 (9.3%) | 5 (3.5%) |
| 60 to 89 Minutes | 23 (8.5%) | 0 (0.0%) |
| 90 or more Minutes | 24 (8.9%) | 0 (0.0%) |
Time of Departure to Work by Sex in Timpson
The most frequent times of departure to work in Timpson are 5:30 AM to 5:59 AM (80, 29.6%) for males and 7:00 AM to 7:29 AM (31, 22.0%) for females.
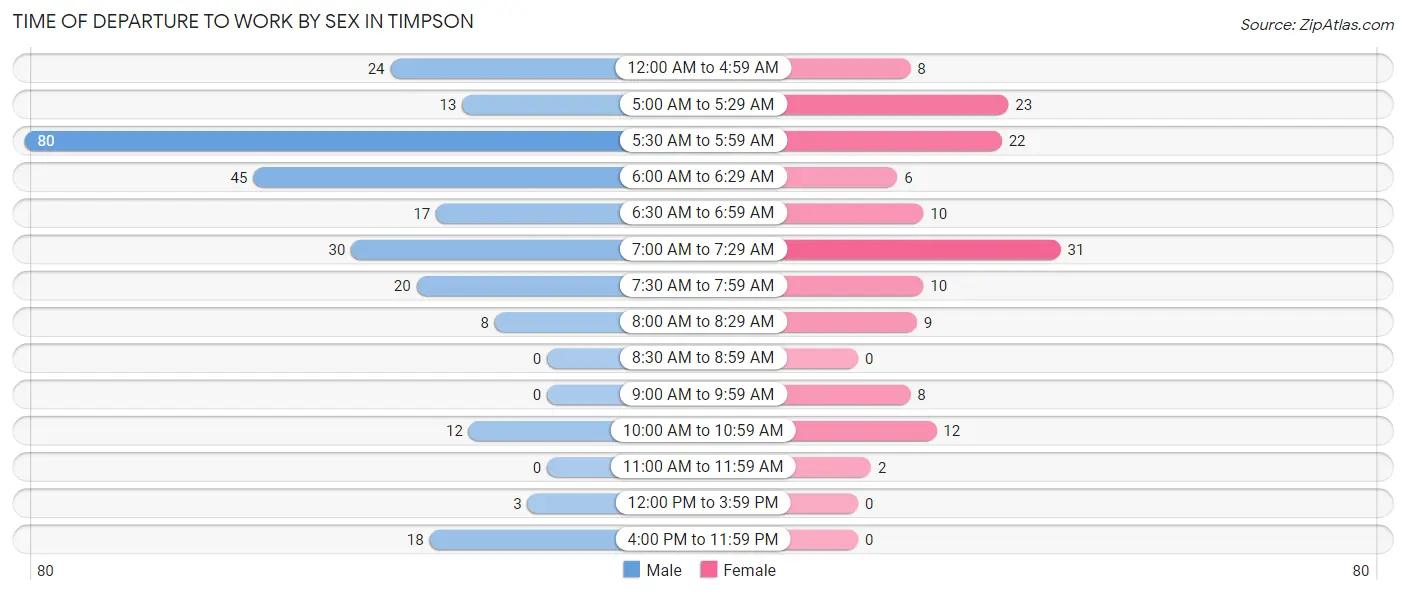
| Time of Departure | Male | Female |
| 12:00 AM to 4:59 AM | 24 (8.9%) | 8 (5.7%) |
| 5:00 AM to 5:29 AM | 13 (4.8%) | 23 (16.3%) |
| 5:30 AM to 5:59 AM | 80 (29.6%) | 22 (15.6%) |
| 6:00 AM to 6:29 AM | 45 (16.7%) | 6 (4.3%) |
| 6:30 AM to 6:59 AM | 17 (6.3%) | 10 (7.1%) |
| 7:00 AM to 7:29 AM | 30 (11.1%) | 31 (22.0%) |
| 7:30 AM to 7:59 AM | 20 (7.4%) | 10 (7.1%) |
| 8:00 AM to 8:29 AM | 8 (3.0%) | 9 (6.4%) |
| 8:30 AM to 8:59 AM | 0 (0.0%) | 0 (0.0%) |
| 9:00 AM to 9:59 AM | 0 (0.0%) | 8 (5.7%) |
| 10:00 AM to 10:59 AM | 12 (4.4%) | 12 (8.5%) |
| 11:00 AM to 11:59 AM | 0 (0.0%) | 2 (1.4%) |
| 12:00 PM to 3:59 PM | 3 (1.1%) | 0 (0.0%) |
| 4:00 PM to 11:59 PM | 18 (6.7%) | 0 (0.0%) |
| Total | 270 (100.0%) | 141 (100.0%) |
Housing Occupancy in Timpson
Occupancy by Ownership in Timpson
Of the total 478 dwellings in Timpson, owner-occupied units account for 271 (56.7%), while renter-occupied units make up 207 (43.3%).
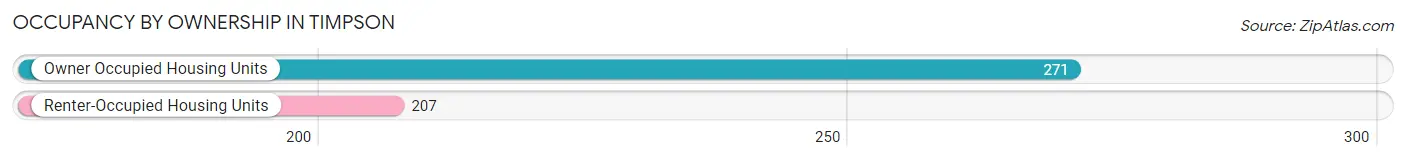
| Occupancy | # Housing Units | % Housing Units |
| Owner Occupied Housing Units | 271 | 56.7% |
| Renter-Occupied Housing Units | 207 | 43.3% |
| Total Occupied Housing Units | 478 | 100.0% |
Occupancy by Household Size in Timpson
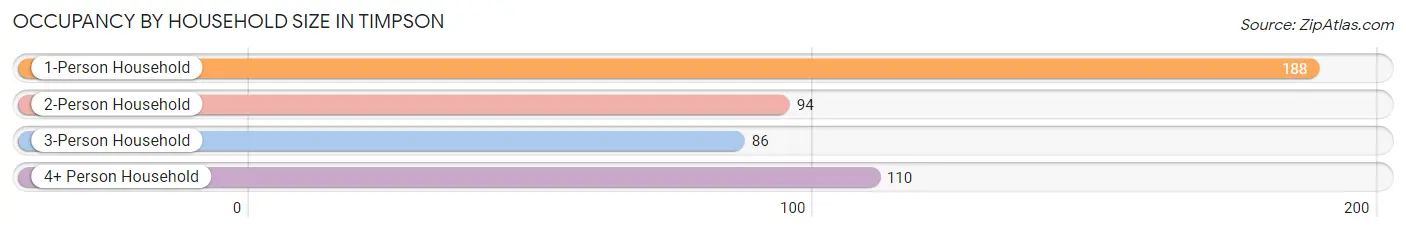
| Household Size | # Housing Units | % Housing Units |
| 1-Person Household | 188 | 39.3% |
| 2-Person Household | 94 | 19.7% |
| 3-Person Household | 86 | 18.0% |
| 4+ Person Household | 110 | 23.0% |
| Total Housing Units | 478 | 100.0% |
Occupancy by Ownership by Household Size in Timpson
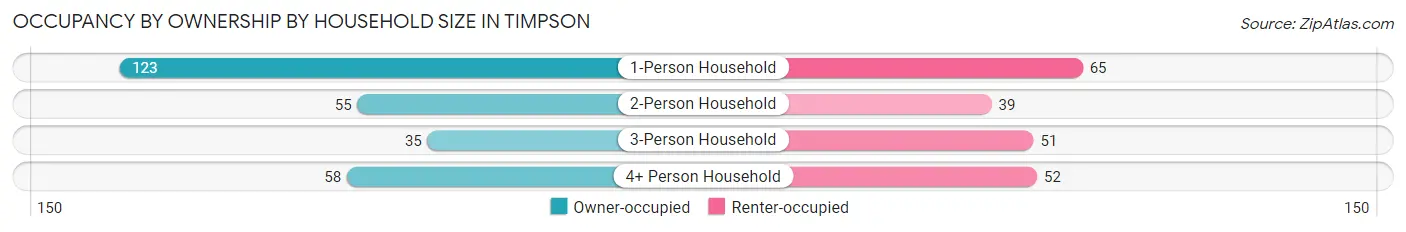
| Household Size | Owner-occupied | Renter-occupied |
| 1-Person Household | 123 (65.4%) | 65 (34.6%) |
| 2-Person Household | 55 (58.5%) | 39 (41.5%) |
| 3-Person Household | 35 (40.7%) | 51 (59.3%) |
| 4+ Person Household | 58 (52.7%) | 52 (47.3%) |
| Total Housing Units | 271 (56.7%) | 207 (43.3%) |
Occupancy by Educational Attainment in Timpson
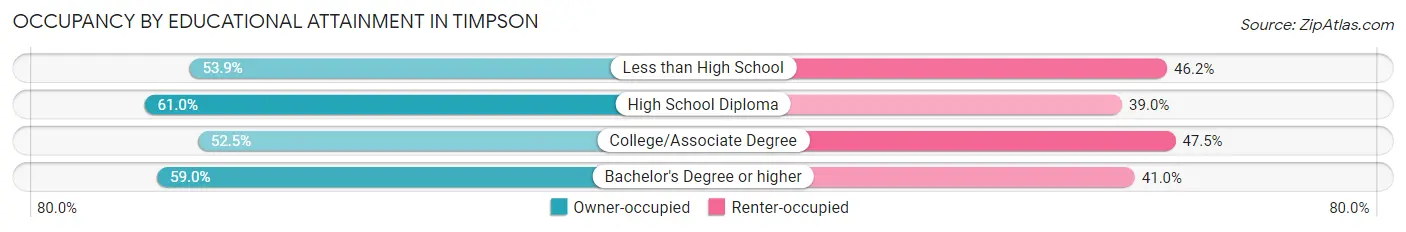
| Household Size | Owner-occupied | Renter-occupied |
| Less than High School | 42 (53.8%) | 36 (46.2%) |
| High School Diploma | 100 (61.0%) | 64 (39.0%) |
| College/Associate Degree | 83 (52.5%) | 75 (47.5%) |
| Bachelor's Degree or higher | 46 (59.0%) | 32 (41.0%) |
Occupancy by Age of Householder in Timpson
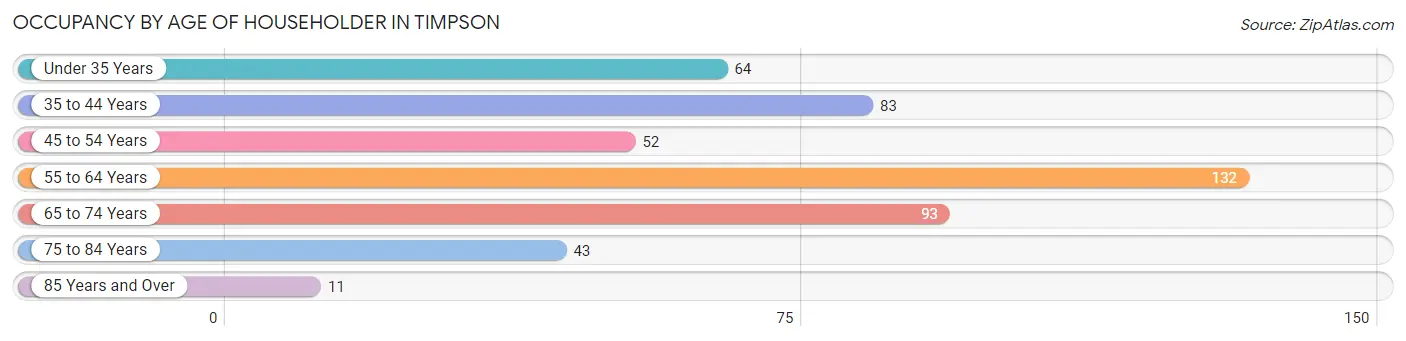
| Age Bracket | # Households | % Households |
| Under 35 Years | 64 | 13.4% |
| 35 to 44 Years | 83 | 17.4% |
| 45 to 54 Years | 52 | 10.9% |
| 55 to 64 Years | 132 | 27.6% |
| 65 to 74 Years | 93 | 19.5% |
| 75 to 84 Years | 43 | 9.0% |
| 85 Years and Over | 11 | 2.3% |
| Total | 478 | 100.0% |
Housing Finances in Timpson
Median Income by Occupancy in Timpson
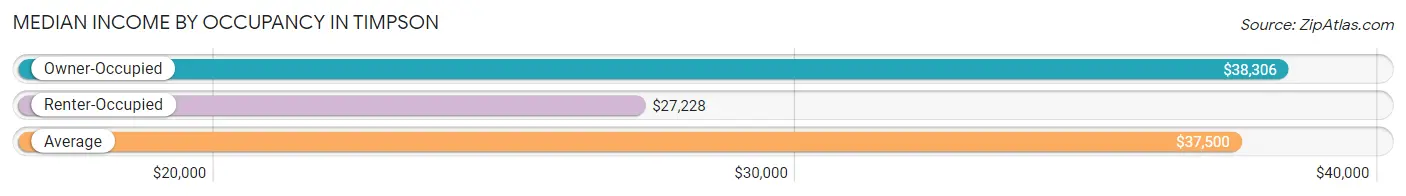
| Occupancy Type | # Households | Median Income |
| Owner-Occupied | 271 (56.7%) | $38,306 |
| Renter-Occupied | 207 (43.3%) | $27,228 |
| Average | 478 (100.0%) | $37,500 |
Occupancy by Householder Income Bracket in Timpson
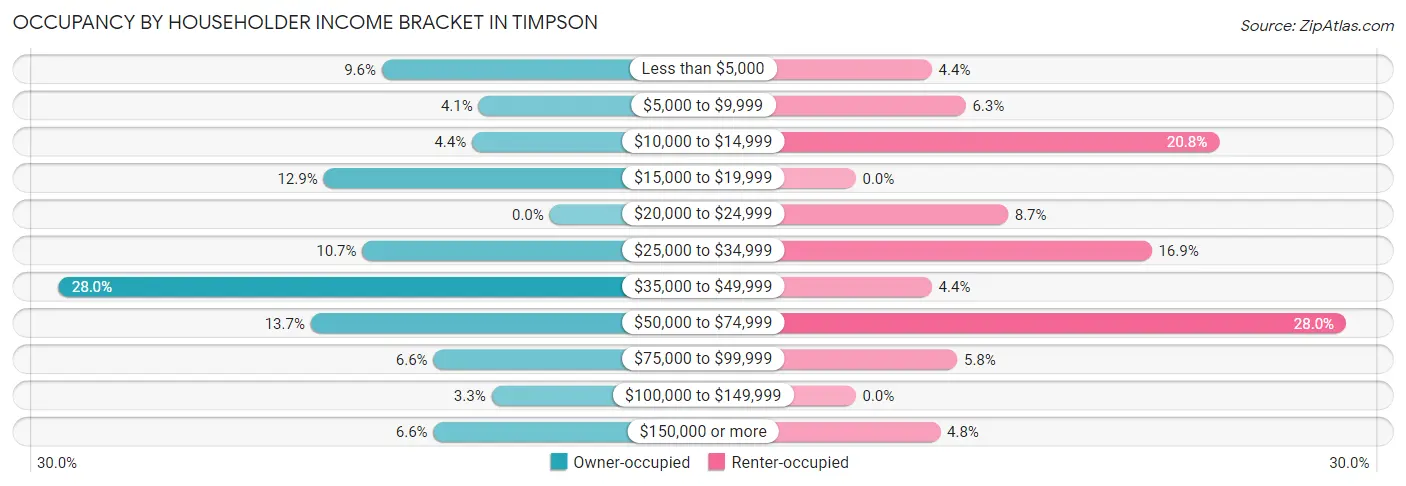
| Income Bracket | Owner-occupied | Renter-occupied |
| Less than $5,000 | 26 (9.6%) | 9 (4.3%) |
| $5,000 to $9,999 | 11 (4.1%) | 13 (6.3%) |
| $10,000 to $14,999 | 12 (4.4%) | 43 (20.8%) |
| $15,000 to $19,999 | 35 (12.9%) | 0 (0.0%) |
| $20,000 to $24,999 | 0 (0.0%) | 18 (8.7%) |
| $25,000 to $34,999 | 29 (10.7%) | 35 (16.9%) |
| $35,000 to $49,999 | 76 (28.0%) | 9 (4.3%) |
| $50,000 to $74,999 | 37 (13.7%) | 58 (28.0%) |
| $75,000 to $99,999 | 18 (6.6%) | 12 (5.8%) |
| $100,000 to $149,999 | 9 (3.3%) | 0 (0.0%) |
| $150,000 or more | 18 (6.6%) | 10 (4.8%) |
| Total | 271 (100.0%) | 207 (100.0%) |
Monthly Housing Cost Tiers in Timpson
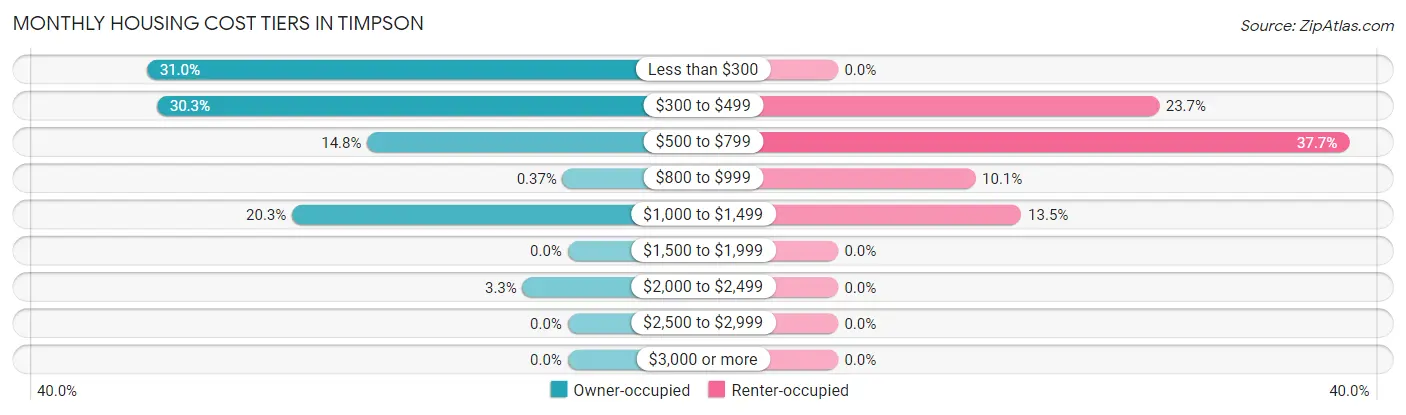
| Monthly Cost | Owner-occupied | Renter-occupied |
| Less than $300 | 84 (31.0%) | 0 (0.0%) |
| $300 to $499 | 82 (30.3%) | 49 (23.7%) |
| $500 to $799 | 40 (14.8%) | 78 (37.7%) |
| $800 to $999 | 1 (0.4%) | 21 (10.1%) |
| $1,000 to $1,499 | 55 (20.3%) | 28 (13.5%) |
| $1,500 to $1,999 | 0 (0.0%) | 0 (0.0%) |
| $2,000 to $2,499 | 9 (3.3%) | 0 (0.0%) |
| $2,500 to $2,999 | 0 (0.0%) | 0 (0.0%) |
| $3,000 or more | 0 (0.0%) | 0 (0.0%) |
| Total | 271 (100.0%) | 207 (100.0%) |
Physical Housing Characteristics in Timpson
Housing Structures in Timpson
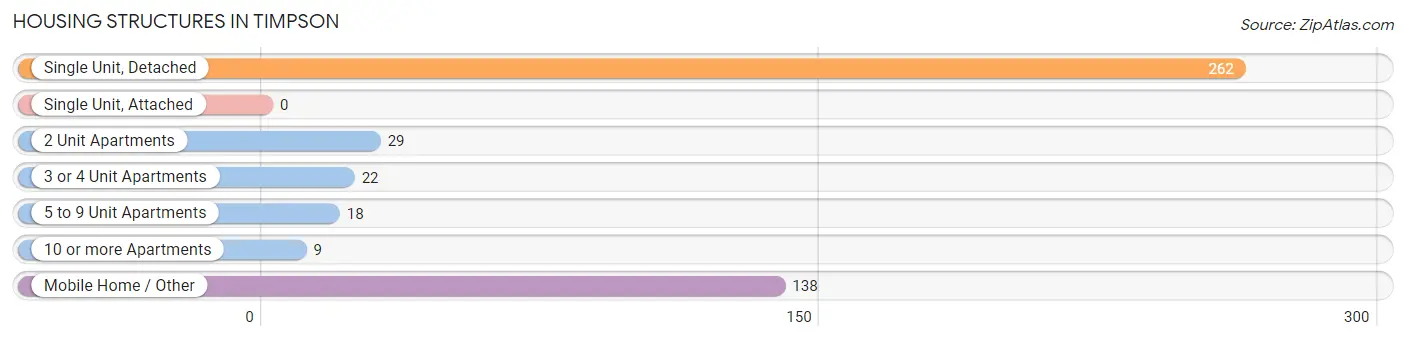
| Structure Type | # Housing Units | % Housing Units |
| Single Unit, Detached | 262 | 54.8% |
| Single Unit, Attached | 0 | 0.0% |
| 2 Unit Apartments | 29 | 6.1% |
| 3 or 4 Unit Apartments | 22 | 4.6% |
| 5 to 9 Unit Apartments | 18 | 3.8% |
| 10 or more Apartments | 9 | 1.9% |
| Mobile Home / Other | 138 | 28.9% |
| Total | 478 | 100.0% |
Housing Structures by Occupancy in Timpson
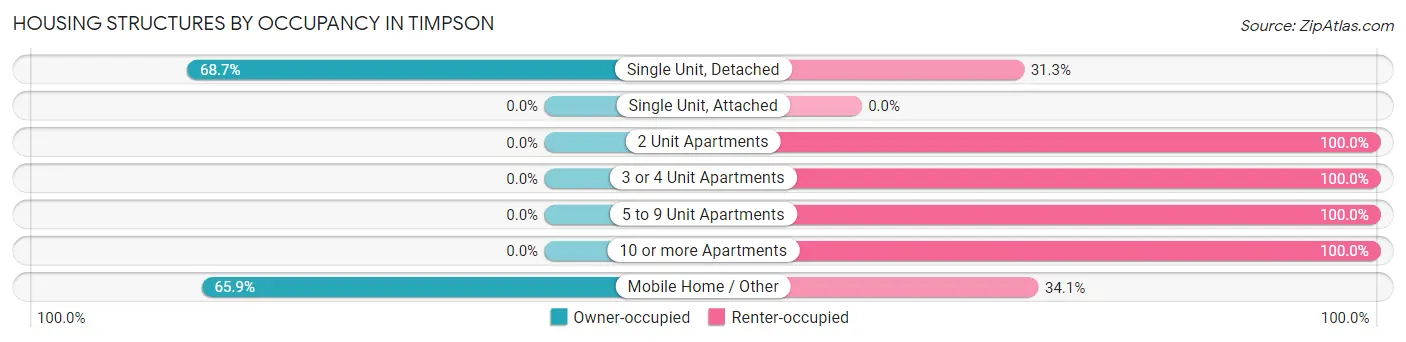
| Structure Type | Owner-occupied | Renter-occupied |
| Single Unit, Detached | 180 (68.7%) | 82 (31.3%) |
| Single Unit, Attached | 0 (0.0%) | 0 (0.0%) |
| 2 Unit Apartments | 0 (0.0%) | 29 (100.0%) |
| 3 or 4 Unit Apartments | 0 (0.0%) | 22 (100.0%) |
| 5 to 9 Unit Apartments | 0 (0.0%) | 18 (100.0%) |
| 10 or more Apartments | 0 (0.0%) | 9 (100.0%) |
| Mobile Home / Other | 91 (65.9%) | 47 (34.1%) |
| Total | 271 (56.7%) | 207 (43.3%) |
Housing Structures by Number of Rooms in Timpson
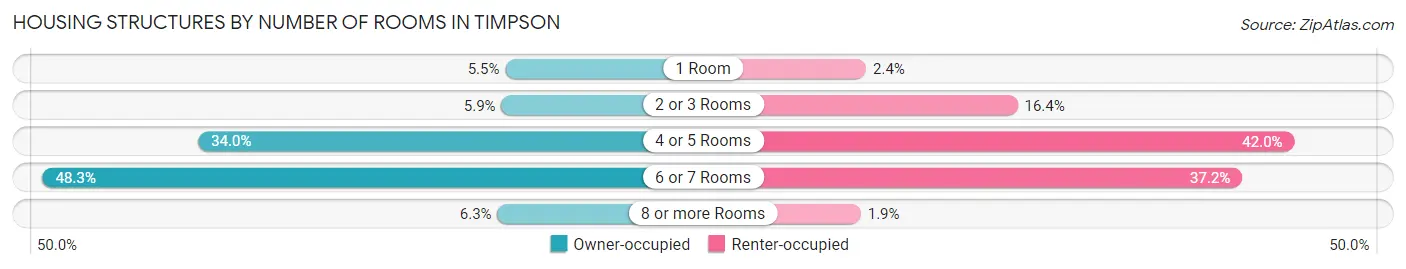
| Number of Rooms | Owner-occupied | Renter-occupied |
| 1 Room | 15 (5.5%) | 5 (2.4%) |
| 2 or 3 Rooms | 16 (5.9%) | 34 (16.4%) |
| 4 or 5 Rooms | 92 (34.0%) | 87 (42.0%) |
| 6 or 7 Rooms | 131 (48.3%) | 77 (37.2%) |
| 8 or more Rooms | 17 (6.3%) | 4 (1.9%) |
| Total | 271 (100.0%) | 207 (100.0%) |
Housing Structure by Heating Type in Timpson
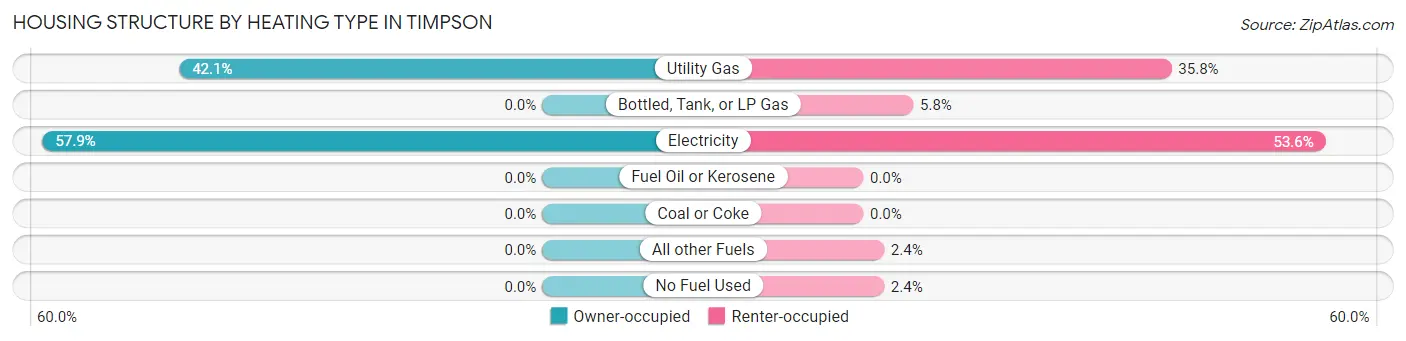
| Heating Type | Owner-occupied | Renter-occupied |
| Utility Gas | 114 (42.1%) | 74 (35.7%) |
| Bottled, Tank, or LP Gas | 0 (0.0%) | 12 (5.8%) |
| Electricity | 157 (57.9%) | 111 (53.6%) |
| Fuel Oil or Kerosene | 0 (0.0%) | 0 (0.0%) |
| Coal or Coke | 0 (0.0%) | 0 (0.0%) |
| All other Fuels | 0 (0.0%) | 5 (2.4%) |
| No Fuel Used | 0 (0.0%) | 5 (2.4%) |
| Total | 271 (100.0%) | 207 (100.0%) |
Household Vehicle Usage in Timpson
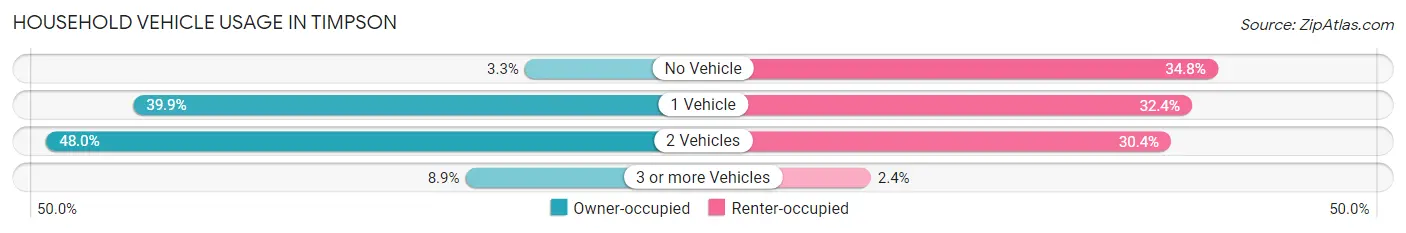
| Vehicles per Household | Owner-occupied | Renter-occupied |
| No Vehicle | 9 (3.3%) | 72 (34.8%) |
| 1 Vehicle | 108 (39.9%) | 67 (32.4%) |
| 2 Vehicles | 130 (48.0%) | 63 (30.4%) |
| 3 or more Vehicles | 24 (8.9%) | 5 (2.4%) |
| Total | 271 (100.0%) | 207 (100.0%) |
Real Estate & Mortgages in Timpson
Real Estate and Mortgage Overview in Timpson
| Characteristic | Without Mortgage | With Mortgage |
| Housing Units | 204 | 67 |
| Median Property Value | $73,000 | $108,700 |
| Median Household Income | $34,239 | $9 |
| Monthly Housing Costs | $339 | $0 |
| Real Estate Taxes | $492 | $9 |
Property Value by Mortgage Status in Timpson
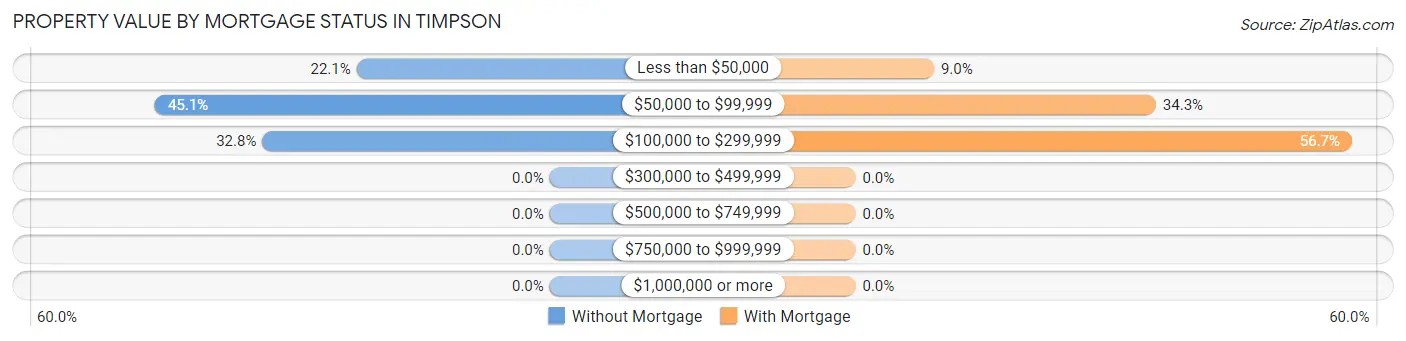
| Property Value | Without Mortgage | With Mortgage |
| Less than $50,000 | 45 (22.1%) | 6 (9.0%) |
| $50,000 to $99,999 | 92 (45.1%) | 23 (34.3%) |
| $100,000 to $299,999 | 67 (32.8%) | 38 (56.7%) |
| $300,000 to $499,999 | 0 (0.0%) | 0 (0.0%) |
| $500,000 to $749,999 | 0 (0.0%) | 0 (0.0%) |
| $750,000 to $999,999 | 0 (0.0%) | 0 (0.0%) |
| $1,000,000 or more | 0 (0.0%) | 0 (0.0%) |
| Total | 204 (100.0%) | 67 (100.0%) |
Household Income by Mortgage Status in Timpson
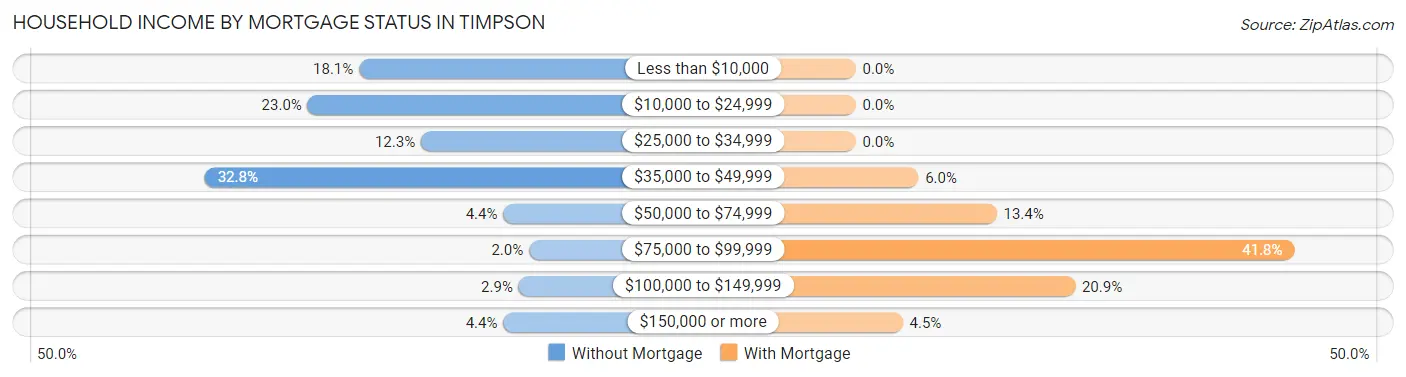
| Household Income | Without Mortgage | With Mortgage |
| Less than $10,000 | 37 (18.1%) | 0 (0.0%) |
| $10,000 to $24,999 | 47 (23.0%) | 0 (0.0%) |
| $25,000 to $34,999 | 25 (12.2%) | 0 (0.0%) |
| $35,000 to $49,999 | 67 (32.8%) | 4 (6.0%) |
| $50,000 to $74,999 | 9 (4.4%) | 9 (13.4%) |
| $75,000 to $99,999 | 4 (2.0%) | 28 (41.8%) |
| $100,000 to $149,999 | 6 (2.9%) | 14 (20.9%) |
| $150,000 or more | 9 (4.4%) | 3 (4.5%) |
| Total | 204 (100.0%) | 67 (100.0%) |
Property Value to Household Income Ratio in Timpson
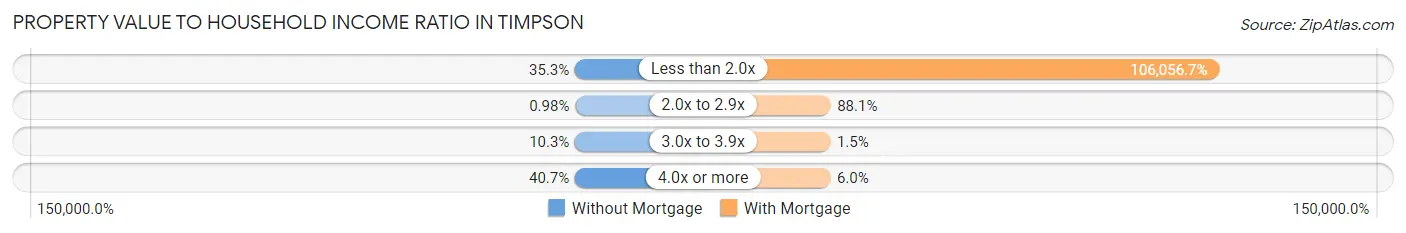
| Value-to-Income Ratio | Without Mortgage | With Mortgage |
| Less than 2.0x | 72 (35.3%) | 71,058 (106,056.7%) |
| 2.0x to 2.9x | 2 (1.0%) | 59 (88.1%) |
| 3.0x to 3.9x | 21 (10.3%) | 1 (1.5%) |
| 4.0x or more | 83 (40.7%) | 4 (6.0%) |
| Total | 204 (100.0%) | 67 (100.0%) |
Real Estate Taxes by Mortgage Status in Timpson
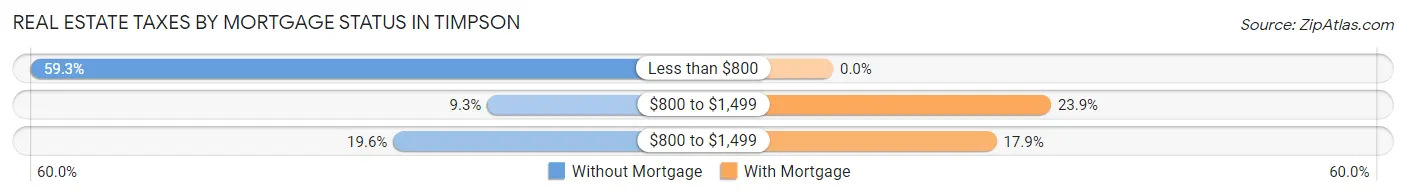
| Property Taxes | Without Mortgage | With Mortgage |
| Less than $800 | 121 (59.3%) | 0 (0.0%) |
| $800 to $1,499 | 19 (9.3%) | 16 (23.9%) |
| $800 to $1,499 | 40 (19.6%) | 12 (17.9%) |
| Total | 204 (100.0%) | 67 (100.0%) |
Health & Disability in Timpson
Health Insurance Coverage by Age in Timpson
| Age Bracket | With Coverage | Without Coverage |
| Under 6 Years | 125 (100.0%) | 0 (0.0%) |
| 6 to 18 Years | 240 (96.8%) | 8 (3.2%) |
| 19 to 25 Years | 134 (97.1%) | 4 (2.9%) |
| 26 to 34 Years | 52 (61.2%) | 33 (38.8%) |
| 35 to 44 Years | 70 (59.3%) | 48 (40.7%) |
| 45 to 54 Years | 114 (98.3%) | 2 (1.7%) |
| 55 to 64 Years | 171 (86.4%) | 27 (13.6%) |
| 65 to 74 Years | 108 (100.0%) | 0 (0.0%) |
| 75 Years and older | 68 (100.0%) | 0 (0.0%) |
| Total | 1,082 (89.9%) | 122 (10.1%) |
Health Insurance Coverage by Citizenship Status in Timpson
| Citizenship Status | With Coverage | Without Coverage |
| Native Born | 125 (100.0%) | 0 (0.0%) |
| Foreign Born, Citizen | 240 (96.8%) | 8 (3.2%) |
| Foreign Born, not a Citizen | 134 (97.1%) | 4 (2.9%) |
Health Insurance Coverage by Household Income in Timpson
| Household Income | With Coverage | Without Coverage |
| Under $25,000 | 246 (80.9%) | 58 (19.1%) |
| $25,000 to $49,999 | 308 (87.5%) | 44 (12.5%) |
| $50,000 to $74,999 | 222 (94.5%) | 13 (5.5%) |
| $75,000 to $99,999 | 70 (90.9%) | 7 (9.1%) |
| $100,000 and over | 236 (100.0%) | 0 (0.0%) |
Public vs Private Health Insurance Coverage by Age in Timpson
| Age Bracket | Public Insurance | Private Insurance |
| Under 6 | 82 (65.6%) | 43 (34.4%) |
| 6 to 18 Years | 134 (54.0%) | 109 (44.0%) |
| 19 to 25 Years | 6 (4.3%) | 128 (92.7%) |
| 25 to 34 Years | 0 (0.0%) | 52 (61.2%) |
| 35 to 44 Years | 4 (3.4%) | 66 (55.9%) |
| 45 to 54 Years | 11 (9.5%) | 103 (88.8%) |
| 55 to 64 Years | 39 (19.7%) | 132 (66.7%) |
| 65 to 74 Years | 108 (100.0%) | 56 (51.8%) |
| 75 Years and over | 68 (100.0%) | 11 (16.2%) |
| Total | 452 (37.5%) | 700 (58.1%) |
Disability Status by Sex by Age in Timpson
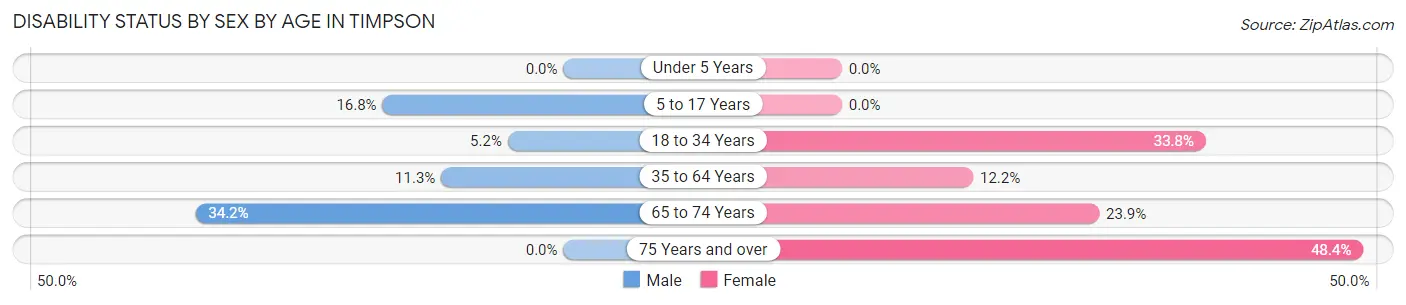
| Age Bracket | Male | Female |
| Under 5 Years | 0 (0.0%) | 0 (0.0%) |
| 5 to 17 Years | 22 (16.8%) | 0 (0.0%) |
| 18 to 34 Years | 8 (5.2%) | 25 (33.8%) |
| 35 to 64 Years | 22 (11.3%) | 29 (12.2%) |
| 65 to 74 Years | 14 (34.2%) | 16 (23.9%) |
| 75 Years and over | 0 (0.0%) | 30 (48.4%) |
Disability Class by Sex by Age in Timpson
Disability Class: Hearing Difficulty
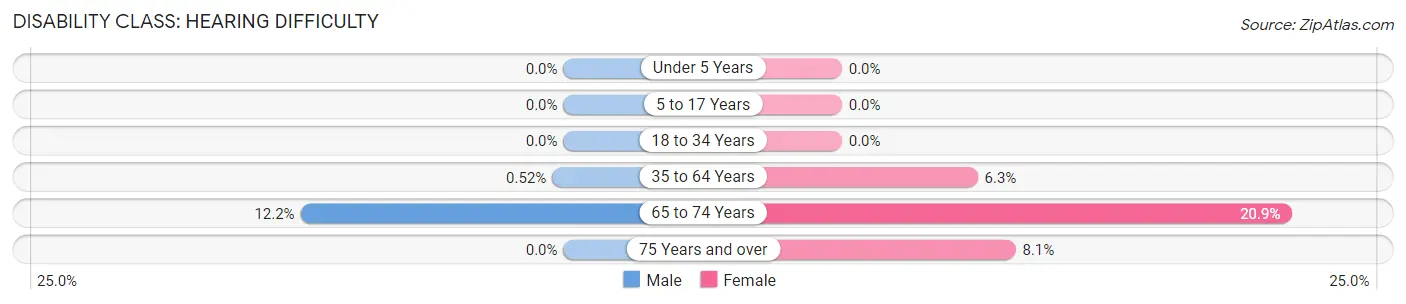
| Age Bracket | Male | Female |
| Under 5 Years | 0 (0.0%) | 0 (0.0%) |
| 5 to 17 Years | 0 (0.0%) | 0 (0.0%) |
| 18 to 34 Years | 0 (0.0%) | 0 (0.0%) |
| 35 to 64 Years | 1 (0.5%) | 15 (6.3%) |
| 65 to 74 Years | 5 (12.2%) | 14 (20.9%) |
| 75 Years and over | 0 (0.0%) | 5 (8.1%) |
Disability Class: Vision Difficulty
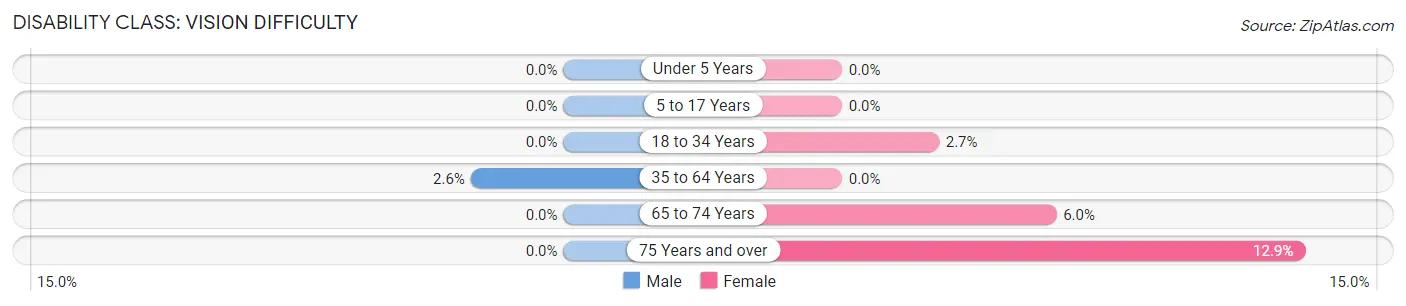
| Age Bracket | Male | Female |
| Under 5 Years | 0 (0.0%) | 0 (0.0%) |
| 5 to 17 Years | 0 (0.0%) | 0 (0.0%) |
| 18 to 34 Years | 0 (0.0%) | 2 (2.7%) |
| 35 to 64 Years | 5 (2.6%) | 0 (0.0%) |
| 65 to 74 Years | 0 (0.0%) | 4 (6.0%) |
| 75 Years and over | 0 (0.0%) | 8 (12.9%) |
Disability Class: Cognitive Difficulty
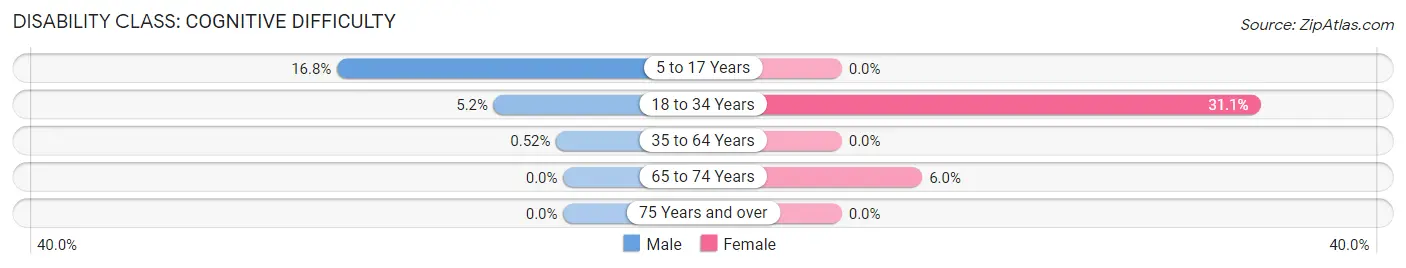
| Age Bracket | Male | Female |
| 5 to 17 Years | 22 (16.8%) | 0 (0.0%) |
| 18 to 34 Years | 8 (5.2%) | 23 (31.1%) |
| 35 to 64 Years | 1 (0.5%) | 0 (0.0%) |
| 65 to 74 Years | 0 (0.0%) | 4 (6.0%) |
| 75 Years and over | 0 (0.0%) | 0 (0.0%) |
Disability Class: Ambulatory Difficulty
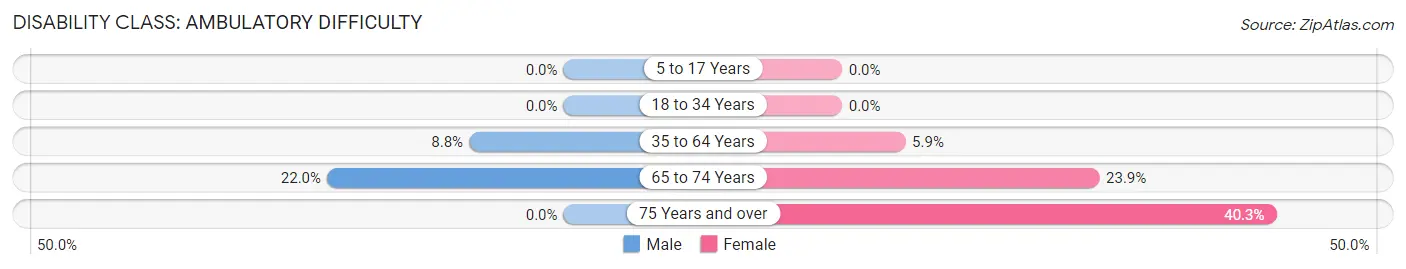
| Age Bracket | Male | Female |
| 5 to 17 Years | 0 (0.0%) | 0 (0.0%) |
| 18 to 34 Years | 0 (0.0%) | 0 (0.0%) |
| 35 to 64 Years | 17 (8.8%) | 14 (5.9%) |
| 65 to 74 Years | 9 (22.0%) | 16 (23.9%) |
| 75 Years and over | 0 (0.0%) | 25 (40.3%) |
Disability Class: Self-Care Difficulty
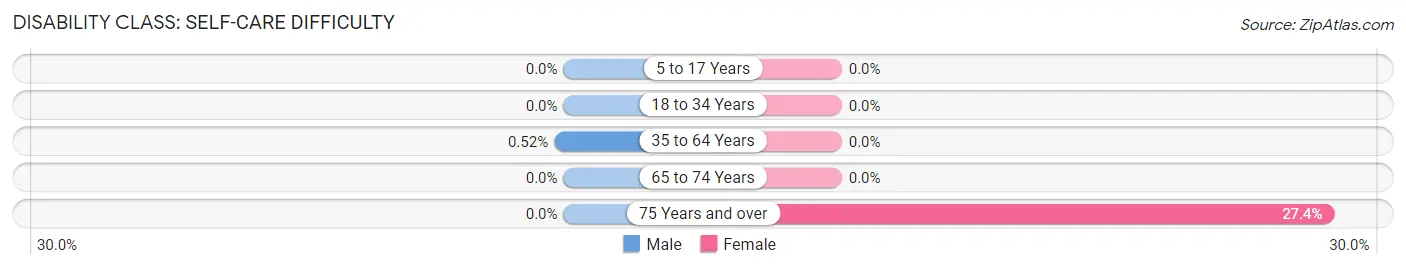
| Age Bracket | Male | Female |
| 5 to 17 Years | 0 (0.0%) | 0 (0.0%) |
| 18 to 34 Years | 0 (0.0%) | 0 (0.0%) |
| 35 to 64 Years | 1 (0.5%) | 0 (0.0%) |
| 65 to 74 Years | 0 (0.0%) | 0 (0.0%) |
| 75 Years and over | 0 (0.0%) | 17 (27.4%) |
Technology Access in Timpson
Computing Device Access in Timpson
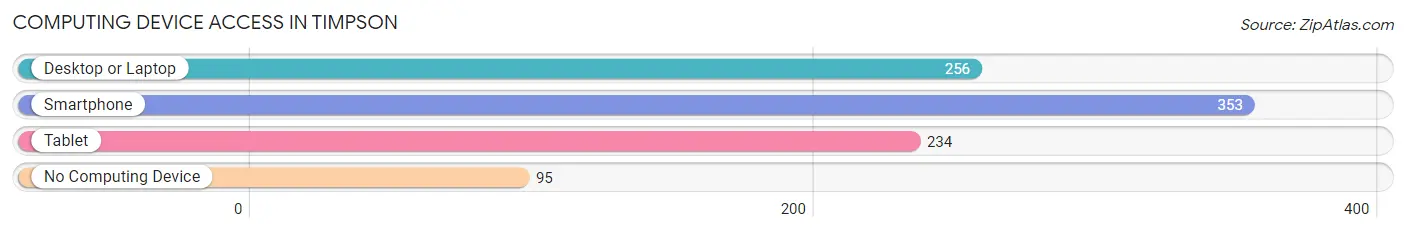
| Device Type | # Households | % Households |
| Desktop or Laptop | 256 | 53.6% |
| Smartphone | 353 | 73.9% |
| Tablet | 234 | 48.9% |
| No Computing Device | 95 | 19.9% |
| Total | 478 | 100.0% |
Internet Access in Timpson
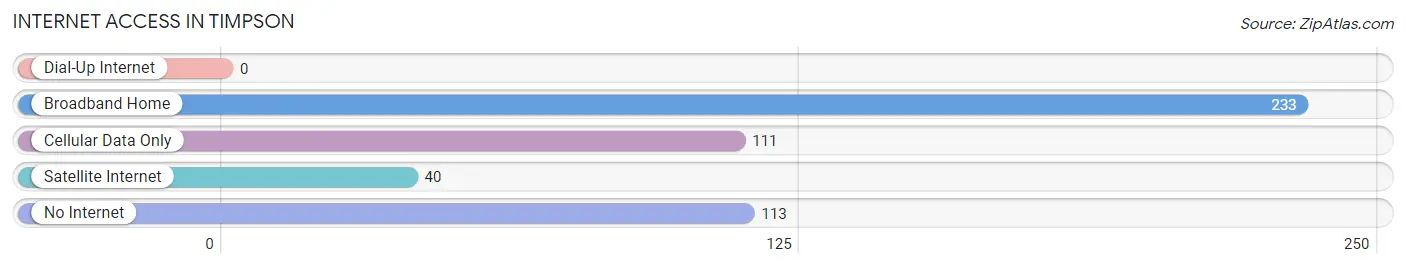
| Internet Type | # Households | % Households |
| Dial-Up Internet | 0 | 0.0% |
| Broadband Home | 233 | 48.7% |
| Cellular Data Only | 111 | 23.2% |
| Satellite Internet | 40 | 8.4% |
| No Internet | 113 | 23.6% |
| Total | 478 | 100.0% |
Timpson Summary
Timpson, Texas is a small town located in the northeastern corner of the state, in Shelby County. It is situated on the banks of the Angelina River, and is surrounded by rolling hills and pine forests. The town was founded in 1873, and has a population of 1,788 as of the 2010 census.
History
Timpson was founded in 1873 by a group of settlers from Tennessee, led by William Timpson. The town was named after him, and the first post office was established in 1875. The town grew slowly, and by the early 1900s had a population of around 500.
Timpson was an agricultural community, and the main crops grown were cotton, corn, and hay. The town also had a sawmill, a gristmill, and a cotton gin. In the early 1900s, the town was also home to a number of businesses, including a bank, a hotel, a drug store, and a general store.
In the 1920s, the town began to experience a period of growth, as the timber industry began to expand in the area. The town was also home to a number of oil wells, and the population grew to around 1,000 by the 1930s.
Geography
Timpson is located in the northeastern corner of Texas, in Shelby County. It is situated on the banks of the Angelina River, and is surrounded by rolling hills and pine forests. The town is located about 80 miles northeast of Houston, and about 50 miles south of Tyler.
The climate in Timpson is humid subtropical, with hot summers and mild winters. The average annual temperature is around 68 degrees Fahrenheit, and the average annual precipitation is around 45 inches.
Economy
Timpson’s economy is largely based on agriculture and timber. The town is home to a number of farms, and the main crops grown are cotton, corn, and hay. The timber industry is also an important part of the local economy, and the town is home to a number of sawmills and lumber companies.
In addition, the town is home to a number of small businesses, including restaurants, retail stores, and service providers. The town also has a number of manufacturing companies, including a furniture factory and a plastics factory.
Demographics
As of the 2010 census, Timpson had a population of 1,788. The racial makeup of the town was 79.3% White, 17.2% African American, 0.7% Native American, 0.3% Asian, 0.1% Pacific Islander, and 2.4% from other races. Hispanic or Latino of any race were 4.2% of the population.
The median household income in Timpson was $31,250, and the median family income was $37,500. The per capita income was $15,945. About 18.2% of the population was below the poverty line.
Timpson is a small town with a rich history and a strong sense of community. The town is home to a number of farms and businesses, and the economy is largely based on agriculture and timber. The town is also home to a diverse population, with a mix of races and ethnicities.
Common Questions
What is Per Capita Income in Timpson?
Per Capita income in Timpson is $18,999.
What is the Median Family Income in Timpson?
Median Family Income in Timpson is $50,500.
What is the Median Household income in Timpson?
Median Household Income in Timpson is $37,500.
What is Income or Wage Gap in Timpson?
Income or Wage Gap in Timpson is 55.0%.
Women in Timpson earn 45.0 cents for every dollar earned by a man.
What is Inequality or Gini Index in Timpson?
Inequality or Gini Index in Timpson is 0.45.
What is the Total Population of Timpson?
Total Population of Timpson is 1,204.
What is the Total Male Population of Timpson?
Total Male Population of Timpson is 565.
What is the Total Female Population of Timpson?
Total Female Population of Timpson is 639.
What is the Ratio of Males per 100 Females in Timpson?
There are 88.42 Males per 100 Females in Timpson.
What is the Ratio of Females per 100 Males in Timpson?
There are 113.10 Females per 100 Males in Timpson.
What is the Median Population Age in Timpson?
Median Population Age in Timpson is 37.1 Years.
What is the Average Family Size in Timpson
Average Family Size in Timpson is 3.6 People.
What is the Average Household Size in Timpson
Average Household Size in Timpson is 2.5 People.
How Large is the Labor Force in Timpson?
There are 447 People in the Labor Forcein in Timpson.
What is the Percentage of People in the Labor Force in Timpson?
50.2% of People are in the Labor Force in Timpson.
What is the Unemployment Rate in Timpson?
Unemployment Rate in Timpson is 3.1%.