Zip Codes with the Highest Percentage of Population Employed in Food Preparation & Serving in Missouri City, TX
RELATED REPORTS & OPTIONS
Food Preparation & Serving
Missouri City
Compare Zip Codes
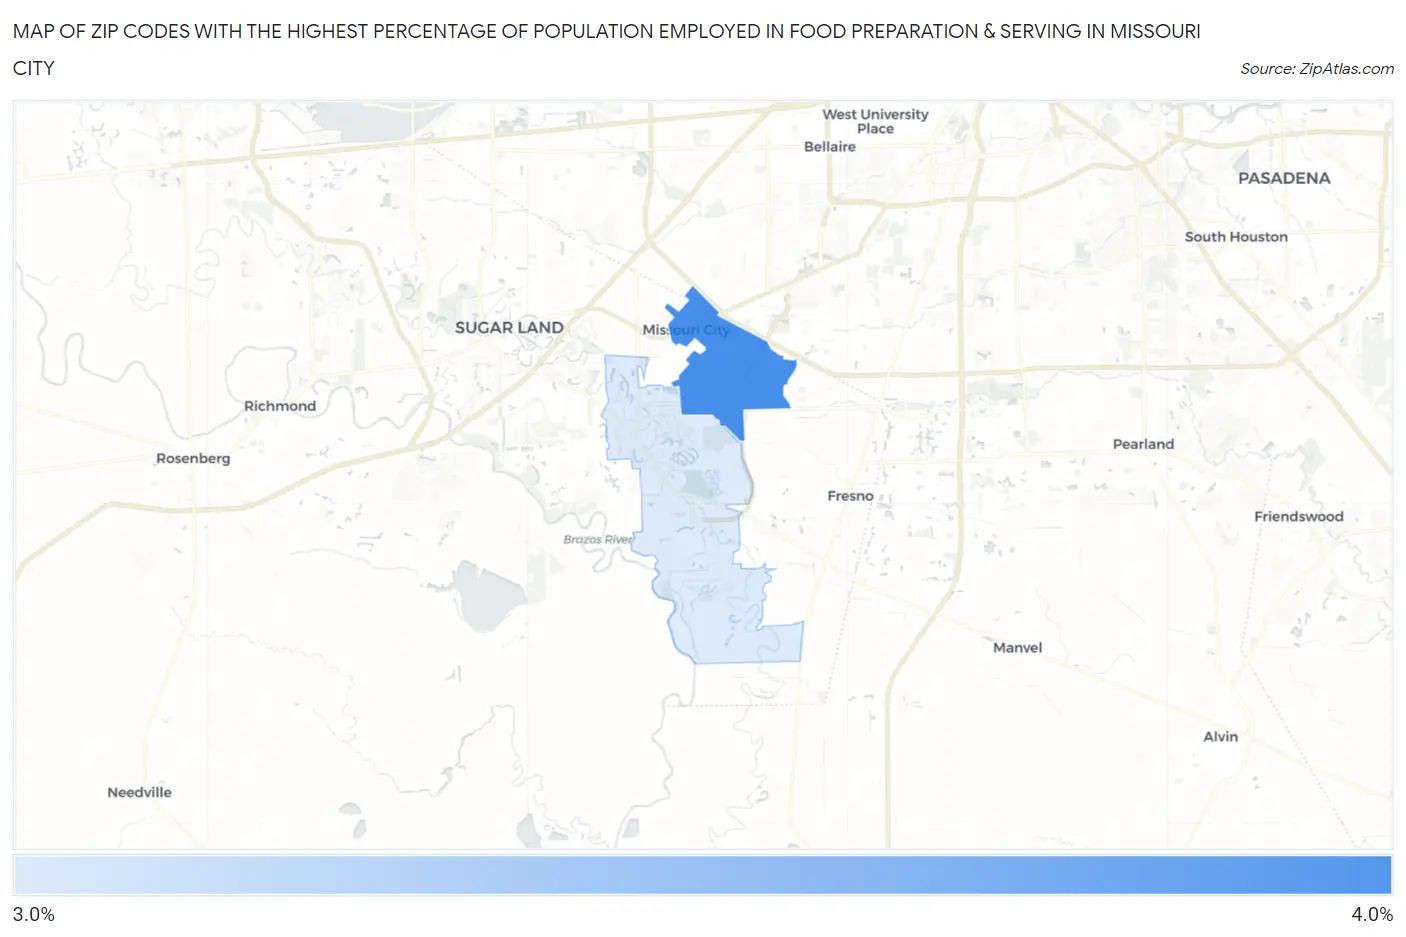
Map of Zip Codes with the Highest Percentage of Population Employed in Food Preparation & Serving in Missouri City
3.4%
3.8%
Zip Codes with the Highest Percentage of Population Employed in Food Preparation & Serving in Missouri City, TX
| Zip Code | % Employed | vs State | vs National | |
| 1. | 77489 | 3.8% | 5.4%(-1.58)#1,096 | 5.3%(-1.51)#18,045 |
| 2. | 77459 | 3.4% | 5.4%(-1.97)#1,179 | 5.3%(-1.91)#19,700 |
1
Common Questions
What are the Top Zip Codes with the Highest Percentage of Population Employed in Food Preparation & Serving in Missouri City, TX?
Top Zip Codes with the Highest Percentage of Population Employed in Food Preparation & Serving in Missouri City, TX are:
What zip code has the Highest Percentage of Population Employed in Food Preparation & Serving in Missouri City, TX?
77489 has the Highest Percentage of Population Employed in Food Preparation & Serving in Missouri City, TX with 3.8%.
What is the Percentage of Population Employed in Food Preparation & Serving in Missouri City, TX?
Percentage of Population Employed in Food Preparation & Serving in Missouri City is 3.5%.
What is the Percentage of Population Employed in Food Preparation & Serving in Texas?
Percentage of Population Employed in Food Preparation & Serving in Texas is 5.4%.
What is the Percentage of Population Employed in Food Preparation & Serving in the United States?
Percentage of Population Employed in Food Preparation & Serving in the United States is 5.3%.