Zip Codes with the Highest Percentage of Population Employed in Food Preparation & Serving in Houston, TX
RELATED REPORTS & OPTIONS
Food Preparation & Serving
Houston
Compare Zip Codes
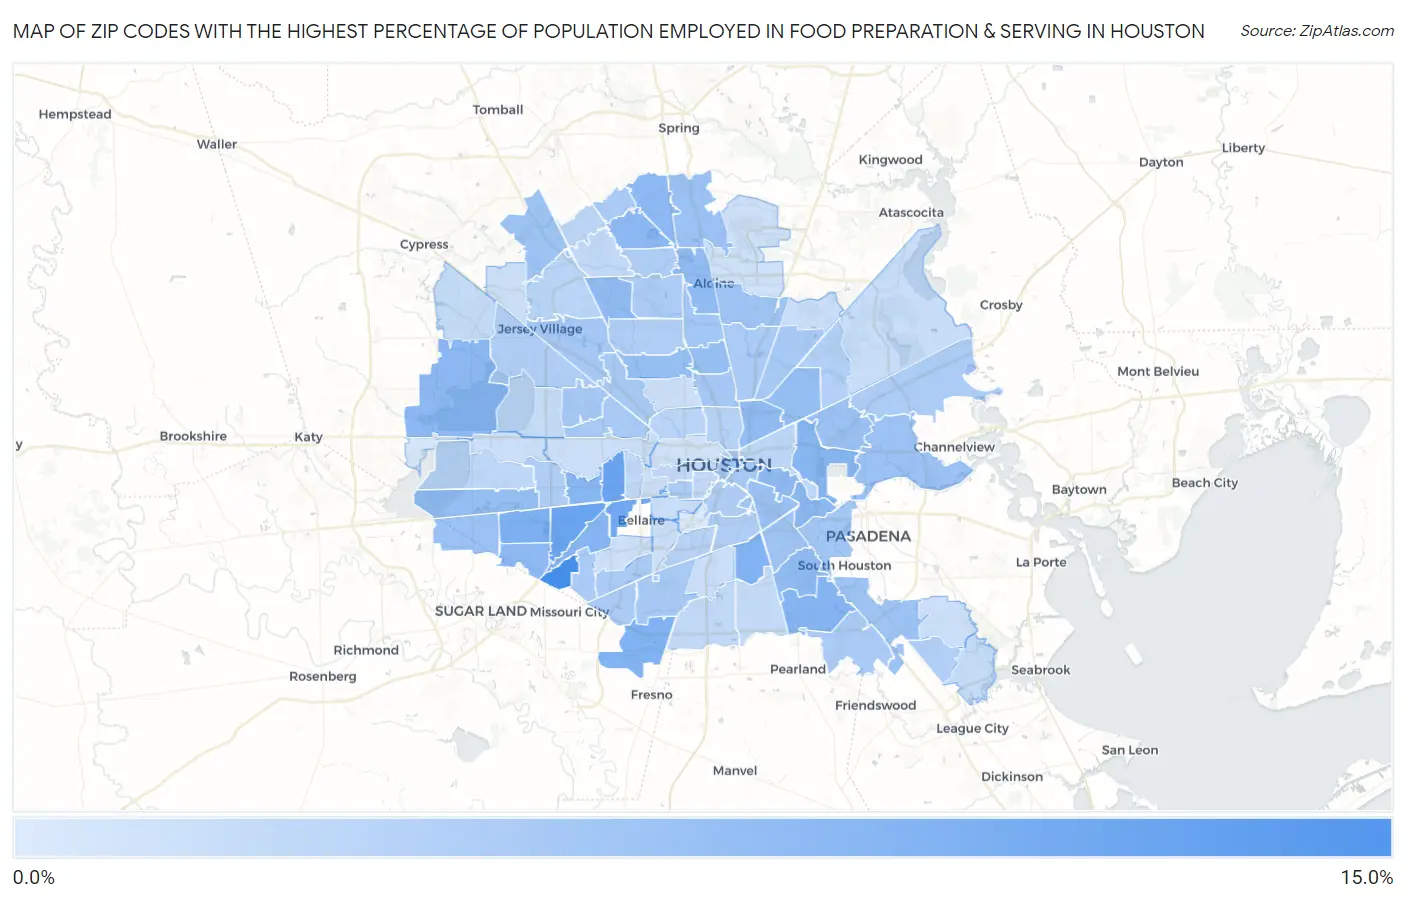
Map of Zip Codes with the Highest Percentage of Population Employed in Food Preparation & Serving in Houston
1.1%
14.4%
Zip Codes with the Highest Percentage of Population Employed in Food Preparation & Serving in Houston, TX
| Zip Code | % Employed | vs State | vs National | |
| 1. | 77031 | 14.4% | 5.4%(+9.04)#58 | 5.3%(+9.10)#1,082 |
| 2. | 77057 | 11.2% | 5.4%(+5.84)#105 | 5.3%(+5.91)#1,961 |
| 3. | 77036 | 11.1% | 5.4%(+5.76)#106 | 5.3%(+5.83)#1,994 |
| 4. | 77081 | 10.6% | 5.4%(+5.27)#122 | 5.3%(+5.34)#2,248 |
| 5. | 77072 | 9.4% | 5.4%(+4.08)#168 | 5.3%(+4.14)#3,111 |
| 6. | 77053 | 9.0% | 5.4%(+3.67)#198 | 5.3%(+3.74)#3,504 |
| 7. | 77033 | 9.0% | 5.4%(+3.65)#203 | 5.3%(+3.72)#3,529 |
| 8. | 77074 | 8.7% | 5.4%(+3.39)#222 | 5.3%(+3.45)#3,799 |
| 9. | 77075 | 8.6% | 5.4%(+3.26)#232 | 5.3%(+3.33)#3,954 |
| 10. | 77063 | 8.5% | 5.4%(+3.14)#246 | 5.3%(+3.21)#4,079 |
| 11. | 77029 | 8.4% | 5.4%(+3.09)#251 | 5.3%(+3.16)#4,123 |
| 12. | 77014 | 8.2% | 5.4%(+2.80)#272 | 5.3%(+2.87)#4,501 |
| 13. | 77084 | 8.2% | 5.4%(+2.80)#273 | 5.3%(+2.87)#4,502 |
| 14. | 77012 | 8.1% | 5.4%(+2.73)#283 | 5.3%(+2.80)#4,591 |
| 15. | 77090 | 7.8% | 5.4%(+2.47)#309 | 5.3%(+2.53)#5,019 |
| 16. | 77011 | 7.8% | 5.4%(+2.43)#314 | 5.3%(+2.49)#5,091 |
| 17. | 77099 | 7.8% | 5.4%(+2.40)#315 | 5.3%(+2.47)#5,135 |
| 18. | 77061 | 7.7% | 5.4%(+2.39)#316 | 5.3%(+2.46)#5,144 |
| 19. | 77060 | 7.7% | 5.4%(+2.38)#321 | 5.3%(+2.44)#5,166 |
| 20. | 77086 | 7.6% | 5.4%(+2.27)#329 | 5.3%(+2.33)#5,347 |
| 21. | 77026 | 7.6% | 5.4%(+2.24)#330 | 5.3%(+2.30)#5,397 |
| 22. | 77028 | 7.3% | 5.4%(+1.93)#377 | 5.3%(+2.00)#5,955 |
| 23. | 77091 | 7.3% | 5.4%(+1.93)#378 | 5.3%(+1.99)#5,964 |
| 24. | 77082 | 7.3% | 5.4%(+1.91)#382 | 5.3%(+1.97)#6,008 |
| 25. | 77076 | 7.2% | 5.4%(+1.87)#386 | 5.3%(+1.94)#6,083 |
| 26. | 77013 | 6.9% | 5.4%(+1.57)#423 | 5.3%(+1.63)#6,773 |
| 27. | 77073 | 6.7% | 5.4%(+1.38)#447 | 5.3%(+1.44)#7,267 |
| 28. | 77083 | 6.7% | 5.4%(+1.34)#451 | 5.3%(+1.41)#7,347 |
| 29. | 77015 | 6.7% | 5.4%(+1.32)#457 | 5.3%(+1.39)#7,405 |
| 30. | 77023 | 6.6% | 5.4%(+1.25)#472 | 5.3%(+1.31)#7,606 |
| 31. | 77204 | 6.5% | 5.4%(+1.17)#484 | 5.3%(+1.24)#7,824 |
| 32. | 77070 | 6.4% | 5.4%(+1.09)#492 | 5.3%(+1.16)#8,019 |
| 33. | 77039 | 6.4% | 5.4%(+1.07)#497 | 5.3%(+1.14)#8,079 |
| 34. | 77034 | 6.4% | 5.4%(+1.02)#506 | 5.3%(+1.09)#8,218 |
| 35. | 77087 | 6.3% | 5.4%(+0.945)#513 | 5.3%(+1.01)#8,447 |
| 36. | 77017 | 6.1% | 5.4%(+0.714)#553 | 5.3%(+0.779)#9,126 |
| 37. | 77037 | 6.0% | 5.4%(+0.618)#573 | 5.3%(+0.683)#9,443 |
| 38. | 77002 | 5.9% | 5.4%(+0.576)#583 | 5.3%(+0.641)#9,583 |
| 39. | 77080 | 5.8% | 5.4%(+0.475)#598 | 5.3%(+0.540)#9,948 |
| 40. | 77040 | 5.8% | 5.4%(+0.425)#607 | 5.3%(+0.490)#10,103 |
| 41. | 77003 | 5.7% | 5.4%(+0.389)#612 | 5.3%(+0.455)#10,206 |
| 42. | 77022 | 5.7% | 5.4%(+0.369)#617 | 5.3%(+0.434)#10,272 |
| 43. | 77045 | 5.7% | 5.4%(+0.327)#628 | 5.3%(+0.392)#10,435 |
| 44. | 77092 | 5.7% | 5.4%(+0.313)#631 | 5.3%(+0.378)#10,471 |
| 45. | 77016 | 5.6% | 5.4%(+0.240)#651 | 5.3%(+0.305)#10,740 |
| 46. | 77055 | 5.6% | 5.4%(+0.207)#659 | 5.3%(+0.272)#10,847 |
| 47. | 77093 | 5.4% | 5.4%(+0.097)#685 | 5.3%(+0.162)#11,232 |
| 48. | 77085 | 5.4% | 5.4%(+0.087)#688 | 5.3%(+0.152)#11,274 |
| 49. | 77098 | 5.4% | 5.4%(+0.056)#691 | 5.3%(+0.121)#11,375 |
| 50. | 77035 | 5.4% | 5.4%(+0.031)#701 | 5.3%(+0.096)#11,465 |
| 51. | 77068 | 5.4% | 5.4%(+0.000)#712 | 5.3%(+0.066)#11,574 |
| 52. | 77071 | 5.3% | 5.4%(-0.003)#714 | 5.3%(+0.063)#11,585 |
| 53. | 77089 | 5.3% | 5.4%(-0.012)#719 | 5.3%(+0.054)#11,622 |
| 54. | 77049 | 5.2% | 5.4%(-0.172)#760 | 5.3%(-0.106)#12,240 |
| 55. | 77038 | 5.2% | 5.4%(-0.173)#763 | 5.3%(-0.107)#12,246 |
| 56. | 77042 | 5.0% | 5.4%(-0.325)#804 | 5.3%(-0.259)#12,838 |
| 57. | 77041 | 5.0% | 5.4%(-0.381)#817 | 5.3%(-0.316)#13,061 |
| 58. | 77067 | 4.9% | 5.4%(-0.418)#824 | 5.3%(-0.353)#13,215 |
| 59. | 77004 | 4.9% | 5.4%(-0.420)#825 | 5.3%(-0.355)#13,223 |
| 60. | 77062 | 4.9% | 5.4%(-0.497)#843 | 5.3%(-0.432)#13,545 |
| 61. | 77088 | 4.8% | 5.4%(-0.507)#848 | 5.3%(-0.442)#13,593 |
| 62. | 77021 | 4.7% | 5.4%(-0.602)#869 | 5.3%(-0.537)#13,952 |
| 63. | 77078 | 4.7% | 5.4%(-0.673)#886 | 5.3%(-0.608)#14,250 |
| 64. | 77009 | 4.5% | 5.4%(-0.878)#931 | 5.3%(-0.813)#15,135 |
| 65. | 77054 | 4.3% | 5.4%(-1.04)#960 | 5.3%(-0.975)#15,842 |
| 66. | 77008 | 4.0% | 5.4%(-1.32)#1,036 | 5.3%(-1.26)#17,007 |
| 67. | 77064 | 4.0% | 5.4%(-1.32)#1,037 | 5.3%(-1.26)#17,013 |
| 68. | 77020 | 3.9% | 5.4%(-1.44)#1,063 | 5.3%(-1.38)#17,489 |
| 69. | 77069 | 3.9% | 5.4%(-1.48)#1,073 | 5.3%(-1.42)#17,677 |
| 70. | 77077 | 3.7% | 5.4%(-1.69)#1,125 | 5.3%(-1.63)#18,540 |
| 71. | 77056 | 3.5% | 5.4%(-1.80)#1,143 | 5.3%(-1.74)#19,012 |
| 72. | 77006 | 3.5% | 5.4%(-1.83)#1,150 | 5.3%(-1.77)#19,134 |
| 73. | 77019 | 3.5% | 5.4%(-1.90)#1,163 | 5.3%(-1.84)#19,398 |
| 74. | 77047 | 3.4% | 5.4%(-1.96)#1,178 | 5.3%(-1.90)#19,660 |
| 75. | 77066 | 3.3% | 5.4%(-2.01)#1,192 | 5.3%(-1.94)#19,876 |
| 76. | 77048 | 3.3% | 5.4%(-2.03)#1,196 | 5.3%(-1.96)#19,974 |
| 77. | 77058 | 3.1% | 5.4%(-2.21)#1,233 | 5.3%(-2.14)#20,690 |
| 78. | 77043 | 3.1% | 5.4%(-2.27)#1,250 | 5.3%(-2.21)#20,945 |
| 79. | 77095 | 3.1% | 5.4%(-2.28)#1,254 | 5.3%(-2.21)#20,976 |
| 80. | 77005 | 2.8% | 5.4%(-2.51)#1,298 | 5.3%(-2.45)#21,913 |
| 81. | 77044 | 2.8% | 5.4%(-2.57)#1,309 | 5.3%(-2.50)#22,105 |
| 82. | 77050 | 2.6% | 5.4%(-2.71)#1,332 | 5.3%(-2.65)#22,645 |
| 83. | 77051 | 2.6% | 5.4%(-2.73)#1,336 | 5.3%(-2.66)#22,691 |
| 84. | 77018 | 2.5% | 5.4%(-2.81)#1,354 | 5.3%(-2.74)#23,009 |
| 85. | 77027 | 2.5% | 5.4%(-2.86)#1,360 | 5.3%(-2.79)#23,187 |
| 86. | 77025 | 2.5% | 5.4%(-2.87)#1,362 | 5.3%(-2.81)#23,221 |
| 87. | 77079 | 2.4% | 5.4%(-2.96)#1,373 | 5.3%(-2.89)#23,472 |
| 88. | 77024 | 2.4% | 5.4%(-2.97)#1,374 | 5.3%(-2.90)#23,506 |
| 89. | 77059 | 2.4% | 5.4%(-2.97)#1,375 | 5.3%(-2.91)#23,519 |
| 90. | 77065 | 2.3% | 5.4%(-3.01)#1,378 | 5.3%(-2.95)#23,650 |
| 91. | 77096 | 2.3% | 5.4%(-3.05)#1,382 | 5.3%(-2.99)#23,789 |
| 92. | 77032 | 2.3% | 5.4%(-3.09)#1,388 | 5.3%(-3.02)#23,905 |
| 93. | 77007 | 2.2% | 5.4%(-3.18)#1,411 | 5.3%(-3.12)#24,205 |
| 94. | 77094 | 1.5% | 5.4%(-3.89)#1,517 | 5.3%(-3.82)#26,075 |
| 95. | 77010 | 1.2% | 5.4%(-4.17)#1,548 | 5.3%(-4.11)#26,640 |
| 96. | 77030 | 1.1% | 5.4%(-4.25)#1,552 | 5.3%(-4.18)#26,794 |
1
Common Questions
What are the Top 10 Zip Codes with the Highest Percentage of Population Employed in Food Preparation & Serving in Houston, TX?
Top 10 Zip Codes with the Highest Percentage of Population Employed in Food Preparation & Serving in Houston, TX are:
What zip code has the Highest Percentage of Population Employed in Food Preparation & Serving in Houston, TX?
77031 has the Highest Percentage of Population Employed in Food Preparation & Serving in Houston, TX with 14.4%.
What is the Percentage of Population Employed in Food Preparation & Serving in Houston, TX?
Percentage of Population Employed in Food Preparation & Serving in Houston is 5.8%.
What is the Percentage of Population Employed in Food Preparation & Serving in Texas?
Percentage of Population Employed in Food Preparation & Serving in Texas is 5.4%.
What is the Percentage of Population Employed in Food Preparation & Serving in the United States?
Percentage of Population Employed in Food Preparation & Serving in the United States is 5.3%.