Preston, TX Map & Demographics
Preston Map
Preston Overview
$31,935
PER CAPITA INCOME
$60,054
AVG FAMILY INCOME
$57,801
AVG HOUSEHOLD INCOME
20.9%
WAGE / INCOME GAP [ % ]
79.1¢/ $1
WAGE / INCOME GAP [ $ ]
0.36
INEQUALITY / GINI INDEX
2,181
TOTAL POPULATION
1,044
MALE POPULATION
1,137
FEMALE POPULATION
91.82
MALES / 100 FEMALES
108.91
FEMALES / 100 MALES
47.7
MEDIAN AGE
3.5
AVG FAMILY SIZE
2.3
AVG HOUSEHOLD SIZE
1,226
LABOR FORCE [ PEOPLE ]
65.4%
PERCENT IN LABOR FORCE
8.8%
UNEMPLOYMENT RATE
Income in Preston
Income Overview in Preston
Per Capita Income in Preston is $31,935, while median incomes of families and households are $60,054 and $57,801 respectively.
| Characteristic | Number | Measure |
| Per Capita Income | 2,181 | $31,935 |
| Median Family Income | 431 | $60,054 |
| Mean Family Income | 431 | $66,009 |
| Median Household Income | 947 | $57,801 |
| Mean Household Income | 947 | $72,359 |
| Income Deficit | 431 | $0 |
| Wage / Income Gap (%) | 2,181 | 20.88% |
| Wage / Income Gap ($) | 2,181 | 79.12¢ per $1 |
| Gini / Inequality Index | 2,181 | 0.36 |
Earnings by Sex in Preston
Average Earnings in Preston are $34,550, $38,446 for men and $30,417 for women, a difference of 20.9%.
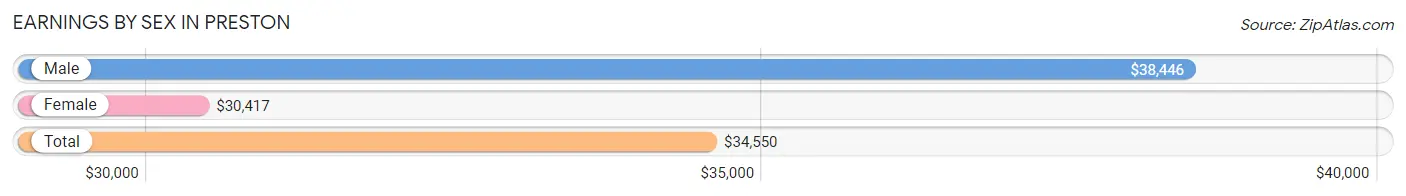
| Sex | Number | Average Earnings |
| Male | 581 (46.4%) | $38,446 |
| Female | 670 (53.6%) | $30,417 |
| Total | 1,251 (100.0%) | $34,550 |
Earnings by Sex by Income Bracket in Preston
The most common earnings brackets in Preston are $17,500 to $19,999 for men (143 | 24.6%) and $45,000 to $49,999 for women (91 | 13.6%).
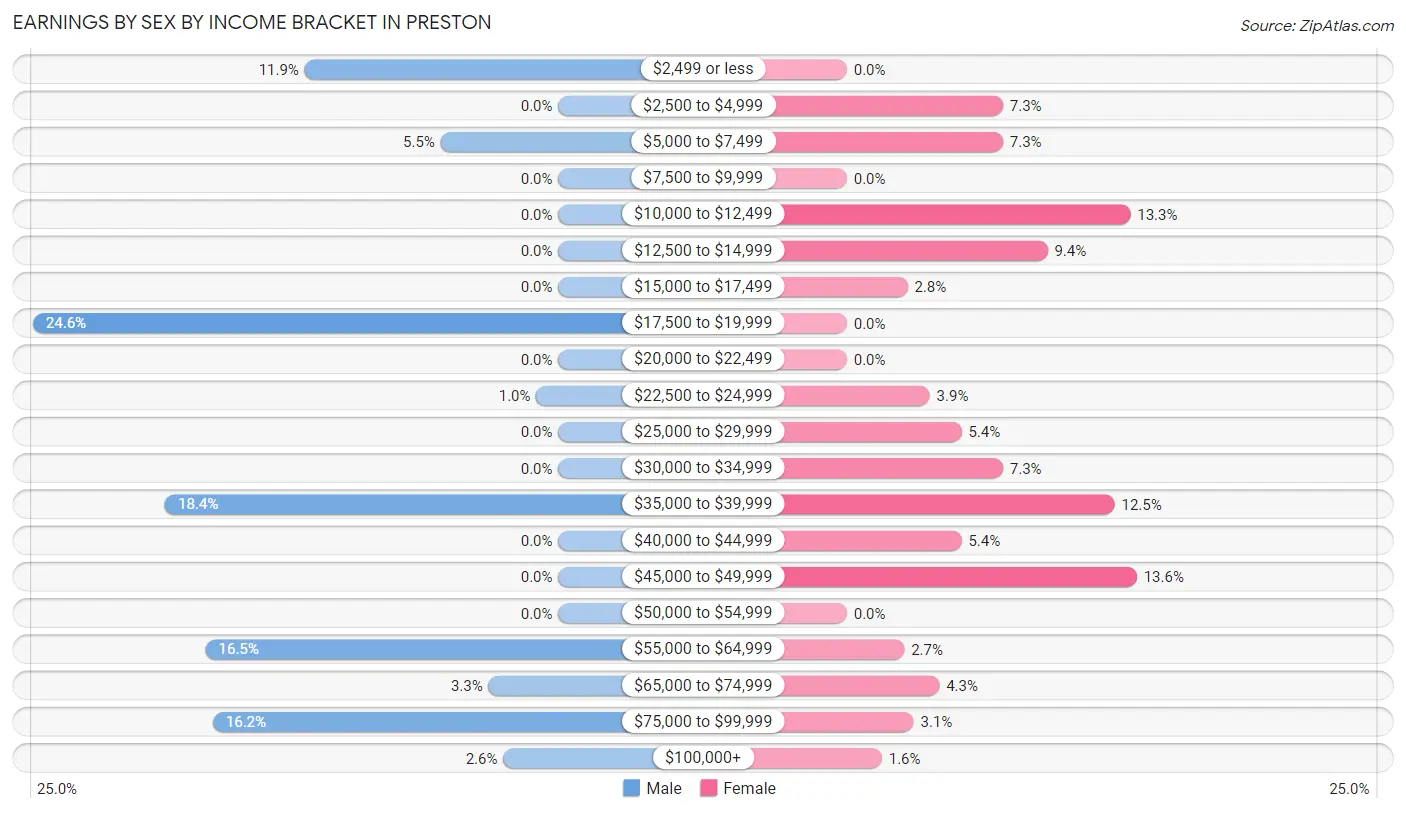
| Income | Male | Female |
| $2,499 or less | 69 (11.9%) | 0 (0.0%) |
| $2,500 to $4,999 | 0 (0.0%) | 49 (7.3%) |
| $5,000 to $7,499 | 32 (5.5%) | 49 (7.3%) |
| $7,500 to $9,999 | 0 (0.0%) | 0 (0.0%) |
| $10,000 to $12,499 | 0 (0.0%) | 89 (13.3%) |
| $12,500 to $14,999 | 0 (0.0%) | 63 (9.4%) |
| $15,000 to $17,499 | 0 (0.0%) | 19 (2.8%) |
| $17,500 to $19,999 | 143 (24.6%) | 0 (0.0%) |
| $20,000 to $22,499 | 0 (0.0%) | 0 (0.0%) |
| $22,500 to $24,999 | 6 (1.0%) | 26 (3.9%) |
| $25,000 to $29,999 | 0 (0.0%) | 36 (5.4%) |
| $30,000 to $34,999 | 0 (0.0%) | 49 (7.3%) |
| $35,000 to $39,999 | 107 (18.4%) | 84 (12.5%) |
| $40,000 to $44,999 | 0 (0.0%) | 36 (5.4%) |
| $45,000 to $49,999 | 0 (0.0%) | 91 (13.6%) |
| $50,000 to $54,999 | 0 (0.0%) | 0 (0.0%) |
| $55,000 to $64,999 | 96 (16.5%) | 18 (2.7%) |
| $65,000 to $74,999 | 19 (3.3%) | 29 (4.3%) |
| $75,000 to $99,999 | 94 (16.2%) | 21 (3.1%) |
| $100,000+ | 15 (2.6%) | 11 (1.6%) |
| Total | 581 (100.0%) | 670 (100.0%) |
Earnings by Sex by Educational Attainment in Preston
Average earnings in Preston are $38,446 for men and $33,750 for women, a difference of 12.2%. Men with an educational attainment of college or associate's degree enjoy the highest average annual earnings of $37,967, while those with college or associate's degree education earn the least with $37,967. Women with an educational attainment of college or associate's degree earn the most with the average annual earnings of $38,318, while those with high school diploma education have the smallest earnings of $15,329.
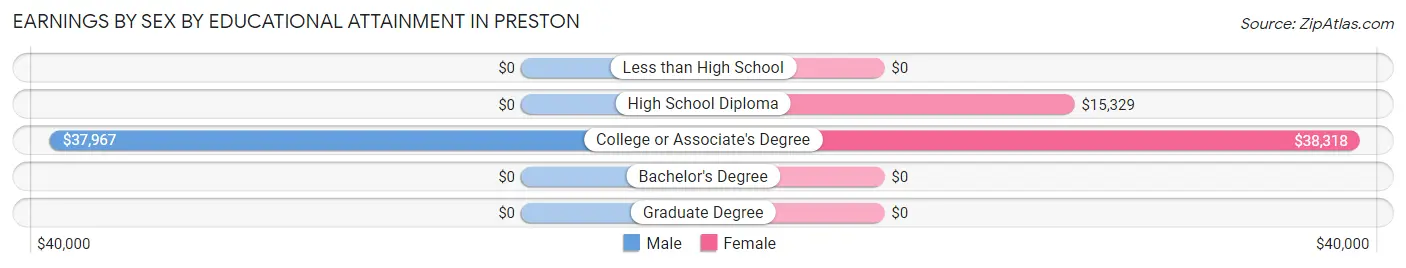
| Educational Attainment | Male Income | Female Income |
| Less than High School | - | - |
| High School Diploma | - | - |
| College or Associate's Degree | $37,967 | $38,318 |
| Bachelor's Degree | - | - |
| Graduate Degree | - | - |
| Total | $38,446 | $33,750 |
Family Income in Preston
Family Income Brackets in Preston
According to the Preston family income data, there are 183 families falling into the $50,000 to $74,999 income range, which is the most common income bracket and makes up 42.5% of all families.
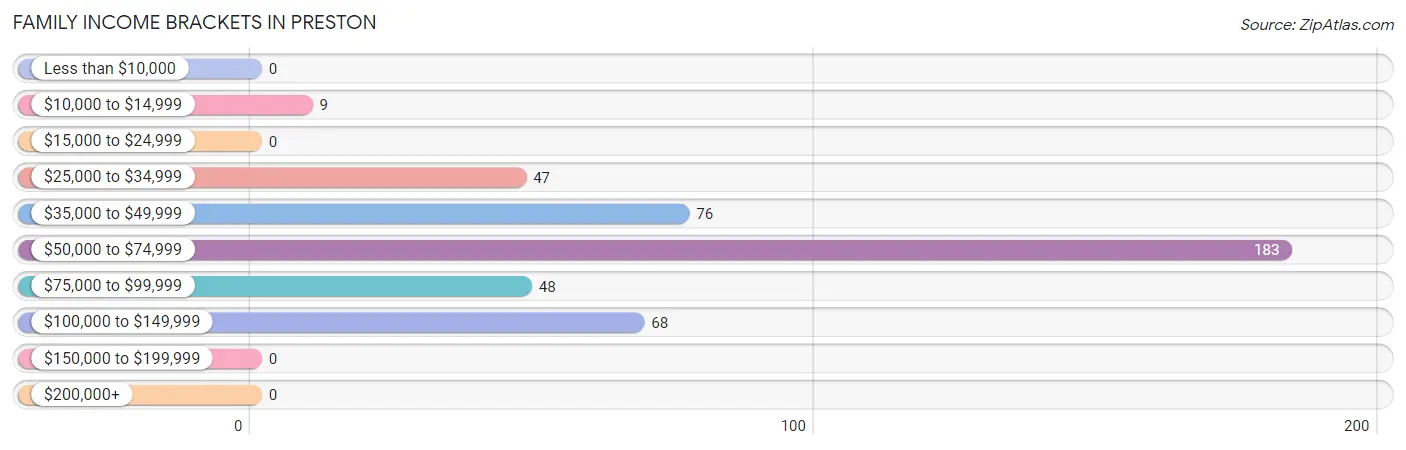
| Income Bracket | # Families | % Families |
| Less than $10,000 | 0 | 0.0% |
| $10,000 to $14,999 | 9 | 2.1% |
| $15,000 to $24,999 | 0 | 0.0% |
| $25,000 to $34,999 | 47 | 10.9% |
| $35,000 to $49,999 | 76 | 17.6% |
| $50,000 to $74,999 | 183 | 42.5% |
| $75,000 to $99,999 | 48 | 11.1% |
| $100,000 to $149,999 | 68 | 15.8% |
| $150,000 to $199,999 | 0 | 0.0% |
| $200,000+ | 0 | 0.0% |
Family Income by Famaliy Size in Preston
2-person families (231 | 53.6%) account for the highest median family income in Preston with $50,662 per family, while 2-person families (231 | 53.6%) have the highest median income of $25,331 per family member.
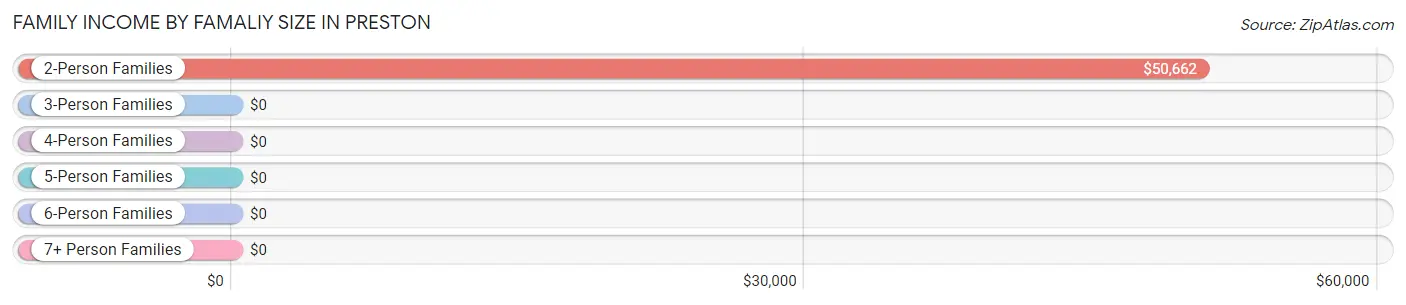
| Income Bracket | # Families | Median Income |
| 2-Person Families | 231 (53.6%) | $50,662 |
| 3-Person Families | 13 (3.0%) | $0 |
| 4-Person Families | 52 (12.1%) | $0 |
| 5-Person Families | 135 (31.3%) | $0 |
| 6-Person Families | 0 (0.0%) | $0 |
| 7+ Person Families | 0 (0.0%) | $0 |
| Total | 431 (100.0%) | $60,054 |
Family Income by Number of Earners in Preston
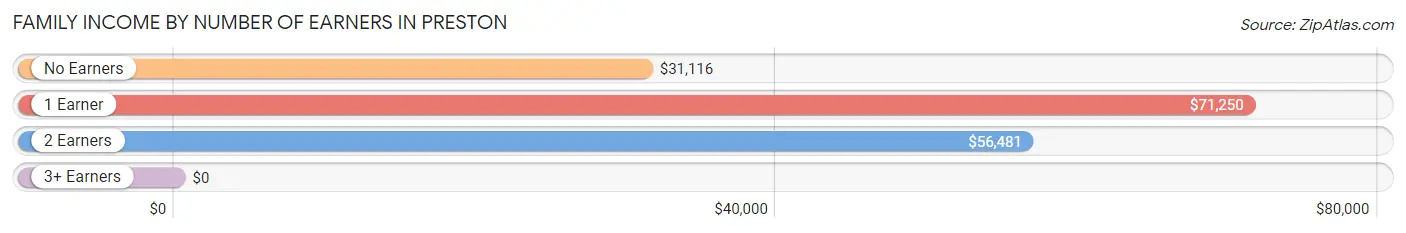
| Number of Earners | # Families | Median Income |
| No Earners | 43 (10.0%) | $31,116 |
| 1 Earner | 140 (32.5%) | $71,250 |
| 2 Earners | 157 (36.4%) | $56,481 |
| 3+ Earners | 91 (21.1%) | $0 |
| Total | 431 (100.0%) | $60,054 |
Household Income in Preston
Household Income Brackets in Preston
With 357 households falling in the category, the $50,000 to $74,999 income range is the most frequent in Preston, accounting for 37.7% of all households.
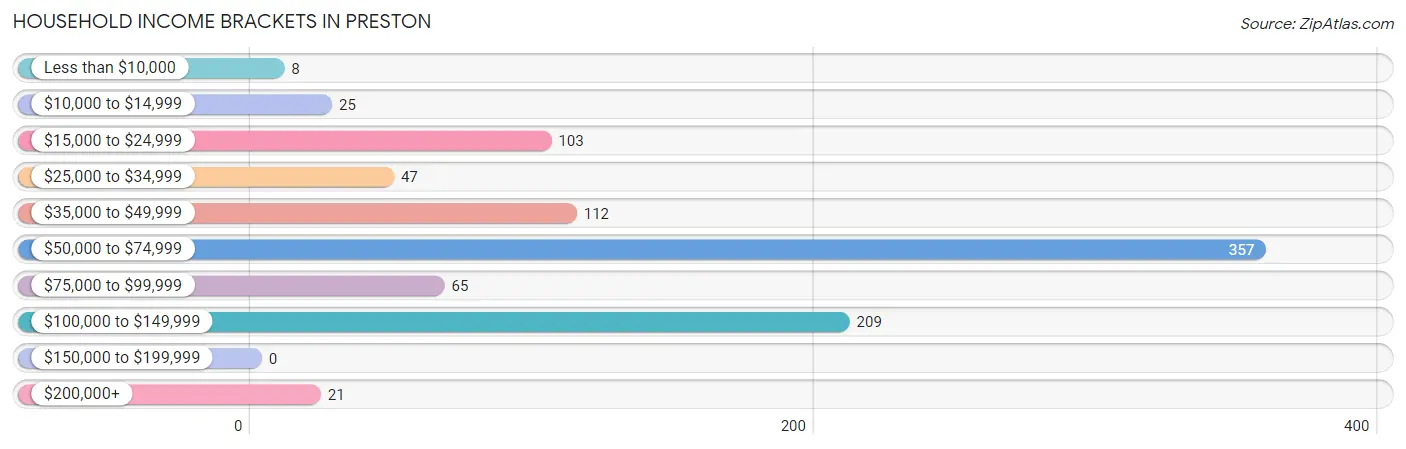
| Income Bracket | # Households | % Households |
| Less than $10,000 | 8 | 0.8% |
| $10,000 to $14,999 | 25 | 2.6% |
| $15,000 to $24,999 | 103 | 10.9% |
| $25,000 to $34,999 | 47 | 5.0% |
| $35,000 to $49,999 | 112 | 11.8% |
| $50,000 to $74,999 | 357 | 37.7% |
| $75,000 to $99,999 | 65 | 6.9% |
| $100,000 to $149,999 | 209 | 22.1% |
| $150,000 to $199,999 | 0 | 0.0% |
| $200,000+ | 21 | 2.2% |
Household Income by Householder Age in Preston
The median household income in Preston is $57,801, with the highest median household income of $58,070 found in the 45 to 64 years age bracket for the primary householder. A total of 308 households (32.5%) fall into this category.
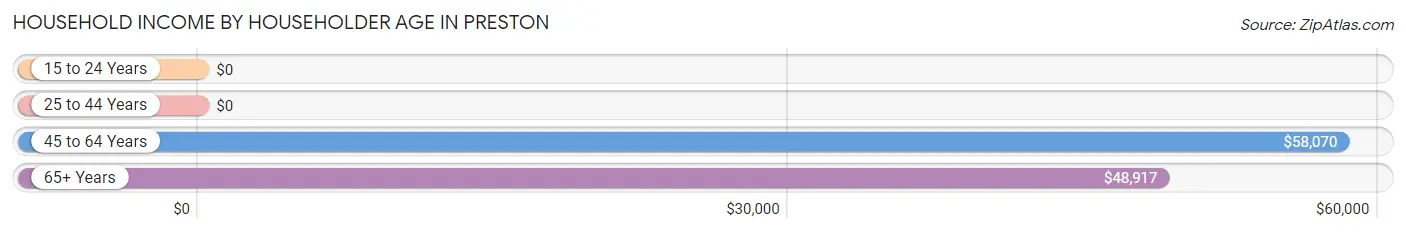
| Income Bracket | # Households | Median Income |
| 15 to 24 Years | 0 (0.0%) | $0 |
| 25 to 44 Years | 232 (24.5%) | $0 |
| 45 to 64 Years | 308 (32.5%) | $58,070 |
| 65+ Years | 407 (43.0%) | $48,917 |
| Total | 947 (100.0%) | $57,801 |
Poverty in Preston
Income Below Poverty by Sex and Age in Preston
With 2.3% poverty level for males and 5.4% for females among the residents of Preston, 65 to 74 year old males and 25 to 34 year old females are the most vulnerable to poverty, with 16 males (24.2%) and 44 females (14.8%) in their respective age groups living below the poverty level.
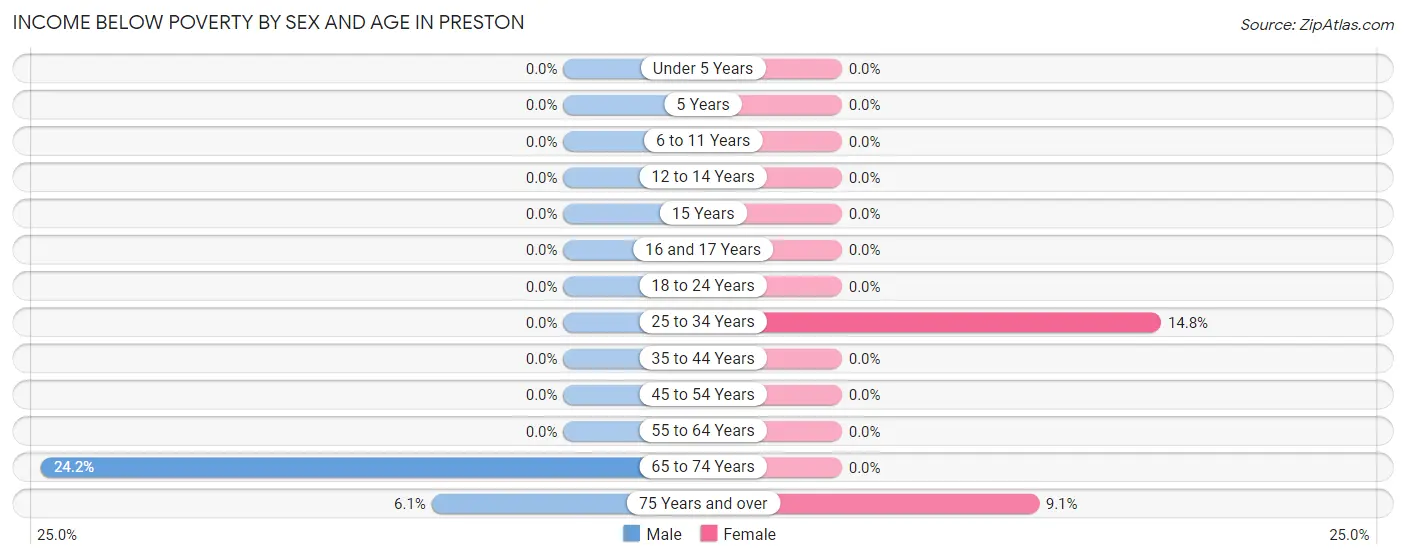
| Age Bracket | Male | Female |
| Under 5 Years | 0 (0.0%) | 0 (0.0%) |
| 5 Years | 0 (0.0%) | 0 (0.0%) |
| 6 to 11 Years | 0 (0.0%) | 0 (0.0%) |
| 12 to 14 Years | 0 (0.0%) | 0 (0.0%) |
| 15 Years | 0 (0.0%) | 0 (0.0%) |
| 16 and 17 Years | 0 (0.0%) | 0 (0.0%) |
| 18 to 24 Years | 0 (0.0%) | 0 (0.0%) |
| 25 to 34 Years | 0 (0.0%) | 44 (14.8%) |
| 35 to 44 Years | 0 (0.0%) | 0 (0.0%) |
| 45 to 54 Years | 0 (0.0%) | 0 (0.0%) |
| 55 to 64 Years | 0 (0.0%) | 0 (0.0%) |
| 65 to 74 Years | 16 (24.2%) | 0 (0.0%) |
| 75 Years and over | 8 (6.1%) | 17 (9.1%) |
| Total | 24 (2.3%) | 61 (5.4%) |
Income Above Poverty by Sex and Age in Preston
According to the poverty statistics in Preston, males aged 6 to 11 years and females aged 6 to 11 years are the age groups that are most secure financially, with 100.0% of males and 100.0% of females in these age groups living above the poverty line.
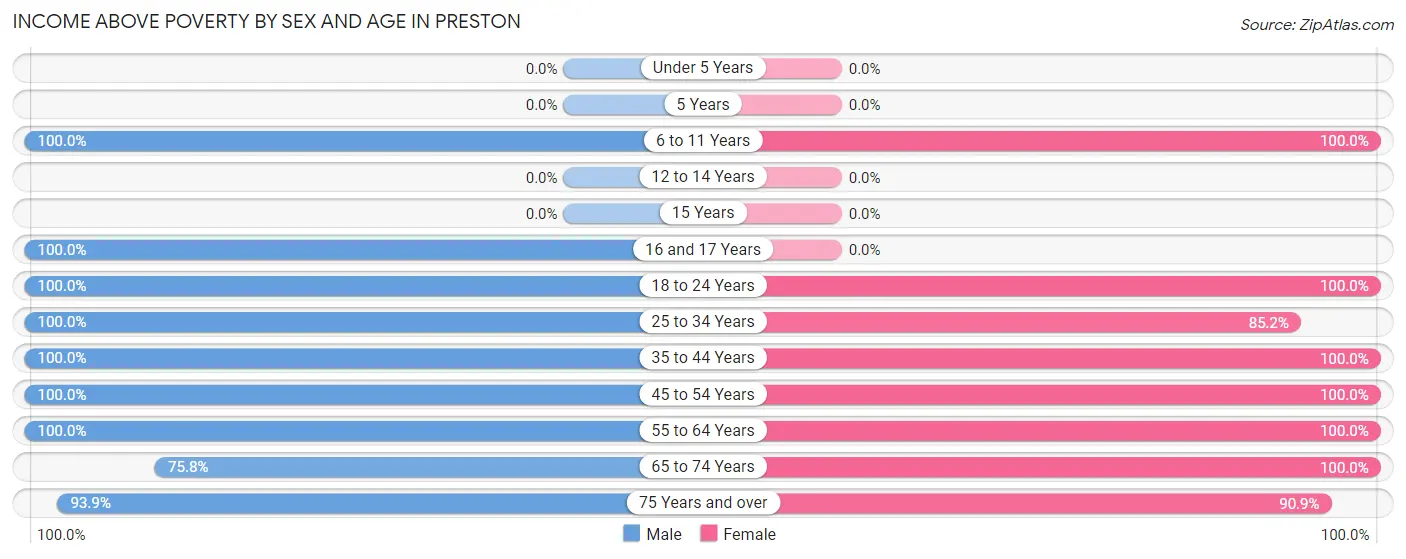
| Age Bracket | Male | Female |
| Under 5 Years | 0 (0.0%) | 0 (0.0%) |
| 5 Years | 0 (0.0%) | 0 (0.0%) |
| 6 to 11 Years | 192 (100.0%) | 115 (100.0%) |
| 12 to 14 Years | 0 (0.0%) | 0 (0.0%) |
| 15 Years | 0 (0.0%) | 0 (0.0%) |
| 16 and 17 Years | 11 (100.0%) | 0 (0.0%) |
| 18 to 24 Years | 35 (100.0%) | 65 (100.0%) |
| 25 to 34 Years | 210 (100.0%) | 253 (85.2%) |
| 35 to 44 Years | 72 (100.0%) | 23 (100.0%) |
| 45 to 54 Years | 161 (100.0%) | 160 (100.0%) |
| 55 to 64 Years | 166 (100.0%) | 121 (100.0%) |
| 65 to 74 Years | 50 (75.8%) | 170 (100.0%) |
| 75 Years and over | 123 (93.9%) | 169 (90.9%) |
| Total | 1,020 (97.7%) | 1,076 (94.6%) |
Income Below Poverty Among Married-Couple Families in Preston
The poverty statistics for married-couple families in Preston show that 2.8% or 9 of the total 327 families live below the poverty line. Families with no children have the highest poverty rate of 4.1%, comprising of 9 families. On the other hand, families with 1 or 2 children have the lowest poverty rate of 0.0%, which includes 0 families.
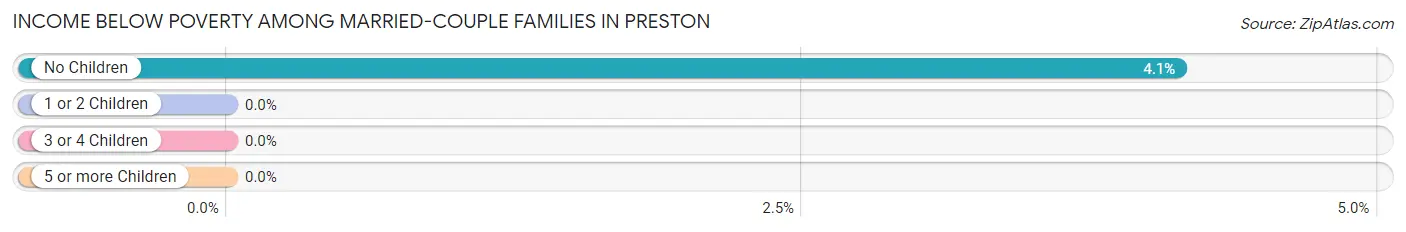
| Children | Above Poverty | Below Poverty |
| No Children | 209 (95.9%) | 9 (4.1%) |
| 1 or 2 Children | 44 (100.0%) | 0 (0.0%) |
| 3 or 4 Children | 65 (100.0%) | 0 (0.0%) |
| 5 or more Children | 0 (0.0%) | 0 (0.0%) |
| Total | 318 (97.3%) | 9 (2.8%) |
Income Below Poverty Among Single-Parent Households in Preston
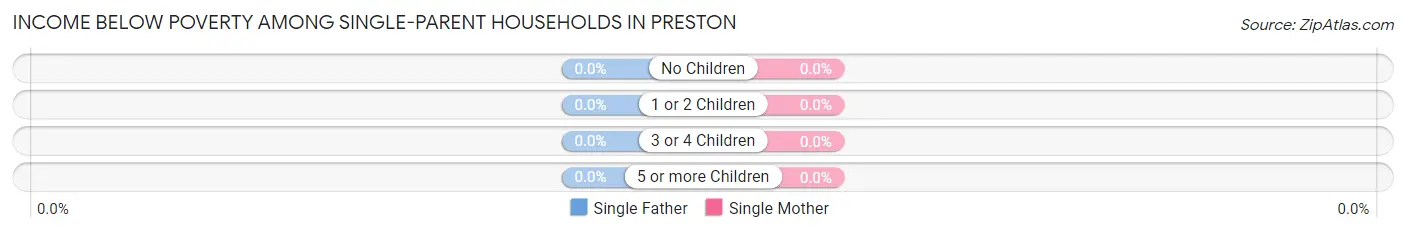
| Children | Single Father | Single Mother |
| No Children | 0 (0.0%) | 0 (0.0%) |
| 1 or 2 Children | 0 (0.0%) | 0 (0.0%) |
| 3 or 4 Children | 0 (0.0%) | 0 (0.0%) |
| 5 or more Children | 0 (0.0%) | 0 (0.0%) |
| Total | 0 (0.0%) | 0 (0.0%) |
Income Below Poverty Among Married-Couple vs Single-Parent Households in Preston
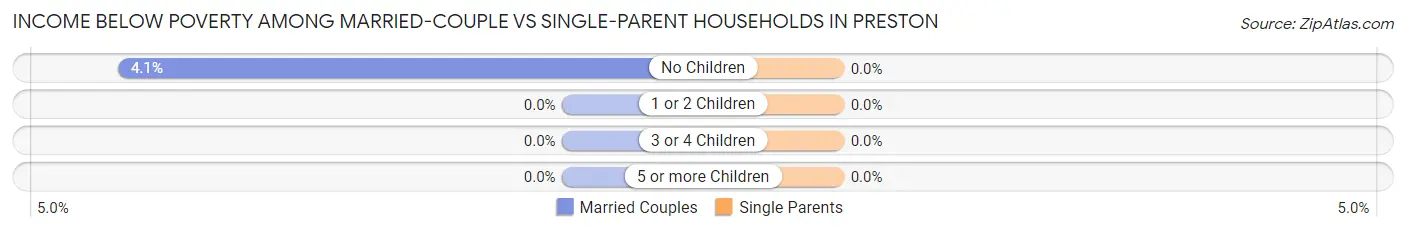
| Children | Married-Couple Families | Single-Parent Households |
| No Children | 9 (4.1%) | 0 (0.0%) |
| 1 or 2 Children | 0 (0.0%) | 0 (0.0%) |
| 3 or 4 Children | 0 (0.0%) | 0 (0.0%) |
| 5 or more Children | 0 (0.0%) | 0 (0.0%) |
| Total | 9 (2.8%) | 0 (0.0%) |
Race in Preston
The most populous races in Preston are White / Caucasian (2,027 | 92.9%), Two or more Races (111 | 5.1%), and Hispanic or Latino (87 | 4.0%).
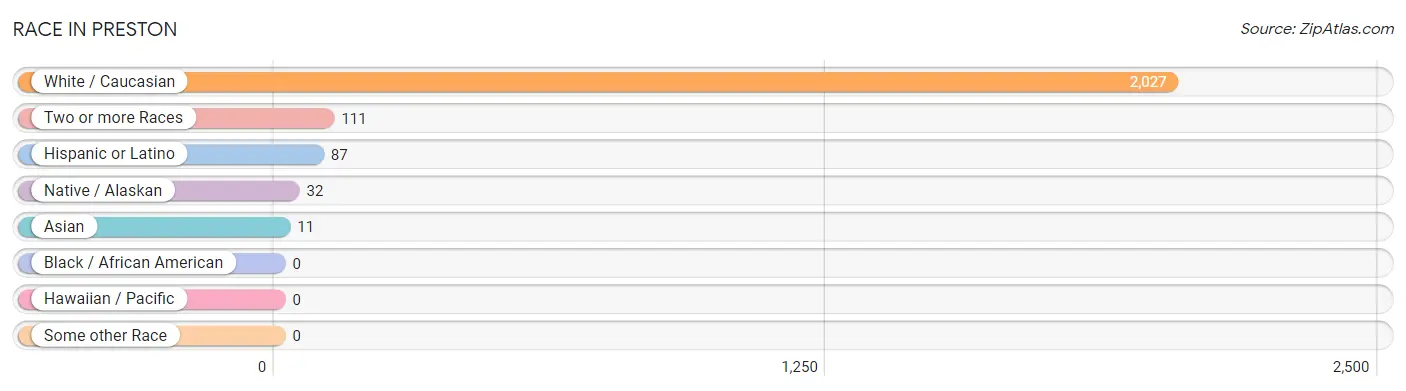
| Race | # Population | % Population |
| Asian | 11 | 0.5% |
| Black / African American | 0 | 0.0% |
| Hawaiian / Pacific | 0 | 0.0% |
| Hispanic or Latino | 87 | 4.0% |
| Native / Alaskan | 32 | 1.5% |
| White / Caucasian | 2,027 | 92.9% |
| Two or more Races | 111 | 5.1% |
| Some other Race | 0 | 0.0% |
| Total | 2,181 | 100.0% |
Ancestry in Preston
The most populous ancestries reported in Preston are Irish (298 | 13.7%), Scandinavian (169 | 7.7%), American (165 | 7.6%), Scotch-Irish (160 | 7.3%), and Scottish (133 | 6.1%), together accounting for 42.4% of all Preston residents.
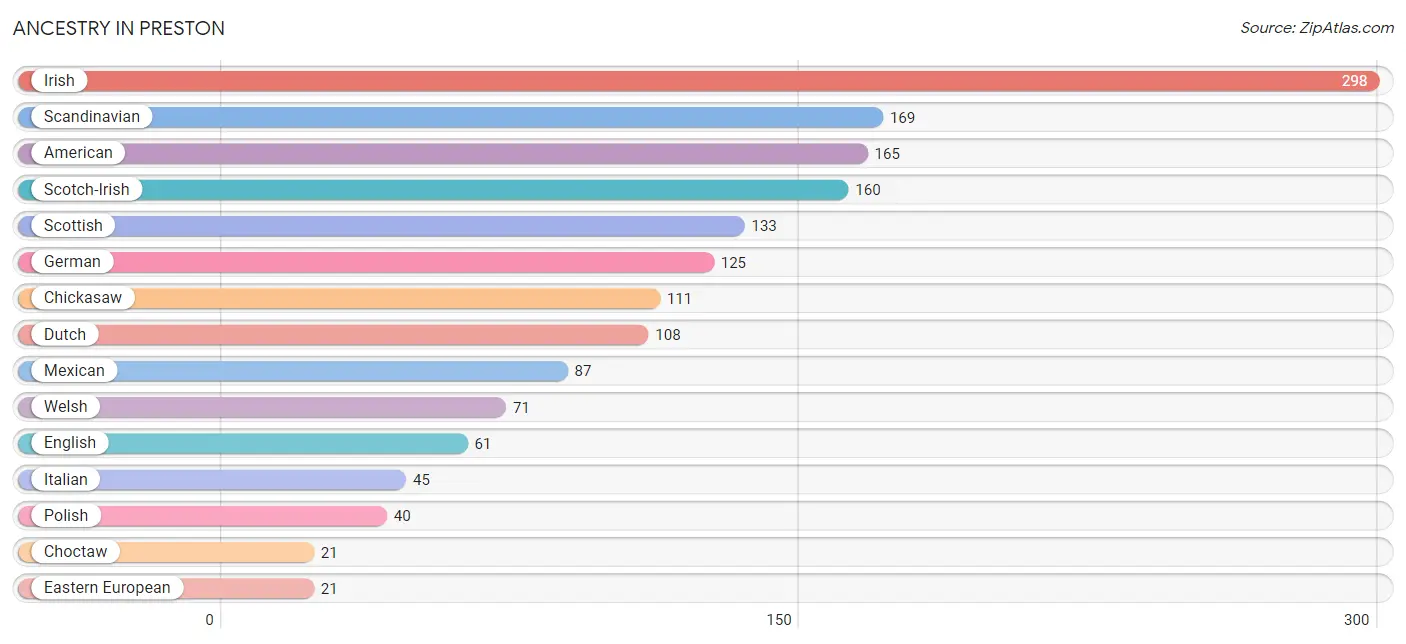
| Ancestry | # Population | % Population |
| American | 165 | 7.6% |
| Chickasaw | 111 | 5.1% |
| Choctaw | 21 | 1.0% |
| Dutch | 108 | 5.0% |
| Eastern European | 21 | 1.0% |
| English | 61 | 2.8% |
| French | 13 | 0.6% |
| German | 125 | 5.7% |
| Irish | 298 | 13.7% |
| Italian | 45 | 2.1% |
| Korean | 11 | 0.5% |
| Lithuanian | 17 | 0.8% |
| Mexican | 87 | 4.0% |
| Navajo | 11 | 0.5% |
| Norwegian | 21 | 1.0% |
| Polish | 40 | 1.8% |
| Scandinavian | 169 | 7.7% |
| Scotch-Irish | 160 | 7.3% |
| Scottish | 133 | 6.1% |
| Swedish | 19 | 0.9% |
| Welsh | 71 | 3.3% | View All 21 Rows |
Immigrants in Preston
The most numerous immigrant groups reported in Preston came from Europe (33 | 1.5%), Germany (33 | 1.5%), Western Europe (33 | 1.5%), Asia (11 | 0.5%), and Philippines (11 | 0.5%), together accounting for 5.5% of all Preston residents.
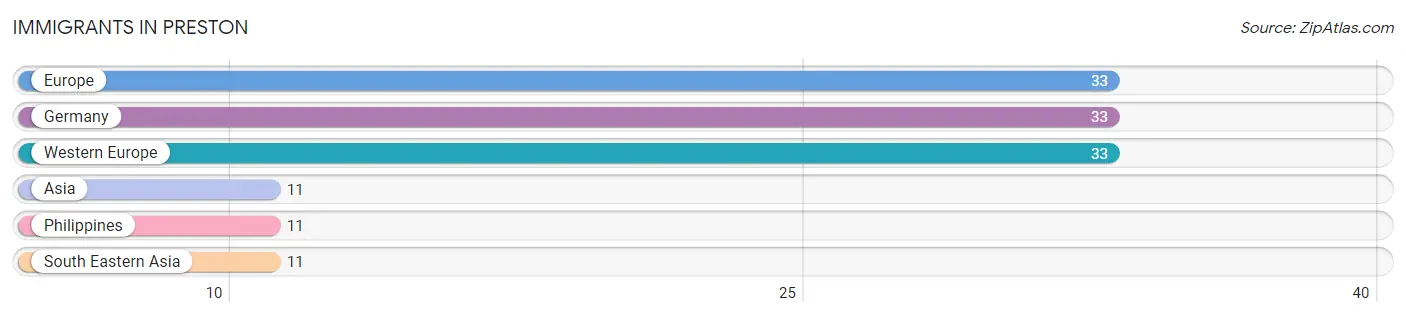
| Immigration Origin | # Population | % Population |
| Asia | 11 | 0.5% |
| Europe | 33 | 1.5% |
| Germany | 33 | 1.5% |
| Philippines | 11 | 0.5% |
| South Eastern Asia | 11 | 0.5% |
| Western Europe | 33 | 1.5% | View All 6 Rows |
Sex and Age in Preston
Sex and Age in Preston
The most populous age groups in Preston are 30 to 34 Years (210 | 20.1%) for men and 30 to 34 Years (219 | 19.3%) for women.
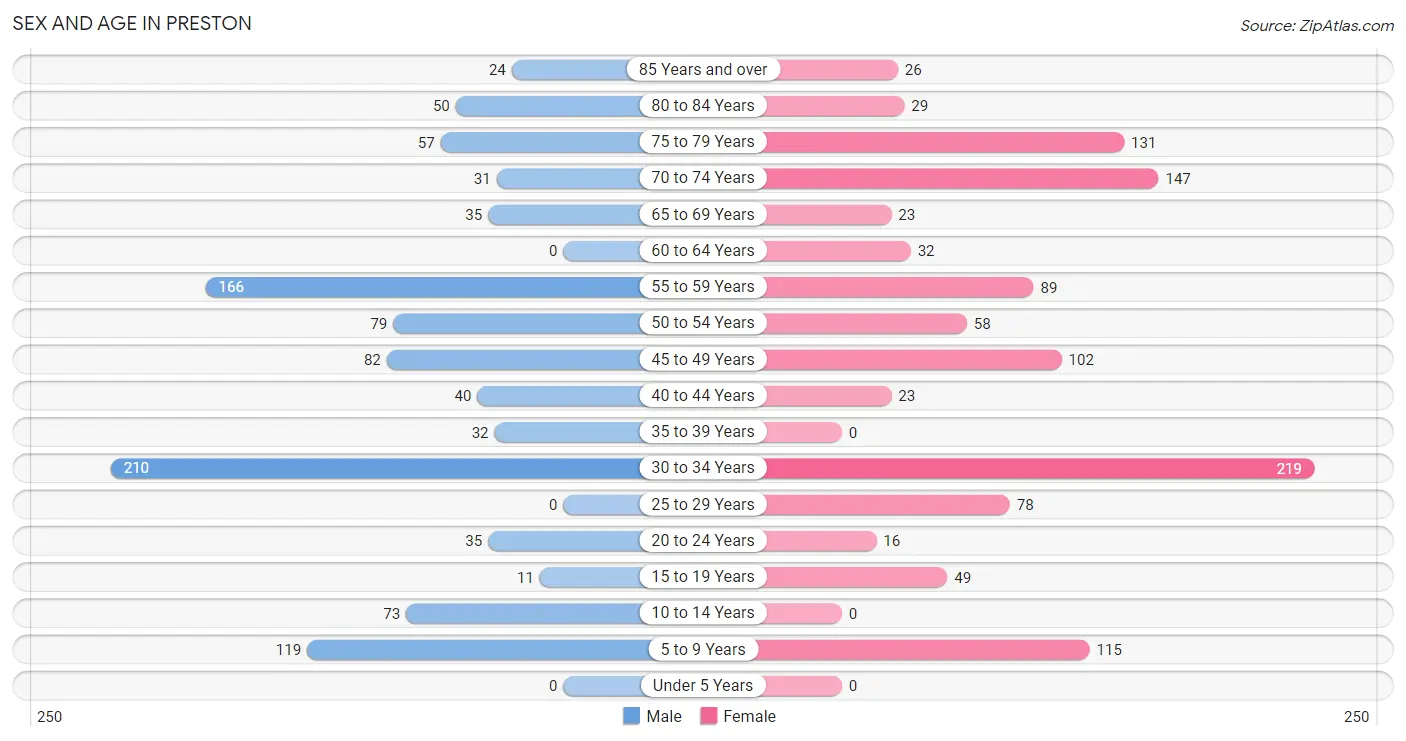
| Age Bracket | Male | Female |
| Under 5 Years | 0 (0.0%) | 0 (0.0%) |
| 5 to 9 Years | 119 (11.4%) | 115 (10.1%) |
| 10 to 14 Years | 73 (7.0%) | 0 (0.0%) |
| 15 to 19 Years | 11 (1.1%) | 49 (4.3%) |
| 20 to 24 Years | 35 (3.4%) | 16 (1.4%) |
| 25 to 29 Years | 0 (0.0%) | 78 (6.9%) |
| 30 to 34 Years | 210 (20.1%) | 219 (19.3%) |
| 35 to 39 Years | 32 (3.1%) | 0 (0.0%) |
| 40 to 44 Years | 40 (3.8%) | 23 (2.0%) |
| 45 to 49 Years | 82 (7.9%) | 102 (9.0%) |
| 50 to 54 Years | 79 (7.6%) | 58 (5.1%) |
| 55 to 59 Years | 166 (15.9%) | 89 (7.8%) |
| 60 to 64 Years | 0 (0.0%) | 32 (2.8%) |
| 65 to 69 Years | 35 (3.4%) | 23 (2.0%) |
| 70 to 74 Years | 31 (3.0%) | 147 (12.9%) |
| 75 to 79 Years | 57 (5.5%) | 131 (11.5%) |
| 80 to 84 Years | 50 (4.8%) | 29 (2.5%) |
| 85 Years and over | 24 (2.3%) | 26 (2.3%) |
| Total | 1,044 (100.0%) | 1,137 (100.0%) |
Families and Households in Preston
Median Family Size in Preston
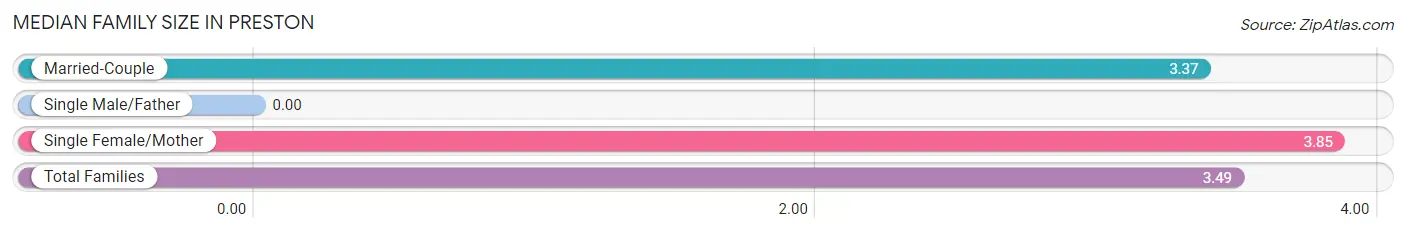
| Family Type | # Families | Family Size |
| Married-Couple | 327 (75.9%) | 3.37 |
| Single Male/Father | 0 (0.0%) | - |
| Single Female/Mother | 104 (24.1%) | 3.85 |
| Total Families | 431 (100.0%) | 3.49 |
Median Household Size in Preston
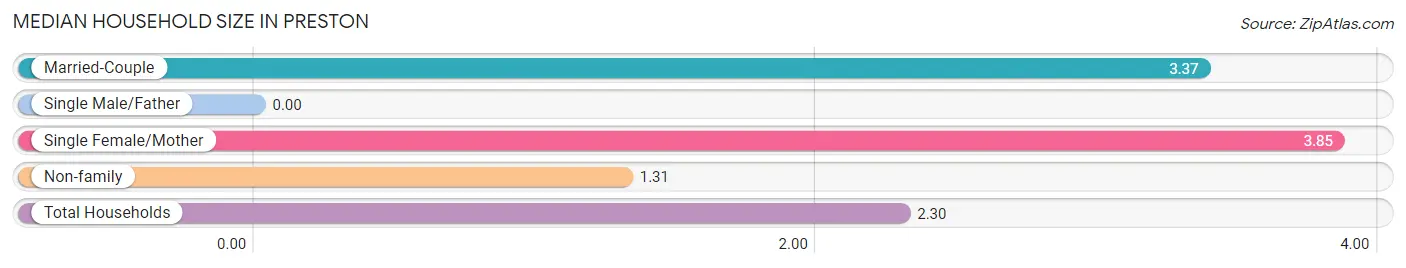
| Household Type | # Households | Household Size |
| Married-Couple | 327 (34.5%) | 3.37 |
| Single Male/Father | 0 (0.0%) | - |
| Single Female/Mother | 104 (11.0%) | 3.85 |
| Non-family | 516 (54.5%) | 1.31 |
| Total Households | 947 (100.0%) | 2.30 |
Household Size by Marriage Status in Preston
Out of a total of 947 households in Preston, 431 (45.5%) are family households, while 516 (54.5%) are nonfamily households. The most numerous type of family households are 2-person households, comprising 231, and the most common type of nonfamily households are 1-person households, comprising 382.
| Household Size | Family Households | Nonfamily Households |
| 1-Person Households | - | 382 (40.3%) |
| 2-Person Households | 231 (24.4%) | 108 (11.4%) |
| 3-Person Households | 13 (1.4%) | 26 (2.8%) |
| 4-Person Households | 52 (5.5%) | 0 (0.0%) |
| 5-Person Households | 135 (14.3%) | 0 (0.0%) |
| 6-Person Households | 0 (0.0%) | 0 (0.0%) |
| 7+ Person Households | 0 (0.0%) | 0 (0.0%) |
| Total | 431 (45.5%) | 516 (54.5%) |
Female Fertility in Preston
Fertility by Age in Preston
| Age Bracket | Women with Births | Births / 1,000 Women |
| 15 to 19 years | 0 (0.0%) | 0.0 |
| 20 to 34 years | 0 (0.0%) | 0.0 |
| 35 to 50 years | 0 (0.0%) | 0.0 |
| Total | 0 (0.0%) | 0.0 |
Fertility by Age by Marriage Status in Preston
| Age Bracket | Married | Unmarried |
| 15 to 19 years | 0 (0.0%) | 0 (0.0%) |
| 20 to 34 years | 0 (0.0%) | 0 (0.0%) |
| 35 to 50 years | 0 (0.0%) | 0 (0.0%) |
| Total | 0 (0.0%) | 0 (0.0%) |
Fertility by Education in Preston
| Educational Attainment | Women with Births | Births / 1,000 Women |
| Less than High School | 0 (0.0%) | 0.0 |
| High School Diploma | 0 (0.0%) | 0.0 |
| College or Associate's Degree | 0 (0.0%) | 0.0 |
| Bachelor's Degree | 0 (0.0%) | 0.0 |
| Graduate Degree | 0 (0.0%) | 0.0 |
| Total | 0 (0.0%) | 0.0 |
Fertility by Education by Marriage Status in Preston
| Educational Attainment | Married | Unmarried |
| Less than High School | 0 (0.0%) | 0 (0.0%) |
| High School Diploma | 0 (0.0%) | 0 (0.0%) |
| College or Associate's Degree | 0 (0.0%) | 0 (0.0%) |
| Bachelor's Degree | 0 (0.0%) | 0 (0.0%) |
| Graduate Degree | 0 (0.0%) | 0 (0.0%) |
| Total | 0 (0.0%) | 0 (0.0%) |
Employment Characteristics in Preston
Employment by Class of Employer in Preston
Among the 1,095 employed individuals in Preston, private company employees (865 | 79.0%), not-for-profit organizations (128 | 11.7%), and self-employed (not incorporated) (70 | 6.4%) make up the most common classes of employment.
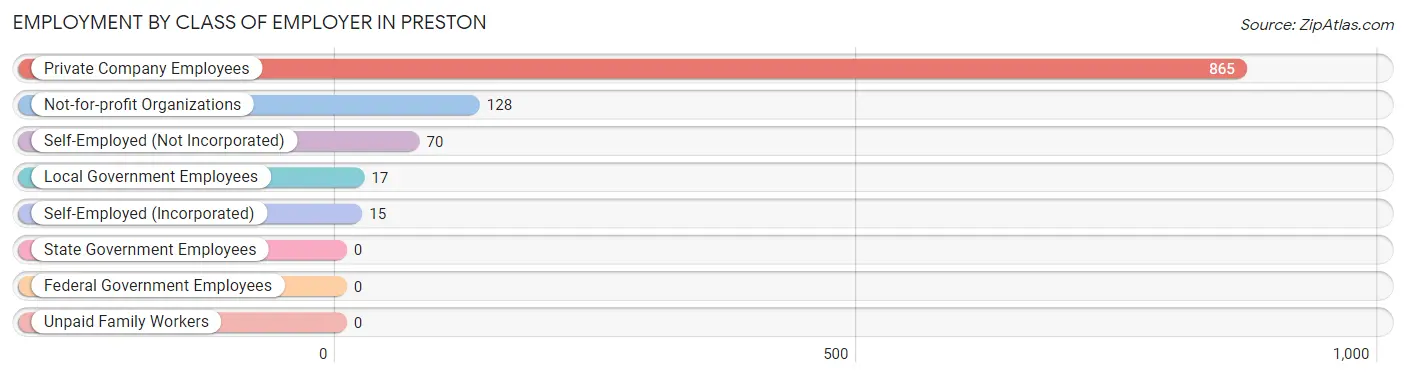
| Employer Class | # Employees | % Employees |
| Private Company Employees | 865 | 79.0% |
| Self-Employed (Incorporated) | 15 | 1.4% |
| Self-Employed (Not Incorporated) | 70 | 6.4% |
| Not-for-profit Organizations | 128 | 11.7% |
| Local Government Employees | 17 | 1.5% |
| State Government Employees | 0 | 0.0% |
| Federal Government Employees | 0 | 0.0% |
| Unpaid Family Workers | 0 | 0.0% |
| Total | 1,095 | 100.0% |
Employment Status by Age in Preston
According to the labor force statistics for Preston, out of the total population over 16 years of age (1,874), 65.4% or 1,226 individuals are in the labor force, with 8.8% or 108 of them unemployed. The age group with the highest labor force participation rate is 25 to 29 years, with 100.0% or 78 individuals in the labor force. Within the labor force, the 60 to 64 years age range has the highest percentage of unemployed individuals, with 100.0% or 32 of them being unemployed.
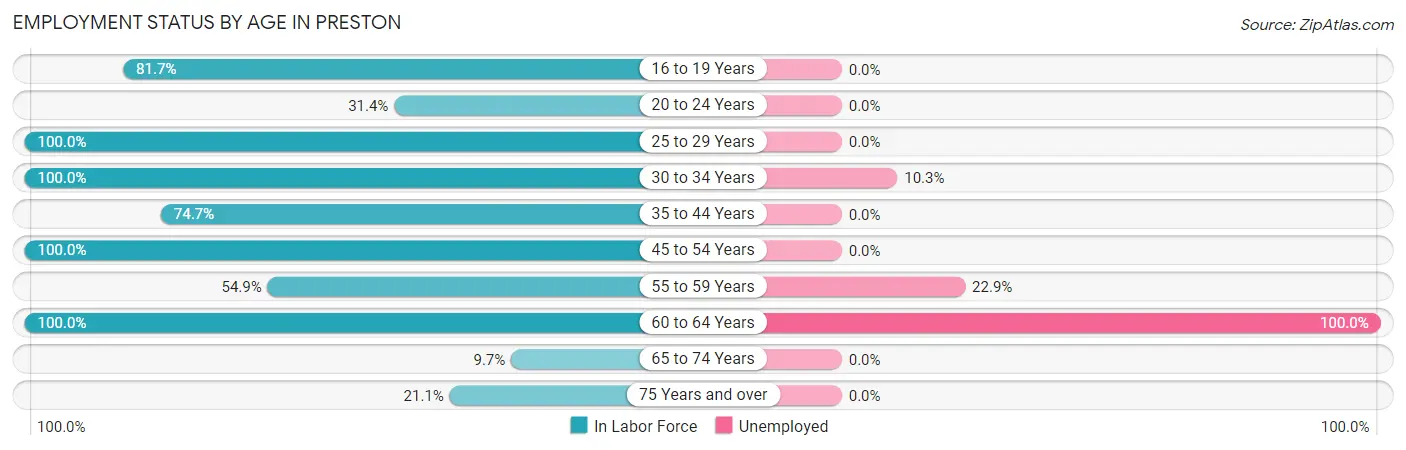
| Age Bracket | In Labor Force | Unemployed |
| 16 to 19 Years | 49 (81.7%) | 0 (0.0%) |
| 20 to 24 Years | 16 (31.4%) | 0 (0.0%) |
| 25 to 29 Years | 78 (100.0%) | 0 (0.0%) |
| 30 to 34 Years | 429 (100.0%) | 44 (10.3%) |
| 35 to 44 Years | 71 (74.7%) | 0 (0.0%) |
| 45 to 54 Years | 321 (100.0%) | 0 (0.0%) |
| 55 to 59 Years | 140 (54.9%) | 32 (22.9%) |
| 60 to 64 Years | 32 (100.0%) | 32 (100.0%) |
| 65 to 74 Years | 23 (9.7%) | 0 (0.0%) |
| 75 Years and over | 67 (21.1%) | 0 (0.0%) |
| Total | 1,226 (65.4%) | 108 (8.8%) |
Employment Status by Educational Attainment in Preston
According to labor force statistics for Preston, 88.5% of individuals (1,071) out of the total population between 25 and 64 years of age (1,210) are in the labor force, with 10.1% or 108 of them being unemployed. The group with the highest labor force participation rate are those with the educational attainment of bachelor's degree or higher, with 100.0% or 64 individuals in the labor force. Within the labor force, individuals with high school diploma education have the highest percentage of unemployment, with 21.5% or 76 of them being unemployed.
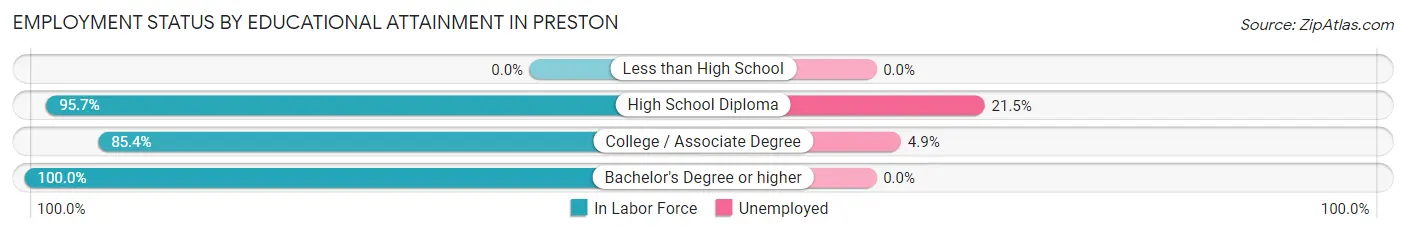
| Educational Attainment | In Labor Force | Unemployed |
| Less than High School | 0 (0.0%) | 0 (0.0%) |
| High School Diploma | 354 (95.7%) | 80 (21.5%) |
| College / Associate Degree | 653 (85.4%) | 37 (4.9%) |
| Bachelor's Degree or higher | 64 (100.0%) | 0 (0.0%) |
| Total | 1,071 (88.5%) | 122 (10.1%) |
Employment Occupations by Sex in Preston
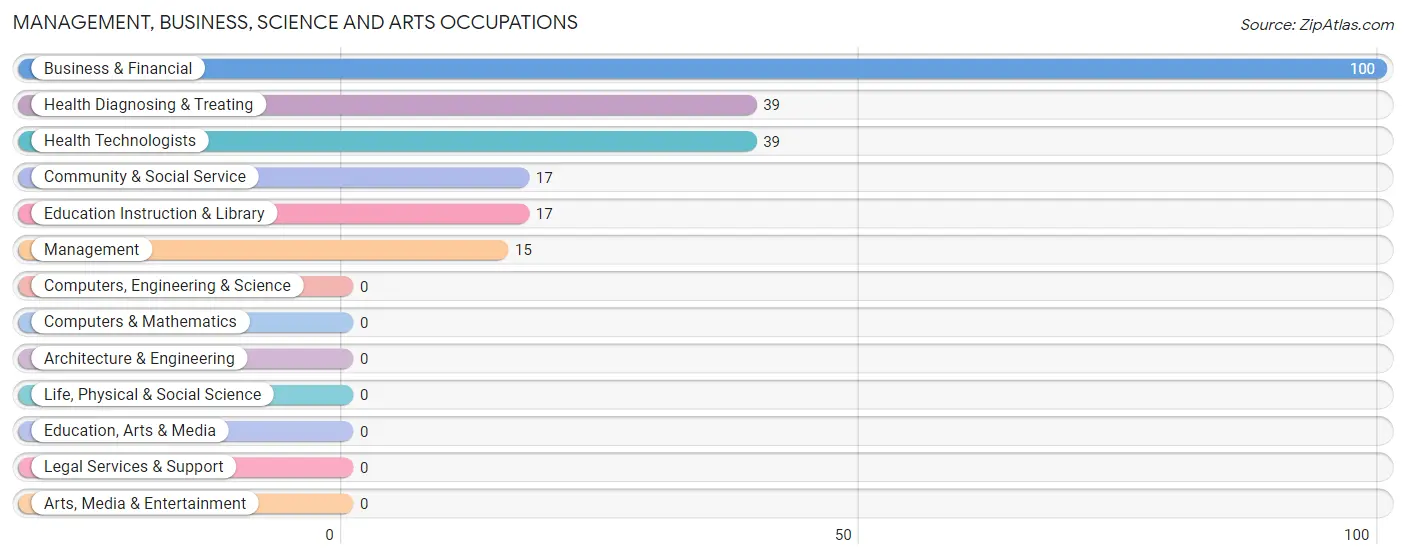
Management, Business, Science and Arts Occupations
The most common Management, Business, Science and Arts occupations in Preston are Business & Financial (100 | 8.9%), Health Diagnosing & Treating (39 | 3.5%), Health Technologists (39 | 3.5%), Community & Social Service (17 | 1.5%), and Education Instruction & Library (17 | 1.5%).
Management, Business, Science and Arts Occupations by Sex
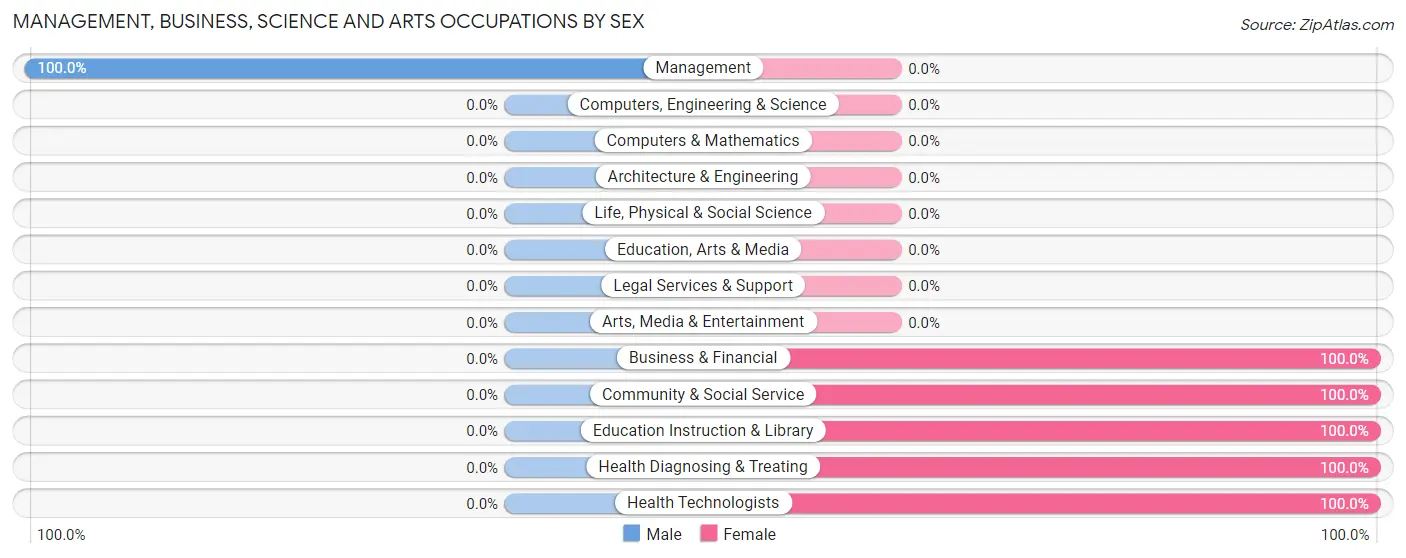
| Occupation | Male | Female |
| Management | 15 (100.0%) | 0 (0.0%) |
| Business & Financial | 0 (0.0%) | 100 (100.0%) |
| Computers, Engineering & Science | 0 (0.0%) | 0 (0.0%) |
| Computers & Mathematics | 0 (0.0%) | 0 (0.0%) |
| Architecture & Engineering | 0 (0.0%) | 0 (0.0%) |
| Life, Physical & Social Science | 0 (0.0%) | 0 (0.0%) |
| Community & Social Service | 0 (0.0%) | 17 (100.0%) |
| Education, Arts & Media | 0 (0.0%) | 0 (0.0%) |
| Legal Services & Support | 0 (0.0%) | 0 (0.0%) |
| Education Instruction & Library | 0 (0.0%) | 17 (100.0%) |
| Arts, Media & Entertainment | 0 (0.0%) | 0 (0.0%) |
| Health Diagnosing & Treating | 0 (0.0%) | 39 (100.0%) |
| Health Technologists | 0 (0.0%) | 39 (100.0%) |
| Total (Category) | 15 (8.8%) | 156 (91.2%) |
| Total (Overall) | 480 (42.9%) | 638 (57.1%) |
Services Occupations
The most common Services occupations in Preston are Food Preparation & Serving (291 | 26.0%), and Personal Care & Service (95 | 8.5%).
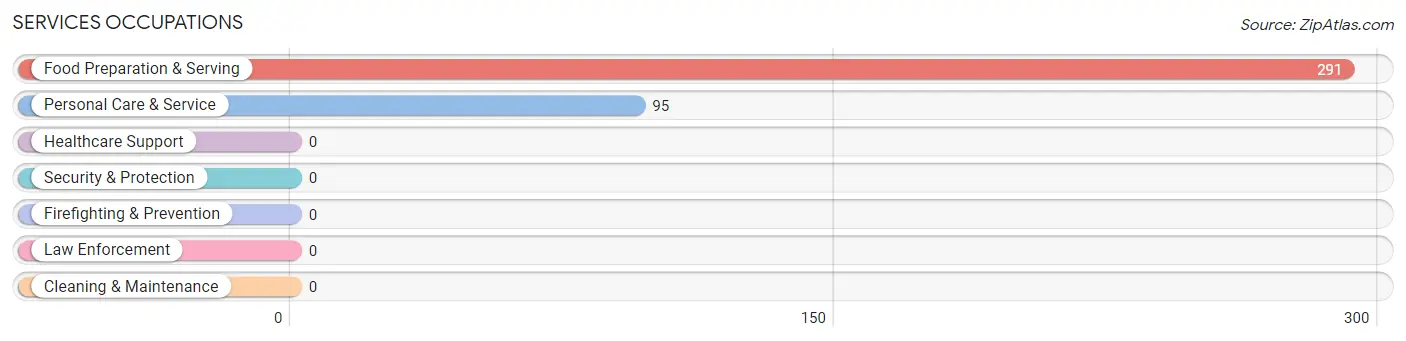
Services Occupations by Sex
Within the Services occupations in Preston, the most male-oriented occupations are Food Preparation & Serving (22.3%), and Personal Care & Service (20.0%), while the most female-oriented occupations are Personal Care & Service (80.0%), and Food Preparation & Serving (77.7%).
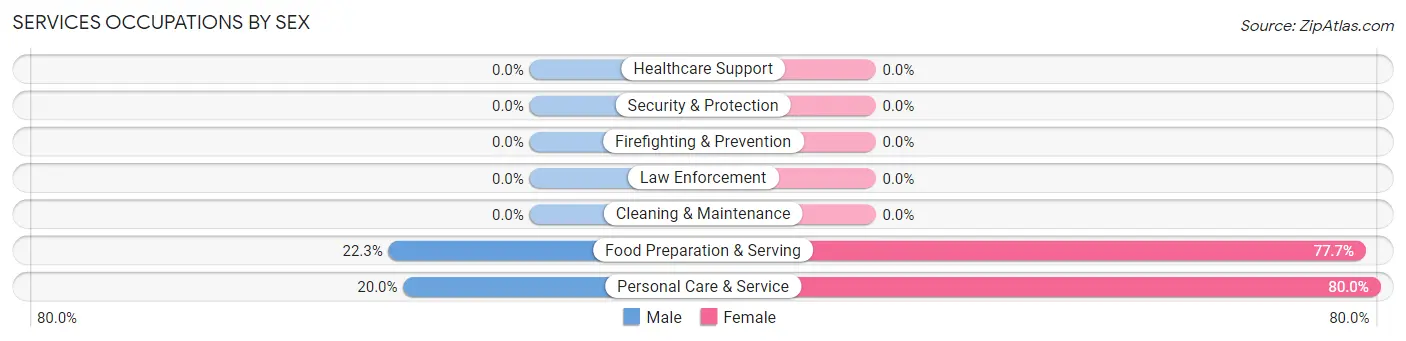
| Occupation | Male | Female |
| Healthcare Support | 0 (0.0%) | 0 (0.0%) |
| Security & Protection | 0 (0.0%) | 0 (0.0%) |
| Firefighting & Prevention | 0 (0.0%) | 0 (0.0%) |
| Law Enforcement | 0 (0.0%) | 0 (0.0%) |
| Food Preparation & Serving | 65 (22.3%) | 226 (77.7%) |
| Cleaning & Maintenance | 0 (0.0%) | 0 (0.0%) |
| Personal Care & Service | 19 (20.0%) | 76 (80.0%) |
| Total (Category) | 84 (21.8%) | 302 (78.2%) |
| Total (Overall) | 480 (42.9%) | 638 (57.1%) |
Sales and Office Occupations
The most common Sales and Office occupations in Preston are Office & Administration (190 | 17.0%), and Sales & Related (130 | 11.6%).
Sales and Office Occupations by Sex
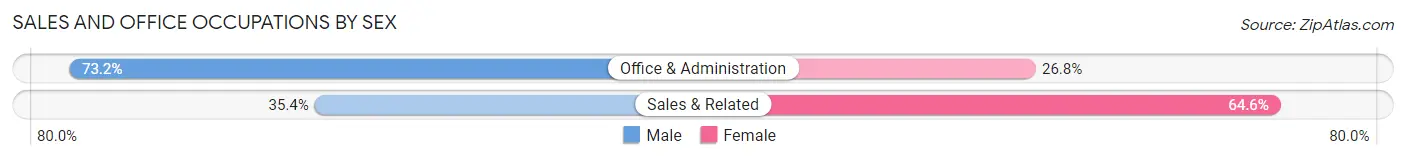
| Occupation | Male | Female |
| Sales & Related | 46 (35.4%) | 84 (64.6%) |
| Office & Administration | 139 (73.2%) | 51 (26.8%) |
| Total (Category) | 185 (57.8%) | 135 (42.2%) |
| Total (Overall) | 480 (42.9%) | 638 (57.1%) |
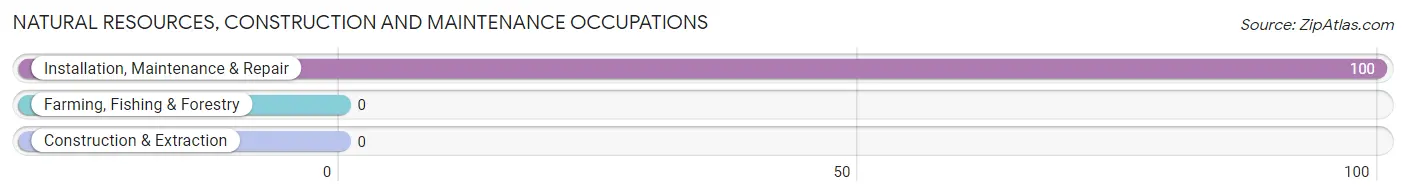
Natural Resources, Construction and Maintenance Occupations
The most common Natural Resources, Construction and Maintenance occupations in Preston are , and Installation, Maintenance & Repair (100 | 8.9%).
Natural Resources, Construction and Maintenance Occupations by Sex
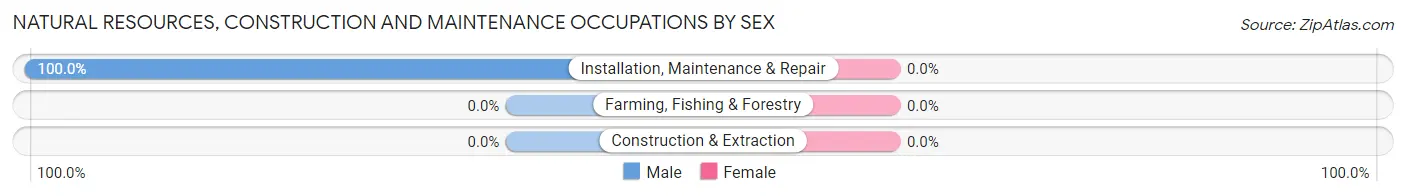
| Occupation | Male | Female |
| Farming, Fishing & Forestry | 0 (0.0%) | 0 (0.0%) |
| Construction & Extraction | 0 (0.0%) | 0 (0.0%) |
| Installation, Maintenance & Repair | 100 (100.0%) | 0 (0.0%) |
| Total (Category) | 100 (100.0%) | 0 (0.0%) |
| Total (Overall) | 480 (42.9%) | 638 (57.1%) |
Production, Transportation and Moving Occupations
The most common Production, Transportation and Moving occupations in Preston are Transportation (71 | 6.4%), and Production (70 | 6.3%).

Production, Transportation and Moving Occupations by Sex
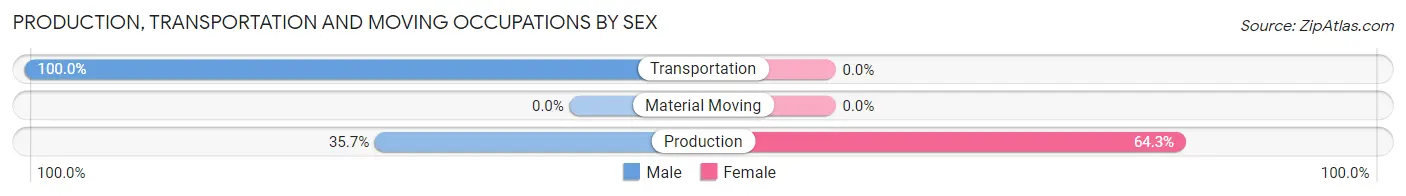
| Occupation | Male | Female |
| Production | 25 (35.7%) | 45 (64.3%) |
| Transportation | 71 (100.0%) | 0 (0.0%) |
| Material Moving | 0 (0.0%) | 0 (0.0%) |
| Total (Category) | 96 (68.1%) | 45 (31.9%) |
| Total (Overall) | 480 (42.9%) | 638 (57.1%) |
Employment Industries by Sex in Preston
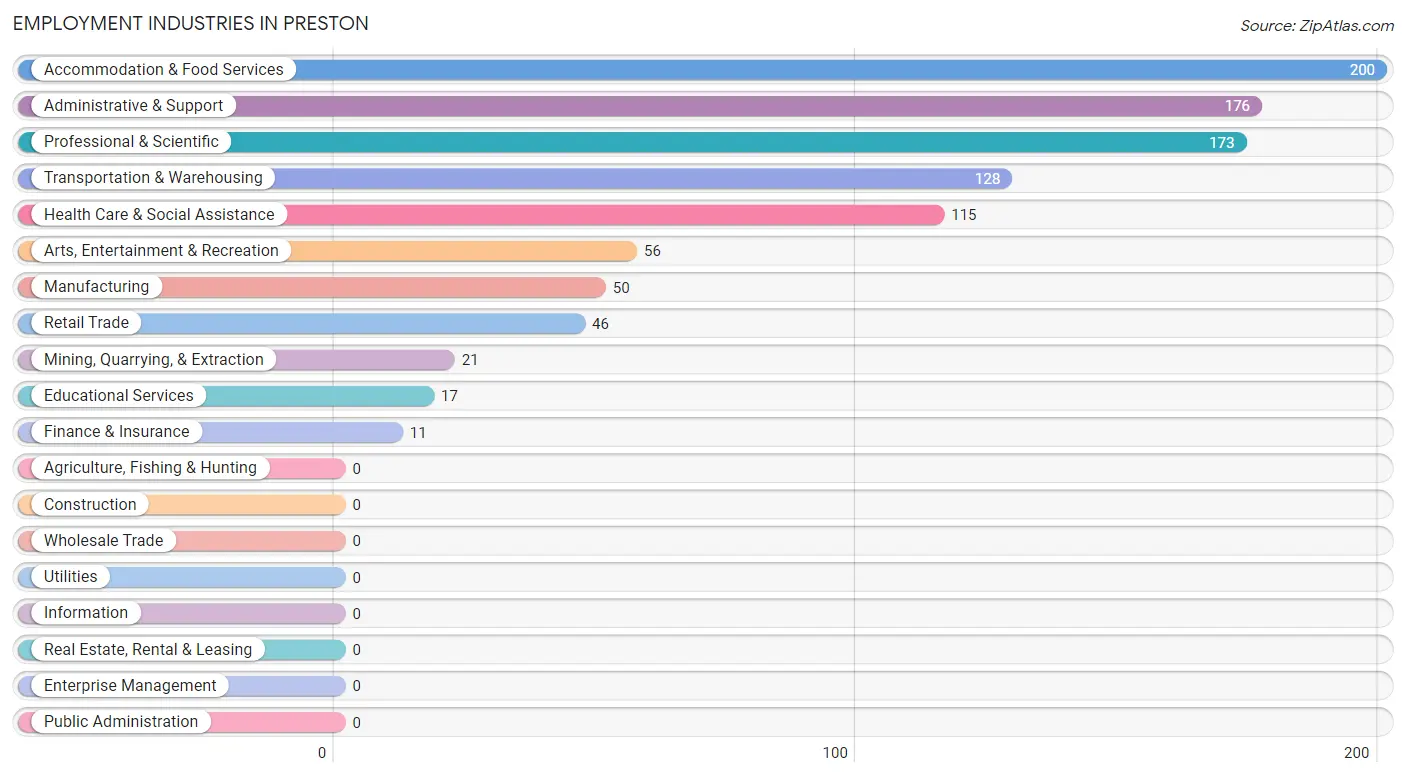
Employment Industries in Preston
The major employment industries in Preston include Accommodation & Food Services (200 | 17.9%), Administrative & Support (176 | 15.7%), Professional & Scientific (173 | 15.5%), Transportation & Warehousing (128 | 11.5%), and Health Care & Social Assistance (115 | 10.3%).
Employment Industries by Sex in Preston
The Preston industries that see more men than women are Mining, Quarrying, & Extraction (100.0%), Retail Trade (100.0%), and Transportation & Warehousing (100.0%), whereas the industries that tend to have a higher number of women are Finance & Insurance (100.0%), Professional & Scientific (100.0%), and Educational Services (100.0%).
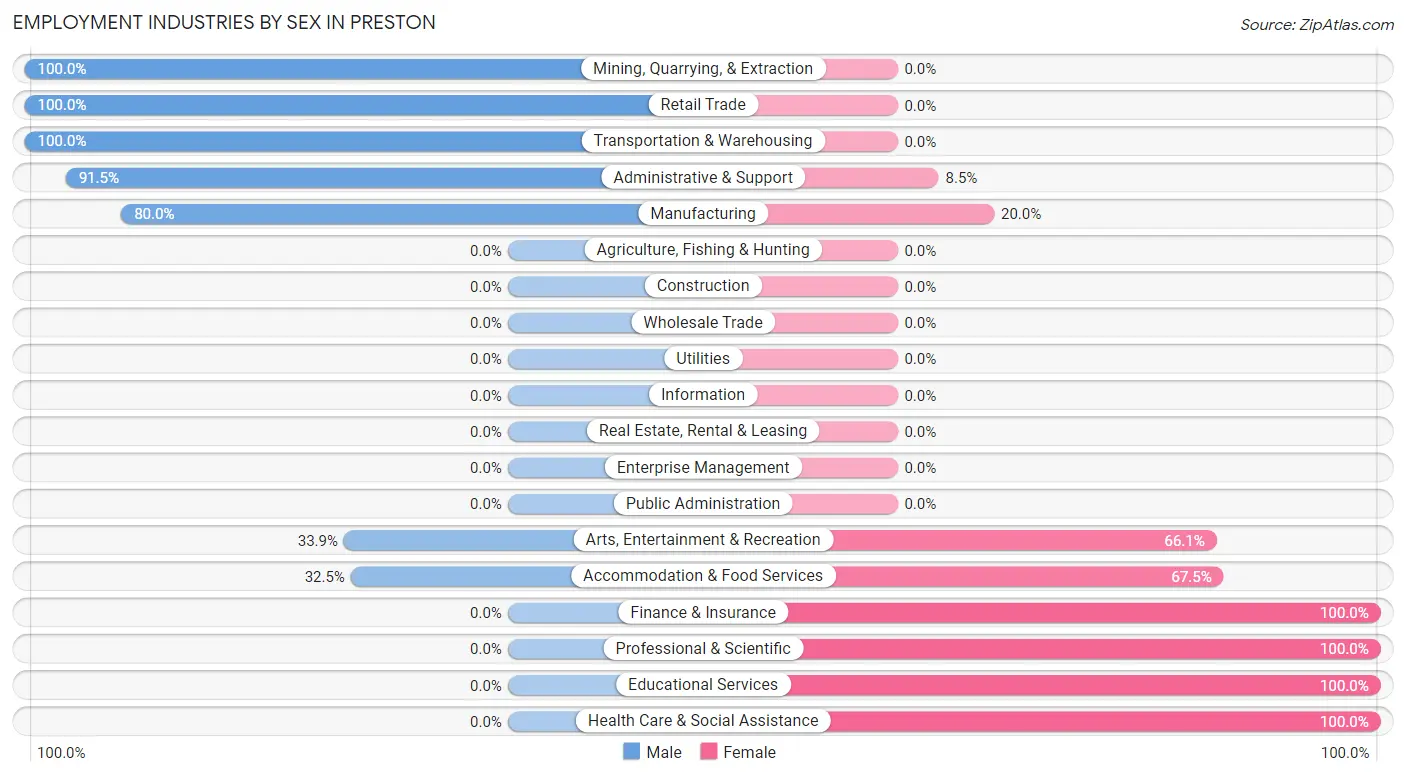
| Industry | Male | Female |
| Agriculture, Fishing & Hunting | 0 (0.0%) | 0 (0.0%) |
| Mining, Quarrying, & Extraction | 21 (100.0%) | 0 (0.0%) |
| Construction | 0 (0.0%) | 0 (0.0%) |
| Manufacturing | 40 (80.0%) | 10 (20.0%) |
| Wholesale Trade | 0 (0.0%) | 0 (0.0%) |
| Retail Trade | 46 (100.0%) | 0 (0.0%) |
| Transportation & Warehousing | 128 (100.0%) | 0 (0.0%) |
| Utilities | 0 (0.0%) | 0 (0.0%) |
| Information | 0 (0.0%) | 0 (0.0%) |
| Finance & Insurance | 0 (0.0%) | 11 (100.0%) |
| Real Estate, Rental & Leasing | 0 (0.0%) | 0 (0.0%) |
| Professional & Scientific | 0 (0.0%) | 173 (100.0%) |
| Enterprise Management | 0 (0.0%) | 0 (0.0%) |
| Administrative & Support | 161 (91.5%) | 15 (8.5%) |
| Educational Services | 0 (0.0%) | 17 (100.0%) |
| Health Care & Social Assistance | 0 (0.0%) | 115 (100.0%) |
| Arts, Entertainment & Recreation | 19 (33.9%) | 37 (66.1%) |
| Accommodation & Food Services | 65 (32.5%) | 135 (67.5%) |
| Public Administration | 0 (0.0%) | 0 (0.0%) |
| Total | 480 (42.9%) | 638 (57.1%) |
Education in Preston
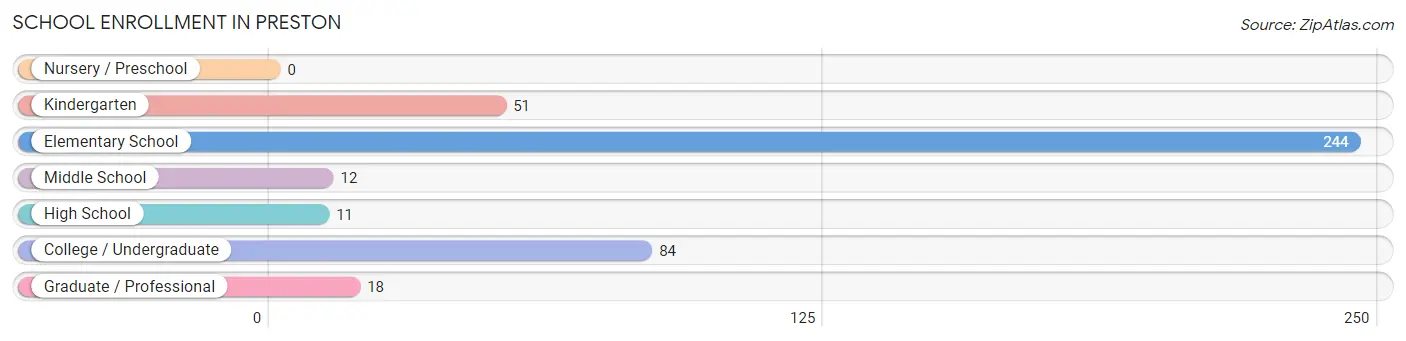
School Enrollment in Preston
The most common levels of schooling among the 420 students in Preston are elementary school (244 | 58.1%), college / undergraduate (84 | 20.0%), and kindergarten (51 | 12.1%).
| School Level | # Students | % Students |
| Nursery / Preschool | 0 | 0.0% |
| Kindergarten | 51 | 12.1% |
| Elementary School | 244 | 58.1% |
| Middle School | 12 | 2.9% |
| High School | 11 | 2.6% |
| College / Undergraduate | 84 | 20.0% |
| Graduate / Professional | 18 | 4.3% |
| Total | 420 | 100.0% |
School Enrollment by Age by Funding Source in Preston
Out of a total of 420 students who are enrolled in schools in Preston, 11 (2.6%) attend a private institution, while the remaining 409 (97.4%) are enrolled in public schools. The age group of 5 to 9 year old has the highest likelihood of being enrolled in private schools, with 11 (4.7% in the age bracket) enrolled. Conversely, the age group of 10 to 14 year olds has the lowest likelihood of being enrolled in a private school, with 73 (100.0% in the age bracket) attending a public institution.
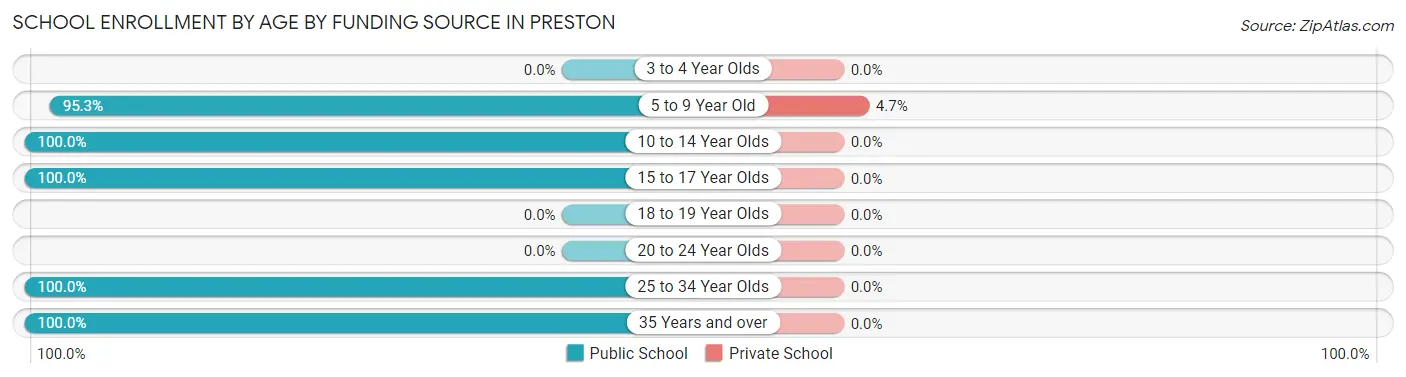
| Age Bracket | Public School | Private School |
| 3 to 4 Year Olds | 0 (0.0%) | 0 (0.0%) |
| 5 to 9 Year Old | 223 (95.3%) | 11 (4.7%) |
| 10 to 14 Year Olds | 73 (100.0%) | 0 (0.0%) |
| 15 to 17 Year Olds | 11 (100.0%) | 0 (0.0%) |
| 18 to 19 Year Olds | 0 (0.0%) | 0 (0.0%) |
| 20 to 24 Year Olds | 0 (0.0%) | 0 (0.0%) |
| 25 to 34 Year Olds | 84 (100.0%) | 0 (0.0%) |
| 35 Years and over | 18 (100.0%) | 0 (0.0%) |
| Total | 409 (97.4%) | 11 (2.6%) |
Educational Attainment by Field of Study in Preston
Business (40 | 23.9%), bio, nature & agricultural (38 | 22.8%), arts & humanities (29 | 17.4%), education (25 | 15.0%), and science & technology (18 | 10.8%) are the most common fields of study among 167 individuals in Preston who have obtained a bachelor's degree or higher.
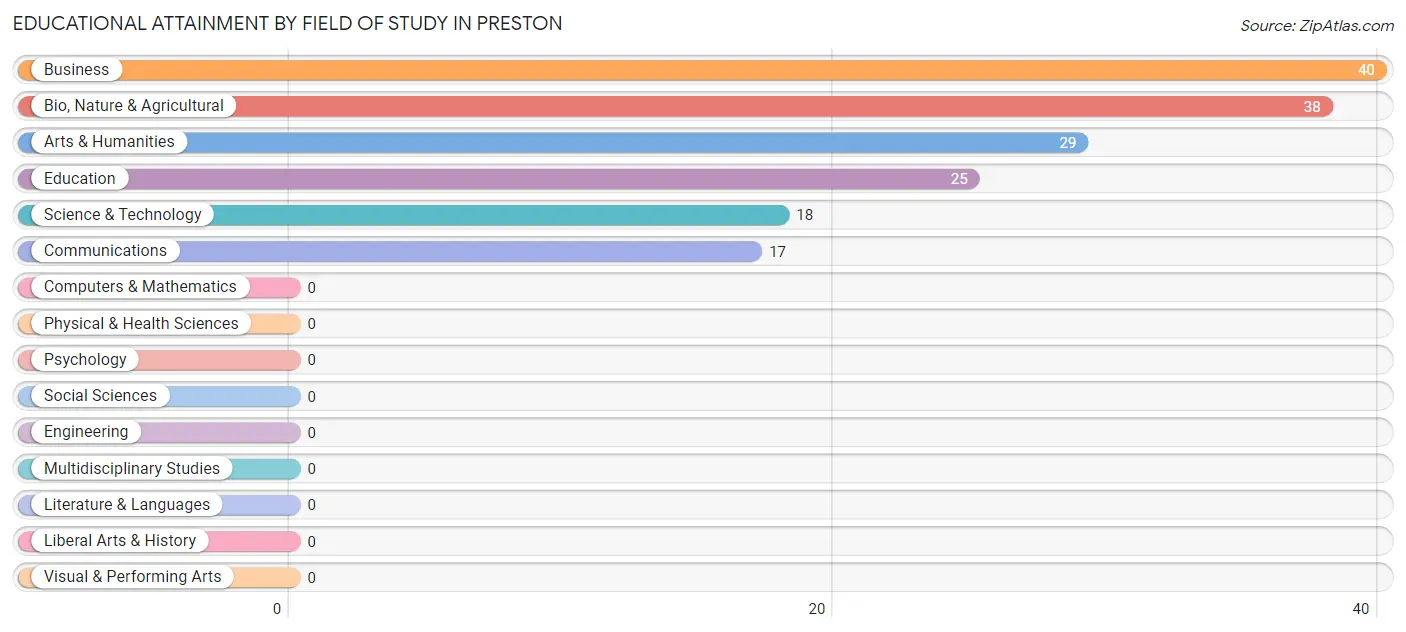
| Field of Study | # Graduates | % Graduates |
| Computers & Mathematics | 0 | 0.0% |
| Bio, Nature & Agricultural | 38 | 22.8% |
| Physical & Health Sciences | 0 | 0.0% |
| Psychology | 0 | 0.0% |
| Social Sciences | 0 | 0.0% |
| Engineering | 0 | 0.0% |
| Multidisciplinary Studies | 0 | 0.0% |
| Science & Technology | 18 | 10.8% |
| Business | 40 | 23.9% |
| Education | 25 | 15.0% |
| Literature & Languages | 0 | 0.0% |
| Liberal Arts & History | 0 | 0.0% |
| Visual & Performing Arts | 0 | 0.0% |
| Communications | 17 | 10.2% |
| Arts & Humanities | 29 | 17.4% |
| Total | 167 | 100.0% |
Transportation & Commute in Preston
Vehicle Availability by Sex in Preston
The most prevalent vehicle ownership categories in Preston are males with 2 vehicles (392, accounting for 81.7%) and females with 2 vehicles (426, making up 63.7%).
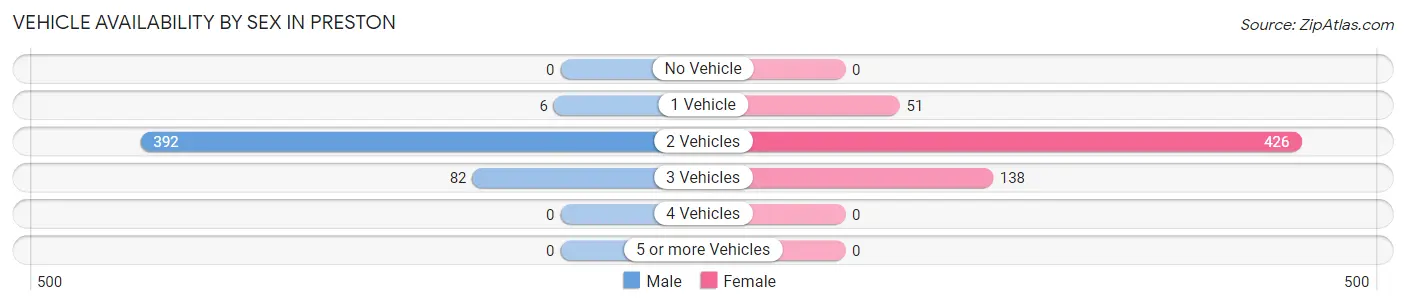
| Vehicles Available | Male | Female |
| No Vehicle | 0 (0.0%) | 0 (0.0%) |
| 1 Vehicle | 6 (1.3%) | 51 (8.3%) |
| 2 Vehicles | 392 (81.7%) | 426 (69.3%) |
| 3 Vehicles | 82 (17.1%) | 138 (22.4%) |
| 4 Vehicles | 0 (0.0%) | 0 (0.0%) |
| 5 or more Vehicles | 0 (0.0%) | 0 (0.0%) |
| Total | 480 (100.0%) | 615 (100.0%) |
Commute Time in Preston
The most frequently occuring commute durations in Preston are 45 to 59 minutes (258 commuters, 24.1%), 30 to 34 minutes (255 commuters, 23.8%), and 5 to 9 minutes (172 commuters, 16.0%).
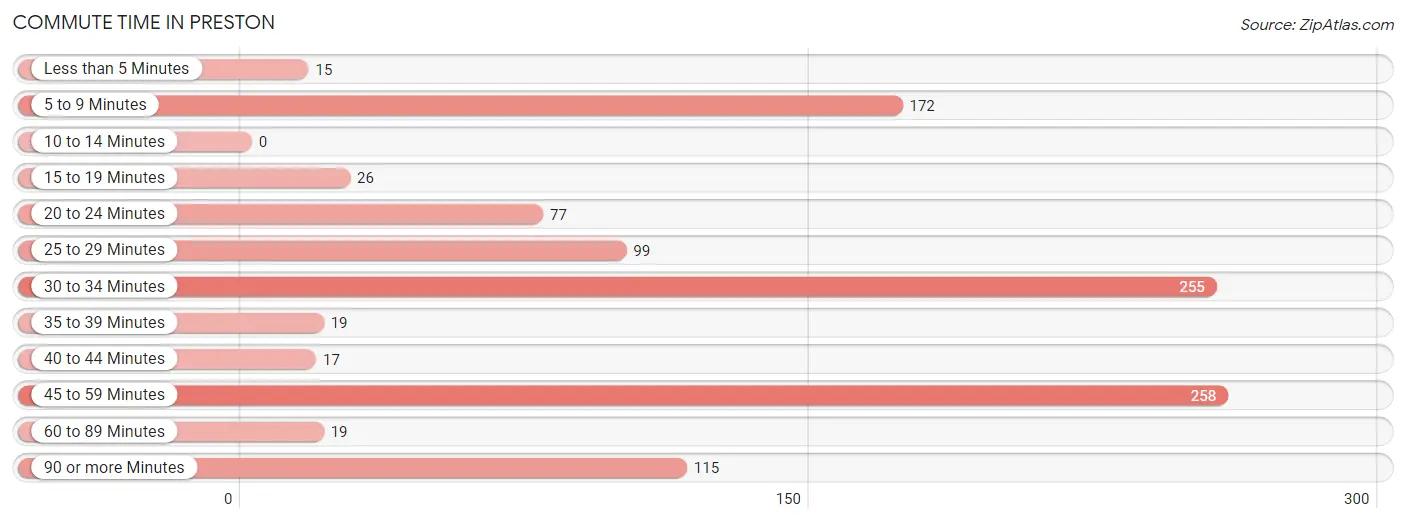
| Commute Time | # Commuters | % Commuters |
| Less than 5 Minutes | 15 | 1.4% |
| 5 to 9 Minutes | 172 | 16.0% |
| 10 to 14 Minutes | 0 | 0.0% |
| 15 to 19 Minutes | 26 | 2.4% |
| 20 to 24 Minutes | 77 | 7.2% |
| 25 to 29 Minutes | 99 | 9.2% |
| 30 to 34 Minutes | 255 | 23.8% |
| 35 to 39 Minutes | 19 | 1.8% |
| 40 to 44 Minutes | 17 | 1.6% |
| 45 to 59 Minutes | 258 | 24.1% |
| 60 to 89 Minutes | 19 | 1.8% |
| 90 or more Minutes | 115 | 10.7% |
Commute Time by Sex in Preston
The most common commute times in Preston are 30 to 34 minutes (121 commuters, 26.5%) for males and 45 to 59 minutes (181 commuters, 29.4%) for females.
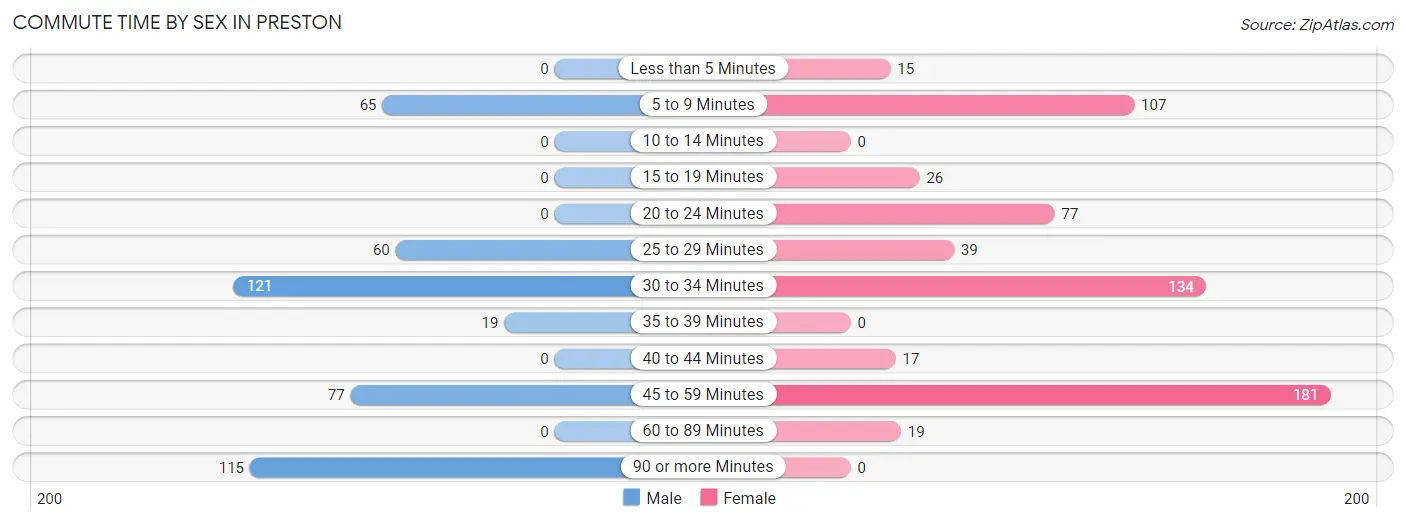
| Commute Time | Male | Female |
| Less than 5 Minutes | 0 (0.0%) | 15 (2.4%) |
| 5 to 9 Minutes | 65 (14.2%) | 107 (17.4%) |
| 10 to 14 Minutes | 0 (0.0%) | 0 (0.0%) |
| 15 to 19 Minutes | 0 (0.0%) | 26 (4.2%) |
| 20 to 24 Minutes | 0 (0.0%) | 77 (12.5%) |
| 25 to 29 Minutes | 60 (13.1%) | 39 (6.3%) |
| 30 to 34 Minutes | 121 (26.5%) | 134 (21.8%) |
| 35 to 39 Minutes | 19 (4.2%) | 0 (0.0%) |
| 40 to 44 Minutes | 0 (0.0%) | 17 (2.8%) |
| 45 to 59 Minutes | 77 (16.9%) | 181 (29.4%) |
| 60 to 89 Minutes | 0 (0.0%) | 19 (3.1%) |
| 90 or more Minutes | 115 (25.2%) | 0 (0.0%) |
Time of Departure to Work by Sex in Preston
The most frequent times of departure to work in Preston are 5:30 AM to 5:59 AM (98, 21.4%) for males and 9:00 AM to 9:59 AM (163, 26.5%) for females.
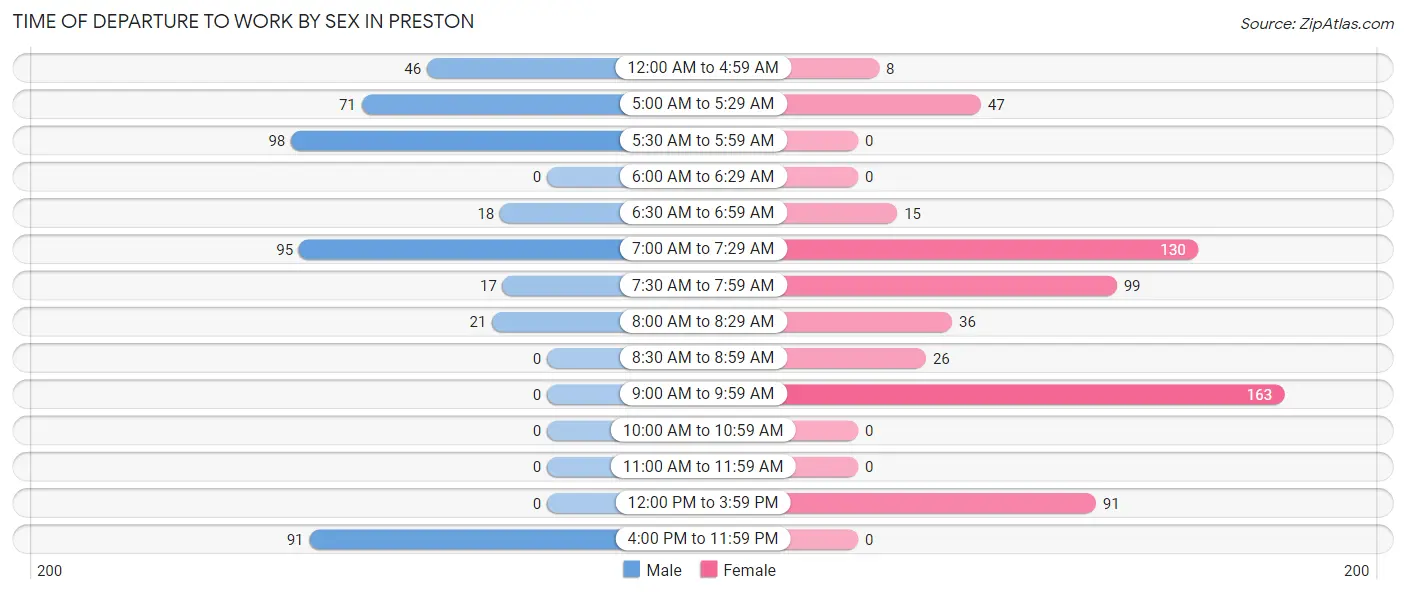
| Time of Departure | Male | Female |
| 12:00 AM to 4:59 AM | 46 (10.1%) | 8 (1.3%) |
| 5:00 AM to 5:29 AM | 71 (15.5%) | 47 (7.6%) |
| 5:30 AM to 5:59 AM | 98 (21.4%) | 0 (0.0%) |
| 6:00 AM to 6:29 AM | 0 (0.0%) | 0 (0.0%) |
| 6:30 AM to 6:59 AM | 18 (3.9%) | 15 (2.4%) |
| 7:00 AM to 7:29 AM | 95 (20.8%) | 130 (21.1%) |
| 7:30 AM to 7:59 AM | 17 (3.7%) | 99 (16.1%) |
| 8:00 AM to 8:29 AM | 21 (4.6%) | 36 (5.9%) |
| 8:30 AM to 8:59 AM | 0 (0.0%) | 26 (4.2%) |
| 9:00 AM to 9:59 AM | 0 (0.0%) | 163 (26.5%) |
| 10:00 AM to 10:59 AM | 0 (0.0%) | 0 (0.0%) |
| 11:00 AM to 11:59 AM | 0 (0.0%) | 0 (0.0%) |
| 12:00 PM to 3:59 PM | 0 (0.0%) | 91 (14.8%) |
| 4:00 PM to 11:59 PM | 91 (19.9%) | 0 (0.0%) |
| Total | 457 (100.0%) | 615 (100.0%) |
Housing Occupancy in Preston
Occupancy by Ownership in Preston
Of the total 947 dwellings in Preston, owner-occupied units account for 679 (71.7%), while renter-occupied units make up 268 (28.3%).
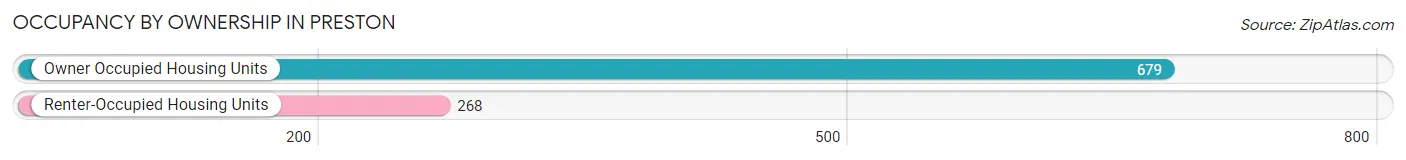
| Occupancy | # Housing Units | % Housing Units |
| Owner Occupied Housing Units | 679 | 71.7% |
| Renter-Occupied Housing Units | 268 | 28.3% |
| Total Occupied Housing Units | 947 | 100.0% |
Occupancy by Household Size in Preston
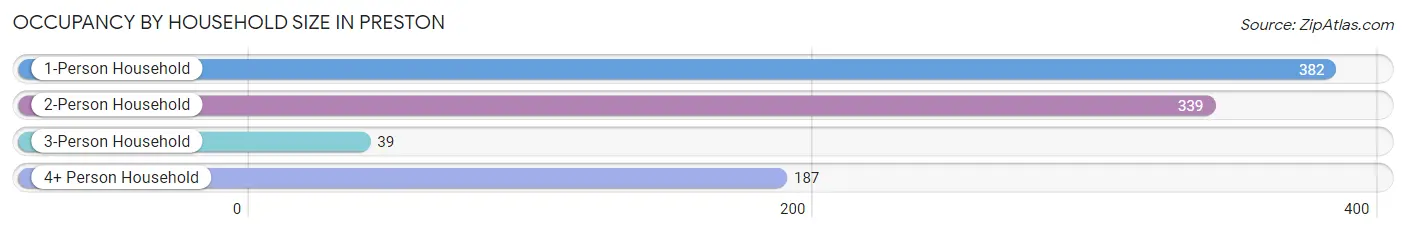
| Household Size | # Housing Units | % Housing Units |
| 1-Person Household | 382 | 40.3% |
| 2-Person Household | 339 | 35.8% |
| 3-Person Household | 39 | 4.1% |
| 4+ Person Household | 187 | 19.8% |
| Total Housing Units | 947 | 100.0% |
Occupancy by Ownership by Household Size in Preston
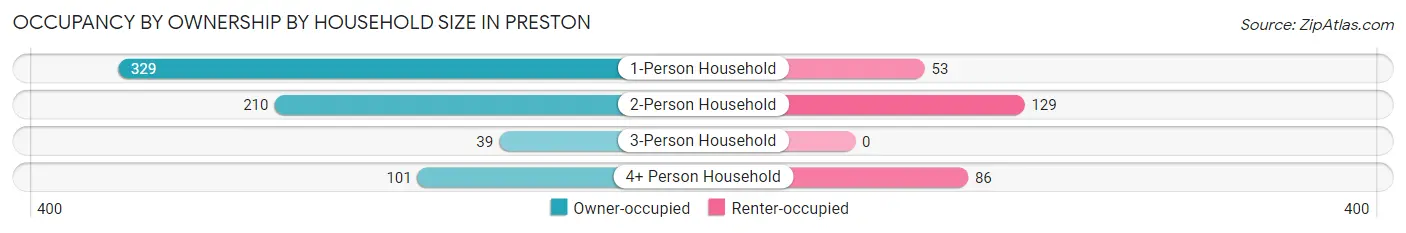
| Household Size | Owner-occupied | Renter-occupied |
| 1-Person Household | 329 (86.1%) | 53 (13.9%) |
| 2-Person Household | 210 (62.0%) | 129 (38.1%) |
| 3-Person Household | 39 (100.0%) | 0 (0.0%) |
| 4+ Person Household | 101 (54.0%) | 86 (46.0%) |
| Total Housing Units | 679 (71.7%) | 268 (28.3%) |
Occupancy by Educational Attainment in Preston
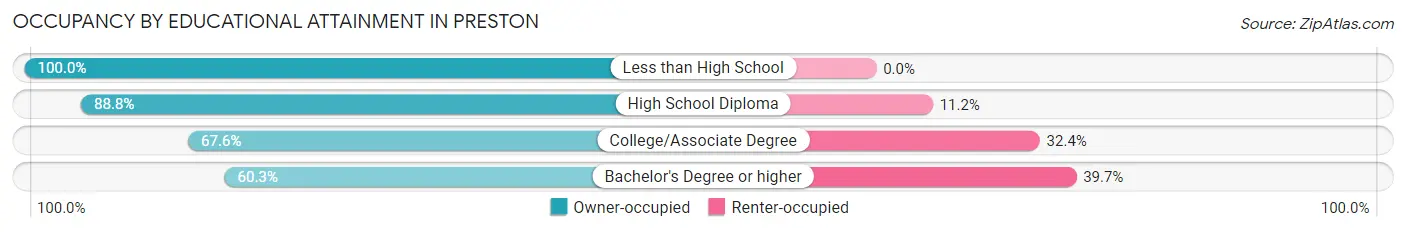
| Household Size | Owner-occupied | Renter-occupied |
| Less than High School | 6 (100.0%) | 0 (0.0%) |
| High School Diploma | 190 (88.8%) | 24 (11.2%) |
| College/Associate Degree | 413 (67.6%) | 198 (32.4%) |
| Bachelor's Degree or higher | 70 (60.3%) | 46 (39.7%) |
Occupancy by Age of Householder in Preston
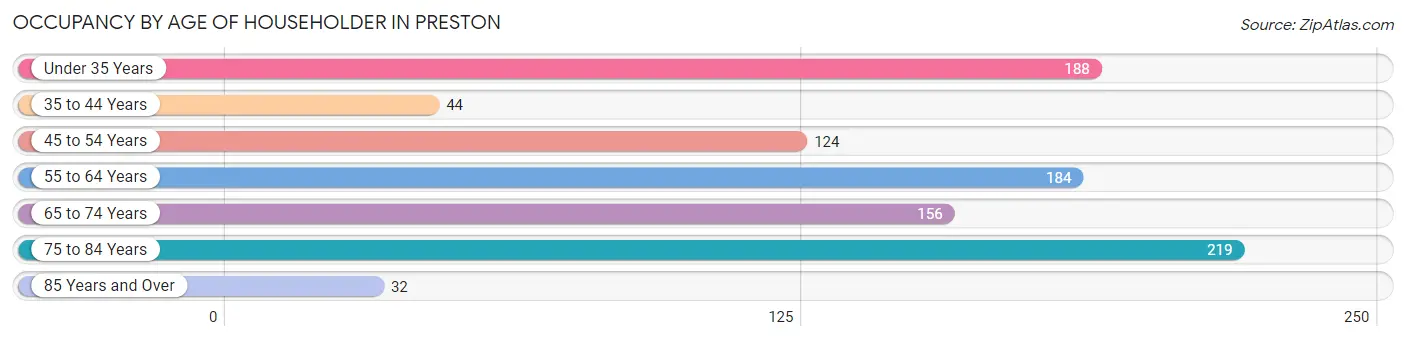
| Age Bracket | # Households | % Households |
| Under 35 Years | 188 | 19.9% |
| 35 to 44 Years | 44 | 4.6% |
| 45 to 54 Years | 124 | 13.1% |
| 55 to 64 Years | 184 | 19.4% |
| 65 to 74 Years | 156 | 16.5% |
| 75 to 84 Years | 219 | 23.1% |
| 85 Years and Over | 32 | 3.4% |
| Total | 947 | 100.0% |
Housing Finances in Preston
Median Income by Occupancy in Preston
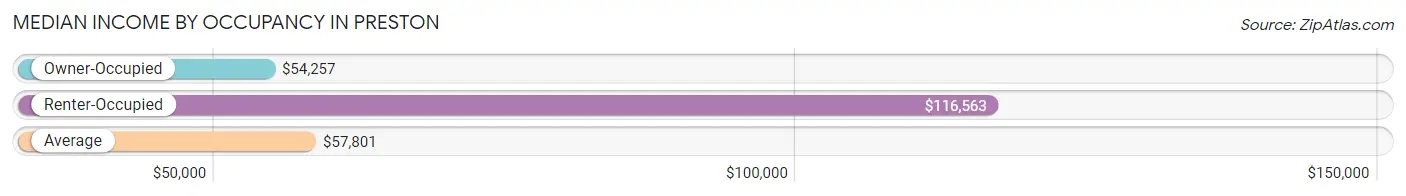
| Occupancy Type | # Households | Median Income |
| Owner-Occupied | 679 (71.7%) | $54,257 |
| Renter-Occupied | 268 (28.3%) | $116,563 |
| Average | 947 (100.0%) | $57,801 |
Occupancy by Householder Income Bracket in Preston
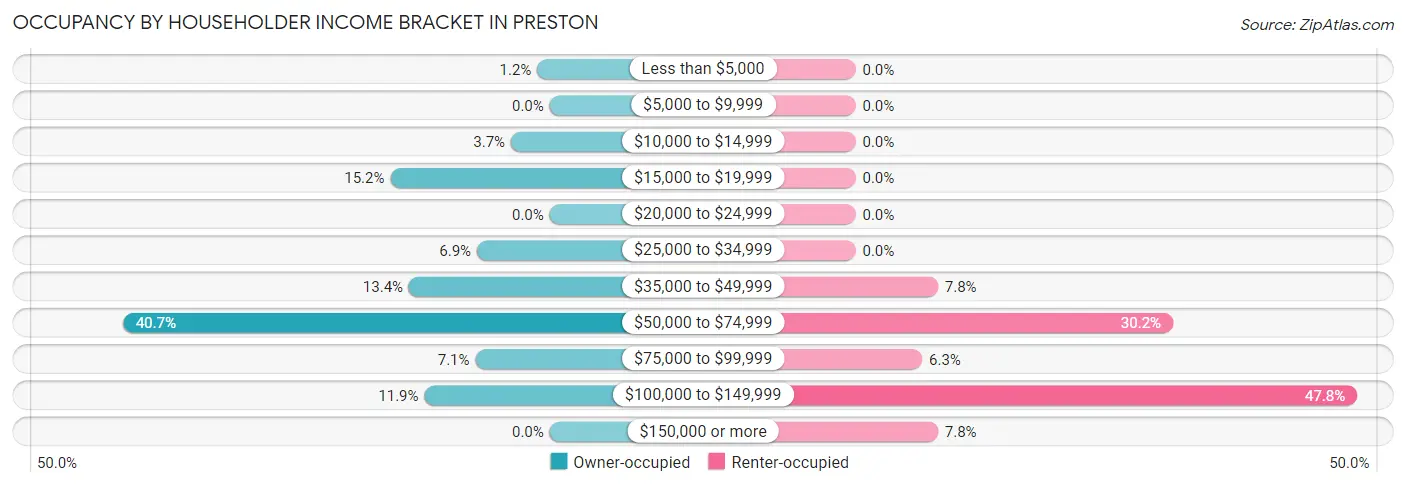
| Income Bracket | Owner-occupied | Renter-occupied |
| Less than $5,000 | 8 (1.2%) | 0 (0.0%) |
| $5,000 to $9,999 | 0 (0.0%) | 0 (0.0%) |
| $10,000 to $14,999 | 25 (3.7%) | 0 (0.0%) |
| $15,000 to $19,999 | 103 (15.2%) | 0 (0.0%) |
| $20,000 to $24,999 | 0 (0.0%) | 0 (0.0%) |
| $25,000 to $34,999 | 47 (6.9%) | 0 (0.0%) |
| $35,000 to $49,999 | 91 (13.4%) | 21 (7.8%) |
| $50,000 to $74,999 | 276 (40.6%) | 81 (30.2%) |
| $75,000 to $99,999 | 48 (7.1%) | 17 (6.3%) |
| $100,000 to $149,999 | 81 (11.9%) | 128 (47.8%) |
| $150,000 or more | 0 (0.0%) | 21 (7.8%) |
| Total | 679 (100.0%) | 268 (100.0%) |
Monthly Housing Cost Tiers in Preston
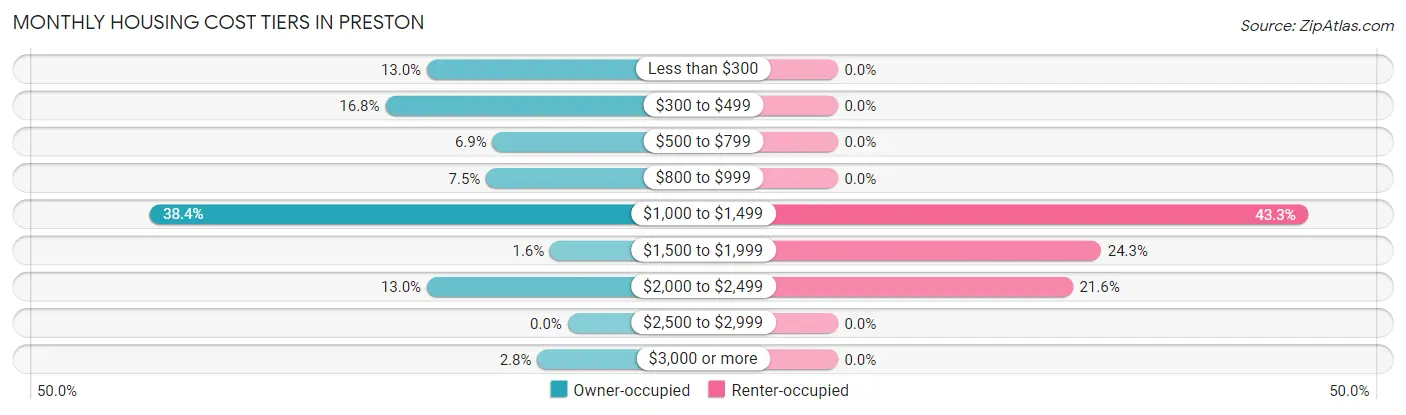
| Monthly Cost | Owner-occupied | Renter-occupied |
| Less than $300 | 88 (13.0%) | 0 (0.0%) |
| $300 to $499 | 114 (16.8%) | 0 (0.0%) |
| $500 to $799 | 47 (6.9%) | 0 (0.0%) |
| $800 to $999 | 51 (7.5%) | 0 (0.0%) |
| $1,000 to $1,499 | 261 (38.4%) | 116 (43.3%) |
| $1,500 to $1,999 | 11 (1.6%) | 65 (24.2%) |
| $2,000 to $2,499 | 88 (13.0%) | 58 (21.6%) |
| $2,500 to $2,999 | 0 (0.0%) | 0 (0.0%) |
| $3,000 or more | 19 (2.8%) | 0 (0.0%) |
| Total | 679 (100.0%) | 268 (100.0%) |
Physical Housing Characteristics in Preston
Housing Structures in Preston
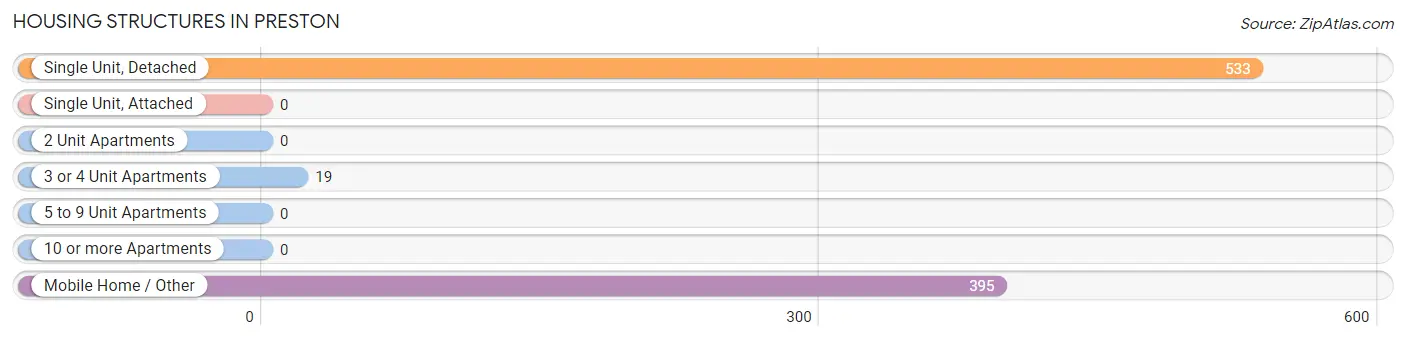
| Structure Type | # Housing Units | % Housing Units |
| Single Unit, Detached | 533 | 56.3% |
| Single Unit, Attached | 0 | 0.0% |
| 2 Unit Apartments | 0 | 0.0% |
| 3 or 4 Unit Apartments | 19 | 2.0% |
| 5 to 9 Unit Apartments | 0 | 0.0% |
| 10 or more Apartments | 0 | 0.0% |
| Mobile Home / Other | 395 | 41.7% |
| Total | 947 | 100.0% |
Housing Structures by Occupancy in Preston
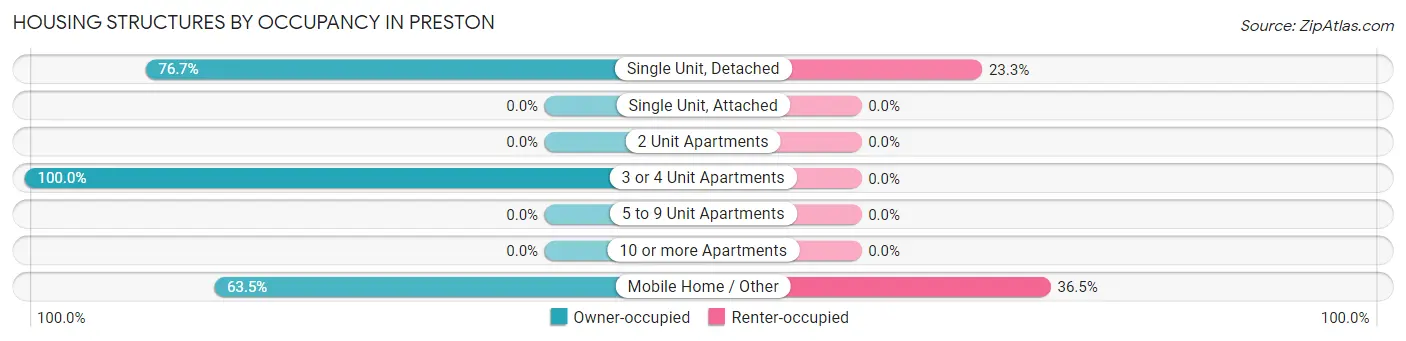
| Structure Type | Owner-occupied | Renter-occupied |
| Single Unit, Detached | 409 (76.7%) | 124 (23.3%) |
| Single Unit, Attached | 0 (0.0%) | 0 (0.0%) |
| 2 Unit Apartments | 0 (0.0%) | 0 (0.0%) |
| 3 or 4 Unit Apartments | 19 (100.0%) | 0 (0.0%) |
| 5 to 9 Unit Apartments | 0 (0.0%) | 0 (0.0%) |
| 10 or more Apartments | 0 (0.0%) | 0 (0.0%) |
| Mobile Home / Other | 251 (63.5%) | 144 (36.5%) |
| Total | 679 (71.7%) | 268 (28.3%) |
Housing Structures by Number of Rooms in Preston
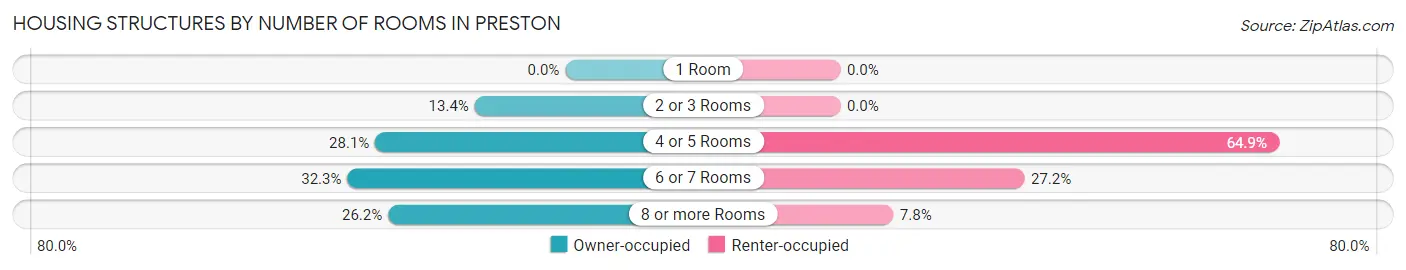
| Number of Rooms | Owner-occupied | Renter-occupied |
| 1 Room | 0 (0.0%) | 0 (0.0%) |
| 2 or 3 Rooms | 91 (13.4%) | 0 (0.0%) |
| 4 or 5 Rooms | 191 (28.1%) | 174 (64.9%) |
| 6 or 7 Rooms | 219 (32.3%) | 73 (27.2%) |
| 8 or more Rooms | 178 (26.2%) | 21 (7.8%) |
| Total | 679 (100.0%) | 268 (100.0%) |
Housing Structure by Heating Type in Preston
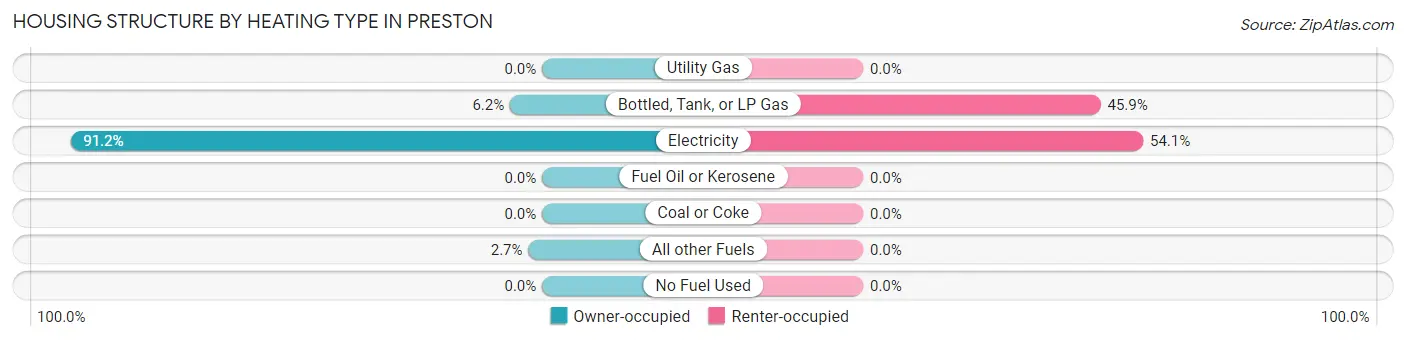
| Heating Type | Owner-occupied | Renter-occupied |
| Utility Gas | 0 (0.0%) | 0 (0.0%) |
| Bottled, Tank, or LP Gas | 42 (6.2%) | 123 (45.9%) |
| Electricity | 619 (91.2%) | 145 (54.1%) |
| Fuel Oil or Kerosene | 0 (0.0%) | 0 (0.0%) |
| Coal or Coke | 0 (0.0%) | 0 (0.0%) |
| All other Fuels | 18 (2.6%) | 0 (0.0%) |
| No Fuel Used | 0 (0.0%) | 0 (0.0%) |
| Total | 679 (100.0%) | 268 (100.0%) |
Household Vehicle Usage in Preston
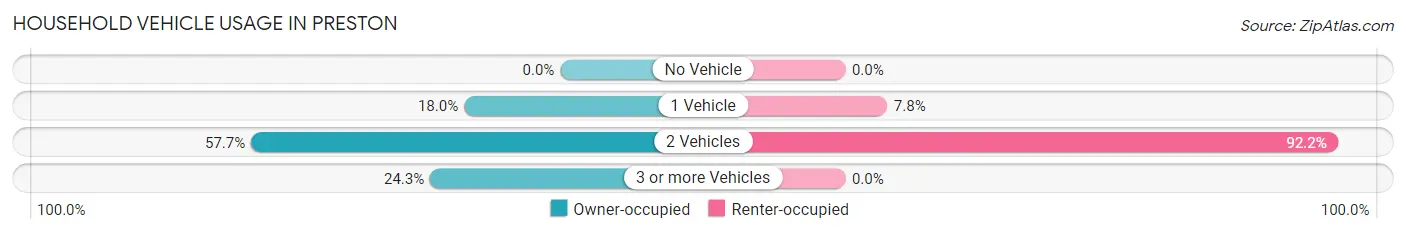
| Vehicles per Household | Owner-occupied | Renter-occupied |
| No Vehicle | 0 (0.0%) | 0 (0.0%) |
| 1 Vehicle | 122 (18.0%) | 21 (7.8%) |
| 2 Vehicles | 392 (57.7%) | 247 (92.2%) |
| 3 or more Vehicles | 165 (24.3%) | 0 (0.0%) |
| Total | 679 (100.0%) | 268 (100.0%) |
Real Estate & Mortgages in Preston
Real Estate and Mortgage Overview in Preston
| Characteristic | Without Mortgage | With Mortgage |
| Housing Units | 275 | 404 |
| Median Property Value | $141,300 | $155,700 |
| Median Household Income | $30,080 | $0 |
| Monthly Housing Costs | $443 | $19 |
| Real Estate Taxes | $834 | $10 |
Property Value by Mortgage Status in Preston
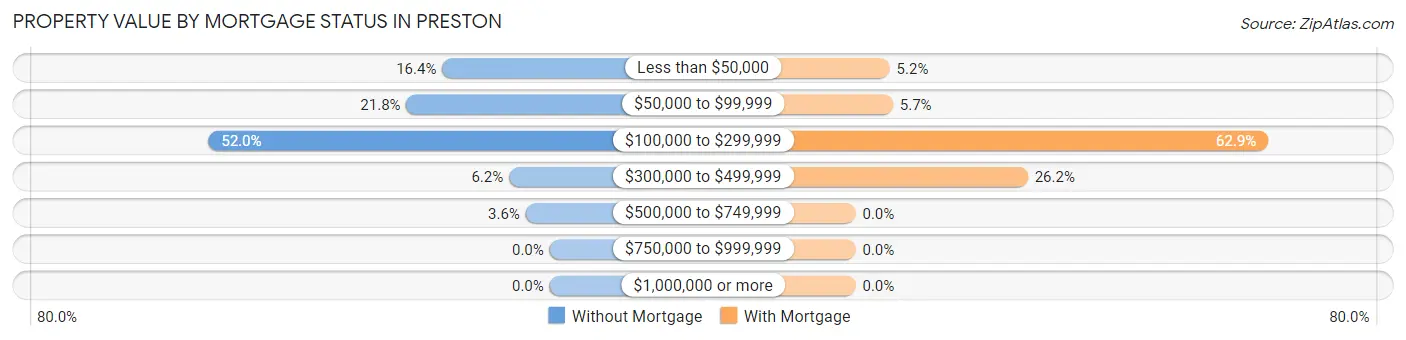
| Property Value | Without Mortgage | With Mortgage |
| Less than $50,000 | 45 (16.4%) | 21 (5.2%) |
| $50,000 to $99,999 | 60 (21.8%) | 23 (5.7%) |
| $100,000 to $299,999 | 143 (52.0%) | 254 (62.9%) |
| $300,000 to $499,999 | 17 (6.2%) | 106 (26.2%) |
| $500,000 to $749,999 | 10 (3.6%) | 0 (0.0%) |
| $750,000 to $999,999 | 0 (0.0%) | 0 (0.0%) |
| $1,000,000 or more | 0 (0.0%) | 0 (0.0%) |
| Total | 275 (100.0%) | 404 (100.0%) |
Household Income by Mortgage Status in Preston
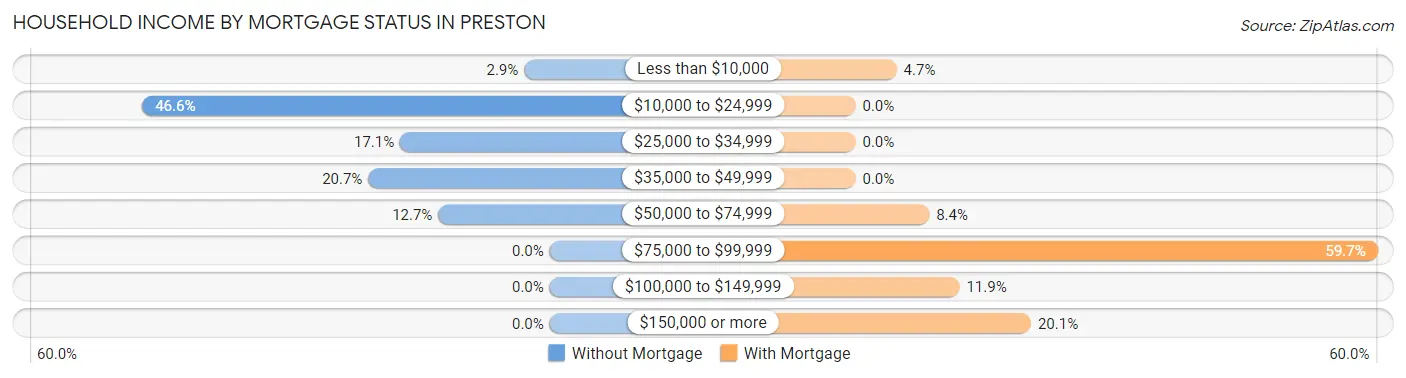
| Household Income | Without Mortgage | With Mortgage |
| Less than $10,000 | 8 (2.9%) | 19 (4.7%) |
| $10,000 to $24,999 | 128 (46.6%) | 0 (0.0%) |
| $25,000 to $34,999 | 47 (17.1%) | 0 (0.0%) |
| $35,000 to $49,999 | 57 (20.7%) | 0 (0.0%) |
| $50,000 to $74,999 | 35 (12.7%) | 34 (8.4%) |
| $75,000 to $99,999 | 0 (0.0%) | 241 (59.7%) |
| $100,000 to $149,999 | 0 (0.0%) | 48 (11.9%) |
| $150,000 or more | 0 (0.0%) | 81 (20.1%) |
| Total | 275 (100.0%) | 404 (100.0%) |
Property Value to Household Income Ratio in Preston
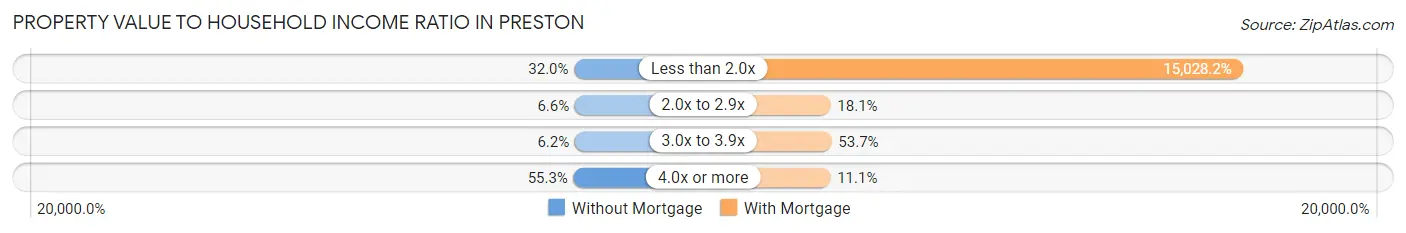
| Value-to-Income Ratio | Without Mortgage | With Mortgage |
| Less than 2.0x | 88 (32.0%) | 60,714 (15,028.2%) |
| 2.0x to 2.9x | 18 (6.6%) | 73 (18.1%) |
| 3.0x to 3.9x | 17 (6.2%) | 217 (53.7%) |
| 4.0x or more | 152 (55.3%) | 45 (11.1%) |
| Total | 275 (100.0%) | 404 (100.0%) |
Real Estate Taxes by Mortgage Status in Preston
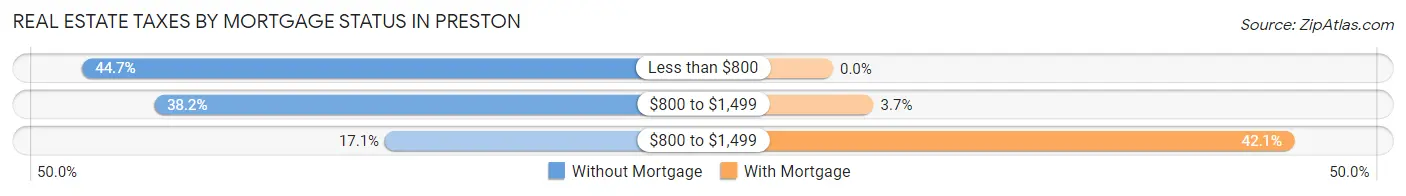
| Property Taxes | Without Mortgage | With Mortgage |
| Less than $800 | 123 (44.7%) | 0 (0.0%) |
| $800 to $1,499 | 105 (38.2%) | 15 (3.7%) |
| $800 to $1,499 | 47 (17.1%) | 170 (42.1%) |
| Total | 275 (100.0%) | 404 (100.0%) |
Health & Disability in Preston
Health Insurance Coverage by Age in Preston
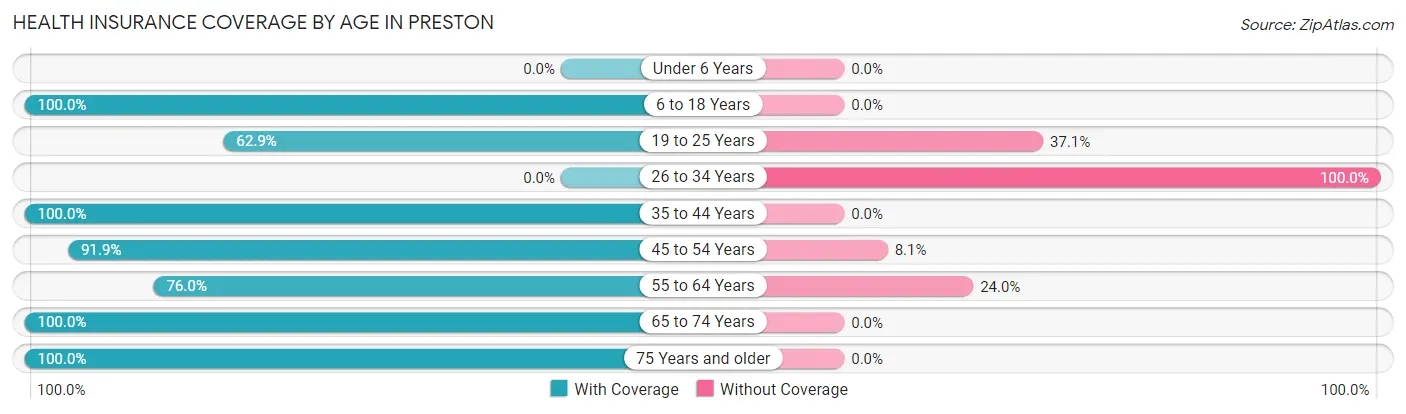
| Age Bracket | With Coverage | Without Coverage |
| Under 6 Years | 0 (0.0%) | 0 (0.0%) |
| 6 to 18 Years | 318 (100.0%) | 0 (0.0%) |
| 19 to 25 Years | 112 (62.9%) | 66 (37.1%) |
| 26 to 34 Years | 0 (0.0%) | 429 (100.0%) |
| 35 to 44 Years | 95 (100.0%) | 0 (0.0%) |
| 45 to 54 Years | 295 (91.9%) | 26 (8.1%) |
| 55 to 64 Years | 218 (76.0%) | 69 (24.0%) |
| 65 to 74 Years | 236 (100.0%) | 0 (0.0%) |
| 75 Years and older | 317 (100.0%) | 0 (0.0%) |
| Total | 1,591 (73.0%) | 590 (27.1%) |
Health Insurance Coverage by Citizenship Status in Preston
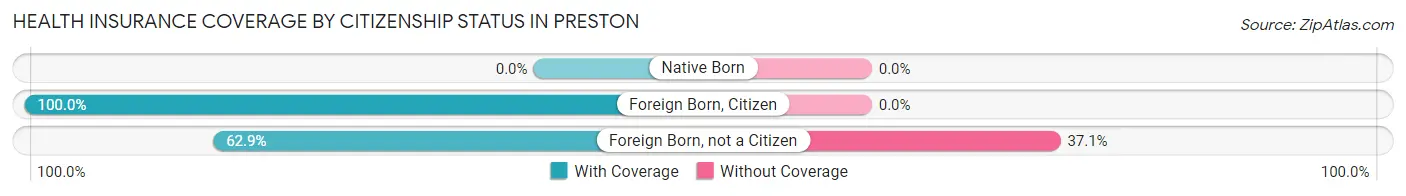
| Citizenship Status | With Coverage | Without Coverage |
| Native Born | 0 (0.0%) | 0 (0.0%) |
| Foreign Born, Citizen | 318 (100.0%) | 0 (0.0%) |
| Foreign Born, not a Citizen | 112 (62.9%) | 66 (37.1%) |
Health Insurance Coverage by Household Income in Preston
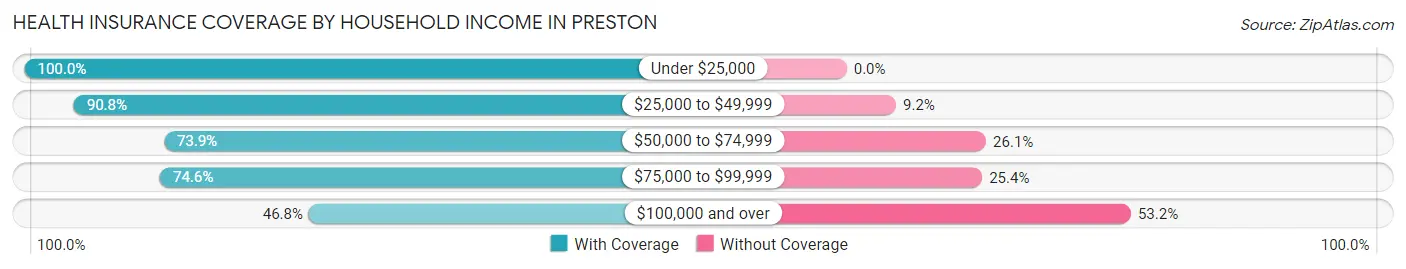
| Household Income | With Coverage | Without Coverage |
| Under $25,000 | 144 (100.0%) | 0 (0.0%) |
| $25,000 to $49,999 | 403 (90.8%) | 41 (9.2%) |
| $50,000 to $74,999 | 716 (73.9%) | 253 (26.1%) |
| $75,000 to $99,999 | 97 (74.6%) | 33 (25.4%) |
| $100,000 and over | 231 (46.8%) | 263 (53.2%) |
Public vs Private Health Insurance Coverage by Age in Preston
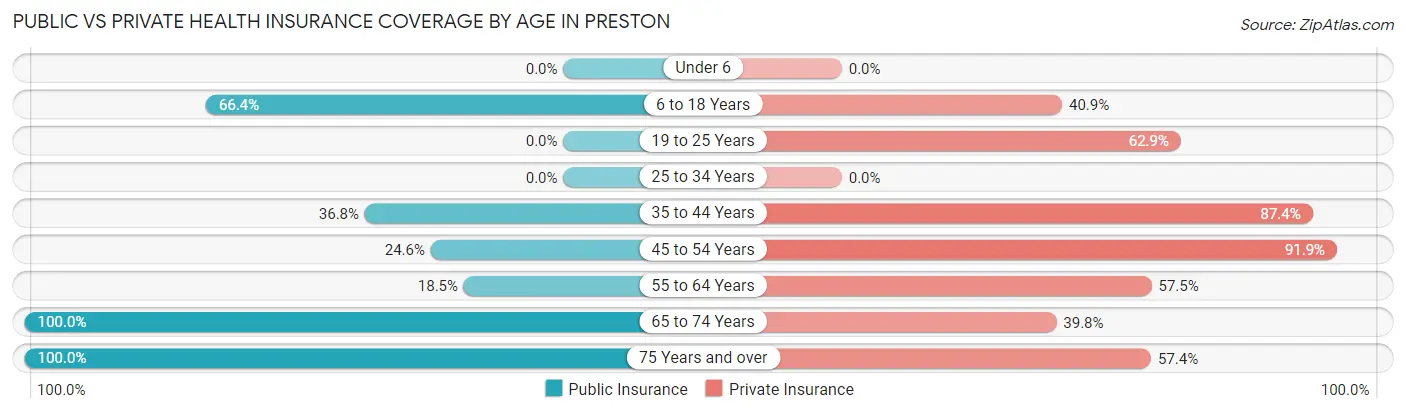
| Age Bracket | Public Insurance | Private Insurance |
| Under 6 | 0 (0.0%) | 0 (0.0%) |
| 6 to 18 Years | 211 (66.3%) | 130 (40.9%) |
| 19 to 25 Years | 0 (0.0%) | 112 (62.9%) |
| 25 to 34 Years | 0 (0.0%) | 0 (0.0%) |
| 35 to 44 Years | 35 (36.8%) | 83 (87.4%) |
| 45 to 54 Years | 79 (24.6%) | 295 (91.9%) |
| 55 to 64 Years | 53 (18.5%) | 165 (57.5%) |
| 65 to 74 Years | 236 (100.0%) | 94 (39.8%) |
| 75 Years and over | 317 (100.0%) | 182 (57.4%) |
| Total | 931 (42.7%) | 1,061 (48.6%) |
Disability Status by Sex by Age in Preston
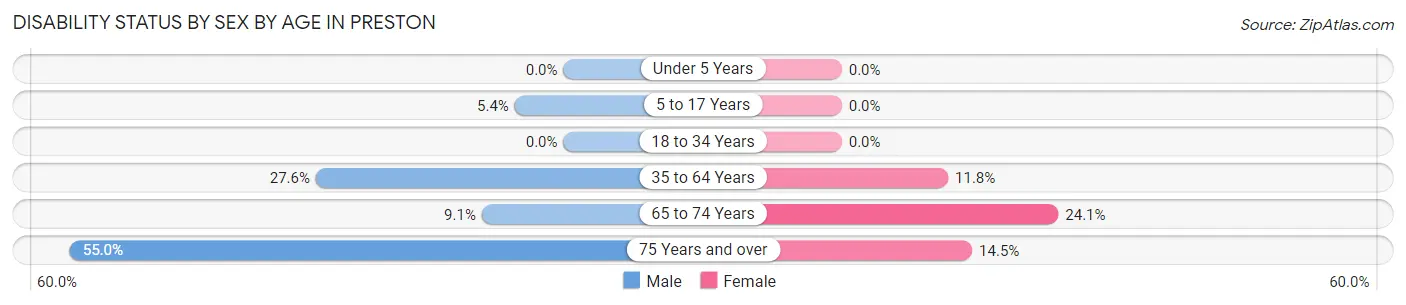
| Age Bracket | Male | Female |
| Under 5 Years | 0 (0.0%) | 0 (0.0%) |
| 5 to 17 Years | 11 (5.4%) | 0 (0.0%) |
| 18 to 34 Years | 0 (0.0%) | 0 (0.0%) |
| 35 to 64 Years | 110 (27.6%) | 36 (11.8%) |
| 65 to 74 Years | 6 (9.1%) | 41 (24.1%) |
| 75 Years and over | 72 (55.0%) | 27 (14.5%) |
Disability Class by Sex by Age in Preston
Disability Class: Hearing Difficulty
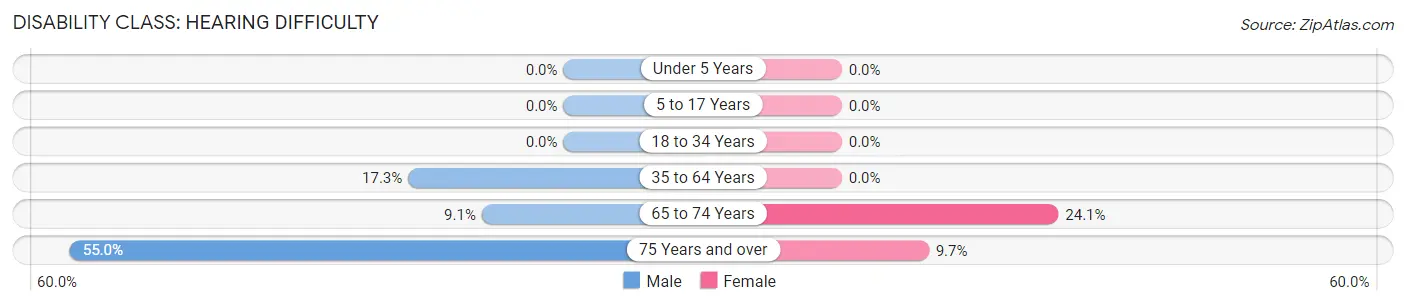
| Age Bracket | Male | Female |
| Under 5 Years | 0 (0.0%) | 0 (0.0%) |
| 5 to 17 Years | 0 (0.0%) | 0 (0.0%) |
| 18 to 34 Years | 0 (0.0%) | 0 (0.0%) |
| 35 to 64 Years | 69 (17.3%) | 0 (0.0%) |
| 65 to 74 Years | 6 (9.1%) | 41 (24.1%) |
| 75 Years and over | 72 (55.0%) | 18 (9.7%) |
Disability Class: Vision Difficulty
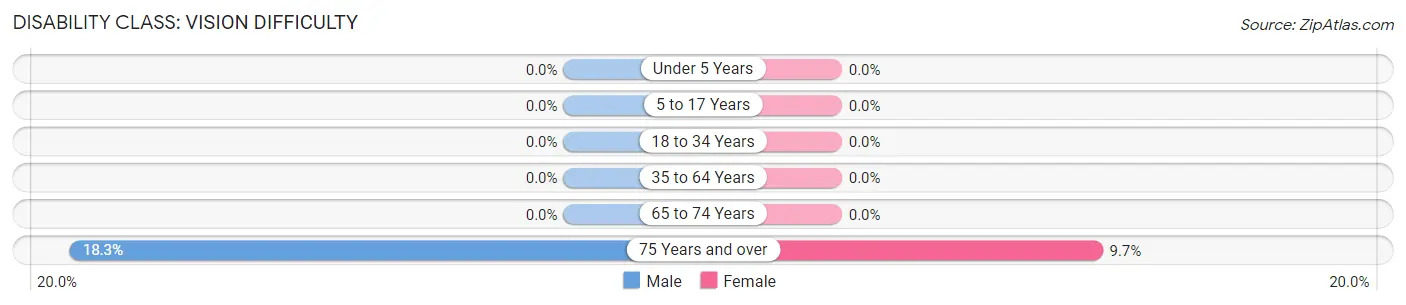
| Age Bracket | Male | Female |
| Under 5 Years | 0 (0.0%) | 0 (0.0%) |
| 5 to 17 Years | 0 (0.0%) | 0 (0.0%) |
| 18 to 34 Years | 0 (0.0%) | 0 (0.0%) |
| 35 to 64 Years | 0 (0.0%) | 0 (0.0%) |
| 65 to 74 Years | 0 (0.0%) | 0 (0.0%) |
| 75 Years and over | 24 (18.3%) | 18 (9.7%) |
Disability Class: Cognitive Difficulty
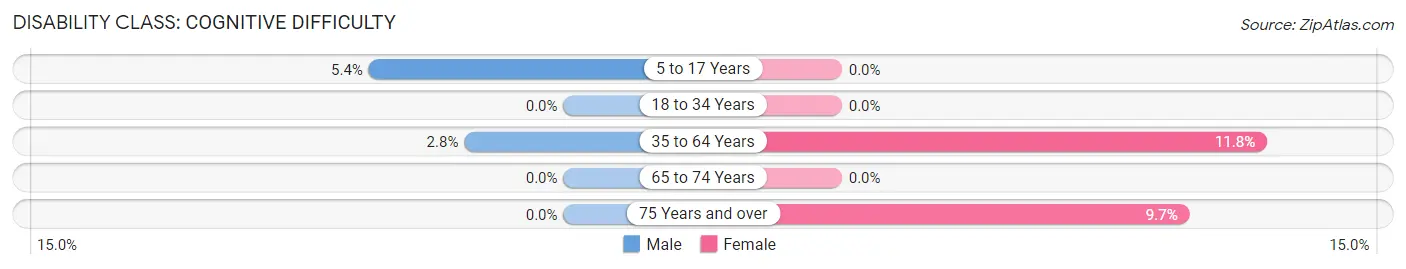
| Age Bracket | Male | Female |
| 5 to 17 Years | 11 (5.4%) | 0 (0.0%) |
| 18 to 34 Years | 0 (0.0%) | 0 (0.0%) |
| 35 to 64 Years | 11 (2.8%) | 36 (11.8%) |
| 65 to 74 Years | 0 (0.0%) | 0 (0.0%) |
| 75 Years and over | 0 (0.0%) | 18 (9.7%) |
Disability Class: Ambulatory Difficulty
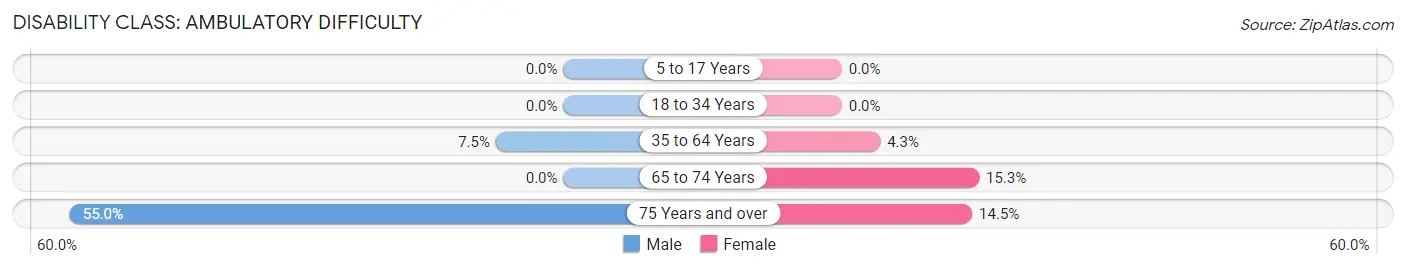
| Age Bracket | Male | Female |
| 5 to 17 Years | 0 (0.0%) | 0 (0.0%) |
| 18 to 34 Years | 0 (0.0%) | 0 (0.0%) |
| 35 to 64 Years | 30 (7.5%) | 13 (4.3%) |
| 65 to 74 Years | 0 (0.0%) | 26 (15.3%) |
| 75 Years and over | 72 (55.0%) | 27 (14.5%) |
Disability Class: Self-Care Difficulty
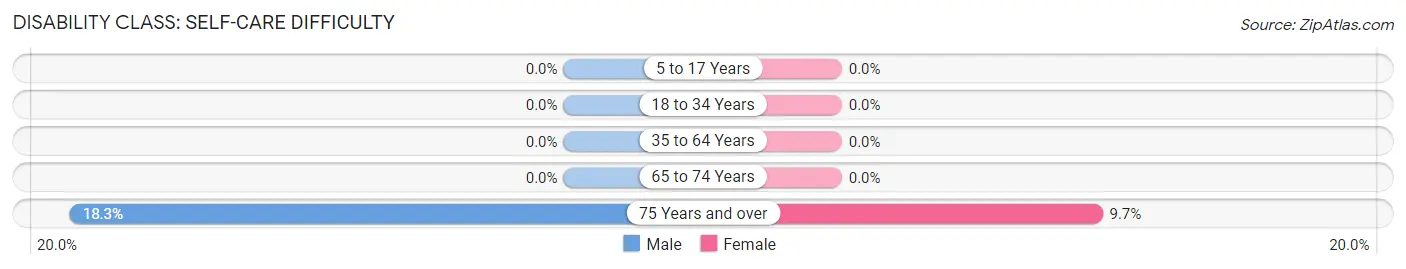
| Age Bracket | Male | Female |
| 5 to 17 Years | 0 (0.0%) | 0 (0.0%) |
| 18 to 34 Years | 0 (0.0%) | 0 (0.0%) |
| 35 to 64 Years | 0 (0.0%) | 0 (0.0%) |
| 65 to 74 Years | 0 (0.0%) | 0 (0.0%) |
| 75 Years and over | 24 (18.3%) | 18 (9.7%) |
Technology Access in Preston
Computing Device Access in Preston
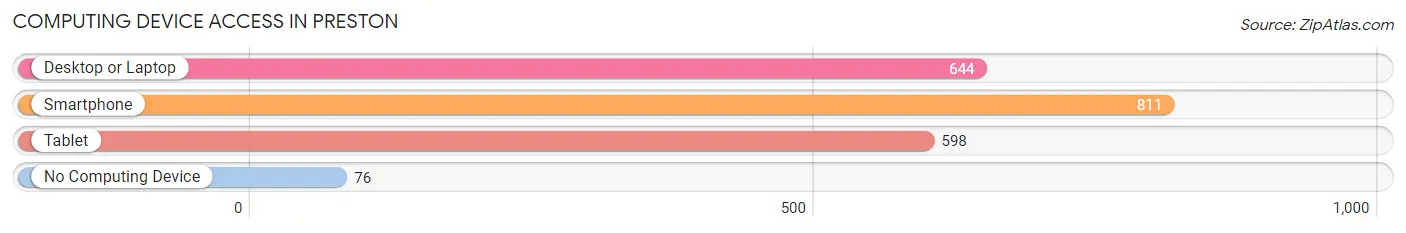
| Device Type | # Households | % Households |
| Desktop or Laptop | 644 | 68.0% |
| Smartphone | 811 | 85.6% |
| Tablet | 598 | 63.1% |
| No Computing Device | 76 | 8.0% |
| Total | 947 | 100.0% |
Internet Access in Preston
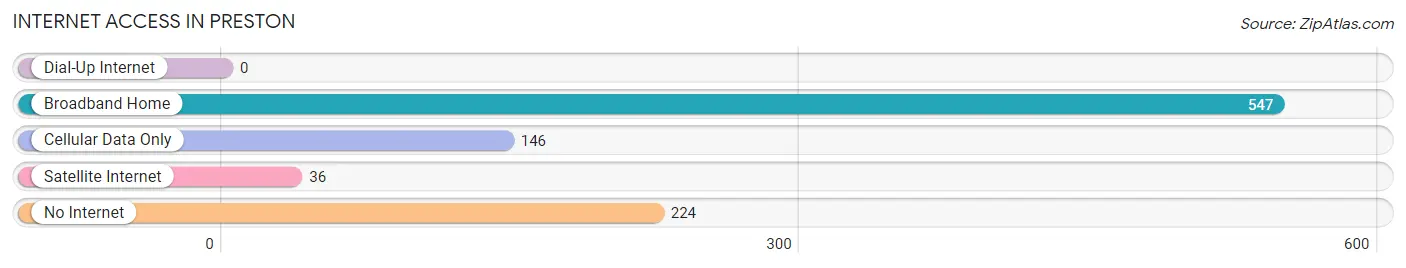
| Internet Type | # Households | % Households |
| Dial-Up Internet | 0 | 0.0% |
| Broadband Home | 547 | 57.8% |
| Cellular Data Only | 146 | 15.4% |
| Satellite Internet | 36 | 3.8% |
| No Internet | 224 | 23.6% |
| Total | 947 | 100.0% |
Preston Summary
Preston, Texas is a small town located in Collin County, Texas, United States. It is situated about 30 miles northeast of Dallas and is part of the Dallas-Fort Worth metropolitan area. The town was founded in 1848 and was named after William B. Preston, a former Secretary of War. As of the 2010 census, the population of Preston was 1,567.
History
Preston was founded in 1848 by William B. Preston, a former Secretary of War. The town was originally known as Prestonville, but the name was changed to Preston in 1854. The town was incorporated in 1873 and was the first town in Collin County to be incorporated.
In the late 19th century, Preston was a thriving agricultural community. Cotton was the main crop grown in the area, and the town was home to several cotton gins. The town also had a number of stores, churches, and a school.
In the early 20th century, Preston began to experience a decline in population as many of its residents moved to larger cities in search of better job opportunities. The Great Depression also had a negative impact on the town, and many of its businesses closed.
In the 1950s, Preston began to experience a resurgence in population as many of its former residents returned to the town. The town also began to attract new residents from other parts of the country.
Geography
Preston is located in Collin County, Texas, United States. It is situated about 30 miles northeast of Dallas and is part of the Dallas-Fort Worth metropolitan area. The town is located at the intersection of State Highway 289 and State Highway 78.
The town has a total area of 1.2 square miles, all of which is land. The town is situated on flat terrain and is surrounded by farmland.
Economy
The economy of Preston is largely based on agriculture. Cotton is the main crop grown in the area, and the town is home to several cotton gins. The town also has a number of stores, churches, and a school.
The town is also home to a number of small businesses, including restaurants, retail stores, and service providers. The town is also home to a number of manufacturing companies, including a plastics manufacturer and a metal fabrication company.
Demographics
As of the 2010 census, the population of Preston was 1,567. The racial makeup of the town was 79.3% White, 11.2% African American, 0.3% Native American, 0.7% Asian, 0.1% Pacific Islander, 6.2% from other races, and 2.4% from two or more races. Hispanic or Latino of any race were 11.7% of the population.
The median household income in Preston was $45,938, and the median family income was $50,625. The per capita income in Preston was $20,945. About 11.2% of families and 13.3% of the population were below the poverty line, including 17.2% of those under age 18 and 8.3% of those age 65 or over.
Common Questions
What is Per Capita Income in Preston?
Per Capita income in Preston is $31,935.
What is the Median Family Income in Preston?
Median Family Income in Preston is $60,054.
What is the Median Household income in Preston?
Median Household Income in Preston is $57,801.
What is Income or Wage Gap in Preston?
Income or Wage Gap in Preston is 20.9%.
Women in Preston earn 79.1 cents for every dollar earned by a man.
What is Inequality or Gini Index in Preston?
Inequality or Gini Index in Preston is 0.36.
What is the Total Population of Preston?
Total Population of Preston is 2,181.
What is the Total Male Population of Preston?
Total Male Population of Preston is 1,044.
What is the Total Female Population of Preston?
Total Female Population of Preston is 1,137.
What is the Ratio of Males per 100 Females in Preston?
There are 91.82 Males per 100 Females in Preston.
What is the Ratio of Females per 100 Males in Preston?
There are 108.91 Females per 100 Males in Preston.
What is the Median Population Age in Preston?
Median Population Age in Preston is 47.7 Years.
What is the Average Family Size in Preston
Average Family Size in Preston is 3.5 People.
What is the Average Household Size in Preston
Average Household Size in Preston is 2.3 People.
How Large is the Labor Force in Preston?
There are 1,226 People in the Labor Forcein in Preston.
What is the Percentage of People in the Labor Force in Preston?
65.4% of People are in the Labor Force in Preston.
What is the Unemployment Rate in Preston?
Unemployment Rate in Preston is 8.8%.