Zip Codes with the Highest Percentage of Population Employed in Food Preparation & Serving in Temple, TX
RELATED REPORTS & OPTIONS
Food Preparation & Serving
Temple
Compare Zip Codes
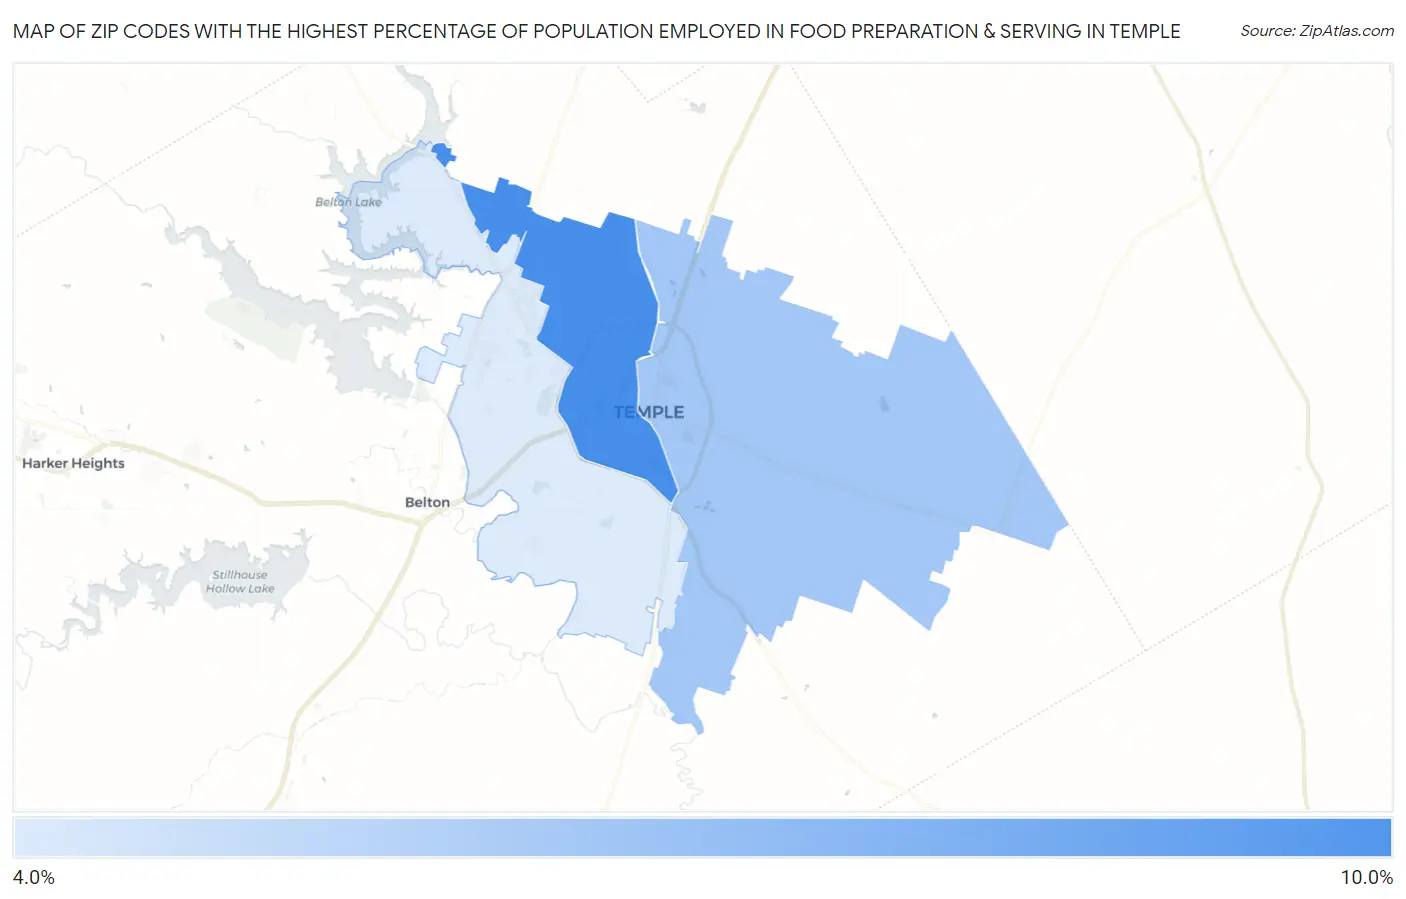
Map of Zip Codes with the Highest Percentage of Population Employed in Food Preparation & Serving in Temple
4.1%
8.3%
Zip Codes with the Highest Percentage of Population Employed in Food Preparation & Serving in Temple, TX
| Zip Code | % Employed | vs State | vs National | |
| 1. | 76504 | 8.3% | 5.4%(+2.94)#264 | 5.3%(+3.01)#4,327 |
| 2. | 76501 | 5.7% | 5.4%(+0.349)#621 | 5.3%(+0.414)#10,343 |
| 3. | 76502 | 4.1% | 5.4%(-1.21)#1,006 | 5.3%(-1.14)#16,531 |
1
Common Questions
What are the Top Zip Codes with the Highest Percentage of Population Employed in Food Preparation & Serving in Temple, TX?
Top Zip Codes with the Highest Percentage of Population Employed in Food Preparation & Serving in Temple, TX are:
What zip code has the Highest Percentage of Population Employed in Food Preparation & Serving in Temple, TX?
76504 has the Highest Percentage of Population Employed in Food Preparation & Serving in Temple, TX with 8.3%.
What is the Percentage of Population Employed in Food Preparation & Serving in Temple, TX?
Percentage of Population Employed in Food Preparation & Serving in Temple is 5.7%.
What is the Percentage of Population Employed in Food Preparation & Serving in Texas?
Percentage of Population Employed in Food Preparation & Serving in Texas is 5.4%.
What is the Percentage of Population Employed in Food Preparation & Serving in the United States?
Percentage of Population Employed in Food Preparation & Serving in the United States is 5.3%.