Las Lomitas, TX Map & Demographics
Las Lomitas Map
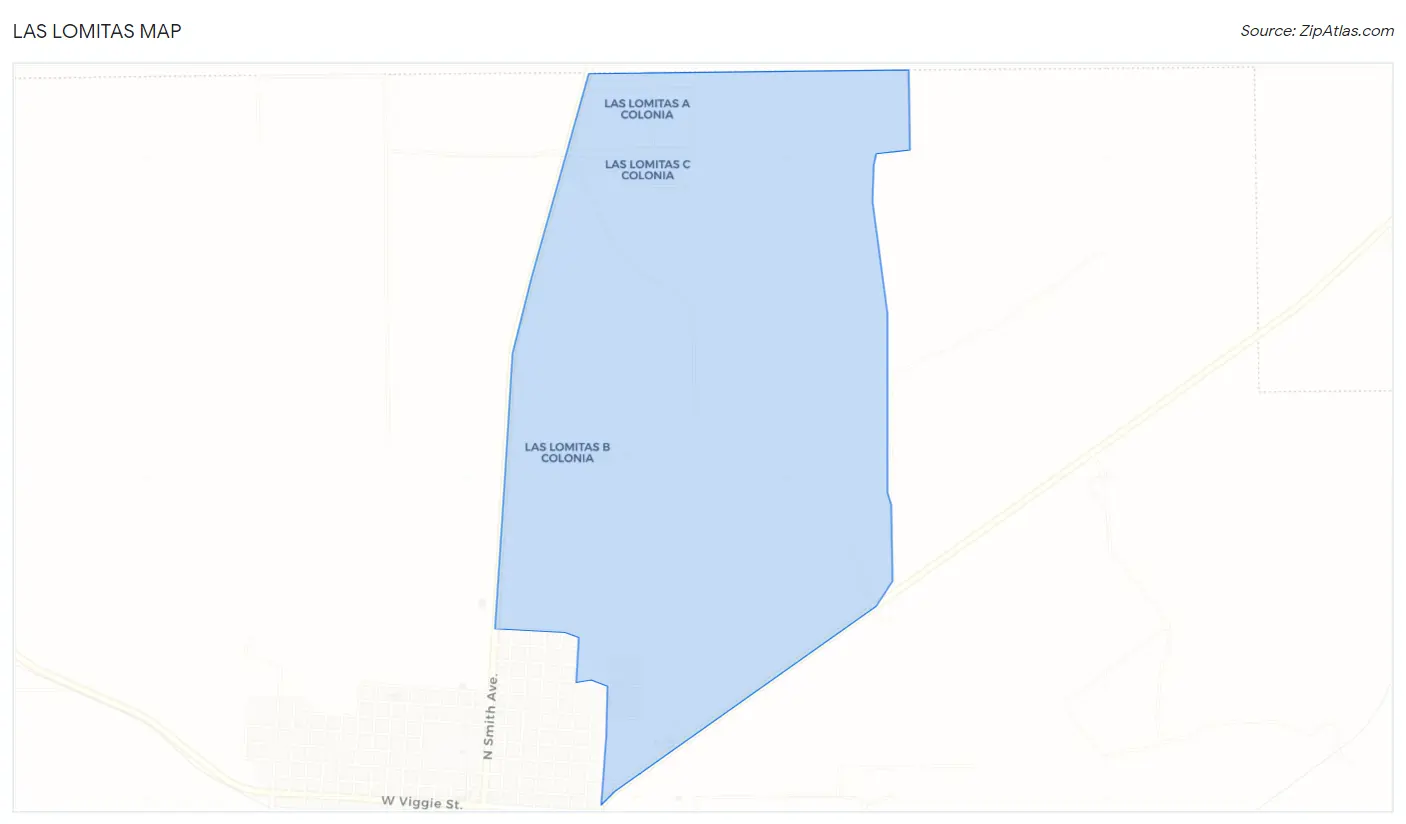
Las Lomitas Overview
$22,741
PER CAPITA INCOME
0.41
INEQUALITY / GINI INDEX
56
TOTAL POPULATION
37
MALE POPULATION
19
FEMALE POPULATION
194.74
MALES / 100 FEMALES
51.35
FEMALES / 100 MALES
39.3
MEDIAN AGE
4.0
AVG FAMILY SIZE
1.9
AVG HOUSEHOLD SIZE
31
LABOR FORCE [ PEOPLE ]
79.5%
PERCENT IN LABOR FORCE
Income in Las Lomitas
Income Overview in Las Lomitas
| Characteristic | Number | Measure |
| Per Capita Income | 56 | $22,741 |
| Median Family Income | 9 | $0 |
| Mean Family Income | 9 | $0 |
| Median Household Income | 29 | $0 |
| Mean Household Income | 29 | $45,538 |
| Income Deficit | 9 | $0 |
| Wage / Income Gap (%) | 56 | 0.00% |
| Wage / Income Gap ($) | 56 | 100.00¢ per $1 |
| Gini / Inequality Index | 56 | 0.41 |
Earnings by Sex in Las Lomitas
| Sex | Number | Average Earnings |
| Male | 26 (83.9%) | $0 |
| Female | 5 (16.1%) | $0 |
| Total | 31 (100.0%) | $0 |
Earnings by Sex by Income Bracket in Las Lomitas
The most common earnings brackets in Las Lomitas are $17,500 to $19,999 for men (9 | 34.6%) and $45,000 to $49,999 for women (5 | 100.0%).
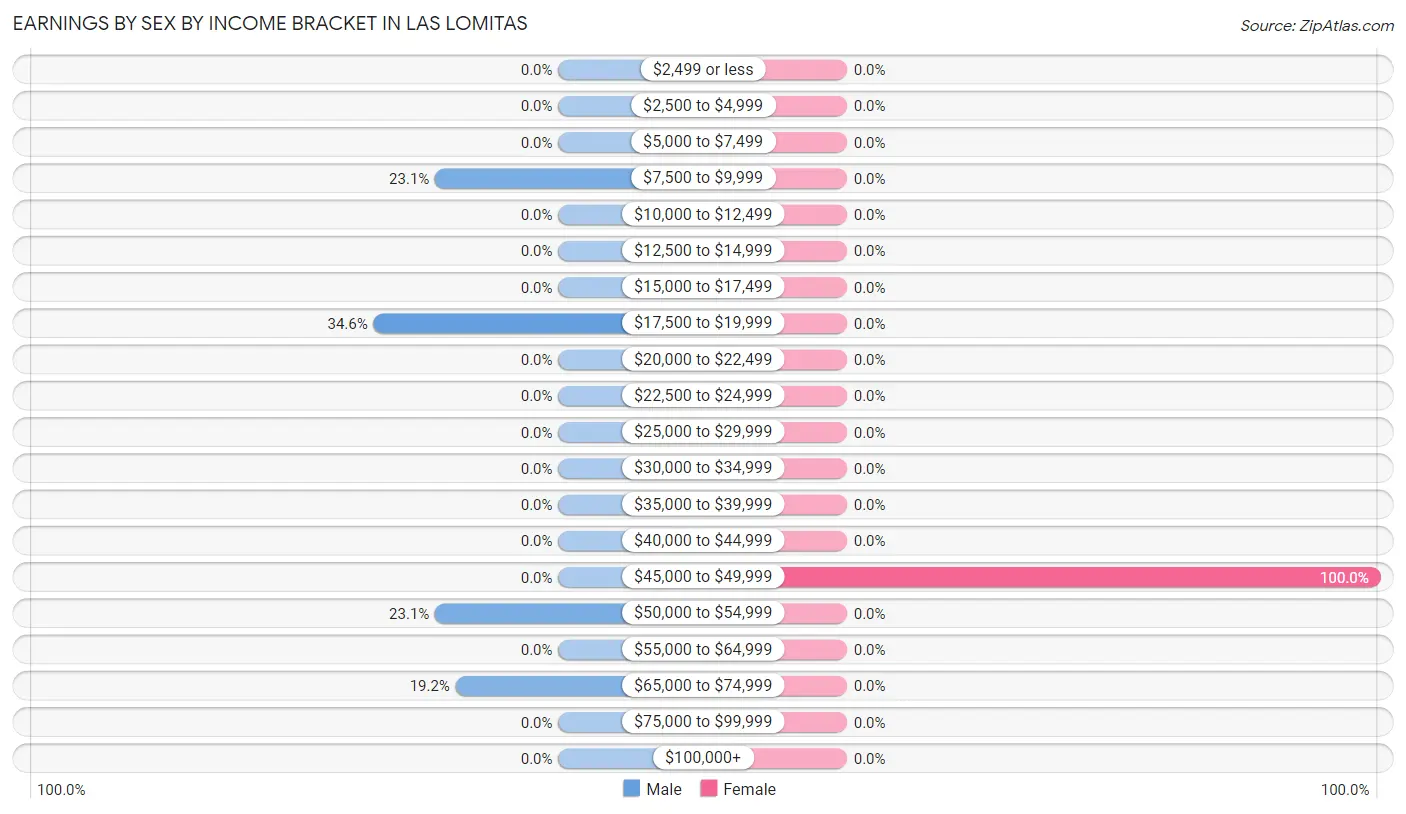
| Income | Male | Female |
| $2,499 or less | 0 (0.0%) | 0 (0.0%) |
| $2,500 to $4,999 | 0 (0.0%) | 0 (0.0%) |
| $5,000 to $7,499 | 0 (0.0%) | 0 (0.0%) |
| $7,500 to $9,999 | 6 (23.1%) | 0 (0.0%) |
| $10,000 to $12,499 | 0 (0.0%) | 0 (0.0%) |
| $12,500 to $14,999 | 0 (0.0%) | 0 (0.0%) |
| $15,000 to $17,499 | 0 (0.0%) | 0 (0.0%) |
| $17,500 to $19,999 | 9 (34.6%) | 0 (0.0%) |
| $20,000 to $22,499 | 0 (0.0%) | 0 (0.0%) |
| $22,500 to $24,999 | 0 (0.0%) | 0 (0.0%) |
| $25,000 to $29,999 | 0 (0.0%) | 0 (0.0%) |
| $30,000 to $34,999 | 0 (0.0%) | 0 (0.0%) |
| $35,000 to $39,999 | 0 (0.0%) | 0 (0.0%) |
| $40,000 to $44,999 | 0 (0.0%) | 0 (0.0%) |
| $45,000 to $49,999 | 0 (0.0%) | 5 (100.0%) |
| $50,000 to $54,999 | 6 (23.1%) | 0 (0.0%) |
| $55,000 to $64,999 | 0 (0.0%) | 0 (0.0%) |
| $65,000 to $74,999 | 5 (19.2%) | 0 (0.0%) |
| $75,000 to $99,999 | 0 (0.0%) | 0 (0.0%) |
| $100,000+ | 0 (0.0%) | 0 (0.0%) |
| Total | 26 (100.0%) | 5 (100.0%) |
Earnings by Sex by Educational Attainment in Las Lomitas
| Educational Attainment | Male Income | Female Income |
| Less than High School | - | - |
| High School Diploma | - | - |
| College or Associate's Degree | - | - |
| Bachelor's Degree | - | - |
| Graduate Degree | - | - |
| Total | - | - |
Family Income in Las Lomitas
Family Income Brackets in Las Lomitas
According to the Las Lomitas family income data, there are 6 families falling into the $100,000 to $149,999 income range, which is the most common income bracket and makes up 66.7% of all families.
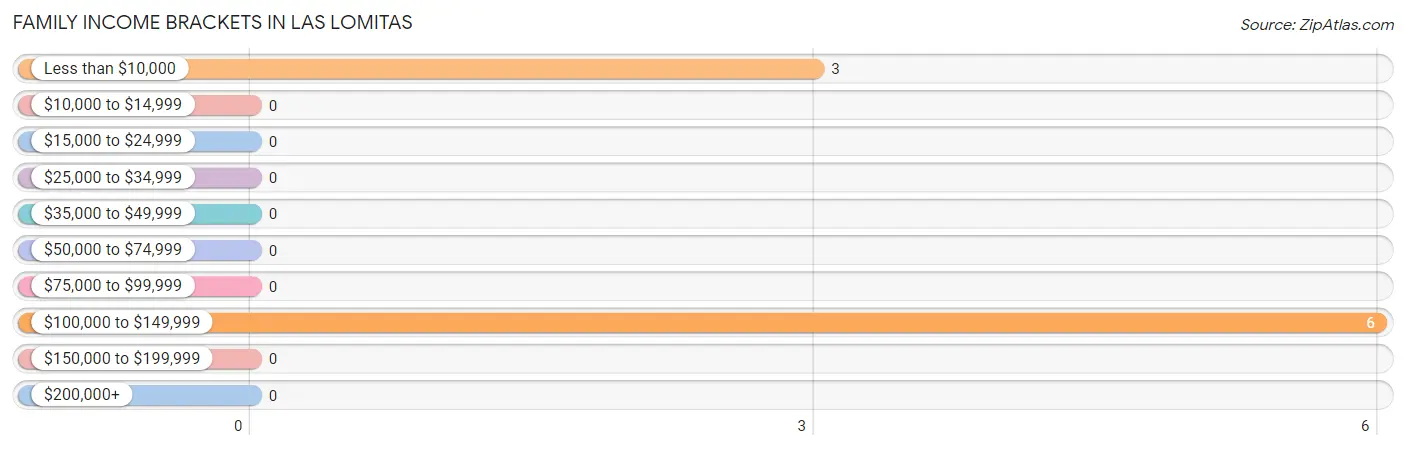
| Income Bracket | # Families | % Families |
| Less than $10,000 | 3 | 33.3% |
| $10,000 to $14,999 | 0 | 0.0% |
| $15,000 to $24,999 | 0 | 0.0% |
| $25,000 to $34,999 | 0 | 0.0% |
| $35,000 to $49,999 | 0 | 0.0% |
| $50,000 to $74,999 | 0 | 0.0% |
| $75,000 to $99,999 | 0 | 0.0% |
| $100,000 to $149,999 | 6 | 66.7% |
| $150,000 to $199,999 | 0 | 0.0% |
| $200,000+ | 0 | 0.0% |
Family Income by Famaliy Size in Las Lomitas
| Income Bracket | # Families | Median Income |
| 2-Person Families | 0 (0.0%) | $0 |
| 3-Person Families | 3 (33.3%) | $0 |
| 4-Person Families | 6 (66.7%) | $0 |
| 5-Person Families | 0 (0.0%) | $0 |
| 6-Person Families | 0 (0.0%) | $0 |
| 7+ Person Families | 0 (0.0%) | $0 |
| Total | 9 (100.0%) | $0 |
Family Income by Number of Earners in Las Lomitas
| Number of Earners | # Families | Median Income |
| No Earners | 3 (33.3%) | $0 |
| 1 Earner | 0 (0.0%) | $0 |
| 2 Earners | 6 (66.7%) | $0 |
| 3+ Earners | 0 (0.0%) | $0 |
| Total | 9 (100.0%) | $0 |
Household Income in Las Lomitas
Household Income Brackets in Las Lomitas
With 9 households falling in the category, the $15,000 to $24,999 income range is the most frequent in Las Lomitas, accounting for 31.0% of all households.
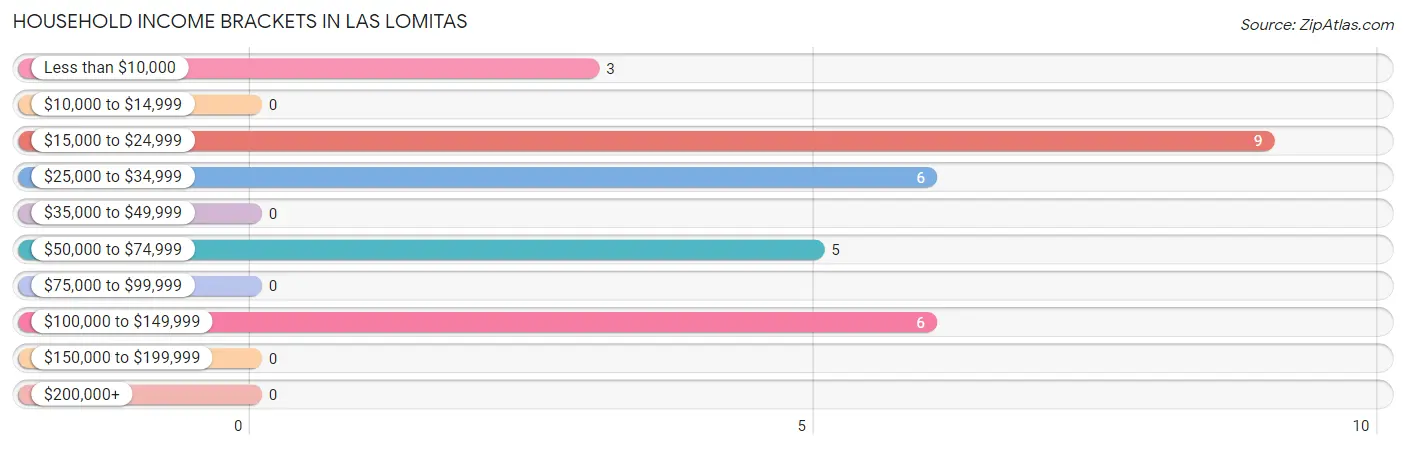
| Income Bracket | # Households | % Households |
| Less than $10,000 | 3 | 10.3% |
| $10,000 to $14,999 | 0 | 0.0% |
| $15,000 to $24,999 | 9 | 31.0% |
| $25,000 to $34,999 | 6 | 20.7% |
| $35,000 to $49,999 | 0 | 0.0% |
| $50,000 to $74,999 | 5 | 17.2% |
| $75,000 to $99,999 | 0 | 0.0% |
| $100,000 to $149,999 | 6 | 20.7% |
| $150,000 to $199,999 | 0 | 0.0% |
| $200,000+ | 0 | 0.0% |
Household Income by Householder Age in Las Lomitas
| Income Bracket | # Households | Median Income |
| 15 to 24 Years | 0 (0.0%) | $0 |
| 25 to 44 Years | 17 (58.6%) | $0 |
| 45 to 64 Years | 12 (41.4%) | $0 |
| 65+ Years | 0 (0.0%) | $0 |
| Total | 29 (100.0%) | $0 |
Poverty in Las Lomitas
Income Below Poverty by Sex and Age in Las Lomitas
With 13.5% poverty level for males and 42.1% for females among the residents of Las Lomitas, 16 and 17 year old males and under 5 year old females are the most vulnerable to poverty, with 5 males (100.0%) and 5 females (45.5%) in their respective age groups living below the poverty level.
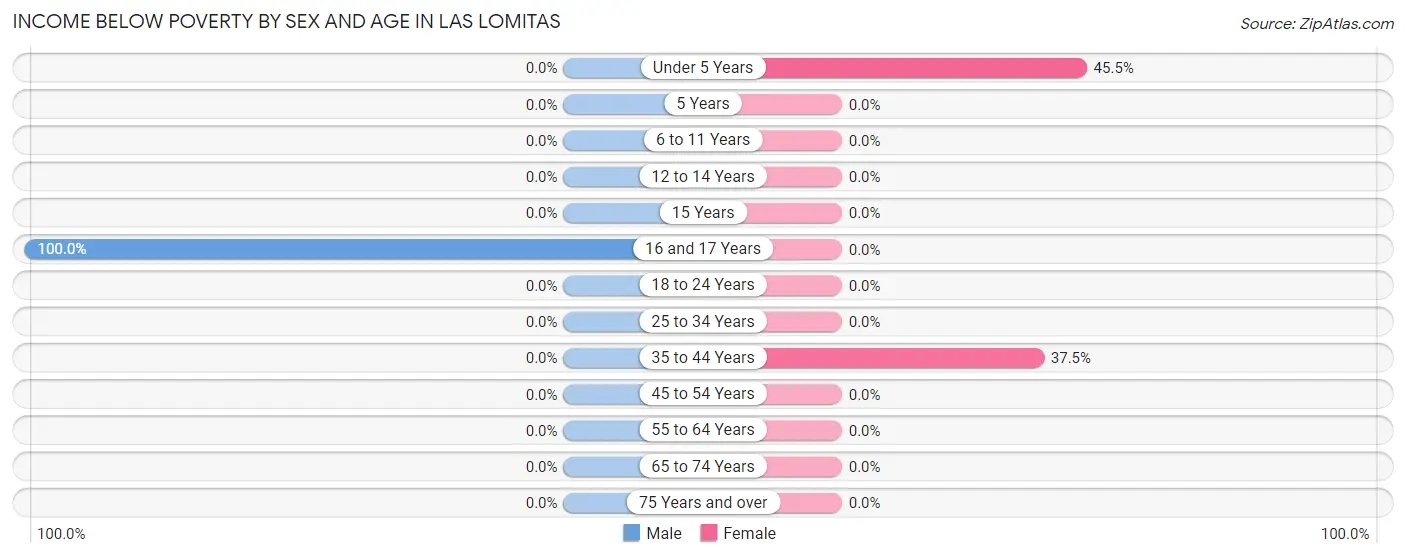
| Age Bracket | Male | Female |
| Under 5 Years | 0 (0.0%) | 5 (45.5%) |
| 5 Years | 0 (0.0%) | 0 (0.0%) |
| 6 to 11 Years | 0 (0.0%) | 0 (0.0%) |
| 12 to 14 Years | 0 (0.0%) | 0 (0.0%) |
| 15 Years | 0 (0.0%) | 0 (0.0%) |
| 16 and 17 Years | 5 (100.0%) | 0 (0.0%) |
| 18 to 24 Years | 0 (0.0%) | 0 (0.0%) |
| 25 to 34 Years | 0 (0.0%) | 0 (0.0%) |
| 35 to 44 Years | 0 (0.0%) | 3 (37.5%) |
| 45 to 54 Years | 0 (0.0%) | 0 (0.0%) |
| 55 to 64 Years | 0 (0.0%) | 0 (0.0%) |
| 65 to 74 Years | 0 (0.0%) | 0 (0.0%) |
| 75 Years and over | 0 (0.0%) | 0 (0.0%) |
| Total | 5 (13.5%) | 8 (42.1%) |
Income Above Poverty by Sex and Age in Las Lomitas
According to the poverty statistics in Las Lomitas, males aged 6 to 11 years and females aged 35 to 44 years are the age groups that are most secure financially, with 100.0% of males and 62.5% of females in these age groups living above the poverty line.
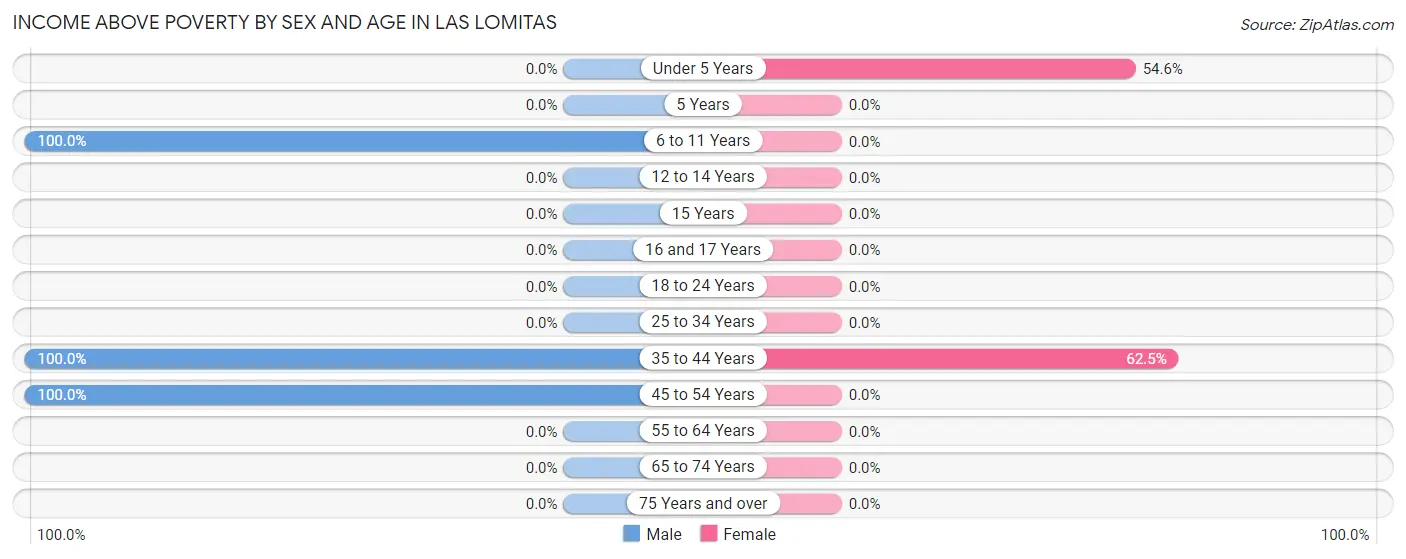
| Age Bracket | Male | Female |
| Under 5 Years | 0 (0.0%) | 6 (54.5%) |
| 5 Years | 0 (0.0%) | 0 (0.0%) |
| 6 to 11 Years | 6 (100.0%) | 0 (0.0%) |
| 12 to 14 Years | 0 (0.0%) | 0 (0.0%) |
| 15 Years | 0 (0.0%) | 0 (0.0%) |
| 16 and 17 Years | 0 (0.0%) | 0 (0.0%) |
| 18 to 24 Years | 0 (0.0%) | 0 (0.0%) |
| 25 to 34 Years | 0 (0.0%) | 0 (0.0%) |
| 35 to 44 Years | 14 (100.0%) | 5 (62.5%) |
| 45 to 54 Years | 12 (100.0%) | 0 (0.0%) |
| 55 to 64 Years | 0 (0.0%) | 0 (0.0%) |
| 65 to 74 Years | 0 (0.0%) | 0 (0.0%) |
| 75 Years and over | 0 (0.0%) | 0 (0.0%) |
| Total | 32 (86.5%) | 11 (57.9%) |
Income Below Poverty Among Married-Couple Families in Las Lomitas
| Children | Above Poverty | Below Poverty |
| No Children | 0 (0.0%) | 0 (0.0%) |
| 1 or 2 Children | 6 (100.0%) | 0 (0.0%) |
| 3 or 4 Children | 0 (0.0%) | 0 (0.0%) |
| 5 or more Children | 0 (0.0%) | 0 (0.0%) |
| Total | 6 (100.0%) | 0 (0.0%) |
Income Below Poverty Among Single-Parent Households in Las Lomitas
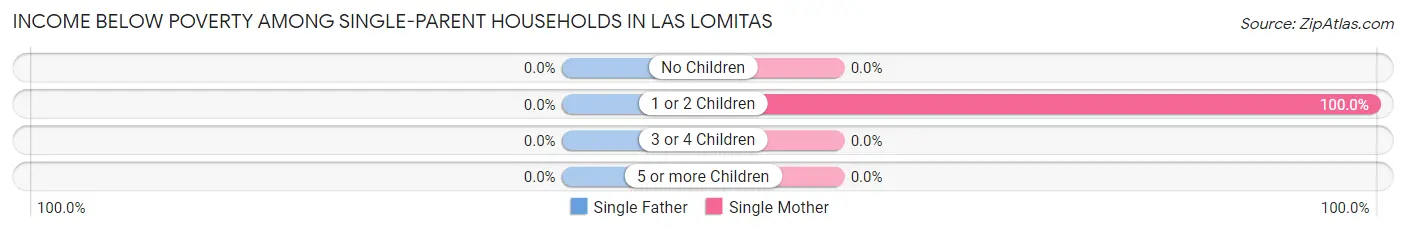
| Children | Single Father | Single Mother |
| No Children | 0 (0.0%) | 0 (0.0%) |
| 1 or 2 Children | 0 (0.0%) | 3 (100.0%) |
| 3 or 4 Children | 0 (0.0%) | 0 (0.0%) |
| 5 or more Children | 0 (0.0%) | 0 (0.0%) |
| Total | 0 (0.0%) | 3 (100.0%) |
Income Below Poverty Among Married-Couple vs Single-Parent Households in Las Lomitas
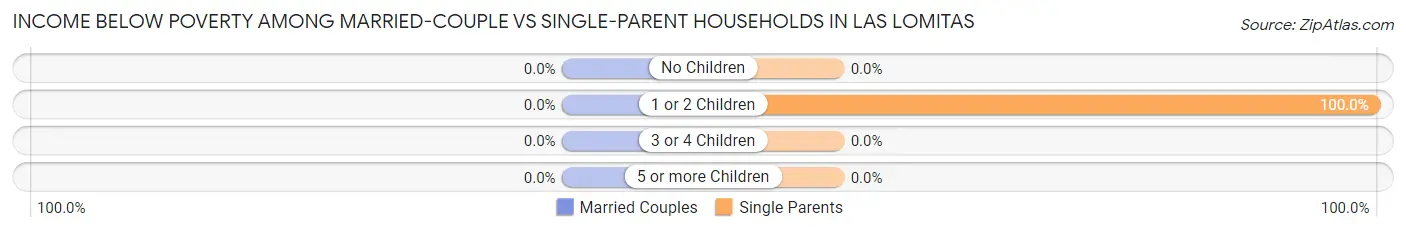
| Children | Married-Couple Families | Single-Parent Households |
| No Children | 0 (0.0%) | 0 (0.0%) |
| 1 or 2 Children | 0 (0.0%) | 3 (100.0%) |
| 3 or 4 Children | 0 (0.0%) | 0 (0.0%) |
| 5 or more Children | 0 (0.0%) | 0 (0.0%) |
| Total | 0 (0.0%) | 3 (100.0%) |
Race in Las Lomitas
The most populous races in Las Lomitas are Hispanic or Latino (56 | 100.0%), Two or more Races (32 | 57.1%), and Some other Race (13 | 23.2%).
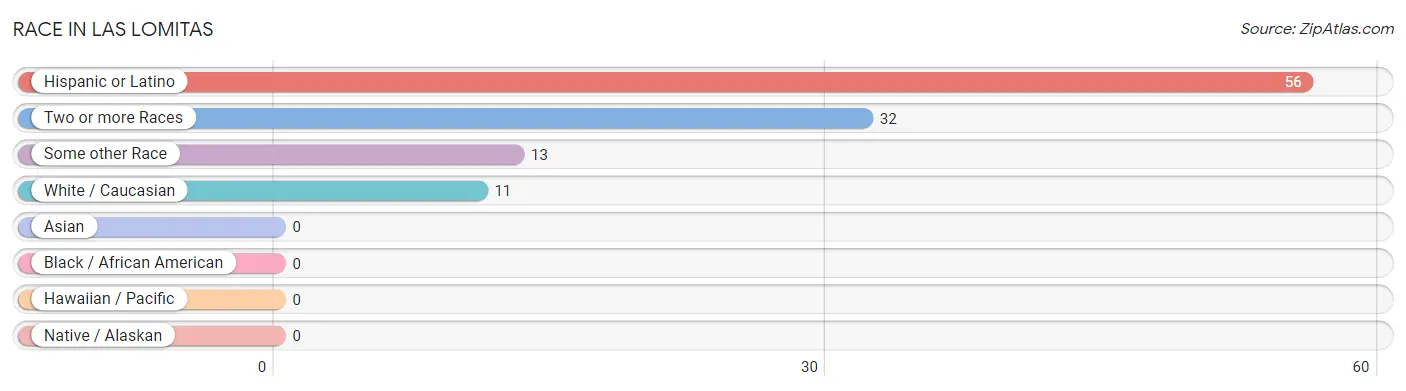
| Race | # Population | % Population |
| Asian | 0 | 0.0% |
| Black / African American | 0 | 0.0% |
| Hawaiian / Pacific | 0 | 0.0% |
| Hispanic or Latino | 56 | 100.0% |
| Native / Alaskan | 0 | 0.0% |
| White / Caucasian | 11 | 19.6% |
| Two or more Races | 32 | 57.1% |
| Some other Race | 13 | 23.2% |
| Total | 56 | 100.0% |
Ancestry in Las Lomitas
The most populous ancestries reported in Las Lomitas are , and Mexican (46 | 82.1%), together accounting for 82.1% of all Las Lomitas residents.

| Ancestry | # Population | % Population |
| Mexican | 46 | 82.1% | View All 1 Rows |
Immigrants in Las Lomitas

| Immigration Origin | # Population | % Population | View All 0 Rows |
Sex and Age in Las Lomitas
Sex and Age in Las Lomitas
The most populous age groups in Las Lomitas are 40 to 44 Years (14 | 37.8%) for men and Under 5 Years (11 | 57.9%) for women.
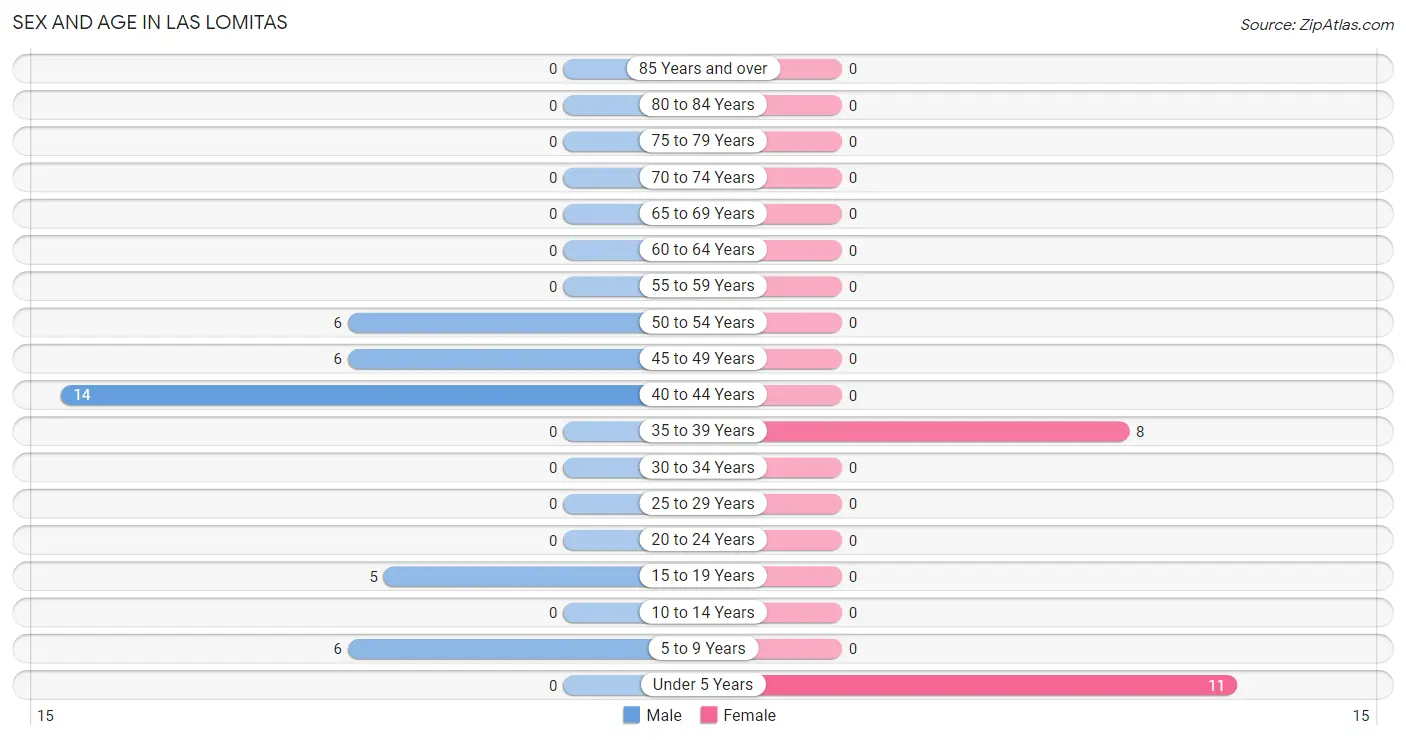
| Age Bracket | Male | Female |
| Under 5 Years | 0 (0.0%) | 11 (57.9%) |
| 5 to 9 Years | 6 (16.2%) | 0 (0.0%) |
| 10 to 14 Years | 0 (0.0%) | 0 (0.0%) |
| 15 to 19 Years | 5 (13.5%) | 0 (0.0%) |
| 20 to 24 Years | 0 (0.0%) | 0 (0.0%) |
| 25 to 29 Years | 0 (0.0%) | 0 (0.0%) |
| 30 to 34 Years | 0 (0.0%) | 0 (0.0%) |
| 35 to 39 Years | 0 (0.0%) | 8 (42.1%) |
| 40 to 44 Years | 14 (37.8%) | 0 (0.0%) |
| 45 to 49 Years | 6 (16.2%) | 0 (0.0%) |
| 50 to 54 Years | 6 (16.2%) | 0 (0.0%) |
| 55 to 59 Years | 0 (0.0%) | 0 (0.0%) |
| 60 to 64 Years | 0 (0.0%) | 0 (0.0%) |
| 65 to 69 Years | 0 (0.0%) | 0 (0.0%) |
| 70 to 74 Years | 0 (0.0%) | 0 (0.0%) |
| 75 to 79 Years | 0 (0.0%) | 0 (0.0%) |
| 80 to 84 Years | 0 (0.0%) | 0 (0.0%) |
| 85 Years and over | 0 (0.0%) | 0 (0.0%) |
| Total | 37 (100.0%) | 19 (100.0%) |
Families and Households in Las Lomitas
Median Family Size in Las Lomitas
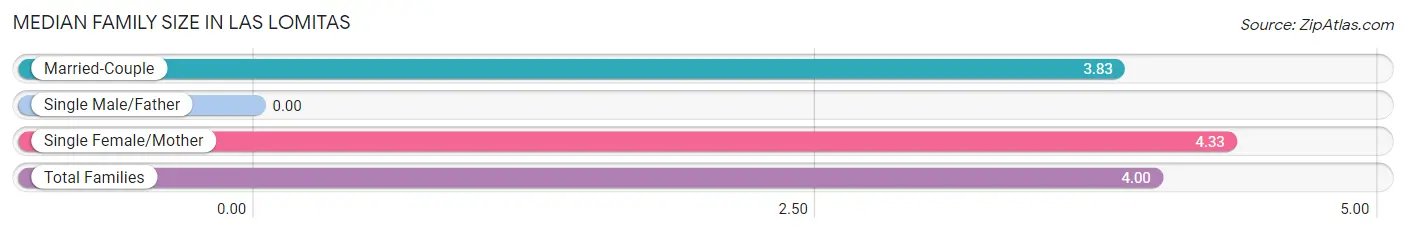
| Family Type | # Families | Family Size |
| Married-Couple | 6 (66.7%) | 3.83 |
| Single Male/Father | 0 (0.0%) | - |
| Single Female/Mother | 3 (33.3%) | 4.33 |
| Total Families | 9 (100.0%) | 4.00 |
Median Household Size in Las Lomitas
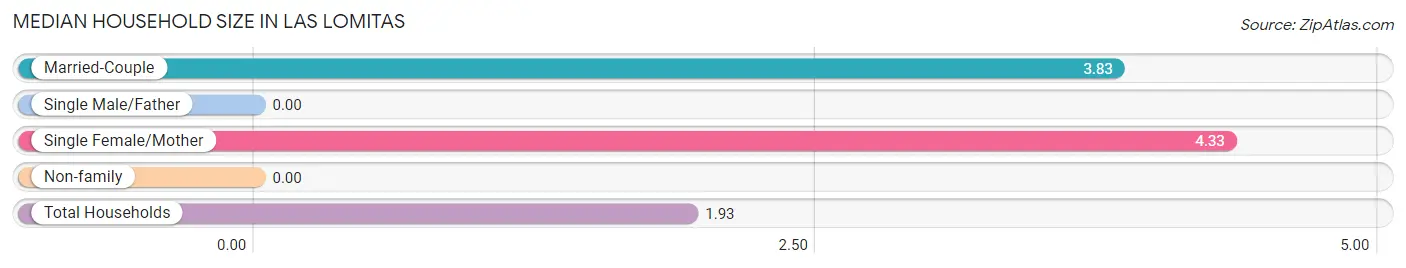
| Household Type | # Households | Household Size |
| Married-Couple | 6 (20.7%) | 3.83 |
| Single Male/Father | 0 (0.0%) | - |
| Single Female/Mother | 3 (10.3%) | 4.33 |
| Non-family | 20 (69.0%) | - |
| Total Households | 29 (100.0%) | 1.93 |
Household Size by Marriage Status in Las Lomitas
Out of a total of 29 households in Las Lomitas, 9 (31.0%) are family households, while 20 (69.0%) are nonfamily households. The most numerous type of family households are 4-person households, comprising 6, and the most common type of nonfamily households are 1-person households, comprising 20.
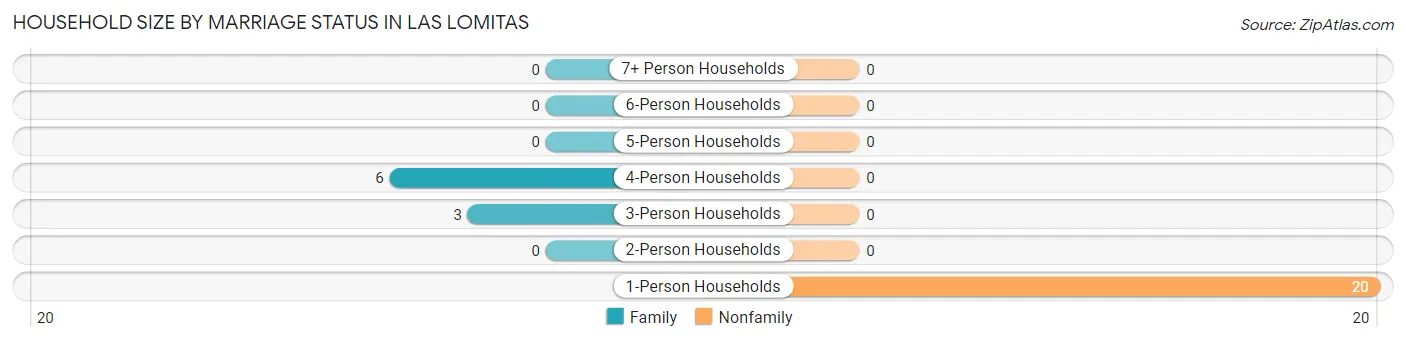
| Household Size | Family Households | Nonfamily Households |
| 1-Person Households | - | 20 (69.0%) |
| 2-Person Households | 0 (0.0%) | 0 (0.0%) |
| 3-Person Households | 3 (10.3%) | 0 (0.0%) |
| 4-Person Households | 6 (20.7%) | 0 (0.0%) |
| 5-Person Households | 0 (0.0%) | 0 (0.0%) |
| 6-Person Households | 0 (0.0%) | 0 (0.0%) |
| 7+ Person Households | 0 (0.0%) | 0 (0.0%) |
| Total | 9 (31.0%) | 20 (69.0%) |
Female Fertility in Las Lomitas
Fertility by Age in Las Lomitas
| Age Bracket | Women with Births | Births / 1,000 Women |
| 15 to 19 years | 0 (0.0%) | 0.0 |
| 20 to 34 years | 0 (0.0%) | 0.0 |
| 35 to 50 years | 0 (0.0%) | 0.0 |
| Total | 0 (0.0%) | 0.0 |
Fertility by Age by Marriage Status in Las Lomitas
| Age Bracket | Married | Unmarried |
| 15 to 19 years | 0 (0.0%) | 0 (0.0%) |
| 20 to 34 years | 0 (0.0%) | 0 (0.0%) |
| 35 to 50 years | 0 (0.0%) | 0 (0.0%) |
| Total | 0 (0.0%) | 0 (0.0%) |
Fertility by Education in Las Lomitas
| Educational Attainment | Women with Births | Births / 1,000 Women |
| Less than High School | 0 (0.0%) | 0.0 |
| High School Diploma | 0 (0.0%) | 0.0 |
| College or Associate's Degree | 0 (0.0%) | 0.0 |
| Bachelor's Degree | 0 (0.0%) | 0.0 |
| Graduate Degree | 0 (0.0%) | 0.0 |
| Total | 0 (0.0%) | 0.0 |
Fertility by Education by Marriage Status in Las Lomitas
| Educational Attainment | Married | Unmarried |
| Less than High School | 0 (0.0%) | 0 (0.0%) |
| High School Diploma | 0 (0.0%) | 0 (0.0%) |
| College or Associate's Degree | 0 (0.0%) | 0 (0.0%) |
| Bachelor's Degree | 0 (0.0%) | 0 (0.0%) |
| Graduate Degree | 0 (0.0%) | 0 (0.0%) |
| Total | 0 (0.0%) | 0 (0.0%) |
Employment Characteristics in Las Lomitas
Employment by Class of Employer in Las Lomitas
Among the 31 employed individuals in Las Lomitas, private company employees (22 | 71.0%), and local government employees (9 | 29.0%) make up the most common classes of employment.
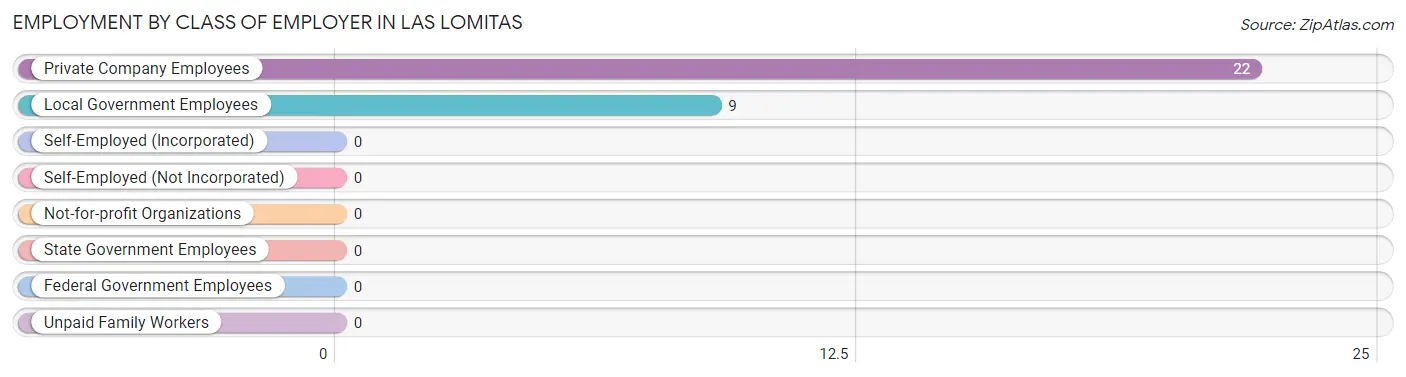
| Employer Class | # Employees | % Employees |
| Private Company Employees | 22 | 71.0% |
| Self-Employed (Incorporated) | 0 | 0.0% |
| Self-Employed (Not Incorporated) | 0 | 0.0% |
| Not-for-profit Organizations | 0 | 0.0% |
| Local Government Employees | 9 | 29.0% |
| State Government Employees | 0 | 0.0% |
| Federal Government Employees | 0 | 0.0% |
| Unpaid Family Workers | 0 | 0.0% |
| Total | 31 | 100.0% |
Employment Status by Age in Las Lomitas
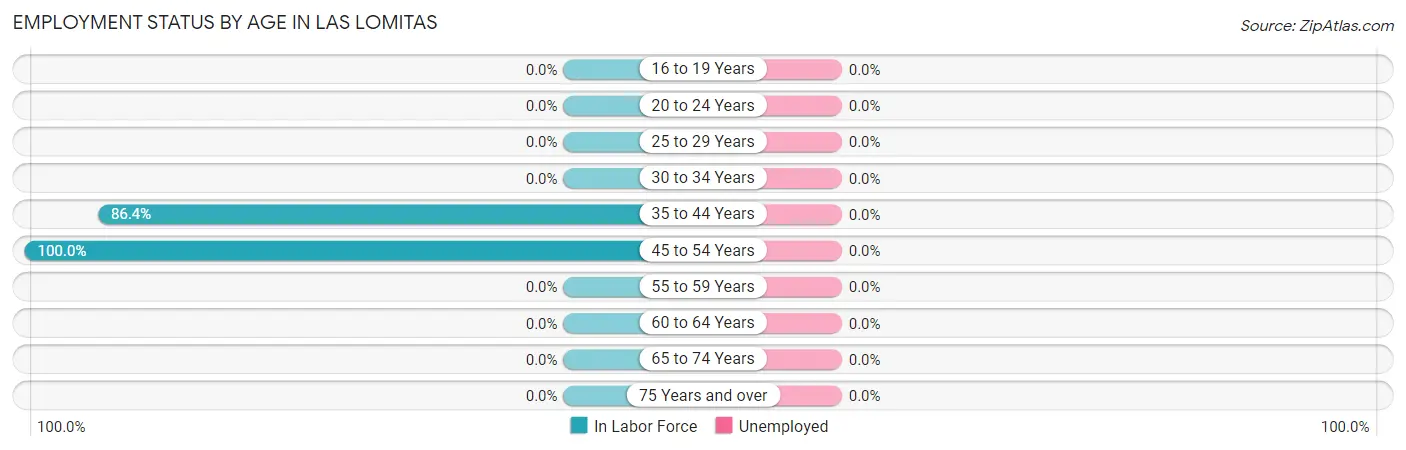
| Age Bracket | In Labor Force | Unemployed |
| 16 to 19 Years | 0 (0.0%) | 0 (0.0%) |
| 20 to 24 Years | 0 (0.0%) | 0 (0.0%) |
| 25 to 29 Years | 0 (0.0%) | 0 (0.0%) |
| 30 to 34 Years | 0 (0.0%) | 0 (0.0%) |
| 35 to 44 Years | 19 (86.4%) | 0 (0.0%) |
| 45 to 54 Years | 12 (100.0%) | 0 (0.0%) |
| 55 to 59 Years | 0 (0.0%) | 0 (0.0%) |
| 60 to 64 Years | 0 (0.0%) | 0 (0.0%) |
| 65 to 74 Years | 0 (0.0%) | 0 (0.0%) |
| 75 Years and over | 0 (0.0%) | 0 (0.0%) |
| Total | 31 (79.5%) | 0 (0.0%) |
Employment Status by Educational Attainment in Las Lomitas
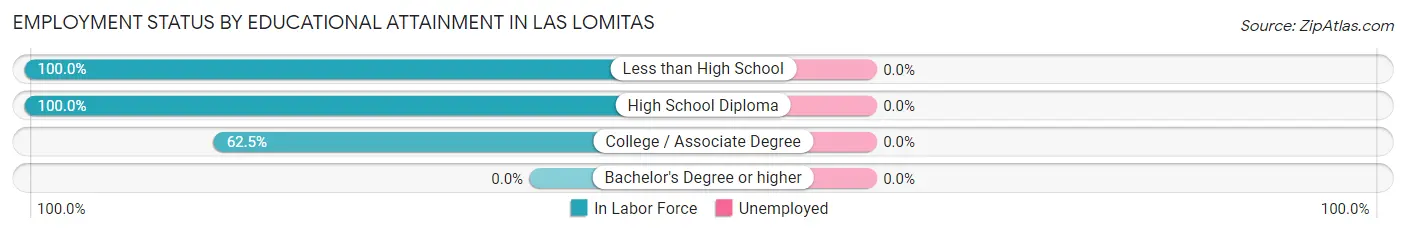
| Educational Attainment | In Labor Force | Unemployed |
| Less than High School | 9 (100.0%) | 0 (0.0%) |
| High School Diploma | 17 (100.0%) | 0 (0.0%) |
| College / Associate Degree | 5 (62.5%) | 0 (0.0%) |
| Bachelor's Degree or higher | 0 (0.0%) | 0 (0.0%) |
| Total | 31 (91.2%) | 0 (0.0%) |
Employment Occupations by Sex in Las Lomitas
Management, Business, Science and Arts Occupations
Management, Business, Science and Arts Occupations by Sex
| Occupation | Male | Female |
| Management | 0 (0.0%) | 0 (0.0%) |
| Business & Financial | 0 (0.0%) | 0 (0.0%) |
| Computers, Engineering & Science | 0 (0.0%) | 0 (0.0%) |
| Computers & Mathematics | 0 (0.0%) | 0 (0.0%) |
| Architecture & Engineering | 0 (0.0%) | 0 (0.0%) |
| Life, Physical & Social Science | 0 (0.0%) | 0 (0.0%) |
| Community & Social Service | 0 (0.0%) | 0 (0.0%) |
| Education, Arts & Media | 0 (0.0%) | 0 (0.0%) |
| Legal Services & Support | 0 (0.0%) | 0 (0.0%) |
| Education Instruction & Library | 0 (0.0%) | 0 (0.0%) |
| Arts, Media & Entertainment | 0 (0.0%) | 0 (0.0%) |
| Health Diagnosing & Treating | 0 (0.0%) | 0 (0.0%) |
| Health Technologists | 0 (0.0%) | 0 (0.0%) |
| Total (Category) | 0 (0.0%) | 0 (0.0%) |
| Total (Overall) | 26 (83.9%) | 5 (16.1%) |
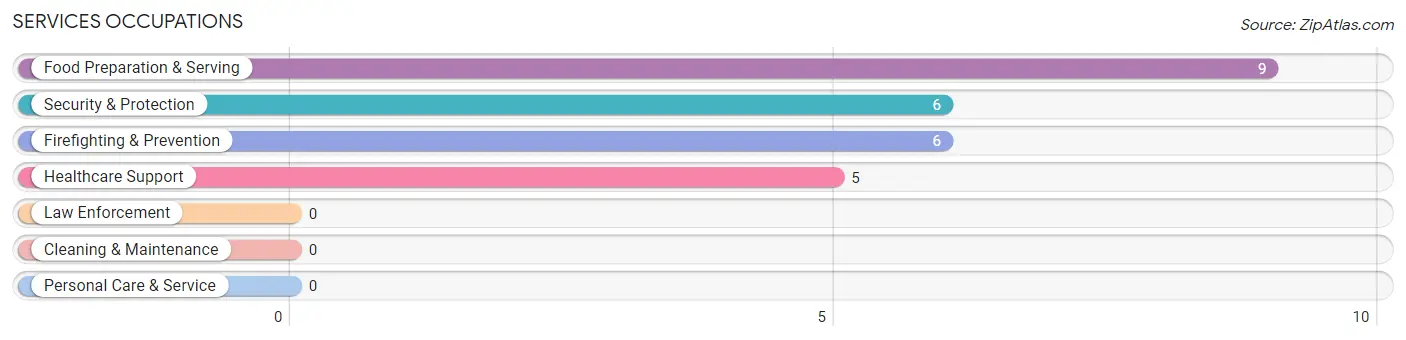
Services Occupations
The most common Services occupations in Las Lomitas are Food Preparation & Serving (9 | 29.0%), Security & Protection (6 | 19.4%), Firefighting & Prevention (6 | 19.4%), and Healthcare Support (5 | 16.1%).
Services Occupations by Sex
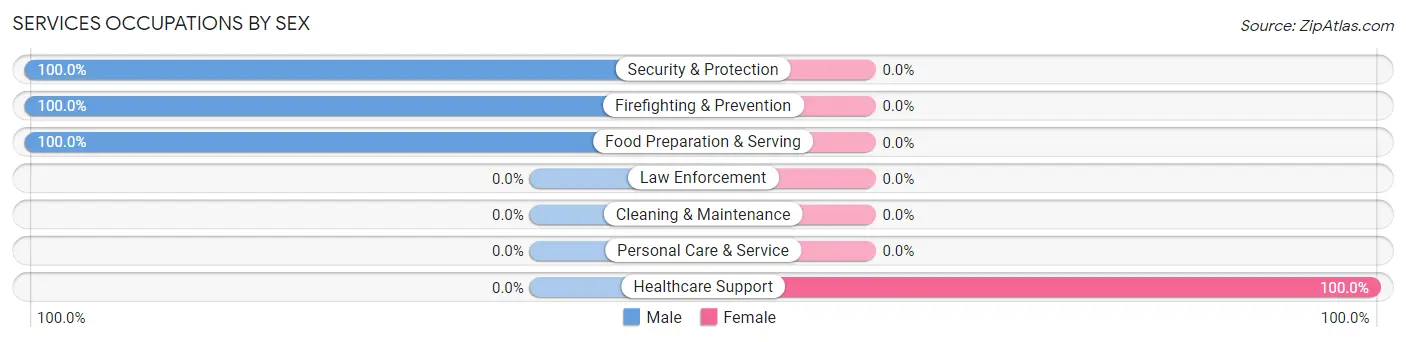
| Occupation | Male | Female |
| Healthcare Support | 0 (0.0%) | 5 (100.0%) |
| Security & Protection | 6 (100.0%) | 0 (0.0%) |
| Firefighting & Prevention | 6 (100.0%) | 0 (0.0%) |
| Law Enforcement | 0 (0.0%) | 0 (0.0%) |
| Food Preparation & Serving | 9 (100.0%) | 0 (0.0%) |
| Cleaning & Maintenance | 0 (0.0%) | 0 (0.0%) |
| Personal Care & Service | 0 (0.0%) | 0 (0.0%) |
| Total (Category) | 15 (75.0%) | 5 (25.0%) |
| Total (Overall) | 26 (83.9%) | 5 (16.1%) |
Sales and Office Occupations
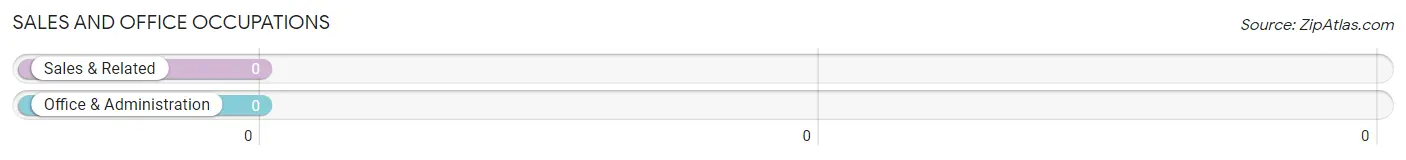
Sales and Office Occupations by Sex
| Occupation | Male | Female |
| Sales & Related | 0 (0.0%) | 0 (0.0%) |
| Office & Administration | 0 (0.0%) | 0 (0.0%) |
| Total (Category) | 0 (0.0%) | 0 (0.0%) |
| Total (Overall) | 26 (83.9%) | 5 (16.1%) |
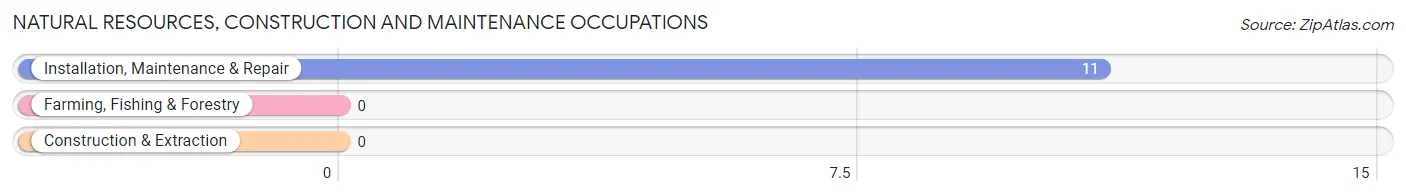
Natural Resources, Construction and Maintenance Occupations
The most common Natural Resources, Construction and Maintenance occupations in Las Lomitas are , and Installation, Maintenance & Repair (11 | 35.5%).
Natural Resources, Construction and Maintenance Occupations by Sex
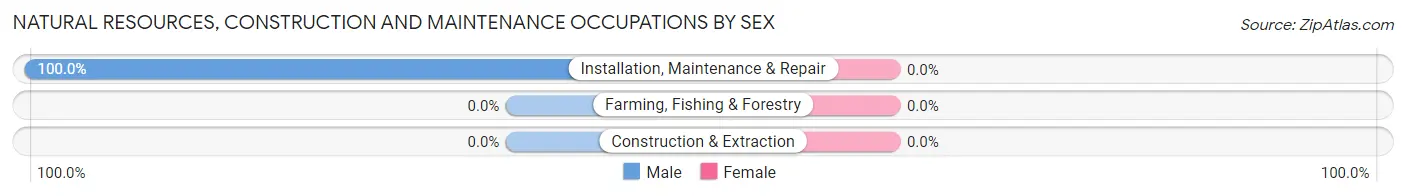
| Occupation | Male | Female |
| Farming, Fishing & Forestry | 0 (0.0%) | 0 (0.0%) |
| Construction & Extraction | 0 (0.0%) | 0 (0.0%) |
| Installation, Maintenance & Repair | 11 (100.0%) | 0 (0.0%) |
| Total (Category) | 11 (100.0%) | 0 (0.0%) |
| Total (Overall) | 26 (83.9%) | 5 (16.1%) |
Production, Transportation and Moving Occupations
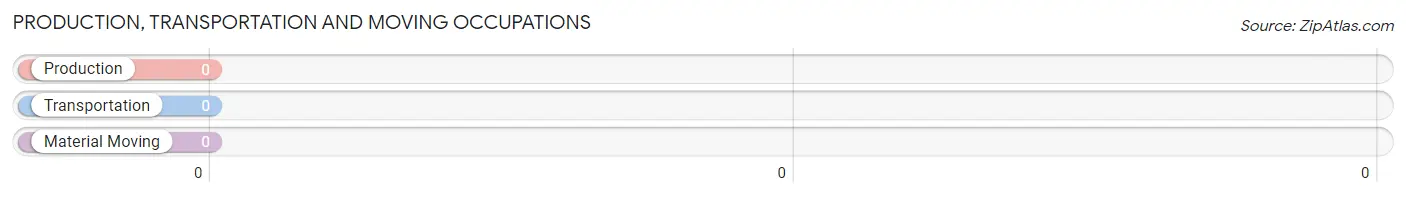
Production, Transportation and Moving Occupations by Sex
| Occupation | Male | Female |
| Production | 0 (0.0%) | 0 (0.0%) |
| Transportation | 0 (0.0%) | 0 (0.0%) |
| Material Moving | 0 (0.0%) | 0 (0.0%) |
| Total (Category) | 0 (0.0%) | 0 (0.0%) |
| Total (Overall) | 26 (83.9%) | 5 (16.1%) |
Employment Industries by Sex in Las Lomitas
Employment Industries in Las Lomitas
The major employment industries in Las Lomitas include Educational Services (9 | 29.0%), Retail Trade (6 | 19.4%), Administrative & Support (6 | 19.4%), Mining, Quarrying, & Extraction (5 | 16.1%), and Health Care & Social Assistance (5 | 16.1%).
Employment Industries by Sex in Las Lomitas
| Industry | Male | Female |
| Agriculture, Fishing & Hunting | 0 (0.0%) | 0 (0.0%) |
| Mining, Quarrying, & Extraction | 5 (100.0%) | 0 (0.0%) |
| Construction | 0 (0.0%) | 0 (0.0%) |
| Manufacturing | 0 (0.0%) | 0 (0.0%) |
| Wholesale Trade | 0 (0.0%) | 0 (0.0%) |
| Retail Trade | 6 (100.0%) | 0 (0.0%) |
| Transportation & Warehousing | 0 (0.0%) | 0 (0.0%) |
| Utilities | 0 (0.0%) | 0 (0.0%) |
| Information | 0 (0.0%) | 0 (0.0%) |
| Finance & Insurance | 0 (0.0%) | 0 (0.0%) |
| Real Estate, Rental & Leasing | 0 (0.0%) | 0 (0.0%) |
| Professional & Scientific | 0 (0.0%) | 0 (0.0%) |
| Enterprise Management | 0 (0.0%) | 0 (0.0%) |
| Administrative & Support | 6 (100.0%) | 0 (0.0%) |
| Educational Services | 9 (100.0%) | 0 (0.0%) |
| Health Care & Social Assistance | 0 (0.0%) | 5 (100.0%) |
| Arts, Entertainment & Recreation | 0 (0.0%) | 0 (0.0%) |
| Accommodation & Food Services | 0 (0.0%) | 0 (0.0%) |
| Public Administration | 0 (0.0%) | 0 (0.0%) |
| Total | 26 (83.9%) | 5 (16.1%) |
Education in Las Lomitas
School Enrollment in Las Lomitas
The most common levels of schooling among the 11 students in Las Lomitas are elementary school (6 | 54.5%), and high school (5 | 45.5%).
| School Level | # Students | % Students |
| Nursery / Preschool | 0 | 0.0% |
| Kindergarten | 0 | 0.0% |
| Elementary School | 6 | 54.5% |
| Middle School | 0 | 0.0% |
| High School | 5 | 45.5% |
| College / Undergraduate | 0 | 0.0% |
| Graduate / Professional | 0 | 0.0% |
| Total | 11 | 100.0% |
School Enrollment by Age by Funding Source in Las Lomitas
| Age Bracket | Public School | Private School |
| 3 to 4 Year Olds | 0 (0.0%) | 0 (0.0%) |
| 5 to 9 Year Old | 6 (100.0%) | 0 (0.0%) |
| 10 to 14 Year Olds | 0 (0.0%) | 0 (0.0%) |
| 15 to 17 Year Olds | 5 (100.0%) | 0 (0.0%) |
| 18 to 19 Year Olds | 0 (0.0%) | 0 (0.0%) |
| 20 to 24 Year Olds | 0 (0.0%) | 0 (0.0%) |
| 25 to 34 Year Olds | 0 (0.0%) | 0 (0.0%) |
| 35 Years and over | 0 (0.0%) | 0 (0.0%) |
| Total | 11 (100.0%) | 0 (0.0%) |
Educational Attainment by Field of Study in Las Lomitas
| Field of Study | # Graduates | % Graduates |
| Computers & Mathematics | 0 | 0.0% |
| Bio, Nature & Agricultural | 0 | 0.0% |
| Physical & Health Sciences | 0 | 0.0% |
| Psychology | 0 | 0.0% |
| Social Sciences | 0 | 0.0% |
| Engineering | 0 | 0.0% |
| Multidisciplinary Studies | 0 | 0.0% |
| Science & Technology | 0 | 0.0% |
| Business | 0 | 0.0% |
| Education | 0 | 0.0% |
| Literature & Languages | 0 | 0.0% |
| Liberal Arts & History | 0 | 0.0% |
| Visual & Performing Arts | 0 | 0.0% |
| Communications | 0 | 0.0% |
| Arts & Humanities | 0 | 0.0% |
| Total | 0 | 0.0% |
Transportation & Commute in Las Lomitas
Vehicle Availability by Sex in Las Lomitas
The most prevalent vehicle ownership categories in Las Lomitas are males with 2 vehicles (17, accounting for 65.4%) and females with 2 vehicles (5, making up 340.0%).
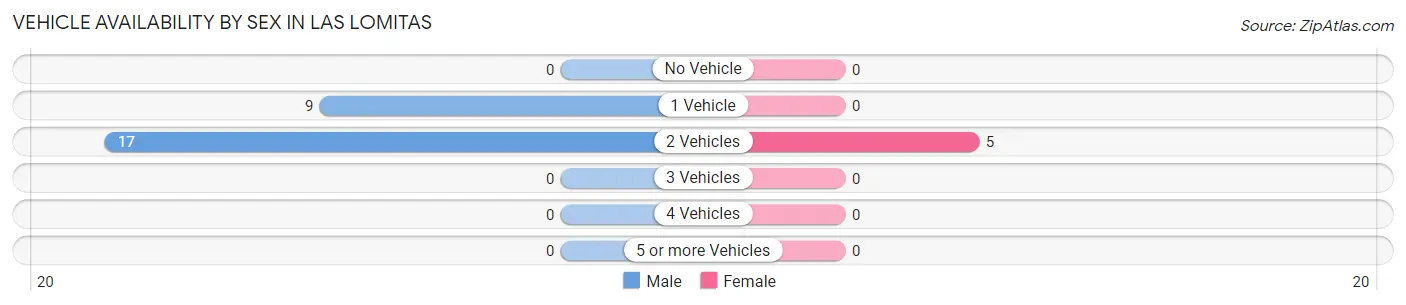
| Vehicles Available | Male | Female |
| No Vehicle | 0 (0.0%) | 0 (0.0%) |
| 1 Vehicle | 9 (34.6%) | 0 (0.0%) |
| 2 Vehicles | 17 (65.4%) | 5 (100.0%) |
| 3 Vehicles | 0 (0.0%) | 0 (0.0%) |
| 4 Vehicles | 0 (0.0%) | 0 (0.0%) |
| 5 or more Vehicles | 0 (0.0%) | 0 (0.0%) |
| Total | 26 (100.0%) | 5 (100.0%) |
Commute Time in Las Lomitas
The most frequently occuring commute durations in Las Lomitas are 5 to 9 minutes (17 commuters, 54.8%), less than 5 minutes (9 commuters, 29.0%), and 60 to 89 minutes (5 commuters, 16.1%).
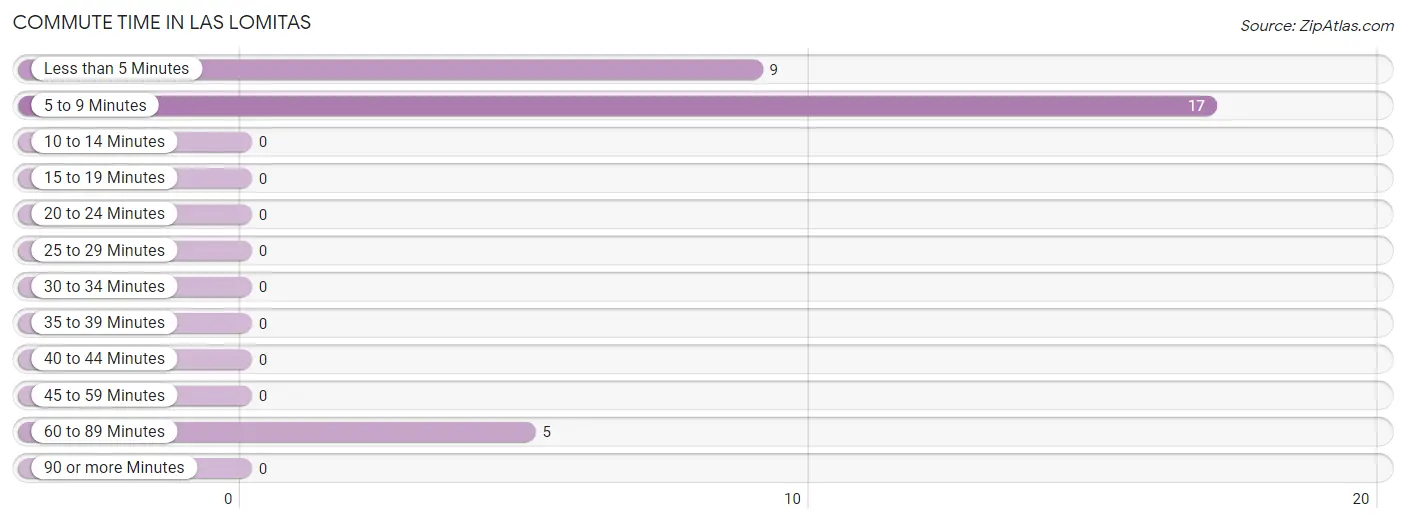
| Commute Time | # Commuters | % Commuters |
| Less than 5 Minutes | 9 | 29.0% |
| 5 to 9 Minutes | 17 | 54.8% |
| 10 to 14 Minutes | 0 | 0.0% |
| 15 to 19 Minutes | 0 | 0.0% |
| 20 to 24 Minutes | 0 | 0.0% |
| 25 to 29 Minutes | 0 | 0.0% |
| 30 to 34 Minutes | 0 | 0.0% |
| 35 to 39 Minutes | 0 | 0.0% |
| 40 to 44 Minutes | 0 | 0.0% |
| 45 to 59 Minutes | 0 | 0.0% |
| 60 to 89 Minutes | 5 | 16.1% |
| 90 or more Minutes | 0 | 0.0% |
Commute Time by Sex in Las Lomitas
The most common commute times in Las Lomitas are 5 to 9 minutes (12 commuters, 46.2%) for males and 5 to 9 minutes (5 commuters, 100.0%) for females.
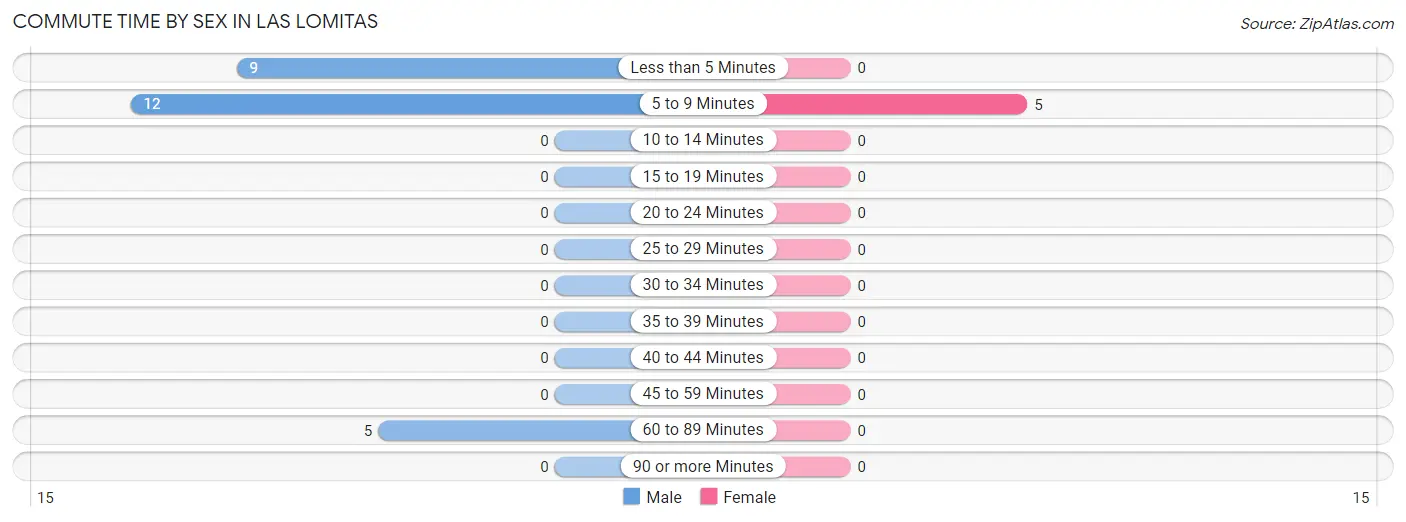
| Commute Time | Male | Female |
| Less than 5 Minutes | 9 (34.6%) | 0 (0.0%) |
| 5 to 9 Minutes | 12 (46.2%) | 5 (100.0%) |
| 10 to 14 Minutes | 0 (0.0%) | 0 (0.0%) |
| 15 to 19 Minutes | 0 (0.0%) | 0 (0.0%) |
| 20 to 24 Minutes | 0 (0.0%) | 0 (0.0%) |
| 25 to 29 Minutes | 0 (0.0%) | 0 (0.0%) |
| 30 to 34 Minutes | 0 (0.0%) | 0 (0.0%) |
| 35 to 39 Minutes | 0 (0.0%) | 0 (0.0%) |
| 40 to 44 Minutes | 0 (0.0%) | 0 (0.0%) |
| 45 to 59 Minutes | 0 (0.0%) | 0 (0.0%) |
| 60 to 89 Minutes | 5 (19.2%) | 0 (0.0%) |
| 90 or more Minutes | 0 (0.0%) | 0 (0.0%) |
Time of Departure to Work by Sex in Las Lomitas
The most frequent times of departure to work in Las Lomitas are 4:00 PM to 11:59 PM (15, 57.7%) for males and 8:00 AM to 8:29 AM (5, 100.0%) for females.
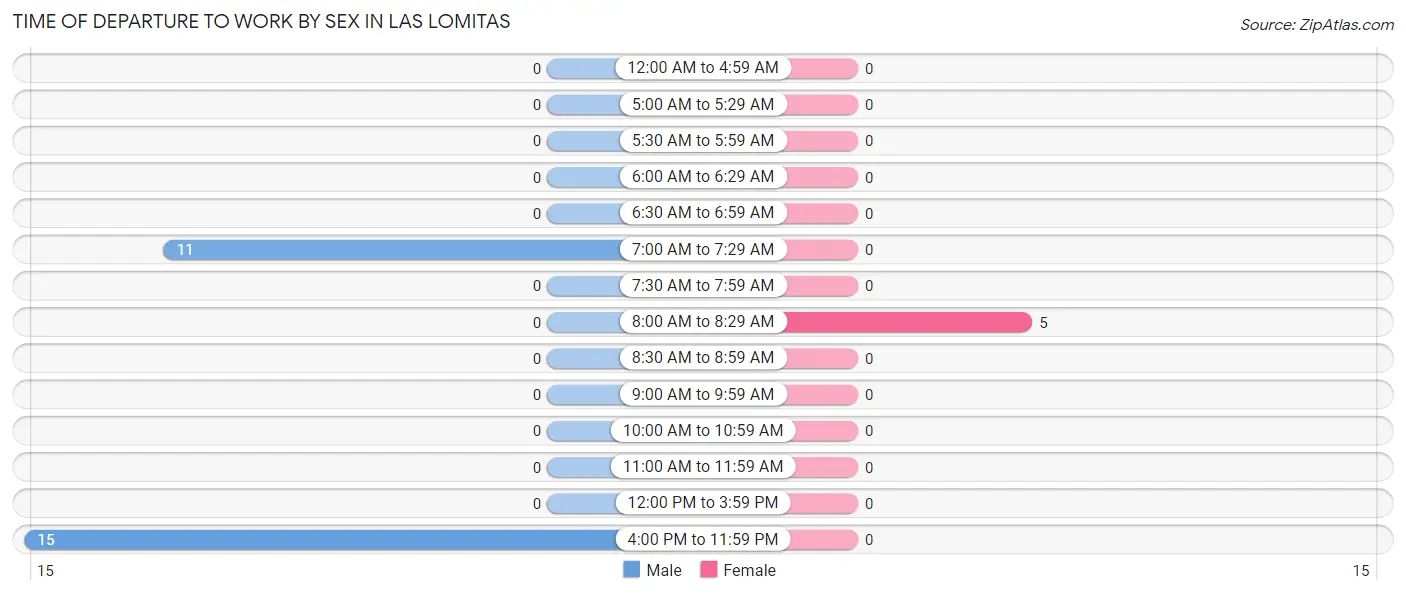
| Time of Departure | Male | Female |
| 12:00 AM to 4:59 AM | 0 (0.0%) | 0 (0.0%) |
| 5:00 AM to 5:29 AM | 0 (0.0%) | 0 (0.0%) |
| 5:30 AM to 5:59 AM | 0 (0.0%) | 0 (0.0%) |
| 6:00 AM to 6:29 AM | 0 (0.0%) | 0 (0.0%) |
| 6:30 AM to 6:59 AM | 0 (0.0%) | 0 (0.0%) |
| 7:00 AM to 7:29 AM | 11 (42.3%) | 0 (0.0%) |
| 7:30 AM to 7:59 AM | 0 (0.0%) | 0 (0.0%) |
| 8:00 AM to 8:29 AM | 0 (0.0%) | 5 (100.0%) |
| 8:30 AM to 8:59 AM | 0 (0.0%) | 0 (0.0%) |
| 9:00 AM to 9:59 AM | 0 (0.0%) | 0 (0.0%) |
| 10:00 AM to 10:59 AM | 0 (0.0%) | 0 (0.0%) |
| 11:00 AM to 11:59 AM | 0 (0.0%) | 0 (0.0%) |
| 12:00 PM to 3:59 PM | 0 (0.0%) | 0 (0.0%) |
| 4:00 PM to 11:59 PM | 15 (57.7%) | 0 (0.0%) |
| Total | 26 (100.0%) | 5 (100.0%) |
Housing Occupancy in Las Lomitas
Occupancy by Ownership in Las Lomitas
Of the total 29 dwellings in Las Lomitas, owner-occupied units account for 29 (100.0%), while renter-occupied units make up 0 (0.0%).
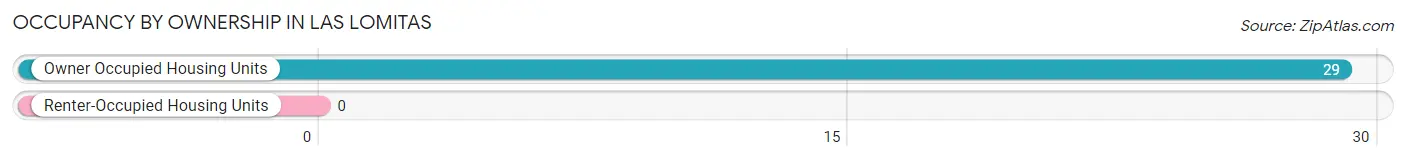
| Occupancy | # Housing Units | % Housing Units |
| Owner Occupied Housing Units | 29 | 100.0% |
| Renter-Occupied Housing Units | 0 | 0.0% |
| Total Occupied Housing Units | 29 | 100.0% |
Occupancy by Household Size in Las Lomitas
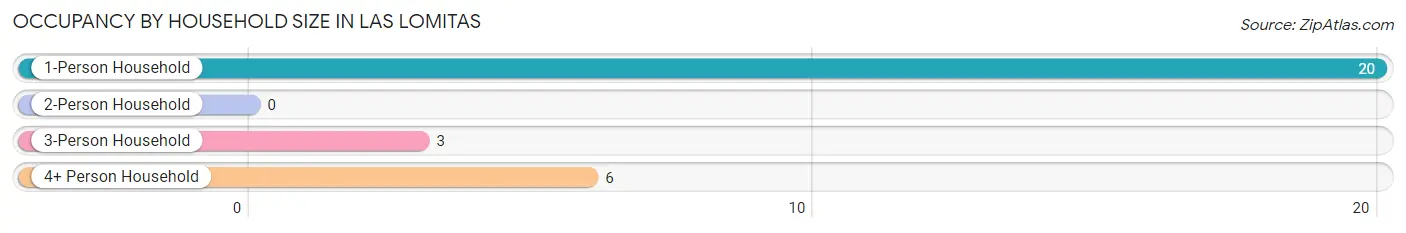
| Household Size | # Housing Units | % Housing Units |
| 1-Person Household | 20 | 69.0% |
| 2-Person Household | 0 | 0.0% |
| 3-Person Household | 3 | 10.3% |
| 4+ Person Household | 6 | 20.7% |
| Total Housing Units | 29 | 100.0% |
Occupancy by Ownership by Household Size in Las Lomitas
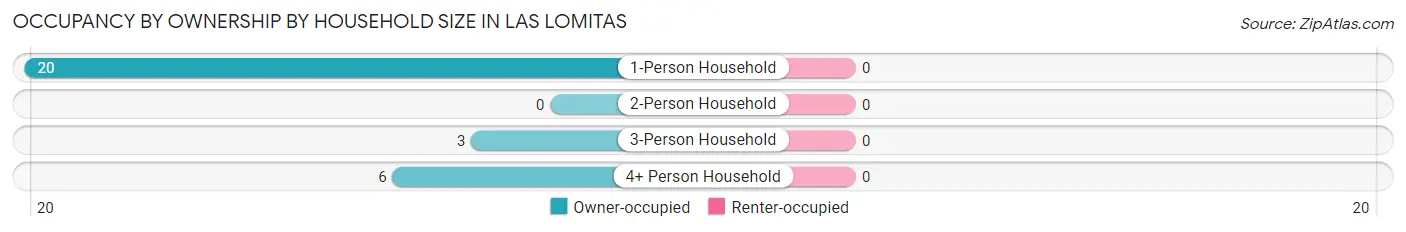
| Household Size | Owner-occupied | Renter-occupied |
| 1-Person Household | 20 (100.0%) | 0 (0.0%) |
| 2-Person Household | 0 (0.0%) | 0 (0.0%) |
| 3-Person Household | 3 (100.0%) | 0 (0.0%) |
| 4+ Person Household | 6 (100.0%) | 0 (0.0%) |
| Total Housing Units | 29 (100.0%) | 0 (0.0%) |
Occupancy by Educational Attainment in Las Lomitas
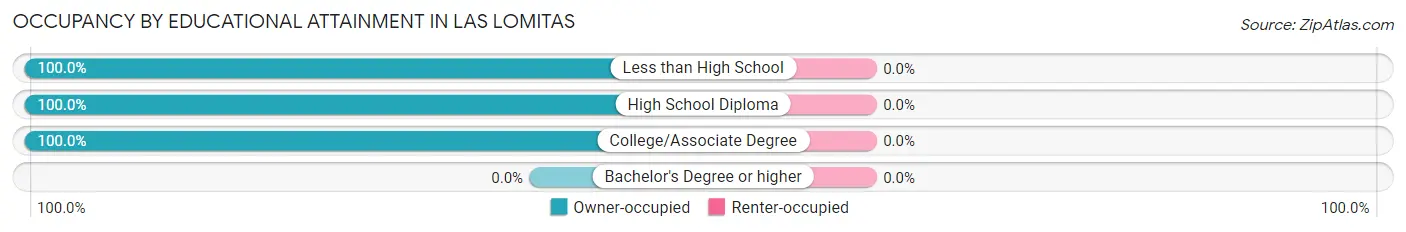
| Household Size | Owner-occupied | Renter-occupied |
| Less than High School | 9 (100.0%) | 0 (0.0%) |
| High School Diploma | 17 (100.0%) | 0 (0.0%) |
| College/Associate Degree | 3 (100.0%) | 0 (0.0%) |
| Bachelor's Degree or higher | 0 (0.0%) | 0 (0.0%) |
Occupancy by Age of Householder in Las Lomitas
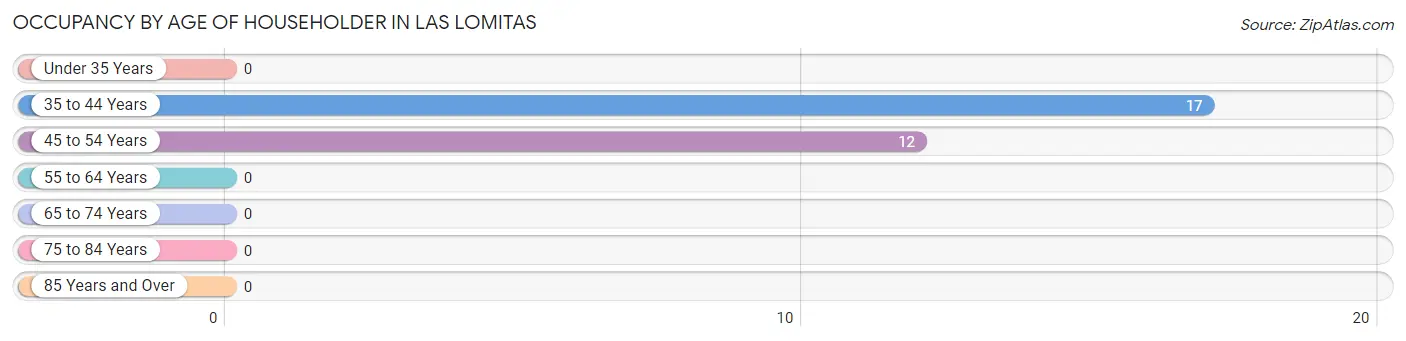
| Age Bracket | # Households | % Households |
| Under 35 Years | 0 | 0.0% |
| 35 to 44 Years | 17 | 58.6% |
| 45 to 54 Years | 12 | 41.4% |
| 55 to 64 Years | 0 | 0.0% |
| 65 to 74 Years | 0 | 0.0% |
| 75 to 84 Years | 0 | 0.0% |
| 85 Years and Over | 0 | 0.0% |
| Total | 29 | 100.0% |
Housing Finances in Las Lomitas
Median Income by Occupancy in Las Lomitas
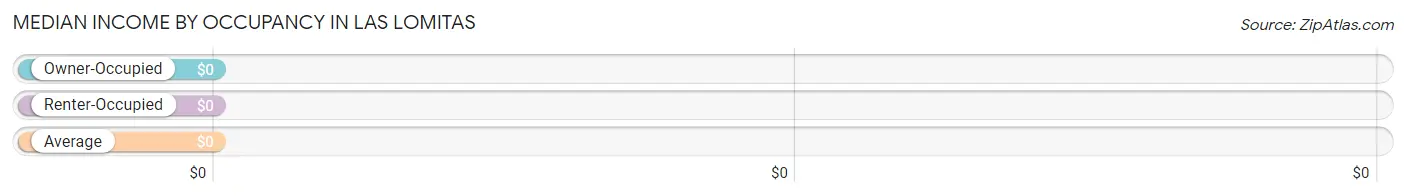
| Occupancy Type | # Households | Median Income |
| Owner-Occupied | 29 (100.0%) | $0 |
| Renter-Occupied | 0 (0.0%) | $0 |
| Average | 29 (100.0%) | $0 |
Occupancy by Householder Income Bracket in Las Lomitas
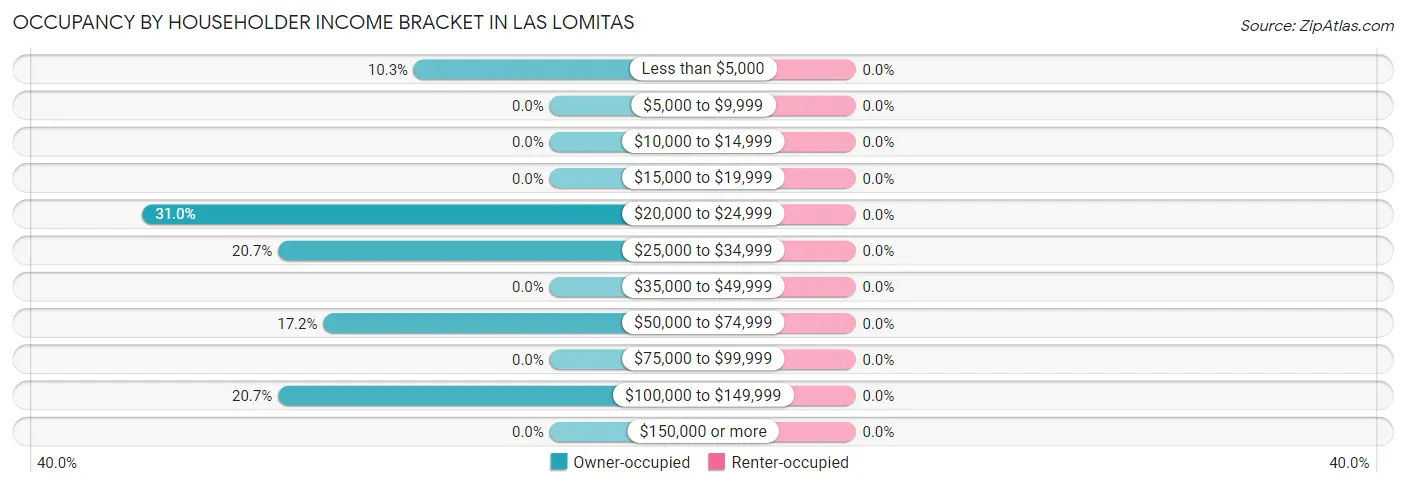
| Income Bracket | Owner-occupied | Renter-occupied |
| Less than $5,000 | 3 (10.3%) | 0 (0.0%) |
| $5,000 to $9,999 | 0 (0.0%) | 0 (0.0%) |
| $10,000 to $14,999 | 0 (0.0%) | 0 (0.0%) |
| $15,000 to $19,999 | 0 (0.0%) | 0 (0.0%) |
| $20,000 to $24,999 | 9 (31.0%) | 0 (0.0%) |
| $25,000 to $34,999 | 6 (20.7%) | 0 (0.0%) |
| $35,000 to $49,999 | 0 (0.0%) | 0 (0.0%) |
| $50,000 to $74,999 | 5 (17.2%) | 0 (0.0%) |
| $75,000 to $99,999 | 0 (0.0%) | 0 (0.0%) |
| $100,000 to $149,999 | 6 (20.7%) | 0 (0.0%) |
| $150,000 or more | 0 (0.0%) | 0 (0.0%) |
| Total | 29 (100.0%) | 0 (0.0%) |
Monthly Housing Cost Tiers in Las Lomitas
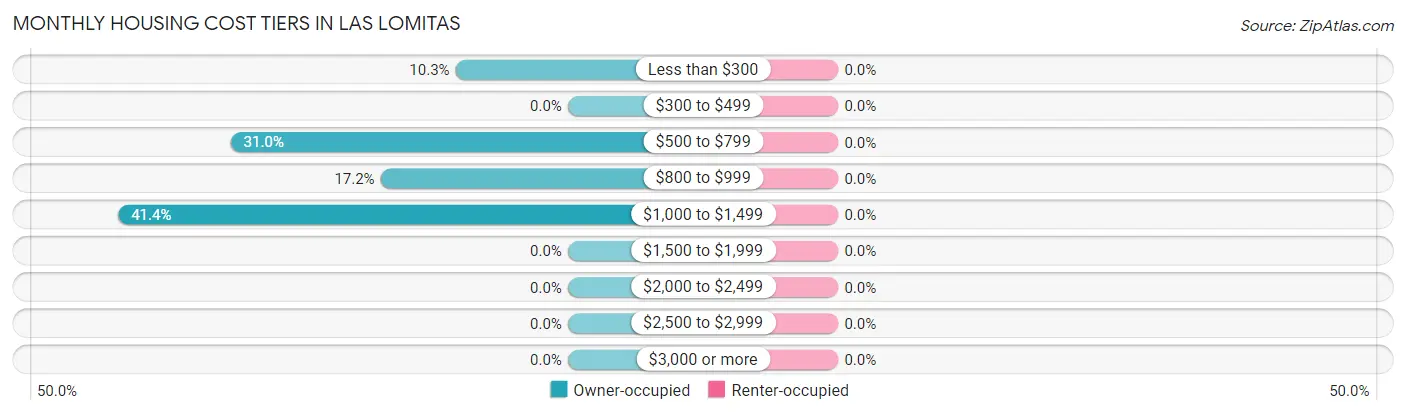
| Monthly Cost | Owner-occupied | Renter-occupied |
| Less than $300 | 3 (10.3%) | 0 (0.0%) |
| $300 to $499 | 0 (0.0%) | 0 (0.0%) |
| $500 to $799 | 9 (31.0%) | 0 (0.0%) |
| $800 to $999 | 5 (17.2%) | 0 (0.0%) |
| $1,000 to $1,499 | 12 (41.4%) | 0 (0.0%) |
| $1,500 to $1,999 | 0 (0.0%) | 0 (0.0%) |
| $2,000 to $2,499 | 0 (0.0%) | 0 (0.0%) |
| $2,500 to $2,999 | 0 (0.0%) | 0 (0.0%) |
| $3,000 or more | 0 (0.0%) | 0 (0.0%) |
| Total | 29 (100.0%) | 0 (0.0%) |
Physical Housing Characteristics in Las Lomitas
Housing Structures in Las Lomitas
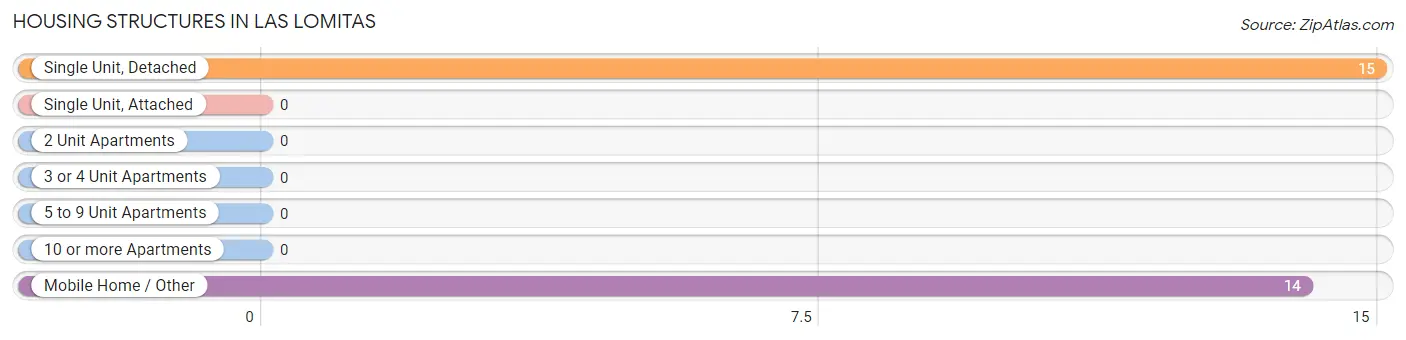
| Structure Type | # Housing Units | % Housing Units |
| Single Unit, Detached | 15 | 51.7% |
| Single Unit, Attached | 0 | 0.0% |
| 2 Unit Apartments | 0 | 0.0% |
| 3 or 4 Unit Apartments | 0 | 0.0% |
| 5 to 9 Unit Apartments | 0 | 0.0% |
| 10 or more Apartments | 0 | 0.0% |
| Mobile Home / Other | 14 | 48.3% |
| Total | 29 | 100.0% |
Housing Structures by Occupancy in Las Lomitas
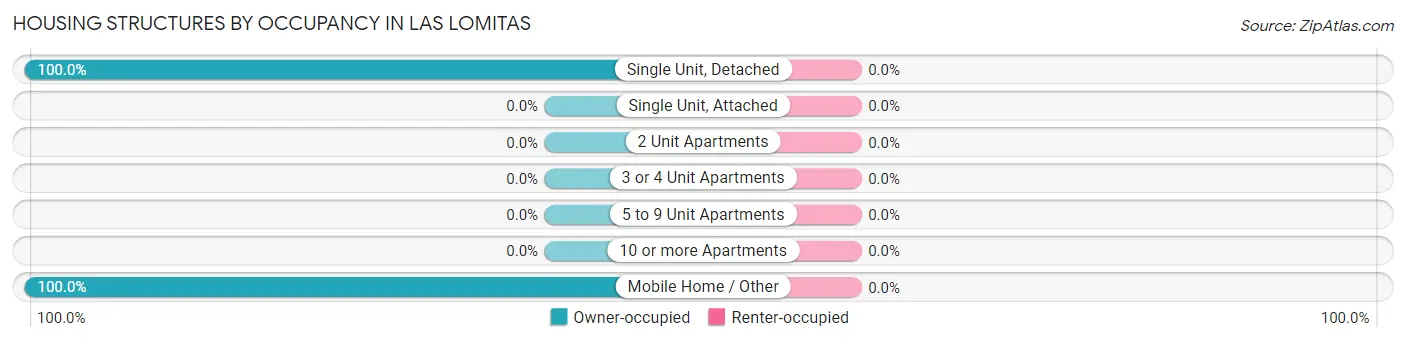
| Structure Type | Owner-occupied | Renter-occupied |
| Single Unit, Detached | 15 (100.0%) | 0 (0.0%) |
| Single Unit, Attached | 0 (0.0%) | 0 (0.0%) |
| 2 Unit Apartments | 0 (0.0%) | 0 (0.0%) |
| 3 or 4 Unit Apartments | 0 (0.0%) | 0 (0.0%) |
| 5 to 9 Unit Apartments | 0 (0.0%) | 0 (0.0%) |
| 10 or more Apartments | 0 (0.0%) | 0 (0.0%) |
| Mobile Home / Other | 14 (100.0%) | 0 (0.0%) |
| Total | 29 (100.0%) | 0 (0.0%) |
Housing Structures by Number of Rooms in Las Lomitas
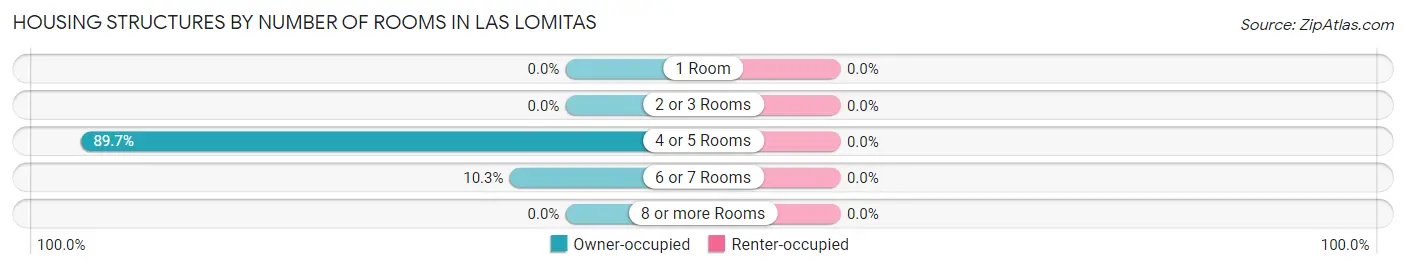
| Number of Rooms | Owner-occupied | Renter-occupied |
| 1 Room | 0 (0.0%) | 0 (0.0%) |
| 2 or 3 Rooms | 0 (0.0%) | 0 (0.0%) |
| 4 or 5 Rooms | 26 (89.7%) | 0 (0.0%) |
| 6 or 7 Rooms | 3 (10.3%) | 0 (0.0%) |
| 8 or more Rooms | 0 (0.0%) | 0 (0.0%) |
| Total | 29 (100.0%) | 0 (0.0%) |
Housing Structure by Heating Type in Las Lomitas
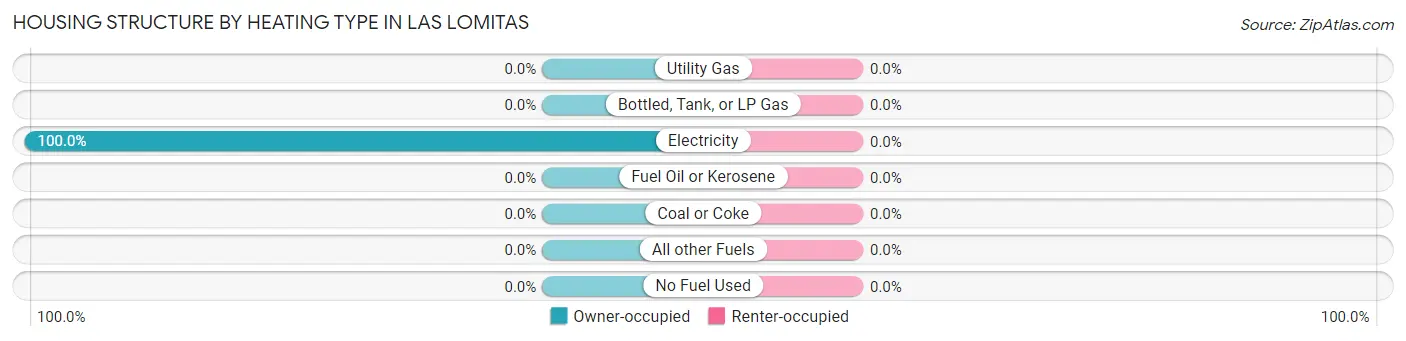
| Heating Type | Owner-occupied | Renter-occupied |
| Utility Gas | 0 (0.0%) | 0 (0.0%) |
| Bottled, Tank, or LP Gas | 0 (0.0%) | 0 (0.0%) |
| Electricity | 29 (100.0%) | 0 (0.0%) |
| Fuel Oil or Kerosene | 0 (0.0%) | 0 (0.0%) |
| Coal or Coke | 0 (0.0%) | 0 (0.0%) |
| All other Fuels | 0 (0.0%) | 0 (0.0%) |
| No Fuel Used | 0 (0.0%) | 0 (0.0%) |
| Total | 29 (100.0%) | 0 (0.0%) |
Household Vehicle Usage in Las Lomitas
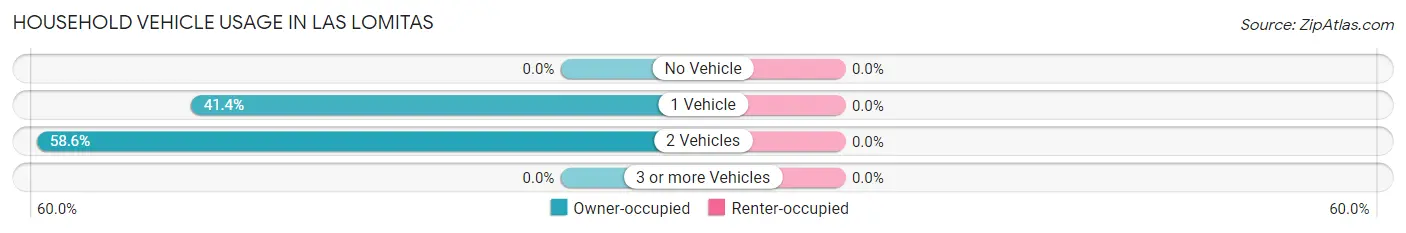
| Vehicles per Household | Owner-occupied | Renter-occupied |
| No Vehicle | 0 (0.0%) | 0 (0.0%) |
| 1 Vehicle | 12 (41.4%) | 0 (0.0%) |
| 2 Vehicles | 17 (58.6%) | 0 (0.0%) |
| 3 or more Vehicles | 0 (0.0%) | 0 (0.0%) |
| Total | 29 (100.0%) | 0 (0.0%) |
Real Estate & Mortgages in Las Lomitas
Real Estate and Mortgage Overview in Las Lomitas
| Characteristic | Without Mortgage | With Mortgage |
| Housing Units | 3 | 26 |
| Median Property Value | - | - |
| Median Household Income | - | - |
| Monthly Housing Costs | - | - |
| Real Estate Taxes | - | - |
Property Value by Mortgage Status in Las Lomitas
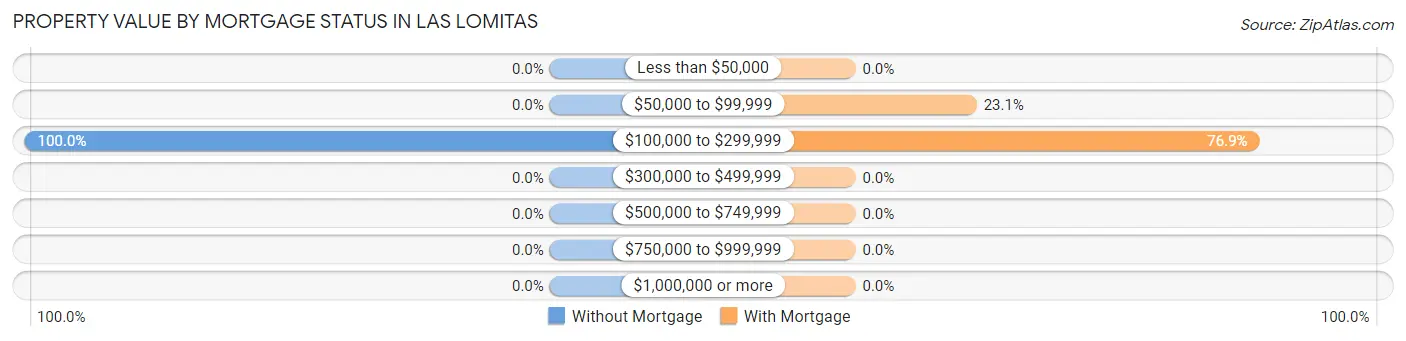
| Property Value | Without Mortgage | With Mortgage |
| Less than $50,000 | 0 (0.0%) | 0 (0.0%) |
| $50,000 to $99,999 | 0 (0.0%) | 6 (23.1%) |
| $100,000 to $299,999 | 3 (100.0%) | 20 (76.9%) |
| $300,000 to $499,999 | 0 (0.0%) | 0 (0.0%) |
| $500,000 to $749,999 | 0 (0.0%) | 0 (0.0%) |
| $750,000 to $999,999 | 0 (0.0%) | 0 (0.0%) |
| $1,000,000 or more | 0 (0.0%) | 0 (0.0%) |
| Total | 3 (100.0%) | 26 (100.0%) |
Household Income by Mortgage Status in Las Lomitas
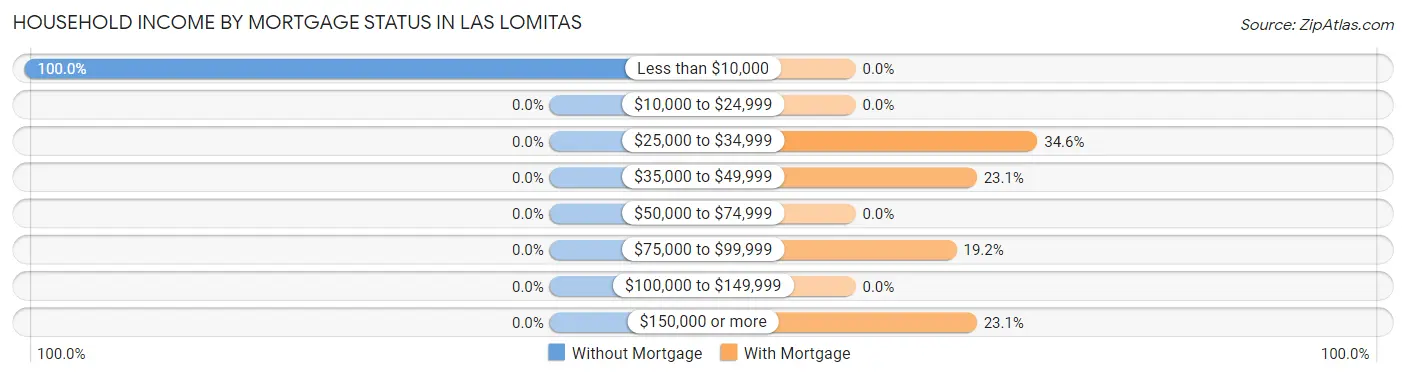
| Household Income | Without Mortgage | With Mortgage |
| Less than $10,000 | 3 (100.0%) | 0 (0.0%) |
| $10,000 to $24,999 | 0 (0.0%) | 0 (0.0%) |
| $25,000 to $34,999 | 0 (0.0%) | 9 (34.6%) |
| $35,000 to $49,999 | 0 (0.0%) | 6 (23.1%) |
| $50,000 to $74,999 | 0 (0.0%) | 0 (0.0%) |
| $75,000 to $99,999 | 0 (0.0%) | 5 (19.2%) |
| $100,000 to $149,999 | 0 (0.0%) | 0 (0.0%) |
| $150,000 or more | 0 (0.0%) | 6 (23.1%) |
| Total | 3 (100.0%) | 26 (100.0%) |
Property Value to Household Income Ratio in Las Lomitas
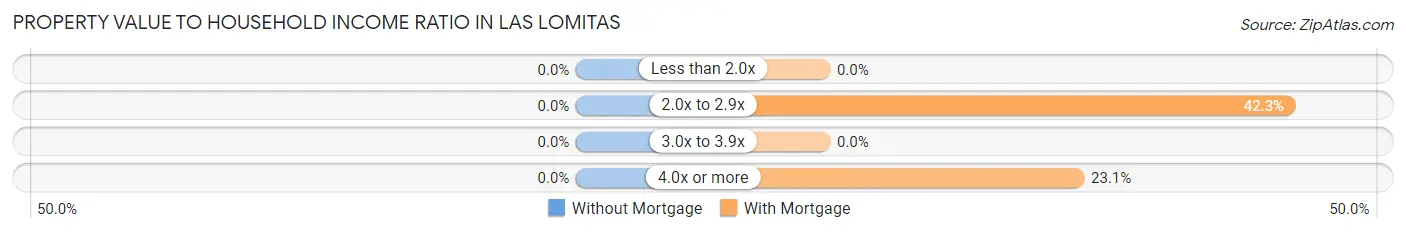
| Value-to-Income Ratio | Without Mortgage | With Mortgage |
| Less than 2.0x | 0 (0.0%) | 0 (0.0%) |
| 2.0x to 2.9x | 0 (0.0%) | 11 (42.3%) |
| 3.0x to 3.9x | 0 (0.0%) | 0 (0.0%) |
| 4.0x or more | 0 (0.0%) | 6 (23.1%) |
| Total | 3 (100.0%) | 26 (100.0%) |
Real Estate Taxes by Mortgage Status in Las Lomitas
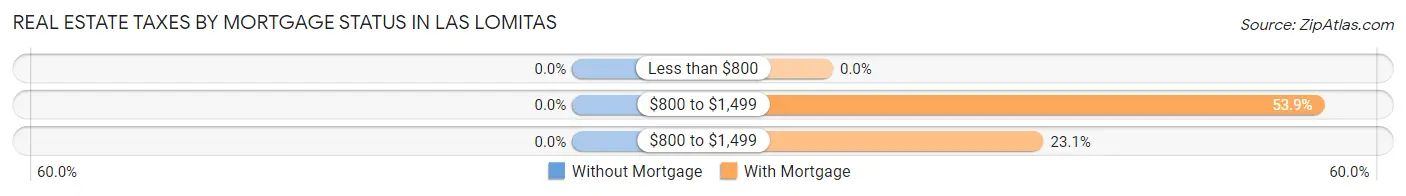
| Property Taxes | Without Mortgage | With Mortgage |
| Less than $800 | 0 (0.0%) | 0 (0.0%) |
| $800 to $1,499 | 0 (0.0%) | 14 (53.8%) |
| $800 to $1,499 | 0 (0.0%) | 6 (23.1%) |
| Total | 3 (100.0%) | 26 (100.0%) |
Health & Disability in Las Lomitas
Health Insurance Coverage by Age in Las Lomitas
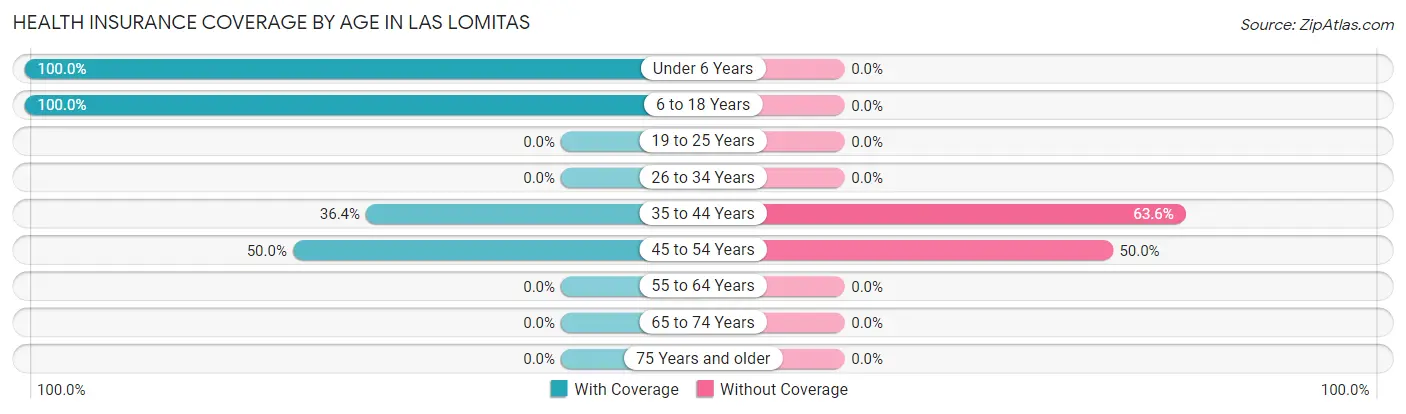
| Age Bracket | With Coverage | Without Coverage |
| Under 6 Years | 11 (100.0%) | 0 (0.0%) |
| 6 to 18 Years | 11 (100.0%) | 0 (0.0%) |
| 19 to 25 Years | 0 (0.0%) | 0 (0.0%) |
| 26 to 34 Years | 0 (0.0%) | 0 (0.0%) |
| 35 to 44 Years | 8 (36.4%) | 14 (63.6%) |
| 45 to 54 Years | 6 (50.0%) | 6 (50.0%) |
| 55 to 64 Years | 0 (0.0%) | 0 (0.0%) |
| 65 to 74 Years | 0 (0.0%) | 0 (0.0%) |
| 75 Years and older | 0 (0.0%) | 0 (0.0%) |
| Total | 36 (64.3%) | 20 (35.7%) |
Health Insurance Coverage by Citizenship Status in Las Lomitas
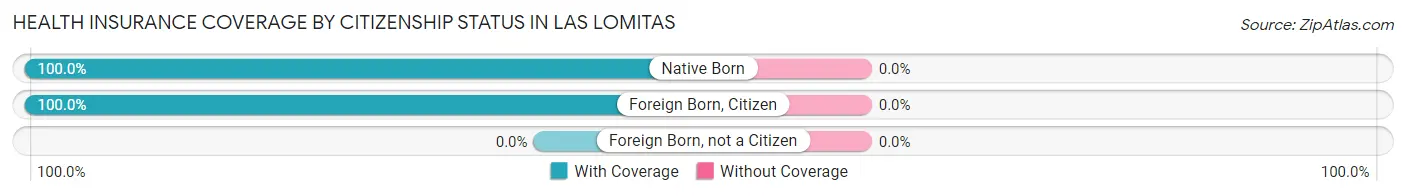
| Citizenship Status | With Coverage | Without Coverage |
| Native Born | 11 (100.0%) | 0 (0.0%) |
| Foreign Born, Citizen | 11 (100.0%) | 0 (0.0%) |
| Foreign Born, not a Citizen | 0 (0.0%) | 0 (0.0%) |
Health Insurance Coverage by Household Income in Las Lomitas
| Household Income | With Coverage | Without Coverage |
| Under $25,000 | 13 (59.1%) | 9 (40.9%) |
| $25,000 to $49,999 | 6 (100.0%) | 0 (0.0%) |
| $50,000 to $74,999 | 5 (100.0%) | 0 (0.0%) |
| $75,000 to $99,999 | 0 (0.0%) | 0 (0.0%) |
| $100,000 and over | 12 (52.2%) | 11 (47.8%) |
Public vs Private Health Insurance Coverage by Age in Las Lomitas
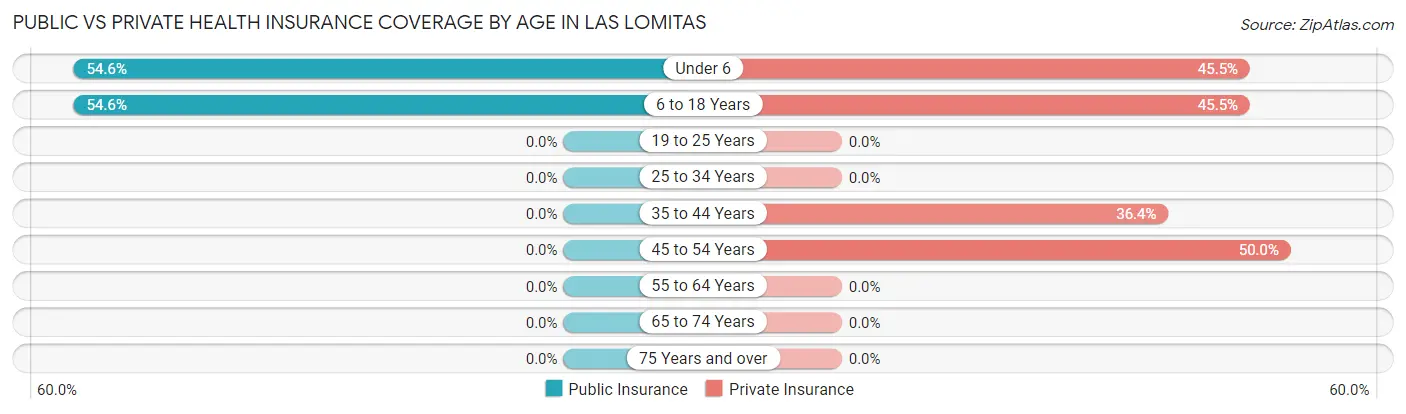
| Age Bracket | Public Insurance | Private Insurance |
| Under 6 | 6 (54.5%) | 5 (45.5%) |
| 6 to 18 Years | 6 (54.5%) | 5 (45.5%) |
| 19 to 25 Years | 0 (0.0%) | 0 (0.0%) |
| 25 to 34 Years | 0 (0.0%) | 0 (0.0%) |
| 35 to 44 Years | 0 (0.0%) | 8 (36.4%) |
| 45 to 54 Years | 0 (0.0%) | 6 (50.0%) |
| 55 to 64 Years | 0 (0.0%) | 0 (0.0%) |
| 65 to 74 Years | 0 (0.0%) | 0 (0.0%) |
| 75 Years and over | 0 (0.0%) | 0 (0.0%) |
| Total | 12 (21.4%) | 24 (42.9%) |
Disability Status by Sex by Age in Las Lomitas
| Age Bracket | Male | Female |
| Under 5 Years | 0 (0.0%) | 0 (0.0%) |
| 5 to 17 Years | 0 (0.0%) | 0 (0.0%) |
| 18 to 34 Years | 0 (0.0%) | 0 (0.0%) |
| 35 to 64 Years | 0 (0.0%) | 0 (0.0%) |
| 65 to 74 Years | 0 (0.0%) | 0 (0.0%) |
| 75 Years and over | 0 (0.0%) | 0 (0.0%) |
Disability Class by Sex by Age in Las Lomitas
Disability Class: Hearing Difficulty
| Age Bracket | Male | Female |
| Under 5 Years | 0 (0.0%) | 0 (0.0%) |
| 5 to 17 Years | 0 (0.0%) | 0 (0.0%) |
| 18 to 34 Years | 0 (0.0%) | 0 (0.0%) |
| 35 to 64 Years | 0 (0.0%) | 0 (0.0%) |
| 65 to 74 Years | 0 (0.0%) | 0 (0.0%) |
| 75 Years and over | 0 (0.0%) | 0 (0.0%) |
Disability Class: Vision Difficulty
| Age Bracket | Male | Female |
| Under 5 Years | 0 (0.0%) | 0 (0.0%) |
| 5 to 17 Years | 0 (0.0%) | 0 (0.0%) |
| 18 to 34 Years | 0 (0.0%) | 0 (0.0%) |
| 35 to 64 Years | 0 (0.0%) | 0 (0.0%) |
| 65 to 74 Years | 0 (0.0%) | 0 (0.0%) |
| 75 Years and over | 0 (0.0%) | 0 (0.0%) |
Disability Class: Cognitive Difficulty
| Age Bracket | Male | Female |
| 5 to 17 Years | 0 (0.0%) | 0 (0.0%) |
| 18 to 34 Years | 0 (0.0%) | 0 (0.0%) |
| 35 to 64 Years | 0 (0.0%) | 0 (0.0%) |
| 65 to 74 Years | 0 (0.0%) | 0 (0.0%) |
| 75 Years and over | 0 (0.0%) | 0 (0.0%) |
Disability Class: Ambulatory Difficulty
| Age Bracket | Male | Female |
| 5 to 17 Years | 0 (0.0%) | 0 (0.0%) |
| 18 to 34 Years | 0 (0.0%) | 0 (0.0%) |
| 35 to 64 Years | 0 (0.0%) | 0 (0.0%) |
| 65 to 74 Years | 0 (0.0%) | 0 (0.0%) |
| 75 Years and over | 0 (0.0%) | 0 (0.0%) |
Disability Class: Self-Care Difficulty
| Age Bracket | Male | Female |
| 5 to 17 Years | 0 (0.0%) | 0 (0.0%) |
| 18 to 34 Years | 0 (0.0%) | 0 (0.0%) |
| 35 to 64 Years | 0 (0.0%) | 0 (0.0%) |
| 65 to 74 Years | 0 (0.0%) | 0 (0.0%) |
| 75 Years and over | 0 (0.0%) | 0 (0.0%) |
Technology Access in Las Lomitas
Computing Device Access in Las Lomitas
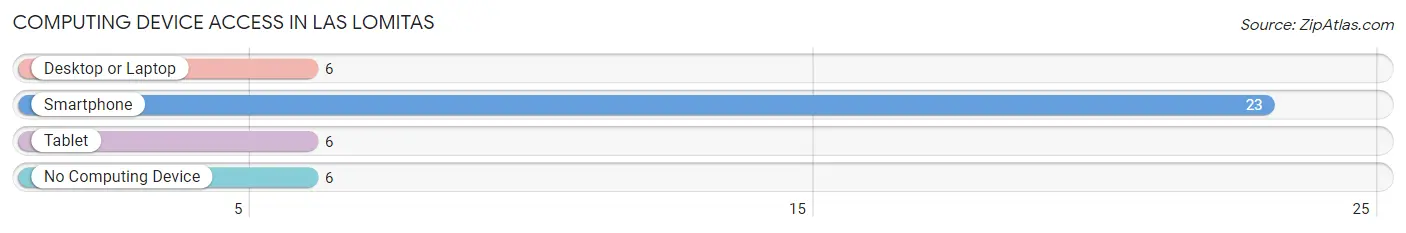
| Device Type | # Households | % Households |
| Desktop or Laptop | 6 | 20.7% |
| Smartphone | 23 | 79.3% |
| Tablet | 6 | 20.7% |
| No Computing Device | 6 | 20.7% |
| Total | 29 | 100.0% |
Internet Access in Las Lomitas
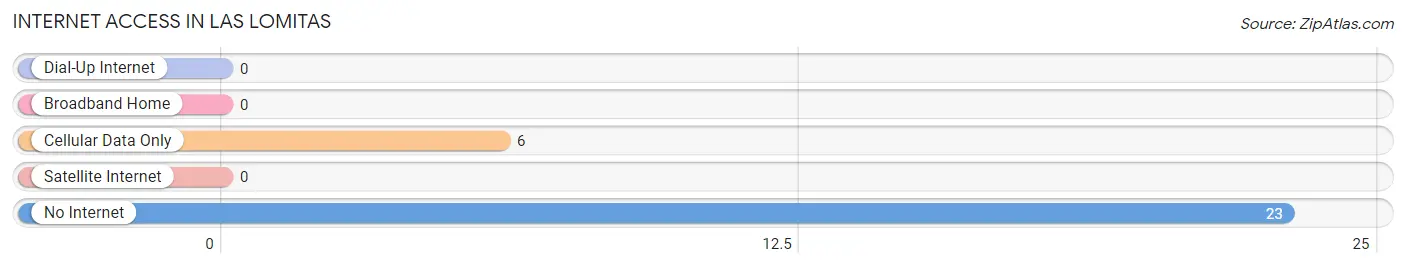
| Internet Type | # Households | % Households |
| Dial-Up Internet | 0 | 0.0% |
| Broadband Home | 0 | 0.0% |
| Cellular Data Only | 6 | 20.7% |
| Satellite Internet | 0 | 0.0% |
| No Internet | 23 | 79.3% |
| Total | 29 | 100.0% |
Las Lomitas Summary
Las Lomitas is a small unincorporated community located in Hidalgo County, Texas. It is situated on the banks of the Rio Grande, just south of the city of McAllen. The population of Las Lomitas was estimated to be around 1,000 in 2020.
History
Las Lomitas was founded in the late 19th century by a group of Mexican settlers who were looking for a place to settle and farm. The area was originally known as El Rancho de las Lomitas, which translates to “the ranch of the little hills”. The settlers were attracted to the area due to its fertile soil and abundant water supply.
The first settlers of Las Lomitas were mostly farmers and ranchers, and the community quickly grew. By the early 20th century, the town had a post office, a school, a church, and a general store.
In the 1950s, the population of Las Lomitas began to decline as many of the residents moved away to larger cities in search of better job opportunities. However, the town has seen a resurgence in recent years, as many people have moved back to the area to take advantage of the area’s natural beauty and proximity to the Rio Grande.
Geography
Las Lomitas is located in the Rio Grande Valley of South Texas, just south of the city of McAllen. The town is situated on the banks of the Rio Grande, and is surrounded by a number of small hills. The area is known for its lush vegetation and abundant wildlife.
The climate in Las Lomitas is subtropical, with hot summers and mild winters. The average temperature in the summer is around 90 degrees Fahrenheit, while the average temperature in the winter is around 70 degrees Fahrenheit.
Economy
The economy of Las Lomitas is largely based on agriculture. The area is known for its production of citrus fruits, vegetables, and other crops. In addition, the town is home to a number of small businesses, including restaurants, shops, and other services.
The town is also home to a number of tourist attractions, including the Las Lomitas Wildlife Refuge, which is a popular destination for birdwatchers.
Demographics
As of the 2020 census, the population of Las Lomitas was estimated to be around 1,000. The majority of the population is of Hispanic or Latino origin, with a small percentage of other ethnicities. The median household income in Las Lomitas is around $30,000, and the median age is around 35 years old.
Conclusion
Las Lomitas is a small unincorporated community located in Hidalgo County, Texas. It is situated on the banks of the Rio Grande, just south of the city of McAllen. The population of Las Lomitas was estimated to be around 1,000 in 2020. The town is known for its lush vegetation and abundant wildlife, and its economy is largely based on agriculture. The majority of the population is of Hispanic or Latino origin, with a small percentage of other ethnicities. The median household income in Las Lomitas is around $30,000, and the median age is around 35 years old.
Common Questions
What is Per Capita Income in Las Lomitas?
Per Capita income in Las Lomitas is $22,741.
What is Inequality or Gini Index in Las Lomitas?
Inequality or Gini Index in Las Lomitas is 0.41.
What is the Total Population of Las Lomitas?
Total Population of Las Lomitas is 56.
What is the Total Male Population of Las Lomitas?
Total Male Population of Las Lomitas is 37.
What is the Total Female Population of Las Lomitas?
Total Female Population of Las Lomitas is 19.
What is the Ratio of Males per 100 Females in Las Lomitas?
There are 194.74 Males per 100 Females in Las Lomitas.
What is the Ratio of Females per 100 Males in Las Lomitas?
There are 51.35 Females per 100 Males in Las Lomitas.
What is the Median Population Age in Las Lomitas?
Median Population Age in Las Lomitas is 39.3 Years.
What is the Average Family Size in Las Lomitas
Average Family Size in Las Lomitas is 4.0 People.
What is the Average Household Size in Las Lomitas
Average Household Size in Las Lomitas is 1.9 People.
How Large is the Labor Force in Las Lomitas?
There are 31 People in the Labor Forcein in Las Lomitas.
What is the Percentage of People in the Labor Force in Las Lomitas?
79.5% of People are in the Labor Force in Las Lomitas.