Zip Codes with the Highest Percentage of Population Employed in Food Preparation & Serving in Killeen, TX
RELATED REPORTS & OPTIONS
Food Preparation & Serving
Killeen
Compare Zip Codes
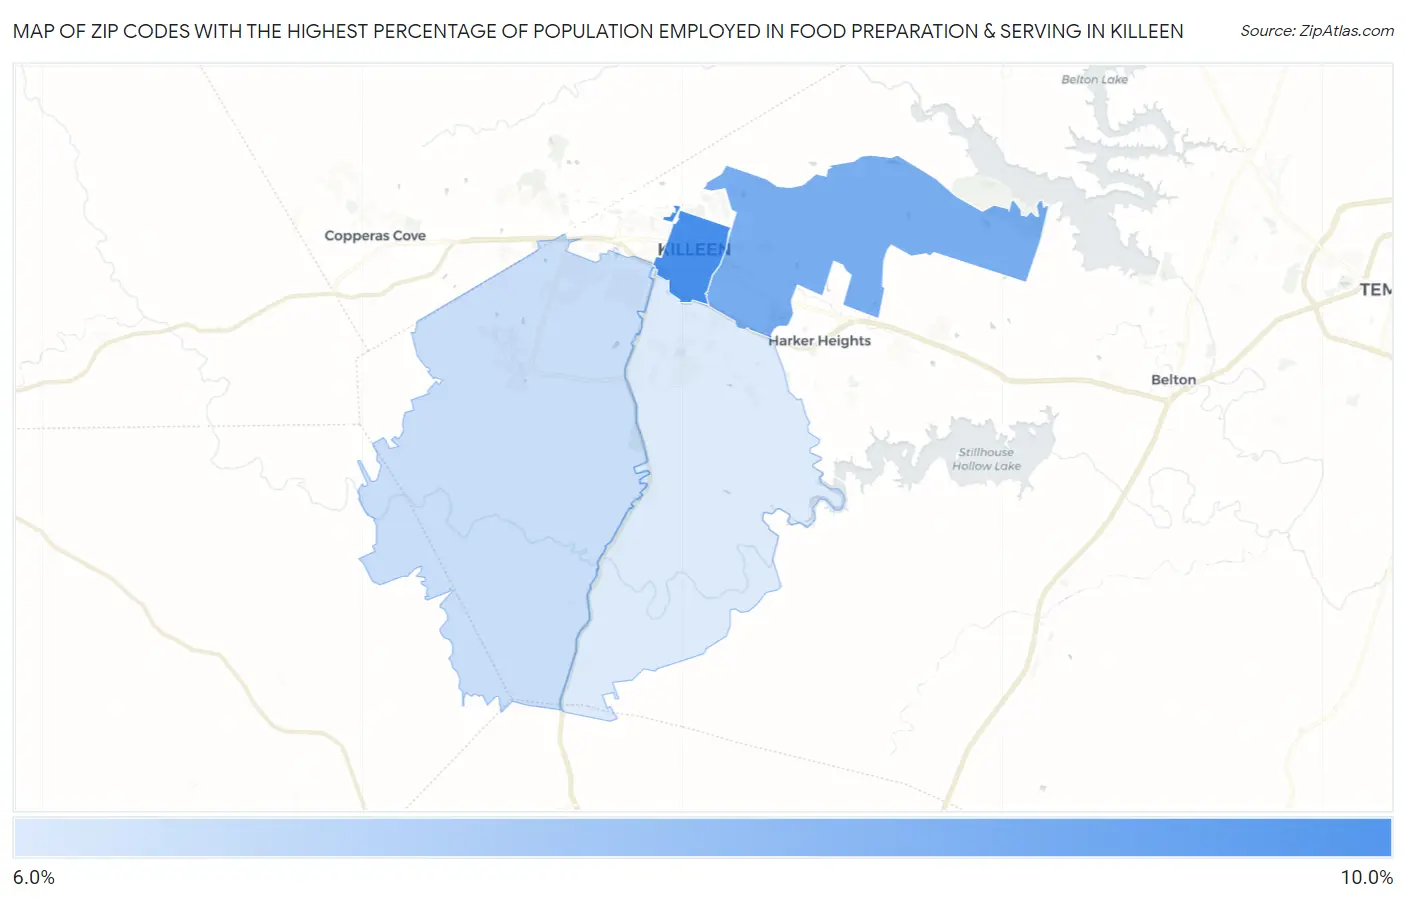
Map of Zip Codes with the Highest Percentage of Population Employed in Food Preparation & Serving in Killeen
6.0%
9.8%
Zip Codes with the Highest Percentage of Population Employed in Food Preparation & Serving in Killeen, TX
| Zip Code | % Employed | vs State | vs National | |
| 1. | 76541 | 9.8% | 5.4%(+4.49)#151 | 5.3%(+4.55)#2,763 |
| 2. | 76543 | 8.6% | 5.4%(+3.25)#234 | 5.3%(+3.31)#3,967 |
| 3. | 76549 | 6.6% | 5.4%(+1.21)#480 | 5.3%(+1.27)#7,700 |
| 4. | 76542 | 6.0% | 5.4%(+0.660)#566 | 5.3%(+0.726)#9,307 |
1
Common Questions
What are the Top 3 Zip Codes with the Highest Percentage of Population Employed in Food Preparation & Serving in Killeen, TX?
Top 3 Zip Codes with the Highest Percentage of Population Employed in Food Preparation & Serving in Killeen, TX are:
What zip code has the Highest Percentage of Population Employed in Food Preparation & Serving in Killeen, TX?
76541 has the Highest Percentage of Population Employed in Food Preparation & Serving in Killeen, TX with 9.8%.
What is the Percentage of Population Employed in Food Preparation & Serving in Killeen, TX?
Percentage of Population Employed in Food Preparation & Serving in Killeen is 7.4%.
What is the Percentage of Population Employed in Food Preparation & Serving in Texas?
Percentage of Population Employed in Food Preparation & Serving in Texas is 5.4%.
What is the Percentage of Population Employed in Food Preparation & Serving in the United States?
Percentage of Population Employed in Food Preparation & Serving in the United States is 5.3%.