Pueblo Nuevo, TX Map & Demographics
Pueblo Nuevo Map
Pueblo Nuevo Overview
$14,238
PER CAPITA INCOME
$38,702
AVG FAMILY INCOME
$10,243
FAMILY INCOME DEFICIT
0.45
INEQUALITY / GINI INDEX
569
TOTAL POPULATION
297
MALE POPULATION
272
FEMALE POPULATION
109.19
MALES / 100 FEMALES
91.58
FEMALES / 100 MALES
27.7
MEDIAN AGE
4.5
AVG FAMILY SIZE
4.2
AVG HOUSEHOLD SIZE
254
LABOR FORCE [ PEOPLE ]
62.1%
PERCENT IN LABOR FORCE
2.8%
UNEMPLOYMENT RATE
Income in Pueblo Nuevo
Income Overview in Pueblo Nuevo
| Characteristic | Number | Measure |
| Per Capita Income | 569 | $14,238 |
| Median Family Income | 123 | $38,702 |
| Mean Family Income | 123 | $53,898 |
| Median Household Income | 135 | $0 |
| Mean Household Income | 135 | $58,216 |
| Income Deficit | 123 | $10,243 |
| Wage / Income Gap (%) | 569 | 0.00% |
| Wage / Income Gap ($) | 569 | 100.00¢ per $1 |
| Gini / Inequality Index | 569 | 0.45 |
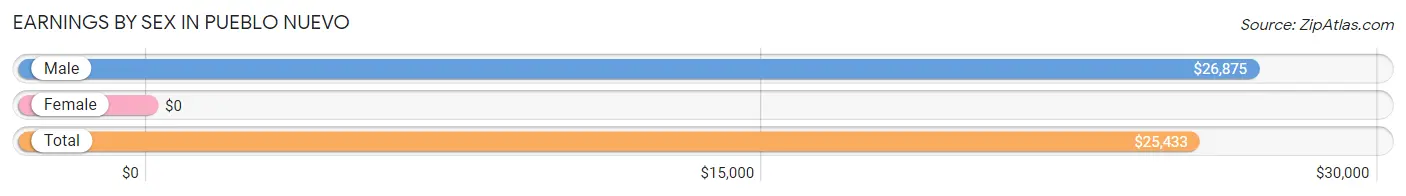
Earnings by Sex in Pueblo Nuevo
| Sex | Number | Average Earnings |
| Male | 137 (55.5%) | $26,875 |
| Female | 110 (44.5%) | $0 |
| Total | 247 (100.0%) | $25,433 |
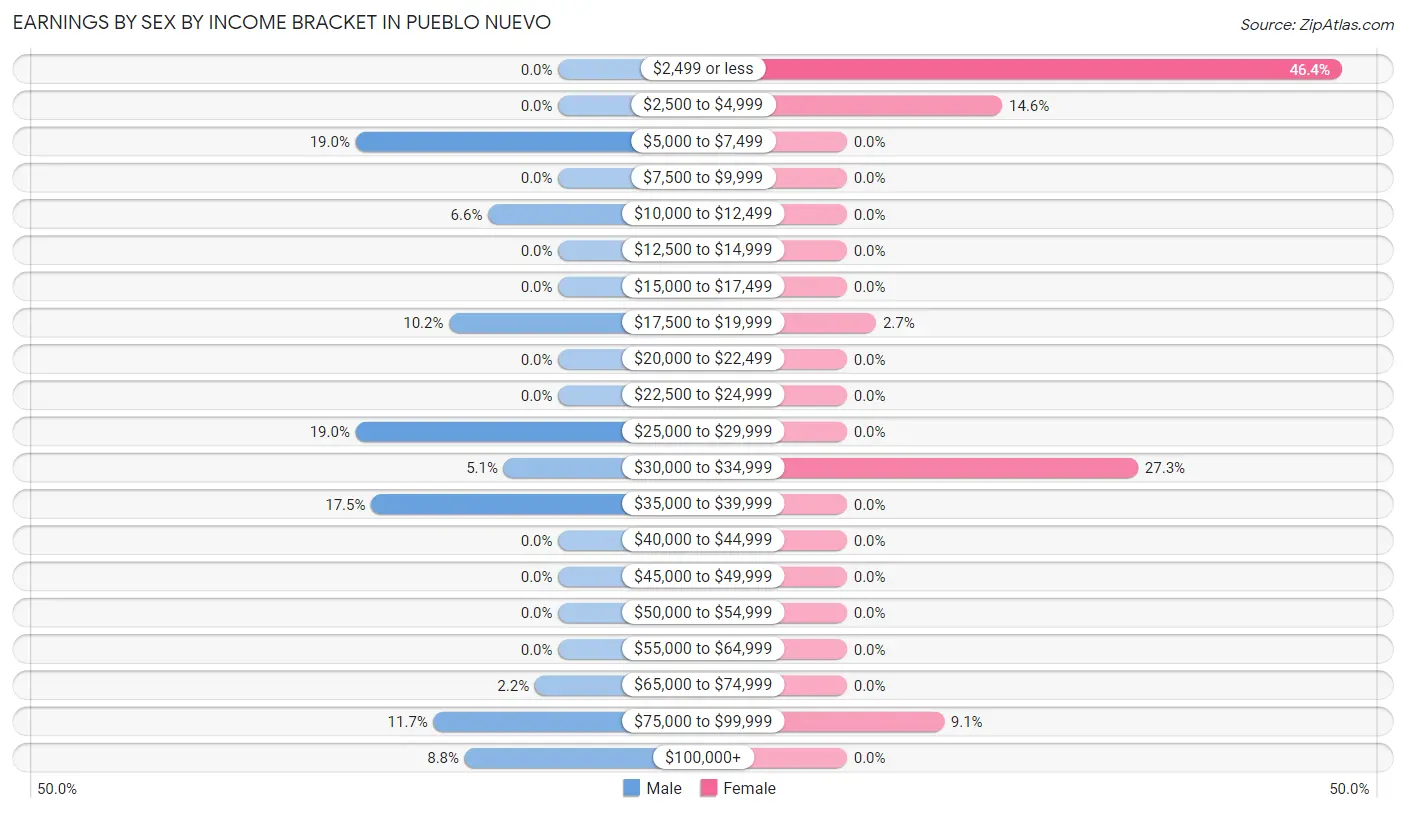
Earnings by Sex by Income Bracket in Pueblo Nuevo
The most common earnings brackets in Pueblo Nuevo are $5,000 to $7,499 for men (26 | 19.0%) and $2,499 or less for women (51 | 46.4%).
| Income | Male | Female |
| $2,499 or less | 0 (0.0%) | 51 (46.4%) |
| $2,500 to $4,999 | 0 (0.0%) | 16 (14.5%) |
| $5,000 to $7,499 | 26 (19.0%) | 0 (0.0%) |
| $7,500 to $9,999 | 0 (0.0%) | 0 (0.0%) |
| $10,000 to $12,499 | 9 (6.6%) | 0 (0.0%) |
| $12,500 to $14,999 | 0 (0.0%) | 0 (0.0%) |
| $15,000 to $17,499 | 0 (0.0%) | 0 (0.0%) |
| $17,500 to $19,999 | 14 (10.2%) | 3 (2.7%) |
| $20,000 to $22,499 | 0 (0.0%) | 0 (0.0%) |
| $22,500 to $24,999 | 0 (0.0%) | 0 (0.0%) |
| $25,000 to $29,999 | 26 (19.0%) | 0 (0.0%) |
| $30,000 to $34,999 | 7 (5.1%) | 30 (27.3%) |
| $35,000 to $39,999 | 24 (17.5%) | 0 (0.0%) |
| $40,000 to $44,999 | 0 (0.0%) | 0 (0.0%) |
| $45,000 to $49,999 | 0 (0.0%) | 0 (0.0%) |
| $50,000 to $54,999 | 0 (0.0%) | 0 (0.0%) |
| $55,000 to $64,999 | 0 (0.0%) | 0 (0.0%) |
| $65,000 to $74,999 | 3 (2.2%) | 0 (0.0%) |
| $75,000 to $99,999 | 16 (11.7%) | 10 (9.1%) |
| $100,000+ | 12 (8.8%) | 0 (0.0%) |
| Total | 137 (100.0%) | 110 (100.0%) |
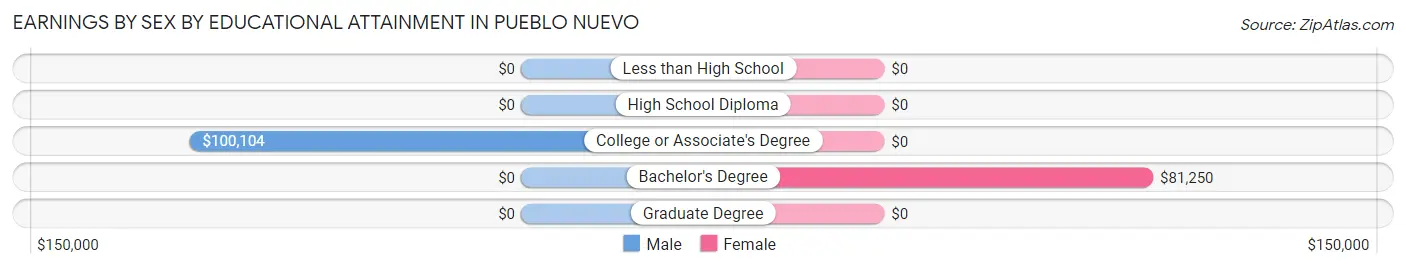
Earnings by Sex by Educational Attainment in Pueblo Nuevo
| Educational Attainment | Male Income | Female Income |
| Less than High School | - | - |
| High School Diploma | - | - |
| College or Associate's Degree | $100,104 | $0 |
| Bachelor's Degree | - | - |
| Graduate Degree | - | - |
| Total | $35,313 | $0 |
Family Income in Pueblo Nuevo
Family Income Brackets in Pueblo Nuevo
According to the Pueblo Nuevo family income data, there are 36 families falling into the $35,000 to $49,999 income range, which is the most common income bracket and makes up 29.3% of all families.
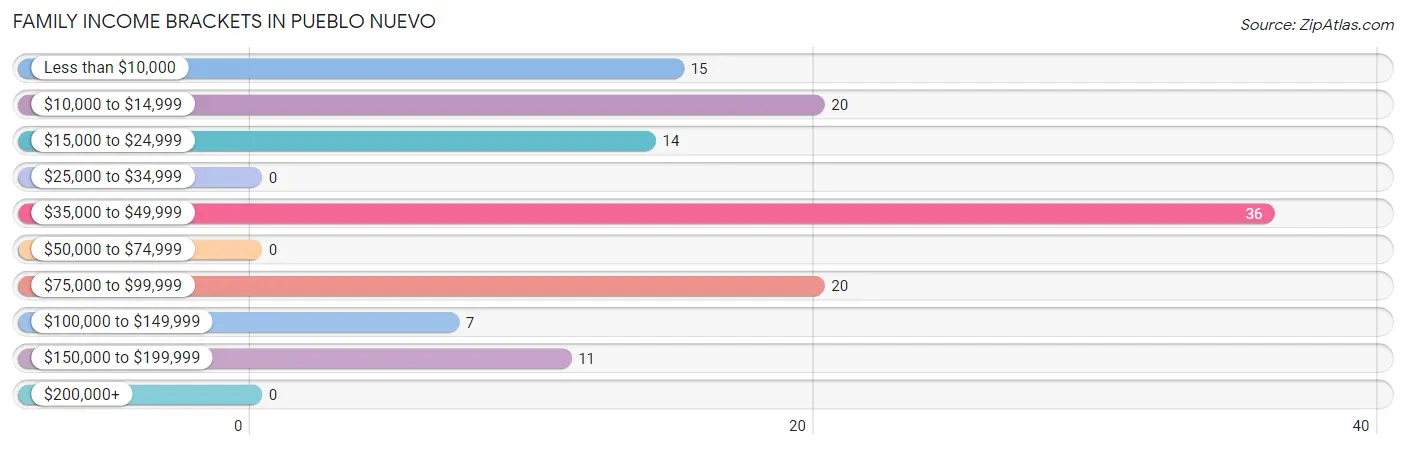
| Income Bracket | # Families | % Families |
| Less than $10,000 | 15 | 12.2% |
| $10,000 to $14,999 | 20 | 16.3% |
| $15,000 to $24,999 | 14 | 11.4% |
| $25,000 to $34,999 | 0 | 0.0% |
| $35,000 to $49,999 | 36 | 29.3% |
| $50,000 to $74,999 | 0 | 0.0% |
| $75,000 to $99,999 | 20 | 16.3% |
| $100,000 to $149,999 | 7 | 5.7% |
| $150,000 to $199,999 | 11 | 8.9% |
| $200,000+ | 0 | 0.0% |
Family Income by Famaliy Size in Pueblo Nuevo
2-person families (38 | 30.9%) account for the highest median family income in Pueblo Nuevo with $13,000 per family, while 2-person families (38 | 30.9%) have the highest median income of $6,500 per family member.
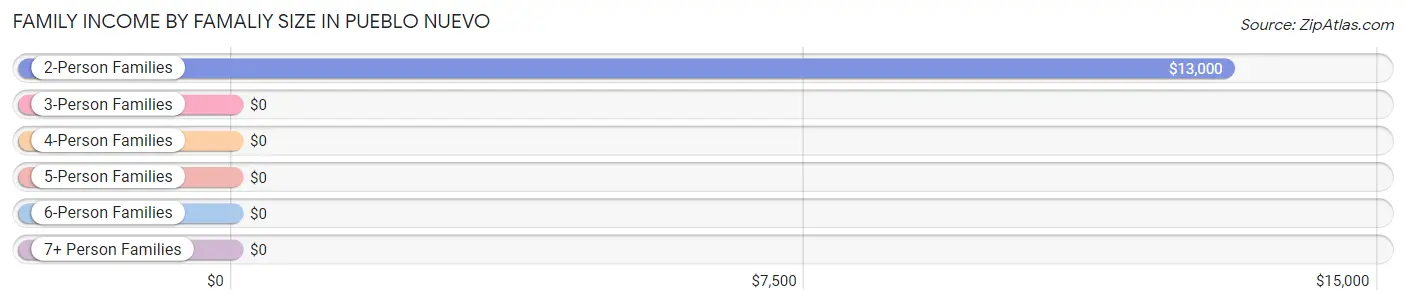
| Income Bracket | # Families | Median Income |
| 2-Person Families | 38 (30.9%) | $13,000 |
| 3-Person Families | 0 (0.0%) | $0 |
| 4-Person Families | 8 (6.5%) | $0 |
| 5-Person Families | 43 (35.0%) | $0 |
| 6-Person Families | 20 (16.3%) | $0 |
| 7+ Person Families | 14 (11.4%) | $0 |
| Total | 123 (100.0%) | $38,702 |
Family Income by Number of Earners in Pueblo Nuevo
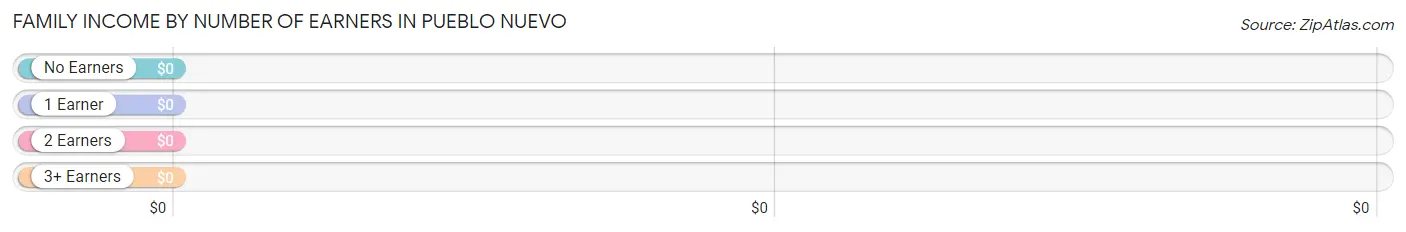
| Number of Earners | # Families | Median Income |
| No Earners | 35 (28.5%) | $0 |
| 1 Earner | 0 (0.0%) | $0 |
| 2 Earners | 42 (34.2%) | $0 |
| 3+ Earners | 46 (37.4%) | $0 |
| Total | 123 (100.0%) | $38,702 |
Household Income in Pueblo Nuevo
Household Income Brackets in Pueblo Nuevo
With 36 households falling in the category, the $35,000 to $49,999 income range is the most frequent in Pueblo Nuevo, accounting for 26.7% of all households.
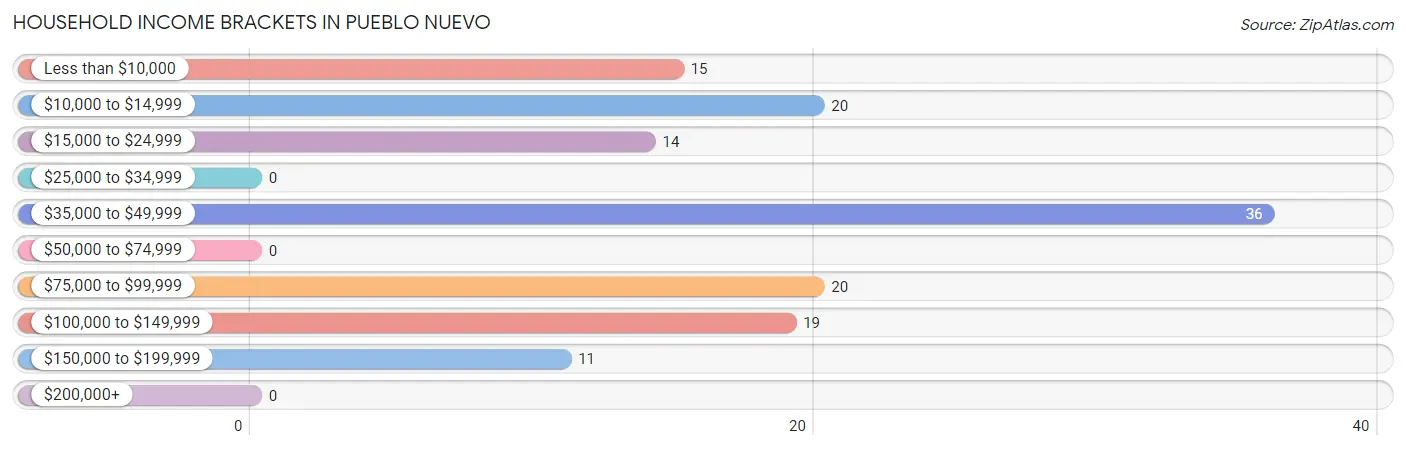
| Income Bracket | # Households | % Households |
| Less than $10,000 | 15 | 11.1% |
| $10,000 to $14,999 | 20 | 14.8% |
| $15,000 to $24,999 | 14 | 10.4% |
| $25,000 to $34,999 | 0 | 0.0% |
| $35,000 to $49,999 | 36 | 26.7% |
| $50,000 to $74,999 | 0 | 0.0% |
| $75,000 to $99,999 | 20 | 14.8% |
| $100,000 to $149,999 | 19 | 14.1% |
| $150,000 to $199,999 | 11 | 8.1% |
| $200,000+ | 0 | 0.0% |
Household Income by Householder Age in Pueblo Nuevo
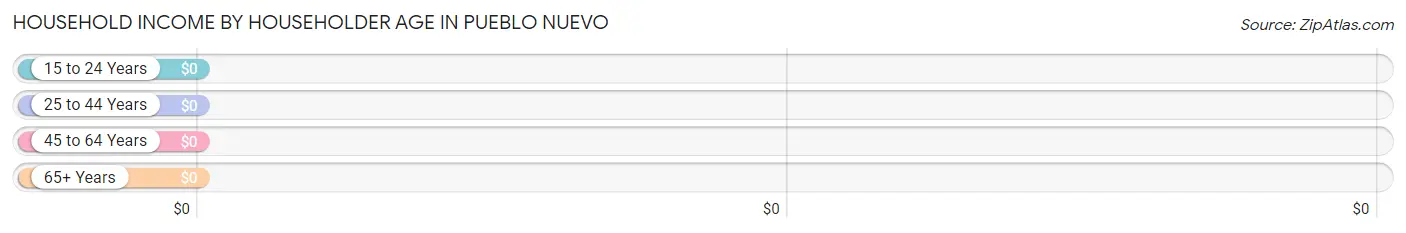
| Income Bracket | # Households | Median Income |
| 15 to 24 Years | 0 (0.0%) | $0 |
| 25 to 44 Years | 54 (40.0%) | $0 |
| 45 to 64 Years | 46 (34.1%) | $0 |
| 65+ Years | 35 (25.9%) | $0 |
| Total | 135 (100.0%) | $0 |
Poverty in Pueblo Nuevo
Income Below Poverty by Sex and Age in Pueblo Nuevo
With 27.3% poverty level for males and 32.0% for females among the residents of Pueblo Nuevo, 16 and 17 year old males and 12 to 14 year old females are the most vulnerable to poverty, with 12 males (100.0%) and 14 females (100.0%) in their respective age groups living below the poverty level.
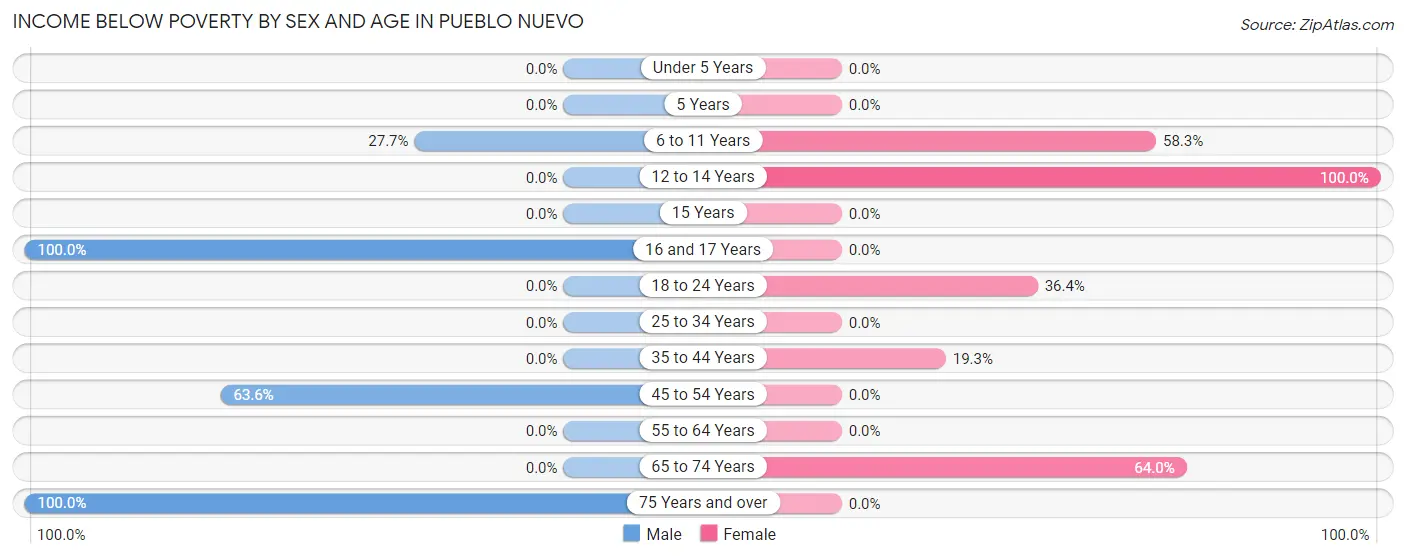
| Age Bracket | Male | Female |
| Under 5 Years | 0 (0.0%) | 0 (0.0%) |
| 5 Years | 0 (0.0%) | 0 (0.0%) |
| 6 to 11 Years | 13 (27.7%) | 14 (58.3%) |
| 12 to 14 Years | 0 (0.0%) | 14 (100.0%) |
| 15 Years | 0 (0.0%) | 0 (0.0%) |
| 16 and 17 Years | 12 (100.0%) | 0 (0.0%) |
| 18 to 24 Years | 0 (0.0%) | 16 (36.4%) |
| 25 to 34 Years | 0 (0.0%) | 0 (0.0%) |
| 35 to 44 Years | 0 (0.0%) | 11 (19.3%) |
| 45 to 54 Years | 14 (63.6%) | 0 (0.0%) |
| 55 to 64 Years | 0 (0.0%) | 0 (0.0%) |
| 65 to 74 Years | 0 (0.0%) | 32 (64.0%) |
| 75 Years and over | 42 (100.0%) | 0 (0.0%) |
| Total | 81 (27.3%) | 87 (32.0%) |
Income Above Poverty by Sex and Age in Pueblo Nuevo
According to the poverty statistics in Pueblo Nuevo, males aged under 5 years and females aged under 5 years are the age groups that are most secure financially, with 100.0% of males and 100.0% of females in these age groups living above the poverty line.
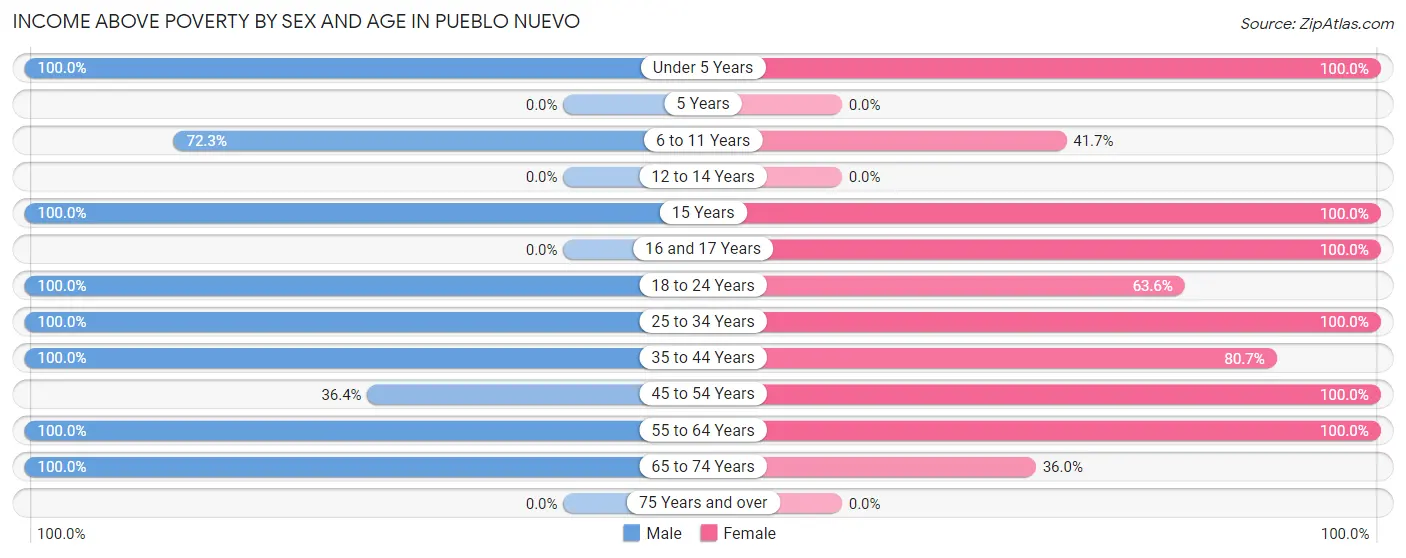
| Age Bracket | Male | Female |
| Under 5 Years | 9 (100.0%) | 15 (100.0%) |
| 5 Years | 0 (0.0%) | 0 (0.0%) |
| 6 to 11 Years | 34 (72.3%) | 10 (41.7%) |
| 12 to 14 Years | 0 (0.0%) | 0 (0.0%) |
| 15 Years | 44 (100.0%) | 7 (100.0%) |
| 16 and 17 Years | 0 (0.0%) | 21 (100.0%) |
| 18 to 24 Years | 33 (100.0%) | 28 (63.6%) |
| 25 to 34 Years | 17 (100.0%) | 20 (100.0%) |
| 35 to 44 Years | 50 (100.0%) | 46 (80.7%) |
| 45 to 54 Years | 8 (36.4%) | 7 (100.0%) |
| 55 to 64 Years | 12 (100.0%) | 13 (100.0%) |
| 65 to 74 Years | 9 (100.0%) | 18 (36.0%) |
| 75 Years and over | 0 (0.0%) | 0 (0.0%) |
| Total | 216 (72.7%) | 185 (68.0%) |
Income Below Poverty Among Married-Couple Families in Pueblo Nuevo
The poverty statistics for married-couple families in Pueblo Nuevo show that 43.4% or 49 of the total 113 families live below the poverty line. Families with 3 or 4 children have the highest poverty rate of 100.0%, comprising of 14 families. On the other hand, families with 1 or 2 children have the lowest poverty rate of 0.0%, which includes 0 families.
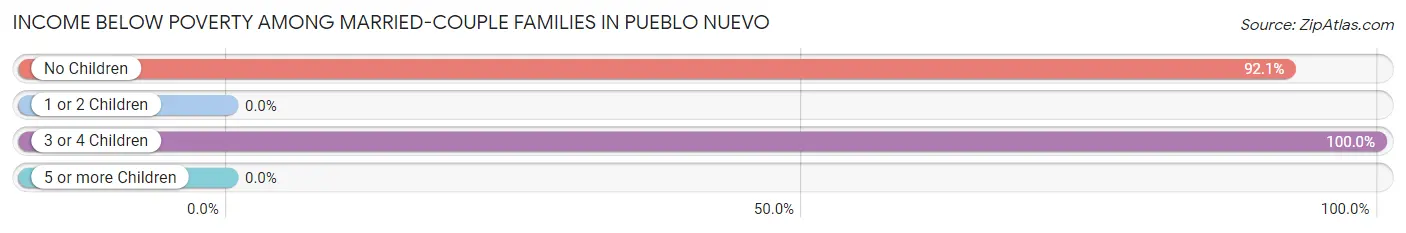
| Children | Above Poverty | Below Poverty |
| No Children | 3 (7.9%) | 35 (92.1%) |
| 1 or 2 Children | 61 (100.0%) | 0 (0.0%) |
| 3 or 4 Children | 0 (0.0%) | 14 (100.0%) |
| 5 or more Children | 0 (0.0%) | 0 (0.0%) |
| Total | 64 (56.6%) | 49 (43.4%) |
Income Below Poverty Among Single-Parent Households in Pueblo Nuevo
| Children | Single Father | Single Mother |
| No Children | 0 (0.0%) | 0 (0.0%) |
| 1 or 2 Children | 0 (0.0%) | 0 (0.0%) |
| 3 or 4 Children | 0 (0.0%) | 0 (0.0%) |
| 5 or more Children | 0 (0.0%) | 0 (0.0%) |
| Total | 0 (0.0%) | 0 (0.0%) |
Income Below Poverty Among Married-Couple vs Single-Parent Households in Pueblo Nuevo
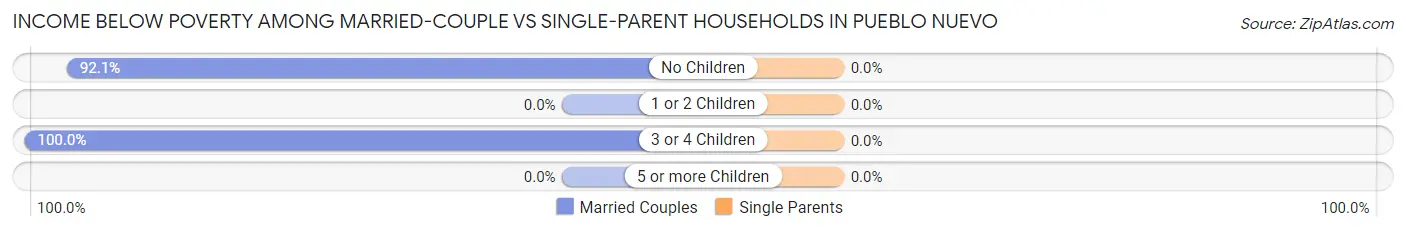
| Children | Married-Couple Families | Single-Parent Households |
| No Children | 35 (92.1%) | 0 (0.0%) |
| 1 or 2 Children | 0 (0.0%) | 0 (0.0%) |
| 3 or 4 Children | 14 (100.0%) | 0 (0.0%) |
| 5 or more Children | 0 (0.0%) | 0 (0.0%) |
| Total | 49 (43.4%) | 0 (0.0%) |
Race in Pueblo Nuevo
The most populous races in Pueblo Nuevo are Hispanic or Latino (569 | 100.0%), White / Caucasian (361 | 63.4%), and Some other Race (132 | 23.2%).
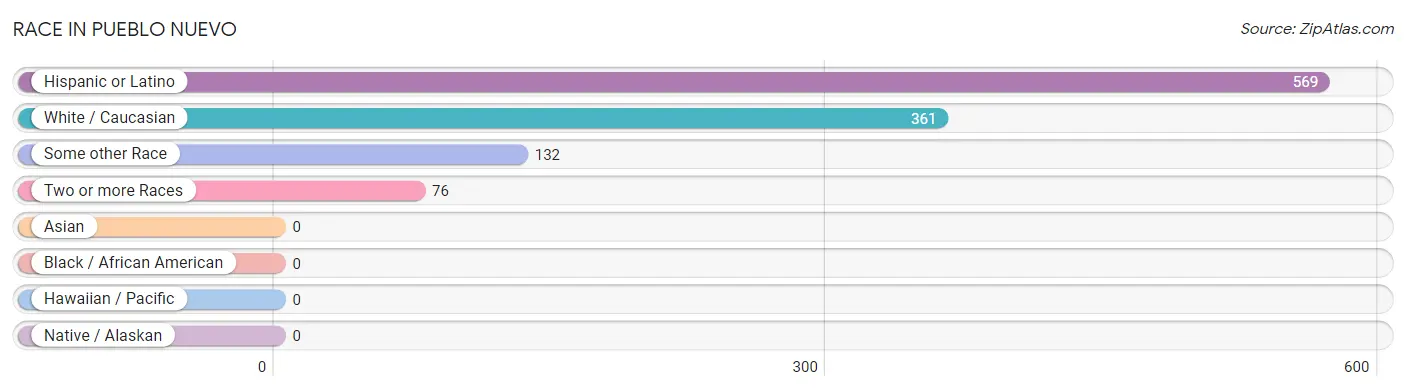
| Race | # Population | % Population |
| Asian | 0 | 0.0% |
| Black / African American | 0 | 0.0% |
| Hawaiian / Pacific | 0 | 0.0% |
| Hispanic or Latino | 569 | 100.0% |
| Native / Alaskan | 0 | 0.0% |
| White / Caucasian | 361 | 63.4% |
| Two or more Races | 76 | 13.4% |
| Some other Race | 132 | 23.2% |
| Total | 569 | 100.0% |
Ancestry in Pueblo Nuevo
The most populous ancestries reported in Pueblo Nuevo are Mexican (566 | 99.5%), Colombian (3 | 0.5%), and South American (3 | 0.5%), together accounting for 100.5% of all Pueblo Nuevo residents.
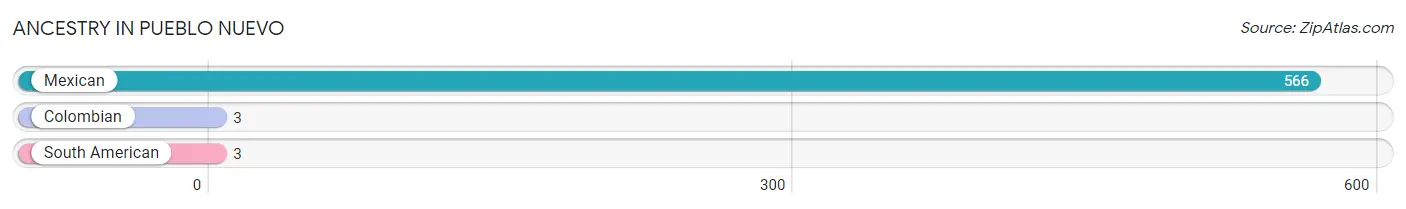
| Ancestry | # Population | % Population |
| Colombian | 3 | 0.5% |
| Mexican | 566 | 99.5% |
| South American | 3 | 0.5% | View All 3 Rows |
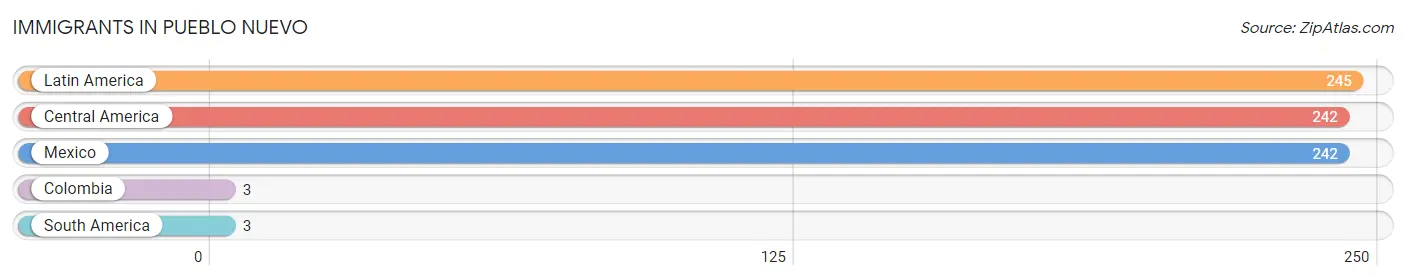
Immigrants in Pueblo Nuevo
The most numerous immigrant groups reported in Pueblo Nuevo came from Latin America (245 | 43.1%), Central America (242 | 42.5%), Mexico (242 | 42.5%), Colombia (3 | 0.5%), and South America (3 | 0.5%), together accounting for 129.2% of all Pueblo Nuevo residents.
| Immigration Origin | # Population | % Population |
| Central America | 242 | 42.5% |
| Colombia | 3 | 0.5% |
| Latin America | 245 | 43.1% |
| Mexico | 242 | 42.5% |
| South America | 3 | 0.5% | View All 5 Rows |
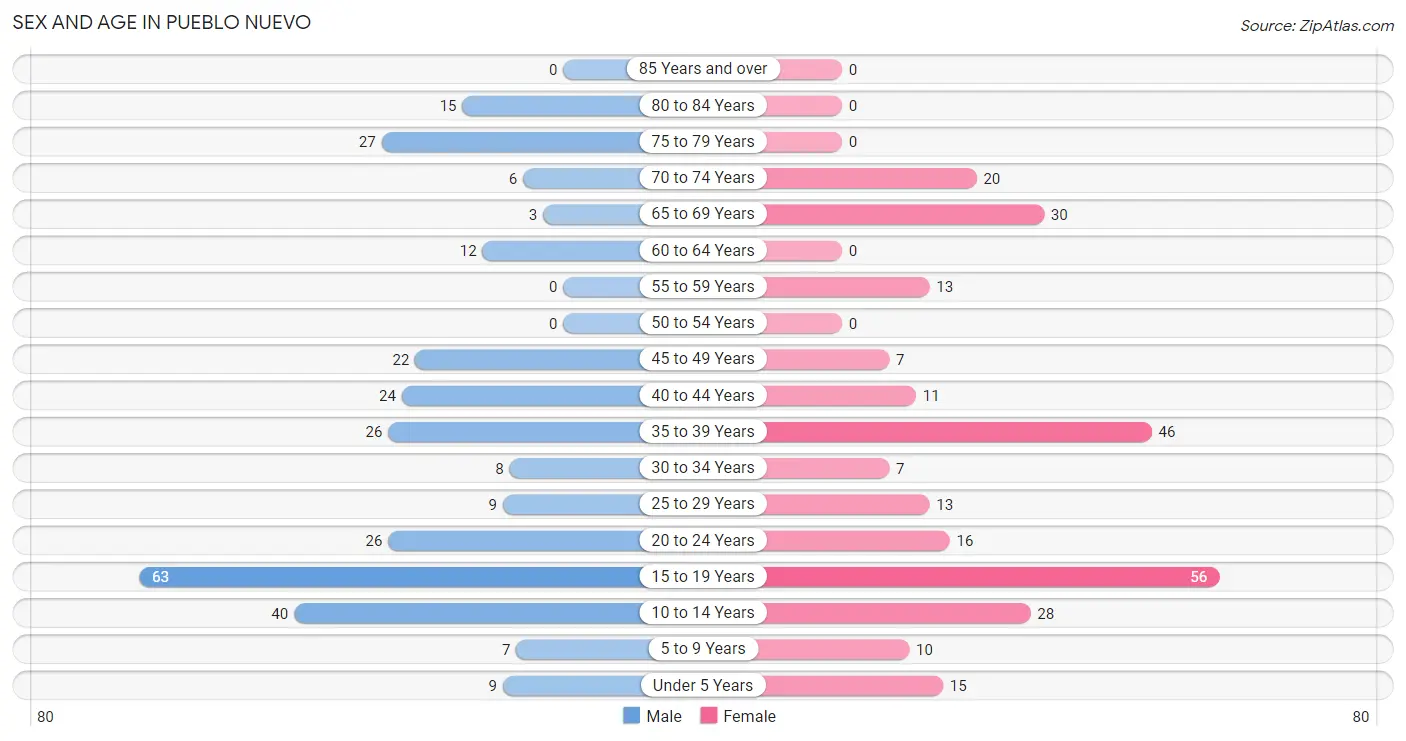
Sex and Age in Pueblo Nuevo
Sex and Age in Pueblo Nuevo
The most populous age groups in Pueblo Nuevo are 15 to 19 Years (63 | 21.2%) for men and 15 to 19 Years (56 | 20.6%) for women.
| Age Bracket | Male | Female |
| Under 5 Years | 9 (3.0%) | 15 (5.5%) |
| 5 to 9 Years | 7 (2.4%) | 10 (3.7%) |
| 10 to 14 Years | 40 (13.5%) | 28 (10.3%) |
| 15 to 19 Years | 63 (21.2%) | 56 (20.6%) |
| 20 to 24 Years | 26 (8.7%) | 16 (5.9%) |
| 25 to 29 Years | 9 (3.0%) | 13 (4.8%) |
| 30 to 34 Years | 8 (2.7%) | 7 (2.6%) |
| 35 to 39 Years | 26 (8.7%) | 46 (16.9%) |
| 40 to 44 Years | 24 (8.1%) | 11 (4.0%) |
| 45 to 49 Years | 22 (7.4%) | 7 (2.6%) |
| 50 to 54 Years | 0 (0.0%) | 0 (0.0%) |
| 55 to 59 Years | 0 (0.0%) | 13 (4.8%) |
| 60 to 64 Years | 12 (4.0%) | 0 (0.0%) |
| 65 to 69 Years | 3 (1.0%) | 30 (11.0%) |
| 70 to 74 Years | 6 (2.0%) | 20 (7.3%) |
| 75 to 79 Years | 27 (9.1%) | 0 (0.0%) |
| 80 to 84 Years | 15 (5.1%) | 0 (0.0%) |
| 85 Years and over | 0 (0.0%) | 0 (0.0%) |
| Total | 297 (100.0%) | 272 (100.0%) |
Families and Households in Pueblo Nuevo
Median Family Size in Pueblo Nuevo
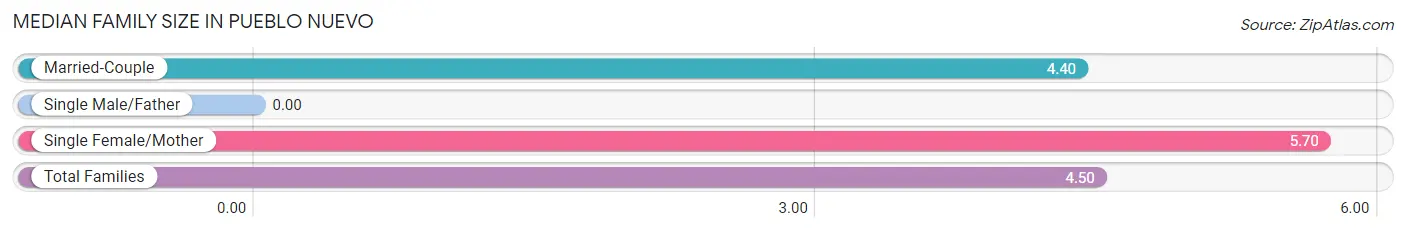
| Family Type | # Families | Family Size |
| Married-Couple | 113 (91.9%) | 4.40 |
| Single Male/Father | 0 (0.0%) | - |
| Single Female/Mother | 10 (8.1%) | 5.70 |
| Total Families | 123 (100.0%) | 4.50 |
Median Household Size in Pueblo Nuevo
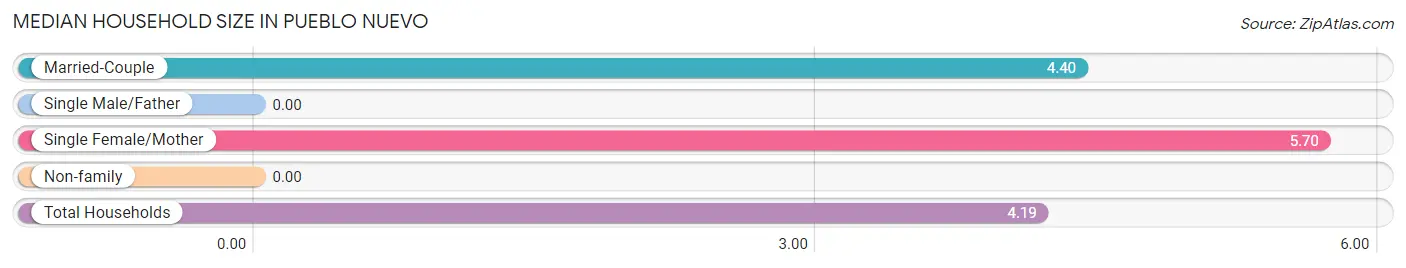
| Household Type | # Households | Household Size |
| Married-Couple | 113 (83.7%) | 4.40 |
| Single Male/Father | 0 (0.0%) | - |
| Single Female/Mother | 10 (7.4%) | 5.70 |
| Non-family | 12 (8.9%) | - |
| Total Households | 135 (100.0%) | 4.19 |
Household Size by Marriage Status in Pueblo Nuevo
Out of a total of 135 households in Pueblo Nuevo, 123 (91.1%) are family households, while 12 (8.9%) are nonfamily households. The most numerous type of family households are 5-person households, comprising 43, and the most common type of nonfamily households are 1-person households, comprising 12.
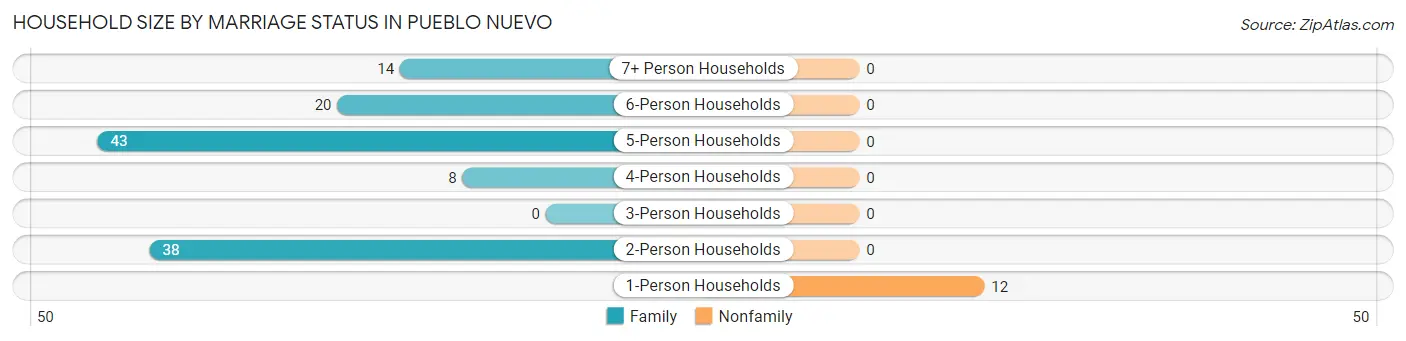
| Household Size | Family Households | Nonfamily Households |
| 1-Person Households | - | 12 (8.9%) |
| 2-Person Households | 38 (28.1%) | 0 (0.0%) |
| 3-Person Households | 0 (0.0%) | 0 (0.0%) |
| 4-Person Households | 8 (5.9%) | 0 (0.0%) |
| 5-Person Households | 43 (31.9%) | 0 (0.0%) |
| 6-Person Households | 20 (14.8%) | 0 (0.0%) |
| 7+ Person Households | 14 (10.4%) | 0 (0.0%) |
| Total | 123 (91.1%) | 12 (8.9%) |
Female Fertility in Pueblo Nuevo
Fertility by Age in Pueblo Nuevo
| Age Bracket | Women with Births | Births / 1,000 Women |
| 15 to 19 years | 0 (0.0%) | 0.0 |
| 20 to 34 years | 0 (0.0%) | 0.0 |
| 35 to 50 years | 0 (0.0%) | 0.0 |
| Total | 0 (0.0%) | 0.0 |
Fertility by Age by Marriage Status in Pueblo Nuevo
| Age Bracket | Married | Unmarried |
| 15 to 19 years | 0 (0.0%) | 0 (0.0%) |
| 20 to 34 years | 0 (0.0%) | 0 (0.0%) |
| 35 to 50 years | 0 (0.0%) | 0 (0.0%) |
| Total | 0 (0.0%) | 0 (0.0%) |
Fertility by Education in Pueblo Nuevo
| Educational Attainment | Women with Births | Births / 1,000 Women |
| Less than High School | 0 (0.0%) | 0.0 |
| High School Diploma | 0 (0.0%) | 0.0 |
| College or Associate's Degree | 0 (0.0%) | 0.0 |
| Bachelor's Degree | 0 (0.0%) | 0.0 |
| Graduate Degree | 0 (0.0%) | 0.0 |
| Total | 0 (0.0%) | 0.0 |
Fertility by Education by Marriage Status in Pueblo Nuevo
| Educational Attainment | Married | Unmarried |
| Less than High School | 0 (0.0%) | 0 (0.0%) |
| High School Diploma | 0 (0.0%) | 0 (0.0%) |
| College or Associate's Degree | 0 (0.0%) | 0 (0.0%) |
| Bachelor's Degree | 0 (0.0%) | 0 (0.0%) |
| Graduate Degree | 0 (0.0%) | 0 (0.0%) |
| Total | 0 (0.0%) | 0 (0.0%) |
Employment Characteristics in Pueblo Nuevo
Employment by Class of Employer in Pueblo Nuevo
Among the 247 employed individuals in Pueblo Nuevo, private company employees (184 | 74.5%), self-employed (not incorporated) (36 | 14.6%), and federal government employees (12 | 4.9%) make up the most common classes of employment.
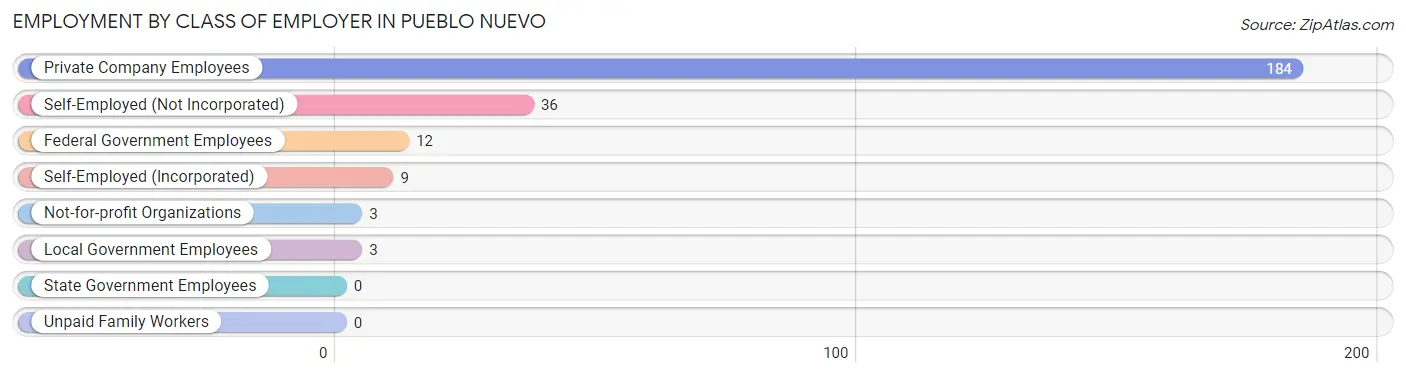
| Employer Class | # Employees | % Employees |
| Private Company Employees | 184 | 74.5% |
| Self-Employed (Incorporated) | 9 | 3.6% |
| Self-Employed (Not Incorporated) | 36 | 14.6% |
| Not-for-profit Organizations | 3 | 1.2% |
| Local Government Employees | 3 | 1.2% |
| State Government Employees | 0 | 0.0% |
| Federal Government Employees | 12 | 4.9% |
| Unpaid Family Workers | 0 | 0.0% |
| Total | 247 | 100.0% |
Employment Status by Age in Pueblo Nuevo
According to the labor force statistics for Pueblo Nuevo, out of the total population over 16 years of age (409), 62.1% or 254 individuals are in the labor force, with 2.8% or 7 of them unemployed. The age group with the highest labor force participation rate is 20 to 24 years, with 100.0% or 42 individuals in the labor force. Within the labor force, the 45 to 54 years age range has the highest percentage of unemployed individuals, with 24.1% or 7 of them being unemployed.
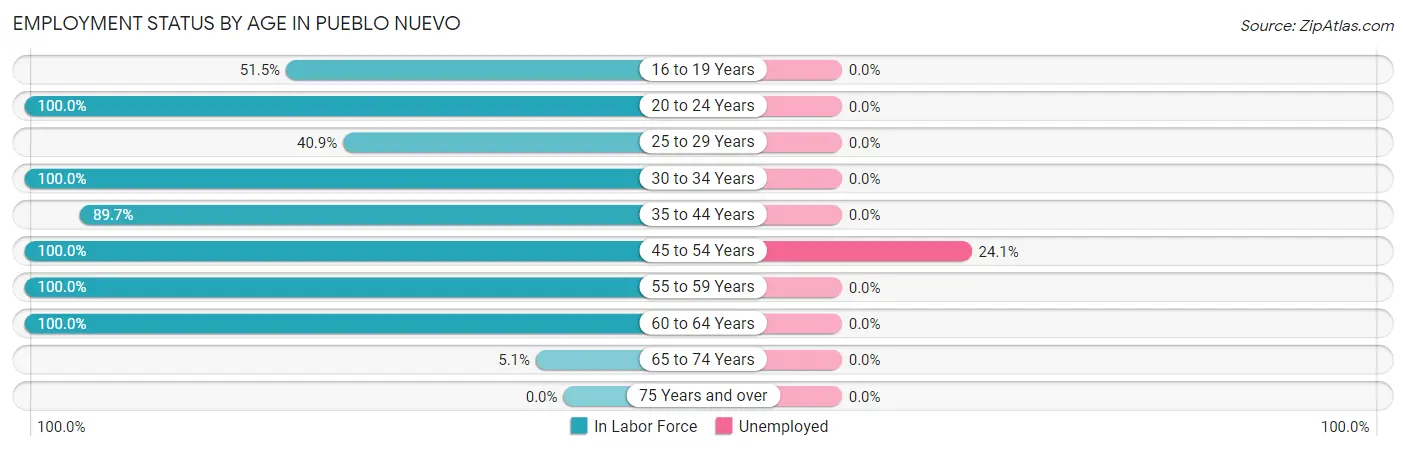
| Age Bracket | In Labor Force | Unemployed |
| 16 to 19 Years | 35 (51.5%) | 0 (0.0%) |
| 20 to 24 Years | 42 (100.0%) | 0 (0.0%) |
| 25 to 29 Years | 9 (40.9%) | 0 (0.0%) |
| 30 to 34 Years | 15 (100.0%) | 0 (0.0%) |
| 35 to 44 Years | 96 (89.7%) | 0 (0.0%) |
| 45 to 54 Years | 29 (100.0%) | 7 (24.1%) |
| 55 to 59 Years | 13 (100.0%) | 0 (0.0%) |
| 60 to 64 Years | 12 (100.0%) | 0 (0.0%) |
| 65 to 74 Years | 3 (5.1%) | 0 (0.0%) |
| 75 Years and over | 0 (0.0%) | 0 (0.0%) |
| Total | 254 (62.1%) | 7 (2.8%) |
Employment Status by Educational Attainment in Pueblo Nuevo
According to labor force statistics for Pueblo Nuevo, 87.9% of individuals (174) out of the total population between 25 and 64 years of age (198) are in the labor force, with 4.0% or 7 of them being unemployed. The group with the highest labor force participation rate are those with the educational attainment of high school diploma, with 100.0% or 29 individuals in the labor force. Within the labor force, individuals with college / associate degree education have the highest percentage of unemployment, with 18.9% or 7 of them being unemployed.
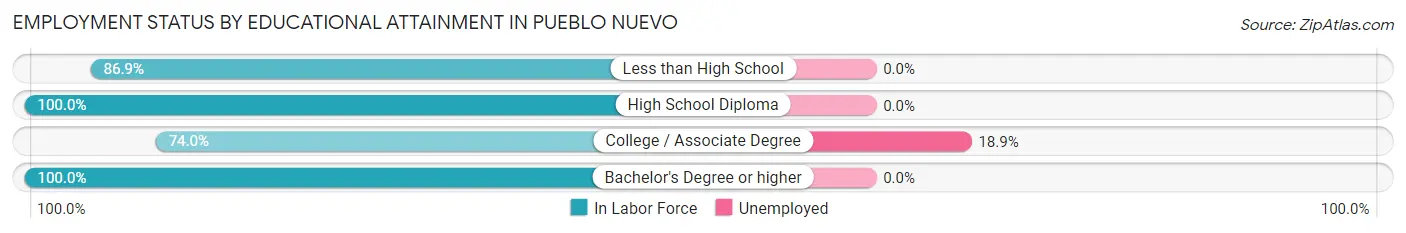
| Educational Attainment | In Labor Force | Unemployed |
| Less than High School | 73 (86.9%) | 0 (0.0%) |
| High School Diploma | 29 (100.0%) | 0 (0.0%) |
| College / Associate Degree | 37 (74.0%) | 9 (18.9%) |
| Bachelor's Degree or higher | 35 (100.0%) | 0 (0.0%) |
| Total | 174 (87.9%) | 8 (4.0%) |
Employment Occupations by Sex in Pueblo Nuevo
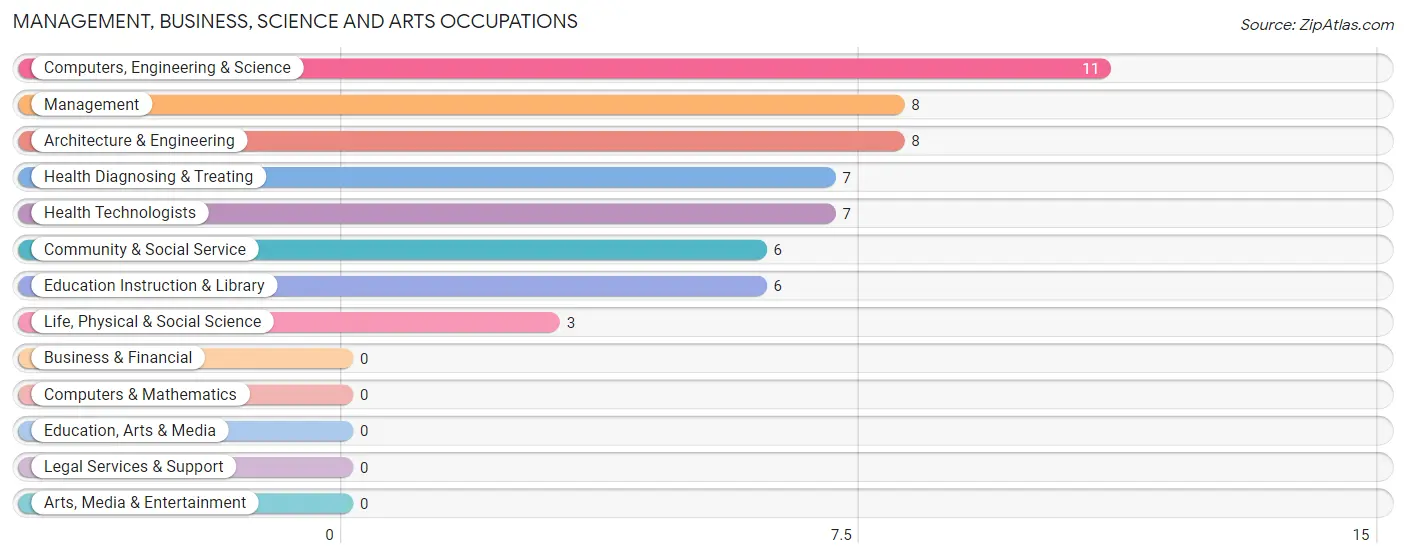
Management, Business, Science and Arts Occupations
The most common Management, Business, Science and Arts occupations in Pueblo Nuevo are Computers, Engineering & Science (11 | 4.4%), Management (8 | 3.2%), Architecture & Engineering (8 | 3.2%), Health Diagnosing & Treating (7 | 2.8%), and Health Technologists (7 | 2.8%).
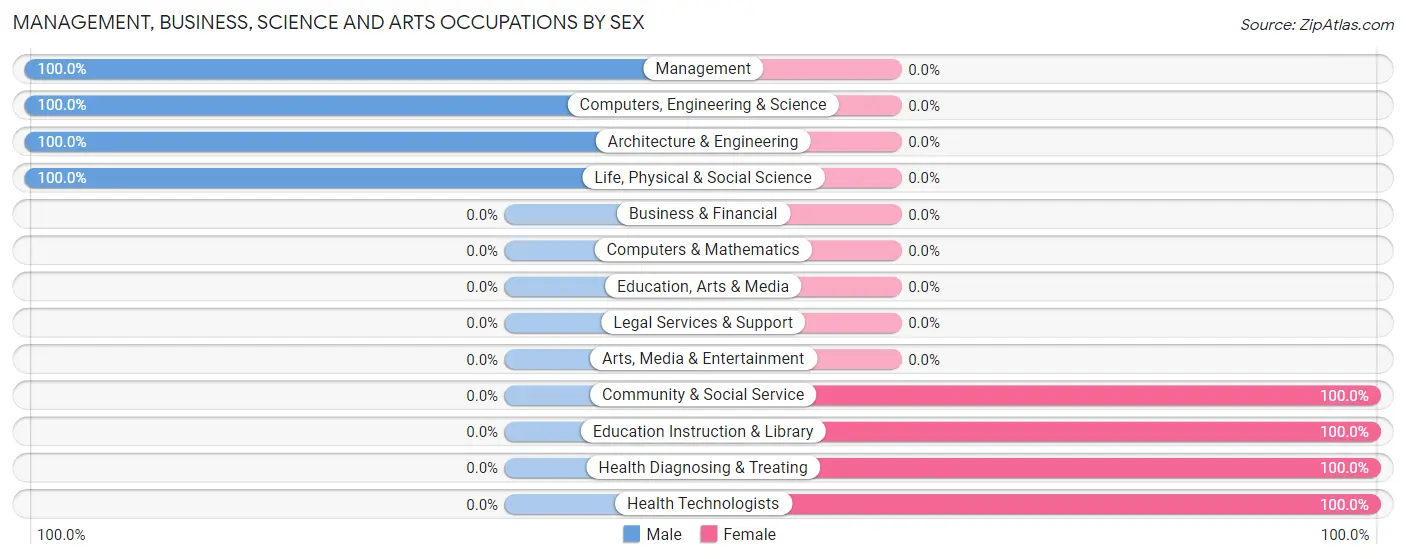
Management, Business, Science and Arts Occupations by Sex
Within the Management, Business, Science and Arts occupations in Pueblo Nuevo, the most male-oriented occupations are Management (100.0%), Computers, Engineering & Science (100.0%), and Architecture & Engineering (100.0%), while the most female-oriented occupations are Community & Social Service (100.0%), Education Instruction & Library (100.0%), and Health Diagnosing & Treating (100.0%).
| Occupation | Male | Female |
| Management | 8 (100.0%) | 0 (0.0%) |
| Business & Financial | 0 (0.0%) | 0 (0.0%) |
| Computers, Engineering & Science | 11 (100.0%) | 0 (0.0%) |
| Computers & Mathematics | 0 (0.0%) | 0 (0.0%) |
| Architecture & Engineering | 8 (100.0%) | 0 (0.0%) |
| Life, Physical & Social Science | 3 (100.0%) | 0 (0.0%) |
| Community & Social Service | 0 (0.0%) | 6 (100.0%) |
| Education, Arts & Media | 0 (0.0%) | 0 (0.0%) |
| Legal Services & Support | 0 (0.0%) | 0 (0.0%) |
| Education Instruction & Library | 0 (0.0%) | 6 (100.0%) |
| Arts, Media & Entertainment | 0 (0.0%) | 0 (0.0%) |
| Health Diagnosing & Treating | 0 (0.0%) | 7 (100.0%) |
| Health Technologists | 0 (0.0%) | 7 (100.0%) |
| Total (Category) | 19 (59.4%) | 13 (40.6%) |
| Total (Overall) | 137 (55.5%) | 110 (44.5%) |
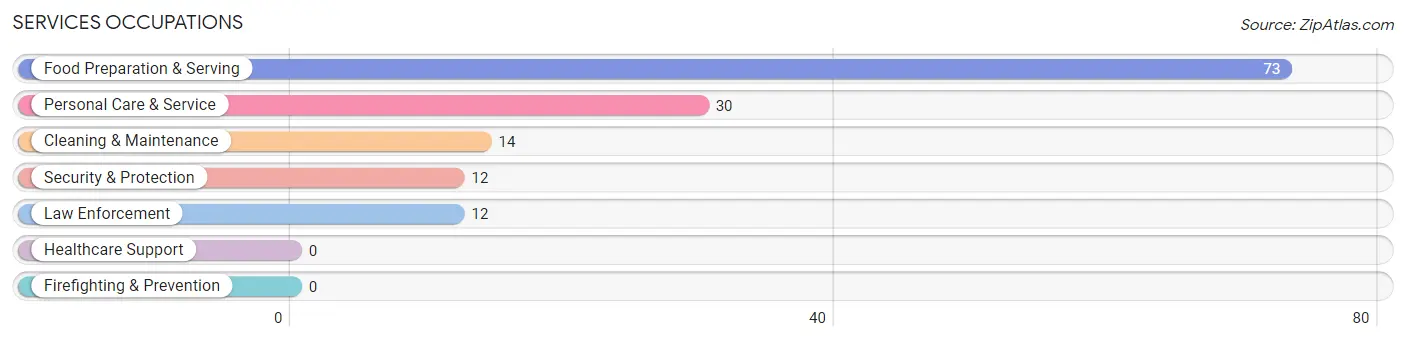
Services Occupations
The most common Services occupations in Pueblo Nuevo are Food Preparation & Serving (73 | 29.5%), Personal Care & Service (30 | 12.1%), Cleaning & Maintenance (14 | 5.7%), Security & Protection (12 | 4.9%), and Law Enforcement (12 | 4.9%).
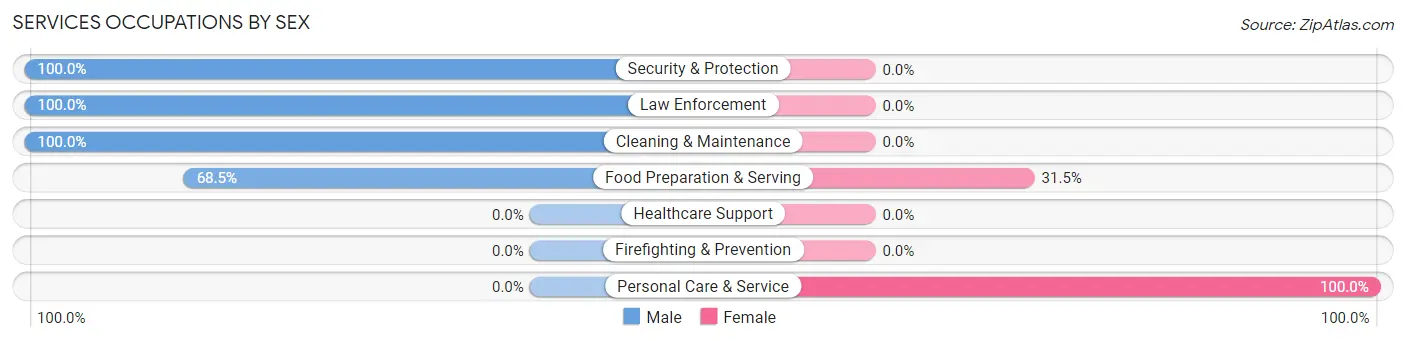
Services Occupations by Sex
Within the Services occupations in Pueblo Nuevo, the most male-oriented occupations are Security & Protection (100.0%), Law Enforcement (100.0%), and Cleaning & Maintenance (100.0%), while the most female-oriented occupations are Personal Care & Service (100.0%), and Food Preparation & Serving (31.5%).
| Occupation | Male | Female |
| Healthcare Support | 0 (0.0%) | 0 (0.0%) |
| Security & Protection | 12 (100.0%) | 0 (0.0%) |
| Firefighting & Prevention | 0 (0.0%) | 0 (0.0%) |
| Law Enforcement | 12 (100.0%) | 0 (0.0%) |
| Food Preparation & Serving | 50 (68.5%) | 23 (31.5%) |
| Cleaning & Maintenance | 14 (100.0%) | 0 (0.0%) |
| Personal Care & Service | 0 (0.0%) | 30 (100.0%) |
| Total (Category) | 76 (58.9%) | 53 (41.1%) |
| Total (Overall) | 137 (55.5%) | 110 (44.5%) |
Sales and Office Occupations
The most common Sales and Office occupations in Pueblo Nuevo are , and Sales & Related (16 | 6.5%).

Sales and Office Occupations by Sex

| Occupation | Male | Female |
| Sales & Related | 0 (0.0%) | 16 (100.0%) |
| Office & Administration | 0 (0.0%) | 0 (0.0%) |
| Total (Category) | 0 (0.0%) | 16 (100.0%) |
| Total (Overall) | 137 (55.5%) | 110 (44.5%) |
Natural Resources, Construction and Maintenance Occupations
The most common Natural Resources, Construction and Maintenance occupations in Pueblo Nuevo are Installation, Maintenance & Repair (26 | 10.5%), and Construction & Extraction (9 | 3.6%).
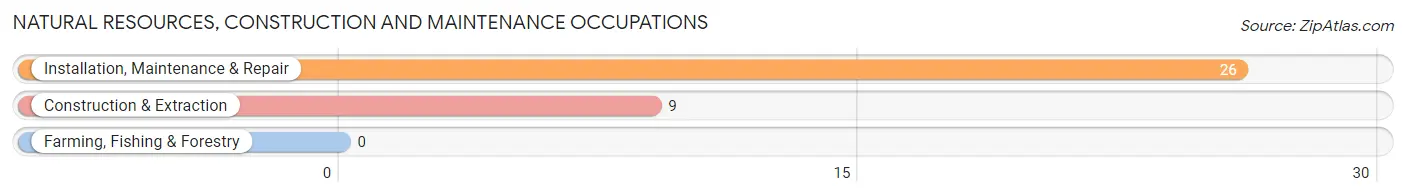
Natural Resources, Construction and Maintenance Occupations by Sex

| Occupation | Male | Female |
| Farming, Fishing & Forestry | 0 (0.0%) | 0 (0.0%) |
| Construction & Extraction | 9 (100.0%) | 0 (0.0%) |
| Installation, Maintenance & Repair | 26 (100.0%) | 0 (0.0%) |
| Total (Category) | 35 (100.0%) | 0 (0.0%) |
| Total (Overall) | 137 (55.5%) | 110 (44.5%) |
Production, Transportation and Moving Occupations
The most common Production, Transportation and Moving occupations in Pueblo Nuevo are Production (28 | 11.3%), and Transportation (7 | 2.8%).
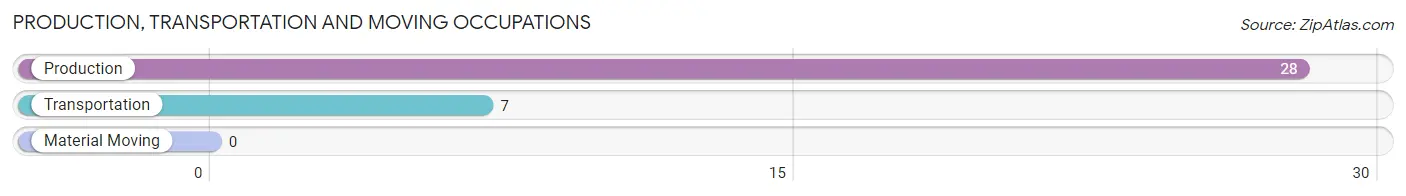
Production, Transportation and Moving Occupations by Sex
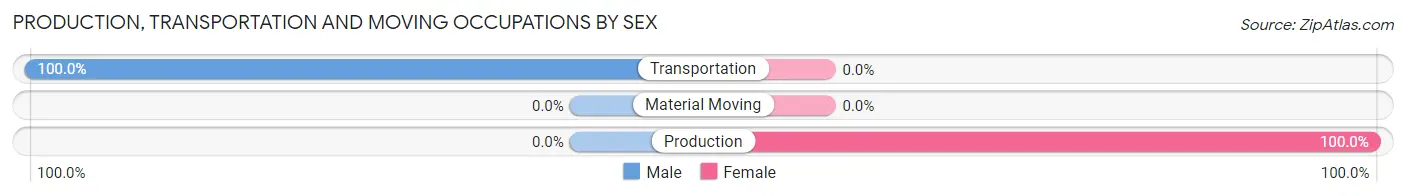
| Occupation | Male | Female |
| Production | 0 (0.0%) | 28 (100.0%) |
| Transportation | 7 (100.0%) | 0 (0.0%) |
| Material Moving | 0 (0.0%) | 0 (0.0%) |
| Total (Category) | 7 (20.0%) | 28 (80.0%) |
| Total (Overall) | 137 (55.5%) | 110 (44.5%) |
Employment Industries by Sex in Pueblo Nuevo
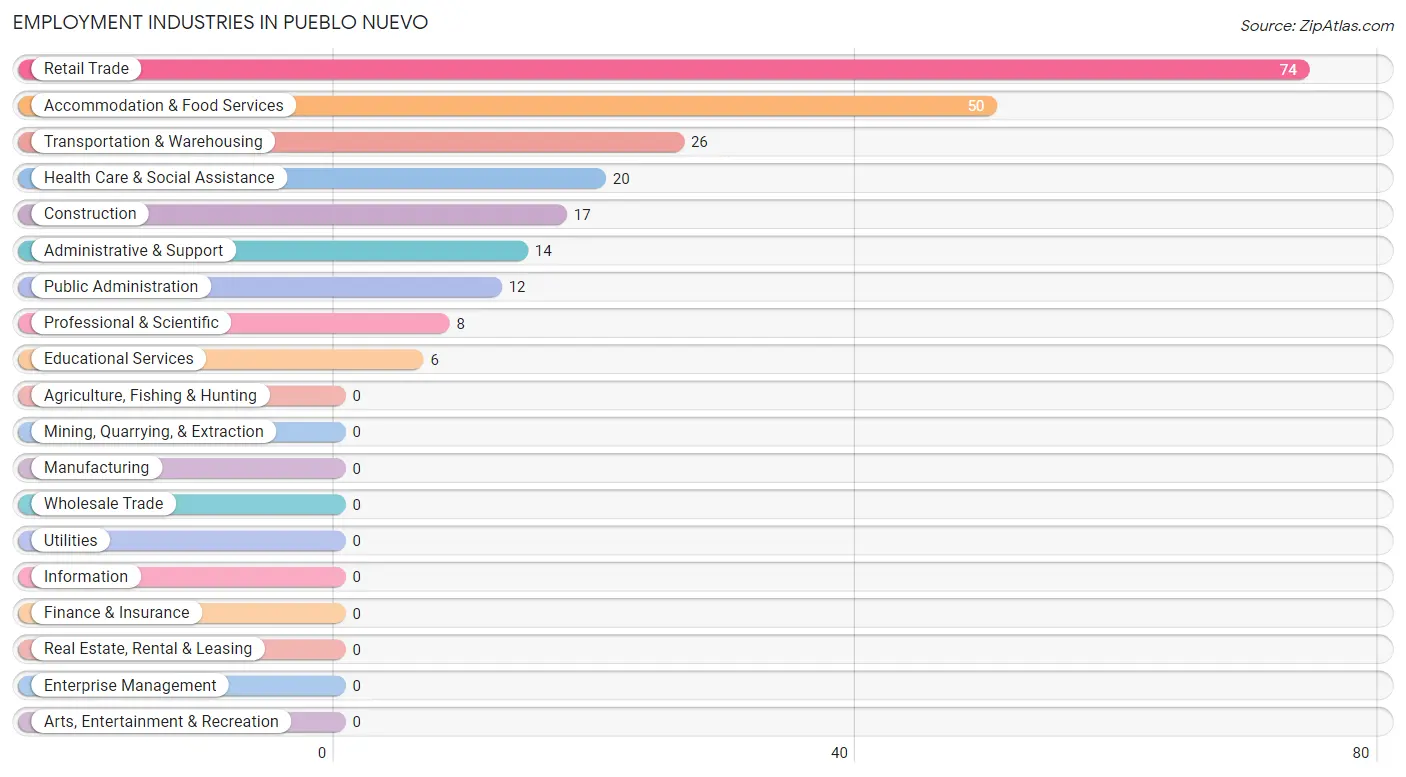
Employment Industries in Pueblo Nuevo
The major employment industries in Pueblo Nuevo include Retail Trade (74 | 30.0%), Accommodation & Food Services (50 | 20.2%), Transportation & Warehousing (26 | 10.5%), Health Care & Social Assistance (20 | 8.1%), and Construction (17 | 6.9%).
Employment Industries by Sex in Pueblo Nuevo
The Pueblo Nuevo industries that see more men than women are Construction (100.0%), Transportation & Warehousing (100.0%), and Professional & Scientific (100.0%), whereas the industries that tend to have a higher number of women are Educational Services (100.0%), Retail Trade (90.5%), and Health Care & Social Assistance (85.0%).
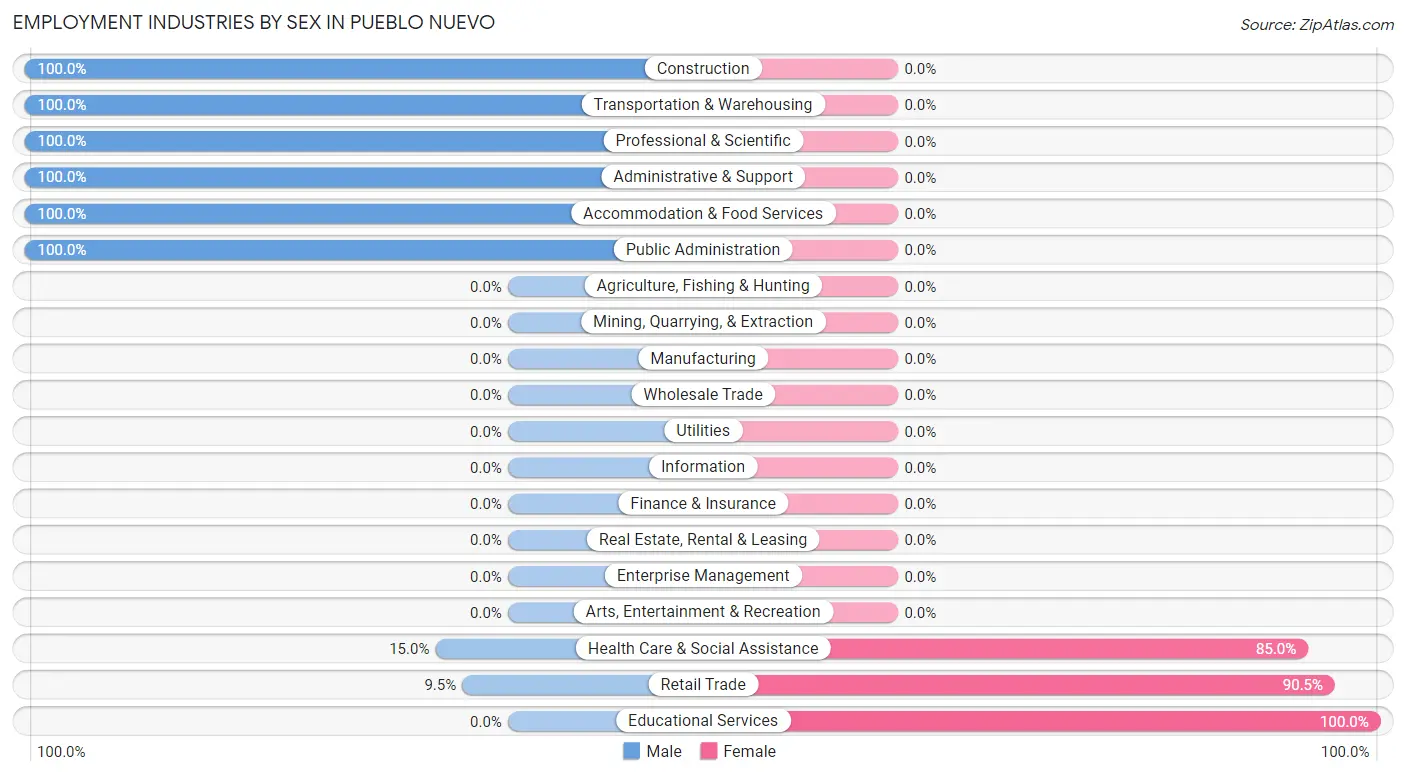
| Industry | Male | Female |
| Agriculture, Fishing & Hunting | 0 (0.0%) | 0 (0.0%) |
| Mining, Quarrying, & Extraction | 0 (0.0%) | 0 (0.0%) |
| Construction | 17 (100.0%) | 0 (0.0%) |
| Manufacturing | 0 (0.0%) | 0 (0.0%) |
| Wholesale Trade | 0 (0.0%) | 0 (0.0%) |
| Retail Trade | 7 (9.5%) | 67 (90.5%) |
| Transportation & Warehousing | 26 (100.0%) | 0 (0.0%) |
| Utilities | 0 (0.0%) | 0 (0.0%) |
| Information | 0 (0.0%) | 0 (0.0%) |
| Finance & Insurance | 0 (0.0%) | 0 (0.0%) |
| Real Estate, Rental & Leasing | 0 (0.0%) | 0 (0.0%) |
| Professional & Scientific | 8 (100.0%) | 0 (0.0%) |
| Enterprise Management | 0 (0.0%) | 0 (0.0%) |
| Administrative & Support | 14 (100.0%) | 0 (0.0%) |
| Educational Services | 0 (0.0%) | 6 (100.0%) |
| Health Care & Social Assistance | 3 (15.0%) | 17 (85.0%) |
| Arts, Entertainment & Recreation | 0 (0.0%) | 0 (0.0%) |
| Accommodation & Food Services | 50 (100.0%) | 0 (0.0%) |
| Public Administration | 12 (100.0%) | 0 (0.0%) |
| Total | 137 (55.5%) | 110 (44.5%) |
Education in Pueblo Nuevo
School Enrollment in Pueblo Nuevo
The most common levels of schooling among the 232 students in Pueblo Nuevo are high school (112 | 48.3%), middle school (68 | 29.3%), and college / undergraduate (26 | 11.2%).
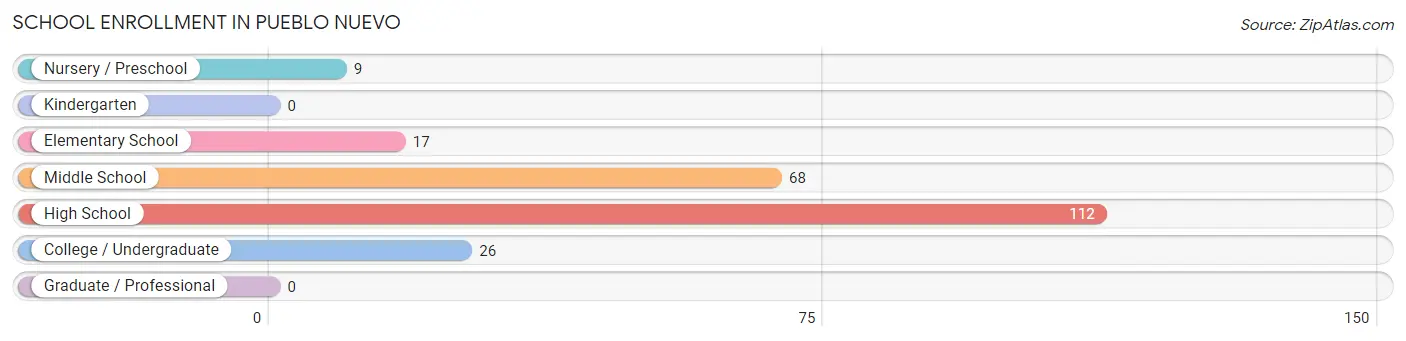
| School Level | # Students | % Students |
| Nursery / Preschool | 9 | 3.9% |
| Kindergarten | 0 | 0.0% |
| Elementary School | 17 | 7.3% |
| Middle School | 68 | 29.3% |
| High School | 112 | 48.3% |
| College / Undergraduate | 26 | 11.2% |
| Graduate / Professional | 0 | 0.0% |
| Total | 232 | 100.0% |
School Enrollment by Age by Funding Source in Pueblo Nuevo
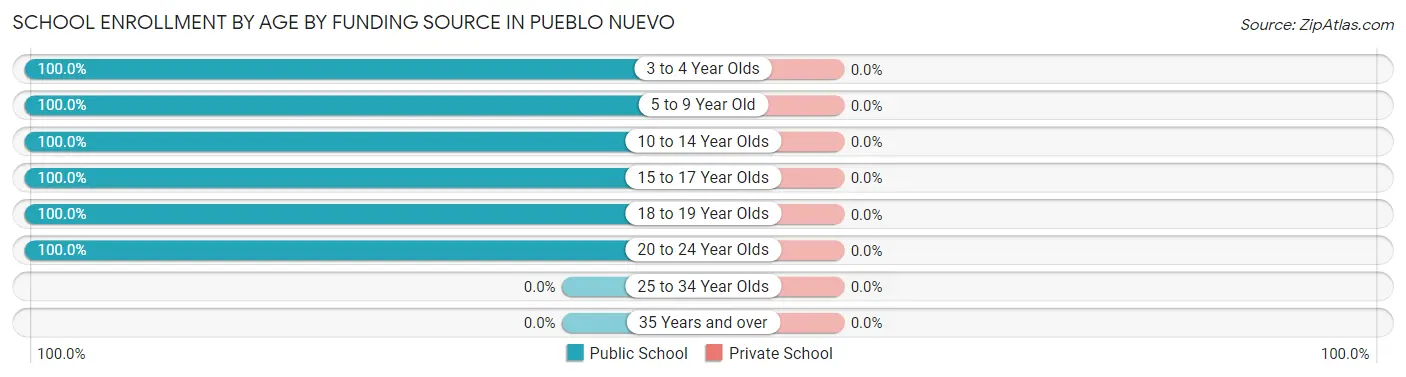
| Age Bracket | Public School | Private School |
| 3 to 4 Year Olds | 9 (100.0%) | 0 (0.0%) |
| 5 to 9 Year Old | 17 (100.0%) | 0 (0.0%) |
| 10 to 14 Year Olds | 68 (100.0%) | 0 (0.0%) |
| 15 to 17 Year Olds | 84 (100.0%) | 0 (0.0%) |
| 18 to 19 Year Olds | 28 (100.0%) | 0 (0.0%) |
| 20 to 24 Year Olds | 26 (100.0%) | 0 (0.0%) |
| 25 to 34 Year Olds | 0 (0.0%) | 0 (0.0%) |
| 35 Years and over | 0 (0.0%) | 0 (0.0%) |
| Total | 232 (100.0%) | 0 (0.0%) |
Educational Attainment by Field of Study in Pueblo Nuevo
Business (20 | 57.1%), social sciences (8 | 22.9%), and science & technology (7 | 20.0%) are the most common fields of study among 35 individuals in Pueblo Nuevo who have obtained a bachelor's degree or higher.
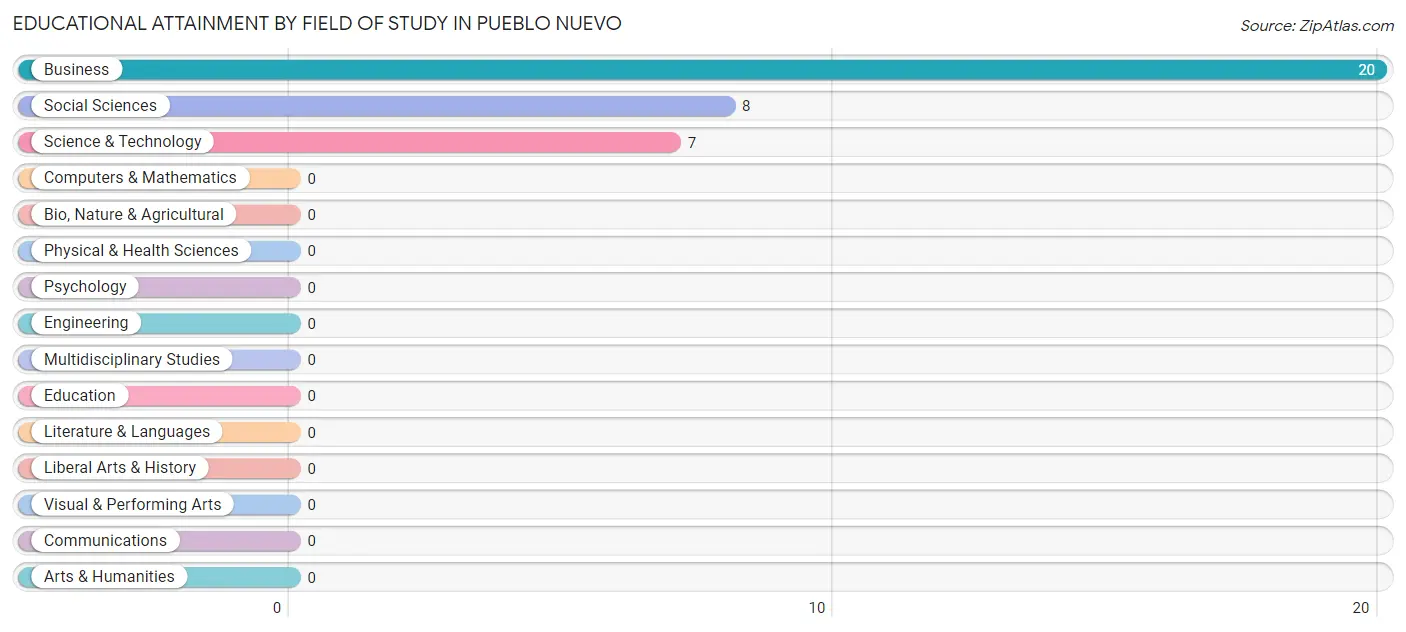
| Field of Study | # Graduates | % Graduates |
| Computers & Mathematics | 0 | 0.0% |
| Bio, Nature & Agricultural | 0 | 0.0% |
| Physical & Health Sciences | 0 | 0.0% |
| Psychology | 0 | 0.0% |
| Social Sciences | 8 | 22.9% |
| Engineering | 0 | 0.0% |
| Multidisciplinary Studies | 0 | 0.0% |
| Science & Technology | 7 | 20.0% |
| Business | 20 | 57.1% |
| Education | 0 | 0.0% |
| Literature & Languages | 0 | 0.0% |
| Liberal Arts & History | 0 | 0.0% |
| Visual & Performing Arts | 0 | 0.0% |
| Communications | 0 | 0.0% |
| Arts & Humanities | 0 | 0.0% |
| Total | 35 | 100.0% |
Transportation & Commute in Pueblo Nuevo
Vehicle Availability by Sex in Pueblo Nuevo
The most prevalent vehicle ownership categories in Pueblo Nuevo are males with 2 vehicles (60, accounting for 43.8%) and females with 2 vehicles (74, making up 56.1%).
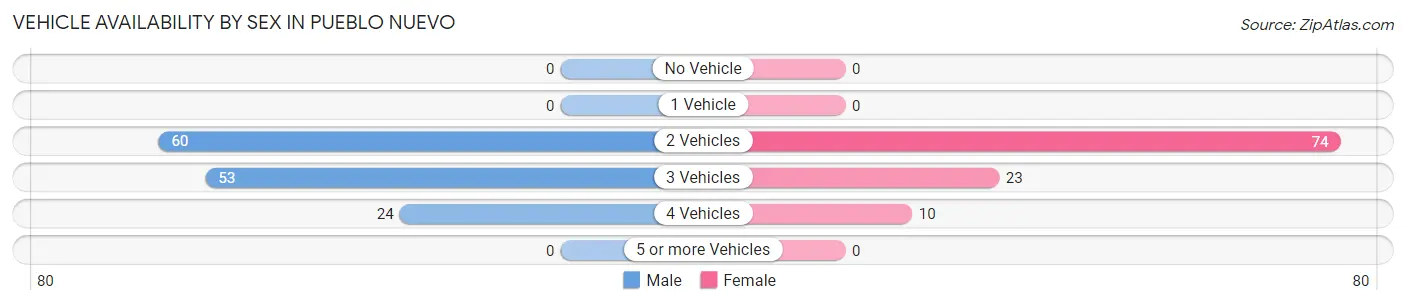
| Vehicles Available | Male | Female |
| No Vehicle | 0 (0.0%) | 0 (0.0%) |
| 1 Vehicle | 0 (0.0%) | 0 (0.0%) |
| 2 Vehicles | 60 (43.8%) | 74 (69.2%) |
| 3 Vehicles | 53 (38.7%) | 23 (21.5%) |
| 4 Vehicles | 24 (17.5%) | 10 (9.3%) |
| 5 or more Vehicles | 0 (0.0%) | 0 (0.0%) |
| Total | 137 (100.0%) | 107 (100.0%) |
Commute Time in Pueblo Nuevo
The most frequently occuring commute durations in Pueblo Nuevo are 30 to 34 minutes (118 commuters, 47.8%), 45 to 59 minutes (34 commuters, 13.8%), and 5 to 9 minutes (27 commuters, 10.9%).
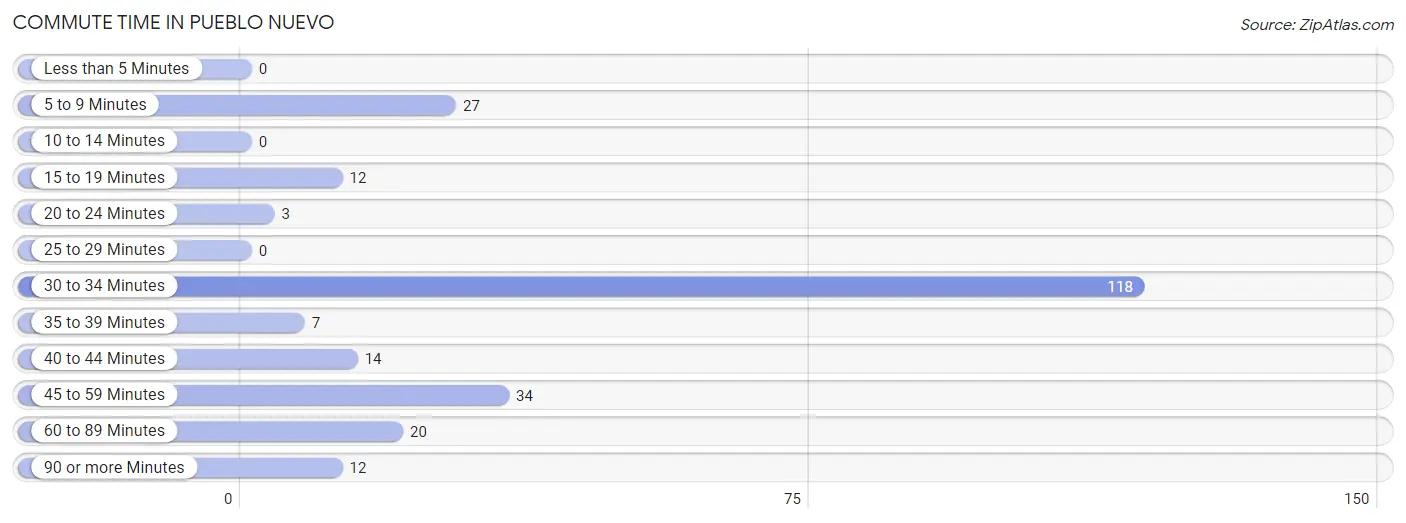
| Commute Time | # Commuters | % Commuters |
| Less than 5 Minutes | 0 | 0.0% |
| 5 to 9 Minutes | 27 | 10.9% |
| 10 to 14 Minutes | 0 | 0.0% |
| 15 to 19 Minutes | 12 | 4.9% |
| 20 to 24 Minutes | 3 | 1.2% |
| 25 to 29 Minutes | 0 | 0.0% |
| 30 to 34 Minutes | 118 | 47.8% |
| 35 to 39 Minutes | 7 | 2.8% |
| 40 to 44 Minutes | 14 | 5.7% |
| 45 to 59 Minutes | 34 | 13.8% |
| 60 to 89 Minutes | 20 | 8.1% |
| 90 or more Minutes | 12 | 4.9% |
Commute Time by Sex in Pueblo Nuevo
The most common commute times in Pueblo Nuevo are 30 to 34 minutes (41 commuters, 29.9%) for males and 30 to 34 minutes (77 commuters, 70.0%) for females.
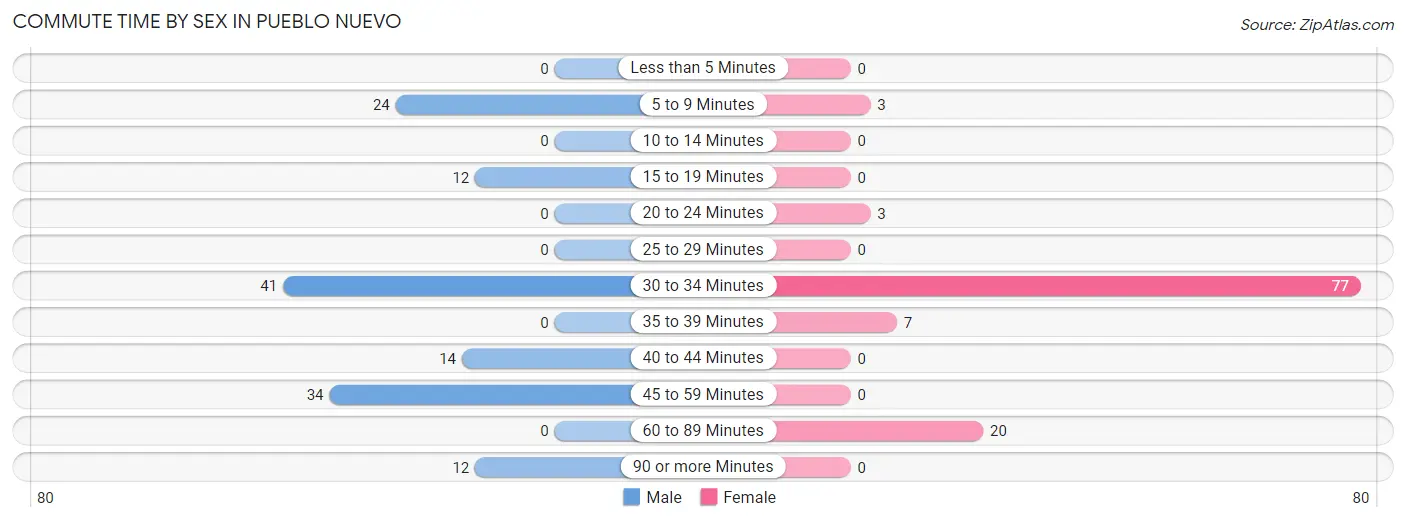
| Commute Time | Male | Female |
| Less than 5 Minutes | 0 (0.0%) | 0 (0.0%) |
| 5 to 9 Minutes | 24 (17.5%) | 3 (2.7%) |
| 10 to 14 Minutes | 0 (0.0%) | 0 (0.0%) |
| 15 to 19 Minutes | 12 (8.8%) | 0 (0.0%) |
| 20 to 24 Minutes | 0 (0.0%) | 3 (2.7%) |
| 25 to 29 Minutes | 0 (0.0%) | 0 (0.0%) |
| 30 to 34 Minutes | 41 (29.9%) | 77 (70.0%) |
| 35 to 39 Minutes | 0 (0.0%) | 7 (6.4%) |
| 40 to 44 Minutes | 14 (10.2%) | 0 (0.0%) |
| 45 to 59 Minutes | 34 (24.8%) | 0 (0.0%) |
| 60 to 89 Minutes | 0 (0.0%) | 20 (18.2%) |
| 90 or more Minutes | 12 (8.8%) | 0 (0.0%) |
Time of Departure to Work by Sex in Pueblo Nuevo
The most frequent times of departure to work in Pueblo Nuevo are 6:30 AM to 6:59 AM (36, 26.3%) for males and 9:00 AM to 9:59 AM (51, 46.4%) for females.
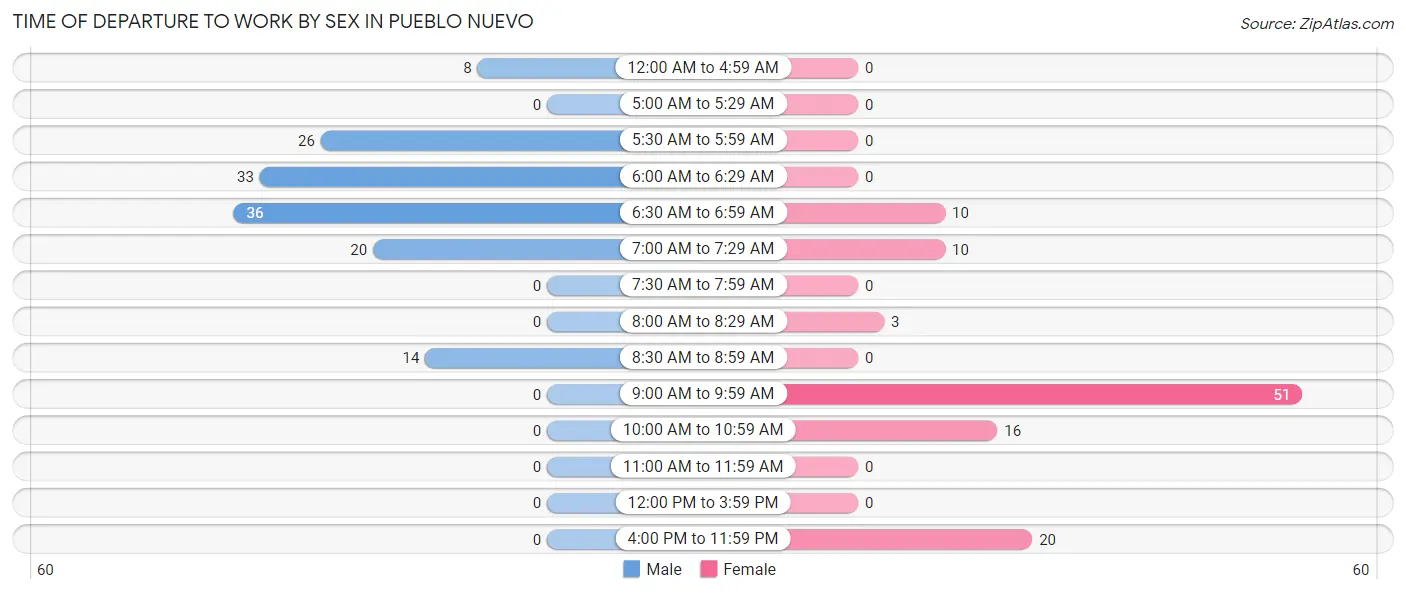
| Time of Departure | Male | Female |
| 12:00 AM to 4:59 AM | 8 (5.8%) | 0 (0.0%) |
| 5:00 AM to 5:29 AM | 0 (0.0%) | 0 (0.0%) |
| 5:30 AM to 5:59 AM | 26 (19.0%) | 0 (0.0%) |
| 6:00 AM to 6:29 AM | 33 (24.1%) | 0 (0.0%) |
| 6:30 AM to 6:59 AM | 36 (26.3%) | 10 (9.1%) |
| 7:00 AM to 7:29 AM | 20 (14.6%) | 10 (9.1%) |
| 7:30 AM to 7:59 AM | 0 (0.0%) | 0 (0.0%) |
| 8:00 AM to 8:29 AM | 0 (0.0%) | 3 (2.7%) |
| 8:30 AM to 8:59 AM | 14 (10.2%) | 0 (0.0%) |
| 9:00 AM to 9:59 AM | 0 (0.0%) | 51 (46.4%) |
| 10:00 AM to 10:59 AM | 0 (0.0%) | 16 (14.5%) |
| 11:00 AM to 11:59 AM | 0 (0.0%) | 0 (0.0%) |
| 12:00 PM to 3:59 PM | 0 (0.0%) | 0 (0.0%) |
| 4:00 PM to 11:59 PM | 0 (0.0%) | 20 (18.2%) |
| Total | 137 (100.0%) | 110 (100.0%) |
Housing Occupancy in Pueblo Nuevo
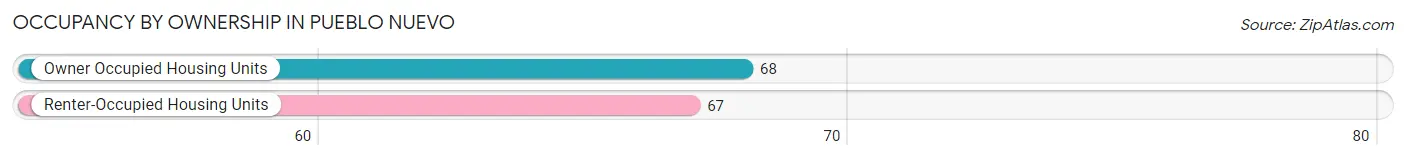
Occupancy by Ownership in Pueblo Nuevo
Of the total 135 dwellings in Pueblo Nuevo, owner-occupied units account for 68 (50.4%), while renter-occupied units make up 67 (49.6%).
| Occupancy | # Housing Units | % Housing Units |
| Owner Occupied Housing Units | 68 | 50.4% |
| Renter-Occupied Housing Units | 67 | 49.6% |
| Total Occupied Housing Units | 135 | 100.0% |
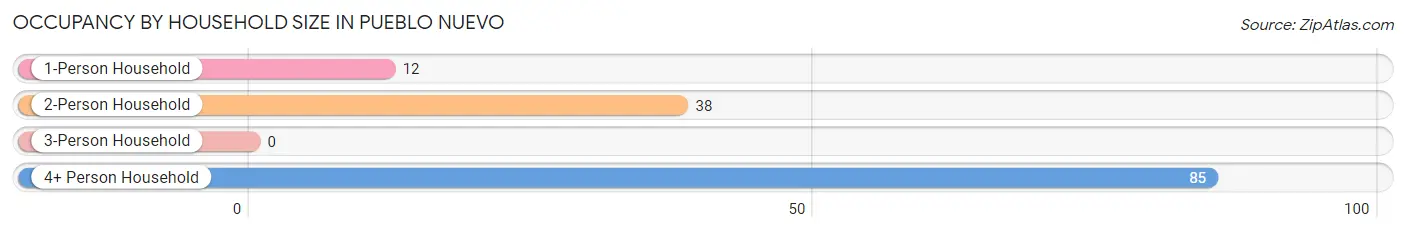
Occupancy by Household Size in Pueblo Nuevo
| Household Size | # Housing Units | % Housing Units |
| 1-Person Household | 12 | 8.9% |
| 2-Person Household | 38 | 28.1% |
| 3-Person Household | 0 | 0.0% |
| 4+ Person Household | 85 | 63.0% |
| Total Housing Units | 135 | 100.0% |
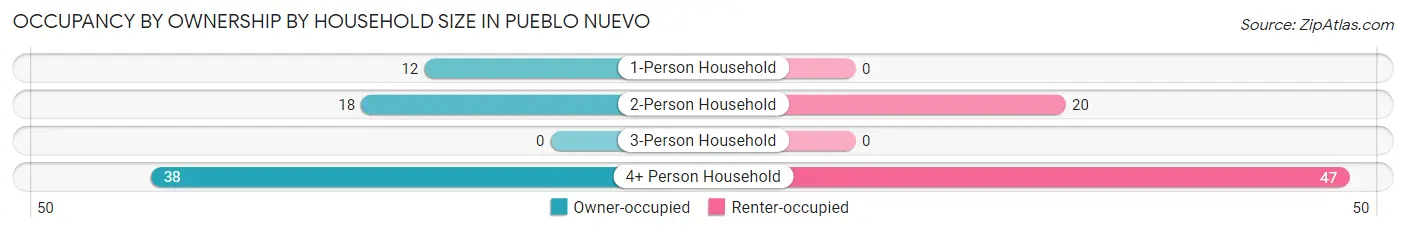
Occupancy by Ownership by Household Size in Pueblo Nuevo
| Household Size | Owner-occupied | Renter-occupied |
| 1-Person Household | 12 (100.0%) | 0 (0.0%) |
| 2-Person Household | 18 (47.4%) | 20 (52.6%) |
| 3-Person Household | 0 (0.0%) | 0 (0.0%) |
| 4+ Person Household | 38 (44.7%) | 47 (55.3%) |
| Total Housing Units | 68 (50.4%) | 67 (49.6%) |
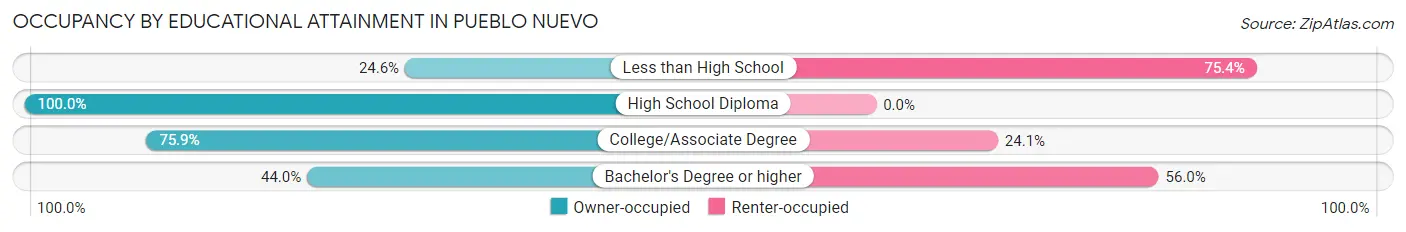
Occupancy by Educational Attainment in Pueblo Nuevo
| Household Size | Owner-occupied | Renter-occupied |
| Less than High School | 15 (24.6%) | 46 (75.4%) |
| High School Diploma | 20 (100.0%) | 0 (0.0%) |
| College/Associate Degree | 22 (75.9%) | 7 (24.1%) |
| Bachelor's Degree or higher | 11 (44.0%) | 14 (56.0%) |
Occupancy by Age of Householder in Pueblo Nuevo
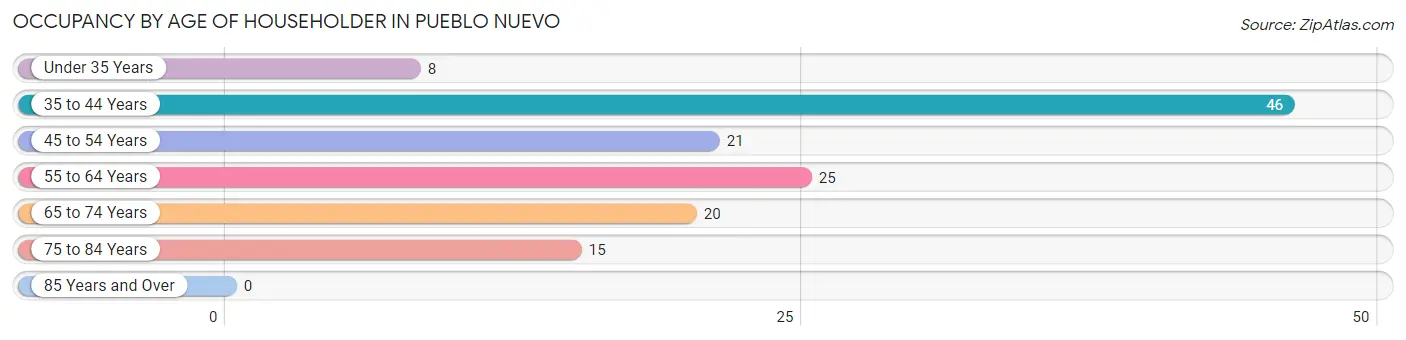
| Age Bracket | # Households | % Households |
| Under 35 Years | 8 | 5.9% |
| 35 to 44 Years | 46 | 34.1% |
| 45 to 54 Years | 21 | 15.6% |
| 55 to 64 Years | 25 | 18.5% |
| 65 to 74 Years | 20 | 14.8% |
| 75 to 84 Years | 15 | 11.1% |
| 85 Years and Over | 0 | 0.0% |
| Total | 135 | 100.0% |
Housing Finances in Pueblo Nuevo
Median Income by Occupancy in Pueblo Nuevo
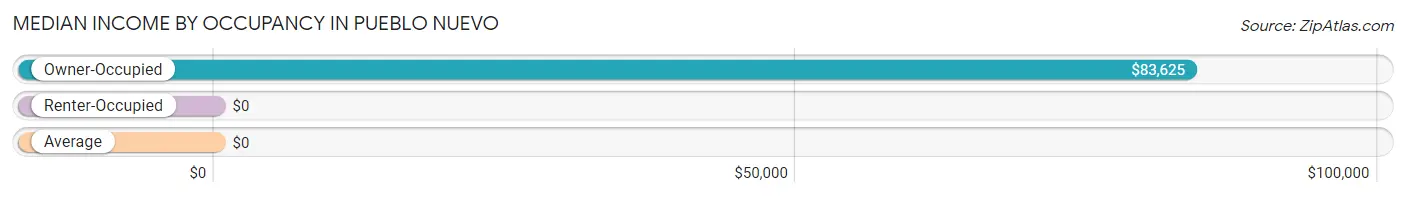
| Occupancy Type | # Households | Median Income |
| Owner-Occupied | 68 (50.4%) | $83,625 |
| Renter-Occupied | 67 (49.6%) | $0 |
| Average | 135 (100.0%) | $0 |
Occupancy by Householder Income Bracket in Pueblo Nuevo
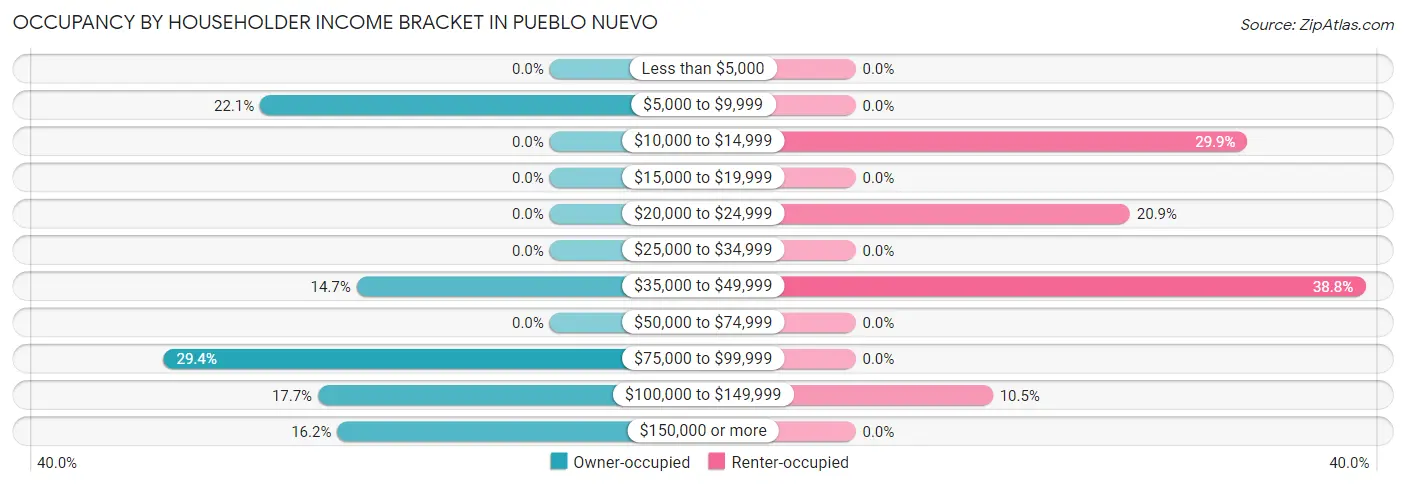
| Income Bracket | Owner-occupied | Renter-occupied |
| Less than $5,000 | 0 (0.0%) | 0 (0.0%) |
| $5,000 to $9,999 | 15 (22.1%) | 0 (0.0%) |
| $10,000 to $14,999 | 0 (0.0%) | 20 (29.8%) |
| $15,000 to $19,999 | 0 (0.0%) | 0 (0.0%) |
| $20,000 to $24,999 | 0 (0.0%) | 14 (20.9%) |
| $25,000 to $34,999 | 0 (0.0%) | 0 (0.0%) |
| $35,000 to $49,999 | 10 (14.7%) | 26 (38.8%) |
| $50,000 to $74,999 | 0 (0.0%) | 0 (0.0%) |
| $75,000 to $99,999 | 20 (29.4%) | 0 (0.0%) |
| $100,000 to $149,999 | 12 (17.6%) | 7 (10.4%) |
| $150,000 or more | 11 (16.2%) | 0 (0.0%) |
| Total | 68 (100.0%) | 67 (100.0%) |
Monthly Housing Cost Tiers in Pueblo Nuevo
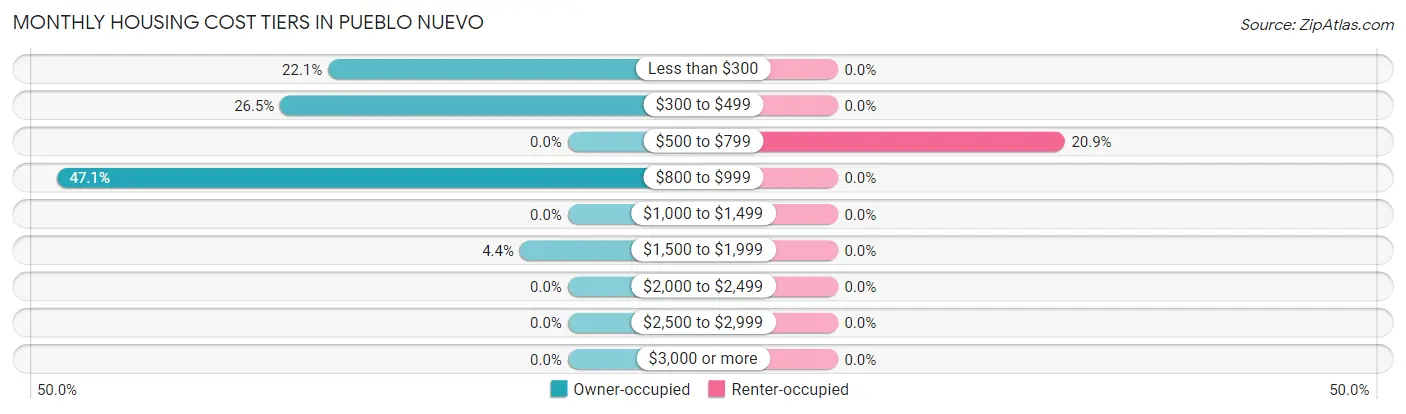
| Monthly Cost | Owner-occupied | Renter-occupied |
| Less than $300 | 15 (22.1%) | 0 (0.0%) |
| $300 to $499 | 18 (26.5%) | 0 (0.0%) |
| $500 to $799 | 0 (0.0%) | 14 (20.9%) |
| $800 to $999 | 32 (47.1%) | 0 (0.0%) |
| $1,000 to $1,499 | 0 (0.0%) | 0 (0.0%) |
| $1,500 to $1,999 | 3 (4.4%) | 0 (0.0%) |
| $2,000 to $2,499 | 0 (0.0%) | 0 (0.0%) |
| $2,500 to $2,999 | 0 (0.0%) | 0 (0.0%) |
| $3,000 or more | 0 (0.0%) | 0 (0.0%) |
| Total | 68 (100.0%) | 67 (100.0%) |
Physical Housing Characteristics in Pueblo Nuevo
Housing Structures in Pueblo Nuevo

| Structure Type | # Housing Units | % Housing Units |
| Single Unit, Detached | 73 | 54.1% |
| Single Unit, Attached | 20 | 14.8% |
| 2 Unit Apartments | 0 | 0.0% |
| 3 or 4 Unit Apartments | 0 | 0.0% |
| 5 to 9 Unit Apartments | 0 | 0.0% |
| 10 or more Apartments | 7 | 5.2% |
| Mobile Home / Other | 35 | 25.9% |
| Total | 135 | 100.0% |
Housing Structures by Occupancy in Pueblo Nuevo
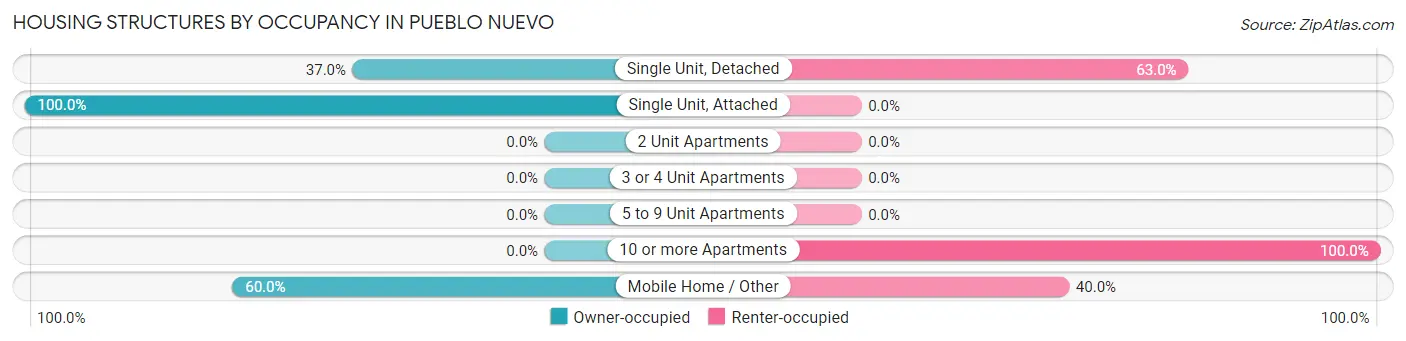
| Structure Type | Owner-occupied | Renter-occupied |
| Single Unit, Detached | 27 (37.0%) | 46 (63.0%) |
| Single Unit, Attached | 20 (100.0%) | 0 (0.0%) |
| 2 Unit Apartments | 0 (0.0%) | 0 (0.0%) |
| 3 or 4 Unit Apartments | 0 (0.0%) | 0 (0.0%) |
| 5 to 9 Unit Apartments | 0 (0.0%) | 0 (0.0%) |
| 10 or more Apartments | 0 (0.0%) | 7 (100.0%) |
| Mobile Home / Other | 21 (60.0%) | 14 (40.0%) |
| Total | 68 (50.4%) | 67 (49.6%) |
Housing Structures by Number of Rooms in Pueblo Nuevo
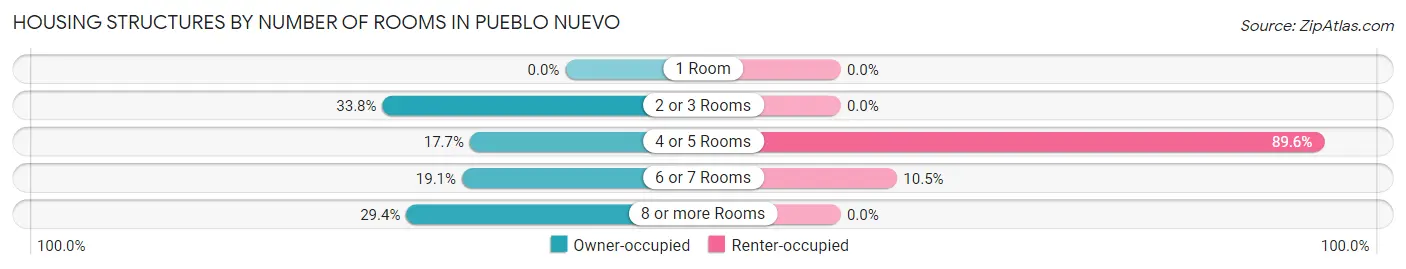
| Number of Rooms | Owner-occupied | Renter-occupied |
| 1 Room | 0 (0.0%) | 0 (0.0%) |
| 2 or 3 Rooms | 23 (33.8%) | 0 (0.0%) |
| 4 or 5 Rooms | 12 (17.6%) | 60 (89.5%) |
| 6 or 7 Rooms | 13 (19.1%) | 7 (10.4%) |
| 8 or more Rooms | 20 (29.4%) | 0 (0.0%) |
| Total | 68 (100.0%) | 67 (100.0%) |
Housing Structure by Heating Type in Pueblo Nuevo
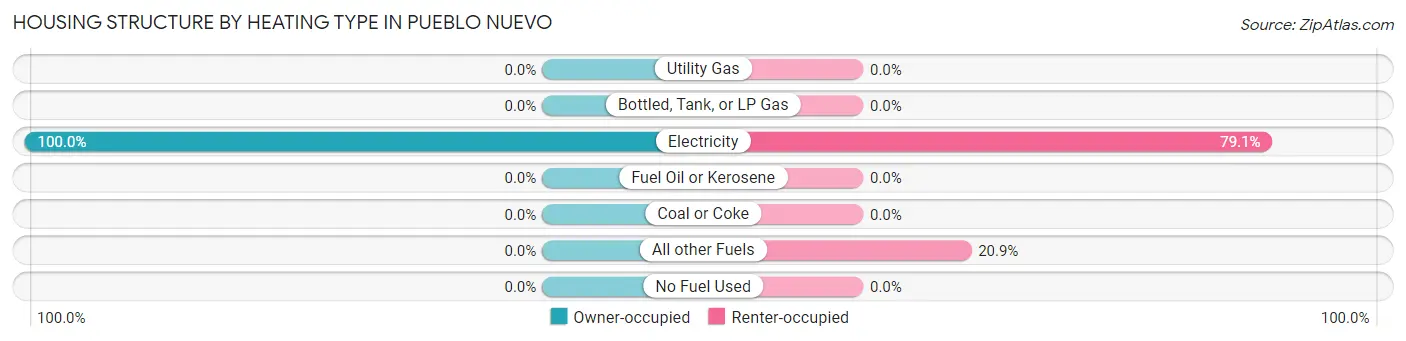
| Heating Type | Owner-occupied | Renter-occupied |
| Utility Gas | 0 (0.0%) | 0 (0.0%) |
| Bottled, Tank, or LP Gas | 0 (0.0%) | 0 (0.0%) |
| Electricity | 68 (100.0%) | 53 (79.1%) |
| Fuel Oil or Kerosene | 0 (0.0%) | 0 (0.0%) |
| Coal or Coke | 0 (0.0%) | 0 (0.0%) |
| All other Fuels | 0 (0.0%) | 14 (20.9%) |
| No Fuel Used | 0 (0.0%) | 0 (0.0%) |
| Total | 68 (100.0%) | 67 (100.0%) |
Household Vehicle Usage in Pueblo Nuevo
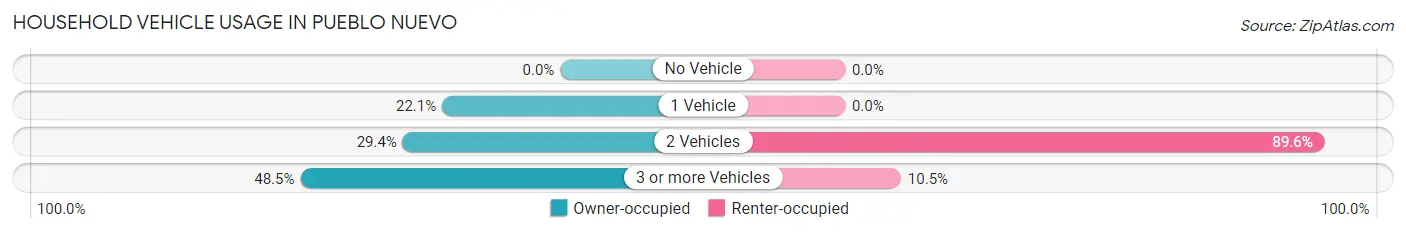
| Vehicles per Household | Owner-occupied | Renter-occupied |
| No Vehicle | 0 (0.0%) | 0 (0.0%) |
| 1 Vehicle | 15 (22.1%) | 0 (0.0%) |
| 2 Vehicles | 20 (29.4%) | 60 (89.5%) |
| 3 or more Vehicles | 33 (48.5%) | 7 (10.4%) |
| Total | 68 (100.0%) | 67 (100.0%) |
Real Estate & Mortgages in Pueblo Nuevo
Real Estate and Mortgage Overview in Pueblo Nuevo
| Characteristic | Without Mortgage | With Mortgage |
| Housing Units | 33 | 35 |
| Median Property Value | - | - |
| Median Household Income | - | - |
| Monthly Housing Costs | $308 | $0 |
| Real Estate Taxes | $630 | $0 |
Property Value by Mortgage Status in Pueblo Nuevo
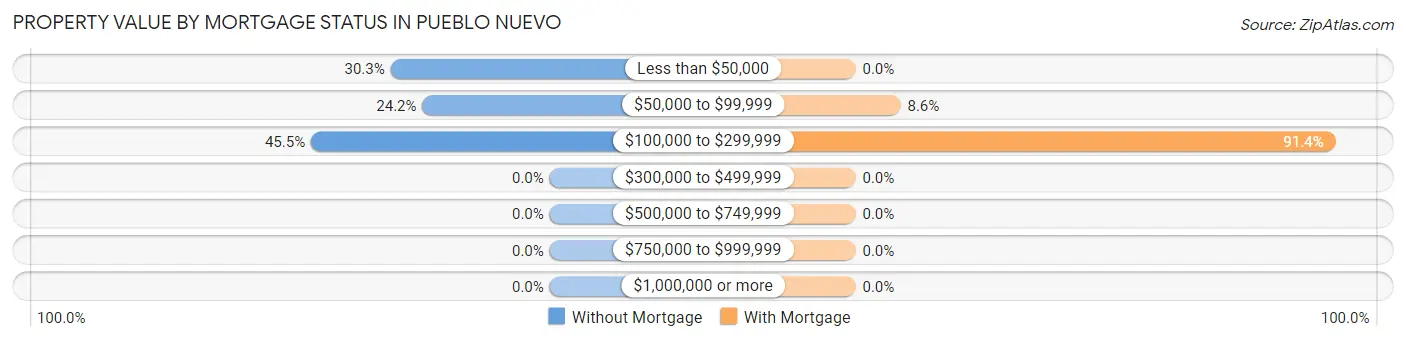
| Property Value | Without Mortgage | With Mortgage |
| Less than $50,000 | 10 (30.3%) | 0 (0.0%) |
| $50,000 to $99,999 | 8 (24.2%) | 3 (8.6%) |
| $100,000 to $299,999 | 15 (45.5%) | 32 (91.4%) |
| $300,000 to $499,999 | 0 (0.0%) | 0 (0.0%) |
| $500,000 to $749,999 | 0 (0.0%) | 0 (0.0%) |
| $750,000 to $999,999 | 0 (0.0%) | 0 (0.0%) |
| $1,000,000 or more | 0 (0.0%) | 0 (0.0%) |
| Total | 33 (100.0%) | 35 (100.0%) |
Household Income by Mortgage Status in Pueblo Nuevo
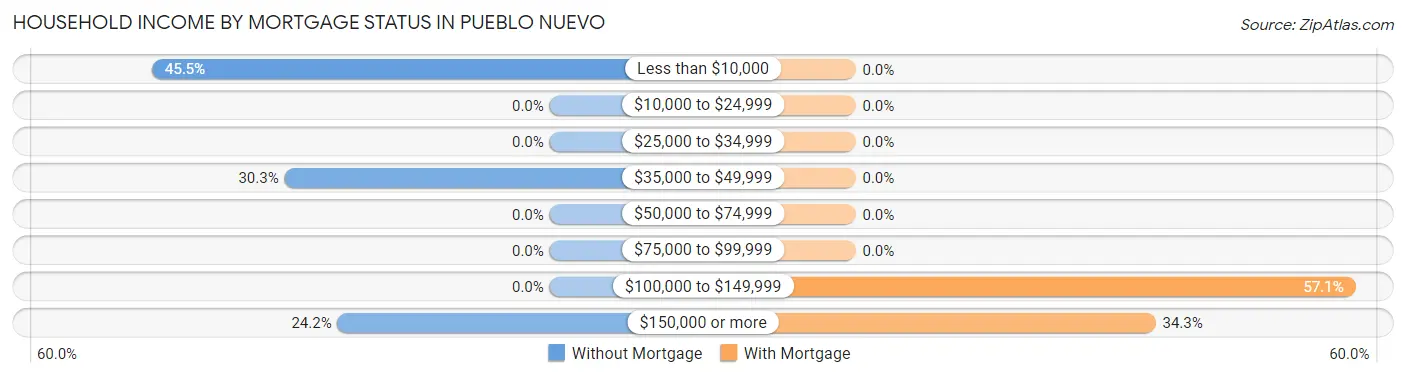
| Household Income | Without Mortgage | With Mortgage |
| Less than $10,000 | 15 (45.5%) | 0 (0.0%) |
| $10,000 to $24,999 | 0 (0.0%) | 0 (0.0%) |
| $25,000 to $34,999 | 0 (0.0%) | 0 (0.0%) |
| $35,000 to $49,999 | 10 (30.3%) | 0 (0.0%) |
| $50,000 to $74,999 | 0 (0.0%) | 0 (0.0%) |
| $75,000 to $99,999 | 0 (0.0%) | 0 (0.0%) |
| $100,000 to $149,999 | 0 (0.0%) | 20 (57.1%) |
| $150,000 or more | 8 (24.2%) | 12 (34.3%) |
| Total | 33 (100.0%) | 35 (100.0%) |
Property Value to Household Income Ratio in Pueblo Nuevo
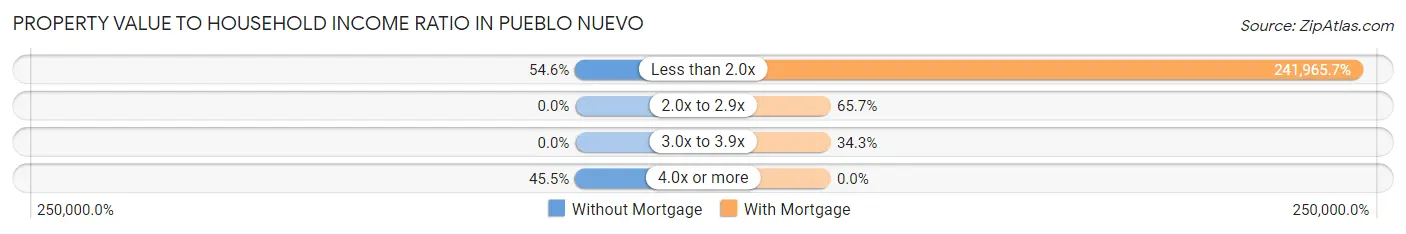
| Value-to-Income Ratio | Without Mortgage | With Mortgage |
| Less than 2.0x | 18 (54.5%) | 84,688 (241,965.7%) |
| 2.0x to 2.9x | 0 (0.0%) | 23 (65.7%) |
| 3.0x to 3.9x | 0 (0.0%) | 12 (34.3%) |
| 4.0x or more | 15 (45.5%) | 0 (0.0%) |
| Total | 33 (100.0%) | 35 (100.0%) |
Real Estate Taxes by Mortgage Status in Pueblo Nuevo
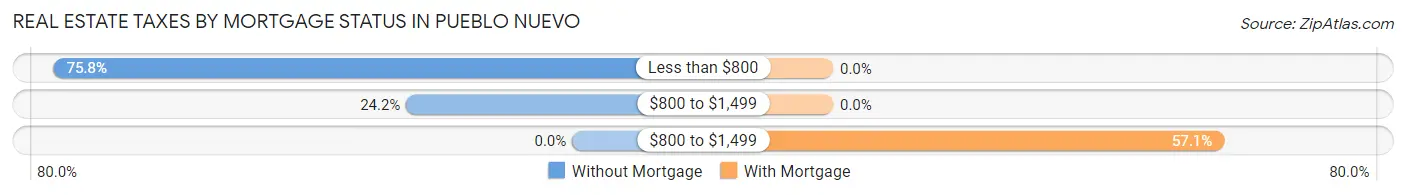
| Property Taxes | Without Mortgage | With Mortgage |
| Less than $800 | 25 (75.8%) | 0 (0.0%) |
| $800 to $1,499 | 8 (24.2%) | 0 (0.0%) |
| $800 to $1,499 | 0 (0.0%) | 20 (57.1%) |
| Total | 33 (100.0%) | 35 (100.0%) |
Health & Disability in Pueblo Nuevo
Health Insurance Coverage by Age in Pueblo Nuevo
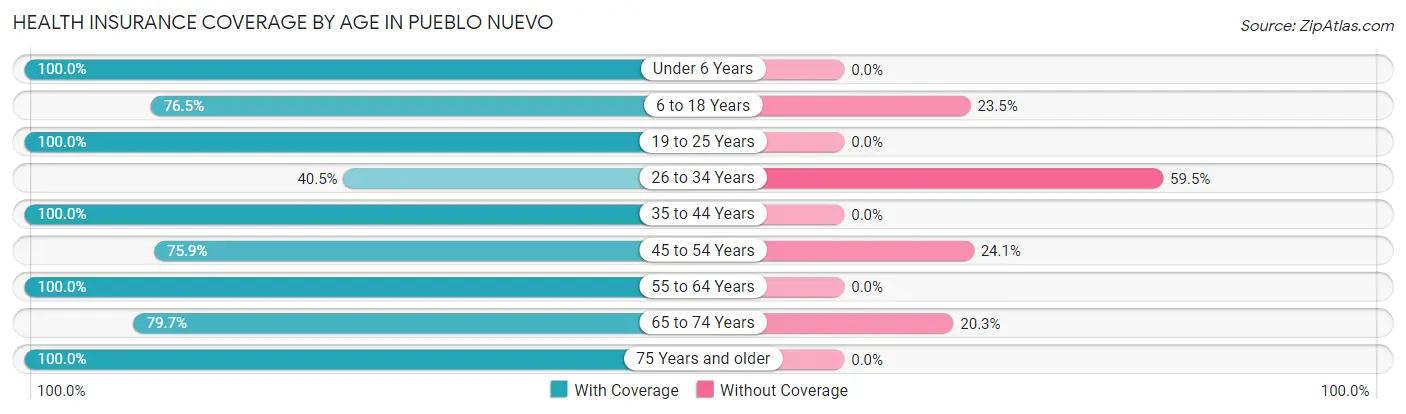
| Age Bracket | With Coverage | Without Coverage |
| Under 6 Years | 24 (100.0%) | 0 (0.0%) |
| 6 to 18 Years | 156 (76.5%) | 48 (23.5%) |
| 19 to 25 Years | 42 (100.0%) | 0 (0.0%) |
| 26 to 34 Years | 15 (40.5%) | 22 (59.5%) |
| 35 to 44 Years | 107 (100.0%) | 0 (0.0%) |
| 45 to 54 Years | 22 (75.9%) | 7 (24.1%) |
| 55 to 64 Years | 25 (100.0%) | 0 (0.0%) |
| 65 to 74 Years | 47 (79.7%) | 12 (20.3%) |
| 75 Years and older | 42 (100.0%) | 0 (0.0%) |
| Total | 480 (84.4%) | 89 (15.6%) |
Health Insurance Coverage by Citizenship Status in Pueblo Nuevo

| Citizenship Status | With Coverage | Without Coverage |
| Native Born | 24 (100.0%) | 0 (0.0%) |
| Foreign Born, Citizen | 156 (76.5%) | 48 (23.5%) |
| Foreign Born, not a Citizen | 42 (100.0%) | 0 (0.0%) |
Health Insurance Coverage by Household Income in Pueblo Nuevo
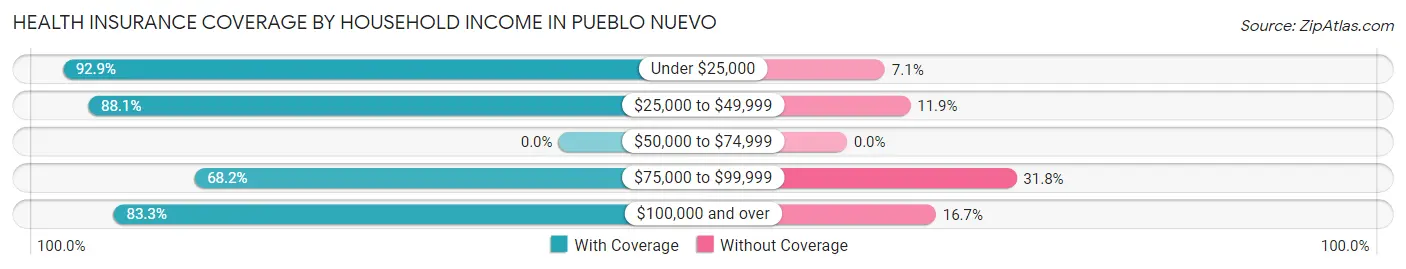
| Household Income | With Coverage | Without Coverage |
| Under $25,000 | 156 (92.9%) | 12 (7.1%) |
| $25,000 to $49,999 | 163 (88.1%) | 22 (11.9%) |
| $50,000 to $74,999 | 0 (0.0%) | 0 (0.0%) |
| $75,000 to $99,999 | 88 (68.2%) | 41 (31.8%) |
| $100,000 and over | 70 (83.3%) | 14 (16.7%) |
Public vs Private Health Insurance Coverage by Age in Pueblo Nuevo
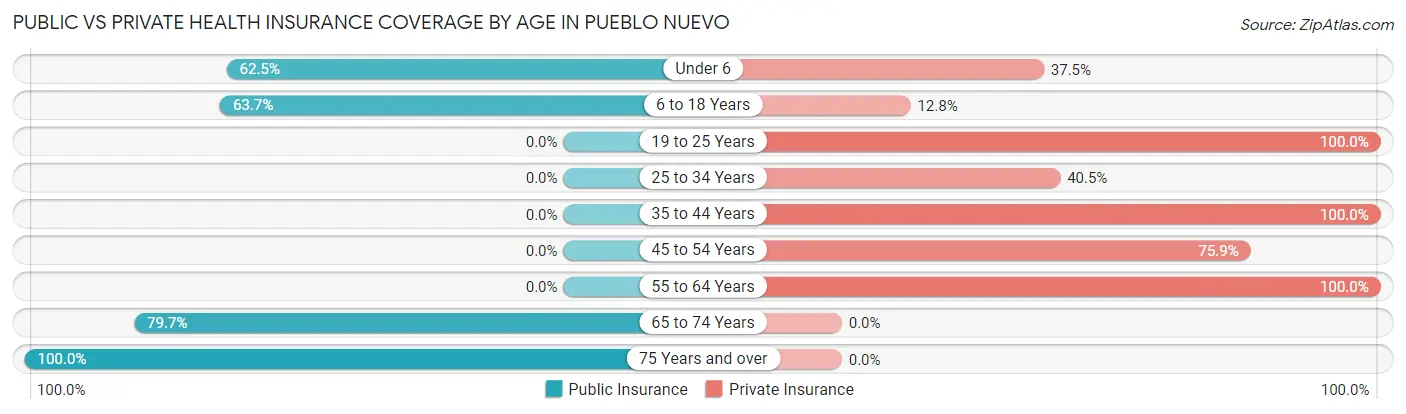
| Age Bracket | Public Insurance | Private Insurance |
| Under 6 | 15 (62.5%) | 9 (37.5%) |
| 6 to 18 Years | 130 (63.7%) | 26 (12.8%) |
| 19 to 25 Years | 0 (0.0%) | 42 (100.0%) |
| 25 to 34 Years | 0 (0.0%) | 15 (40.5%) |
| 35 to 44 Years | 0 (0.0%) | 107 (100.0%) |
| 45 to 54 Years | 0 (0.0%) | 22 (75.9%) |
| 55 to 64 Years | 0 (0.0%) | 25 (100.0%) |
| 65 to 74 Years | 47 (79.7%) | 0 (0.0%) |
| 75 Years and over | 42 (100.0%) | 0 (0.0%) |
| Total | 234 (41.1%) | 246 (43.2%) |
Disability Status by Sex by Age in Pueblo Nuevo
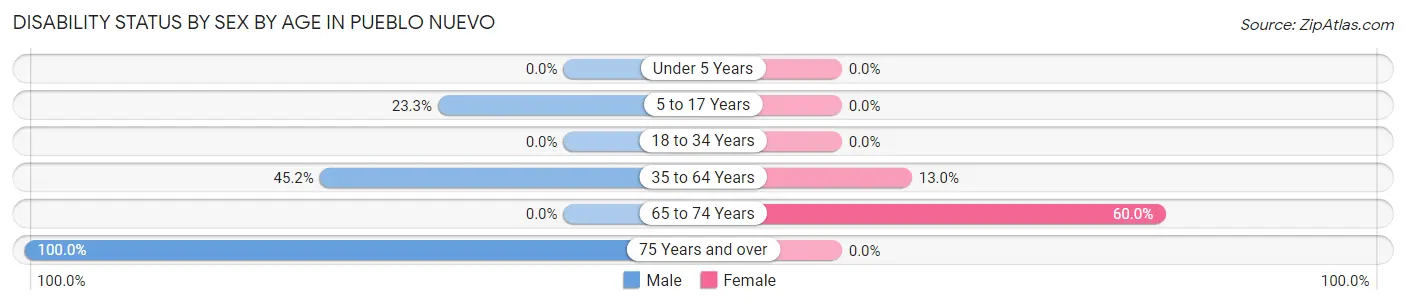
| Age Bracket | Male | Female |
| Under 5 Years | 0 (0.0%) | 0 (0.0%) |
| 5 to 17 Years | 24 (23.3%) | 0 (0.0%) |
| 18 to 34 Years | 0 (0.0%) | 0 (0.0%) |
| 35 to 64 Years | 38 (45.2%) | 10 (13.0%) |
| 65 to 74 Years | 0 (0.0%) | 30 (60.0%) |
| 75 Years and over | 42 (100.0%) | 0 (0.0%) |
Disability Class by Sex by Age in Pueblo Nuevo
Disability Class: Hearing Difficulty
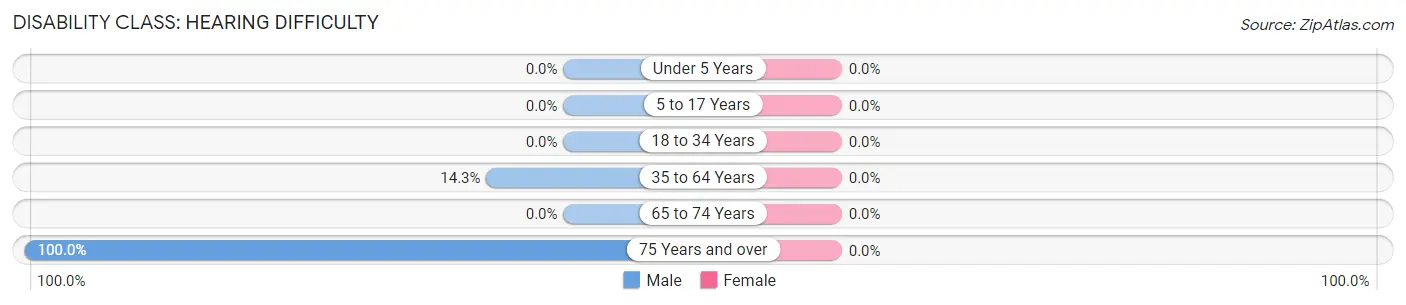
| Age Bracket | Male | Female |
| Under 5 Years | 0 (0.0%) | 0 (0.0%) |
| 5 to 17 Years | 0 (0.0%) | 0 (0.0%) |
| 18 to 34 Years | 0 (0.0%) | 0 (0.0%) |
| 35 to 64 Years | 12 (14.3%) | 0 (0.0%) |
| 65 to 74 Years | 0 (0.0%) | 0 (0.0%) |
| 75 Years and over | 42 (100.0%) | 0 (0.0%) |
Disability Class: Vision Difficulty
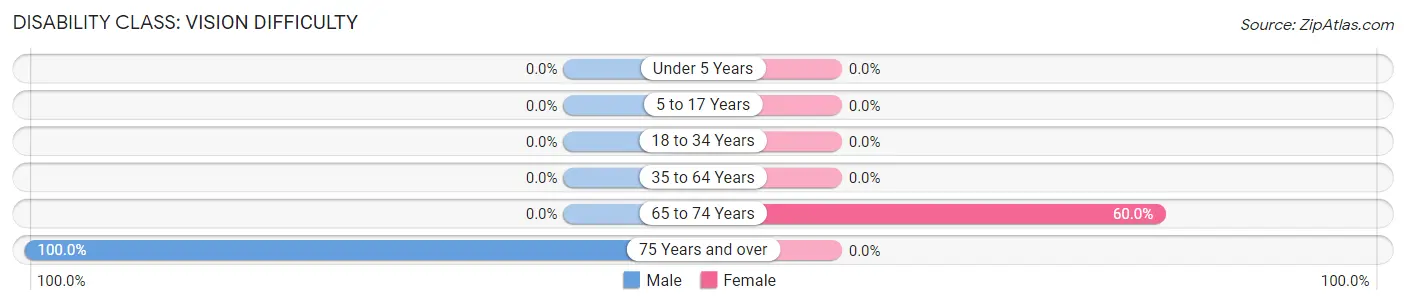
| Age Bracket | Male | Female |
| Under 5 Years | 0 (0.0%) | 0 (0.0%) |
| 5 to 17 Years | 0 (0.0%) | 0 (0.0%) |
| 18 to 34 Years | 0 (0.0%) | 0 (0.0%) |
| 35 to 64 Years | 0 (0.0%) | 0 (0.0%) |
| 65 to 74 Years | 0 (0.0%) | 30 (60.0%) |
| 75 Years and over | 42 (100.0%) | 0 (0.0%) |
Disability Class: Cognitive Difficulty
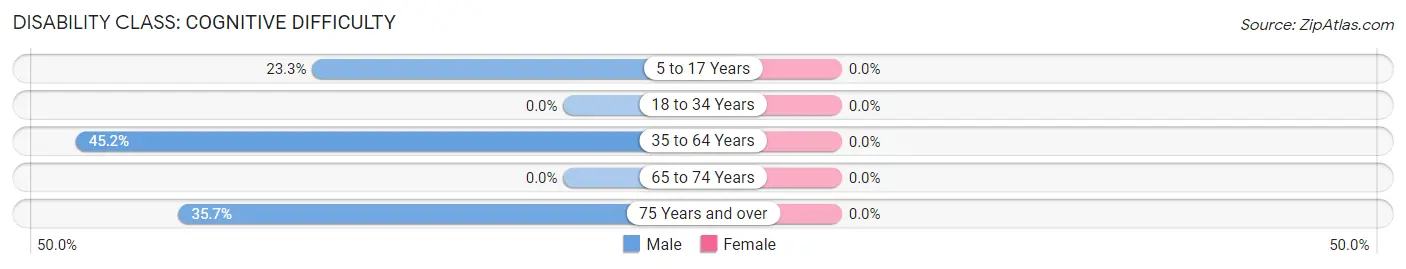
| Age Bracket | Male | Female |
| 5 to 17 Years | 24 (23.3%) | 0 (0.0%) |
| 18 to 34 Years | 0 (0.0%) | 0 (0.0%) |
| 35 to 64 Years | 38 (45.2%) | 0 (0.0%) |
| 65 to 74 Years | 0 (0.0%) | 0 (0.0%) |
| 75 Years and over | 15 (35.7%) | 0 (0.0%) |
Disability Class: Ambulatory Difficulty
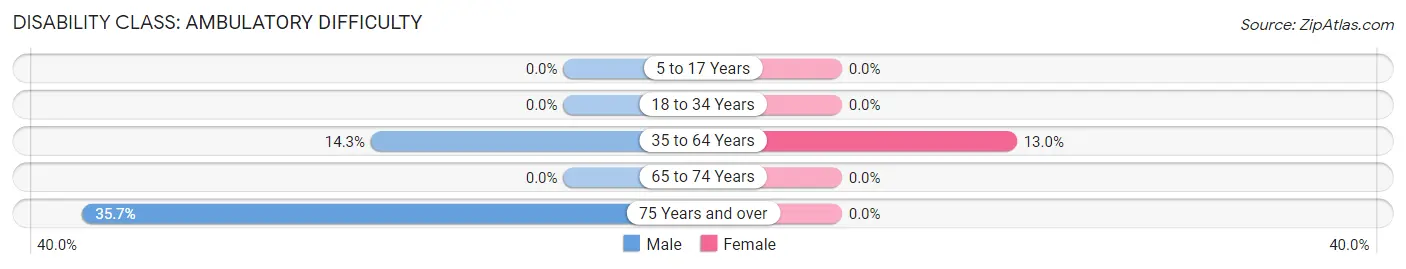
| Age Bracket | Male | Female |
| 5 to 17 Years | 0 (0.0%) | 0 (0.0%) |
| 18 to 34 Years | 0 (0.0%) | 0 (0.0%) |
| 35 to 64 Years | 12 (14.3%) | 10 (13.0%) |
| 65 to 74 Years | 0 (0.0%) | 0 (0.0%) |
| 75 Years and over | 15 (35.7%) | 0 (0.0%) |
Disability Class: Self-Care Difficulty

| Age Bracket | Male | Female |
| 5 to 17 Years | 0 (0.0%) | 0 (0.0%) |
| 18 to 34 Years | 0 (0.0%) | 0 (0.0%) |
| 35 to 64 Years | 12 (14.3%) | 0 (0.0%) |
| 65 to 74 Years | 0 (0.0%) | 0 (0.0%) |
| 75 Years and over | 0 (0.0%) | 0 (0.0%) |
Technology Access in Pueblo Nuevo
Computing Device Access in Pueblo Nuevo
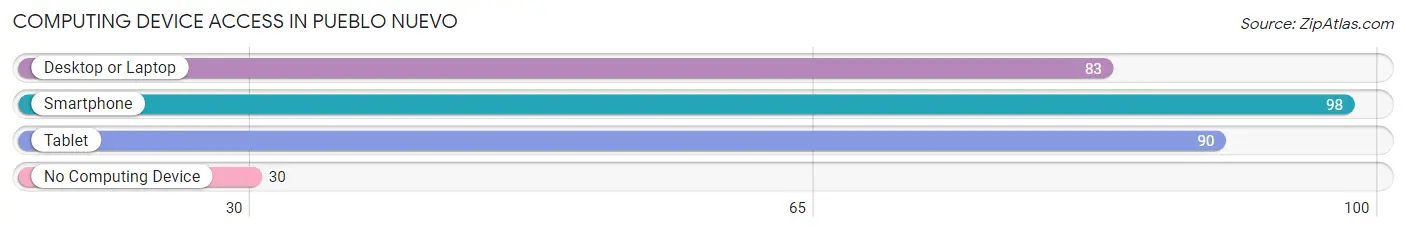
| Device Type | # Households | % Households |
| Desktop or Laptop | 83 | 61.5% |
| Smartphone | 98 | 72.6% |
| Tablet | 90 | 66.7% |
| No Computing Device | 30 | 22.2% |
| Total | 135 | 100.0% |
Internet Access in Pueblo Nuevo
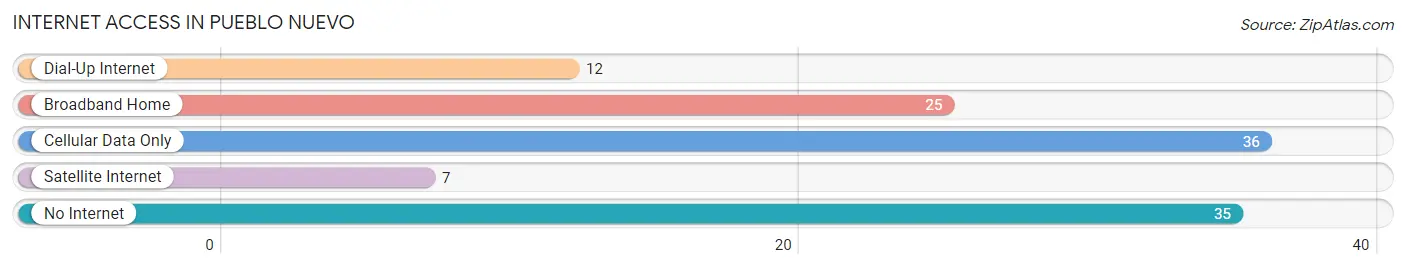
| Internet Type | # Households | % Households |
| Dial-Up Internet | 12 | 8.9% |
| Broadband Home | 25 | 18.5% |
| Cellular Data Only | 36 | 26.7% |
| Satellite Internet | 7 | 5.2% |
| No Internet | 35 | 25.9% |
| Total | 135 | 100.0% |
Pueblo Nuevo Summary
Pueblo Nuevo, Texas is a small unincorporated community located in Starr County, Texas. It is situated on the banks of the Rio Grande, just south of the city of Rio Grande City. The population of Pueblo Nuevo was estimated to be around 1,000 people in 2020.
Geography
Pueblo Nuevo is located in Starr County, Texas, on the banks of the Rio Grande. It is situated just south of the city of Rio Grande City. The terrain of the area is mostly flat, with some rolling hills. The climate is semi-arid, with hot summers and mild winters. The average annual temperature is around 70°F (21°C).
History
Pueblo Nuevo was founded in the late 19th century by Mexican immigrants who were looking for a place to settle and start a new life. The area was originally known as El Pueblo Nuevo, which translates to “The New Town”. The town was officially incorporated in 1891.
In the early 20th century, Pueblo Nuevo was a thriving agricultural community. The town was home to several large farms and ranches, as well as a number of small businesses. The town was also home to a number of churches, schools, and other civic organizations.
In the mid-20th century, the population of Pueblo Nuevo began to decline as many of the residents moved away in search of better economic opportunities. By the late 20th century, the population had dropped to around 1,000 people.
Economy
The economy of Pueblo Nuevo is largely based on agriculture. The town is home to several large farms and ranches, as well as a number of small businesses. The town is also home to a number of churches, schools, and other civic organizations.
The town is also home to a number of tourist attractions, including the historic Pueblo Nuevo Cemetery, the Pueblo Nuevo Museum, and the Pueblo Nuevo State Park.
Demographics
As of 2020, the population of Pueblo Nuevo was estimated to be around 1,000 people. The majority of the population is of Hispanic or Latino descent. The median household income is around $30,000 per year. The median age is around 30 years old.
Conclusion
Pueblo Nuevo, Texas is a small unincorporated community located in Starr County, Texas. It is situated on the banks of the Rio Grande, just south of the city of Rio Grande City. The population of Pueblo Nuevo was estimated to be around 1,000 people in 2020. The economy of Pueblo Nuevo is largely based on agriculture, with a number of small businesses and tourist attractions. The majority of the population is of Hispanic or Latino descent, with a median household income of around $30,000 per year and a median age of around 30 years old.
Common Questions
What is Per Capita Income in Pueblo Nuevo?
Per Capita income in Pueblo Nuevo is $14,238.
What is the Median Family Income in Pueblo Nuevo?
Median Family Income in Pueblo Nuevo is $38,702.
What is Family Income Deficit in Pueblo Nuevo?
Family Income Deficit in Pueblo Nuevo is $10,243.
Families that are below poverty line in Pueblo Nuevo earn $10,243 less on average than the poverty threshold level.
What is Inequality or Gini Index in Pueblo Nuevo?
Inequality or Gini Index in Pueblo Nuevo is 0.45.
What is the Total Population of Pueblo Nuevo?
Total Population of Pueblo Nuevo is 569.
What is the Total Male Population of Pueblo Nuevo?
Total Male Population of Pueblo Nuevo is 297.
What is the Total Female Population of Pueblo Nuevo?
Total Female Population of Pueblo Nuevo is 272.
What is the Ratio of Males per 100 Females in Pueblo Nuevo?
There are 109.19 Males per 100 Females in Pueblo Nuevo.
What is the Ratio of Females per 100 Males in Pueblo Nuevo?
There are 91.58 Females per 100 Males in Pueblo Nuevo.
What is the Median Population Age in Pueblo Nuevo?
Median Population Age in Pueblo Nuevo is 27.7 Years.
What is the Average Family Size in Pueblo Nuevo
Average Family Size in Pueblo Nuevo is 4.5 People.
What is the Average Household Size in Pueblo Nuevo
Average Household Size in Pueblo Nuevo is 4.2 People.
How Large is the Labor Force in Pueblo Nuevo?
There are 254 People in the Labor Forcein in Pueblo Nuevo.
What is the Percentage of People in the Labor Force in Pueblo Nuevo?
62.1% of People are in the Labor Force in Pueblo Nuevo.
What is the Unemployment Rate in Pueblo Nuevo?
Unemployment Rate in Pueblo Nuevo is 2.8%.