Wixon Valley, TX Map & Demographics
Wixon Valley Map
Wixon Valley Overview
$59,214
PER CAPITA INCOME
$111,250
AVG FAMILY INCOME
$115,417
AVG HOUSEHOLD INCOME
6.7%
WAGE / INCOME GAP [ % ]
93.3¢/ $1
WAGE / INCOME GAP [ $ ]
0.43
INEQUALITY / GINI INDEX
206
TOTAL POPULATION
114
MALE POPULATION
92
FEMALE POPULATION
123.91
MALES / 100 FEMALES
80.70
FEMALES / 100 MALES
48.7
MEDIAN AGE
2.4
AVG FAMILY SIZE
2.2
AVG HOUSEHOLD SIZE
125
LABOR FORCE [ PEOPLE ]
70.6%
PERCENT IN LABOR FORCE
8.8%
UNEMPLOYMENT RATE
Wixon Valley Area Codes
Income in Wixon Valley
Income Overview in Wixon Valley
Per Capita Income in Wixon Valley is $59,214, while median incomes of families and households are $111,250 and $115,417 respectively.
| Characteristic | Number | Measure |
| Per Capita Income | 206 | $59,214 |
| Median Family Income | 66 | $111,250 |
| Mean Family Income | 66 | $146,692 |
| Median Household Income | 93 | $115,417 |
| Mean Household Income | 93 | $137,538 |
| Income Deficit | 66 | $0 |
| Wage / Income Gap (%) | 206 | 6.67% |
| Wage / Income Gap ($) | 206 | 93.33¢ per $1 |
| Gini / Inequality Index | 206 | 0.43 |
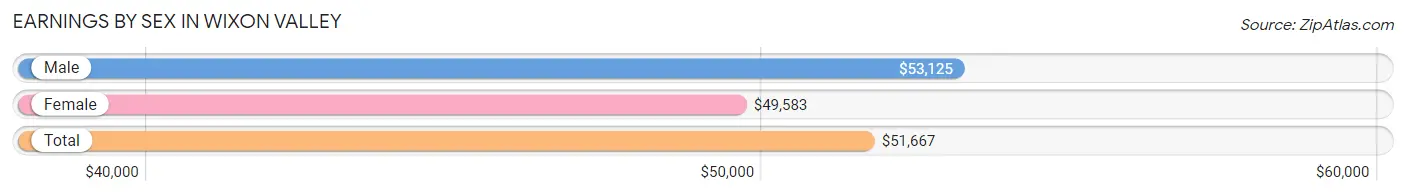
Earnings by Sex in Wixon Valley
Average Earnings in Wixon Valley are $51,667, $53,125 for men and $49,583 for women, a difference of 6.7%.
| Sex | Number | Average Earnings |
| Male | 69 (57.5%) | $53,125 |
| Female | 51 (42.5%) | $49,583 |
| Total | 120 (100.0%) | $51,667 |
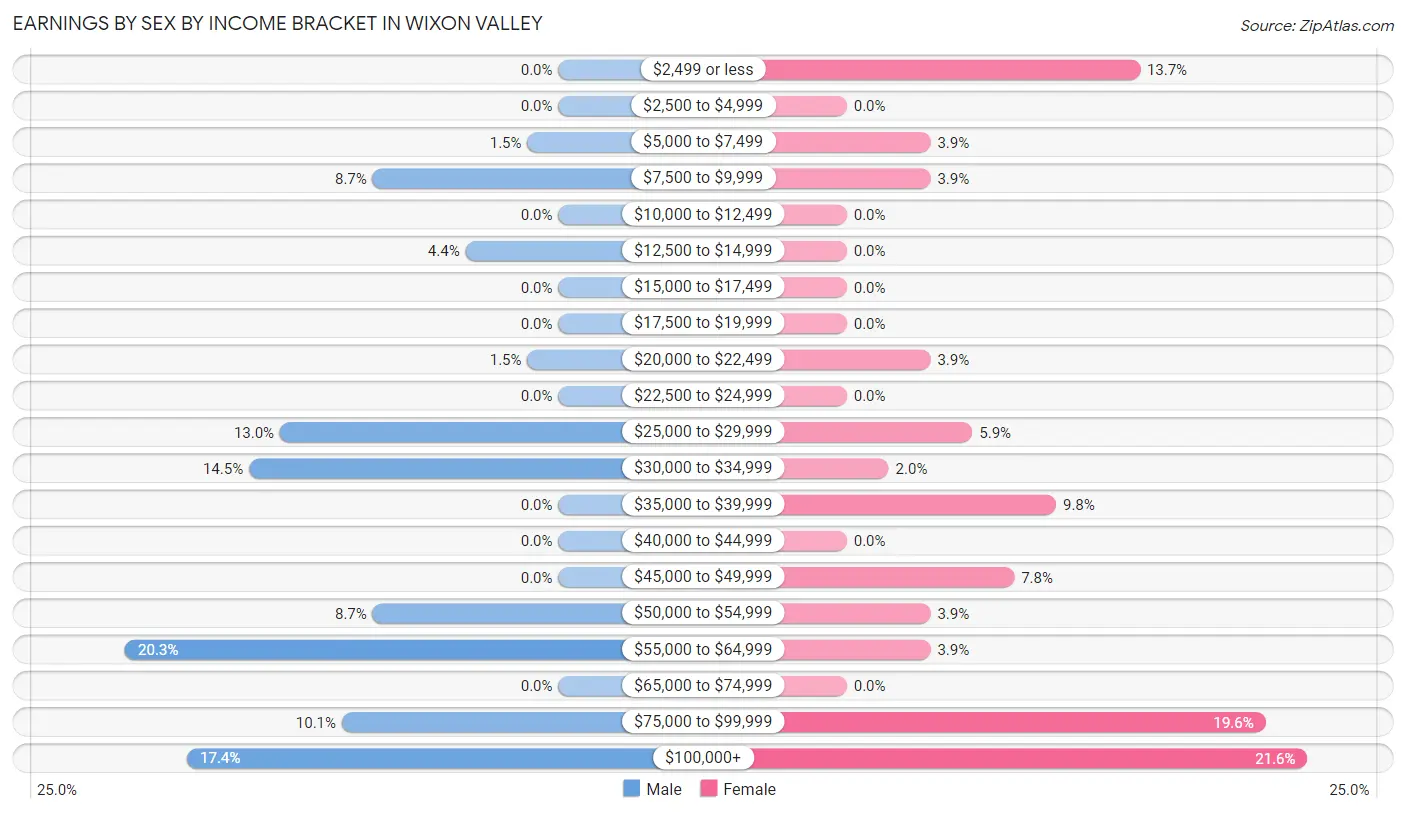
Earnings by Sex by Income Bracket in Wixon Valley
The most common earnings brackets in Wixon Valley are $55,000 to $64,999 for men (14 | 20.3%) and $100,000+ for women (11 | 21.6%).
| Income | Male | Female |
| $2,499 or less | 0 (0.0%) | 7 (13.7%) |
| $2,500 to $4,999 | 0 (0.0%) | 0 (0.0%) |
| $5,000 to $7,499 | 1 (1.5%) | 2 (3.9%) |
| $7,500 to $9,999 | 6 (8.7%) | 2 (3.9%) |
| $10,000 to $12,499 | 0 (0.0%) | 0 (0.0%) |
| $12,500 to $14,999 | 3 (4.3%) | 0 (0.0%) |
| $15,000 to $17,499 | 0 (0.0%) | 0 (0.0%) |
| $17,500 to $19,999 | 0 (0.0%) | 0 (0.0%) |
| $20,000 to $22,499 | 1 (1.5%) | 2 (3.9%) |
| $22,500 to $24,999 | 0 (0.0%) | 0 (0.0%) |
| $25,000 to $29,999 | 9 (13.0%) | 3 (5.9%) |
| $30,000 to $34,999 | 10 (14.5%) | 1 (2.0%) |
| $35,000 to $39,999 | 0 (0.0%) | 5 (9.8%) |
| $40,000 to $44,999 | 0 (0.0%) | 0 (0.0%) |
| $45,000 to $49,999 | 0 (0.0%) | 4 (7.8%) |
| $50,000 to $54,999 | 6 (8.7%) | 2 (3.9%) |
| $55,000 to $64,999 | 14 (20.3%) | 2 (3.9%) |
| $65,000 to $74,999 | 0 (0.0%) | 0 (0.0%) |
| $75,000 to $99,999 | 7 (10.1%) | 10 (19.6%) |
| $100,000+ | 12 (17.4%) | 11 (21.6%) |
| Total | 69 (100.0%) | 51 (100.0%) |
Earnings by Sex by Educational Attainment in Wixon Valley
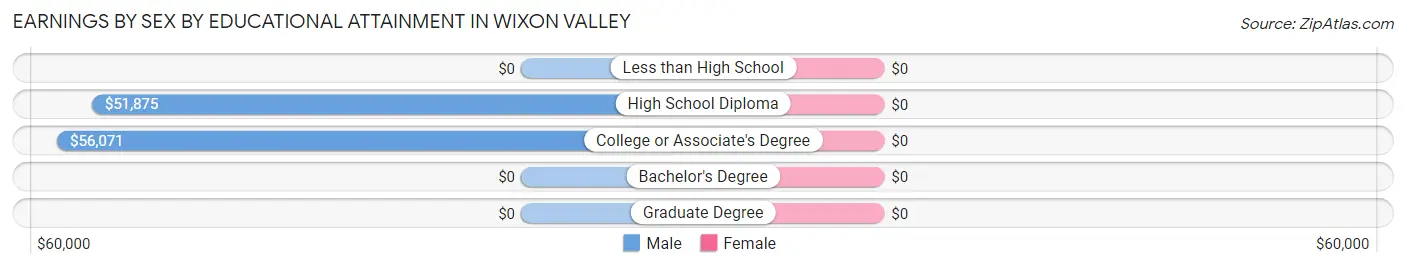
| Educational Attainment | Male Income | Female Income |
| Less than High School | - | - |
| High School Diploma | $51,875 | $0 |
| College or Associate's Degree | $56,071 | $0 |
| Bachelor's Degree | - | - |
| Graduate Degree | - | - |
| Total | $56,806 | $50,625 |
Family Income in Wixon Valley
Family Income Brackets in Wixon Valley
According to the Wixon Valley family income data, there are 15 families falling into the $50,000 to $74,999 income range, which is the most common income bracket and makes up 22.7% of all families.
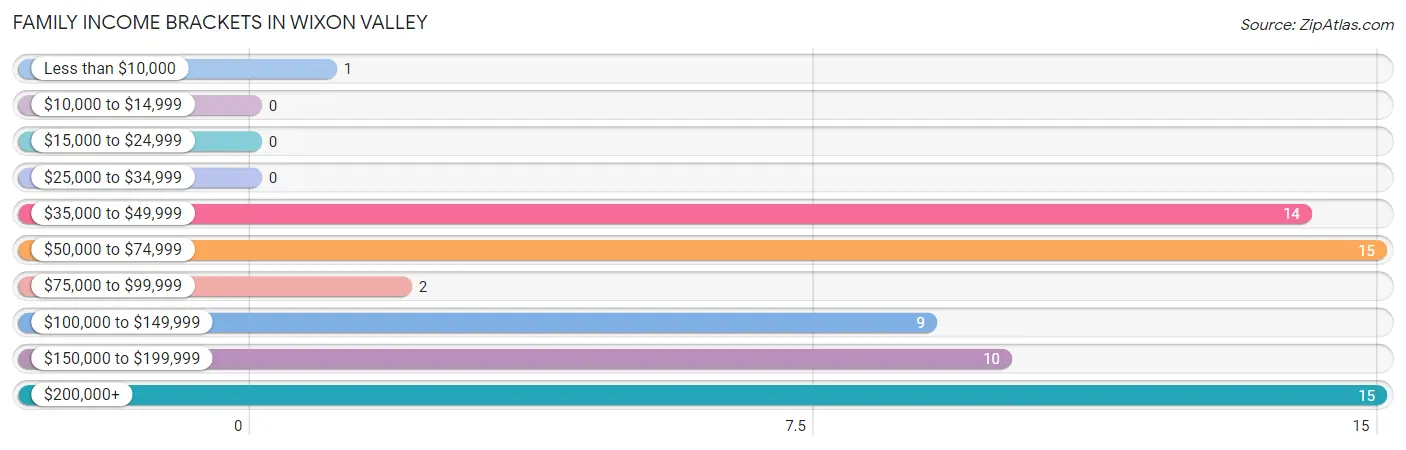
| Income Bracket | # Families | % Families |
| Less than $10,000 | 1 | 1.5% |
| $10,000 to $14,999 | 0 | 0.0% |
| $15,000 to $24,999 | 0 | 0.0% |
| $25,000 to $34,999 | 0 | 0.0% |
| $35,000 to $49,999 | 14 | 21.2% |
| $50,000 to $74,999 | 15 | 22.7% |
| $75,000 to $99,999 | 2 | 3.0% |
| $100,000 to $149,999 | 9 | 13.6% |
| $150,000 to $199,999 | 10 | 15.2% |
| $200,000+ | 15 | 22.7% |
Family Income by Famaliy Size in Wixon Valley
2-person families (43 | 65.1%) account for the highest median family income in Wixon Valley with $136,250 per family, while 2-person families (43 | 65.1%) have the highest median income of $68,125 per family member.
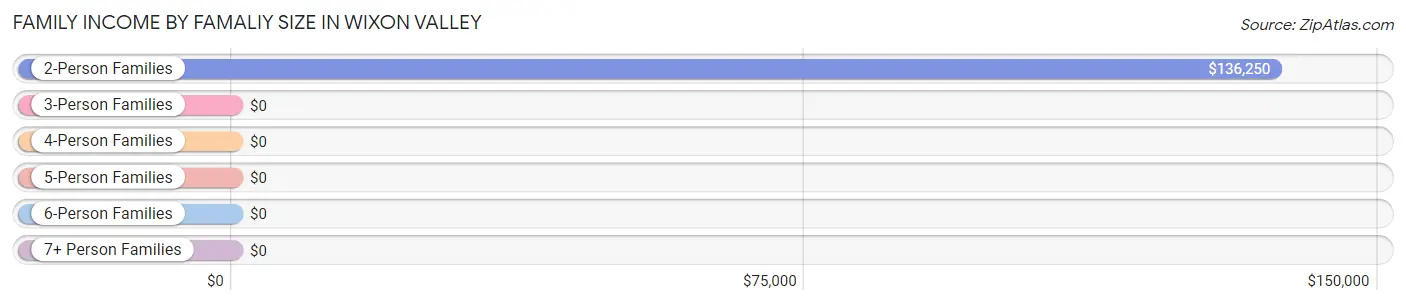
| Income Bracket | # Families | Median Income |
| 2-Person Families | 43 (65.1%) | $136,250 |
| 3-Person Families | 11 (16.7%) | $0 |
| 4-Person Families | 11 (16.7%) | $0 |
| 5-Person Families | 0 (0.0%) | $0 |
| 6-Person Families | 1 (1.5%) | $0 |
| 7+ Person Families | 0 (0.0%) | $0 |
| Total | 66 (100.0%) | $111,250 |
Family Income by Number of Earners in Wixon Valley
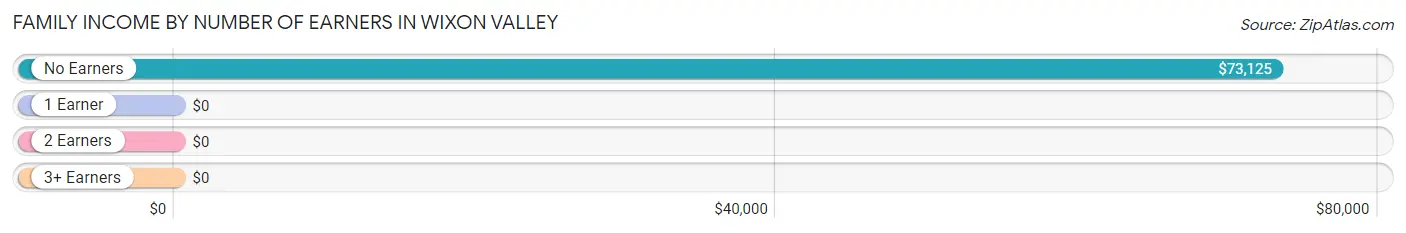
| Number of Earners | # Families | Median Income |
| No Earners | 11 (16.7%) | $73,125 |
| 1 Earner | 16 (24.2%) | $0 |
| 2 Earners | 38 (57.6%) | $0 |
| 3+ Earners | 1 (1.5%) | $0 |
| Total | 66 (100.0%) | $111,250 |
Household Income in Wixon Valley
Household Income Brackets in Wixon Valley
With 22 households falling in the category, the $200,000+ income range is the most frequent in Wixon Valley, accounting for 23.7% of all households.
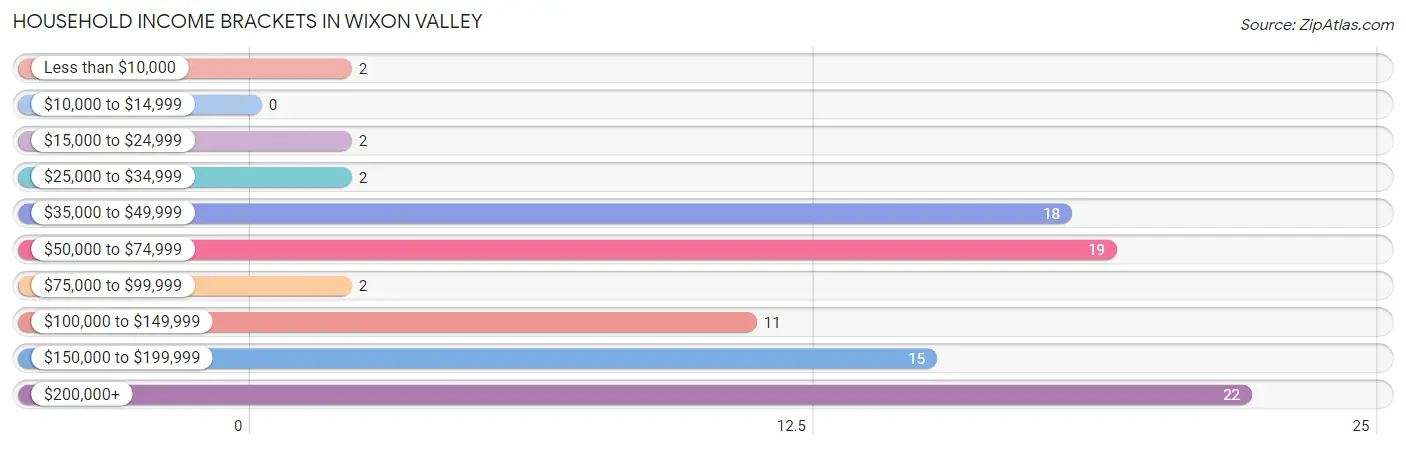
| Income Bracket | # Households | % Households |
| Less than $10,000 | 2 | 2.2% |
| $10,000 to $14,999 | 0 | 0.0% |
| $15,000 to $24,999 | 2 | 2.2% |
| $25,000 to $34,999 | 2 | 2.2% |
| $35,000 to $49,999 | 18 | 19.4% |
| $50,000 to $74,999 | 19 | 20.4% |
| $75,000 to $99,999 | 2 | 2.2% |
| $100,000 to $149,999 | 11 | 11.8% |
| $150,000 to $199,999 | 15 | 16.1% |
| $200,000+ | 22 | 23.7% |
Household Income by Householder Age in Wixon Valley
The median household income in Wixon Valley is $115,417, with the highest median household income of $184,375 found in the 45 to 64 years age bracket for the primary householder. A total of 25 households (26.9%) fall into this category. Meanwhile, the 25 to 44 years age bracket for the primary householder has the lowest median household income of $0, with 15 households (16.1%) in this group.
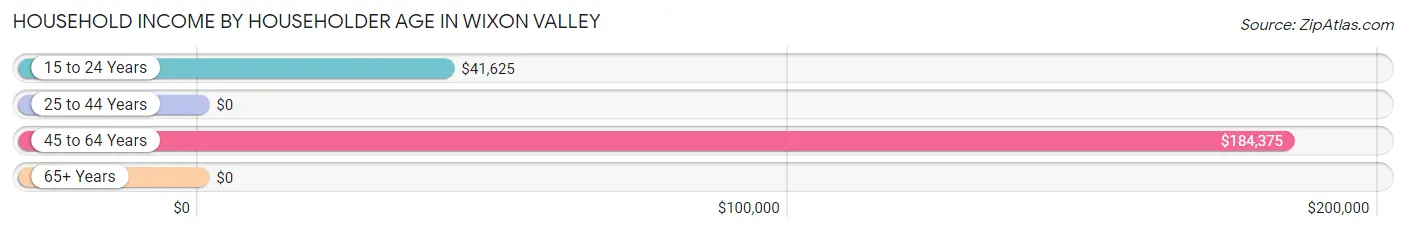
| Income Bracket | # Households | Median Income |
| 15 to 24 Years | 13 (14.0%) | $41,625 |
| 25 to 44 Years | 15 (16.1%) | $0 |
| 45 to 64 Years | 25 (26.9%) | $184,375 |
| 65+ Years | 40 (43.0%) | $0 |
| Total | 93 (100.0%) | $115,417 |
Poverty in Wixon Valley
Income Below Poverty by Sex and Age in Wixon Valley
With 1.8% poverty level for males and 2.4% for females among the residents of Wixon Valley, 65 to 74 year old males and under 5 year old females are the most vulnerable to poverty, with 2 males (14.3%) and 1 females (33.3%) in their respective age groups living below the poverty level.
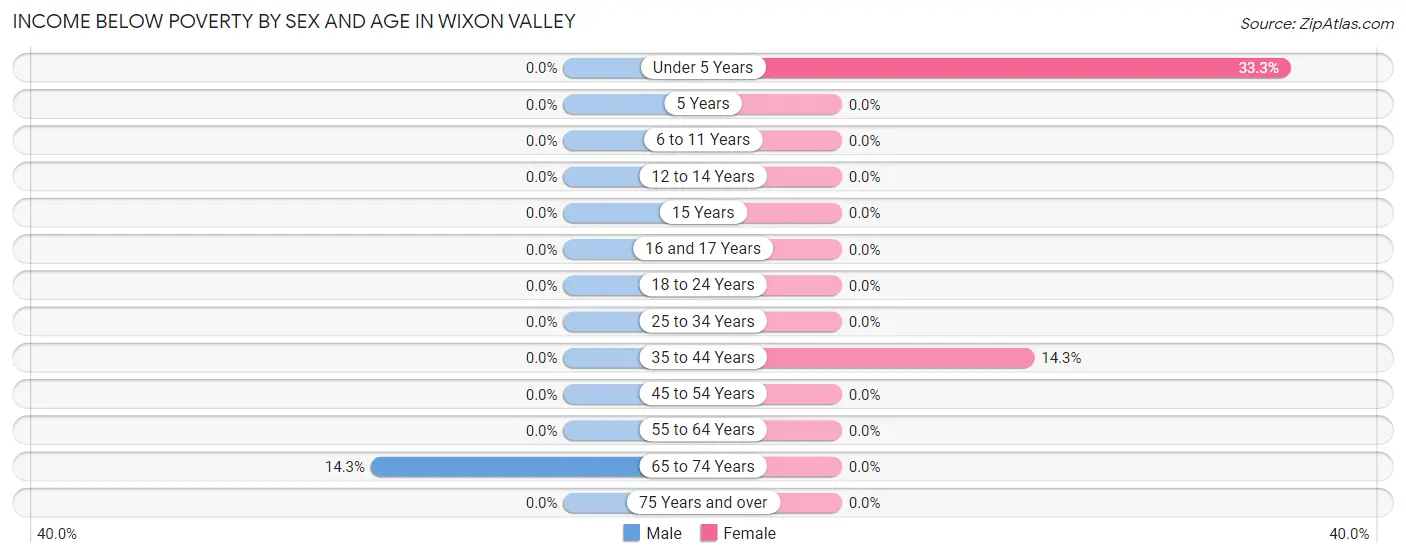
| Age Bracket | Male | Female |
| Under 5 Years | 0 (0.0%) | 1 (33.3%) |
| 5 Years | 0 (0.0%) | 0 (0.0%) |
| 6 to 11 Years | 0 (0.0%) | 0 (0.0%) |
| 12 to 14 Years | 0 (0.0%) | 0 (0.0%) |
| 15 Years | 0 (0.0%) | 0 (0.0%) |
| 16 and 17 Years | 0 (0.0%) | 0 (0.0%) |
| 18 to 24 Years | 0 (0.0%) | 0 (0.0%) |
| 25 to 34 Years | 0 (0.0%) | 0 (0.0%) |
| 35 to 44 Years | 0 (0.0%) | 1 (14.3%) |
| 45 to 54 Years | 0 (0.0%) | 0 (0.0%) |
| 55 to 64 Years | 0 (0.0%) | 0 (0.0%) |
| 65 to 74 Years | 2 (14.3%) | 0 (0.0%) |
| 75 Years and over | 0 (0.0%) | 0 (0.0%) |
| Total | 2 (1.8%) | 2 (2.4%) |
Income Above Poverty by Sex and Age in Wixon Valley
According to the poverty statistics in Wixon Valley, males aged under 5 years and females aged 6 to 11 years are the age groups that are most secure financially, with 100.0% of males and 100.0% of females in these age groups living above the poverty line.
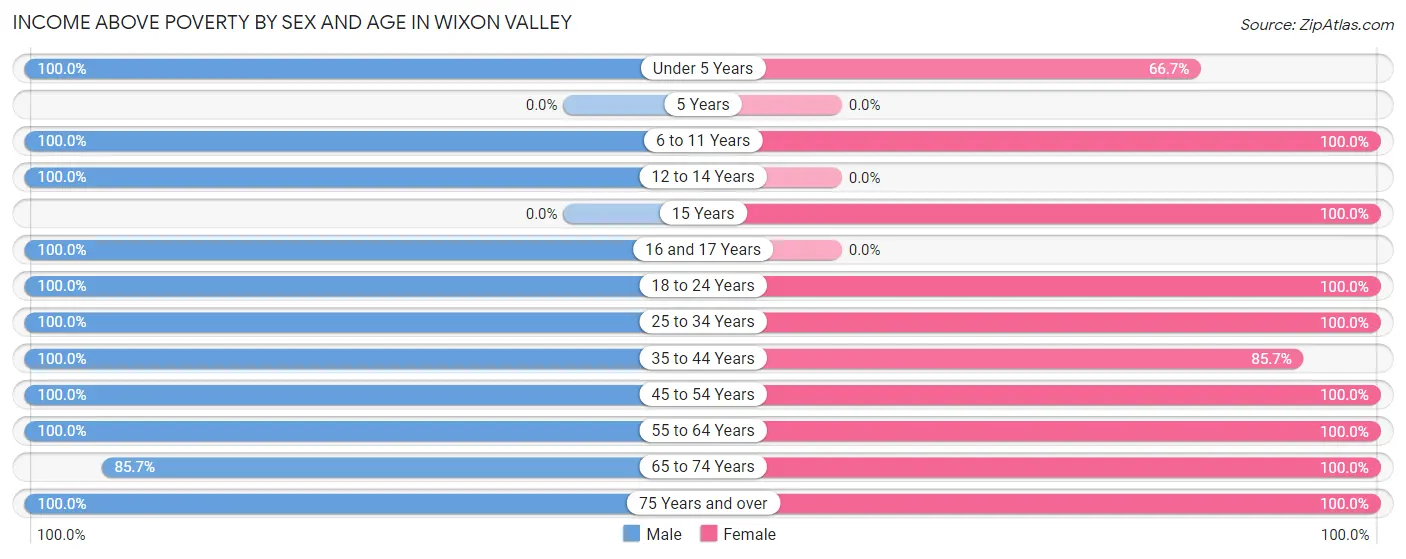
| Age Bracket | Male | Female |
| Under 5 Years | 3 (100.0%) | 2 (66.7%) |
| 5 Years | 0 (0.0%) | 0 (0.0%) |
| 6 to 11 Years | 1 (100.0%) | 4 (100.0%) |
| 12 to 14 Years | 6 (100.0%) | 0 (0.0%) |
| 15 Years | 0 (0.0%) | 1 (100.0%) |
| 16 and 17 Years | 2 (100.0%) | 0 (0.0%) |
| 18 to 24 Years | 31 (100.0%) | 2 (100.0%) |
| 25 to 34 Years | 11 (100.0%) | 10 (100.0%) |
| 35 to 44 Years | 5 (100.0%) | 6 (85.7%) |
| 45 to 54 Years | 15 (100.0%) | 13 (100.0%) |
| 55 to 64 Years | 15 (100.0%) | 13 (100.0%) |
| 65 to 74 Years | 12 (85.7%) | 19 (100.0%) |
| 75 Years and over | 7 (100.0%) | 13 (100.0%) |
| Total | 108 (98.2%) | 83 (97.7%) |
Income Below Poverty Among Married-Couple Families in Wixon Valley
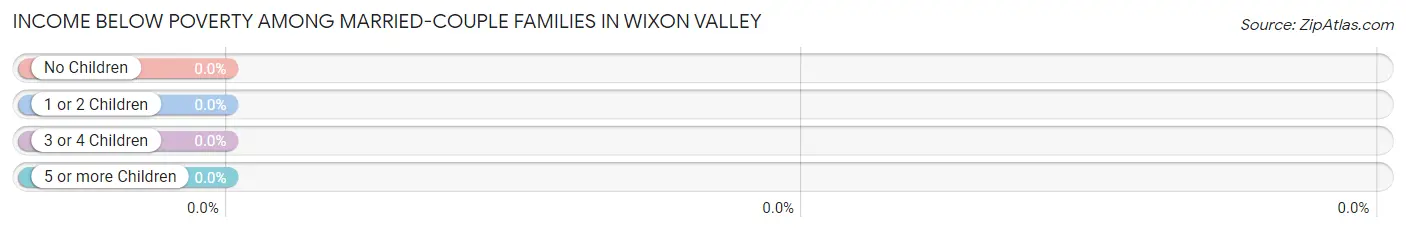
| Children | Above Poverty | Below Poverty |
| No Children | 39 (100.0%) | 0 (0.0%) |
| 1 or 2 Children | 7 (100.0%) | 0 (0.0%) |
| 3 or 4 Children | 1 (100.0%) | 0 (0.0%) |
| 5 or more Children | 0 (0.0%) | 0 (0.0%) |
| Total | 47 (100.0%) | 0 (0.0%) |
Income Below Poverty Among Single-Parent Households in Wixon Valley
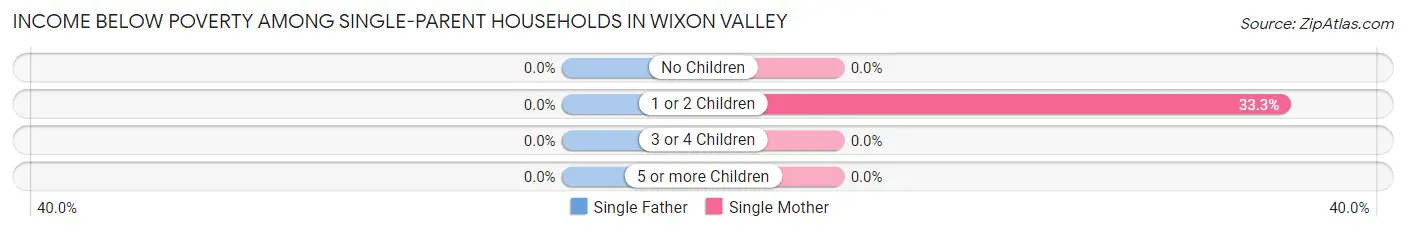
| Children | Single Father | Single Mother |
| No Children | 0 (0.0%) | 0 (0.0%) |
| 1 or 2 Children | 0 (0.0%) | 1 (33.3%) |
| 3 or 4 Children | 0 (0.0%) | 0 (0.0%) |
| 5 or more Children | 0 (0.0%) | 0 (0.0%) |
| Total | 0 (0.0%) | 1 (12.5%) |
Income Below Poverty Among Married-Couple vs Single-Parent Households in Wixon Valley
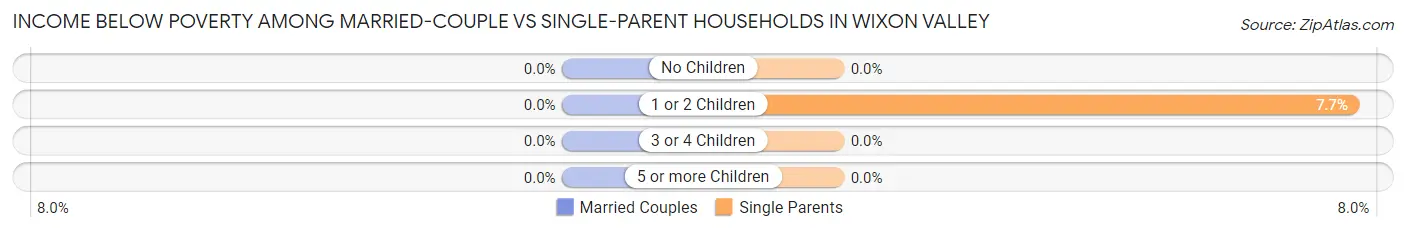
| Children | Married-Couple Families | Single-Parent Households |
| No Children | 0 (0.0%) | 0 (0.0%) |
| 1 or 2 Children | 0 (0.0%) | 1 (7.7%) |
| 3 or 4 Children | 0 (0.0%) | 0 (0.0%) |
| 5 or more Children | 0 (0.0%) | 0 (0.0%) |
| Total | 0 (0.0%) | 1 (5.3%) |
Race in Wixon Valley
The most populous races in Wixon Valley are White / Caucasian (147 | 71.4%), Black / African American (53 | 25.7%), and Hispanic or Latino (19 | 9.2%).
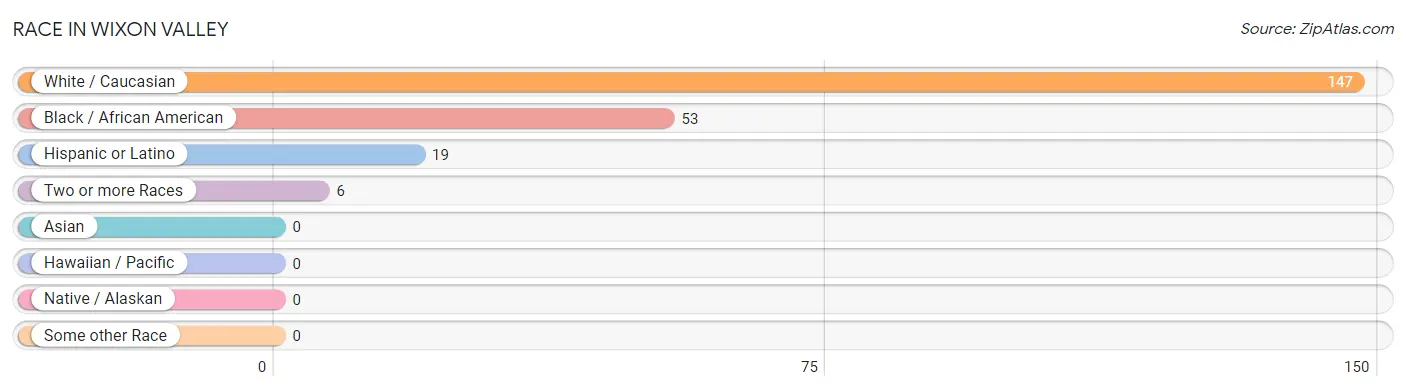
| Race | # Population | % Population |
| Asian | 0 | 0.0% |
| Black / African American | 53 | 25.7% |
| Hawaiian / Pacific | 0 | 0.0% |
| Hispanic or Latino | 19 | 9.2% |
| Native / Alaskan | 0 | 0.0% |
| White / Caucasian | 147 | 71.4% |
| Two or more Races | 6 | 2.9% |
| Some other Race | 0 | 0.0% |
| Total | 206 | 100.0% |
Ancestry in Wixon Valley
The most populous ancestries reported in Wixon Valley are Irish (26 | 12.6%), German (24 | 11.7%), Mexican (19 | 9.2%), English (14 | 6.8%), and American (11 | 5.3%), together accounting for 45.6% of all Wixon Valley residents.
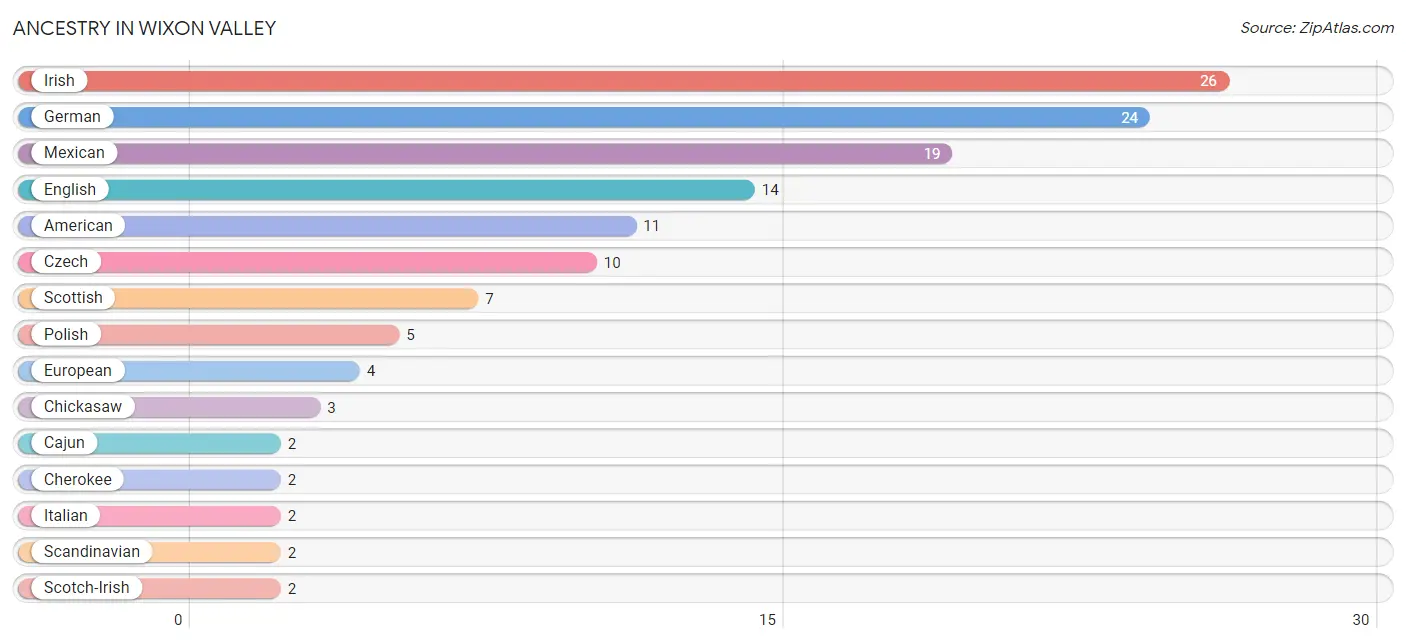
| Ancestry | # Population | % Population |
| American | 11 | 5.3% |
| Cajun | 2 | 1.0% |
| Cherokee | 2 | 1.0% |
| Chickasaw | 3 | 1.5% |
| Czech | 10 | 4.9% |
| English | 14 | 6.8% |
| European | 4 | 1.9% |
| German | 24 | 11.7% |
| Irish | 26 | 12.6% |
| Italian | 2 | 1.0% |
| Mexican | 19 | 9.2% |
| Polish | 5 | 2.4% |
| Portuguese | 1 | 0.5% |
| Scandinavian | 2 | 1.0% |
| Scotch-Irish | 2 | 1.0% |
| Scottish | 7 | 3.4% |
| Sri Lankan | 1 | 0.5% | View All 17 Rows |
Immigrants in Wixon Valley
The most numerous immigrant groups reported in Wixon Valley came from Central America (2 | 1.0%), Latin America (2 | 1.0%), and Mexico (2 | 1.0%), together accounting for 2.9% of all Wixon Valley residents.
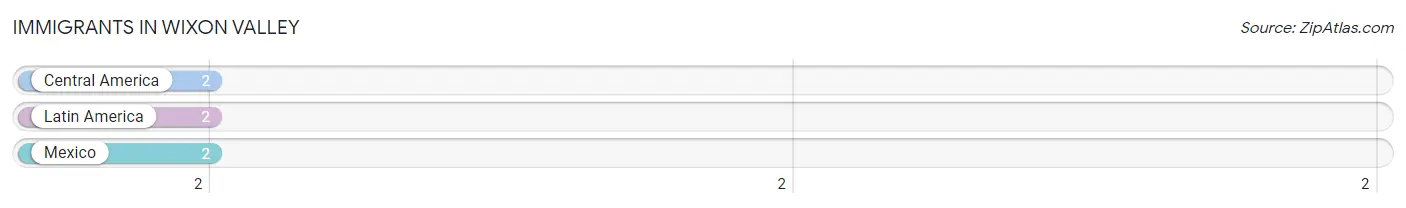
| Immigration Origin | # Population | % Population |
| Central America | 2 | 1.0% |
| Latin America | 2 | 1.0% |
| Mexico | 2 | 1.0% | View All 3 Rows |
Sex and Age in Wixon Valley
Sex and Age in Wixon Valley
The most populous age groups in Wixon Valley are 15 to 19 Years (23 | 20.2%) for men and 70 to 74 Years (13 | 14.1%) for women.
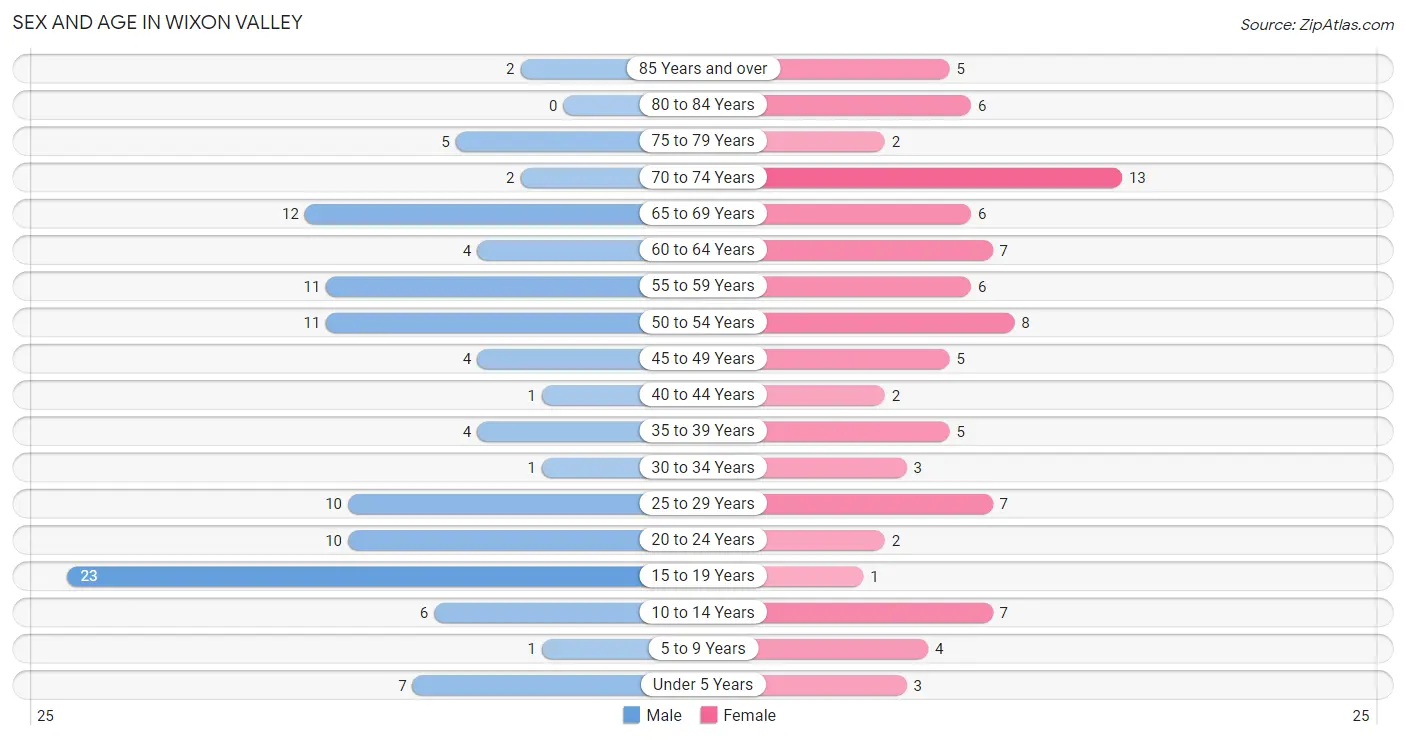
| Age Bracket | Male | Female |
| Under 5 Years | 7 (6.1%) | 3 (3.3%) |
| 5 to 9 Years | 1 (0.9%) | 4 (4.3%) |
| 10 to 14 Years | 6 (5.3%) | 7 (7.6%) |
| 15 to 19 Years | 23 (20.2%) | 1 (1.1%) |
| 20 to 24 Years | 10 (8.8%) | 2 (2.2%) |
| 25 to 29 Years | 10 (8.8%) | 7 (7.6%) |
| 30 to 34 Years | 1 (0.9%) | 3 (3.3%) |
| 35 to 39 Years | 4 (3.5%) | 5 (5.4%) |
| 40 to 44 Years | 1 (0.9%) | 2 (2.2%) |
| 45 to 49 Years | 4 (3.5%) | 5 (5.4%) |
| 50 to 54 Years | 11 (9.7%) | 8 (8.7%) |
| 55 to 59 Years | 11 (9.7%) | 6 (6.5%) |
| 60 to 64 Years | 4 (3.5%) | 7 (7.6%) |
| 65 to 69 Years | 12 (10.5%) | 6 (6.5%) |
| 70 to 74 Years | 2 (1.8%) | 13 (14.1%) |
| 75 to 79 Years | 5 (4.4%) | 2 (2.2%) |
| 80 to 84 Years | 0 (0.0%) | 6 (6.5%) |
| 85 Years and over | 2 (1.8%) | 5 (5.4%) |
| Total | 114 (100.0%) | 92 (100.0%) |
Families and Households in Wixon Valley
Median Family Size in Wixon Valley
The median family size in Wixon Valley is 2.42 persons per family, with single male/father families (11 | 16.7%) accounting for the largest median family size of 3.18 persons per family. On the other hand, single female/mother families (8 | 12.1%) represent the smallest median family size with 2.00 persons per family.
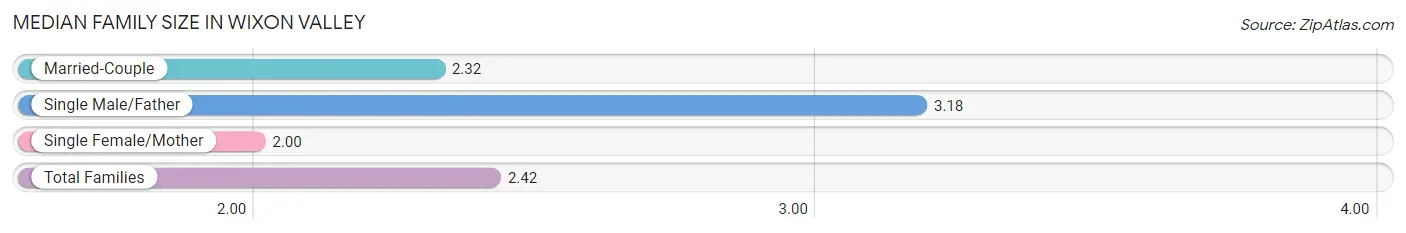
| Family Type | # Families | Family Size |
| Married-Couple | 47 (71.2%) | 2.32 |
| Single Male/Father | 11 (16.7%) | 3.18 |
| Single Female/Mother | 8 (12.1%) | 2.00 |
| Total Families | 66 (100.0%) | 2.42 |
Median Household Size in Wixon Valley
The median household size in Wixon Valley is 2.22 persons per household, with single male/father households (11 | 11.8%) accounting for the largest median household size of 3.18 persons per household. non-family households (27 | 29.0%) represent the smallest median household size with 1.37 persons per household.
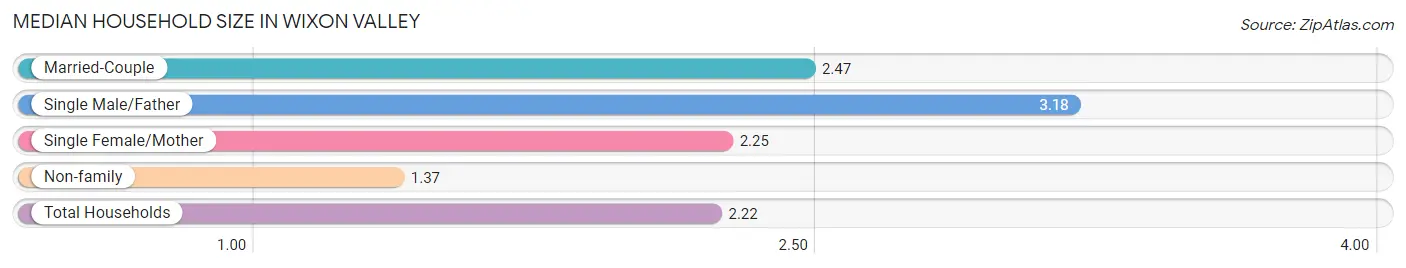
| Household Type | # Households | Household Size |
| Married-Couple | 47 (50.5%) | 2.47 |
| Single Male/Father | 11 (11.8%) | 3.18 |
| Single Female/Mother | 8 (8.6%) | 2.25 |
| Non-family | 27 (29.0%) | 1.37 |
| Total Households | 93 (100.0%) | 2.22 |
Household Size by Marriage Status in Wixon Valley
Out of a total of 93 households in Wixon Valley, 66 (71.0%) are family households, while 27 (29.0%) are nonfamily households. The most numerous type of family households are 2-person households, comprising 42, and the most common type of nonfamily households are 1-person households, comprising 22.
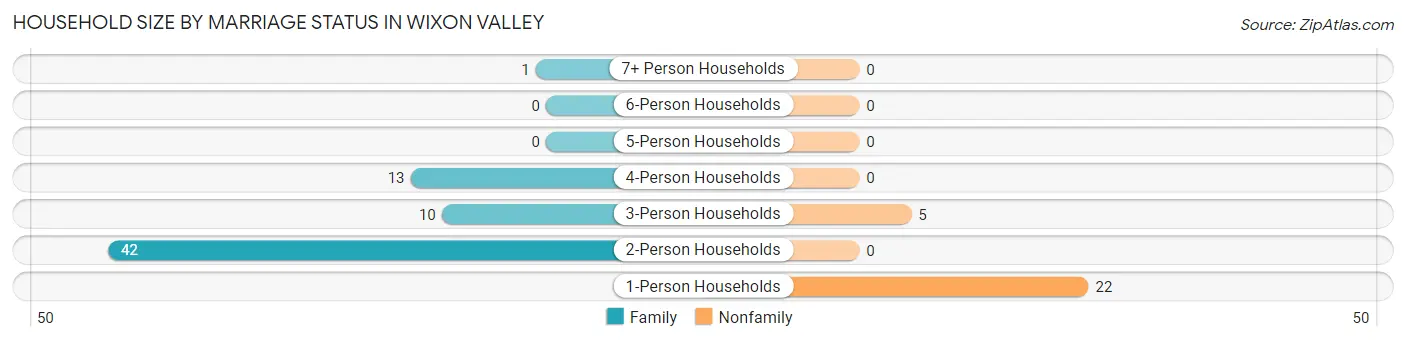
| Household Size | Family Households | Nonfamily Households |
| 1-Person Households | - | 22 (23.7%) |
| 2-Person Households | 42 (45.2%) | 0 (0.0%) |
| 3-Person Households | 10 (10.7%) | 5 (5.4%) |
| 4-Person Households | 13 (14.0%) | 0 (0.0%) |
| 5-Person Households | 0 (0.0%) | 0 (0.0%) |
| 6-Person Households | 0 (0.0%) | 0 (0.0%) |
| 7+ Person Households | 1 (1.1%) | 0 (0.0%) |
| Total | 66 (71.0%) | 27 (29.0%) |
Female Fertility in Wixon Valley
Fertility by Age in Wixon Valley
Average fertility rate in Wixon Valley is 80.0 births per 1,000 women. Women in the age bracket of 20 to 34 years have the highest fertility rate with 167.0 births per 1,000 women. Women in the age bracket of 20 to 34 years acount for 100.0% of all women with births.
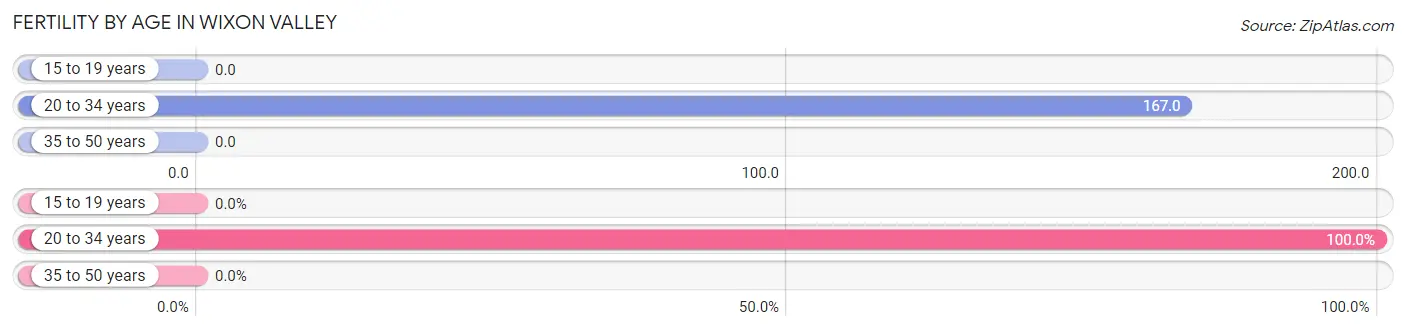
| Age Bracket | Women with Births | Births / 1,000 Women |
| 15 to 19 years | 0 (0.0%) | 0.0 |
| 20 to 34 years | 2 (100.0%) | 167.0 |
| 35 to 50 years | 0 (0.0%) | 0.0 |
| Total | 2 (100.0%) | 80.0 |
Fertility by Age by Marriage Status in Wixon Valley
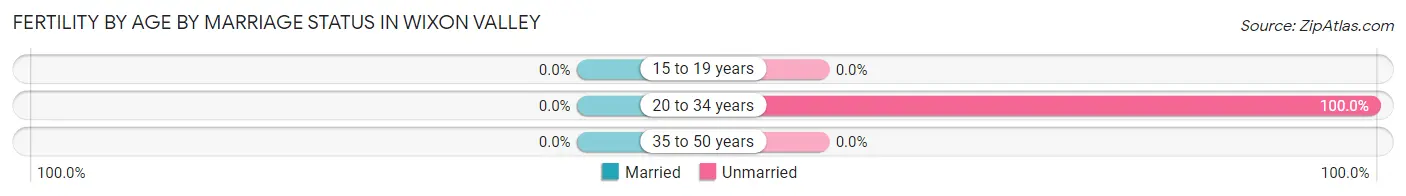
| Age Bracket | Married | Unmarried |
| 15 to 19 years | 0 (0.0%) | 0 (0.0%) |
| 20 to 34 years | 0 (0.0%) | 2 (100.0%) |
| 35 to 50 years | 0 (0.0%) | 0 (0.0%) |
| Total | 0 (0.0%) | 2 (100.0%) |
Fertility by Education in Wixon Valley
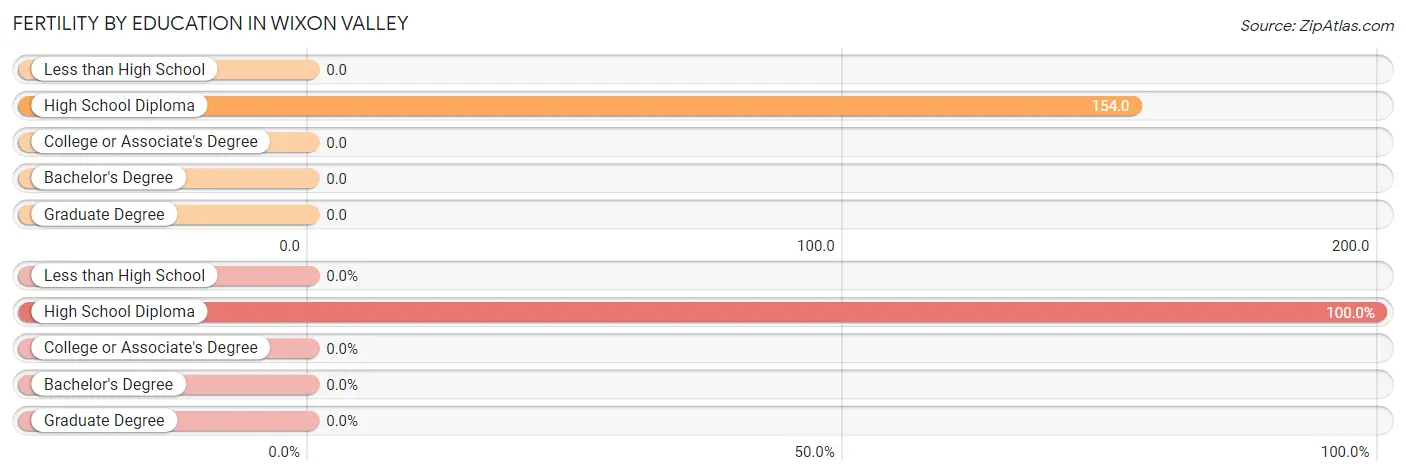
| Educational Attainment | Women with Births | Births / 1,000 Women |
| Less than High School | 0 (0.0%) | 0.0 |
| High School Diploma | 2 (100.0%) | 154.0 |
| College or Associate's Degree | 0 (0.0%) | 0.0 |
| Bachelor's Degree | 0 (0.0%) | 0.0 |
| Graduate Degree | 0 (0.0%) | 0.0 |
| Total | 2 (100.0%) | 80.0 |
Fertility by Education by Marriage Status in Wixon Valley
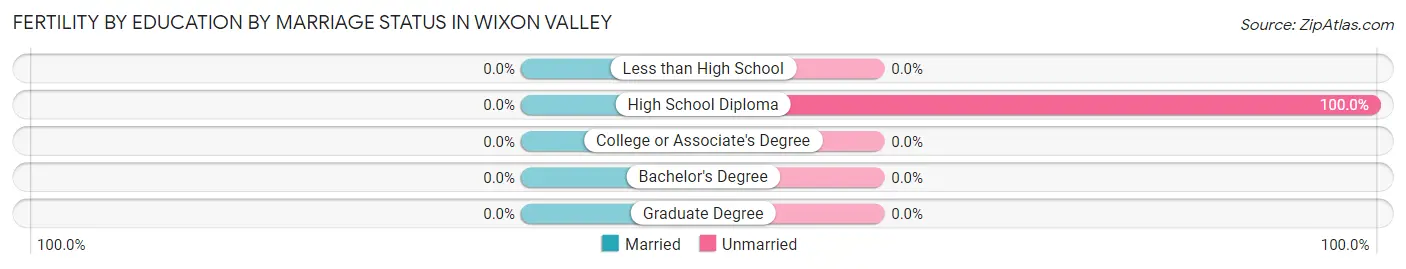
| Educational Attainment | Married | Unmarried |
| Less than High School | 0 (0.0%) | 0 (0.0%) |
| High School Diploma | 0 (0.0%) | 2 (100.0%) |
| College or Associate's Degree | 0 (0.0%) | 0 (0.0%) |
| Bachelor's Degree | 0 (0.0%) | 0 (0.0%) |
| Graduate Degree | 0 (0.0%) | 0 (0.0%) |
| Total | 0 (0.0%) | 2 (100.0%) |
Employment Characteristics in Wixon Valley
Employment by Class of Employer in Wixon Valley
Among the 114 employed individuals in Wixon Valley, private company employees (64 | 56.1%), state government employees (16 | 14.0%), and local government employees (14 | 12.3%) make up the most common classes of employment.
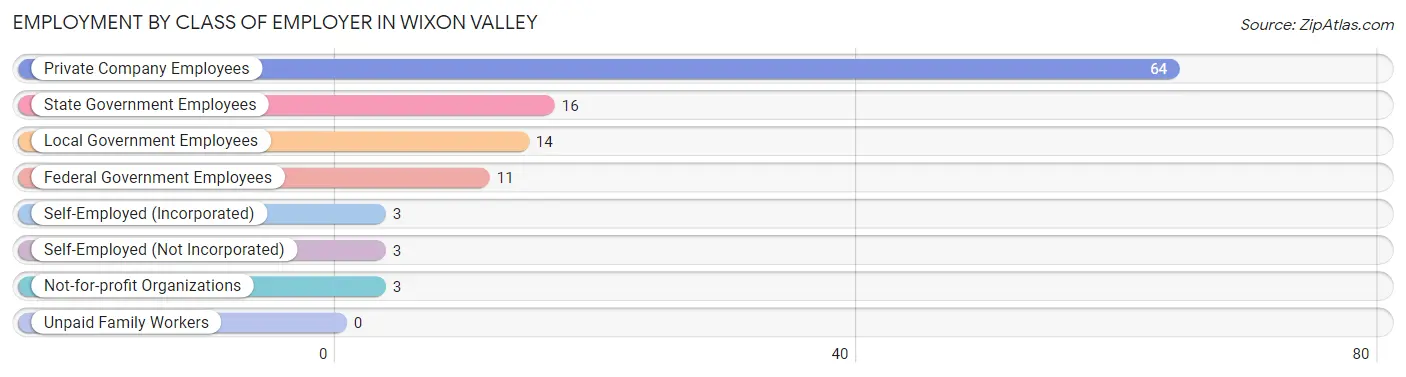
| Employer Class | # Employees | % Employees |
| Private Company Employees | 64 | 56.1% |
| Self-Employed (Incorporated) | 3 | 2.6% |
| Self-Employed (Not Incorporated) | 3 | 2.6% |
| Not-for-profit Organizations | 3 | 2.6% |
| Local Government Employees | 14 | 12.3% |
| State Government Employees | 16 | 14.0% |
| Federal Government Employees | 11 | 9.7% |
| Unpaid Family Workers | 0 | 0.0% |
| Total | 114 | 100.0% |
Employment Status by Age in Wixon Valley
According to the labor force statistics for Wixon Valley, out of the total population over 16 years of age (177), 70.6% or 125 individuals are in the labor force, with 8.8% or 11 of them unemployed. The age group with the highest labor force participation rate is 20 to 24 years, with 100.0% or 12 individuals in the labor force. Within the labor force, the 16 to 19 years age range has the highest percentage of unemployed individuals, with 52.4% or 11 of them being unemployed.
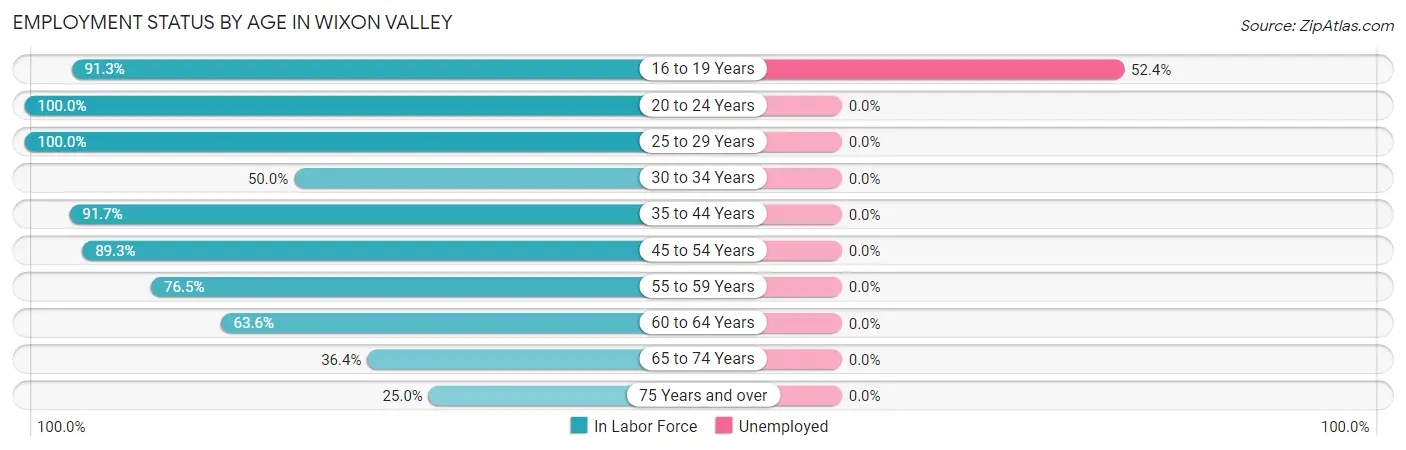
| Age Bracket | In Labor Force | Unemployed |
| 16 to 19 Years | 21 (91.3%) | 11 (52.4%) |
| 20 to 24 Years | 12 (100.0%) | 0 (0.0%) |
| 25 to 29 Years | 17 (100.0%) | 0 (0.0%) |
| 30 to 34 Years | 2 (50.0%) | 0 (0.0%) |
| 35 to 44 Years | 11 (91.7%) | 0 (0.0%) |
| 45 to 54 Years | 25 (89.3%) | 0 (0.0%) |
| 55 to 59 Years | 13 (76.5%) | 0 (0.0%) |
| 60 to 64 Years | 7 (63.6%) | 0 (0.0%) |
| 65 to 74 Years | 12 (36.4%) | 0 (0.0%) |
| 75 Years and over | 5 (25.0%) | 0 (0.0%) |
| Total | 125 (70.6%) | 11 (8.8%) |
Employment Status by Educational Attainment in Wixon Valley
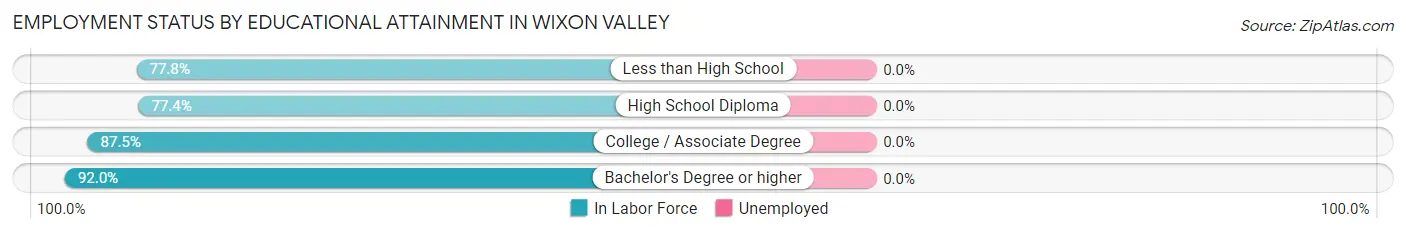
| Educational Attainment | In Labor Force | Unemployed |
| Less than High School | 7 (77.8%) | 0 (0.0%) |
| High School Diploma | 24 (77.4%) | 0 (0.0%) |
| College / Associate Degree | 21 (87.5%) | 0 (0.0%) |
| Bachelor's Degree or higher | 23 (92.0%) | 0 (0.0%) |
| Total | 75 (84.3%) | 0 (0.0%) |
Employment Occupations by Sex in Wixon Valley
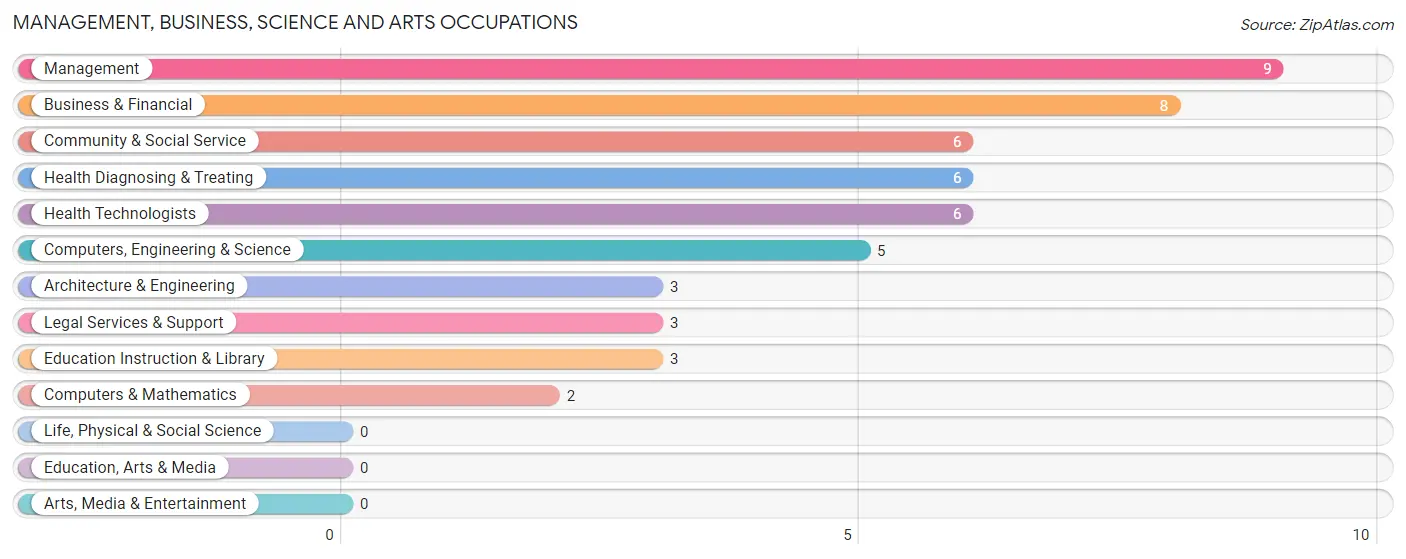
Management, Business, Science and Arts Occupations
The most common Management, Business, Science and Arts occupations in Wixon Valley are Management (9 | 7.9%), Business & Financial (8 | 7.0%), Community & Social Service (6 | 5.3%), Health Diagnosing & Treating (6 | 5.3%), and Health Technologists (6 | 5.3%).
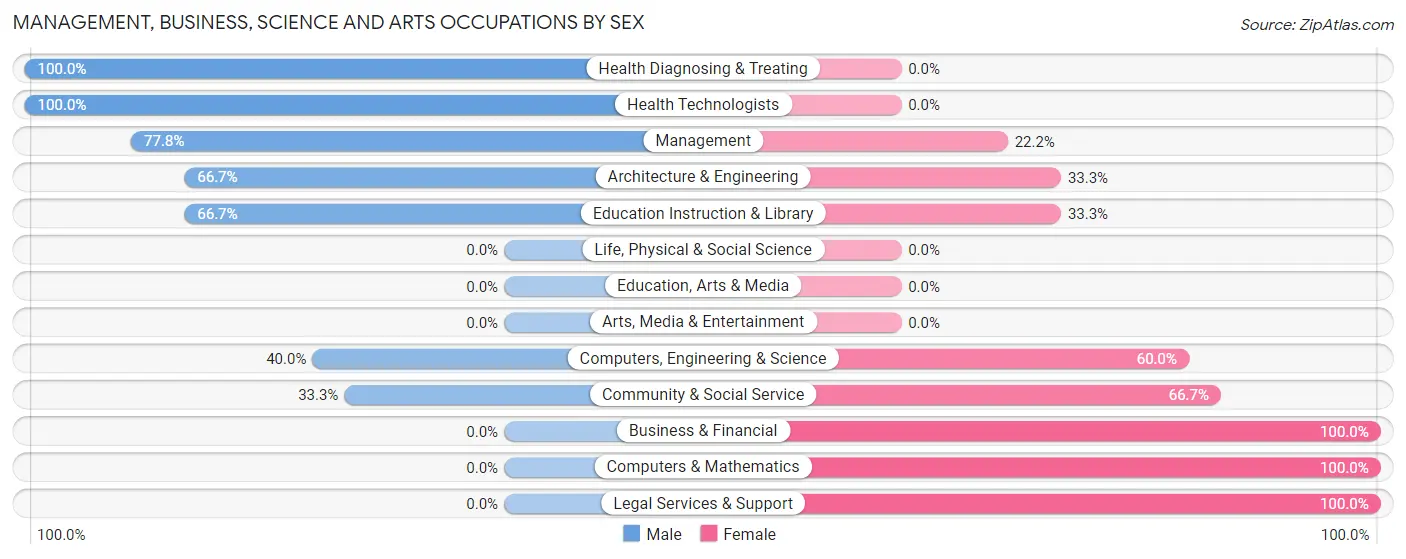
Management, Business, Science and Arts Occupations by Sex
Within the Management, Business, Science and Arts occupations in Wixon Valley, the most male-oriented occupations are Health Diagnosing & Treating (100.0%), Health Technologists (100.0%), and Management (77.8%), while the most female-oriented occupations are Business & Financial (100.0%), Computers & Mathematics (100.0%), and Legal Services & Support (100.0%).
| Occupation | Male | Female |
| Management | 7 (77.8%) | 2 (22.2%) |
| Business & Financial | 0 (0.0%) | 8 (100.0%) |
| Computers, Engineering & Science | 2 (40.0%) | 3 (60.0%) |
| Computers & Mathematics | 0 (0.0%) | 2 (100.0%) |
| Architecture & Engineering | 2 (66.7%) | 1 (33.3%) |
| Life, Physical & Social Science | 0 (0.0%) | 0 (0.0%) |
| Community & Social Service | 2 (33.3%) | 4 (66.7%) |
| Education, Arts & Media | 0 (0.0%) | 0 (0.0%) |
| Legal Services & Support | 0 (0.0%) | 3 (100.0%) |
| Education Instruction & Library | 2 (66.7%) | 1 (33.3%) |
| Arts, Media & Entertainment | 0 (0.0%) | 0 (0.0%) |
| Health Diagnosing & Treating | 6 (100.0%) | 0 (0.0%) |
| Health Technologists | 6 (100.0%) | 0 (0.0%) |
| Total (Category) | 17 (50.0%) | 17 (50.0%) |
| Total (Overall) | 68 (59.7%) | 46 (40.4%) |
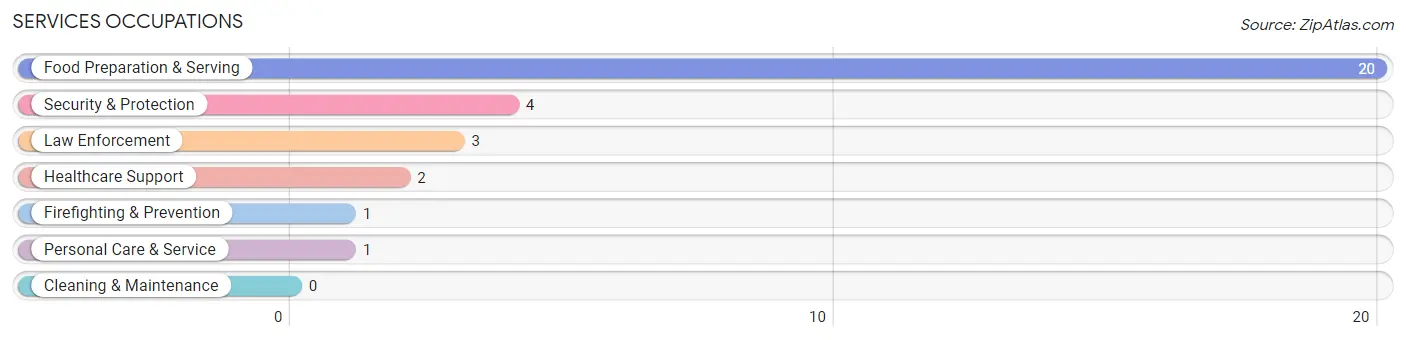
Services Occupations
The most common Services occupations in Wixon Valley are Food Preparation & Serving (20 | 17.5%), Security & Protection (4 | 3.5%), Law Enforcement (3 | 2.6%), Healthcare Support (2 | 1.8%), and Firefighting & Prevention (1 | 0.9%).
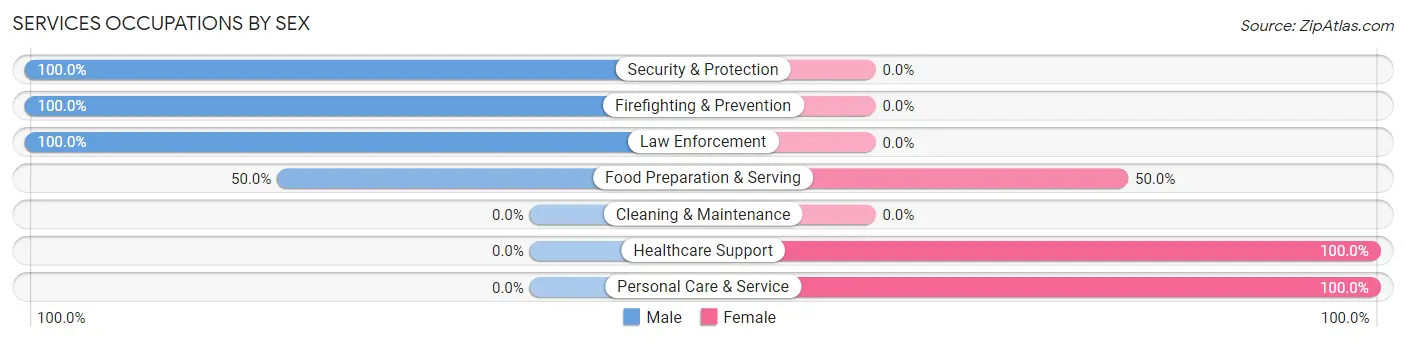
Services Occupations by Sex
Within the Services occupations in Wixon Valley, the most male-oriented occupations are Security & Protection (100.0%), Firefighting & Prevention (100.0%), and Law Enforcement (100.0%), while the most female-oriented occupations are Healthcare Support (100.0%), Personal Care & Service (100.0%), and Food Preparation & Serving (50.0%).
| Occupation | Male | Female |
| Healthcare Support | 0 (0.0%) | 2 (100.0%) |
| Security & Protection | 4 (100.0%) | 0 (0.0%) |
| Firefighting & Prevention | 1 (100.0%) | 0 (0.0%) |
| Law Enforcement | 3 (100.0%) | 0 (0.0%) |
| Food Preparation & Serving | 10 (50.0%) | 10 (50.0%) |
| Cleaning & Maintenance | 0 (0.0%) | 0 (0.0%) |
| Personal Care & Service | 0 (0.0%) | 1 (100.0%) |
| Total (Category) | 14 (51.8%) | 13 (48.1%) |
| Total (Overall) | 68 (59.7%) | 46 (40.4%) |
Sales and Office Occupations
The most common Sales and Office occupations in Wixon Valley are Office & Administration (29 | 25.4%), and Sales & Related (4 | 3.5%).
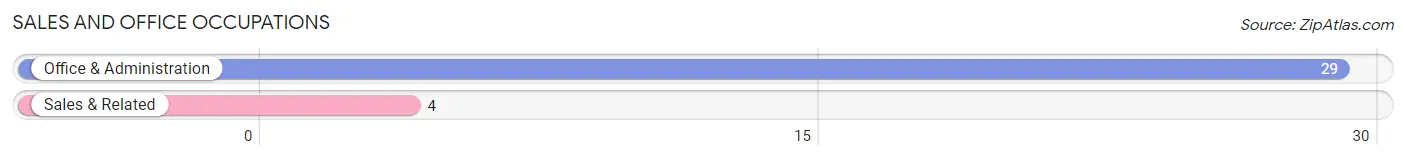
Sales and Office Occupations by Sex
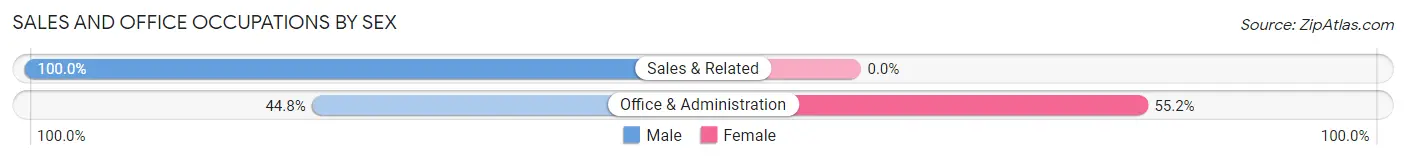
| Occupation | Male | Female |
| Sales & Related | 4 (100.0%) | 0 (0.0%) |
| Office & Administration | 13 (44.8%) | 16 (55.2%) |
| Total (Category) | 17 (51.5%) | 16 (48.5%) |
| Total (Overall) | 68 (59.7%) | 46 (40.4%) |
Natural Resources, Construction and Maintenance Occupations
The most common Natural Resources, Construction and Maintenance occupations in Wixon Valley are Construction & Extraction (12 | 10.5%), and Installation, Maintenance & Repair (4 | 3.5%).
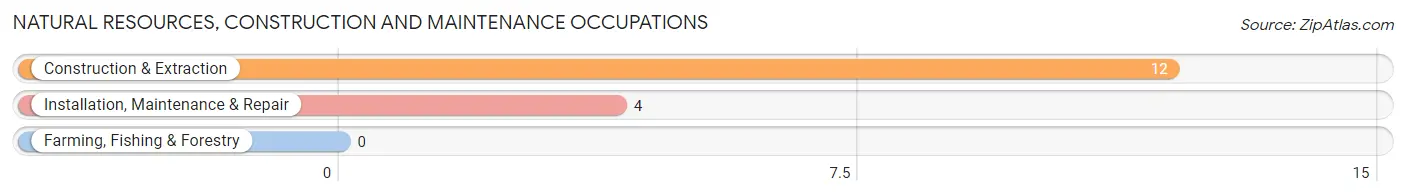
Natural Resources, Construction and Maintenance Occupations by Sex
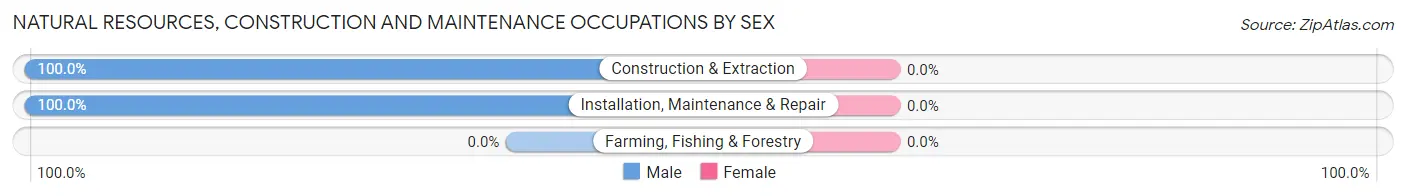
| Occupation | Male | Female |
| Farming, Fishing & Forestry | 0 (0.0%) | 0 (0.0%) |
| Construction & Extraction | 12 (100.0%) | 0 (0.0%) |
| Installation, Maintenance & Repair | 4 (100.0%) | 0 (0.0%) |
| Total (Category) | 16 (100.0%) | 0 (0.0%) |
| Total (Overall) | 68 (59.7%) | 46 (40.4%) |
Production, Transportation and Moving Occupations
The most common Production, Transportation and Moving occupations in Wixon Valley are Production (2 | 1.8%), and Transportation (2 | 1.8%).
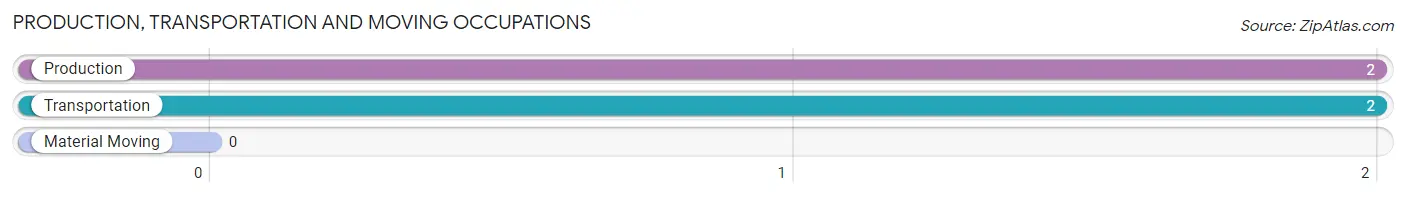
Production, Transportation and Moving Occupations by Sex
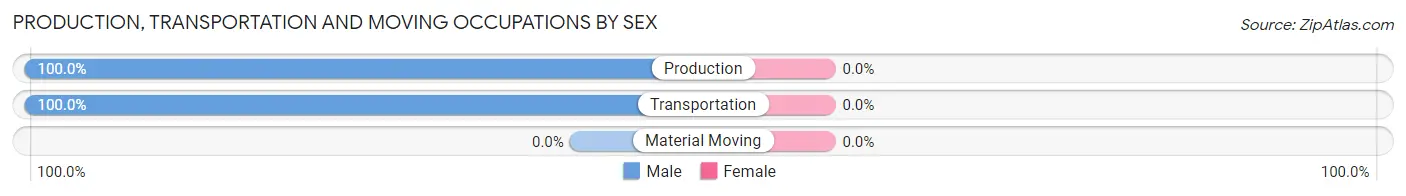
| Occupation | Male | Female |
| Production | 2 (100.0%) | 0 (0.0%) |
| Transportation | 2 (100.0%) | 0 (0.0%) |
| Material Moving | 0 (0.0%) | 0 (0.0%) |
| Total (Category) | 4 (100.0%) | 0 (0.0%) |
| Total (Overall) | 68 (59.7%) | 46 (40.4%) |
Employment Industries by Sex in Wixon Valley
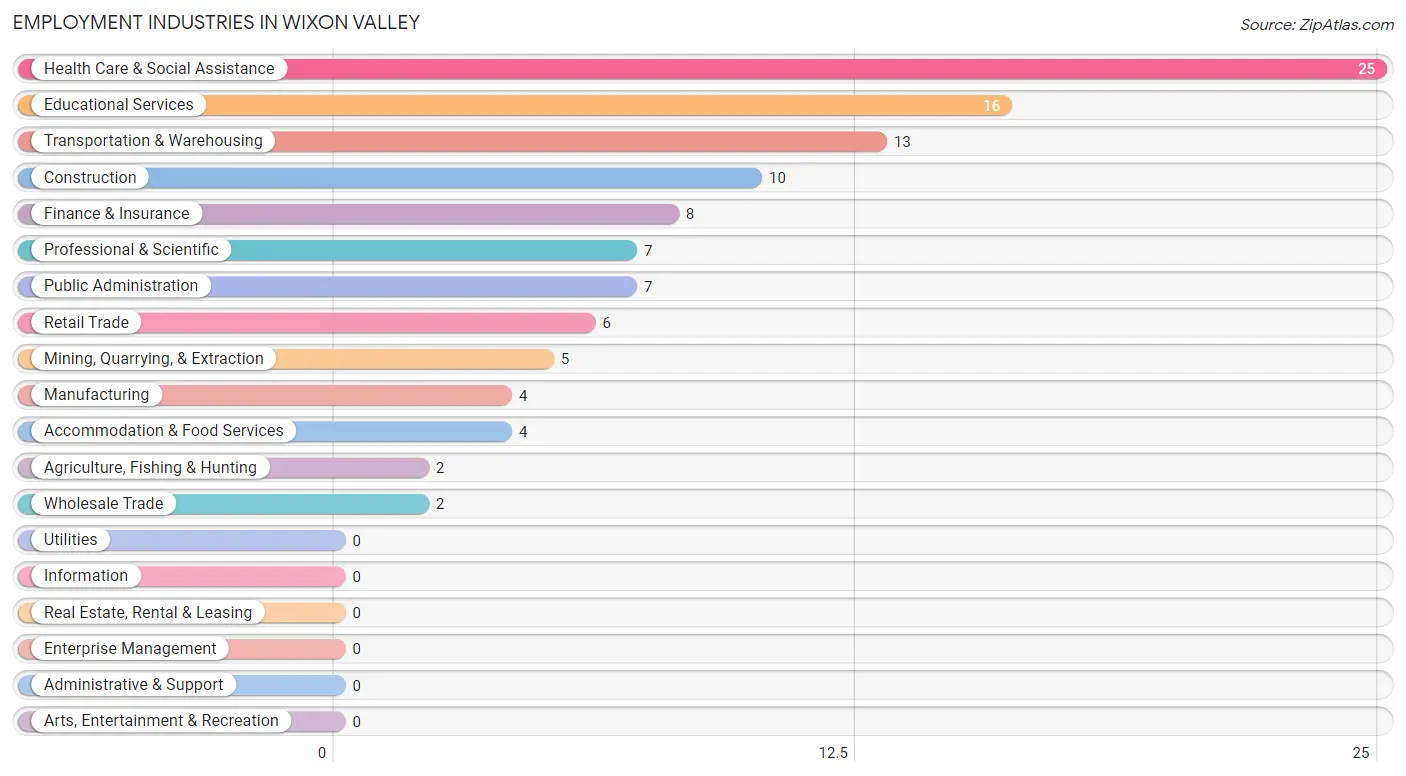
Employment Industries in Wixon Valley
The major employment industries in Wixon Valley include Health Care & Social Assistance (25 | 21.9%), Educational Services (16 | 14.0%), Transportation & Warehousing (13 | 11.4%), Construction (10 | 8.8%), and Finance & Insurance (8 | 7.0%).
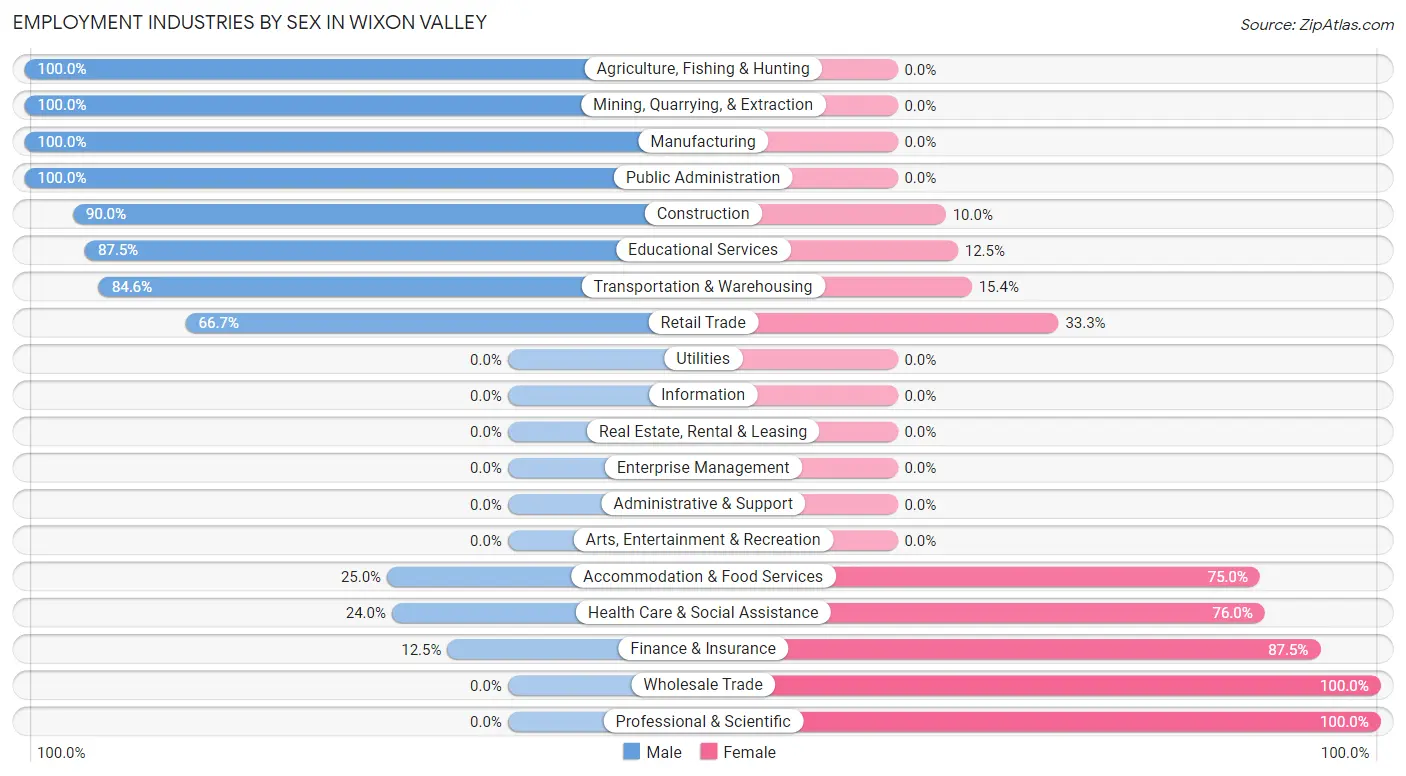
Employment Industries by Sex in Wixon Valley
The Wixon Valley industries that see more men than women are Agriculture, Fishing & Hunting (100.0%), Mining, Quarrying, & Extraction (100.0%), and Manufacturing (100.0%), whereas the industries that tend to have a higher number of women are Wholesale Trade (100.0%), Professional & Scientific (100.0%), and Finance & Insurance (87.5%).
| Industry | Male | Female |
| Agriculture, Fishing & Hunting | 2 (100.0%) | 0 (0.0%) |
| Mining, Quarrying, & Extraction | 5 (100.0%) | 0 (0.0%) |
| Construction | 9 (90.0%) | 1 (10.0%) |
| Manufacturing | 4 (100.0%) | 0 (0.0%) |
| Wholesale Trade | 0 (0.0%) | 2 (100.0%) |
| Retail Trade | 4 (66.7%) | 2 (33.3%) |
| Transportation & Warehousing | 11 (84.6%) | 2 (15.4%) |
| Utilities | 0 (0.0%) | 0 (0.0%) |
| Information | 0 (0.0%) | 0 (0.0%) |
| Finance & Insurance | 1 (12.5%) | 7 (87.5%) |
| Real Estate, Rental & Leasing | 0 (0.0%) | 0 (0.0%) |
| Professional & Scientific | 0 (0.0%) | 7 (100.0%) |
| Enterprise Management | 0 (0.0%) | 0 (0.0%) |
| Administrative & Support | 0 (0.0%) | 0 (0.0%) |
| Educational Services | 14 (87.5%) | 2 (12.5%) |
| Health Care & Social Assistance | 6 (24.0%) | 19 (76.0%) |
| Arts, Entertainment & Recreation | 0 (0.0%) | 0 (0.0%) |
| Accommodation & Food Services | 1 (25.0%) | 3 (75.0%) |
| Public Administration | 7 (100.0%) | 0 (0.0%) |
| Total | 68 (59.7%) | 46 (40.4%) |
Education in Wixon Valley
School Enrollment in Wixon Valley
The most common levels of schooling among the 36 students in Wixon Valley are middle school (11 | 30.6%), college / undergraduate (11 | 30.6%), and elementary school (7 | 19.4%).
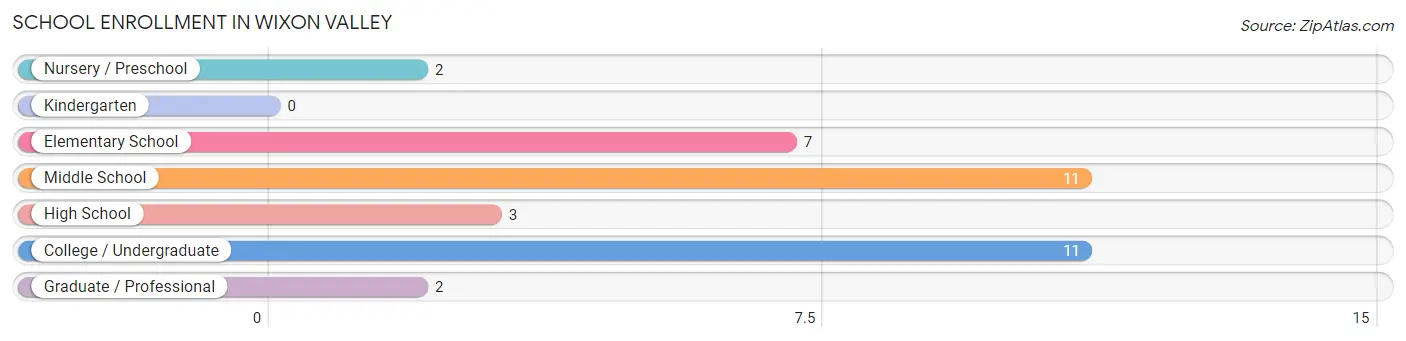
| School Level | # Students | % Students |
| Nursery / Preschool | 2 | 5.6% |
| Kindergarten | 0 | 0.0% |
| Elementary School | 7 | 19.4% |
| Middle School | 11 | 30.6% |
| High School | 3 | 8.3% |
| College / Undergraduate | 11 | 30.6% |
| Graduate / Professional | 2 | 5.6% |
| Total | 36 | 100.0% |
School Enrollment by Age by Funding Source in Wixon Valley
Out of a total of 36 students who are enrolled in schools in Wixon Valley, 5 (13.9%) attend a private institution, while the remaining 31 (86.1%) are enrolled in public schools. The age group of 15 to 17 year olds has the highest likelihood of being enrolled in private schools, with 1 (33.3% in the age bracket) enrolled. Conversely, the age group of 3 to 4 year olds has the lowest likelihood of being enrolled in a private school, with 2 (100.0% in the age bracket) attending a public institution.
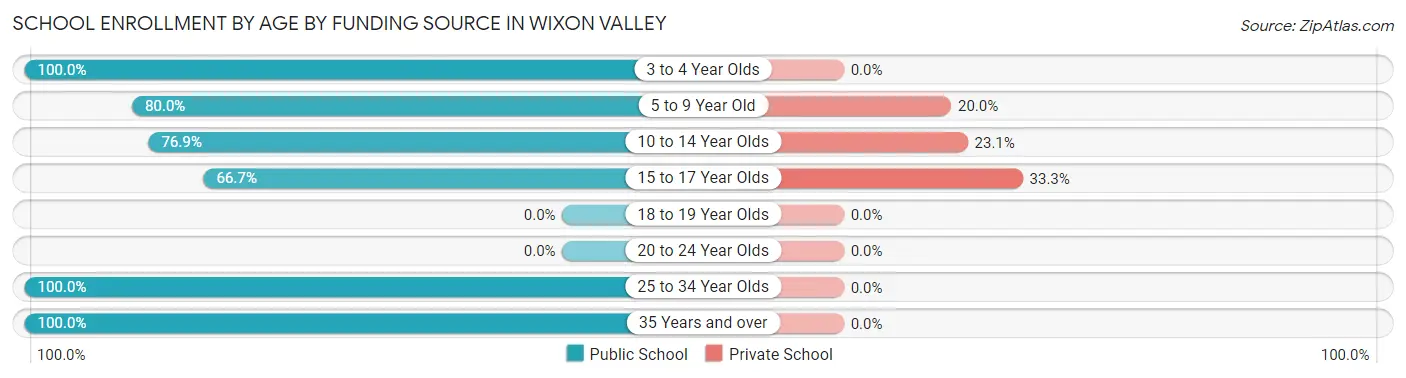
| Age Bracket | Public School | Private School |
| 3 to 4 Year Olds | 2 (100.0%) | 0 (0.0%) |
| 5 to 9 Year Old | 4 (80.0%) | 1 (20.0%) |
| 10 to 14 Year Olds | 10 (76.9%) | 3 (23.1%) |
| 15 to 17 Year Olds | 2 (66.7%) | 1 (33.3%) |
| 18 to 19 Year Olds | 0 (0.0%) | 0 (0.0%) |
| 20 to 24 Year Olds | 0 (0.0%) | 0 (0.0%) |
| 25 to 34 Year Olds | 7 (100.0%) | 0 (0.0%) |
| 35 Years and over | 6 (100.0%) | 0 (0.0%) |
| Total | 31 (86.1%) | 5 (13.9%) |
Educational Attainment by Field of Study in Wixon Valley
Bio, nature & agricultural (18 | 42.9%), education (10 | 23.8%), science & technology (5 | 11.9%), business (4 | 9.5%), and social sciences (2 | 4.8%) are the most common fields of study among 42 individuals in Wixon Valley who have obtained a bachelor's degree or higher.
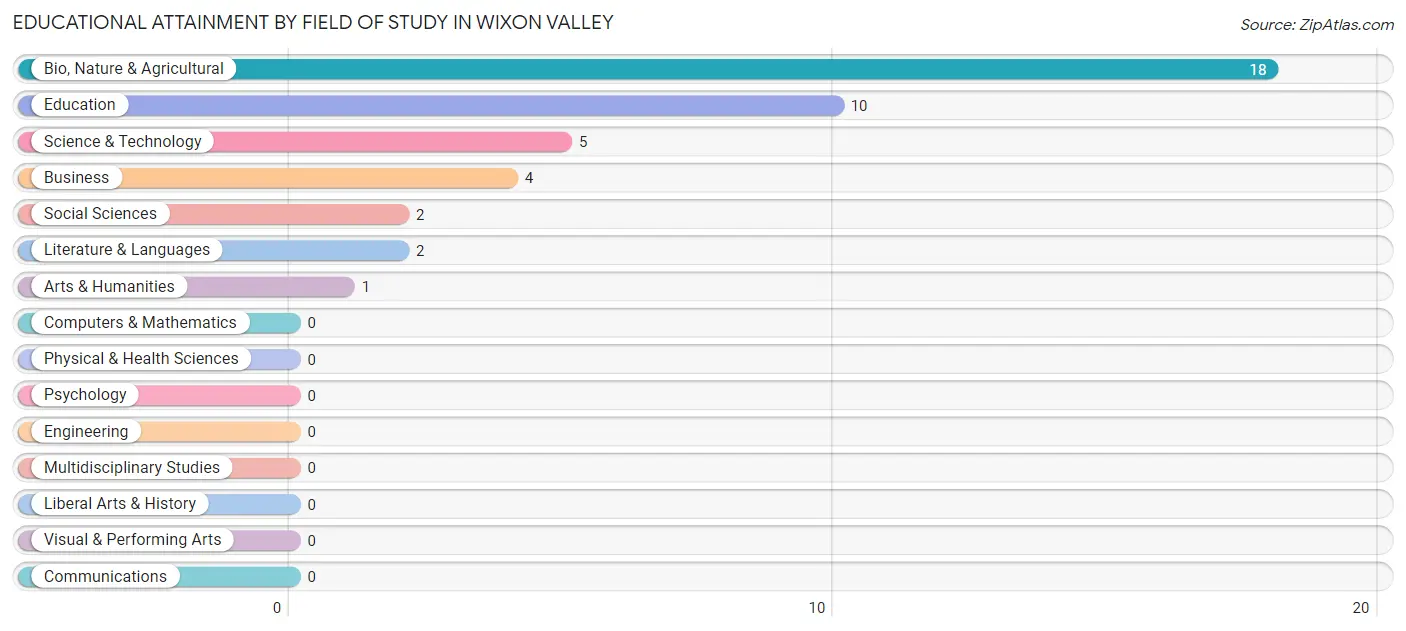
| Field of Study | # Graduates | % Graduates |
| Computers & Mathematics | 0 | 0.0% |
| Bio, Nature & Agricultural | 18 | 42.9% |
| Physical & Health Sciences | 0 | 0.0% |
| Psychology | 0 | 0.0% |
| Social Sciences | 2 | 4.8% |
| Engineering | 0 | 0.0% |
| Multidisciplinary Studies | 0 | 0.0% |
| Science & Technology | 5 | 11.9% |
| Business | 4 | 9.5% |
| Education | 10 | 23.8% |
| Literature & Languages | 2 | 4.8% |
| Liberal Arts & History | 0 | 0.0% |
| Visual & Performing Arts | 0 | 0.0% |
| Communications | 0 | 0.0% |
| Arts & Humanities | 1 | 2.4% |
| Total | 42 | 100.0% |
Transportation & Commute in Wixon Valley
Vehicle Availability by Sex in Wixon Valley
The most prevalent vehicle ownership categories in Wixon Valley are males with 2 vehicles (22, accounting for 32.4%) and females with 2 vehicles (25, making up 47.8%).
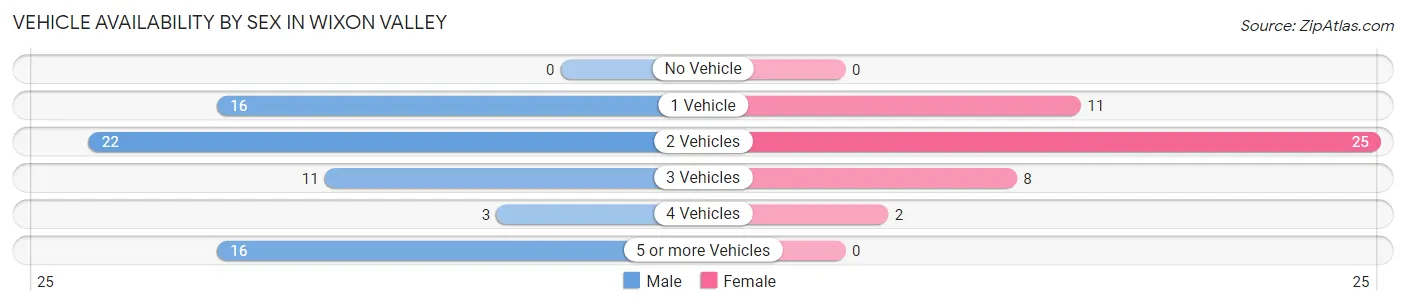
| Vehicles Available | Male | Female |
| No Vehicle | 0 (0.0%) | 0 (0.0%) |
| 1 Vehicle | 16 (23.5%) | 11 (23.9%) |
| 2 Vehicles | 22 (32.4%) | 25 (54.3%) |
| 3 Vehicles | 11 (16.2%) | 8 (17.4%) |
| 4 Vehicles | 3 (4.4%) | 2 (4.3%) |
| 5 or more Vehicles | 16 (23.5%) | 0 (0.0%) |
| Total | 68 (100.0%) | 46 (100.0%) |
Commute Time in Wixon Valley
The most frequently occuring commute durations in Wixon Valley are 15 to 19 minutes (35 commuters, 33.7%), 10 to 14 minutes (23 commuters, 22.1%), and 30 to 34 minutes (12 commuters, 11.5%).
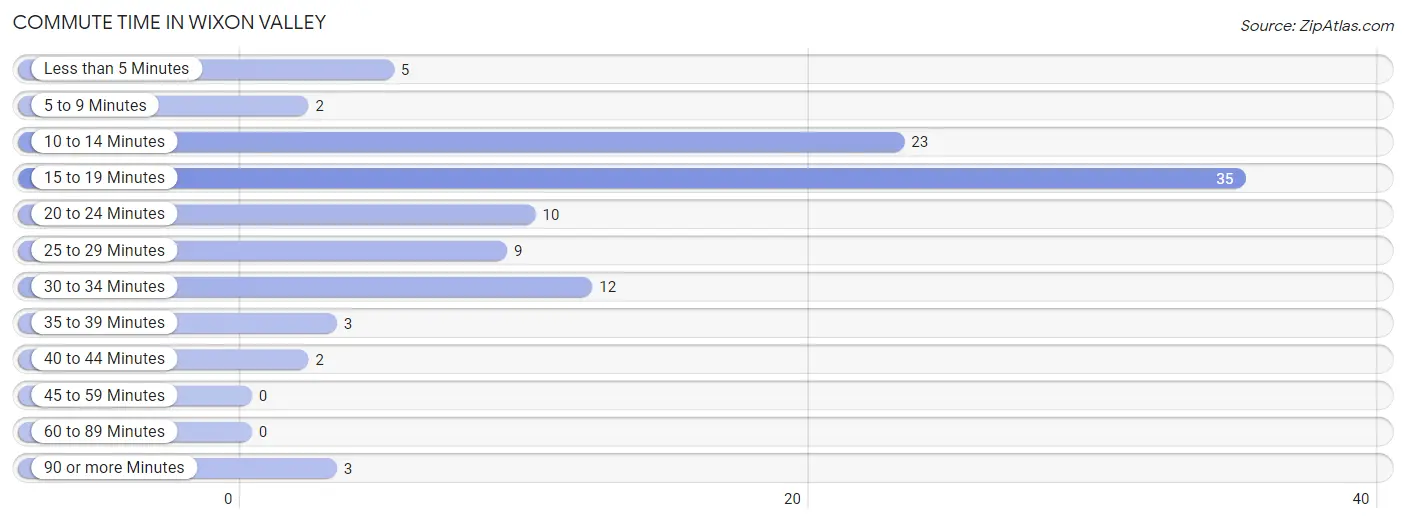
| Commute Time | # Commuters | % Commuters |
| Less than 5 Minutes | 5 | 4.8% |
| 5 to 9 Minutes | 2 | 1.9% |
| 10 to 14 Minutes | 23 | 22.1% |
| 15 to 19 Minutes | 35 | 33.7% |
| 20 to 24 Minutes | 10 | 9.6% |
| 25 to 29 Minutes | 9 | 8.6% |
| 30 to 34 Minutes | 12 | 11.5% |
| 35 to 39 Minutes | 3 | 2.9% |
| 40 to 44 Minutes | 2 | 1.9% |
| 45 to 59 Minutes | 0 | 0.0% |
| 60 to 89 Minutes | 0 | 0.0% |
| 90 or more Minutes | 3 | 2.9% |
Commute Time by Sex in Wixon Valley
The most common commute times in Wixon Valley are 10 to 14 minutes (21 commuters, 30.9%) for males and 15 to 19 minutes (19 commuters, 52.8%) for females.
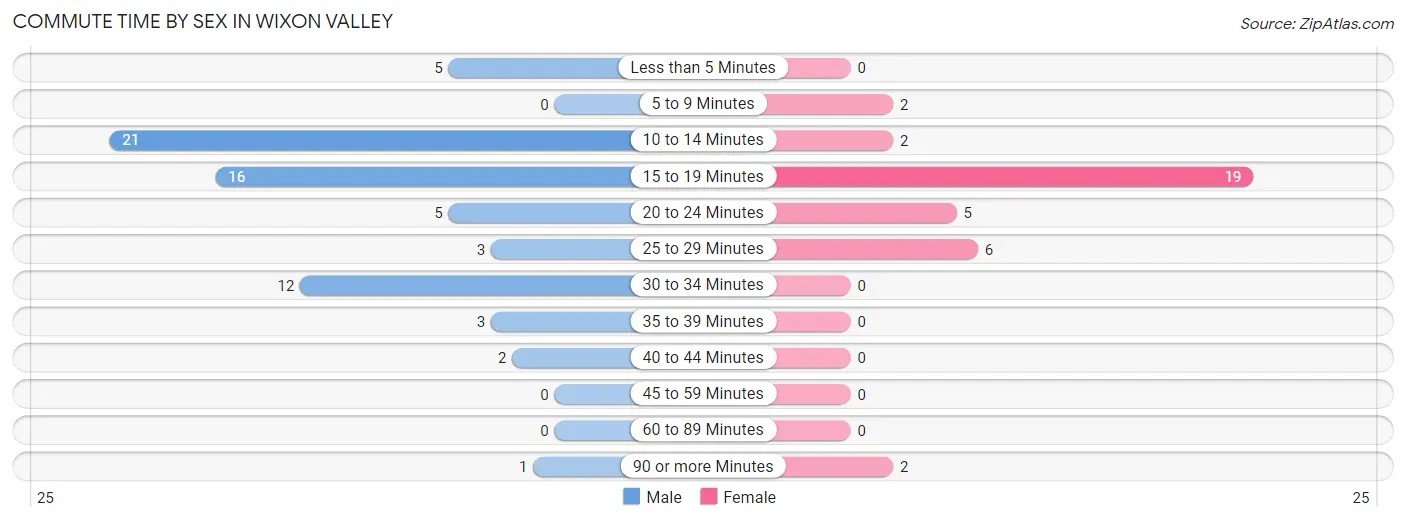
| Commute Time | Male | Female |
| Less than 5 Minutes | 5 (7.3%) | 0 (0.0%) |
| 5 to 9 Minutes | 0 (0.0%) | 2 (5.6%) |
| 10 to 14 Minutes | 21 (30.9%) | 2 (5.6%) |
| 15 to 19 Minutes | 16 (23.5%) | 19 (52.8%) |
| 20 to 24 Minutes | 5 (7.3%) | 5 (13.9%) |
| 25 to 29 Minutes | 3 (4.4%) | 6 (16.7%) |
| 30 to 34 Minutes | 12 (17.6%) | 0 (0.0%) |
| 35 to 39 Minutes | 3 (4.4%) | 0 (0.0%) |
| 40 to 44 Minutes | 2 (2.9%) | 0 (0.0%) |
| 45 to 59 Minutes | 0 (0.0%) | 0 (0.0%) |
| 60 to 89 Minutes | 0 (0.0%) | 0 (0.0%) |
| 90 or more Minutes | 1 (1.5%) | 2 (5.6%) |
Time of Departure to Work by Sex in Wixon Valley
The most frequent times of departure to work in Wixon Valley are 11:00 AM to 11:59 AM (16, 23.5%) for males and 8:00 AM to 8:29 AM (13, 36.1%) for females.
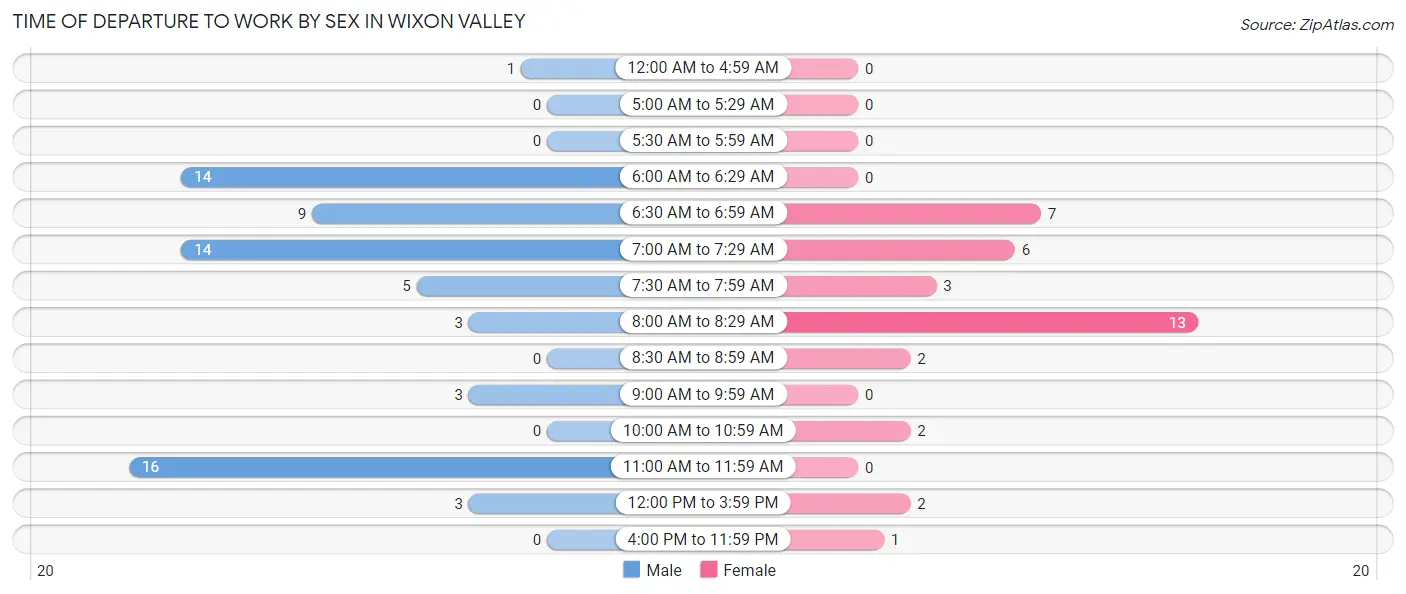
| Time of Departure | Male | Female |
| 12:00 AM to 4:59 AM | 1 (1.5%) | 0 (0.0%) |
| 5:00 AM to 5:29 AM | 0 (0.0%) | 0 (0.0%) |
| 5:30 AM to 5:59 AM | 0 (0.0%) | 0 (0.0%) |
| 6:00 AM to 6:29 AM | 14 (20.6%) | 0 (0.0%) |
| 6:30 AM to 6:59 AM | 9 (13.2%) | 7 (19.4%) |
| 7:00 AM to 7:29 AM | 14 (20.6%) | 6 (16.7%) |
| 7:30 AM to 7:59 AM | 5 (7.3%) | 3 (8.3%) |
| 8:00 AM to 8:29 AM | 3 (4.4%) | 13 (36.1%) |
| 8:30 AM to 8:59 AM | 0 (0.0%) | 2 (5.6%) |
| 9:00 AM to 9:59 AM | 3 (4.4%) | 0 (0.0%) |
| 10:00 AM to 10:59 AM | 0 (0.0%) | 2 (5.6%) |
| 11:00 AM to 11:59 AM | 16 (23.5%) | 0 (0.0%) |
| 12:00 PM to 3:59 PM | 3 (4.4%) | 2 (5.6%) |
| 4:00 PM to 11:59 PM | 0 (0.0%) | 1 (2.8%) |
| Total | 68 (100.0%) | 36 (100.0%) |
Housing Occupancy in Wixon Valley
Occupancy by Ownership in Wixon Valley
Of the total 93 dwellings in Wixon Valley, owner-occupied units account for 87 (93.5%), while renter-occupied units make up 6 (6.5%).
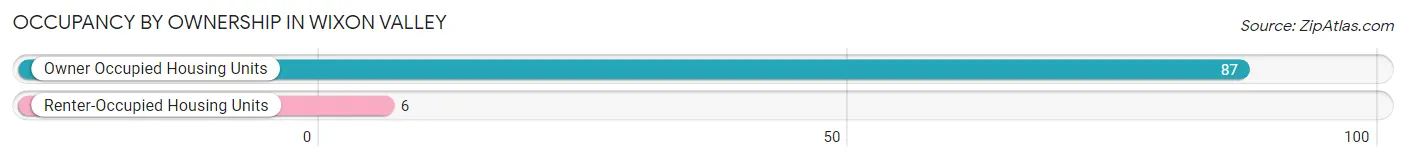
| Occupancy | # Housing Units | % Housing Units |
| Owner Occupied Housing Units | 87 | 93.5% |
| Renter-Occupied Housing Units | 6 | 6.5% |
| Total Occupied Housing Units | 93 | 100.0% |
Occupancy by Household Size in Wixon Valley
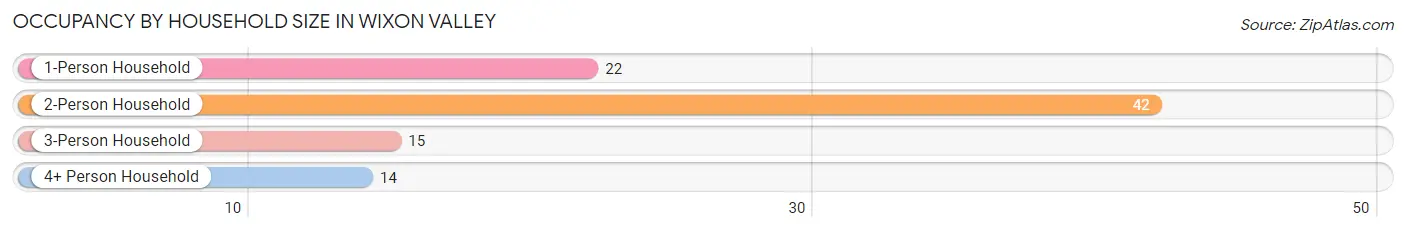
| Household Size | # Housing Units | % Housing Units |
| 1-Person Household | 22 | 23.7% |
| 2-Person Household | 42 | 45.2% |
| 3-Person Household | 15 | 16.1% |
| 4+ Person Household | 14 | 15.0% |
| Total Housing Units | 93 | 100.0% |
Occupancy by Ownership by Household Size in Wixon Valley
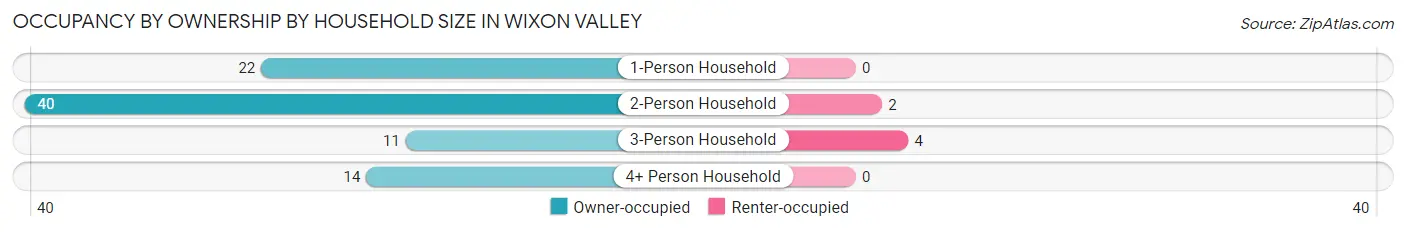
| Household Size | Owner-occupied | Renter-occupied |
| 1-Person Household | 22 (100.0%) | 0 (0.0%) |
| 2-Person Household | 40 (95.2%) | 2 (4.8%) |
| 3-Person Household | 11 (73.3%) | 4 (26.7%) |
| 4+ Person Household | 14 (100.0%) | 0 (0.0%) |
| Total Housing Units | 87 (93.5%) | 6 (6.5%) |
Occupancy by Educational Attainment in Wixon Valley
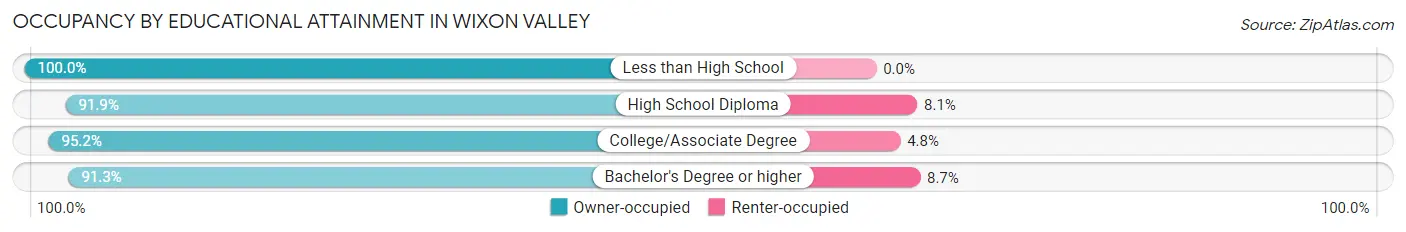
| Household Size | Owner-occupied | Renter-occupied |
| Less than High School | 12 (100.0%) | 0 (0.0%) |
| High School Diploma | 34 (91.9%) | 3 (8.1%) |
| College/Associate Degree | 20 (95.2%) | 1 (4.8%) |
| Bachelor's Degree or higher | 21 (91.3%) | 2 (8.7%) |
Occupancy by Age of Householder in Wixon Valley
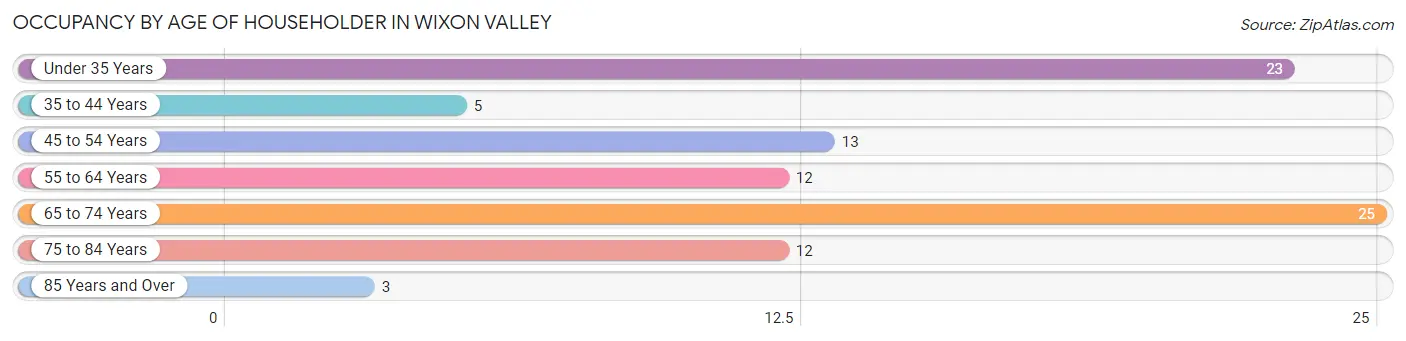
| Age Bracket | # Households | % Households |
| Under 35 Years | 23 | 24.7% |
| 35 to 44 Years | 5 | 5.4% |
| 45 to 54 Years | 13 | 14.0% |
| 55 to 64 Years | 12 | 12.9% |
| 65 to 74 Years | 25 | 26.9% |
| 75 to 84 Years | 12 | 12.9% |
| 85 Years and Over | 3 | 3.2% |
| Total | 93 | 100.0% |
Housing Finances in Wixon Valley
Median Income by Occupancy in Wixon Valley
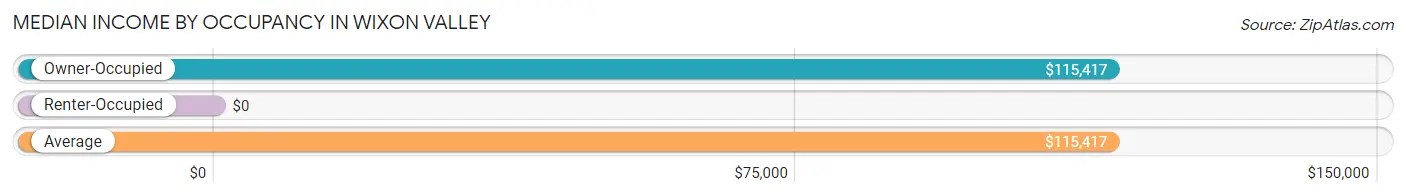
| Occupancy Type | # Households | Median Income |
| Owner-Occupied | 87 (93.5%) | $115,417 |
| Renter-Occupied | 6 (6.5%) | $0 |
| Average | 93 (100.0%) | $115,417 |
Occupancy by Householder Income Bracket in Wixon Valley
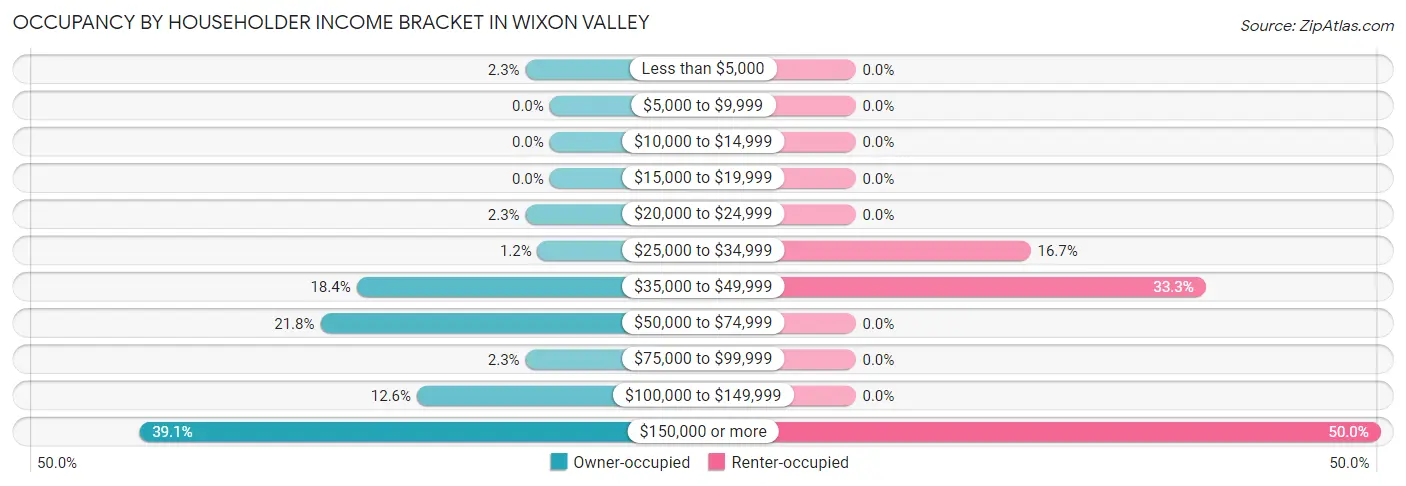
| Income Bracket | Owner-occupied | Renter-occupied |
| Less than $5,000 | 2 (2.3%) | 0 (0.0%) |
| $5,000 to $9,999 | 0 (0.0%) | 0 (0.0%) |
| $10,000 to $14,999 | 0 (0.0%) | 0 (0.0%) |
| $15,000 to $19,999 | 0 (0.0%) | 0 (0.0%) |
| $20,000 to $24,999 | 2 (2.3%) | 0 (0.0%) |
| $25,000 to $34,999 | 1 (1.1%) | 1 (16.7%) |
| $35,000 to $49,999 | 16 (18.4%) | 2 (33.3%) |
| $50,000 to $74,999 | 19 (21.8%) | 0 (0.0%) |
| $75,000 to $99,999 | 2 (2.3%) | 0 (0.0%) |
| $100,000 to $149,999 | 11 (12.6%) | 0 (0.0%) |
| $150,000 or more | 34 (39.1%) | 3 (50.0%) |
| Total | 87 (100.0%) | 6 (100.0%) |
Monthly Housing Cost Tiers in Wixon Valley
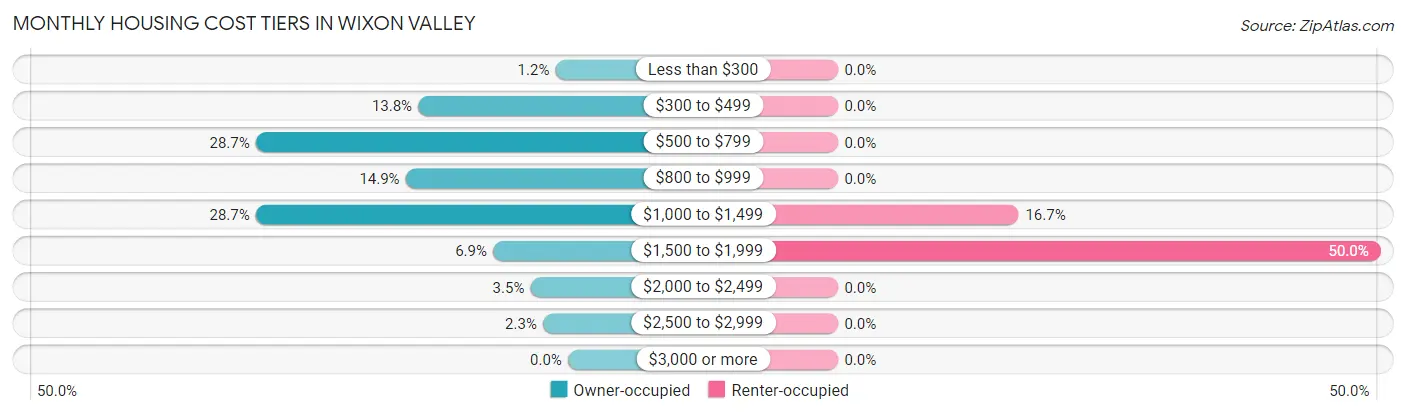
| Monthly Cost | Owner-occupied | Renter-occupied |
| Less than $300 | 1 (1.1%) | 0 (0.0%) |
| $300 to $499 | 12 (13.8%) | 0 (0.0%) |
| $500 to $799 | 25 (28.7%) | 0 (0.0%) |
| $800 to $999 | 13 (14.9%) | 0 (0.0%) |
| $1,000 to $1,499 | 25 (28.7%) | 1 (16.7%) |
| $1,500 to $1,999 | 6 (6.9%) | 3 (50.0%) |
| $2,000 to $2,499 | 3 (3.5%) | 0 (0.0%) |
| $2,500 to $2,999 | 2 (2.3%) | 0 (0.0%) |
| $3,000 or more | 0 (0.0%) | 0 (0.0%) |
| Total | 87 (100.0%) | 6 (100.0%) |
Physical Housing Characteristics in Wixon Valley
Housing Structures in Wixon Valley
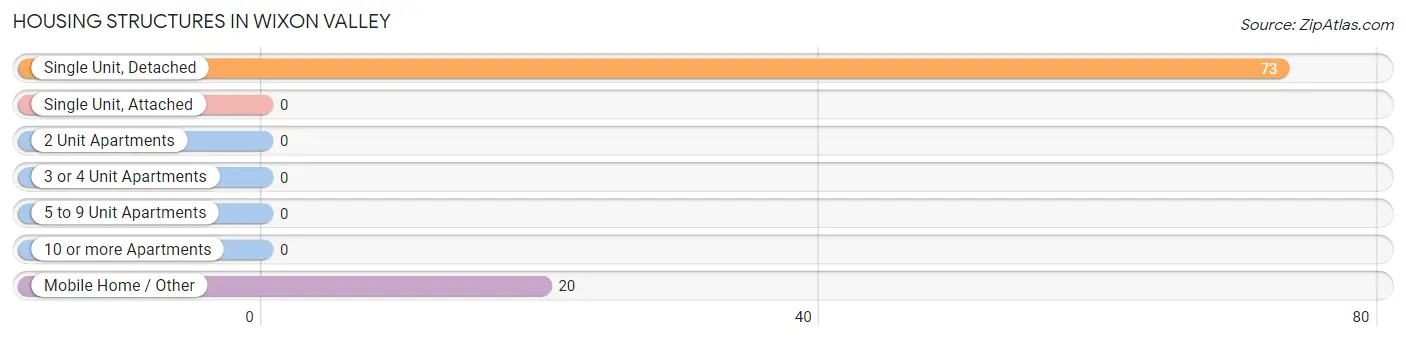
| Structure Type | # Housing Units | % Housing Units |
| Single Unit, Detached | 73 | 78.5% |
| Single Unit, Attached | 0 | 0.0% |
| 2 Unit Apartments | 0 | 0.0% |
| 3 or 4 Unit Apartments | 0 | 0.0% |
| 5 to 9 Unit Apartments | 0 | 0.0% |
| 10 or more Apartments | 0 | 0.0% |
| Mobile Home / Other | 20 | 21.5% |
| Total | 93 | 100.0% |
Housing Structures by Occupancy in Wixon Valley
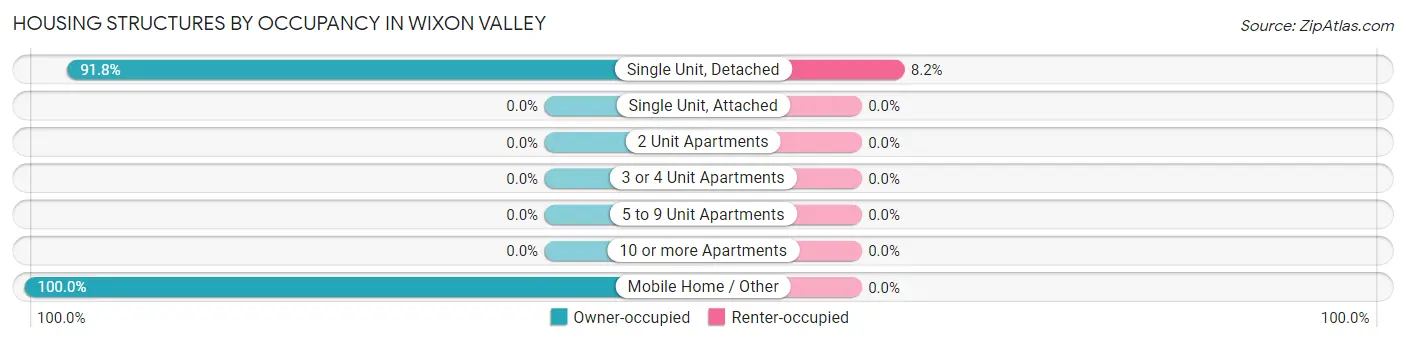
| Structure Type | Owner-occupied | Renter-occupied |
| Single Unit, Detached | 67 (91.8%) | 6 (8.2%) |
| Single Unit, Attached | 0 (0.0%) | 0 (0.0%) |
| 2 Unit Apartments | 0 (0.0%) | 0 (0.0%) |
| 3 or 4 Unit Apartments | 0 (0.0%) | 0 (0.0%) |
| 5 to 9 Unit Apartments | 0 (0.0%) | 0 (0.0%) |
| 10 or more Apartments | 0 (0.0%) | 0 (0.0%) |
| Mobile Home / Other | 20 (100.0%) | 0 (0.0%) |
| Total | 87 (93.5%) | 6 (6.5%) |
Housing Structures by Number of Rooms in Wixon Valley
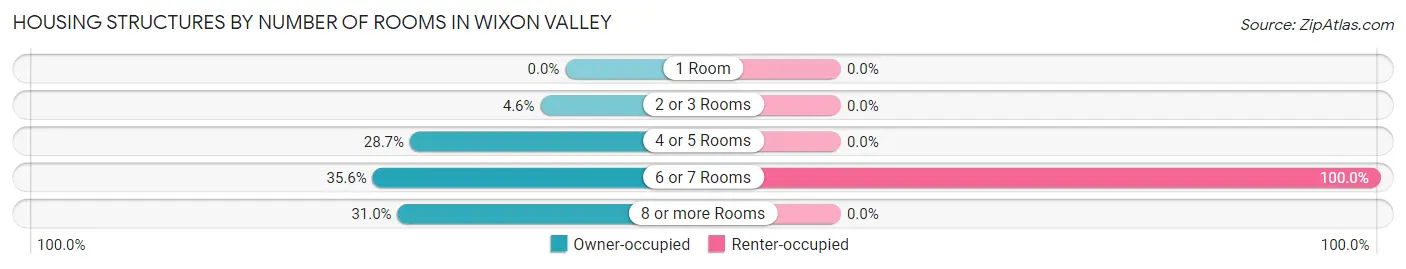
| Number of Rooms | Owner-occupied | Renter-occupied |
| 1 Room | 0 (0.0%) | 0 (0.0%) |
| 2 or 3 Rooms | 4 (4.6%) | 0 (0.0%) |
| 4 or 5 Rooms | 25 (28.7%) | 0 (0.0%) |
| 6 or 7 Rooms | 31 (35.6%) | 6 (100.0%) |
| 8 or more Rooms | 27 (31.0%) | 0 (0.0%) |
| Total | 87 (100.0%) | 6 (100.0%) |
Housing Structure by Heating Type in Wixon Valley
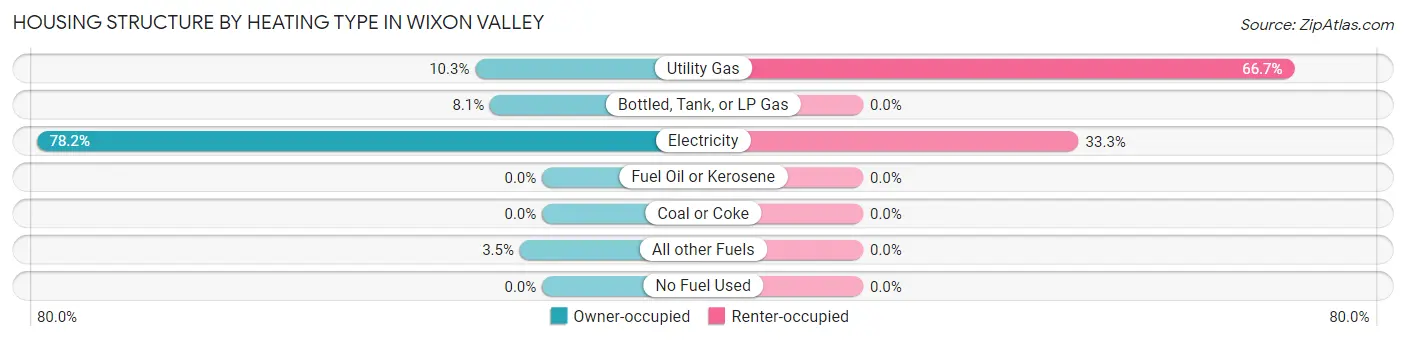
| Heating Type | Owner-occupied | Renter-occupied |
| Utility Gas | 9 (10.3%) | 4 (66.7%) |
| Bottled, Tank, or LP Gas | 7 (8.1%) | 0 (0.0%) |
| Electricity | 68 (78.2%) | 2 (33.3%) |
| Fuel Oil or Kerosene | 0 (0.0%) | 0 (0.0%) |
| Coal or Coke | 0 (0.0%) | 0 (0.0%) |
| All other Fuels | 3 (3.5%) | 0 (0.0%) |
| No Fuel Used | 0 (0.0%) | 0 (0.0%) |
| Total | 87 (100.0%) | 6 (100.0%) |
Household Vehicle Usage in Wixon Valley
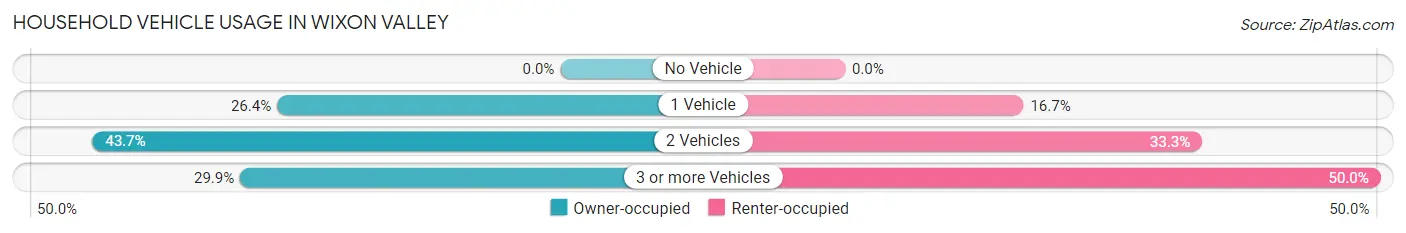
| Vehicles per Household | Owner-occupied | Renter-occupied |
| No Vehicle | 0 (0.0%) | 0 (0.0%) |
| 1 Vehicle | 23 (26.4%) | 1 (16.7%) |
| 2 Vehicles | 38 (43.7%) | 2 (33.3%) |
| 3 or more Vehicles | 26 (29.9%) | 3 (50.0%) |
| Total | 87 (100.0%) | 6 (100.0%) |
Real Estate & Mortgages in Wixon Valley
Real Estate and Mortgage Overview in Wixon Valley
| Characteristic | Without Mortgage | With Mortgage |
| Housing Units | 33 | 54 |
| Median Property Value | $287,500 | $264,700 |
| Median Household Income | $106,250 | $24 |
| Monthly Housing Costs | $539 | $0 |
| Real Estate Taxes | $2,550 | $10 |
Property Value by Mortgage Status in Wixon Valley
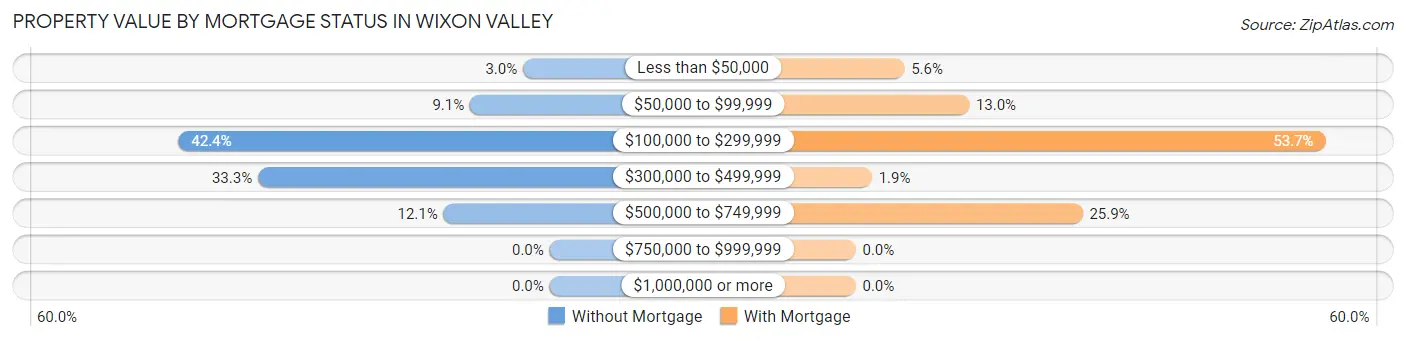
| Property Value | Without Mortgage | With Mortgage |
| Less than $50,000 | 1 (3.0%) | 3 (5.6%) |
| $50,000 to $99,999 | 3 (9.1%) | 7 (13.0%) |
| $100,000 to $299,999 | 14 (42.4%) | 29 (53.7%) |
| $300,000 to $499,999 | 11 (33.3%) | 1 (1.8%) |
| $500,000 to $749,999 | 4 (12.1%) | 14 (25.9%) |
| $750,000 to $999,999 | 0 (0.0%) | 0 (0.0%) |
| $1,000,000 or more | 0 (0.0%) | 0 (0.0%) |
| Total | 33 (100.0%) | 54 (100.0%) |
Household Income by Mortgage Status in Wixon Valley
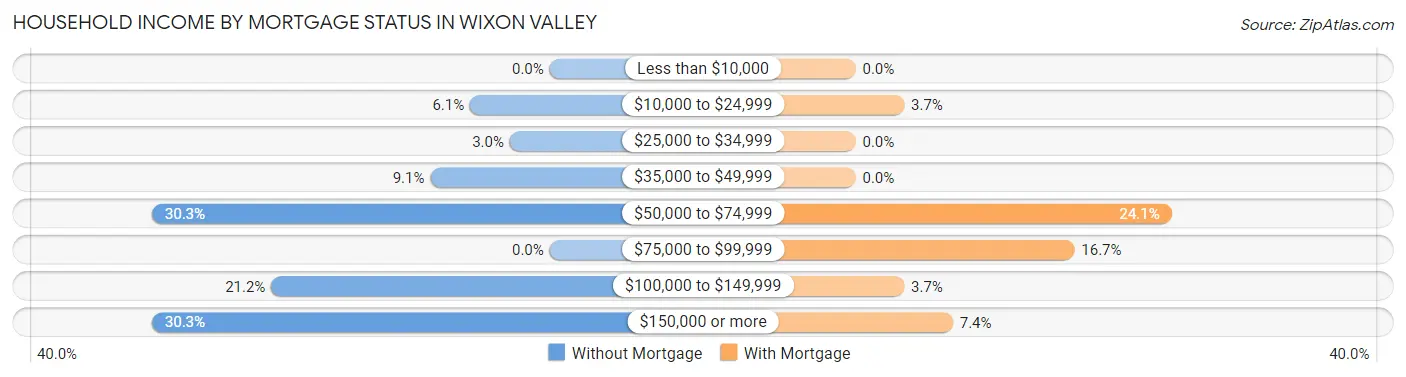
| Household Income | Without Mortgage | With Mortgage |
| Less than $10,000 | 0 (0.0%) | 0 (0.0%) |
| $10,000 to $24,999 | 2 (6.1%) | 2 (3.7%) |
| $25,000 to $34,999 | 1 (3.0%) | 0 (0.0%) |
| $35,000 to $49,999 | 3 (9.1%) | 0 (0.0%) |
| $50,000 to $74,999 | 10 (30.3%) | 13 (24.1%) |
| $75,000 to $99,999 | 0 (0.0%) | 9 (16.7%) |
| $100,000 to $149,999 | 7 (21.2%) | 2 (3.7%) |
| $150,000 or more | 10 (30.3%) | 4 (7.4%) |
| Total | 33 (100.0%) | 54 (100.0%) |
Property Value to Household Income Ratio in Wixon Valley
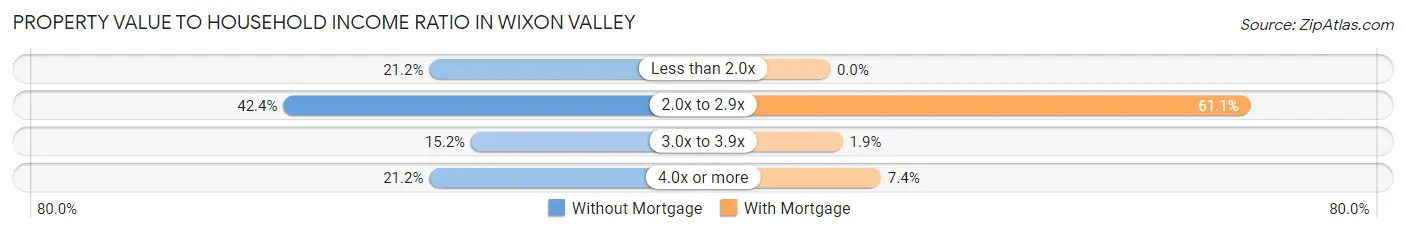
| Value-to-Income Ratio | Without Mortgage | With Mortgage |
| Less than 2.0x | 7 (21.2%) | 0 (0.0%) |
| 2.0x to 2.9x | 14 (42.4%) | 33 (61.1%) |
| 3.0x to 3.9x | 5 (15.1%) | 1 (1.8%) |
| 4.0x or more | 7 (21.2%) | 4 (7.4%) |
| Total | 33 (100.0%) | 54 (100.0%) |
Real Estate Taxes by Mortgage Status in Wixon Valley
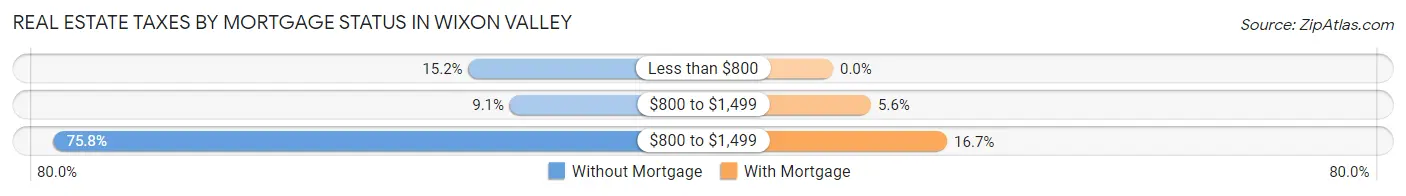
| Property Taxes | Without Mortgage | With Mortgage |
| Less than $800 | 5 (15.1%) | 0 (0.0%) |
| $800 to $1,499 | 3 (9.1%) | 3 (5.6%) |
| $800 to $1,499 | 25 (75.8%) | 9 (16.7%) |
| Total | 33 (100.0%) | 54 (100.0%) |
Health & Disability in Wixon Valley
Health Insurance Coverage by Age in Wixon Valley
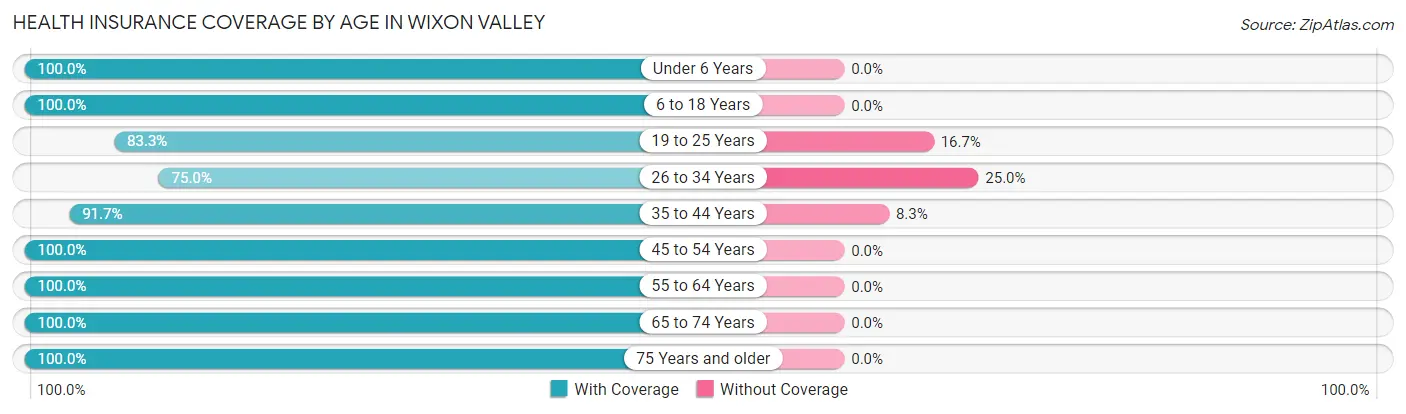
| Age Bracket | With Coverage | Without Coverage |
| Under 6 Years | 10 (100.0%) | 0 (0.0%) |
| 6 to 18 Years | 21 (100.0%) | 0 (0.0%) |
| 19 to 25 Years | 35 (83.3%) | 7 (16.7%) |
| 26 to 34 Years | 9 (75.0%) | 3 (25.0%) |
| 35 to 44 Years | 11 (91.7%) | 1 (8.3%) |
| 45 to 54 Years | 28 (100.0%) | 0 (0.0%) |
| 55 to 64 Years | 28 (100.0%) | 0 (0.0%) |
| 65 to 74 Years | 33 (100.0%) | 0 (0.0%) |
| 75 Years and older | 20 (100.0%) | 0 (0.0%) |
| Total | 195 (94.7%) | 11 (5.3%) |
Health Insurance Coverage by Citizenship Status in Wixon Valley
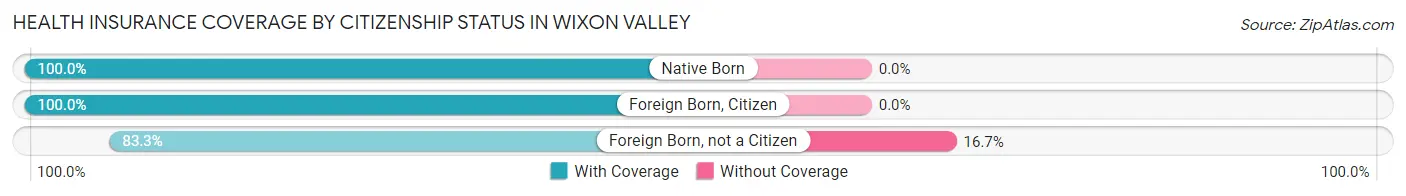
| Citizenship Status | With Coverage | Without Coverage |
| Native Born | 10 (100.0%) | 0 (0.0%) |
| Foreign Born, Citizen | 21 (100.0%) | 0 (0.0%) |
| Foreign Born, not a Citizen | 35 (83.3%) | 7 (16.7%) |
Health Insurance Coverage by Household Income in Wixon Valley
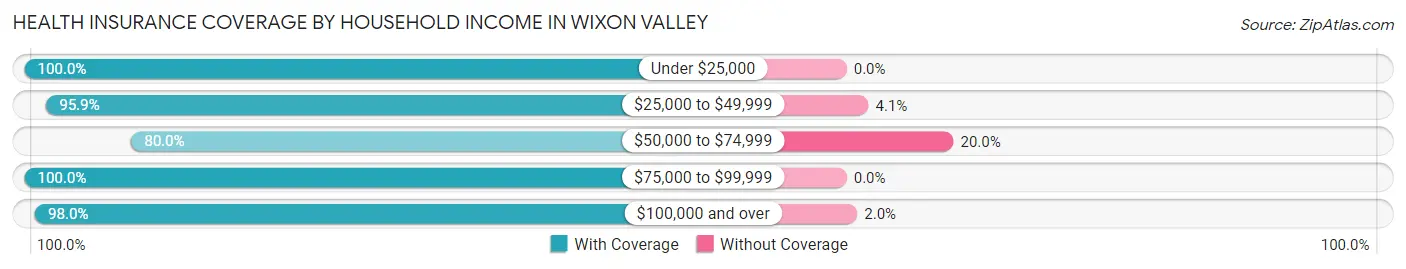
| Household Income | With Coverage | Without Coverage |
| Under $25,000 | 4 (100.0%) | 0 (0.0%) |
| $25,000 to $49,999 | 47 (95.9%) | 2 (4.1%) |
| $50,000 to $74,999 | 28 (80.0%) | 7 (20.0%) |
| $75,000 to $99,999 | 17 (100.0%) | 0 (0.0%) |
| $100,000 and over | 99 (98.0%) | 2 (2.0%) |
Public vs Private Health Insurance Coverage by Age in Wixon Valley
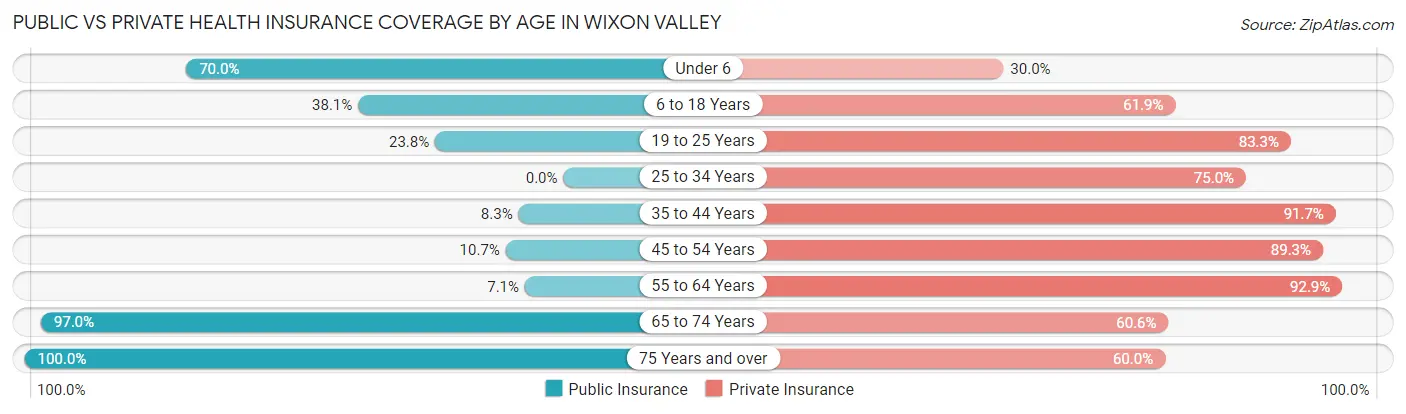
| Age Bracket | Public Insurance | Private Insurance |
| Under 6 | 7 (70.0%) | 3 (30.0%) |
| 6 to 18 Years | 8 (38.1%) | 13 (61.9%) |
| 19 to 25 Years | 10 (23.8%) | 35 (83.3%) |
| 25 to 34 Years | 0 (0.0%) | 9 (75.0%) |
| 35 to 44 Years | 1 (8.3%) | 11 (91.7%) |
| 45 to 54 Years | 3 (10.7%) | 25 (89.3%) |
| 55 to 64 Years | 2 (7.1%) | 26 (92.9%) |
| 65 to 74 Years | 32 (97.0%) | 20 (60.6%) |
| 75 Years and over | 20 (100.0%) | 12 (60.0%) |
| Total | 83 (40.3%) | 154 (74.8%) |
Disability Status by Sex by Age in Wixon Valley
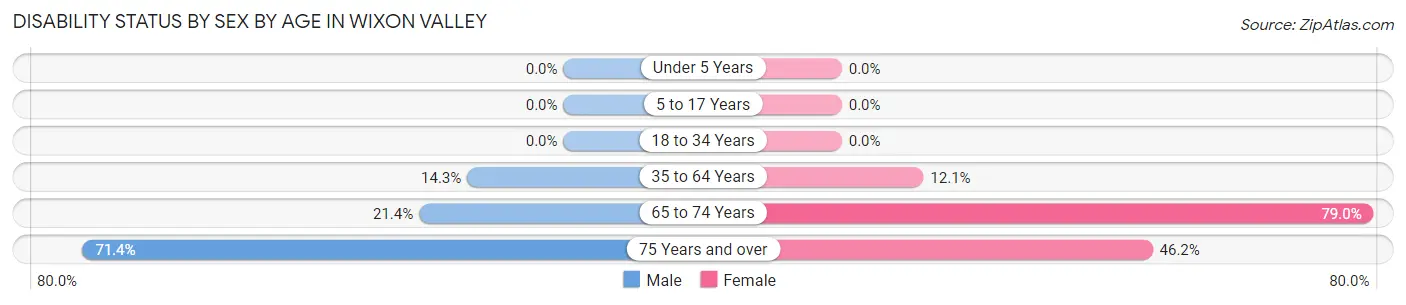
| Age Bracket | Male | Female |
| Under 5 Years | 0 (0.0%) | 0 (0.0%) |
| 5 to 17 Years | 0 (0.0%) | 0 (0.0%) |
| 18 to 34 Years | 0 (0.0%) | 0 (0.0%) |
| 35 to 64 Years | 5 (14.3%) | 4 (12.1%) |
| 65 to 74 Years | 3 (21.4%) | 15 (78.9%) |
| 75 Years and over | 5 (71.4%) | 6 (46.2%) |
Disability Class by Sex by Age in Wixon Valley
Disability Class: Hearing Difficulty
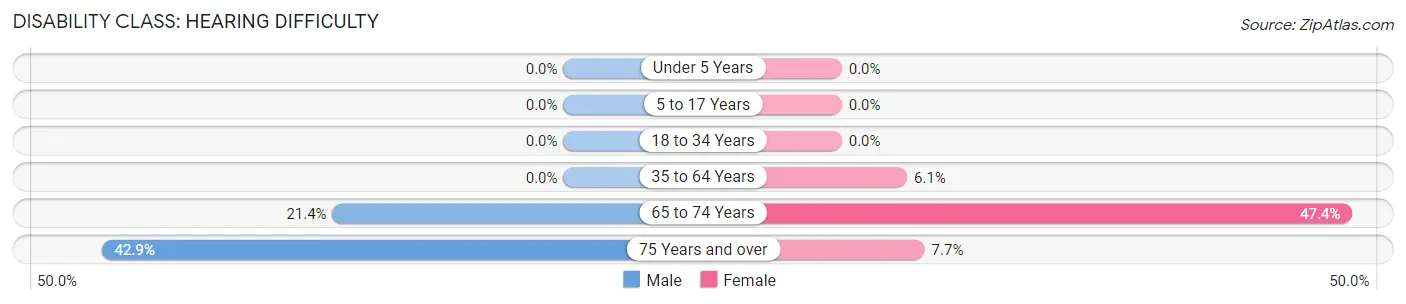
| Age Bracket | Male | Female |
| Under 5 Years | 0 (0.0%) | 0 (0.0%) |
| 5 to 17 Years | 0 (0.0%) | 0 (0.0%) |
| 18 to 34 Years | 0 (0.0%) | 0 (0.0%) |
| 35 to 64 Years | 0 (0.0%) | 2 (6.1%) |
| 65 to 74 Years | 3 (21.4%) | 9 (47.4%) |
| 75 Years and over | 3 (42.9%) | 1 (7.7%) |
Disability Class: Vision Difficulty
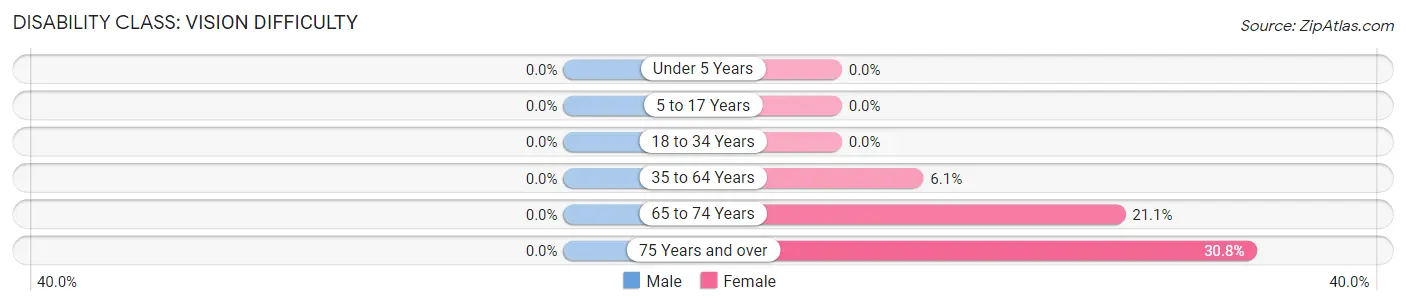
| Age Bracket | Male | Female |
| Under 5 Years | 0 (0.0%) | 0 (0.0%) |
| 5 to 17 Years | 0 (0.0%) | 0 (0.0%) |
| 18 to 34 Years | 0 (0.0%) | 0 (0.0%) |
| 35 to 64 Years | 0 (0.0%) | 2 (6.1%) |
| 65 to 74 Years | 0 (0.0%) | 4 (21.0%) |
| 75 Years and over | 0 (0.0%) | 4 (30.8%) |
Disability Class: Cognitive Difficulty
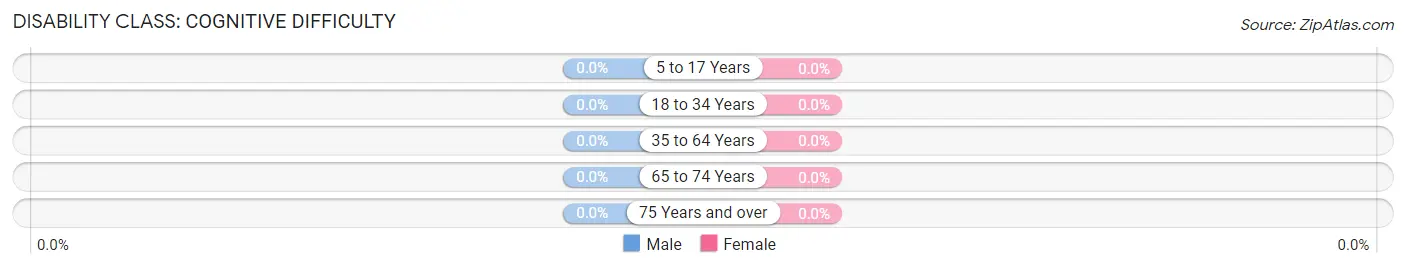
| Age Bracket | Male | Female |
| 5 to 17 Years | 0 (0.0%) | 0 (0.0%) |
| 18 to 34 Years | 0 (0.0%) | 0 (0.0%) |
| 35 to 64 Years | 0 (0.0%) | 0 (0.0%) |
| 65 to 74 Years | 0 (0.0%) | 0 (0.0%) |
| 75 Years and over | 0 (0.0%) | 0 (0.0%) |
Disability Class: Ambulatory Difficulty
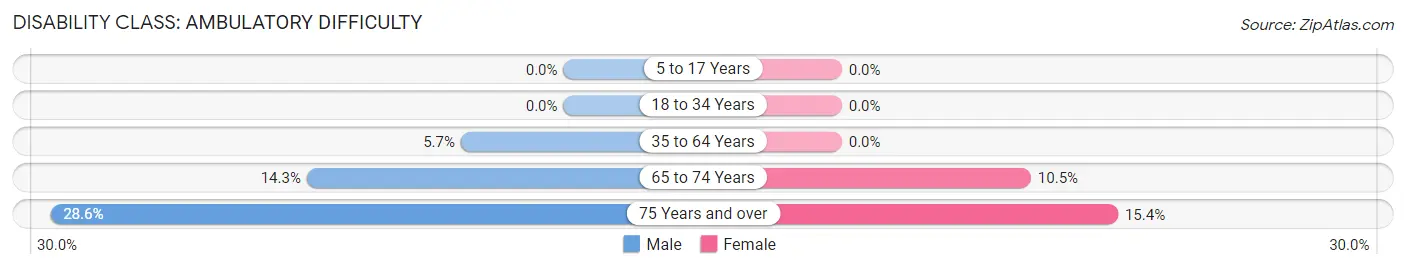
| Age Bracket | Male | Female |
| 5 to 17 Years | 0 (0.0%) | 0 (0.0%) |
| 18 to 34 Years | 0 (0.0%) | 0 (0.0%) |
| 35 to 64 Years | 2 (5.7%) | 0 (0.0%) |
| 65 to 74 Years | 2 (14.3%) | 2 (10.5%) |
| 75 Years and over | 2 (28.6%) | 2 (15.4%) |
Disability Class: Self-Care Difficulty
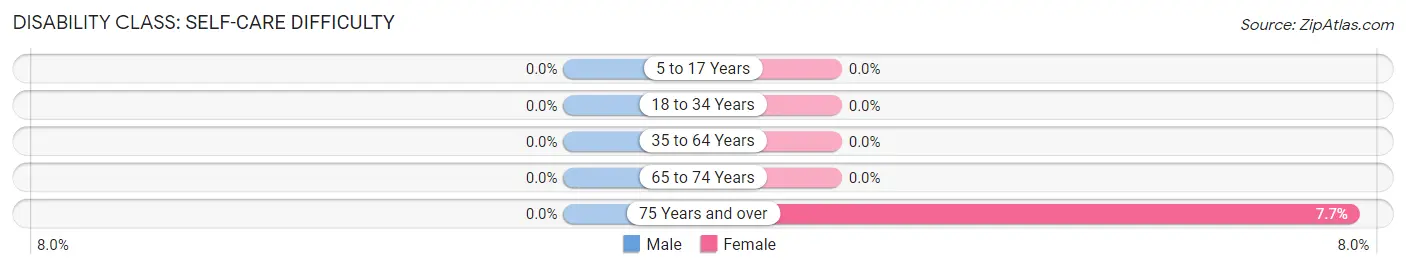
| Age Bracket | Male | Female |
| 5 to 17 Years | 0 (0.0%) | 0 (0.0%) |
| 18 to 34 Years | 0 (0.0%) | 0 (0.0%) |
| 35 to 64 Years | 0 (0.0%) | 0 (0.0%) |
| 65 to 74 Years | 0 (0.0%) | 0 (0.0%) |
| 75 Years and over | 0 (0.0%) | 1 (7.7%) |
Technology Access in Wixon Valley
Computing Device Access in Wixon Valley
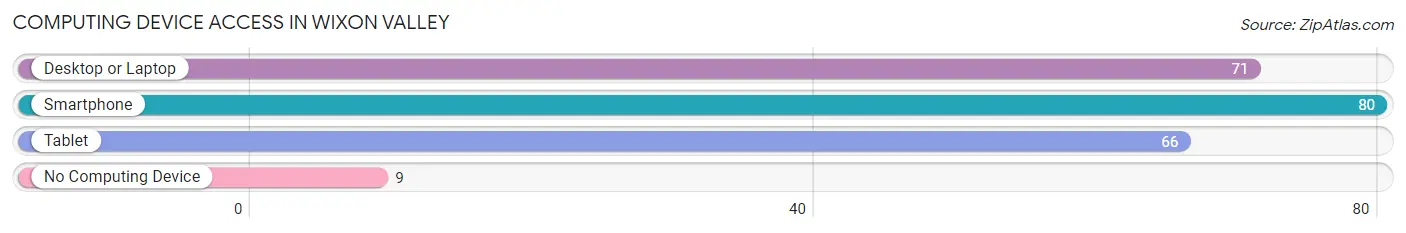
| Device Type | # Households | % Households |
| Desktop or Laptop | 71 | 76.3% |
| Smartphone | 80 | 86.0% |
| Tablet | 66 | 71.0% |
| No Computing Device | 9 | 9.7% |
| Total | 93 | 100.0% |
Internet Access in Wixon Valley
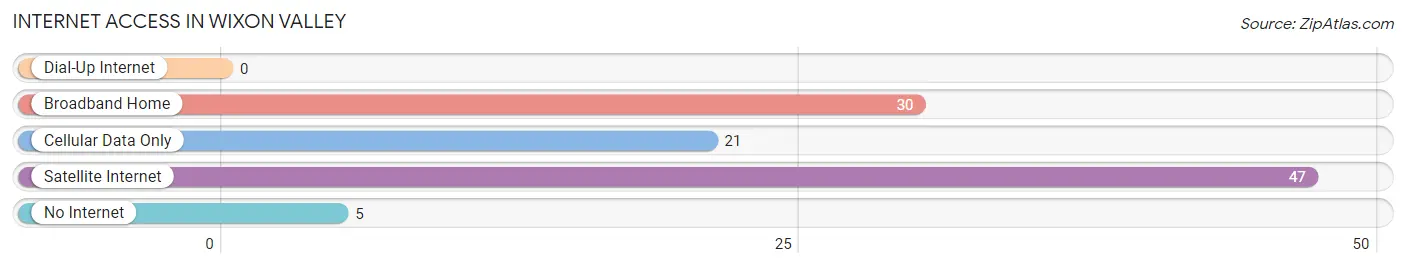
| Internet Type | # Households | % Households |
| Dial-Up Internet | 0 | 0.0% |
| Broadband Home | 30 | 32.3% |
| Cellular Data Only | 21 | 22.6% |
| Satellite Internet | 47 | 50.5% |
| No Internet | 5 | 5.4% |
| Total | 93 | 100.0% |
Wixon Valley Summary
Wixon Valley is a small unincorporated community located in the Texas Hill Country, in Gillespie County, Texas. It is situated about 10 miles south of Fredericksburg, and about 20 miles north of Kerrville. The population of Wixon Valley was estimated to be around 200 people in 2020.
History
Wixon Valley was first settled in the late 1800s by German immigrants. The area was originally known as “Wixon’s Valley”, named after the first settler, John Wixon. Wixon Valley was officially established in 1891, when the post office was established.
The area was primarily used for ranching and farming, and the community was largely self-sufficient. The local economy was based on the production of wool, cotton, and other agricultural products. The town also had a general store, a blacksmith shop, and a school.
In the early 1900s, the town began to decline as the railroad bypassed the area. The population decreased, and the town was eventually abandoned. In the late 1970s, the town was rediscovered by a group of local residents who wanted to preserve the area’s history. The town was restored and is now a popular tourist destination.
Geography
Wixon Valley is located in the Texas Hill Country, in Gillespie County, Texas. It is situated about 10 miles south of Fredericksburg, and about 20 miles north of Kerrville. The area is characterized by rolling hills, creeks, and limestone outcroppings. The climate is mild, with hot summers and cool winters.
The town is located on the banks of the Pedernales River, which is a popular spot for fishing, swimming, and canoeing. The area is also home to a variety of wildlife, including deer, wild turkeys, and armadillos.
Economy
The economy of Wixon Valley is largely based on tourism. The town is a popular destination for visitors who are looking to explore the area’s history and natural beauty. The town is also home to several wineries, which attract visitors from all over the state.
In addition to tourism, the town is also home to several small businesses, including a general store, a cafe, and a bed and breakfast. The town also has a small airport, which is used for private planes and helicopters.
Demographics
The population of Wixon Valley was estimated to be around 200 people in 2020. The town is predominantly white, with a small Hispanic population. The median household income is around $50,000, and the median home value is around $200,000. The town is served by the Fredericksburg Independent School District.
Common Questions
What is Per Capita Income in Wixon Valley?
Per Capita income in Wixon Valley is $59,214.
What is the Median Family Income in Wixon Valley?
Median Family Income in Wixon Valley is $111,250.
What is the Median Household income in Wixon Valley?
Median Household Income in Wixon Valley is $115,417.
What is Income or Wage Gap in Wixon Valley?
Income or Wage Gap in Wixon Valley is 6.7%.
Women in Wixon Valley earn 93.3 cents for every dollar earned by a man.
What is Inequality or Gini Index in Wixon Valley?
Inequality or Gini Index in Wixon Valley is 0.43.
What is the Total Population of Wixon Valley?
Total Population of Wixon Valley is 206.
What is the Total Male Population of Wixon Valley?
Total Male Population of Wixon Valley is 114.
What is the Total Female Population of Wixon Valley?
Total Female Population of Wixon Valley is 92.
What is the Ratio of Males per 100 Females in Wixon Valley?
There are 123.91 Males per 100 Females in Wixon Valley.
What is the Ratio of Females per 100 Males in Wixon Valley?
There are 80.70 Females per 100 Males in Wixon Valley.
What is the Median Population Age in Wixon Valley?
Median Population Age in Wixon Valley is 48.7 Years.
What is the Average Family Size in Wixon Valley
Average Family Size in Wixon Valley is 2.4 People.
What is the Average Household Size in Wixon Valley
Average Household Size in Wixon Valley is 2.2 People.
How Large is the Labor Force in Wixon Valley?
There are 125 People in the Labor Forcein in Wixon Valley.
What is the Percentage of People in the Labor Force in Wixon Valley?
70.6% of People are in the Labor Force in Wixon Valley.
What is the Unemployment Rate in Wixon Valley?
Unemployment Rate in Wixon Valley is 8.8%.