Shippenville borough, PA Map & Demographics
Shippenville borough Overview
$24,109
PER CAPITA INCOME
$58,250
AVG FAMILY INCOME
$45,865
AVG HOUSEHOLD INCOME
30.0%
WAGE / INCOME GAP [ % ]
70.0¢/ $1
WAGE / INCOME GAP [ $ ]
0.40
INEQUALITY / GINI INDEX
627
TOTAL POPULATION
305
MALE POPULATION
322
FEMALE POPULATION
94.72
MALES / 100 FEMALES
105.57
FEMALES / 100 MALES
34.6
MEDIAN AGE
3.0
AVG FAMILY SIZE
2.5
AVG HOUSEHOLD SIZE
282
LABOR FORCE [ PEOPLE ]
57.2%
PERCENT IN LABOR FORCE
5.3%
UNEMPLOYMENT RATE
Income in Shippenville borough
Income Overview in Shippenville borough
Per Capita Income in Shippenville borough is $24,109, while median incomes of families and households are $58,250 and $45,865 respectively.
| Characteristic | Number | Measure |
| Per Capita Income | 627 | $24,109 |
| Median Family Income | 113 | $58,250 |
| Mean Family Income | 113 | $74,863 |
| Median Household Income | 213 | $45,865 |
| Mean Household Income | 213 | $63,195 |
| Income Deficit | 113 | $0 |
| Wage / Income Gap (%) | 627 | 30.00% |
| Wage / Income Gap ($) | 627 | 70.00¢ per $1 |
| Gini / Inequality Index | 627 | 0.40 |
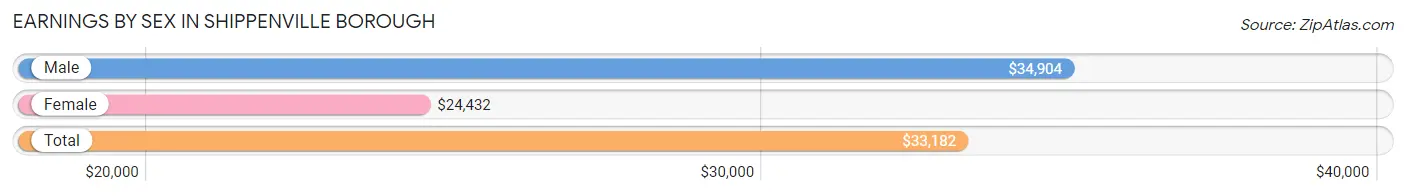
Earnings by Sex in Shippenville borough
Average Earnings in Shippenville borough are $33,182, $34,904 for men and $24,432 for women, a difference of 30.0%.
| Sex | Number | Average Earnings |
| Male | 165 (56.9%) | $34,904 |
| Female | 125 (43.1%) | $24,432 |
| Total | 290 (100.0%) | $33,182 |
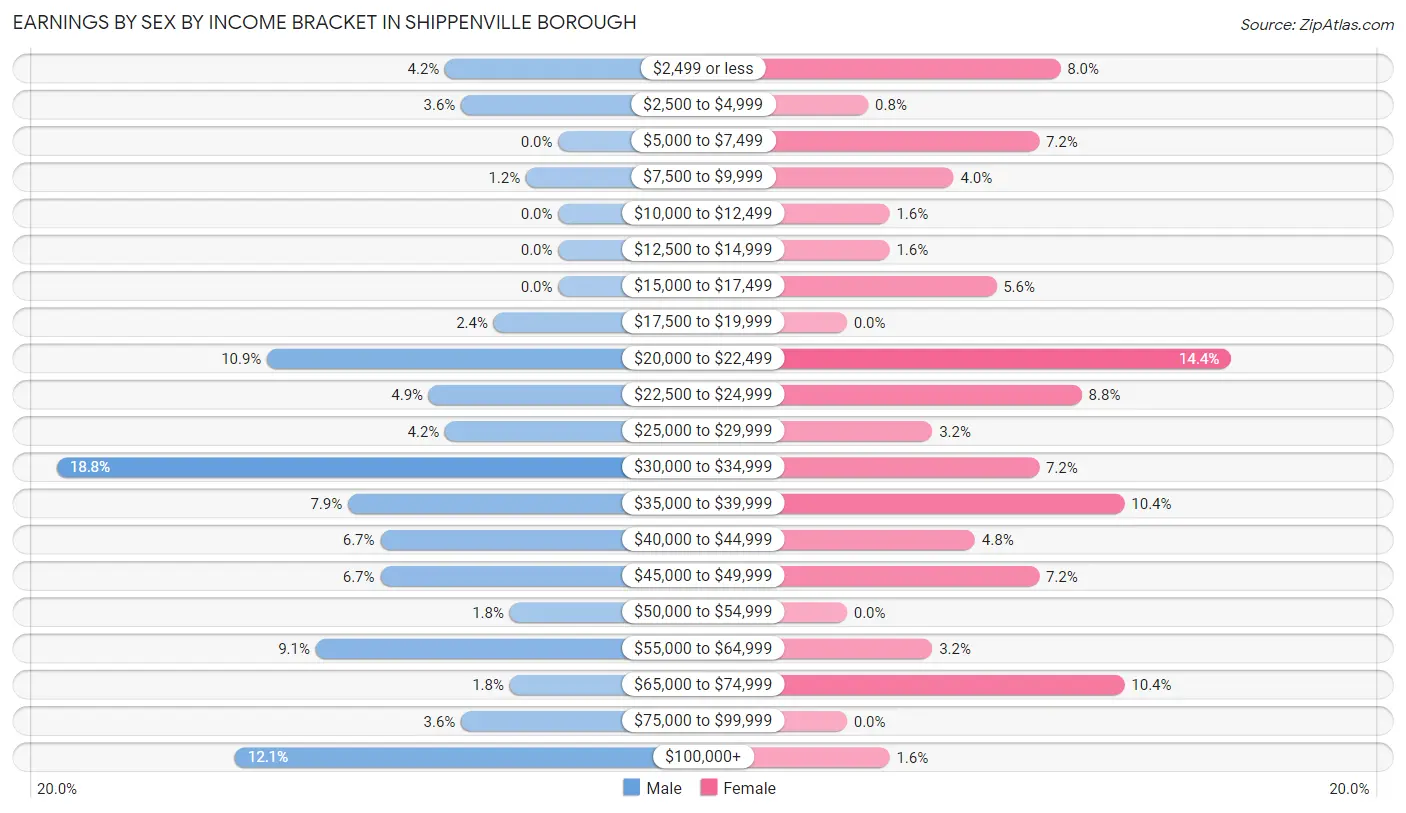
Earnings by Sex by Income Bracket in Shippenville borough
The most common earnings brackets in Shippenville borough are $30,000 to $34,999 for men (31 | 18.8%) and $20,000 to $22,499 for women (18 | 14.4%).
| Income | Male | Female |
| $2,499 or less | 7 (4.2%) | 10 (8.0%) |
| $2,500 to $4,999 | 6 (3.6%) | 1 (0.8%) |
| $5,000 to $7,499 | 0 (0.0%) | 9 (7.2%) |
| $7,500 to $9,999 | 2 (1.2%) | 5 (4.0%) |
| $10,000 to $12,499 | 0 (0.0%) | 2 (1.6%) |
| $12,500 to $14,999 | 0 (0.0%) | 2 (1.6%) |
| $15,000 to $17,499 | 0 (0.0%) | 7 (5.6%) |
| $17,500 to $19,999 | 4 (2.4%) | 0 (0.0%) |
| $20,000 to $22,499 | 18 (10.9%) | 18 (14.4%) |
| $22,500 to $24,999 | 8 (4.9%) | 11 (8.8%) |
| $25,000 to $29,999 | 7 (4.2%) | 4 (3.2%) |
| $30,000 to $34,999 | 31 (18.8%) | 9 (7.2%) |
| $35,000 to $39,999 | 13 (7.9%) | 13 (10.4%) |
| $40,000 to $44,999 | 11 (6.7%) | 6 (4.8%) |
| $45,000 to $49,999 | 11 (6.7%) | 9 (7.2%) |
| $50,000 to $54,999 | 3 (1.8%) | 0 (0.0%) |
| $55,000 to $64,999 | 15 (9.1%) | 4 (3.2%) |
| $65,000 to $74,999 | 3 (1.8%) | 13 (10.4%) |
| $75,000 to $99,999 | 6 (3.6%) | 0 (0.0%) |
| $100,000+ | 20 (12.1%) | 2 (1.6%) |
| Total | 165 (100.0%) | 125 (100.0%) |
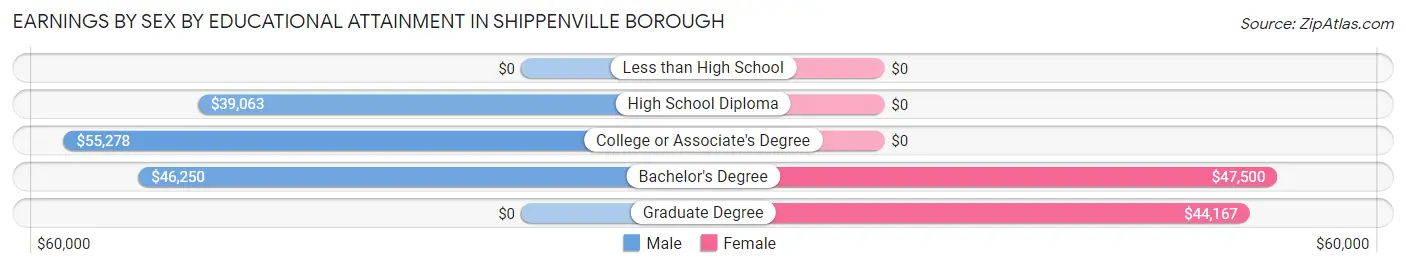
Earnings by Sex by Educational Attainment in Shippenville borough
Average earnings in Shippenville borough are $39,688 for men and $36,406 for women, a difference of 8.3%. Men with an educational attainment of college or associate's degree enjoy the highest average annual earnings of $55,278, while those with high school diploma education earn the least with $39,063. Women with an educational attainment of bachelor's degree earn the most with the average annual earnings of $47,500, while those with graduate degree education have the smallest earnings of $44,167.
| Educational Attainment | Male Income | Female Income |
| Less than High School | - | - |
| High School Diploma | $39,063 | $0 |
| College or Associate's Degree | $55,278 | $0 |
| Bachelor's Degree | $46,250 | $47,500 |
| Graduate Degree | - | - |
| Total | $39,688 | $36,406 |
Family Income in Shippenville borough
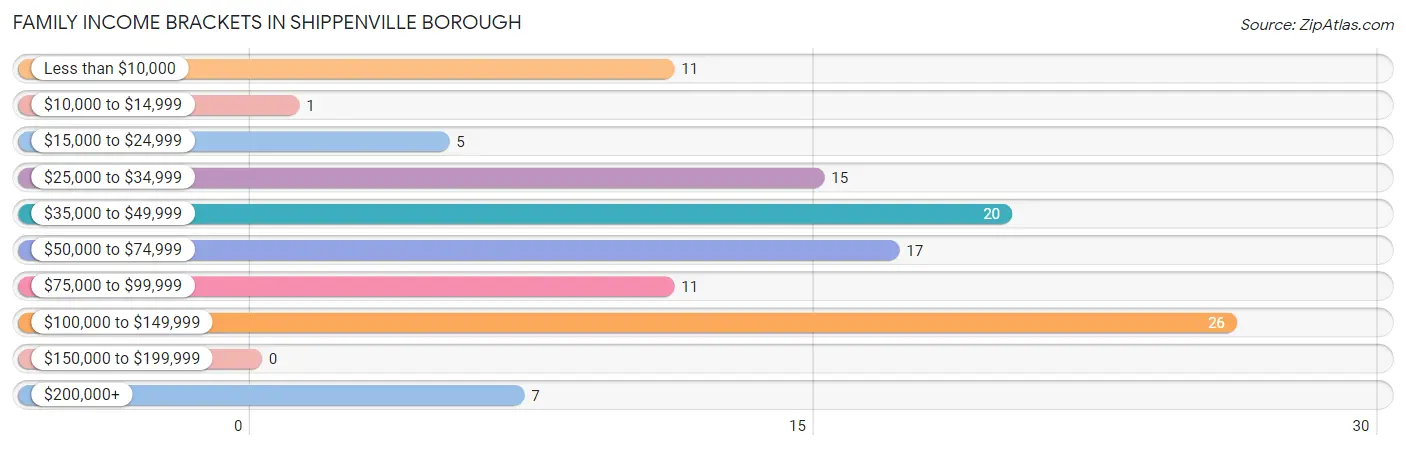
Family Income Brackets in Shippenville borough
According to the Shippenville borough family income data, there are 26 families falling into the $100,000 to $149,999 income range, which is the most common income bracket and makes up 23.0% of all families.
| Income Bracket | # Families | % Families |
| Less than $10,000 | 11 | 9.7% |
| $10,000 to $14,999 | 1 | 0.9% |
| $15,000 to $24,999 | 5 | 4.4% |
| $25,000 to $34,999 | 15 | 13.3% |
| $35,000 to $49,999 | 20 | 17.7% |
| $50,000 to $74,999 | 17 | 15.0% |
| $75,000 to $99,999 | 11 | 9.7% |
| $100,000 to $149,999 | 26 | 23.0% |
| $150,000 to $199,999 | 0 | 0.0% |
| $200,000+ | 7 | 6.2% |
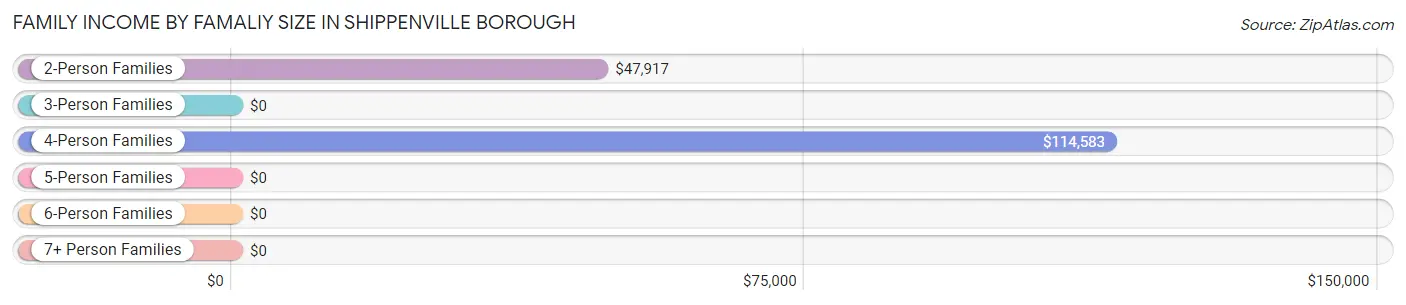
Family Income by Famaliy Size in Shippenville borough
4-person families (21 | 18.6%) account for the highest median family income in Shippenville borough with $114,583 per family, while 4-person families (21 | 18.6%) have the highest median income of $28,646 per family member.
| Income Bracket | # Families | Median Income |
| 2-Person Families | 53 (46.9%) | $47,917 |
| 3-Person Families | 25 (22.1%) | $0 |
| 4-Person Families | 21 (18.6%) | $114,583 |
| 5-Person Families | 7 (6.2%) | $0 |
| 6-Person Families | 5 (4.4%) | $0 |
| 7+ Person Families | 2 (1.8%) | $0 |
| Total | 113 (100.0%) | $58,250 |
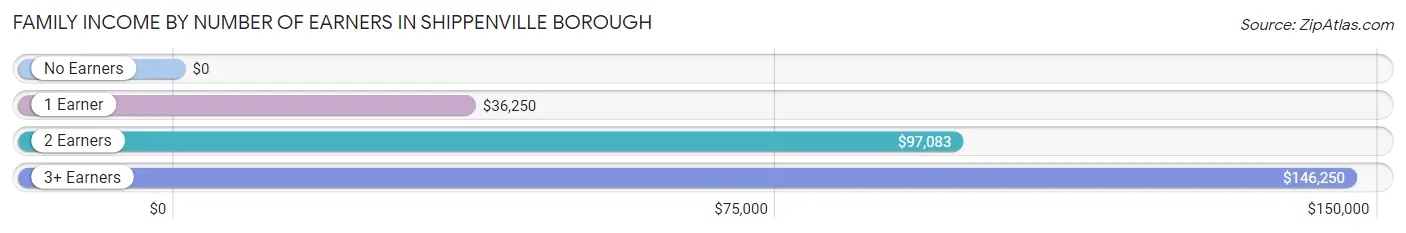
Family Income by Number of Earners in Shippenville borough
| Number of Earners | # Families | Median Income |
| No Earners | 15 (13.3%) | $0 |
| 1 Earner | 47 (41.6%) | $36,250 |
| 2 Earners | 45 (39.8%) | $97,083 |
| 3+ Earners | 6 (5.3%) | $146,250 |
| Total | 113 (100.0%) | $58,250 |
Household Income in Shippenville borough
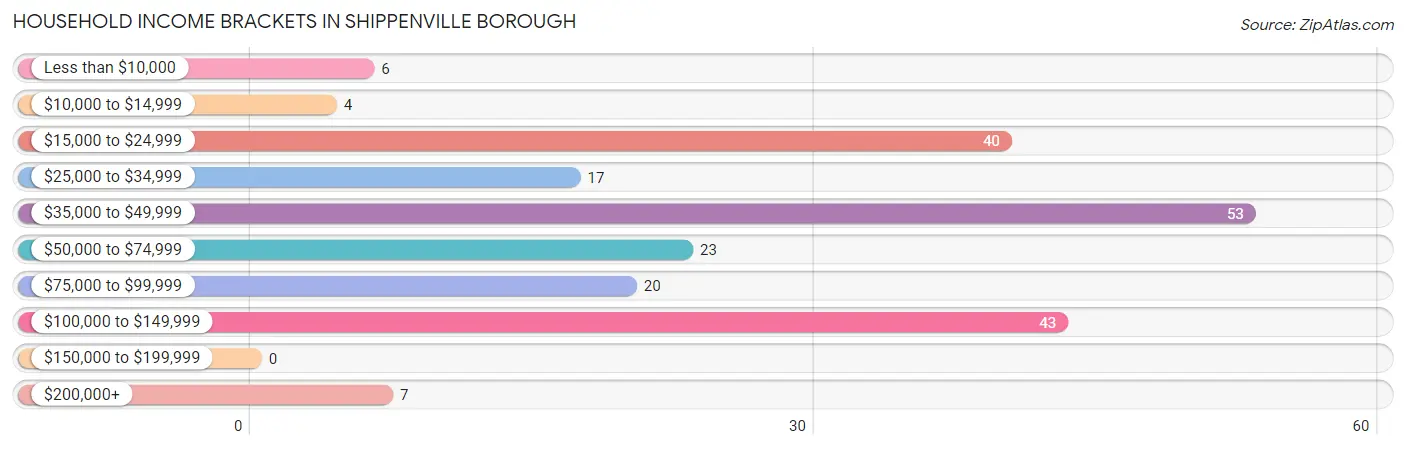
Household Income Brackets in Shippenville borough
With 53 households falling in the category, the $35,000 to $49,999 income range is the most frequent in Shippenville borough, accounting for 24.9% of all households.
| Income Bracket | # Households | % Households |
| Less than $10,000 | 6 | 2.8% |
| $10,000 to $14,999 | 4 | 1.9% |
| $15,000 to $24,999 | 40 | 18.8% |
| $25,000 to $34,999 | 17 | 8.0% |
| $35,000 to $49,999 | 53 | 24.9% |
| $50,000 to $74,999 | 23 | 10.8% |
| $75,000 to $99,999 | 20 | 9.4% |
| $100,000 to $149,999 | 43 | 20.2% |
| $150,000 to $199,999 | 0 | 0.0% |
| $200,000+ | 7 | 3.3% |
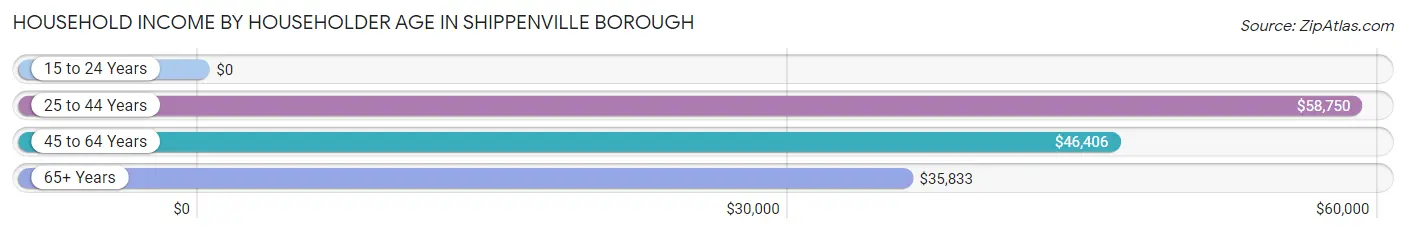
Household Income by Householder Age in Shippenville borough
The median household income in Shippenville borough is $45,865, with the highest median household income of $58,750 found in the 25 to 44 years age bracket for the primary householder. A total of 94 households (44.1%) fall into this category. Meanwhile, the 15 to 24 years age bracket for the primary householder has the lowest median household income of $0, with 12 households (5.6%) in this group.
| Income Bracket | # Households | Median Income |
| 15 to 24 Years | 12 (5.6%) | $0 |
| 25 to 44 Years | 94 (44.1%) | $58,750 |
| 45 to 64 Years | 77 (36.1%) | $46,406 |
| 65+ Years | 30 (14.1%) | $35,833 |
| Total | 213 (100.0%) | $45,865 |
Poverty in Shippenville borough
Income Below Poverty by Sex and Age in Shippenville borough
With 4.8% poverty level for males and 25.7% for females among the residents of Shippenville borough, 35 to 44 year old males and 5 year old females are the most vulnerable to poverty, with 8 males (24.2%) and 5 females (100.0%) in their respective age groups living below the poverty level.
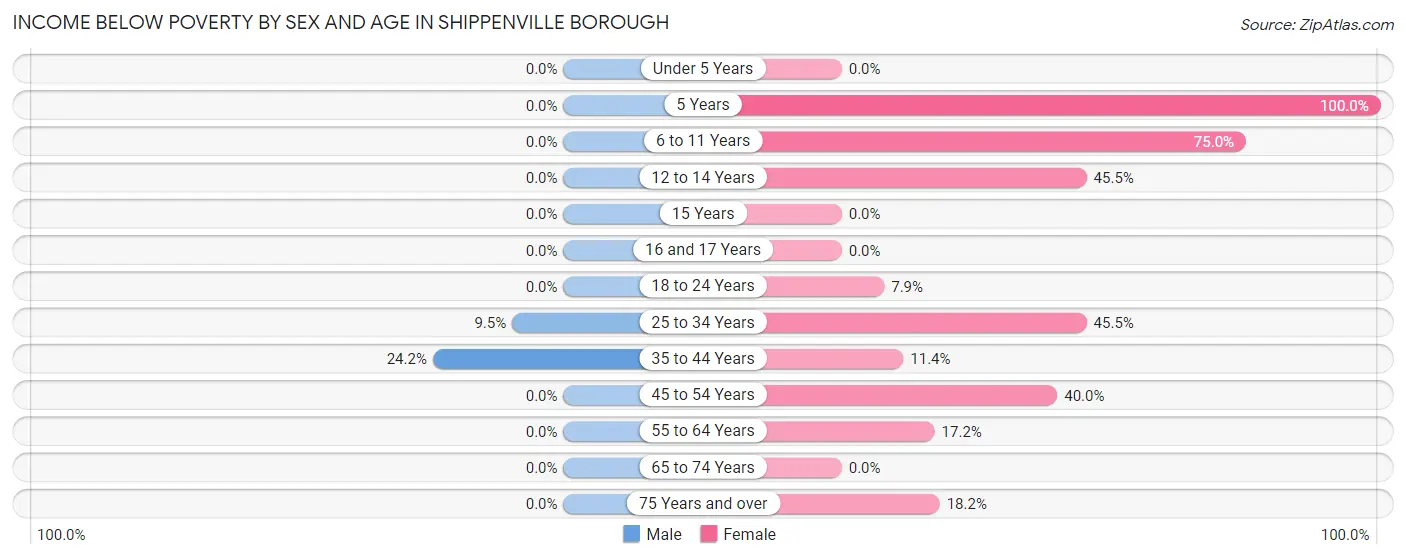
| Age Bracket | Male | Female |
| Under 5 Years | 0 (0.0%) | 0 (0.0%) |
| 5 Years | 0 (0.0%) | 5 (100.0%) |
| 6 to 11 Years | 0 (0.0%) | 21 (75.0%) |
| 12 to 14 Years | 0 (0.0%) | 5 (45.5%) |
| 15 Years | 0 (0.0%) | 0 (0.0%) |
| 16 and 17 Years | 0 (0.0%) | 0 (0.0%) |
| 18 to 24 Years | 0 (0.0%) | 3 (7.9%) |
| 25 to 34 Years | 4 (9.5%) | 20 (45.5%) |
| 35 to 44 Years | 8 (24.2%) | 4 (11.4%) |
| 45 to 54 Years | 0 (0.0%) | 2 (40.0%) |
| 55 to 64 Years | 0 (0.0%) | 5 (17.2%) |
| 65 to 74 Years | 0 (0.0%) | 0 (0.0%) |
| 75 Years and over | 0 (0.0%) | 2 (18.2%) |
| Total | 12 (4.8%) | 67 (25.7%) |
Income Above Poverty by Sex and Age in Shippenville borough
According to the poverty statistics in Shippenville borough, males aged under 5 years and females aged under 5 years are the age groups that are most secure financially, with 100.0% of males and 100.0% of females in these age groups living above the poverty line.
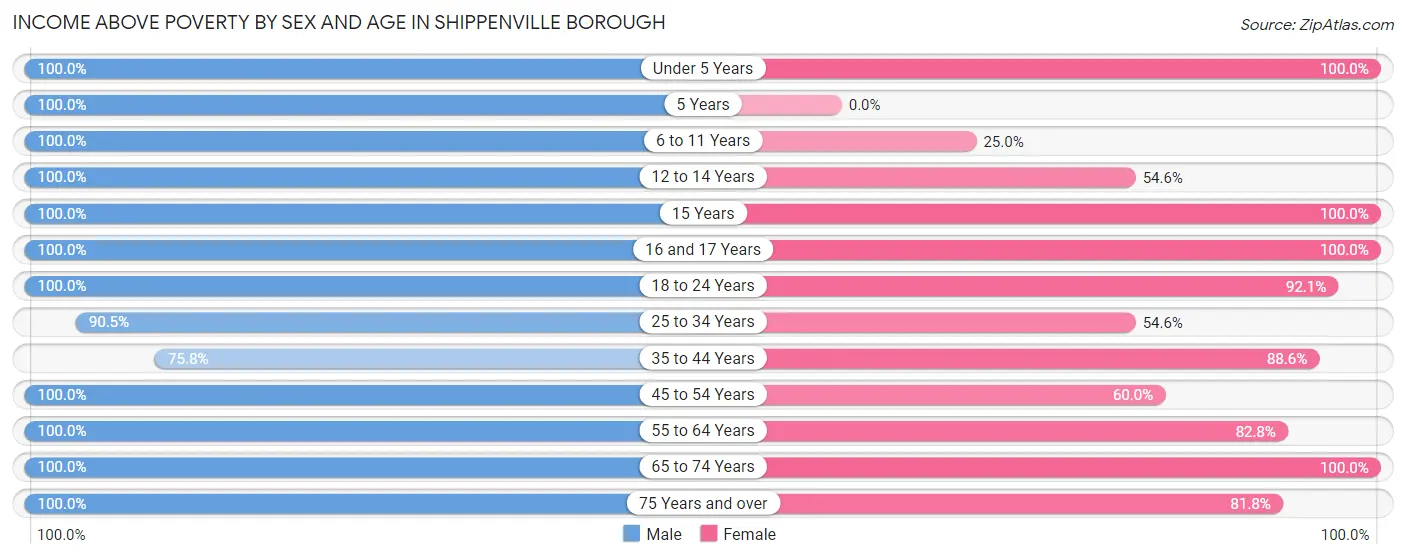
| Age Bracket | Male | Female |
| Under 5 Years | 16 (100.0%) | 17 (100.0%) |
| 5 Years | 2 (100.0%) | 0 (0.0%) |
| 6 to 11 Years | 12 (100.0%) | 7 (25.0%) |
| 12 to 14 Years | 4 (100.0%) | 6 (54.5%) |
| 15 Years | 2 (100.0%) | 3 (100.0%) |
| 16 and 17 Years | 8 (100.0%) | 15 (100.0%) |
| 18 to 24 Years | 33 (100.0%) | 35 (92.1%) |
| 25 to 34 Years | 38 (90.5%) | 24 (54.5%) |
| 35 to 44 Years | 25 (75.8%) | 31 (88.6%) |
| 45 to 54 Years | 34 (100.0%) | 3 (60.0%) |
| 55 to 64 Years | 48 (100.0%) | 24 (82.8%) |
| 65 to 74 Years | 13 (100.0%) | 20 (100.0%) |
| 75 Years and over | 5 (100.0%) | 9 (81.8%) |
| Total | 240 (95.2%) | 194 (74.3%) |
Income Below Poverty Among Married-Couple Families in Shippenville borough
The poverty statistics for married-couple families in Shippenville borough show that 9.6% or 5 of the total 52 families live below the poverty line. Families with 3 or 4 children have the highest poverty rate of 35.7%, comprising of 5 families. On the other hand, families with no children have the lowest poverty rate of 0.0%, which includes 0 families.
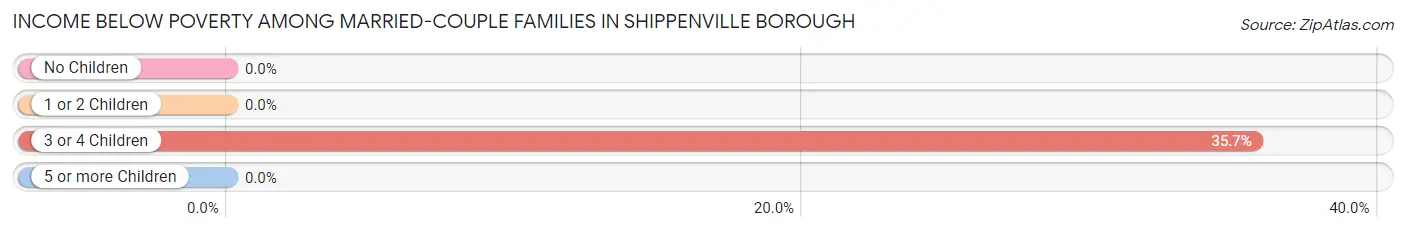
| Children | Above Poverty | Below Poverty |
| No Children | 25 (100.0%) | 0 (0.0%) |
| 1 or 2 Children | 13 (100.0%) | 0 (0.0%) |
| 3 or 4 Children | 9 (64.3%) | 5 (35.7%) |
| 5 or more Children | 0 (0.0%) | 0 (0.0%) |
| Total | 47 (90.4%) | 5 (9.6%) |
Income Below Poverty Among Single-Parent Households in Shippenville borough
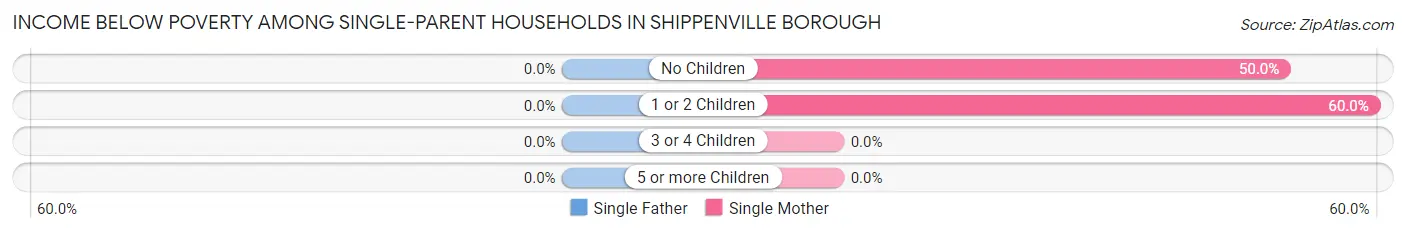
| Children | Single Father | Single Mother |
| No Children | 0 (0.0%) | 3 (50.0%) |
| 1 or 2 Children | 0 (0.0%) | 9 (60.0%) |
| 3 or 4 Children | 0 (0.0%) | 0 (0.0%) |
| 5 or more Children | 0 (0.0%) | 0 (0.0%) |
| Total | 0 (0.0%) | 12 (52.2%) |
Income Below Poverty Among Married-Couple vs Single-Parent Households in Shippenville borough
The poverty data for Shippenville borough shows that 5 of the married-couple family households (9.6%) and 12 of the single-parent households (19.7%) are living below the poverty level. Within the married-couple family households, those with 3 or 4 children have the highest poverty rate, with 5 households (35.7%) falling below the poverty line. Among the single-parent households, those with 1 or 2 children have the highest poverty rate, with 9 household (20.4%) living below poverty.
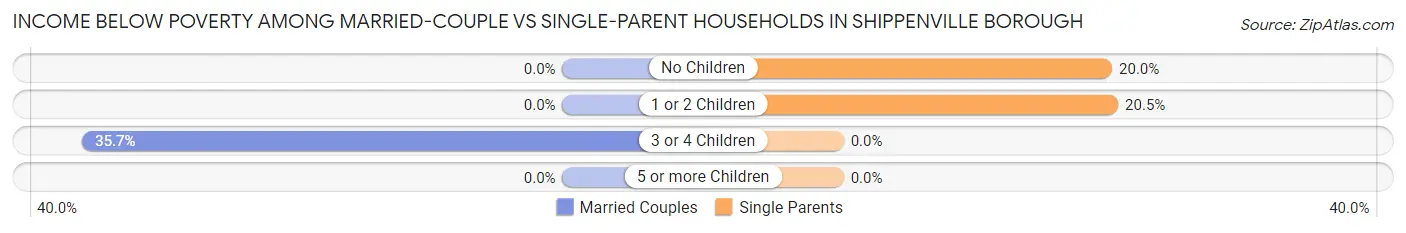
| Children | Married-Couple Families | Single-Parent Households |
| No Children | 0 (0.0%) | 3 (20.0%) |
| 1 or 2 Children | 0 (0.0%) | 9 (20.4%) |
| 3 or 4 Children | 5 (35.7%) | 0 (0.0%) |
| 5 or more Children | 0 (0.0%) | 0 (0.0%) |
| Total | 5 (9.6%) | 12 (19.7%) |
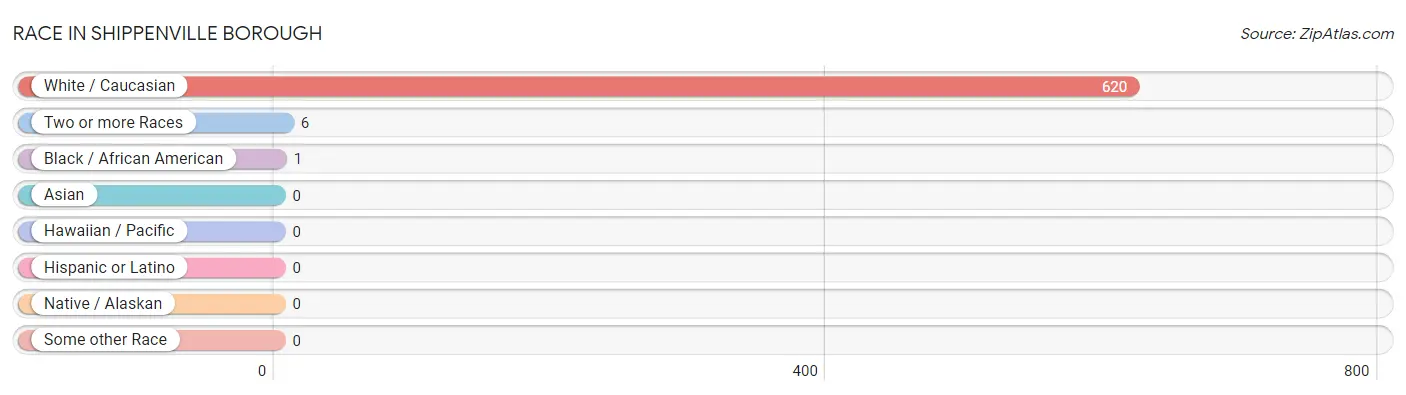
Race in Shippenville borough
The most populous races in Shippenville borough are White / Caucasian (620 | 98.9%), Two or more Races (6 | 1.0%), and Black / African American (1 | 0.2%).
| Race | # Population | % Population |
| Asian | 0 | 0.0% |
| Black / African American | 1 | 0.2% |
| Hawaiian / Pacific | 0 | 0.0% |
| Hispanic or Latino | 0 | 0.0% |
| Native / Alaskan | 0 | 0.0% |
| White / Caucasian | 620 | 98.9% |
| Two or more Races | 6 | 1.0% |
| Some other Race | 0 | 0.0% |
| Total | 627 | 100.0% |
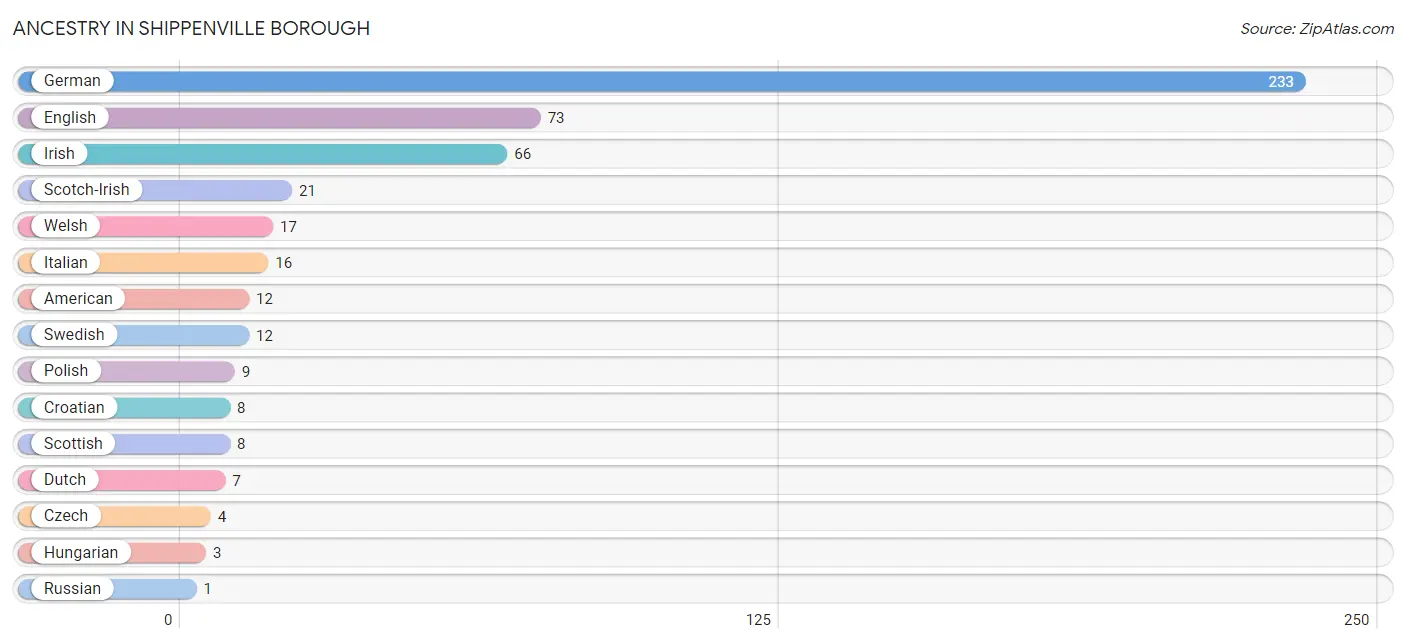
Ancestry in Shippenville borough
The most populous ancestries reported in Shippenville borough are German (233 | 37.2%), English (73 | 11.6%), Irish (66 | 10.5%), Scotch-Irish (21 | 3.4%), and Welsh (17 | 2.7%), together accounting for 65.4% of all Shippenville borough residents.
| Ancestry | # Population | % Population |
| American | 12 | 1.9% |
| Croatian | 8 | 1.3% |
| Czech | 4 | 0.6% |
| Dutch | 7 | 1.1% |
| English | 73 | 11.6% |
| German | 233 | 37.2% |
| Hungarian | 3 | 0.5% |
| Irish | 66 | 10.5% |
| Italian | 16 | 2.5% |
| Polish | 9 | 1.4% |
| Russian | 1 | 0.2% |
| Scotch-Irish | 21 | 3.4% |
| Scottish | 8 | 1.3% |
| Swedish | 12 | 1.9% |
| Welsh | 17 | 2.7% | View All 15 Rows |
Immigrants in Shippenville borough

| Immigration Origin | # Population | % Population | View All 0 Rows |
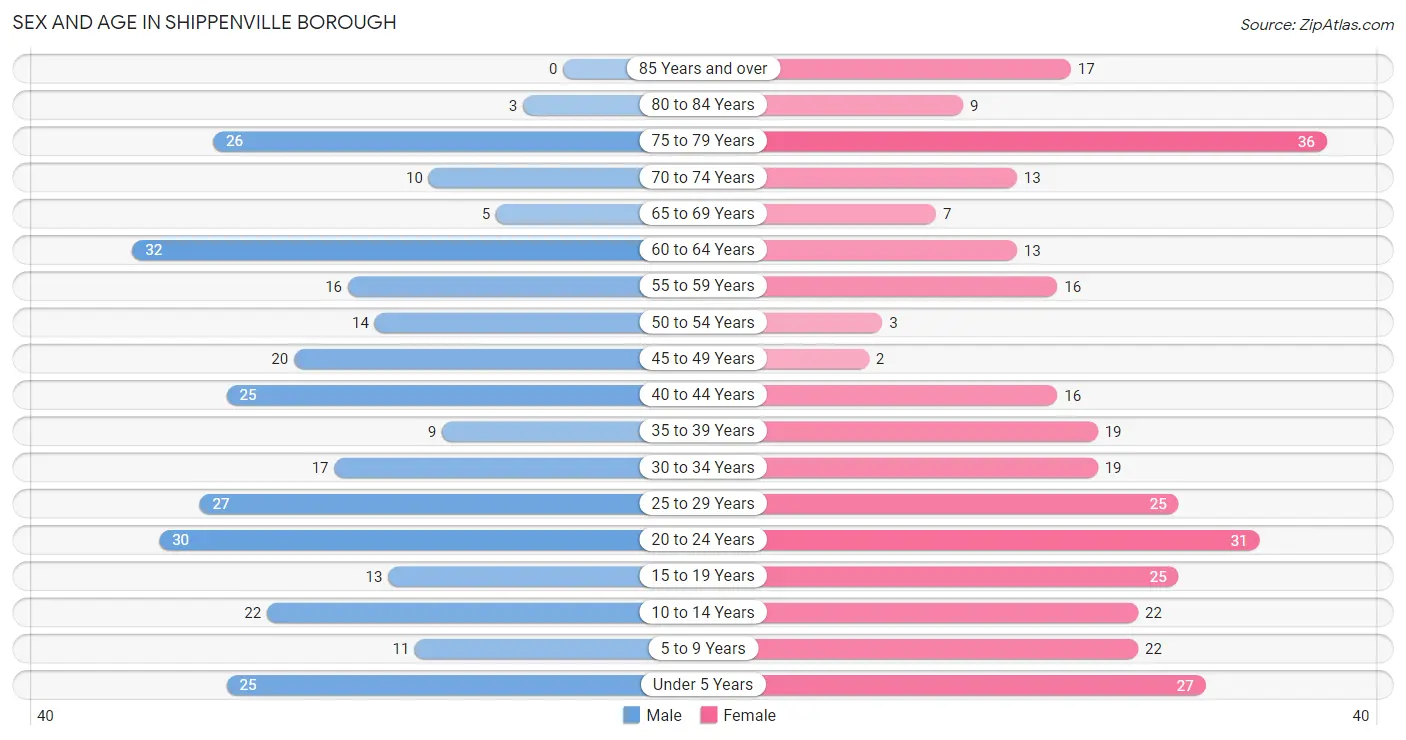
Sex and Age in Shippenville borough
Sex and Age in Shippenville borough
The most populous age groups in Shippenville borough are 60 to 64 Years (32 | 10.5%) for men and 75 to 79 Years (36 | 11.2%) for women.
| Age Bracket | Male | Female |
| Under 5 Years | 25 (8.2%) | 27 (8.4%) |
| 5 to 9 Years | 11 (3.6%) | 22 (6.8%) |
| 10 to 14 Years | 22 (7.2%) | 22 (6.8%) |
| 15 to 19 Years | 13 (4.3%) | 25 (7.8%) |
| 20 to 24 Years | 30 (9.8%) | 31 (9.6%) |
| 25 to 29 Years | 27 (8.8%) | 25 (7.8%) |
| 30 to 34 Years | 17 (5.6%) | 19 (5.9%) |
| 35 to 39 Years | 9 (2.9%) | 19 (5.9%) |
| 40 to 44 Years | 25 (8.2%) | 16 (5.0%) |
| 45 to 49 Years | 20 (6.6%) | 2 (0.6%) |
| 50 to 54 Years | 14 (4.6%) | 3 (0.9%) |
| 55 to 59 Years | 16 (5.2%) | 16 (5.0%) |
| 60 to 64 Years | 32 (10.5%) | 13 (4.0%) |
| 65 to 69 Years | 5 (1.6%) | 7 (2.2%) |
| 70 to 74 Years | 10 (3.3%) | 13 (4.0%) |
| 75 to 79 Years | 26 (8.5%) | 36 (11.2%) |
| 80 to 84 Years | 3 (1.0%) | 9 (2.8%) |
| 85 Years and over | 0 (0.0%) | 17 (5.3%) |
| Total | 305 (100.0%) | 322 (100.0%) |
Families and Households in Shippenville borough
Median Family Size in Shippenville borough
The median family size in Shippenville borough is 3.04 persons per family, with married-couple families (52 | 46.0%) accounting for the largest median family size of 3.46 persons per family. On the other hand, single male/father families (38 | 33.6%) represent the smallest median family size with 2.53 persons per family.
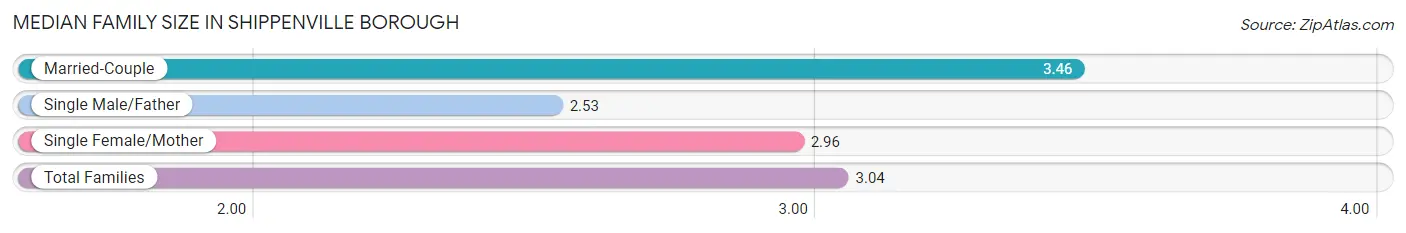
| Family Type | # Families | Family Size |
| Married-Couple | 52 (46.0%) | 3.46 |
| Single Male/Father | 38 (33.6%) | 2.53 |
| Single Female/Mother | 23 (20.3%) | 2.96 |
| Total Families | 113 (100.0%) | 3.04 |
Median Household Size in Shippenville borough
The median household size in Shippenville borough is 2.50 persons per household, with single female/mother households (23 | 10.8%) accounting for the largest median household size of 3.48 persons per household. non-family households (100 | 46.9%) represent the smallest median household size with 1.41 persons per household.
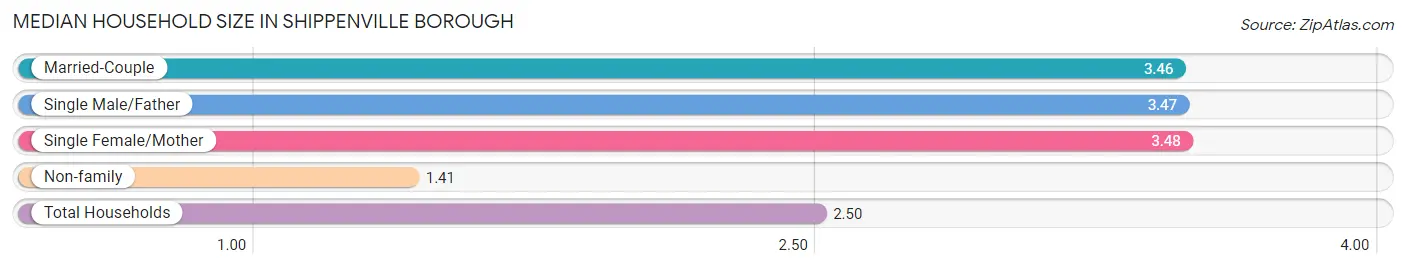
| Household Type | # Households | Household Size |
| Married-Couple | 52 (24.4%) | 3.46 |
| Single Male/Father | 38 (17.8%) | 3.47 |
| Single Female/Mother | 23 (10.8%) | 3.48 |
| Non-family | 100 (46.9%) | 1.41 |
| Total Households | 213 (100.0%) | 2.50 |
Household Size by Marriage Status in Shippenville borough
Out of a total of 213 households in Shippenville borough, 113 (53.0%) are family households, while 100 (46.9%) are nonfamily households. The most numerous type of family households are 2-person households, comprising 42, and the most common type of nonfamily households are 1-person households, comprising 77.
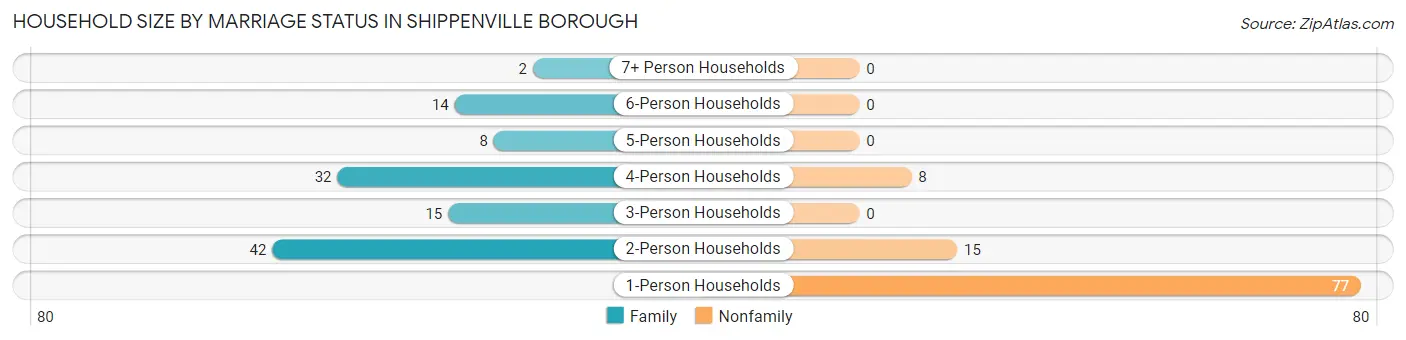
| Household Size | Family Households | Nonfamily Households |
| 1-Person Households | - | 77 (36.1%) |
| 2-Person Households | 42 (19.7%) | 15 (7.0%) |
| 3-Person Households | 15 (7.0%) | 0 (0.0%) |
| 4-Person Households | 32 (15.0%) | 8 (3.8%) |
| 5-Person Households | 8 (3.8%) | 0 (0.0%) |
| 6-Person Households | 14 (6.6%) | 0 (0.0%) |
| 7+ Person Households | 2 (0.9%) | 0 (0.0%) |
| Total | 113 (53.0%) | 100 (46.9%) |
Female Fertility in Shippenville borough
Fertility by Age in Shippenville borough
Average fertility rate in Shippenville borough is 14.0 births per 1,000 women. Women in the age bracket of 20 to 34 years have the highest fertility rate with 27.0 births per 1,000 women. Women in the age bracket of 20 to 34 years acount for 100.0% of all women with births.
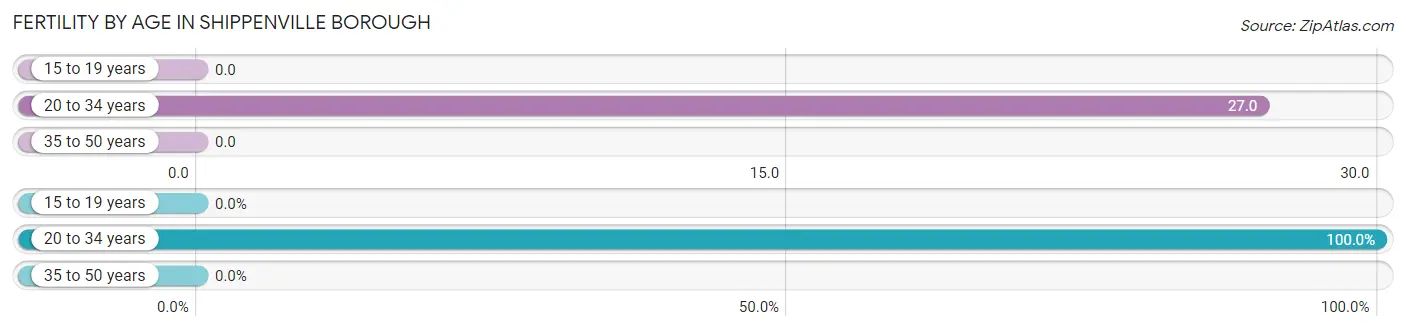
| Age Bracket | Women with Births | Births / 1,000 Women |
| 15 to 19 years | 0 (0.0%) | 0.0 |
| 20 to 34 years | 2 (100.0%) | 27.0 |
| 35 to 50 years | 0 (0.0%) | 0.0 |
| Total | 2 (100.0%) | 14.0 |
Fertility by Age by Marriage Status in Shippenville borough
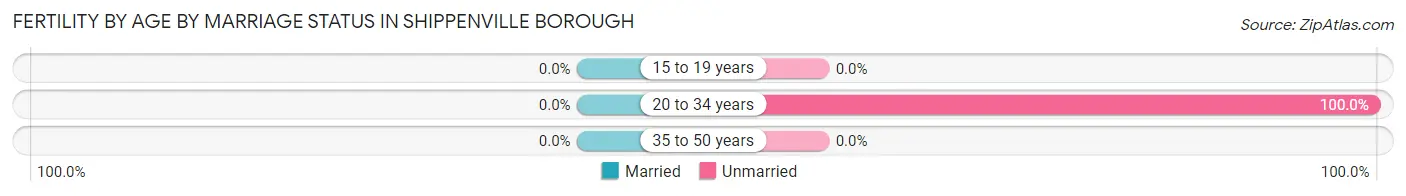
| Age Bracket | Married | Unmarried |
| 15 to 19 years | 0 (0.0%) | 0 (0.0%) |
| 20 to 34 years | 0 (0.0%) | 2 (100.0%) |
| 35 to 50 years | 0 (0.0%) | 0 (0.0%) |
| Total | 0 (0.0%) | 2 (100.0%) |
Fertility by Education in Shippenville borough
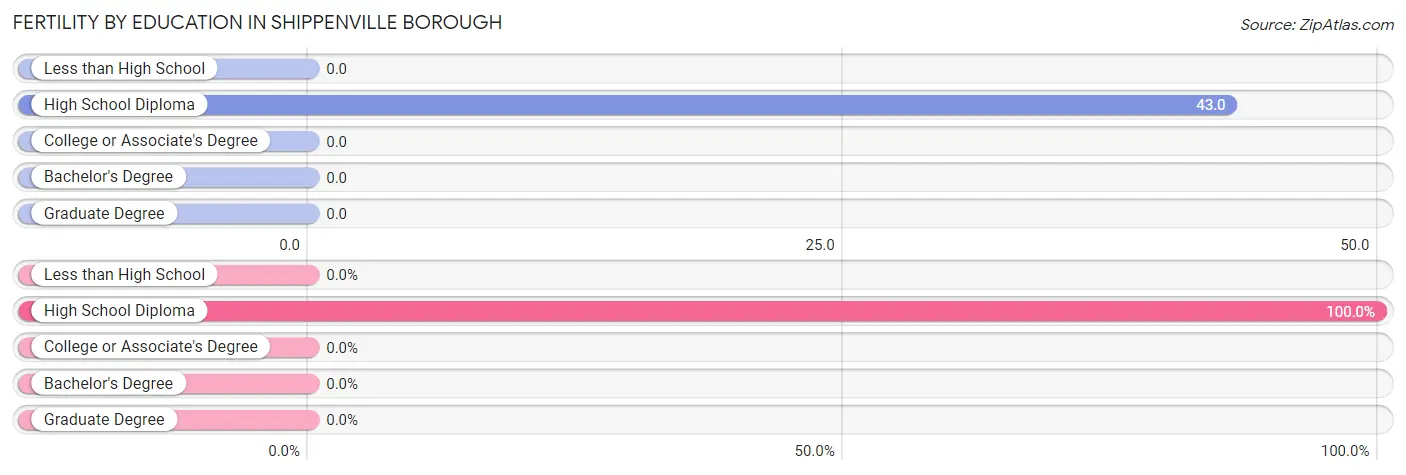
| Educational Attainment | Women with Births | Births / 1,000 Women |
| Less than High School | 0 (0.0%) | 0.0 |
| High School Diploma | 2 (100.0%) | 43.0 |
| College or Associate's Degree | 0 (0.0%) | 0.0 |
| Bachelor's Degree | 0 (0.0%) | 0.0 |
| Graduate Degree | 0 (0.0%) | 0.0 |
| Total | 2 (100.0%) | 14.0 |
Fertility by Education by Marriage Status in Shippenville borough
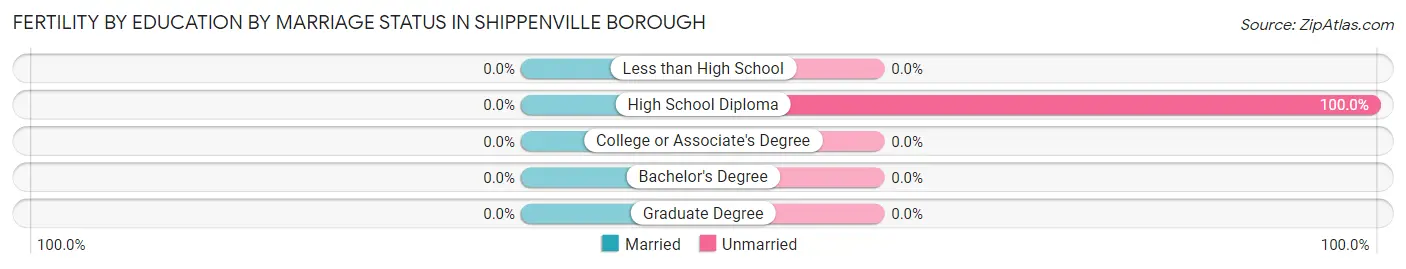
| Educational Attainment | Married | Unmarried |
| Less than High School | 0 (0.0%) | 0 (0.0%) |
| High School Diploma | 0 (0.0%) | 2 (100.0%) |
| College or Associate's Degree | 0 (0.0%) | 0 (0.0%) |
| Bachelor's Degree | 0 (0.0%) | 0 (0.0%) |
| Graduate Degree | 0 (0.0%) | 0 (0.0%) |
| Total | 0 (0.0%) | 2 (100.0%) |
Employment Characteristics in Shippenville borough
Employment by Class of Employer in Shippenville borough
Among the 267 employed individuals in Shippenville borough, private company employees (212 | 79.4%), not-for-profit organizations (22 | 8.2%), and local government employees (21 | 7.9%) make up the most common classes of employment.
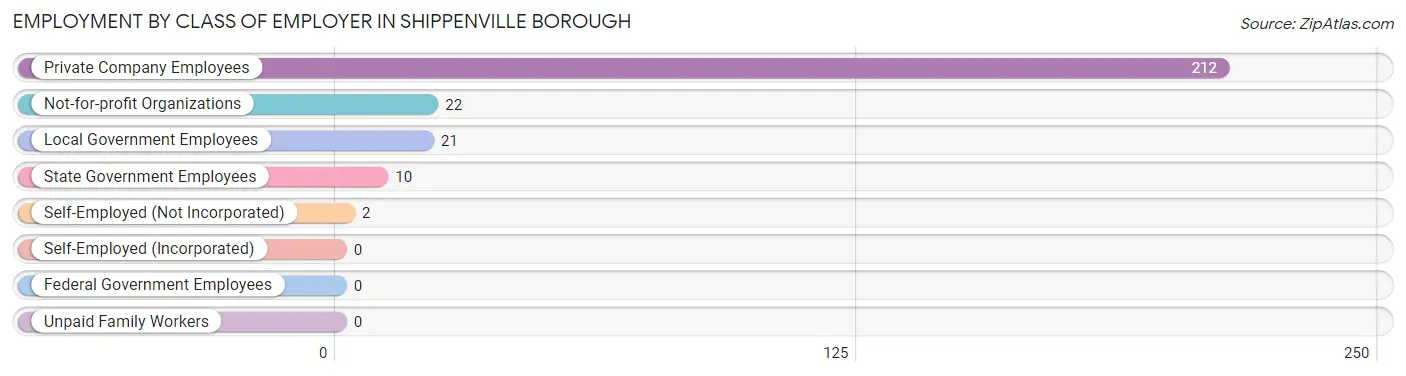
| Employer Class | # Employees | % Employees |
| Private Company Employees | 212 | 79.4% |
| Self-Employed (Incorporated) | 0 | 0.0% |
| Self-Employed (Not Incorporated) | 2 | 0.7% |
| Not-for-profit Organizations | 22 | 8.2% |
| Local Government Employees | 21 | 7.9% |
| State Government Employees | 10 | 3.7% |
| Federal Government Employees | 0 | 0.0% |
| Unpaid Family Workers | 0 | 0.0% |
| Total | 267 | 100.0% |
Employment Status by Age in Shippenville borough
According to the labor force statistics for Shippenville borough, out of the total population over 16 years of age (493), 57.2% or 282 individuals are in the labor force, with 5.3% or 15 of them unemployed. The age group with the highest labor force participation rate is 20 to 24 years, with 90.2% or 55 individuals in the labor force. Within the labor force, the 35 to 44 years age range has the highest percentage of unemployed individuals, with 9.3% or 5 of them being unemployed.
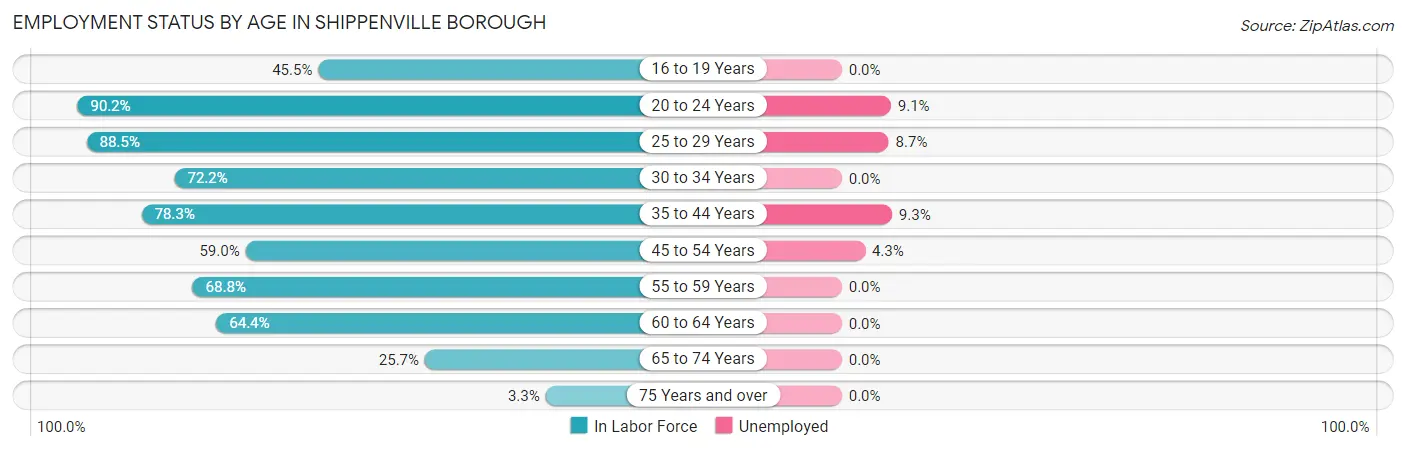
| Age Bracket | In Labor Force | Unemployed |
| 16 to 19 Years | 15 (45.5%) | 0 (0.0%) |
| 20 to 24 Years | 55 (90.2%) | 5 (9.1%) |
| 25 to 29 Years | 46 (88.5%) | 4 (8.7%) |
| 30 to 34 Years | 26 (72.2%) | 0 (0.0%) |
| 35 to 44 Years | 54 (78.3%) | 5 (9.3%) |
| 45 to 54 Years | 23 (59.0%) | 1 (4.3%) |
| 55 to 59 Years | 22 (68.8%) | 0 (0.0%) |
| 60 to 64 Years | 29 (64.4%) | 0 (0.0%) |
| 65 to 74 Years | 9 (25.7%) | 0 (0.0%) |
| 75 Years and over | 3 (3.3%) | 0 (0.0%) |
| Total | 282 (57.2%) | 15 (5.3%) |
Employment Status by Educational Attainment in Shippenville borough
According to labor force statistics for Shippenville borough, 73.3% of individuals (200) out of the total population between 25 and 64 years of age (273) are in the labor force, with 5.0% or 10 of them being unemployed. The group with the highest labor force participation rate are those with the educational attainment of bachelor's degree or higher, with 97.7% or 43 individuals in the labor force. Within the labor force, individuals with college / associate degree education have the highest percentage of unemployment, with 12.2% or 5 of them being unemployed.
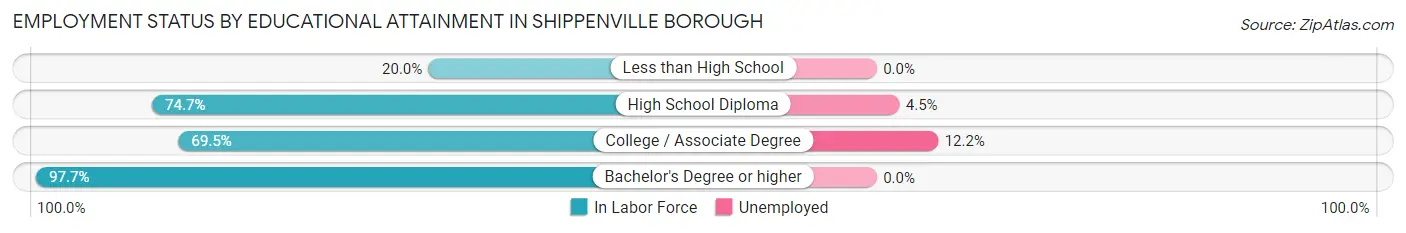
| Educational Attainment | In Labor Force | Unemployed |
| Less than High School | 4 (20.0%) | 0 (0.0%) |
| High School Diploma | 112 (74.7%) | 7 (4.5%) |
| College / Associate Degree | 41 (69.5%) | 7 (12.2%) |
| Bachelor's Degree or higher | 43 (97.7%) | 0 (0.0%) |
| Total | 200 (73.3%) | 14 (5.0%) |
Employment Occupations by Sex in Shippenville borough
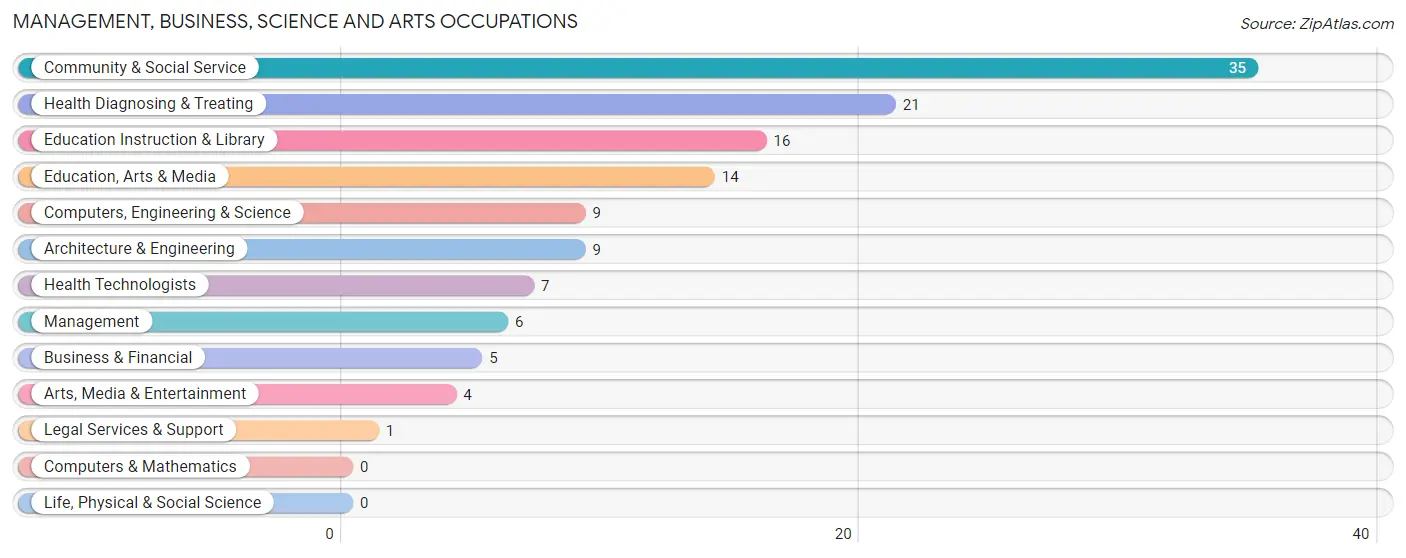
Management, Business, Science and Arts Occupations
The most common Management, Business, Science and Arts occupations in Shippenville borough are Community & Social Service (35 | 13.1%), Health Diagnosing & Treating (21 | 7.9%), Education Instruction & Library (16 | 6.0%), Education, Arts & Media (14 | 5.2%), and Computers, Engineering & Science (9 | 3.4%).
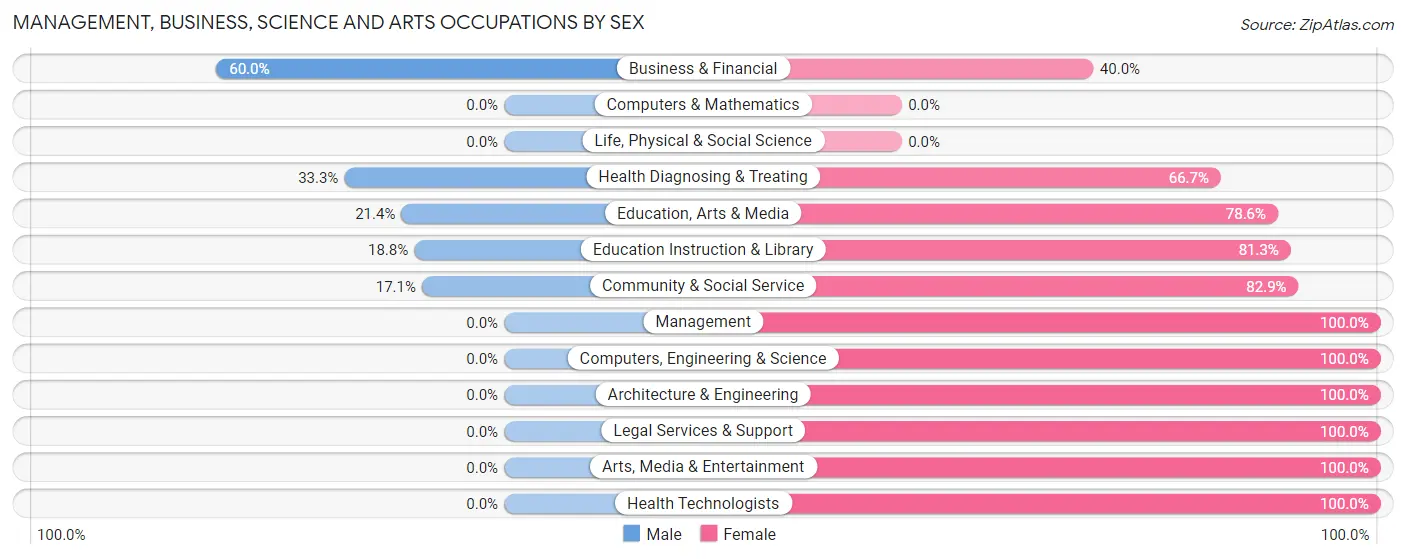
Management, Business, Science and Arts Occupations by Sex
Within the Management, Business, Science and Arts occupations in Shippenville borough, the most male-oriented occupations are Business & Financial (60.0%), Health Diagnosing & Treating (33.3%), and Education, Arts & Media (21.4%), while the most female-oriented occupations are Management (100.0%), Computers, Engineering & Science (100.0%), and Architecture & Engineering (100.0%).
| Occupation | Male | Female |
| Management | 0 (0.0%) | 6 (100.0%) |
| Business & Financial | 3 (60.0%) | 2 (40.0%) |
| Computers, Engineering & Science | 0 (0.0%) | 9 (100.0%) |
| Computers & Mathematics | 0 (0.0%) | 0 (0.0%) |
| Architecture & Engineering | 0 (0.0%) | 9 (100.0%) |
| Life, Physical & Social Science | 0 (0.0%) | 0 (0.0%) |
| Community & Social Service | 6 (17.1%) | 29 (82.9%) |
| Education, Arts & Media | 3 (21.4%) | 11 (78.6%) |
| Legal Services & Support | 0 (0.0%) | 1 (100.0%) |
| Education Instruction & Library | 3 (18.8%) | 13 (81.2%) |
| Arts, Media & Entertainment | 0 (0.0%) | 4 (100.0%) |
| Health Diagnosing & Treating | 7 (33.3%) | 14 (66.7%) |
| Health Technologists | 0 (0.0%) | 7 (100.0%) |
| Total (Category) | 16 (21.0%) | 60 (78.9%) |
| Total (Overall) | 154 (57.7%) | 113 (42.3%) |
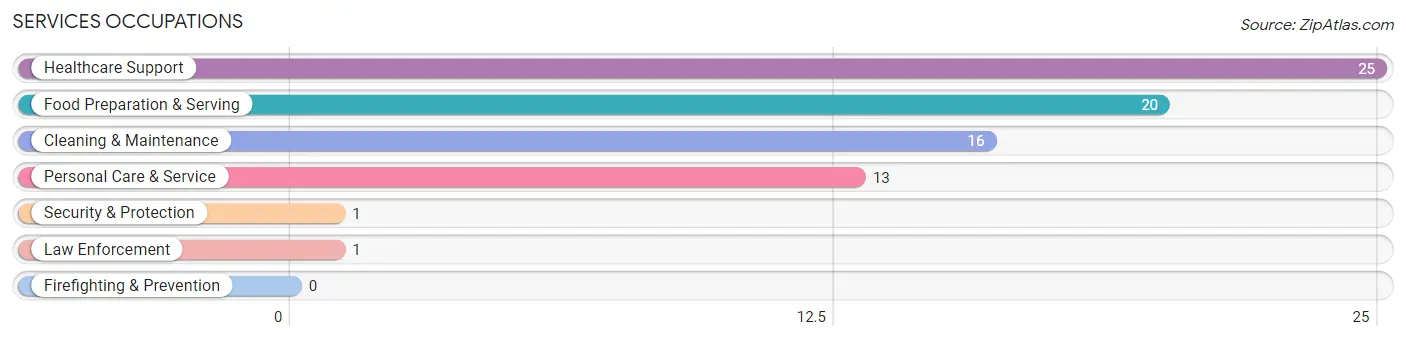
Services Occupations
The most common Services occupations in Shippenville borough are Healthcare Support (25 | 9.4%), Food Preparation & Serving (20 | 7.5%), Cleaning & Maintenance (16 | 6.0%), Personal Care & Service (13 | 4.9%), and Security & Protection (1 | 0.4%).
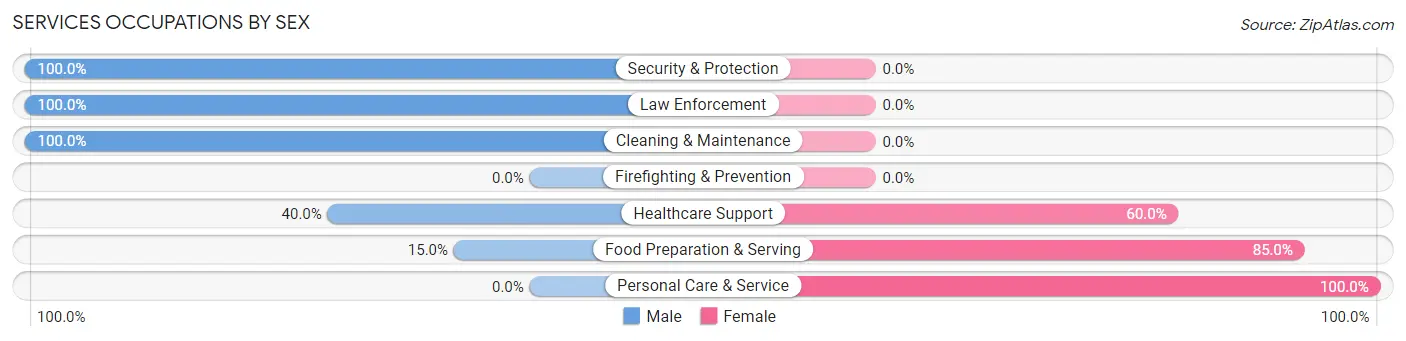
Services Occupations by Sex
Within the Services occupations in Shippenville borough, the most male-oriented occupations are Security & Protection (100.0%), Law Enforcement (100.0%), and Cleaning & Maintenance (100.0%), while the most female-oriented occupations are Personal Care & Service (100.0%), Food Preparation & Serving (85.0%), and Healthcare Support (60.0%).
| Occupation | Male | Female |
| Healthcare Support | 10 (40.0%) | 15 (60.0%) |
| Security & Protection | 1 (100.0%) | 0 (0.0%) |
| Firefighting & Prevention | 0 (0.0%) | 0 (0.0%) |
| Law Enforcement | 1 (100.0%) | 0 (0.0%) |
| Food Preparation & Serving | 3 (15.0%) | 17 (85.0%) |
| Cleaning & Maintenance | 16 (100.0%) | 0 (0.0%) |
| Personal Care & Service | 0 (0.0%) | 13 (100.0%) |
| Total (Category) | 30 (40.0%) | 45 (60.0%) |
| Total (Overall) | 154 (57.7%) | 113 (42.3%) |
Sales and Office Occupations
The most common Sales and Office occupations in Shippenville borough are Office & Administration (11 | 4.1%), and Sales & Related (8 | 3.0%).

Sales and Office Occupations by Sex

| Occupation | Male | Female |
| Sales & Related | 8 (100.0%) | 0 (0.0%) |
| Office & Administration | 4 (36.4%) | 7 (63.6%) |
| Total (Category) | 12 (63.2%) | 7 (36.8%) |
| Total (Overall) | 154 (57.7%) | 113 (42.3%) |
Natural Resources, Construction and Maintenance Occupations
The most common Natural Resources, Construction and Maintenance occupations in Shippenville borough are Installation, Maintenance & Repair (10 | 3.7%), Construction & Extraction (9 | 3.4%), and Farming, Fishing & Forestry (1 | 0.4%).

Natural Resources, Construction and Maintenance Occupations by Sex

| Occupation | Male | Female |
| Farming, Fishing & Forestry | 0 (0.0%) | 1 (100.0%) |
| Construction & Extraction | 9 (100.0%) | 0 (0.0%) |
| Installation, Maintenance & Repair | 10 (100.0%) | 0 (0.0%) |
| Total (Category) | 19 (95.0%) | 1 (5.0%) |
| Total (Overall) | 154 (57.7%) | 113 (42.3%) |
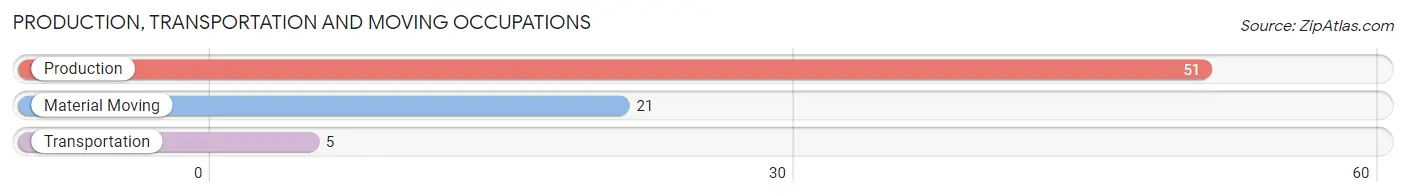
Production, Transportation and Moving Occupations
The most common Production, Transportation and Moving occupations in Shippenville borough are Production (51 | 19.1%), Material Moving (21 | 7.9%), and Transportation (5 | 1.9%).
Production, Transportation and Moving Occupations by Sex
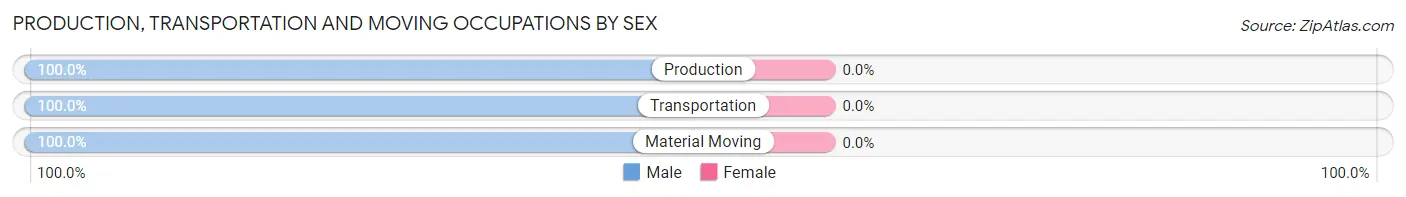
| Occupation | Male | Female |
| Production | 51 (100.0%) | 0 (0.0%) |
| Transportation | 5 (100.0%) | 0 (0.0%) |
| Material Moving | 21 (100.0%) | 0 (0.0%) |
| Total (Category) | 77 (100.0%) | 0 (0.0%) |
| Total (Overall) | 154 (57.7%) | 113 (42.3%) |
Employment Industries by Sex in Shippenville borough
Employment Industries in Shippenville borough
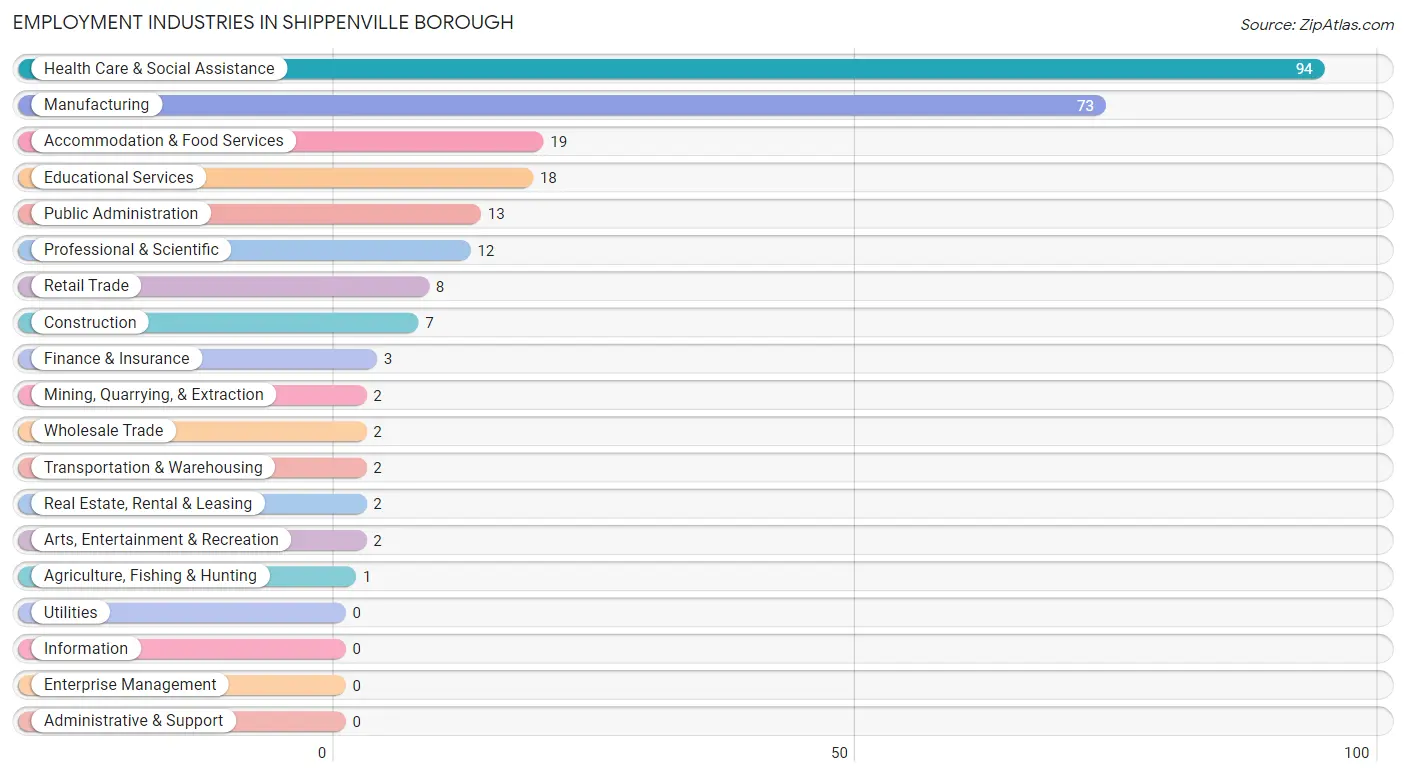
The major employment industries in Shippenville borough include Health Care & Social Assistance (94 | 35.2%), Manufacturing (73 | 27.3%), Accommodation & Food Services (19 | 7.1%), Educational Services (18 | 6.7%), and Public Administration (13 | 4.9%).
Employment Industries by Sex in Shippenville borough
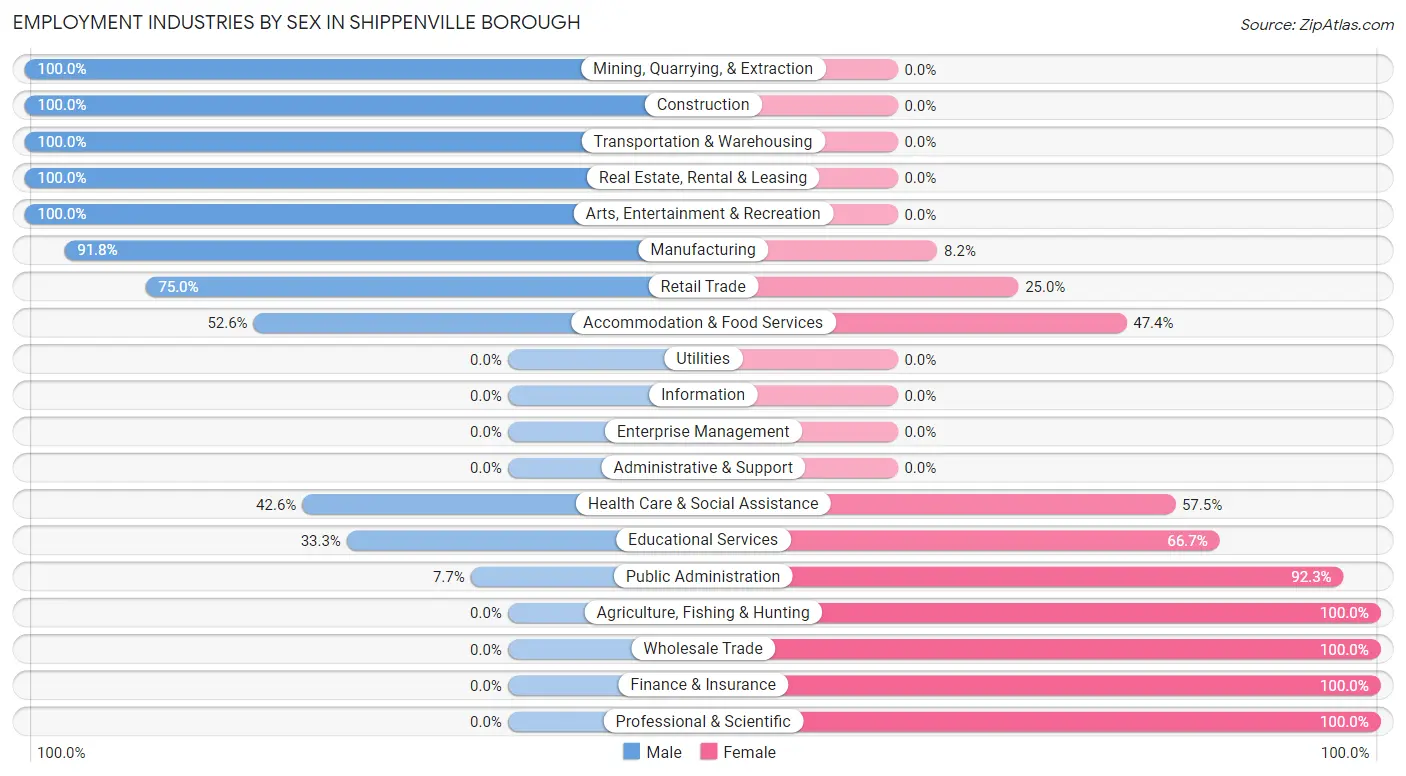
The Shippenville borough industries that see more men than women are Mining, Quarrying, & Extraction (100.0%), Construction (100.0%), and Transportation & Warehousing (100.0%), whereas the industries that tend to have a higher number of women are Agriculture, Fishing & Hunting (100.0%), Wholesale Trade (100.0%), and Finance & Insurance (100.0%).
| Industry | Male | Female |
| Agriculture, Fishing & Hunting | 0 (0.0%) | 1 (100.0%) |
| Mining, Quarrying, & Extraction | 2 (100.0%) | 0 (0.0%) |
| Construction | 7 (100.0%) | 0 (0.0%) |
| Manufacturing | 67 (91.8%) | 6 (8.2%) |
| Wholesale Trade | 0 (0.0%) | 2 (100.0%) |
| Retail Trade | 6 (75.0%) | 2 (25.0%) |
| Transportation & Warehousing | 2 (100.0%) | 0 (0.0%) |
| Utilities | 0 (0.0%) | 0 (0.0%) |
| Information | 0 (0.0%) | 0 (0.0%) |
| Finance & Insurance | 0 (0.0%) | 3 (100.0%) |
| Real Estate, Rental & Leasing | 2 (100.0%) | 0 (0.0%) |
| Professional & Scientific | 0 (0.0%) | 12 (100.0%) |
| Enterprise Management | 0 (0.0%) | 0 (0.0%) |
| Administrative & Support | 0 (0.0%) | 0 (0.0%) |
| Educational Services | 6 (33.3%) | 12 (66.7%) |
| Health Care & Social Assistance | 40 (42.5%) | 54 (57.5%) |
| Arts, Entertainment & Recreation | 2 (100.0%) | 0 (0.0%) |
| Accommodation & Food Services | 10 (52.6%) | 9 (47.4%) |
| Public Administration | 1 (7.7%) | 12 (92.3%) |
| Total | 154 (57.7%) | 113 (42.3%) |
Education in Shippenville borough
School Enrollment in Shippenville borough
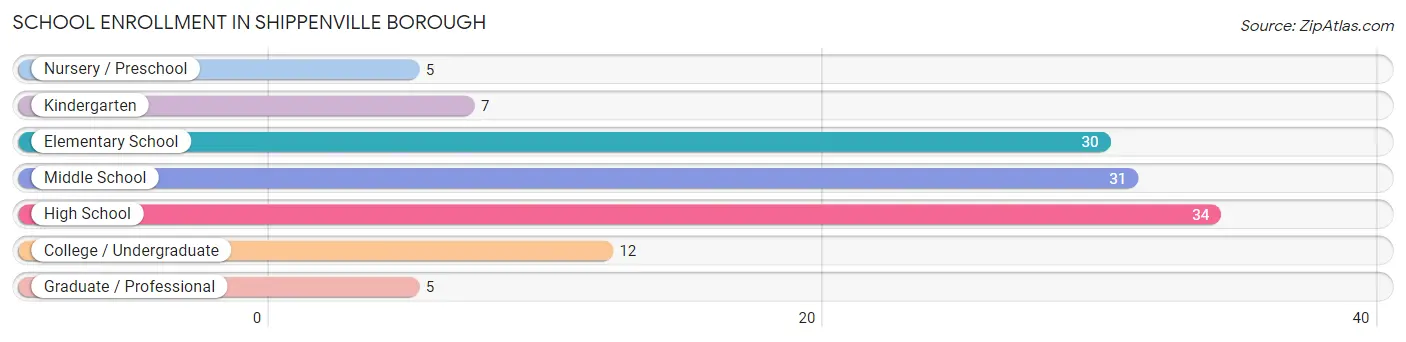
The most common levels of schooling among the 124 students in Shippenville borough are high school (34 | 27.4%), middle school (31 | 25.0%), and elementary school (30 | 24.2%).
| School Level | # Students | % Students |
| Nursery / Preschool | 5 | 4.0% |
| Kindergarten | 7 | 5.7% |
| Elementary School | 30 | 24.2% |
| Middle School | 31 | 25.0% |
| High School | 34 | 27.4% |
| College / Undergraduate | 12 | 9.7% |
| Graduate / Professional | 5 | 4.0% |
| Total | 124 | 100.0% |
School Enrollment by Age by Funding Source in Shippenville borough
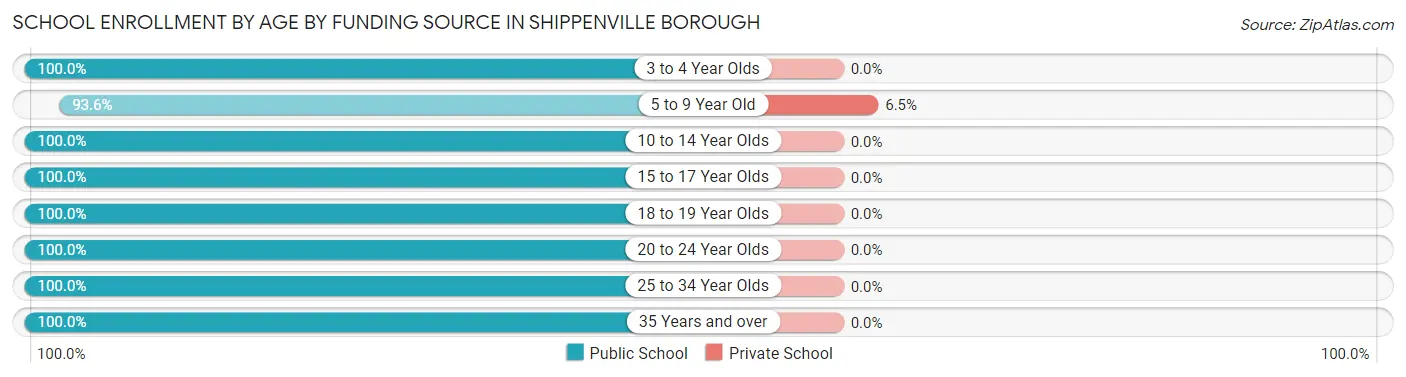
Out of a total of 124 students who are enrolled in schools in Shippenville borough, 2 (1.6%) attend a private institution, while the remaining 122 (98.4%) are enrolled in public schools. The age group of 5 to 9 year old has the highest likelihood of being enrolled in private schools, with 2 (6.5% in the age bracket) enrolled. Conversely, the age group of 3 to 4 year olds has the lowest likelihood of being enrolled in a private school, with 3 (100.0% in the age bracket) attending a public institution.
| Age Bracket | Public School | Private School |
| 3 to 4 Year Olds | 3 (100.0%) | 0 (0.0%) |
| 5 to 9 Year Old | 29 (93.5%) | 2 (6.5%) |
| 10 to 14 Year Olds | 39 (100.0%) | 0 (0.0%) |
| 15 to 17 Year Olds | 28 (100.0%) | 0 (0.0%) |
| 18 to 19 Year Olds | 9 (100.0%) | 0 (0.0%) |
| 20 to 24 Year Olds | 3 (100.0%) | 0 (0.0%) |
| 25 to 34 Year Olds | 9 (100.0%) | 0 (0.0%) |
| 35 Years and over | 2 (100.0%) | 0 (0.0%) |
| Total | 122 (98.4%) | 2 (1.6%) |
Educational Attainment by Field of Study in Shippenville borough
Education (24 | 34.8%), science & technology (10 | 14.5%), business (8 | 11.6%), psychology (7 | 10.1%), and arts & humanities (6 | 8.7%) are the most common fields of study among 69 individuals in Shippenville borough who have obtained a bachelor's degree or higher.
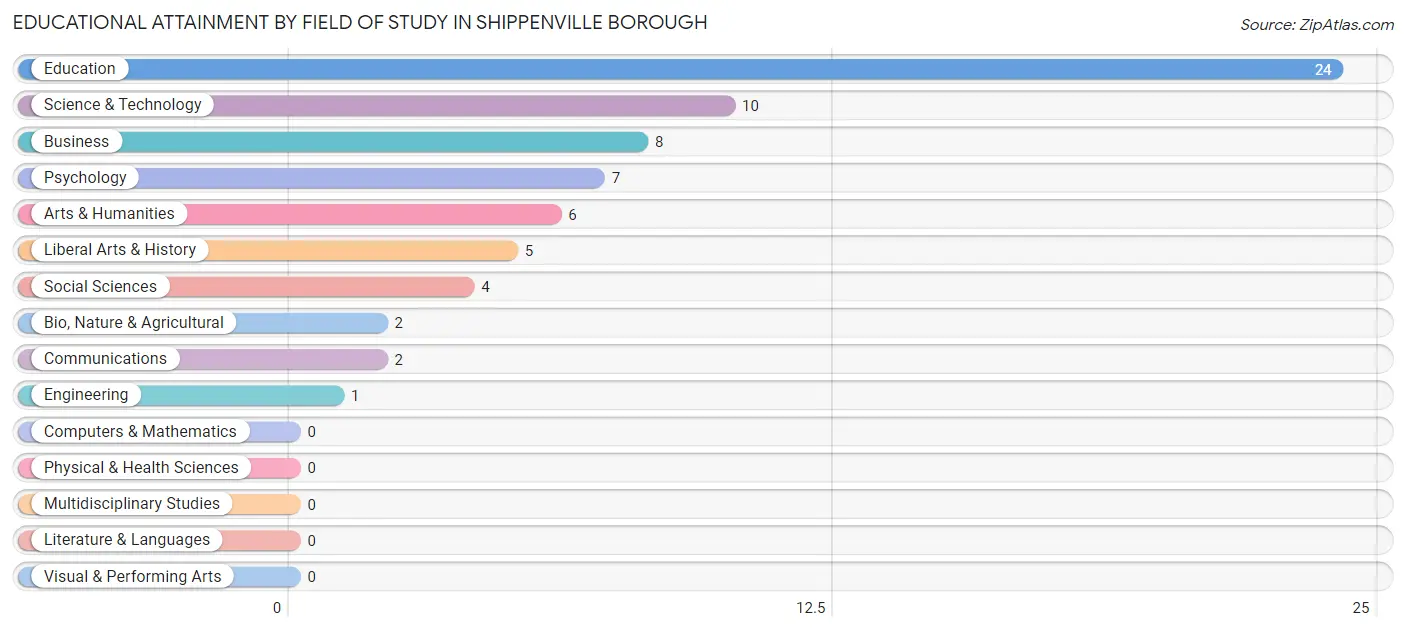
| Field of Study | # Graduates | % Graduates |
| Computers & Mathematics | 0 | 0.0% |
| Bio, Nature & Agricultural | 2 | 2.9% |
| Physical & Health Sciences | 0 | 0.0% |
| Psychology | 7 | 10.1% |
| Social Sciences | 4 | 5.8% |
| Engineering | 1 | 1.5% |
| Multidisciplinary Studies | 0 | 0.0% |
| Science & Technology | 10 | 14.5% |
| Business | 8 | 11.6% |
| Education | 24 | 34.8% |
| Literature & Languages | 0 | 0.0% |
| Liberal Arts & History | 5 | 7.2% |
| Visual & Performing Arts | 0 | 0.0% |
| Communications | 2 | 2.9% |
| Arts & Humanities | 6 | 8.7% |
| Total | 69 | 100.0% |
Transportation & Commute in Shippenville borough
Vehicle Availability by Sex in Shippenville borough
The most prevalent vehicle ownership categories in Shippenville borough are males with 2 vehicles (84, accounting for 54.5%) and females with 2 vehicles (63, making up 74.3%).
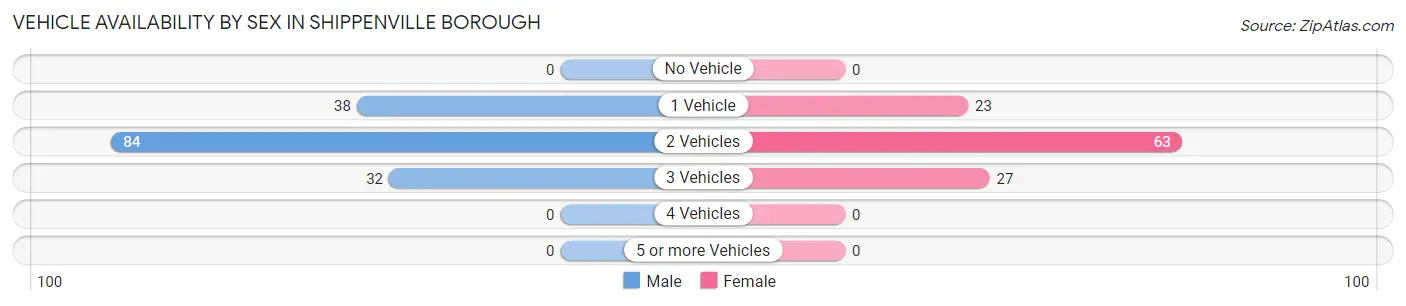
| Vehicles Available | Male | Female |
| No Vehicle | 0 (0.0%) | 0 (0.0%) |
| 1 Vehicle | 38 (24.7%) | 23 (20.3%) |
| 2 Vehicles | 84 (54.5%) | 63 (55.7%) |
| 3 Vehicles | 32 (20.8%) | 27 (23.9%) |
| 4 Vehicles | 0 (0.0%) | 0 (0.0%) |
| 5 or more Vehicles | 0 (0.0%) | 0 (0.0%) |
| Total | 154 (100.0%) | 113 (100.0%) |
Commute Time in Shippenville borough
The most frequently occuring commute durations in Shippenville borough are 10 to 14 minutes (53 commuters, 21.4%), 15 to 19 minutes (46 commuters, 18.5%), and 5 to 9 minutes (45 commuters, 18.1%).
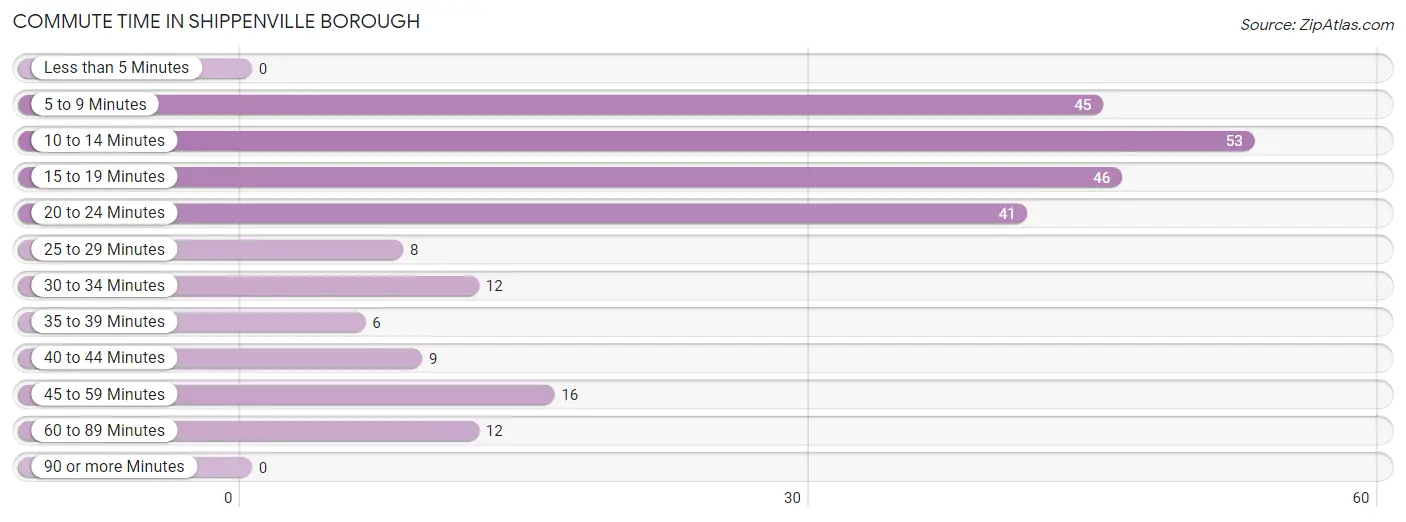
| Commute Time | # Commuters | % Commuters |
| Less than 5 Minutes | 0 | 0.0% |
| 5 to 9 Minutes | 45 | 18.1% |
| 10 to 14 Minutes | 53 | 21.4% |
| 15 to 19 Minutes | 46 | 18.5% |
| 20 to 24 Minutes | 41 | 16.5% |
| 25 to 29 Minutes | 8 | 3.2% |
| 30 to 34 Minutes | 12 | 4.8% |
| 35 to 39 Minutes | 6 | 2.4% |
| 40 to 44 Minutes | 9 | 3.6% |
| 45 to 59 Minutes | 16 | 6.5% |
| 60 to 89 Minutes | 12 | 4.8% |
| 90 or more Minutes | 0 | 0.0% |
Commute Time by Sex in Shippenville borough
The most common commute times in Shippenville borough are 10 to 14 minutes (33 commuters, 22.6%) for males and 5 to 9 minutes (22 commuters, 21.6%) for females.
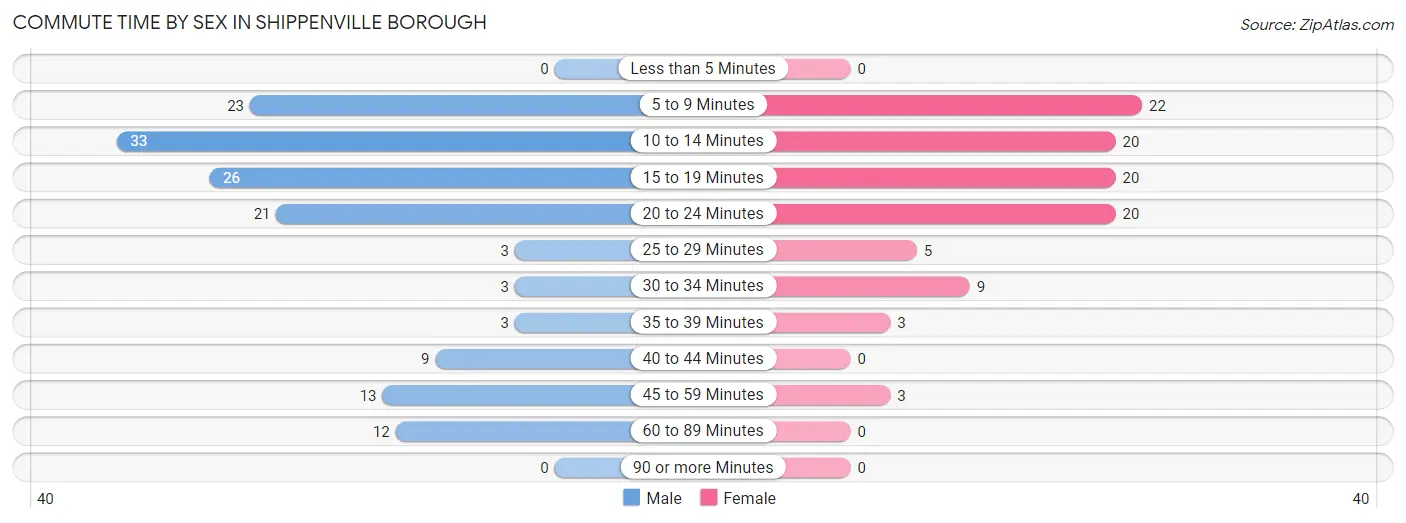
| Commute Time | Male | Female |
| Less than 5 Minutes | 0 (0.0%) | 0 (0.0%) |
| 5 to 9 Minutes | 23 (15.8%) | 22 (21.6%) |
| 10 to 14 Minutes | 33 (22.6%) | 20 (19.6%) |
| 15 to 19 Minutes | 26 (17.8%) | 20 (19.6%) |
| 20 to 24 Minutes | 21 (14.4%) | 20 (19.6%) |
| 25 to 29 Minutes | 3 (2.1%) | 5 (4.9%) |
| 30 to 34 Minutes | 3 (2.1%) | 9 (8.8%) |
| 35 to 39 Minutes | 3 (2.1%) | 3 (2.9%) |
| 40 to 44 Minutes | 9 (6.2%) | 0 (0.0%) |
| 45 to 59 Minutes | 13 (8.9%) | 3 (2.9%) |
| 60 to 89 Minutes | 12 (8.2%) | 0 (0.0%) |
| 90 or more Minutes | 0 (0.0%) | 0 (0.0%) |
Time of Departure to Work by Sex in Shippenville borough
The most frequent times of departure to work in Shippenville borough are 6:30 AM to 6:59 AM (29, 19.9%) for males and 8:00 AM to 8:29 AM (21, 20.6%) for females.
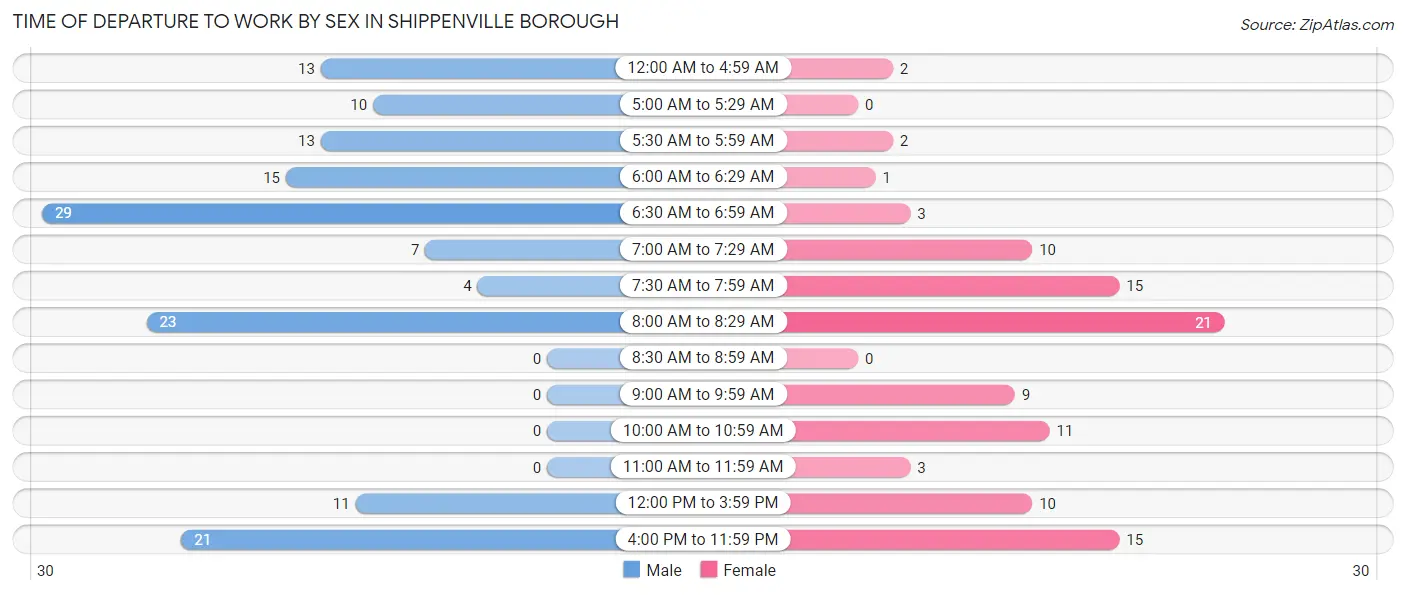
| Time of Departure | Male | Female |
| 12:00 AM to 4:59 AM | 13 (8.9%) | 2 (2.0%) |
| 5:00 AM to 5:29 AM | 10 (6.9%) | 0 (0.0%) |
| 5:30 AM to 5:59 AM | 13 (8.9%) | 2 (2.0%) |
| 6:00 AM to 6:29 AM | 15 (10.3%) | 1 (1.0%) |
| 6:30 AM to 6:59 AM | 29 (19.9%) | 3 (2.9%) |
| 7:00 AM to 7:29 AM | 7 (4.8%) | 10 (9.8%) |
| 7:30 AM to 7:59 AM | 4 (2.7%) | 15 (14.7%) |
| 8:00 AM to 8:29 AM | 23 (15.8%) | 21 (20.6%) |
| 8:30 AM to 8:59 AM | 0 (0.0%) | 0 (0.0%) |
| 9:00 AM to 9:59 AM | 0 (0.0%) | 9 (8.8%) |
| 10:00 AM to 10:59 AM | 0 (0.0%) | 11 (10.8%) |
| 11:00 AM to 11:59 AM | 0 (0.0%) | 3 (2.9%) |
| 12:00 PM to 3:59 PM | 11 (7.5%) | 10 (9.8%) |
| 4:00 PM to 11:59 PM | 21 (14.4%) | 15 (14.7%) |
| Total | 146 (100.0%) | 102 (100.0%) |
Housing Occupancy in Shippenville borough
Occupancy by Ownership in Shippenville borough
Of the total 213 dwellings in Shippenville borough, owner-occupied units account for 122 (57.3%), while renter-occupied units make up 91 (42.7%).
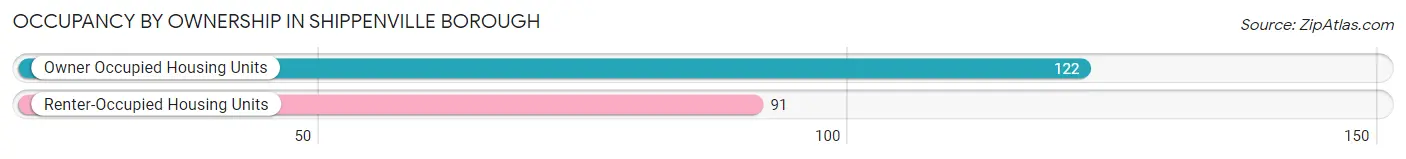
| Occupancy | # Housing Units | % Housing Units |
| Owner Occupied Housing Units | 122 | 57.3% |
| Renter-Occupied Housing Units | 91 | 42.7% |
| Total Occupied Housing Units | 213 | 100.0% |
Occupancy by Household Size in Shippenville borough
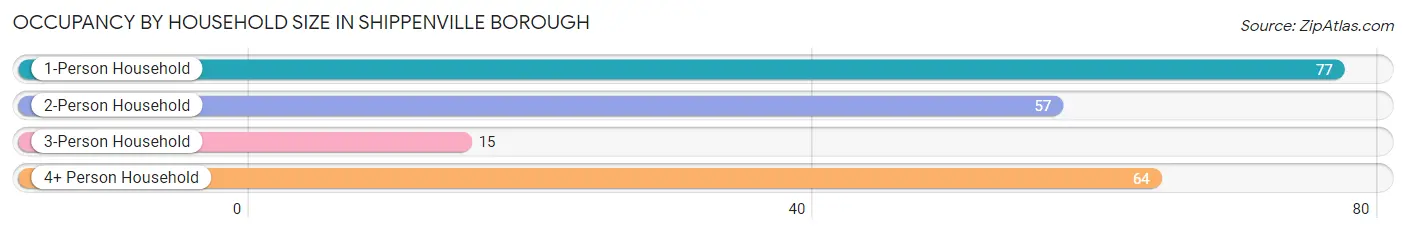
| Household Size | # Housing Units | % Housing Units |
| 1-Person Household | 77 | 36.1% |
| 2-Person Household | 57 | 26.8% |
| 3-Person Household | 15 | 7.0% |
| 4+ Person Household | 64 | 30.0% |
| Total Housing Units | 213 | 100.0% |
Occupancy by Ownership by Household Size in Shippenville borough
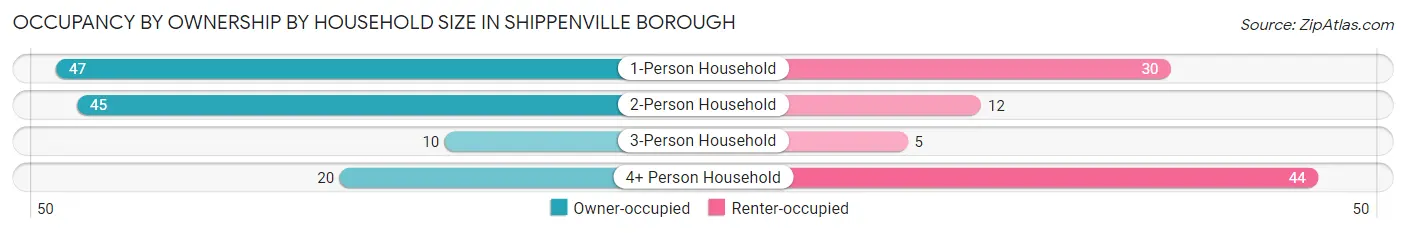
| Household Size | Owner-occupied | Renter-occupied |
| 1-Person Household | 47 (61.0%) | 30 (39.0%) |
| 2-Person Household | 45 (78.9%) | 12 (21.0%) |
| 3-Person Household | 10 (66.7%) | 5 (33.3%) |
| 4+ Person Household | 20 (31.2%) | 44 (68.8%) |
| Total Housing Units | 122 (57.3%) | 91 (42.7%) |
Occupancy by Educational Attainment in Shippenville borough
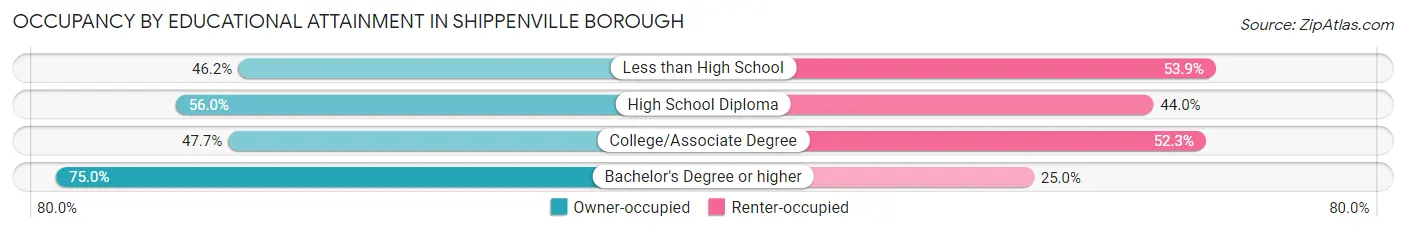
| Household Size | Owner-occupied | Renter-occupied |
| Less than High School | 6 (46.2%) | 7 (53.8%) |
| High School Diploma | 65 (56.0%) | 51 (44.0%) |
| College/Associate Degree | 21 (47.7%) | 23 (52.3%) |
| Bachelor's Degree or higher | 30 (75.0%) | 10 (25.0%) |
Occupancy by Age of Householder in Shippenville borough
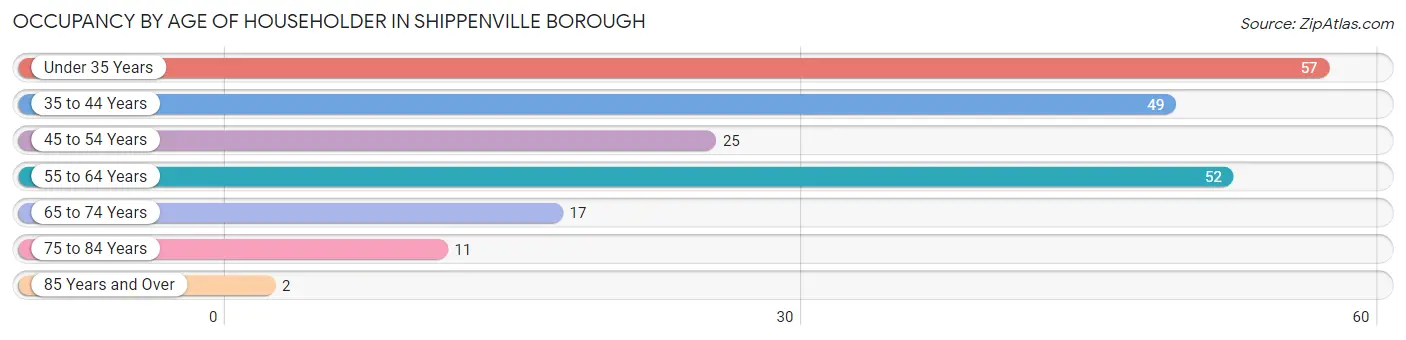
| Age Bracket | # Households | % Households |
| Under 35 Years | 57 | 26.8% |
| 35 to 44 Years | 49 | 23.0% |
| 45 to 54 Years | 25 | 11.7% |
| 55 to 64 Years | 52 | 24.4% |
| 65 to 74 Years | 17 | 8.0% |
| 75 to 84 Years | 11 | 5.2% |
| 85 Years and Over | 2 | 0.9% |
| Total | 213 | 100.0% |
Housing Finances in Shippenville borough
Median Income by Occupancy in Shippenville borough
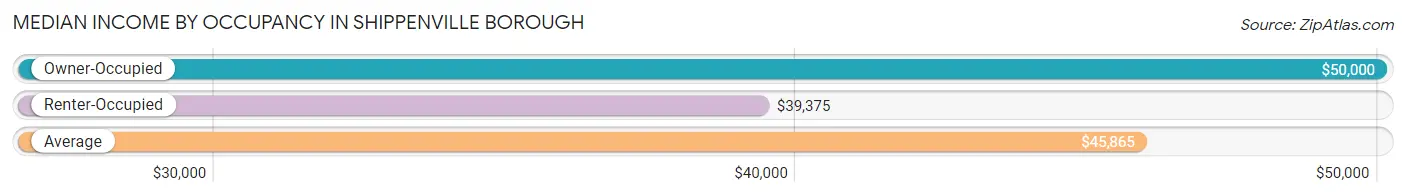
| Occupancy Type | # Households | Median Income |
| Owner-Occupied | 122 (57.3%) | $50,000 |
| Renter-Occupied | 91 (42.7%) | $39,375 |
| Average | 213 (100.0%) | $45,865 |
Occupancy by Householder Income Bracket in Shippenville borough
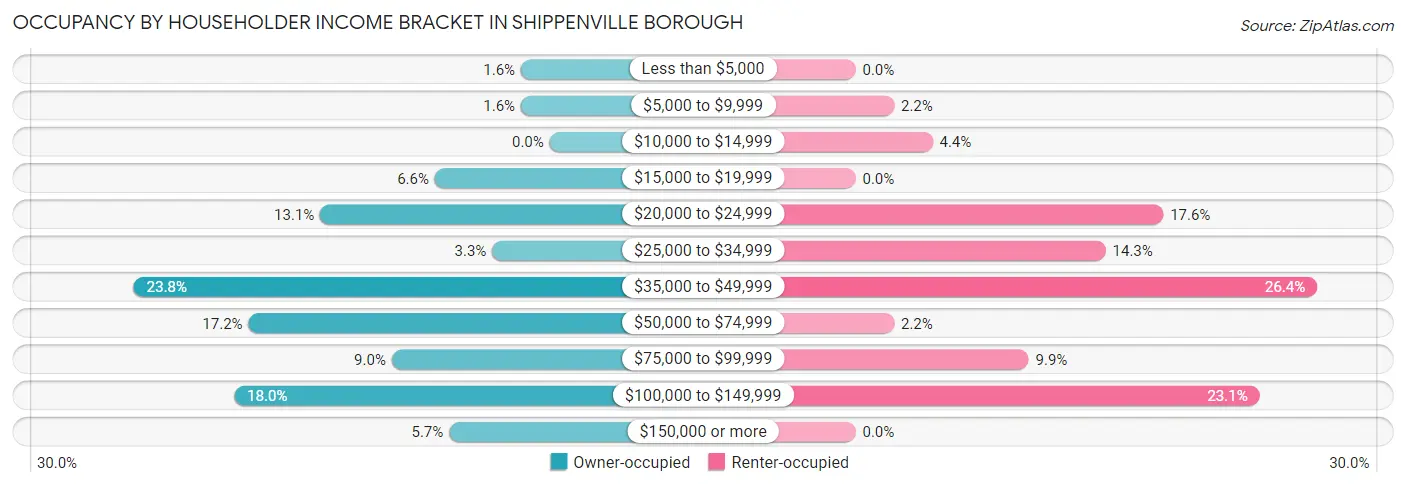
| Income Bracket | Owner-occupied | Renter-occupied |
| Less than $5,000 | 2 (1.6%) | 0 (0.0%) |
| $5,000 to $9,999 | 2 (1.6%) | 2 (2.2%) |
| $10,000 to $14,999 | 0 (0.0%) | 4 (4.4%) |
| $15,000 to $19,999 | 8 (6.6%) | 0 (0.0%) |
| $20,000 to $24,999 | 16 (13.1%) | 16 (17.6%) |
| $25,000 to $34,999 | 4 (3.3%) | 13 (14.3%) |
| $35,000 to $49,999 | 29 (23.8%) | 24 (26.4%) |
| $50,000 to $74,999 | 21 (17.2%) | 2 (2.2%) |
| $75,000 to $99,999 | 11 (9.0%) | 9 (9.9%) |
| $100,000 to $149,999 | 22 (18.0%) | 21 (23.1%) |
| $150,000 or more | 7 (5.7%) | 0 (0.0%) |
| Total | 122 (100.0%) | 91 (100.0%) |
Monthly Housing Cost Tiers in Shippenville borough
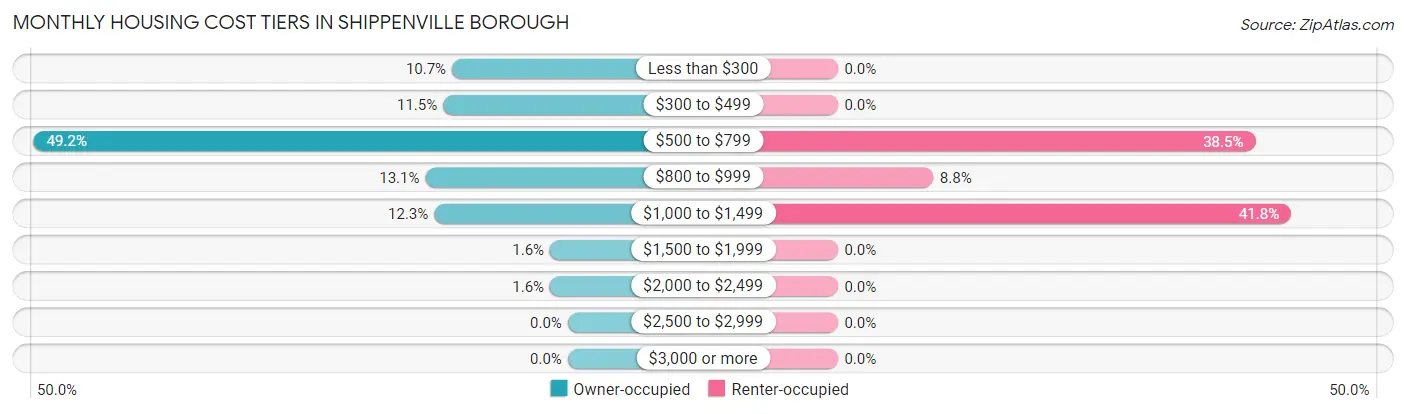
| Monthly Cost | Owner-occupied | Renter-occupied |
| Less than $300 | 13 (10.7%) | 0 (0.0%) |
| $300 to $499 | 14 (11.5%) | 0 (0.0%) |
| $500 to $799 | 60 (49.2%) | 35 (38.5%) |
| $800 to $999 | 16 (13.1%) | 8 (8.8%) |
| $1,000 to $1,499 | 15 (12.3%) | 38 (41.8%) |
| $1,500 to $1,999 | 2 (1.6%) | 0 (0.0%) |
| $2,000 to $2,499 | 2 (1.6%) | 0 (0.0%) |
| $2,500 to $2,999 | 0 (0.0%) | 0 (0.0%) |
| $3,000 or more | 0 (0.0%) | 0 (0.0%) |
| Total | 122 (100.0%) | 91 (100.0%) |
Physical Housing Characteristics in Shippenville borough
Housing Structures in Shippenville borough
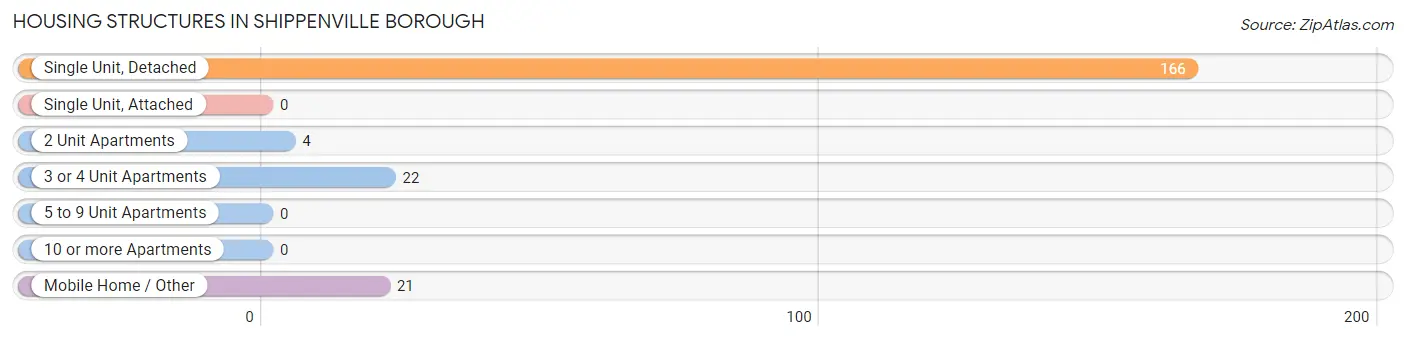
| Structure Type | # Housing Units | % Housing Units |
| Single Unit, Detached | 166 | 77.9% |
| Single Unit, Attached | 0 | 0.0% |
| 2 Unit Apartments | 4 | 1.9% |
| 3 or 4 Unit Apartments | 22 | 10.3% |
| 5 to 9 Unit Apartments | 0 | 0.0% |
| 10 or more Apartments | 0 | 0.0% |
| Mobile Home / Other | 21 | 9.9% |
| Total | 213 | 100.0% |
Housing Structures by Occupancy in Shippenville borough
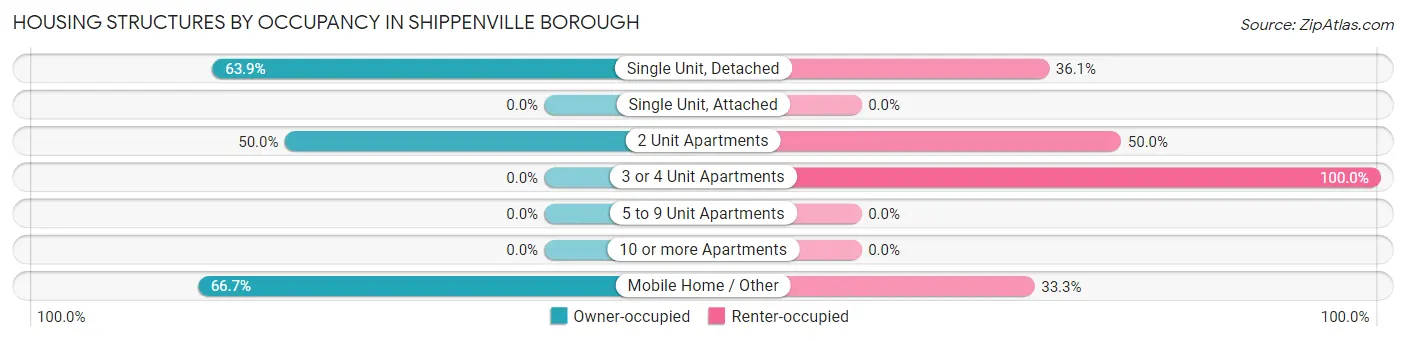
| Structure Type | Owner-occupied | Renter-occupied |
| Single Unit, Detached | 106 (63.9%) | 60 (36.1%) |
| Single Unit, Attached | 0 (0.0%) | 0 (0.0%) |
| 2 Unit Apartments | 2 (50.0%) | 2 (50.0%) |
| 3 or 4 Unit Apartments | 0 (0.0%) | 22 (100.0%) |
| 5 to 9 Unit Apartments | 0 (0.0%) | 0 (0.0%) |
| 10 or more Apartments | 0 (0.0%) | 0 (0.0%) |
| Mobile Home / Other | 14 (66.7%) | 7 (33.3%) |
| Total | 122 (57.3%) | 91 (42.7%) |
Housing Structures by Number of Rooms in Shippenville borough
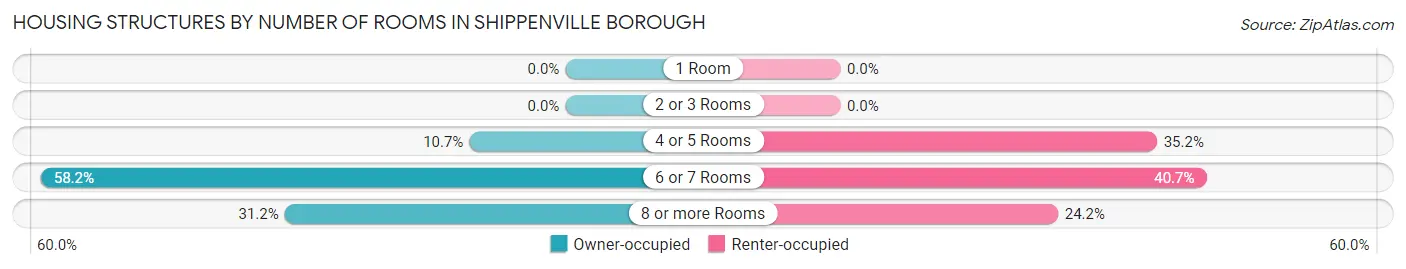
| Number of Rooms | Owner-occupied | Renter-occupied |
| 1 Room | 0 (0.0%) | 0 (0.0%) |
| 2 or 3 Rooms | 0 (0.0%) | 0 (0.0%) |
| 4 or 5 Rooms | 13 (10.7%) | 32 (35.2%) |
| 6 or 7 Rooms | 71 (58.2%) | 37 (40.7%) |
| 8 or more Rooms | 38 (31.1%) | 22 (24.2%) |
| Total | 122 (100.0%) | 91 (100.0%) |
Housing Structure by Heating Type in Shippenville borough
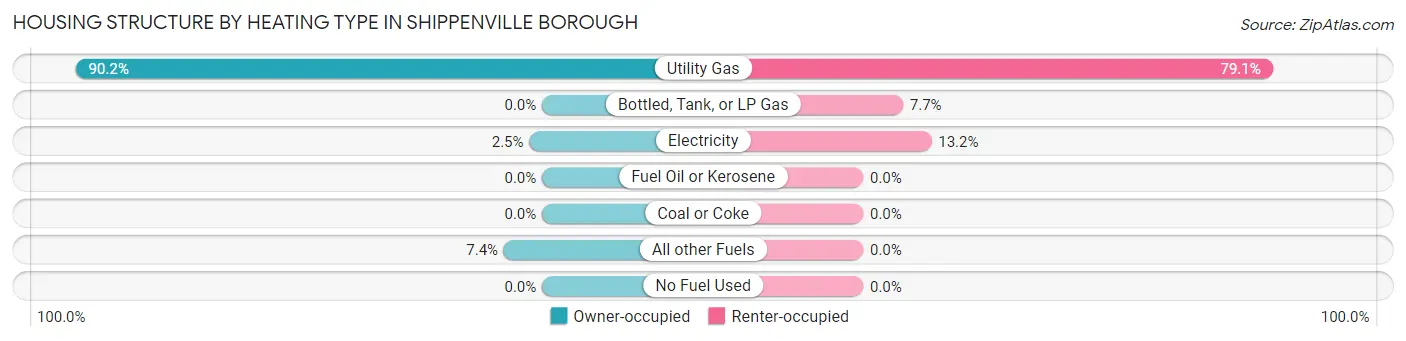
| Heating Type | Owner-occupied | Renter-occupied |
| Utility Gas | 110 (90.2%) | 72 (79.1%) |
| Bottled, Tank, or LP Gas | 0 (0.0%) | 7 (7.7%) |
| Electricity | 3 (2.5%) | 12 (13.2%) |
| Fuel Oil or Kerosene | 0 (0.0%) | 0 (0.0%) |
| Coal or Coke | 0 (0.0%) | 0 (0.0%) |
| All other Fuels | 9 (7.4%) | 0 (0.0%) |
| No Fuel Used | 0 (0.0%) | 0 (0.0%) |
| Total | 122 (100.0%) | 91 (100.0%) |
Household Vehicle Usage in Shippenville borough
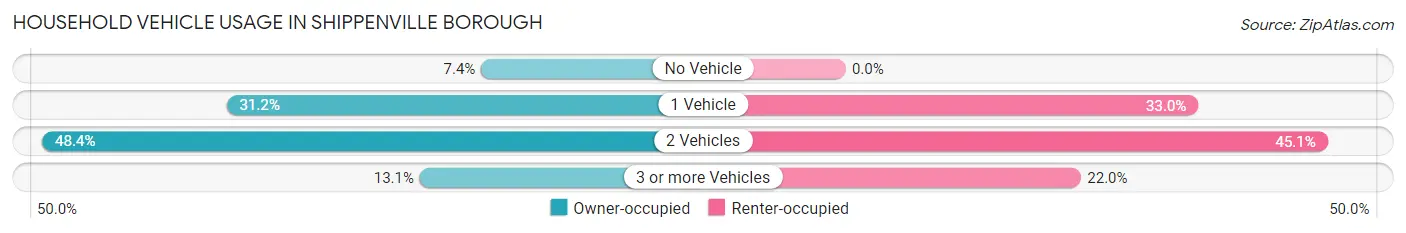
| Vehicles per Household | Owner-occupied | Renter-occupied |
| No Vehicle | 9 (7.4%) | 0 (0.0%) |
| 1 Vehicle | 38 (31.1%) | 30 (33.0%) |
| 2 Vehicles | 59 (48.4%) | 41 (45.1%) |
| 3 or more Vehicles | 16 (13.1%) | 20 (22.0%) |
| Total | 122 (100.0%) | 91 (100.0%) |
Real Estate & Mortgages in Shippenville borough
Real Estate and Mortgage Overview in Shippenville borough
| Characteristic | Without Mortgage | With Mortgage |
| Housing Units | 64 | 58 |
| Median Property Value | $73,800 | $95,000 |
| Median Household Income | $37,143 | $5 |
| Monthly Housing Costs | $547 | $0 |
| Real Estate Taxes | $867 | $2 |
Property Value by Mortgage Status in Shippenville borough
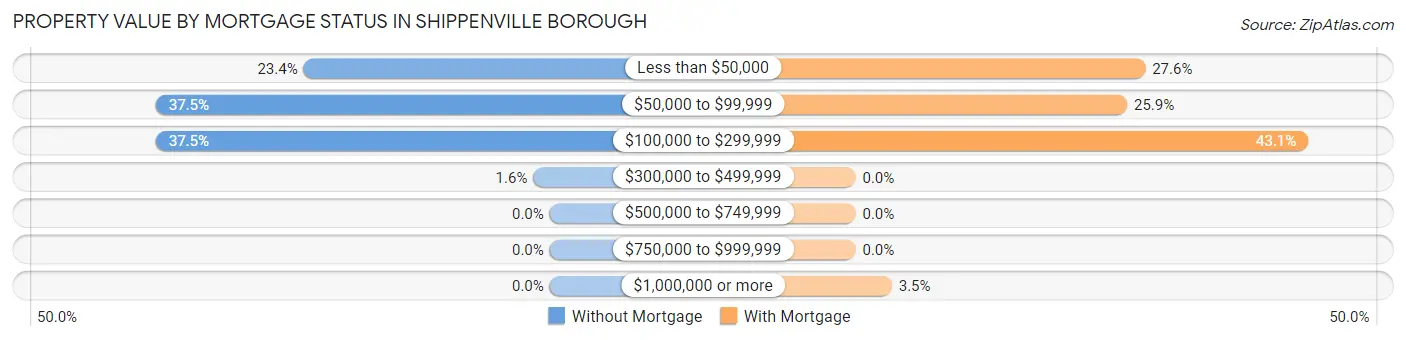
| Property Value | Without Mortgage | With Mortgage |
| Less than $50,000 | 15 (23.4%) | 16 (27.6%) |
| $50,000 to $99,999 | 24 (37.5%) | 15 (25.9%) |
| $100,000 to $299,999 | 24 (37.5%) | 25 (43.1%) |
| $300,000 to $499,999 | 1 (1.6%) | 0 (0.0%) |
| $500,000 to $749,999 | 0 (0.0%) | 0 (0.0%) |
| $750,000 to $999,999 | 0 (0.0%) | 0 (0.0%) |
| $1,000,000 or more | 0 (0.0%) | 2 (3.5%) |
| Total | 64 (100.0%) | 58 (100.0%) |
Household Income by Mortgage Status in Shippenville borough
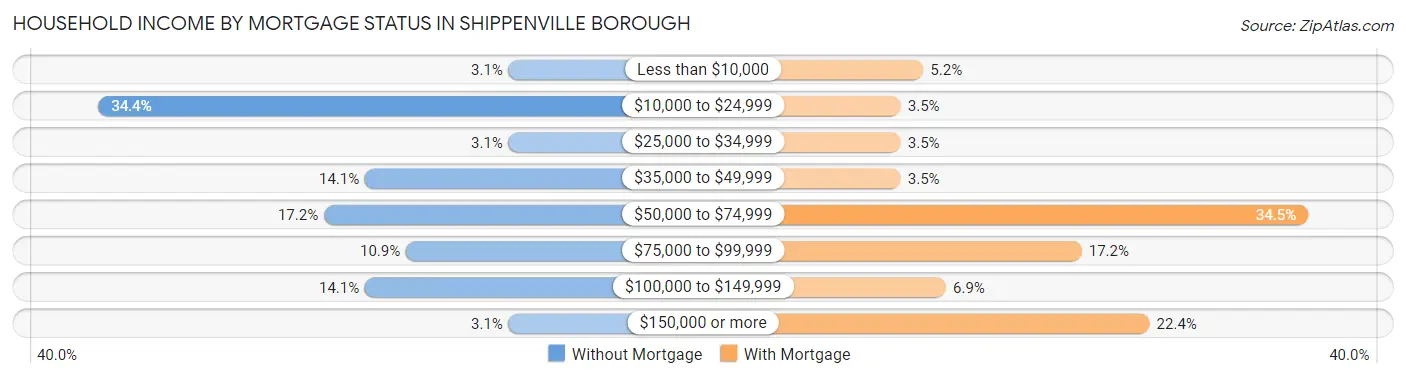
| Household Income | Without Mortgage | With Mortgage |
| Less than $10,000 | 2 (3.1%) | 3 (5.2%) |
| $10,000 to $24,999 | 22 (34.4%) | 2 (3.5%) |
| $25,000 to $34,999 | 2 (3.1%) | 2 (3.5%) |
| $35,000 to $49,999 | 9 (14.1%) | 2 (3.5%) |
| $50,000 to $74,999 | 11 (17.2%) | 20 (34.5%) |
| $75,000 to $99,999 | 7 (10.9%) | 10 (17.2%) |
| $100,000 to $149,999 | 9 (14.1%) | 4 (6.9%) |
| $150,000 or more | 2 (3.1%) | 13 (22.4%) |
| Total | 64 (100.0%) | 58 (100.0%) |
Property Value to Household Income Ratio in Shippenville borough
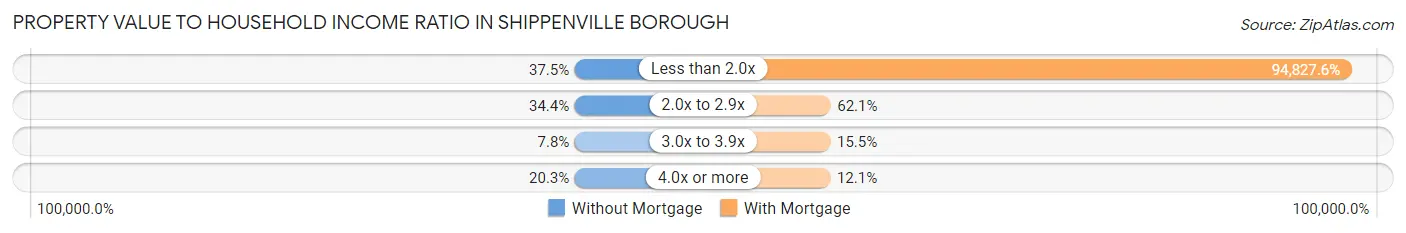
| Value-to-Income Ratio | Without Mortgage | With Mortgage |
| Less than 2.0x | 24 (37.5%) | 55,000 (94,827.6%) |
| 2.0x to 2.9x | 22 (34.4%) | 36 (62.1%) |
| 3.0x to 3.9x | 5 (7.8%) | 9 (15.5%) |
| 4.0x or more | 13 (20.3%) | 7 (12.1%) |
| Total | 64 (100.0%) | 58 (100.0%) |
Real Estate Taxes by Mortgage Status in Shippenville borough
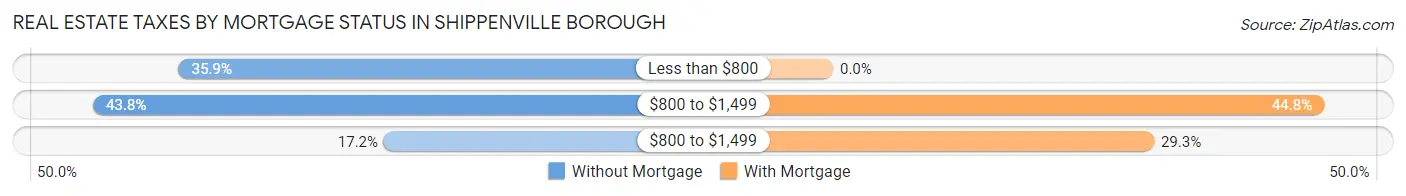
| Property Taxes | Without Mortgage | With Mortgage |
| Less than $800 | 23 (35.9%) | 0 (0.0%) |
| $800 to $1,499 | 28 (43.8%) | 26 (44.8%) |
| $800 to $1,499 | 11 (17.2%) | 17 (29.3%) |
| Total | 64 (100.0%) | 58 (100.0%) |
Health & Disability in Shippenville borough
Health Insurance Coverage by Age in Shippenville borough
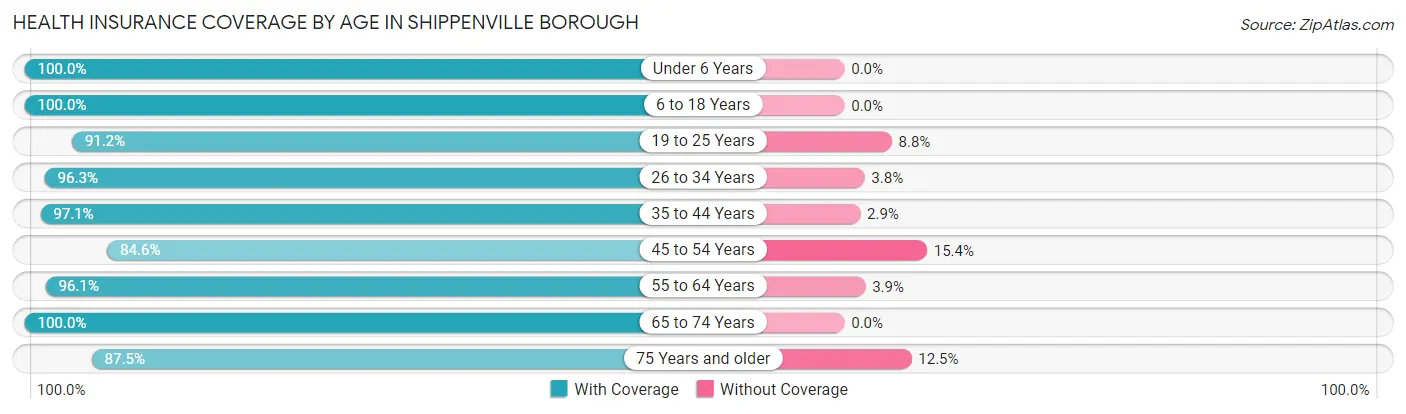
| Age Bracket | With Coverage | Without Coverage |
| Under 6 Years | 59 (100.0%) | 0 (0.0%) |
| 6 to 18 Years | 107 (100.0%) | 0 (0.0%) |
| 19 to 25 Years | 62 (91.2%) | 6 (8.8%) |
| 26 to 34 Years | 77 (96.3%) | 3 (3.7%) |
| 35 to 44 Years | 66 (97.1%) | 2 (2.9%) |
| 45 to 54 Years | 33 (84.6%) | 6 (15.4%) |
| 55 to 64 Years | 74 (96.1%) | 3 (3.9%) |
| 65 to 74 Years | 33 (100.0%) | 0 (0.0%) |
| 75 Years and older | 14 (87.5%) | 2 (12.5%) |
| Total | 525 (96.0%) | 22 (4.0%) |
Health Insurance Coverage by Citizenship Status in Shippenville borough
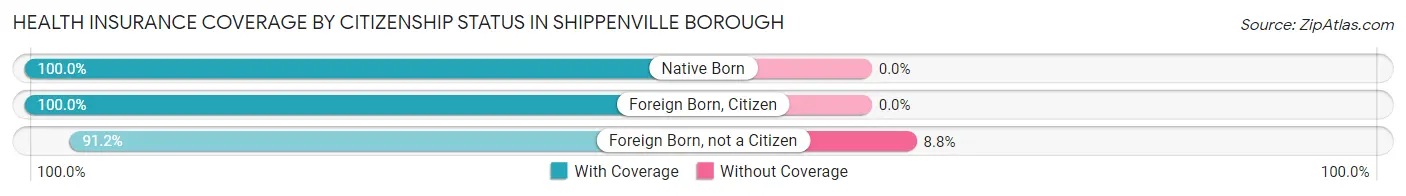
| Citizenship Status | With Coverage | Without Coverage |
| Native Born | 59 (100.0%) | 0 (0.0%) |
| Foreign Born, Citizen | 107 (100.0%) | 0 (0.0%) |
| Foreign Born, not a Citizen | 62 (91.2%) | 6 (8.8%) |
Health Insurance Coverage by Household Income in Shippenville borough
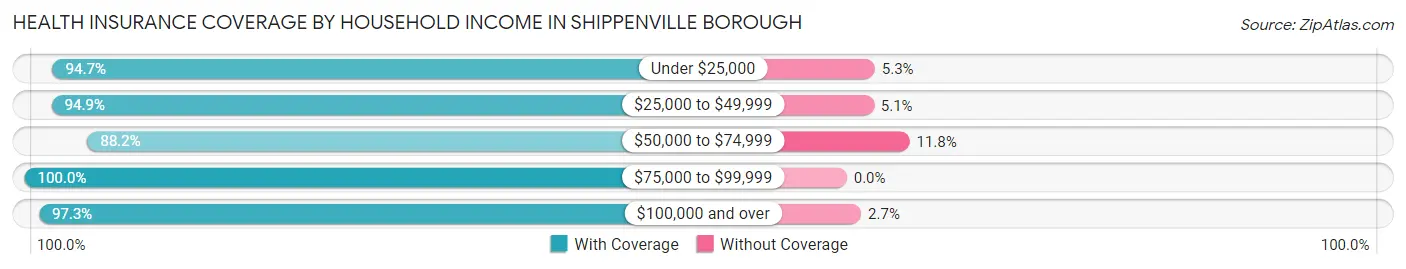
| Household Income | With Coverage | Without Coverage |
| Under $25,000 | 72 (94.7%) | 4 (5.3%) |
| $25,000 to $49,999 | 131 (94.9%) | 7 (5.1%) |
| $50,000 to $74,999 | 45 (88.2%) | 6 (11.8%) |
| $75,000 to $99,999 | 82 (100.0%) | 0 (0.0%) |
| $100,000 and over | 181 (97.3%) | 5 (2.7%) |
Public vs Private Health Insurance Coverage by Age in Shippenville borough
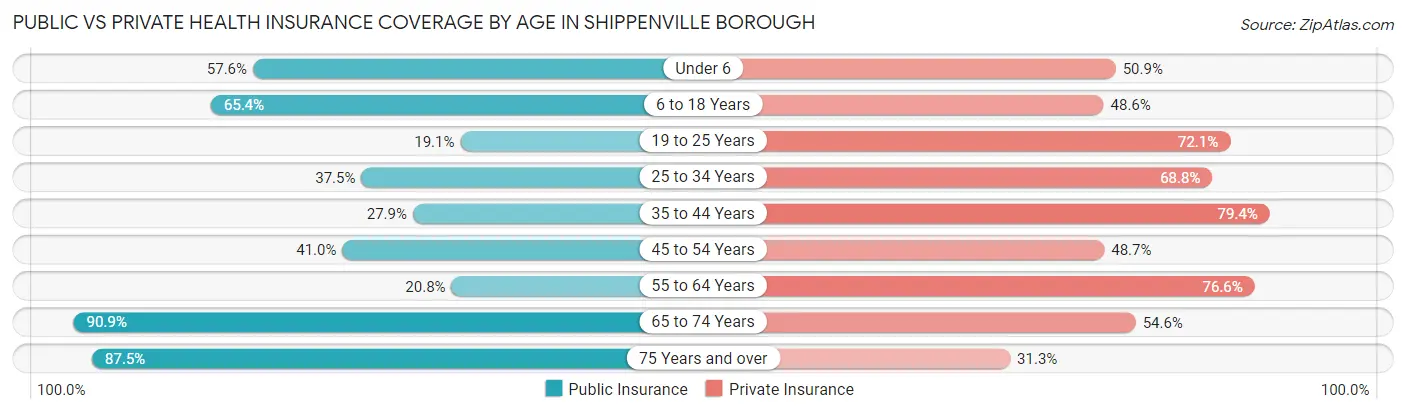
| Age Bracket | Public Insurance | Private Insurance |
| Under 6 | 34 (57.6%) | 30 (50.8%) |
| 6 to 18 Years | 70 (65.4%) | 52 (48.6%) |
| 19 to 25 Years | 13 (19.1%) | 49 (72.1%) |
| 25 to 34 Years | 30 (37.5%) | 55 (68.8%) |
| 35 to 44 Years | 19 (27.9%) | 54 (79.4%) |
| 45 to 54 Years | 16 (41.0%) | 19 (48.7%) |
| 55 to 64 Years | 16 (20.8%) | 59 (76.6%) |
| 65 to 74 Years | 30 (90.9%) | 18 (54.5%) |
| 75 Years and over | 14 (87.5%) | 5 (31.2%) |
| Total | 242 (44.2%) | 341 (62.3%) |
Disability Status by Sex by Age in Shippenville borough
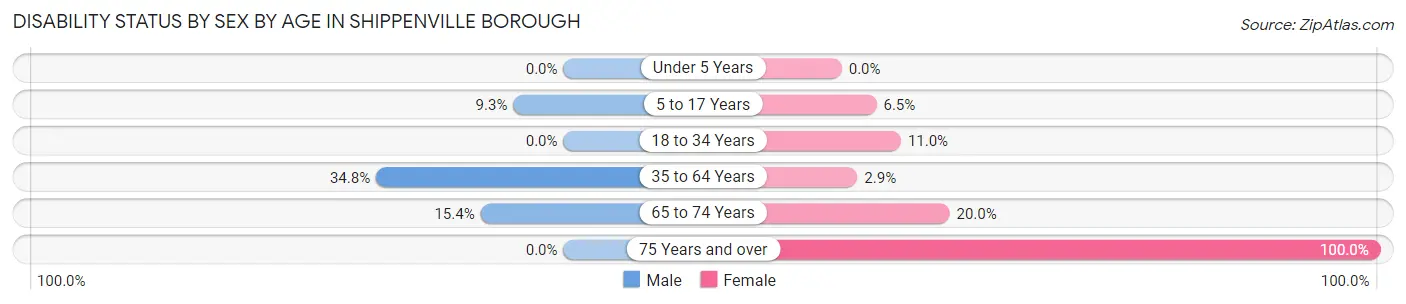
| Age Bracket | Male | Female |
| Under 5 Years | 0 (0.0%) | 0 (0.0%) |
| 5 to 17 Years | 4 (9.3%) | 4 (6.5%) |
| 18 to 34 Years | 0 (0.0%) | 9 (11.0%) |
| 35 to 64 Years | 40 (34.8%) | 2 (2.9%) |
| 65 to 74 Years | 2 (15.4%) | 4 (20.0%) |
| 75 Years and over | 0 (0.0%) | 11 (100.0%) |
Disability Class by Sex by Age in Shippenville borough
Disability Class: Hearing Difficulty
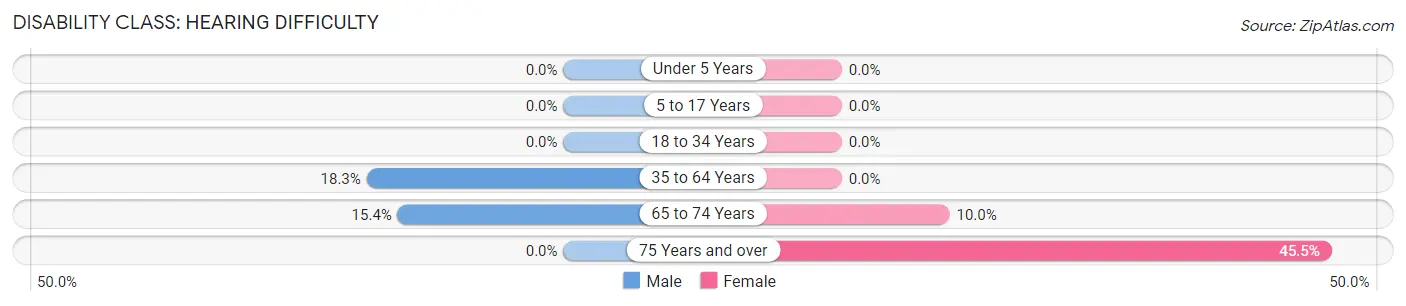
| Age Bracket | Male | Female |
| Under 5 Years | 0 (0.0%) | 0 (0.0%) |
| 5 to 17 Years | 0 (0.0%) | 0 (0.0%) |
| 18 to 34 Years | 0 (0.0%) | 0 (0.0%) |
| 35 to 64 Years | 21 (18.3%) | 0 (0.0%) |
| 65 to 74 Years | 2 (15.4%) | 2 (10.0%) |
| 75 Years and over | 0 (0.0%) | 5 (45.5%) |
Disability Class: Vision Difficulty
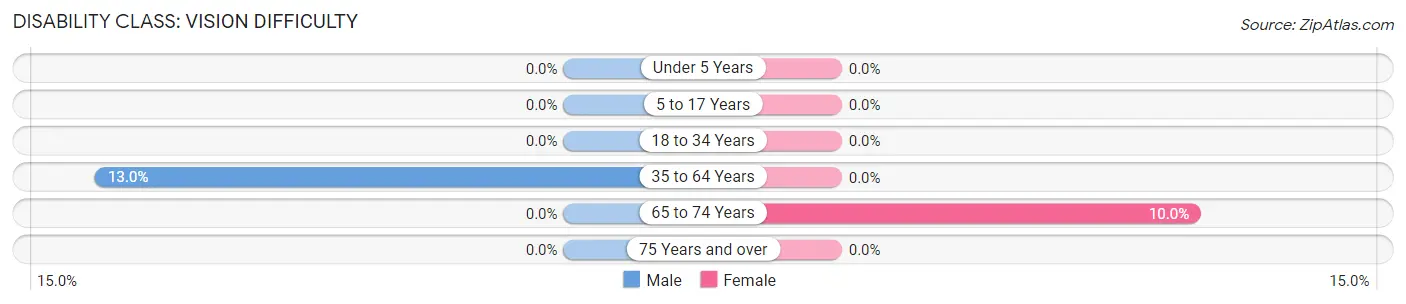
| Age Bracket | Male | Female |
| Under 5 Years | 0 (0.0%) | 0 (0.0%) |
| 5 to 17 Years | 0 (0.0%) | 0 (0.0%) |
| 18 to 34 Years | 0 (0.0%) | 0 (0.0%) |
| 35 to 64 Years | 15 (13.0%) | 0 (0.0%) |
| 65 to 74 Years | 0 (0.0%) | 2 (10.0%) |
| 75 Years and over | 0 (0.0%) | 0 (0.0%) |
Disability Class: Cognitive Difficulty
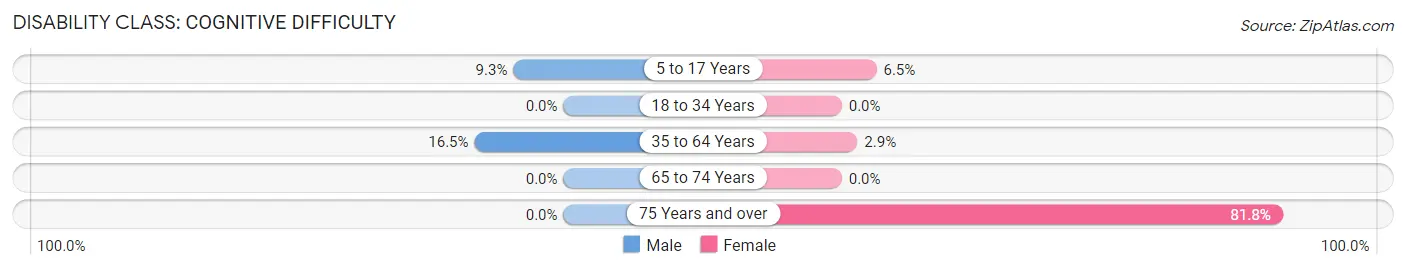
| Age Bracket | Male | Female |
| 5 to 17 Years | 4 (9.3%) | 4 (6.5%) |
| 18 to 34 Years | 0 (0.0%) | 0 (0.0%) |
| 35 to 64 Years | 19 (16.5%) | 2 (2.9%) |
| 65 to 74 Years | 0 (0.0%) | 0 (0.0%) |
| 75 Years and over | 0 (0.0%) | 9 (81.8%) |
Disability Class: Ambulatory Difficulty
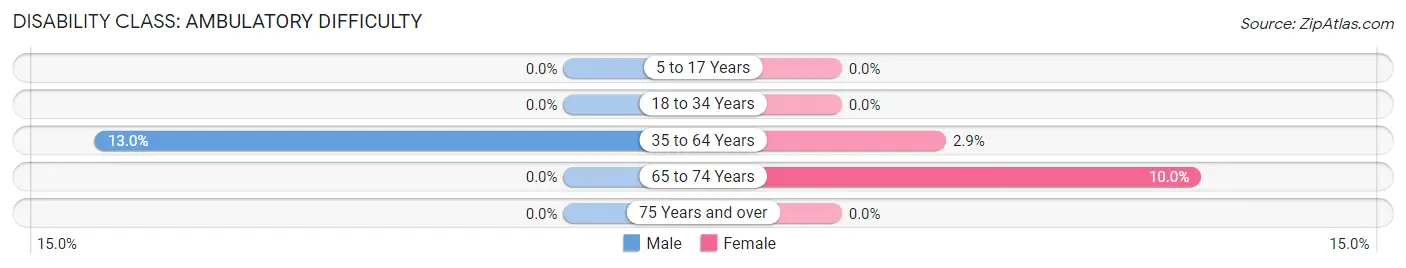
| Age Bracket | Male | Female |
| 5 to 17 Years | 0 (0.0%) | 0 (0.0%) |
| 18 to 34 Years | 0 (0.0%) | 0 (0.0%) |
| 35 to 64 Years | 15 (13.0%) | 2 (2.9%) |
| 65 to 74 Years | 0 (0.0%) | 2 (10.0%) |
| 75 Years and over | 0 (0.0%) | 0 (0.0%) |
Disability Class: Self-Care Difficulty
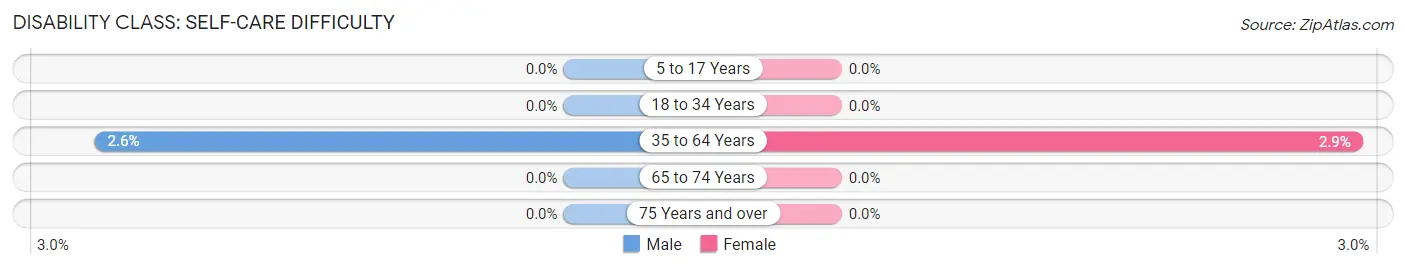
| Age Bracket | Male | Female |
| 5 to 17 Years | 0 (0.0%) | 0 (0.0%) |
| 18 to 34 Years | 0 (0.0%) | 0 (0.0%) |
| 35 to 64 Years | 3 (2.6%) | 2 (2.9%) |
| 65 to 74 Years | 0 (0.0%) | 0 (0.0%) |
| 75 Years and over | 0 (0.0%) | 0 (0.0%) |
Technology Access in Shippenville borough
Computing Device Access in Shippenville borough
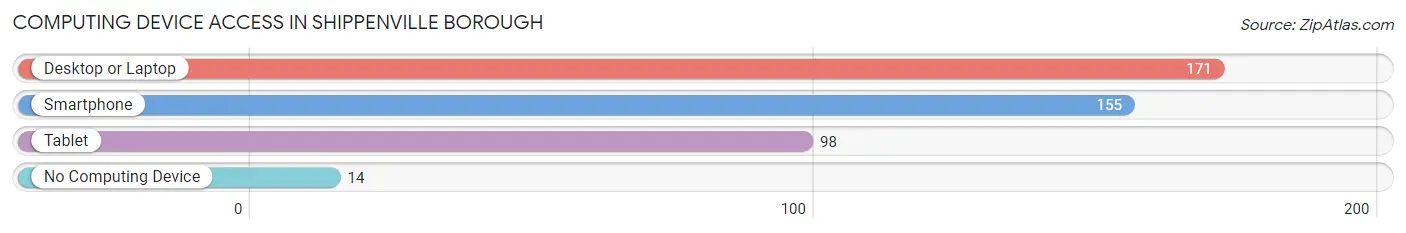
| Device Type | # Households | % Households |
| Desktop or Laptop | 171 | 80.3% |
| Smartphone | 155 | 72.8% |
| Tablet | 98 | 46.0% |
| No Computing Device | 14 | 6.6% |
| Total | 213 | 100.0% |
Internet Access in Shippenville borough
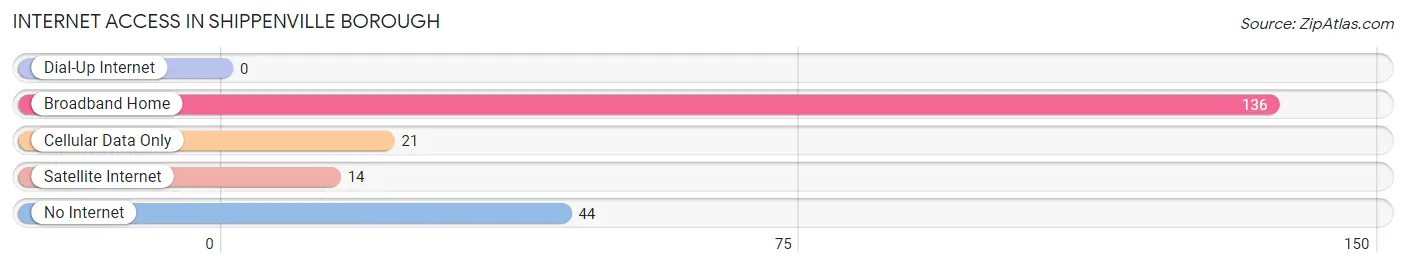
| Internet Type | # Households | % Households |
| Dial-Up Internet | 0 | 0.0% |
| Broadband Home | 136 | 63.8% |
| Cellular Data Only | 21 | 9.9% |
| Satellite Internet | 14 | 6.6% |
| No Internet | 44 | 20.7% |
| Total | 213 | 100.0% |
Shippenville borough Summary
Shippenville Borough is a small borough located in Clarion County, Pennsylvania. It is situated in the northwestern part of the state, approximately 70 miles northeast of Pittsburgh. The borough is bordered by the Clarion River to the north, and is home to a population of approximately 1,000 people.
History
Shippenville Borough was founded in 1836 by William Shippen, a local landowner. The borough was named after him, and was incorporated in 1867. The town was originally a small farming community, and the main industry was lumber. In the late 19th century, the lumber industry began to decline, and the town shifted its focus to manufacturing. The first factory in the borough was the Shippenville Manufacturing Company, which opened in 1891. The company produced a variety of products, including furniture, clothing, and tools.
In the early 20th century, the borough experienced a period of growth and development. The population increased from 1,000 in 1900 to 1,500 in 1920. During this time, several new businesses opened, including a bank, a hotel, and a movie theater. The borough also saw the construction of a new school and a library.
Geography
Shippenville Borough is located in the northwestern part of Clarion County, Pennsylvania. It is situated along the Clarion River, which forms the northern border of the borough. The borough is located approximately 70 miles northeast of Pittsburgh. The terrain is mostly flat, with some rolling hills in the southern part of the borough. The climate is humid continental, with cold winters and warm summers.
Economy
The economy of Shippenville Borough is largely based on manufacturing. The largest employer in the borough is the Shippenville Manufacturing Company, which produces a variety of products, including furniture, clothing, and tools. Other major employers include a bank, a hotel, and a movie theater. The borough also has several small businesses, including restaurants, retail stores, and service providers.
Demographics
As of the 2010 census, the population of Shippenville Borough was 1,000. The racial makeup of the borough was 97.2% White, 0.7% African American, 0.3% Native American, 0.2% Asian, and 1.6% from other races. The median household income was $37,500, and the median family income was $45,000. The per capita income was $19,000. Approximately 15.3% of the population was below the poverty line.
Common Questions
What is Per Capita Income in Shippenville borough?
Per Capita income in Shippenville borough is $24,109.
What is the Median Family Income in Shippenville borough?
Median Family Income in Shippenville borough is $58,250.
What is the Median Household income in Shippenville borough?
Median Household Income in Shippenville borough is $45,865.
What is Income or Wage Gap in Shippenville borough?
Income or Wage Gap in Shippenville borough is 30.0%.
Women in Shippenville borough earn 70.0 cents for every dollar earned by a man.
What is Inequality or Gini Index in Shippenville borough?
Inequality or Gini Index in Shippenville borough is 0.40.
What is the Total Population of Shippenville borough?
Total Population of Shippenville borough is 627.
What is the Total Male Population of Shippenville borough?
Total Male Population of Shippenville borough is 305.
What is the Total Female Population of Shippenville borough?
Total Female Population of Shippenville borough is 322.
What is the Ratio of Males per 100 Females in Shippenville borough?
There are 94.72 Males per 100 Females in Shippenville borough.
What is the Ratio of Females per 100 Males in Shippenville borough?
There are 105.57 Females per 100 Males in Shippenville borough.
What is the Median Population Age in Shippenville borough?
Median Population Age in Shippenville borough is 34.6 Years.
What is the Average Family Size in Shippenville borough
Average Family Size in Shippenville borough is 3.0 People.
What is the Average Household Size in Shippenville borough
Average Household Size in Shippenville borough is 2.5 People.
How Large is the Labor Force in Shippenville borough?
There are 282 People in the Labor Forcein in Shippenville borough.
What is the Percentage of People in the Labor Force in Shippenville borough?
57.2% of People are in the Labor Force in Shippenville borough.
What is the Unemployment Rate in Shippenville borough?
Unemployment Rate in Shippenville borough is 5.3%.