Point Marion borough, PA Map & Demographics
Point Marion borough Overview
$22,682
PER CAPITA INCOME
$61,979
AVG FAMILY INCOME
$47,500
AVG HOUSEHOLD INCOME
32.2%
WAGE / INCOME GAP [ % ]
67.8¢/ $1
WAGE / INCOME GAP [ $ ]
$6,653
FAMILY INCOME DEFICIT
0.42
INEQUALITY / GINI INDEX
1,276
TOTAL POPULATION
628
MALE POPULATION
648
FEMALE POPULATION
96.91
MALES / 100 FEMALES
103.18
FEMALES / 100 MALES
36.6
MEDIAN AGE
3.5
AVG FAMILY SIZE
2.7
AVG HOUSEHOLD SIZE
641
LABOR FORCE [ PEOPLE ]
64.8%
PERCENT IN LABOR FORCE
5.8%
UNEMPLOYMENT RATE
Income in Point Marion borough
Income Overview in Point Marion borough
Per Capita Income in Point Marion borough is $22,682, while median incomes of families and households are $61,979 and $47,500 respectively.
| Characteristic | Number | Measure |
| Per Capita Income | 1,276 | $22,682 |
| Median Family Income | 283 | $61,979 |
| Mean Family Income | 283 | $71,977 |
| Median Household Income | 456 | $47,500 |
| Mean Household Income | 456 | $61,247 |
| Income Deficit | 283 | $6,653 |
| Wage / Income Gap (%) | 1,276 | 32.17% |
| Wage / Income Gap ($) | 1,276 | 67.83¢ per $1 |
| Gini / Inequality Index | 1,276 | 0.42 |
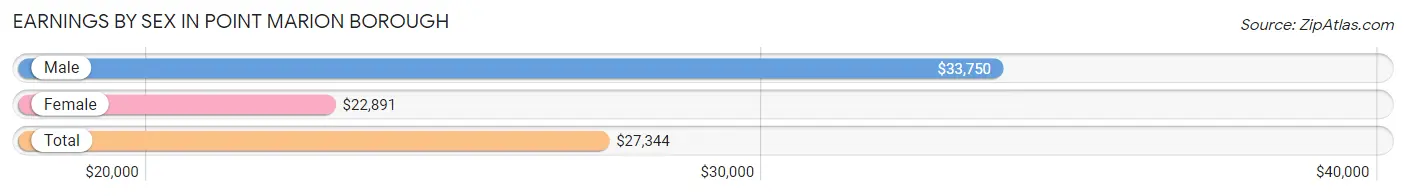
Earnings by Sex in Point Marion borough
Average Earnings in Point Marion borough are $27,344, $33,750 for men and $22,891 for women, a difference of 32.2%.
| Sex | Number | Average Earnings |
| Male | 350 (54.6%) | $33,750 |
| Female | 291 (45.4%) | $22,891 |
| Total | 641 (100.0%) | $27,344 |
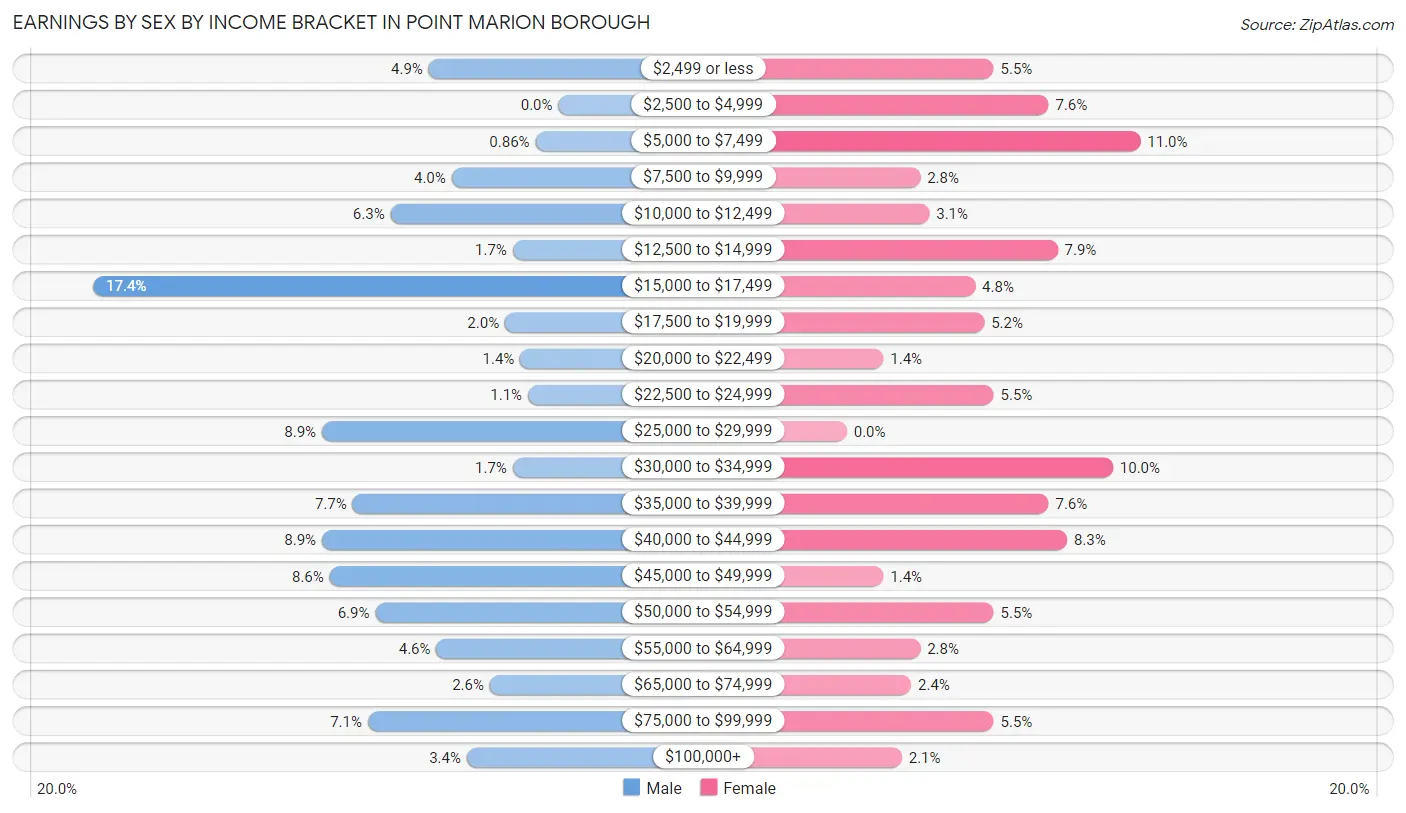
Earnings by Sex by Income Bracket in Point Marion borough
The most common earnings brackets in Point Marion borough are $15,000 to $17,499 for men (61 | 17.4%) and $5,000 to $7,499 for women (32 | 11.0%).
| Income | Male | Female |
| $2,499 or less | 17 (4.9%) | 16 (5.5%) |
| $2,500 to $4,999 | 0 (0.0%) | 22 (7.6%) |
| $5,000 to $7,499 | 3 (0.9%) | 32 (11.0%) |
| $7,500 to $9,999 | 14 (4.0%) | 8 (2.8%) |
| $10,000 to $12,499 | 22 (6.3%) | 9 (3.1%) |
| $12,500 to $14,999 | 6 (1.7%) | 23 (7.9%) |
| $15,000 to $17,499 | 61 (17.4%) | 14 (4.8%) |
| $17,500 to $19,999 | 7 (2.0%) | 15 (5.1%) |
| $20,000 to $22,499 | 5 (1.4%) | 4 (1.4%) |
| $22,500 to $24,999 | 4 (1.1%) | 16 (5.5%) |
| $25,000 to $29,999 | 31 (8.9%) | 0 (0.0%) |
| $30,000 to $34,999 | 6 (1.7%) | 29 (10.0%) |
| $35,000 to $39,999 | 27 (7.7%) | 22 (7.6%) |
| $40,000 to $44,999 | 31 (8.9%) | 24 (8.3%) |
| $45,000 to $49,999 | 30 (8.6%) | 4 (1.4%) |
| $50,000 to $54,999 | 24 (6.9%) | 16 (5.5%) |
| $55,000 to $64,999 | 16 (4.6%) | 8 (2.8%) |
| $65,000 to $74,999 | 9 (2.6%) | 7 (2.4%) |
| $75,000 to $99,999 | 25 (7.1%) | 16 (5.5%) |
| $100,000+ | 12 (3.4%) | 6 (2.1%) |
| Total | 350 (100.0%) | 291 (100.0%) |
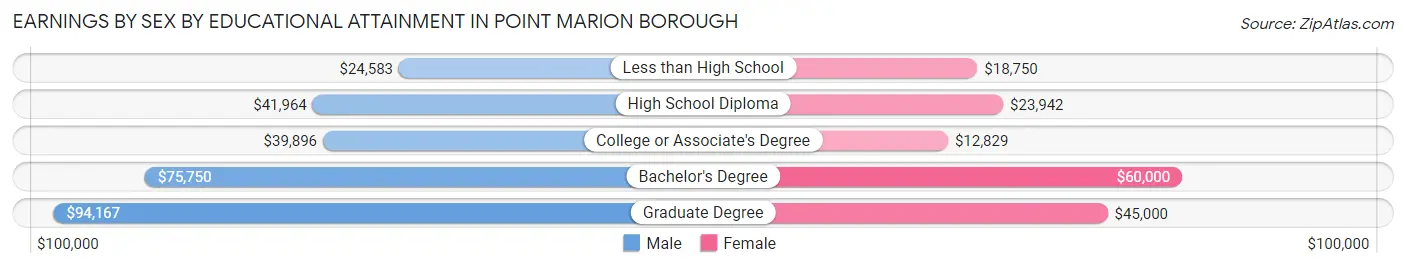
Earnings by Sex by Educational Attainment in Point Marion borough
Average earnings in Point Marion borough are $41,389 for men and $23,125 for women, a difference of 44.1%. Men with an educational attainment of graduate degree enjoy the highest average annual earnings of $94,167, while those with less than high school education earn the least with $24,583. Women with an educational attainment of bachelor's degree earn the most with the average annual earnings of $60,000, while those with college or associate's degree education have the smallest earnings of $12,829.
| Educational Attainment | Male Income | Female Income |
| Less than High School | $24,583 | $18,750 |
| High School Diploma | $41,964 | $23,942 |
| College or Associate's Degree | $39,896 | $12,829 |
| Bachelor's Degree | $75,750 | $60,000 |
| Graduate Degree | $94,167 | $45,000 |
| Total | $41,389 | $23,125 |
Family Income in Point Marion borough
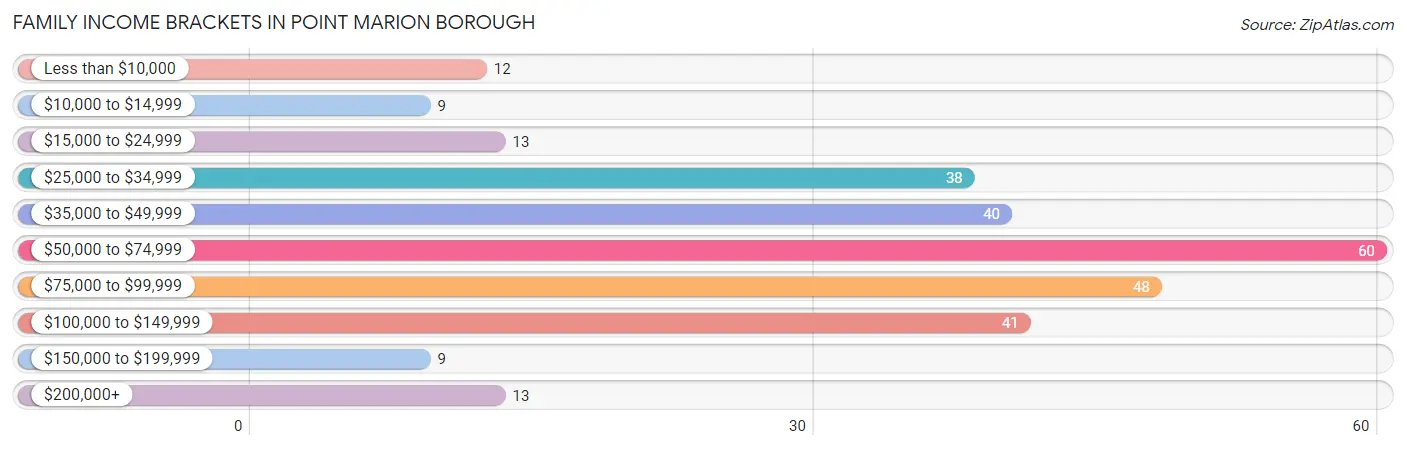
Family Income Brackets in Point Marion borough
According to the Point Marion borough family income data, there are 60 families falling into the $50,000 to $74,999 income range, which is the most common income bracket and makes up 21.2% of all families. Conversely, the $10,000 to $14,999 income bracket is the least frequent group with only 9 families (3.2%) belonging to this category.
| Income Bracket | # Families | % Families |
| Less than $10,000 | 12 | 4.2% |
| $10,000 to $14,999 | 9 | 3.2% |
| $15,000 to $24,999 | 13 | 4.6% |
| $25,000 to $34,999 | 38 | 13.4% |
| $35,000 to $49,999 | 40 | 14.1% |
| $50,000 to $74,999 | 60 | 21.2% |
| $75,000 to $99,999 | 48 | 17.0% |
| $100,000 to $149,999 | 41 | 14.5% |
| $150,000 to $199,999 | 9 | 3.2% |
| $200,000+ | 13 | 4.6% |
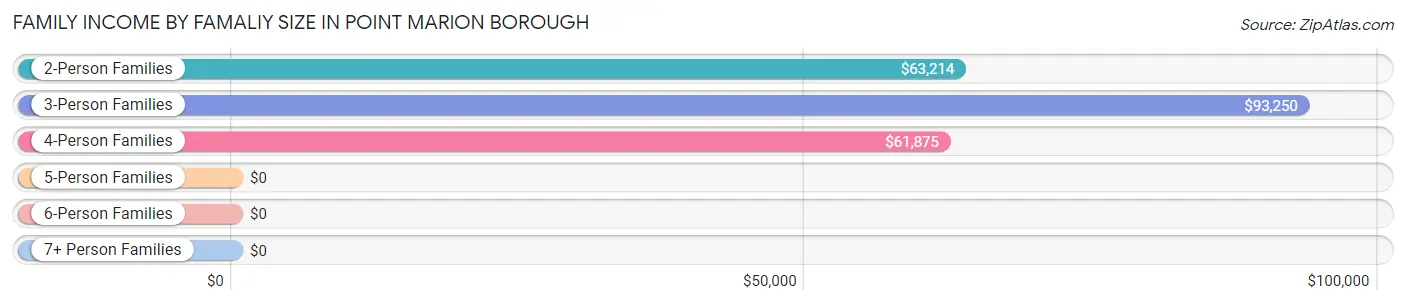
Family Income by Famaliy Size in Point Marion borough
3-person families (53 | 18.7%) account for the highest median family income in Point Marion borough with $93,250 per family, while 2-person families (116 | 41.0%) have the highest median income of $31,607 per family member.
| Income Bracket | # Families | Median Income |
| 2-Person Families | 116 (41.0%) | $63,214 |
| 3-Person Families | 53 (18.7%) | $93,250 |
| 4-Person Families | 44 (15.5%) | $61,875 |
| 5-Person Families | 56 (19.8%) | $0 |
| 6-Person Families | 14 (5.0%) | $0 |
| 7+ Person Families | 0 (0.0%) | $0 |
| Total | 283 (100.0%) | $61,979 |
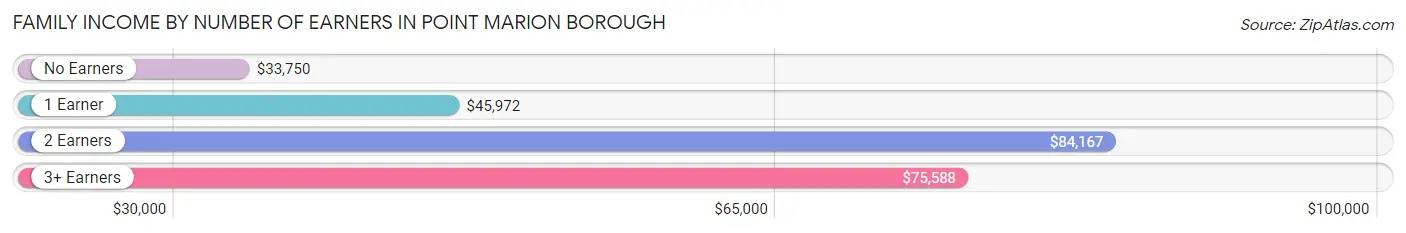
Family Income by Number of Earners in Point Marion borough
The median family income in Point Marion borough is $61,979, with families comprising 2 earners (120) having the highest median family income of $84,167, while families with no earners (34) have the lowest median family income of $33,750, accounting for 42.4% and 12.0% of families, respectively.
| Number of Earners | # Families | Median Income |
| No Earners | 34 (12.0%) | $33,750 |
| 1 Earner | 93 (32.9%) | $45,972 |
| 2 Earners | 120 (42.4%) | $84,167 |
| 3+ Earners | 36 (12.7%) | $75,588 |
| Total | 283 (100.0%) | $61,979 |
Household Income in Point Marion borough
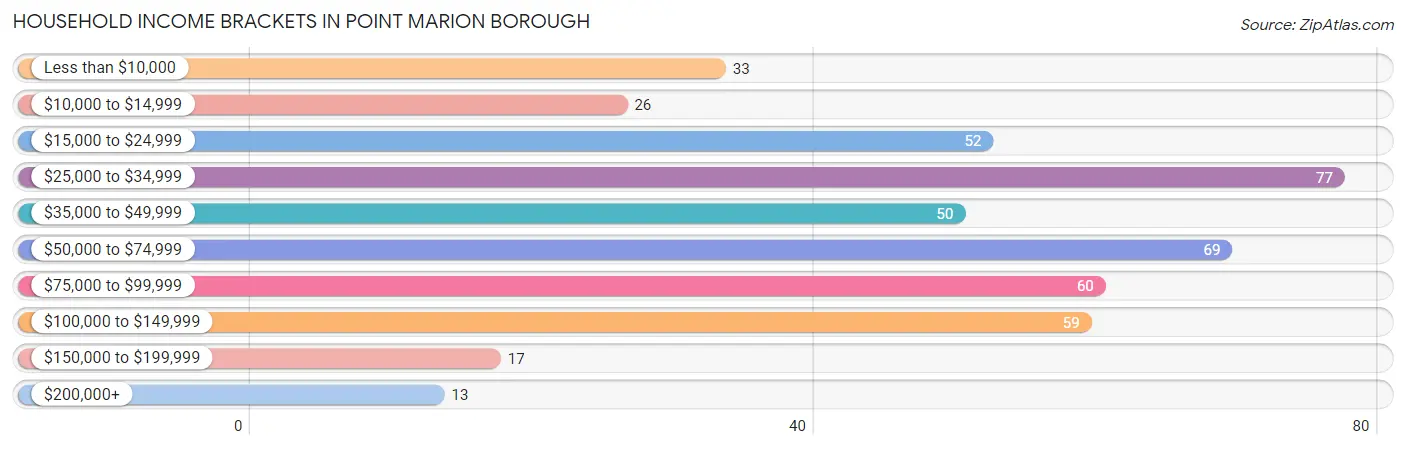
Household Income Brackets in Point Marion borough
With 77 households falling in the category, the $25,000 to $34,999 income range is the most frequent in Point Marion borough, accounting for 16.9% of all households. In contrast, only 13 households (2.9%) fall into the $200,000+ income bracket, making it the least populous group.
| Income Bracket | # Households | % Households |
| Less than $10,000 | 33 | 7.2% |
| $10,000 to $14,999 | 26 | 5.7% |
| $15,000 to $24,999 | 52 | 11.4% |
| $25,000 to $34,999 | 77 | 16.9% |
| $35,000 to $49,999 | 50 | 11.0% |
| $50,000 to $74,999 | 69 | 15.1% |
| $75,000 to $99,999 | 60 | 13.2% |
| $100,000 to $149,999 | 59 | 12.9% |
| $150,000 to $199,999 | 17 | 3.7% |
| $200,000+ | 13 | 2.9% |
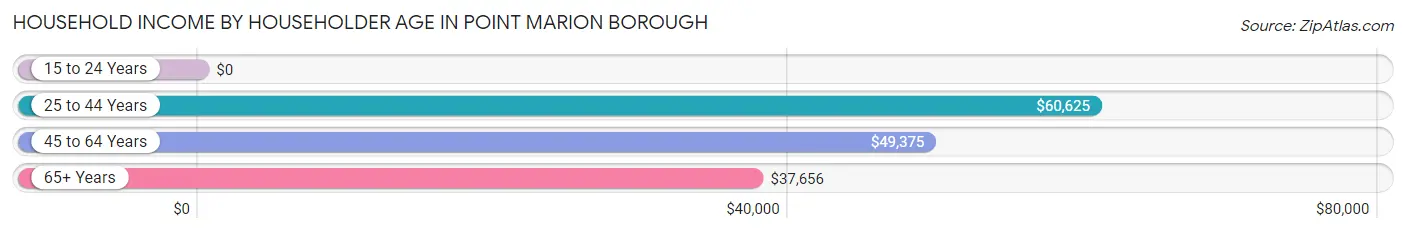
Household Income by Householder Age in Point Marion borough
The median household income in Point Marion borough is $47,500, with the highest median household income of $60,625 found in the 25 to 44 years age bracket for the primary householder. A total of 202 households (44.3%) fall into this category. Meanwhile, the 15 to 24 years age bracket for the primary householder has the lowest median household income of $0, with 4 households (0.9%) in this group.
| Income Bracket | # Households | Median Income |
| 15 to 24 Years | 4 (0.9%) | $0 |
| 25 to 44 Years | 202 (44.3%) | $60,625 |
| 45 to 64 Years | 121 (26.5%) | $49,375 |
| 65+ Years | 129 (28.3%) | $37,656 |
| Total | 456 (100.0%) | $47,500 |
Poverty in Point Marion borough
Income Below Poverty by Sex and Age in Point Marion borough
With 26.4% poverty level for males and 25.7% for females among the residents of Point Marion borough, under 5 year old males and under 5 year old females are the most vulnerable to poverty, with 38 males (66.7%) and 16 females (66.7%) in their respective age groups living below the poverty level.
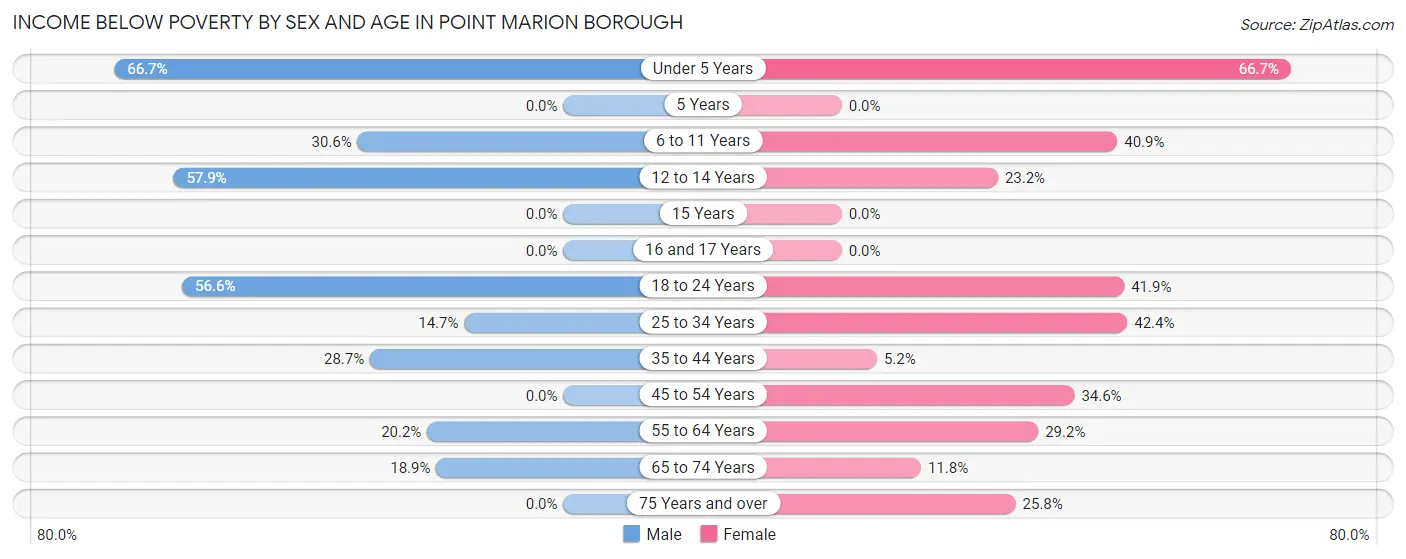
| Age Bracket | Male | Female |
| Under 5 Years | 38 (66.7%) | 16 (66.7%) |
| 5 Years | 0 (0.0%) | 0 (0.0%) |
| 6 to 11 Years | 11 (30.6%) | 18 (40.9%) |
| 12 to 14 Years | 11 (57.9%) | 16 (23.2%) |
| 15 Years | 0 (0.0%) | 0 (0.0%) |
| 16 and 17 Years | 0 (0.0%) | 0 (0.0%) |
| 18 to 24 Years | 30 (56.6%) | 13 (41.9%) |
| 25 to 34 Years | 15 (14.7%) | 39 (42.4%) |
| 35 to 44 Years | 31 (28.7%) | 7 (5.2%) |
| 45 to 54 Years | 0 (0.0%) | 19 (34.5%) |
| 55 to 64 Years | 18 (20.2%) | 14 (29.2%) |
| 65 to 74 Years | 10 (18.9%) | 4 (11.8%) |
| 75 Years and over | 0 (0.0%) | 16 (25.8%) |
| Total | 164 (26.4%) | 162 (25.7%) |
Income Above Poverty by Sex and Age in Point Marion borough
According to the poverty statistics in Point Marion borough, males aged 5 years and females aged 15 years are the age groups that are most secure financially, with 100.0% of males and 100.0% of females in these age groups living above the poverty line.
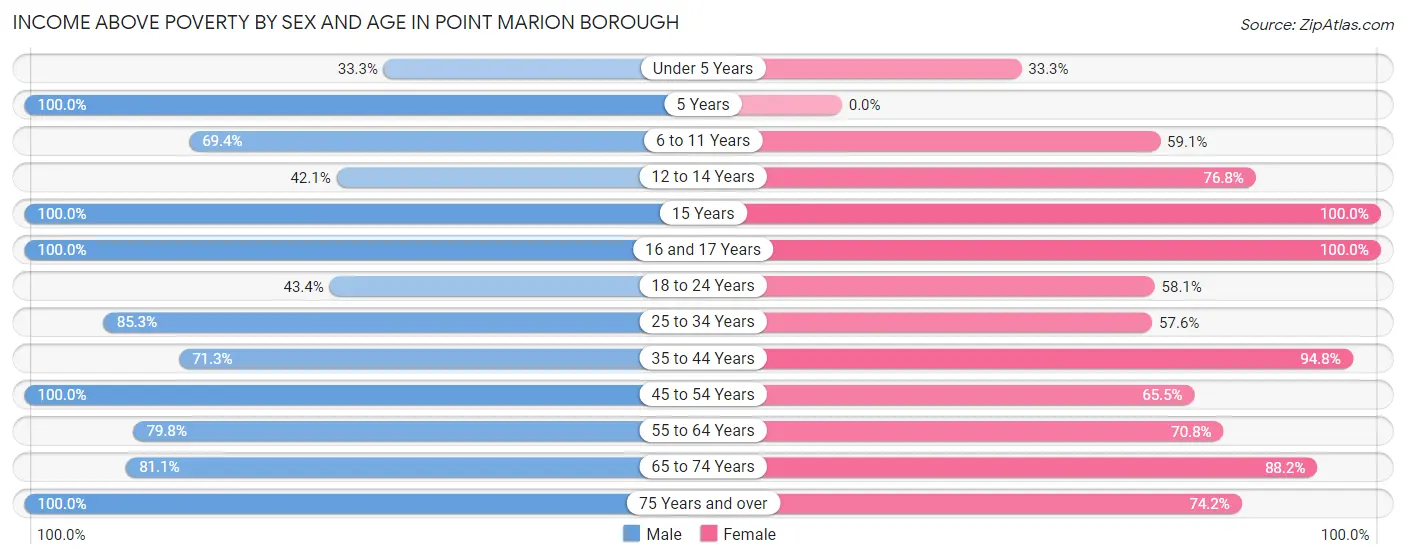
| Age Bracket | Male | Female |
| Under 5 Years | 19 (33.3%) | 8 (33.3%) |
| 5 Years | 5 (100.0%) | 0 (0.0%) |
| 6 to 11 Years | 25 (69.4%) | 26 (59.1%) |
| 12 to 14 Years | 8 (42.1%) | 53 (76.8%) |
| 15 Years | 4 (100.0%) | 23 (100.0%) |
| 16 and 17 Years | 17 (100.0%) | 14 (100.0%) |
| 18 to 24 Years | 23 (43.4%) | 18 (58.1%) |
| 25 to 34 Years | 87 (85.3%) | 53 (57.6%) |
| 35 to 44 Years | 77 (71.3%) | 127 (94.8%) |
| 45 to 54 Years | 62 (100.0%) | 36 (65.4%) |
| 55 to 64 Years | 71 (79.8%) | 34 (70.8%) |
| 65 to 74 Years | 43 (81.1%) | 30 (88.2%) |
| 75 Years and over | 16 (100.0%) | 46 (74.2%) |
| Total | 457 (73.6%) | 468 (74.3%) |
Income Below Poverty Among Married-Couple Families in Point Marion borough
The poverty statistics for married-couple families in Point Marion borough show that 15.1% or 35 of the total 231 families live below the poverty line. Families with 3 or 4 children have the highest poverty rate of 55.6%, comprising of 25 families. On the other hand, families with 1 or 2 children have the lowest poverty rate of 4.9%, which includes 4 families.
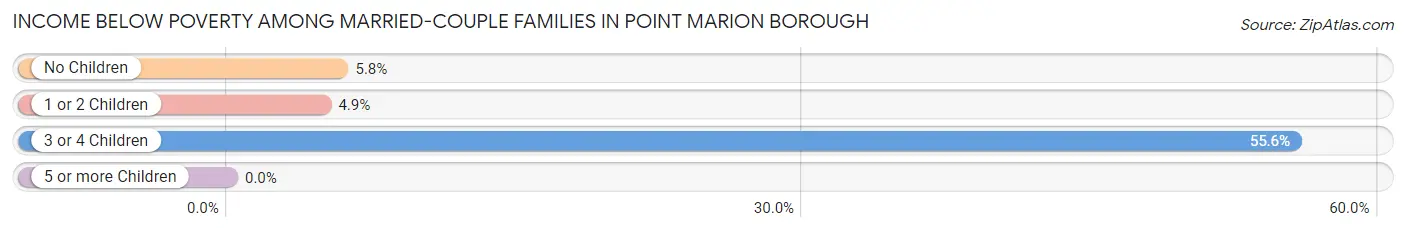
| Children | Above Poverty | Below Poverty |
| No Children | 98 (94.2%) | 6 (5.8%) |
| 1 or 2 Children | 78 (95.1%) | 4 (4.9%) |
| 3 or 4 Children | 20 (44.4%) | 25 (55.6%) |
| 5 or more Children | 0 (0.0%) | 0 (0.0%) |
| Total | 196 (84.9%) | 35 (15.1%) |
Income Below Poverty Among Single-Parent Households in Point Marion borough
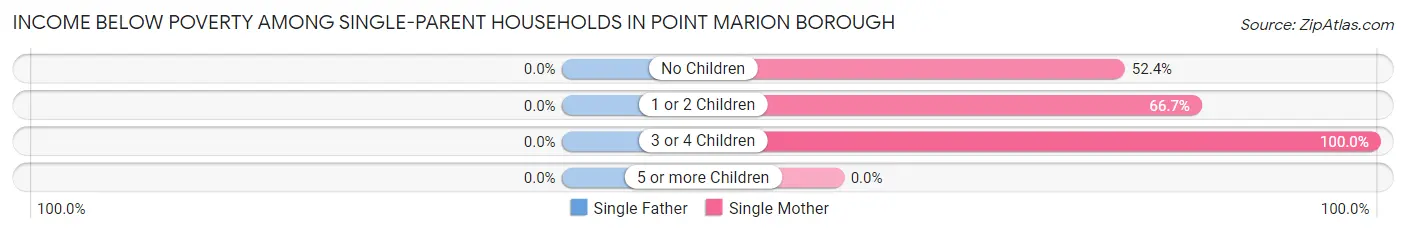
| Children | Single Father | Single Mother |
| No Children | 0 (0.0%) | 11 (52.4%) |
| 1 or 2 Children | 0 (0.0%) | 8 (66.7%) |
| 3 or 4 Children | 0 (0.0%) | 4 (100.0%) |
| 5 or more Children | 0 (0.0%) | 0 (0.0%) |
| Total | 0 (0.0%) | 23 (62.2%) |
Income Below Poverty Among Married-Couple vs Single-Parent Households in Point Marion borough
The poverty data for Point Marion borough shows that 35 of the married-couple family households (15.1%) and 23 of the single-parent households (44.2%) are living below the poverty level. Within the married-couple family households, those with 3 or 4 children have the highest poverty rate, with 25 households (55.6%) falling below the poverty line. Among the single-parent households, those with no children have the highest poverty rate, with 11 household (50.0%) living below poverty.
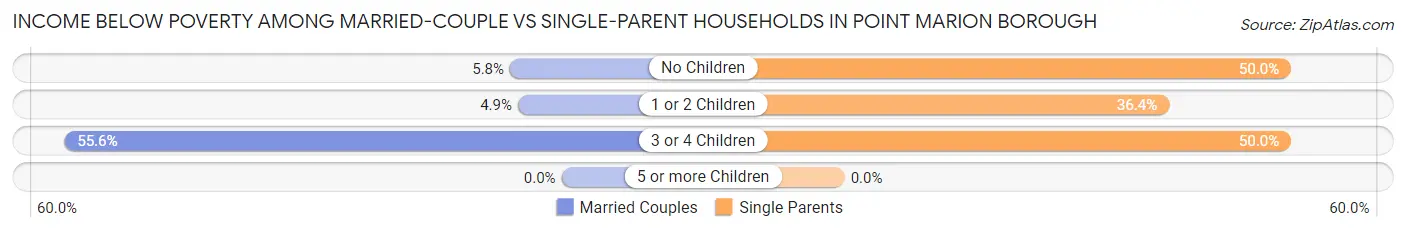
| Children | Married-Couple Families | Single-Parent Households |
| No Children | 6 (5.8%) | 11 (50.0%) |
| 1 or 2 Children | 4 (4.9%) | 8 (36.4%) |
| 3 or 4 Children | 25 (55.6%) | 4 (50.0%) |
| 5 or more Children | 0 (0.0%) | 0 (0.0%) |
| Total | 35 (15.1%) | 23 (44.2%) |
Race in Point Marion borough
The most populous races in Point Marion borough are White / Caucasian (1,239 | 97.1%), Hispanic or Latino (32 | 2.5%), and Black / African American (19 | 1.5%).
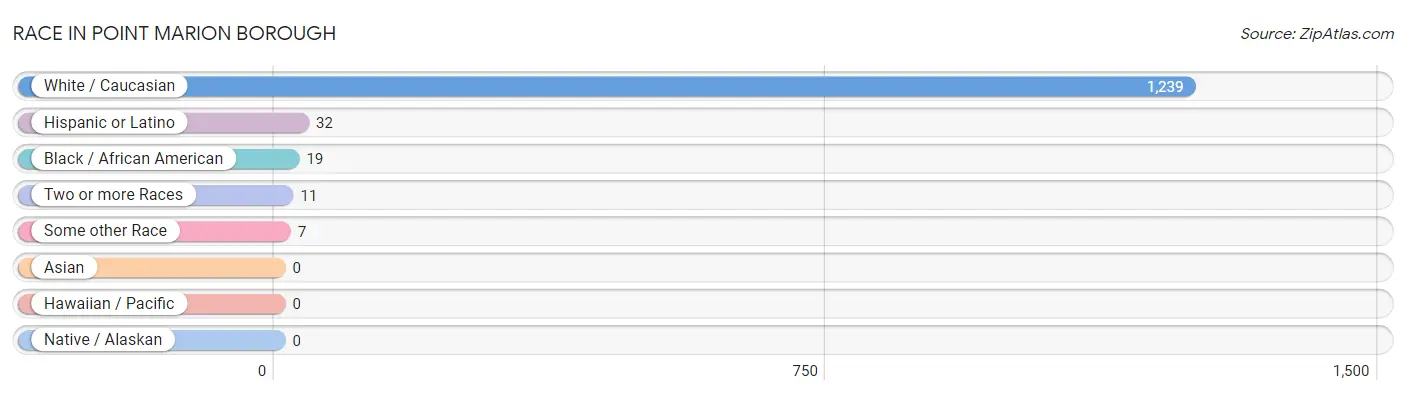
| Race | # Population | % Population |
| Asian | 0 | 0.0% |
| Black / African American | 19 | 1.5% |
| Hawaiian / Pacific | 0 | 0.0% |
| Hispanic or Latino | 32 | 2.5% |
| Native / Alaskan | 0 | 0.0% |
| White / Caucasian | 1,239 | 97.1% |
| Two or more Races | 11 | 0.9% |
| Some other Race | 7 | 0.5% |
| Total | 1,276 | 100.0% |
Ancestry in Point Marion borough
The most populous ancestries reported in Point Marion borough are Irish (331 | 25.9%), German (252 | 19.8%), English (203 | 15.9%), Italian (150 | 11.8%), and Polish (93 | 7.3%), together accounting for 80.6% of all Point Marion borough residents.
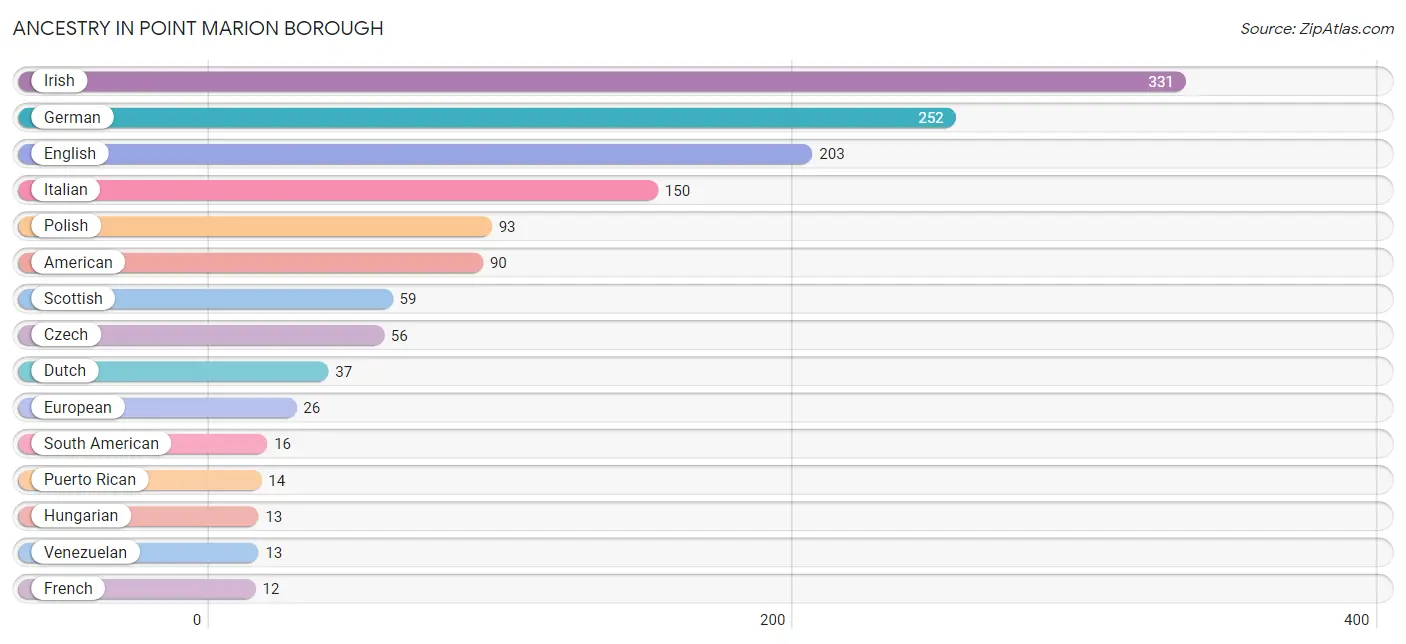
| Ancestry | # Population | % Population |
| American | 90 | 7.0% |
| Belgian | 10 | 0.8% |
| Cherokee | 1 | 0.1% |
| Colombian | 3 | 0.2% |
| Czech | 56 | 4.4% |
| Czechoslovakian | 7 | 0.5% |
| Dutch | 37 | 2.9% |
| Eastern European | 10 | 0.8% |
| English | 203 | 15.9% |
| European | 26 | 2.0% |
| French | 12 | 0.9% |
| French Canadian | 2 | 0.2% |
| German | 252 | 19.8% |
| Hungarian | 13 | 1.0% |
| Irish | 331 | 25.9% |
| Italian | 150 | 11.8% |
| Mexican | 2 | 0.2% |
| Polish | 93 | 7.3% |
| Puerto Rican | 14 | 1.1% |
| Scottish | 59 | 4.6% |
| Slavic | 6 | 0.5% |
| Slovak | 10 | 0.8% |
| Slovene | 3 | 0.2% |
| South American | 16 | 1.3% |
| Swedish | 4 | 0.3% |
| Swiss | 4 | 0.3% |
| Ukrainian | 4 | 0.3% |
| Venezuelan | 13 | 1.0% | View All 28 Rows |
Immigrants in Point Marion borough

| Immigration Origin | # Population | % Population | View All 0 Rows |
Sex and Age in Point Marion borough
Sex and Age in Point Marion borough
The most populous age groups in Point Marion borough are 40 to 44 Years (76 | 12.1%) for men and 35 to 39 Years (90 | 13.9%) for women.
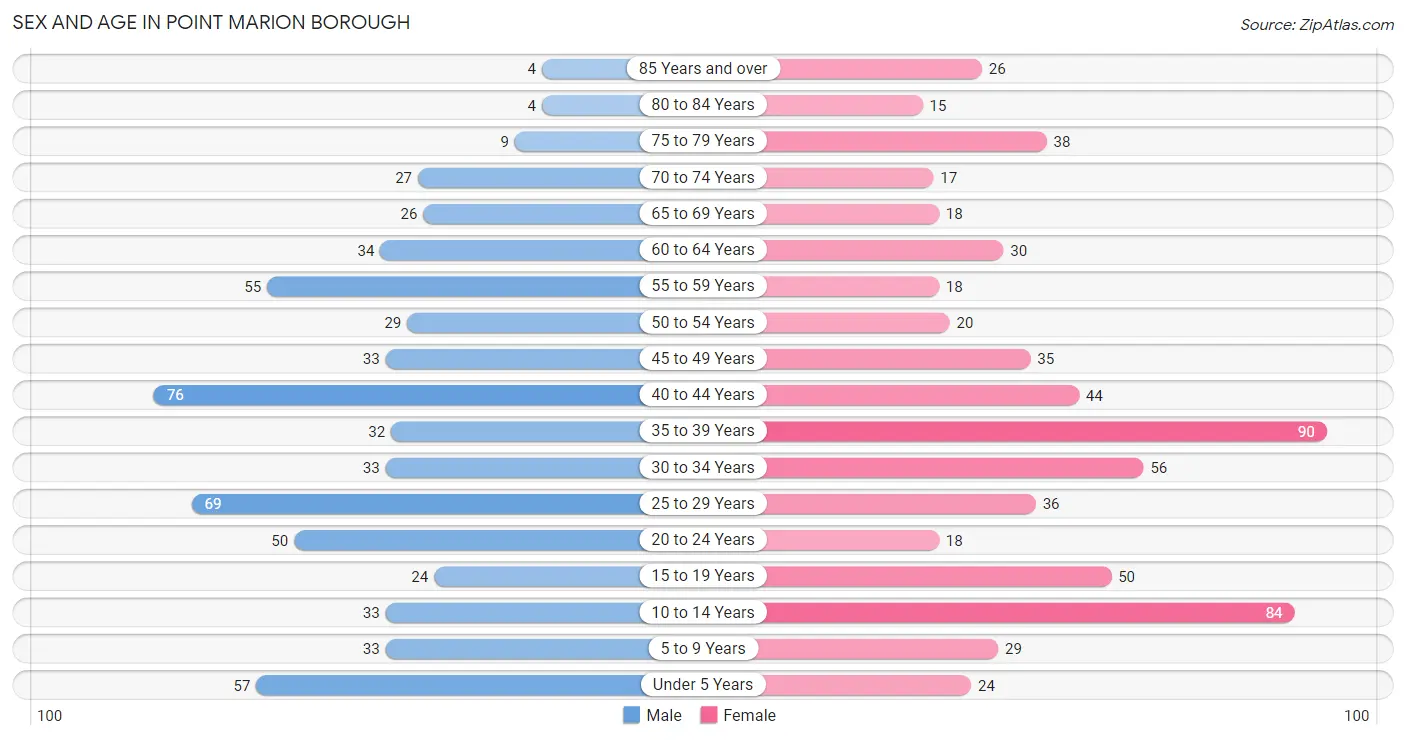
| Age Bracket | Male | Female |
| Under 5 Years | 57 (9.1%) | 24 (3.7%) |
| 5 to 9 Years | 33 (5.2%) | 29 (4.5%) |
| 10 to 14 Years | 33 (5.2%) | 84 (13.0%) |
| 15 to 19 Years | 24 (3.8%) | 50 (7.7%) |
| 20 to 24 Years | 50 (8.0%) | 18 (2.8%) |
| 25 to 29 Years | 69 (11.0%) | 36 (5.6%) |
| 30 to 34 Years | 33 (5.2%) | 56 (8.6%) |
| 35 to 39 Years | 32 (5.1%) | 90 (13.9%) |
| 40 to 44 Years | 76 (12.1%) | 44 (6.8%) |
| 45 to 49 Years | 33 (5.2%) | 35 (5.4%) |
| 50 to 54 Years | 29 (4.6%) | 20 (3.1%) |
| 55 to 59 Years | 55 (8.8%) | 18 (2.8%) |
| 60 to 64 Years | 34 (5.4%) | 30 (4.6%) |
| 65 to 69 Years | 26 (4.1%) | 18 (2.8%) |
| 70 to 74 Years | 27 (4.3%) | 17 (2.6%) |
| 75 to 79 Years | 9 (1.4%) | 38 (5.9%) |
| 80 to 84 Years | 4 (0.6%) | 15 (2.3%) |
| 85 Years and over | 4 (0.6%) | 26 (4.0%) |
| Total | 628 (100.0%) | 648 (100.0%) |
Families and Households in Point Marion borough
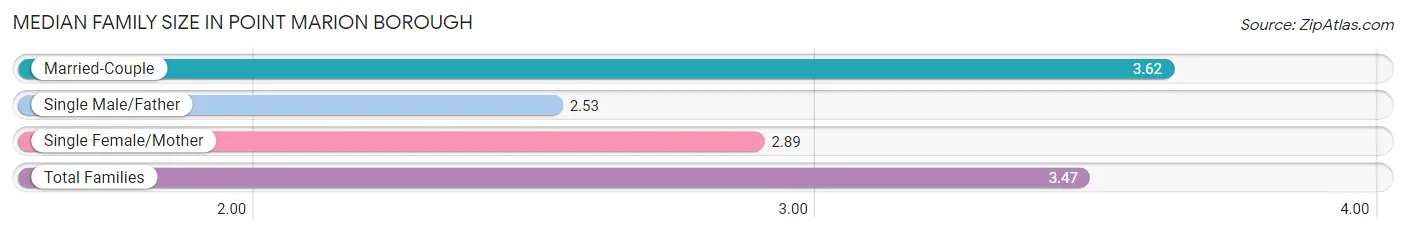
Median Family Size in Point Marion borough
The median family size in Point Marion borough is 3.47 persons per family, with married-couple families (231 | 81.6%) accounting for the largest median family size of 3.62 persons per family. On the other hand, single male/father families (15 | 5.3%) represent the smallest median family size with 2.53 persons per family.
| Family Type | # Families | Family Size |
| Married-Couple | 231 (81.6%) | 3.62 |
| Single Male/Father | 15 (5.3%) | 2.53 |
| Single Female/Mother | 37 (13.1%) | 2.89 |
| Total Families | 283 (100.0%) | 3.47 |
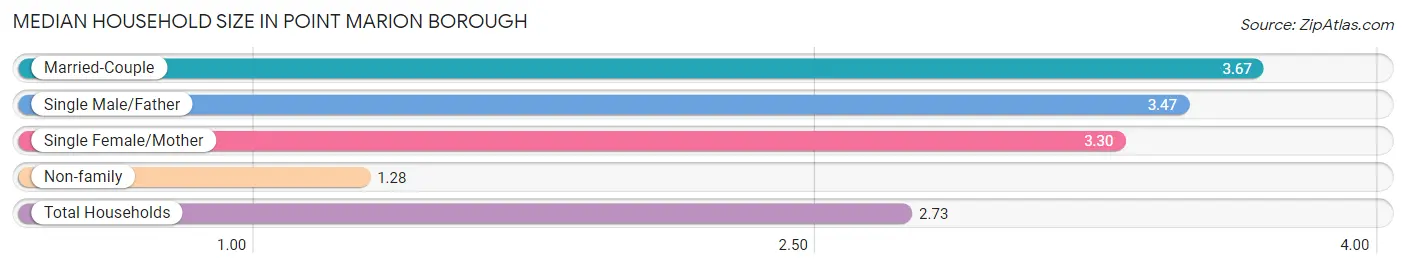
Median Household Size in Point Marion borough
The median household size in Point Marion borough is 2.73 persons per household, with married-couple households (231 | 50.7%) accounting for the largest median household size of 3.67 persons per household. non-family households (173 | 37.9%) represent the smallest median household size with 1.28 persons per household.
| Household Type | # Households | Household Size |
| Married-Couple | 231 (50.7%) | 3.67 |
| Single Male/Father | 15 (3.3%) | 3.47 |
| Single Female/Mother | 37 (8.1%) | 3.30 |
| Non-family | 173 (37.9%) | 1.28 |
| Total Households | 456 (100.0%) | 2.73 |
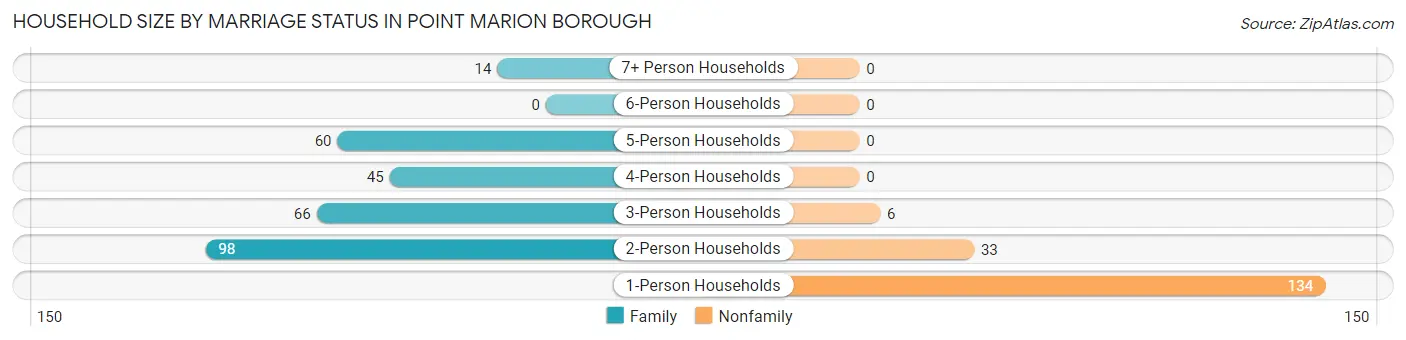
Household Size by Marriage Status in Point Marion borough
Out of a total of 456 households in Point Marion borough, 283 (62.1%) are family households, while 173 (37.9%) are nonfamily households. The most numerous type of family households are 2-person households, comprising 98, and the most common type of nonfamily households are 1-person households, comprising 134.
| Household Size | Family Households | Nonfamily Households |
| 1-Person Households | - | 134 (29.4%) |
| 2-Person Households | 98 (21.5%) | 33 (7.2%) |
| 3-Person Households | 66 (14.5%) | 6 (1.3%) |
| 4-Person Households | 45 (9.9%) | 0 (0.0%) |
| 5-Person Households | 60 (13.2%) | 0 (0.0%) |
| 6-Person Households | 0 (0.0%) | 0 (0.0%) |
| 7+ Person Households | 14 (3.1%) | 0 (0.0%) |
| Total | 283 (62.1%) | 173 (37.9%) |
Female Fertility in Point Marion borough
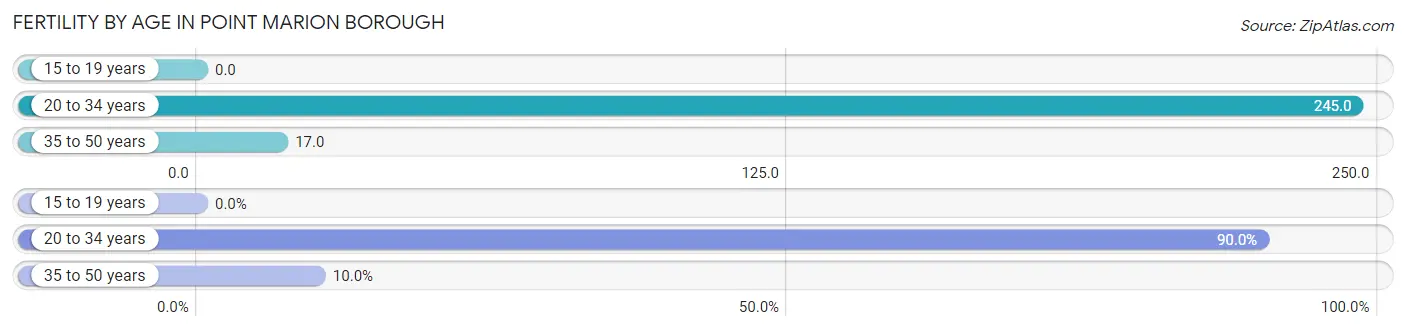
Fertility by Age in Point Marion borough
Average fertility rate in Point Marion borough is 90.0 births per 1,000 women. Women in the age bracket of 20 to 34 years have the highest fertility rate with 245.0 births per 1,000 women. Women in the age bracket of 20 to 34 years acount for 90.0% of all women with births.
| Age Bracket | Women with Births | Births / 1,000 Women |
| 15 to 19 years | 0 (0.0%) | 0.0 |
| 20 to 34 years | 27 (90.0%) | 245.0 |
| 35 to 50 years | 3 (10.0%) | 17.0 |
| Total | 30 (100.0%) | 90.0 |
Fertility by Age by Marriage Status in Point Marion borough
66.7% of women with births (30) in Point Marion borough are married. The highest percentage of unmarried women with births falls into 20 to 34 years age bracket with 37.0% of them unmarried at the time of birth, while the lowest percentage of unmarried women with births belong to 35 to 50 years age bracket with 0.0% of them unmarried.
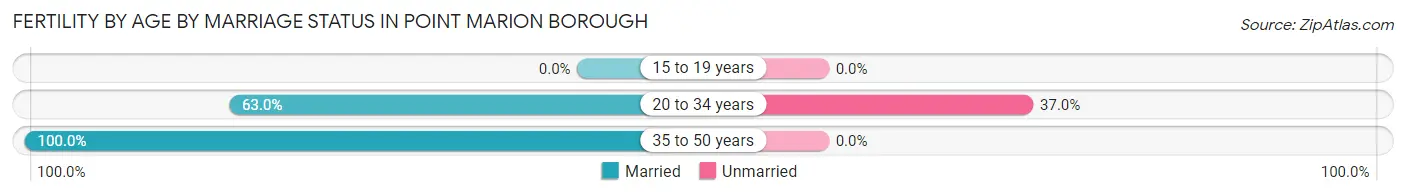
| Age Bracket | Married | Unmarried |
| 15 to 19 years | 0 (0.0%) | 0 (0.0%) |
| 20 to 34 years | 17 (63.0%) | 10 (37.0%) |
| 35 to 50 years | 3 (100.0%) | 0 (0.0%) |
| Total | 20 (66.7%) | 10 (33.3%) |
Fertility by Education in Point Marion borough
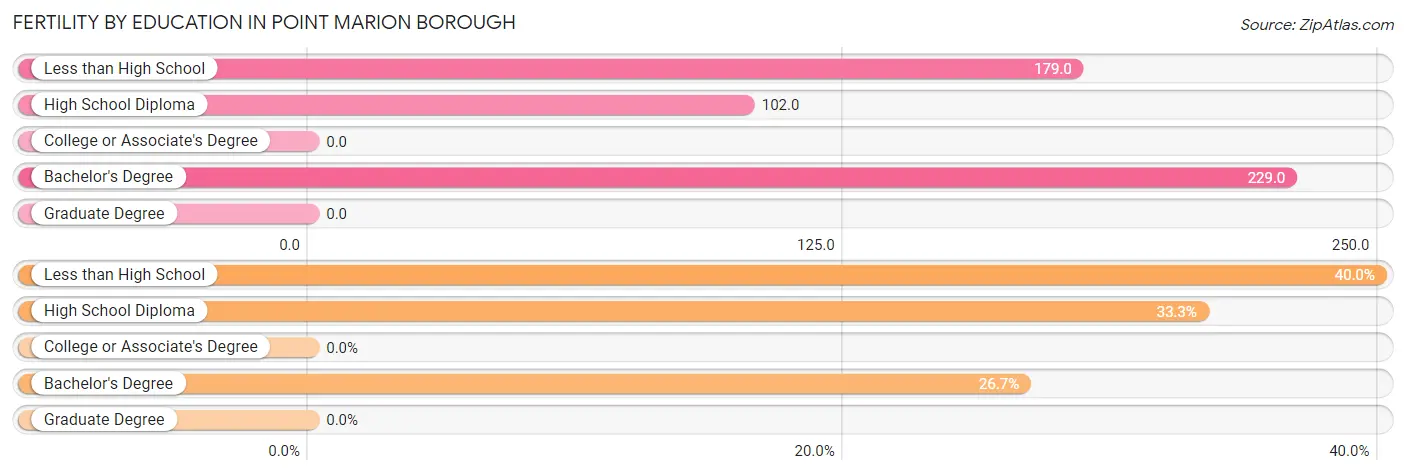
| Educational Attainment | Women with Births | Births / 1,000 Women |
| Less than High School | 12 (40.0%) | 179.0 |
| High School Diploma | 10 (33.3%) | 102.0 |
| College or Associate's Degree | 0 (0.0%) | 0.0 |
| Bachelor's Degree | 8 (26.7%) | 229.0 |
| Graduate Degree | 0 (0.0%) | 0.0 |
| Total | 30 (100.0%) | 90.0 |
Fertility by Education by Marriage Status in Point Marion borough
33.3% of women with births in Point Marion borough are unmarried. Women with the educational attainment of less than high school are most likely to be married with 100.0% of them married at childbirth, while women with the educational attainment of bachelor's degree are least likely to be married with 62.5% of them unmarried at childbirth.
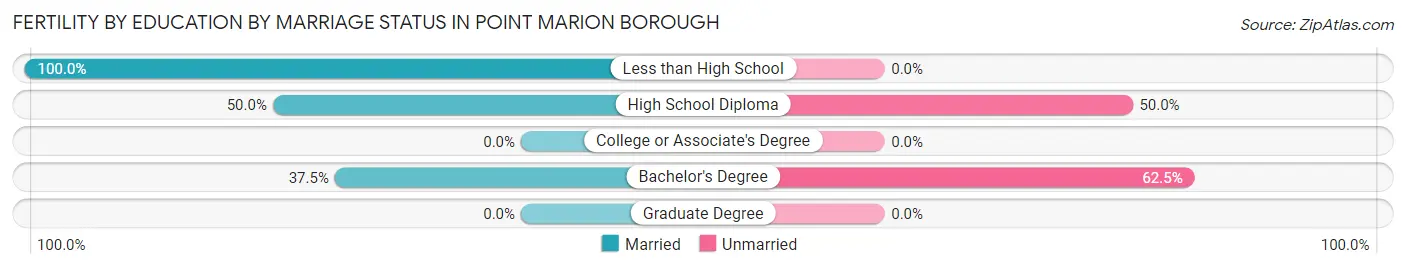
| Educational Attainment | Married | Unmarried |
| Less than High School | 12 (100.0%) | 0 (0.0%) |
| High School Diploma | 5 (50.0%) | 5 (50.0%) |
| College or Associate's Degree | 0 (0.0%) | 0 (0.0%) |
| Bachelor's Degree | 3 (37.5%) | 5 (62.5%) |
| Graduate Degree | 0 (0.0%) | 0 (0.0%) |
| Total | 20 (66.7%) | 10 (33.3%) |
Employment Characteristics in Point Marion borough
Employment by Class of Employer in Point Marion borough
Among the 601 employed individuals in Point Marion borough, private company employees (440 | 73.2%), not-for-profit organizations (79 | 13.1%), and state government employees (29 | 4.8%) make up the most common classes of employment.
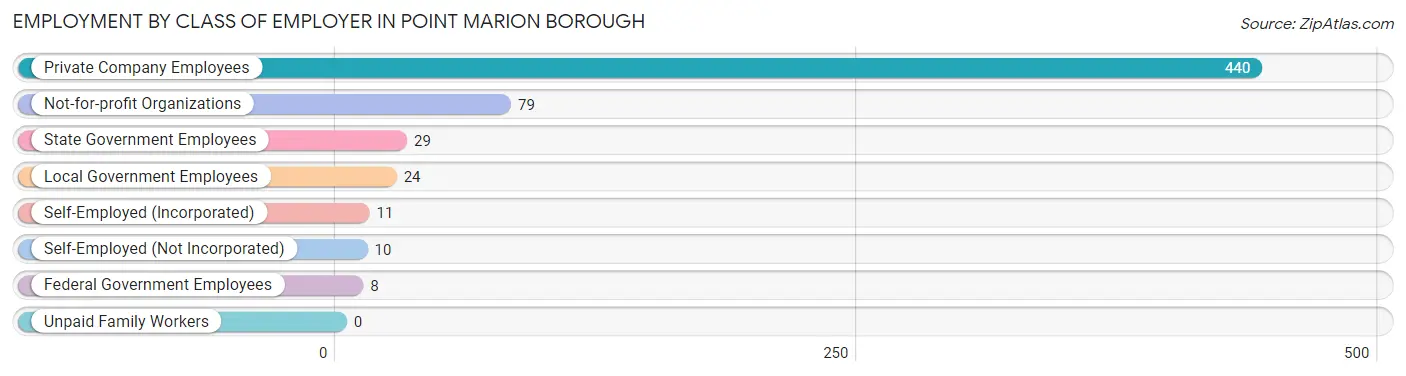
| Employer Class | # Employees | % Employees |
| Private Company Employees | 440 | 73.2% |
| Self-Employed (Incorporated) | 11 | 1.8% |
| Self-Employed (Not Incorporated) | 10 | 1.7% |
| Not-for-profit Organizations | 79 | 13.1% |
| Local Government Employees | 24 | 4.0% |
| State Government Employees | 29 | 4.8% |
| Federal Government Employees | 8 | 1.3% |
| Unpaid Family Workers | 0 | 0.0% |
| Total | 601 | 100.0% |
Employment Status by Age in Point Marion borough
According to the labor force statistics for Point Marion borough, out of the total population over 16 years of age (989), 64.8% or 641 individuals are in the labor force, with 5.8% or 37 of them unemployed. The age group with the highest labor force participation rate is 30 to 34 years, with 97.8% or 87 individuals in the labor force. Within the labor force, the 16 to 19 years age range has the highest percentage of unemployed individuals, with 70.0% or 14 of them being unemployed.
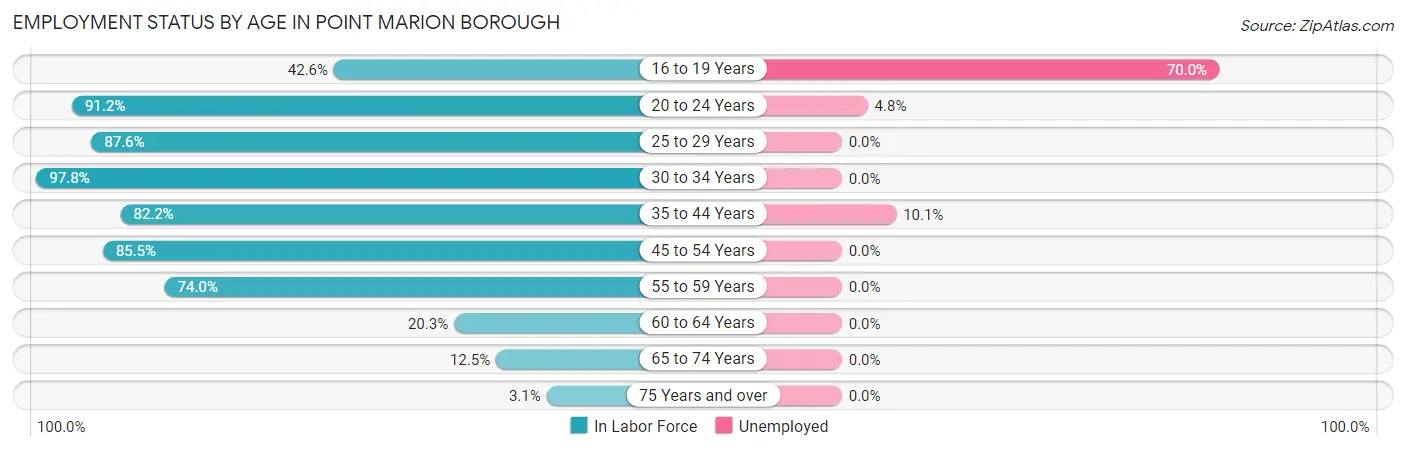
| Age Bracket | In Labor Force | Unemployed |
| 16 to 19 Years | 20 (42.6%) | 14 (70.0%) |
| 20 to 24 Years | 62 (91.2%) | 3 (4.8%) |
| 25 to 29 Years | 92 (87.6%) | 0 (0.0%) |
| 30 to 34 Years | 87 (97.8%) | 0 (0.0%) |
| 35 to 44 Years | 199 (82.2%) | 20 (10.1%) |
| 45 to 54 Years | 100 (85.5%) | 0 (0.0%) |
| 55 to 59 Years | 54 (74.0%) | 0 (0.0%) |
| 60 to 64 Years | 13 (20.3%) | 0 (0.0%) |
| 65 to 74 Years | 11 (12.5%) | 0 (0.0%) |
| 75 Years and over | 3 (3.1%) | 0 (0.0%) |
| Total | 641 (64.8%) | 37 (5.8%) |
Employment Status by Educational Attainment in Point Marion borough
According to labor force statistics for Point Marion borough, 79.0% of individuals (545) out of the total population between 25 and 64 years of age (690) are in the labor force, with 3.7% or 20 of them being unemployed. The group with the highest labor force participation rate are those with the educational attainment of bachelor's degree or higher, with 98.0% or 99 individuals in the labor force. Within the labor force, individuals with less than high school education have the highest percentage of unemployment, with 15.1% or 13 of them being unemployed.
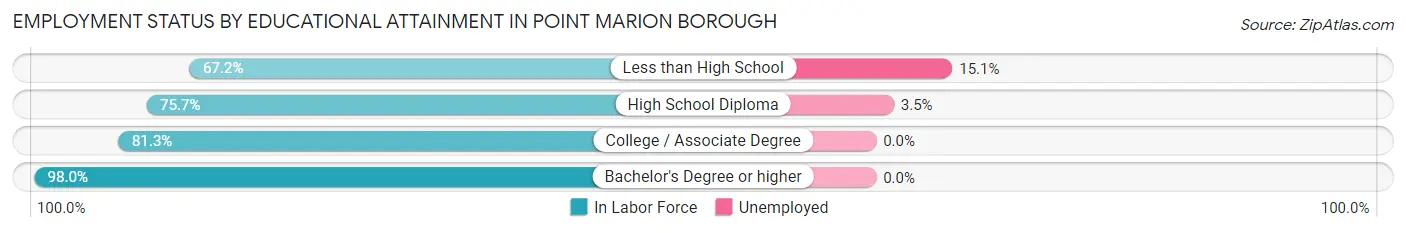
| Educational Attainment | In Labor Force | Unemployed |
| Less than High School | 86 (67.2%) | 19 (15.1%) |
| High School Diploma | 199 (75.7%) | 9 (3.5%) |
| College / Associate Degree | 161 (81.3%) | 0 (0.0%) |
| Bachelor's Degree or higher | 99 (98.0%) | 0 (0.0%) |
| Total | 545 (79.0%) | 26 (3.7%) |
Employment Occupations by Sex in Point Marion borough
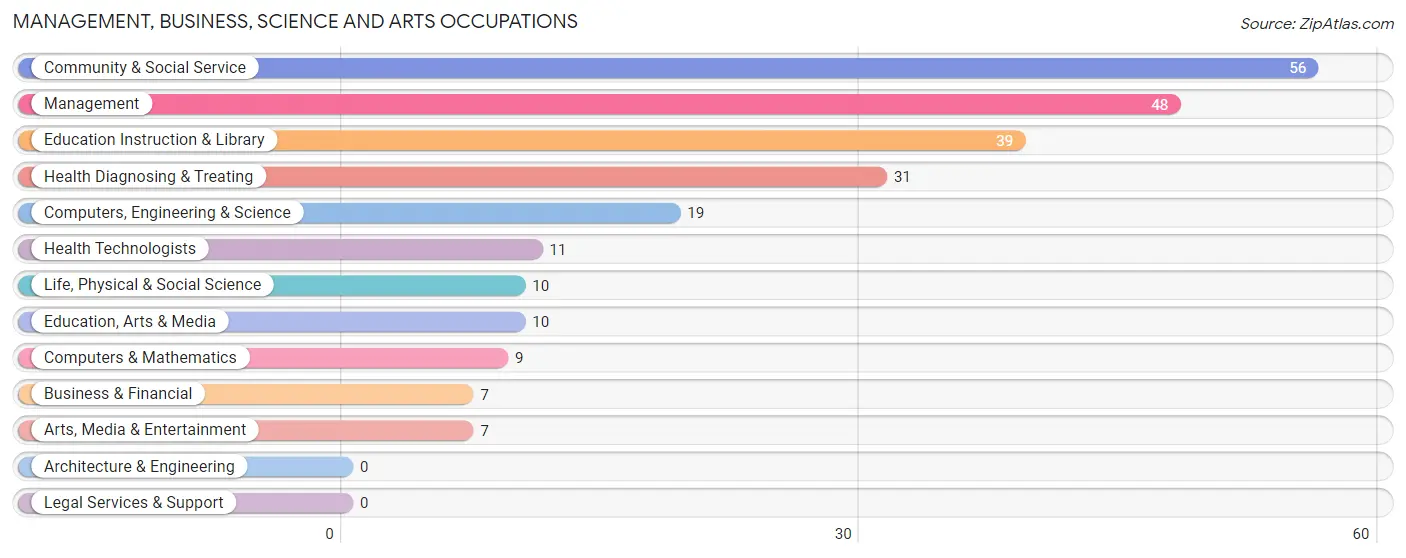
Management, Business, Science and Arts Occupations
The most common Management, Business, Science and Arts occupations in Point Marion borough are Community & Social Service (56 | 9.3%), Management (48 | 8.0%), Education Instruction & Library (39 | 6.5%), Health Diagnosing & Treating (31 | 5.1%), and Computers, Engineering & Science (19 | 3.2%).
Management, Business, Science and Arts Occupations by Sex
Within the Management, Business, Science and Arts occupations in Point Marion borough, the most male-oriented occupations are Arts, Media & Entertainment (100.0%), Life, Physical & Social Science (80.0%), and Computers, Engineering & Science (78.9%), while the most female-oriented occupations are Business & Financial (100.0%), Education, Arts & Media (100.0%), and Health Technologists (100.0%).
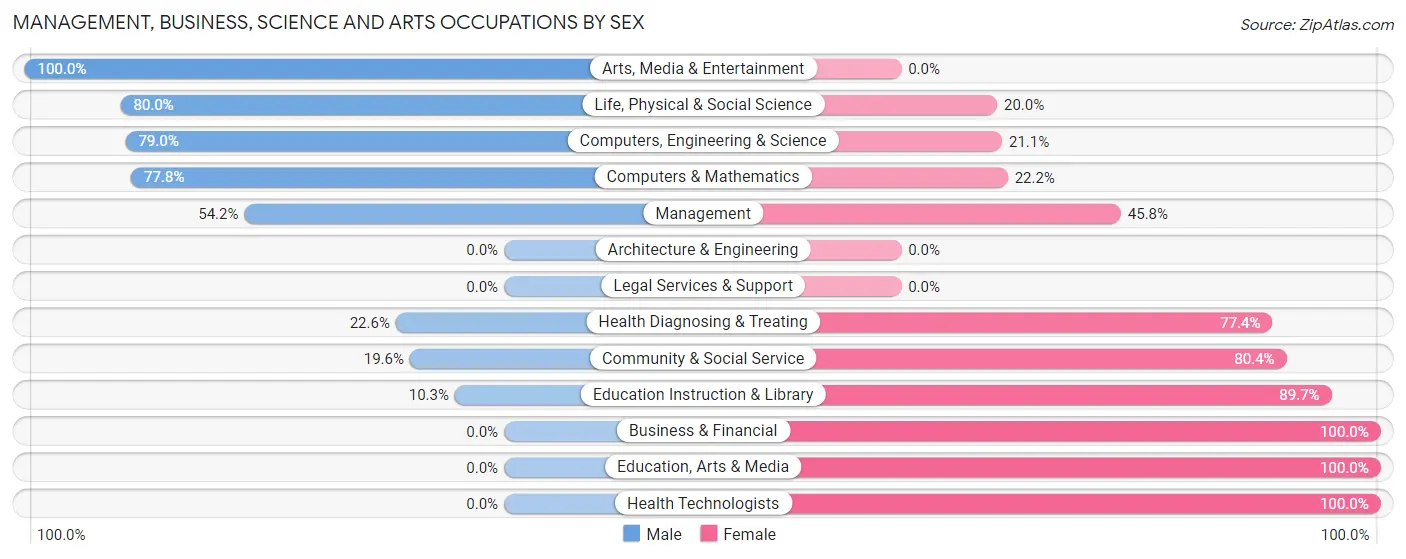
| Occupation | Male | Female |
| Management | 26 (54.2%) | 22 (45.8%) |
| Business & Financial | 0 (0.0%) | 7 (100.0%) |
| Computers, Engineering & Science | 15 (78.9%) | 4 (21.0%) |
| Computers & Mathematics | 7 (77.8%) | 2 (22.2%) |
| Architecture & Engineering | 0 (0.0%) | 0 (0.0%) |
| Life, Physical & Social Science | 8 (80.0%) | 2 (20.0%) |
| Community & Social Service | 11 (19.6%) | 45 (80.4%) |
| Education, Arts & Media | 0 (0.0%) | 10 (100.0%) |
| Legal Services & Support | 0 (0.0%) | 0 (0.0%) |
| Education Instruction & Library | 4 (10.3%) | 35 (89.7%) |
| Arts, Media & Entertainment | 7 (100.0%) | 0 (0.0%) |
| Health Diagnosing & Treating | 7 (22.6%) | 24 (77.4%) |
| Health Technologists | 0 (0.0%) | 11 (100.0%) |
| Total (Category) | 59 (36.6%) | 102 (63.3%) |
| Total (Overall) | 325 (53.8%) | 279 (46.2%) |
Services Occupations
The most common Services occupations in Point Marion borough are Food Preparation & Serving (48 | 8.0%), Security & Protection (37 | 6.1%), Firefighting & Prevention (37 | 6.1%), Healthcare Support (26 | 4.3%), and Personal Care & Service (13 | 2.1%).

Services Occupations by Sex
Within the Services occupations in Point Marion borough, the most male-oriented occupations are Security & Protection (100.0%), Firefighting & Prevention (100.0%), and Cleaning & Maintenance (100.0%), while the most female-oriented occupations are Personal Care & Service (100.0%), Healthcare Support (69.2%), and Food Preparation & Serving (25.0%).

| Occupation | Male | Female |
| Healthcare Support | 8 (30.8%) | 18 (69.2%) |
| Security & Protection | 37 (100.0%) | 0 (0.0%) |
| Firefighting & Prevention | 37 (100.0%) | 0 (0.0%) |
| Law Enforcement | 0 (0.0%) | 0 (0.0%) |
| Food Preparation & Serving | 36 (75.0%) | 12 (25.0%) |
| Cleaning & Maintenance | 12 (100.0%) | 0 (0.0%) |
| Personal Care & Service | 0 (0.0%) | 13 (100.0%) |
| Total (Category) | 93 (68.4%) | 43 (31.6%) |
| Total (Overall) | 325 (53.8%) | 279 (46.2%) |
Sales and Office Occupations
The most common Sales and Office occupations in Point Marion borough are Sales & Related (78 | 12.9%), and Office & Administration (62 | 10.3%).
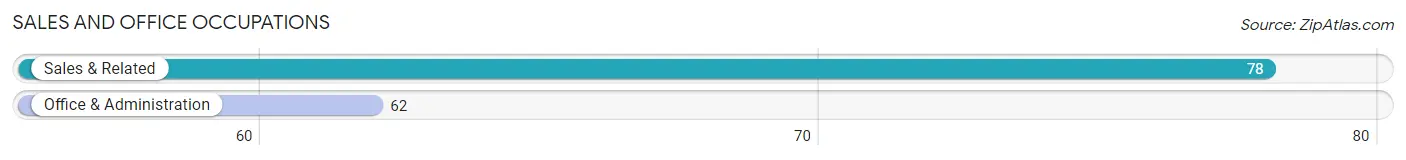
Sales and Office Occupations by Sex
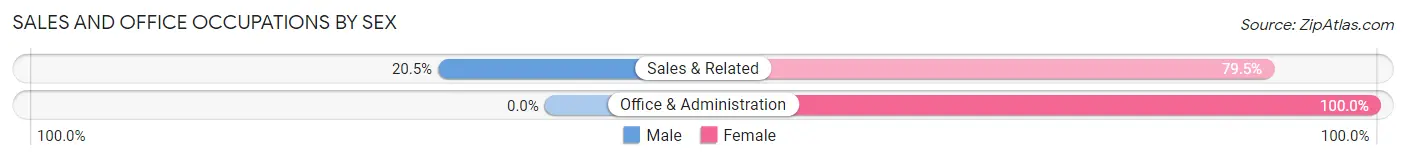
| Occupation | Male | Female |
| Sales & Related | 16 (20.5%) | 62 (79.5%) |
| Office & Administration | 0 (0.0%) | 62 (100.0%) |
| Total (Category) | 16 (11.4%) | 124 (88.6%) |
| Total (Overall) | 325 (53.8%) | 279 (46.2%) |
Natural Resources, Construction and Maintenance Occupations
The most common Natural Resources, Construction and Maintenance occupations in Point Marion borough are Construction & Extraction (54 | 8.9%), and Installation, Maintenance & Repair (26 | 4.3%).
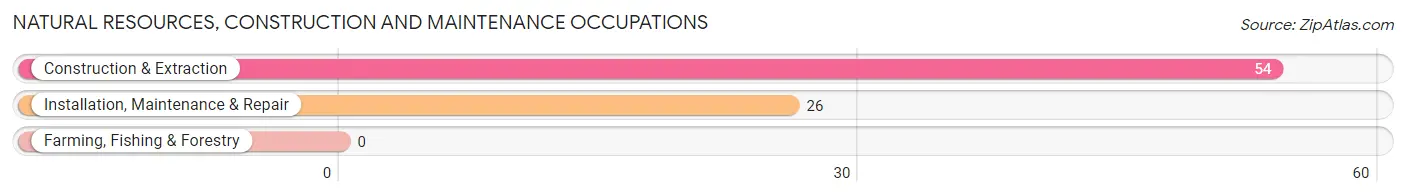
Natural Resources, Construction and Maintenance Occupations by Sex
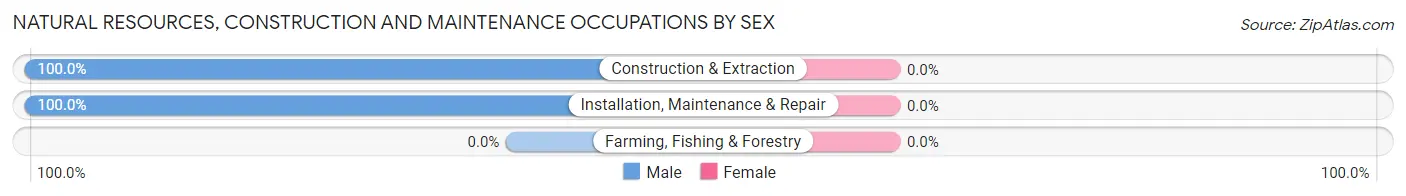
| Occupation | Male | Female |
| Farming, Fishing & Forestry | 0 (0.0%) | 0 (0.0%) |
| Construction & Extraction | 54 (100.0%) | 0 (0.0%) |
| Installation, Maintenance & Repair | 26 (100.0%) | 0 (0.0%) |
| Total (Category) | 80 (100.0%) | 0 (0.0%) |
| Total (Overall) | 325 (53.8%) | 279 (46.2%) |
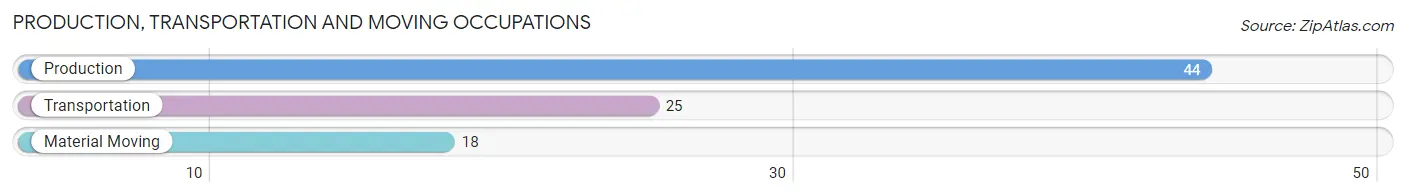
Production, Transportation and Moving Occupations
The most common Production, Transportation and Moving occupations in Point Marion borough are Production (44 | 7.3%), Transportation (25 | 4.1%), and Material Moving (18 | 3.0%).
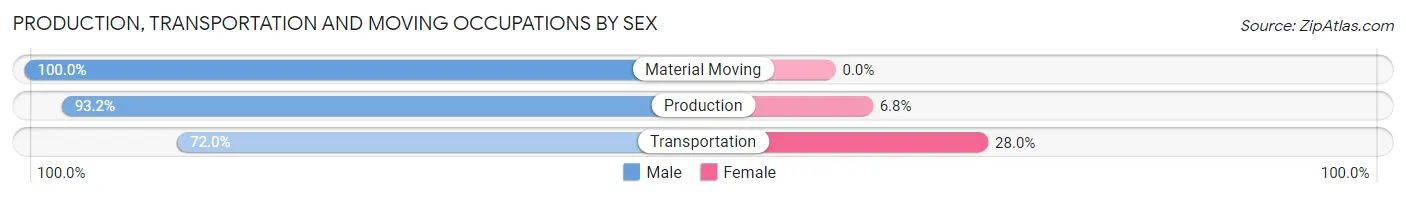
Production, Transportation and Moving Occupations by Sex
| Occupation | Male | Female |
| Production | 41 (93.2%) | 3 (6.8%) |
| Transportation | 18 (72.0%) | 7 (28.0%) |
| Material Moving | 18 (100.0%) | 0 (0.0%) |
| Total (Category) | 77 (88.5%) | 10 (11.5%) |
| Total (Overall) | 325 (53.8%) | 279 (46.2%) |
Employment Industries by Sex in Point Marion borough
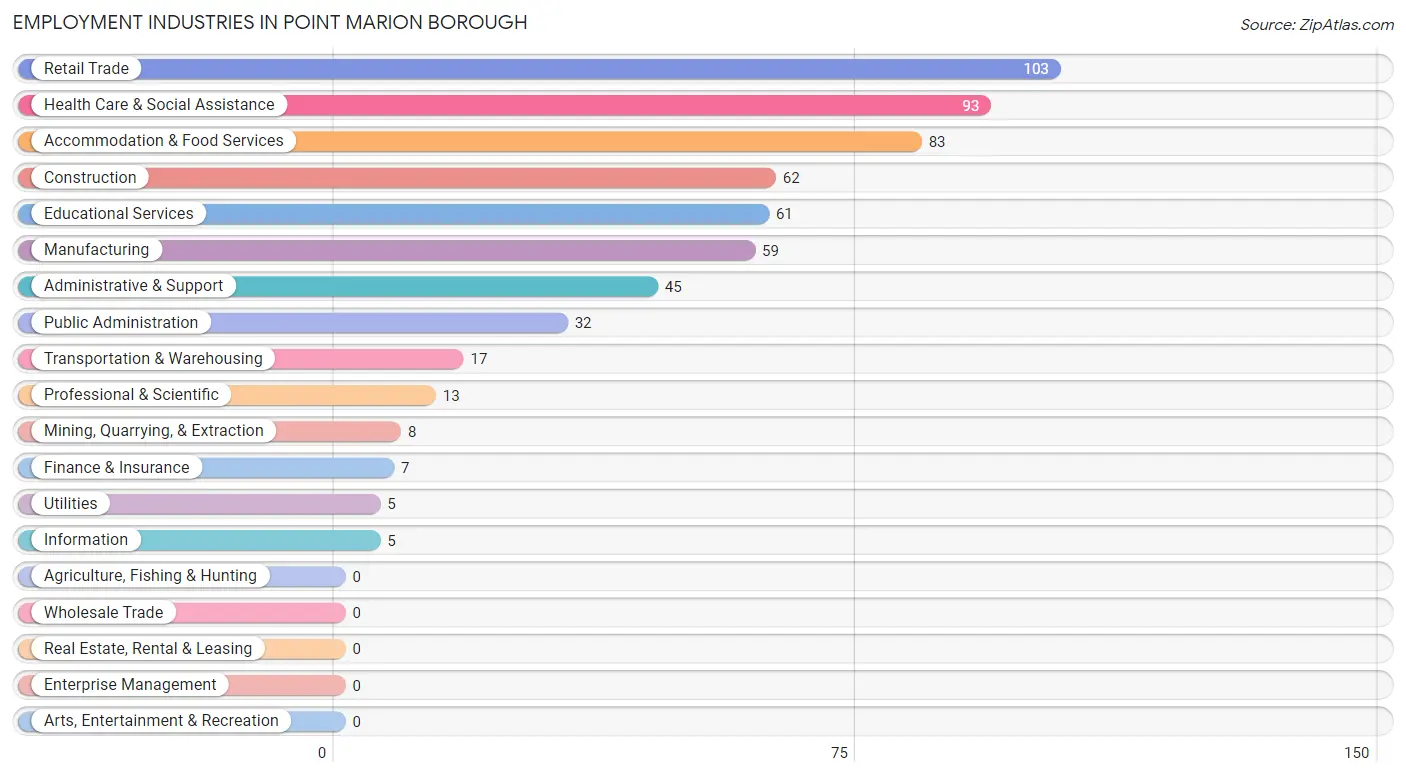
Employment Industries in Point Marion borough
The major employment industries in Point Marion borough include Retail Trade (103 | 17.1%), Health Care & Social Assistance (93 | 15.4%), Accommodation & Food Services (83 | 13.7%), Construction (62 | 10.3%), and Educational Services (61 | 10.1%).
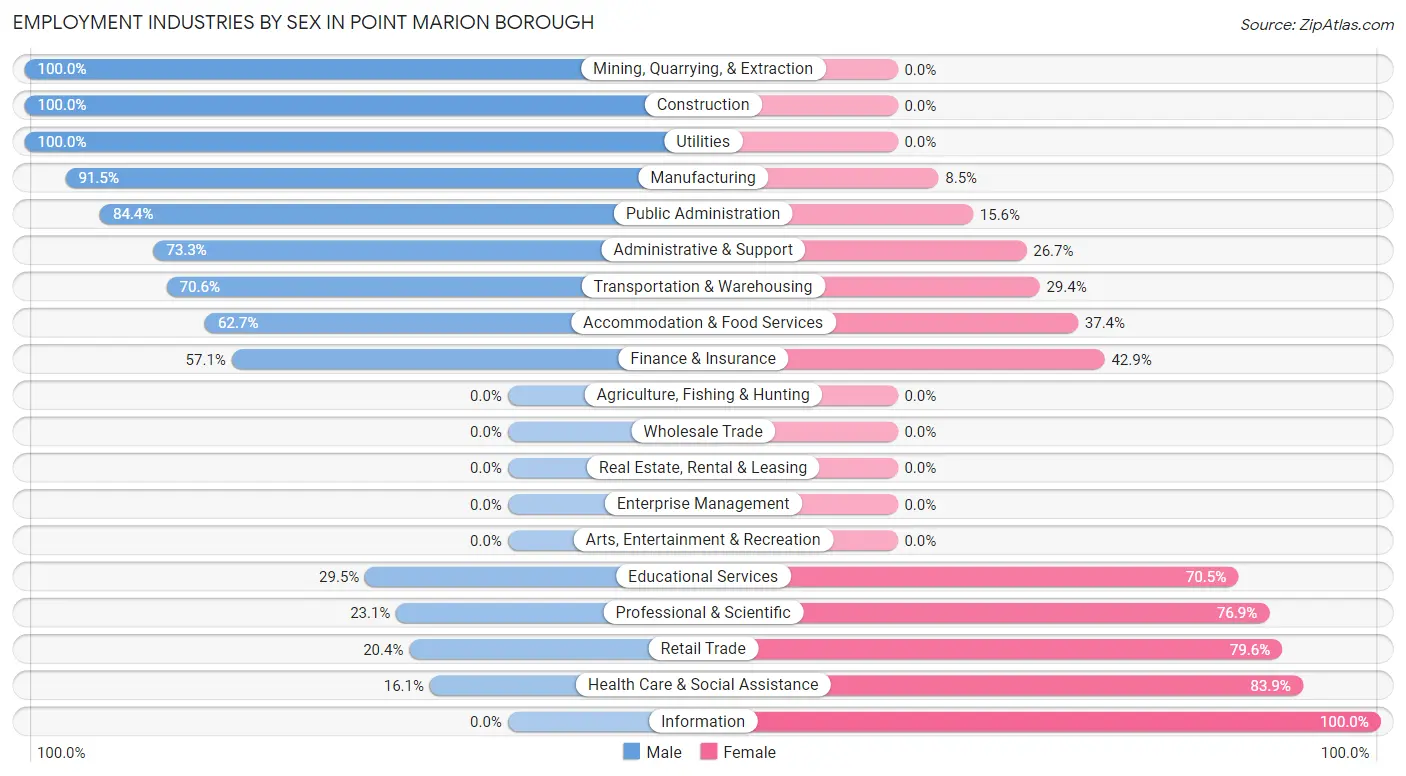
Employment Industries by Sex in Point Marion borough
The Point Marion borough industries that see more men than women are Mining, Quarrying, & Extraction (100.0%), Construction (100.0%), and Utilities (100.0%), whereas the industries that tend to have a higher number of women are Information (100.0%), Health Care & Social Assistance (83.9%), and Retail Trade (79.6%).
| Industry | Male | Female |
| Agriculture, Fishing & Hunting | 0 (0.0%) | 0 (0.0%) |
| Mining, Quarrying, & Extraction | 8 (100.0%) | 0 (0.0%) |
| Construction | 62 (100.0%) | 0 (0.0%) |
| Manufacturing | 54 (91.5%) | 5 (8.5%) |
| Wholesale Trade | 0 (0.0%) | 0 (0.0%) |
| Retail Trade | 21 (20.4%) | 82 (79.6%) |
| Transportation & Warehousing | 12 (70.6%) | 5 (29.4%) |
| Utilities | 5 (100.0%) | 0 (0.0%) |
| Information | 0 (0.0%) | 5 (100.0%) |
| Finance & Insurance | 4 (57.1%) | 3 (42.9%) |
| Real Estate, Rental & Leasing | 0 (0.0%) | 0 (0.0%) |
| Professional & Scientific | 3 (23.1%) | 10 (76.9%) |
| Enterprise Management | 0 (0.0%) | 0 (0.0%) |
| Administrative & Support | 33 (73.3%) | 12 (26.7%) |
| Educational Services | 18 (29.5%) | 43 (70.5%) |
| Health Care & Social Assistance | 15 (16.1%) | 78 (83.9%) |
| Arts, Entertainment & Recreation | 0 (0.0%) | 0 (0.0%) |
| Accommodation & Food Services | 52 (62.6%) | 31 (37.3%) |
| Public Administration | 27 (84.4%) | 5 (15.6%) |
| Total | 325 (53.8%) | 279 (46.2%) |
Education in Point Marion borough
School Enrollment in Point Marion borough
The most common levels of schooling among the 300 students in Point Marion borough are middle school (116 | 38.7%), elementary school (57 | 19.0%), and high school (53 | 17.7%).
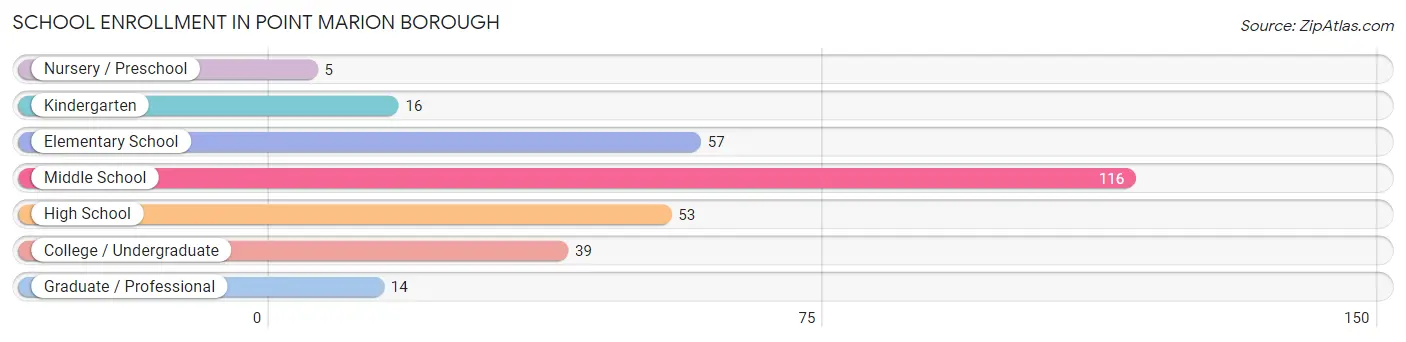
| School Level | # Students | % Students |
| Nursery / Preschool | 5 | 1.7% |
| Kindergarten | 16 | 5.3% |
| Elementary School | 57 | 19.0% |
| Middle School | 116 | 38.7% |
| High School | 53 | 17.7% |
| College / Undergraduate | 39 | 13.0% |
| Graduate / Professional | 14 | 4.7% |
| Total | 300 | 100.0% |
School Enrollment by Age by Funding Source in Point Marion borough
Out of a total of 300 students who are enrolled in schools in Point Marion borough, 30 (10.0%) attend a private institution, while the remaining 270 (90.0%) are enrolled in public schools. The age group of 20 to 24 year olds has the highest likelihood of being enrolled in private schools, with 14 (60.9% in the age bracket) enrolled. Conversely, the age group of 3 to 4 year olds has the lowest likelihood of being enrolled in a private school, with 5 (100.0% in the age bracket) attending a public institution.
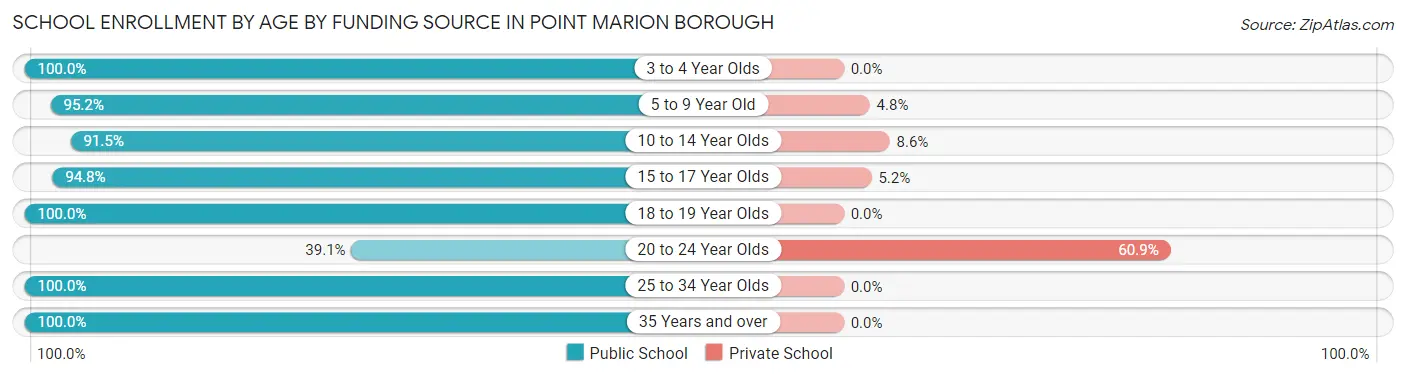
| Age Bracket | Public School | Private School |
| 3 to 4 Year Olds | 5 (100.0%) | 0 (0.0%) |
| 5 to 9 Year Old | 59 (95.2%) | 3 (4.8%) |
| 10 to 14 Year Olds | 107 (91.4%) | 10 (8.6%) |
| 15 to 17 Year Olds | 55 (94.8%) | 3 (5.2%) |
| 18 to 19 Year Olds | 16 (100.0%) | 0 (0.0%) |
| 20 to 24 Year Olds | 9 (39.1%) | 14 (60.9%) |
| 25 to 34 Year Olds | 13 (100.0%) | 0 (0.0%) |
| 35 Years and over | 6 (100.0%) | 0 (0.0%) |
| Total | 270 (90.0%) | 30 (10.0%) |
Educational Attainment by Field of Study in Point Marion borough
Science & technology (20 | 17.7%), psychology (14 | 12.4%), education (13 | 11.5%), business (12 | 10.6%), and communications (10 | 8.8%) are the most common fields of study among 113 individuals in Point Marion borough who have obtained a bachelor's degree or higher.
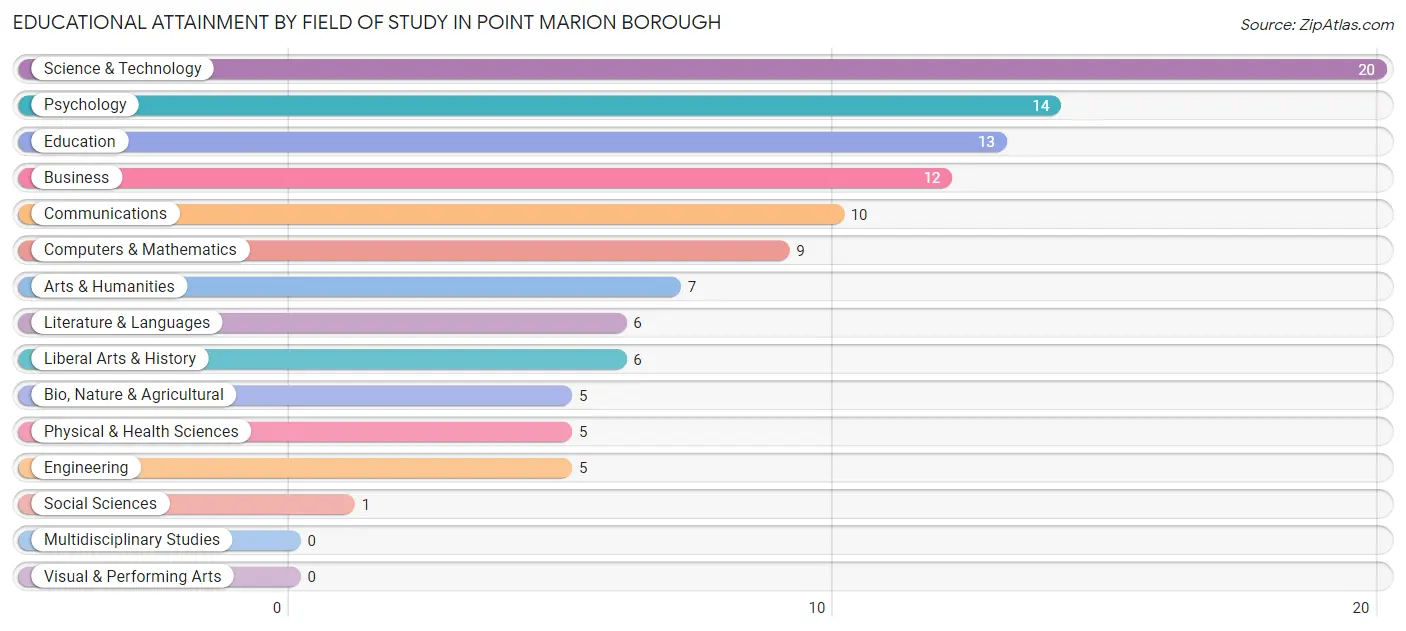
| Field of Study | # Graduates | % Graduates |
| Computers & Mathematics | 9 | 8.0% |
| Bio, Nature & Agricultural | 5 | 4.4% |
| Physical & Health Sciences | 5 | 4.4% |
| Psychology | 14 | 12.4% |
| Social Sciences | 1 | 0.9% |
| Engineering | 5 | 4.4% |
| Multidisciplinary Studies | 0 | 0.0% |
| Science & Technology | 20 | 17.7% |
| Business | 12 | 10.6% |
| Education | 13 | 11.5% |
| Literature & Languages | 6 | 5.3% |
| Liberal Arts & History | 6 | 5.3% |
| Visual & Performing Arts | 0 | 0.0% |
| Communications | 10 | 8.8% |
| Arts & Humanities | 7 | 6.2% |
| Total | 113 | 100.0% |
Transportation & Commute in Point Marion borough
Vehicle Availability by Sex in Point Marion borough
The most prevalent vehicle ownership categories in Point Marion borough are males with 2 vehicles (174, accounting for 53.5%) and females with 2 vehicles (150, making up 63.0%).
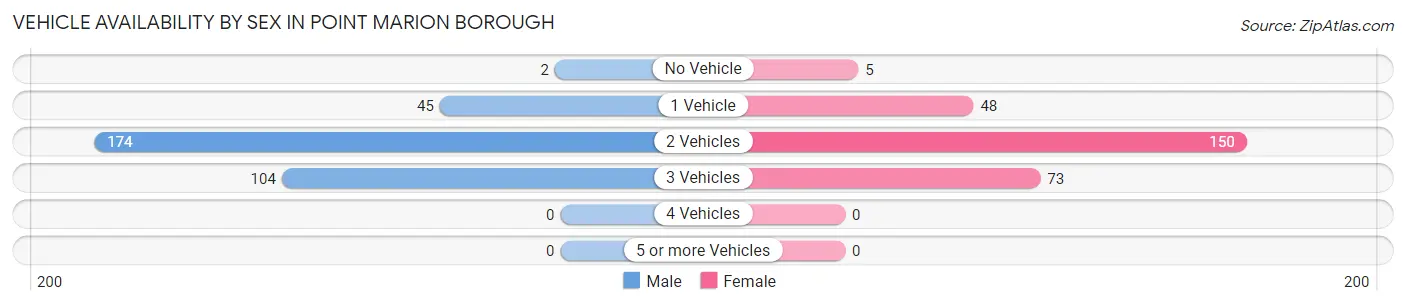
| Vehicles Available | Male | Female |
| No Vehicle | 2 (0.6%) | 5 (1.8%) |
| 1 Vehicle | 45 (13.9%) | 48 (17.4%) |
| 2 Vehicles | 174 (53.5%) | 150 (54.3%) |
| 3 Vehicles | 104 (32.0%) | 73 (26.5%) |
| 4 Vehicles | 0 (0.0%) | 0 (0.0%) |
| 5 or more Vehicles | 0 (0.0%) | 0 (0.0%) |
| Total | 325 (100.0%) | 276 (100.0%) |
Commute Time in Point Marion borough
The most frequently occuring commute durations in Point Marion borough are 30 to 34 minutes (183 commuters, 32.2%), 20 to 24 minutes (105 commuters, 18.4%), and 25 to 29 minutes (60 commuters, 10.5%).
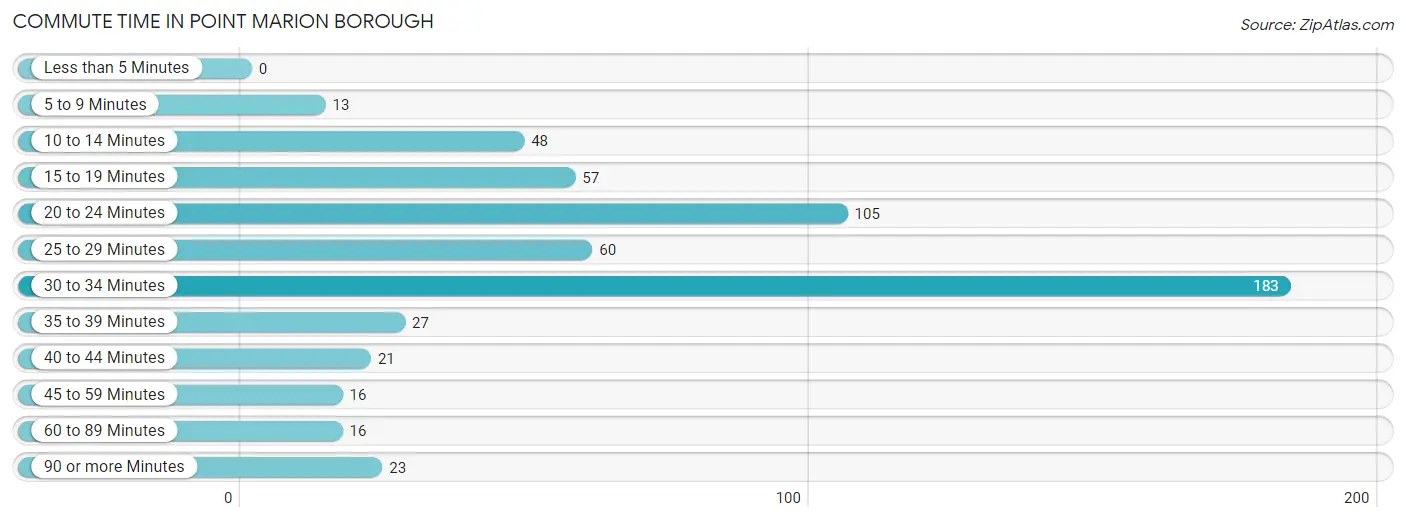
| Commute Time | # Commuters | % Commuters |
| Less than 5 Minutes | 0 | 0.0% |
| 5 to 9 Minutes | 13 | 2.3% |
| 10 to 14 Minutes | 48 | 8.4% |
| 15 to 19 Minutes | 57 | 10.0% |
| 20 to 24 Minutes | 105 | 18.4% |
| 25 to 29 Minutes | 60 | 10.5% |
| 30 to 34 Minutes | 183 | 32.2% |
| 35 to 39 Minutes | 27 | 4.8% |
| 40 to 44 Minutes | 21 | 3.7% |
| 45 to 59 Minutes | 16 | 2.8% |
| 60 to 89 Minutes | 16 | 2.8% |
| 90 or more Minutes | 23 | 4.0% |
Commute Time by Sex in Point Marion borough
The most common commute times in Point Marion borough are 30 to 34 minutes (114 commuters, 35.4%) for males and 30 to 34 minutes (69 commuters, 27.9%) for females.
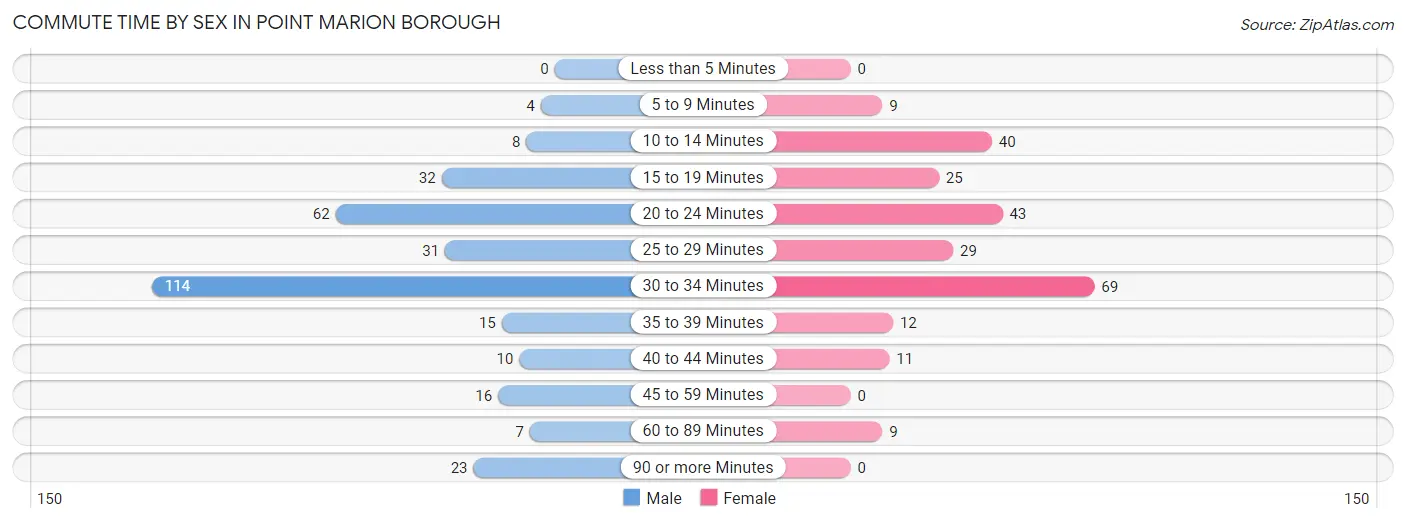
| Commute Time | Male | Female |
| Less than 5 Minutes | 0 (0.0%) | 0 (0.0%) |
| 5 to 9 Minutes | 4 (1.2%) | 9 (3.6%) |
| 10 to 14 Minutes | 8 (2.5%) | 40 (16.2%) |
| 15 to 19 Minutes | 32 (9.9%) | 25 (10.1%) |
| 20 to 24 Minutes | 62 (19.3%) | 43 (17.4%) |
| 25 to 29 Minutes | 31 (9.6%) | 29 (11.7%) |
| 30 to 34 Minutes | 114 (35.4%) | 69 (27.9%) |
| 35 to 39 Minutes | 15 (4.7%) | 12 (4.9%) |
| 40 to 44 Minutes | 10 (3.1%) | 11 (4.4%) |
| 45 to 59 Minutes | 16 (5.0%) | 0 (0.0%) |
| 60 to 89 Minutes | 7 (2.2%) | 9 (3.6%) |
| 90 or more Minutes | 23 (7.1%) | 0 (0.0%) |
Time of Departure to Work by Sex in Point Marion borough
The most frequent times of departure to work in Point Marion borough are 7:00 AM to 7:29 AM (67, 20.8%) for males and 9:00 AM to 9:59 AM (56, 22.7%) for females.
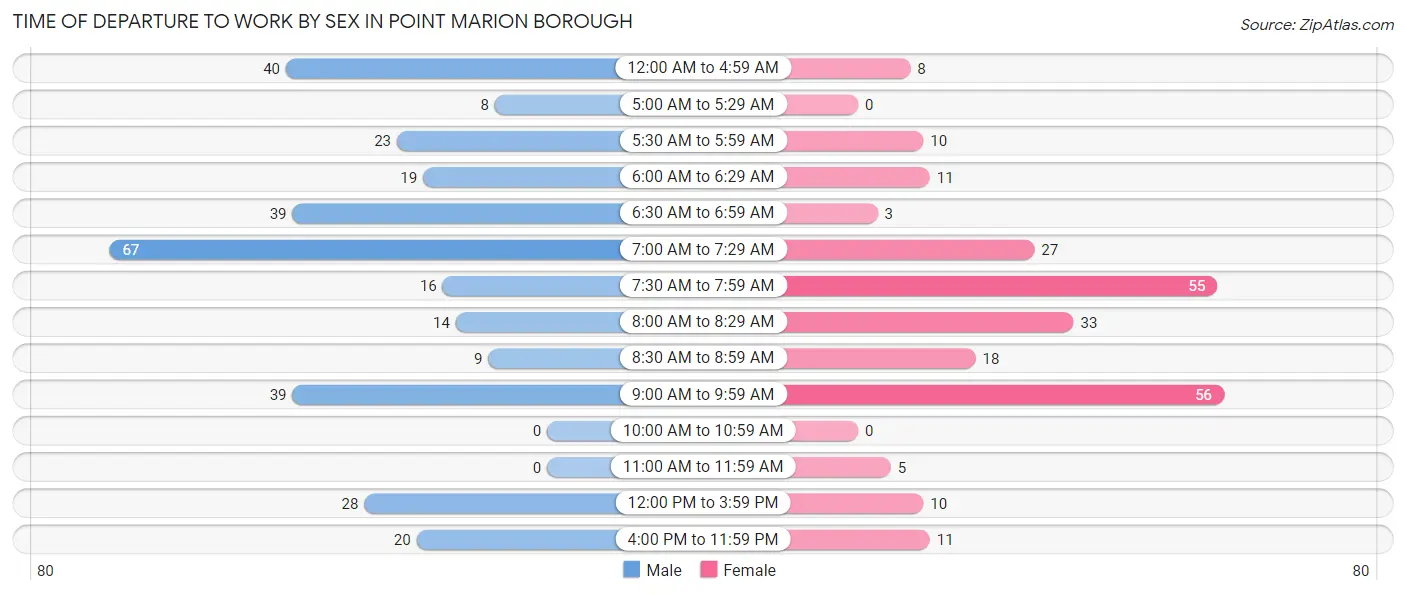
| Time of Departure | Male | Female |
| 12:00 AM to 4:59 AM | 40 (12.4%) | 8 (3.2%) |
| 5:00 AM to 5:29 AM | 8 (2.5%) | 0 (0.0%) |
| 5:30 AM to 5:59 AM | 23 (7.1%) | 10 (4.1%) |
| 6:00 AM to 6:29 AM | 19 (5.9%) | 11 (4.4%) |
| 6:30 AM to 6:59 AM | 39 (12.1%) | 3 (1.2%) |
| 7:00 AM to 7:29 AM | 67 (20.8%) | 27 (10.9%) |
| 7:30 AM to 7:59 AM | 16 (5.0%) | 55 (22.3%) |
| 8:00 AM to 8:29 AM | 14 (4.3%) | 33 (13.4%) |
| 8:30 AM to 8:59 AM | 9 (2.8%) | 18 (7.3%) |
| 9:00 AM to 9:59 AM | 39 (12.1%) | 56 (22.7%) |
| 10:00 AM to 10:59 AM | 0 (0.0%) | 0 (0.0%) |
| 11:00 AM to 11:59 AM | 0 (0.0%) | 5 (2.0%) |
| 12:00 PM to 3:59 PM | 28 (8.7%) | 10 (4.1%) |
| 4:00 PM to 11:59 PM | 20 (6.2%) | 11 (4.4%) |
| Total | 322 (100.0%) | 247 (100.0%) |
Housing Occupancy in Point Marion borough
Occupancy by Ownership in Point Marion borough
Of the total 456 dwellings in Point Marion borough, owner-occupied units account for 275 (60.3%), while renter-occupied units make up 181 (39.7%).
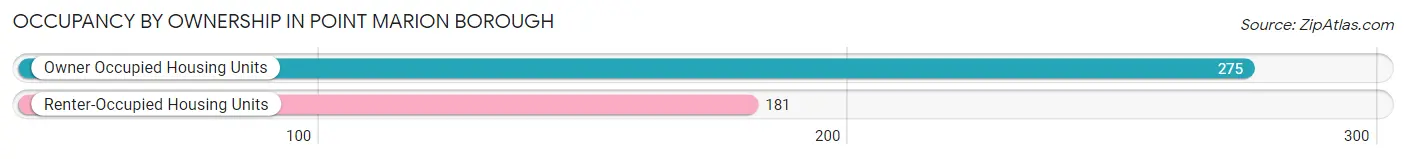
| Occupancy | # Housing Units | % Housing Units |
| Owner Occupied Housing Units | 275 | 60.3% |
| Renter-Occupied Housing Units | 181 | 39.7% |
| Total Occupied Housing Units | 456 | 100.0% |
Occupancy by Household Size in Point Marion borough
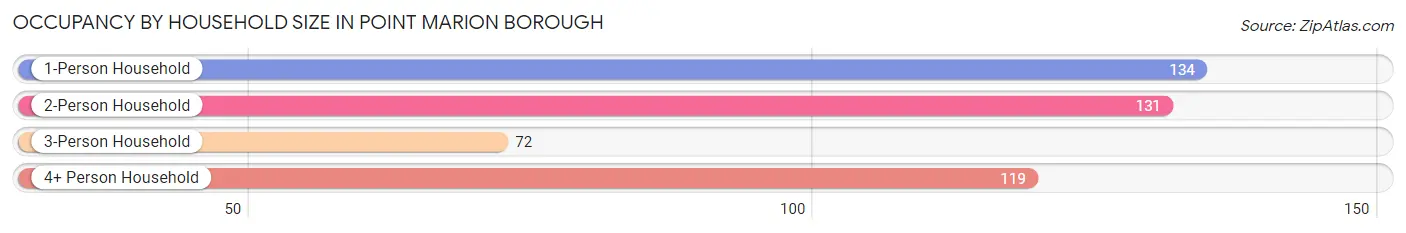
| Household Size | # Housing Units | % Housing Units |
| 1-Person Household | 134 | 29.4% |
| 2-Person Household | 131 | 28.7% |
| 3-Person Household | 72 | 15.8% |
| 4+ Person Household | 119 | 26.1% |
| Total Housing Units | 456 | 100.0% |
Occupancy by Ownership by Household Size in Point Marion borough
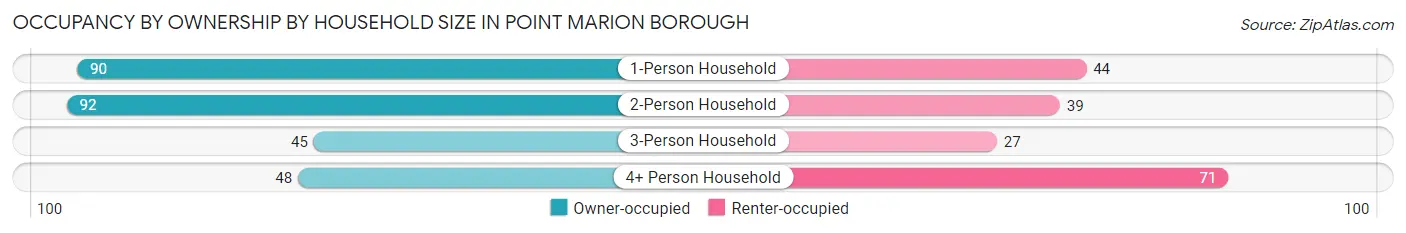
| Household Size | Owner-occupied | Renter-occupied |
| 1-Person Household | 90 (67.2%) | 44 (32.8%) |
| 2-Person Household | 92 (70.2%) | 39 (29.8%) |
| 3-Person Household | 45 (62.5%) | 27 (37.5%) |
| 4+ Person Household | 48 (40.3%) | 71 (59.7%) |
| Total Housing Units | 275 (60.3%) | 181 (39.7%) |
Occupancy by Educational Attainment in Point Marion borough
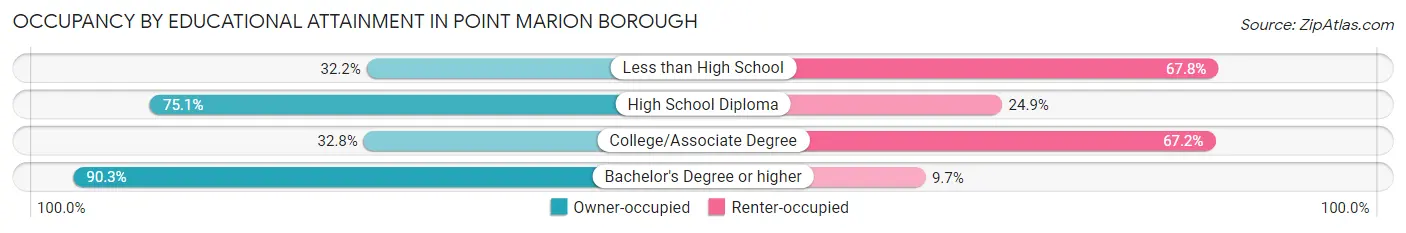
| Household Size | Owner-occupied | Renter-occupied |
| Less than High School | 19 (32.2%) | 40 (67.8%) |
| High School Diploma | 160 (75.1%) | 53 (24.9%) |
| College/Associate Degree | 40 (32.8%) | 82 (67.2%) |
| Bachelor's Degree or higher | 56 (90.3%) | 6 (9.7%) |
Occupancy by Age of Householder in Point Marion borough
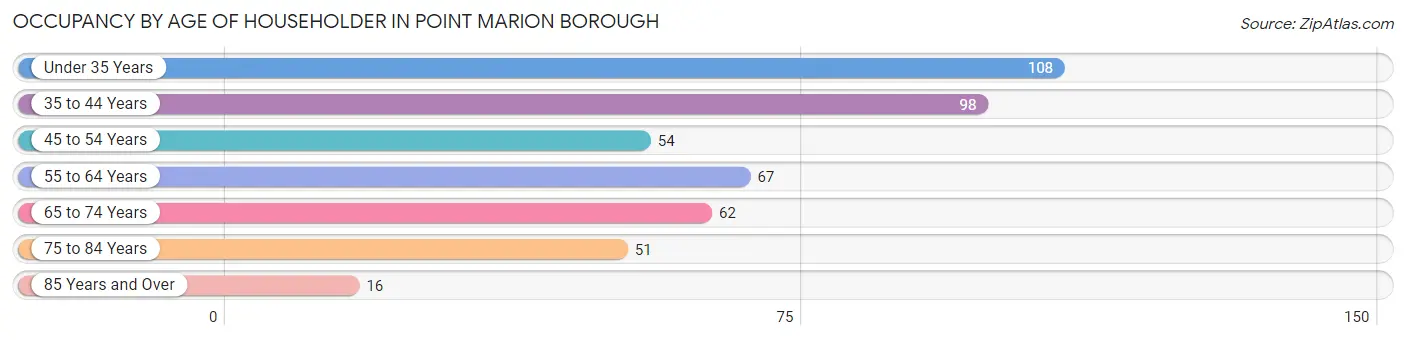
| Age Bracket | # Households | % Households |
| Under 35 Years | 108 | 23.7% |
| 35 to 44 Years | 98 | 21.5% |
| 45 to 54 Years | 54 | 11.8% |
| 55 to 64 Years | 67 | 14.7% |
| 65 to 74 Years | 62 | 13.6% |
| 75 to 84 Years | 51 | 11.2% |
| 85 Years and Over | 16 | 3.5% |
| Total | 456 | 100.0% |
Housing Finances in Point Marion borough
Median Income by Occupancy in Point Marion borough
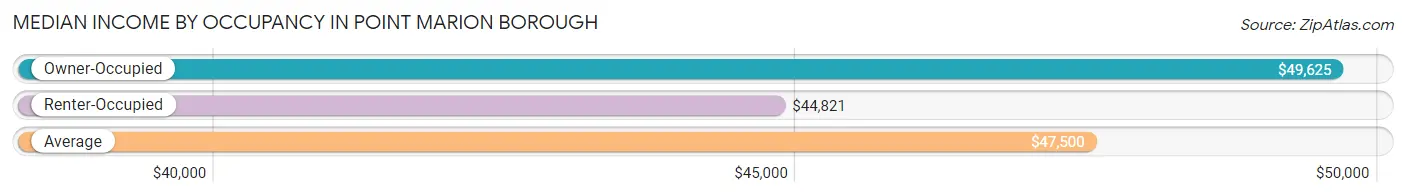
| Occupancy Type | # Households | Median Income |
| Owner-Occupied | 275 (60.3%) | $49,625 |
| Renter-Occupied | 181 (39.7%) | $44,821 |
| Average | 456 (100.0%) | $47,500 |
Occupancy by Householder Income Bracket in Point Marion borough
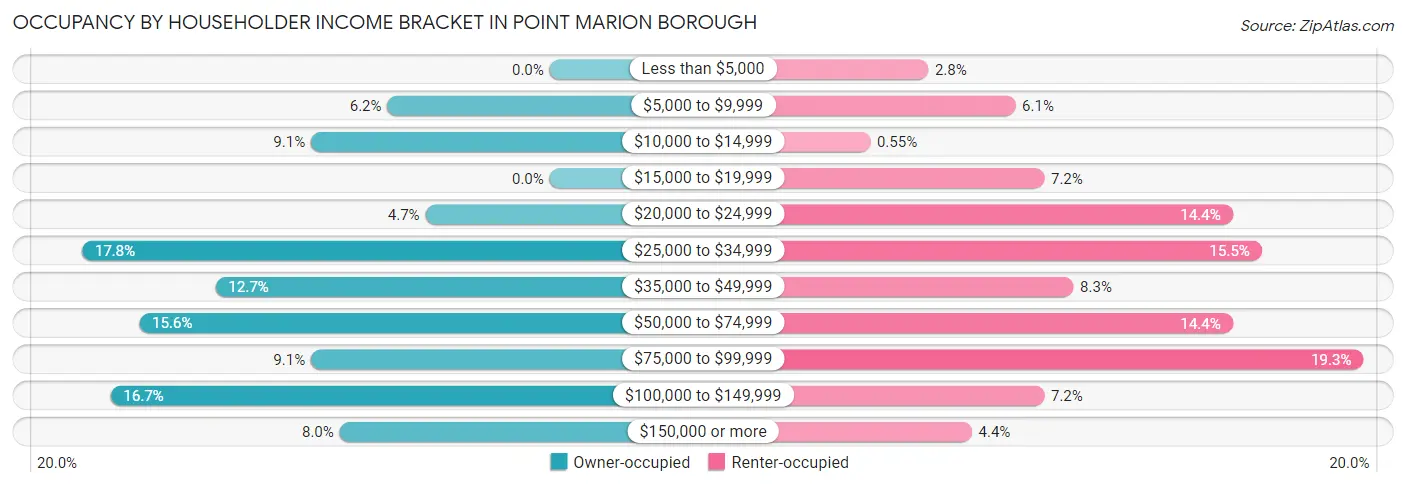
| Income Bracket | Owner-occupied | Renter-occupied |
| Less than $5,000 | 0 (0.0%) | 5 (2.8%) |
| $5,000 to $9,999 | 17 (6.2%) | 11 (6.1%) |
| $10,000 to $14,999 | 25 (9.1%) | 1 (0.5%) |
| $15,000 to $19,999 | 0 (0.0%) | 13 (7.2%) |
| $20,000 to $24,999 | 13 (4.7%) | 26 (14.4%) |
| $25,000 to $34,999 | 49 (17.8%) | 28 (15.5%) |
| $35,000 to $49,999 | 35 (12.7%) | 15 (8.3%) |
| $50,000 to $74,999 | 43 (15.6%) | 26 (14.4%) |
| $75,000 to $99,999 | 25 (9.1%) | 35 (19.3%) |
| $100,000 to $149,999 | 46 (16.7%) | 13 (7.2%) |
| $150,000 or more | 22 (8.0%) | 8 (4.4%) |
| Total | 275 (100.0%) | 181 (100.0%) |
Monthly Housing Cost Tiers in Point Marion borough
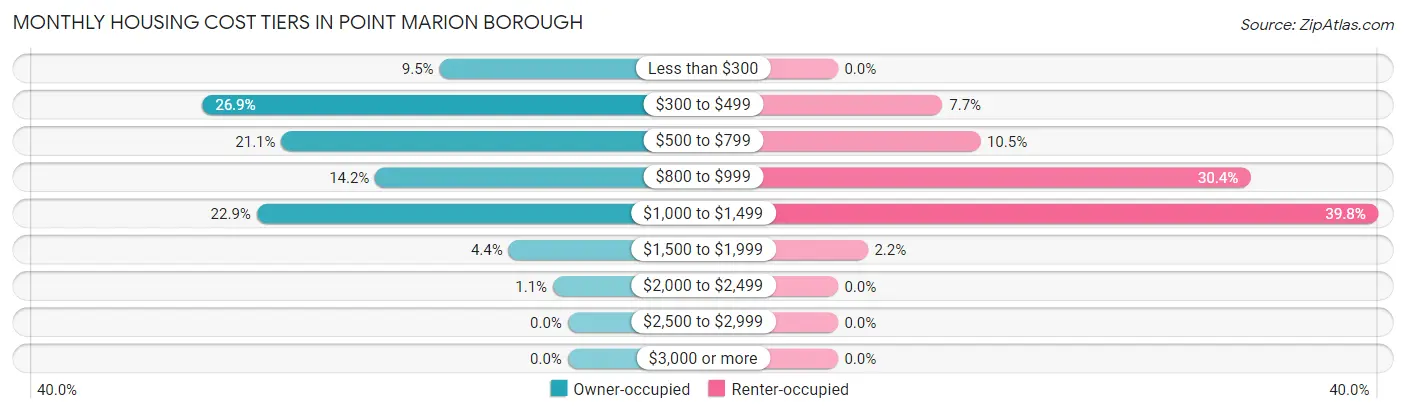
| Monthly Cost | Owner-occupied | Renter-occupied |
| Less than $300 | 26 (9.5%) | 0 (0.0%) |
| $300 to $499 | 74 (26.9%) | 14 (7.7%) |
| $500 to $799 | 58 (21.1%) | 19 (10.5%) |
| $800 to $999 | 39 (14.2%) | 55 (30.4%) |
| $1,000 to $1,499 | 63 (22.9%) | 72 (39.8%) |
| $1,500 to $1,999 | 12 (4.4%) | 4 (2.2%) |
| $2,000 to $2,499 | 3 (1.1%) | 0 (0.0%) |
| $2,500 to $2,999 | 0 (0.0%) | 0 (0.0%) |
| $3,000 or more | 0 (0.0%) | 0 (0.0%) |
| Total | 275 (100.0%) | 181 (100.0%) |
Physical Housing Characteristics in Point Marion borough
Housing Structures in Point Marion borough
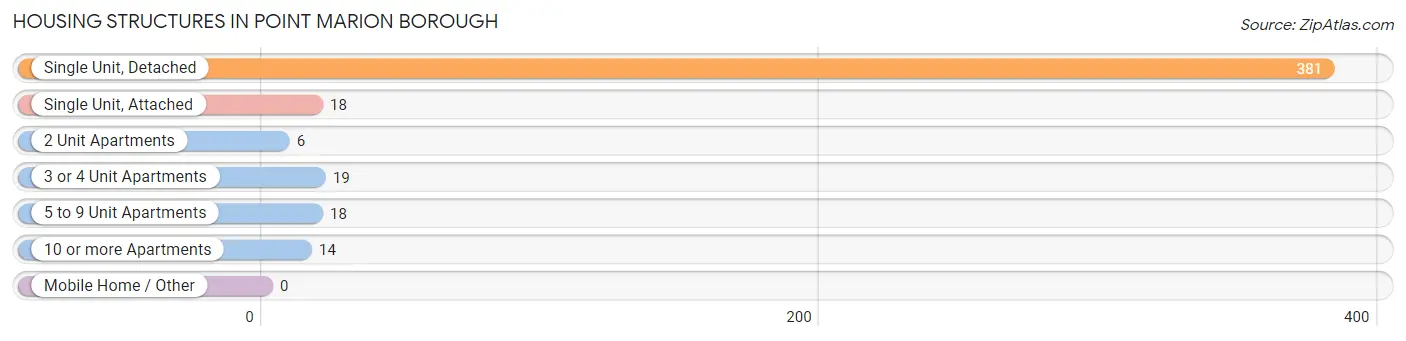
| Structure Type | # Housing Units | % Housing Units |
| Single Unit, Detached | 381 | 83.6% |
| Single Unit, Attached | 18 | 4.0% |
| 2 Unit Apartments | 6 | 1.3% |
| 3 or 4 Unit Apartments | 19 | 4.2% |
| 5 to 9 Unit Apartments | 18 | 4.0% |
| 10 or more Apartments | 14 | 3.1% |
| Mobile Home / Other | 0 | 0.0% |
| Total | 456 | 100.0% |
Housing Structures by Occupancy in Point Marion borough
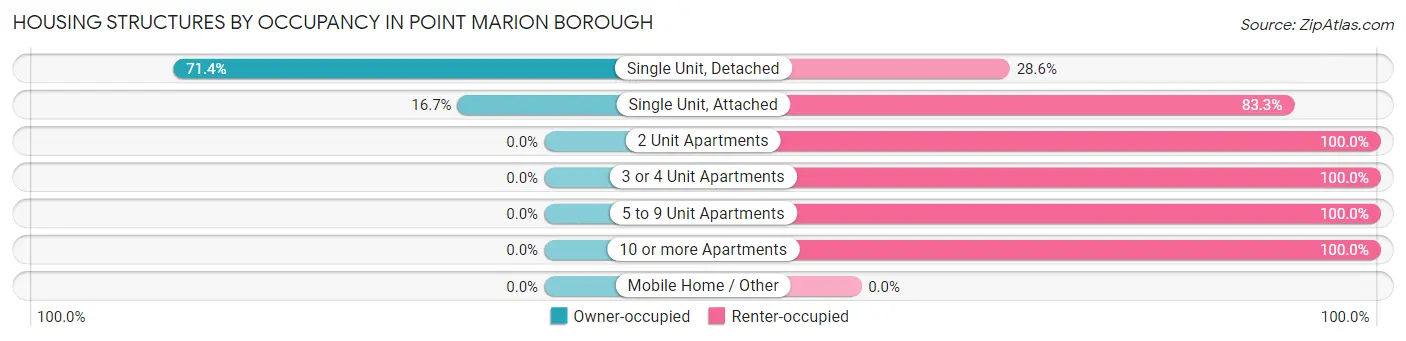
| Structure Type | Owner-occupied | Renter-occupied |
| Single Unit, Detached | 272 (71.4%) | 109 (28.6%) |
| Single Unit, Attached | 3 (16.7%) | 15 (83.3%) |
| 2 Unit Apartments | 0 (0.0%) | 6 (100.0%) |
| 3 or 4 Unit Apartments | 0 (0.0%) | 19 (100.0%) |
| 5 to 9 Unit Apartments | 0 (0.0%) | 18 (100.0%) |
| 10 or more Apartments | 0 (0.0%) | 14 (100.0%) |
| Mobile Home / Other | 0 (0.0%) | 0 (0.0%) |
| Total | 275 (60.3%) | 181 (39.7%) |
Housing Structures by Number of Rooms in Point Marion borough
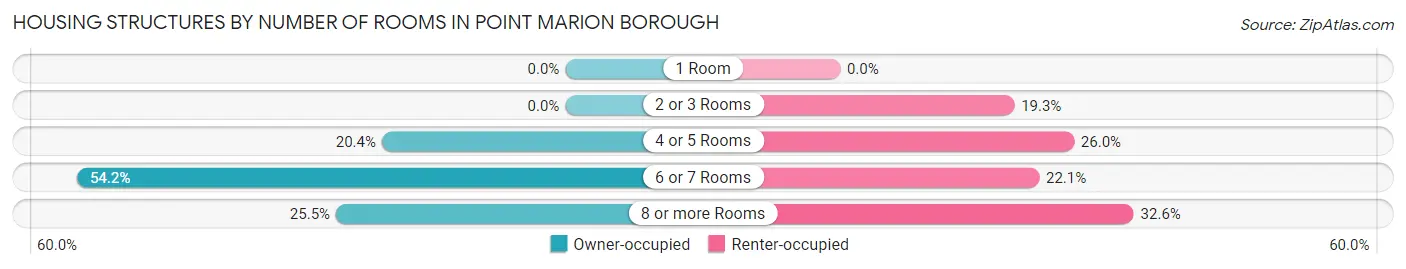
| Number of Rooms | Owner-occupied | Renter-occupied |
| 1 Room | 0 (0.0%) | 0 (0.0%) |
| 2 or 3 Rooms | 0 (0.0%) | 35 (19.3%) |
| 4 or 5 Rooms | 56 (20.4%) | 47 (26.0%) |
| 6 or 7 Rooms | 149 (54.2%) | 40 (22.1%) |
| 8 or more Rooms | 70 (25.5%) | 59 (32.6%) |
| Total | 275 (100.0%) | 181 (100.0%) |
Housing Structure by Heating Type in Point Marion borough
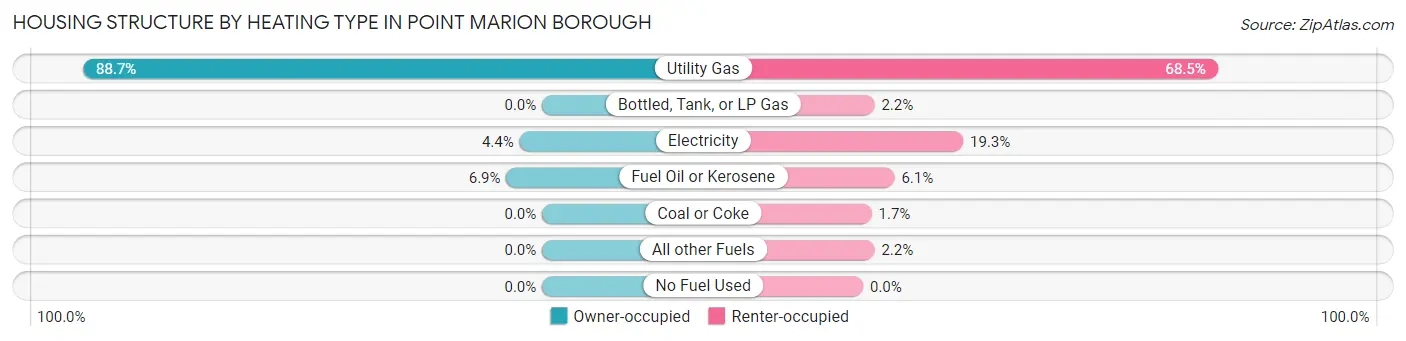
| Heating Type | Owner-occupied | Renter-occupied |
| Utility Gas | 244 (88.7%) | 124 (68.5%) |
| Bottled, Tank, or LP Gas | 0 (0.0%) | 4 (2.2%) |
| Electricity | 12 (4.4%) | 35 (19.3%) |
| Fuel Oil or Kerosene | 19 (6.9%) | 11 (6.1%) |
| Coal or Coke | 0 (0.0%) | 3 (1.7%) |
| All other Fuels | 0 (0.0%) | 4 (2.2%) |
| No Fuel Used | 0 (0.0%) | 0 (0.0%) |
| Total | 275 (100.0%) | 181 (100.0%) |
Household Vehicle Usage in Point Marion borough
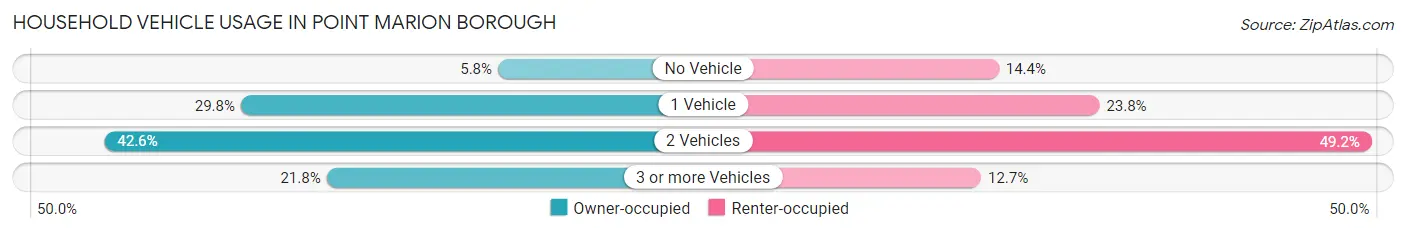
| Vehicles per Household | Owner-occupied | Renter-occupied |
| No Vehicle | 16 (5.8%) | 26 (14.4%) |
| 1 Vehicle | 82 (29.8%) | 43 (23.8%) |
| 2 Vehicles | 117 (42.5%) | 89 (49.2%) |
| 3 or more Vehicles | 60 (21.8%) | 23 (12.7%) |
| Total | 275 (100.0%) | 181 (100.0%) |
Real Estate & Mortgages in Point Marion borough
Real Estate and Mortgage Overview in Point Marion borough
| Characteristic | Without Mortgage | With Mortgage |
| Housing Units | 150 | 125 |
| Median Property Value | $73,300 | $113,000 |
| Median Household Income | $47,500 | $15 |
| Monthly Housing Costs | $440 | $0 |
| Real Estate Taxes | $960 | $0 |
Property Value by Mortgage Status in Point Marion borough
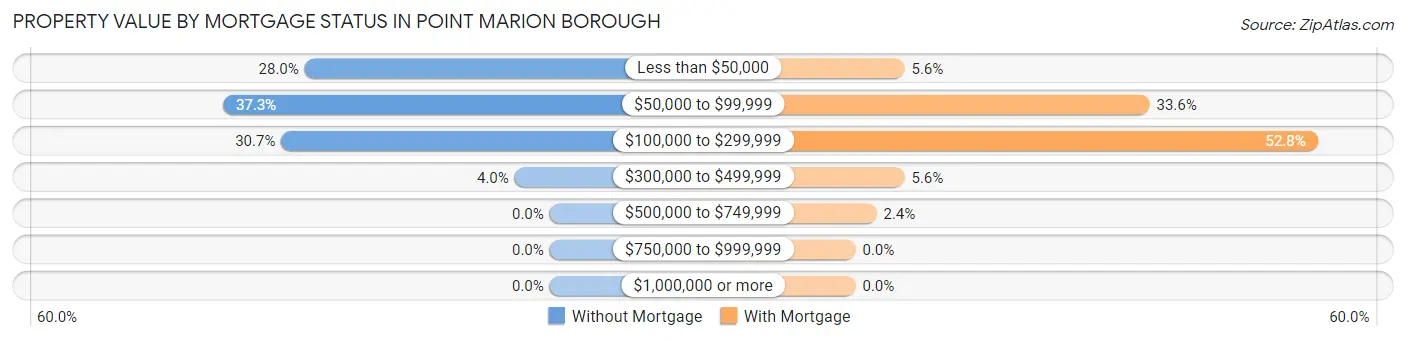
| Property Value | Without Mortgage | With Mortgage |
| Less than $50,000 | 42 (28.0%) | 7 (5.6%) |
| $50,000 to $99,999 | 56 (37.3%) | 42 (33.6%) |
| $100,000 to $299,999 | 46 (30.7%) | 66 (52.8%) |
| $300,000 to $499,999 | 6 (4.0%) | 7 (5.6%) |
| $500,000 to $749,999 | 0 (0.0%) | 3 (2.4%) |
| $750,000 to $999,999 | 0 (0.0%) | 0 (0.0%) |
| $1,000,000 or more | 0 (0.0%) | 0 (0.0%) |
| Total | 150 (100.0%) | 125 (100.0%) |
Household Income by Mortgage Status in Point Marion borough
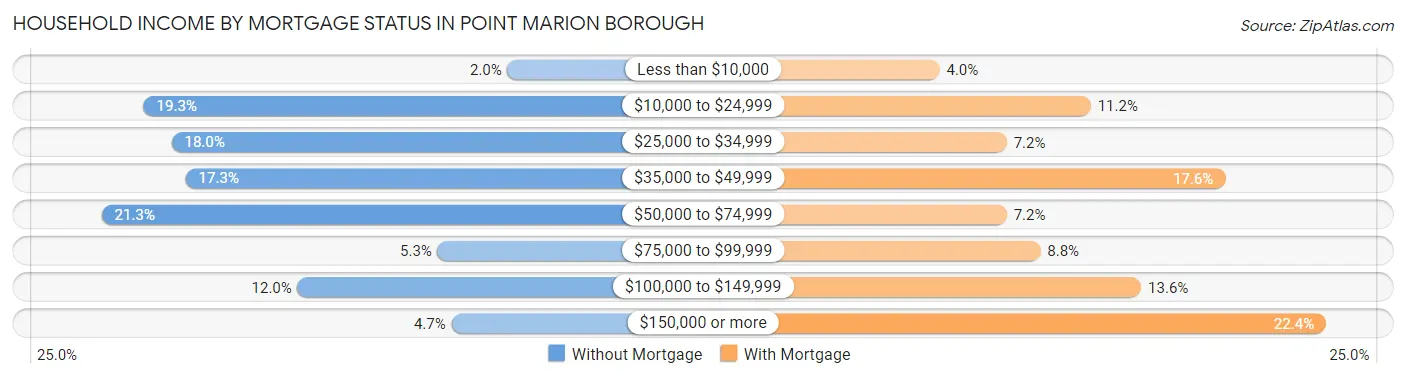
| Household Income | Without Mortgage | With Mortgage |
| Less than $10,000 | 3 (2.0%) | 5 (4.0%) |
| $10,000 to $24,999 | 29 (19.3%) | 14 (11.2%) |
| $25,000 to $34,999 | 27 (18.0%) | 9 (7.2%) |
| $35,000 to $49,999 | 26 (17.3%) | 22 (17.6%) |
| $50,000 to $74,999 | 32 (21.3%) | 9 (7.2%) |
| $75,000 to $99,999 | 8 (5.3%) | 11 (8.8%) |
| $100,000 to $149,999 | 18 (12.0%) | 17 (13.6%) |
| $150,000 or more | 7 (4.7%) | 28 (22.4%) |
| Total | 150 (100.0%) | 125 (100.0%) |
Property Value to Household Income Ratio in Point Marion borough
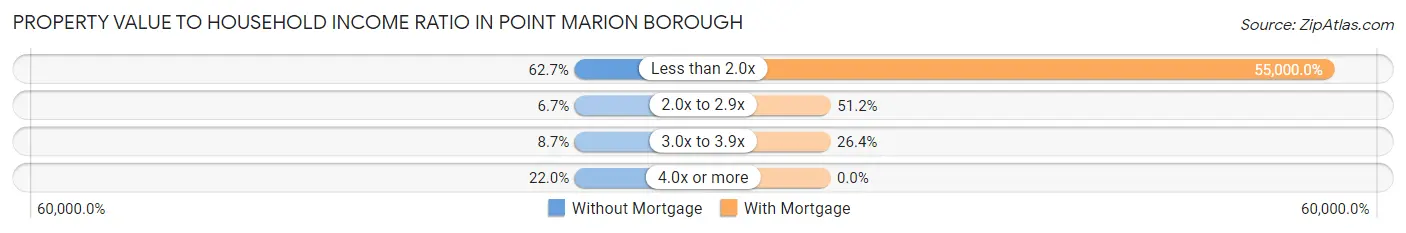
| Value-to-Income Ratio | Without Mortgage | With Mortgage |
| Less than 2.0x | 94 (62.7%) | 68,750 (55,000.0%) |
| 2.0x to 2.9x | 10 (6.7%) | 64 (51.2%) |
| 3.0x to 3.9x | 13 (8.7%) | 33 (26.4%) |
| 4.0x or more | 33 (22.0%) | 0 (0.0%) |
| Total | 150 (100.0%) | 125 (100.0%) |
Real Estate Taxes by Mortgage Status in Point Marion borough
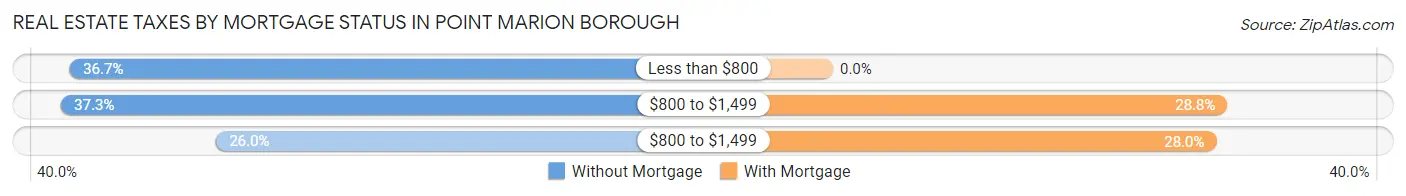
| Property Taxes | Without Mortgage | With Mortgage |
| Less than $800 | 55 (36.7%) | 0 (0.0%) |
| $800 to $1,499 | 56 (37.3%) | 36 (28.8%) |
| $800 to $1,499 | 39 (26.0%) | 35 (28.0%) |
| Total | 150 (100.0%) | 125 (100.0%) |
Health & Disability in Point Marion borough
Health Insurance Coverage by Age in Point Marion borough
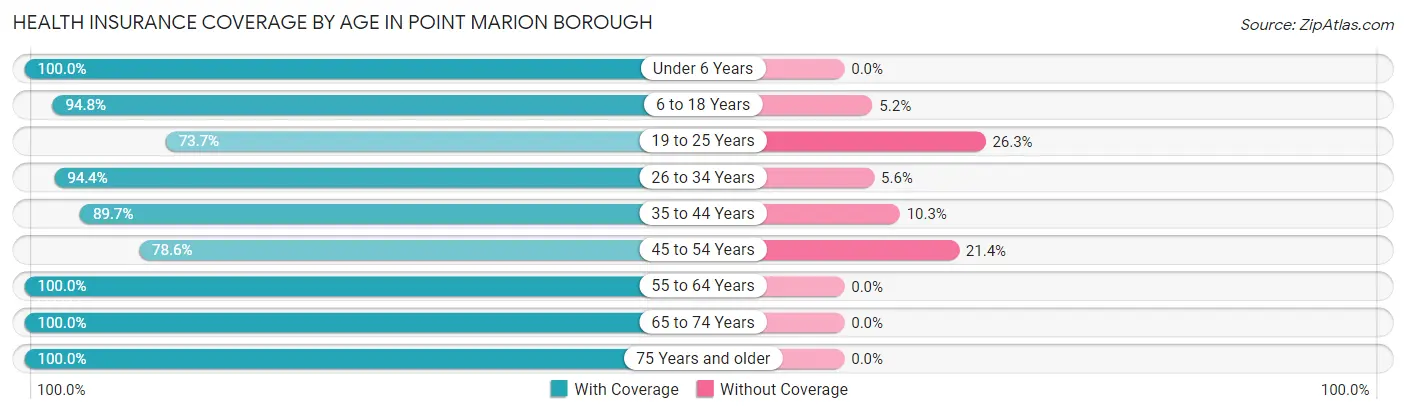
| Age Bracket | With Coverage | Without Coverage |
| Under 6 Years | 92 (100.0%) | 0 (0.0%) |
| 6 to 18 Years | 217 (94.8%) | 12 (5.2%) |
| 19 to 25 Years | 70 (73.7%) | 25 (26.3%) |
| 26 to 34 Years | 170 (94.4%) | 10 (5.6%) |
| 35 to 44 Years | 217 (89.7%) | 25 (10.3%) |
| 45 to 54 Years | 92 (78.6%) | 25 (21.4%) |
| 55 to 64 Years | 137 (100.0%) | 0 (0.0%) |
| 65 to 74 Years | 87 (100.0%) | 0 (0.0%) |
| 75 Years and older | 78 (100.0%) | 0 (0.0%) |
| Total | 1,160 (92.3%) | 97 (7.7%) |
Health Insurance Coverage by Citizenship Status in Point Marion borough
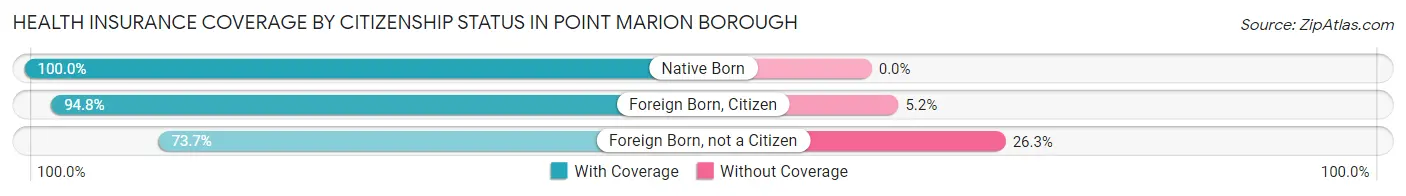
| Citizenship Status | With Coverage | Without Coverage |
| Native Born | 92 (100.0%) | 0 (0.0%) |
| Foreign Born, Citizen | 217 (94.8%) | 12 (5.2%) |
| Foreign Born, not a Citizen | 70 (73.7%) | 25 (26.3%) |
Health Insurance Coverage by Household Income in Point Marion borough
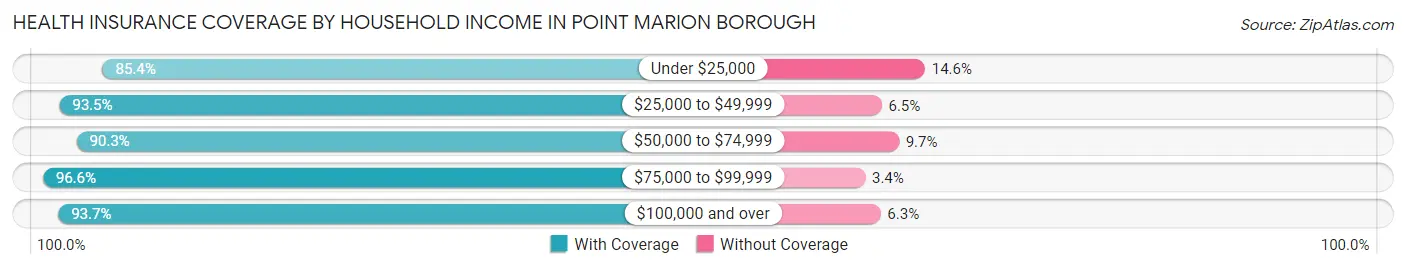
| Household Income | With Coverage | Without Coverage |
| Under $25,000 | 187 (85.4%) | 32 (14.6%) |
| $25,000 to $49,999 | 287 (93.5%) | 20 (6.5%) |
| $50,000 to $74,999 | 195 (90.3%) | 21 (9.7%) |
| $75,000 to $99,999 | 254 (96.6%) | 9 (3.4%) |
| $100,000 and over | 223 (93.7%) | 15 (6.3%) |
Public vs Private Health Insurance Coverage by Age in Point Marion borough
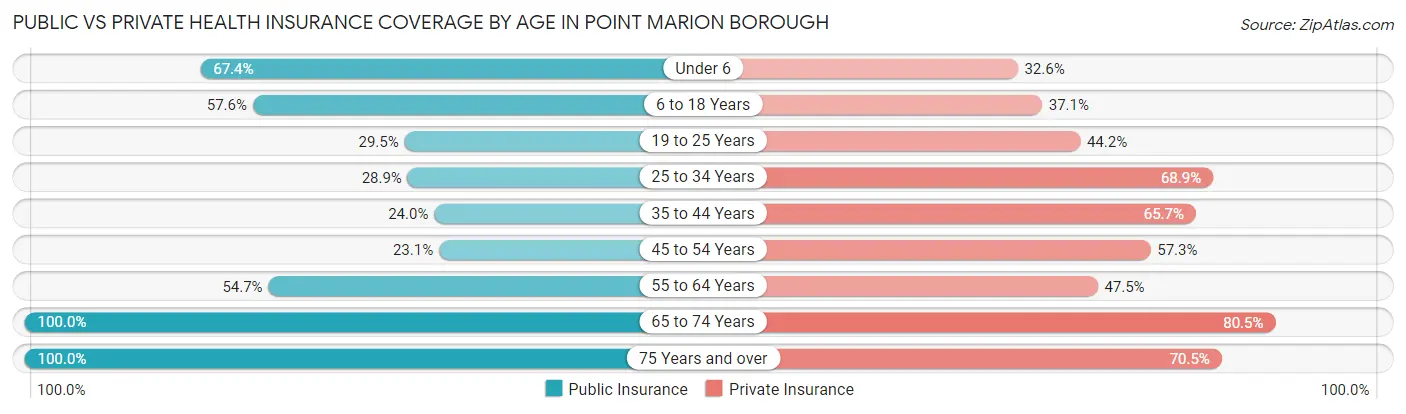
| Age Bracket | Public Insurance | Private Insurance |
| Under 6 | 62 (67.4%) | 30 (32.6%) |
| 6 to 18 Years | 132 (57.6%) | 85 (37.1%) |
| 19 to 25 Years | 28 (29.5%) | 42 (44.2%) |
| 25 to 34 Years | 52 (28.9%) | 124 (68.9%) |
| 35 to 44 Years | 58 (24.0%) | 159 (65.7%) |
| 45 to 54 Years | 27 (23.1%) | 67 (57.3%) |
| 55 to 64 Years | 75 (54.7%) | 65 (47.4%) |
| 65 to 74 Years | 87 (100.0%) | 70 (80.5%) |
| 75 Years and over | 78 (100.0%) | 55 (70.5%) |
| Total | 599 (47.6%) | 697 (55.4%) |
Disability Status by Sex by Age in Point Marion borough
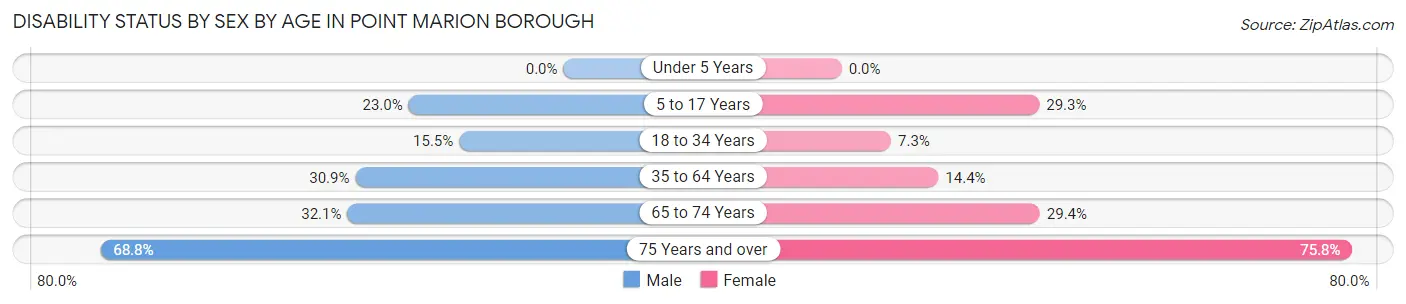
| Age Bracket | Male | Female |
| Under 5 Years | 0 (0.0%) | 0 (0.0%) |
| 5 to 17 Years | 20 (23.0%) | 44 (29.3%) |
| 18 to 34 Years | 24 (15.5%) | 9 (7.3%) |
| 35 to 64 Years | 80 (30.9%) | 34 (14.3%) |
| 65 to 74 Years | 17 (32.1%) | 10 (29.4%) |
| 75 Years and over | 11 (68.8%) | 47 (75.8%) |
Disability Class by Sex by Age in Point Marion borough
Disability Class: Hearing Difficulty
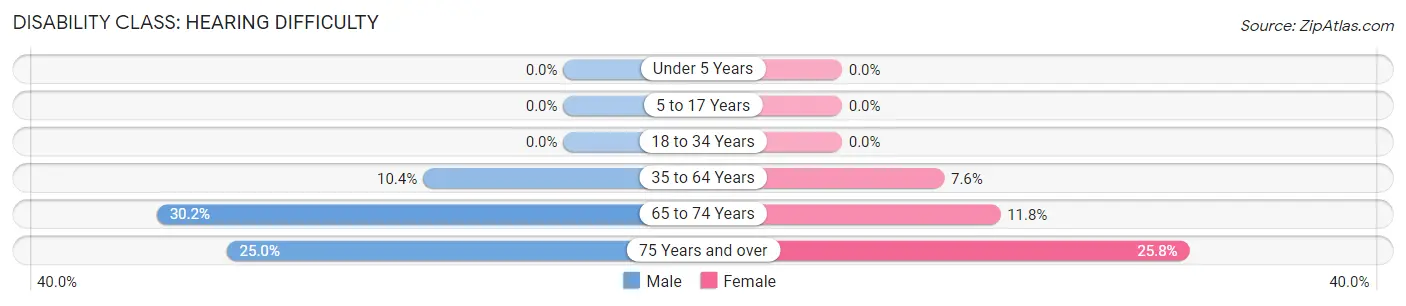
| Age Bracket | Male | Female |
| Under 5 Years | 0 (0.0%) | 0 (0.0%) |
| 5 to 17 Years | 0 (0.0%) | 0 (0.0%) |
| 18 to 34 Years | 0 (0.0%) | 0 (0.0%) |
| 35 to 64 Years | 27 (10.4%) | 18 (7.6%) |
| 65 to 74 Years | 16 (30.2%) | 4 (11.8%) |
| 75 Years and over | 4 (25.0%) | 16 (25.8%) |
Disability Class: Vision Difficulty
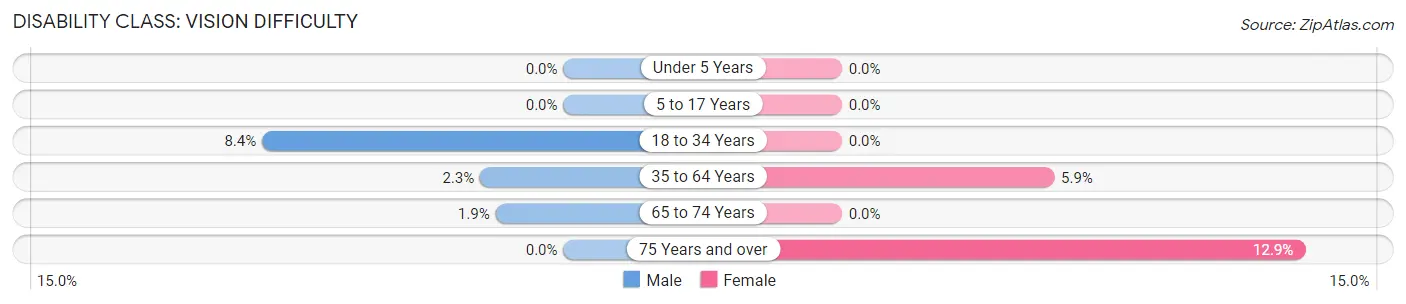
| Age Bracket | Male | Female |
| Under 5 Years | 0 (0.0%) | 0 (0.0%) |
| 5 to 17 Years | 0 (0.0%) | 0 (0.0%) |
| 18 to 34 Years | 13 (8.4%) | 0 (0.0%) |
| 35 to 64 Years | 6 (2.3%) | 14 (5.9%) |
| 65 to 74 Years | 1 (1.9%) | 0 (0.0%) |
| 75 Years and over | 0 (0.0%) | 8 (12.9%) |
Disability Class: Cognitive Difficulty
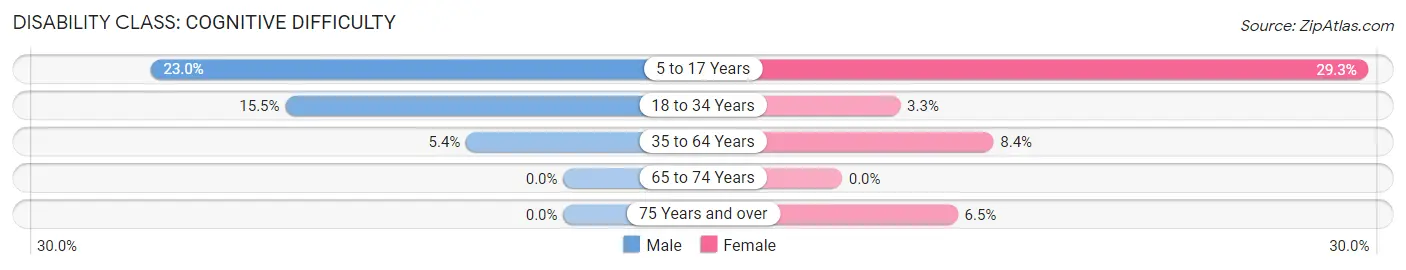
| Age Bracket | Male | Female |
| 5 to 17 Years | 20 (23.0%) | 44 (29.3%) |
| 18 to 34 Years | 24 (15.5%) | 4 (3.3%) |
| 35 to 64 Years | 14 (5.4%) | 20 (8.4%) |
| 65 to 74 Years | 0 (0.0%) | 0 (0.0%) |
| 75 Years and over | 0 (0.0%) | 4 (6.5%) |
Disability Class: Ambulatory Difficulty
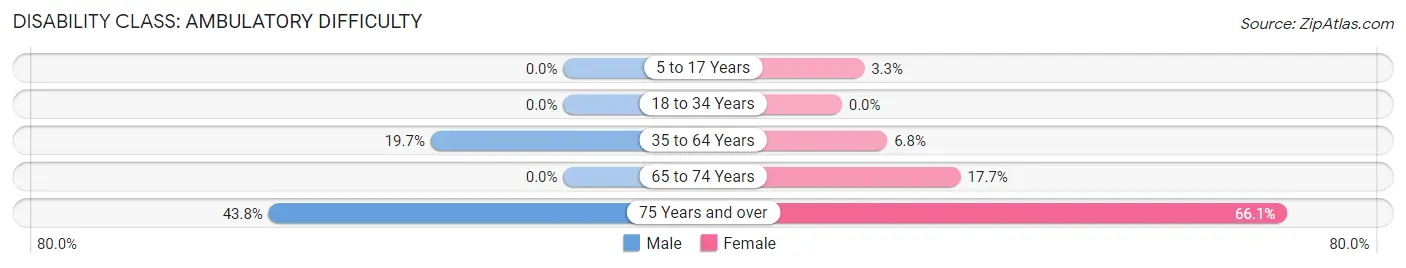
| Age Bracket | Male | Female |
| 5 to 17 Years | 0 (0.0%) | 5 (3.3%) |
| 18 to 34 Years | 0 (0.0%) | 0 (0.0%) |
| 35 to 64 Years | 51 (19.7%) | 16 (6.8%) |
| 65 to 74 Years | 0 (0.0%) | 6 (17.6%) |
| 75 Years and over | 7 (43.8%) | 41 (66.1%) |
Disability Class: Self-Care Difficulty
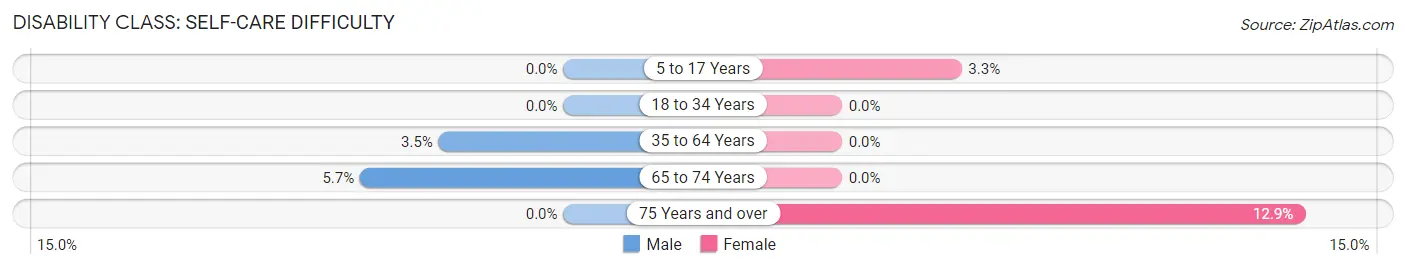
| Age Bracket | Male | Female |
| 5 to 17 Years | 0 (0.0%) | 5 (3.3%) |
| 18 to 34 Years | 0 (0.0%) | 0 (0.0%) |
| 35 to 64 Years | 9 (3.5%) | 0 (0.0%) |
| 65 to 74 Years | 3 (5.7%) | 0 (0.0%) |
| 75 Years and over | 0 (0.0%) | 8 (12.9%) |
Technology Access in Point Marion borough
Computing Device Access in Point Marion borough
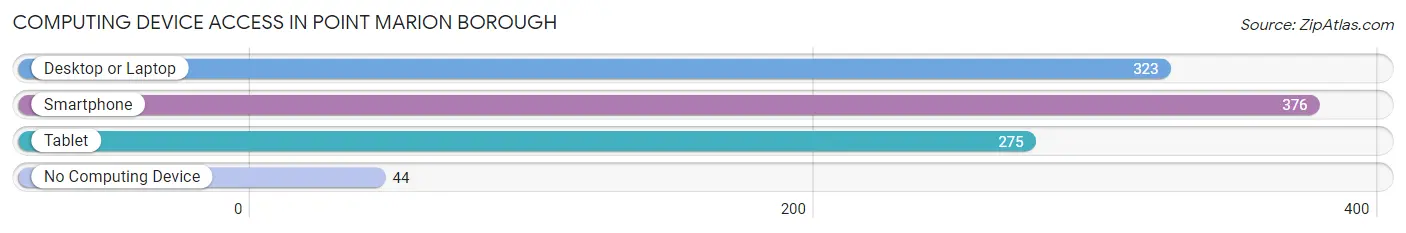
| Device Type | # Households | % Households |
| Desktop or Laptop | 323 | 70.8% |
| Smartphone | 376 | 82.5% |
| Tablet | 275 | 60.3% |
| No Computing Device | 44 | 9.7% |
| Total | 456 | 100.0% |
Internet Access in Point Marion borough
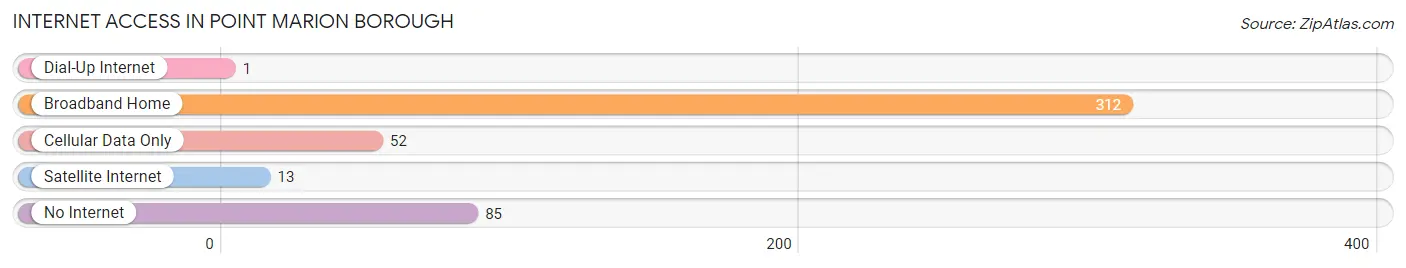
| Internet Type | # Households | % Households |
| Dial-Up Internet | 1 | 0.2% |
| Broadband Home | 312 | 68.4% |
| Cellular Data Only | 52 | 11.4% |
| Satellite Internet | 13 | 2.9% |
| No Internet | 85 | 18.6% |
| Total | 456 | 100.0% |
Point Marion borough Summary
Introduction
Point Marion Borough is a small borough located in Fayette County, Pennsylvania. It is situated along the Monongahela River, approximately 40 miles south of Pittsburgh. The borough was incorporated in 1891 and has a population of 1,541 as of the 2010 census. The borough is home to a variety of businesses, including a coal mine, a power plant, and a variety of small businesses.
History
The area that is now Point Marion Borough was first settled in the late 1700s by a group of German immigrants. The area was originally known as “Point Marion” due to its location at the confluence of the Monongahela and Cheat Rivers. The area was officially incorporated as a borough in 1891.
In the late 1800s, the area was a major coal mining center. The coal industry was the primary source of employment for the residents of Point Marion. The coal industry declined in the early 1900s, and the borough began to diversify its economy.
In the early 1900s, the borough was home to a variety of small businesses, including a sawmill, a grist mill, a brickyard, and a tannery. The borough also had a variety of stores, including a general store, a drug store, and a hardware store.
In the mid-1900s, the borough was home to a power plant, which provided electricity to the area. The power plant was closed in the late 1990s, and the borough has since diversified its economy.
Geography
Point Marion Borough is located in Fayette County, Pennsylvania. It is situated along the Monongahela River, approximately 40 miles south of Pittsburgh. The borough is bordered by the townships of German, Wharton, and Nicholson.
The borough has a total area of 0.7 square miles, all of which is land. The borough is located in a hilly region, with elevations ranging from 1,000 to 1,500 feet above sea level.
Economy
The economy of Point Marion Borough is largely based on small businesses. The borough is home to a variety of businesses, including a coal mine, a power plant, and a variety of small businesses.
The borough is also home to a variety of manufacturing businesses, including a furniture factory, a metal fabrication plant, and a printing company. The borough also has a variety of retail stores, including a grocery store, a hardware store, and a variety of specialty shops.
Demographics
As of the 2010 census, the population of Point Marion Borough was 1,541. The racial makeup of the borough was 97.3% White, 0.9% African American, 0.2% Native American, 0.2% Asian, and 1.4% from other races.
The median household income in the borough was $31,250, and the median family income was $37,500. The per capita income in the borough was $17,845. Approximately 11.3% of the population was below the poverty line.
Conclusion
Point Marion Borough is a small borough located in Fayette County, Pennsylvania. It is situated along the Monongahela River, approximately 40 miles south of Pittsburgh. The borough was incorporated in 1891 and has a population of 1,541 as of the 2010 census. The borough is home to a variety of businesses, including a coal mine, a power plant, and a variety of small businesses. The economy of Point Marion Borough is largely based on small businesses, and the borough has a median household income of $31,250.
Common Questions
What is Per Capita Income in Point Marion borough?
Per Capita income in Point Marion borough is $22,682.
What is the Median Family Income in Point Marion borough?
Median Family Income in Point Marion borough is $61,979.
What is the Median Household income in Point Marion borough?
Median Household Income in Point Marion borough is $47,500.
What is Income or Wage Gap in Point Marion borough?
Income or Wage Gap in Point Marion borough is 32.2%.
Women in Point Marion borough earn 67.8 cents for every dollar earned by a man.
What is Family Income Deficit in Point Marion borough?
Family Income Deficit in Point Marion borough is $6,653.
Families that are below poverty line in Point Marion borough earn $6,653 less on average than the poverty threshold level.
What is Inequality or Gini Index in Point Marion borough?
Inequality or Gini Index in Point Marion borough is 0.42.
What is the Total Population of Point Marion borough?
Total Population of Point Marion borough is 1,276.
What is the Total Male Population of Point Marion borough?
Total Male Population of Point Marion borough is 628.
What is the Total Female Population of Point Marion borough?
Total Female Population of Point Marion borough is 648.
What is the Ratio of Males per 100 Females in Point Marion borough?
There are 96.91 Males per 100 Females in Point Marion borough.
What is the Ratio of Females per 100 Males in Point Marion borough?
There are 103.18 Females per 100 Males in Point Marion borough.
What is the Median Population Age in Point Marion borough?
Median Population Age in Point Marion borough is 36.6 Years.
What is the Average Family Size in Point Marion borough
Average Family Size in Point Marion borough is 3.5 People.
What is the Average Household Size in Point Marion borough
Average Household Size in Point Marion borough is 2.7 People.
How Large is the Labor Force in Point Marion borough?
There are 641 People in the Labor Forcein in Point Marion borough.
What is the Percentage of People in the Labor Force in Point Marion borough?
64.8% of People are in the Labor Force in Point Marion borough.
What is the Unemployment Rate in Point Marion borough?
Unemployment Rate in Point Marion borough is 5.8%.