Hawthorn borough, PA Map & Demographics
Hawthorn borough Overview
$23,570
PER CAPITA INCOME
$57,917
AVG FAMILY INCOME
$43,929
AVG HOUSEHOLD INCOME
47.8%
WAGE / INCOME GAP [ % ]
52.2¢/ $1
WAGE / INCOME GAP [ $ ]
0.40
INEQUALITY / GINI INDEX
480
TOTAL POPULATION
231
MALE POPULATION
249
FEMALE POPULATION
92.77
MALES / 100 FEMALES
107.79
FEMALES / 100 MALES
45.1
MEDIAN AGE
3.0
AVG FAMILY SIZE
2.5
AVG HOUSEHOLD SIZE
224
LABOR FORCE [ PEOPLE ]
57.1%
PERCENT IN LABOR FORCE
9.1%
UNEMPLOYMENT RATE
Income in Hawthorn borough
Income Overview in Hawthorn borough
Per Capita Income in Hawthorn borough is $23,570, while median incomes of families and households are $57,917 and $43,929 respectively.
| Characteristic | Number | Measure |
| Per Capita Income | 480 | $23,570 |
| Median Family Income | 128 | $57,917 |
| Mean Family Income | 128 | $69,643 |
| Median Household Income | 196 | $43,929 |
| Mean Household Income | 196 | $56,265 |
| Income Deficit | 128 | $0 |
| Wage / Income Gap (%) | 480 | 47.81% |
| Wage / Income Gap ($) | 480 | 52.19¢ per $1 |
| Gini / Inequality Index | 480 | 0.40 |
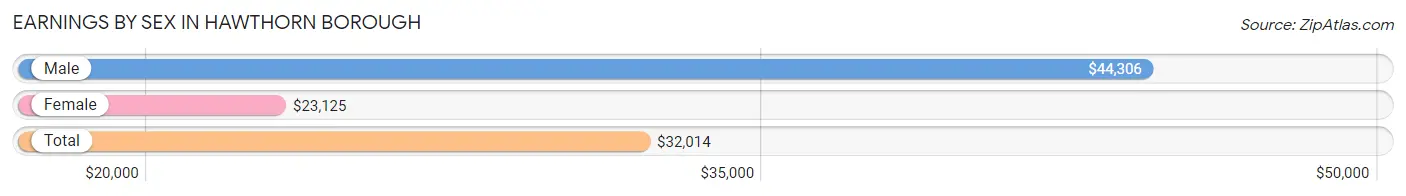
Earnings by Sex in Hawthorn borough
Average Earnings in Hawthorn borough are $32,014, $44,306 for men and $23,125 for women, a difference of 47.8%.
| Sex | Number | Average Earnings |
| Male | 121 (52.8%) | $44,306 |
| Female | 108 (47.2%) | $23,125 |
| Total | 229 (100.0%) | $32,014 |
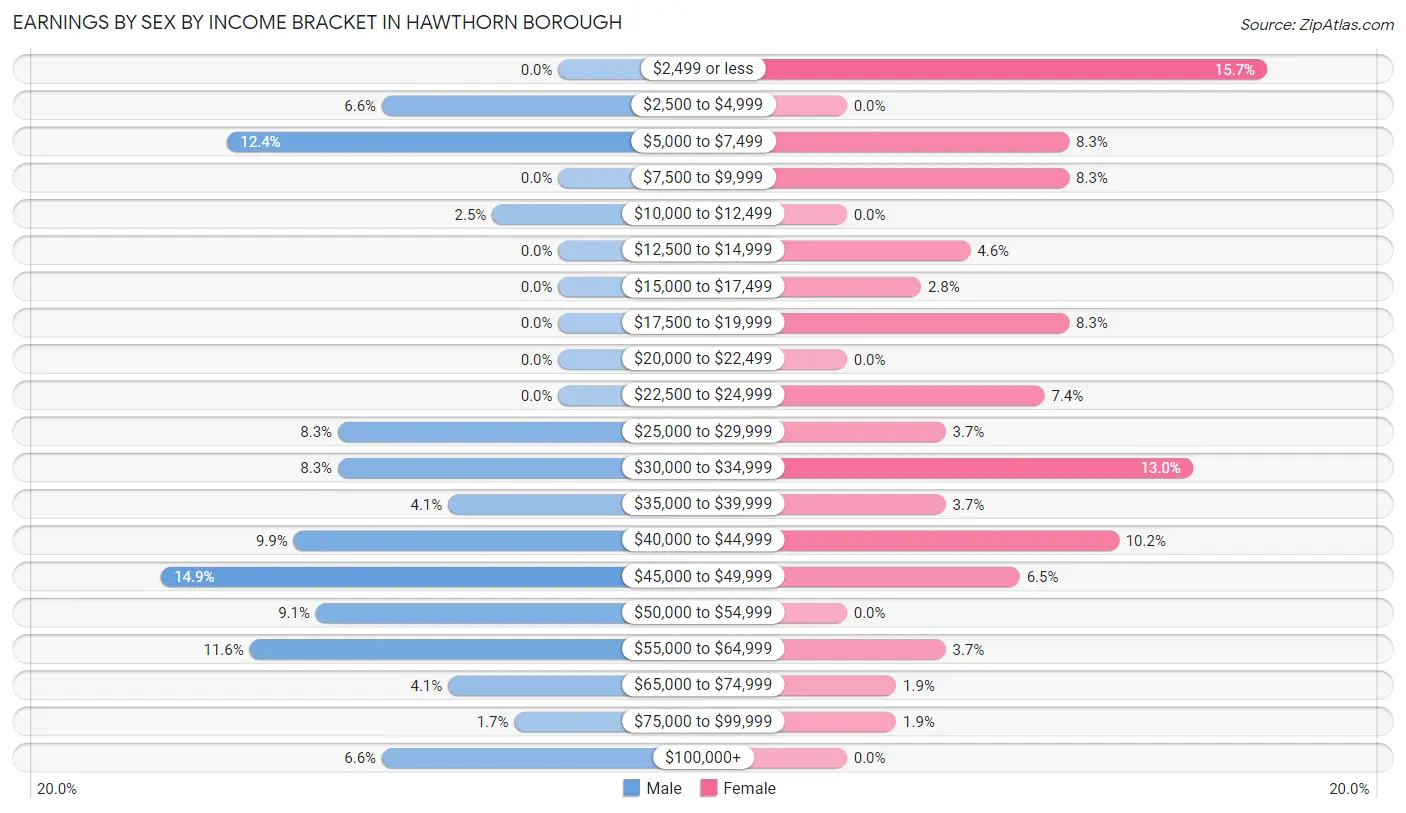
Earnings by Sex by Income Bracket in Hawthorn borough
The most common earnings brackets in Hawthorn borough are $45,000 to $49,999 for men (18 | 14.9%) and $2,499 or less for women (17 | 15.7%).
| Income | Male | Female |
| $2,499 or less | 0 (0.0%) | 17 (15.7%) |
| $2,500 to $4,999 | 8 (6.6%) | 0 (0.0%) |
| $5,000 to $7,499 | 15 (12.4%) | 9 (8.3%) |
| $7,500 to $9,999 | 0 (0.0%) | 9 (8.3%) |
| $10,000 to $12,499 | 3 (2.5%) | 0 (0.0%) |
| $12,500 to $14,999 | 0 (0.0%) | 5 (4.6%) |
| $15,000 to $17,499 | 0 (0.0%) | 3 (2.8%) |
| $17,500 to $19,999 | 0 (0.0%) | 9 (8.3%) |
| $20,000 to $22,499 | 0 (0.0%) | 0 (0.0%) |
| $22,500 to $24,999 | 0 (0.0%) | 8 (7.4%) |
| $25,000 to $29,999 | 10 (8.3%) | 4 (3.7%) |
| $30,000 to $34,999 | 10 (8.3%) | 14 (13.0%) |
| $35,000 to $39,999 | 5 (4.1%) | 4 (3.7%) |
| $40,000 to $44,999 | 12 (9.9%) | 11 (10.2%) |
| $45,000 to $49,999 | 18 (14.9%) | 7 (6.5%) |
| $50,000 to $54,999 | 11 (9.1%) | 0 (0.0%) |
| $55,000 to $64,999 | 14 (11.6%) | 4 (3.7%) |
| $65,000 to $74,999 | 5 (4.1%) | 2 (1.8%) |
| $75,000 to $99,999 | 2 (1.7%) | 2 (1.8%) |
| $100,000+ | 8 (6.6%) | 0 (0.0%) |
| Total | 121 (100.0%) | 108 (100.0%) |
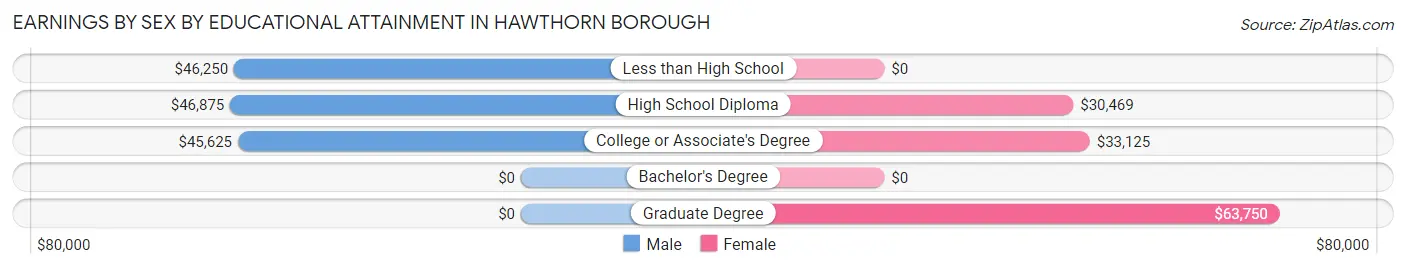
Earnings by Sex by Educational Attainment in Hawthorn borough
Average earnings in Hawthorn borough are $46,094 for men and $29,583 for women, a difference of 35.8%. Men with an educational attainment of high school diploma enjoy the highest average annual earnings of $46,875, while those with college or associate's degree education earn the least with $45,625. Women with an educational attainment of graduate degree earn the most with the average annual earnings of $63,750, while those with high school diploma education have the smallest earnings of $30,469.
| Educational Attainment | Male Income | Female Income |
| Less than High School | $46,250 | $0 |
| High School Diploma | $46,875 | $30,469 |
| College or Associate's Degree | $45,625 | $33,125 |
| Bachelor's Degree | - | - |
| Graduate Degree | - | - |
| Total | $46,094 | $29,583 |
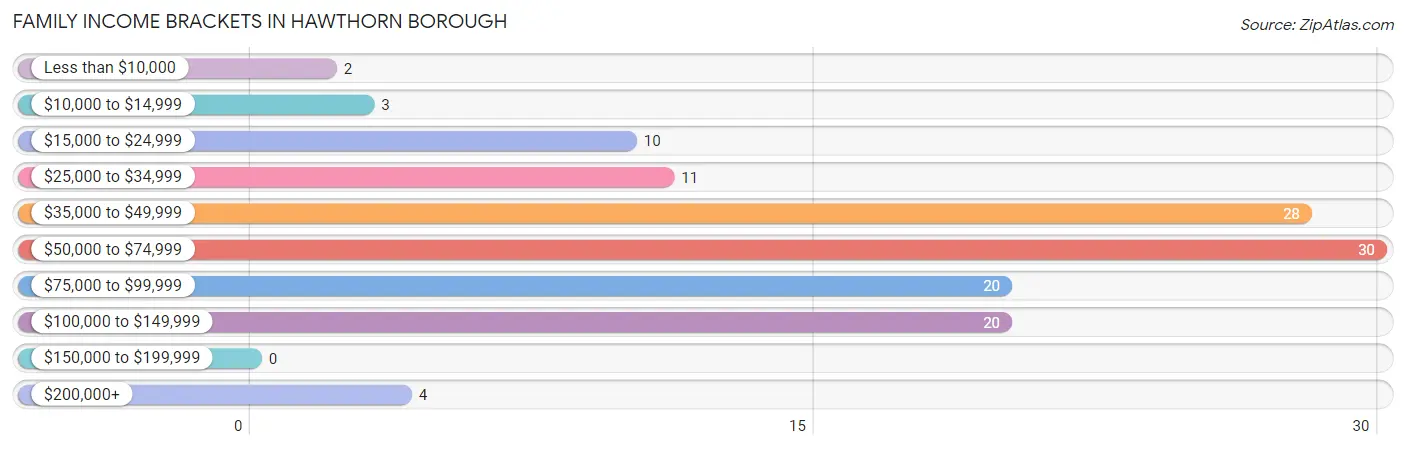
Family Income in Hawthorn borough
Family Income Brackets in Hawthorn borough
According to the Hawthorn borough family income data, there are 30 families falling into the $50,000 to $74,999 income range, which is the most common income bracket and makes up 23.4% of all families.
| Income Bracket | # Families | % Families |
| Less than $10,000 | 2 | 1.6% |
| $10,000 to $14,999 | 3 | 2.3% |
| $15,000 to $24,999 | 10 | 7.8% |
| $25,000 to $34,999 | 11 | 8.6% |
| $35,000 to $49,999 | 28 | 21.9% |
| $50,000 to $74,999 | 30 | 23.4% |
| $75,000 to $99,999 | 20 | 15.6% |
| $100,000 to $149,999 | 20 | 15.6% |
| $150,000 to $199,999 | 0 | 0.0% |
| $200,000+ | 4 | 3.1% |
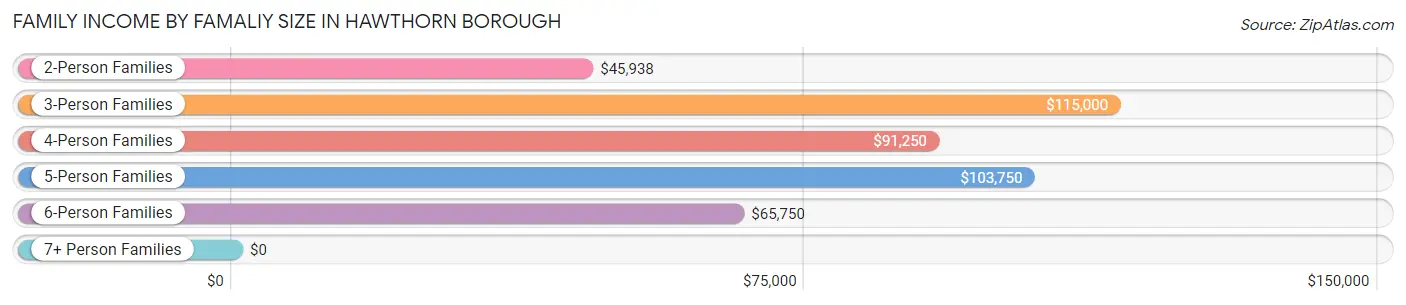
Family Income by Famaliy Size in Hawthorn borough
3-person families (20 | 15.6%) account for the highest median family income in Hawthorn borough with $115,000 per family, while 3-person families (20 | 15.6%) have the highest median income of $38,333 per family member.
| Income Bracket | # Families | Median Income |
| 2-Person Families | 77 (60.2%) | $45,938 |
| 3-Person Families | 20 (15.6%) | $115,000 |
| 4-Person Families | 16 (12.5%) | $91,250 |
| 5-Person Families | 4 (3.1%) | $103,750 |
| 6-Person Families | 11 (8.6%) | $65,750 |
| 7+ Person Families | 0 (0.0%) | $0 |
| Total | 128 (100.0%) | $57,917 |
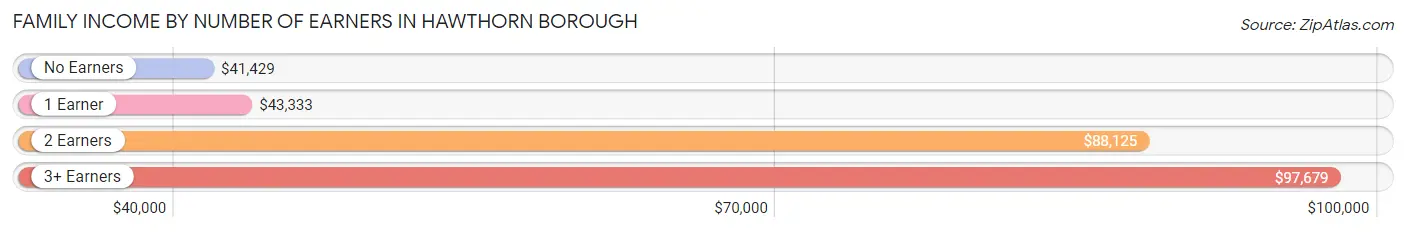
Family Income by Number of Earners in Hawthorn borough
The median family income in Hawthorn borough is $57,917, with families comprising 3+ earners (19) having the highest median family income of $97,679, while families with no earners (34) have the lowest median family income of $41,429, accounting for 14.8% and 26.6% of families, respectively.
| Number of Earners | # Families | Median Income |
| No Earners | 34 (26.6%) | $41,429 |
| 1 Earner | 38 (29.7%) | $43,333 |
| 2 Earners | 37 (28.9%) | $88,125 |
| 3+ Earners | 19 (14.8%) | $97,679 |
| Total | 128 (100.0%) | $57,917 |
Household Income in Hawthorn borough
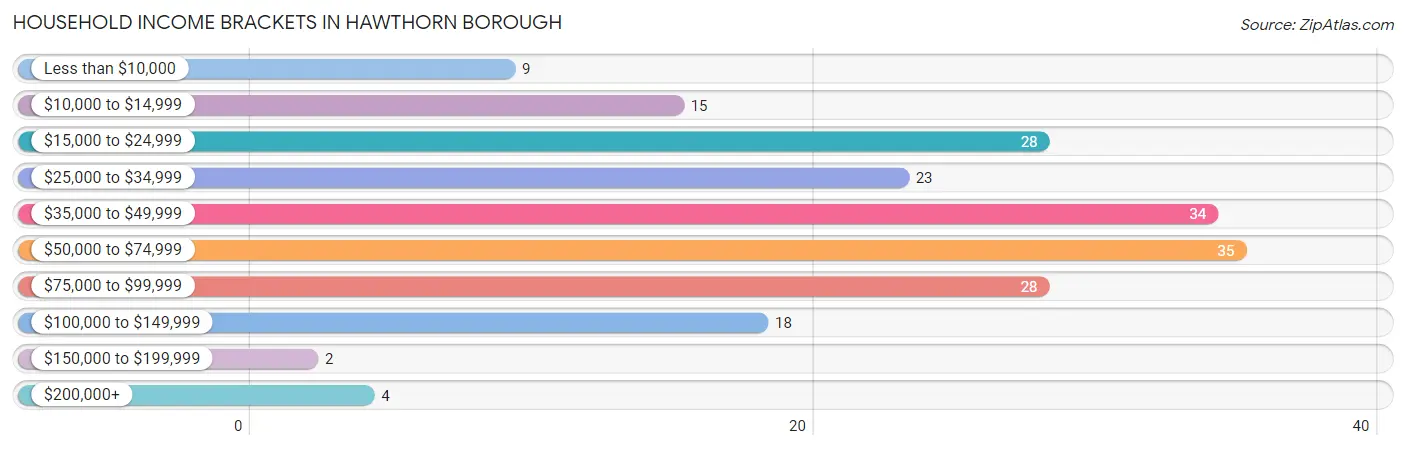
Household Income Brackets in Hawthorn borough
With 35 households falling in the category, the $50,000 to $74,999 income range is the most frequent in Hawthorn borough, accounting for 17.9% of all households. In contrast, only 2 households (1.0%) fall into the $150,000 to $199,999 income bracket, making it the least populous group.
| Income Bracket | # Households | % Households |
| Less than $10,000 | 9 | 4.6% |
| $10,000 to $14,999 | 15 | 7.7% |
| $15,000 to $24,999 | 28 | 14.3% |
| $25,000 to $34,999 | 23 | 11.7% |
| $35,000 to $49,999 | 34 | 17.3% |
| $50,000 to $74,999 | 35 | 17.9% |
| $75,000 to $99,999 | 28 | 14.3% |
| $100,000 to $149,999 | 18 | 9.2% |
| $150,000 to $199,999 | 2 | 1.0% |
| $200,000+ | 4 | 2.0% |
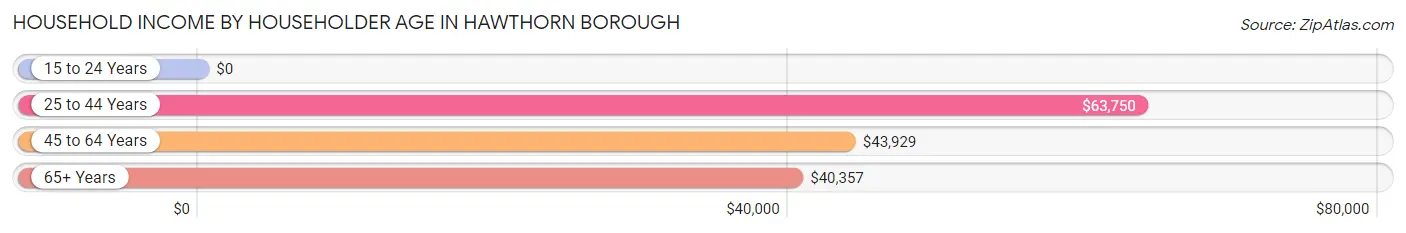
Household Income by Householder Age in Hawthorn borough
The median household income in Hawthorn borough is $43,929, with the highest median household income of $63,750 found in the 25 to 44 years age bracket for the primary householder. A total of 42 households (21.4%) fall into this category. Meanwhile, the 15 to 24 years age bracket for the primary householder has the lowest median household income of $0, with 2 households (1.0%) in this group.
| Income Bracket | # Households | Median Income |
| 15 to 24 Years | 2 (1.0%) | $0 |
| 25 to 44 Years | 42 (21.4%) | $63,750 |
| 45 to 64 Years | 80 (40.8%) | $43,929 |
| 65+ Years | 72 (36.7%) | $40,357 |
| Total | 196 (100.0%) | $43,929 |
Poverty in Hawthorn borough
Income Below Poverty by Sex and Age in Hawthorn borough
With 3.9% poverty level for males and 12.4% for females among the residents of Hawthorn borough, 25 to 34 year old males and 55 to 64 year old females are the most vulnerable to poverty, with 4 males (9.8%) and 16 females (48.5%) in their respective age groups living below the poverty level.
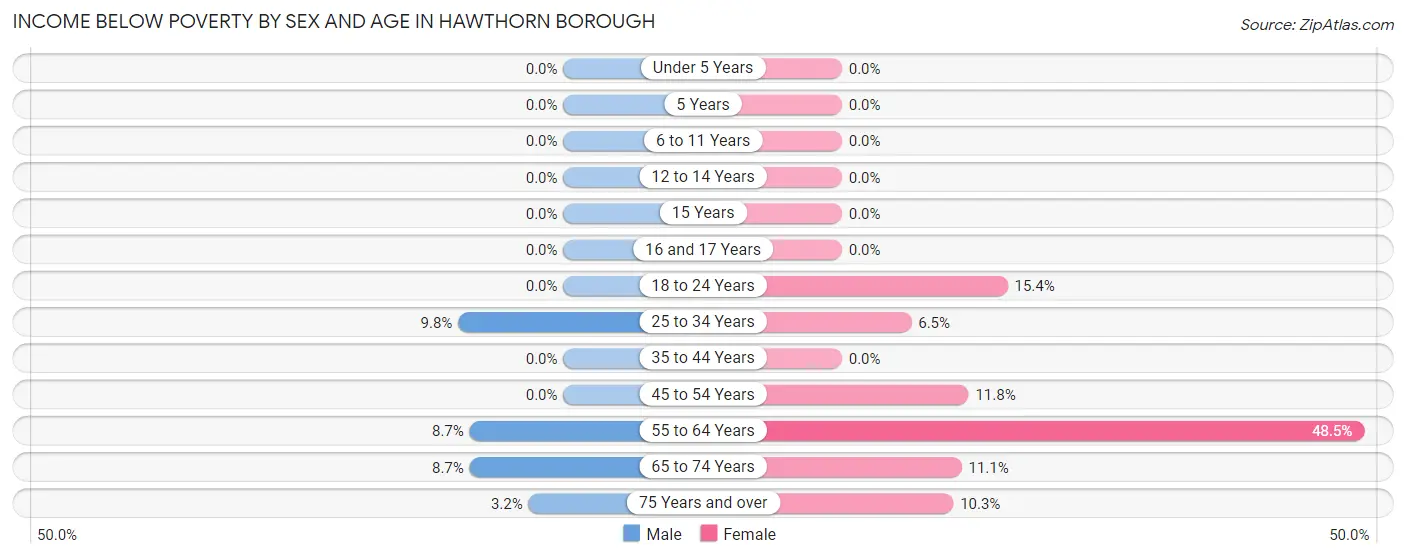
| Age Bracket | Male | Female |
| Under 5 Years | 0 (0.0%) | 0 (0.0%) |
| 5 Years | 0 (0.0%) | 0 (0.0%) |
| 6 to 11 Years | 0 (0.0%) | 0 (0.0%) |
| 12 to 14 Years | 0 (0.0%) | 0 (0.0%) |
| 15 Years | 0 (0.0%) | 0 (0.0%) |
| 16 and 17 Years | 0 (0.0%) | 0 (0.0%) |
| 18 to 24 Years | 0 (0.0%) | 2 (15.4%) |
| 25 to 34 Years | 4 (9.8%) | 2 (6.5%) |
| 35 to 44 Years | 0 (0.0%) | 0 (0.0%) |
| 45 to 54 Years | 0 (0.0%) | 4 (11.8%) |
| 55 to 64 Years | 2 (8.7%) | 16 (48.5%) |
| 65 to 74 Years | 2 (8.7%) | 4 (11.1%) |
| 75 Years and over | 1 (3.2%) | 3 (10.3%) |
| Total | 9 (3.9%) | 31 (12.4%) |
Income Above Poverty by Sex and Age in Hawthorn borough
According to the poverty statistics in Hawthorn borough, males aged under 5 years and females aged under 5 years are the age groups that are most secure financially, with 100.0% of males and 100.0% of females in these age groups living above the poverty line.
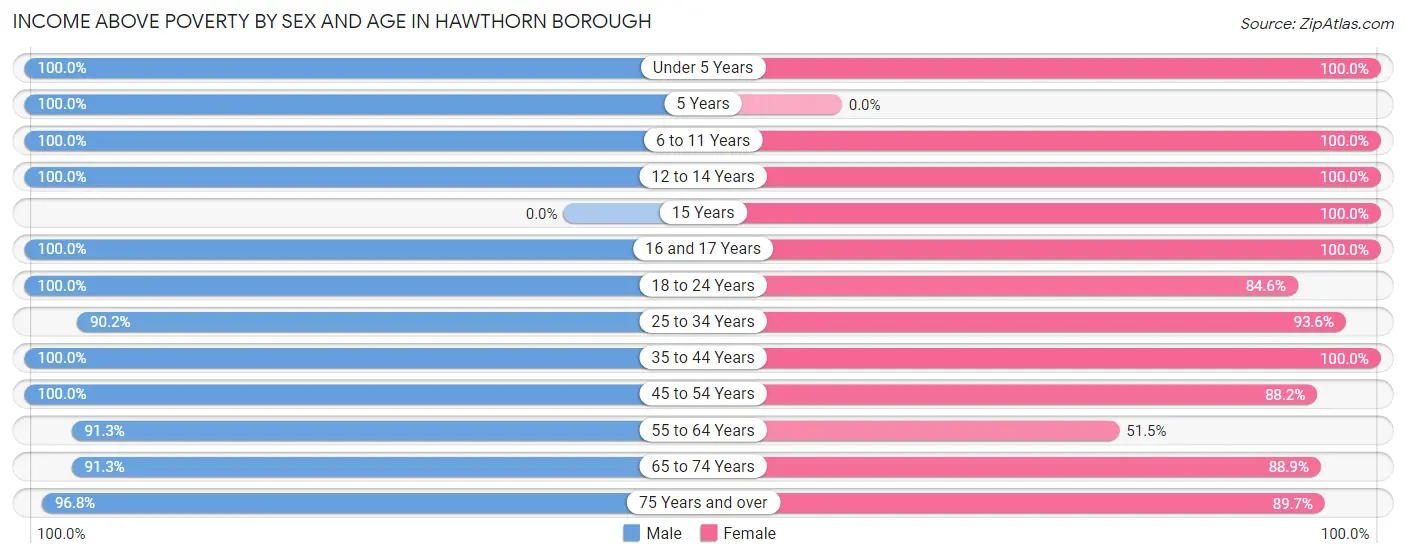
| Age Bracket | Male | Female |
| Under 5 Years | 23 (100.0%) | 11 (100.0%) |
| 5 Years | 6 (100.0%) | 0 (0.0%) |
| 6 to 11 Years | 9 (100.0%) | 24 (100.0%) |
| 12 to 14 Years | 7 (100.0%) | 6 (100.0%) |
| 15 Years | 0 (0.0%) | 2 (100.0%) |
| 16 and 17 Years | 5 (100.0%) | 11 (100.0%) |
| 18 to 24 Years | 7 (100.0%) | 11 (84.6%) |
| 25 to 34 Years | 37 (90.2%) | 29 (93.5%) |
| 35 to 44 Years | 24 (100.0%) | 19 (100.0%) |
| 45 to 54 Years | 32 (100.0%) | 30 (88.2%) |
| 55 to 64 Years | 21 (91.3%) | 17 (51.5%) |
| 65 to 74 Years | 21 (91.3%) | 32 (88.9%) |
| 75 Years and over | 30 (96.8%) | 26 (89.7%) |
| Total | 222 (96.1%) | 218 (87.5%) |
Income Below Poverty Among Married-Couple Families in Hawthorn borough
The poverty statistics for married-couple families in Hawthorn borough show that 3.2% or 3 of the total 95 families live below the poverty line. Families with no children have the highest poverty rate of 4.4%, comprising of 3 families. On the other hand, families with 1 or 2 children have the lowest poverty rate of 0.0%, which includes 0 families.
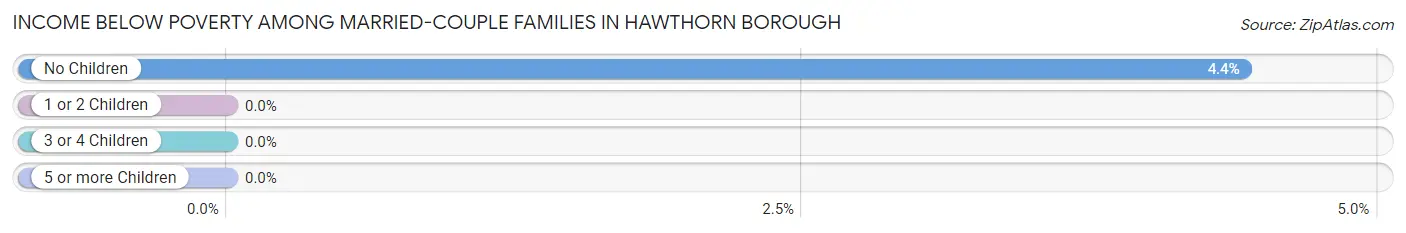
| Children | Above Poverty | Below Poverty |
| No Children | 65 (95.6%) | 3 (4.4%) |
| 1 or 2 Children | 16 (100.0%) | 0 (0.0%) |
| 3 or 4 Children | 11 (100.0%) | 0 (0.0%) |
| 5 or more Children | 0 (0.0%) | 0 (0.0%) |
| Total | 92 (96.8%) | 3 (3.2%) |
Income Below Poverty Among Single-Parent Households in Hawthorn borough
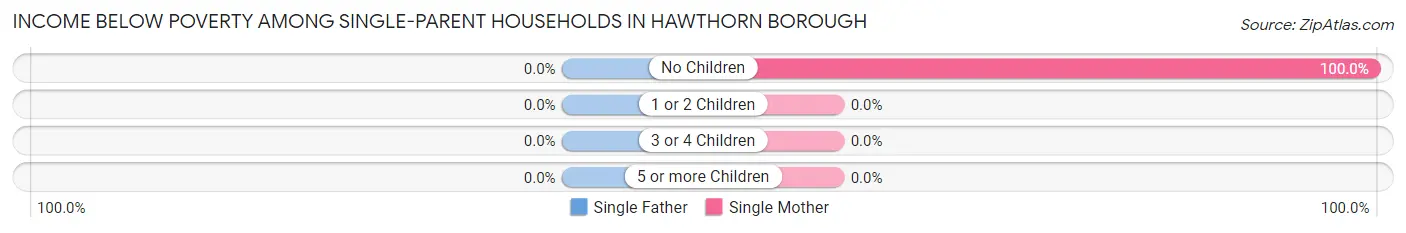
| Children | Single Father | Single Mother |
| No Children | 0 (0.0%) | 2 (100.0%) |
| 1 or 2 Children | 0 (0.0%) | 0 (0.0%) |
| 3 or 4 Children | 0 (0.0%) | 0 (0.0%) |
| 5 or more Children | 0 (0.0%) | 0 (0.0%) |
| Total | 0 (0.0%) | 2 (10.5%) |
Income Below Poverty Among Married-Couple vs Single-Parent Households in Hawthorn borough
The poverty data for Hawthorn borough shows that 3 of the married-couple family households (3.2%) and 2 of the single-parent households (6.1%) are living below the poverty level. Within the married-couple family households, those with no children have the highest poverty rate, with 3 households (4.4%) falling below the poverty line. Among the single-parent households, those with no children have the highest poverty rate, with 2 household (50.0%) living below poverty.
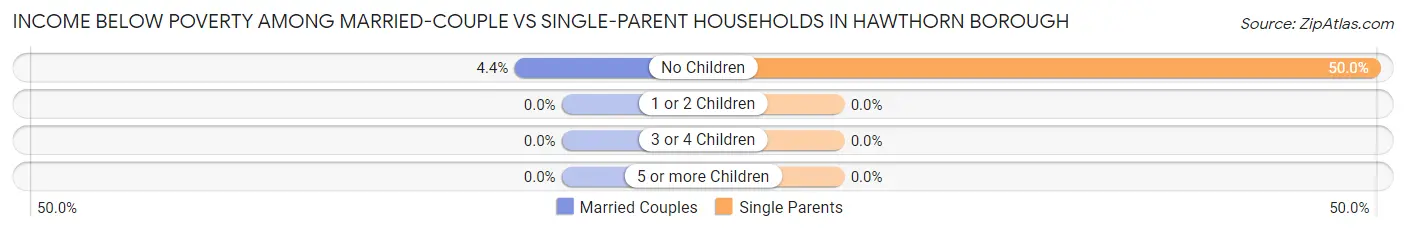
| Children | Married-Couple Families | Single-Parent Households |
| No Children | 3 (4.4%) | 2 (50.0%) |
| 1 or 2 Children | 0 (0.0%) | 0 (0.0%) |
| 3 or 4 Children | 0 (0.0%) | 0 (0.0%) |
| 5 or more Children | 0 (0.0%) | 0 (0.0%) |
| Total | 3 (3.2%) | 2 (6.1%) |
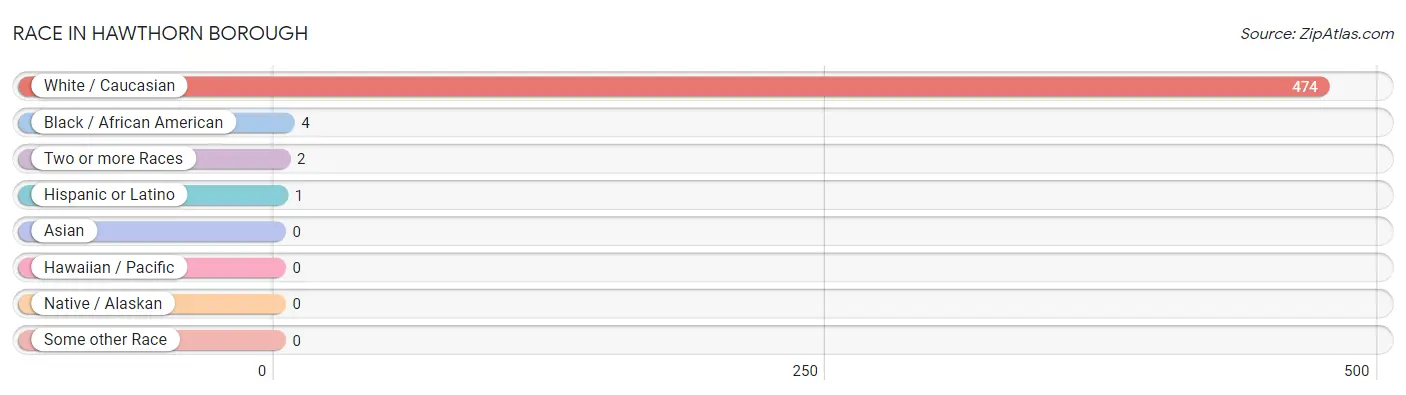
Race in Hawthorn borough
The most populous races in Hawthorn borough are White / Caucasian (474 | 98.8%), Black / African American (4 | 0.8%), and Two or more Races (2 | 0.4%).
| Race | # Population | % Population |
| Asian | 0 | 0.0% |
| Black / African American | 4 | 0.8% |
| Hawaiian / Pacific | 0 | 0.0% |
| Hispanic or Latino | 1 | 0.2% |
| Native / Alaskan | 0 | 0.0% |
| White / Caucasian | 474 | 98.8% |
| Two or more Races | 2 | 0.4% |
| Some other Race | 0 | 0.0% |
| Total | 480 | 100.0% |
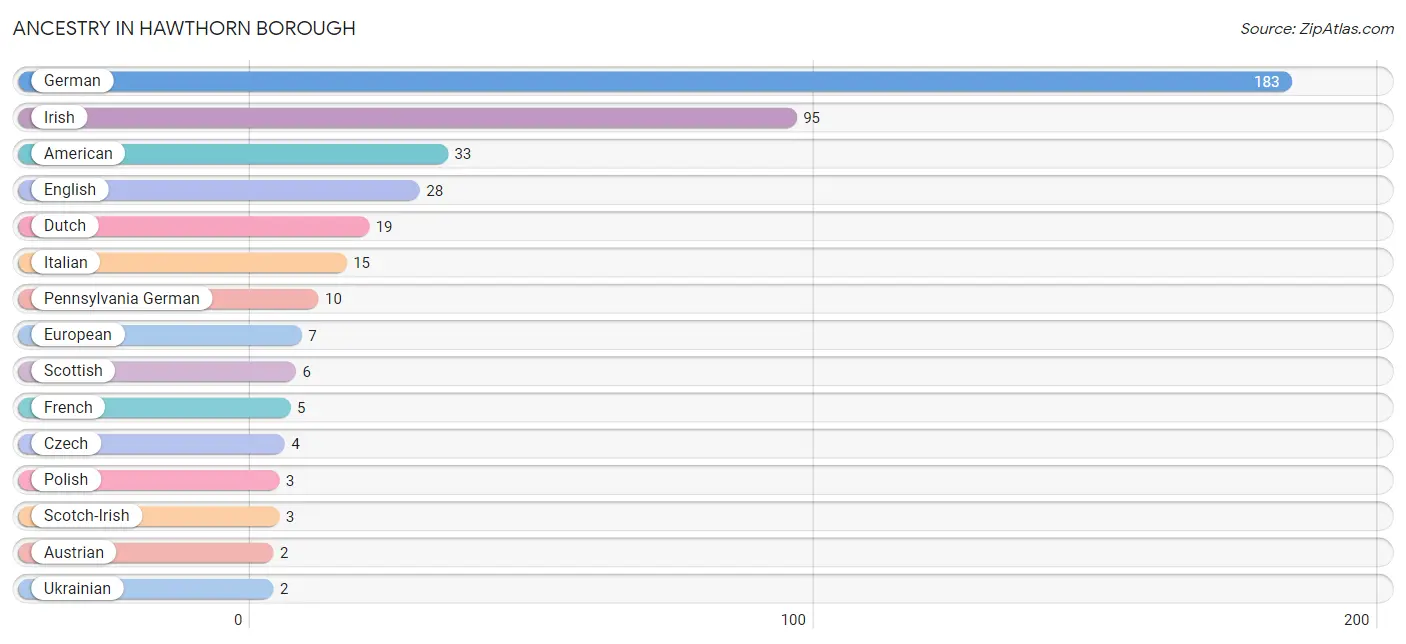
Ancestry in Hawthorn borough
The most populous ancestries reported in Hawthorn borough are German (183 | 38.1%), Irish (95 | 19.8%), American (33 | 6.9%), English (28 | 5.8%), and Dutch (19 | 4.0%), together accounting for 74.6% of all Hawthorn borough residents.
| Ancestry | # Population | % Population |
| American | 33 | 6.9% |
| Austrian | 2 | 0.4% |
| Blackfeet | 1 | 0.2% |
| Central American Indian | 1 | 0.2% |
| Czech | 4 | 0.8% |
| Dutch | 19 | 4.0% |
| English | 28 | 5.8% |
| European | 7 | 1.5% |
| French | 5 | 1.0% |
| German | 183 | 38.1% |
| Hungarian | 1 | 0.2% |
| Irish | 95 | 19.8% |
| Italian | 15 | 3.1% |
| Pennsylvania German | 10 | 2.1% |
| Polish | 3 | 0.6% |
| Puerto Rican | 1 | 0.2% |
| Scotch-Irish | 3 | 0.6% |
| Scottish | 6 | 1.3% |
| Shoshone | 1 | 0.2% |
| Ukrainian | 2 | 0.4% |
| West Indian | 1 | 0.2% | View All 21 Rows |
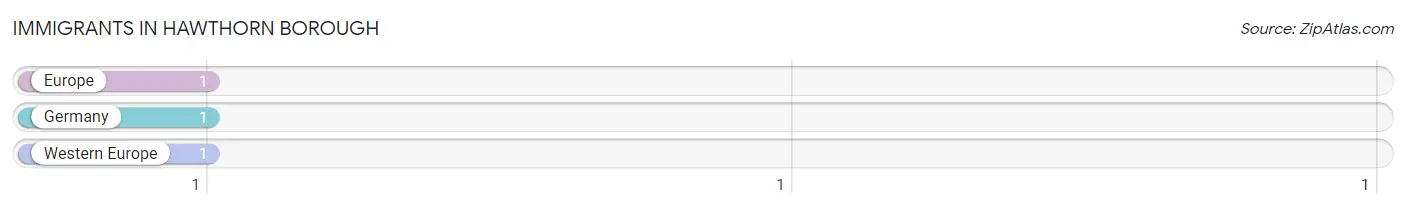
Immigrants in Hawthorn borough
The most numerous immigrant groups reported in Hawthorn borough came from Europe (1 | 0.2%), Germany (1 | 0.2%), and Western Europe (1 | 0.2%), together accounting for 0.6% of all Hawthorn borough residents.
| Immigration Origin | # Population | % Population |
| Europe | 1 | 0.2% |
| Germany | 1 | 0.2% |
| Western Europe | 1 | 0.2% | View All 3 Rows |
Sex and Age in Hawthorn borough
Sex and Age in Hawthorn borough
The most populous age groups in Hawthorn borough are 25 to 29 Years (28 | 12.1%) for men and 70 to 74 Years (25 | 10.0%) for women.
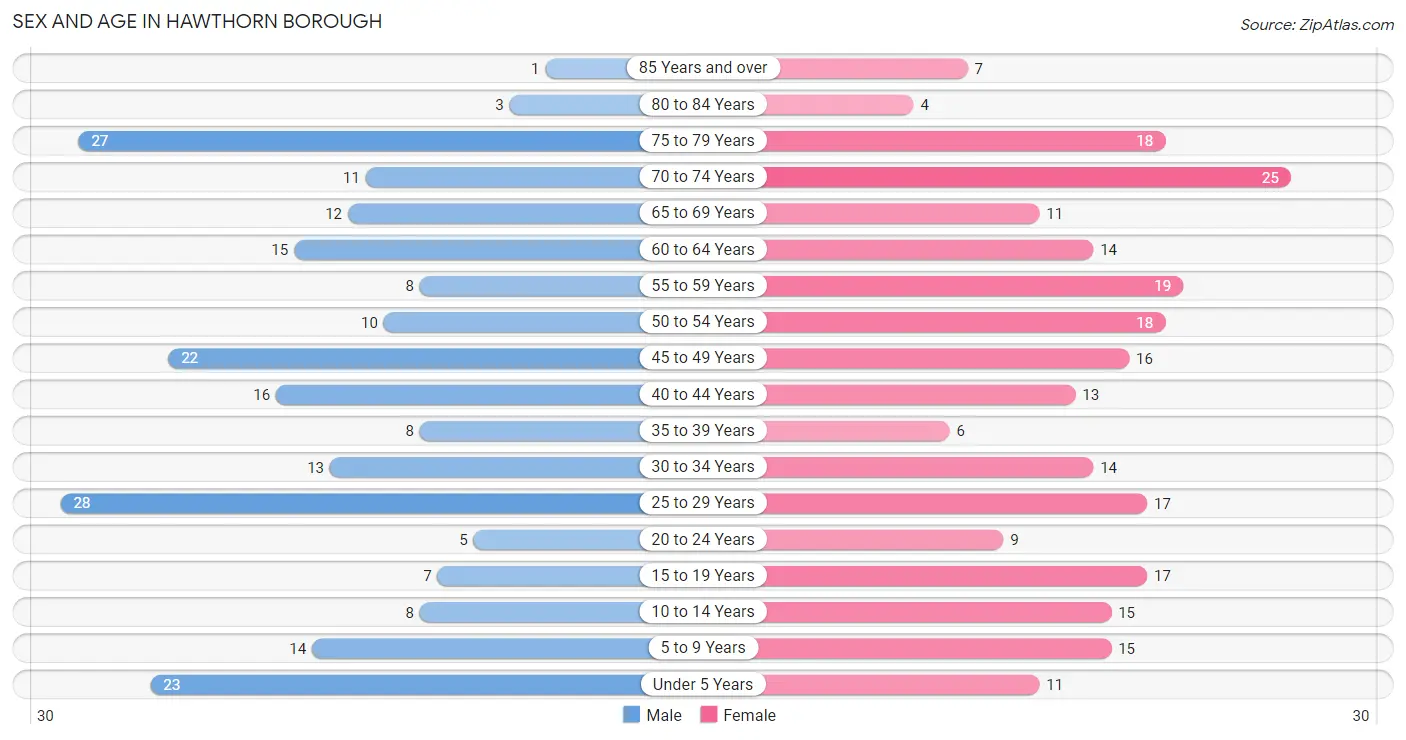
| Age Bracket | Male | Female |
| Under 5 Years | 23 (10.0%) | 11 (4.4%) |
| 5 to 9 Years | 14 (6.1%) | 15 (6.0%) |
| 10 to 14 Years | 8 (3.5%) | 15 (6.0%) |
| 15 to 19 Years | 7 (3.0%) | 17 (6.8%) |
| 20 to 24 Years | 5 (2.2%) | 9 (3.6%) |
| 25 to 29 Years | 28 (12.1%) | 17 (6.8%) |
| 30 to 34 Years | 13 (5.6%) | 14 (5.6%) |
| 35 to 39 Years | 8 (3.5%) | 6 (2.4%) |
| 40 to 44 Years | 16 (6.9%) | 13 (5.2%) |
| 45 to 49 Years | 22 (9.5%) | 16 (6.4%) |
| 50 to 54 Years | 10 (4.3%) | 18 (7.2%) |
| 55 to 59 Years | 8 (3.5%) | 19 (7.6%) |
| 60 to 64 Years | 15 (6.5%) | 14 (5.6%) |
| 65 to 69 Years | 12 (5.2%) | 11 (4.4%) |
| 70 to 74 Years | 11 (4.8%) | 25 (10.0%) |
| 75 to 79 Years | 27 (11.7%) | 18 (7.2%) |
| 80 to 84 Years | 3 (1.3%) | 4 (1.6%) |
| 85 Years and over | 1 (0.4%) | 7 (2.8%) |
| Total | 231 (100.0%) | 249 (100.0%) |
Families and Households in Hawthorn borough
Median Family Size in Hawthorn borough
The median family size in Hawthorn borough is 3.05 persons per family, with married-couple families (95 | 74.2%) accounting for the largest median family size of 3.25 persons per family. On the other hand, single male/father families (14 | 10.9%) represent the smallest median family size with 1.79 persons per family.
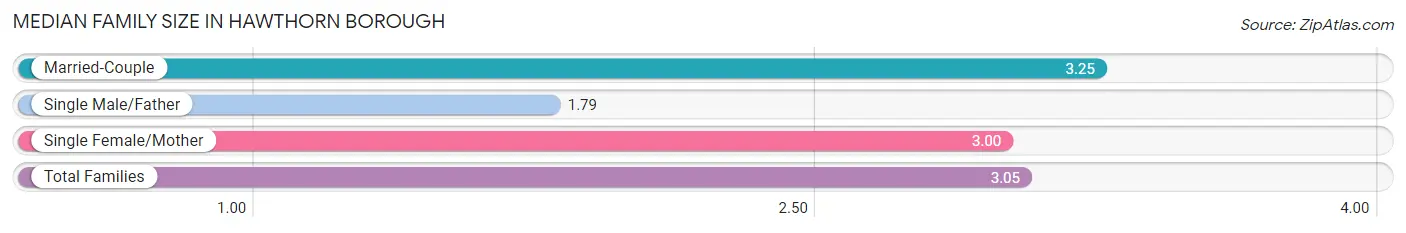
| Family Type | # Families | Family Size |
| Married-Couple | 95 (74.2%) | 3.25 |
| Single Male/Father | 14 (10.9%) | 1.79 |
| Single Female/Mother | 19 (14.8%) | 3.00 |
| Total Families | 128 (100.0%) | 3.05 |
Median Household Size in Hawthorn borough
The median household size in Hawthorn borough is 2.45 persons per household, with single female/mother households (19 | 9.7%) accounting for the largest median household size of 3.37 persons per household. non-family households (68 | 34.7%) represent the smallest median household size with 1.10 persons per household.
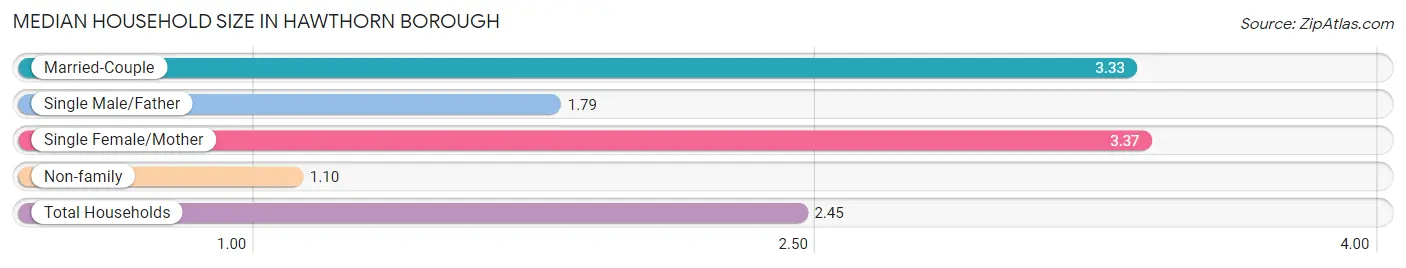
| Household Type | # Households | Household Size |
| Married-Couple | 95 (48.5%) | 3.33 |
| Single Male/Father | 14 (7.1%) | 1.79 |
| Single Female/Mother | 19 (9.7%) | 3.37 |
| Non-family | 68 (34.7%) | 1.10 |
| Total Households | 196 (100.0%) | 2.45 |
Household Size by Marriage Status in Hawthorn borough
Out of a total of 196 households in Hawthorn borough, 128 (65.3%) are family households, while 68 (34.7%) are nonfamily households. The most numerous type of family households are 2-person households, comprising 75, and the most common type of nonfamily households are 1-person households, comprising 61.
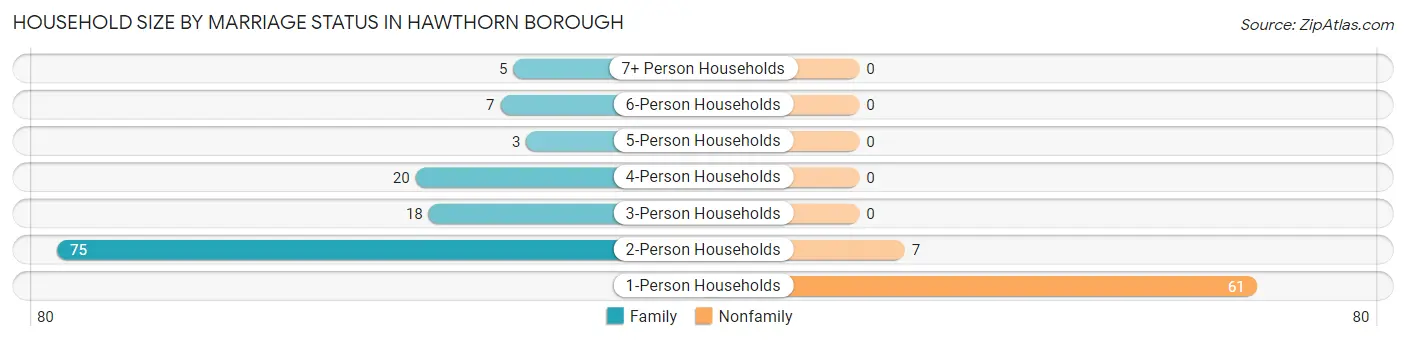
| Household Size | Family Households | Nonfamily Households |
| 1-Person Households | - | 61 (31.1%) |
| 2-Person Households | 75 (38.3%) | 7 (3.6%) |
| 3-Person Households | 18 (9.2%) | 0 (0.0%) |
| 4-Person Households | 20 (10.2%) | 0 (0.0%) |
| 5-Person Households | 3 (1.5%) | 0 (0.0%) |
| 6-Person Households | 7 (3.6%) | 0 (0.0%) |
| 7+ Person Households | 5 (2.5%) | 0 (0.0%) |
| Total | 128 (65.3%) | 68 (34.7%) |
Female Fertility in Hawthorn borough
Fertility by Age in Hawthorn borough
| Age Bracket | Women with Births | Births / 1,000 Women |
| 15 to 19 years | 0 (0.0%) | 0.0 |
| 20 to 34 years | 0 (0.0%) | 0.0 |
| 35 to 50 years | 0 (0.0%) | 0.0 |
| Total | 0 (0.0%) | 0.0 |
Fertility by Age by Marriage Status in Hawthorn borough
| Age Bracket | Married | Unmarried |
| 15 to 19 years | 0 (0.0%) | 0 (0.0%) |
| 20 to 34 years | 0 (0.0%) | 0 (0.0%) |
| 35 to 50 years | 0 (0.0%) | 0 (0.0%) |
| Total | 0 (0.0%) | 0 (0.0%) |
Fertility by Education in Hawthorn borough
| Educational Attainment | Women with Births | Births / 1,000 Women |
| Less than High School | 0 (0.0%) | 0.0 |
| High School Diploma | 0 (0.0%) | 0.0 |
| College or Associate's Degree | 0 (0.0%) | 0.0 |
| Bachelor's Degree | 0 (0.0%) | 0.0 |
| Graduate Degree | 0 (0.0%) | 0.0 |
| Total | 0 (0.0%) | 0.0 |
Fertility by Education by Marriage Status in Hawthorn borough
| Educational Attainment | Married | Unmarried |
| Less than High School | 0 (0.0%) | 0 (0.0%) |
| High School Diploma | 0 (0.0%) | 0 (0.0%) |
| College or Associate's Degree | 0 (0.0%) | 0 (0.0%) |
| Bachelor's Degree | 0 (0.0%) | 0 (0.0%) |
| Graduate Degree | 0 (0.0%) | 0 (0.0%) |
| Total | 0 (0.0%) | 0 (0.0%) |
Employment Characteristics in Hawthorn borough
Employment by Class of Employer in Hawthorn borough
Among the 200 employed individuals in Hawthorn borough, private company employees (156 | 78.0%), not-for-profit organizations (19 | 9.5%), and self-employed (not incorporated) (8 | 4.0%) make up the most common classes of employment.
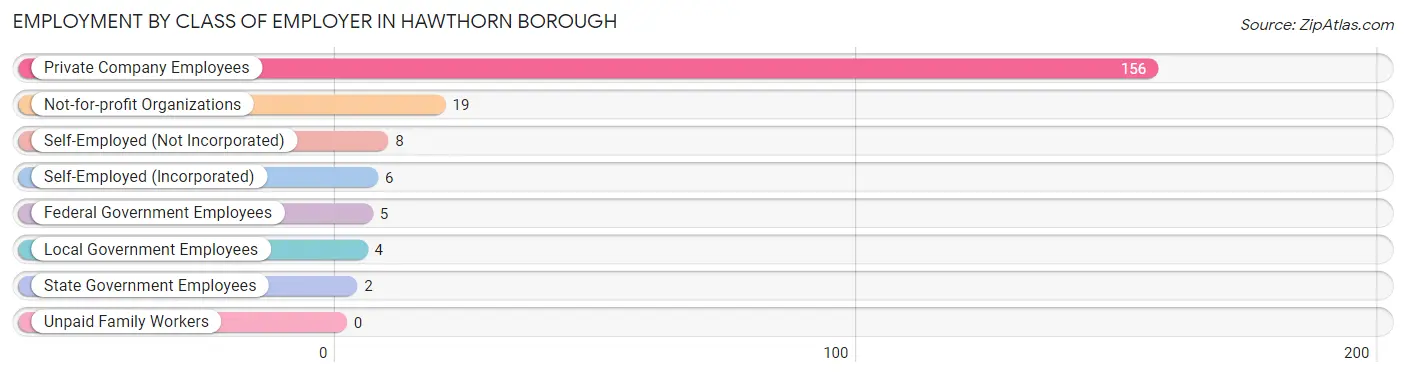
| Employer Class | # Employees | % Employees |
| Private Company Employees | 156 | 78.0% |
| Self-Employed (Incorporated) | 6 | 3.0% |
| Self-Employed (Not Incorporated) | 8 | 4.0% |
| Not-for-profit Organizations | 19 | 9.5% |
| Local Government Employees | 4 | 2.0% |
| State Government Employees | 2 | 1.0% |
| Federal Government Employees | 5 | 2.5% |
| Unpaid Family Workers | 0 | 0.0% |
| Total | 200 | 100.0% |
Employment Status by Age in Hawthorn borough
According to the labor force statistics for Hawthorn borough, out of the total population over 16 years of age (392), 57.1% or 224 individuals are in the labor force, with 9.1% or 20 of them unemployed. The age group with the highest labor force participation rate is 45 to 54 years, with 98.5% or 65 individuals in the labor force. Within the labor force, the 30 to 34 years age range has the highest percentage of unemployed individuals, with 26.1% or 6 of them being unemployed.

| Age Bracket | In Labor Force | Unemployed |
| 16 to 19 Years | 17 (77.3%) | 0 (0.0%) |
| 20 to 24 Years | 9 (64.3%) | 0 (0.0%) |
| 25 to 29 Years | 38 (84.4%) | 2 (5.3%) |
| 30 to 34 Years | 23 (85.2%) | 6 (26.1%) |
| 35 to 44 Years | 38 (88.4%) | 0 (0.0%) |
| 45 to 54 Years | 65 (98.5%) | 11 (16.7%) |
| 55 to 59 Years | 7 (25.9%) | 0 (0.0%) |
| 60 to 64 Years | 12 (41.4%) | 2 (16.7%) |
| 65 to 74 Years | 15 (25.4%) | 0 (0.0%) |
| 75 Years and over | 0 (0.0%) | 0 (0.0%) |
| Total | 224 (57.1%) | 20 (9.1%) |
Employment Status by Educational Attainment in Hawthorn borough
According to labor force statistics for Hawthorn borough, 77.2% of individuals (183) out of the total population between 25 and 64 years of age (237) are in the labor force, with 11.2% or 20 of them being unemployed. The group with the highest labor force participation rate are those with the educational attainment of college / associate degree, with 88.6% or 78 individuals in the labor force. Within the labor force, individuals with less than high school education have the highest percentage of unemployment, with 41.7% or 5 of them being unemployed.
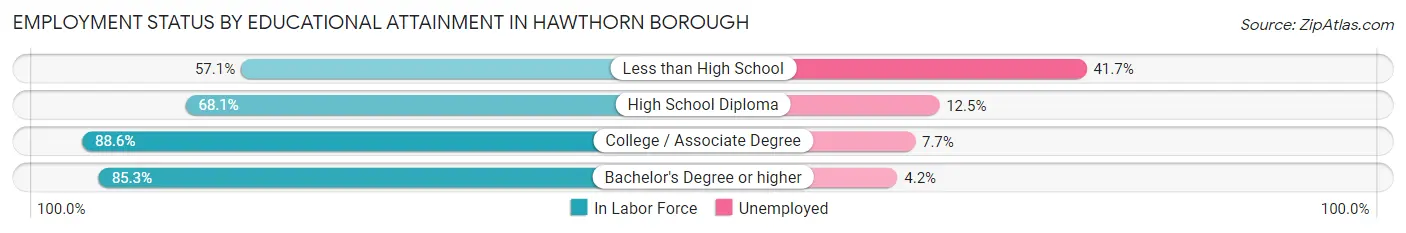
| Educational Attainment | In Labor Force | Unemployed |
| Less than High School | 12 (57.1%) | 9 (41.7%) |
| High School Diploma | 64 (68.1%) | 12 (12.5%) |
| College / Associate Degree | 78 (88.6%) | 7 (7.7%) |
| Bachelor's Degree or higher | 29 (85.3%) | 1 (4.2%) |
| Total | 183 (77.2%) | 27 (11.2%) |
Employment Occupations by Sex in Hawthorn borough
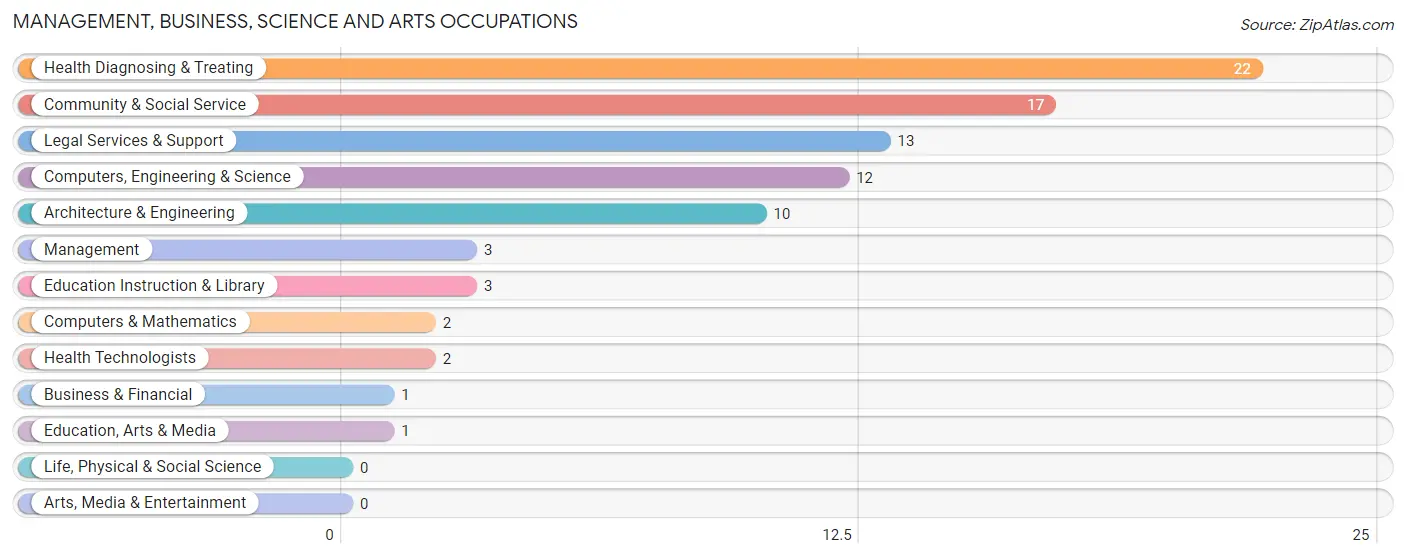
Management, Business, Science and Arts Occupations
The most common Management, Business, Science and Arts occupations in Hawthorn borough are Health Diagnosing & Treating (22 | 11.1%), Community & Social Service (17 | 8.5%), Legal Services & Support (13 | 6.5%), Computers, Engineering & Science (12 | 6.0%), and Architecture & Engineering (10 | 5.0%).
Management, Business, Science and Arts Occupations by Sex
Within the Management, Business, Science and Arts occupations in Hawthorn borough, the most male-oriented occupations are Business & Financial (100.0%), Computers, Engineering & Science (100.0%), and Computers & Mathematics (100.0%), while the most female-oriented occupations are Management (100.0%), Education, Arts & Media (100.0%), and Education Instruction & Library (100.0%).
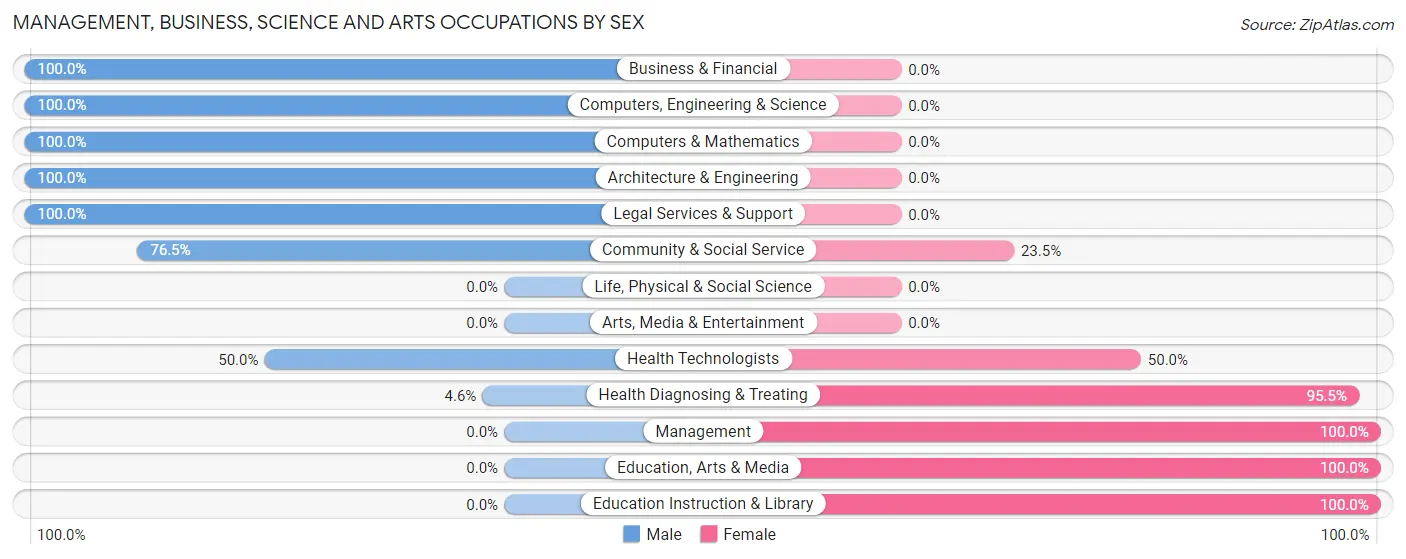
| Occupation | Male | Female |
| Management | 0 (0.0%) | 3 (100.0%) |
| Business & Financial | 1 (100.0%) | 0 (0.0%) |
| Computers, Engineering & Science | 12 (100.0%) | 0 (0.0%) |
| Computers & Mathematics | 2 (100.0%) | 0 (0.0%) |
| Architecture & Engineering | 10 (100.0%) | 0 (0.0%) |
| Life, Physical & Social Science | 0 (0.0%) | 0 (0.0%) |
| Community & Social Service | 13 (76.5%) | 4 (23.5%) |
| Education, Arts & Media | 0 (0.0%) | 1 (100.0%) |
| Legal Services & Support | 13 (100.0%) | 0 (0.0%) |
| Education Instruction & Library | 0 (0.0%) | 3 (100.0%) |
| Arts, Media & Entertainment | 0 (0.0%) | 0 (0.0%) |
| Health Diagnosing & Treating | 1 (4.5%) | 21 (95.5%) |
| Health Technologists | 1 (50.0%) | 1 (50.0%) |
| Total (Category) | 27 (49.1%) | 28 (50.9%) |
| Total (Overall) | 104 (52.3%) | 95 (47.7%) |
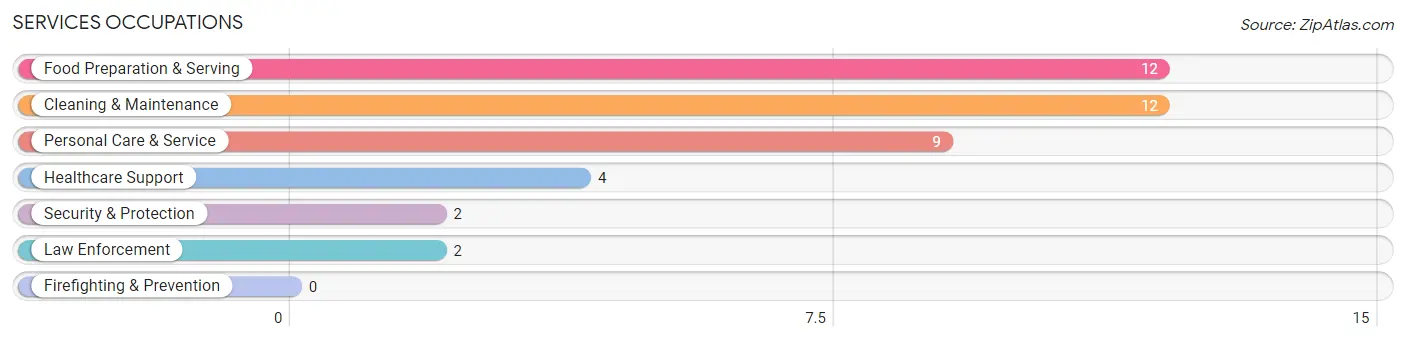
Services Occupations
The most common Services occupations in Hawthorn borough are Food Preparation & Serving (12 | 6.0%), Cleaning & Maintenance (12 | 6.0%), Personal Care & Service (9 | 4.5%), Healthcare Support (4 | 2.0%), and Security & Protection (2 | 1.0%).
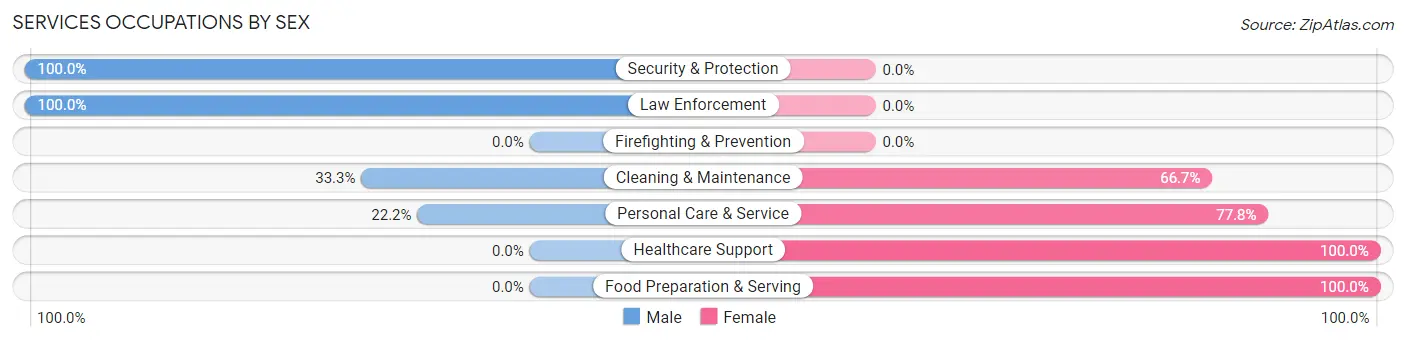
Services Occupations by Sex
Within the Services occupations in Hawthorn borough, the most male-oriented occupations are Security & Protection (100.0%), Law Enforcement (100.0%), and Cleaning & Maintenance (33.3%), while the most female-oriented occupations are Healthcare Support (100.0%), Food Preparation & Serving (100.0%), and Personal Care & Service (77.8%).
| Occupation | Male | Female |
| Healthcare Support | 0 (0.0%) | 4 (100.0%) |
| Security & Protection | 2 (100.0%) | 0 (0.0%) |
| Firefighting & Prevention | 0 (0.0%) | 0 (0.0%) |
| Law Enforcement | 2 (100.0%) | 0 (0.0%) |
| Food Preparation & Serving | 0 (0.0%) | 12 (100.0%) |
| Cleaning & Maintenance | 4 (33.3%) | 8 (66.7%) |
| Personal Care & Service | 2 (22.2%) | 7 (77.8%) |
| Total (Category) | 8 (20.5%) | 31 (79.5%) |
| Total (Overall) | 104 (52.3%) | 95 (47.7%) |
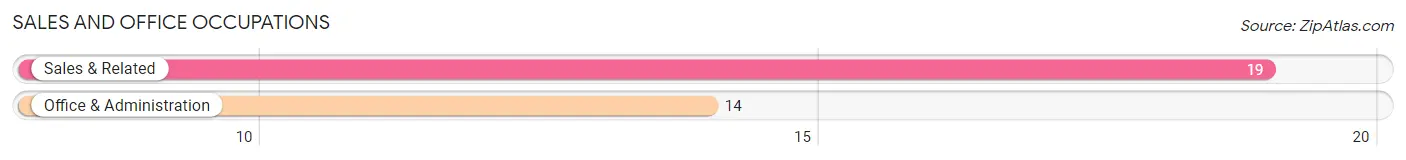
Sales and Office Occupations
The most common Sales and Office occupations in Hawthorn borough are Sales & Related (19 | 9.6%), and Office & Administration (14 | 7.0%).
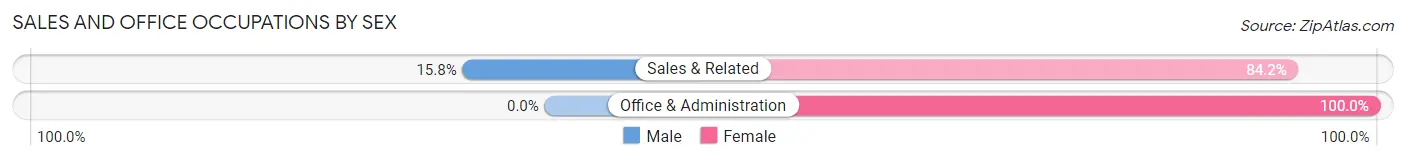
Sales and Office Occupations by Sex
| Occupation | Male | Female |
| Sales & Related | 3 (15.8%) | 16 (84.2%) |
| Office & Administration | 0 (0.0%) | 14 (100.0%) |
| Total (Category) | 3 (9.1%) | 30 (90.9%) |
| Total (Overall) | 104 (52.3%) | 95 (47.7%) |
Natural Resources, Construction and Maintenance Occupations
The most common Natural Resources, Construction and Maintenance occupations in Hawthorn borough are Construction & Extraction (15 | 7.5%), Installation, Maintenance & Repair (7 | 3.5%), and Farming, Fishing & Forestry (3 | 1.5%).
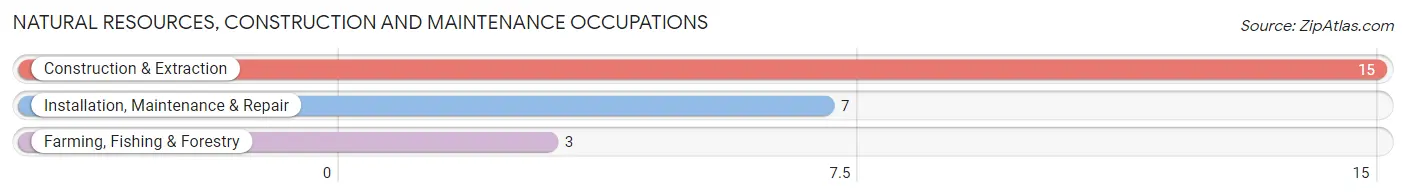
Natural Resources, Construction and Maintenance Occupations by Sex
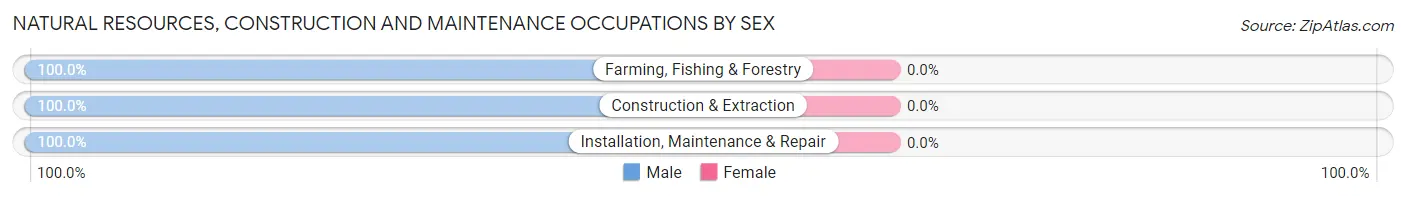
| Occupation | Male | Female |
| Farming, Fishing & Forestry | 3 (100.0%) | 0 (0.0%) |
| Construction & Extraction | 15 (100.0%) | 0 (0.0%) |
| Installation, Maintenance & Repair | 7 (100.0%) | 0 (0.0%) |
| Total (Category) | 25 (100.0%) | 0 (0.0%) |
| Total (Overall) | 104 (52.3%) | 95 (47.7%) |
Production, Transportation and Moving Occupations
The most common Production, Transportation and Moving occupations in Hawthorn borough are Production (21 | 10.5%), Material Moving (15 | 7.5%), and Transportation (11 | 5.5%).
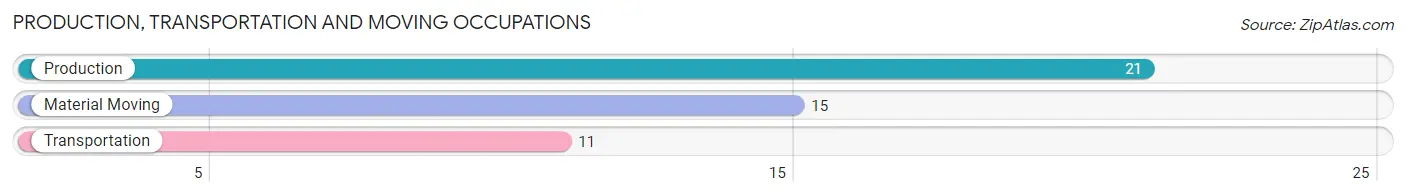
Production, Transportation and Moving Occupations by Sex
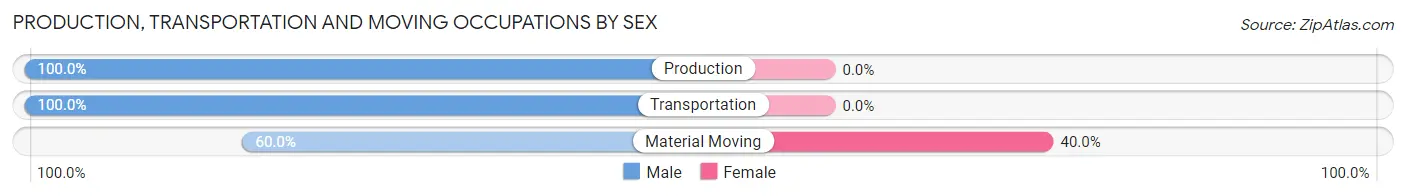
| Occupation | Male | Female |
| Production | 21 (100.0%) | 0 (0.0%) |
| Transportation | 11 (100.0%) | 0 (0.0%) |
| Material Moving | 9 (60.0%) | 6 (40.0%) |
| Total (Category) | 41 (87.2%) | 6 (12.8%) |
| Total (Overall) | 104 (52.3%) | 95 (47.7%) |
Employment Industries by Sex in Hawthorn borough
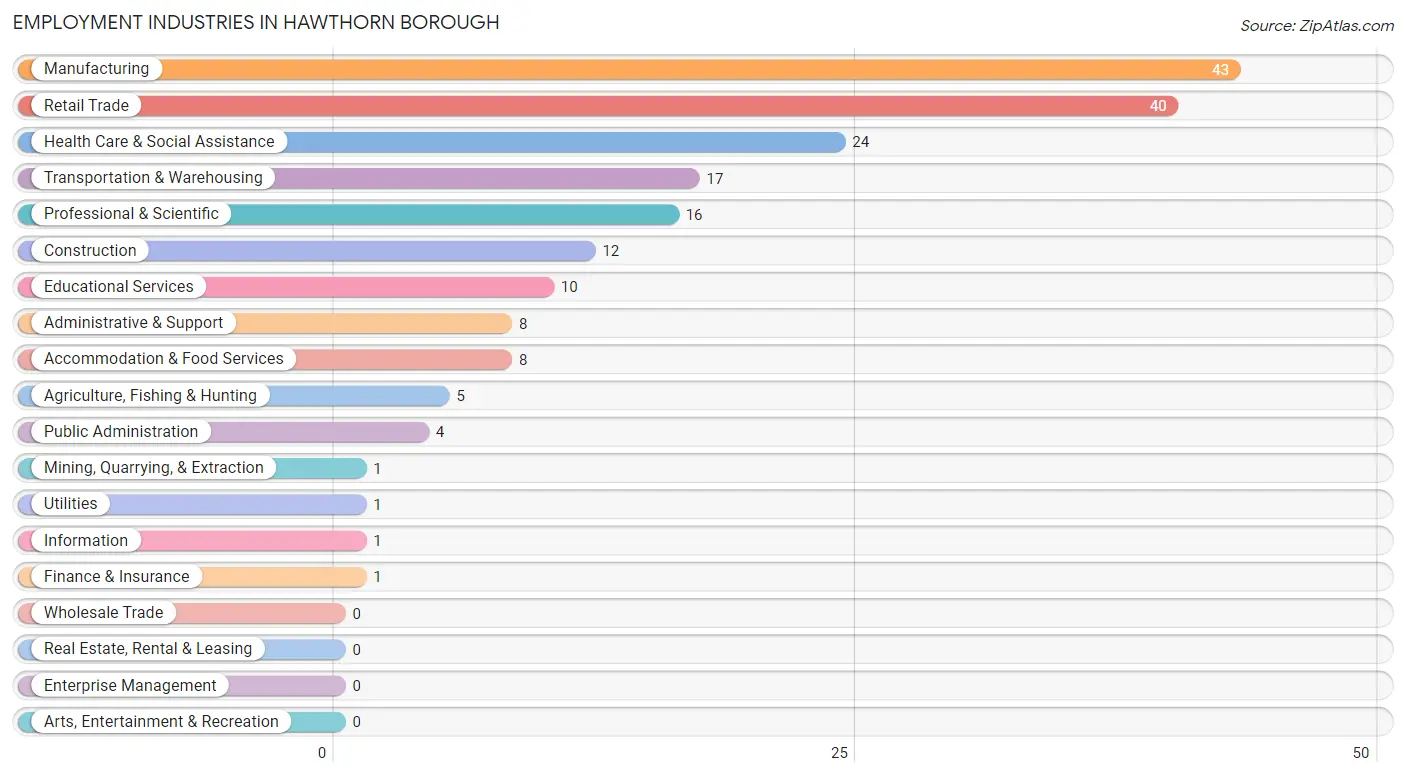
Employment Industries in Hawthorn borough
The major employment industries in Hawthorn borough include Manufacturing (43 | 21.6%), Retail Trade (40 | 20.1%), Health Care & Social Assistance (24 | 12.1%), Transportation & Warehousing (17 | 8.5%), and Professional & Scientific (16 | 8.0%).
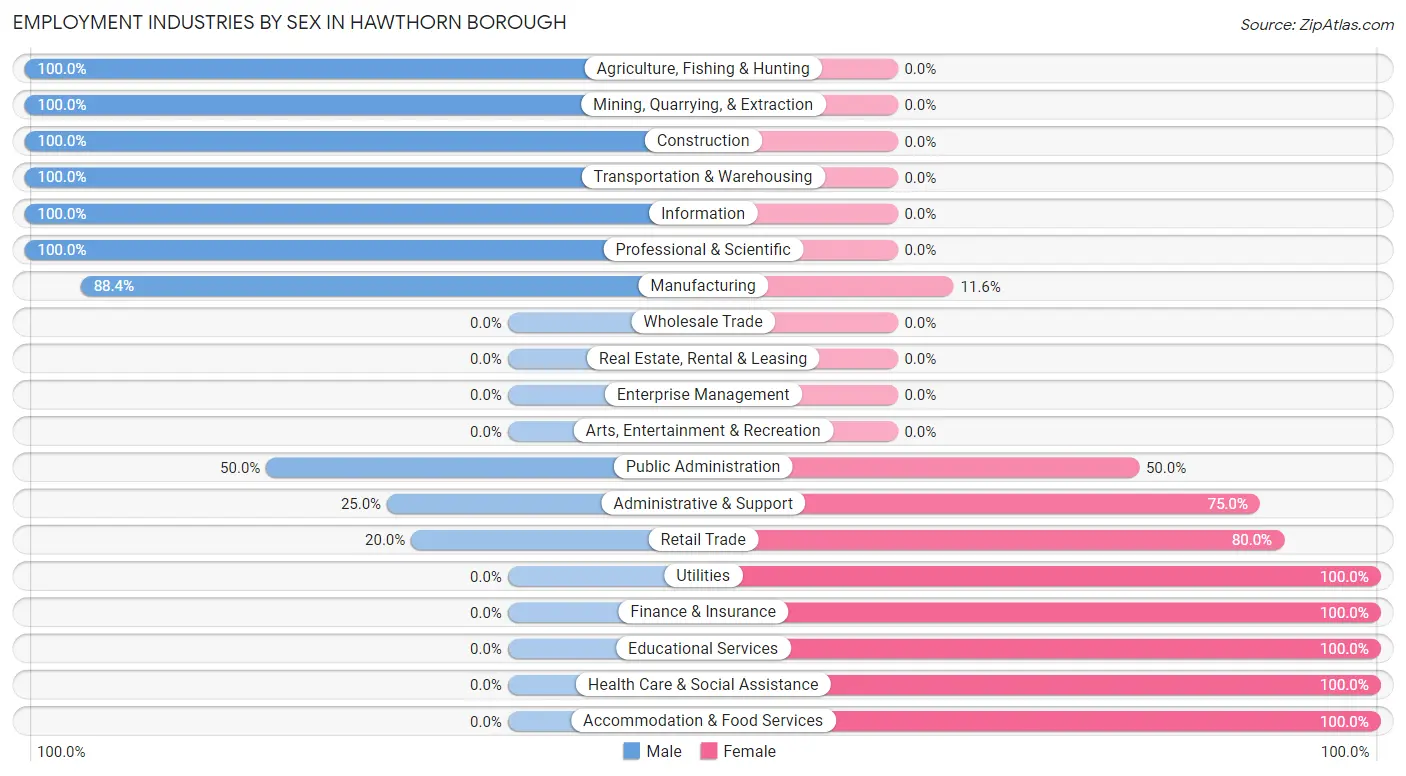
Employment Industries by Sex in Hawthorn borough
The Hawthorn borough industries that see more men than women are Agriculture, Fishing & Hunting (100.0%), Mining, Quarrying, & Extraction (100.0%), and Construction (100.0%), whereas the industries that tend to have a higher number of women are Utilities (100.0%), Finance & Insurance (100.0%), and Educational Services (100.0%).
| Industry | Male | Female |
| Agriculture, Fishing & Hunting | 5 (100.0%) | 0 (0.0%) |
| Mining, Quarrying, & Extraction | 1 (100.0%) | 0 (0.0%) |
| Construction | 12 (100.0%) | 0 (0.0%) |
| Manufacturing | 38 (88.4%) | 5 (11.6%) |
| Wholesale Trade | 0 (0.0%) | 0 (0.0%) |
| Retail Trade | 8 (20.0%) | 32 (80.0%) |
| Transportation & Warehousing | 17 (100.0%) | 0 (0.0%) |
| Utilities | 0 (0.0%) | 1 (100.0%) |
| Information | 1 (100.0%) | 0 (0.0%) |
| Finance & Insurance | 0 (0.0%) | 1 (100.0%) |
| Real Estate, Rental & Leasing | 0 (0.0%) | 0 (0.0%) |
| Professional & Scientific | 16 (100.0%) | 0 (0.0%) |
| Enterprise Management | 0 (0.0%) | 0 (0.0%) |
| Administrative & Support | 2 (25.0%) | 6 (75.0%) |
| Educational Services | 0 (0.0%) | 10 (100.0%) |
| Health Care & Social Assistance | 0 (0.0%) | 24 (100.0%) |
| Arts, Entertainment & Recreation | 0 (0.0%) | 0 (0.0%) |
| Accommodation & Food Services | 0 (0.0%) | 8 (100.0%) |
| Public Administration | 2 (50.0%) | 2 (50.0%) |
| Total | 104 (52.3%) | 95 (47.7%) |
Education in Hawthorn borough
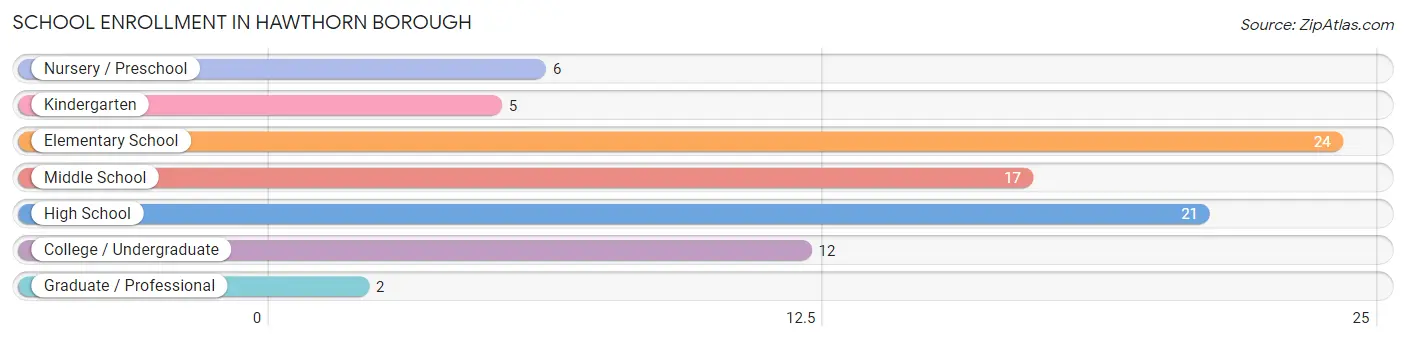
School Enrollment in Hawthorn borough
The most common levels of schooling among the 87 students in Hawthorn borough are elementary school (24 | 27.6%), high school (21 | 24.1%), and middle school (17 | 19.5%).
| School Level | # Students | % Students |
| Nursery / Preschool | 6 | 6.9% |
| Kindergarten | 5 | 5.8% |
| Elementary School | 24 | 27.6% |
| Middle School | 17 | 19.5% |
| High School | 21 | 24.1% |
| College / Undergraduate | 12 | 13.8% |
| Graduate / Professional | 2 | 2.3% |
| Total | 87 | 100.0% |
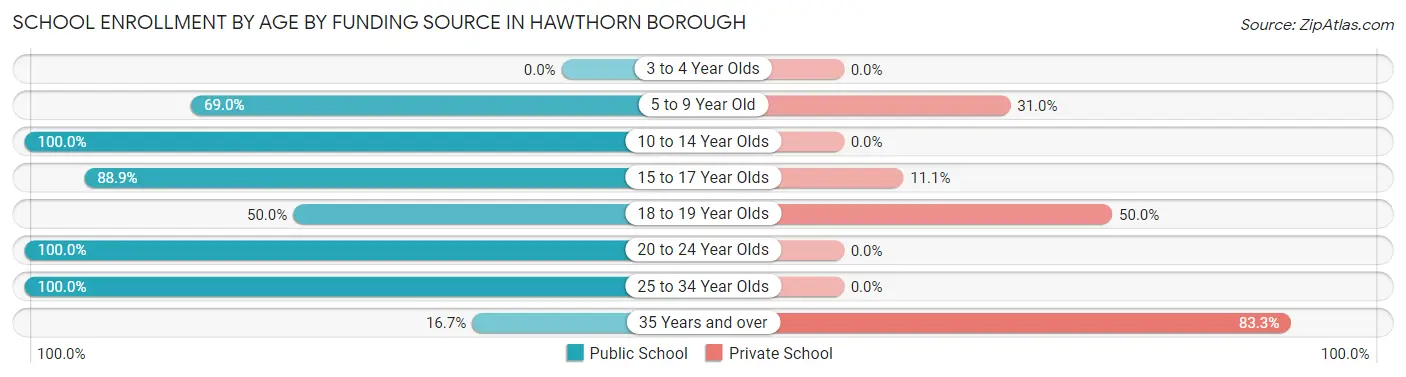
School Enrollment by Age by Funding Source in Hawthorn borough
Out of a total of 87 students who are enrolled in schools in Hawthorn borough, 18 (20.7%) attend a private institution, while the remaining 69 (79.3%) are enrolled in public schools. The age group of 35 years and over has the highest likelihood of being enrolled in private schools, with 5 (83.3% in the age bracket) enrolled. Conversely, the age group of 10 to 14 year olds has the lowest likelihood of being enrolled in a private school, with 23 (100.0% in the age bracket) attending a public institution.
| Age Bracket | Public School | Private School |
| 3 to 4 Year Olds | 0 (0.0%) | 0 (0.0%) |
| 5 to 9 Year Old | 20 (69.0%) | 9 (31.0%) |
| 10 to 14 Year Olds | 23 (100.0%) | 0 (0.0%) |
| 15 to 17 Year Olds | 16 (88.9%) | 2 (11.1%) |
| 18 to 19 Year Olds | 2 (50.0%) | 2 (50.0%) |
| 20 to 24 Year Olds | 2 (100.0%) | 0 (0.0%) |
| 25 to 34 Year Olds | 5 (100.0%) | 0 (0.0%) |
| 35 Years and over | 1 (16.7%) | 5 (83.3%) |
| Total | 69 (79.3%) | 18 (20.7%) |
Educational Attainment by Field of Study in Hawthorn borough
Arts & humanities (14 | 33.3%), business (12 | 28.6%), science & technology (6 | 14.3%), education (6 | 14.3%), and physical & health sciences (1 | 2.4%) are the most common fields of study among 42 individuals in Hawthorn borough who have obtained a bachelor's degree or higher.
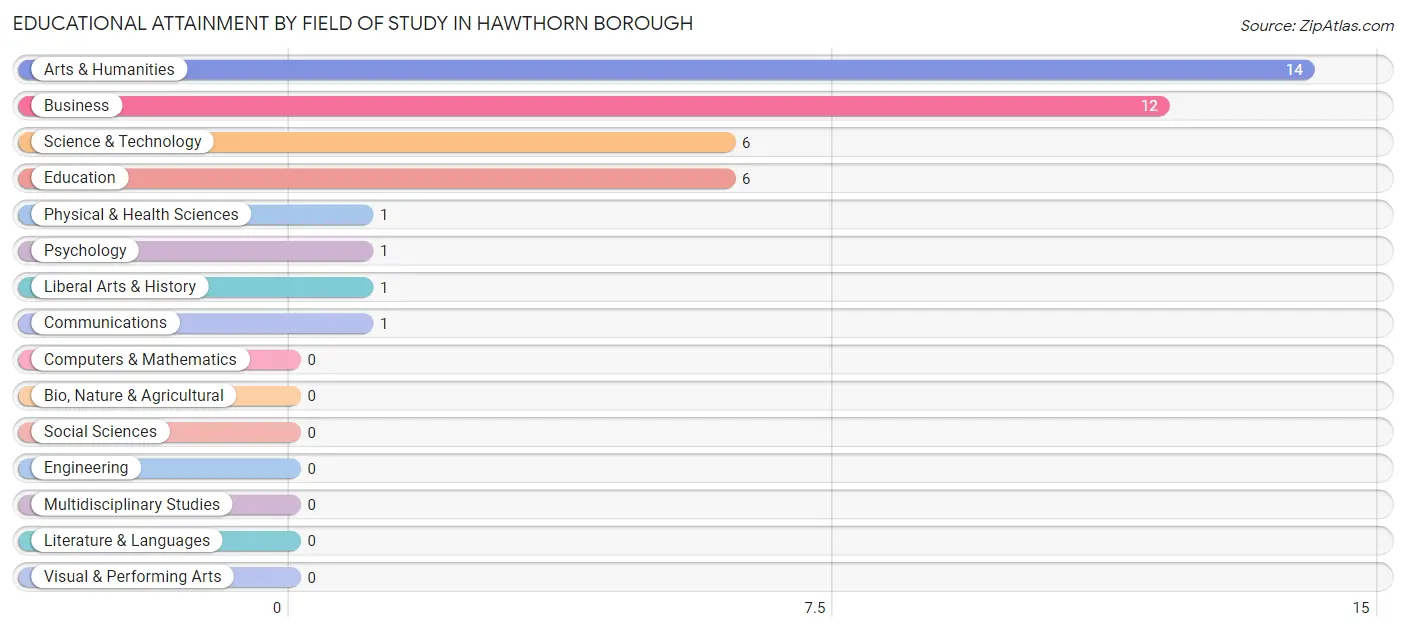
| Field of Study | # Graduates | % Graduates |
| Computers & Mathematics | 0 | 0.0% |
| Bio, Nature & Agricultural | 0 | 0.0% |
| Physical & Health Sciences | 1 | 2.4% |
| Psychology | 1 | 2.4% |
| Social Sciences | 0 | 0.0% |
| Engineering | 0 | 0.0% |
| Multidisciplinary Studies | 0 | 0.0% |
| Science & Technology | 6 | 14.3% |
| Business | 12 | 28.6% |
| Education | 6 | 14.3% |
| Literature & Languages | 0 | 0.0% |
| Liberal Arts & History | 1 | 2.4% |
| Visual & Performing Arts | 0 | 0.0% |
| Communications | 1 | 2.4% |
| Arts & Humanities | 14 | 33.3% |
| Total | 42 | 100.0% |
Transportation & Commute in Hawthorn borough
Vehicle Availability by Sex in Hawthorn borough
The most prevalent vehicle ownership categories in Hawthorn borough are males with 2 vehicles (45, accounting for 41.3%) and females with 2 vehicles (38, making up 49.4%).
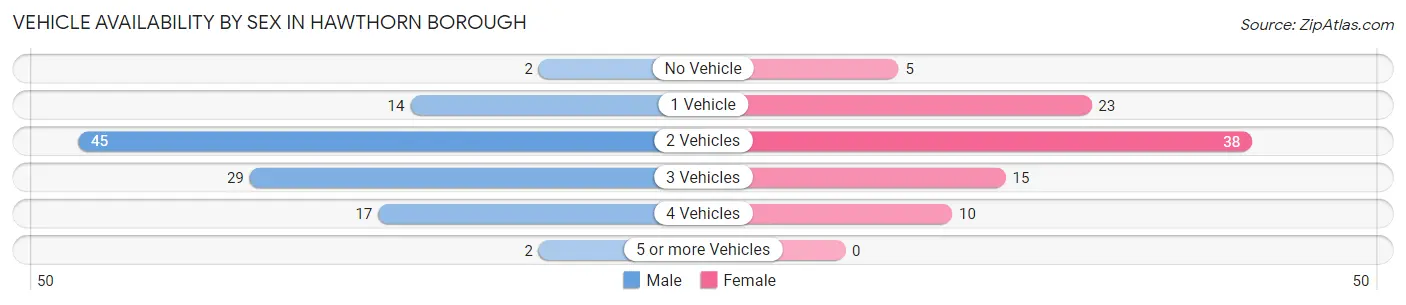
| Vehicles Available | Male | Female |
| No Vehicle | 2 (1.8%) | 5 (5.5%) |
| 1 Vehicle | 14 (12.8%) | 23 (25.3%) |
| 2 Vehicles | 45 (41.3%) | 38 (41.8%) |
| 3 Vehicles | 29 (26.6%) | 15 (16.5%) |
| 4 Vehicles | 17 (15.6%) | 10 (11.0%) |
| 5 or more Vehicles | 2 (1.8%) | 0 (0.0%) |
| Total | 109 (100.0%) | 91 (100.0%) |
Commute Time in Hawthorn borough
The most frequently occuring commute durations in Hawthorn borough are 30 to 34 minutes (42 commuters, 22.1%), 10 to 14 minutes (28 commuters, 14.7%), and 15 to 19 minutes (25 commuters, 13.2%).
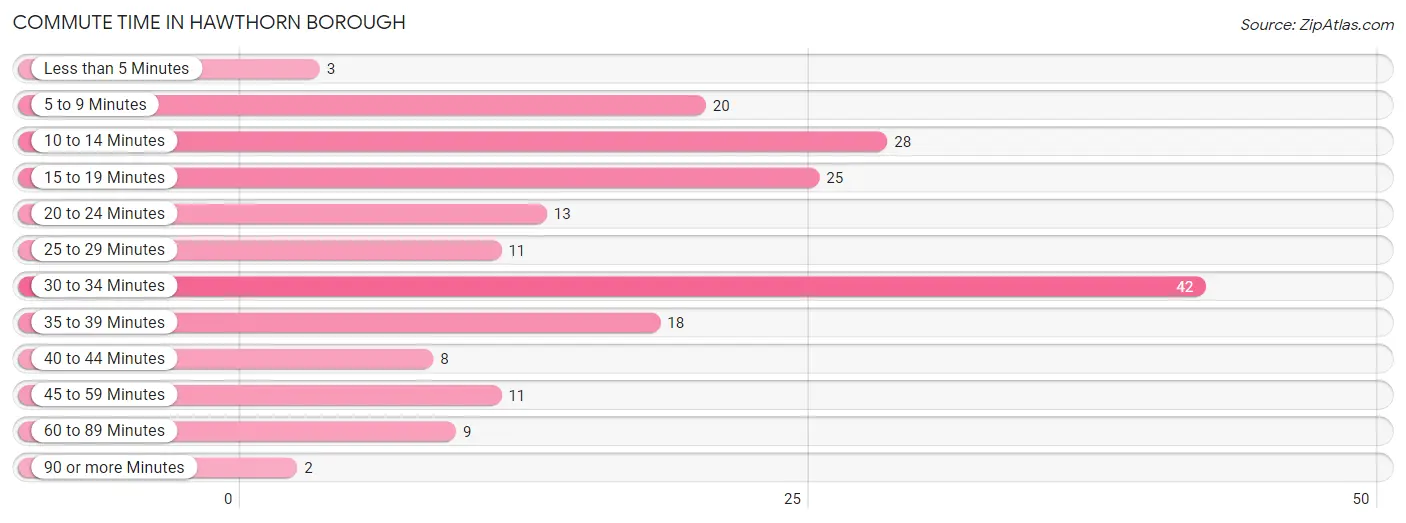
| Commute Time | # Commuters | % Commuters |
| Less than 5 Minutes | 3 | 1.6% |
| 5 to 9 Minutes | 20 | 10.5% |
| 10 to 14 Minutes | 28 | 14.7% |
| 15 to 19 Minutes | 25 | 13.2% |
| 20 to 24 Minutes | 13 | 6.8% |
| 25 to 29 Minutes | 11 | 5.8% |
| 30 to 34 Minutes | 42 | 22.1% |
| 35 to 39 Minutes | 18 | 9.5% |
| 40 to 44 Minutes | 8 | 4.2% |
| 45 to 59 Minutes | 11 | 5.8% |
| 60 to 89 Minutes | 9 | 4.7% |
| 90 or more Minutes | 2 | 1.1% |
Commute Time by Sex in Hawthorn borough
The most common commute times in Hawthorn borough are 10 to 14 minutes (23 commuters, 22.8%) for males and 30 to 34 minutes (29 commuters, 32.6%) for females.
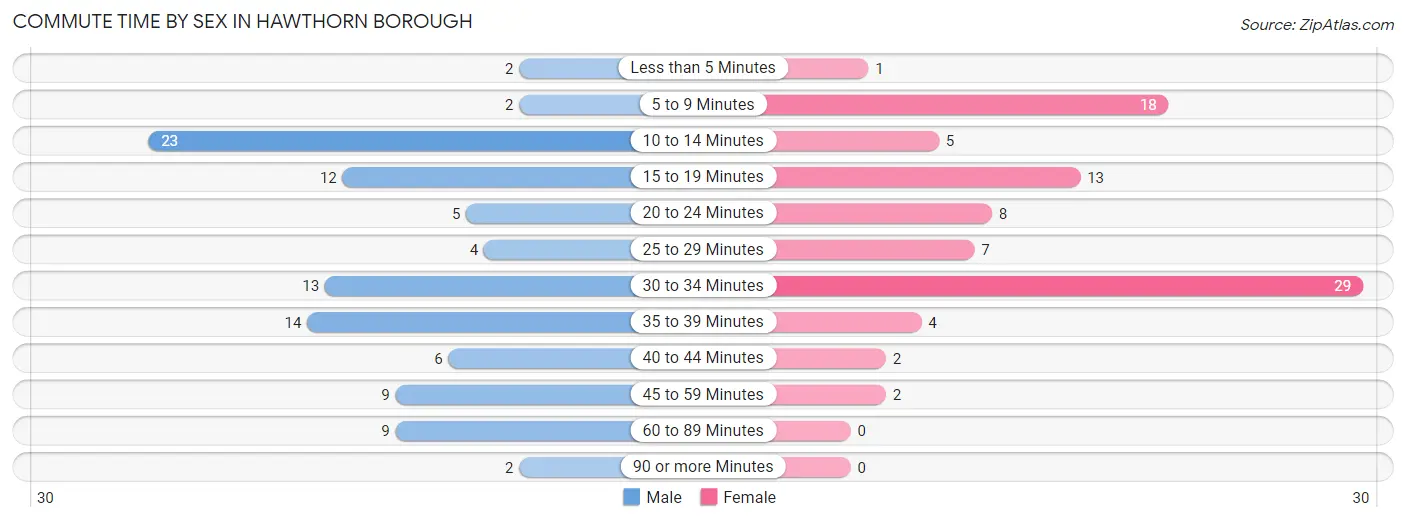
| Commute Time | Male | Female |
| Less than 5 Minutes | 2 (2.0%) | 1 (1.1%) |
| 5 to 9 Minutes | 2 (2.0%) | 18 (20.2%) |
| 10 to 14 Minutes | 23 (22.8%) | 5 (5.6%) |
| 15 to 19 Minutes | 12 (11.9%) | 13 (14.6%) |
| 20 to 24 Minutes | 5 (5.0%) | 8 (9.0%) |
| 25 to 29 Minutes | 4 (4.0%) | 7 (7.9%) |
| 30 to 34 Minutes | 13 (12.9%) | 29 (32.6%) |
| 35 to 39 Minutes | 14 (13.9%) | 4 (4.5%) |
| 40 to 44 Minutes | 6 (5.9%) | 2 (2.2%) |
| 45 to 59 Minutes | 9 (8.9%) | 2 (2.2%) |
| 60 to 89 Minutes | 9 (8.9%) | 0 (0.0%) |
| 90 or more Minutes | 2 (2.0%) | 0 (0.0%) |
Time of Departure to Work by Sex in Hawthorn borough
The most frequent times of departure to work in Hawthorn borough are 5:30 AM to 5:59 AM (17, 16.8%) for males and 4:00 PM to 11:59 PM (18, 20.2%) for females.
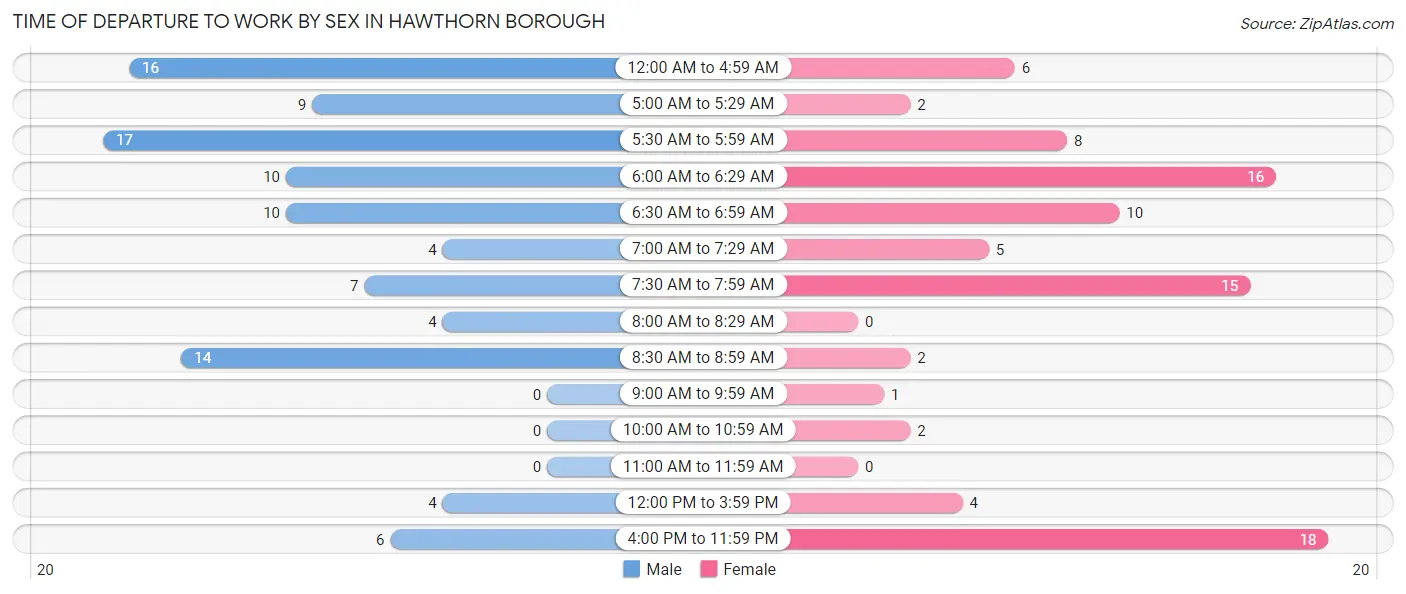
| Time of Departure | Male | Female |
| 12:00 AM to 4:59 AM | 16 (15.8%) | 6 (6.7%) |
| 5:00 AM to 5:29 AM | 9 (8.9%) | 2 (2.2%) |
| 5:30 AM to 5:59 AM | 17 (16.8%) | 8 (9.0%) |
| 6:00 AM to 6:29 AM | 10 (9.9%) | 16 (18.0%) |
| 6:30 AM to 6:59 AM | 10 (9.9%) | 10 (11.2%) |
| 7:00 AM to 7:29 AM | 4 (4.0%) | 5 (5.6%) |
| 7:30 AM to 7:59 AM | 7 (6.9%) | 15 (16.9%) |
| 8:00 AM to 8:29 AM | 4 (4.0%) | 0 (0.0%) |
| 8:30 AM to 8:59 AM | 14 (13.9%) | 2 (2.2%) |
| 9:00 AM to 9:59 AM | 0 (0.0%) | 1 (1.1%) |
| 10:00 AM to 10:59 AM | 0 (0.0%) | 2 (2.2%) |
| 11:00 AM to 11:59 AM | 0 (0.0%) | 0 (0.0%) |
| 12:00 PM to 3:59 PM | 4 (4.0%) | 4 (4.5%) |
| 4:00 PM to 11:59 PM | 6 (5.9%) | 18 (20.2%) |
| Total | 101 (100.0%) | 89 (100.0%) |
Housing Occupancy in Hawthorn borough
Occupancy by Ownership in Hawthorn borough
Of the total 196 dwellings in Hawthorn borough, owner-occupied units account for 149 (76.0%), while renter-occupied units make up 47 (24.0%).
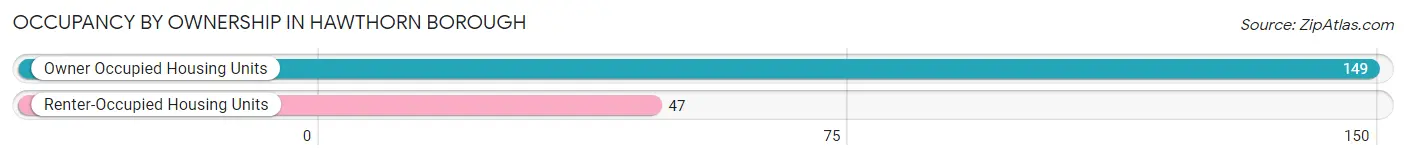
| Occupancy | # Housing Units | % Housing Units |
| Owner Occupied Housing Units | 149 | 76.0% |
| Renter-Occupied Housing Units | 47 | 24.0% |
| Total Occupied Housing Units | 196 | 100.0% |
Occupancy by Household Size in Hawthorn borough
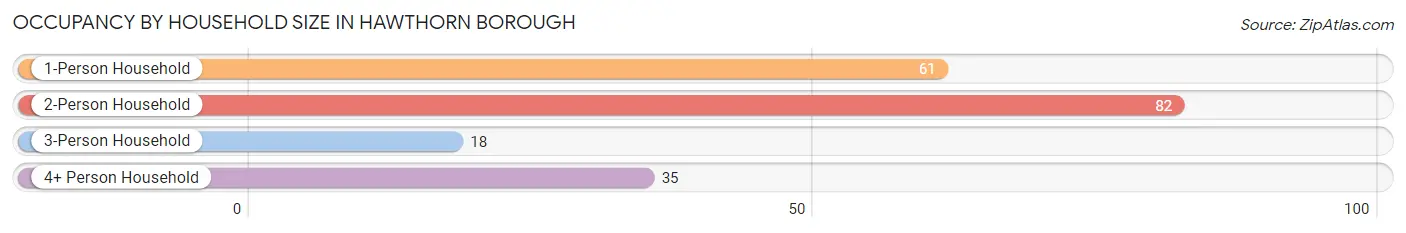
| Household Size | # Housing Units | % Housing Units |
| 1-Person Household | 61 | 31.1% |
| 2-Person Household | 82 | 41.8% |
| 3-Person Household | 18 | 9.2% |
| 4+ Person Household | 35 | 17.9% |
| Total Housing Units | 196 | 100.0% |
Occupancy by Ownership by Household Size in Hawthorn borough
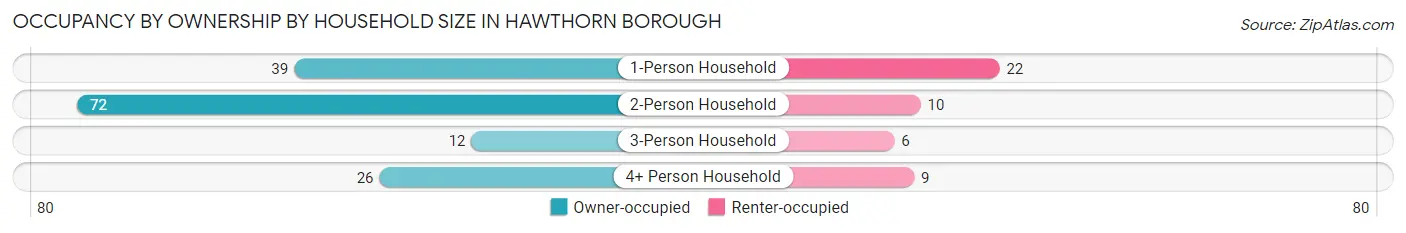
| Household Size | Owner-occupied | Renter-occupied |
| 1-Person Household | 39 (63.9%) | 22 (36.1%) |
| 2-Person Household | 72 (87.8%) | 10 (12.2%) |
| 3-Person Household | 12 (66.7%) | 6 (33.3%) |
| 4+ Person Household | 26 (74.3%) | 9 (25.7%) |
| Total Housing Units | 149 (76.0%) | 47 (24.0%) |
Occupancy by Educational Attainment in Hawthorn borough
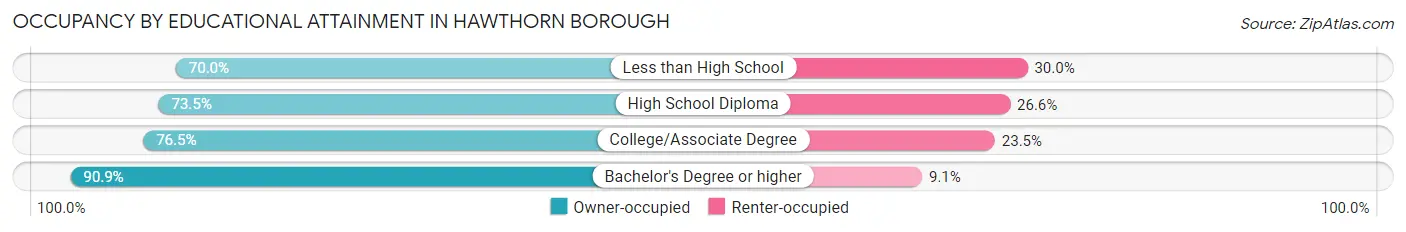
| Household Size | Owner-occupied | Renter-occupied |
| Less than High School | 7 (70.0%) | 3 (30.0%) |
| High School Diploma | 83 (73.5%) | 30 (26.6%) |
| College/Associate Degree | 39 (76.5%) | 12 (23.5%) |
| Bachelor's Degree or higher | 20 (90.9%) | 2 (9.1%) |
Occupancy by Age of Householder in Hawthorn borough
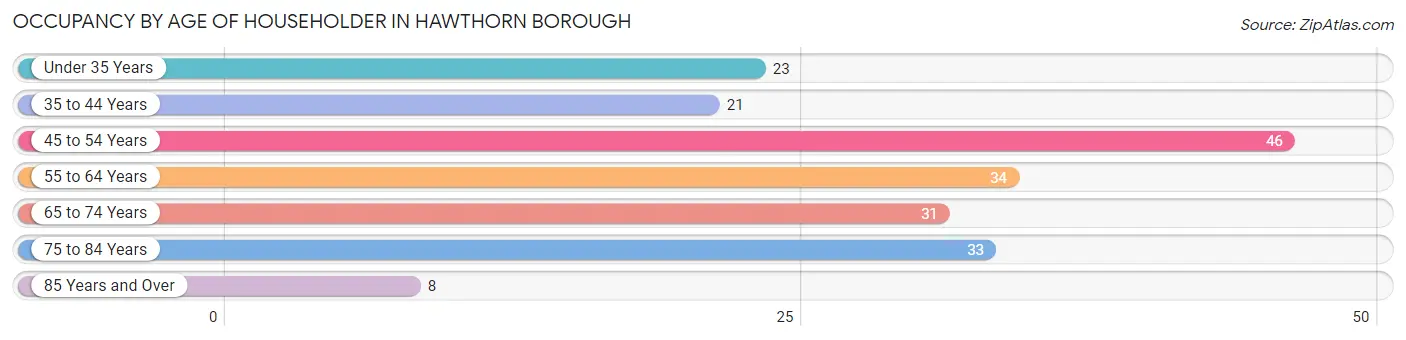
| Age Bracket | # Households | % Households |
| Under 35 Years | 23 | 11.7% |
| 35 to 44 Years | 21 | 10.7% |
| 45 to 54 Years | 46 | 23.5% |
| 55 to 64 Years | 34 | 17.3% |
| 65 to 74 Years | 31 | 15.8% |
| 75 to 84 Years | 33 | 16.8% |
| 85 Years and Over | 8 | 4.1% |
| Total | 196 | 100.0% |
Housing Finances in Hawthorn borough
Median Income by Occupancy in Hawthorn borough
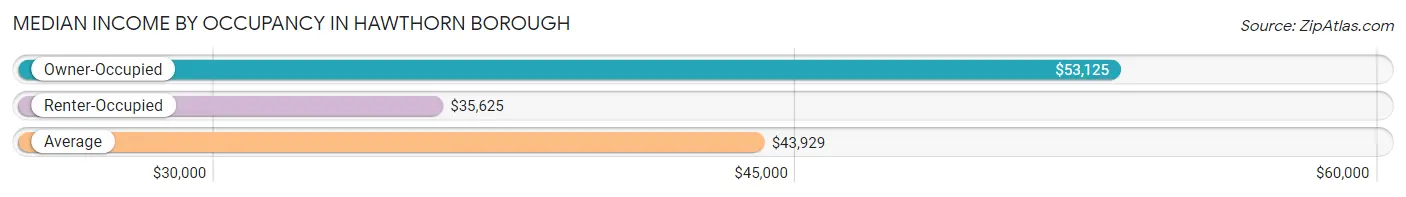
| Occupancy Type | # Households | Median Income |
| Owner-Occupied | 149 (76.0%) | $53,125 |
| Renter-Occupied | 47 (24.0%) | $35,625 |
| Average | 196 (100.0%) | $43,929 |
Occupancy by Householder Income Bracket in Hawthorn borough
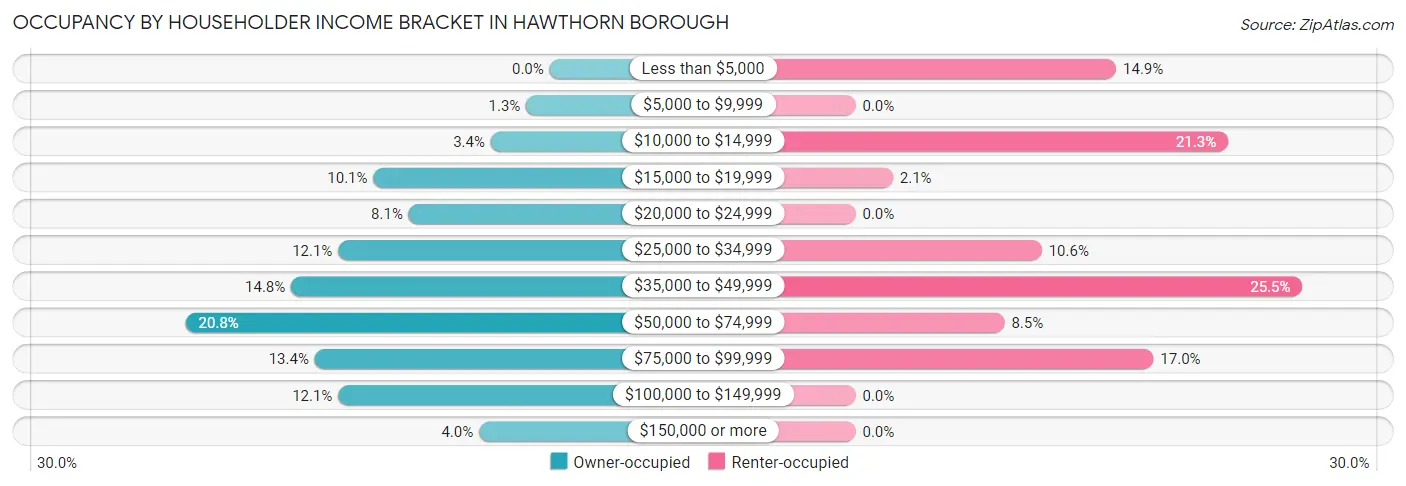
| Income Bracket | Owner-occupied | Renter-occupied |
| Less than $5,000 | 0 (0.0%) | 7 (14.9%) |
| $5,000 to $9,999 | 2 (1.3%) | 0 (0.0%) |
| $10,000 to $14,999 | 5 (3.4%) | 10 (21.3%) |
| $15,000 to $19,999 | 15 (10.1%) | 1 (2.1%) |
| $20,000 to $24,999 | 12 (8.1%) | 0 (0.0%) |
| $25,000 to $34,999 | 18 (12.1%) | 5 (10.6%) |
| $35,000 to $49,999 | 22 (14.8%) | 12 (25.5%) |
| $50,000 to $74,999 | 31 (20.8%) | 4 (8.5%) |
| $75,000 to $99,999 | 20 (13.4%) | 8 (17.0%) |
| $100,000 to $149,999 | 18 (12.1%) | 0 (0.0%) |
| $150,000 or more | 6 (4.0%) | 0 (0.0%) |
| Total | 149 (100.0%) | 47 (100.0%) |
Monthly Housing Cost Tiers in Hawthorn borough
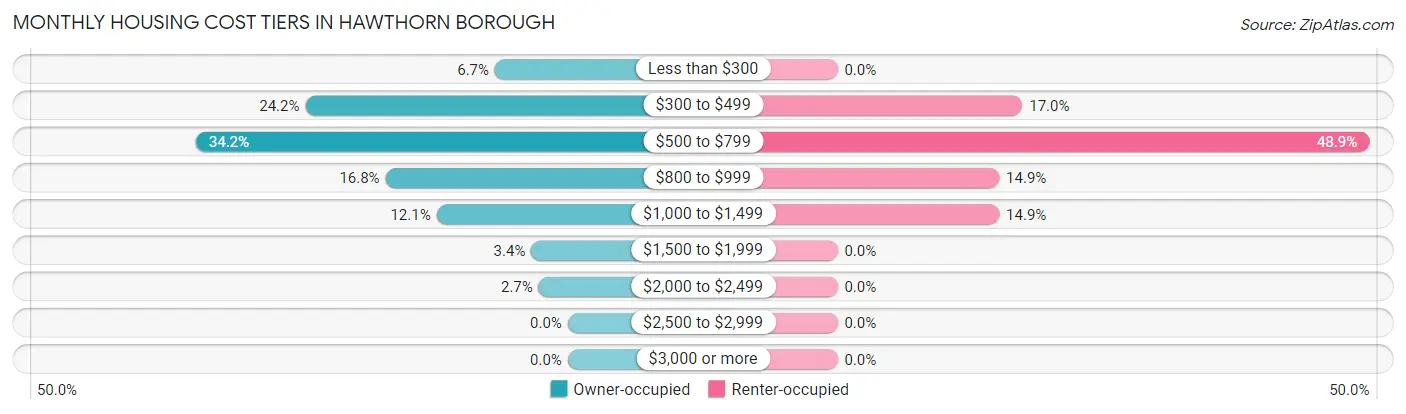
| Monthly Cost | Owner-occupied | Renter-occupied |
| Less than $300 | 10 (6.7%) | 0 (0.0%) |
| $300 to $499 | 36 (24.2%) | 8 (17.0%) |
| $500 to $799 | 51 (34.2%) | 23 (48.9%) |
| $800 to $999 | 25 (16.8%) | 7 (14.9%) |
| $1,000 to $1,499 | 18 (12.1%) | 7 (14.9%) |
| $1,500 to $1,999 | 5 (3.4%) | 0 (0.0%) |
| $2,000 to $2,499 | 4 (2.7%) | 0 (0.0%) |
| $2,500 to $2,999 | 0 (0.0%) | 0 (0.0%) |
| $3,000 or more | 0 (0.0%) | 0 (0.0%) |
| Total | 149 (100.0%) | 47 (100.0%) |
Physical Housing Characteristics in Hawthorn borough
Housing Structures in Hawthorn borough
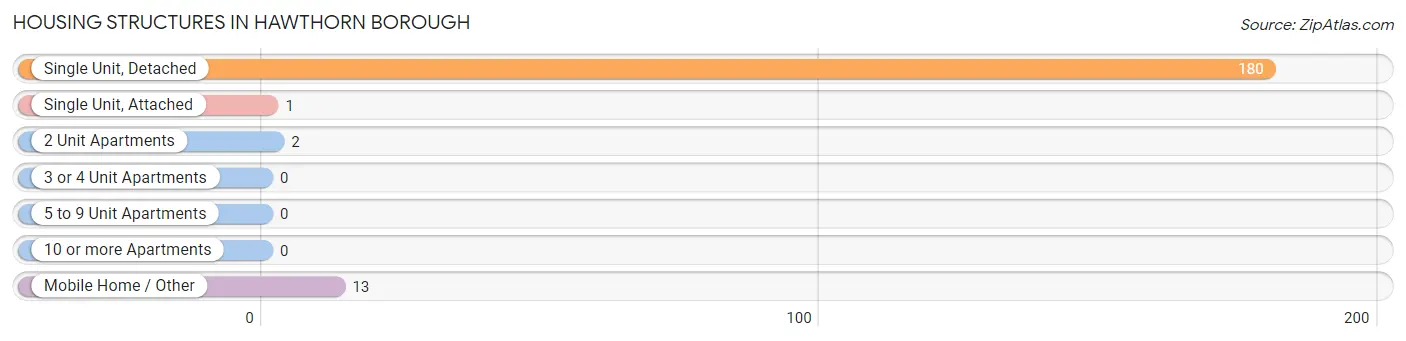
| Structure Type | # Housing Units | % Housing Units |
| Single Unit, Detached | 180 | 91.8% |
| Single Unit, Attached | 1 | 0.5% |
| 2 Unit Apartments | 2 | 1.0% |
| 3 or 4 Unit Apartments | 0 | 0.0% |
| 5 to 9 Unit Apartments | 0 | 0.0% |
| 10 or more Apartments | 0 | 0.0% |
| Mobile Home / Other | 13 | 6.6% |
| Total | 196 | 100.0% |
Housing Structures by Occupancy in Hawthorn borough
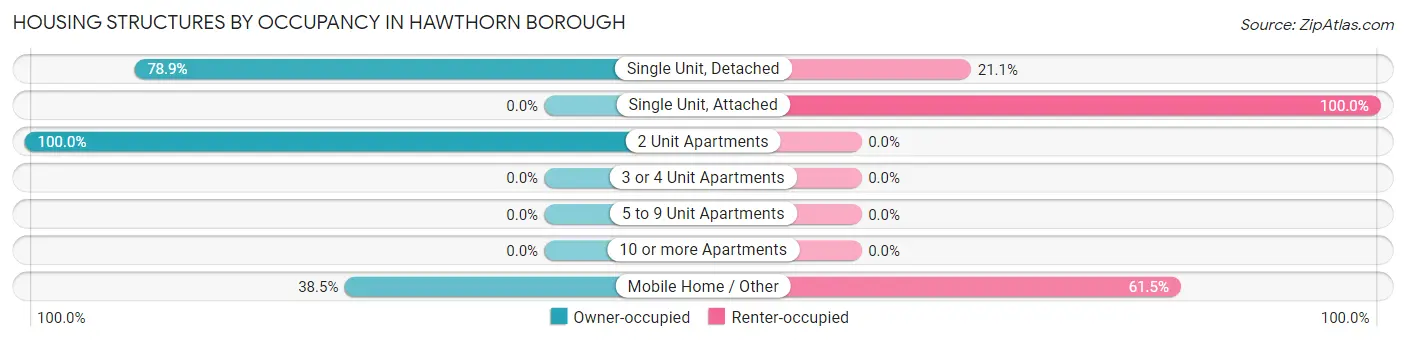
| Structure Type | Owner-occupied | Renter-occupied |
| Single Unit, Detached | 142 (78.9%) | 38 (21.1%) |
| Single Unit, Attached | 0 (0.0%) | 1 (100.0%) |
| 2 Unit Apartments | 2 (100.0%) | 0 (0.0%) |
| 3 or 4 Unit Apartments | 0 (0.0%) | 0 (0.0%) |
| 5 to 9 Unit Apartments | 0 (0.0%) | 0 (0.0%) |
| 10 or more Apartments | 0 (0.0%) | 0 (0.0%) |
| Mobile Home / Other | 5 (38.5%) | 8 (61.5%) |
| Total | 149 (76.0%) | 47 (24.0%) |
Housing Structures by Number of Rooms in Hawthorn borough
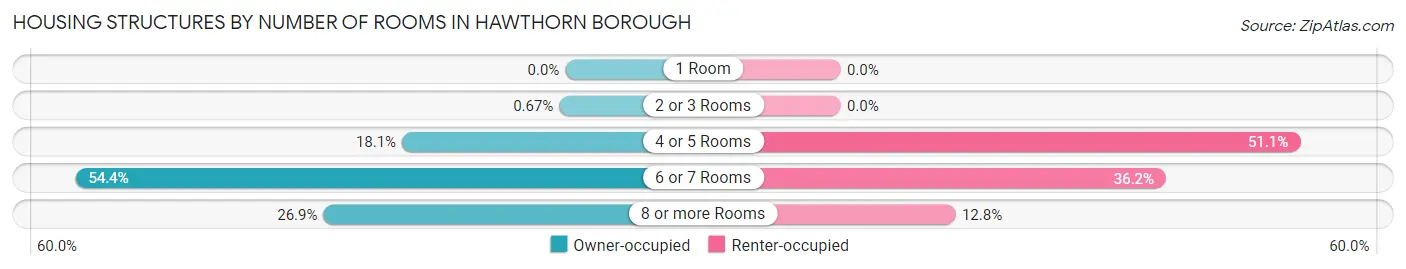
| Number of Rooms | Owner-occupied | Renter-occupied |
| 1 Room | 0 (0.0%) | 0 (0.0%) |
| 2 or 3 Rooms | 1 (0.7%) | 0 (0.0%) |
| 4 or 5 Rooms | 27 (18.1%) | 24 (51.1%) |
| 6 or 7 Rooms | 81 (54.4%) | 17 (36.2%) |
| 8 or more Rooms | 40 (26.9%) | 6 (12.8%) |
| Total | 149 (100.0%) | 47 (100.0%) |
Housing Structure by Heating Type in Hawthorn borough
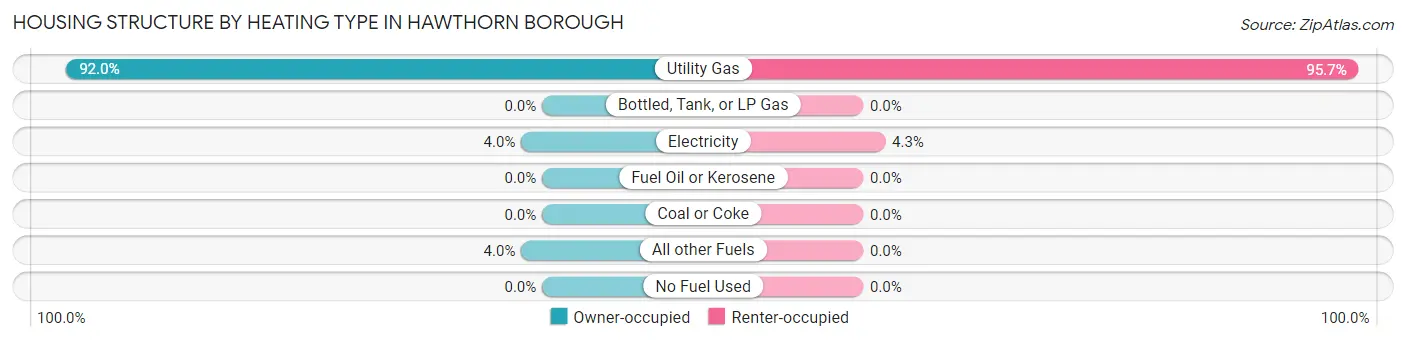
| Heating Type | Owner-occupied | Renter-occupied |
| Utility Gas | 137 (91.9%) | 45 (95.7%) |
| Bottled, Tank, or LP Gas | 0 (0.0%) | 0 (0.0%) |
| Electricity | 6 (4.0%) | 2 (4.3%) |
| Fuel Oil or Kerosene | 0 (0.0%) | 0 (0.0%) |
| Coal or Coke | 0 (0.0%) | 0 (0.0%) |
| All other Fuels | 6 (4.0%) | 0 (0.0%) |
| No Fuel Used | 0 (0.0%) | 0 (0.0%) |
| Total | 149 (100.0%) | 47 (100.0%) |
Household Vehicle Usage in Hawthorn borough
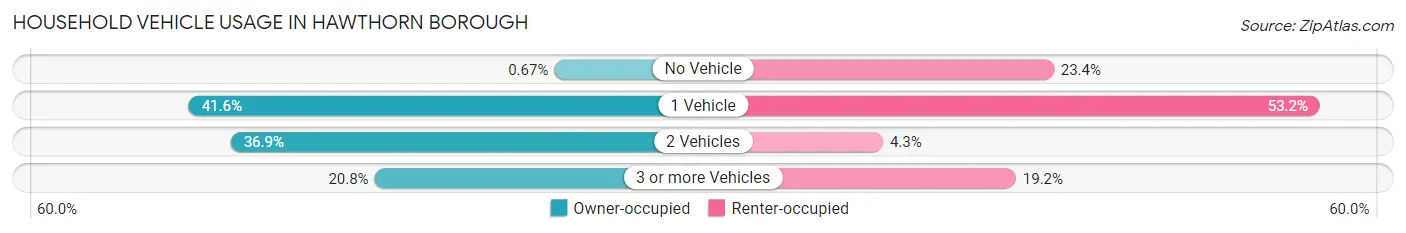
| Vehicles per Household | Owner-occupied | Renter-occupied |
| No Vehicle | 1 (0.7%) | 11 (23.4%) |
| 1 Vehicle | 62 (41.6%) | 25 (53.2%) |
| 2 Vehicles | 55 (36.9%) | 2 (4.3%) |
| 3 or more Vehicles | 31 (20.8%) | 9 (19.2%) |
| Total | 149 (100.0%) | 47 (100.0%) |
Real Estate & Mortgages in Hawthorn borough
Real Estate and Mortgage Overview in Hawthorn borough
| Characteristic | Without Mortgage | With Mortgage |
| Housing Units | 82 | 67 |
| Median Property Value | $90,000 | $89,600 |
| Median Household Income | $35,000 | $6 |
| Monthly Housing Costs | $488 | $0 |
| Real Estate Taxes | $900 | $3 |
Property Value by Mortgage Status in Hawthorn borough
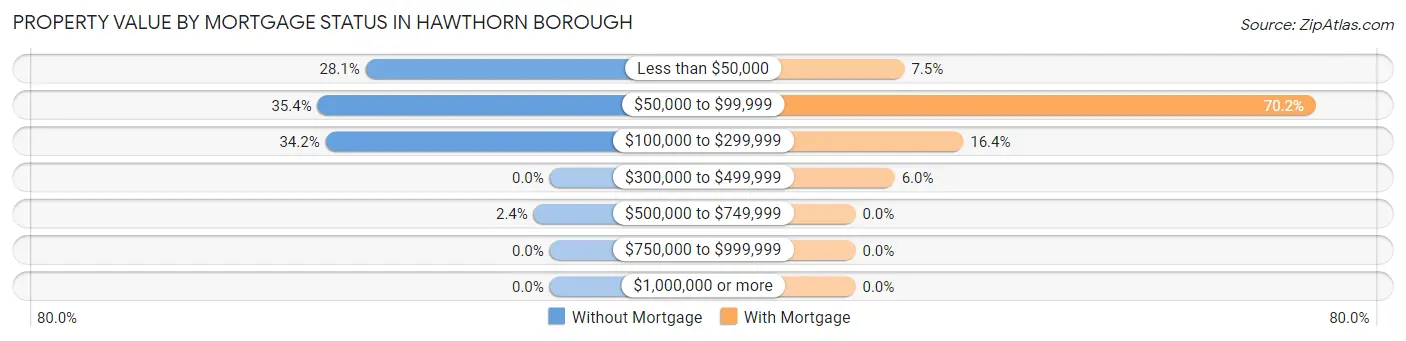
| Property Value | Without Mortgage | With Mortgage |
| Less than $50,000 | 23 (28.1%) | 5 (7.5%) |
| $50,000 to $99,999 | 29 (35.4%) | 47 (70.2%) |
| $100,000 to $299,999 | 28 (34.2%) | 11 (16.4%) |
| $300,000 to $499,999 | 0 (0.0%) | 4 (6.0%) |
| $500,000 to $749,999 | 2 (2.4%) | 0 (0.0%) |
| $750,000 to $999,999 | 0 (0.0%) | 0 (0.0%) |
| $1,000,000 or more | 0 (0.0%) | 0 (0.0%) |
| Total | 82 (100.0%) | 67 (100.0%) |
Household Income by Mortgage Status in Hawthorn borough
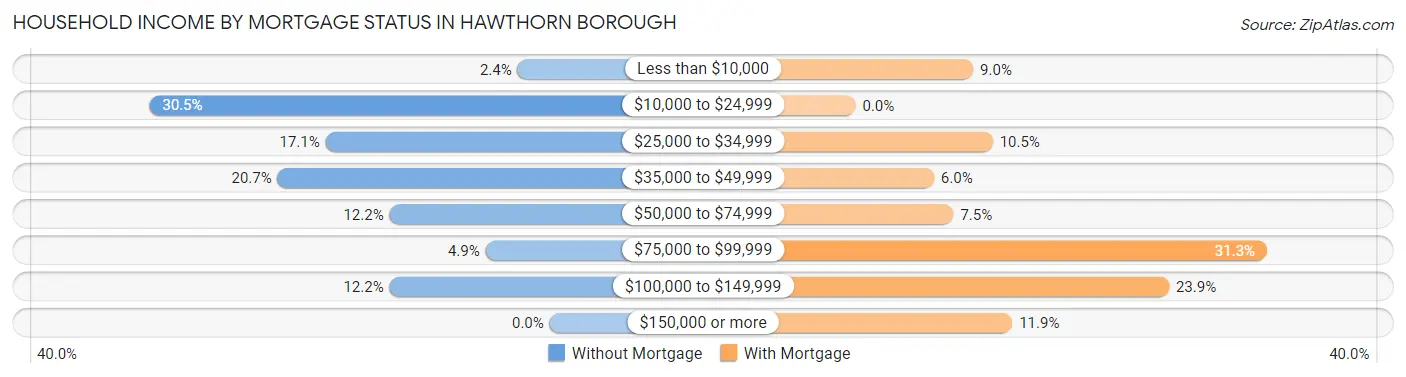
| Household Income | Without Mortgage | With Mortgage |
| Less than $10,000 | 2 (2.4%) | 6 (9.0%) |
| $10,000 to $24,999 | 25 (30.5%) | 0 (0.0%) |
| $25,000 to $34,999 | 14 (17.1%) | 7 (10.4%) |
| $35,000 to $49,999 | 17 (20.7%) | 4 (6.0%) |
| $50,000 to $74,999 | 10 (12.2%) | 5 (7.5%) |
| $75,000 to $99,999 | 4 (4.9%) | 21 (31.3%) |
| $100,000 to $149,999 | 10 (12.2%) | 16 (23.9%) |
| $150,000 or more | 0 (0.0%) | 8 (11.9%) |
| Total | 82 (100.0%) | 67 (100.0%) |
Property Value to Household Income Ratio in Hawthorn borough
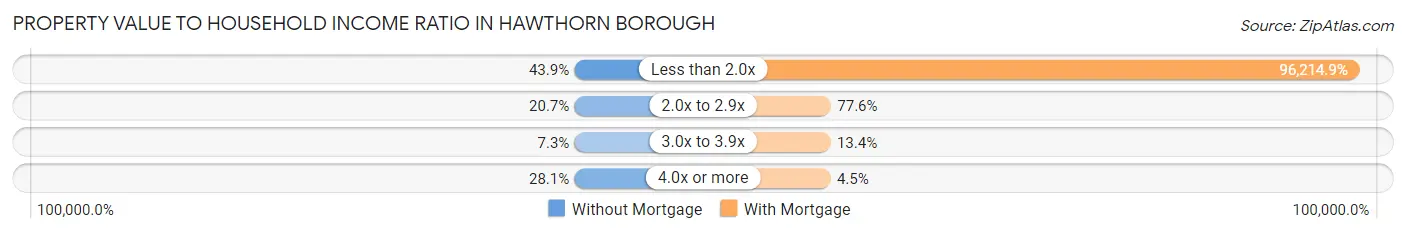
| Value-to-Income Ratio | Without Mortgage | With Mortgage |
| Less than 2.0x | 36 (43.9%) | 64,464 (96,214.9%) |
| 2.0x to 2.9x | 17 (20.7%) | 52 (77.6%) |
| 3.0x to 3.9x | 6 (7.3%) | 9 (13.4%) |
| 4.0x or more | 23 (28.1%) | 3 (4.5%) |
| Total | 82 (100.0%) | 67 (100.0%) |
Real Estate Taxes by Mortgage Status in Hawthorn borough
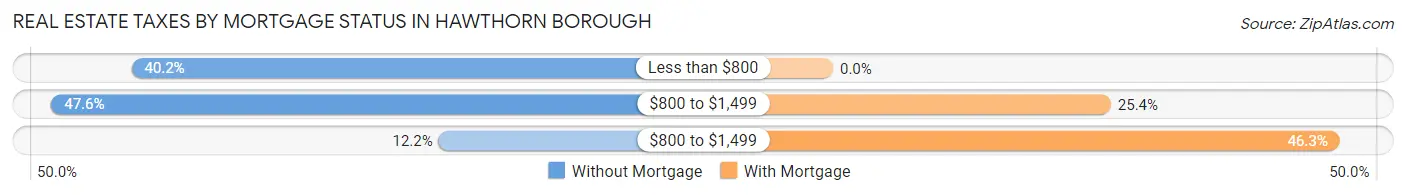
| Property Taxes | Without Mortgage | With Mortgage |
| Less than $800 | 33 (40.2%) | 0 (0.0%) |
| $800 to $1,499 | 39 (47.6%) | 17 (25.4%) |
| $800 to $1,499 | 10 (12.2%) | 31 (46.3%) |
| Total | 82 (100.0%) | 67 (100.0%) |
Health & Disability in Hawthorn borough
Health Insurance Coverage by Age in Hawthorn borough
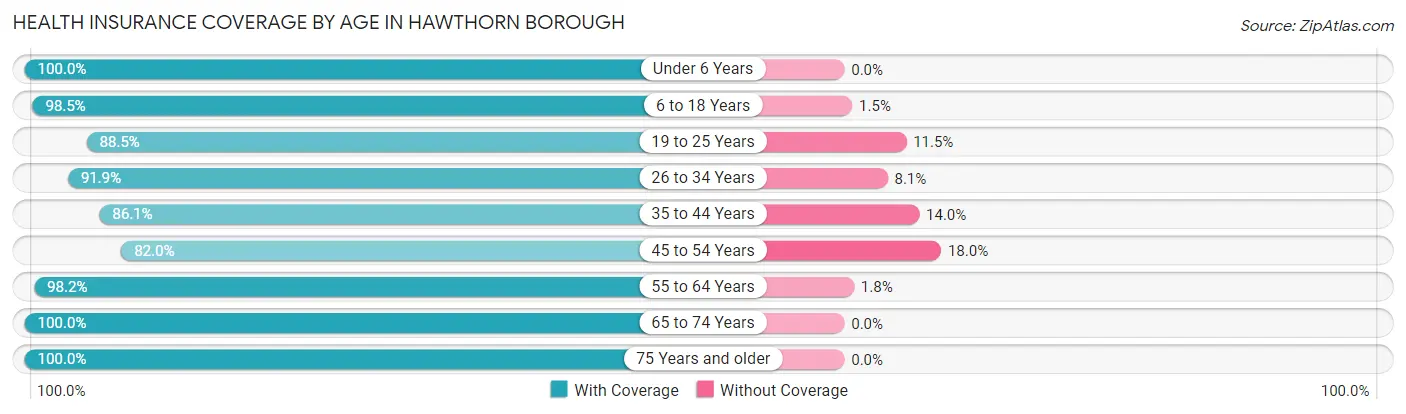
| Age Bracket | With Coverage | Without Coverage |
| Under 6 Years | 40 (100.0%) | 0 (0.0%) |
| 6 to 18 Years | 67 (98.5%) | 1 (1.5%) |
| 19 to 25 Years | 23 (88.5%) | 3 (11.5%) |
| 26 to 34 Years | 57 (91.9%) | 5 (8.1%) |
| 35 to 44 Years | 37 (86.1%) | 6 (14.0%) |
| 45 to 54 Years | 50 (82.0%) | 11 (18.0%) |
| 55 to 64 Years | 55 (98.2%) | 1 (1.8%) |
| 65 to 74 Years | 59 (100.0%) | 0 (0.0%) |
| 75 Years and older | 60 (100.0%) | 0 (0.0%) |
| Total | 448 (94.3%) | 27 (5.7%) |
Health Insurance Coverage by Citizenship Status in Hawthorn borough
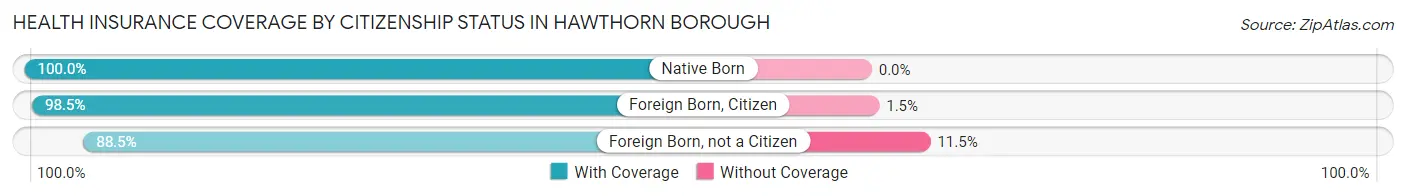
| Citizenship Status | With Coverage | Without Coverage |
| Native Born | 40 (100.0%) | 0 (0.0%) |
| Foreign Born, Citizen | 67 (98.5%) | 1 (1.5%) |
| Foreign Born, not a Citizen | 23 (88.5%) | 3 (11.5%) |
Health Insurance Coverage by Household Income in Hawthorn borough
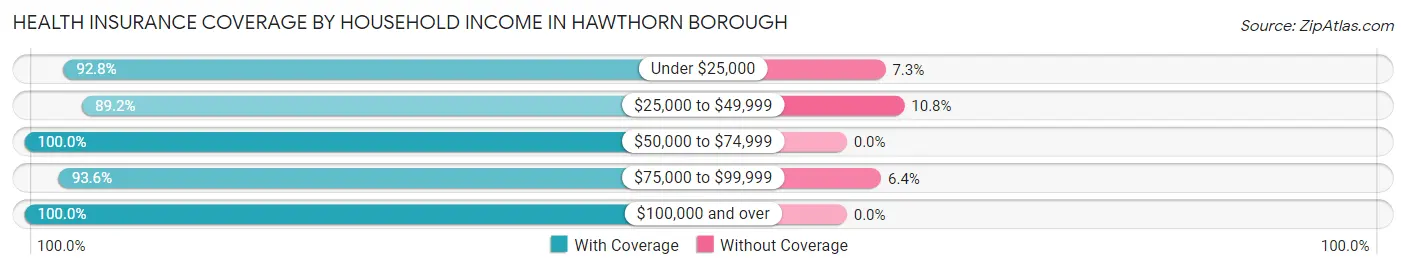
| Household Income | With Coverage | Without Coverage |
| Under $25,000 | 64 (92.7%) | 5 (7.2%) |
| $25,000 to $49,999 | 124 (89.2%) | 15 (10.8%) |
| $50,000 to $74,999 | 75 (100.0%) | 0 (0.0%) |
| $75,000 to $99,999 | 102 (93.6%) | 7 (6.4%) |
| $100,000 and over | 83 (100.0%) | 0 (0.0%) |
Public vs Private Health Insurance Coverage by Age in Hawthorn borough
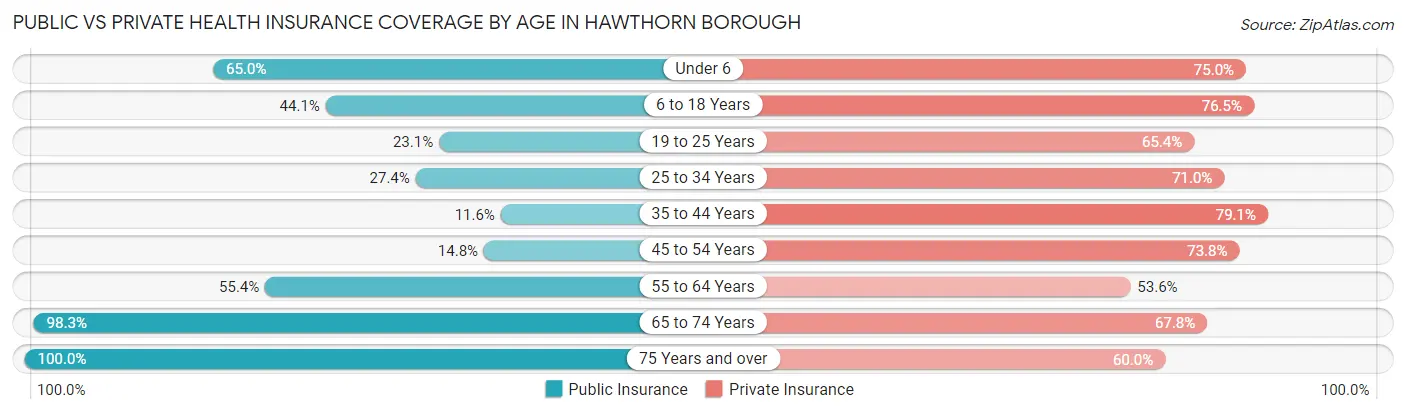
| Age Bracket | Public Insurance | Private Insurance |
| Under 6 | 26 (65.0%) | 30 (75.0%) |
| 6 to 18 Years | 30 (44.1%) | 52 (76.5%) |
| 19 to 25 Years | 6 (23.1%) | 17 (65.4%) |
| 25 to 34 Years | 17 (27.4%) | 44 (71.0%) |
| 35 to 44 Years | 5 (11.6%) | 34 (79.1%) |
| 45 to 54 Years | 9 (14.7%) | 45 (73.8%) |
| 55 to 64 Years | 31 (55.4%) | 30 (53.6%) |
| 65 to 74 Years | 58 (98.3%) | 40 (67.8%) |
| 75 Years and over | 60 (100.0%) | 36 (60.0%) |
| Total | 242 (50.9%) | 328 (69.1%) |
Disability Status by Sex by Age in Hawthorn borough
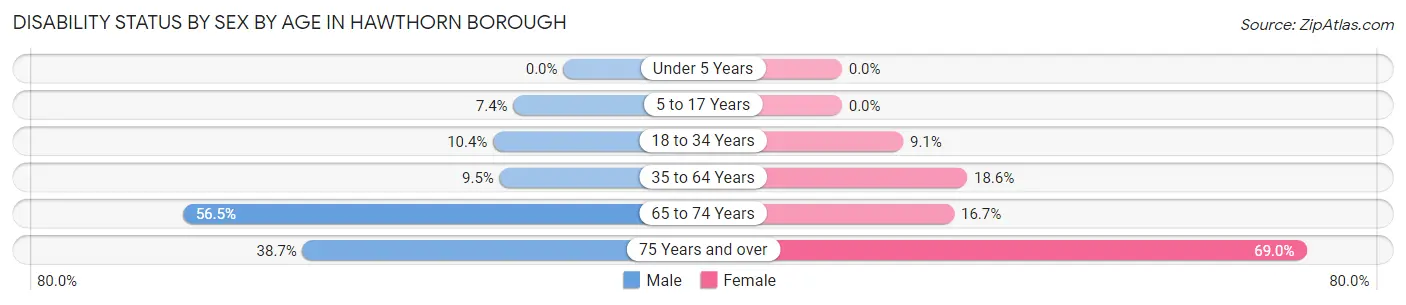
| Age Bracket | Male | Female |
| Under 5 Years | 0 (0.0%) | 0 (0.0%) |
| 5 to 17 Years | 2 (7.4%) | 0 (0.0%) |
| 18 to 34 Years | 5 (10.4%) | 4 (9.1%) |
| 35 to 64 Years | 7 (9.5%) | 16 (18.6%) |
| 65 to 74 Years | 13 (56.5%) | 6 (16.7%) |
| 75 Years and over | 12 (38.7%) | 20 (69.0%) |
Disability Class by Sex by Age in Hawthorn borough
Disability Class: Hearing Difficulty
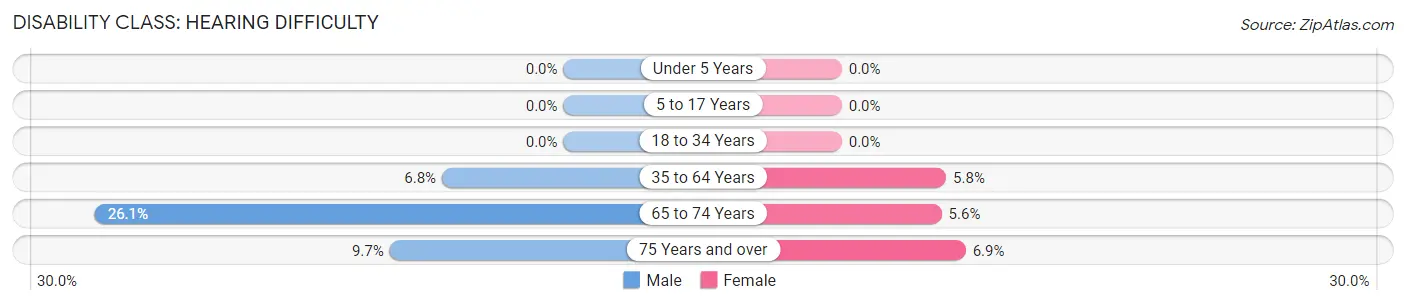
| Age Bracket | Male | Female |
| Under 5 Years | 0 (0.0%) | 0 (0.0%) |
| 5 to 17 Years | 0 (0.0%) | 0 (0.0%) |
| 18 to 34 Years | 0 (0.0%) | 0 (0.0%) |
| 35 to 64 Years | 5 (6.8%) | 5 (5.8%) |
| 65 to 74 Years | 6 (26.1%) | 2 (5.6%) |
| 75 Years and over | 3 (9.7%) | 2 (6.9%) |
Disability Class: Vision Difficulty
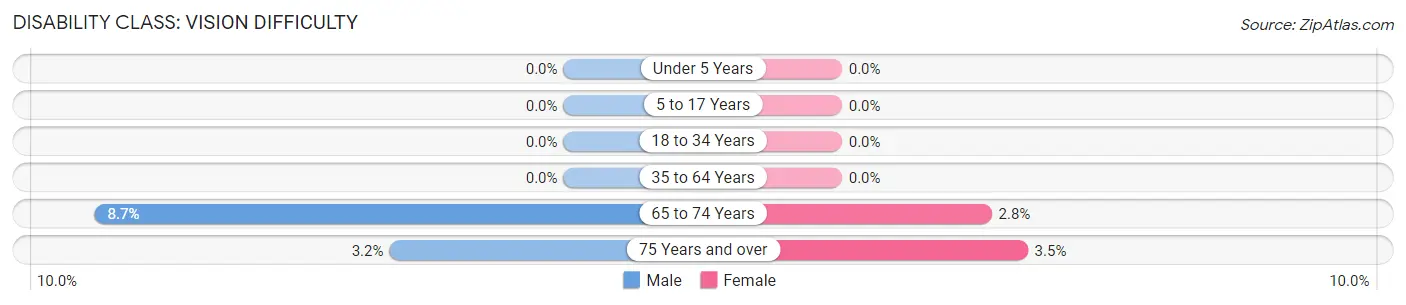
| Age Bracket | Male | Female |
| Under 5 Years | 0 (0.0%) | 0 (0.0%) |
| 5 to 17 Years | 0 (0.0%) | 0 (0.0%) |
| 18 to 34 Years | 0 (0.0%) | 0 (0.0%) |
| 35 to 64 Years | 0 (0.0%) | 0 (0.0%) |
| 65 to 74 Years | 2 (8.7%) | 1 (2.8%) |
| 75 Years and over | 1 (3.2%) | 1 (3.5%) |
Disability Class: Cognitive Difficulty
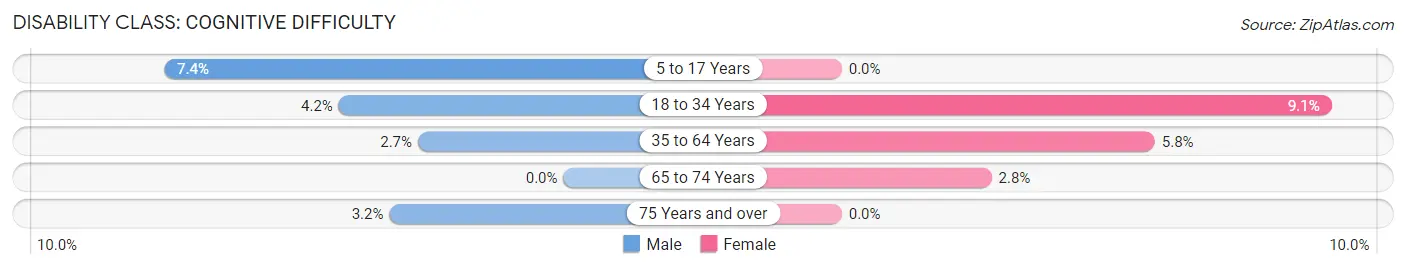
| Age Bracket | Male | Female |
| 5 to 17 Years | 2 (7.4%) | 0 (0.0%) |
| 18 to 34 Years | 2 (4.2%) | 4 (9.1%) |
| 35 to 64 Years | 2 (2.7%) | 5 (5.8%) |
| 65 to 74 Years | 0 (0.0%) | 1 (2.8%) |
| 75 Years and over | 1 (3.2%) | 0 (0.0%) |
Disability Class: Ambulatory Difficulty
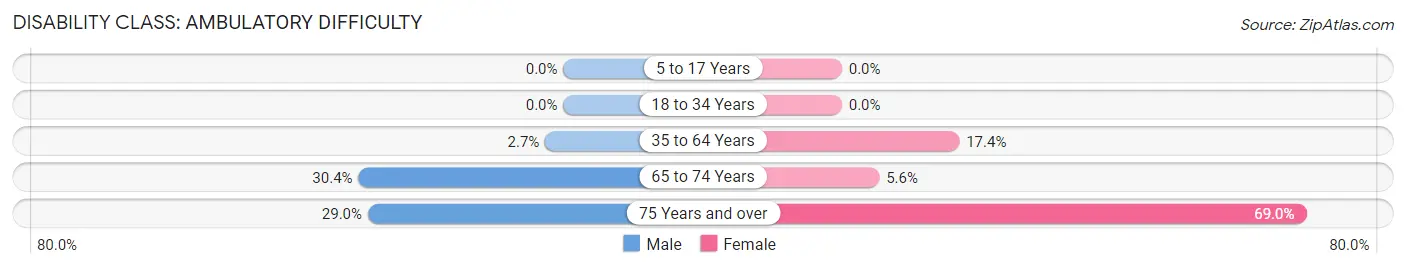
| Age Bracket | Male | Female |
| 5 to 17 Years | 0 (0.0%) | 0 (0.0%) |
| 18 to 34 Years | 0 (0.0%) | 0 (0.0%) |
| 35 to 64 Years | 2 (2.7%) | 15 (17.4%) |
| 65 to 74 Years | 7 (30.4%) | 2 (5.6%) |
| 75 Years and over | 9 (29.0%) | 20 (69.0%) |
Disability Class: Self-Care Difficulty
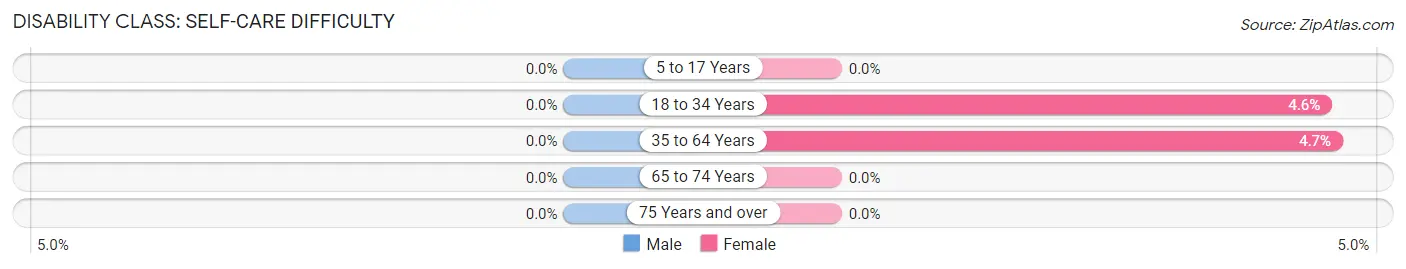
| Age Bracket | Male | Female |
| 5 to 17 Years | 0 (0.0%) | 0 (0.0%) |
| 18 to 34 Years | 0 (0.0%) | 2 (4.5%) |
| 35 to 64 Years | 0 (0.0%) | 4 (4.6%) |
| 65 to 74 Years | 0 (0.0%) | 0 (0.0%) |
| 75 Years and over | 0 (0.0%) | 0 (0.0%) |
Technology Access in Hawthorn borough
Computing Device Access in Hawthorn borough
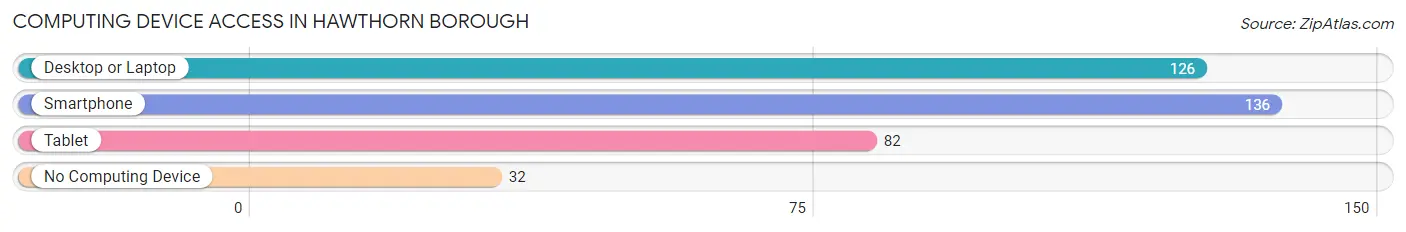
| Device Type | # Households | % Households |
| Desktop or Laptop | 126 | 64.3% |
| Smartphone | 136 | 69.4% |
| Tablet | 82 | 41.8% |
| No Computing Device | 32 | 16.3% |
| Total | 196 | 100.0% |
Internet Access in Hawthorn borough
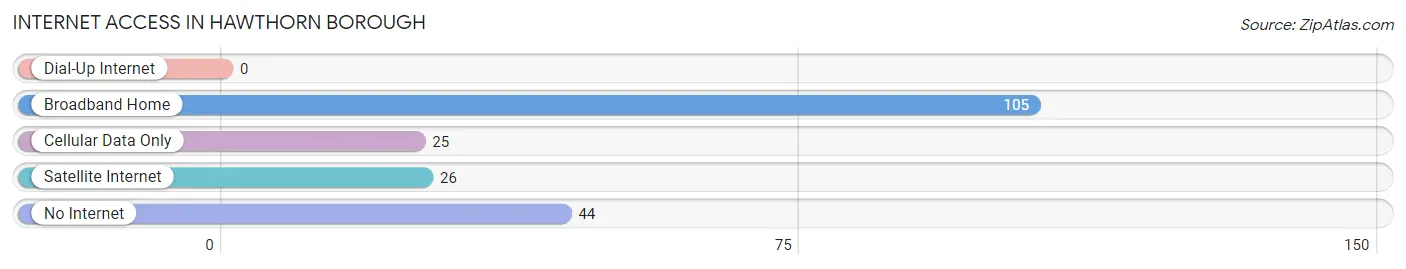
| Internet Type | # Households | % Households |
| Dial-Up Internet | 0 | 0.0% |
| Broadband Home | 105 | 53.6% |
| Cellular Data Only | 25 | 12.8% |
| Satellite Internet | 26 | 13.3% |
| No Internet | 44 | 22.5% |
| Total | 196 | 100.0% |
Hawthorn borough Summary
Hawthorn Borough is a small borough located in Westmoreland County, Pennsylvania. It is situated in the Laurel Highlands region of the state, approximately 40 miles southeast of Pittsburgh. The borough is home to a population of approximately 1,400 people, and is part of the Greater Pittsburgh Metropolitan Area.
History
The area that is now Hawthorn Borough was first settled in the late 1700s by a group of German immigrants. The town was originally known as “Hoffman’s Crossroads”, named after the Hoffman family who owned the land. In 1845, the town was officially incorporated as Hawthorn Borough. The name was chosen to honor the Hawthorn family, who had been prominent in the area since the early 1800s.
The town grew slowly over the next several decades, and by the early 1900s had become a popular destination for tourists. The town was known for its scenic beauty, and was home to several resorts and hotels. In the 1920s, the town was connected to the rest of the state by the Pennsylvania Railroad, which allowed for increased tourism and economic growth.
Geography
Hawthorn Borough is located in the Laurel Highlands region of Pennsylvania. It is situated in the foothills of the Allegheny Mountains, and is approximately 40 miles southeast of Pittsburgh. The borough is bordered by the towns of Loyalhanna, Ligonier, and Donegal. The borough is situated on the banks of the Loyalhanna Creek, and is home to several small lakes and ponds.
The borough has a total area of 1.2 square miles, all of which is land. The borough is located at an elevation of 1,400 feet above sea level. The climate in the area is classified as humid continental, with cold winters and hot, humid summers.
Economy
The economy of Hawthorn Borough is largely based on tourism and retail. The town is home to several small businesses, including restaurants, shops, and galleries. The town is also home to several resorts and hotels, which attract visitors from all over the region.
The town is also home to several manufacturing companies, including a paper mill and a furniture factory. The town is also home to several small farms, which produce a variety of crops and livestock.
Demographics
As of the 2010 census, the population of Hawthorn Borough was 1,400. The racial makeup of the borough was 97.3% White, 0.7% African American, 0.3% Native American, 0.3% Asian, and 1.3% from other races. Hispanic or Latino of any race were 1.3% of the population.
The median household income in the borough was $41,250, and the median family income was $50,000. The per capita income for the borough was $20,000. About 8.3% of families and 10.3% of the population were below the poverty line, including 14.3% of those under the age of 18 and 6.7% of those 65 and older.
Conclusion
Hawthorn Borough is a small borough located in Westmoreland County, Pennsylvania. It is situated in the Laurel Highlands region of the state, approximately 40 miles southeast of Pittsburgh. The borough is home to a population of approximately 1,400 people, and is part of the Greater Pittsburgh Metropolitan Area. The economy of the borough is largely based on tourism and retail, and the town is home to several small businesses, resorts, and manufacturing companies. The racial makeup of the borough is predominantly White, with a small percentage of African American, Native American, and Asian residents. The median household income in the borough is $41,250, and the per capita income is $20,000.
Common Questions
What is Per Capita Income in Hawthorn borough?
Per Capita income in Hawthorn borough is $23,570.
What is the Median Family Income in Hawthorn borough?
Median Family Income in Hawthorn borough is $57,917.
What is the Median Household income in Hawthorn borough?
Median Household Income in Hawthorn borough is $43,929.
What is Income or Wage Gap in Hawthorn borough?
Income or Wage Gap in Hawthorn borough is 47.8%.
Women in Hawthorn borough earn 52.2 cents for every dollar earned by a man.
What is Inequality or Gini Index in Hawthorn borough?
Inequality or Gini Index in Hawthorn borough is 0.40.
What is the Total Population of Hawthorn borough?
Total Population of Hawthorn borough is 480.
What is the Total Male Population of Hawthorn borough?
Total Male Population of Hawthorn borough is 231.
What is the Total Female Population of Hawthorn borough?
Total Female Population of Hawthorn borough is 249.
What is the Ratio of Males per 100 Females in Hawthorn borough?
There are 92.77 Males per 100 Females in Hawthorn borough.
What is the Ratio of Females per 100 Males in Hawthorn borough?
There are 107.79 Females per 100 Males in Hawthorn borough.
What is the Median Population Age in Hawthorn borough?
Median Population Age in Hawthorn borough is 45.1 Years.
What is the Average Family Size in Hawthorn borough
Average Family Size in Hawthorn borough is 3.0 People.
What is the Average Household Size in Hawthorn borough
Average Household Size in Hawthorn borough is 2.5 People.
How Large is the Labor Force in Hawthorn borough?
There are 224 People in the Labor Forcein in Hawthorn borough.
What is the Percentage of People in the Labor Force in Hawthorn borough?
57.1% of People are in the Labor Force in Hawthorn borough.
What is the Unemployment Rate in Hawthorn borough?
Unemployment Rate in Hawthorn borough is 9.1%.