Elkland borough, PA Map & Demographics
Elkland borough Overview
$32,514
PER CAPITA INCOME
$85,795
AVG FAMILY INCOME
$57,375
AVG HOUSEHOLD INCOME
9.0%
WAGE / INCOME GAP [ % ]
91.0¢/ $1
WAGE / INCOME GAP [ $ ]
0.43
INEQUALITY / GINI INDEX
1,673
TOTAL POPULATION
770
MALE POPULATION
903
FEMALE POPULATION
85.27
MALES / 100 FEMALES
117.27
FEMALES / 100 MALES
44.9
MEDIAN AGE
3.0
AVG FAMILY SIZE
2.4
AVG HOUSEHOLD SIZE
750
LABOR FORCE [ PEOPLE ]
54.0%
PERCENT IN LABOR FORCE
4.1%
UNEMPLOYMENT RATE
Income in Elkland borough
Income Overview in Elkland borough
Per Capita Income in Elkland borough is $32,514, while median incomes of families and households are $85,795 and $57,375 respectively.
| Characteristic | Number | Measure |
| Per Capita Income | 1,673 | $32,514 |
| Median Family Income | 433 | $85,795 |
| Mean Family Income | 433 | $90,243 |
| Median Household Income | 703 | $57,375 |
| Mean Household Income | 703 | $71,729 |
| Income Deficit | 433 | $0 |
| Wage / Income Gap (%) | 1,673 | 8.98% |
| Wage / Income Gap ($) | 1,673 | 91.02¢ per $1 |
| Gini / Inequality Index | 1,673 | 0.43 |
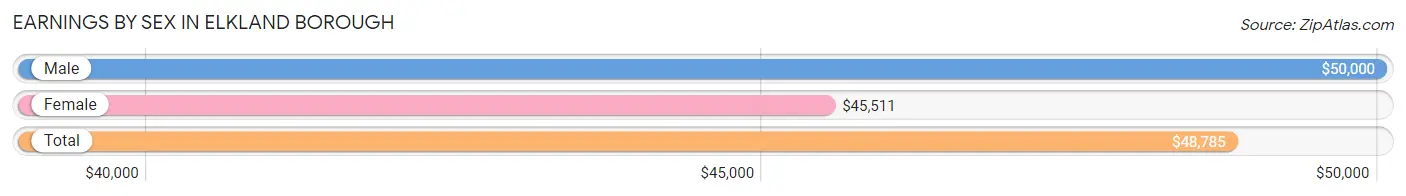
Earnings by Sex in Elkland borough
Average Earnings in Elkland borough are $48,785, $50,000 for men and $45,511 for women, a difference of 9.0%.
| Sex | Number | Average Earnings |
| Male | 378 (49.4%) | $50,000 |
| Female | 387 (50.6%) | $45,511 |
| Total | 765 (100.0%) | $48,785 |
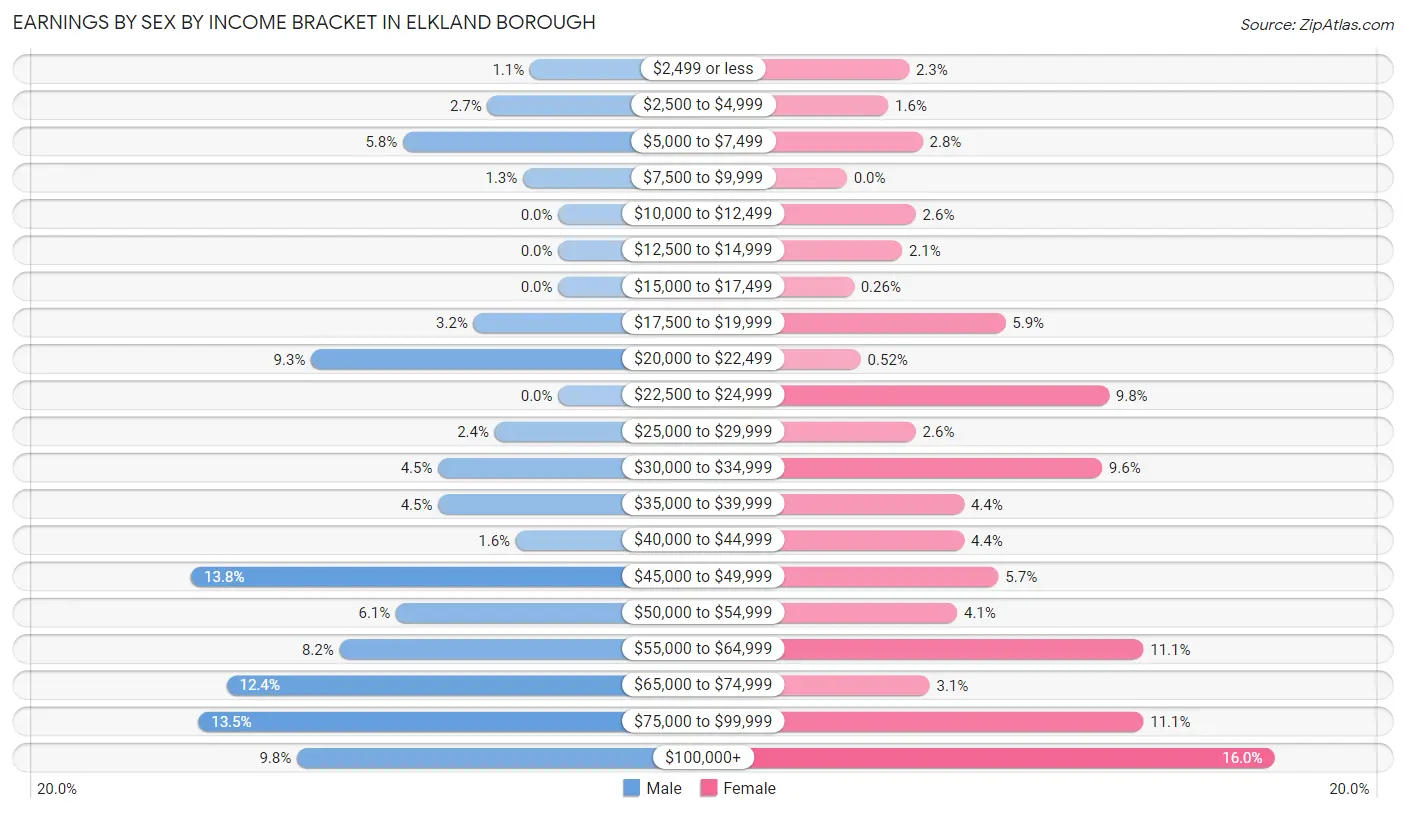
Earnings by Sex by Income Bracket in Elkland borough
The most common earnings brackets in Elkland borough are $45,000 to $49,999 for men (52 | 13.8%) and $100,000+ for women (62 | 16.0%).
| Income | Male | Female |
| $2,499 or less | 4 (1.1%) | 9 (2.3%) |
| $2,500 to $4,999 | 10 (2.6%) | 6 (1.5%) |
| $5,000 to $7,499 | 22 (5.8%) | 11 (2.8%) |
| $7,500 to $9,999 | 5 (1.3%) | 0 (0.0%) |
| $10,000 to $12,499 | 0 (0.0%) | 10 (2.6%) |
| $12,500 to $14,999 | 0 (0.0%) | 8 (2.1%) |
| $15,000 to $17,499 | 0 (0.0%) | 1 (0.3%) |
| $17,500 to $19,999 | 12 (3.2%) | 23 (5.9%) |
| $20,000 to $22,499 | 35 (9.3%) | 2 (0.5%) |
| $22,500 to $24,999 | 0 (0.0%) | 38 (9.8%) |
| $25,000 to $29,999 | 9 (2.4%) | 10 (2.6%) |
| $30,000 to $34,999 | 17 (4.5%) | 37 (9.6%) |
| $35,000 to $39,999 | 17 (4.5%) | 17 (4.4%) |
| $40,000 to $44,999 | 6 (1.6%) | 17 (4.4%) |
| $45,000 to $49,999 | 52 (13.8%) | 22 (5.7%) |
| $50,000 to $54,999 | 23 (6.1%) | 16 (4.1%) |
| $55,000 to $64,999 | 31 (8.2%) | 43 (11.1%) |
| $65,000 to $74,999 | 47 (12.4%) | 12 (3.1%) |
| $75,000 to $99,999 | 51 (13.5%) | 43 (11.1%) |
| $100,000+ | 37 (9.8%) | 62 (16.0%) |
| Total | 378 (100.0%) | 387 (100.0%) |
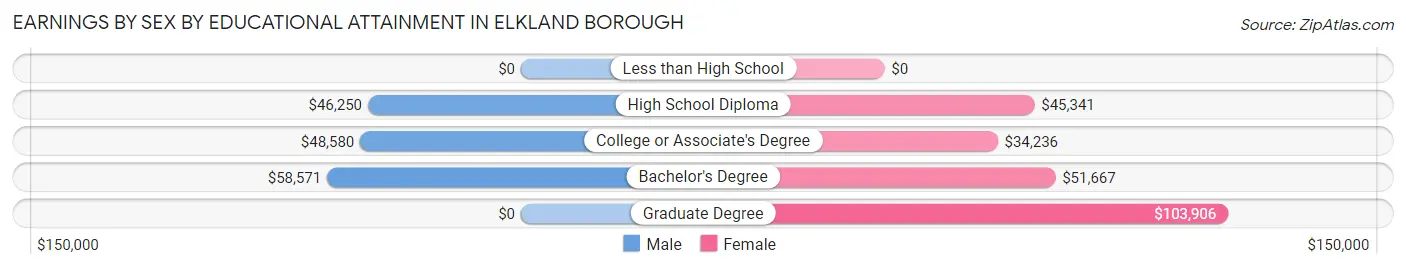
Earnings by Sex by Educational Attainment in Elkland borough
Average earnings in Elkland borough are $50,667 for men and $50,625 for women, a difference of 0.1%. Men with an educational attainment of bachelor's degree enjoy the highest average annual earnings of $58,571, while those with high school diploma education earn the least with $46,250. Women with an educational attainment of graduate degree earn the most with the average annual earnings of $103,906, while those with college or associate's degree education have the smallest earnings of $34,236.
| Educational Attainment | Male Income | Female Income |
| Less than High School | - | - |
| High School Diploma | $46,250 | $45,341 |
| College or Associate's Degree | $48,580 | $34,236 |
| Bachelor's Degree | $58,571 | $51,667 |
| Graduate Degree | - | - |
| Total | $50,667 | $50,625 |
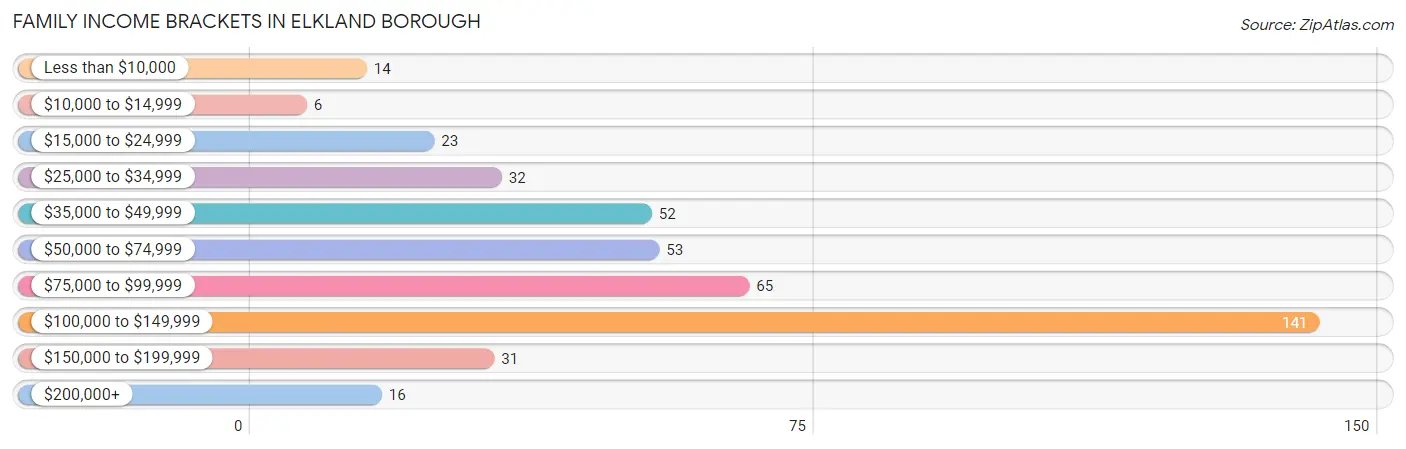
Family Income in Elkland borough
Family Income Brackets in Elkland borough
According to the Elkland borough family income data, there are 141 families falling into the $100,000 to $149,999 income range, which is the most common income bracket and makes up 32.6% of all families. Conversely, the $10,000 to $14,999 income bracket is the least frequent group with only 6 families (1.4%) belonging to this category.
| Income Bracket | # Families | % Families |
| Less than $10,000 | 14 | 3.2% |
| $10,000 to $14,999 | 6 | 1.4% |
| $15,000 to $24,999 | 23 | 5.3% |
| $25,000 to $34,999 | 32 | 7.4% |
| $35,000 to $49,999 | 52 | 12.0% |
| $50,000 to $74,999 | 53 | 12.2% |
| $75,000 to $99,999 | 65 | 15.0% |
| $100,000 to $149,999 | 141 | 32.6% |
| $150,000 to $199,999 | 31 | 7.2% |
| $200,000+ | 16 | 3.7% |
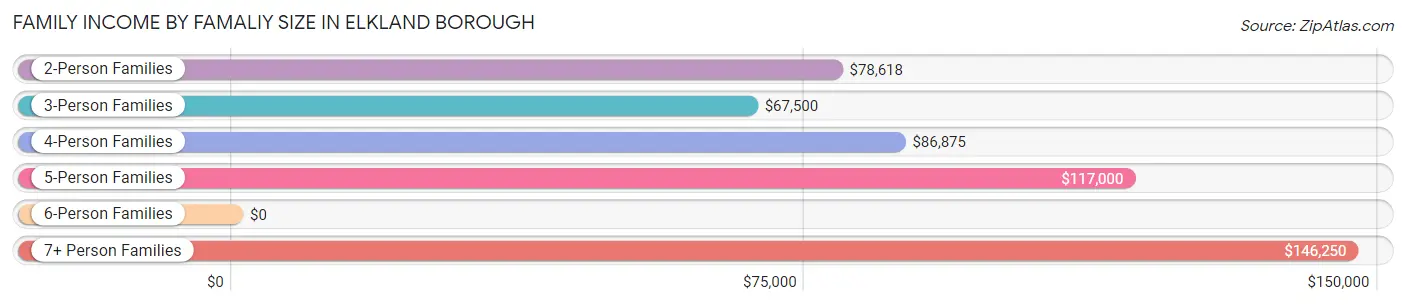
Family Income by Famaliy Size in Elkland borough
7+ person families (14 | 3.2%) account for the highest median family income in Elkland borough with $146,250 per family, while 2-person families (247 | 57.0%) have the highest median income of $39,309 per family member.
| Income Bracket | # Families | Median Income |
| 2-Person Families | 247 (57.0%) | $78,618 |
| 3-Person Families | 50 (11.6%) | $67,500 |
| 4-Person Families | 91 (21.0%) | $86,875 |
| 5-Person Families | 30 (6.9%) | $117,000 |
| 6-Person Families | 1 (0.2%) | $0 |
| 7+ Person Families | 14 (3.2%) | $146,250 |
| Total | 433 (100.0%) | $85,795 |
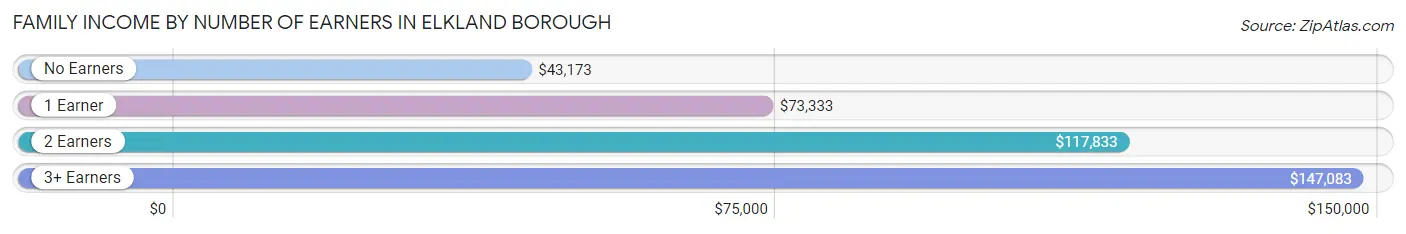
Family Income by Number of Earners in Elkland borough
The median family income in Elkland borough is $85,795, with families comprising 3+ earners (16) having the highest median family income of $147,083, while families with no earners (83) have the lowest median family income of $43,173, accounting for 3.7% and 19.2% of families, respectively.
| Number of Earners | # Families | Median Income |
| No Earners | 83 (19.2%) | $43,173 |
| 1 Earner | 160 (36.9%) | $73,333 |
| 2 Earners | 174 (40.2%) | $117,833 |
| 3+ Earners | 16 (3.7%) | $147,083 |
| Total | 433 (100.0%) | $85,795 |
Household Income in Elkland borough
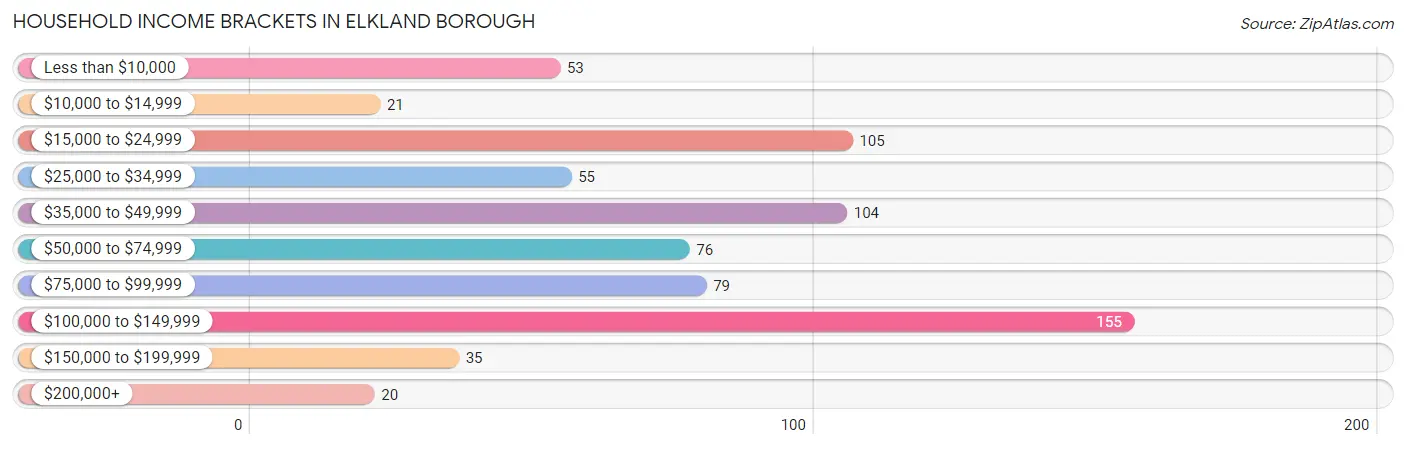
Household Income Brackets in Elkland borough
With 155 households falling in the category, the $100,000 to $149,999 income range is the most frequent in Elkland borough, accounting for 22.1% of all households. In contrast, only 20 households (2.8%) fall into the $200,000+ income bracket, making it the least populous group.
| Income Bracket | # Households | % Households |
| Less than $10,000 | 53 | 7.5% |
| $10,000 to $14,999 | 21 | 3.0% |
| $15,000 to $24,999 | 105 | 14.9% |
| $25,000 to $34,999 | 55 | 7.8% |
| $35,000 to $49,999 | 104 | 14.8% |
| $50,000 to $74,999 | 76 | 10.8% |
| $75,000 to $99,999 | 79 | 11.2% |
| $100,000 to $149,999 | 155 | 22.0% |
| $150,000 to $199,999 | 35 | 5.0% |
| $200,000+ | 20 | 2.8% |
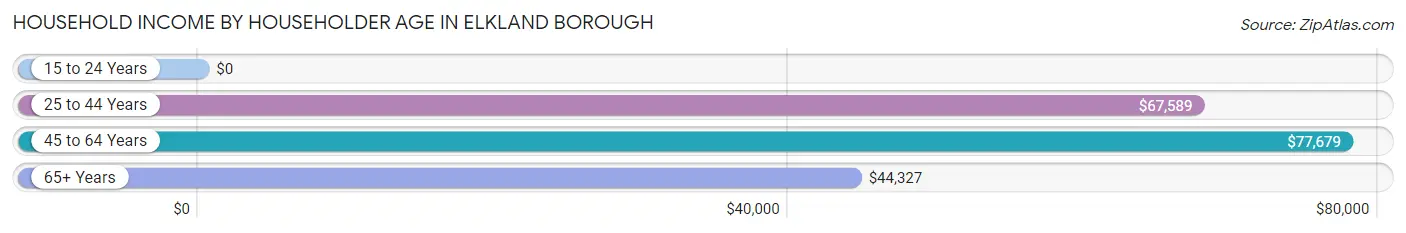
Household Income by Householder Age in Elkland borough
The median household income in Elkland borough is $57,375, with the highest median household income of $77,679 found in the 45 to 64 years age bracket for the primary householder. A total of 229 households (32.6%) fall into this category. Meanwhile, the 15 to 24 years age bracket for the primary householder has the lowest median household income of $0, with 20 households (2.8%) in this group.
| Income Bracket | # Households | Median Income |
| 15 to 24 Years | 20 (2.8%) | $0 |
| 25 to 44 Years | 209 (29.7%) | $67,589 |
| 45 to 64 Years | 229 (32.6%) | $77,679 |
| 65+ Years | 245 (34.8%) | $44,327 |
| Total | 703 (100.0%) | $57,375 |
Poverty in Elkland borough
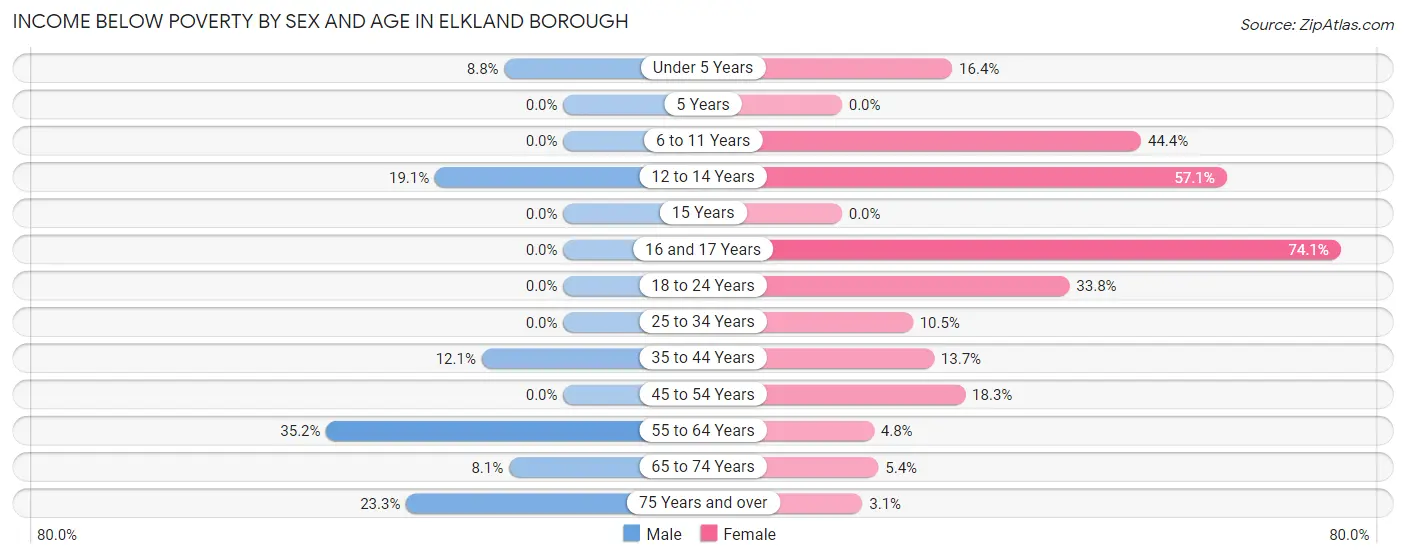
Income Below Poverty by Sex and Age in Elkland borough
With 10.5% poverty level for males and 16.7% for females among the residents of Elkland borough, 55 to 64 year old males and 16 and 17 year old females are the most vulnerable to poverty, with 38 males (35.2%) and 20 females (74.1%) in their respective age groups living below the poverty level.
| Age Bracket | Male | Female |
| Under 5 Years | 7 (8.7%) | 10 (16.4%) |
| 5 Years | 0 (0.0%) | 0 (0.0%) |
| 6 to 11 Years | 0 (0.0%) | 16 (44.4%) |
| 12 to 14 Years | 4 (19.1%) | 16 (57.1%) |
| 15 Years | 0 (0.0%) | 0 (0.0%) |
| 16 and 17 Years | 0 (0.0%) | 20 (74.1%) |
| 18 to 24 Years | 0 (0.0%) | 24 (33.8%) |
| 25 to 34 Years | 0 (0.0%) | 10 (10.5%) |
| 35 to 44 Years | 8 (12.1%) | 16 (13.7%) |
| 45 to 54 Years | 0 (0.0%) | 24 (18.3%) |
| 55 to 64 Years | 38 (35.2%) | 5 (4.8%) |
| 65 to 74 Years | 10 (8.1%) | 5 (5.4%) |
| 75 Years and over | 14 (23.3%) | 4 (3.0%) |
| Total | 81 (10.5%) | 150 (16.7%) |
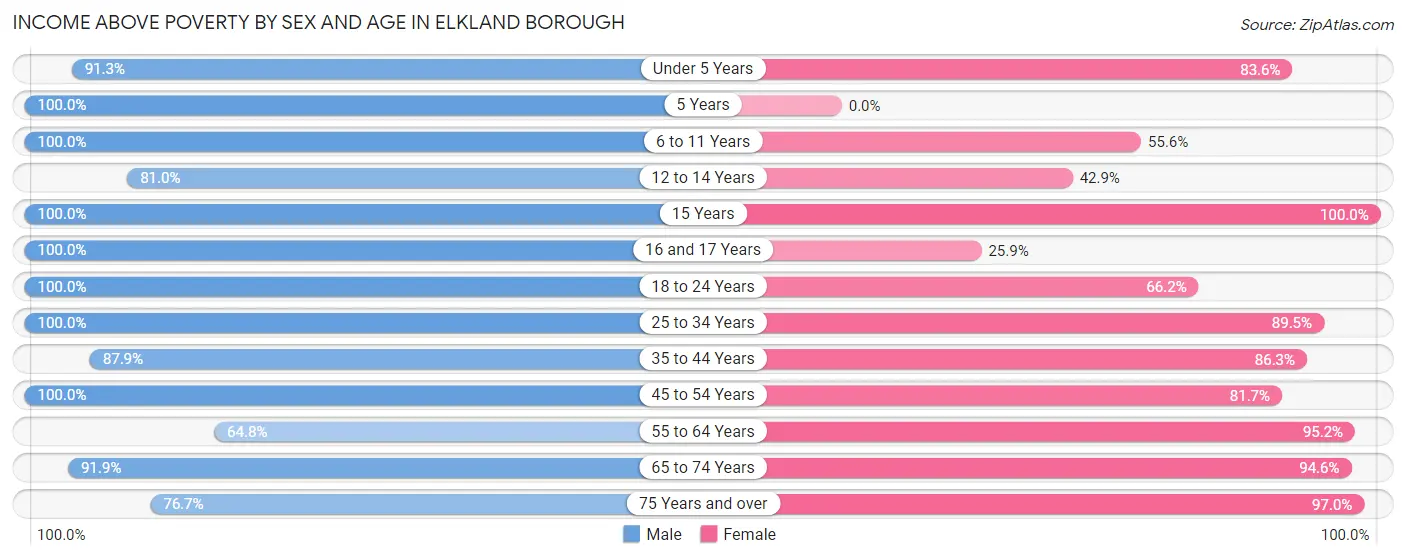
Income Above Poverty by Sex and Age in Elkland borough
According to the poverty statistics in Elkland borough, males aged 5 years and females aged 15 years are the age groups that are most secure financially, with 100.0% of males and 100.0% of females in these age groups living above the poverty line.
| Age Bracket | Male | Female |
| Under 5 Years | 73 (91.2%) | 51 (83.6%) |
| 5 Years | 6 (100.0%) | 0 (0.0%) |
| 6 to 11 Years | 30 (100.0%) | 20 (55.6%) |
| 12 to 14 Years | 17 (80.9%) | 12 (42.9%) |
| 15 Years | 16 (100.0%) | 7 (100.0%) |
| 16 and 17 Years | 11 (100.0%) | 7 (25.9%) |
| 18 to 24 Years | 51 (100.0%) | 47 (66.2%) |
| 25 to 34 Years | 119 (100.0%) | 85 (89.5%) |
| 35 to 44 Years | 58 (87.9%) | 101 (86.3%) |
| 45 to 54 Years | 77 (100.0%) | 107 (81.7%) |
| 55 to 64 Years | 70 (64.8%) | 100 (95.2%) |
| 65 to 74 Years | 114 (91.9%) | 87 (94.6%) |
| 75 Years and over | 46 (76.7%) | 127 (97.0%) |
| Total | 688 (89.5%) | 751 (83.4%) |
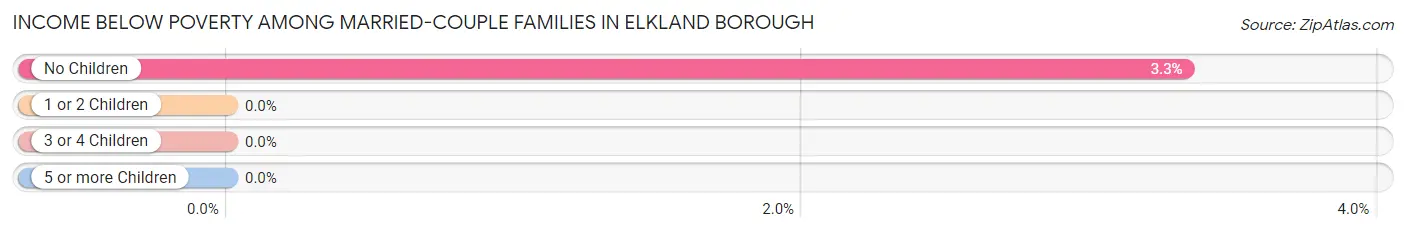
Income Below Poverty Among Married-Couple Families in Elkland borough
The poverty statistics for married-couple families in Elkland borough show that 2.4% or 7 of the total 296 families live below the poverty line. Families with no children have the highest poverty rate of 3.3%, comprising of 7 families. On the other hand, families with 1 or 2 children have the lowest poverty rate of 0.0%, which includes 0 families.
| Children | Above Poverty | Below Poverty |
| No Children | 203 (96.7%) | 7 (3.3%) |
| 1 or 2 Children | 68 (100.0%) | 0 (0.0%) |
| 3 or 4 Children | 10 (100.0%) | 0 (0.0%) |
| 5 or more Children | 8 (100.0%) | 0 (0.0%) |
| Total | 289 (97.6%) | 7 (2.4%) |
Income Below Poverty Among Single-Parent Households in Elkland borough
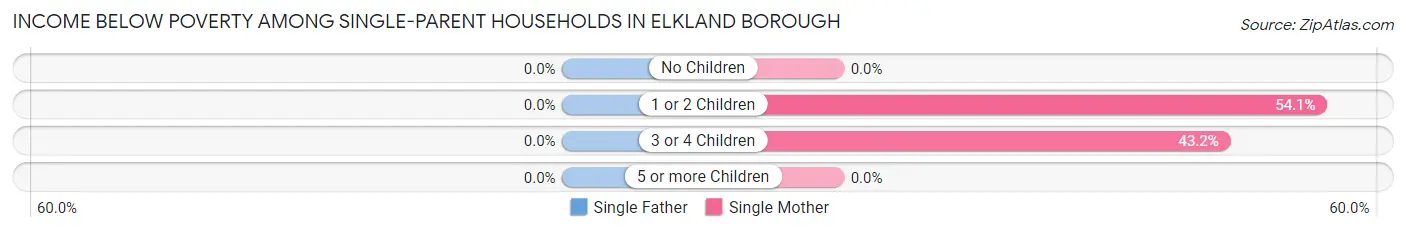
| Children | Single Father | Single Mother |
| No Children | 0 (0.0%) | 0 (0.0%) |
| 1 or 2 Children | 0 (0.0%) | 20 (54.0%) |
| 3 or 4 Children | 0 (0.0%) | 16 (43.2%) |
| 5 or more Children | 0 (0.0%) | 0 (0.0%) |
| Total | 0 (0.0%) | 36 (29.3%) |
Income Below Poverty Among Married-Couple vs Single-Parent Households in Elkland borough
The poverty data for Elkland borough shows that 7 of the married-couple family households (2.4%) and 36 of the single-parent households (26.3%) are living below the poverty level. Within the married-couple family households, those with no children have the highest poverty rate, with 7 households (3.3%) falling below the poverty line. Among the single-parent households, those with 1 or 2 children have the highest poverty rate, with 20 household (45.5%) living below poverty.
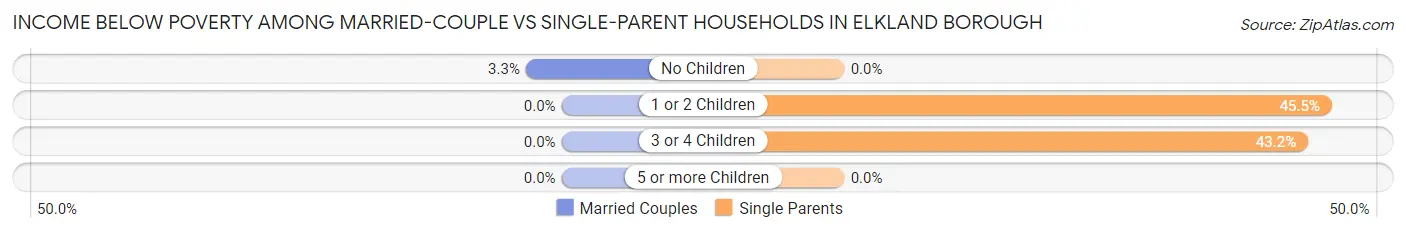
| Children | Married-Couple Families | Single-Parent Households |
| No Children | 7 (3.3%) | 0 (0.0%) |
| 1 or 2 Children | 0 (0.0%) | 20 (45.5%) |
| 3 or 4 Children | 0 (0.0%) | 16 (43.2%) |
| 5 or more Children | 0 (0.0%) | 0 (0.0%) |
| Total | 7 (2.4%) | 36 (26.3%) |
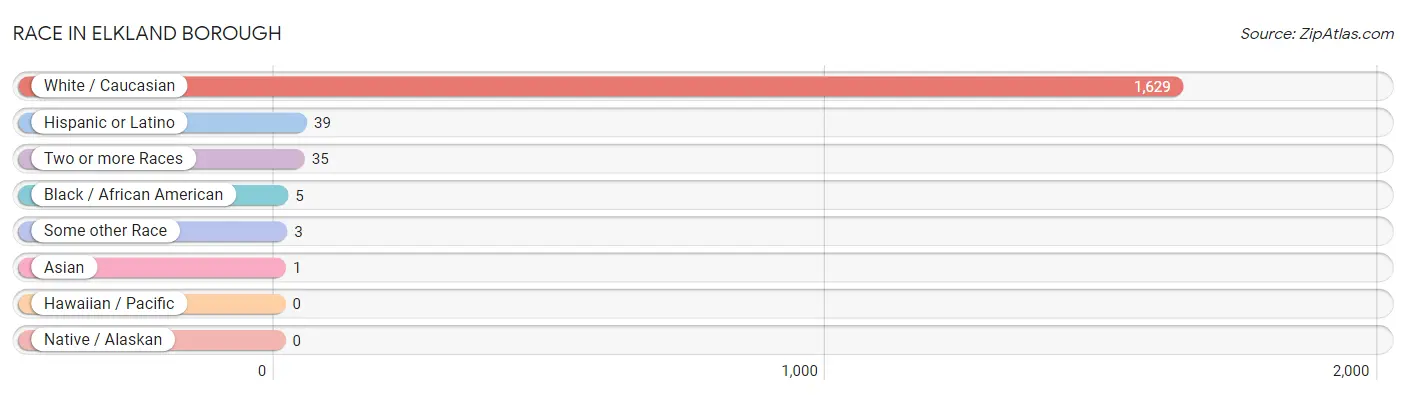
Race in Elkland borough
The most populous races in Elkland borough are White / Caucasian (1,629 | 97.4%), Hispanic or Latino (39 | 2.3%), and Two or more Races (35 | 2.1%).
| Race | # Population | % Population |
| Asian | 1 | 0.1% |
| Black / African American | 5 | 0.3% |
| Hawaiian / Pacific | 0 | 0.0% |
| Hispanic or Latino | 39 | 2.3% |
| Native / Alaskan | 0 | 0.0% |
| White / Caucasian | 1,629 | 97.4% |
| Two or more Races | 35 | 2.1% |
| Some other Race | 3 | 0.2% |
| Total | 1,673 | 100.0% |
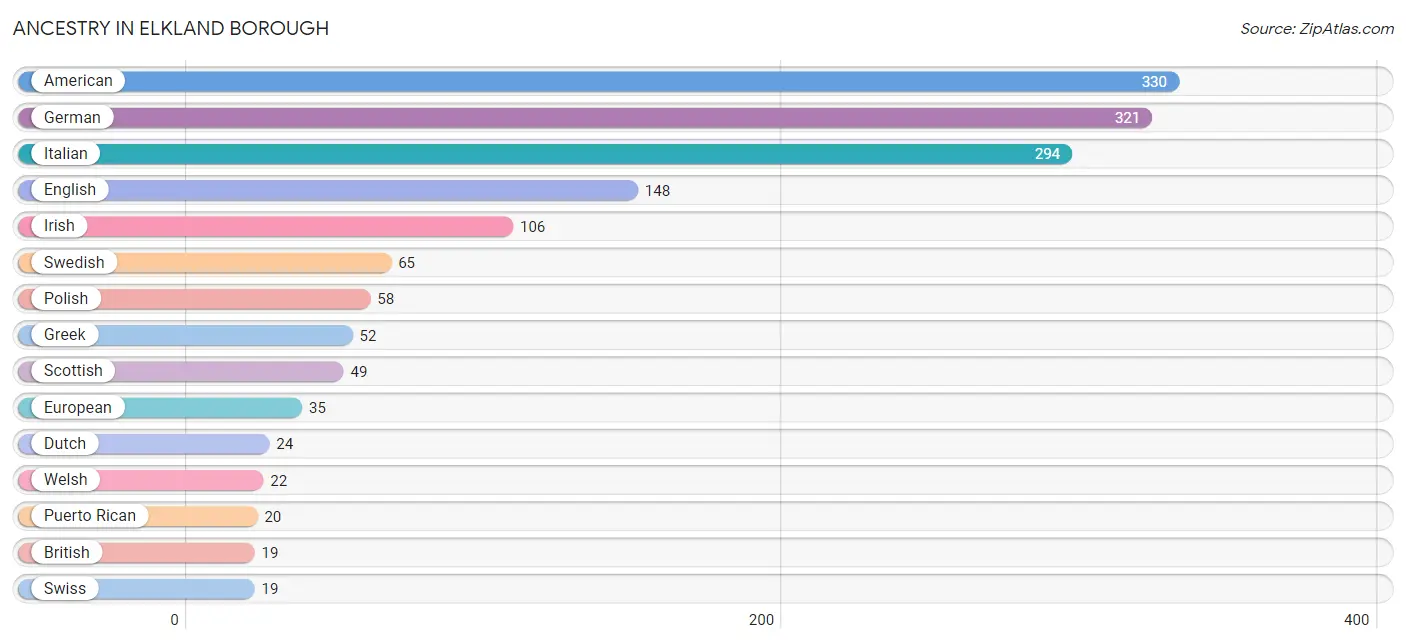
Ancestry in Elkland borough
The most populous ancestries reported in Elkland borough are American (330 | 19.7%), German (321 | 19.2%), Italian (294 | 17.6%), English (148 | 8.8%), and Irish (106 | 6.3%), together accounting for 71.7% of all Elkland borough residents.
| Ancestry | # Population | % Population |
| American | 330 | 19.7% |
| British | 19 | 1.1% |
| Central American | 13 | 0.8% |
| Cherokee | 7 | 0.4% |
| Dutch | 24 | 1.4% |
| English | 148 | 8.8% |
| European | 35 | 2.1% |
| French | 10 | 0.6% |
| German | 321 | 19.2% |
| Greek | 52 | 3.1% |
| Hungarian | 5 | 0.3% |
| Irish | 106 | 6.3% |
| Italian | 294 | 17.6% |
| Korean | 1 | 0.1% |
| Mexican | 6 | 0.4% |
| Norwegian | 9 | 0.5% |
| Polish | 58 | 3.5% |
| Puerto Rican | 20 | 1.2% |
| Russian | 15 | 0.9% |
| Salvadoran | 13 | 0.8% |
| Scandinavian | 3 | 0.2% |
| Scotch-Irish | 14 | 0.8% |
| Scottish | 49 | 2.9% |
| Slovak | 2 | 0.1% |
| Swedish | 65 | 3.9% |
| Swiss | 19 | 1.1% |
| Ukrainian | 7 | 0.4% |
| Welsh | 22 | 1.3% | View All 28 Rows |
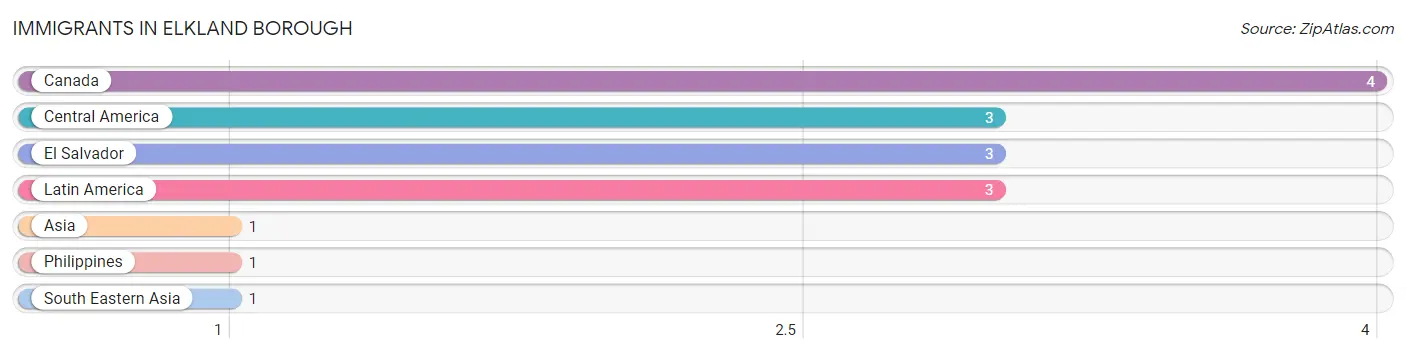
Immigrants in Elkland borough
The most numerous immigrant groups reported in Elkland borough came from Canada (4 | 0.2%), Central America (3 | 0.2%), El Salvador (3 | 0.2%), Latin America (3 | 0.2%), and Asia (1 | 0.1%), together accounting for 0.8% of all Elkland borough residents.
| Immigration Origin | # Population | % Population |
| Asia | 1 | 0.1% |
| Canada | 4 | 0.2% |
| Central America | 3 | 0.2% |
| El Salvador | 3 | 0.2% |
| Latin America | 3 | 0.2% |
| Philippines | 1 | 0.1% |
| South Eastern Asia | 1 | 0.1% | View All 7 Rows |
Sex and Age in Elkland borough
Sex and Age in Elkland borough
The most populous age groups in Elkland borough are 65 to 69 Years (88 | 11.4%) for men and 40 to 44 Years (86 | 9.5%) for women.
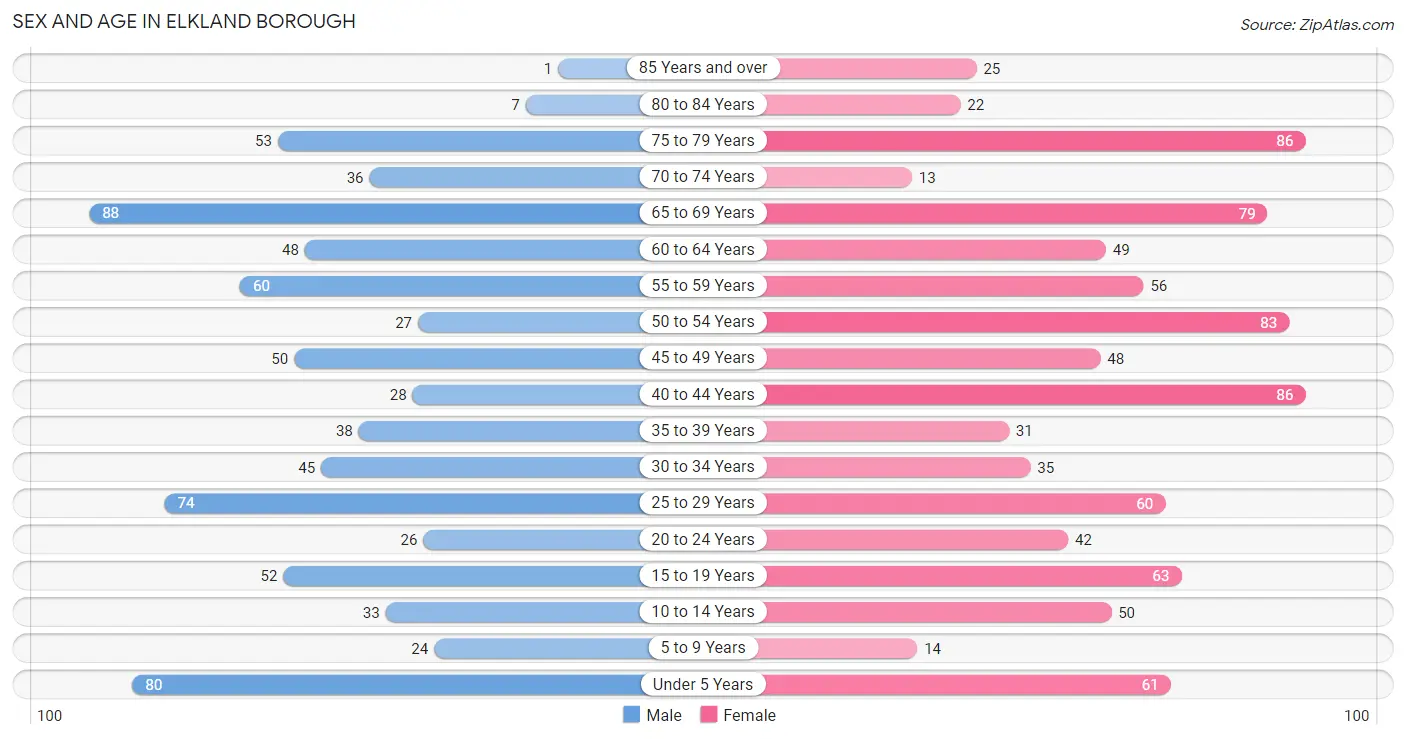
| Age Bracket | Male | Female |
| Under 5 Years | 80 (10.4%) | 61 (6.8%) |
| 5 to 9 Years | 24 (3.1%) | 14 (1.5%) |
| 10 to 14 Years | 33 (4.3%) | 50 (5.5%) |
| 15 to 19 Years | 52 (6.8%) | 63 (7.0%) |
| 20 to 24 Years | 26 (3.4%) | 42 (4.6%) |
| 25 to 29 Years | 74 (9.6%) | 60 (6.6%) |
| 30 to 34 Years | 45 (5.8%) | 35 (3.9%) |
| 35 to 39 Years | 38 (4.9%) | 31 (3.4%) |
| 40 to 44 Years | 28 (3.6%) | 86 (9.5%) |
| 45 to 49 Years | 50 (6.5%) | 48 (5.3%) |
| 50 to 54 Years | 27 (3.5%) | 83 (9.2%) |
| 55 to 59 Years | 60 (7.8%) | 56 (6.2%) |
| 60 to 64 Years | 48 (6.2%) | 49 (5.4%) |
| 65 to 69 Years | 88 (11.4%) | 79 (8.7%) |
| 70 to 74 Years | 36 (4.7%) | 13 (1.4%) |
| 75 to 79 Years | 53 (6.9%) | 86 (9.5%) |
| 80 to 84 Years | 7 (0.9%) | 22 (2.4%) |
| 85 Years and over | 1 (0.1%) | 25 (2.8%) |
| Total | 770 (100.0%) | 903 (100.0%) |
Families and Households in Elkland borough
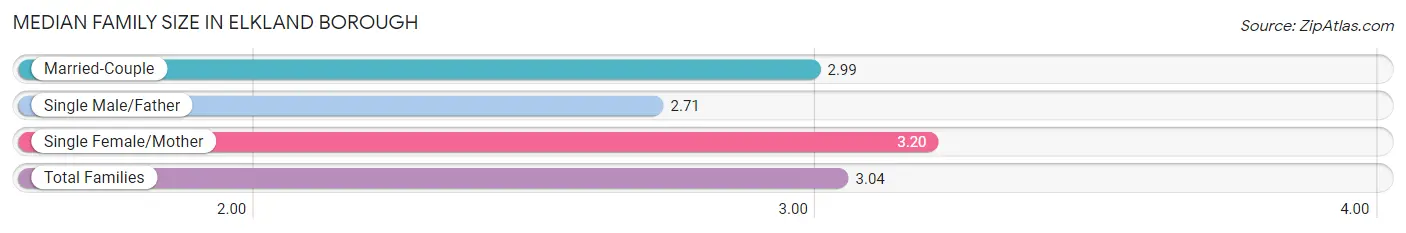
Median Family Size in Elkland borough
The median family size in Elkland borough is 3.04 persons per family, with single female/mother families (123 | 28.4%) accounting for the largest median family size of 3.2 persons per family. On the other hand, single male/father families (14 | 3.2%) represent the smallest median family size with 2.71 persons per family.
| Family Type | # Families | Family Size |
| Married-Couple | 296 (68.4%) | 2.99 |
| Single Male/Father | 14 (3.2%) | 2.71 |
| Single Female/Mother | 123 (28.4%) | 3.20 |
| Total Families | 433 (100.0%) | 3.04 |
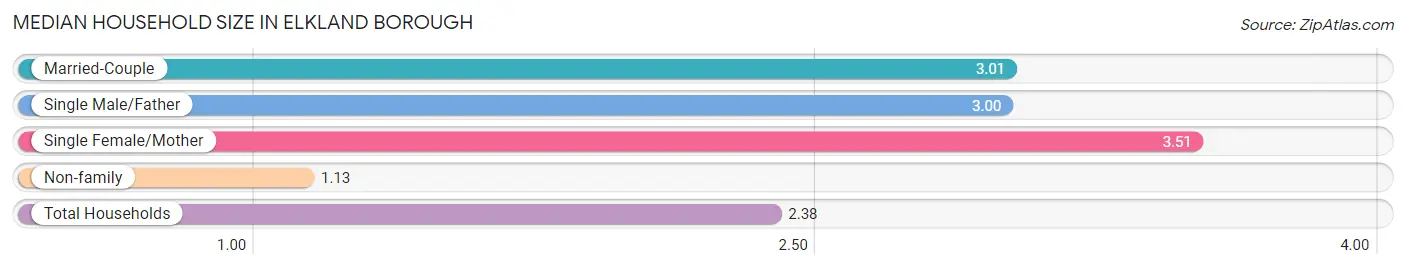
Median Household Size in Elkland borough
The median household size in Elkland borough is 2.38 persons per household, with single female/mother households (123 | 17.5%) accounting for the largest median household size of 3.51 persons per household. non-family households (270 | 38.4%) represent the smallest median household size with 1.13 persons per household.
| Household Type | # Households | Household Size |
| Married-Couple | 296 (42.1%) | 3.01 |
| Single Male/Father | 14 (2.0%) | 3.00 |
| Single Female/Mother | 123 (17.5%) | 3.51 |
| Non-family | 270 (38.4%) | 1.13 |
| Total Households | 703 (100.0%) | 2.38 |
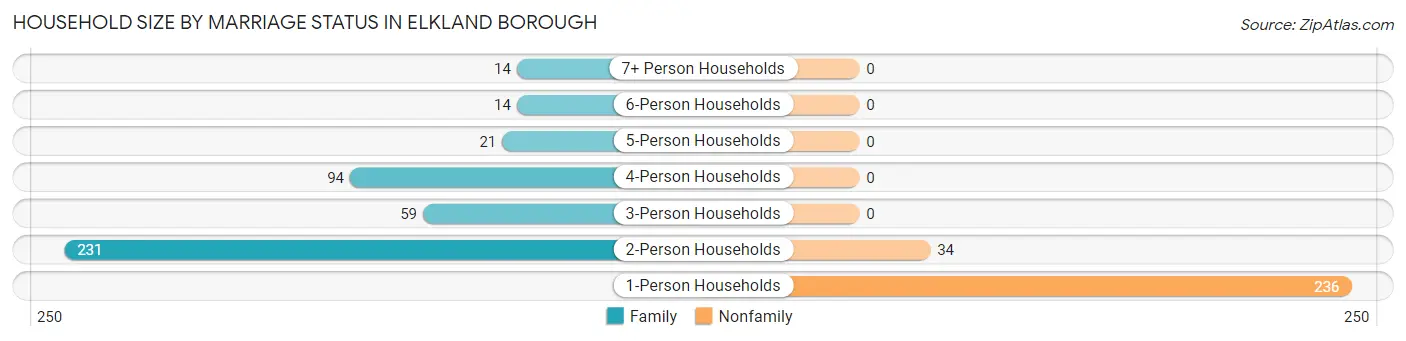
Household Size by Marriage Status in Elkland borough
Out of a total of 703 households in Elkland borough, 433 (61.6%) are family households, while 270 (38.4%) are nonfamily households. The most numerous type of family households are 2-person households, comprising 231, and the most common type of nonfamily households are 1-person households, comprising 236.
| Household Size | Family Households | Nonfamily Households |
| 1-Person Households | - | 236 (33.6%) |
| 2-Person Households | 231 (32.9%) | 34 (4.8%) |
| 3-Person Households | 59 (8.4%) | 0 (0.0%) |
| 4-Person Households | 94 (13.4%) | 0 (0.0%) |
| 5-Person Households | 21 (3.0%) | 0 (0.0%) |
| 6-Person Households | 14 (2.0%) | 0 (0.0%) |
| 7+ Person Households | 14 (2.0%) | 0 (0.0%) |
| Total | 433 (61.6%) | 270 (38.4%) |
Female Fertility in Elkland borough
Fertility by Age in Elkland borough
Average fertility rate in Elkland borough is 128.0 births per 1,000 women. Women in the age bracket of 20 to 34 years have the highest fertility rate with 314.0 births per 1,000 women. Women in the age bracket of 20 to 34 years acount for 86.0% of all women with births.
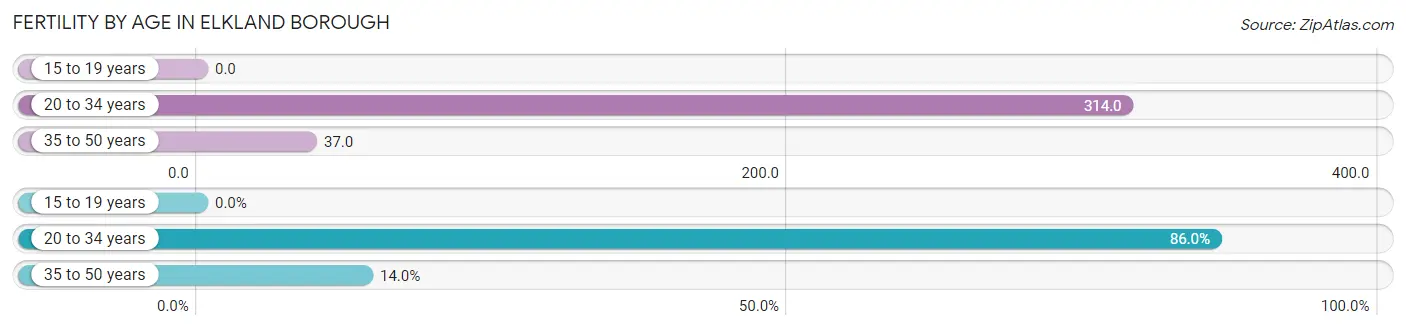
| Age Bracket | Women with Births | Births / 1,000 Women |
| 15 to 19 years | 0 (0.0%) | 0.0 |
| 20 to 34 years | 43 (86.0%) | 314.0 |
| 35 to 50 years | 7 (14.0%) | 37.0 |
| Total | 50 (100.0%) | 128.0 |
Fertility by Age by Marriage Status in Elkland borough
80.0% of women with births (50) in Elkland borough are married. The highest percentage of unmarried women with births falls into 20 to 34 years age bracket with 23.3% of them unmarried at the time of birth, while the lowest percentage of unmarried women with births belong to 35 to 50 years age bracket with 0.0% of them unmarried.
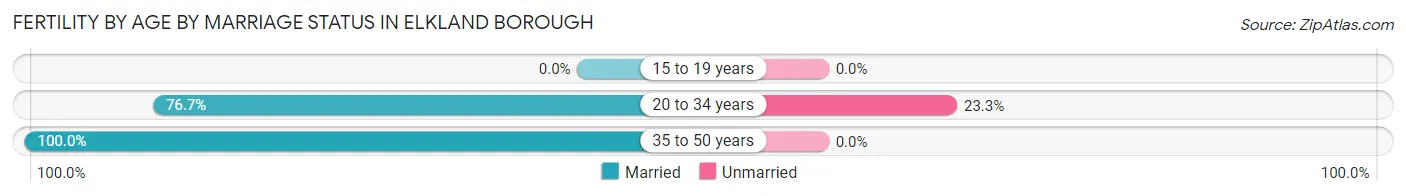
| Age Bracket | Married | Unmarried |
| 15 to 19 years | 0 (0.0%) | 0 (0.0%) |
| 20 to 34 years | 33 (76.7%) | 10 (23.3%) |
| 35 to 50 years | 7 (100.0%) | 0 (0.0%) |
| Total | 40 (80.0%) | 10 (20.0%) |
Fertility by Education in Elkland borough
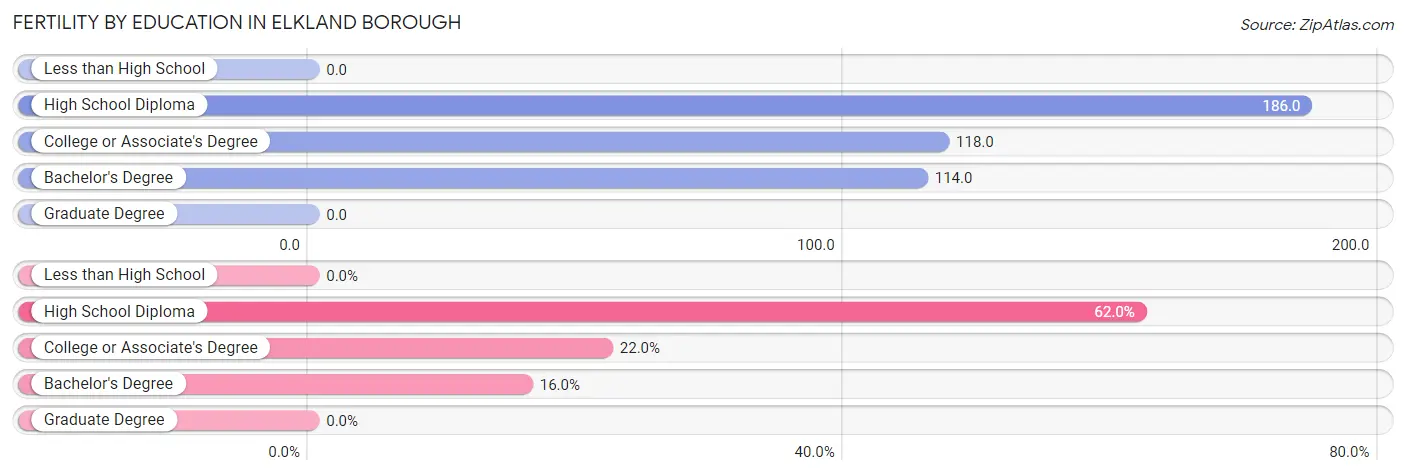
| Educational Attainment | Women with Births | Births / 1,000 Women |
| Less than High School | 0 (0.0%) | 0.0 |
| High School Diploma | 31 (62.0%) | 186.0 |
| College or Associate's Degree | 11 (22.0%) | 118.0 |
| Bachelor's Degree | 8 (16.0%) | 114.0 |
| Graduate Degree | 0 (0.0%) | 0.0 |
| Total | 50 (100.0%) | 128.0 |
Fertility by Education by Marriage Status in Elkland borough
20.0% of women with births in Elkland borough are unmarried. Women with the educational attainment of high school diploma are most likely to be married with 93.5% of them married at childbirth, while women with the educational attainment of bachelor's degree are least likely to be married with 50.0% of them unmarried at childbirth.
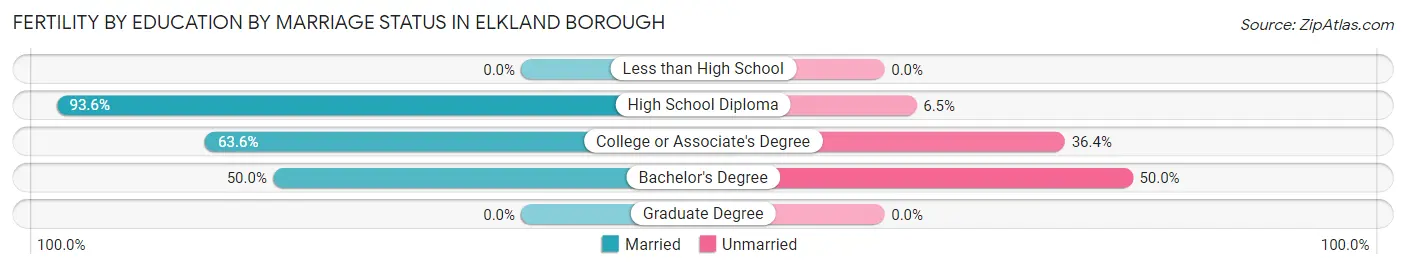
| Educational Attainment | Married | Unmarried |
| Less than High School | 0 (0.0%) | 0 (0.0%) |
| High School Diploma | 29 (93.5%) | 2 (6.5%) |
| College or Associate's Degree | 7 (63.6%) | 4 (36.4%) |
| Bachelor's Degree | 4 (50.0%) | 4 (50.0%) |
| Graduate Degree | 0 (0.0%) | 0 (0.0%) |
| Total | 40 (80.0%) | 10 (20.0%) |
Employment Characteristics in Elkland borough
Employment by Class of Employer in Elkland borough
Among the 713 employed individuals in Elkland borough, private company employees (535 | 75.0%), state government employees (44 | 6.2%), and local government employees (40 | 5.6%) make up the most common classes of employment.
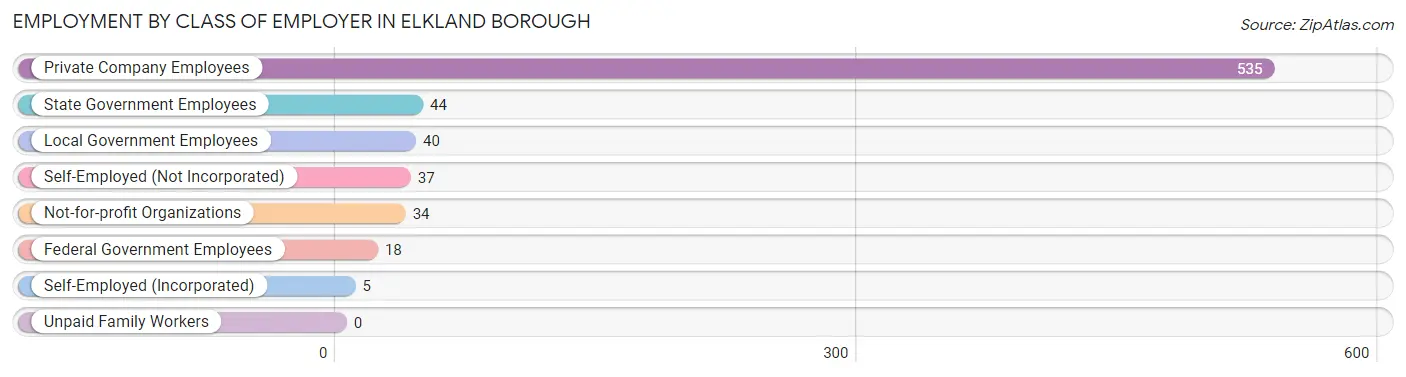
| Employer Class | # Employees | % Employees |
| Private Company Employees | 535 | 75.0% |
| Self-Employed (Incorporated) | 5 | 0.7% |
| Self-Employed (Not Incorporated) | 37 | 5.2% |
| Not-for-profit Organizations | 34 | 4.8% |
| Local Government Employees | 40 | 5.6% |
| State Government Employees | 44 | 6.2% |
| Federal Government Employees | 18 | 2.5% |
| Unpaid Family Workers | 0 | 0.0% |
| Total | 713 | 100.0% |
Employment Status by Age in Elkland borough
According to the labor force statistics for Elkland borough, out of the total population over 16 years of age (1,388), 54.0% or 750 individuals are in the labor force, with 4.1% or 31 of them unemployed. The age group with the highest labor force participation rate is 30 to 34 years, with 92.5% or 74 individuals in the labor force. Within the labor force, the 16 to 19 years age range has the highest percentage of unemployed individuals, with 21.9% or 7 of them being unemployed.
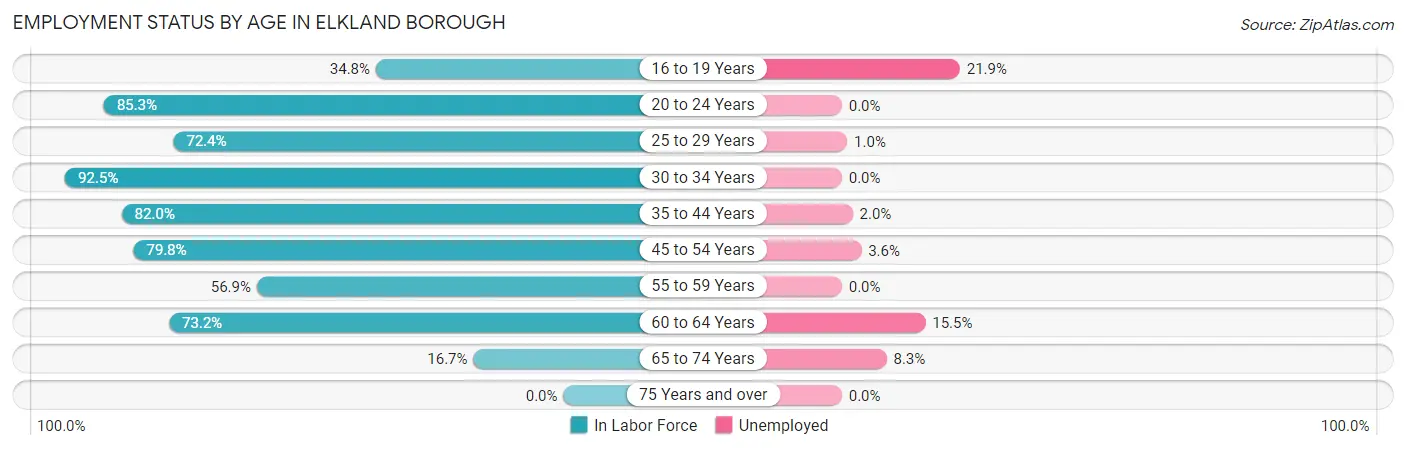
| Age Bracket | In Labor Force | Unemployed |
| 16 to 19 Years | 32 (34.8%) | 7 (21.9%) |
| 20 to 24 Years | 58 (85.3%) | 0 (0.0%) |
| 25 to 29 Years | 97 (72.4%) | 1 (1.0%) |
| 30 to 34 Years | 74 (92.5%) | 0 (0.0%) |
| 35 to 44 Years | 150 (82.0%) | 3 (2.0%) |
| 45 to 54 Years | 166 (79.8%) | 6 (3.6%) |
| 55 to 59 Years | 66 (56.9%) | 0 (0.0%) |
| 60 to 64 Years | 71 (73.2%) | 11 (15.5%) |
| 65 to 74 Years | 36 (16.7%) | 3 (8.3%) |
| 75 Years and over | 0 (0.0%) | 0 (0.0%) |
| Total | 750 (54.0%) | 31 (4.1%) |
Employment Status by Educational Attainment in Elkland borough
According to labor force statistics for Elkland borough, 76.3% of individuals (624) out of the total population between 25 and 64 years of age (818) are in the labor force, with 3.4% or 21 of them being unemployed. The group with the highest labor force participation rate are those with the educational attainment of bachelor's degree or higher, with 91.0% or 172 individuals in the labor force. Within the labor force, individuals with college / associate degree education have the highest percentage of unemployment, with 5.7% or 14 of them being unemployed.
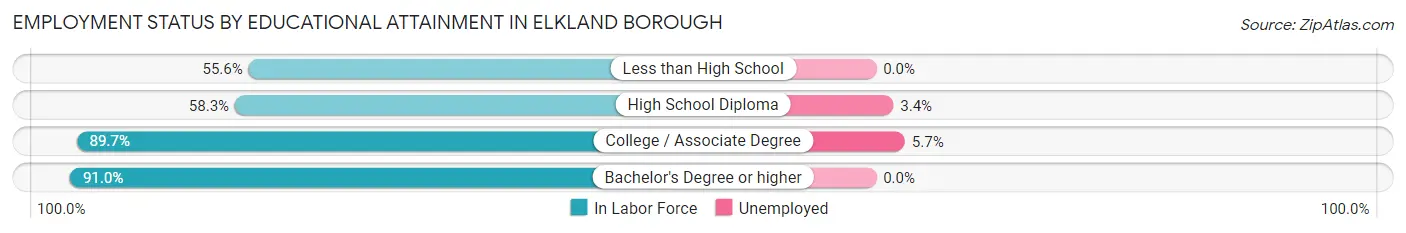
| Educational Attainment | In Labor Force | Unemployed |
| Less than High School | 5 (55.6%) | 0 (0.0%) |
| High School Diploma | 203 (58.3%) | 12 (3.4%) |
| College / Associate Degree | 244 (89.7%) | 16 (5.7%) |
| Bachelor's Degree or higher | 172 (91.0%) | 0 (0.0%) |
| Total | 624 (76.3%) | 28 (3.4%) |
Employment Occupations by Sex in Elkland borough
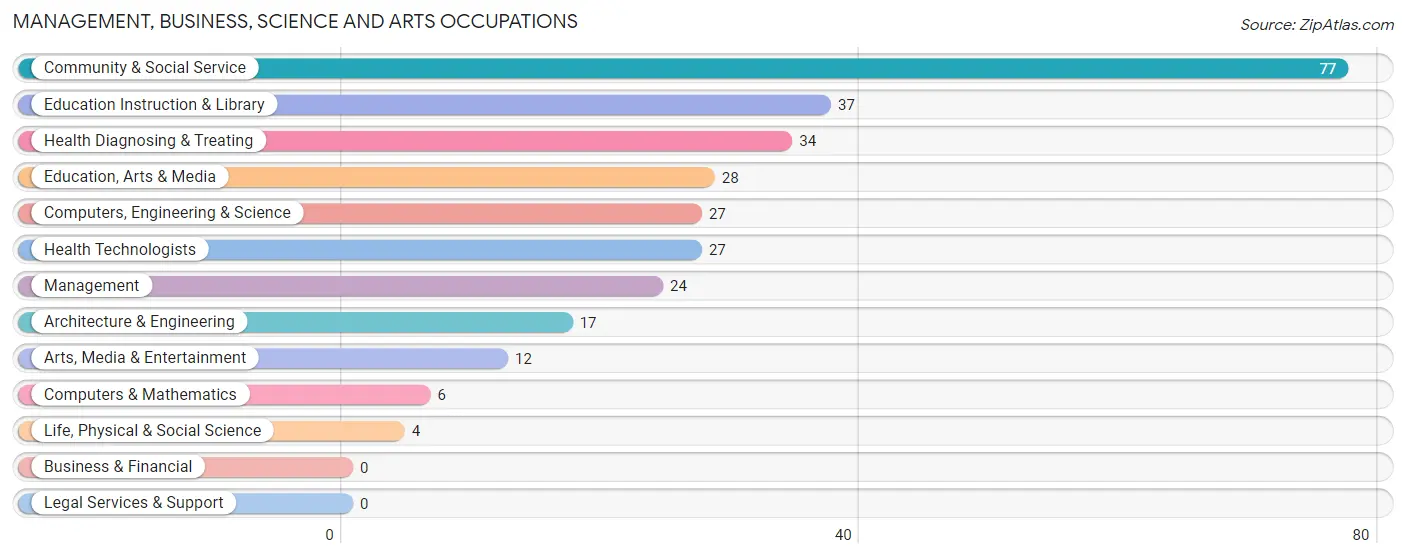
Management, Business, Science and Arts Occupations
The most common Management, Business, Science and Arts occupations in Elkland borough are Community & Social Service (77 | 10.7%), Education Instruction & Library (37 | 5.1%), Health Diagnosing & Treating (34 | 4.7%), Education, Arts & Media (28 | 3.9%), and Computers, Engineering & Science (27 | 3.8%).
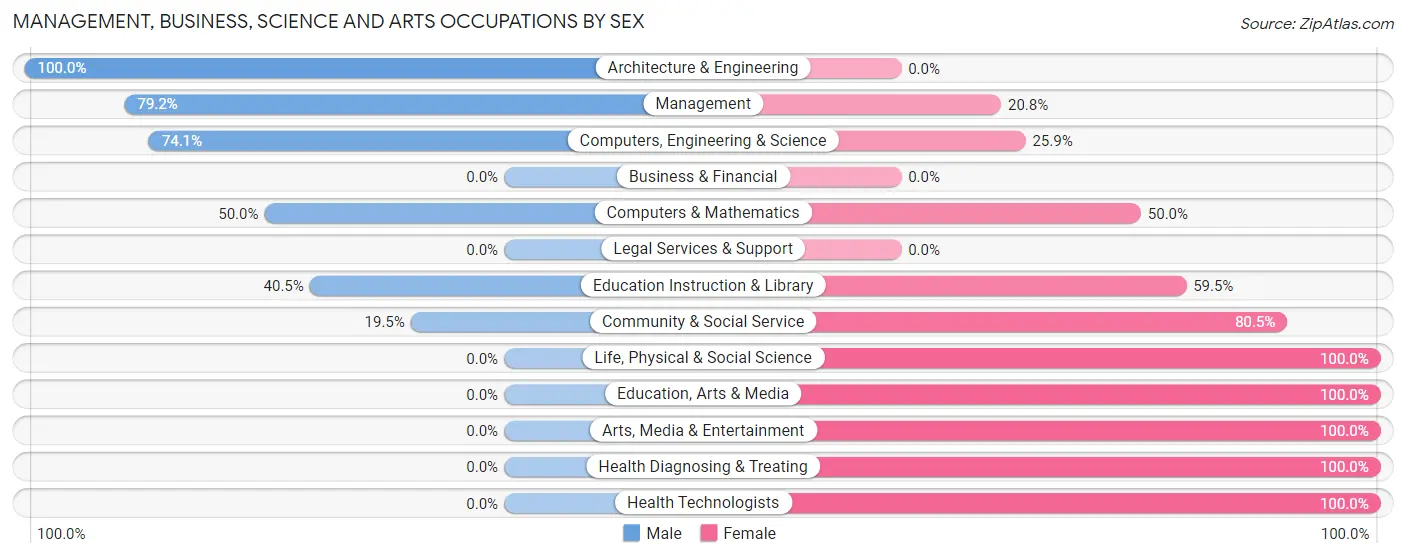
Management, Business, Science and Arts Occupations by Sex
Within the Management, Business, Science and Arts occupations in Elkland borough, the most male-oriented occupations are Architecture & Engineering (100.0%), Management (79.2%), and Computers, Engineering & Science (74.1%), while the most female-oriented occupations are Life, Physical & Social Science (100.0%), Education, Arts & Media (100.0%), and Arts, Media & Entertainment (100.0%).
| Occupation | Male | Female |
| Management | 19 (79.2%) | 5 (20.8%) |
| Business & Financial | 0 (0.0%) | 0 (0.0%) |
| Computers, Engineering & Science | 20 (74.1%) | 7 (25.9%) |
| Computers & Mathematics | 3 (50.0%) | 3 (50.0%) |
| Architecture & Engineering | 17 (100.0%) | 0 (0.0%) |
| Life, Physical & Social Science | 0 (0.0%) | 4 (100.0%) |
| Community & Social Service | 15 (19.5%) | 62 (80.5%) |
| Education, Arts & Media | 0 (0.0%) | 28 (100.0%) |
| Legal Services & Support | 0 (0.0%) | 0 (0.0%) |
| Education Instruction & Library | 15 (40.5%) | 22 (59.5%) |
| Arts, Media & Entertainment | 0 (0.0%) | 12 (100.0%) |
| Health Diagnosing & Treating | 0 (0.0%) | 34 (100.0%) |
| Health Technologists | 0 (0.0%) | 27 (100.0%) |
| Total (Category) | 54 (33.3%) | 108 (66.7%) |
| Total (Overall) | 339 (47.1%) | 380 (52.8%) |
Services Occupations
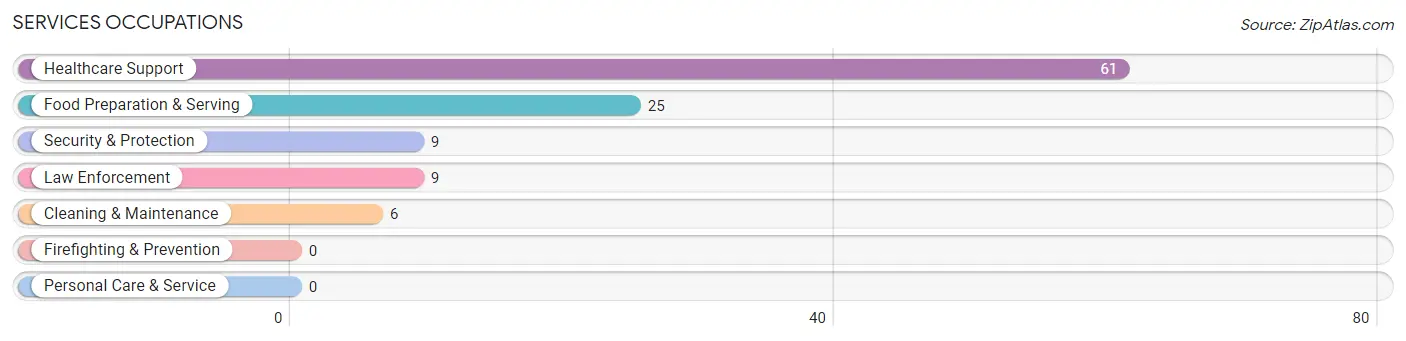
The most common Services occupations in Elkland borough are Healthcare Support (61 | 8.5%), Food Preparation & Serving (25 | 3.5%), Security & Protection (9 | 1.3%), Law Enforcement (9 | 1.3%), and Cleaning & Maintenance (6 | 0.8%).
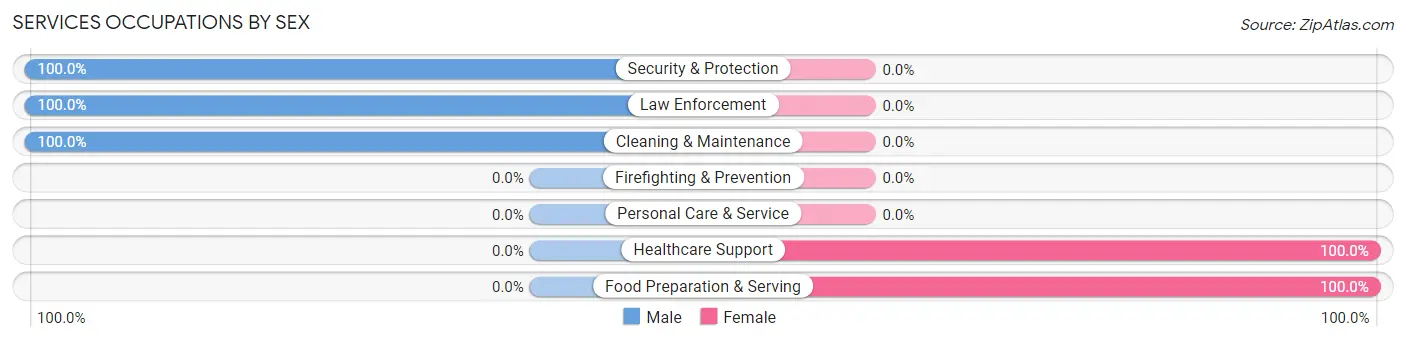
Services Occupations by Sex
Within the Services occupations in Elkland borough, the most male-oriented occupations are Security & Protection (100.0%), Law Enforcement (100.0%), and Cleaning & Maintenance (100.0%), while the most female-oriented occupations are Healthcare Support (100.0%), and Food Preparation & Serving (100.0%).
| Occupation | Male | Female |
| Healthcare Support | 0 (0.0%) | 61 (100.0%) |
| Security & Protection | 9 (100.0%) | 0 (0.0%) |
| Firefighting & Prevention | 0 (0.0%) | 0 (0.0%) |
| Law Enforcement | 9 (100.0%) | 0 (0.0%) |
| Food Preparation & Serving | 0 (0.0%) | 25 (100.0%) |
| Cleaning & Maintenance | 6 (100.0%) | 0 (0.0%) |
| Personal Care & Service | 0 (0.0%) | 0 (0.0%) |
| Total (Category) | 15 (14.8%) | 86 (85.2%) |
| Total (Overall) | 339 (47.1%) | 380 (52.8%) |
Sales and Office Occupations
The most common Sales and Office occupations in Elkland borough are Sales & Related (111 | 15.4%), and Office & Administration (75 | 10.4%).

Sales and Office Occupations by Sex

| Occupation | Male | Female |
| Sales & Related | 55 (49.5%) | 56 (50.4%) |
| Office & Administration | 7 (9.3%) | 68 (90.7%) |
| Total (Category) | 62 (33.3%) | 124 (66.7%) |
| Total (Overall) | 339 (47.1%) | 380 (52.8%) |
Natural Resources, Construction and Maintenance Occupations
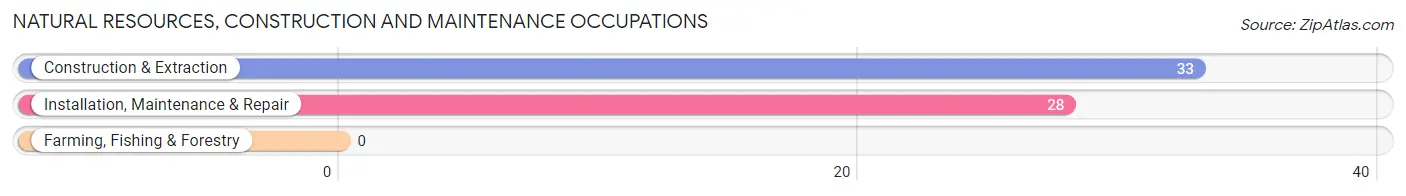
The most common Natural Resources, Construction and Maintenance occupations in Elkland borough are Construction & Extraction (33 | 4.6%), and Installation, Maintenance & Repair (28 | 3.9%).
Natural Resources, Construction and Maintenance Occupations by Sex
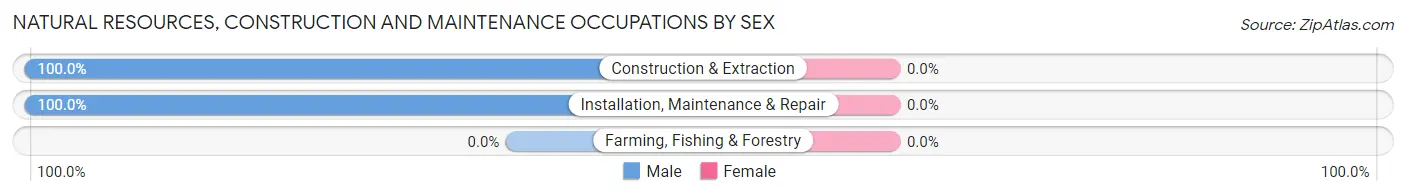
| Occupation | Male | Female |
| Farming, Fishing & Forestry | 0 (0.0%) | 0 (0.0%) |
| Construction & Extraction | 33 (100.0%) | 0 (0.0%) |
| Installation, Maintenance & Repair | 28 (100.0%) | 0 (0.0%) |
| Total (Category) | 61 (100.0%) | 0 (0.0%) |
| Total (Overall) | 339 (47.1%) | 380 (52.8%) |
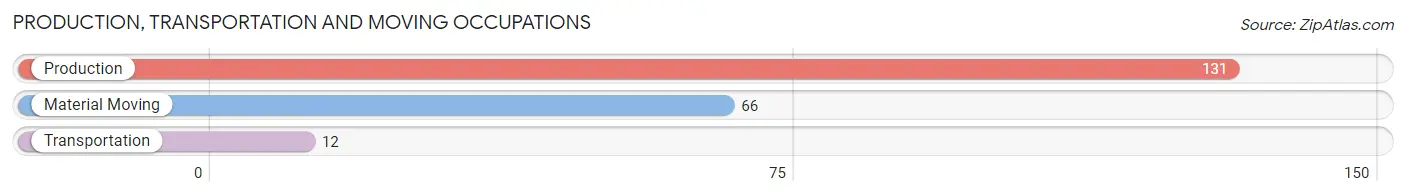
Production, Transportation and Moving Occupations
The most common Production, Transportation and Moving occupations in Elkland borough are Production (131 | 18.2%), Material Moving (66 | 9.2%), and Transportation (12 | 1.7%).
Production, Transportation and Moving Occupations by Sex
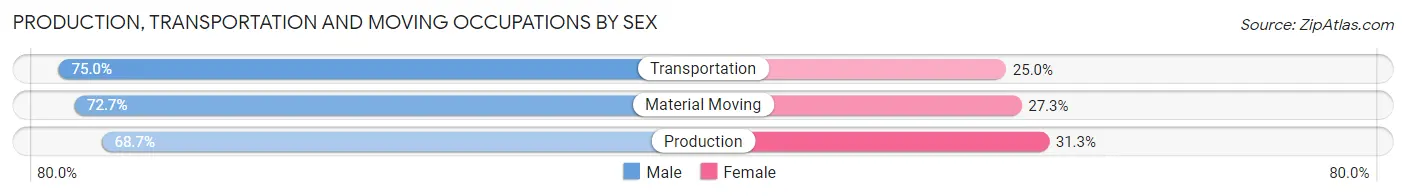
| Occupation | Male | Female |
| Production | 90 (68.7%) | 41 (31.3%) |
| Transportation | 9 (75.0%) | 3 (25.0%) |
| Material Moving | 48 (72.7%) | 18 (27.3%) |
| Total (Category) | 147 (70.3%) | 62 (29.7%) |
| Total (Overall) | 339 (47.1%) | 380 (52.8%) |
Employment Industries by Sex in Elkland borough
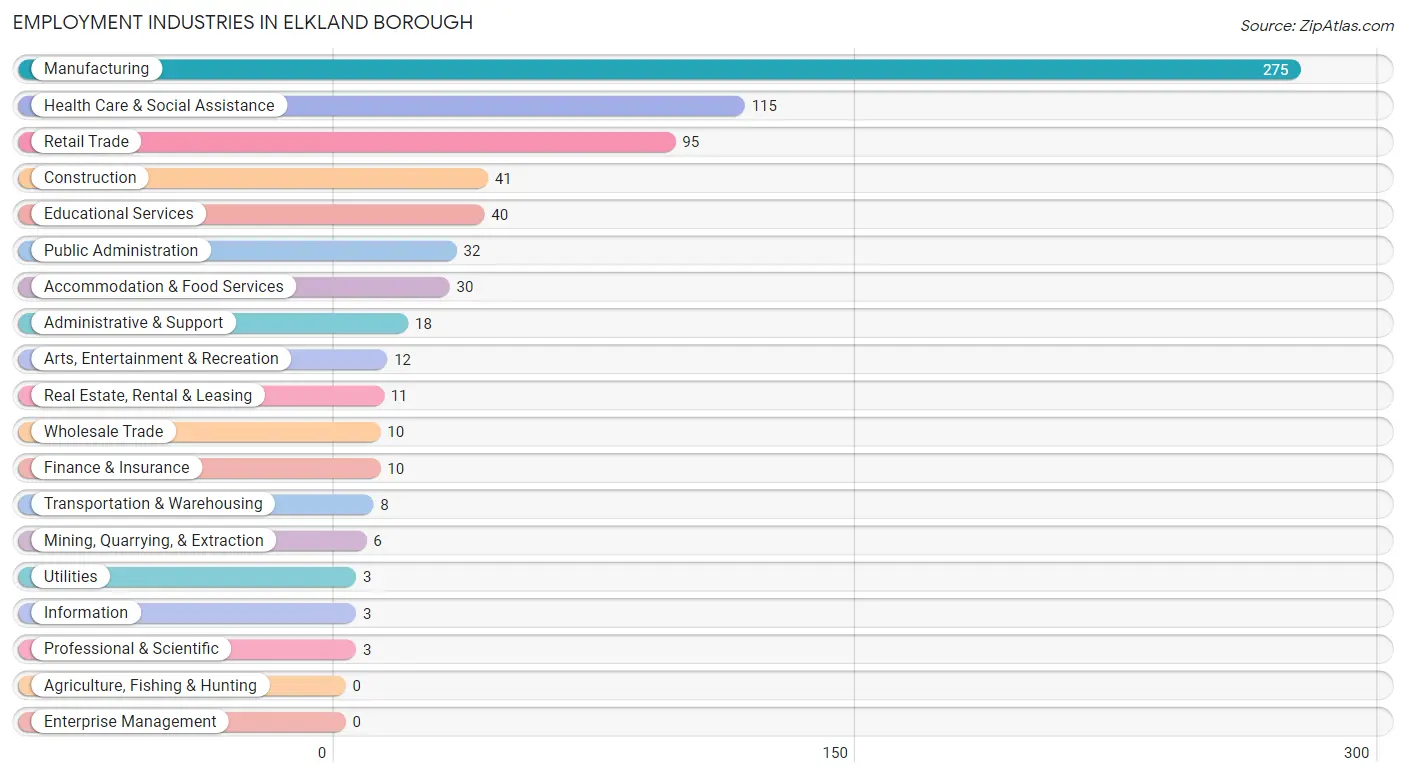
Employment Industries in Elkland borough
The major employment industries in Elkland borough include Manufacturing (275 | 38.3%), Health Care & Social Assistance (115 | 16.0%), Retail Trade (95 | 13.2%), Construction (41 | 5.7%), and Educational Services (40 | 5.6%).
Employment Industries by Sex in Elkland borough
The Elkland borough industries that see more men than women are Mining, Quarrying, & Extraction (100.0%), Wholesale Trade (100.0%), and Transportation & Warehousing (100.0%), whereas the industries that tend to have a higher number of women are Information (100.0%), Health Care & Social Assistance (100.0%), and Arts, Entertainment & Recreation (100.0%).
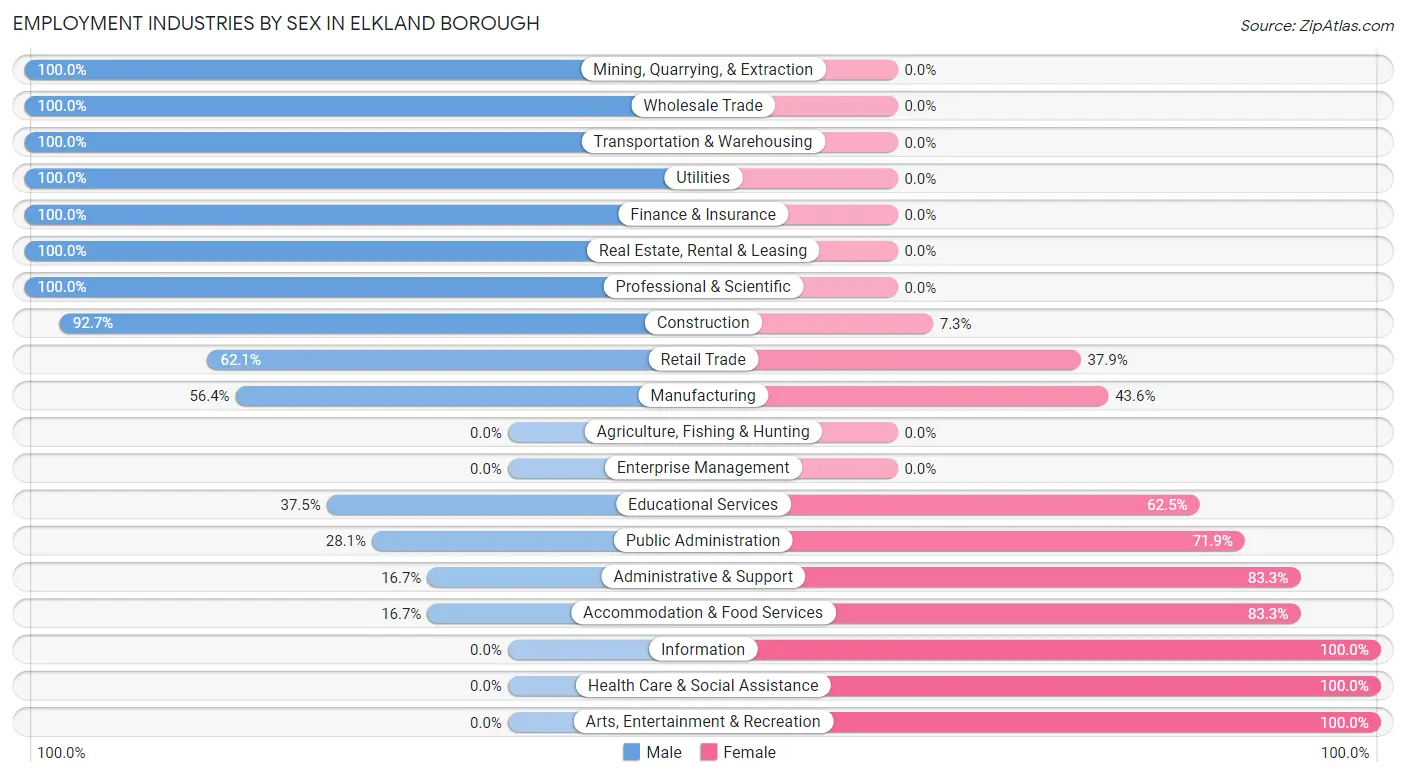
| Industry | Male | Female |
| Agriculture, Fishing & Hunting | 0 (0.0%) | 0 (0.0%) |
| Mining, Quarrying, & Extraction | 6 (100.0%) | 0 (0.0%) |
| Construction | 38 (92.7%) | 3 (7.3%) |
| Manufacturing | 155 (56.4%) | 120 (43.6%) |
| Wholesale Trade | 10 (100.0%) | 0 (0.0%) |
| Retail Trade | 59 (62.1%) | 36 (37.9%) |
| Transportation & Warehousing | 8 (100.0%) | 0 (0.0%) |
| Utilities | 3 (100.0%) | 0 (0.0%) |
| Information | 0 (0.0%) | 3 (100.0%) |
| Finance & Insurance | 10 (100.0%) | 0 (0.0%) |
| Real Estate, Rental & Leasing | 11 (100.0%) | 0 (0.0%) |
| Professional & Scientific | 3 (100.0%) | 0 (0.0%) |
| Enterprise Management | 0 (0.0%) | 0 (0.0%) |
| Administrative & Support | 3 (16.7%) | 15 (83.3%) |
| Educational Services | 15 (37.5%) | 25 (62.5%) |
| Health Care & Social Assistance | 0 (0.0%) | 115 (100.0%) |
| Arts, Entertainment & Recreation | 0 (0.0%) | 12 (100.0%) |
| Accommodation & Food Services | 5 (16.7%) | 25 (83.3%) |
| Public Administration | 9 (28.1%) | 23 (71.9%) |
| Total | 339 (47.1%) | 380 (52.8%) |
Education in Elkland borough
School Enrollment in Elkland borough
The most common levels of schooling among the 234 students in Elkland borough are middle school (87 | 37.2%), high school (64 | 27.4%), and nursery / preschool (24 | 10.3%).
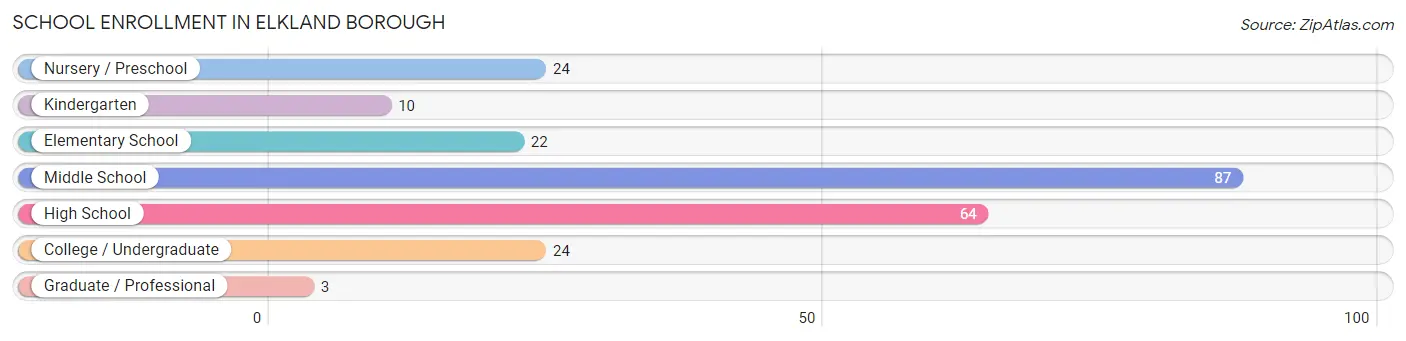
| School Level | # Students | % Students |
| Nursery / Preschool | 24 | 10.3% |
| Kindergarten | 10 | 4.3% |
| Elementary School | 22 | 9.4% |
| Middle School | 87 | 37.2% |
| High School | 64 | 27.4% |
| College / Undergraduate | 24 | 10.3% |
| Graduate / Professional | 3 | 1.3% |
| Total | 234 | 100.0% |
School Enrollment by Age by Funding Source in Elkland borough
Out of a total of 234 students who are enrolled in schools in Elkland borough, 15 (6.4%) attend a private institution, while the remaining 219 (93.6%) are enrolled in public schools. The age group of 3 to 4 year olds has the highest likelihood of being enrolled in private schools, with 13 (59.1% in the age bracket) enrolled. Conversely, the age group of 10 to 14 year olds has the lowest likelihood of being enrolled in a private school, with 83 (100.0% in the age bracket) attending a public institution.
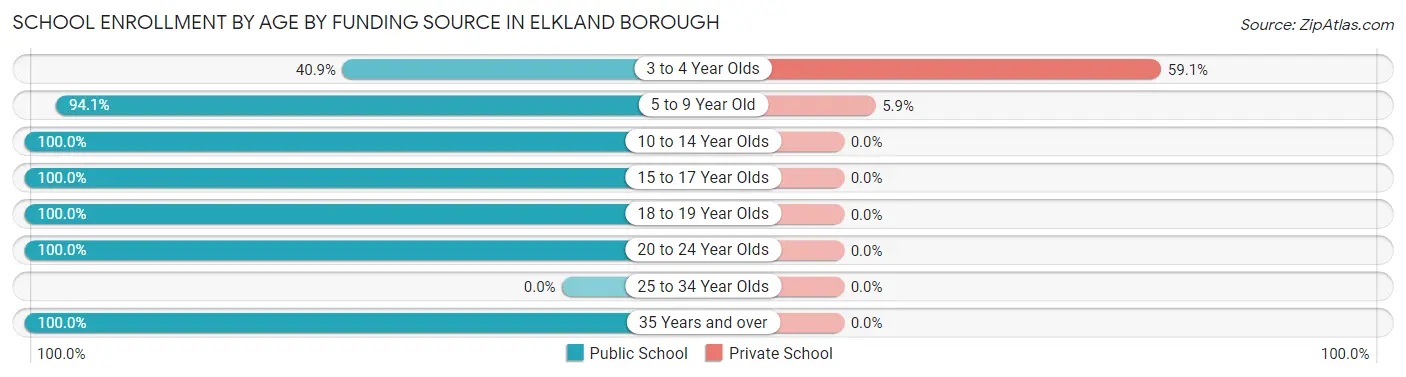
| Age Bracket | Public School | Private School |
| 3 to 4 Year Olds | 9 (40.9%) | 13 (59.1%) |
| 5 to 9 Year Old | 32 (94.1%) | 2 (5.9%) |
| 10 to 14 Year Olds | 83 (100.0%) | 0 (0.0%) |
| 15 to 17 Year Olds | 61 (100.0%) | 0 (0.0%) |
| 18 to 19 Year Olds | 24 (100.0%) | 0 (0.0%) |
| 20 to 24 Year Olds | 4 (100.0%) | 0 (0.0%) |
| 25 to 34 Year Olds | 0 (0.0%) | 0 (0.0%) |
| 35 Years and over | 6 (100.0%) | 0 (0.0%) |
| Total | 219 (93.6%) | 15 (6.4%) |
Educational Attainment by Field of Study in Elkland borough
Education (91 | 40.3%), business (31 | 13.7%), arts & humanities (30 | 13.3%), science & technology (29 | 12.8%), and psychology (12 | 5.3%) are the most common fields of study among 226 individuals in Elkland borough who have obtained a bachelor's degree or higher.
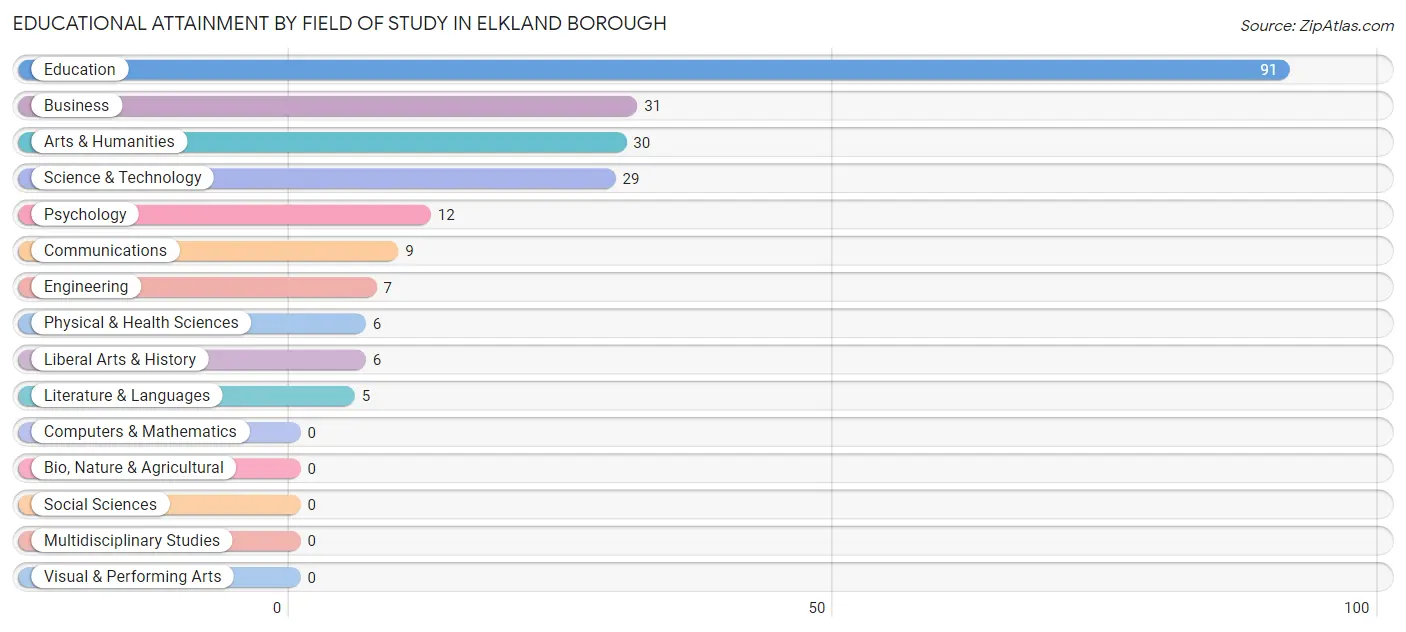
| Field of Study | # Graduates | % Graduates |
| Computers & Mathematics | 0 | 0.0% |
| Bio, Nature & Agricultural | 0 | 0.0% |
| Physical & Health Sciences | 6 | 2.6% |
| Psychology | 12 | 5.3% |
| Social Sciences | 0 | 0.0% |
| Engineering | 7 | 3.1% |
| Multidisciplinary Studies | 0 | 0.0% |
| Science & Technology | 29 | 12.8% |
| Business | 31 | 13.7% |
| Education | 91 | 40.3% |
| Literature & Languages | 5 | 2.2% |
| Liberal Arts & History | 6 | 2.6% |
| Visual & Performing Arts | 0 | 0.0% |
| Communications | 9 | 4.0% |
| Arts & Humanities | 30 | 13.3% |
| Total | 226 | 100.0% |
Transportation & Commute in Elkland borough
Vehicle Availability by Sex in Elkland borough
The most prevalent vehicle ownership categories in Elkland borough are males with 2 vehicles (157, accounting for 46.3%) and females with 2 vehicles (143, making up 42.0%).
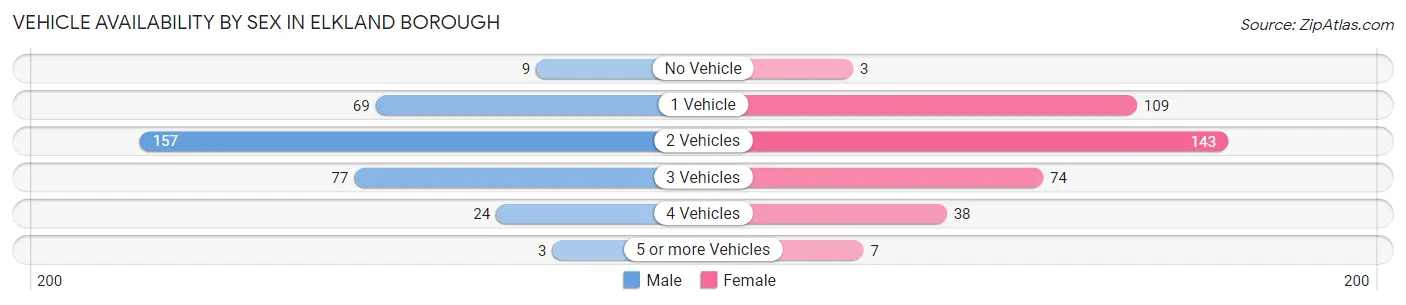
| Vehicles Available | Male | Female |
| No Vehicle | 9 (2.6%) | 3 (0.8%) |
| 1 Vehicle | 69 (20.3%) | 109 (29.1%) |
| 2 Vehicles | 157 (46.3%) | 143 (38.2%) |
| 3 Vehicles | 77 (22.7%) | 74 (19.8%) |
| 4 Vehicles | 24 (7.1%) | 38 (10.2%) |
| 5 or more Vehicles | 3 (0.9%) | 7 (1.9%) |
| Total | 339 (100.0%) | 374 (100.0%) |
Commute Time in Elkland borough
The most frequently occuring commute durations in Elkland borough are 30 to 34 minutes (140 commuters, 20.4%), 35 to 39 minutes (100 commuters, 14.6%), and 5 to 9 minutes (84 commuters, 12.2%).
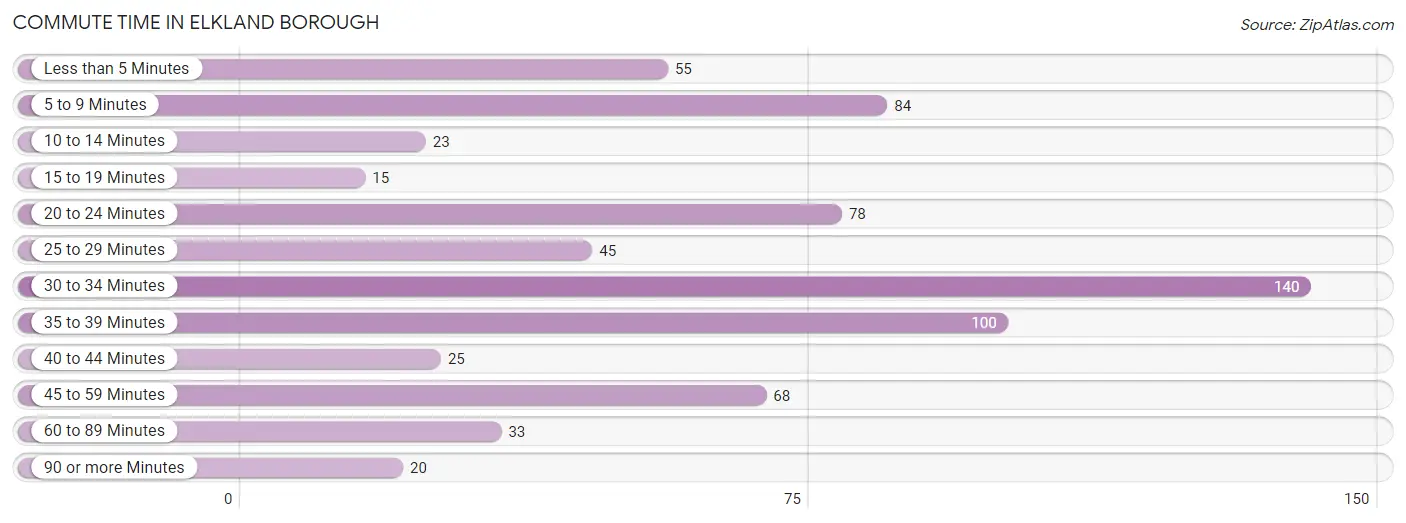
| Commute Time | # Commuters | % Commuters |
| Less than 5 Minutes | 55 | 8.0% |
| 5 to 9 Minutes | 84 | 12.2% |
| 10 to 14 Minutes | 23 | 3.4% |
| 15 to 19 Minutes | 15 | 2.2% |
| 20 to 24 Minutes | 78 | 11.4% |
| 25 to 29 Minutes | 45 | 6.6% |
| 30 to 34 Minutes | 140 | 20.4% |
| 35 to 39 Minutes | 100 | 14.6% |
| 40 to 44 Minutes | 25 | 3.6% |
| 45 to 59 Minutes | 68 | 9.9% |
| 60 to 89 Minutes | 33 | 4.8% |
| 90 or more Minutes | 20 | 2.9% |
Commute Time by Sex in Elkland borough
The most common commute times in Elkland borough are 30 to 34 minutes (66 commuters, 19.8%) for males and 35 to 39 minutes (84 commuters, 23.9%) for females.
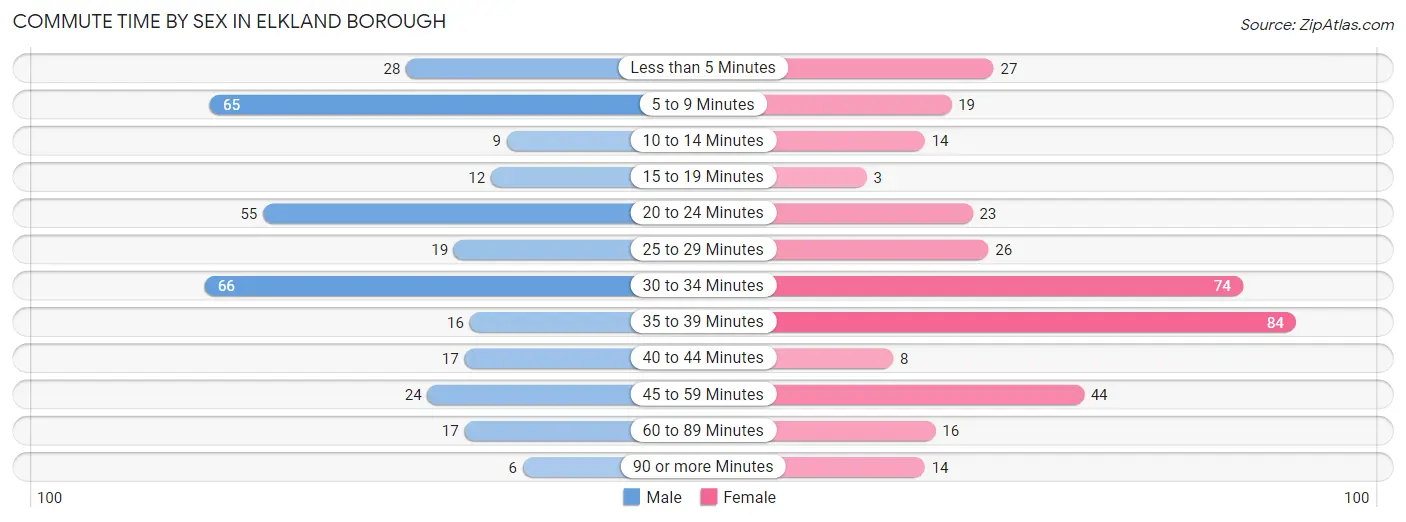
| Commute Time | Male | Female |
| Less than 5 Minutes | 28 (8.4%) | 27 (7.7%) |
| 5 to 9 Minutes | 65 (19.5%) | 19 (5.4%) |
| 10 to 14 Minutes | 9 (2.7%) | 14 (4.0%) |
| 15 to 19 Minutes | 12 (3.6%) | 3 (0.9%) |
| 20 to 24 Minutes | 55 (16.5%) | 23 (6.5%) |
| 25 to 29 Minutes | 19 (5.7%) | 26 (7.4%) |
| 30 to 34 Minutes | 66 (19.8%) | 74 (21.0%) |
| 35 to 39 Minutes | 16 (4.8%) | 84 (23.9%) |
| 40 to 44 Minutes | 17 (5.1%) | 8 (2.3%) |
| 45 to 59 Minutes | 24 (7.2%) | 44 (12.5%) |
| 60 to 89 Minutes | 17 (5.1%) | 16 (4.5%) |
| 90 or more Minutes | 6 (1.8%) | 14 (4.0%) |
Time of Departure to Work by Sex in Elkland borough
The most frequent times of departure to work in Elkland borough are 7:30 AM to 7:59 AM (55, 16.5%) for males and 7:00 AM to 7:29 AM (79, 22.4%) for females.
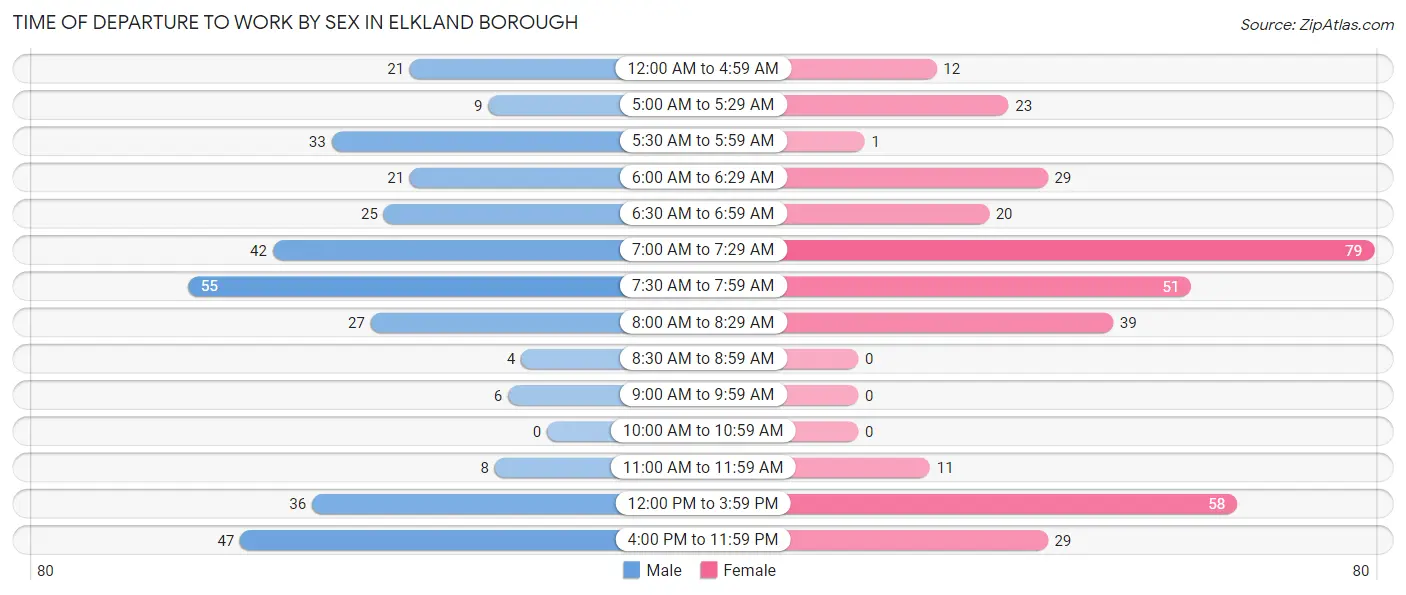
| Time of Departure | Male | Female |
| 12:00 AM to 4:59 AM | 21 (6.3%) | 12 (3.4%) |
| 5:00 AM to 5:29 AM | 9 (2.7%) | 23 (6.5%) |
| 5:30 AM to 5:59 AM | 33 (9.9%) | 1 (0.3%) |
| 6:00 AM to 6:29 AM | 21 (6.3%) | 29 (8.2%) |
| 6:30 AM to 6:59 AM | 25 (7.5%) | 20 (5.7%) |
| 7:00 AM to 7:29 AM | 42 (12.6%) | 79 (22.4%) |
| 7:30 AM to 7:59 AM | 55 (16.5%) | 51 (14.5%) |
| 8:00 AM to 8:29 AM | 27 (8.1%) | 39 (11.1%) |
| 8:30 AM to 8:59 AM | 4 (1.2%) | 0 (0.0%) |
| 9:00 AM to 9:59 AM | 6 (1.8%) | 0 (0.0%) |
| 10:00 AM to 10:59 AM | 0 (0.0%) | 0 (0.0%) |
| 11:00 AM to 11:59 AM | 8 (2.4%) | 11 (3.1%) |
| 12:00 PM to 3:59 PM | 36 (10.8%) | 58 (16.5%) |
| 4:00 PM to 11:59 PM | 47 (14.1%) | 29 (8.2%) |
| Total | 334 (100.0%) | 352 (100.0%) |
Housing Occupancy in Elkland borough
Occupancy by Ownership in Elkland borough
Of the total 703 dwellings in Elkland borough, owner-occupied units account for 497 (70.7%), while renter-occupied units make up 206 (29.3%).
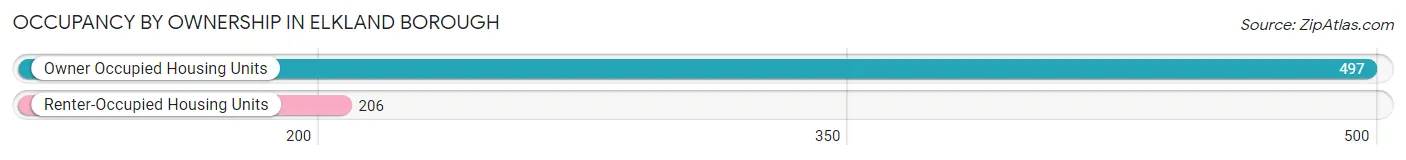
| Occupancy | # Housing Units | % Housing Units |
| Owner Occupied Housing Units | 497 | 70.7% |
| Renter-Occupied Housing Units | 206 | 29.3% |
| Total Occupied Housing Units | 703 | 100.0% |
Occupancy by Household Size in Elkland borough
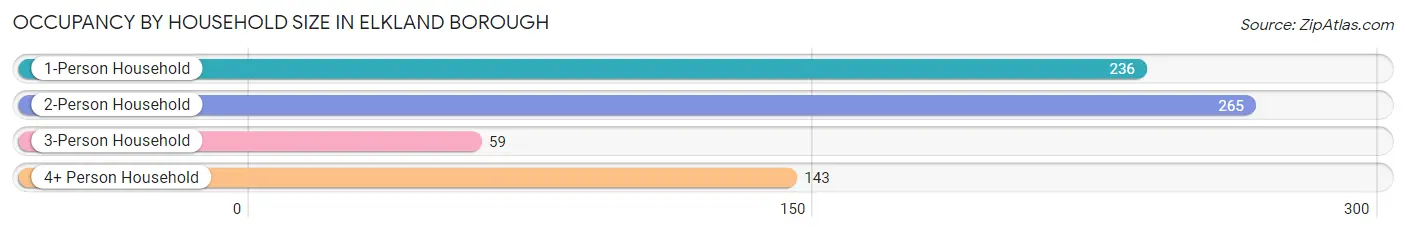
| Household Size | # Housing Units | % Housing Units |
| 1-Person Household | 236 | 33.6% |
| 2-Person Household | 265 | 37.7% |
| 3-Person Household | 59 | 8.4% |
| 4+ Person Household | 143 | 20.3% |
| Total Housing Units | 703 | 100.0% |
Occupancy by Ownership by Household Size in Elkland borough
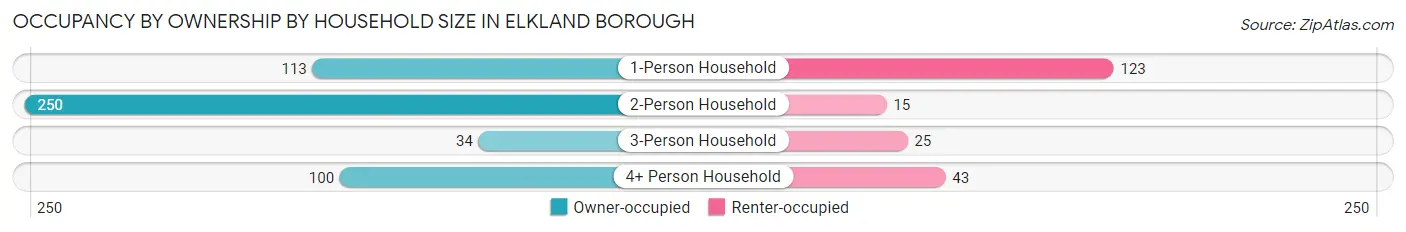
| Household Size | Owner-occupied | Renter-occupied |
| 1-Person Household | 113 (47.9%) | 123 (52.1%) |
| 2-Person Household | 250 (94.3%) | 15 (5.7%) |
| 3-Person Household | 34 (57.6%) | 25 (42.4%) |
| 4+ Person Household | 100 (69.9%) | 43 (30.1%) |
| Total Housing Units | 497 (70.7%) | 206 (29.3%) |
Occupancy by Educational Attainment in Elkland borough
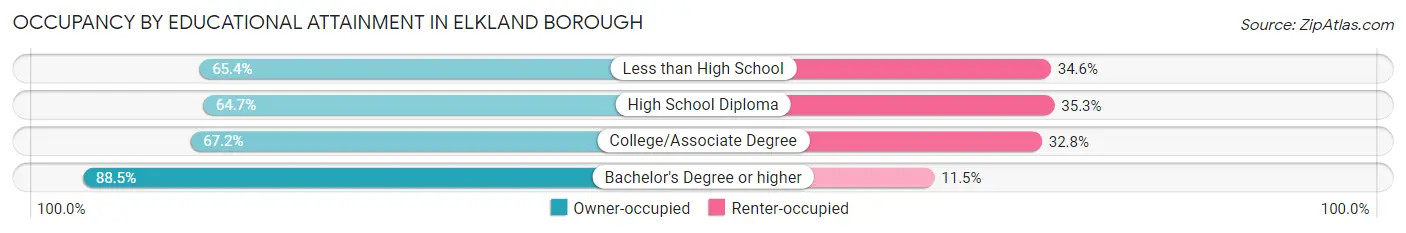
| Household Size | Owner-occupied | Renter-occupied |
| Less than High School | 17 (65.4%) | 9 (34.6%) |
| High School Diploma | 205 (64.7%) | 112 (35.3%) |
| College/Associate Degree | 137 (67.2%) | 67 (32.8%) |
| Bachelor's Degree or higher | 138 (88.5%) | 18 (11.5%) |
Occupancy by Age of Householder in Elkland borough
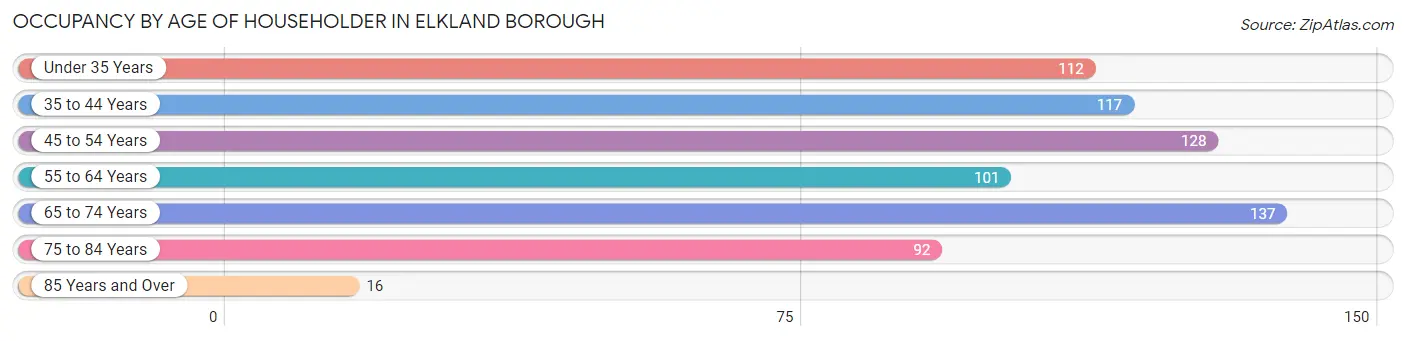
| Age Bracket | # Households | % Households |
| Under 35 Years | 112 | 15.9% |
| 35 to 44 Years | 117 | 16.6% |
| 45 to 54 Years | 128 | 18.2% |
| 55 to 64 Years | 101 | 14.4% |
| 65 to 74 Years | 137 | 19.5% |
| 75 to 84 Years | 92 | 13.1% |
| 85 Years and Over | 16 | 2.3% |
| Total | 703 | 100.0% |
Housing Finances in Elkland borough
Median Income by Occupancy in Elkland borough
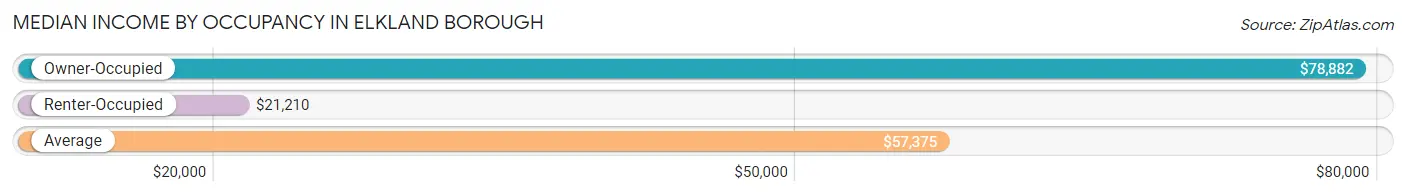
| Occupancy Type | # Households | Median Income |
| Owner-Occupied | 497 (70.7%) | $78,882 |
| Renter-Occupied | 206 (29.3%) | $21,210 |
| Average | 703 (100.0%) | $57,375 |
Occupancy by Householder Income Bracket in Elkland borough
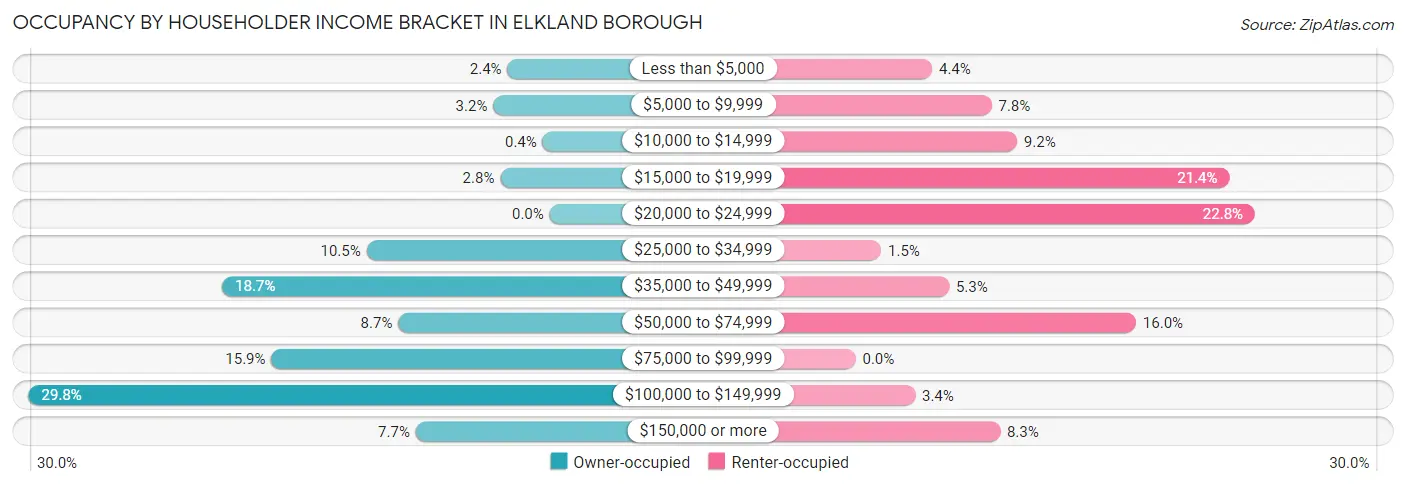
| Income Bracket | Owner-occupied | Renter-occupied |
| Less than $5,000 | 12 (2.4%) | 9 (4.4%) |
| $5,000 to $9,999 | 16 (3.2%) | 16 (7.8%) |
| $10,000 to $14,999 | 2 (0.4%) | 19 (9.2%) |
| $15,000 to $19,999 | 14 (2.8%) | 44 (21.4%) |
| $20,000 to $24,999 | 0 (0.0%) | 47 (22.8%) |
| $25,000 to $34,999 | 52 (10.5%) | 3 (1.5%) |
| $35,000 to $49,999 | 93 (18.7%) | 11 (5.3%) |
| $50,000 to $74,999 | 43 (8.6%) | 33 (16.0%) |
| $75,000 to $99,999 | 79 (15.9%) | 0 (0.0%) |
| $100,000 to $149,999 | 148 (29.8%) | 7 (3.4%) |
| $150,000 or more | 38 (7.6%) | 17 (8.3%) |
| Total | 497 (100.0%) | 206 (100.0%) |
Monthly Housing Cost Tiers in Elkland borough
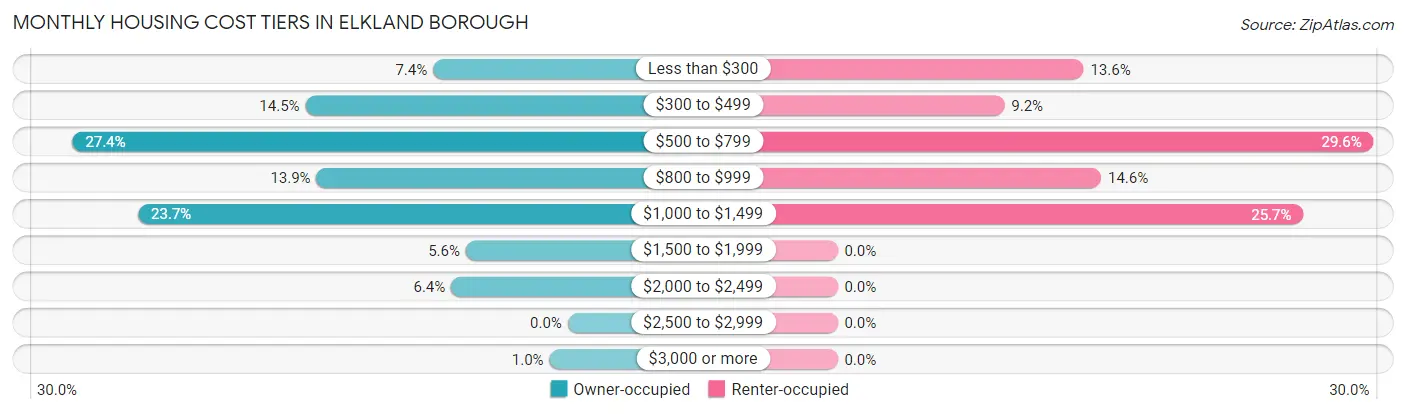
| Monthly Cost | Owner-occupied | Renter-occupied |
| Less than $300 | 37 (7.4%) | 28 (13.6%) |
| $300 to $499 | 72 (14.5%) | 19 (9.2%) |
| $500 to $799 | 136 (27.4%) | 61 (29.6%) |
| $800 to $999 | 69 (13.9%) | 30 (14.6%) |
| $1,000 to $1,499 | 118 (23.7%) | 53 (25.7%) |
| $1,500 to $1,999 | 28 (5.6%) | 0 (0.0%) |
| $2,000 to $2,499 | 32 (6.4%) | 0 (0.0%) |
| $2,500 to $2,999 | 0 (0.0%) | 0 (0.0%) |
| $3,000 or more | 5 (1.0%) | 0 (0.0%) |
| Total | 497 (100.0%) | 206 (100.0%) |
Physical Housing Characteristics in Elkland borough
Housing Structures in Elkland borough
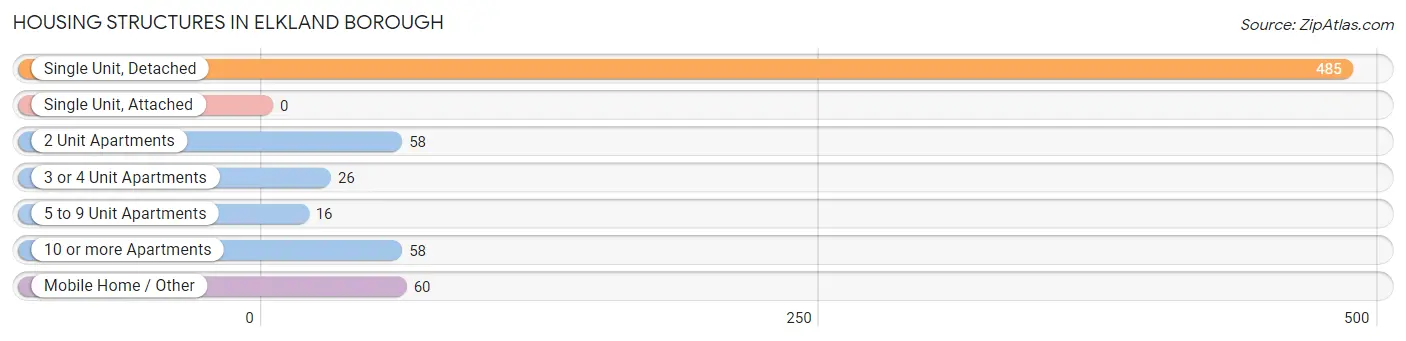
| Structure Type | # Housing Units | % Housing Units |
| Single Unit, Detached | 485 | 69.0% |
| Single Unit, Attached | 0 | 0.0% |
| 2 Unit Apartments | 58 | 8.3% |
| 3 or 4 Unit Apartments | 26 | 3.7% |
| 5 to 9 Unit Apartments | 16 | 2.3% |
| 10 or more Apartments | 58 | 8.3% |
| Mobile Home / Other | 60 | 8.5% |
| Total | 703 | 100.0% |
Housing Structures by Occupancy in Elkland borough
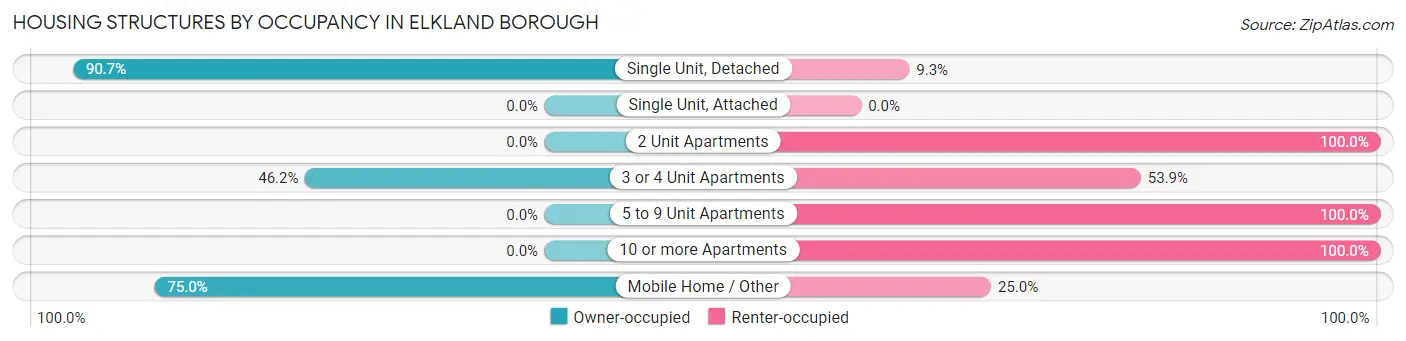
| Structure Type | Owner-occupied | Renter-occupied |
| Single Unit, Detached | 440 (90.7%) | 45 (9.3%) |
| Single Unit, Attached | 0 (0.0%) | 0 (0.0%) |
| 2 Unit Apartments | 0 (0.0%) | 58 (100.0%) |
| 3 or 4 Unit Apartments | 12 (46.2%) | 14 (53.8%) |
| 5 to 9 Unit Apartments | 0 (0.0%) | 16 (100.0%) |
| 10 or more Apartments | 0 (0.0%) | 58 (100.0%) |
| Mobile Home / Other | 45 (75.0%) | 15 (25.0%) |
| Total | 497 (70.7%) | 206 (29.3%) |
Housing Structures by Number of Rooms in Elkland borough
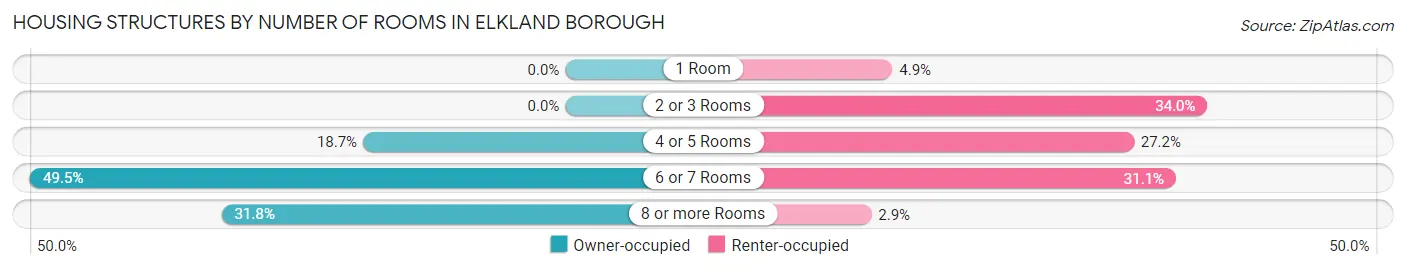
| Number of Rooms | Owner-occupied | Renter-occupied |
| 1 Room | 0 (0.0%) | 10 (4.9%) |
| 2 or 3 Rooms | 0 (0.0%) | 70 (34.0%) |
| 4 or 5 Rooms | 93 (18.7%) | 56 (27.2%) |
| 6 or 7 Rooms | 246 (49.5%) | 64 (31.1%) |
| 8 or more Rooms | 158 (31.8%) | 6 (2.9%) |
| Total | 497 (100.0%) | 206 (100.0%) |
Housing Structure by Heating Type in Elkland borough
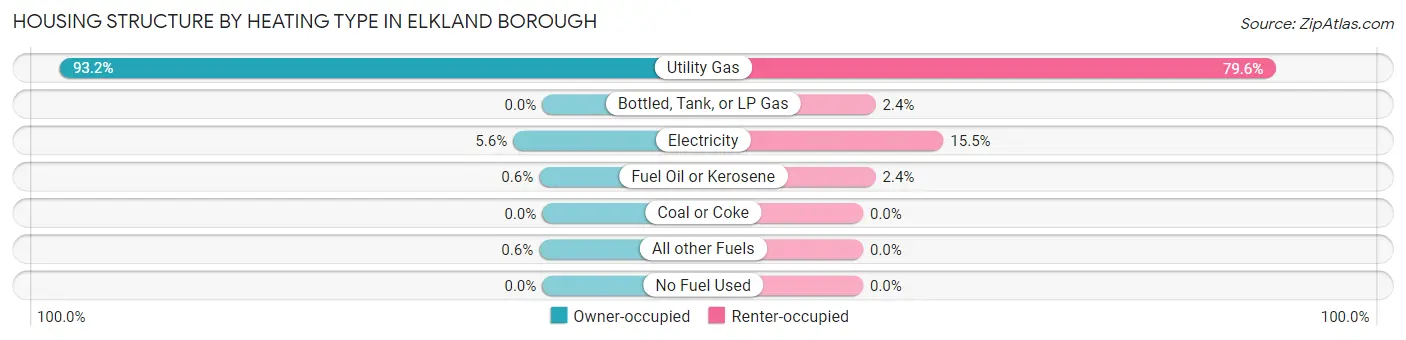
| Heating Type | Owner-occupied | Renter-occupied |
| Utility Gas | 463 (93.2%) | 164 (79.6%) |
| Bottled, Tank, or LP Gas | 0 (0.0%) | 5 (2.4%) |
| Electricity | 28 (5.6%) | 32 (15.5%) |
| Fuel Oil or Kerosene | 3 (0.6%) | 5 (2.4%) |
| Coal or Coke | 0 (0.0%) | 0 (0.0%) |
| All other Fuels | 3 (0.6%) | 0 (0.0%) |
| No Fuel Used | 0 (0.0%) | 0 (0.0%) |
| Total | 497 (100.0%) | 206 (100.0%) |
Household Vehicle Usage in Elkland borough
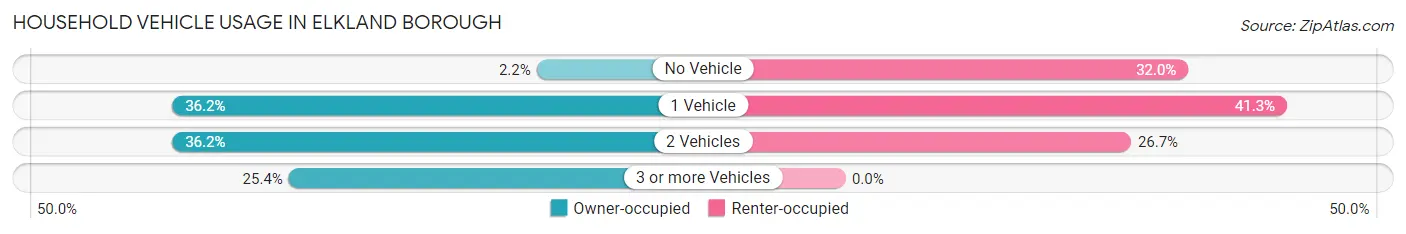
| Vehicles per Household | Owner-occupied | Renter-occupied |
| No Vehicle | 11 (2.2%) | 66 (32.0%) |
| 1 Vehicle | 180 (36.2%) | 85 (41.3%) |
| 2 Vehicles | 180 (36.2%) | 55 (26.7%) |
| 3 or more Vehicles | 126 (25.4%) | 0 (0.0%) |
| Total | 497 (100.0%) | 206 (100.0%) |
Real Estate & Mortgages in Elkland borough
Real Estate and Mortgage Overview in Elkland borough
| Characteristic | Without Mortgage | With Mortgage |
| Housing Units | 223 | 274 |
| Median Property Value | $105,200 | $139,400 |
| Median Household Income | $46,164 | $38 |
| Monthly Housing Costs | $507 | $5 |
| Real Estate Taxes | $986 | $4 |
Property Value by Mortgage Status in Elkland borough
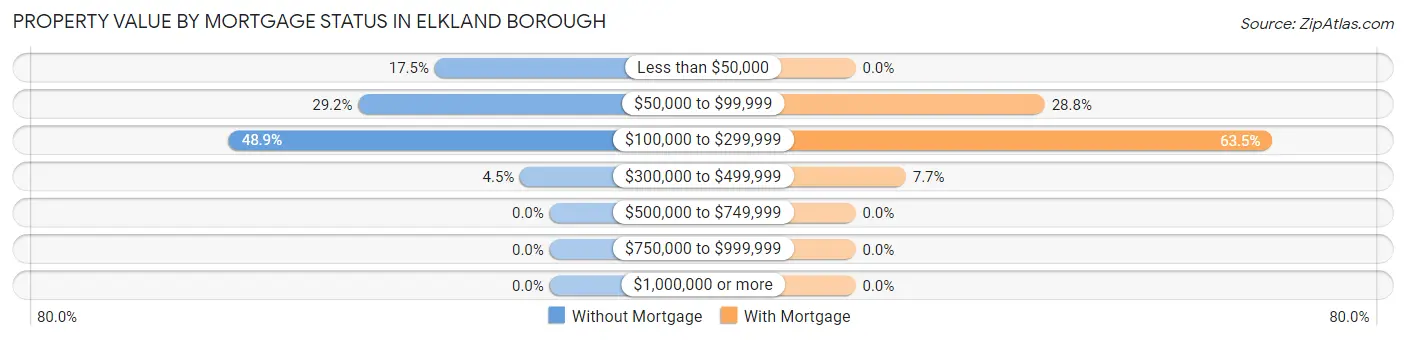
| Property Value | Without Mortgage | With Mortgage |
| Less than $50,000 | 39 (17.5%) | 0 (0.0%) |
| $50,000 to $99,999 | 65 (29.1%) | 79 (28.8%) |
| $100,000 to $299,999 | 109 (48.9%) | 174 (63.5%) |
| $300,000 to $499,999 | 10 (4.5%) | 21 (7.7%) |
| $500,000 to $749,999 | 0 (0.0%) | 0 (0.0%) |
| $750,000 to $999,999 | 0 (0.0%) | 0 (0.0%) |
| $1,000,000 or more | 0 (0.0%) | 0 (0.0%) |
| Total | 223 (100.0%) | 274 (100.0%) |
Household Income by Mortgage Status in Elkland borough
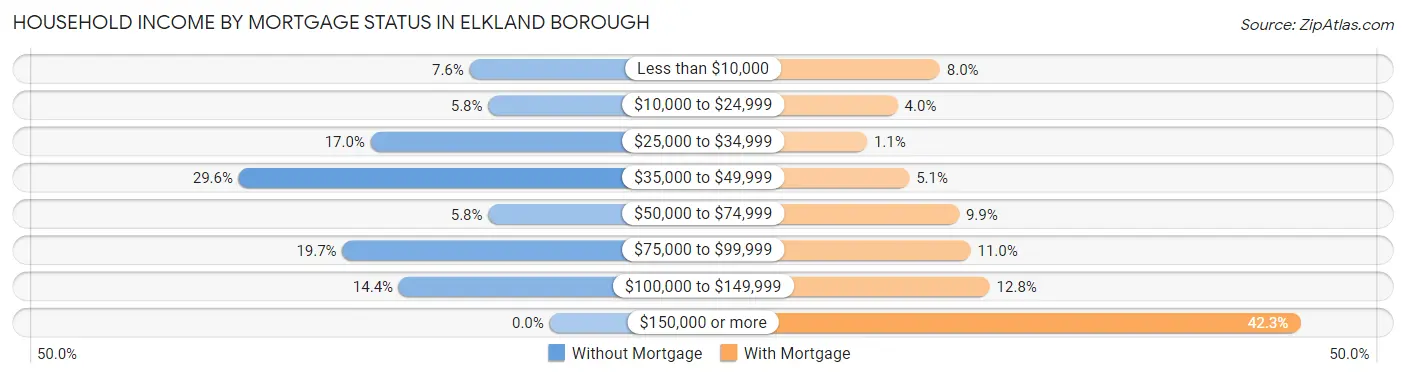
| Household Income | Without Mortgage | With Mortgage |
| Less than $10,000 | 17 (7.6%) | 22 (8.0%) |
| $10,000 to $24,999 | 13 (5.8%) | 11 (4.0%) |
| $25,000 to $34,999 | 38 (17.0%) | 3 (1.1%) |
| $35,000 to $49,999 | 66 (29.6%) | 14 (5.1%) |
| $50,000 to $74,999 | 13 (5.8%) | 27 (9.9%) |
| $75,000 to $99,999 | 44 (19.7%) | 30 (11.0%) |
| $100,000 to $149,999 | 32 (14.3%) | 35 (12.8%) |
| $150,000 or more | 0 (0.0%) | 116 (42.3%) |
| Total | 223 (100.0%) | 274 (100.0%) |
Property Value to Household Income Ratio in Elkland borough
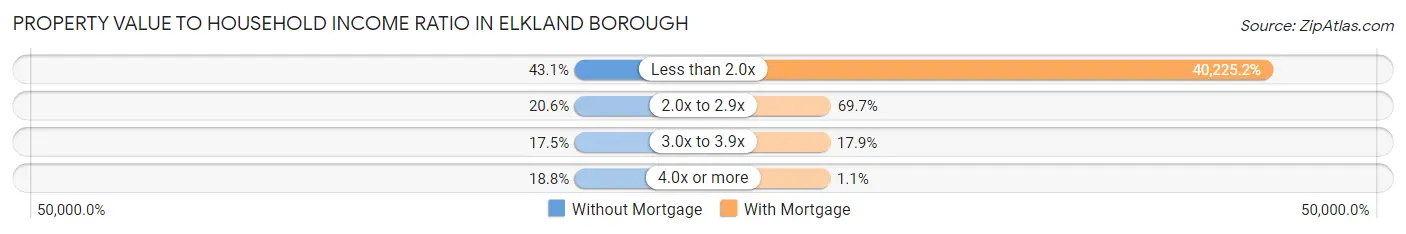
| Value-to-Income Ratio | Without Mortgage | With Mortgage |
| Less than 2.0x | 96 (43.0%) | 110,217 (40,225.2%) |
| 2.0x to 2.9x | 46 (20.6%) | 191 (69.7%) |
| 3.0x to 3.9x | 39 (17.5%) | 49 (17.9%) |
| 4.0x or more | 42 (18.8%) | 3 (1.1%) |
| Total | 223 (100.0%) | 274 (100.0%) |
Real Estate Taxes by Mortgage Status in Elkland borough
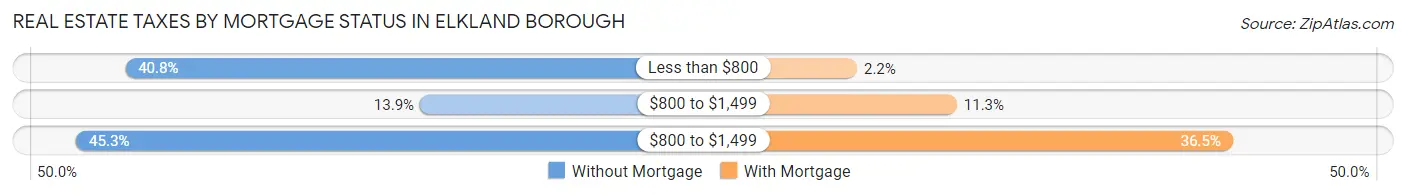
| Property Taxes | Without Mortgage | With Mortgage |
| Less than $800 | 91 (40.8%) | 6 (2.2%) |
| $800 to $1,499 | 31 (13.9%) | 31 (11.3%) |
| $800 to $1,499 | 101 (45.3%) | 100 (36.5%) |
| Total | 223 (100.0%) | 274 (100.0%) |
Health & Disability in Elkland borough
Health Insurance Coverage by Age in Elkland borough
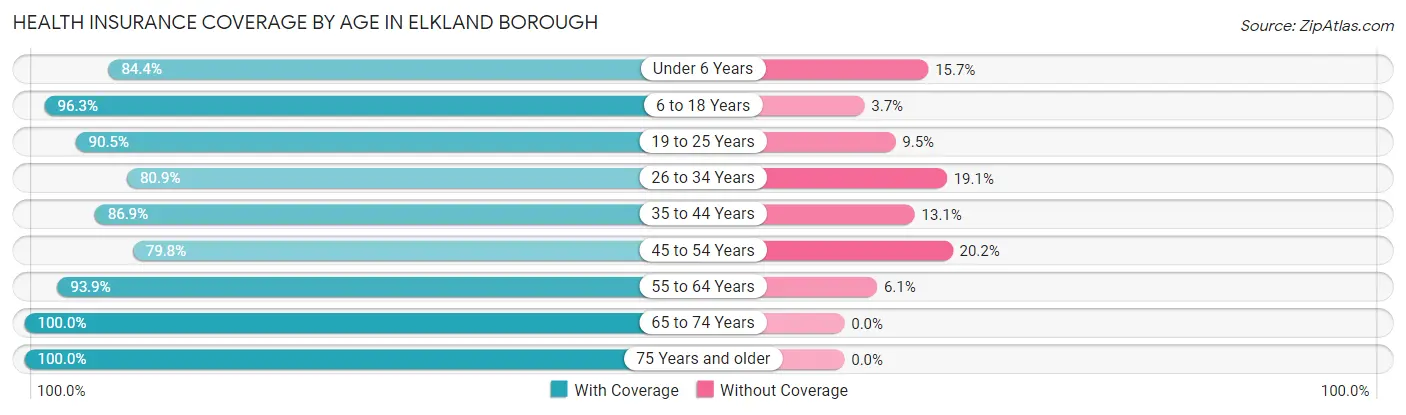
| Age Bracket | With Coverage | Without Coverage |
| Under 6 Years | 124 (84.4%) | 23 (15.7%) |
| 6 to 18 Years | 180 (96.3%) | 7 (3.7%) |
| 19 to 25 Years | 133 (90.5%) | 14 (9.5%) |
| 26 to 34 Years | 144 (80.9%) | 34 (19.1%) |
| 35 to 44 Years | 159 (86.9%) | 24 (13.1%) |
| 45 to 54 Years | 166 (79.8%) | 42 (20.2%) |
| 55 to 64 Years | 200 (93.9%) | 13 (6.1%) |
| 65 to 74 Years | 216 (100.0%) | 0 (0.0%) |
| 75 Years and older | 191 (100.0%) | 0 (0.0%) |
| Total | 1,513 (90.6%) | 157 (9.4%) |
Health Insurance Coverage by Citizenship Status in Elkland borough
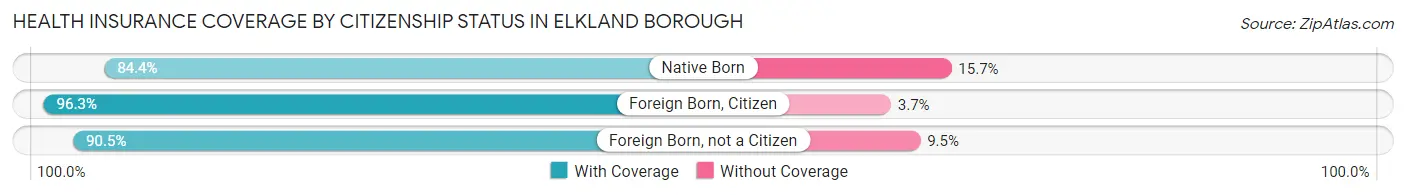
| Citizenship Status | With Coverage | Without Coverage |
| Native Born | 124 (84.4%) | 23 (15.7%) |
| Foreign Born, Citizen | 180 (96.3%) | 7 (3.7%) |
| Foreign Born, not a Citizen | 133 (90.5%) | 14 (9.5%) |
Health Insurance Coverage by Household Income in Elkland borough
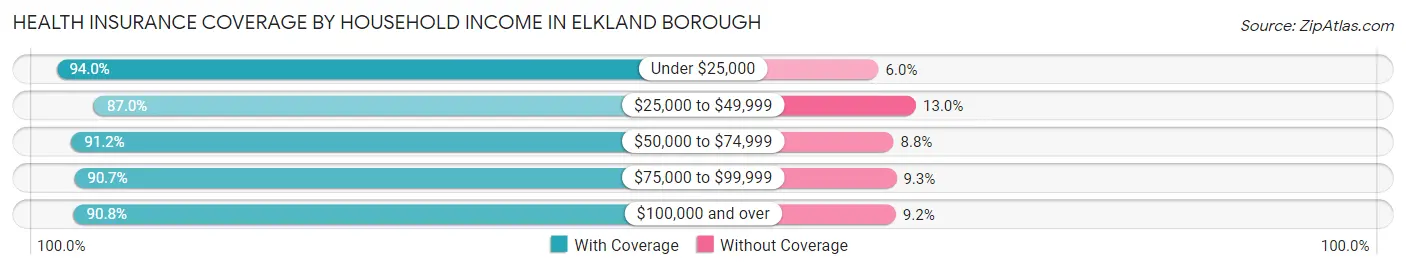
| Household Income | With Coverage | Without Coverage |
| Under $25,000 | 252 (94.0%) | 16 (6.0%) |
| $25,000 to $49,999 | 288 (87.0%) | 43 (13.0%) |
| $50,000 to $74,999 | 156 (91.2%) | 15 (8.8%) |
| $75,000 to $99,999 | 185 (90.7%) | 19 (9.3%) |
| $100,000 and over | 632 (90.8%) | 64 (9.2%) |
Public vs Private Health Insurance Coverage by Age in Elkland borough
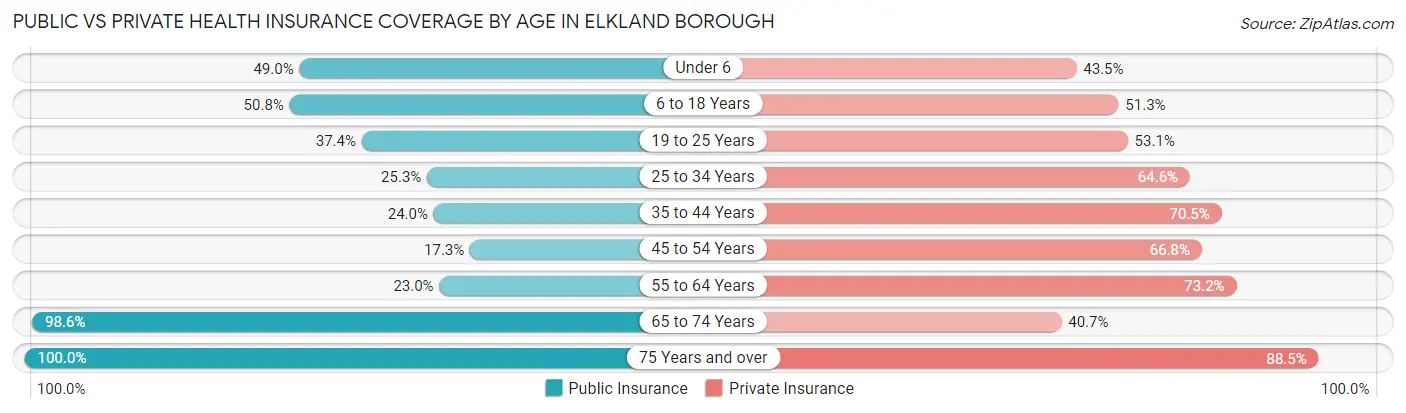
| Age Bracket | Public Insurance | Private Insurance |
| Under 6 | 72 (49.0%) | 64 (43.5%) |
| 6 to 18 Years | 95 (50.8%) | 96 (51.3%) |
| 19 to 25 Years | 55 (37.4%) | 78 (53.1%) |
| 25 to 34 Years | 45 (25.3%) | 115 (64.6%) |
| 35 to 44 Years | 44 (24.0%) | 129 (70.5%) |
| 45 to 54 Years | 36 (17.3%) | 139 (66.8%) |
| 55 to 64 Years | 49 (23.0%) | 156 (73.2%) |
| 65 to 74 Years | 213 (98.6%) | 88 (40.7%) |
| 75 Years and over | 191 (100.0%) | 169 (88.5%) |
| Total | 800 (47.9%) | 1,034 (61.9%) |
Disability Status by Sex by Age in Elkland borough
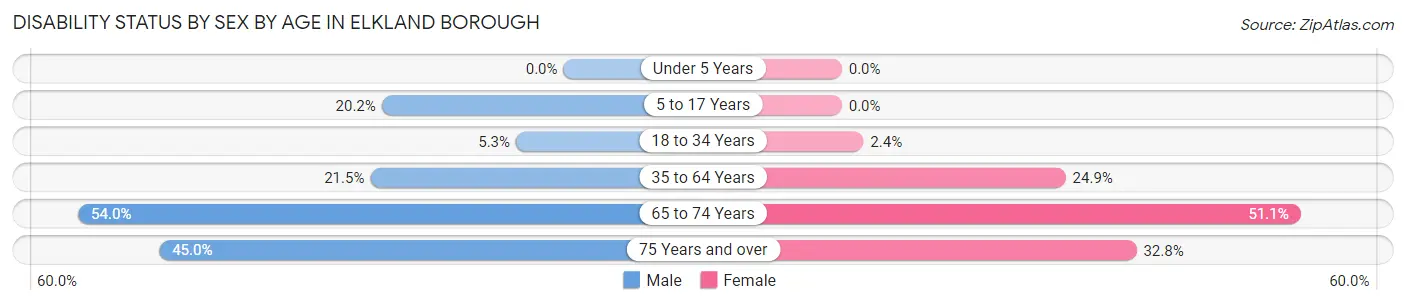
| Age Bracket | Male | Female |
| Under 5 Years | 0 (0.0%) | 0 (0.0%) |
| 5 to 17 Years | 17 (20.2%) | 0 (0.0%) |
| 18 to 34 Years | 9 (5.3%) | 4 (2.4%) |
| 35 to 64 Years | 54 (21.5%) | 88 (24.9%) |
| 65 to 74 Years | 67 (54.0%) | 47 (51.1%) |
| 75 Years and over | 27 (45.0%) | 43 (32.8%) |
Disability Class by Sex by Age in Elkland borough
Disability Class: Hearing Difficulty
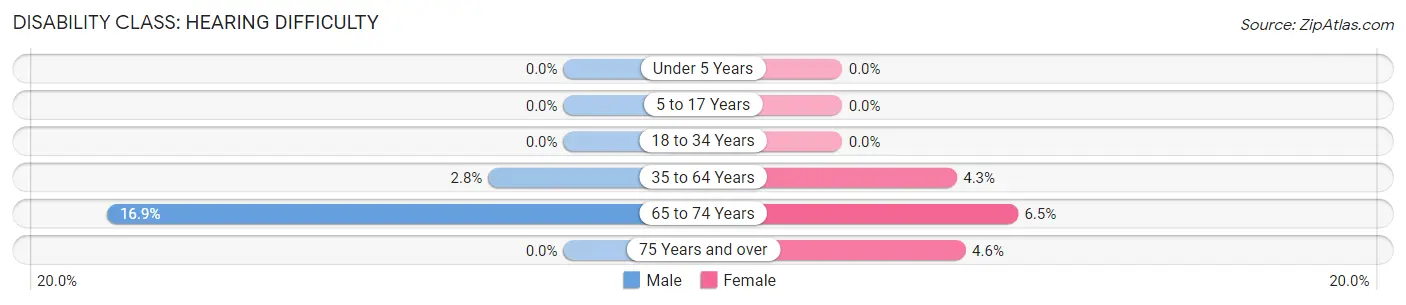
| Age Bracket | Male | Female |
| Under 5 Years | 0 (0.0%) | 0 (0.0%) |
| 5 to 17 Years | 0 (0.0%) | 0 (0.0%) |
| 18 to 34 Years | 0 (0.0%) | 0 (0.0%) |
| 35 to 64 Years | 7 (2.8%) | 15 (4.3%) |
| 65 to 74 Years | 21 (16.9%) | 6 (6.5%) |
| 75 Years and over | 0 (0.0%) | 6 (4.6%) |
Disability Class: Vision Difficulty
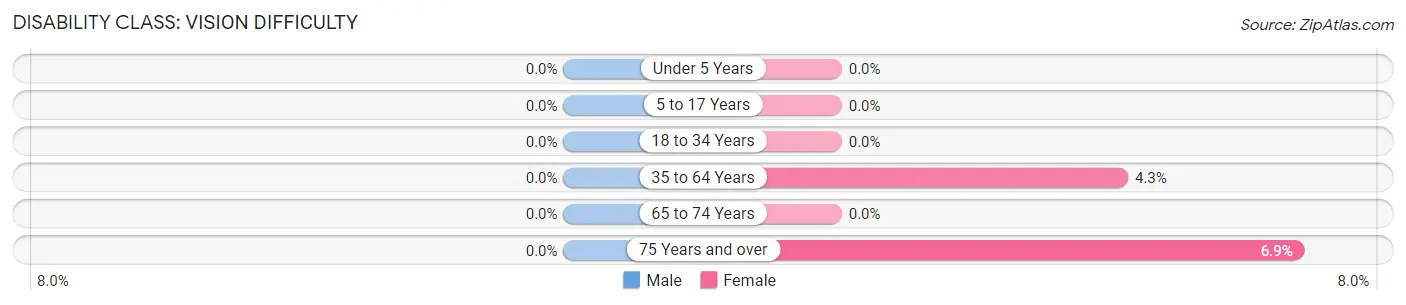
| Age Bracket | Male | Female |
| Under 5 Years | 0 (0.0%) | 0 (0.0%) |
| 5 to 17 Years | 0 (0.0%) | 0 (0.0%) |
| 18 to 34 Years | 0 (0.0%) | 0 (0.0%) |
| 35 to 64 Years | 0 (0.0%) | 15 (4.3%) |
| 65 to 74 Years | 0 (0.0%) | 0 (0.0%) |
| 75 Years and over | 0 (0.0%) | 9 (6.9%) |
Disability Class: Cognitive Difficulty
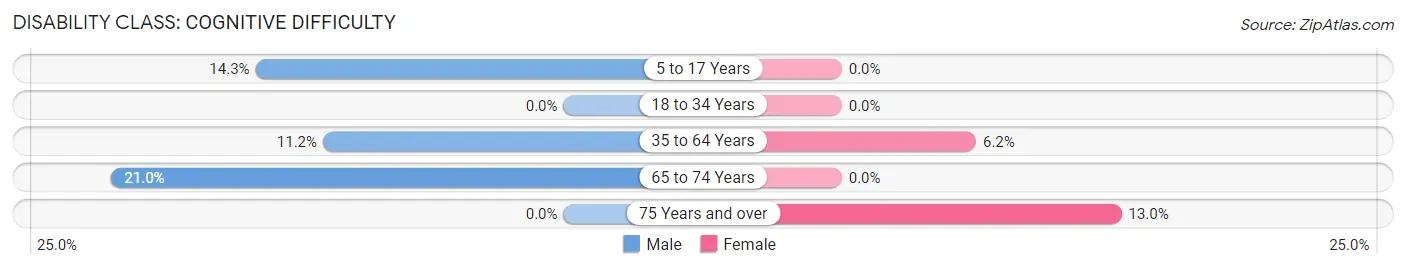
| Age Bracket | Male | Female |
| 5 to 17 Years | 12 (14.3%) | 0 (0.0%) |
| 18 to 34 Years | 0 (0.0%) | 0 (0.0%) |
| 35 to 64 Years | 28 (11.2%) | 22 (6.2%) |
| 65 to 74 Years | 26 (21.0%) | 0 (0.0%) |
| 75 Years and over | 0 (0.0%) | 17 (13.0%) |
Disability Class: Ambulatory Difficulty
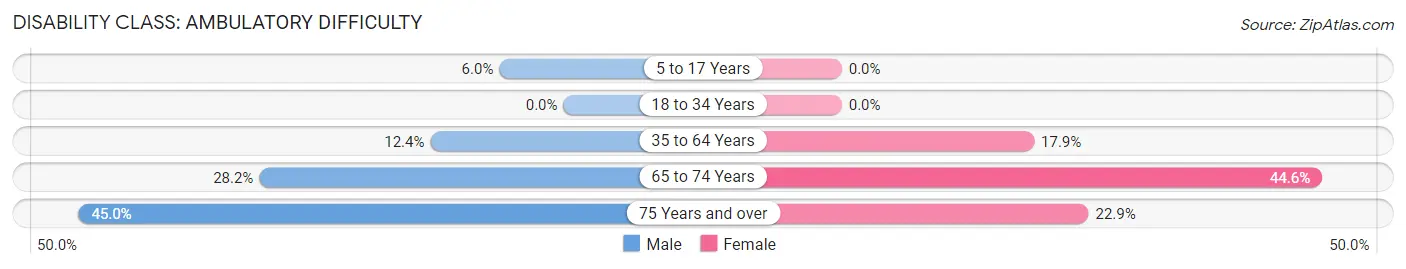
| Age Bracket | Male | Female |
| 5 to 17 Years | 5 (5.9%) | 0 (0.0%) |
| 18 to 34 Years | 0 (0.0%) | 0 (0.0%) |
| 35 to 64 Years | 31 (12.3%) | 63 (17.8%) |
| 65 to 74 Years | 35 (28.2%) | 41 (44.6%) |
| 75 Years and over | 27 (45.0%) | 30 (22.9%) |
Disability Class: Self-Care Difficulty
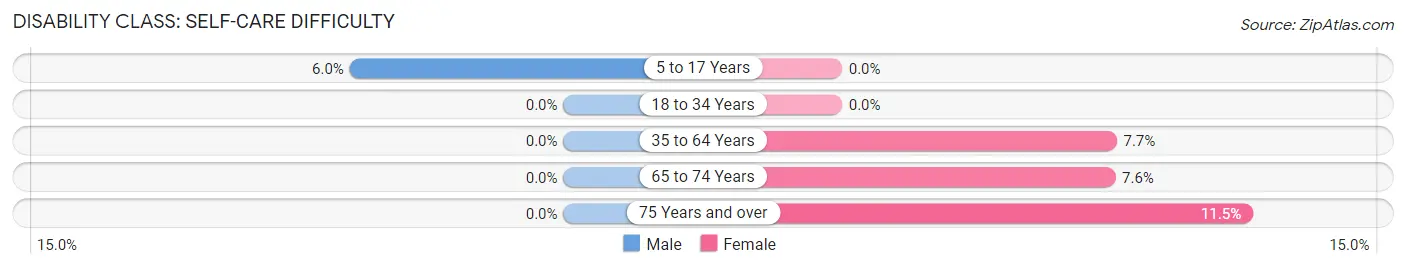
| Age Bracket | Male | Female |
| 5 to 17 Years | 5 (5.9%) | 0 (0.0%) |
| 18 to 34 Years | 0 (0.0%) | 0 (0.0%) |
| 35 to 64 Years | 0 (0.0%) | 27 (7.6%) |
| 65 to 74 Years | 0 (0.0%) | 7 (7.6%) |
| 75 Years and over | 0 (0.0%) | 15 (11.5%) |
Technology Access in Elkland borough
Computing Device Access in Elkland borough
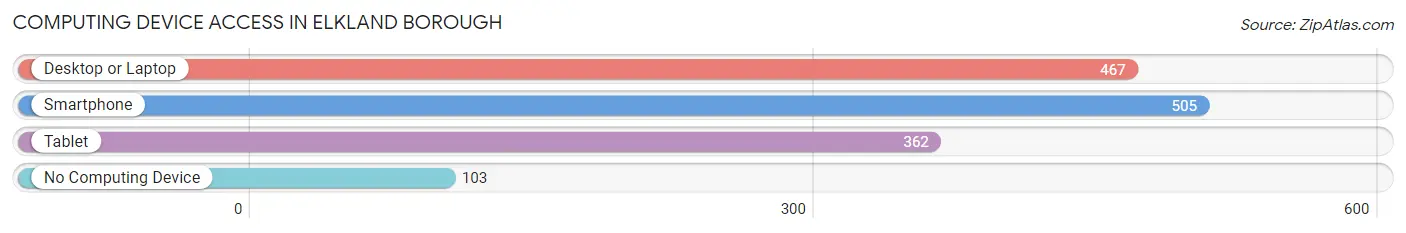
| Device Type | # Households | % Households |
| Desktop or Laptop | 467 | 66.4% |
| Smartphone | 505 | 71.8% |
| Tablet | 362 | 51.5% |
| No Computing Device | 103 | 14.6% |
| Total | 703 | 100.0% |
Internet Access in Elkland borough
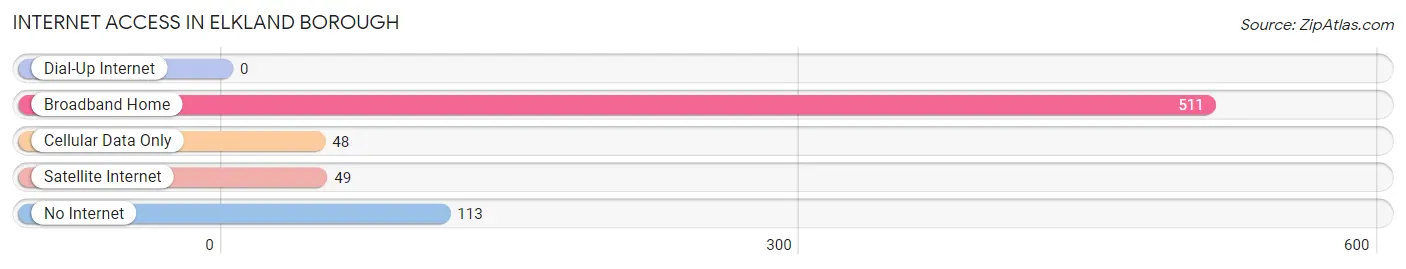
| Internet Type | # Households | % Households |
| Dial-Up Internet | 0 | 0.0% |
| Broadband Home | 511 | 72.7% |
| Cellular Data Only | 48 | 6.8% |
| Satellite Internet | 49 | 7.0% |
| No Internet | 113 | 16.1% |
| Total | 703 | 100.0% |
Elkland borough Summary
Elkland Borough is a small borough located in Tioga County, Pennsylvania. It is situated in the northern part of the state, approximately 20 miles south of the New York border. The borough is home to a population of approximately 1,500 people, and is part of the Wellsboro Micropolitan Statistical Area.
History
Elkland Borough was founded in 1876, when the first settlers arrived in the area. The town was named after the Elkland Creek, which runs through the borough. The creek was named after the elk that were once plentiful in the area. The first settlers were mostly farmers, and the town quickly grew to become a thriving agricultural community.
In the late 19th century, the town began to industrialize, and several factories were built in the area. The most notable of these was the Elkland Manufacturing Company, which produced a variety of products, including furniture, tools, and machinery. The company was in operation until the early 20th century, when it closed due to the Great Depression.
In the early 20th century, the town began to experience a population decline, as many of the residents moved away in search of better economic opportunities. This trend continued until the 1950s, when the population began to slowly increase again.
Geography
Elkland Borough is located in the northern part of Tioga County, Pennsylvania. It is situated in the Appalachian Mountains, and is surrounded by rolling hills and forests. The borough is located approximately 20 miles south of the New York border, and is part of the Wellsboro Micropolitan Statistical Area.
The borough is home to several parks and recreational areas, including the Elkland Borough Park, which features a playground, picnic area, and walking trails. The borough is also home to several lakes, including Lake Hammond and Lake Tioga.
Economy
The economy of Elkland Borough is largely based on agriculture and tourism. The borough is home to several farms, which produce a variety of crops, including corn, soybeans, and hay. The borough is also home to several wineries, which produce a variety of wines.
The borough is also home to several small businesses, including restaurants, shops, and other services. The borough is also home to several manufacturing companies, which produce a variety of products, including furniture, tools, and machinery.
Demographics
As of the 2010 census, the population of Elkland Borough was 1,521. The racial makeup of the borough was 97.3% White, 0.7% African American, 0.2% Native American, 0.2% Asian, 0.2% from other races, and 1.6% from two or more races. Hispanic or Latino of any race were 0.7% of the population.
The median income for a household in the borough was $37,917, and the median income for a family was $45,625. The per capita income for the borough was $18,945. About 11.2% of families and 14.2% of the population were below the poverty line, including 19.2% of those under age 18 and 8.2% of those age 65 or over.
Common Questions
What is Per Capita Income in Elkland borough?
Per Capita income in Elkland borough is $32,514.
What is the Median Family Income in Elkland borough?
Median Family Income in Elkland borough is $85,795.
What is the Median Household income in Elkland borough?
Median Household Income in Elkland borough is $57,375.
What is Income or Wage Gap in Elkland borough?
Income or Wage Gap in Elkland borough is 9.0%.
Women in Elkland borough earn 91.0 cents for every dollar earned by a man.
What is Inequality or Gini Index in Elkland borough?
Inequality or Gini Index in Elkland borough is 0.43.
What is the Total Population of Elkland borough?
Total Population of Elkland borough is 1,673.
What is the Total Male Population of Elkland borough?
Total Male Population of Elkland borough is 770.
What is the Total Female Population of Elkland borough?
Total Female Population of Elkland borough is 903.
What is the Ratio of Males per 100 Females in Elkland borough?
There are 85.27 Males per 100 Females in Elkland borough.
What is the Ratio of Females per 100 Males in Elkland borough?
There are 117.27 Females per 100 Males in Elkland borough.
What is the Median Population Age in Elkland borough?
Median Population Age in Elkland borough is 44.9 Years.
What is the Average Family Size in Elkland borough
Average Family Size in Elkland borough is 3.0 People.
What is the Average Household Size in Elkland borough
Average Household Size in Elkland borough is 2.4 People.
How Large is the Labor Force in Elkland borough?
There are 750 People in the Labor Forcein in Elkland borough.
What is the Percentage of People in the Labor Force in Elkland borough?
54.0% of People are in the Labor Force in Elkland borough.
What is the Unemployment Rate in Elkland borough?
Unemployment Rate in Elkland borough is 4.1%.