Coral, PA Map & Demographics
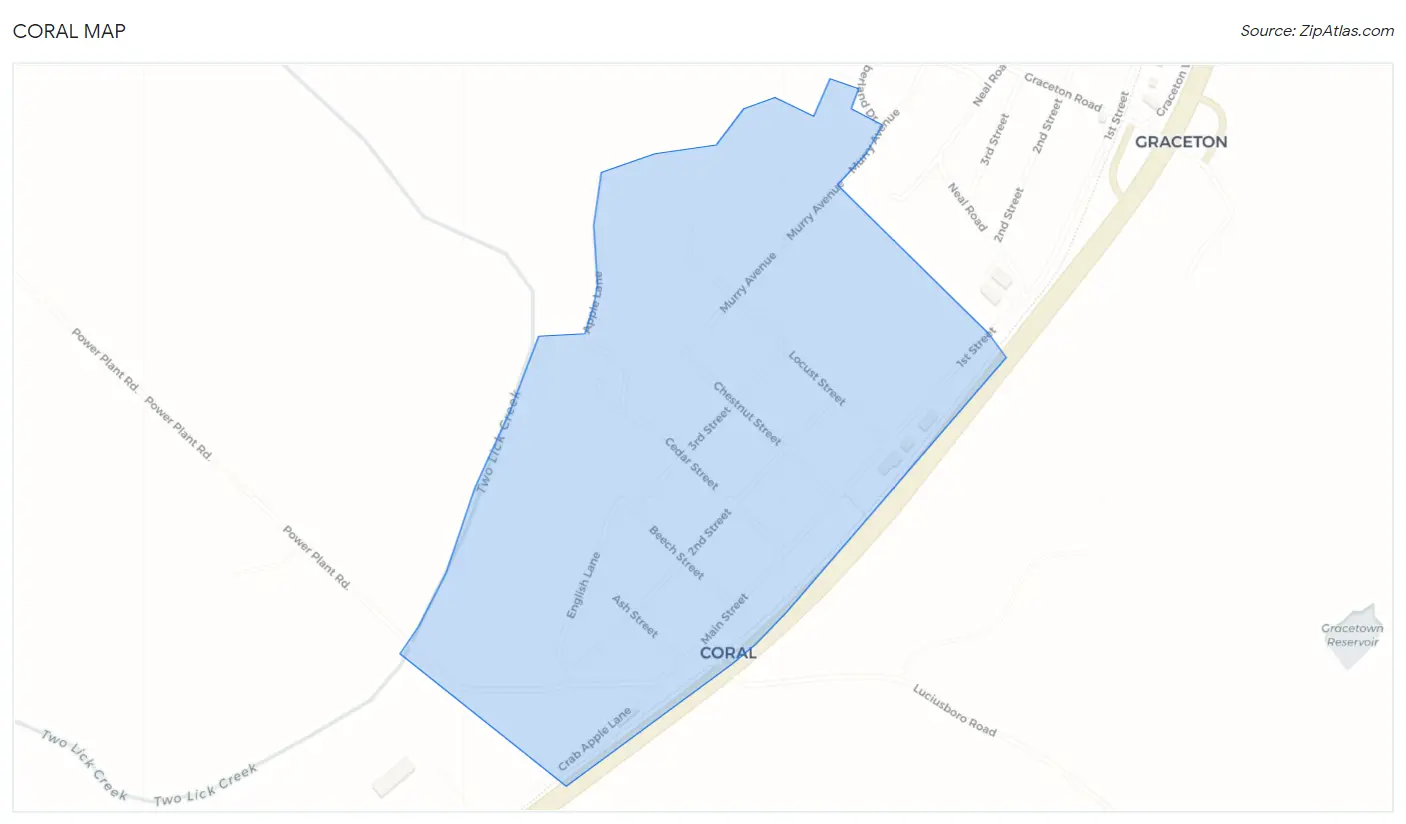
Coral Map
Coral Overview
$23,191
PER CAPITA INCOME
$52,574
AVG HOUSEHOLD INCOME
0.32
INEQUALITY / GINI INDEX
234
TOTAL POPULATION
125
MALE POPULATION
109
FEMALE POPULATION
114.68
MALES / 100 FEMALES
87.20
FEMALES / 100 MALES
57.1
MEDIAN AGE
2.6
AVG FAMILY SIZE
2.0
AVG HOUSEHOLD SIZE
169
LABOR FORCE [ PEOPLE ]
72.2%
PERCENT IN LABOR FORCE
5.9%
UNEMPLOYMENT RATE
Coral Zip Codes
Income in Coral
Income Overview in Coral
| Characteristic | Number | Measure |
| Per Capita Income | 234 | $23,191 |
| Median Family Income | 63 | $0 |
| Mean Family Income | 63 | $0 |
| Median Household Income | 119 | $52,574 |
| Mean Household Income | 119 | $44,763 |
| Income Deficit | 63 | $0 |
| Wage / Income Gap (%) | 234 | 0.00% |
| Wage / Income Gap ($) | 234 | 100.00¢ per $1 |
| Gini / Inequality Index | 234 | 0.32 |
Earnings by Sex in Coral
| Sex | Number | Average Earnings |
| Male | 108 (63.9%) | $0 |
| Female | 61 (36.1%) | $0 |
| Total | 169 (100.0%) | $0 |
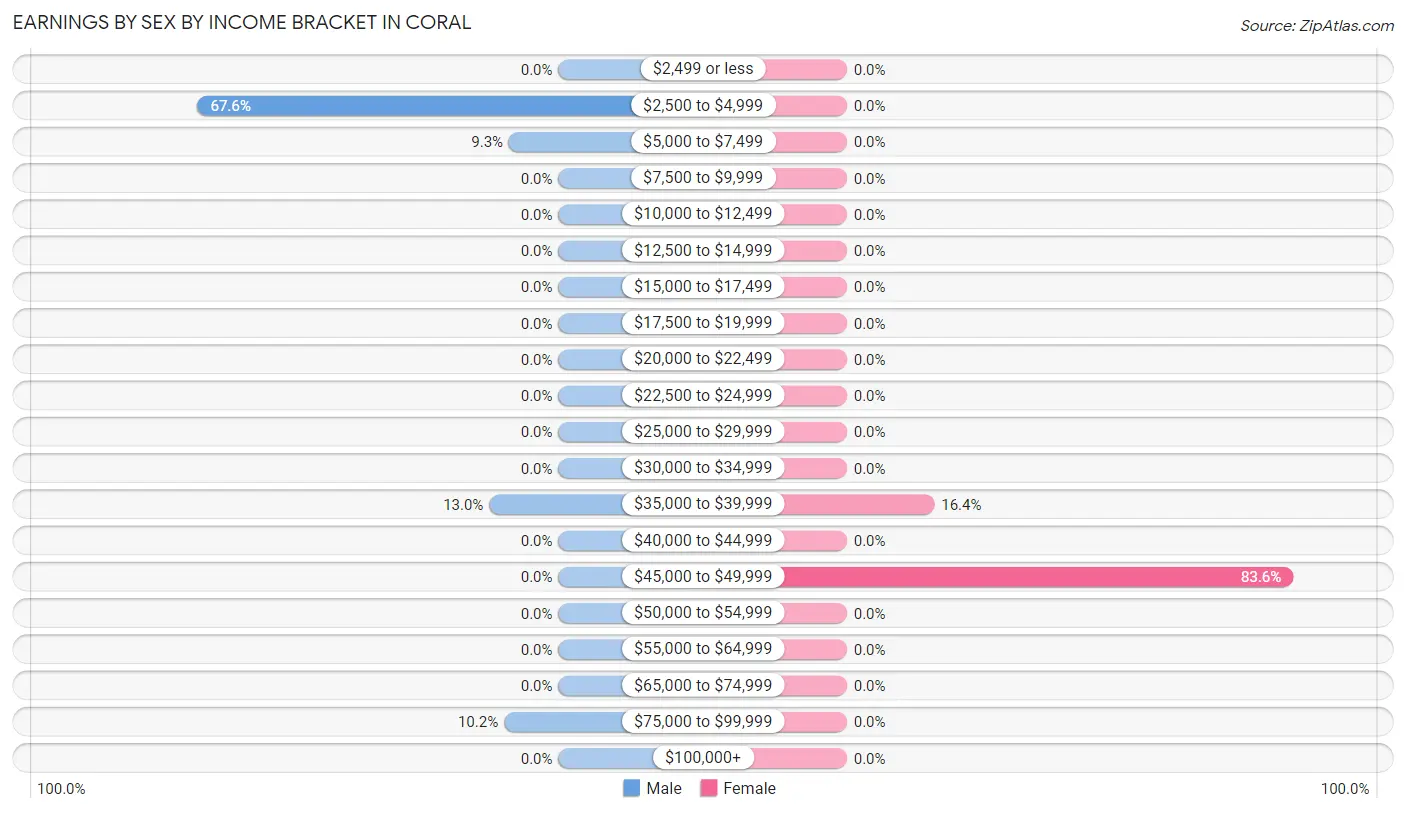
Earnings by Sex by Income Bracket in Coral
The most common earnings brackets in Coral are $2,500 to $4,999 for men (73 | 67.6%) and $45,000 to $49,999 for women (51 | 83.6%).
| Income | Male | Female |
| $2,499 or less | 0 (0.0%) | 0 (0.0%) |
| $2,500 to $4,999 | 73 (67.6%) | 0 (0.0%) |
| $5,000 to $7,499 | 10 (9.3%) | 0 (0.0%) |
| $7,500 to $9,999 | 0 (0.0%) | 0 (0.0%) |
| $10,000 to $12,499 | 0 (0.0%) | 0 (0.0%) |
| $12,500 to $14,999 | 0 (0.0%) | 0 (0.0%) |
| $15,000 to $17,499 | 0 (0.0%) | 0 (0.0%) |
| $17,500 to $19,999 | 0 (0.0%) | 0 (0.0%) |
| $20,000 to $22,499 | 0 (0.0%) | 0 (0.0%) |
| $22,500 to $24,999 | 0 (0.0%) | 0 (0.0%) |
| $25,000 to $29,999 | 0 (0.0%) | 0 (0.0%) |
| $30,000 to $34,999 | 0 (0.0%) | 0 (0.0%) |
| $35,000 to $39,999 | 14 (13.0%) | 10 (16.4%) |
| $40,000 to $44,999 | 0 (0.0%) | 0 (0.0%) |
| $45,000 to $49,999 | 0 (0.0%) | 51 (83.6%) |
| $50,000 to $54,999 | 0 (0.0%) | 0 (0.0%) |
| $55,000 to $64,999 | 0 (0.0%) | 0 (0.0%) |
| $65,000 to $74,999 | 0 (0.0%) | 0 (0.0%) |
| $75,000 to $99,999 | 11 (10.2%) | 0 (0.0%) |
| $100,000+ | 0 (0.0%) | 0 (0.0%) |
| Total | 108 (100.0%) | 61 (100.0%) |
Earnings by Sex by Educational Attainment in Coral
| Educational Attainment | Male Income | Female Income |
| Less than High School | - | - |
| High School Diploma | - | - |
| College or Associate's Degree | - | - |
| Bachelor's Degree | - | - |
| Graduate Degree | - | - |
| Total | - | - |
Family Income in Coral
Family Income Brackets in Coral
According to the Coral family income data, there are 51 families falling into the $50,000 to $74,999 income range, which is the most common income bracket and makes up 80.9% of all families.
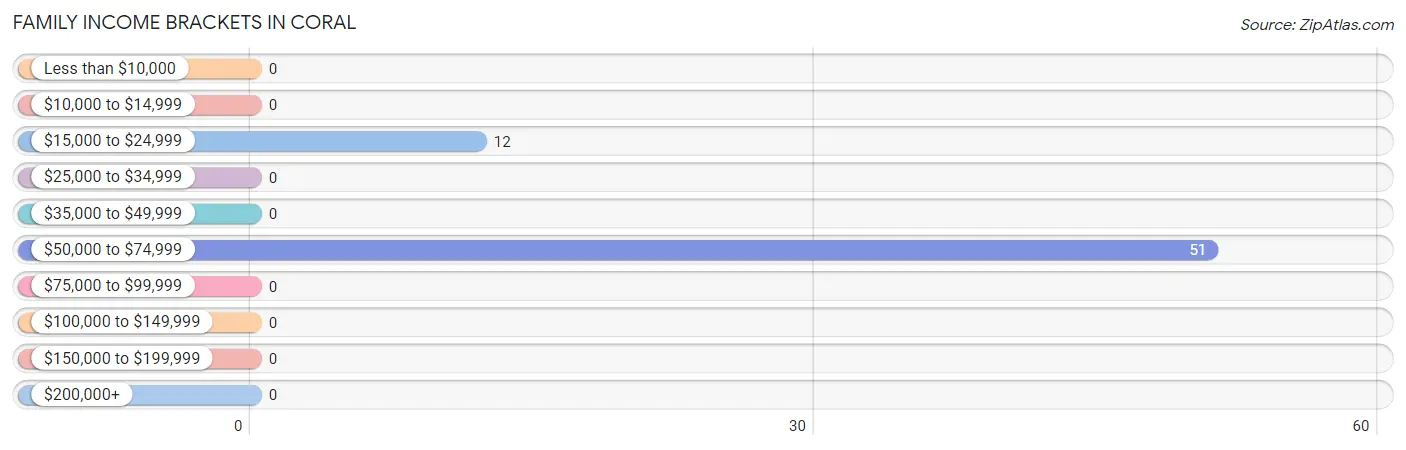
| Income Bracket | # Families | % Families |
| Less than $10,000 | 0 | 0.0% |
| $10,000 to $14,999 | 0 | 0.0% |
| $15,000 to $24,999 | 12 | 19.0% |
| $25,000 to $34,999 | 0 | 0.0% |
| $35,000 to $49,999 | 0 | 0.0% |
| $50,000 to $74,999 | 51 | 81.0% |
| $75,000 to $99,999 | 0 | 0.0% |
| $100,000 to $149,999 | 0 | 0.0% |
| $150,000 to $199,999 | 0 | 0.0% |
| $200,000+ | 0 | 0.0% |
Family Income by Famaliy Size in Coral
| Income Bracket | # Families | Median Income |
| 2-Person Families | 12 (19.1%) | $0 |
| 3-Person Families | 51 (80.9%) | $0 |
| 4-Person Families | 0 (0.0%) | $0 |
| 5-Person Families | 0 (0.0%) | $0 |
| 6-Person Families | 0 (0.0%) | $0 |
| 7+ Person Families | 0 (0.0%) | $0 |
| Total | 63 (100.0%) | $0 |
Family Income by Number of Earners in Coral
| Number of Earners | # Families | Median Income |
| No Earners | 12 (19.1%) | $0 |
| 1 Earner | 0 (0.0%) | $0 |
| 2 Earners | 51 (80.9%) | $0 |
| 3+ Earners | 0 (0.0%) | $0 |
| Total | 63 (100.0%) | $0 |
Household Income in Coral
Household Income Brackets in Coral
With 51 households falling in the category, the $50,000 to $74,999 income range is the most frequent in Coral, accounting for 42.9% of all households.
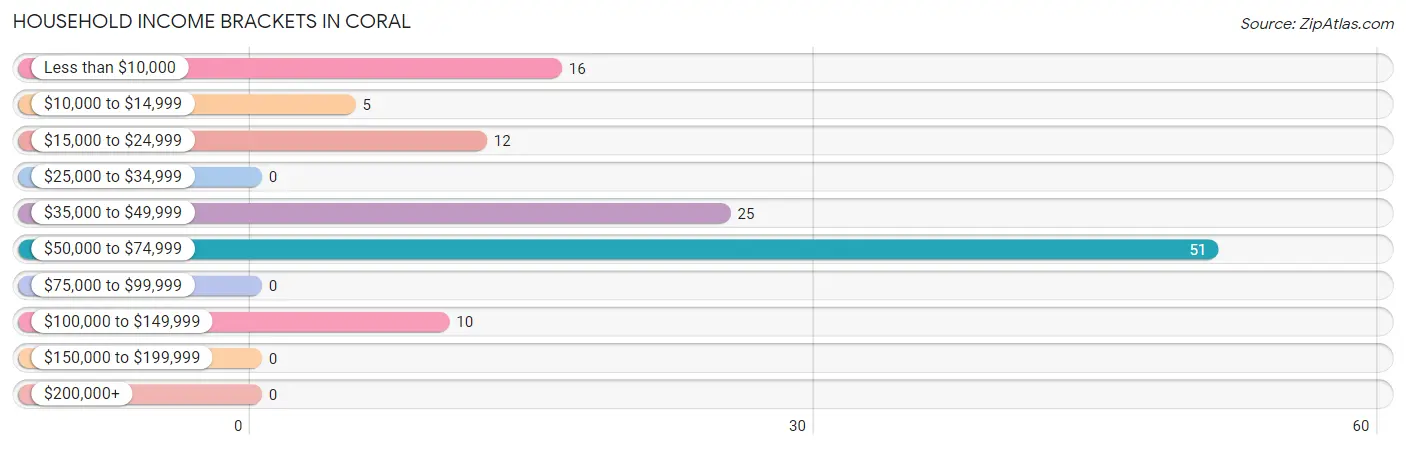
| Income Bracket | # Households | % Households |
| Less than $10,000 | 16 | 13.4% |
| $10,000 to $14,999 | 5 | 4.2% |
| $15,000 to $24,999 | 12 | 10.1% |
| $25,000 to $34,999 | 0 | 0.0% |
| $35,000 to $49,999 | 25 | 21.0% |
| $50,000 to $74,999 | 51 | 42.9% |
| $75,000 to $99,999 | 0 | 0.0% |
| $100,000 to $149,999 | 10 | 8.4% |
| $150,000 to $199,999 | 0 | 0.0% |
| $200,000+ | 0 | 0.0% |
Household Income by Householder Age in Coral
The median household income in Coral is $52,574, with the highest median household income of $53,211 found in the 45 to 64 years age bracket for the primary householder. A total of 73 households (61.3%) fall into this category.
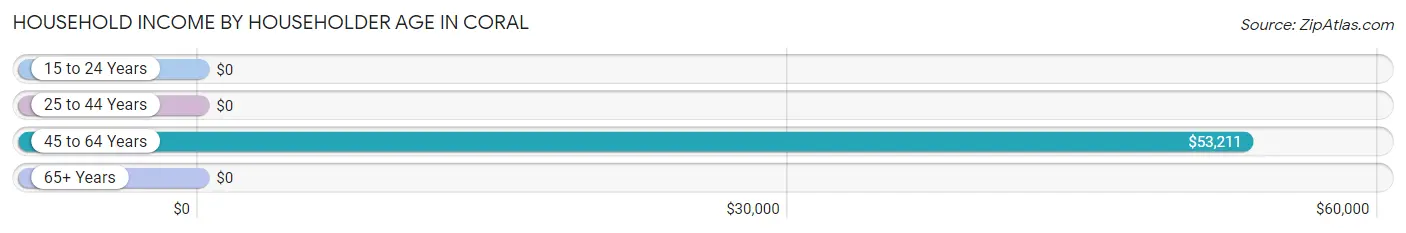
| Income Bracket | # Households | Median Income |
| 15 to 24 Years | 0 (0.0%) | $0 |
| 25 to 44 Years | 29 (24.4%) | $0 |
| 45 to 64 Years | 73 (61.3%) | $53,211 |
| 65+ Years | 17 (14.3%) | $0 |
| Total | 119 (100.0%) | $52,574 |
Poverty in Coral
Income Below Poverty by Sex and Age in Coral
With 12.0% poverty level for males and 5.5% for females among the residents of Coral, 55 to 64 year old males and 65 to 74 year old females are the most vulnerable to poverty, with 10 males (45.5%) and 6 females (100.0%) in their respective age groups living below the poverty level.
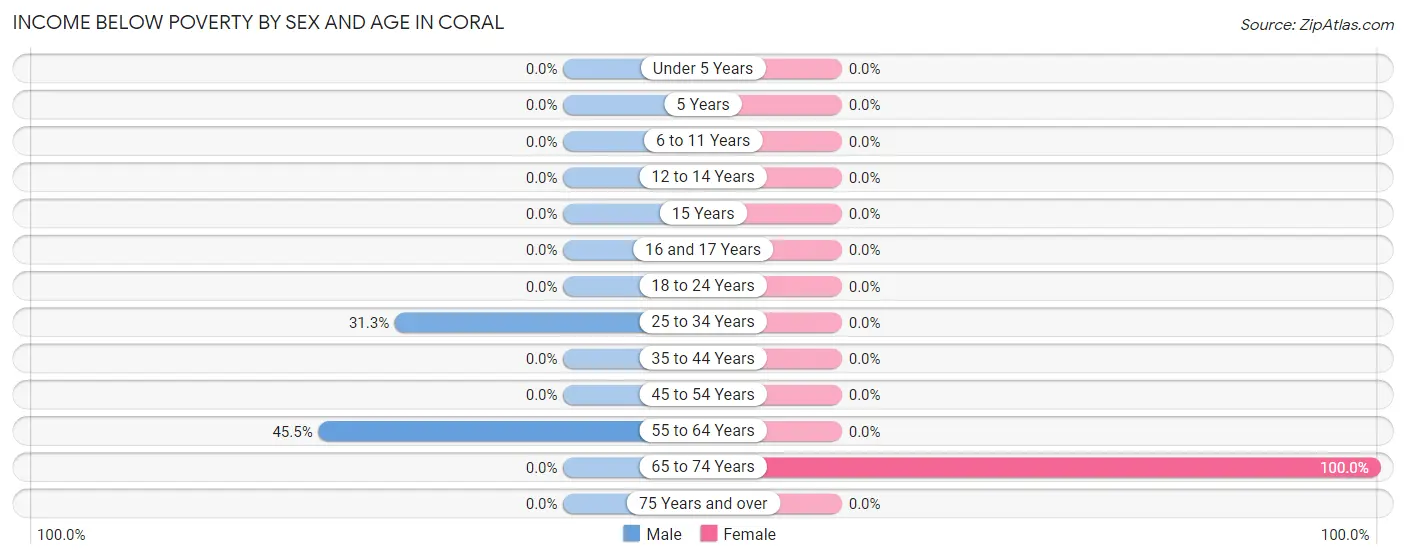
| Age Bracket | Male | Female |
| Under 5 Years | 0 (0.0%) | 0 (0.0%) |
| 5 Years | 0 (0.0%) | 0 (0.0%) |
| 6 to 11 Years | 0 (0.0%) | 0 (0.0%) |
| 12 to 14 Years | 0 (0.0%) | 0 (0.0%) |
| 15 Years | 0 (0.0%) | 0 (0.0%) |
| 16 and 17 Years | 0 (0.0%) | 0 (0.0%) |
| 18 to 24 Years | 0 (0.0%) | 0 (0.0%) |
| 25 to 34 Years | 5 (31.2%) | 0 (0.0%) |
| 35 to 44 Years | 0 (0.0%) | 0 (0.0%) |
| 45 to 54 Years | 0 (0.0%) | 0 (0.0%) |
| 55 to 64 Years | 10 (45.5%) | 0 (0.0%) |
| 65 to 74 Years | 0 (0.0%) | 6 (100.0%) |
| 75 Years and over | 0 (0.0%) | 0 (0.0%) |
| Total | 15 (12.0%) | 6 (5.5%) |
Income Above Poverty by Sex and Age in Coral
According to the poverty statistics in Coral, males aged 18 to 24 years and females aged 25 to 34 years are the age groups that are most secure financially, with 100.0% of males and 100.0% of females in these age groups living above the poverty line.
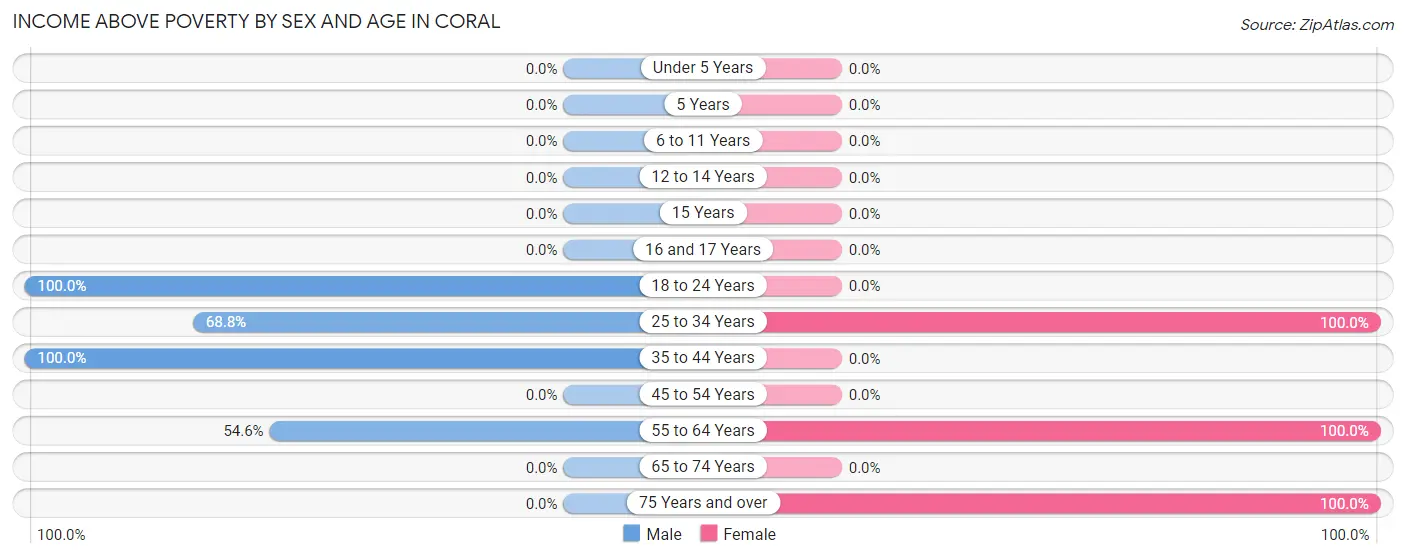
| Age Bracket | Male | Female |
| Under 5 Years | 0 (0.0%) | 0 (0.0%) |
| 5 Years | 0 (0.0%) | 0 (0.0%) |
| 6 to 11 Years | 0 (0.0%) | 0 (0.0%) |
| 12 to 14 Years | 0 (0.0%) | 0 (0.0%) |
| 15 Years | 0 (0.0%) | 0 (0.0%) |
| 16 and 17 Years | 0 (0.0%) | 0 (0.0%) |
| 18 to 24 Years | 73 (100.0%) | 0 (0.0%) |
| 25 to 34 Years | 11 (68.8%) | 10 (100.0%) |
| 35 to 44 Years | 14 (100.0%) | 0 (0.0%) |
| 45 to 54 Years | 0 (0.0%) | 0 (0.0%) |
| 55 to 64 Years | 12 (54.5%) | 62 (100.0%) |
| 65 to 74 Years | 0 (0.0%) | 0 (0.0%) |
| 75 Years and over | 0 (0.0%) | 31 (100.0%) |
| Total | 110 (88.0%) | 103 (94.5%) |
Income Below Poverty Among Married-Couple Families in Coral
| Children | Above Poverty | Below Poverty |
| No Children | 12 (100.0%) | 0 (0.0%) |
| 1 or 2 Children | 0 (0.0%) | 0 (0.0%) |
| 3 or 4 Children | 0 (0.0%) | 0 (0.0%) |
| 5 or more Children | 0 (0.0%) | 0 (0.0%) |
| Total | 12 (100.0%) | 0 (0.0%) |
Income Below Poverty Among Single-Parent Households in Coral
| Children | Single Father | Single Mother |
| No Children | 0 (0.0%) | 0 (0.0%) |
| 1 or 2 Children | 0 (0.0%) | 0 (0.0%) |
| 3 or 4 Children | 0 (0.0%) | 0 (0.0%) |
| 5 or more Children | 0 (0.0%) | 0 (0.0%) |
| Total | 0 (0.0%) | 0 (0.0%) |
Income Below Poverty Among Married-Couple vs Single-Parent Households in Coral
| Children | Married-Couple Families | Single-Parent Households |
| No Children | 0 (0.0%) | 0 (0.0%) |
| 1 or 2 Children | 0 (0.0%) | 0 (0.0%) |
| 3 or 4 Children | 0 (0.0%) | 0 (0.0%) |
| 5 or more Children | 0 (0.0%) | 0 (0.0%) |
| Total | 0 (0.0%) | 0 (0.0%) |
Race in Coral
The most populous races in Coral are , and White / Caucasian (234 | 100.0%).
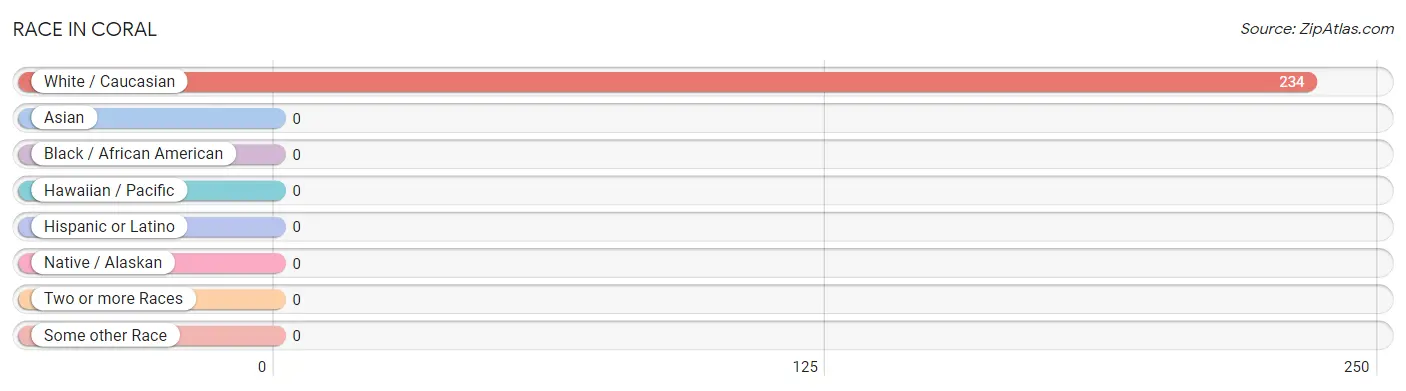
| Race | # Population | % Population |
| Asian | 0 | 0.0% |
| Black / African American | 0 | 0.0% |
| Hawaiian / Pacific | 0 | 0.0% |
| Hispanic or Latino | 0 | 0.0% |
| Native / Alaskan | 0 | 0.0% |
| White / Caucasian | 234 | 100.0% |
| Two or more Races | 0 | 0.0% |
| Some other Race | 0 | 0.0% |
| Total | 234 | 100.0% |
Ancestry in Coral
The most populous ancestries reported in Coral are Italian (180 | 76.9%), Polish (85 | 36.3%), German (25 | 10.7%), Hungarian (23 | 9.8%), and English (14 | 6.0%), together accounting for 139.7% of all Coral residents.
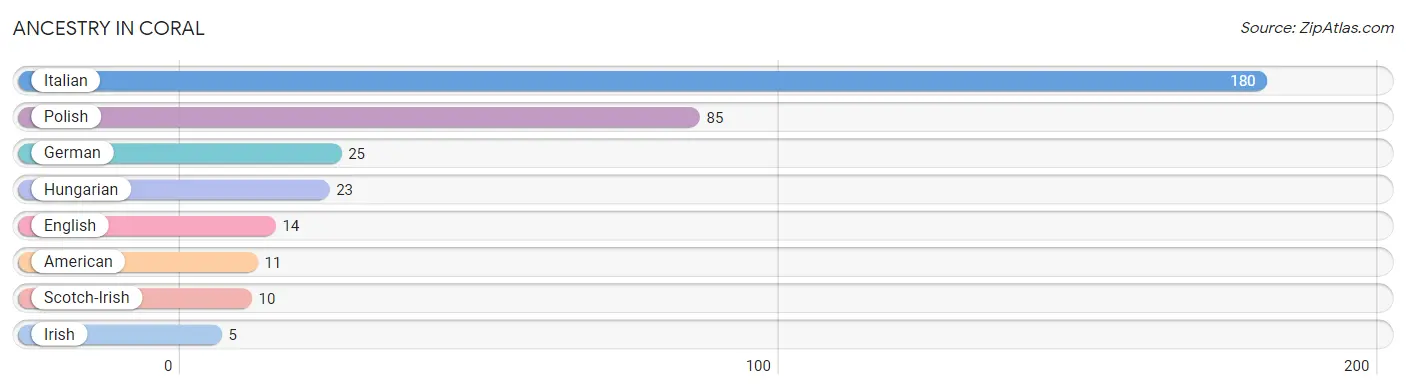
| Ancestry | # Population | % Population |
| American | 11 | 4.7% |
| English | 14 | 6.0% |
| German | 25 | 10.7% |
| Hungarian | 23 | 9.8% |
| Irish | 5 | 2.1% |
| Italian | 180 | 76.9% |
| Polish | 85 | 36.3% |
| Scotch-Irish | 10 | 4.3% | View All 8 Rows |
Immigrants in Coral

| Immigration Origin | # Population | % Population | View All 0 Rows |
Sex and Age in Coral
Sex and Age in Coral
The most populous age groups in Coral are 20 to 24 Years (73 | 58.4%) for men and 55 to 59 Years (62 | 56.9%) for women.
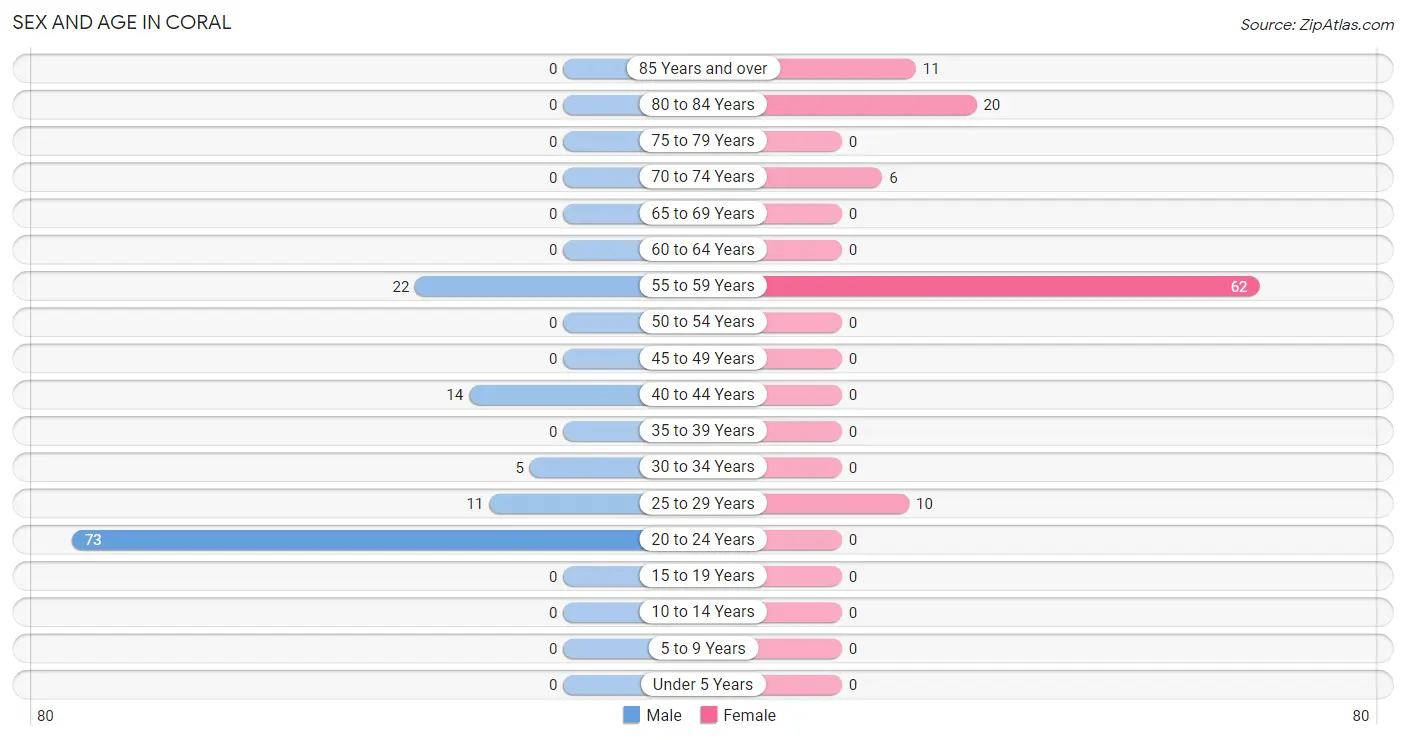
| Age Bracket | Male | Female |
| Under 5 Years | 0 (0.0%) | 0 (0.0%) |
| 5 to 9 Years | 0 (0.0%) | 0 (0.0%) |
| 10 to 14 Years | 0 (0.0%) | 0 (0.0%) |
| 15 to 19 Years | 0 (0.0%) | 0 (0.0%) |
| 20 to 24 Years | 73 (58.4%) | 0 (0.0%) |
| 25 to 29 Years | 11 (8.8%) | 10 (9.2%) |
| 30 to 34 Years | 5 (4.0%) | 0 (0.0%) |
| 35 to 39 Years | 0 (0.0%) | 0 (0.0%) |
| 40 to 44 Years | 14 (11.2%) | 0 (0.0%) |
| 45 to 49 Years | 0 (0.0%) | 0 (0.0%) |
| 50 to 54 Years | 0 (0.0%) | 0 (0.0%) |
| 55 to 59 Years | 22 (17.6%) | 62 (56.9%) |
| 60 to 64 Years | 0 (0.0%) | 0 (0.0%) |
| 65 to 69 Years | 0 (0.0%) | 0 (0.0%) |
| 70 to 74 Years | 0 (0.0%) | 6 (5.5%) |
| 75 to 79 Years | 0 (0.0%) | 0 (0.0%) |
| 80 to 84 Years | 0 (0.0%) | 20 (18.3%) |
| 85 Years and over | 0 (0.0%) | 11 (10.1%) |
| Total | 125 (100.0%) | 109 (100.0%) |
Families and Households in Coral
Median Family Size in Coral
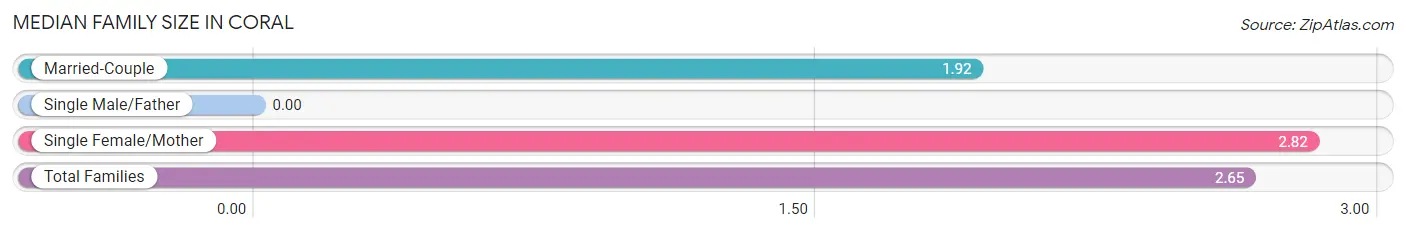
| Family Type | # Families | Family Size |
| Married-Couple | 12 (19.1%) | 1.92 |
| Single Male/Father | 0 (0.0%) | - |
| Single Female/Mother | 51 (80.9%) | 2.82 |
| Total Families | 63 (100.0%) | 2.65 |
Median Household Size in Coral
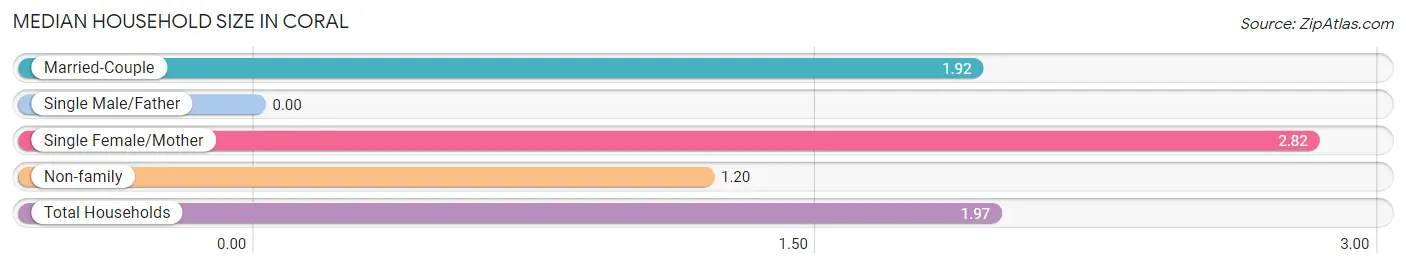
| Household Type | # Households | Household Size |
| Married-Couple | 12 (10.1%) | 1.92 |
| Single Male/Father | 0 (0.0%) | - |
| Single Female/Mother | 51 (42.9%) | 2.82 |
| Non-family | 56 (47.1%) | 1.20 |
| Total Households | 119 (100.0%) | 1.97 |
Household Size by Marriage Status in Coral
Out of a total of 119 households in Coral, 63 (52.9%) are family households, while 56 (47.1%) are nonfamily households. The most numerous type of family households are 3-person households, comprising 51, and the most common type of nonfamily households are 1-person households, comprising 46.
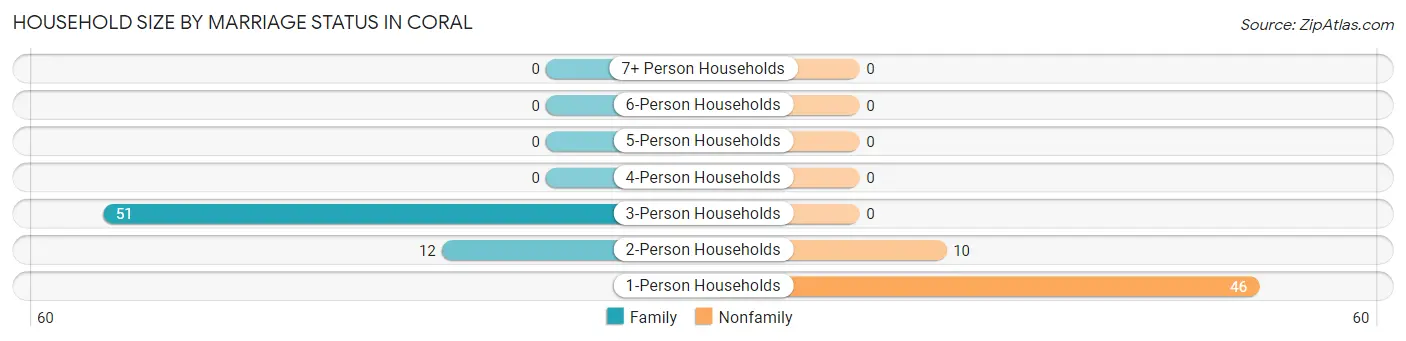
| Household Size | Family Households | Nonfamily Households |
| 1-Person Households | - | 46 (38.7%) |
| 2-Person Households | 12 (10.1%) | 10 (8.4%) |
| 3-Person Households | 51 (42.9%) | 0 (0.0%) |
| 4-Person Households | 0 (0.0%) | 0 (0.0%) |
| 5-Person Households | 0 (0.0%) | 0 (0.0%) |
| 6-Person Households | 0 (0.0%) | 0 (0.0%) |
| 7+ Person Households | 0 (0.0%) | 0 (0.0%) |
| Total | 63 (52.9%) | 56 (47.1%) |
Female Fertility in Coral
Fertility by Age in Coral
| Age Bracket | Women with Births | Births / 1,000 Women |
| 15 to 19 years | 0 (0.0%) | 0.0 |
| 20 to 34 years | 0 (0.0%) | 0.0 |
| 35 to 50 years | 0 (0.0%) | 0.0 |
| Total | 0 (0.0%) | 0.0 |
Fertility by Age by Marriage Status in Coral
| Age Bracket | Married | Unmarried |
| 15 to 19 years | 0 (0.0%) | 0 (0.0%) |
| 20 to 34 years | 0 (0.0%) | 0 (0.0%) |
| 35 to 50 years | 0 (0.0%) | 0 (0.0%) |
| Total | 0 (0.0%) | 0 (0.0%) |
Fertility by Education in Coral
| Educational Attainment | Women with Births | Births / 1,000 Women |
| Less than High School | 0 (0.0%) | 0.0 |
| High School Diploma | 0 (0.0%) | 0.0 |
| College or Associate's Degree | 0 (0.0%) | 0.0 |
| Bachelor's Degree | 0 (0.0%) | 0.0 |
| Graduate Degree | 0 (0.0%) | 0.0 |
| Total | 0 (0.0%) | 0.0 |
Fertility by Education by Marriage Status in Coral
| Educational Attainment | Married | Unmarried |
| Less than High School | 0 (0.0%) | 0 (0.0%) |
| High School Diploma | 0 (0.0%) | 0 (0.0%) |
| College or Associate's Degree | 0 (0.0%) | 0 (0.0%) |
| Bachelor's Degree | 0 (0.0%) | 0 (0.0%) |
| Graduate Degree | 0 (0.0%) | 0 (0.0%) |
| Total | 0 (0.0%) | 0 (0.0%) |
Employment Characteristics in Coral
Employment by Class of Employer in Coral
Among the 159 employed individuals in Coral, private company employees (87 | 54.7%), state government employees (51 | 32.1%), and federal government employees (11 | 6.9%) make up the most common classes of employment.
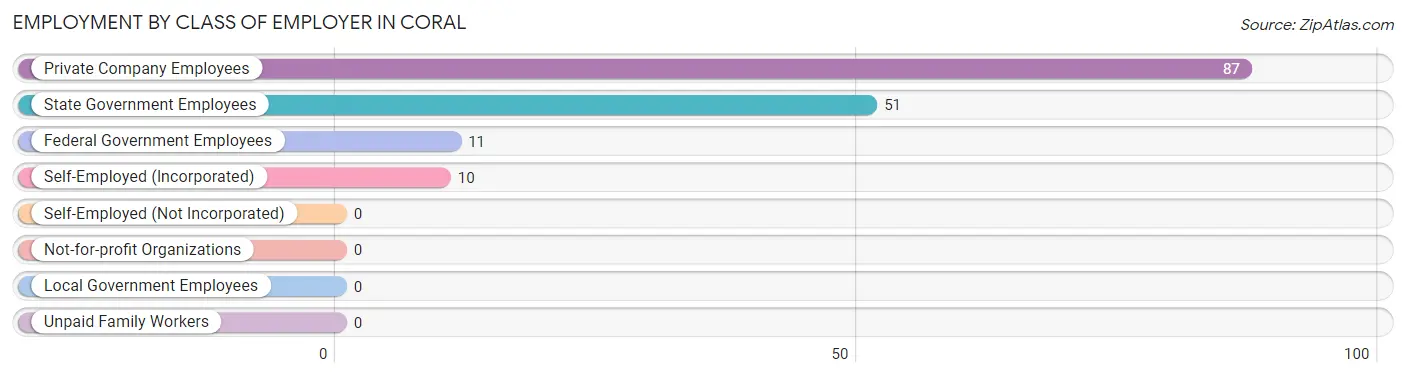
| Employer Class | # Employees | % Employees |
| Private Company Employees | 87 | 54.7% |
| Self-Employed (Incorporated) | 10 | 6.3% |
| Self-Employed (Not Incorporated) | 0 | 0.0% |
| Not-for-profit Organizations | 0 | 0.0% |
| Local Government Employees | 0 | 0.0% |
| State Government Employees | 51 | 32.1% |
| Federal Government Employees | 11 | 6.9% |
| Unpaid Family Workers | 0 | 0.0% |
| Total | 159 | 100.0% |
Employment Status by Age in Coral
According to the labor force statistics for Coral, out of the total population over 16 years of age (234), 72.2% or 169 individuals are in the labor force, with 5.9% or 10 of them unemployed. The age group with the highest labor force participation rate is 20 to 24 years, with 100.0% or 73 individuals in the labor force. Within the labor force, the 55 to 59 years age range has the highest percentage of unemployed individuals, with 16.4% or 10 of them being unemployed.
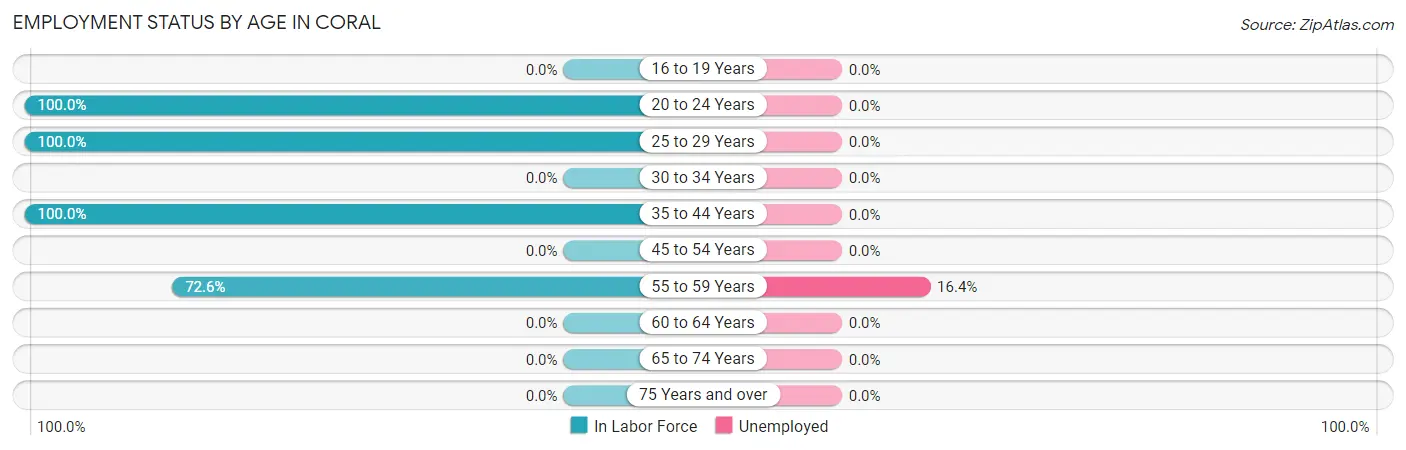
| Age Bracket | In Labor Force | Unemployed |
| 16 to 19 Years | 0 (0.0%) | 0 (0.0%) |
| 20 to 24 Years | 73 (100.0%) | 0 (0.0%) |
| 25 to 29 Years | 21 (100.0%) | 0 (0.0%) |
| 30 to 34 Years | 0 (0.0%) | 0 (0.0%) |
| 35 to 44 Years | 14 (100.0%) | 0 (0.0%) |
| 45 to 54 Years | 0 (0.0%) | 0 (0.0%) |
| 55 to 59 Years | 61 (72.6%) | 10 (16.4%) |
| 60 to 64 Years | 0 (0.0%) | 0 (0.0%) |
| 65 to 74 Years | 0 (0.0%) | 0 (0.0%) |
| 75 Years and over | 0 (0.0%) | 0 (0.0%) |
| Total | 169 (72.2%) | 10 (5.9%) |
Employment Status by Educational Attainment in Coral
According to labor force statistics for Coral, 77.4% of individuals (96) out of the total population between 25 and 64 years of age (124) are in the labor force, with 10.4% or 10 of them being unemployed. The group with the highest labor force participation rate are those with the educational attainment of college / associate degree, with 78.9% or 45 individuals in the labor force. Within the labor force, individuals with college / associate degree education have the highest percentage of unemployment, with 22.2% or 10 of them being unemployed.
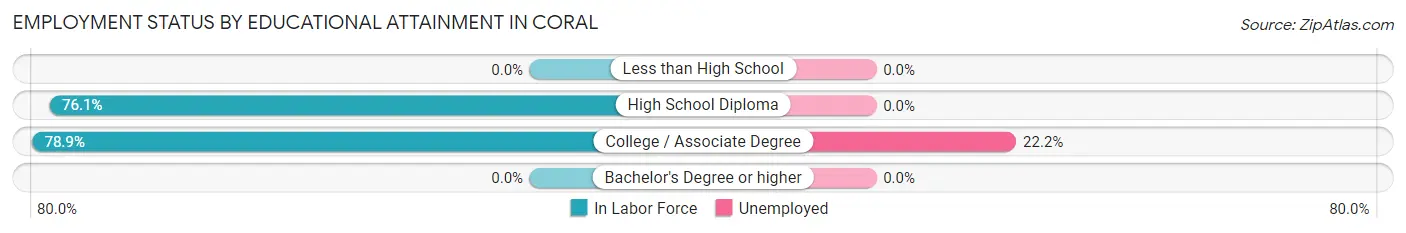
| Educational Attainment | In Labor Force | Unemployed |
| Less than High School | 0 (0.0%) | 0 (0.0%) |
| High School Diploma | 51 (76.1%) | 0 (0.0%) |
| College / Associate Degree | 45 (78.9%) | 13 (22.2%) |
| Bachelor's Degree or higher | 0 (0.0%) | 0 (0.0%) |
| Total | 96 (77.4%) | 13 (10.4%) |
Employment Occupations by Sex in Coral
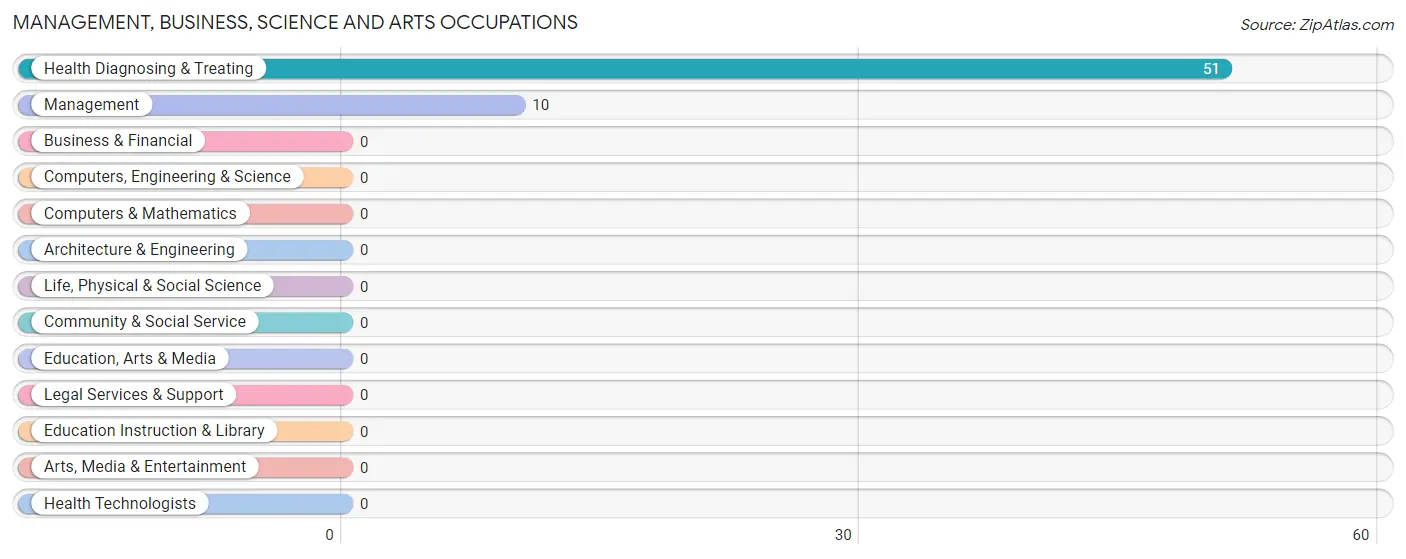
Management, Business, Science and Arts Occupations
The most common Management, Business, Science and Arts occupations in Coral are Health Diagnosing & Treating (51 | 32.1%), and Management (10 | 6.3%).
Management, Business, Science and Arts Occupations by Sex
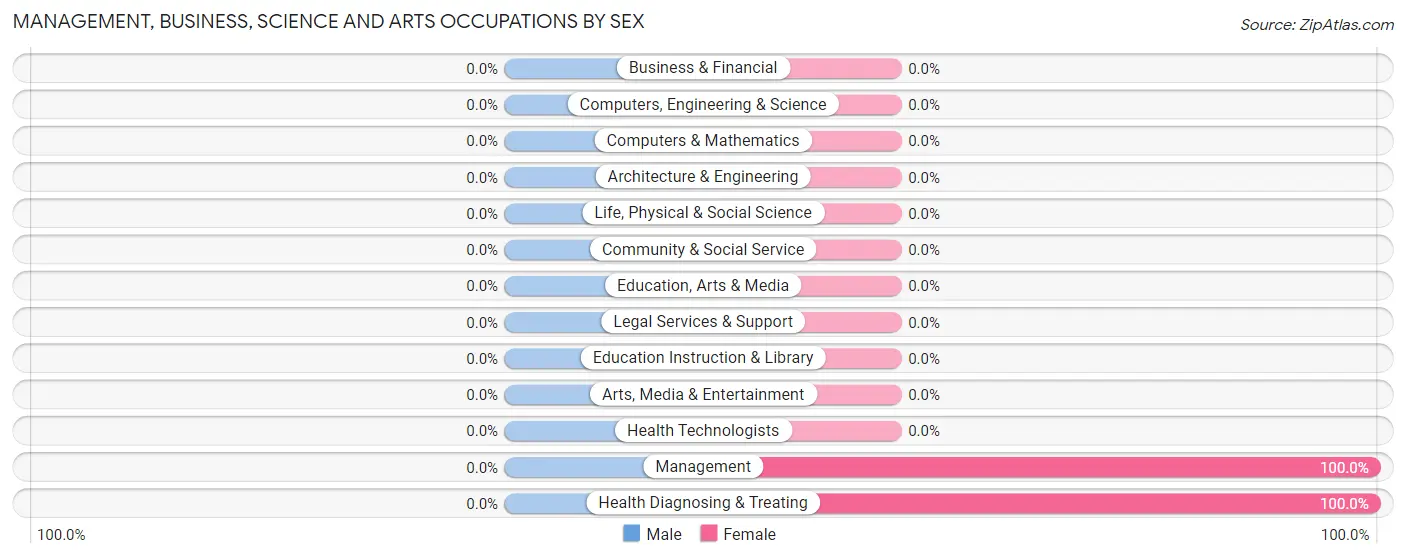
| Occupation | Male | Female |
| Management | 0 (0.0%) | 10 (100.0%) |
| Business & Financial | 0 (0.0%) | 0 (0.0%) |
| Computers, Engineering & Science | 0 (0.0%) | 0 (0.0%) |
| Computers & Mathematics | 0 (0.0%) | 0 (0.0%) |
| Architecture & Engineering | 0 (0.0%) | 0 (0.0%) |
| Life, Physical & Social Science | 0 (0.0%) | 0 (0.0%) |
| Community & Social Service | 0 (0.0%) | 0 (0.0%) |
| Education, Arts & Media | 0 (0.0%) | 0 (0.0%) |
| Legal Services & Support | 0 (0.0%) | 0 (0.0%) |
| Education Instruction & Library | 0 (0.0%) | 0 (0.0%) |
| Arts, Media & Entertainment | 0 (0.0%) | 0 (0.0%) |
| Health Diagnosing & Treating | 0 (0.0%) | 51 (100.0%) |
| Health Technologists | 0 (0.0%) | 0 (0.0%) |
| Total (Category) | 0 (0.0%) | 61 (100.0%) |
| Total (Overall) | 98 (61.6%) | 61 (38.4%) |
Services Occupations
Services Occupations by Sex
| Occupation | Male | Female |
| Healthcare Support | 0 (0.0%) | 0 (0.0%) |
| Security & Protection | 0 (0.0%) | 0 (0.0%) |
| Firefighting & Prevention | 0 (0.0%) | 0 (0.0%) |
| Law Enforcement | 0 (0.0%) | 0 (0.0%) |
| Food Preparation & Serving | 0 (0.0%) | 0 (0.0%) |
| Cleaning & Maintenance | 0 (0.0%) | 0 (0.0%) |
| Personal Care & Service | 0 (0.0%) | 0 (0.0%) |
| Total (Category) | 0 (0.0%) | 0 (0.0%) |
| Total (Overall) | 98 (61.6%) | 61 (38.4%) |
Sales and Office Occupations
The most common Sales and Office occupations in Coral are , and Office & Administration (73 | 45.9%).
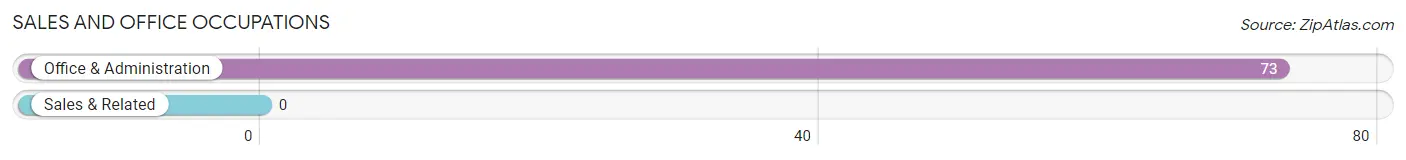
Sales and Office Occupations by Sex
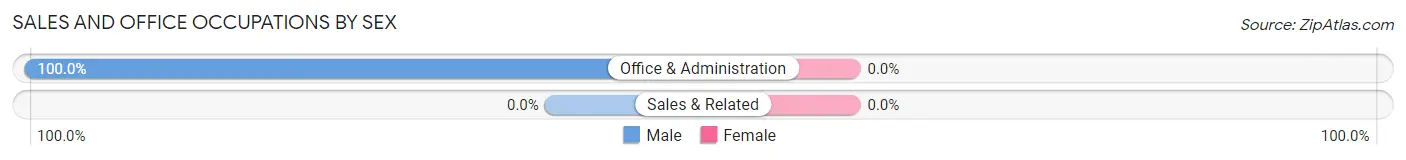
| Occupation | Male | Female |
| Sales & Related | 0 (0.0%) | 0 (0.0%) |
| Office & Administration | 73 (100.0%) | 0 (0.0%) |
| Total (Category) | 73 (100.0%) | 0 (0.0%) |
| Total (Overall) | 98 (61.6%) | 61 (38.4%) |
Natural Resources, Construction and Maintenance Occupations
The most common Natural Resources, Construction and Maintenance occupations in Coral are , and Construction & Extraction (11 | 6.9%).
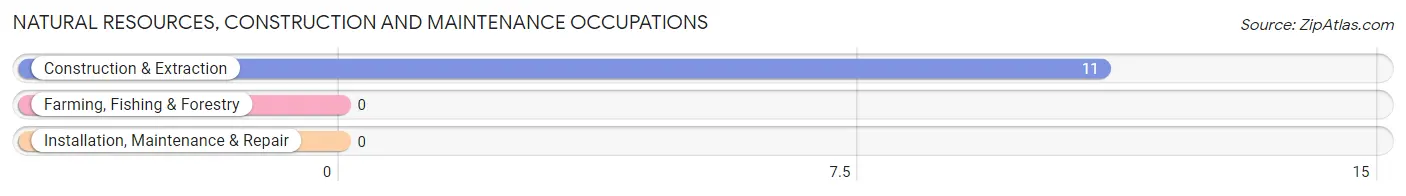
Natural Resources, Construction and Maintenance Occupations by Sex
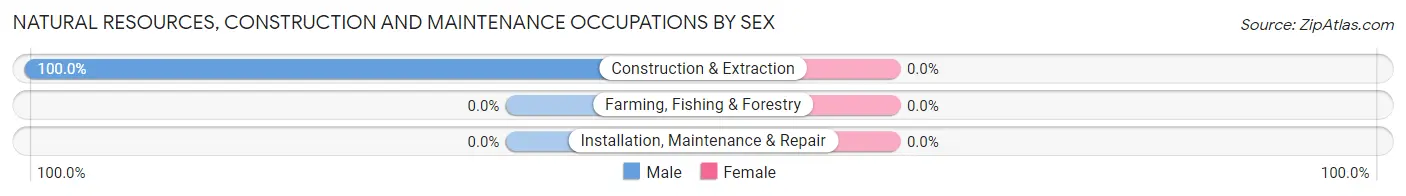
| Occupation | Male | Female |
| Farming, Fishing & Forestry | 0 (0.0%) | 0 (0.0%) |
| Construction & Extraction | 11 (100.0%) | 0 (0.0%) |
| Installation, Maintenance & Repair | 0 (0.0%) | 0 (0.0%) |
| Total (Category) | 11 (100.0%) | 0 (0.0%) |
| Total (Overall) | 98 (61.6%) | 61 (38.4%) |
Production, Transportation and Moving Occupations
The most common Production, Transportation and Moving occupations in Coral are , and Production (14 | 8.8%).
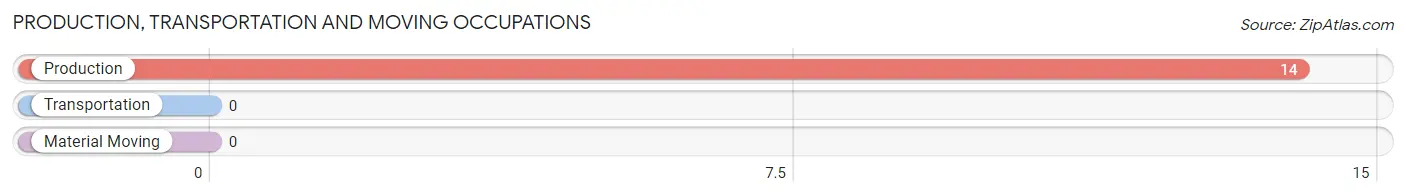
Production, Transportation and Moving Occupations by Sex
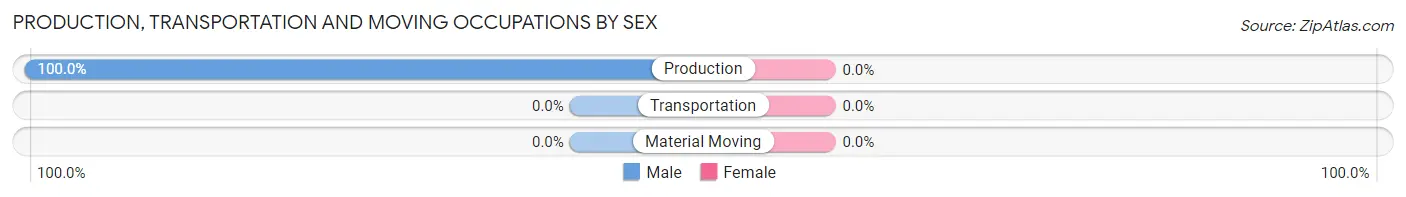
| Occupation | Male | Female |
| Production | 14 (100.0%) | 0 (0.0%) |
| Transportation | 0 (0.0%) | 0 (0.0%) |
| Material Moving | 0 (0.0%) | 0 (0.0%) |
| Total (Category) | 14 (100.0%) | 0 (0.0%) |
| Total (Overall) | 98 (61.6%) | 61 (38.4%) |
Employment Industries by Sex in Coral
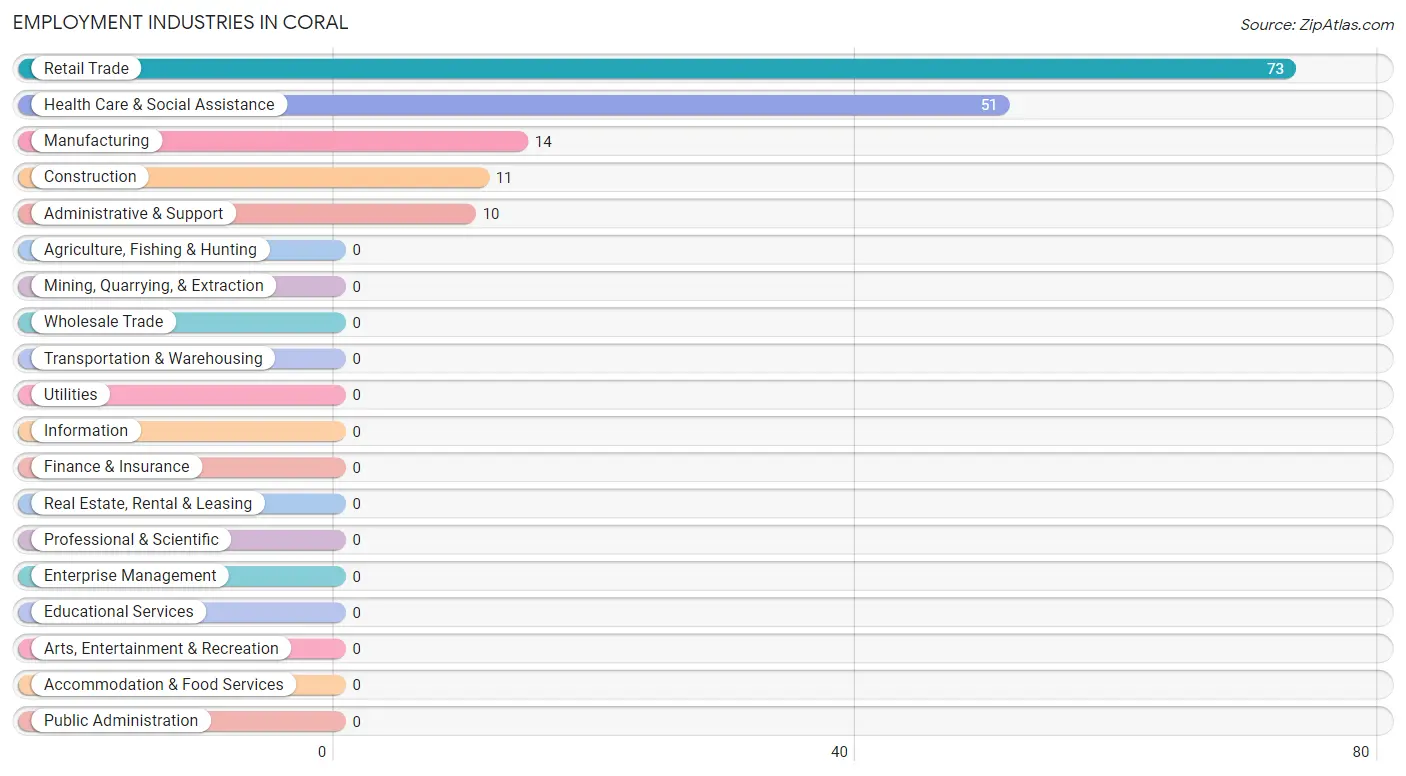
Employment Industries in Coral
The major employment industries in Coral include Retail Trade (73 | 45.9%), Health Care & Social Assistance (51 | 32.1%), Manufacturing (14 | 8.8%), Construction (11 | 6.9%), and Administrative & Support (10 | 6.3%).
Employment Industries by Sex in Coral
The Coral industries that see more men than women are Construction (100.0%), Manufacturing (100.0%), and Retail Trade (100.0%), whereas the industries that tend to have a higher number of women are Administrative & Support (100.0%), and Health Care & Social Assistance (100.0%).
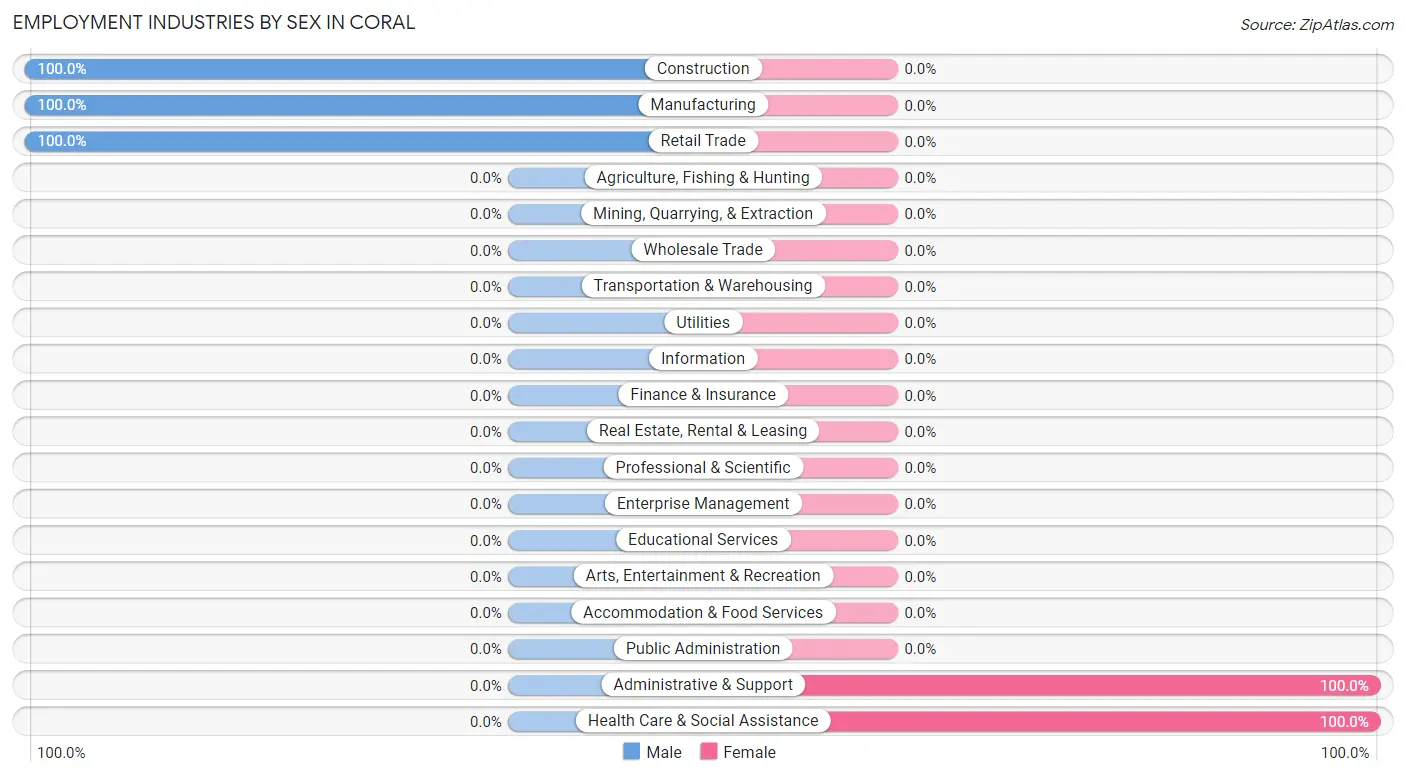
| Industry | Male | Female |
| Agriculture, Fishing & Hunting | 0 (0.0%) | 0 (0.0%) |
| Mining, Quarrying, & Extraction | 0 (0.0%) | 0 (0.0%) |
| Construction | 11 (100.0%) | 0 (0.0%) |
| Manufacturing | 14 (100.0%) | 0 (0.0%) |
| Wholesale Trade | 0 (0.0%) | 0 (0.0%) |
| Retail Trade | 73 (100.0%) | 0 (0.0%) |
| Transportation & Warehousing | 0 (0.0%) | 0 (0.0%) |
| Utilities | 0 (0.0%) | 0 (0.0%) |
| Information | 0 (0.0%) | 0 (0.0%) |
| Finance & Insurance | 0 (0.0%) | 0 (0.0%) |
| Real Estate, Rental & Leasing | 0 (0.0%) | 0 (0.0%) |
| Professional & Scientific | 0 (0.0%) | 0 (0.0%) |
| Enterprise Management | 0 (0.0%) | 0 (0.0%) |
| Administrative & Support | 0 (0.0%) | 10 (100.0%) |
| Educational Services | 0 (0.0%) | 0 (0.0%) |
| Health Care & Social Assistance | 0 (0.0%) | 51 (100.0%) |
| Arts, Entertainment & Recreation | 0 (0.0%) | 0 (0.0%) |
| Accommodation & Food Services | 0 (0.0%) | 0 (0.0%) |
| Public Administration | 0 (0.0%) | 0 (0.0%) |
| Total | 98 (61.6%) | 61 (38.4%) |
Education in Coral
School Enrollment in Coral
| School Level | # Students | % Students |
| Nursery / Preschool | 0 | 0.0% |
| Kindergarten | 0 | 0.0% |
| Elementary School | 0 | 0.0% |
| Middle School | 0 | 0.0% |
| High School | 0 | 0.0% |
| College / Undergraduate | 0 | 0.0% |
| Graduate / Professional | 0 | 0.0% |
| Total | 0 | 0.0% |
School Enrollment by Age by Funding Source in Coral
| Age Bracket | Public School | Private School |
| 3 to 4 Year Olds | 0 (0.0%) | 0 (0.0%) |
| 5 to 9 Year Old | 0 (0.0%) | 0 (0.0%) |
| 10 to 14 Year Olds | 0 (0.0%) | 0 (0.0%) |
| 15 to 17 Year Olds | 0 (0.0%) | 0 (0.0%) |
| 18 to 19 Year Olds | 0 (0.0%) | 0 (0.0%) |
| 20 to 24 Year Olds | 0 (0.0%) | 0 (0.0%) |
| 25 to 34 Year Olds | 0 (0.0%) | 0 (0.0%) |
| 35 Years and over | 0 (0.0%) | 0 (0.0%) |
| Total | 0 (0.0%) | 0 (0.0%) |
Educational Attainment by Field of Study in Coral
| Field of Study | # Graduates | % Graduates |
| Computers & Mathematics | 0 | 0.0% |
| Bio, Nature & Agricultural | 0 | 0.0% |
| Physical & Health Sciences | 0 | 0.0% |
| Psychology | 0 | 0.0% |
| Social Sciences | 0 | 0.0% |
| Engineering | 0 | 0.0% |
| Multidisciplinary Studies | 0 | 0.0% |
| Science & Technology | 0 | 0.0% |
| Business | 0 | 0.0% |
| Education | 0 | 0.0% |
| Literature & Languages | 0 | 0.0% |
| Liberal Arts & History | 0 | 0.0% |
| Visual & Performing Arts | 0 | 0.0% |
| Communications | 0 | 0.0% |
| Arts & Humanities | 0 | 0.0% |
| Total | 0 | 0.0% |
Transportation & Commute in Coral
Vehicle Availability by Sex in Coral
The most prevalent vehicle ownership categories in Coral are males with 2 vehicles (73, accounting for 74.5%) and females with 2 vehicles (51, making up 119.7%).
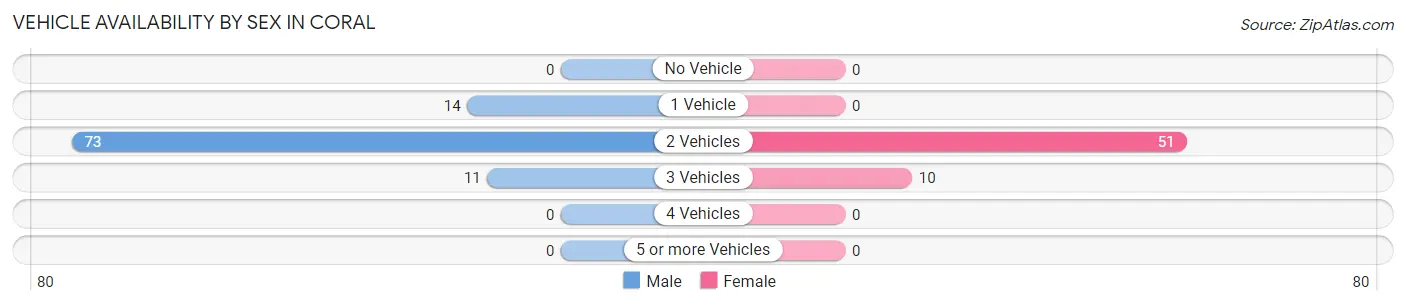
| Vehicles Available | Male | Female |
| No Vehicle | 0 (0.0%) | 0 (0.0%) |
| 1 Vehicle | 14 (14.3%) | 0 (0.0%) |
| 2 Vehicles | 73 (74.5%) | 51 (83.6%) |
| 3 Vehicles | 11 (11.2%) | 10 (16.4%) |
| 4 Vehicles | 0 (0.0%) | 0 (0.0%) |
| 5 or more Vehicles | 0 (0.0%) | 0 (0.0%) |
| Total | 98 (100.0%) | 61 (100.0%) |
Commute Time in Coral
The most frequently occuring commute durations in Coral are 25 to 29 minutes (124 commuters, 78.0%), 10 to 14 minutes (14 commuters, 8.8%), and 60 to 89 minutes (11 commuters, 6.9%).
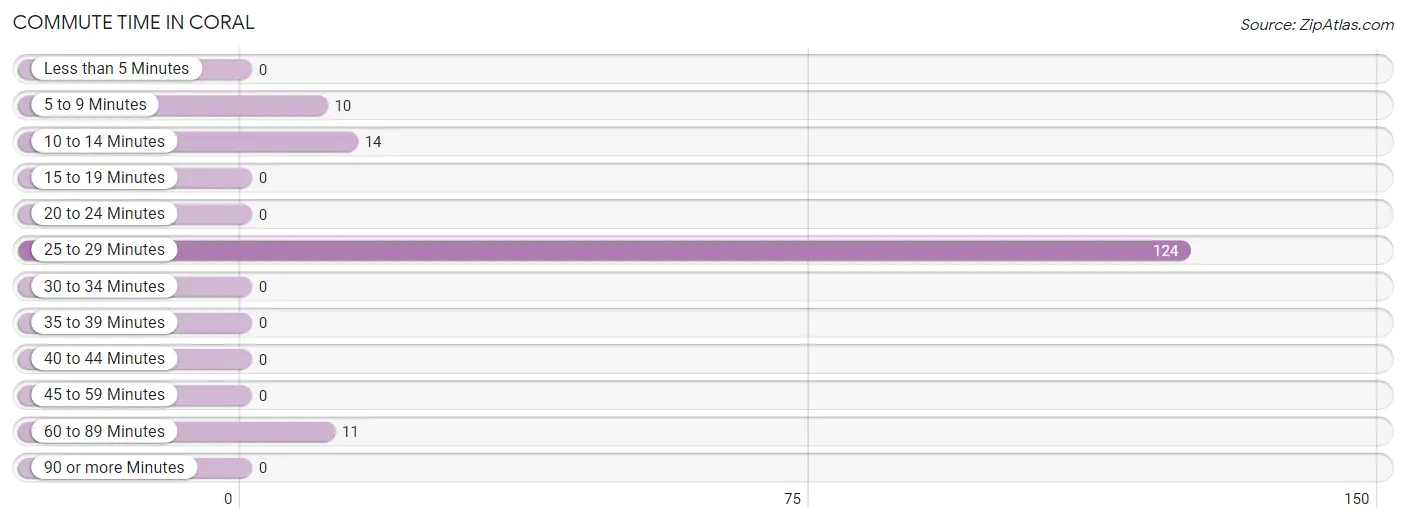
| Commute Time | # Commuters | % Commuters |
| Less than 5 Minutes | 0 | 0.0% |
| 5 to 9 Minutes | 10 | 6.3% |
| 10 to 14 Minutes | 14 | 8.8% |
| 15 to 19 Minutes | 0 | 0.0% |
| 20 to 24 Minutes | 0 | 0.0% |
| 25 to 29 Minutes | 124 | 78.0% |
| 30 to 34 Minutes | 0 | 0.0% |
| 35 to 39 Minutes | 0 | 0.0% |
| 40 to 44 Minutes | 0 | 0.0% |
| 45 to 59 Minutes | 0 | 0.0% |
| 60 to 89 Minutes | 11 | 6.9% |
| 90 or more Minutes | 0 | 0.0% |
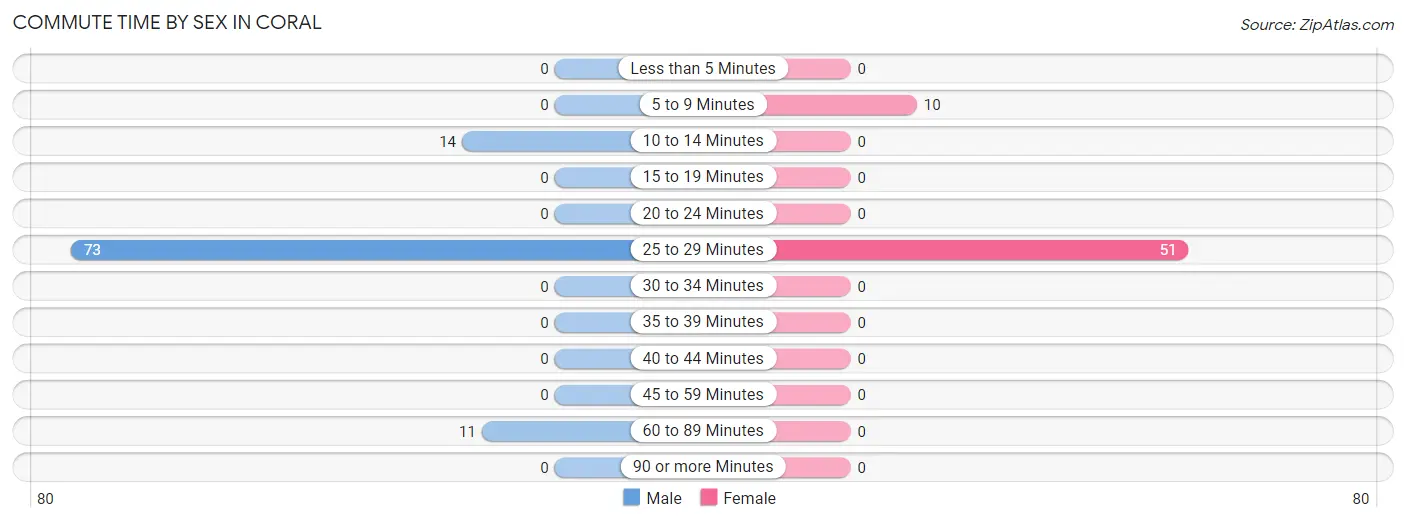
Commute Time by Sex in Coral
The most common commute times in Coral are 25 to 29 minutes (73 commuters, 74.5%) for males and 25 to 29 minutes (51 commuters, 83.6%) for females.
| Commute Time | Male | Female |
| Less than 5 Minutes | 0 (0.0%) | 0 (0.0%) |
| 5 to 9 Minutes | 0 (0.0%) | 10 (16.4%) |
| 10 to 14 Minutes | 14 (14.3%) | 0 (0.0%) |
| 15 to 19 Minutes | 0 (0.0%) | 0 (0.0%) |
| 20 to 24 Minutes | 0 (0.0%) | 0 (0.0%) |
| 25 to 29 Minutes | 73 (74.5%) | 51 (83.6%) |
| 30 to 34 Minutes | 0 (0.0%) | 0 (0.0%) |
| 35 to 39 Minutes | 0 (0.0%) | 0 (0.0%) |
| 40 to 44 Minutes | 0 (0.0%) | 0 (0.0%) |
| 45 to 59 Minutes | 0 (0.0%) | 0 (0.0%) |
| 60 to 89 Minutes | 11 (11.2%) | 0 (0.0%) |
| 90 or more Minutes | 0 (0.0%) | 0 (0.0%) |
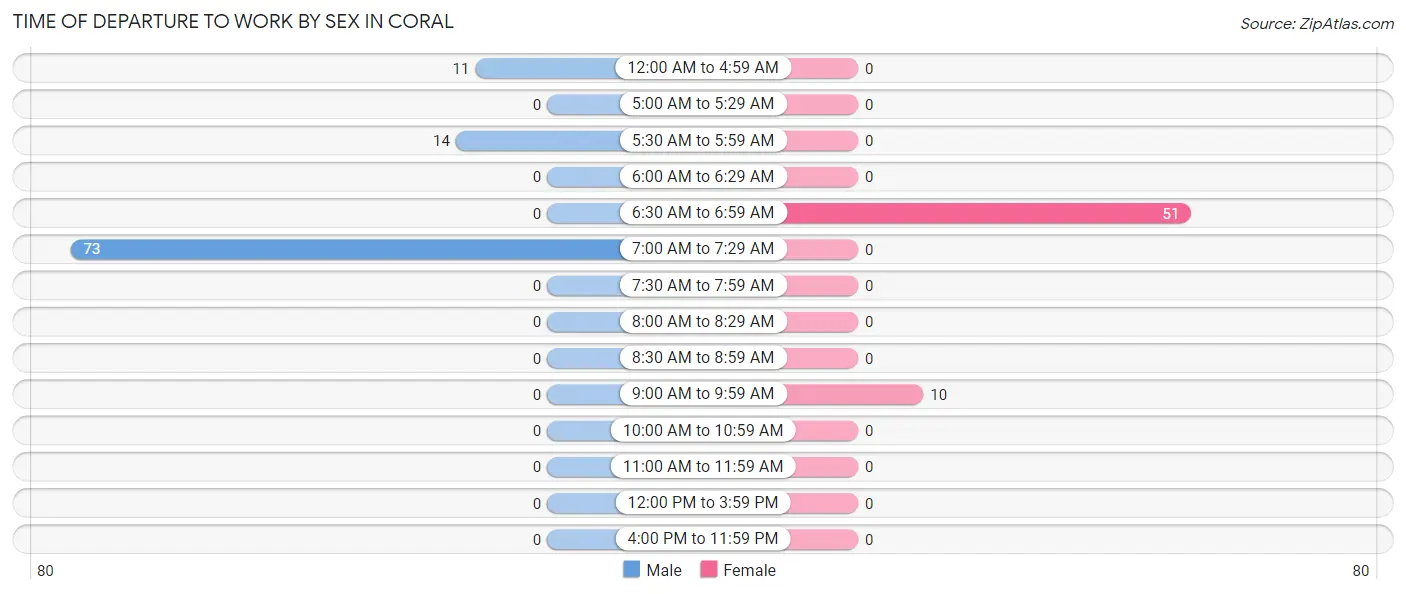
Time of Departure to Work by Sex in Coral
The most frequent times of departure to work in Coral are 7:00 AM to 7:29 AM (73, 74.5%) for males and 6:30 AM to 6:59 AM (51, 83.6%) for females.
| Time of Departure | Male | Female |
| 12:00 AM to 4:59 AM | 11 (11.2%) | 0 (0.0%) |
| 5:00 AM to 5:29 AM | 0 (0.0%) | 0 (0.0%) |
| 5:30 AM to 5:59 AM | 14 (14.3%) | 0 (0.0%) |
| 6:00 AM to 6:29 AM | 0 (0.0%) | 0 (0.0%) |
| 6:30 AM to 6:59 AM | 0 (0.0%) | 51 (83.6%) |
| 7:00 AM to 7:29 AM | 73 (74.5%) | 0 (0.0%) |
| 7:30 AM to 7:59 AM | 0 (0.0%) | 0 (0.0%) |
| 8:00 AM to 8:29 AM | 0 (0.0%) | 0 (0.0%) |
| 8:30 AM to 8:59 AM | 0 (0.0%) | 0 (0.0%) |
| 9:00 AM to 9:59 AM | 0 (0.0%) | 10 (16.4%) |
| 10:00 AM to 10:59 AM | 0 (0.0%) | 0 (0.0%) |
| 11:00 AM to 11:59 AM | 0 (0.0%) | 0 (0.0%) |
| 12:00 PM to 3:59 PM | 0 (0.0%) | 0 (0.0%) |
| 4:00 PM to 11:59 PM | 0 (0.0%) | 0 (0.0%) |
| Total | 98 (100.0%) | 61 (100.0%) |
Housing Occupancy in Coral
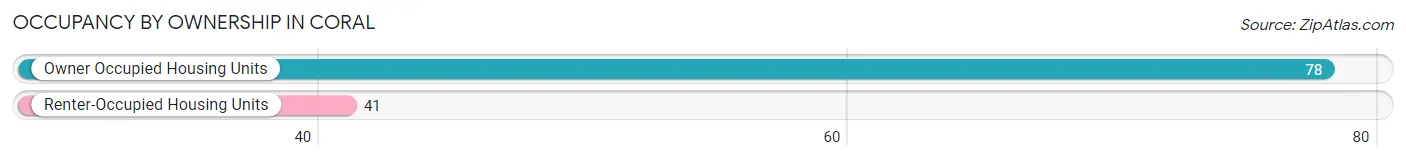
Occupancy by Ownership in Coral
Of the total 119 dwellings in Coral, owner-occupied units account for 78 (65.5%), while renter-occupied units make up 41 (34.4%).
| Occupancy | # Housing Units | % Housing Units |
| Owner Occupied Housing Units | 78 | 65.5% |
| Renter-Occupied Housing Units | 41 | 34.4% |
| Total Occupied Housing Units | 119 | 100.0% |
Occupancy by Household Size in Coral
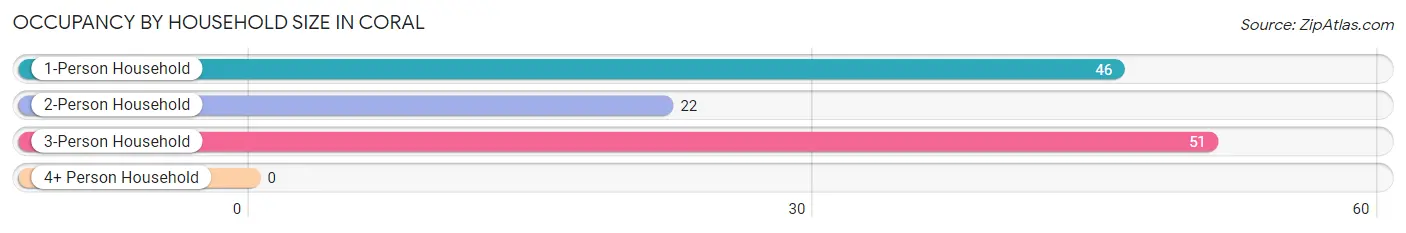
| Household Size | # Housing Units | % Housing Units |
| 1-Person Household | 46 | 38.7% |
| 2-Person Household | 22 | 18.5% |
| 3-Person Household | 51 | 42.9% |
| 4+ Person Household | 0 | 0.0% |
| Total Housing Units | 119 | 100.0% |
Occupancy by Ownership by Household Size in Coral
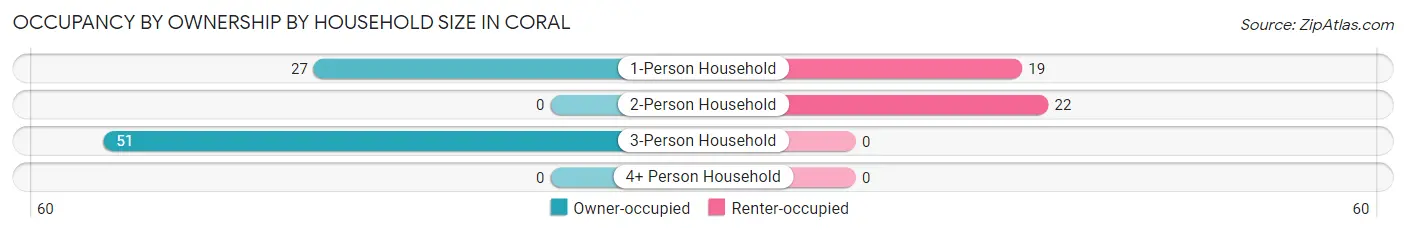
| Household Size | Owner-occupied | Renter-occupied |
| 1-Person Household | 27 (58.7%) | 19 (41.3%) |
| 2-Person Household | 0 (0.0%) | 22 (100.0%) |
| 3-Person Household | 51 (100.0%) | 0 (0.0%) |
| 4+ Person Household | 0 (0.0%) | 0 (0.0%) |
| Total Housing Units | 78 (65.5%) | 41 (34.4%) |
Occupancy by Educational Attainment in Coral
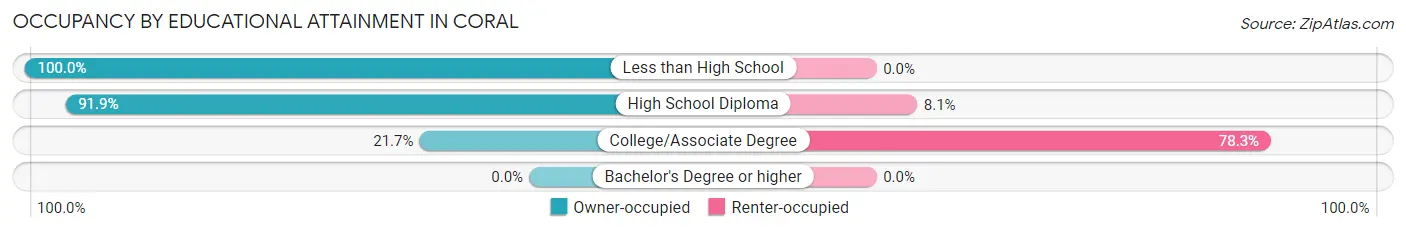
| Household Size | Owner-occupied | Renter-occupied |
| Less than High School | 11 (100.0%) | 0 (0.0%) |
| High School Diploma | 57 (91.9%) | 5 (8.1%) |
| College/Associate Degree | 10 (21.7%) | 36 (78.3%) |
| Bachelor's Degree or higher | 0 (0.0%) | 0 (0.0%) |
Occupancy by Age of Householder in Coral
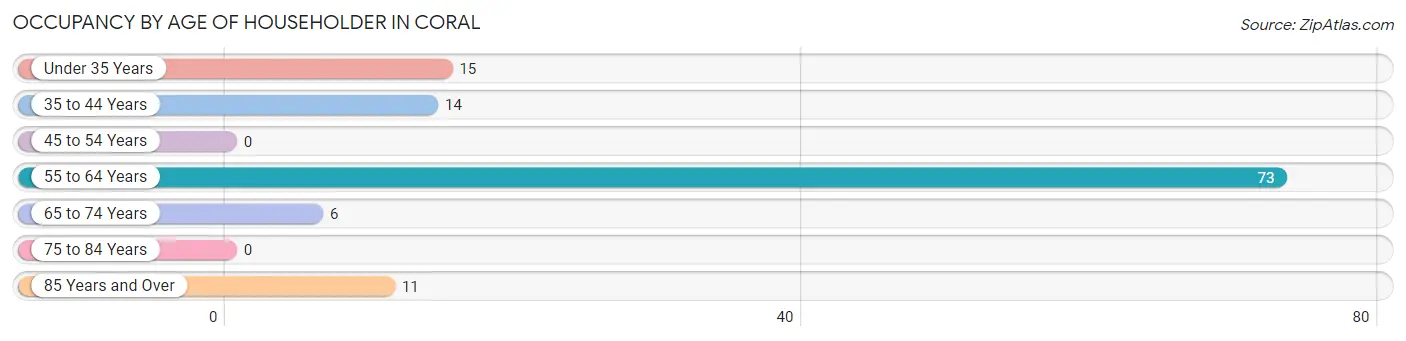
| Age Bracket | # Households | % Households |
| Under 35 Years | 15 | 12.6% |
| 35 to 44 Years | 14 | 11.8% |
| 45 to 54 Years | 0 | 0.0% |
| 55 to 64 Years | 73 | 61.3% |
| 65 to 74 Years | 6 | 5.0% |
| 75 to 84 Years | 0 | 0.0% |
| 85 Years and Over | 11 | 9.2% |
| Total | 119 | 100.0% |
Housing Finances in Coral
Median Income by Occupancy in Coral
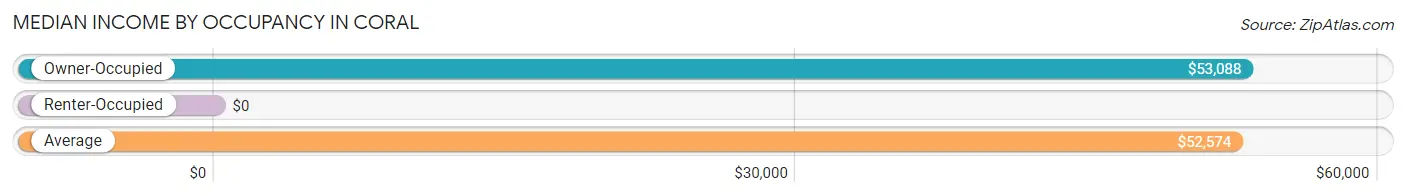
| Occupancy Type | # Households | Median Income |
| Owner-Occupied | 78 (65.5%) | $53,088 |
| Renter-Occupied | 41 (34.4%) | $0 |
| Average | 119 (100.0%) | $52,574 |
Occupancy by Householder Income Bracket in Coral
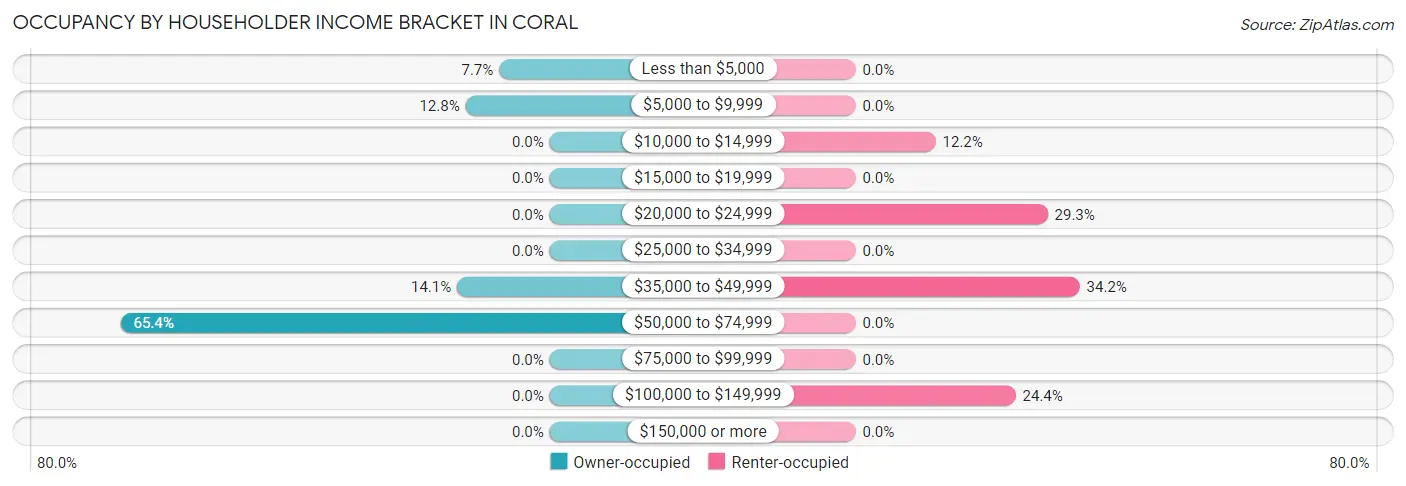
| Income Bracket | Owner-occupied | Renter-occupied |
| Less than $5,000 | 6 (7.7%) | 0 (0.0%) |
| $5,000 to $9,999 | 10 (12.8%) | 0 (0.0%) |
| $10,000 to $14,999 | 0 (0.0%) | 5 (12.2%) |
| $15,000 to $19,999 | 0 (0.0%) | 0 (0.0%) |
| $20,000 to $24,999 | 0 (0.0%) | 12 (29.3%) |
| $25,000 to $34,999 | 0 (0.0%) | 0 (0.0%) |
| $35,000 to $49,999 | 11 (14.1%) | 14 (34.2%) |
| $50,000 to $74,999 | 51 (65.4%) | 0 (0.0%) |
| $75,000 to $99,999 | 0 (0.0%) | 0 (0.0%) |
| $100,000 to $149,999 | 0 (0.0%) | 10 (24.4%) |
| $150,000 or more | 0 (0.0%) | 0 (0.0%) |
| Total | 78 (100.0%) | 41 (100.0%) |
Monthly Housing Cost Tiers in Coral
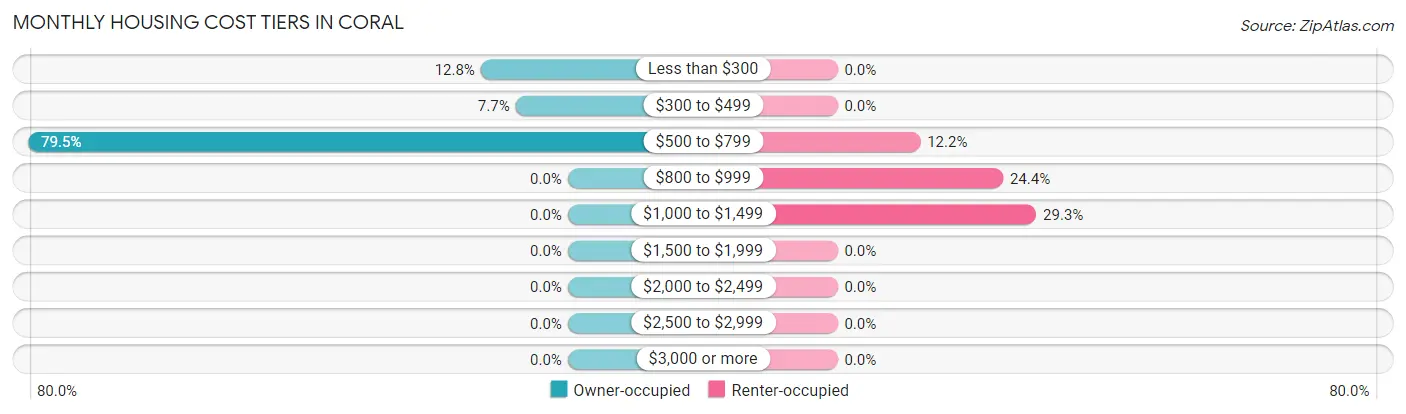
| Monthly Cost | Owner-occupied | Renter-occupied |
| Less than $300 | 10 (12.8%) | 0 (0.0%) |
| $300 to $499 | 6 (7.7%) | 0 (0.0%) |
| $500 to $799 | 62 (79.5%) | 5 (12.2%) |
| $800 to $999 | 0 (0.0%) | 10 (24.4%) |
| $1,000 to $1,499 | 0 (0.0%) | 12 (29.3%) |
| $1,500 to $1,999 | 0 (0.0%) | 0 (0.0%) |
| $2,000 to $2,499 | 0 (0.0%) | 0 (0.0%) |
| $2,500 to $2,999 | 0 (0.0%) | 0 (0.0%) |
| $3,000 or more | 0 (0.0%) | 0 (0.0%) |
| Total | 78 (100.0%) | 41 (100.0%) |
Physical Housing Characteristics in Coral
Housing Structures in Coral
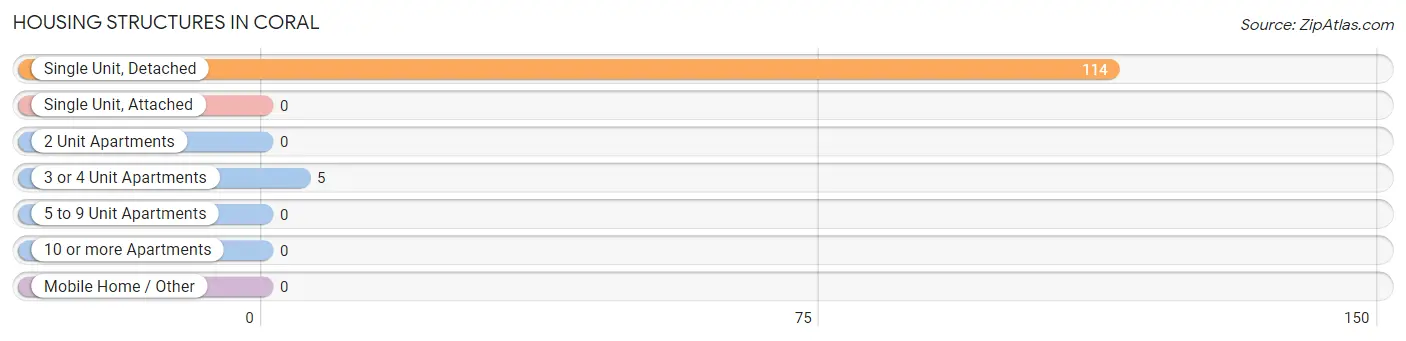
| Structure Type | # Housing Units | % Housing Units |
| Single Unit, Detached | 114 | 95.8% |
| Single Unit, Attached | 0 | 0.0% |
| 2 Unit Apartments | 0 | 0.0% |
| 3 or 4 Unit Apartments | 5 | 4.2% |
| 5 to 9 Unit Apartments | 0 | 0.0% |
| 10 or more Apartments | 0 | 0.0% |
| Mobile Home / Other | 0 | 0.0% |
| Total | 119 | 100.0% |
Housing Structures by Occupancy in Coral
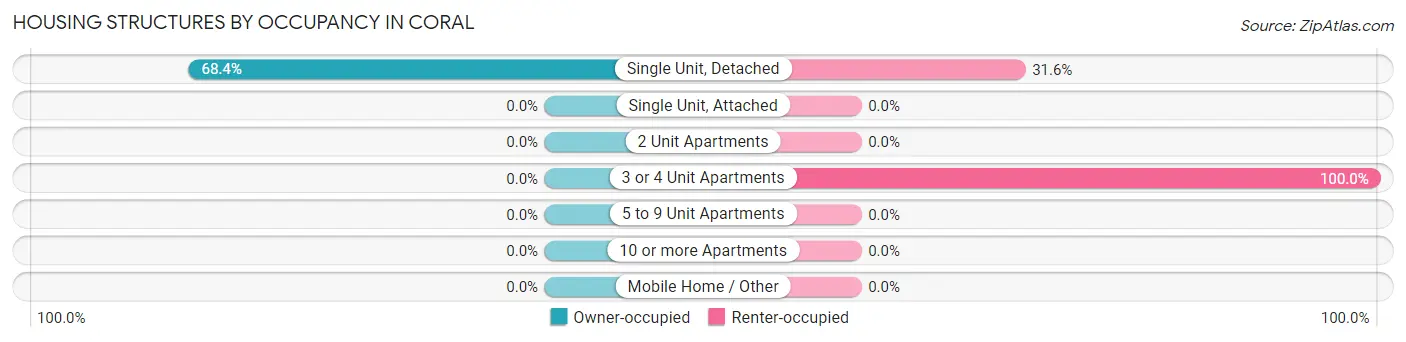
| Structure Type | Owner-occupied | Renter-occupied |
| Single Unit, Detached | 78 (68.4%) | 36 (31.6%) |
| Single Unit, Attached | 0 (0.0%) | 0 (0.0%) |
| 2 Unit Apartments | 0 (0.0%) | 0 (0.0%) |
| 3 or 4 Unit Apartments | 0 (0.0%) | 5 (100.0%) |
| 5 to 9 Unit Apartments | 0 (0.0%) | 0 (0.0%) |
| 10 or more Apartments | 0 (0.0%) | 0 (0.0%) |
| Mobile Home / Other | 0 (0.0%) | 0 (0.0%) |
| Total | 78 (65.5%) | 41 (34.4%) |
Housing Structures by Number of Rooms in Coral
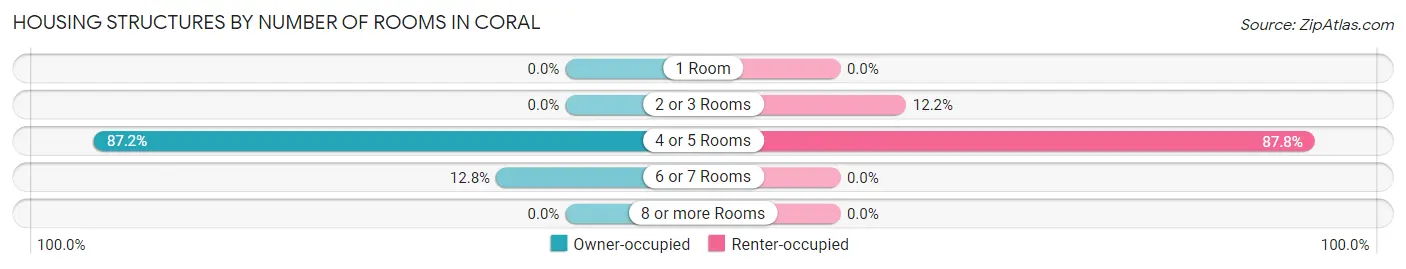
| Number of Rooms | Owner-occupied | Renter-occupied |
| 1 Room | 0 (0.0%) | 0 (0.0%) |
| 2 or 3 Rooms | 0 (0.0%) | 5 (12.2%) |
| 4 or 5 Rooms | 68 (87.2%) | 36 (87.8%) |
| 6 or 7 Rooms | 10 (12.8%) | 0 (0.0%) |
| 8 or more Rooms | 0 (0.0%) | 0 (0.0%) |
| Total | 78 (100.0%) | 41 (100.0%) |
Housing Structure by Heating Type in Coral
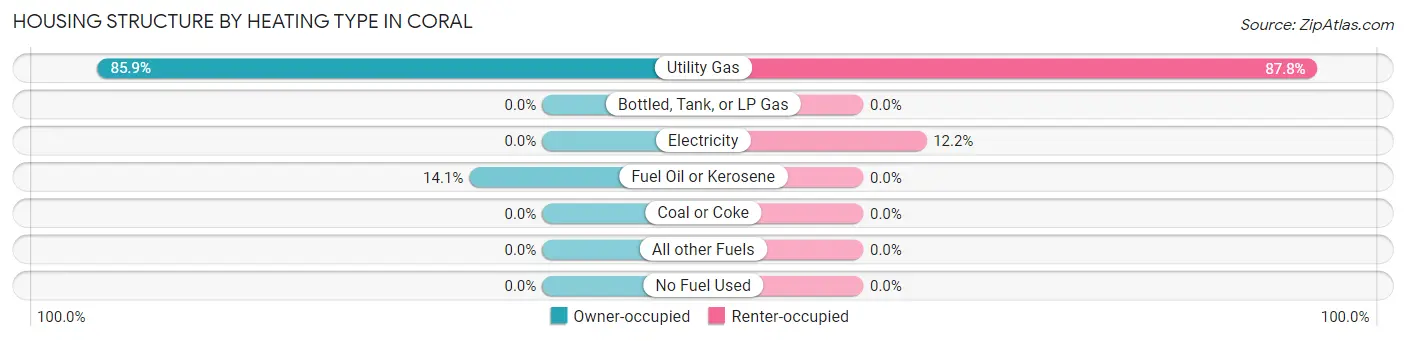
| Heating Type | Owner-occupied | Renter-occupied |
| Utility Gas | 67 (85.9%) | 36 (87.8%) |
| Bottled, Tank, or LP Gas | 0 (0.0%) | 0 (0.0%) |
| Electricity | 0 (0.0%) | 5 (12.2%) |
| Fuel Oil or Kerosene | 11 (14.1%) | 0 (0.0%) |
| Coal or Coke | 0 (0.0%) | 0 (0.0%) |
| All other Fuels | 0 (0.0%) | 0 (0.0%) |
| No Fuel Used | 0 (0.0%) | 0 (0.0%) |
| Total | 78 (100.0%) | 41 (100.0%) |
Household Vehicle Usage in Coral
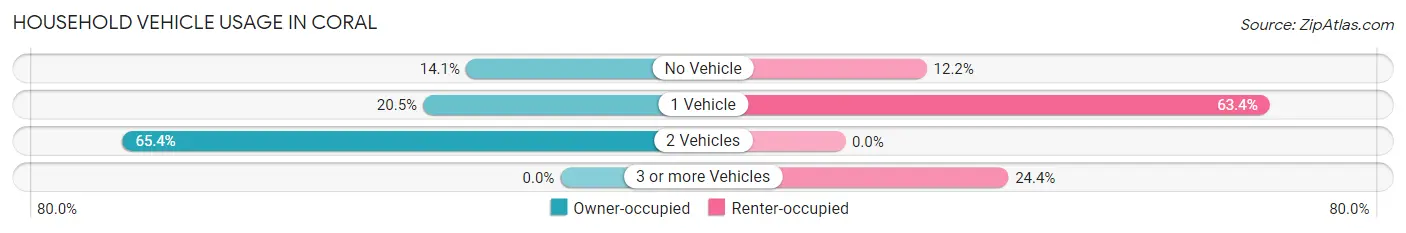
| Vehicles per Household | Owner-occupied | Renter-occupied |
| No Vehicle | 11 (14.1%) | 5 (12.2%) |
| 1 Vehicle | 16 (20.5%) | 26 (63.4%) |
| 2 Vehicles | 51 (65.4%) | 0 (0.0%) |
| 3 or more Vehicles | 0 (0.0%) | 10 (24.4%) |
| Total | 78 (100.0%) | 41 (100.0%) |
Real Estate & Mortgages in Coral
Real Estate and Mortgage Overview in Coral
| Characteristic | Without Mortgage | With Mortgage |
| Housing Units | 78 | 0 |
| Median Property Value | $62,400 | $0 |
| Median Household Income | $53,088 | $0 |
| Monthly Housing Costs | $537 | $0 |
| Real Estate Taxes | $2,333 | $0 |
Property Value by Mortgage Status in Coral
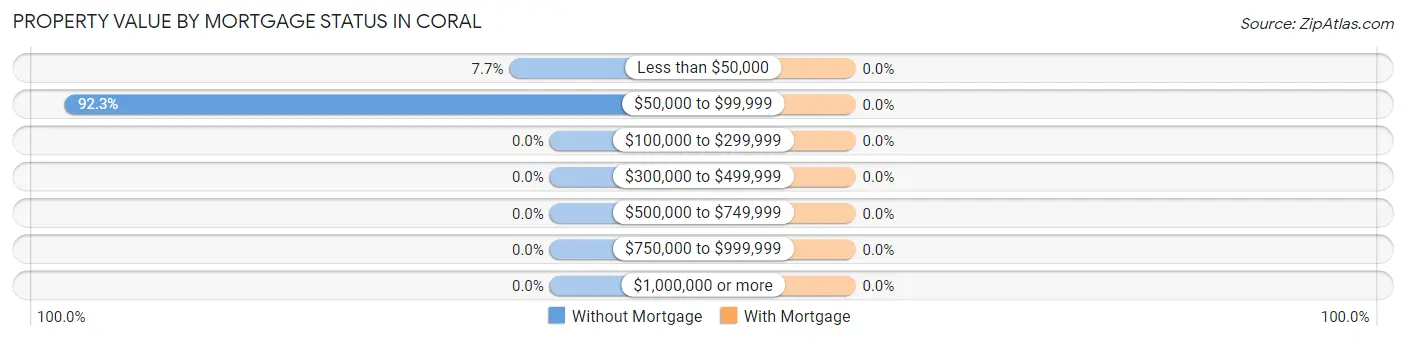
| Property Value | Without Mortgage | With Mortgage |
| Less than $50,000 | 6 (7.7%) | 0 (0.0%) |
| $50,000 to $99,999 | 72 (92.3%) | 0 (0.0%) |
| $100,000 to $299,999 | 0 (0.0%) | 0 (0.0%) |
| $300,000 to $499,999 | 0 (0.0%) | 0 (0.0%) |
| $500,000 to $749,999 | 0 (0.0%) | 0 (0.0%) |
| $750,000 to $999,999 | 0 (0.0%) | 0 (0.0%) |
| $1,000,000 or more | 0 (0.0%) | 0 (0.0%) |
| Total | 78 (100.0%) | 0 (0.0%) |
Household Income by Mortgage Status in Coral
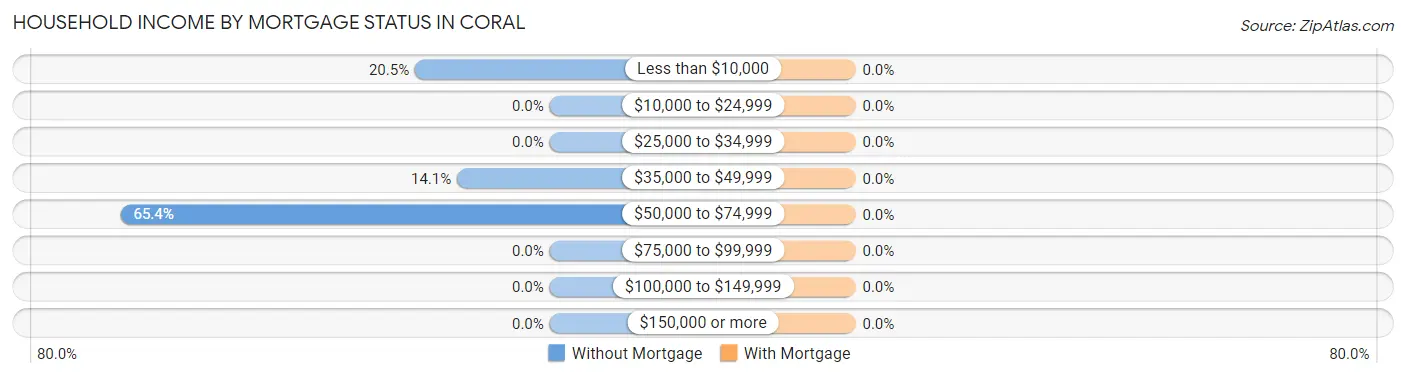
| Household Income | Without Mortgage | With Mortgage |
| Less than $10,000 | 16 (20.5%) | 0 (0.0%) |
| $10,000 to $24,999 | 0 (0.0%) | 0 (0.0%) |
| $25,000 to $34,999 | 0 (0.0%) | 0 (0.0%) |
| $35,000 to $49,999 | 11 (14.1%) | 0 (0.0%) |
| $50,000 to $74,999 | 51 (65.4%) | 0 (0.0%) |
| $75,000 to $99,999 | 0 (0.0%) | 0 (0.0%) |
| $100,000 to $149,999 | 0 (0.0%) | 0 (0.0%) |
| $150,000 or more | 0 (0.0%) | 0 (0.0%) |
| Total | 78 (100.0%) | 0 (0.0%) |
Property Value to Household Income Ratio in Coral
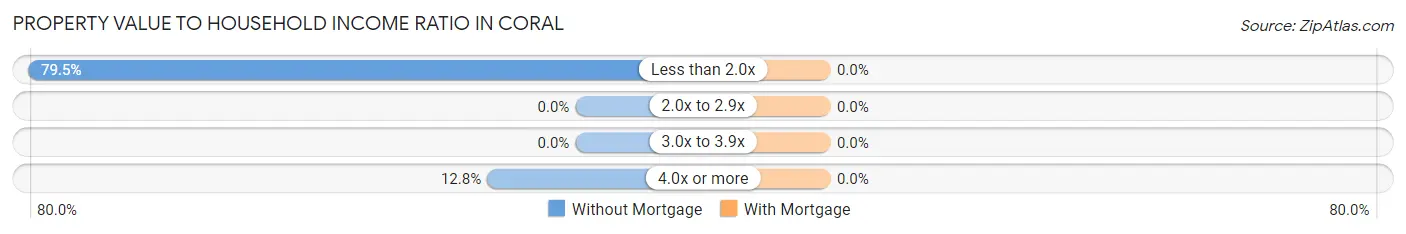
| Value-to-Income Ratio | Without Mortgage | With Mortgage |
| Less than 2.0x | 62 (79.5%) | 0 (0.0%) |
| 2.0x to 2.9x | 0 (0.0%) | 0 (0.0%) |
| 3.0x to 3.9x | 0 (0.0%) | 0 (0.0%) |
| 4.0x or more | 10 (12.8%) | 0 (0.0%) |
| Total | 78 (100.0%) | 0 (0.0%) |
Real Estate Taxes by Mortgage Status in Coral
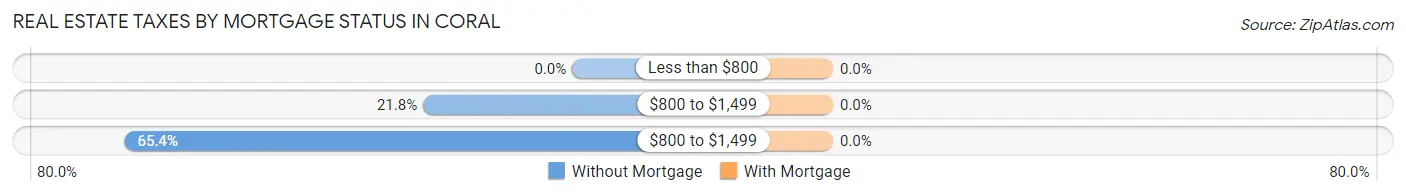
| Property Taxes | Without Mortgage | With Mortgage |
| Less than $800 | 0 (0.0%) | 0 (0.0%) |
| $800 to $1,499 | 17 (21.8%) | 0 (0.0%) |
| $800 to $1,499 | 51 (65.4%) | 0 (0.0%) |
| Total | 78 (100.0%) | 0 (0.0%) |
Health & Disability in Coral
Health Insurance Coverage by Age in Coral
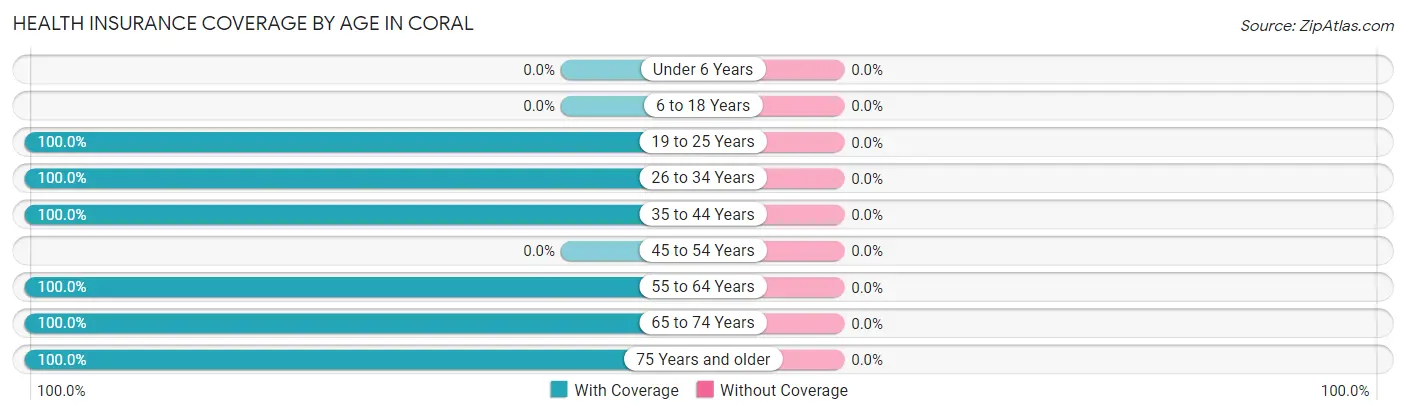
| Age Bracket | With Coverage | Without Coverage |
| Under 6 Years | 0 (0.0%) | 0 (0.0%) |
| 6 to 18 Years | 0 (0.0%) | 0 (0.0%) |
| 19 to 25 Years | 73 (100.0%) | 0 (0.0%) |
| 26 to 34 Years | 26 (100.0%) | 0 (0.0%) |
| 35 to 44 Years | 14 (100.0%) | 0 (0.0%) |
| 45 to 54 Years | 0 (0.0%) | 0 (0.0%) |
| 55 to 64 Years | 84 (100.0%) | 0 (0.0%) |
| 65 to 74 Years | 6 (100.0%) | 0 (0.0%) |
| 75 Years and older | 31 (100.0%) | 0 (0.0%) |
| Total | 234 (100.0%) | 0 (0.0%) |
Health Insurance Coverage by Citizenship Status in Coral
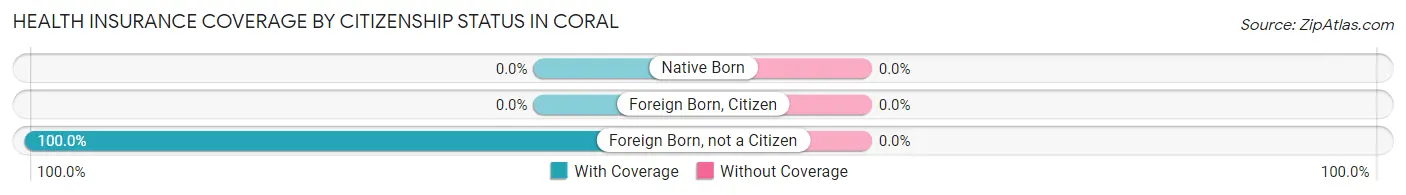
| Citizenship Status | With Coverage | Without Coverage |
| Native Born | 0 (0.0%) | 0 (0.0%) |
| Foreign Born, Citizen | 0 (0.0%) | 0 (0.0%) |
| Foreign Born, not a Citizen | 73 (100.0%) | 0 (0.0%) |
Health Insurance Coverage by Household Income in Coral
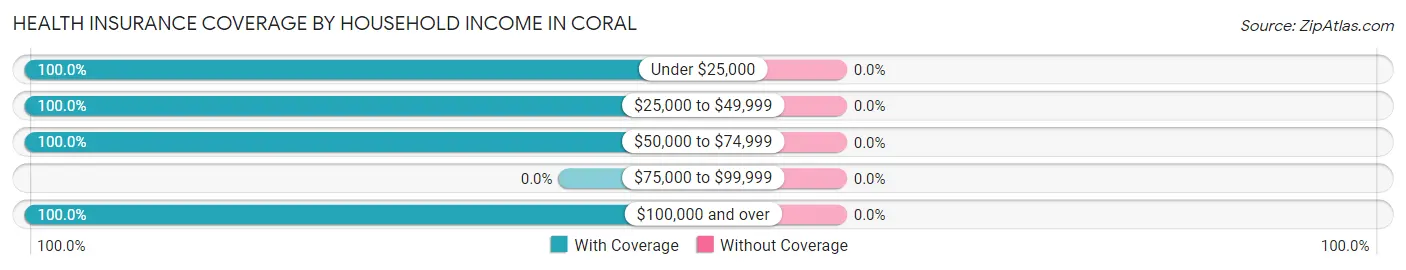
| Household Income | With Coverage | Without Coverage |
| Under $25,000 | 44 (100.0%) | 0 (0.0%) |
| $25,000 to $49,999 | 25 (100.0%) | 0 (0.0%) |
| $50,000 to $74,999 | 144 (100.0%) | 0 (0.0%) |
| $75,000 to $99,999 | 0 (0.0%) | 0 (0.0%) |
| $100,000 and over | 21 (100.0%) | 0 (0.0%) |
Public vs Private Health Insurance Coverage by Age in Coral
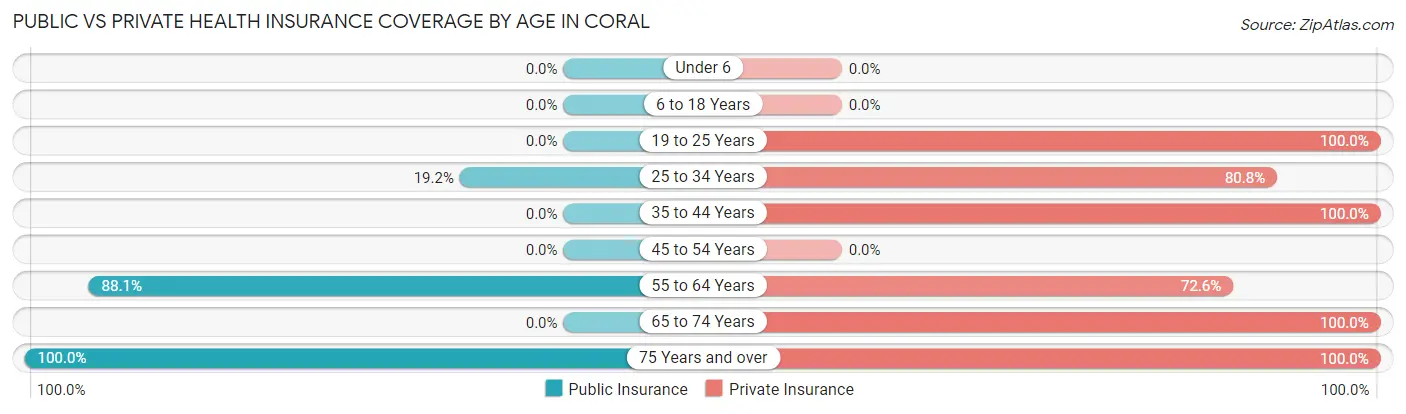
| Age Bracket | Public Insurance | Private Insurance |
| Under 6 | 0 (0.0%) | 0 (0.0%) |
| 6 to 18 Years | 0 (0.0%) | 0 (0.0%) |
| 19 to 25 Years | 0 (0.0%) | 73 (100.0%) |
| 25 to 34 Years | 5 (19.2%) | 21 (80.8%) |
| 35 to 44 Years | 0 (0.0%) | 14 (100.0%) |
| 45 to 54 Years | 0 (0.0%) | 0 (0.0%) |
| 55 to 64 Years | 74 (88.1%) | 61 (72.6%) |
| 65 to 74 Years | 0 (0.0%) | 6 (100.0%) |
| 75 Years and over | 31 (100.0%) | 31 (100.0%) |
| Total | 110 (47.0%) | 206 (88.0%) |
Disability Status by Sex by Age in Coral
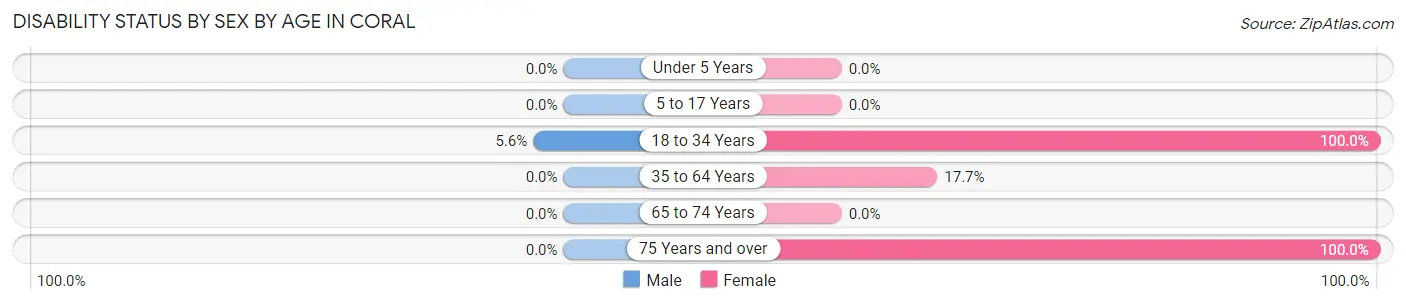
| Age Bracket | Male | Female |
| Under 5 Years | 0 (0.0%) | 0 (0.0%) |
| 5 to 17 Years | 0 (0.0%) | 0 (0.0%) |
| 18 to 34 Years | 5 (5.6%) | 10 (100.0%) |
| 35 to 64 Years | 0 (0.0%) | 11 (17.7%) |
| 65 to 74 Years | 0 (0.0%) | 0 (0.0%) |
| 75 Years and over | 0 (0.0%) | 31 (100.0%) |
Disability Class by Sex by Age in Coral
Disability Class: Hearing Difficulty
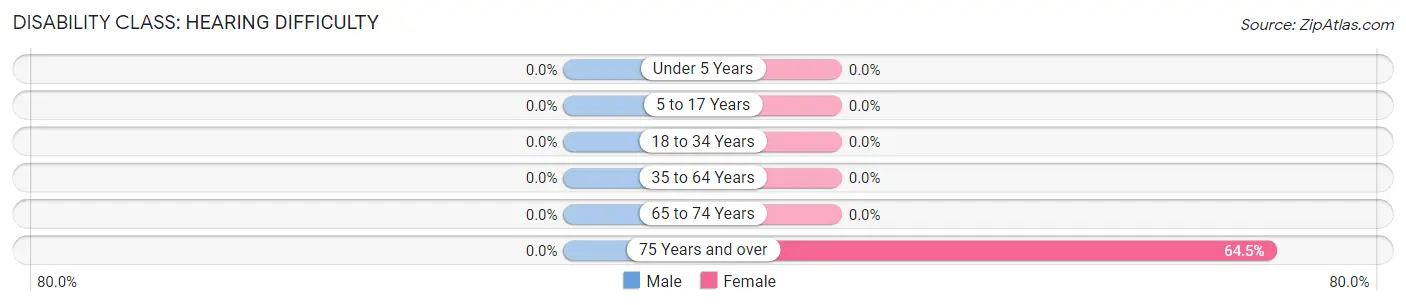
| Age Bracket | Male | Female |
| Under 5 Years | 0 (0.0%) | 0 (0.0%) |
| 5 to 17 Years | 0 (0.0%) | 0 (0.0%) |
| 18 to 34 Years | 0 (0.0%) | 0 (0.0%) |
| 35 to 64 Years | 0 (0.0%) | 0 (0.0%) |
| 65 to 74 Years | 0 (0.0%) | 0 (0.0%) |
| 75 Years and over | 0 (0.0%) | 20 (64.5%) |
Disability Class: Vision Difficulty
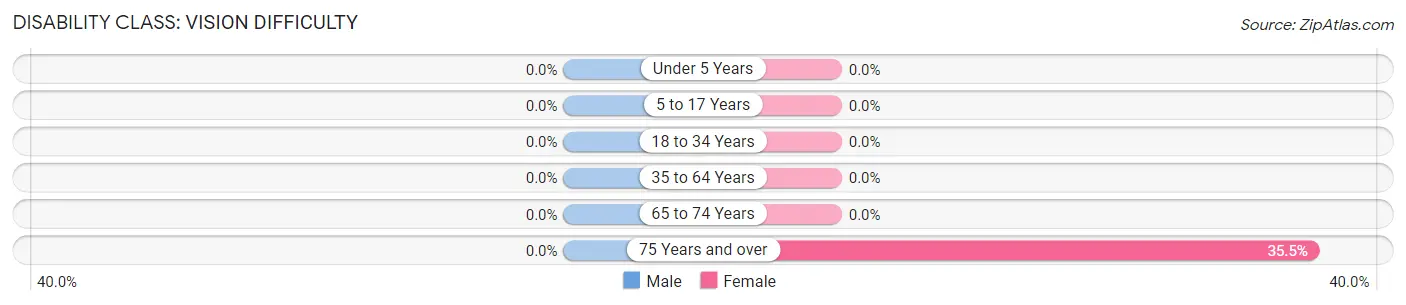
| Age Bracket | Male | Female |
| Under 5 Years | 0 (0.0%) | 0 (0.0%) |
| 5 to 17 Years | 0 (0.0%) | 0 (0.0%) |
| 18 to 34 Years | 0 (0.0%) | 0 (0.0%) |
| 35 to 64 Years | 0 (0.0%) | 0 (0.0%) |
| 65 to 74 Years | 0 (0.0%) | 0 (0.0%) |
| 75 Years and over | 0 (0.0%) | 11 (35.5%) |
Disability Class: Cognitive Difficulty
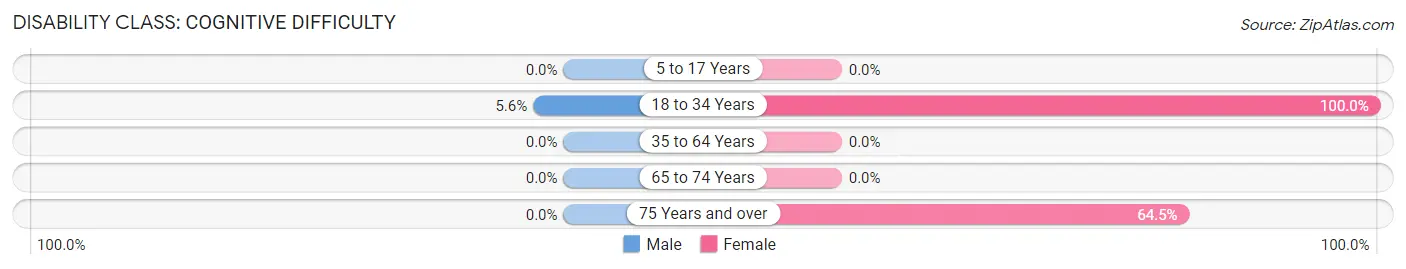
| Age Bracket | Male | Female |
| 5 to 17 Years | 0 (0.0%) | 0 (0.0%) |
| 18 to 34 Years | 5 (5.6%) | 10 (100.0%) |
| 35 to 64 Years | 0 (0.0%) | 0 (0.0%) |
| 65 to 74 Years | 0 (0.0%) | 0 (0.0%) |
| 75 Years and over | 0 (0.0%) | 20 (64.5%) |
Disability Class: Ambulatory Difficulty
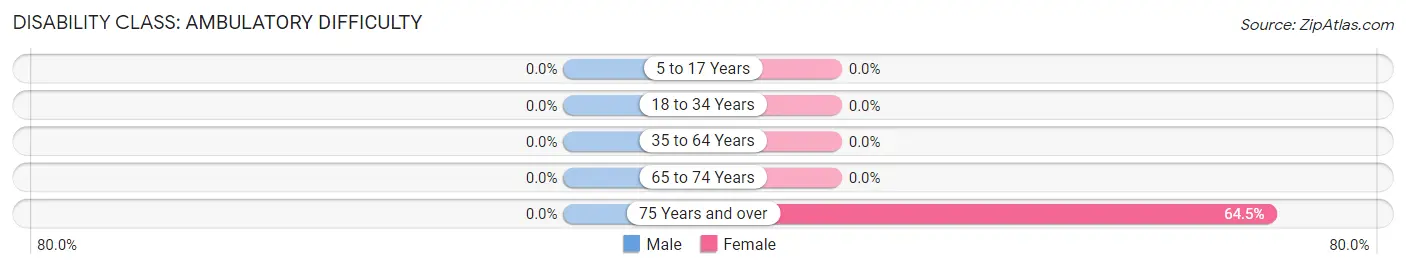
| Age Bracket | Male | Female |
| 5 to 17 Years | 0 (0.0%) | 0 (0.0%) |
| 18 to 34 Years | 0 (0.0%) | 0 (0.0%) |
| 35 to 64 Years | 0 (0.0%) | 0 (0.0%) |
| 65 to 74 Years | 0 (0.0%) | 0 (0.0%) |
| 75 Years and over | 0 (0.0%) | 20 (64.5%) |
Disability Class: Self-Care Difficulty
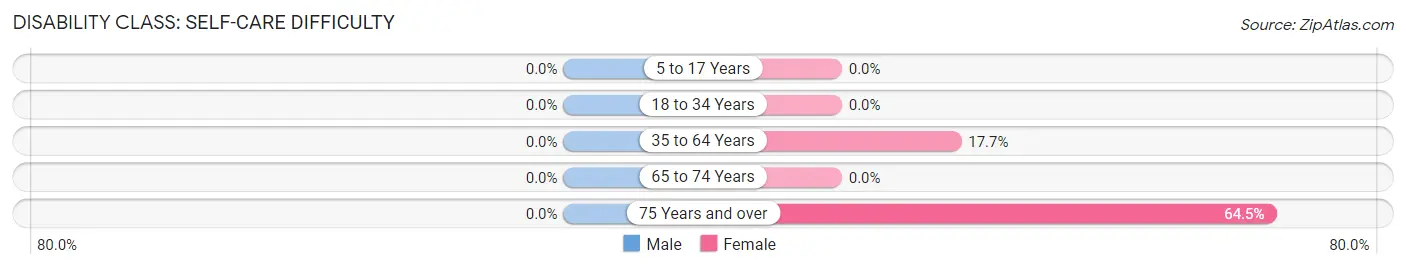
| Age Bracket | Male | Female |
| 5 to 17 Years | 0 (0.0%) | 0 (0.0%) |
| 18 to 34 Years | 0 (0.0%) | 0 (0.0%) |
| 35 to 64 Years | 0 (0.0%) | 11 (17.7%) |
| 65 to 74 Years | 0 (0.0%) | 0 (0.0%) |
| 75 Years and over | 0 (0.0%) | 20 (64.5%) |
Technology Access in Coral
Computing Device Access in Coral
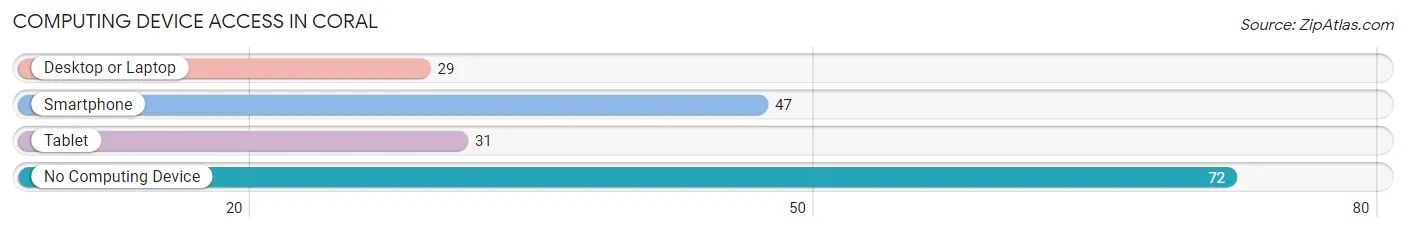
| Device Type | # Households | % Households |
| Desktop or Laptop | 29 | 24.4% |
| Smartphone | 47 | 39.5% |
| Tablet | 31 | 26.1% |
| No Computing Device | 72 | 60.5% |
| Total | 119 | 100.0% |
Internet Access in Coral
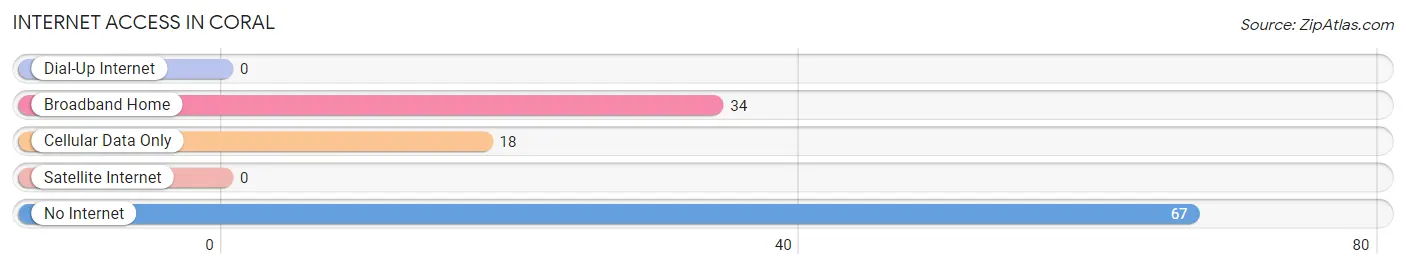
| Internet Type | # Households | % Households |
| Dial-Up Internet | 0 | 0.0% |
| Broadband Home | 34 | 28.6% |
| Cellular Data Only | 18 | 15.1% |
| Satellite Internet | 0 | 0.0% |
| No Internet | 67 | 56.3% |
| Total | 119 | 100.0% |
Coral Summary
Coral, Pennsylvania is a small borough located in the southwestern corner of Butler County, Pennsylvania. It is situated in the foothills of the Allegheny Mountains, approximately 30 miles north of Pittsburgh. The borough was founded in 1876 and incorporated in 1883. As of the 2010 census, the population of Coral was 1,093.
Geography
Coral is located at 40°51'N, 79°59'W (40.8500, -79.9833). It is situated in the foothills of the Allegheny Mountains, approximately 30 miles north of Pittsburgh. The borough has a total area of 0.6 square miles, all of which is land. The terrain is mostly hilly, with some flat areas. The borough is drained by the Connoquenessing Creek, which flows through the center of town.
Climate
Coral has a humid continental climate, with cold, snowy winters and hot, humid summers. The average annual temperature is 48°F, with an average high of 68°F in July and an average low of 28°F in January. The average annual precipitation is 40 inches, with an average of 28 inches of snowfall.
Demographics
As of the 2010 census, the population of Coral was 1,093. The racial makeup of the borough was 97.2% White, 0.7% African American, 0.2% Native American, 0.2% Asian, 0.2% from other races, and 1.7% from two or more races. Hispanic or Latino of any race were 0.7% of the population.
Economy
Coral is a small, rural borough with a primarily agricultural economy. The main industries are dairy farming, beef cattle, and poultry production. The borough also has a small manufacturing sector, with several small businesses located in the area.
History
Coral was founded in 1876 by a group of settlers from the nearby town of Butler. The borough was incorporated in 1883. The name “Coral” was chosen because of the abundance of coral fossils found in the area.
In the early 20th century, Coral was a thriving agricultural community. The borough was home to several dairy farms, as well as a number of small businesses. The borough also had a thriving lumber industry, with several sawmills located in the area.
In the late 20th century, Coral began to decline as the local economy shifted away from agriculture. The borough’s population decreased, and many of the businesses closed. However, in recent years, the borough has seen a resurgence in population and economic activity. The borough is now home to several small businesses, as well as a number of tourist attractions.
Common Questions
What is Per Capita Income in Coral?
Per Capita income in Coral is $23,191.
What is the Median Household income in Coral?
Median Household Income in Coral is $52,574.
What is Inequality or Gini Index in Coral?
Inequality or Gini Index in Coral is 0.32.
What is the Total Population of Coral?
Total Population of Coral is 234.
What is the Total Male Population of Coral?
Total Male Population of Coral is 125.
What is the Total Female Population of Coral?
Total Female Population of Coral is 109.
What is the Ratio of Males per 100 Females in Coral?
There are 114.68 Males per 100 Females in Coral.
What is the Ratio of Females per 100 Males in Coral?
There are 87.20 Females per 100 Males in Coral.
What is the Median Population Age in Coral?
Median Population Age in Coral is 57.1 Years.
What is the Average Family Size in Coral
Average Family Size in Coral is 2.6 People.
What is the Average Household Size in Coral
Average Household Size in Coral is 2.0 People.
How Large is the Labor Force in Coral?
There are 169 People in the Labor Forcein in Coral.
What is the Percentage of People in the Labor Force in Coral?
72.2% of People are in the Labor Force in Coral.
What is the Unemployment Rate in Coral?
Unemployment Rate in Coral is 5.9%.