Clymer borough, PA Map & Demographics
Clymer borough Overview
$32,976
PER CAPITA INCOME
$47,969
AVG FAMILY INCOME
$45,750
AVG HOUSEHOLD INCOME
38.7%
WAGE / INCOME GAP [ % ]
61.3¢/ $1
WAGE / INCOME GAP [ $ ]
$7,657
FAMILY INCOME DEFICIT
0.50
INEQUALITY / GINI INDEX
1,109
TOTAL POPULATION
503
MALE POPULATION
606
FEMALE POPULATION
83.00
MALES / 100 FEMALES
120.48
FEMALES / 100 MALES
43.9
MEDIAN AGE
2.8
AVG FAMILY SIZE
2.1
AVG HOUSEHOLD SIZE
545
LABOR FORCE [ PEOPLE ]
59.9%
PERCENT IN LABOR FORCE
5.3%
UNEMPLOYMENT RATE
Income in Clymer borough
Income Overview in Clymer borough
Per Capita Income in Clymer borough is $32,976, while median incomes of families and households are $47,969 and $45,750 respectively.
| Characteristic | Number | Measure |
| Per Capita Income | 1,109 | $32,976 |
| Median Family Income | 283 | $47,969 |
| Mean Family Income | 283 | $83,032 |
| Median Household Income | 518 | $45,750 |
| Mean Household Income | 518 | $68,084 |
| Income Deficit | 283 | $7,657 |
| Wage / Income Gap (%) | 1,109 | 38.71% |
| Wage / Income Gap ($) | 1,109 | 61.29¢ per $1 |
| Gini / Inequality Index | 1,109 | 0.50 |
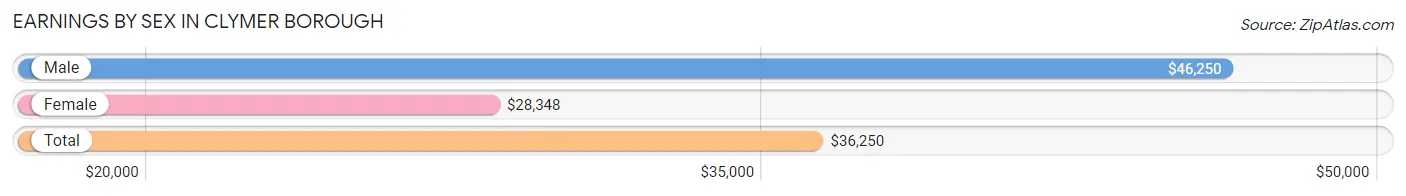
Earnings by Sex in Clymer borough
Average Earnings in Clymer borough are $36,250, $46,250 for men and $28,348 for women, a difference of 38.7%.
| Sex | Number | Average Earnings |
| Male | 254 (46.9%) | $46,250 |
| Female | 287 (53.0%) | $28,348 |
| Total | 541 (100.0%) | $36,250 |
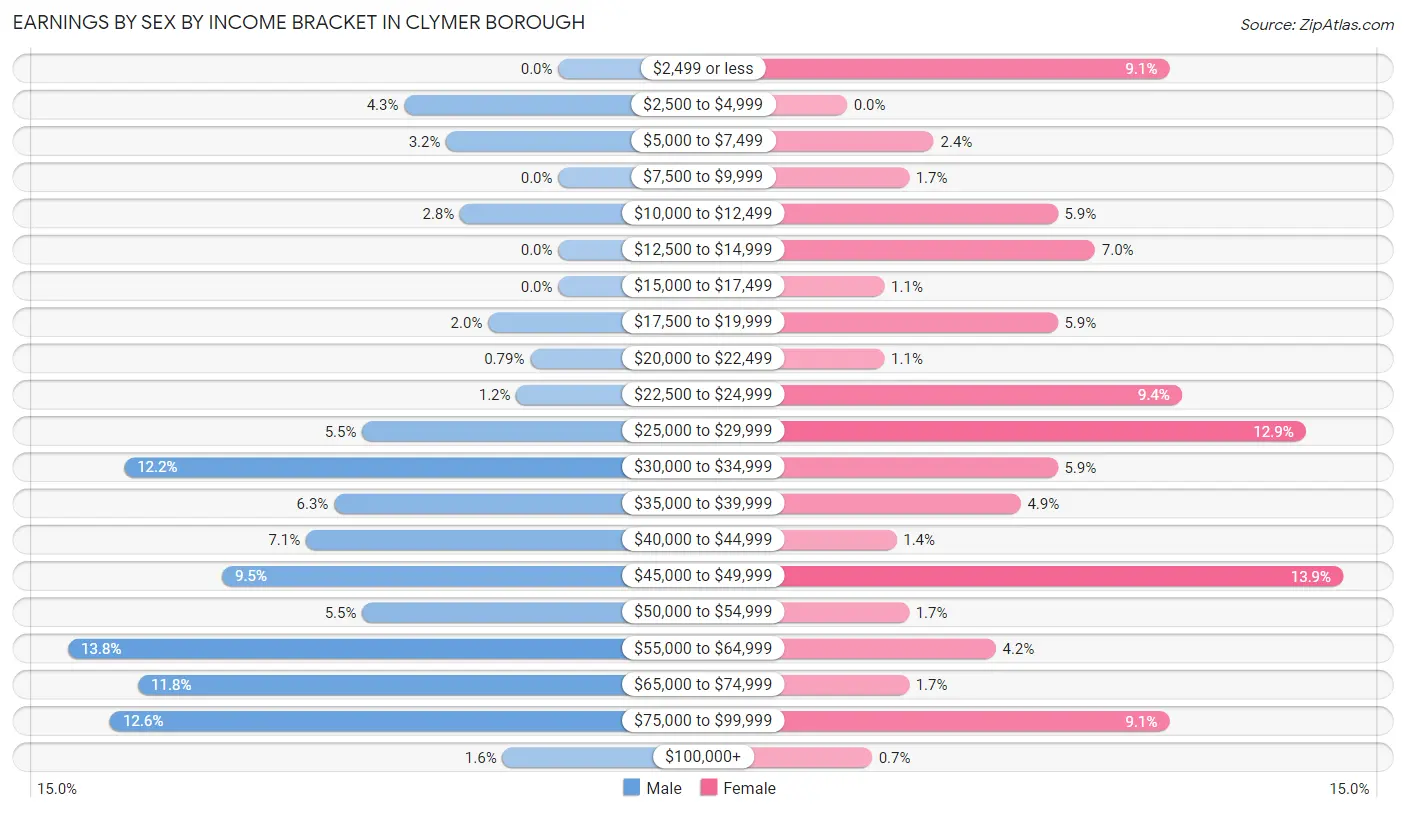
Earnings by Sex by Income Bracket in Clymer borough
The most common earnings brackets in Clymer borough are $55,000 to $64,999 for men (35 | 13.8%) and $45,000 to $49,999 for women (40 | 13.9%).
| Income | Male | Female |
| $2,499 or less | 0 (0.0%) | 26 (9.1%) |
| $2,500 to $4,999 | 11 (4.3%) | 0 (0.0%) |
| $5,000 to $7,499 | 8 (3.2%) | 7 (2.4%) |
| $7,500 to $9,999 | 0 (0.0%) | 5 (1.7%) |
| $10,000 to $12,499 | 7 (2.8%) | 17 (5.9%) |
| $12,500 to $14,999 | 0 (0.0%) | 20 (7.0%) |
| $15,000 to $17,499 | 0 (0.0%) | 3 (1.1%) |
| $17,500 to $19,999 | 5 (2.0%) | 17 (5.9%) |
| $20,000 to $22,499 | 2 (0.8%) | 3 (1.1%) |
| $22,500 to $24,999 | 3 (1.2%) | 27 (9.4%) |
| $25,000 to $29,999 | 14 (5.5%) | 37 (12.9%) |
| $30,000 to $34,999 | 31 (12.2%) | 17 (5.9%) |
| $35,000 to $39,999 | 16 (6.3%) | 14 (4.9%) |
| $40,000 to $44,999 | 18 (7.1%) | 4 (1.4%) |
| $45,000 to $49,999 | 24 (9.5%) | 40 (13.9%) |
| $50,000 to $54,999 | 14 (5.5%) | 5 (1.7%) |
| $55,000 to $64,999 | 35 (13.8%) | 12 (4.2%) |
| $65,000 to $74,999 | 30 (11.8%) | 5 (1.7%) |
| $75,000 to $99,999 | 32 (12.6%) | 26 (9.1%) |
| $100,000+ | 4 (1.6%) | 2 (0.7%) |
| Total | 254 (100.0%) | 287 (100.0%) |
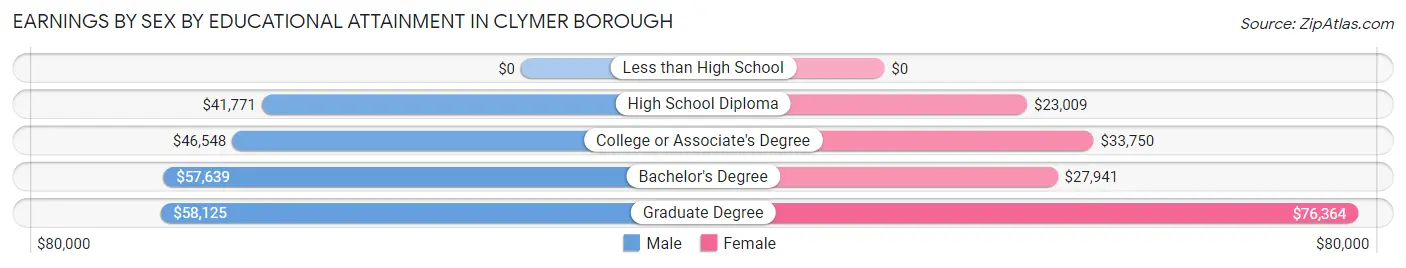
Earnings by Sex by Educational Attainment in Clymer borough
Average earnings in Clymer borough are $50,000 for men and $29,241 for women, a difference of 41.5%. Men with an educational attainment of graduate degree enjoy the highest average annual earnings of $58,125, while those with high school diploma education earn the least with $41,771. Women with an educational attainment of graduate degree earn the most with the average annual earnings of $76,364, while those with high school diploma education have the smallest earnings of $23,009.
| Educational Attainment | Male Income | Female Income |
| Less than High School | - | - |
| High School Diploma | $41,771 | $23,009 |
| College or Associate's Degree | $46,548 | $33,750 |
| Bachelor's Degree | $57,639 | $27,941 |
| Graduate Degree | $58,125 | $76,364 |
| Total | $50,000 | $29,241 |
Family Income in Clymer borough
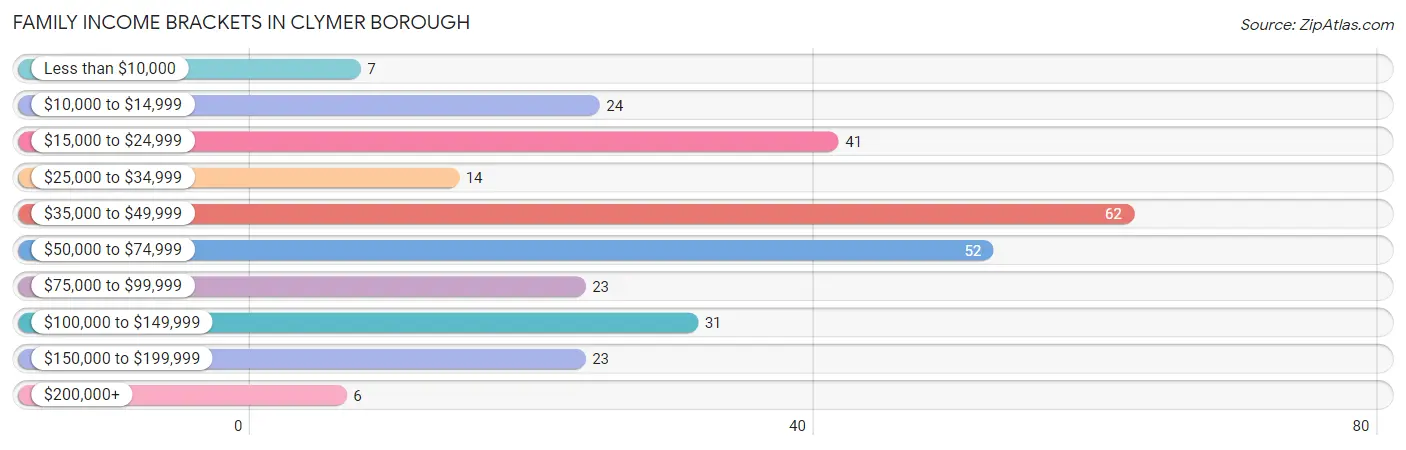
Family Income Brackets in Clymer borough
According to the Clymer borough family income data, there are 62 families falling into the $35,000 to $49,999 income range, which is the most common income bracket and makes up 21.9% of all families. Conversely, the $200,000+ income bracket is the least frequent group with only 6 families (2.1%) belonging to this category.
| Income Bracket | # Families | % Families |
| Less than $10,000 | 7 | 2.5% |
| $10,000 to $14,999 | 24 | 8.5% |
| $15,000 to $24,999 | 41 | 14.5% |
| $25,000 to $34,999 | 14 | 4.9% |
| $35,000 to $49,999 | 62 | 21.9% |
| $50,000 to $74,999 | 52 | 18.4% |
| $75,000 to $99,999 | 23 | 8.1% |
| $100,000 to $149,999 | 31 | 11.0% |
| $150,000 to $199,999 | 23 | 8.1% |
| $200,000+ | 6 | 2.1% |
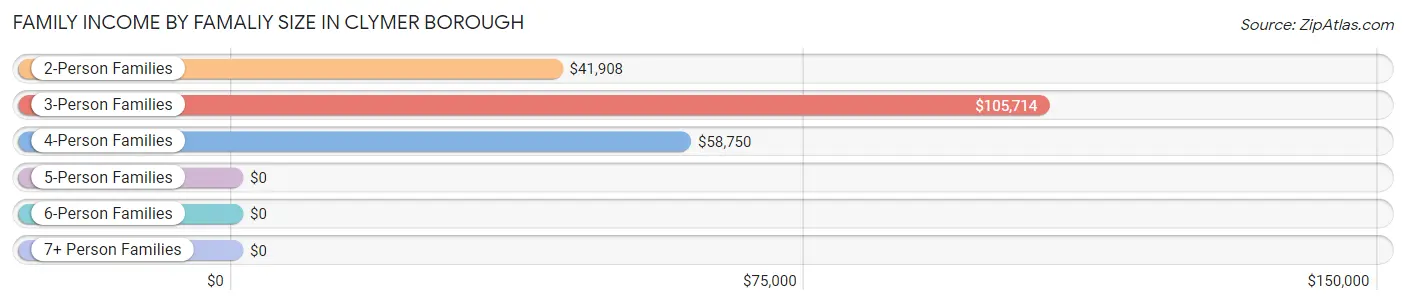
Family Income by Famaliy Size in Clymer borough
3-person families (30 | 10.6%) account for the highest median family income in Clymer borough with $105,714 per family, while 3-person families (30 | 10.6%) have the highest median income of $35,238 per family member.
| Income Bracket | # Families | Median Income |
| 2-Person Families | 175 (61.8%) | $41,908 |
| 3-Person Families | 30 (10.6%) | $105,714 |
| 4-Person Families | 44 (15.5%) | $58,750 |
| 5-Person Families | 30 (10.6%) | $0 |
| 6-Person Families | 4 (1.4%) | $0 |
| 7+ Person Families | 0 (0.0%) | $0 |
| Total | 283 (100.0%) | $47,969 |
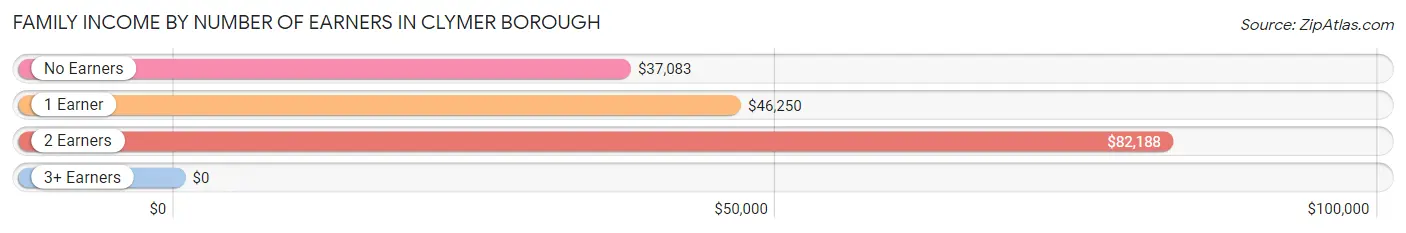
Family Income by Number of Earners in Clymer borough
| Number of Earners | # Families | Median Income |
| No Earners | 81 (28.6%) | $37,083 |
| 1 Earner | 94 (33.2%) | $46,250 |
| 2 Earners | 99 (35.0%) | $82,188 |
| 3+ Earners | 9 (3.2%) | $0 |
| Total | 283 (100.0%) | $47,969 |
Household Income in Clymer borough
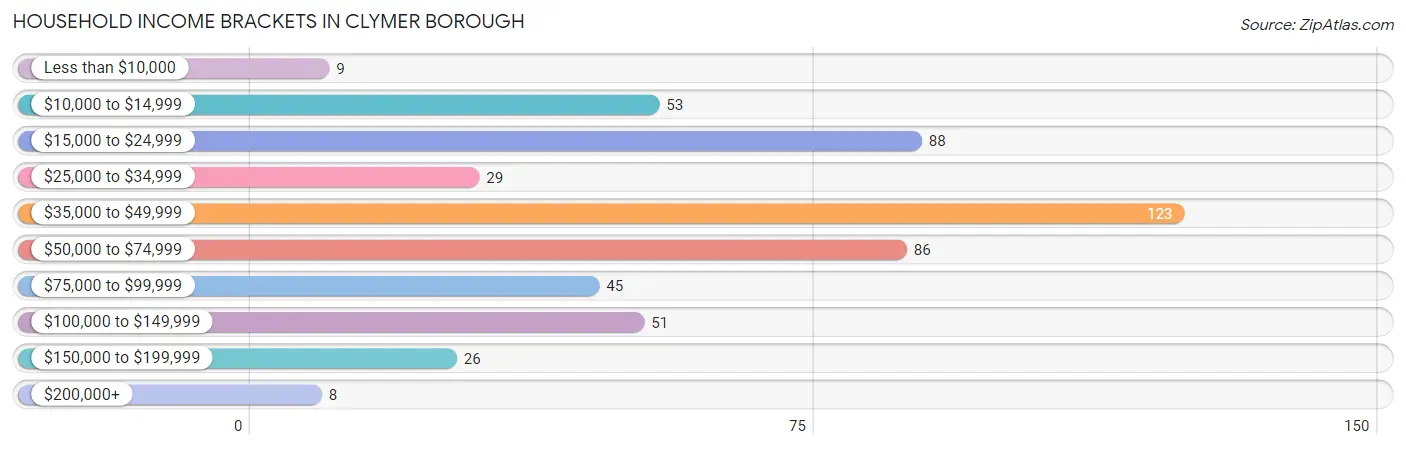
Household Income Brackets in Clymer borough
With 123 households falling in the category, the $35,000 to $49,999 income range is the most frequent in Clymer borough, accounting for 23.7% of all households. In contrast, only 8 households (1.5%) fall into the $200,000+ income bracket, making it the least populous group.
| Income Bracket | # Households | % Households |
| Less than $10,000 | 9 | 1.7% |
| $10,000 to $14,999 | 53 | 10.2% |
| $15,000 to $24,999 | 88 | 17.0% |
| $25,000 to $34,999 | 29 | 5.6% |
| $35,000 to $49,999 | 123 | 23.7% |
| $50,000 to $74,999 | 86 | 16.6% |
| $75,000 to $99,999 | 45 | 8.7% |
| $100,000 to $149,999 | 51 | 9.8% |
| $150,000 to $199,999 | 26 | 5.0% |
| $200,000+ | 8 | 1.5% |
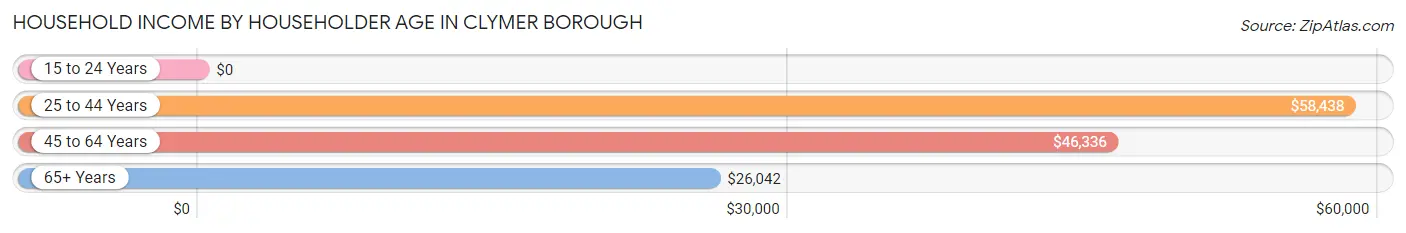
Household Income by Householder Age in Clymer borough
The median household income in Clymer borough is $45,750, with the highest median household income of $58,438 found in the 25 to 44 years age bracket for the primary householder. A total of 129 households (24.9%) fall into this category. Meanwhile, the 15 to 24 years age bracket for the primary householder has the lowest median household income of $0, with 7 households (1.3%) in this group.
| Income Bracket | # Households | Median Income |
| 15 to 24 Years | 7 (1.3%) | $0 |
| 25 to 44 Years | 129 (24.9%) | $58,438 |
| 45 to 64 Years | 233 (45.0%) | $46,336 |
| 65+ Years | 149 (28.8%) | $26,042 |
| Total | 518 (100.0%) | $45,750 |
Poverty in Clymer borough
Income Below Poverty by Sex and Age in Clymer borough
With 15.7% poverty level for males and 21.1% for females among the residents of Clymer borough, under 5 year old males and 18 to 24 year old females are the most vulnerable to poverty, with 7 males (100.0%) and 19 females (65.5%) in their respective age groups living below the poverty level.
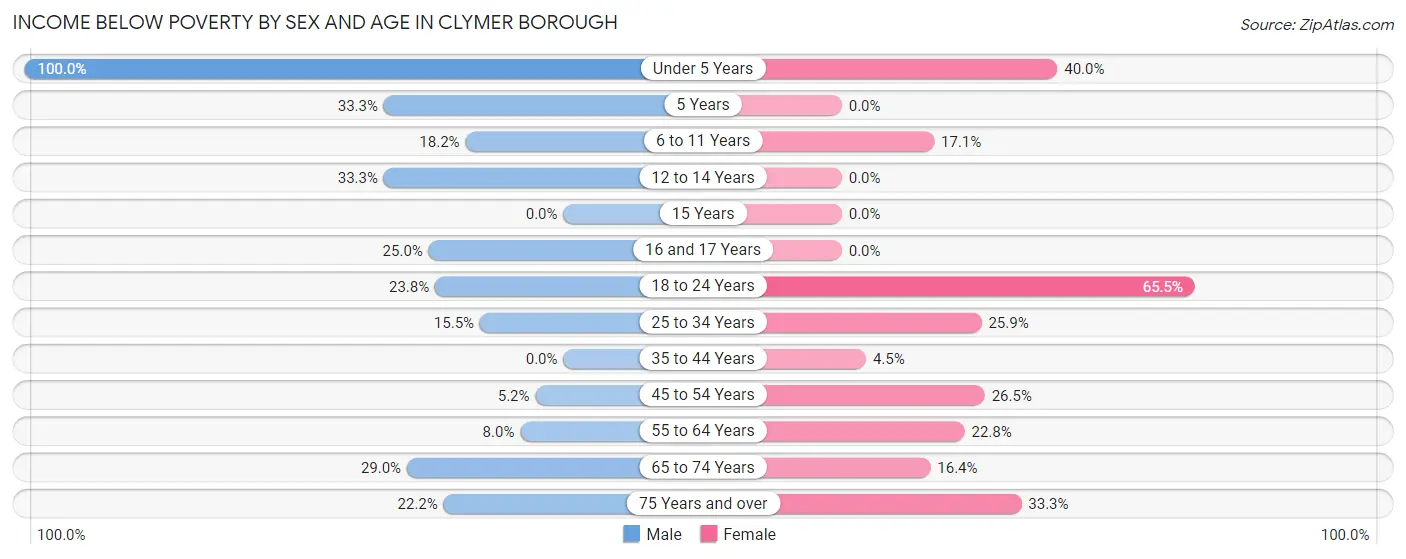
| Age Bracket | Male | Female |
| Under 5 Years | 7 (100.0%) | 14 (40.0%) |
| 5 Years | 4 (33.3%) | 0 (0.0%) |
| 6 to 11 Years | 4 (18.2%) | 12 (17.1%) |
| 12 to 14 Years | 5 (33.3%) | 0 (0.0%) |
| 15 Years | 0 (0.0%) | 0 (0.0%) |
| 16 and 17 Years | 5 (25.0%) | 0 (0.0%) |
| 18 to 24 Years | 5 (23.8%) | 19 (65.5%) |
| 25 to 34 Years | 11 (15.5%) | 14 (25.9%) |
| 35 to 44 Years | 0 (0.0%) | 4 (4.5%) |
| 45 to 54 Years | 4 (5.2%) | 26 (26.5%) |
| 55 to 64 Years | 8 (8.0%) | 18 (22.8%) |
| 65 to 74 Years | 18 (29.0%) | 12 (16.4%) |
| 75 Years and over | 8 (22.2%) | 9 (33.3%) |
| Total | 79 (15.7%) | 128 (21.1%) |
Income Above Poverty by Sex and Age in Clymer borough
According to the poverty statistics in Clymer borough, males aged 35 to 44 years and females aged 5 years are the age groups that are most secure financially, with 100.0% of males and 100.0% of females in these age groups living above the poverty line.
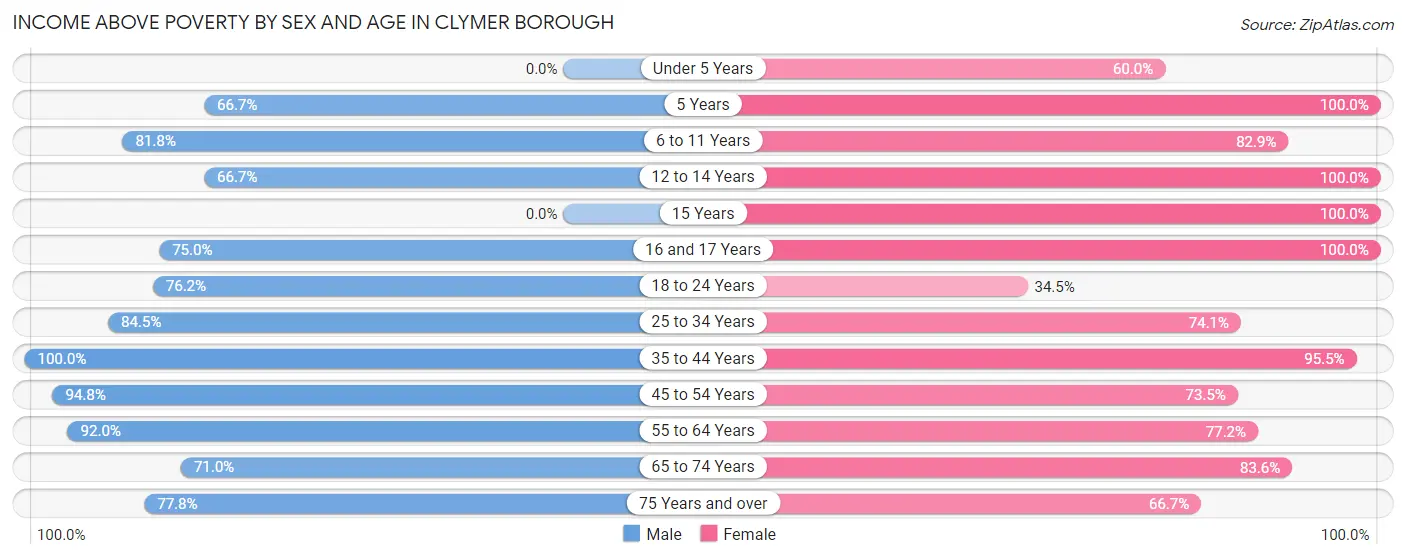
| Age Bracket | Male | Female |
| Under 5 Years | 0 (0.0%) | 21 (60.0%) |
| 5 Years | 8 (66.7%) | 3 (100.0%) |
| 6 to 11 Years | 18 (81.8%) | 58 (82.9%) |
| 12 to 14 Years | 10 (66.7%) | 29 (100.0%) |
| 15 Years | 0 (0.0%) | 6 (100.0%) |
| 16 and 17 Years | 15 (75.0%) | 14 (100.0%) |
| 18 to 24 Years | 16 (76.2%) | 10 (34.5%) |
| 25 to 34 Years | 60 (84.5%) | 40 (74.1%) |
| 35 to 44 Years | 60 (100.0%) | 85 (95.5%) |
| 45 to 54 Years | 73 (94.8%) | 72 (73.5%) |
| 55 to 64 Years | 92 (92.0%) | 61 (77.2%) |
| 65 to 74 Years | 44 (71.0%) | 61 (83.6%) |
| 75 Years and over | 28 (77.8%) | 18 (66.7%) |
| Total | 424 (84.3%) | 478 (78.9%) |
Income Below Poverty Among Married-Couple Families in Clymer borough
The poverty statistics for married-couple families in Clymer borough show that 15.4% or 31 of the total 201 families live below the poverty line. Families with no children have the highest poverty rate of 17.5%, comprising of 27 families. On the other hand, families with 1 or 2 children have the lowest poverty rate of 0.0%, which includes 0 families.
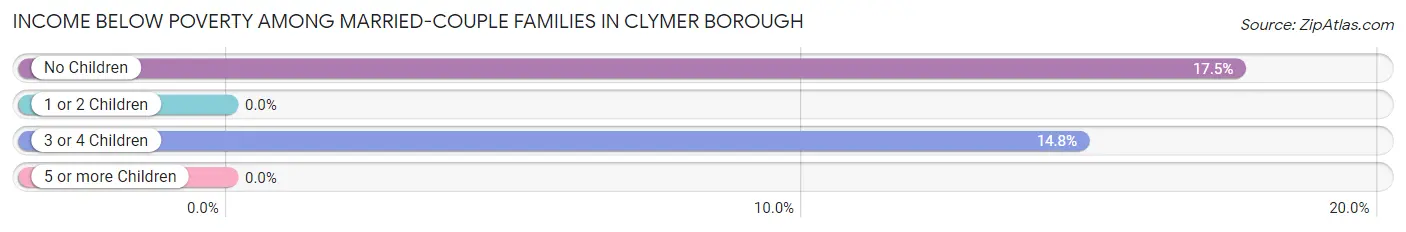
| Children | Above Poverty | Below Poverty |
| No Children | 127 (82.5%) | 27 (17.5%) |
| 1 or 2 Children | 20 (100.0%) | 0 (0.0%) |
| 3 or 4 Children | 23 (85.2%) | 4 (14.8%) |
| 5 or more Children | 0 (0.0%) | 0 (0.0%) |
| Total | 170 (84.6%) | 31 (15.4%) |
Income Below Poverty Among Single-Parent Households in Clymer borough
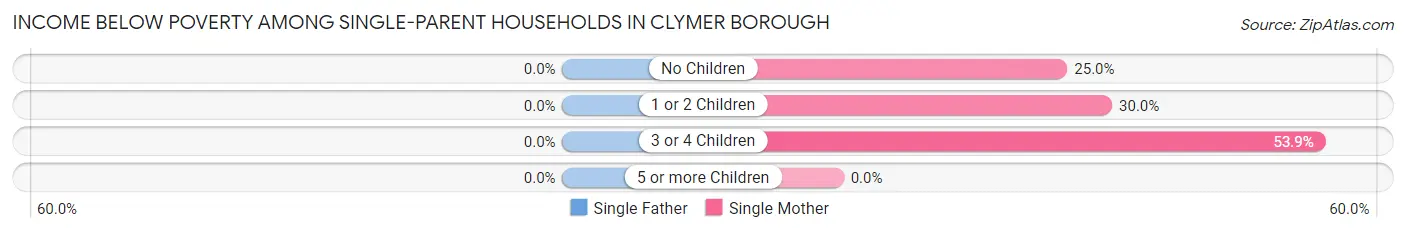
| Children | Single Father | Single Mother |
| No Children | 0 (0.0%) | 1 (25.0%) |
| 1 or 2 Children | 0 (0.0%) | 12 (30.0%) |
| 3 or 4 Children | 0 (0.0%) | 7 (53.8%) |
| 5 or more Children | 0 (0.0%) | 0 (0.0%) |
| Total | 0 (0.0%) | 20 (35.1%) |
Income Below Poverty Among Married-Couple vs Single-Parent Households in Clymer borough
The poverty data for Clymer borough shows that 31 of the married-couple family households (15.4%) and 20 of the single-parent households (24.4%) are living below the poverty level. Within the married-couple family households, those with no children have the highest poverty rate, with 27 households (17.5%) falling below the poverty line. Among the single-parent households, those with 3 or 4 children have the highest poverty rate, with 7 household (36.8%) living below poverty.
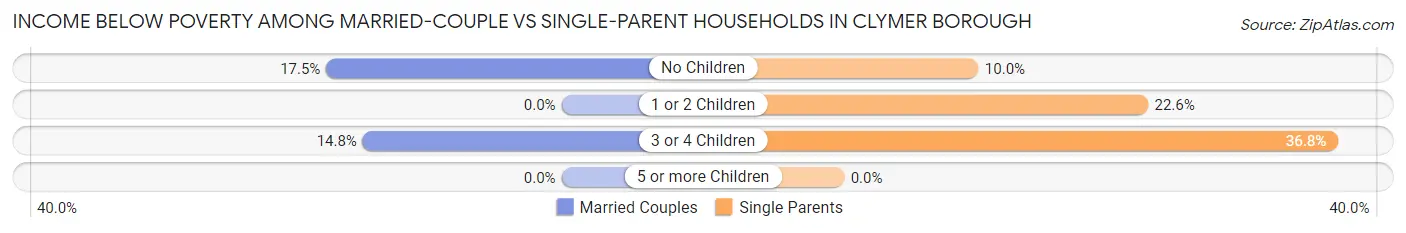
| Children | Married-Couple Families | Single-Parent Households |
| No Children | 27 (17.5%) | 1 (10.0%) |
| 1 or 2 Children | 0 (0.0%) | 12 (22.6%) |
| 3 or 4 Children | 4 (14.8%) | 7 (36.8%) |
| 5 or more Children | 0 (0.0%) | 0 (0.0%) |
| Total | 31 (15.4%) | 20 (24.4%) |
Race in Clymer borough
The most populous races in Clymer borough are White / Caucasian (1,065 | 96.0%), Two or more Races (30 | 2.7%), and Black / African American (14 | 1.3%).
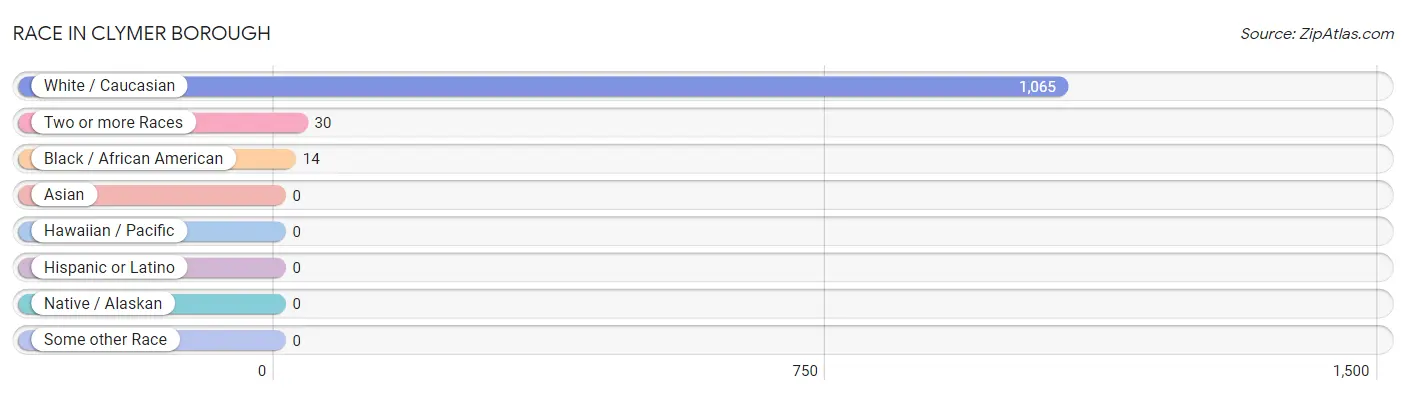
| Race | # Population | % Population |
| Asian | 0 | 0.0% |
| Black / African American | 14 | 1.3% |
| Hawaiian / Pacific | 0 | 0.0% |
| Hispanic or Latino | 0 | 0.0% |
| Native / Alaskan | 0 | 0.0% |
| White / Caucasian | 1,065 | 96.0% |
| Two or more Races | 30 | 2.7% |
| Some other Race | 0 | 0.0% |
| Total | 1,109 | 100.0% |
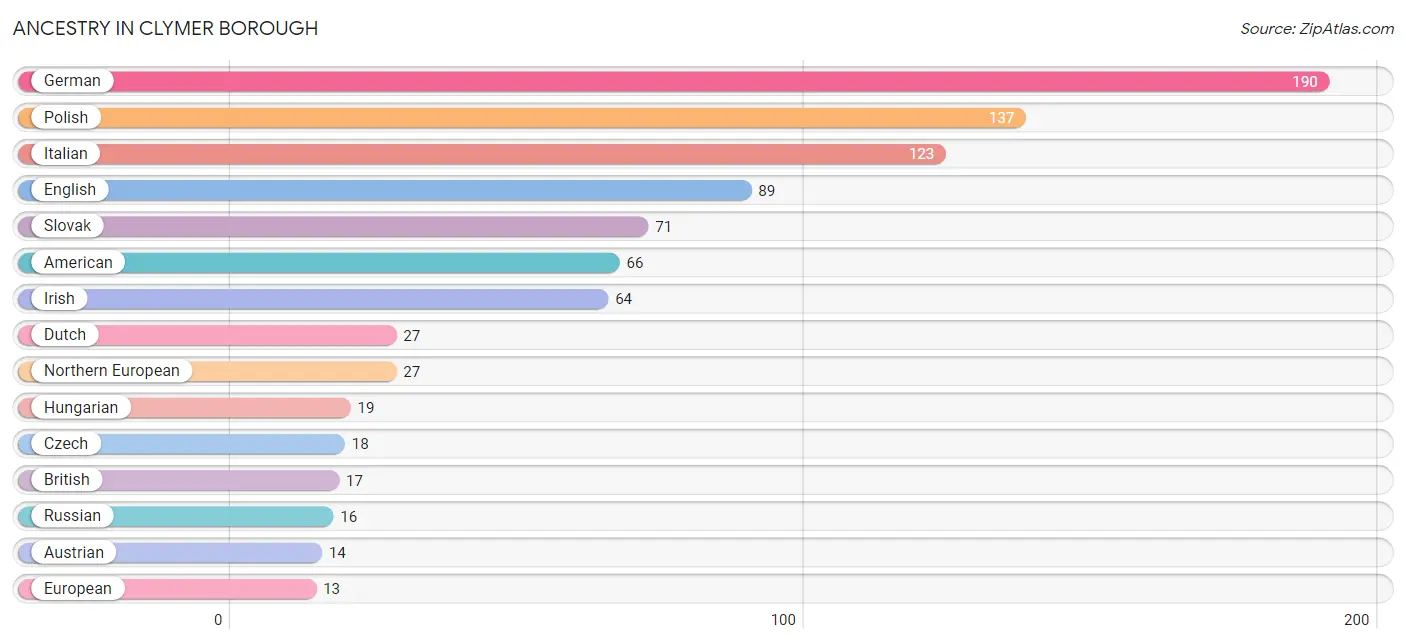
Ancestry in Clymer borough
The most populous ancestries reported in Clymer borough are German (190 | 17.1%), Polish (137 | 12.3%), Italian (123 | 11.1%), English (89 | 8.0%), and Slovak (71 | 6.4%), together accounting for 55.0% of all Clymer borough residents.
| Ancestry | # Population | % Population |
| American | 66 | 5.9% |
| Austrian | 14 | 1.3% |
| British | 17 | 1.5% |
| Czech | 18 | 1.6% |
| Czechoslovakian | 10 | 0.9% |
| Dutch | 27 | 2.4% |
| Eastern European | 5 | 0.4% |
| English | 89 | 8.0% |
| European | 13 | 1.2% |
| French | 5 | 0.4% |
| German | 190 | 17.1% |
| Hungarian | 19 | 1.7% |
| Irish | 64 | 5.8% |
| Italian | 123 | 11.1% |
| Northern European | 27 | 2.4% |
| Norwegian | 10 | 0.9% |
| Pennsylvania German | 1 | 0.1% |
| Polish | 137 | 12.3% |
| Russian | 16 | 1.4% |
| Scotch-Irish | 5 | 0.4% |
| Scottish | 7 | 0.6% |
| Slavic | 3 | 0.3% |
| Slovak | 71 | 6.4% |
| Swedish | 11 | 1.0% |
| Ukrainian | 13 | 1.2% |
| Welsh | 8 | 0.7% | View All 26 Rows |
Immigrants in Clymer borough

| Immigration Origin | # Population | % Population | View All 0 Rows |
Sex and Age in Clymer borough
Sex and Age in Clymer borough
The most populous age groups in Clymer borough are 55 to 59 Years (52 | 10.3%) for men and 5 to 9 Years (52 | 8.6%) for women.
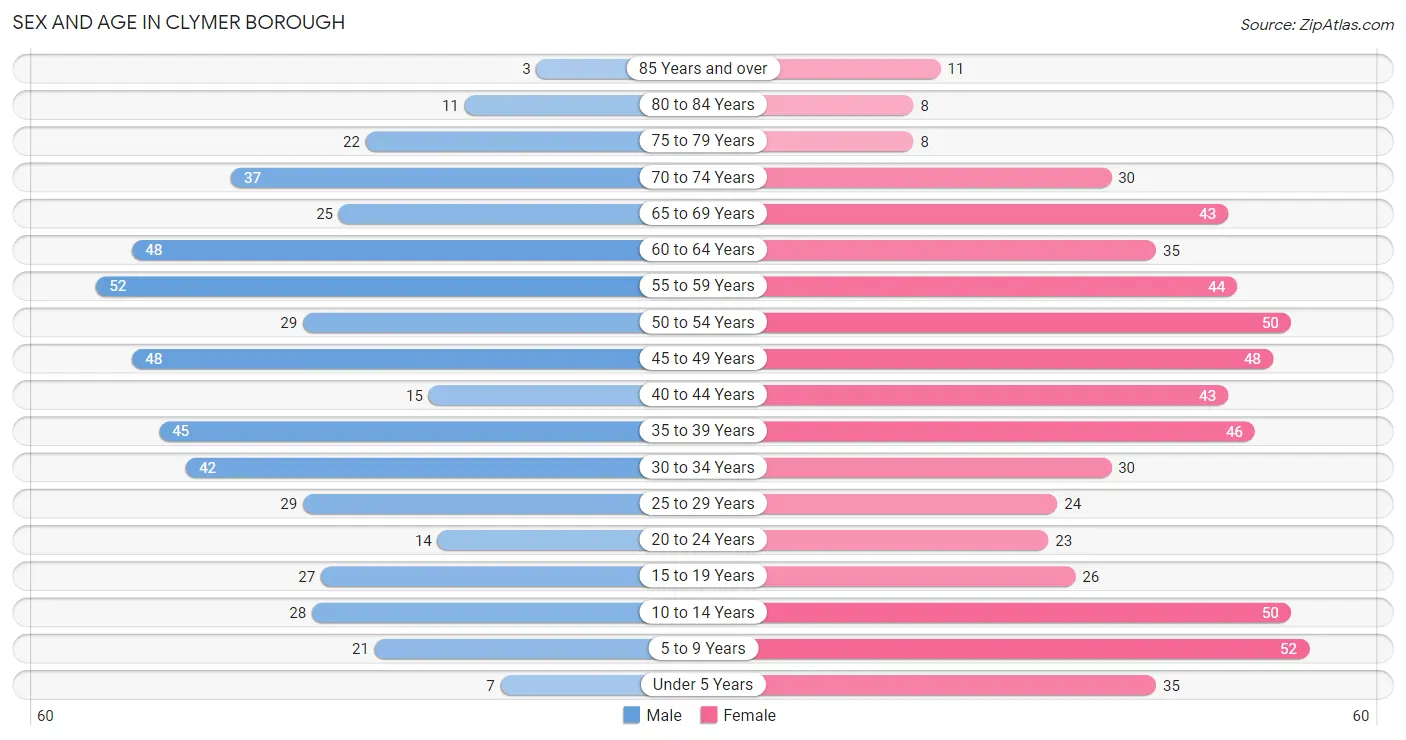
| Age Bracket | Male | Female |
| Under 5 Years | 7 (1.4%) | 35 (5.8%) |
| 5 to 9 Years | 21 (4.2%) | 52 (8.6%) |
| 10 to 14 Years | 28 (5.6%) | 50 (8.3%) |
| 15 to 19 Years | 27 (5.4%) | 26 (4.3%) |
| 20 to 24 Years | 14 (2.8%) | 23 (3.8%) |
| 25 to 29 Years | 29 (5.8%) | 24 (4.0%) |
| 30 to 34 Years | 42 (8.4%) | 30 (5.0%) |
| 35 to 39 Years | 45 (8.9%) | 46 (7.6%) |
| 40 to 44 Years | 15 (3.0%) | 43 (7.1%) |
| 45 to 49 Years | 48 (9.5%) | 48 (7.9%) |
| 50 to 54 Years | 29 (5.8%) | 50 (8.3%) |
| 55 to 59 Years | 52 (10.3%) | 44 (7.3%) |
| 60 to 64 Years | 48 (9.5%) | 35 (5.8%) |
| 65 to 69 Years | 25 (5.0%) | 43 (7.1%) |
| 70 to 74 Years | 37 (7.4%) | 30 (5.0%) |
| 75 to 79 Years | 22 (4.4%) | 8 (1.3%) |
| 80 to 84 Years | 11 (2.2%) | 8 (1.3%) |
| 85 Years and over | 3 (0.6%) | 11 (1.8%) |
| Total | 503 (100.0%) | 606 (100.0%) |
Families and Households in Clymer borough
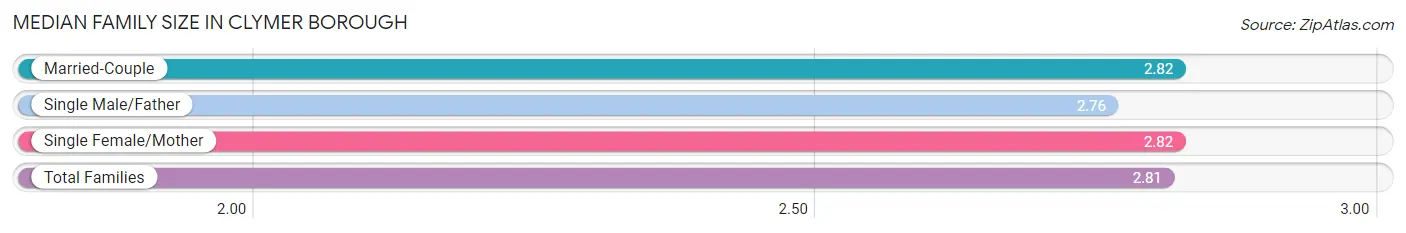
Median Family Size in Clymer borough
The median family size in Clymer borough is 2.81 persons per family, with married-couple families (201 | 71.0%) accounting for the largest median family size of 2.82 persons per family. On the other hand, single male/father families (25 | 8.8%) represent the smallest median family size with 2.76 persons per family.
| Family Type | # Families | Family Size |
| Married-Couple | 201 (71.0%) | 2.82 |
| Single Male/Father | 25 (8.8%) | 2.76 |
| Single Female/Mother | 57 (20.1%) | 2.82 |
| Total Families | 283 (100.0%) | 2.81 |
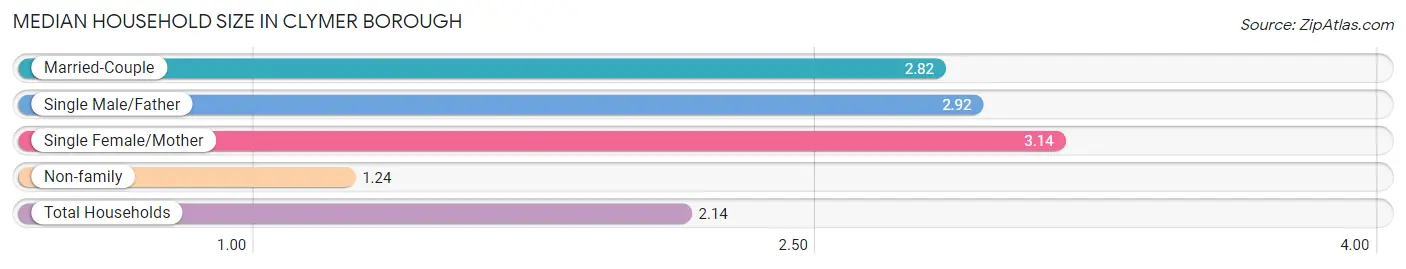
Median Household Size in Clymer borough
The median household size in Clymer borough is 2.14 persons per household, with single female/mother households (57 | 11.0%) accounting for the largest median household size of 3.14 persons per household. non-family households (235 | 45.4%) represent the smallest median household size with 1.24 persons per household.
| Household Type | # Households | Household Size |
| Married-Couple | 201 (38.8%) | 2.82 |
| Single Male/Father | 25 (4.8%) | 2.92 |
| Single Female/Mother | 57 (11.0%) | 3.14 |
| Non-family | 235 (45.4%) | 1.24 |
| Total Households | 518 (100.0%) | 2.14 |
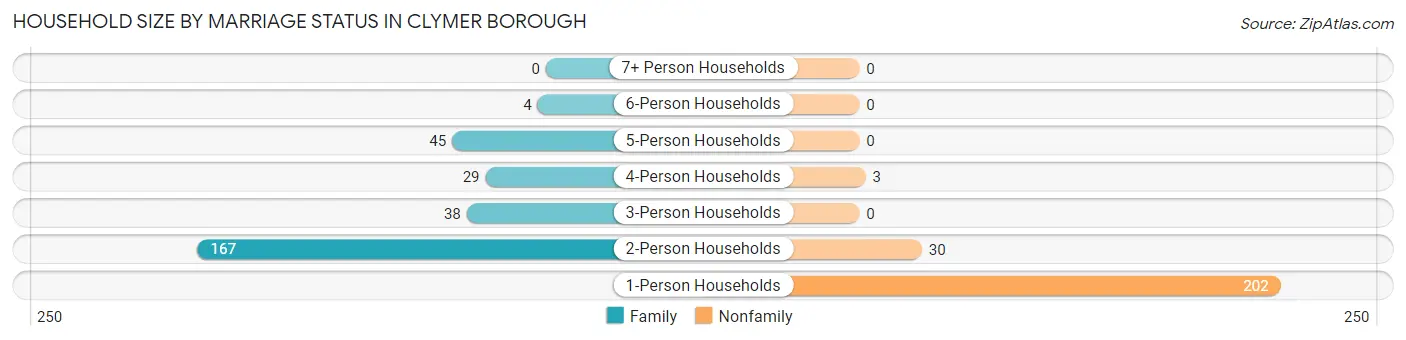
Household Size by Marriage Status in Clymer borough
Out of a total of 518 households in Clymer borough, 283 (54.6%) are family households, while 235 (45.4%) are nonfamily households. The most numerous type of family households are 2-person households, comprising 167, and the most common type of nonfamily households are 1-person households, comprising 202.
| Household Size | Family Households | Nonfamily Households |
| 1-Person Households | - | 202 (39.0%) |
| 2-Person Households | 167 (32.2%) | 30 (5.8%) |
| 3-Person Households | 38 (7.3%) | 0 (0.0%) |
| 4-Person Households | 29 (5.6%) | 3 (0.6%) |
| 5-Person Households | 45 (8.7%) | 0 (0.0%) |
| 6-Person Households | 4 (0.8%) | 0 (0.0%) |
| 7+ Person Households | 0 (0.0%) | 0 (0.0%) |
| Total | 283 (54.6%) | 235 (45.4%) |
Female Fertility in Clymer borough
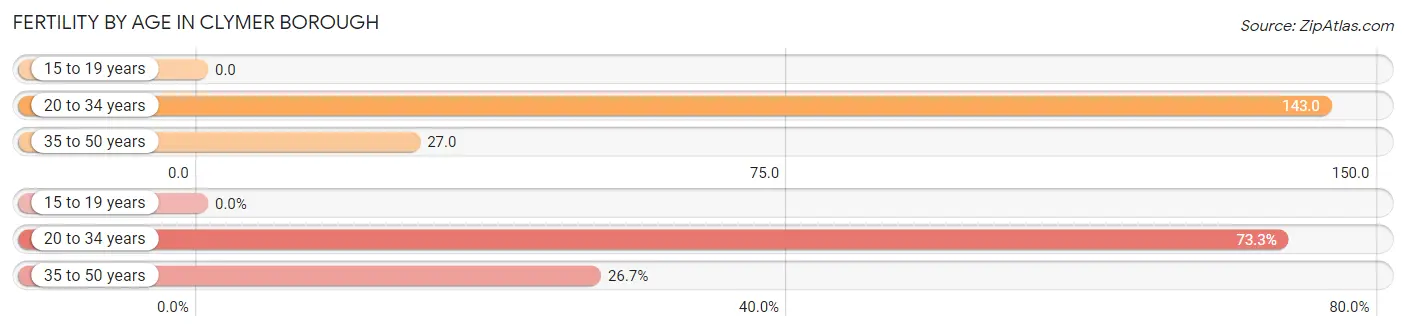
Fertility by Age in Clymer borough
Average fertility rate in Clymer borough is 60.0 births per 1,000 women. Women in the age bracket of 20 to 34 years have the highest fertility rate with 143.0 births per 1,000 women. Women in the age bracket of 20 to 34 years acount for 73.3% of all women with births.
| Age Bracket | Women with Births | Births / 1,000 Women |
| 15 to 19 years | 0 (0.0%) | 0.0 |
| 20 to 34 years | 11 (73.3%) | 143.0 |
| 35 to 50 years | 4 (26.7%) | 27.0 |
| Total | 15 (100.0%) | 60.0 |
Fertility by Age by Marriage Status in Clymer borough
26.7% of women with births (15) in Clymer borough are married. The highest percentage of unmarried women with births falls into 20 to 34 years age bracket with 100.0% of them unmarried at the time of birth, while the lowest percentage of unmarried women with births belong to 35 to 50 years age bracket with 0.0% of them unmarried.
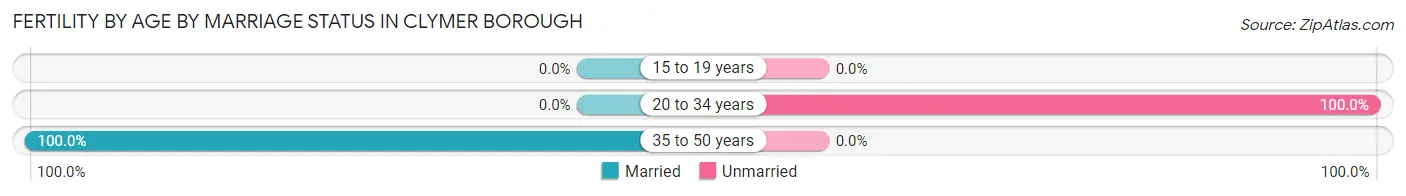
| Age Bracket | Married | Unmarried |
| 15 to 19 years | 0 (0.0%) | 0 (0.0%) |
| 20 to 34 years | 0 (0.0%) | 11 (100.0%) |
| 35 to 50 years | 4 (100.0%) | 0 (0.0%) |
| Total | 4 (26.7%) | 11 (73.3%) |
Fertility by Education in Clymer borough
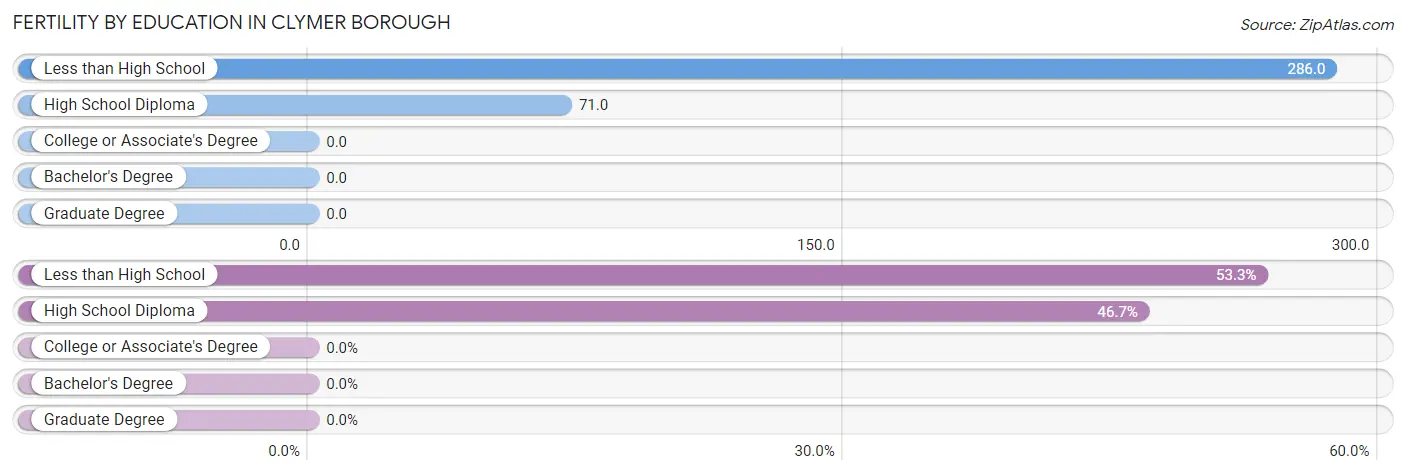
| Educational Attainment | Women with Births | Births / 1,000 Women |
| Less than High School | 8 (53.3%) | 286.0 |
| High School Diploma | 7 (46.7%) | 71.0 |
| College or Associate's Degree | 0 (0.0%) | 0.0 |
| Bachelor's Degree | 0 (0.0%) | 0.0 |
| Graduate Degree | 0 (0.0%) | 0.0 |
| Total | 15 (100.0%) | 60.0 |
Fertility by Education by Marriage Status in Clymer borough
73.3% of women with births in Clymer borough are unmarried. Women with the educational attainment of high school diploma are most likely to be married with 57.1% of them married at childbirth, while women with the educational attainment of less than high school are least likely to be married with 100.0% of them unmarried at childbirth.
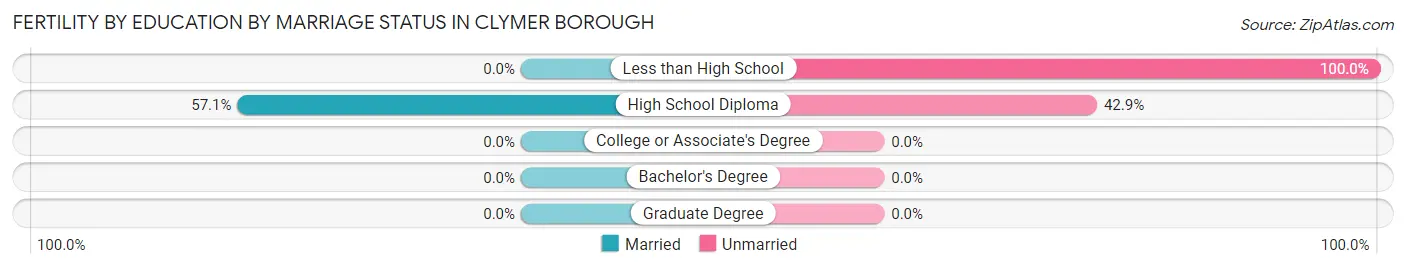
| Educational Attainment | Married | Unmarried |
| Less than High School | 0 (0.0%) | 8 (100.0%) |
| High School Diploma | 4 (57.1%) | 3 (42.9%) |
| College or Associate's Degree | 0 (0.0%) | 0 (0.0%) |
| Bachelor's Degree | 0 (0.0%) | 0 (0.0%) |
| Graduate Degree | 0 (0.0%) | 0 (0.0%) |
| Total | 4 (26.7%) | 11 (73.3%) |
Employment Characteristics in Clymer borough
Employment by Class of Employer in Clymer borough
Among the 499 employed individuals in Clymer borough, private company employees (339 | 67.9%), local government employees (56 | 11.2%), and not-for-profit organizations (44 | 8.8%) make up the most common classes of employment.
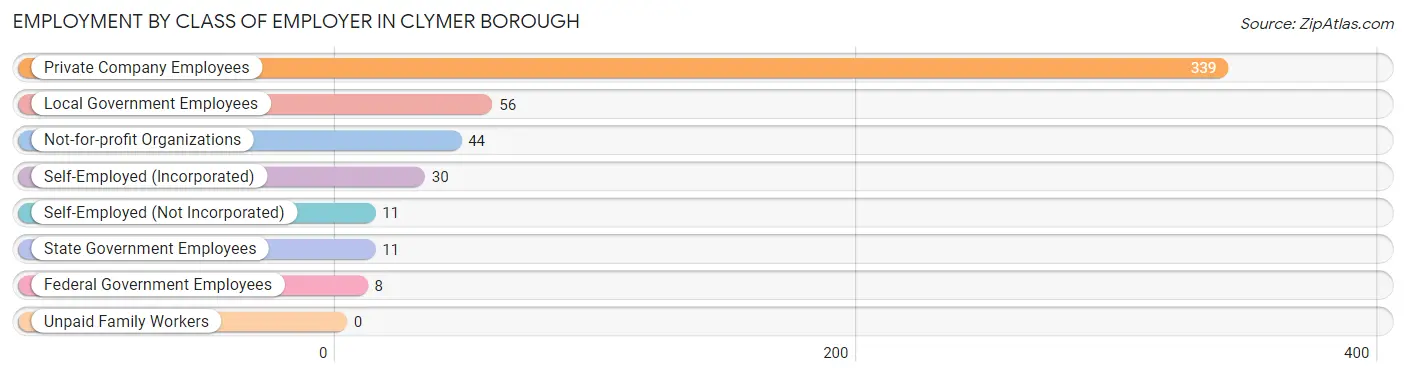
| Employer Class | # Employees | % Employees |
| Private Company Employees | 339 | 67.9% |
| Self-Employed (Incorporated) | 30 | 6.0% |
| Self-Employed (Not Incorporated) | 11 | 2.2% |
| Not-for-profit Organizations | 44 | 8.8% |
| Local Government Employees | 56 | 11.2% |
| State Government Employees | 11 | 2.2% |
| Federal Government Employees | 8 | 1.6% |
| Unpaid Family Workers | 0 | 0.0% |
| Total | 499 | 100.0% |
Employment Status by Age in Clymer borough
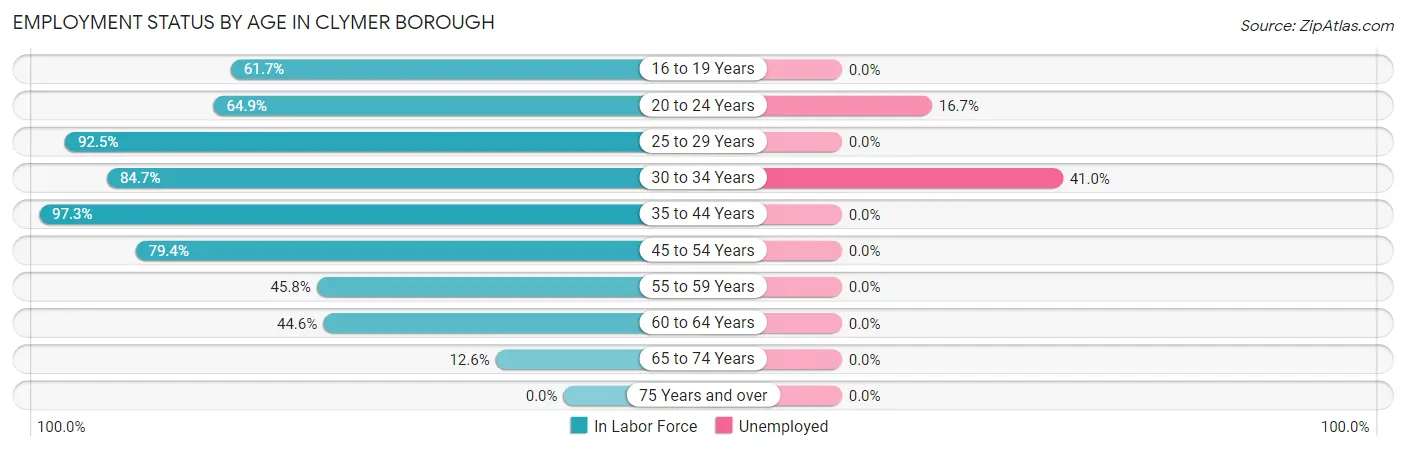
According to the labor force statistics for Clymer borough, out of the total population over 16 years of age (910), 59.9% or 545 individuals are in the labor force, with 5.3% or 29 of them unemployed. The age group with the highest labor force participation rate is 35 to 44 years, with 97.3% or 145 individuals in the labor force. Within the labor force, the 30 to 34 years age range has the highest percentage of unemployed individuals, with 41.0% or 25 of them being unemployed.
| Age Bracket | In Labor Force | Unemployed |
| 16 to 19 Years | 29 (61.7%) | 0 (0.0%) |
| 20 to 24 Years | 24 (64.9%) | 4 (16.7%) |
| 25 to 29 Years | 49 (92.5%) | 0 (0.0%) |
| 30 to 34 Years | 61 (84.7%) | 25 (41.0%) |
| 35 to 44 Years | 145 (97.3%) | 0 (0.0%) |
| 45 to 54 Years | 139 (79.4%) | 0 (0.0%) |
| 55 to 59 Years | 44 (45.8%) | 0 (0.0%) |
| 60 to 64 Years | 37 (44.6%) | 0 (0.0%) |
| 65 to 74 Years | 17 (12.6%) | 0 (0.0%) |
| 75 Years and over | 0 (0.0%) | 0 (0.0%) |
| Total | 545 (59.9%) | 29 (5.3%) |
Employment Status by Educational Attainment in Clymer borough
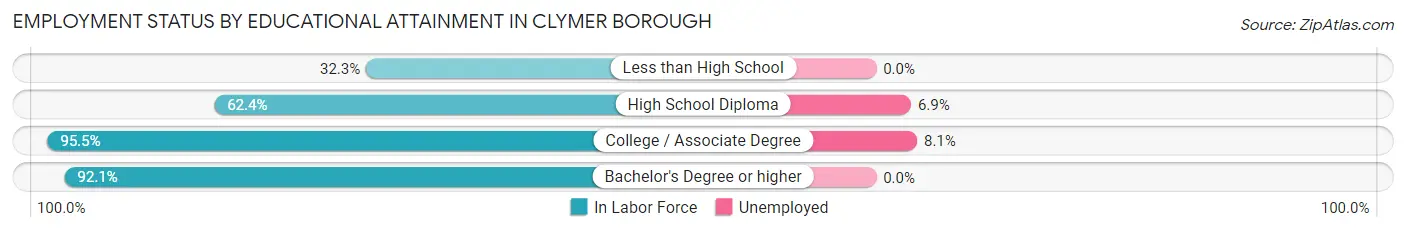
According to labor force statistics for Clymer borough, 75.6% of individuals (475) out of the total population between 25 and 64 years of age (628) are in the labor force, with 5.3% or 25 of them being unemployed. The group with the highest labor force participation rate are those with the educational attainment of college / associate degree, with 95.5% or 148 individuals in the labor force. Within the labor force, individuals with college / associate degree education have the highest percentage of unemployment, with 8.1% or 12 of them being unemployed.
| Educational Attainment | In Labor Force | Unemployed |
| Less than High School | 10 (32.3%) | 0 (0.0%) |
| High School Diploma | 189 (62.4%) | 21 (6.9%) |
| College / Associate Degree | 148 (95.5%) | 13 (8.1%) |
| Bachelor's Degree or higher | 128 (92.1%) | 0 (0.0%) |
| Total | 475 (75.6%) | 33 (5.3%) |
Employment Occupations by Sex in Clymer borough
Management, Business, Science and Arts Occupations
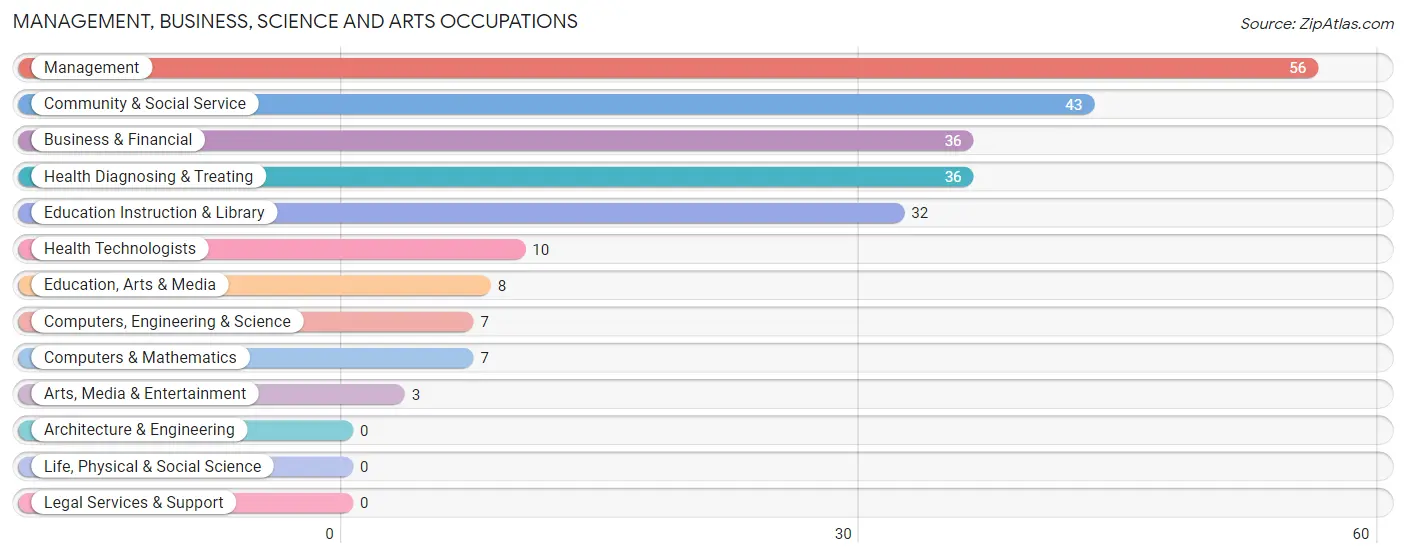
The most common Management, Business, Science and Arts occupations in Clymer borough are Management (56 | 10.8%), Community & Social Service (43 | 8.3%), Business & Financial (36 | 7.0%), Health Diagnosing & Treating (36 | 7.0%), and Education Instruction & Library (32 | 6.2%).
Management, Business, Science and Arts Occupations by Sex
Within the Management, Business, Science and Arts occupations in Clymer borough, the most male-oriented occupations are Computers, Engineering & Science (100.0%), Computers & Mathematics (100.0%), and Education, Arts & Media (100.0%), while the most female-oriented occupations are Arts, Media & Entertainment (100.0%), Health Diagnosing & Treating (100.0%), and Health Technologists (100.0%).
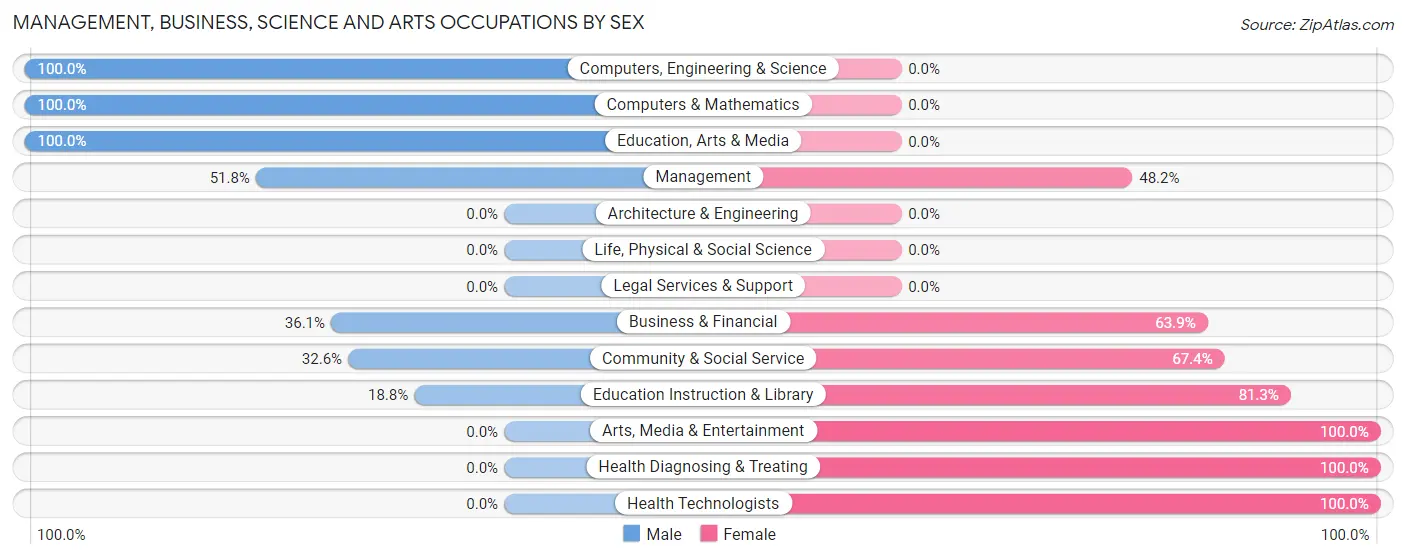
| Occupation | Male | Female |
| Management | 29 (51.8%) | 27 (48.2%) |
| Business & Financial | 13 (36.1%) | 23 (63.9%) |
| Computers, Engineering & Science | 7 (100.0%) | 0 (0.0%) |
| Computers & Mathematics | 7 (100.0%) | 0 (0.0%) |
| Architecture & Engineering | 0 (0.0%) | 0 (0.0%) |
| Life, Physical & Social Science | 0 (0.0%) | 0 (0.0%) |
| Community & Social Service | 14 (32.6%) | 29 (67.4%) |
| Education, Arts & Media | 8 (100.0%) | 0 (0.0%) |
| Legal Services & Support | 0 (0.0%) | 0 (0.0%) |
| Education Instruction & Library | 6 (18.8%) | 26 (81.2%) |
| Arts, Media & Entertainment | 0 (0.0%) | 3 (100.0%) |
| Health Diagnosing & Treating | 0 (0.0%) | 36 (100.0%) |
| Health Technologists | 0 (0.0%) | 10 (100.0%) |
| Total (Category) | 63 (35.4%) | 115 (64.6%) |
| Total (Overall) | 236 (45.7%) | 280 (54.3%) |
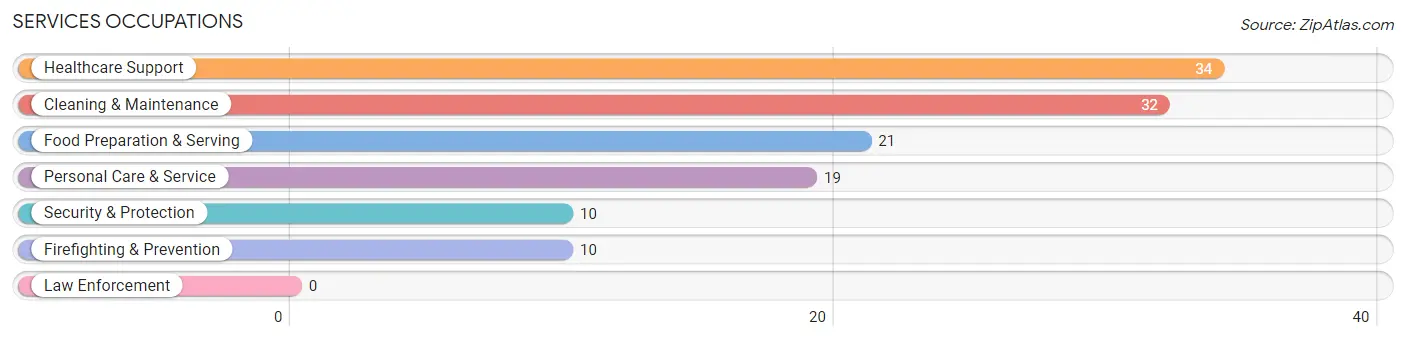
Services Occupations
The most common Services occupations in Clymer borough are Healthcare Support (34 | 6.6%), Cleaning & Maintenance (32 | 6.2%), Food Preparation & Serving (21 | 4.1%), Personal Care & Service (19 | 3.7%), and Security & Protection (10 | 1.9%).
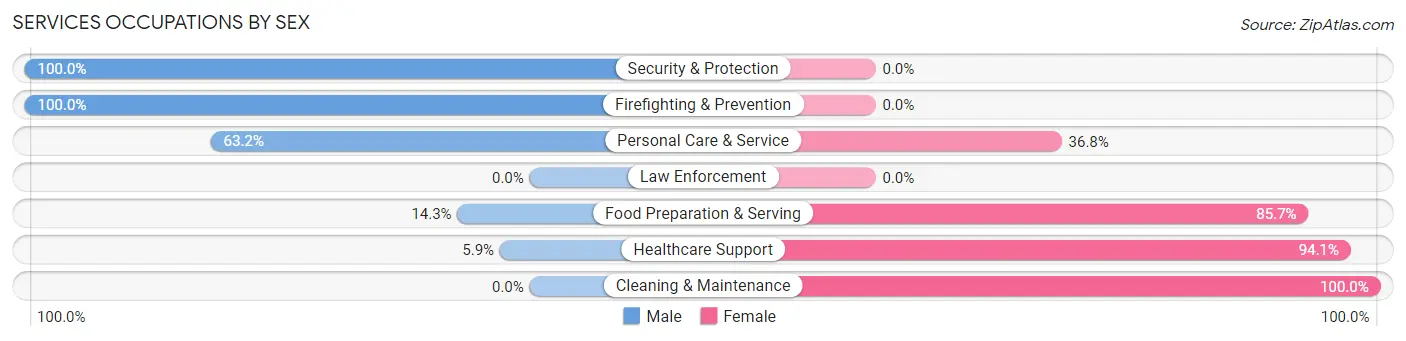
Services Occupations by Sex
Within the Services occupations in Clymer borough, the most male-oriented occupations are Security & Protection (100.0%), Firefighting & Prevention (100.0%), and Personal Care & Service (63.2%), while the most female-oriented occupations are Cleaning & Maintenance (100.0%), Healthcare Support (94.1%), and Food Preparation & Serving (85.7%).
| Occupation | Male | Female |
| Healthcare Support | 2 (5.9%) | 32 (94.1%) |
| Security & Protection | 10 (100.0%) | 0 (0.0%) |
| Firefighting & Prevention | 10 (100.0%) | 0 (0.0%) |
| Law Enforcement | 0 (0.0%) | 0 (0.0%) |
| Food Preparation & Serving | 3 (14.3%) | 18 (85.7%) |
| Cleaning & Maintenance | 0 (0.0%) | 32 (100.0%) |
| Personal Care & Service | 12 (63.2%) | 7 (36.8%) |
| Total (Category) | 27 (23.3%) | 89 (76.7%) |
| Total (Overall) | 236 (45.7%) | 280 (54.3%) |
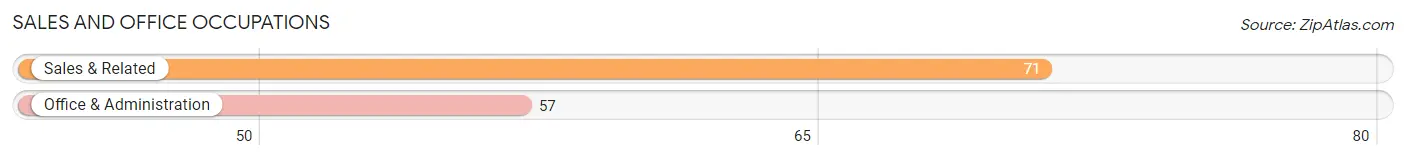
Sales and Office Occupations
The most common Sales and Office occupations in Clymer borough are Sales & Related (71 | 13.8%), and Office & Administration (57 | 11.1%).
Sales and Office Occupations by Sex
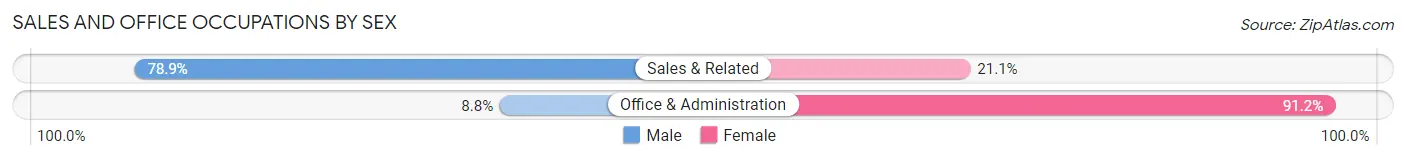
| Occupation | Male | Female |
| Sales & Related | 56 (78.9%) | 15 (21.1%) |
| Office & Administration | 5 (8.8%) | 52 (91.2%) |
| Total (Category) | 61 (47.7%) | 67 (52.3%) |
| Total (Overall) | 236 (45.7%) | 280 (54.3%) |
Natural Resources, Construction and Maintenance Occupations
The most common Natural Resources, Construction and Maintenance occupations in Clymer borough are Construction & Extraction (31 | 6.0%), and Farming, Fishing & Forestry (2 | 0.4%).
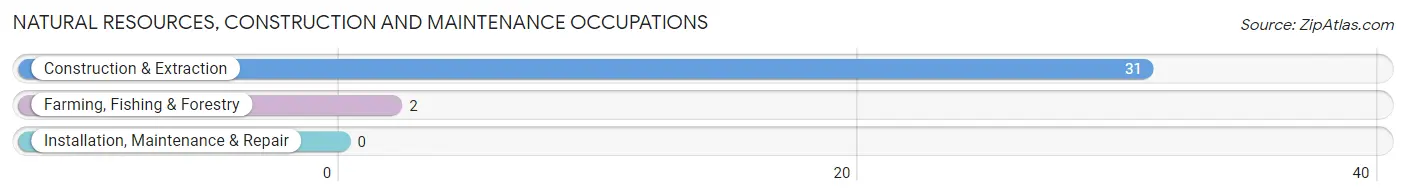
Natural Resources, Construction and Maintenance Occupations by Sex
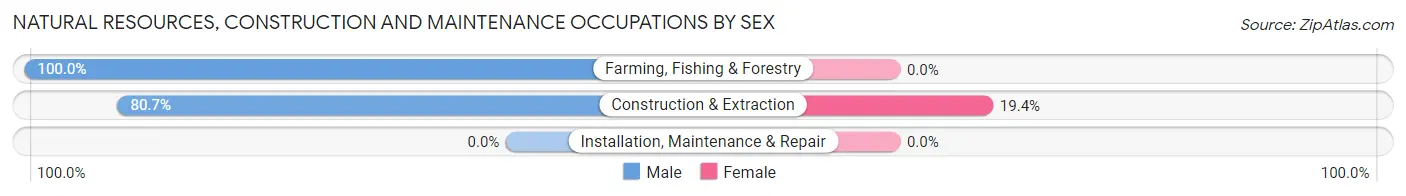
| Occupation | Male | Female |
| Farming, Fishing & Forestry | 2 (100.0%) | 0 (0.0%) |
| Construction & Extraction | 25 (80.6%) | 6 (19.4%) |
| Installation, Maintenance & Repair | 0 (0.0%) | 0 (0.0%) |
| Total (Category) | 27 (81.8%) | 6 (18.2%) |
| Total (Overall) | 236 (45.7%) | 280 (54.3%) |
Production, Transportation and Moving Occupations
The most common Production, Transportation and Moving occupations in Clymer borough are Production (42 | 8.1%), Transportation (16 | 3.1%), and Material Moving (3 | 0.6%).
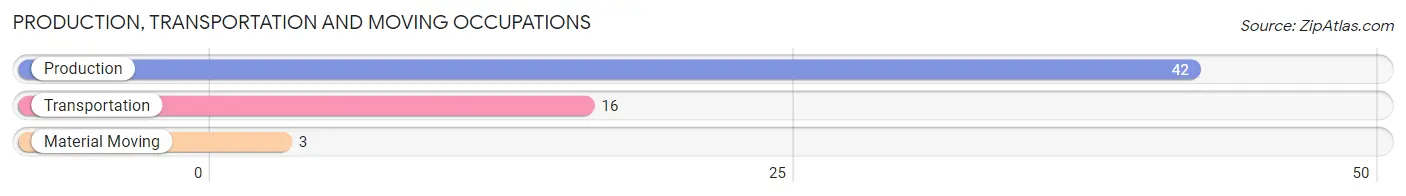
Production, Transportation and Moving Occupations by Sex
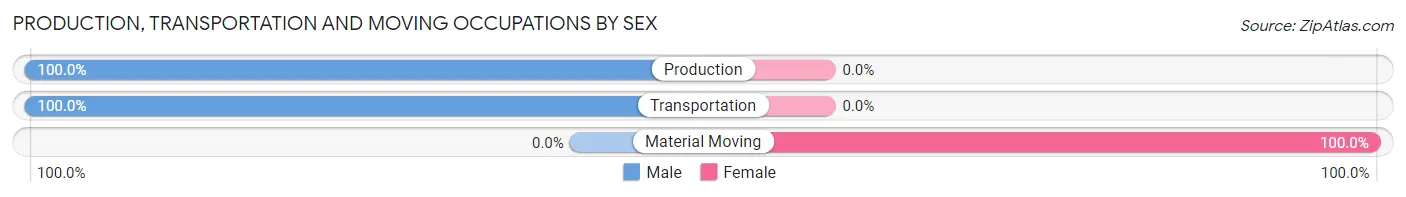
| Occupation | Male | Female |
| Production | 42 (100.0%) | 0 (0.0%) |
| Transportation | 16 (100.0%) | 0 (0.0%) |
| Material Moving | 0 (0.0%) | 3 (100.0%) |
| Total (Category) | 58 (95.1%) | 3 (4.9%) |
| Total (Overall) | 236 (45.7%) | 280 (54.3%) |
Employment Industries by Sex in Clymer borough
Employment Industries in Clymer borough
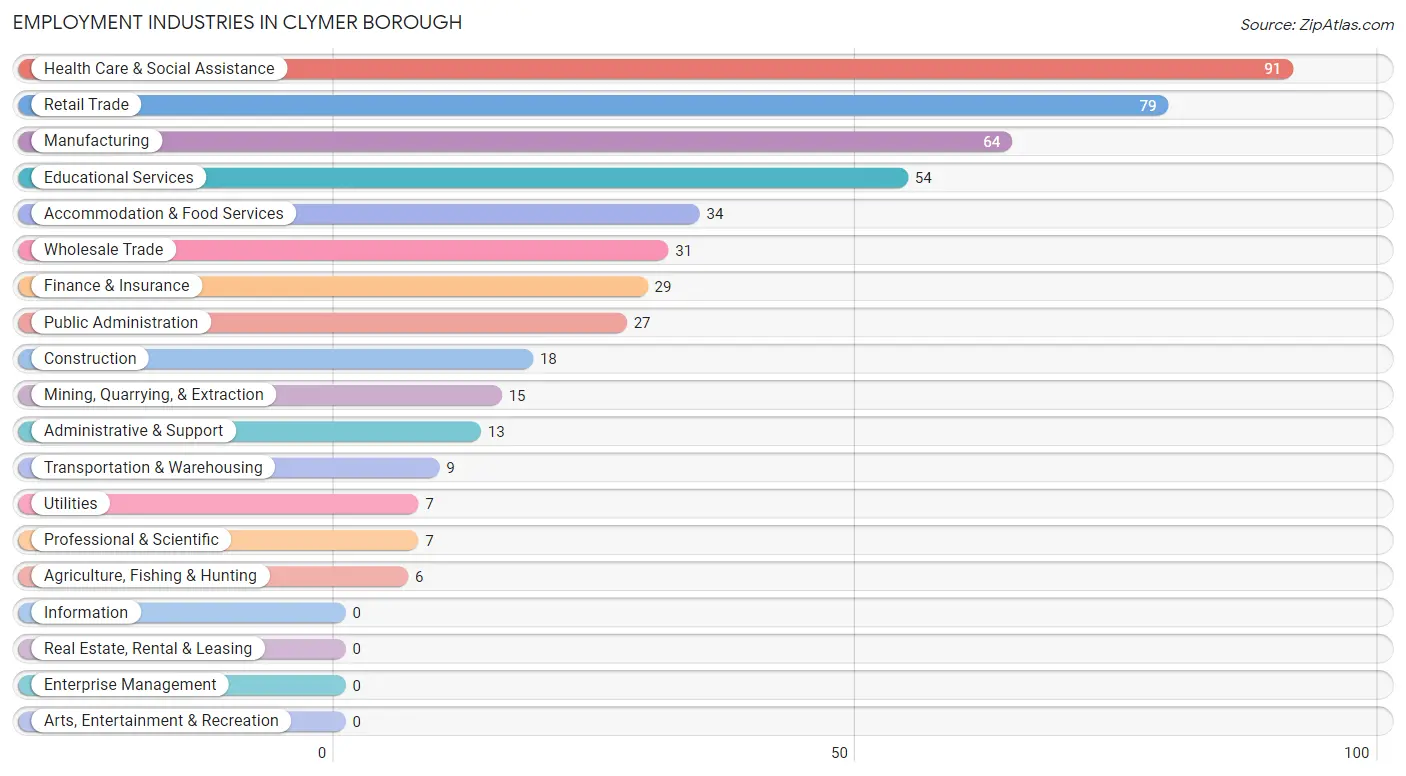
The major employment industries in Clymer borough include Health Care & Social Assistance (91 | 17.6%), Retail Trade (79 | 15.3%), Manufacturing (64 | 12.4%), Educational Services (54 | 10.5%), and Accommodation & Food Services (34 | 6.6%).
Employment Industries by Sex in Clymer borough
The Clymer borough industries that see more men than women are Agriculture, Fishing & Hunting (100.0%), Mining, Quarrying, & Extraction (100.0%), and Wholesale Trade (100.0%), whereas the industries that tend to have a higher number of women are Administrative & Support (100.0%), Educational Services (88.9%), and Health Care & Social Assistance (86.8%).
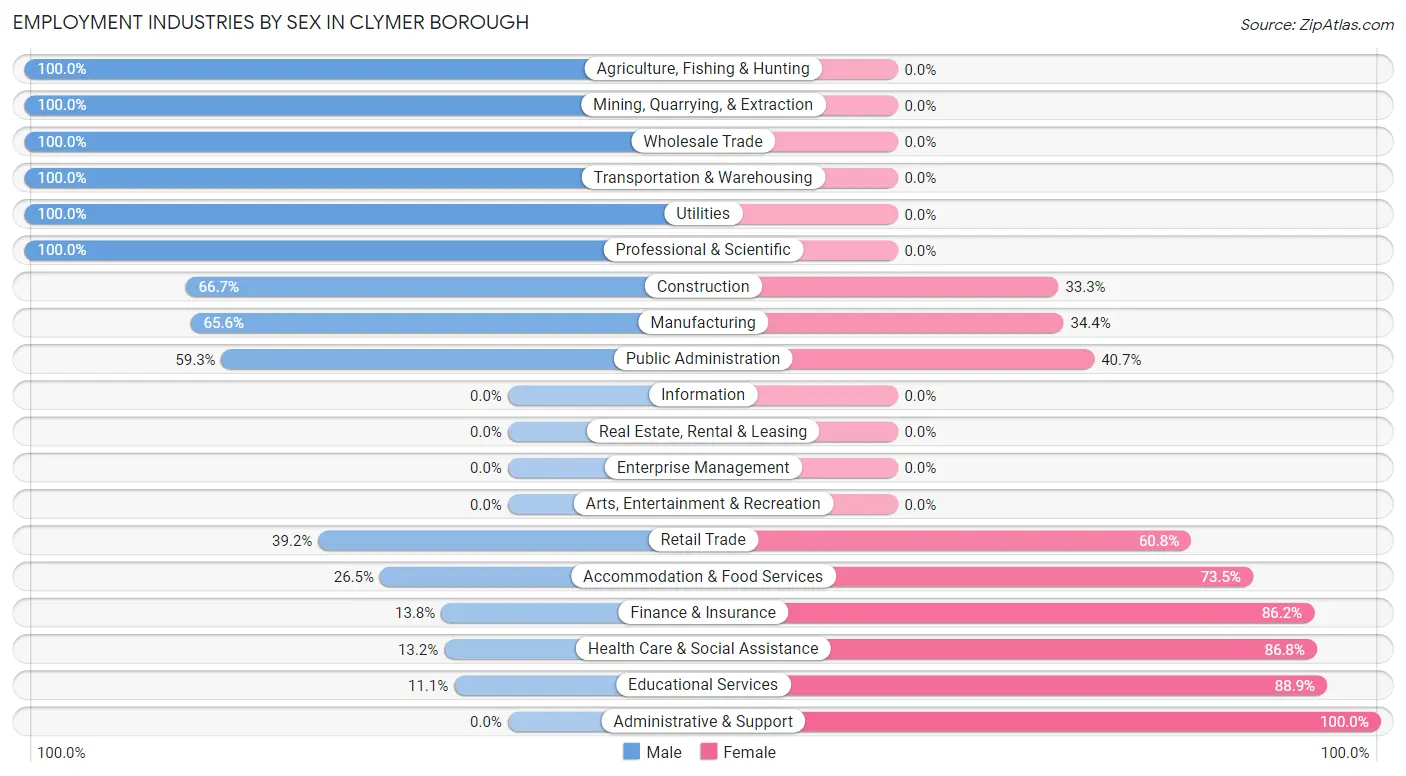
| Industry | Male | Female |
| Agriculture, Fishing & Hunting | 6 (100.0%) | 0 (0.0%) |
| Mining, Quarrying, & Extraction | 15 (100.0%) | 0 (0.0%) |
| Construction | 12 (66.7%) | 6 (33.3%) |
| Manufacturing | 42 (65.6%) | 22 (34.4%) |
| Wholesale Trade | 31 (100.0%) | 0 (0.0%) |
| Retail Trade | 31 (39.2%) | 48 (60.8%) |
| Transportation & Warehousing | 9 (100.0%) | 0 (0.0%) |
| Utilities | 7 (100.0%) | 0 (0.0%) |
| Information | 0 (0.0%) | 0 (0.0%) |
| Finance & Insurance | 4 (13.8%) | 25 (86.2%) |
| Real Estate, Rental & Leasing | 0 (0.0%) | 0 (0.0%) |
| Professional & Scientific | 7 (100.0%) | 0 (0.0%) |
| Enterprise Management | 0 (0.0%) | 0 (0.0%) |
| Administrative & Support | 0 (0.0%) | 13 (100.0%) |
| Educational Services | 6 (11.1%) | 48 (88.9%) |
| Health Care & Social Assistance | 12 (13.2%) | 79 (86.8%) |
| Arts, Entertainment & Recreation | 0 (0.0%) | 0 (0.0%) |
| Accommodation & Food Services | 9 (26.5%) | 25 (73.5%) |
| Public Administration | 16 (59.3%) | 11 (40.7%) |
| Total | 236 (45.7%) | 280 (54.3%) |
Education in Clymer borough
School Enrollment in Clymer borough
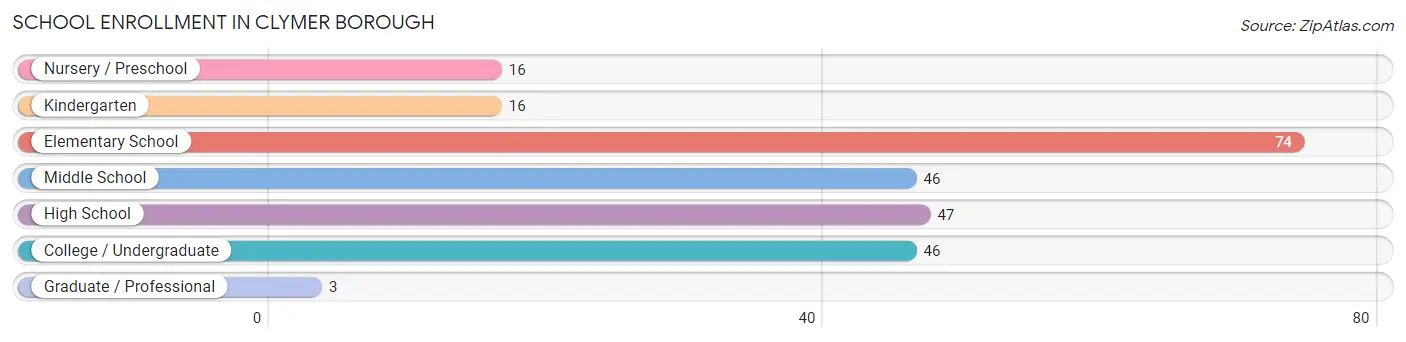
The most common levels of schooling among the 248 students in Clymer borough are elementary school (74 | 29.8%), high school (47 | 19.0%), and middle school (46 | 18.5%).
| School Level | # Students | % Students |
| Nursery / Preschool | 16 | 6.5% |
| Kindergarten | 16 | 6.5% |
| Elementary School | 74 | 29.8% |
| Middle School | 46 | 18.5% |
| High School | 47 | 19.0% |
| College / Undergraduate | 46 | 18.5% |
| Graduate / Professional | 3 | 1.2% |
| Total | 248 | 100.0% |
School Enrollment by Age by Funding Source in Clymer borough
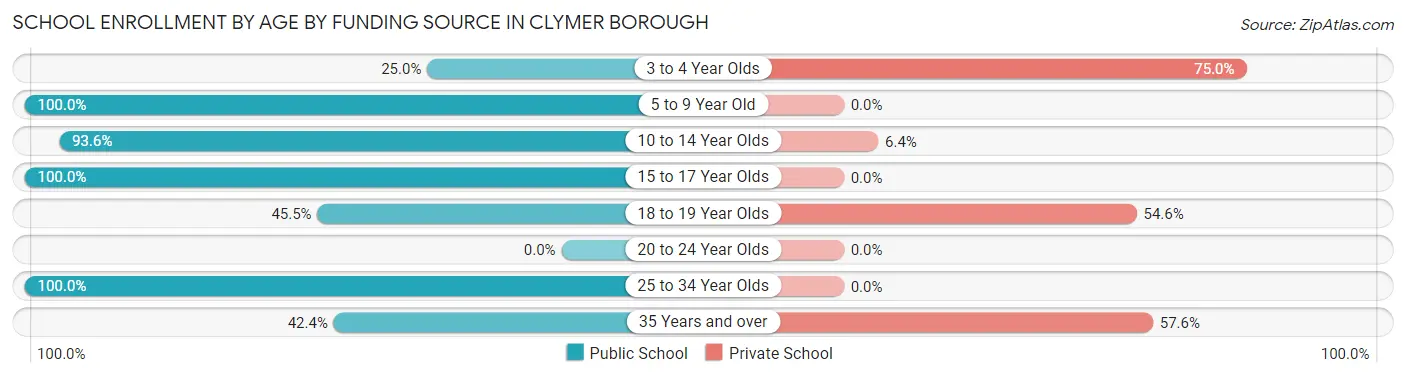
Out of a total of 248 students who are enrolled in schools in Clymer borough, 36 (14.5%) attend a private institution, while the remaining 212 (85.5%) are enrolled in public schools. The age group of 3 to 4 year olds has the highest likelihood of being enrolled in private schools, with 6 (75.0% in the age bracket) enrolled. Conversely, the age group of 5 to 9 year old has the lowest likelihood of being enrolled in a private school, with 73 (100.0% in the age bracket) attending a public institution.
| Age Bracket | Public School | Private School |
| 3 to 4 Year Olds | 2 (25.0%) | 6 (75.0%) |
| 5 to 9 Year Old | 73 (100.0%) | 0 (0.0%) |
| 10 to 14 Year Olds | 73 (93.6%) | 5 (6.4%) |
| 15 to 17 Year Olds | 40 (100.0%) | 0 (0.0%) |
| 18 to 19 Year Olds | 5 (45.5%) | 6 (54.5%) |
| 20 to 24 Year Olds | 0 (0.0%) | 0 (0.0%) |
| 25 to 34 Year Olds | 5 (100.0%) | 0 (0.0%) |
| 35 Years and over | 14 (42.4%) | 19 (57.6%) |
| Total | 212 (85.5%) | 36 (14.5%) |
Educational Attainment by Field of Study in Clymer borough
Education (49 | 31.4%), business (32 | 20.5%), science & technology (21 | 13.5%), physical & health sciences (19 | 12.2%), and literature & languages (14 | 9.0%) are the most common fields of study among 156 individuals in Clymer borough who have obtained a bachelor's degree or higher.
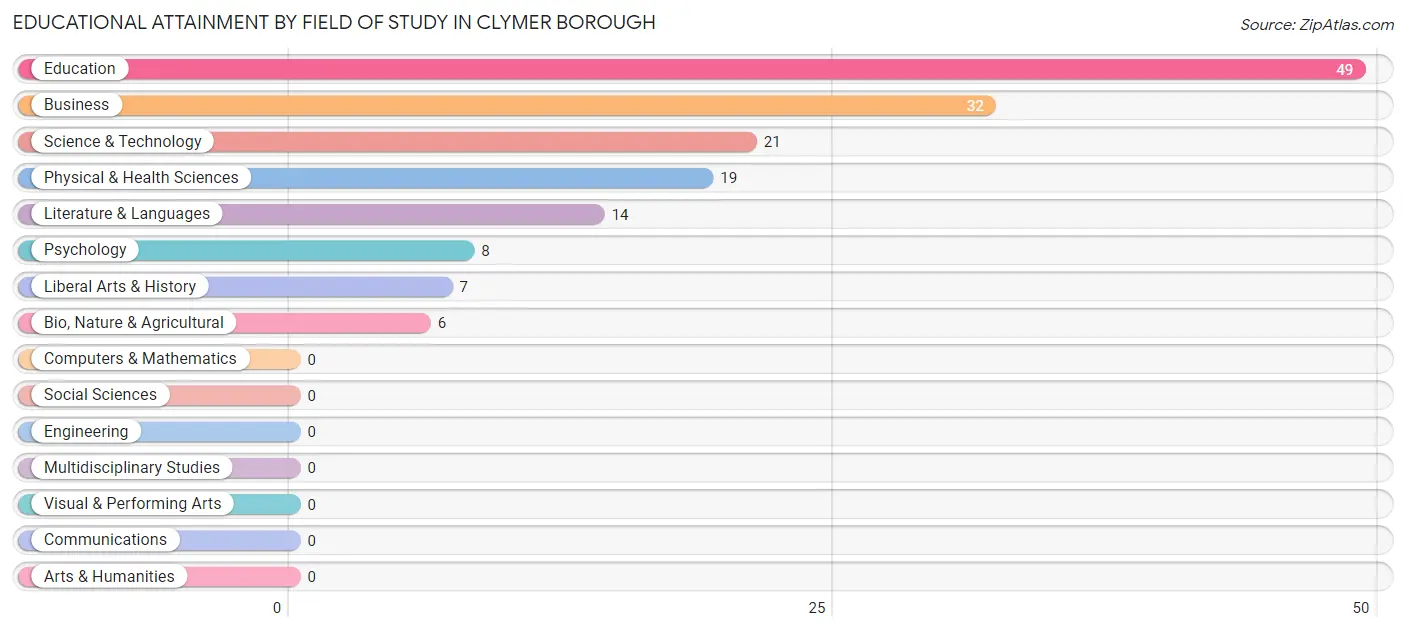
| Field of Study | # Graduates | % Graduates |
| Computers & Mathematics | 0 | 0.0% |
| Bio, Nature & Agricultural | 6 | 3.8% |
| Physical & Health Sciences | 19 | 12.2% |
| Psychology | 8 | 5.1% |
| Social Sciences | 0 | 0.0% |
| Engineering | 0 | 0.0% |
| Multidisciplinary Studies | 0 | 0.0% |
| Science & Technology | 21 | 13.5% |
| Business | 32 | 20.5% |
| Education | 49 | 31.4% |
| Literature & Languages | 14 | 9.0% |
| Liberal Arts & History | 7 | 4.5% |
| Visual & Performing Arts | 0 | 0.0% |
| Communications | 0 | 0.0% |
| Arts & Humanities | 0 | 0.0% |
| Total | 156 | 100.0% |
Transportation & Commute in Clymer borough
Vehicle Availability by Sex in Clymer borough
The most prevalent vehicle ownership categories in Clymer borough are males with 2 vehicles (109, accounting for 47.0%) and females with 2 vehicles (141, making up 40.8%).
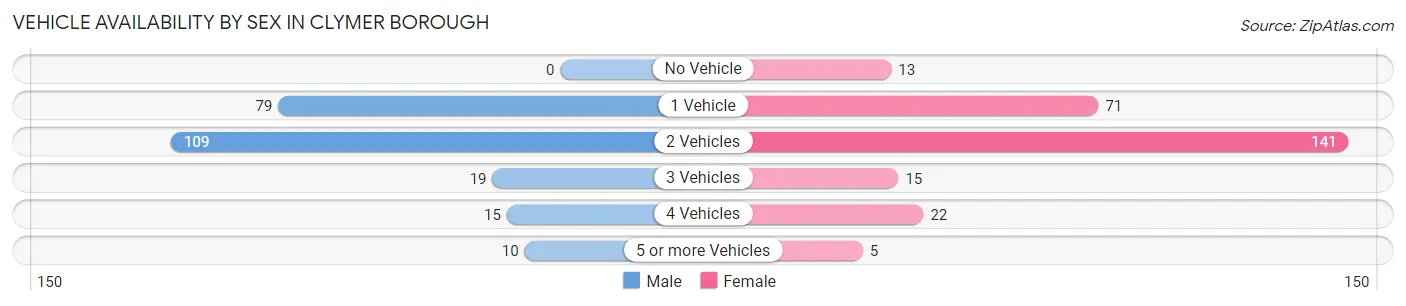
| Vehicles Available | Male | Female |
| No Vehicle | 0 (0.0%) | 13 (4.9%) |
| 1 Vehicle | 79 (34.1%) | 71 (26.6%) |
| 2 Vehicles | 109 (47.0%) | 141 (52.8%) |
| 3 Vehicles | 19 (8.2%) | 15 (5.6%) |
| 4 Vehicles | 15 (6.5%) | 22 (8.2%) |
| 5 or more Vehicles | 10 (4.3%) | 5 (1.9%) |
| Total | 232 (100.0%) | 267 (100.0%) |
Commute Time in Clymer borough
The most frequently occuring commute durations in Clymer borough are 15 to 19 minutes (91 commuters, 18.8%), 20 to 24 minutes (79 commuters, 16.3%), and 10 to 14 minutes (73 commuters, 15.1%).
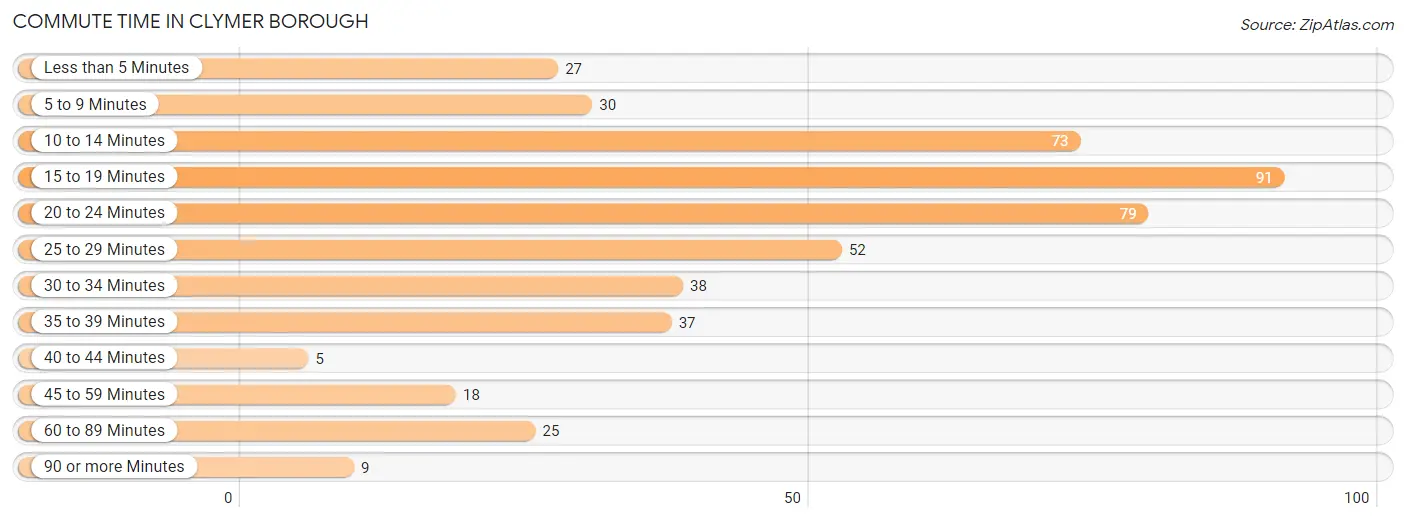
| Commute Time | # Commuters | % Commuters |
| Less than 5 Minutes | 27 | 5.6% |
| 5 to 9 Minutes | 30 | 6.2% |
| 10 to 14 Minutes | 73 | 15.1% |
| 15 to 19 Minutes | 91 | 18.8% |
| 20 to 24 Minutes | 79 | 16.3% |
| 25 to 29 Minutes | 52 | 10.7% |
| 30 to 34 Minutes | 38 | 7.9% |
| 35 to 39 Minutes | 37 | 7.6% |
| 40 to 44 Minutes | 5 | 1.0% |
| 45 to 59 Minutes | 18 | 3.7% |
| 60 to 89 Minutes | 25 | 5.2% |
| 90 or more Minutes | 9 | 1.9% |
Commute Time by Sex in Clymer borough
The most common commute times in Clymer borough are 10 to 14 minutes (54 commuters, 24.0%) for males and 15 to 19 minutes (59 commuters, 22.8%) for females.
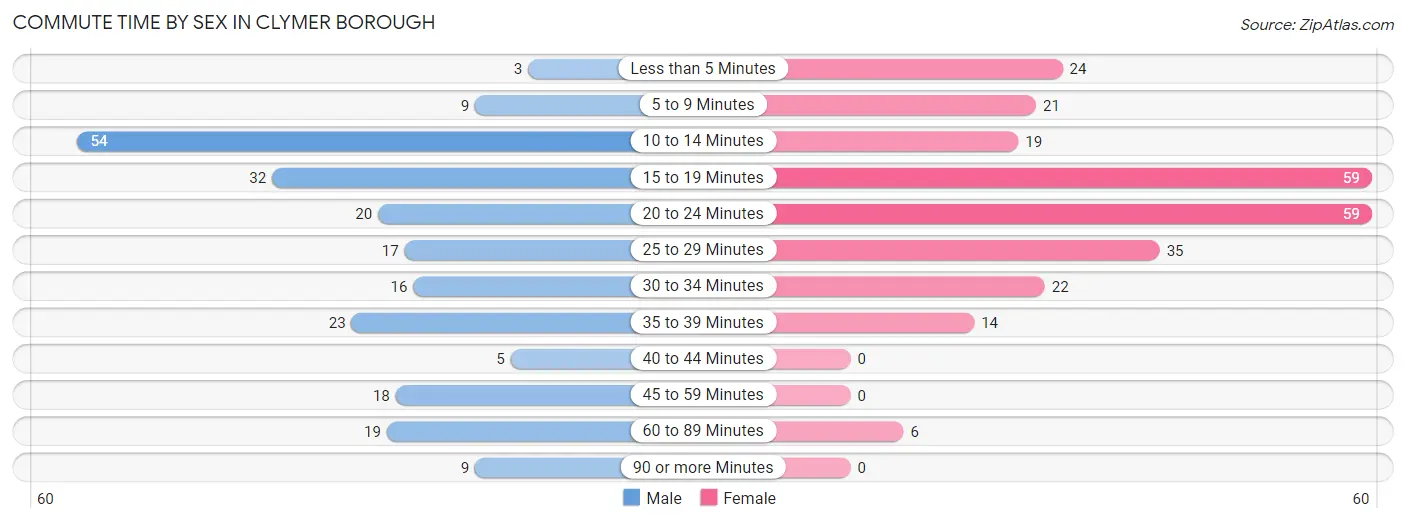
| Commute Time | Male | Female |
| Less than 5 Minutes | 3 (1.3%) | 24 (9.3%) |
| 5 to 9 Minutes | 9 (4.0%) | 21 (8.1%) |
| 10 to 14 Minutes | 54 (24.0%) | 19 (7.3%) |
| 15 to 19 Minutes | 32 (14.2%) | 59 (22.8%) |
| 20 to 24 Minutes | 20 (8.9%) | 59 (22.8%) |
| 25 to 29 Minutes | 17 (7.6%) | 35 (13.5%) |
| 30 to 34 Minutes | 16 (7.1%) | 22 (8.5%) |
| 35 to 39 Minutes | 23 (10.2%) | 14 (5.4%) |
| 40 to 44 Minutes | 5 (2.2%) | 0 (0.0%) |
| 45 to 59 Minutes | 18 (8.0%) | 0 (0.0%) |
| 60 to 89 Minutes | 19 (8.4%) | 6 (2.3%) |
| 90 or more Minutes | 9 (4.0%) | 0 (0.0%) |
Time of Departure to Work by Sex in Clymer borough
The most frequent times of departure to work in Clymer borough are 12:00 PM to 3:59 PM (51, 22.7%) for males and 6:30 AM to 6:59 AM (71, 27.4%) for females.
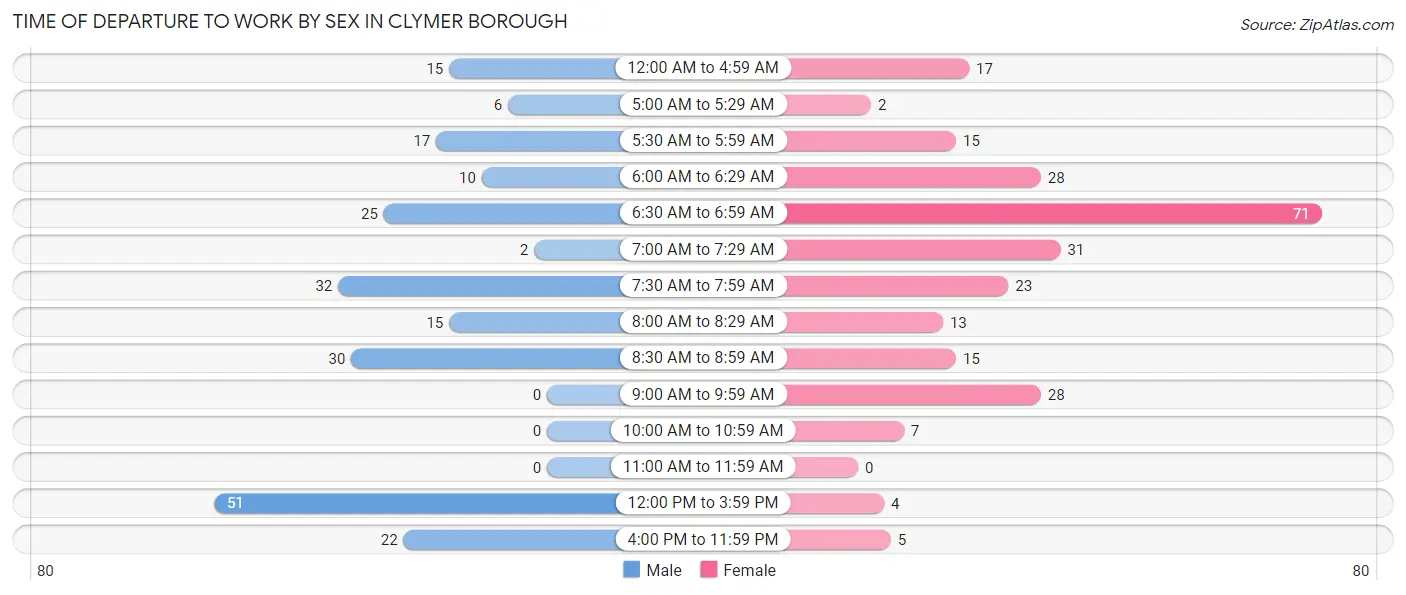
| Time of Departure | Male | Female |
| 12:00 AM to 4:59 AM | 15 (6.7%) | 17 (6.6%) |
| 5:00 AM to 5:29 AM | 6 (2.7%) | 2 (0.8%) |
| 5:30 AM to 5:59 AM | 17 (7.6%) | 15 (5.8%) |
| 6:00 AM to 6:29 AM | 10 (4.4%) | 28 (10.8%) |
| 6:30 AM to 6:59 AM | 25 (11.1%) | 71 (27.4%) |
| 7:00 AM to 7:29 AM | 2 (0.9%) | 31 (12.0%) |
| 7:30 AM to 7:59 AM | 32 (14.2%) | 23 (8.9%) |
| 8:00 AM to 8:29 AM | 15 (6.7%) | 13 (5.0%) |
| 8:30 AM to 8:59 AM | 30 (13.3%) | 15 (5.8%) |
| 9:00 AM to 9:59 AM | 0 (0.0%) | 28 (10.8%) |
| 10:00 AM to 10:59 AM | 0 (0.0%) | 7 (2.7%) |
| 11:00 AM to 11:59 AM | 0 (0.0%) | 0 (0.0%) |
| 12:00 PM to 3:59 PM | 51 (22.7%) | 4 (1.5%) |
| 4:00 PM to 11:59 PM | 22 (9.8%) | 5 (1.9%) |
| Total | 225 (100.0%) | 259 (100.0%) |
Housing Occupancy in Clymer borough
Occupancy by Ownership in Clymer borough
Of the total 518 dwellings in Clymer borough, owner-occupied units account for 321 (62.0%), while renter-occupied units make up 197 (38.0%).
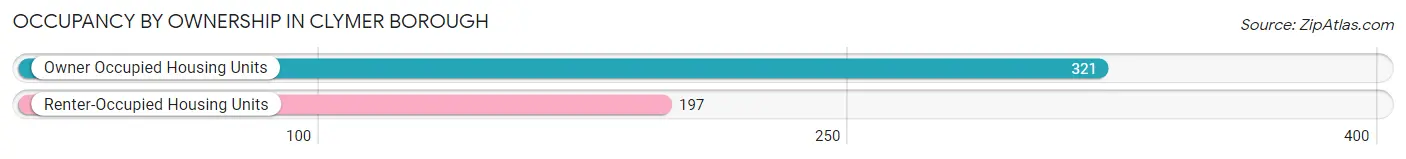
| Occupancy | # Housing Units | % Housing Units |
| Owner Occupied Housing Units | 321 | 62.0% |
| Renter-Occupied Housing Units | 197 | 38.0% |
| Total Occupied Housing Units | 518 | 100.0% |
Occupancy by Household Size in Clymer borough
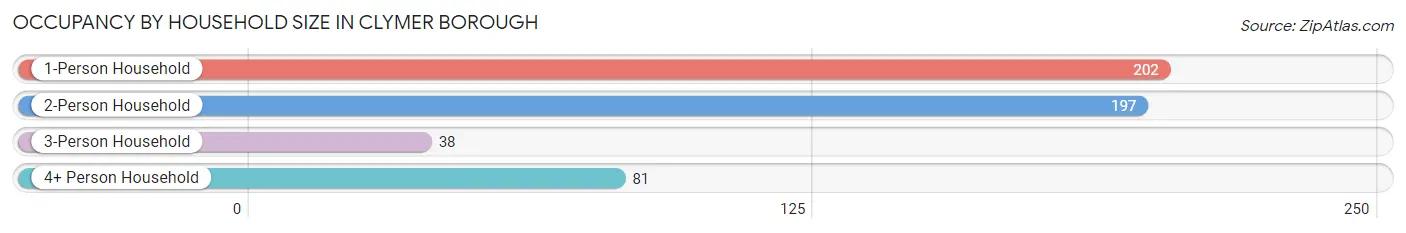
| Household Size | # Housing Units | % Housing Units |
| 1-Person Household | 202 | 39.0% |
| 2-Person Household | 197 | 38.0% |
| 3-Person Household | 38 | 7.3% |
| 4+ Person Household | 81 | 15.6% |
| Total Housing Units | 518 | 100.0% |
Occupancy by Ownership by Household Size in Clymer borough
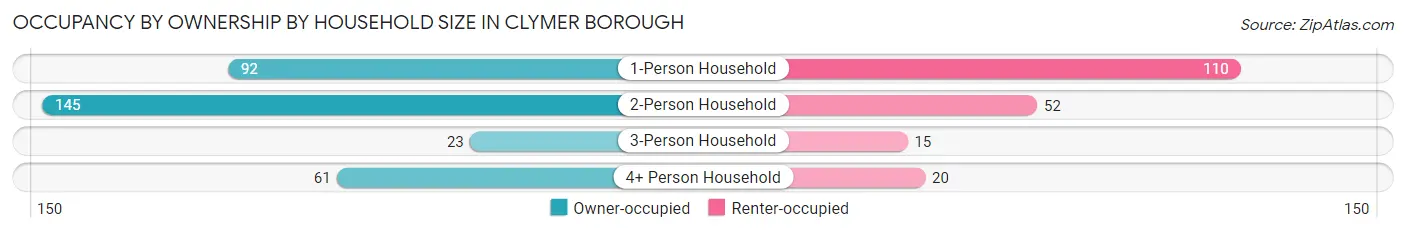
| Household Size | Owner-occupied | Renter-occupied |
| 1-Person Household | 92 (45.5%) | 110 (54.5%) |
| 2-Person Household | 145 (73.6%) | 52 (26.4%) |
| 3-Person Household | 23 (60.5%) | 15 (39.5%) |
| 4+ Person Household | 61 (75.3%) | 20 (24.7%) |
| Total Housing Units | 321 (62.0%) | 197 (38.0%) |
Occupancy by Educational Attainment in Clymer borough
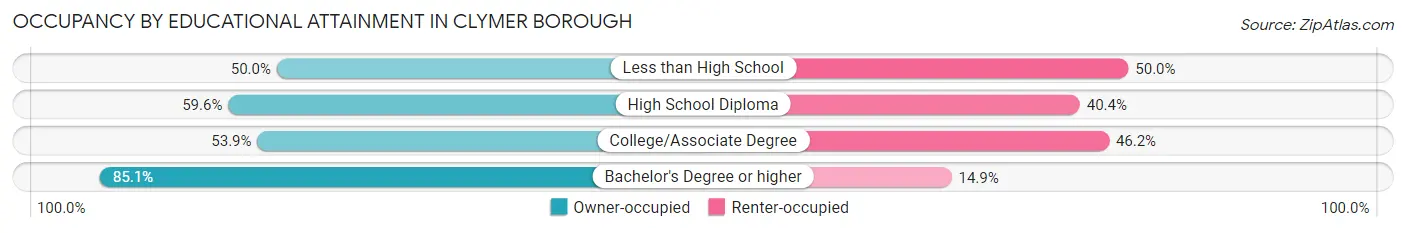
| Household Size | Owner-occupied | Renter-occupied |
| Less than High School | 9 (50.0%) | 9 (50.0%) |
| High School Diploma | 161 (59.6%) | 109 (40.4%) |
| College/Associate Degree | 77 (53.8%) | 66 (46.2%) |
| Bachelor's Degree or higher | 74 (85.1%) | 13 (14.9%) |
Occupancy by Age of Householder in Clymer borough
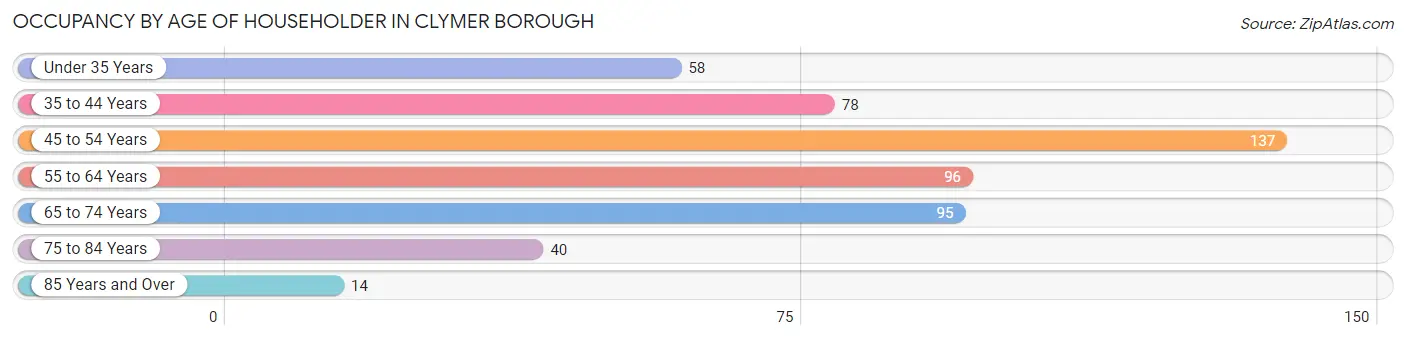
| Age Bracket | # Households | % Households |
| Under 35 Years | 58 | 11.2% |
| 35 to 44 Years | 78 | 15.1% |
| 45 to 54 Years | 137 | 26.5% |
| 55 to 64 Years | 96 | 18.5% |
| 65 to 74 Years | 95 | 18.3% |
| 75 to 84 Years | 40 | 7.7% |
| 85 Years and Over | 14 | 2.7% |
| Total | 518 | 100.0% |
Housing Finances in Clymer borough
Median Income by Occupancy in Clymer borough
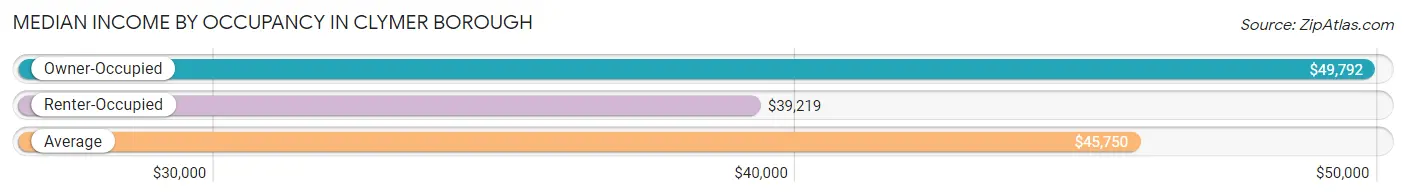
| Occupancy Type | # Households | Median Income |
| Owner-Occupied | 321 (62.0%) | $49,792 |
| Renter-Occupied | 197 (38.0%) | $39,219 |
| Average | 518 (100.0%) | $45,750 |
Occupancy by Householder Income Bracket in Clymer borough
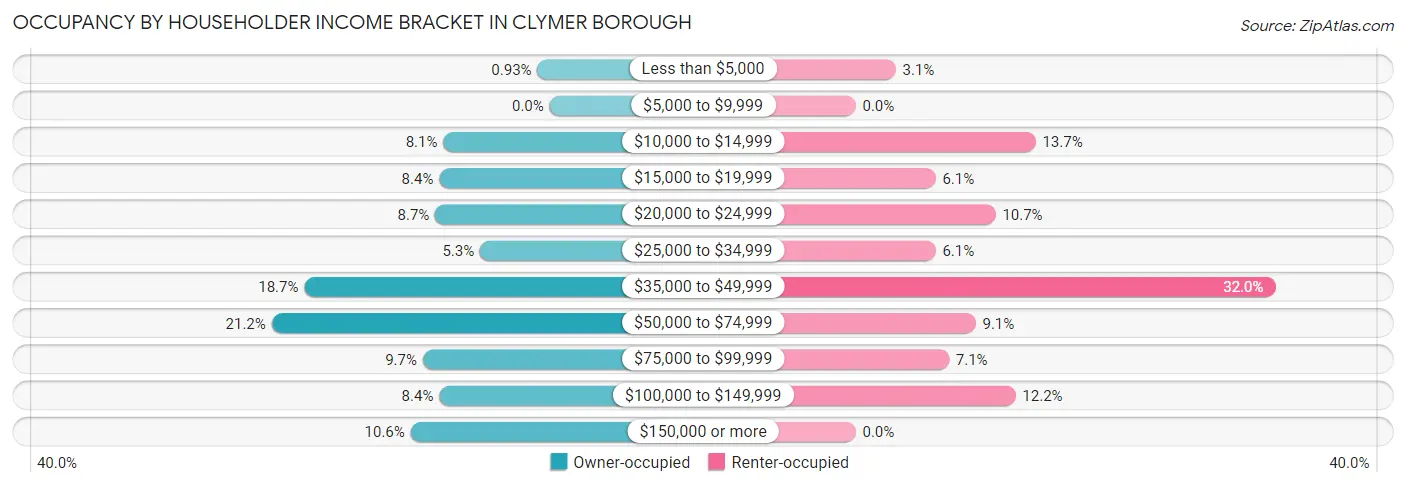
| Income Bracket | Owner-occupied | Renter-occupied |
| Less than $5,000 | 3 (0.9%) | 6 (3.0%) |
| $5,000 to $9,999 | 0 (0.0%) | 0 (0.0%) |
| $10,000 to $14,999 | 26 (8.1%) | 27 (13.7%) |
| $15,000 to $19,999 | 27 (8.4%) | 12 (6.1%) |
| $20,000 to $24,999 | 28 (8.7%) | 21 (10.7%) |
| $25,000 to $34,999 | 17 (5.3%) | 12 (6.1%) |
| $35,000 to $49,999 | 60 (18.7%) | 63 (32.0%) |
| $50,000 to $74,999 | 68 (21.2%) | 18 (9.1%) |
| $75,000 to $99,999 | 31 (9.7%) | 14 (7.1%) |
| $100,000 to $149,999 | 27 (8.4%) | 24 (12.2%) |
| $150,000 or more | 34 (10.6%) | 0 (0.0%) |
| Total | 321 (100.0%) | 197 (100.0%) |
Monthly Housing Cost Tiers in Clymer borough
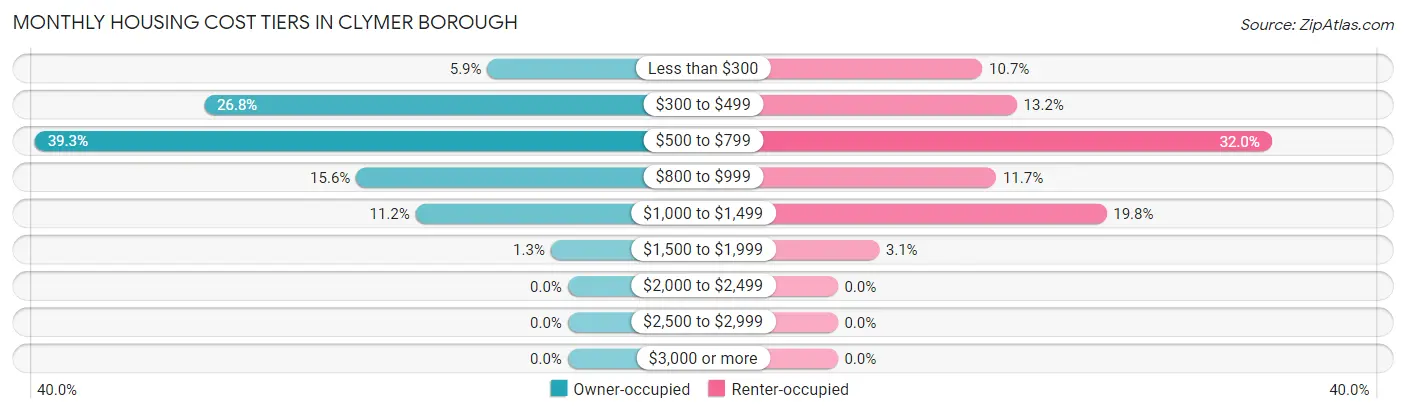
| Monthly Cost | Owner-occupied | Renter-occupied |
| Less than $300 | 19 (5.9%) | 21 (10.7%) |
| $300 to $499 | 86 (26.8%) | 26 (13.2%) |
| $500 to $799 | 126 (39.3%) | 63 (32.0%) |
| $800 to $999 | 50 (15.6%) | 23 (11.7%) |
| $1,000 to $1,499 | 36 (11.2%) | 39 (19.8%) |
| $1,500 to $1,999 | 4 (1.3%) | 6 (3.0%) |
| $2,000 to $2,499 | 0 (0.0%) | 0 (0.0%) |
| $2,500 to $2,999 | 0 (0.0%) | 0 (0.0%) |
| $3,000 or more | 0 (0.0%) | 0 (0.0%) |
| Total | 321 (100.0%) | 197 (100.0%) |
Physical Housing Characteristics in Clymer borough
Housing Structures in Clymer borough
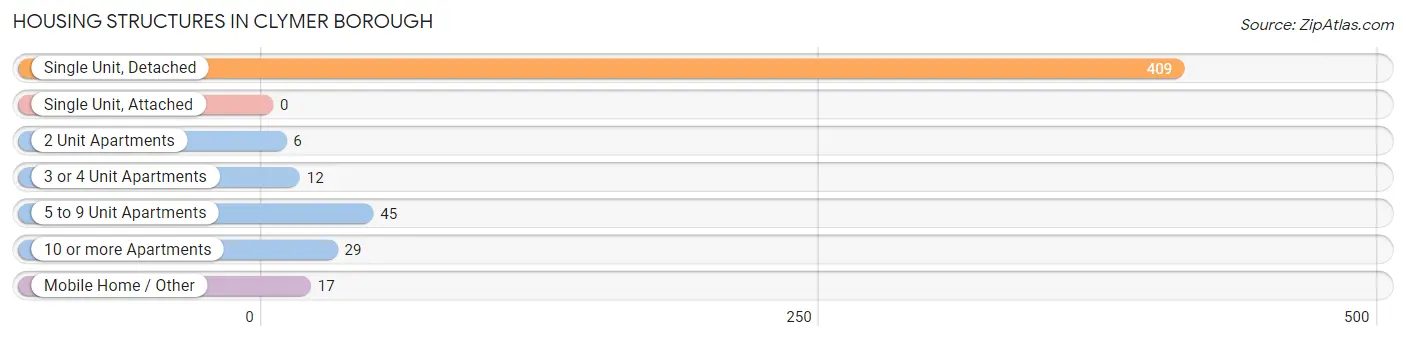
| Structure Type | # Housing Units | % Housing Units |
| Single Unit, Detached | 409 | 79.0% |
| Single Unit, Attached | 0 | 0.0% |
| 2 Unit Apartments | 6 | 1.2% |
| 3 or 4 Unit Apartments | 12 | 2.3% |
| 5 to 9 Unit Apartments | 45 | 8.7% |
| 10 or more Apartments | 29 | 5.6% |
| Mobile Home / Other | 17 | 3.3% |
| Total | 518 | 100.0% |
Housing Structures by Occupancy in Clymer borough
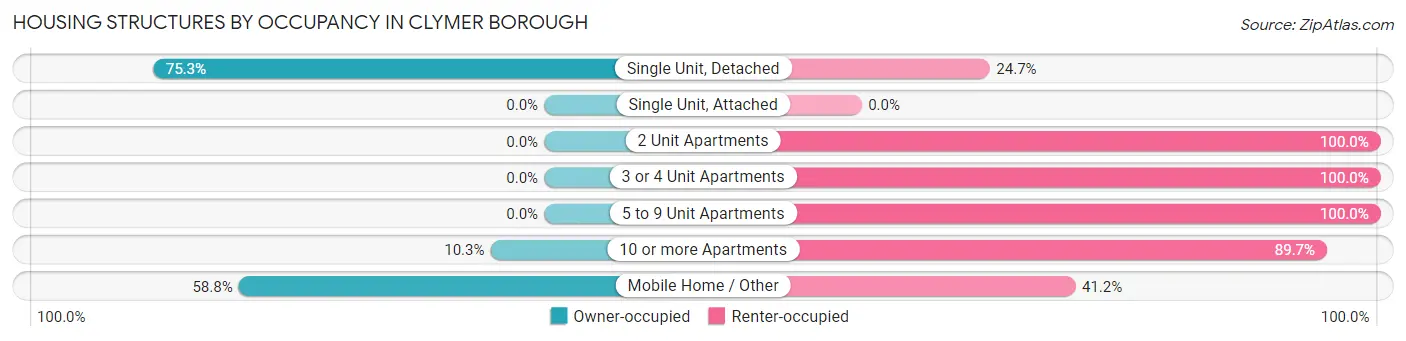
| Structure Type | Owner-occupied | Renter-occupied |
| Single Unit, Detached | 308 (75.3%) | 101 (24.7%) |
| Single Unit, Attached | 0 (0.0%) | 0 (0.0%) |
| 2 Unit Apartments | 0 (0.0%) | 6 (100.0%) |
| 3 or 4 Unit Apartments | 0 (0.0%) | 12 (100.0%) |
| 5 to 9 Unit Apartments | 0 (0.0%) | 45 (100.0%) |
| 10 or more Apartments | 3 (10.3%) | 26 (89.7%) |
| Mobile Home / Other | 10 (58.8%) | 7 (41.2%) |
| Total | 321 (62.0%) | 197 (38.0%) |
Housing Structures by Number of Rooms in Clymer borough
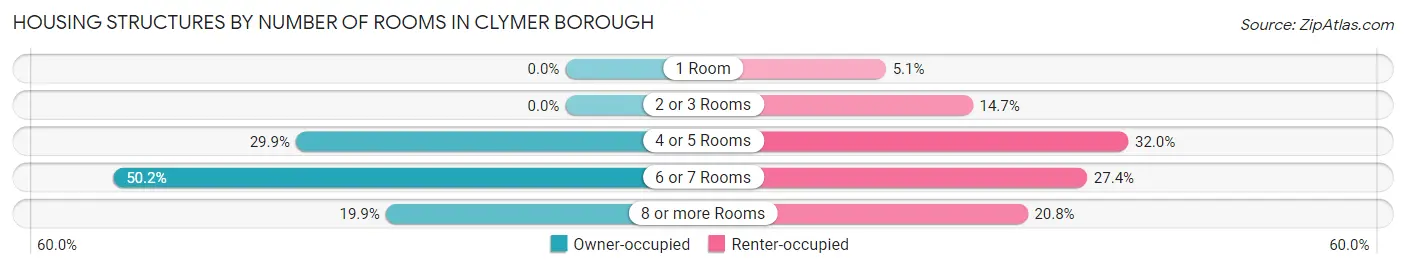
| Number of Rooms | Owner-occupied | Renter-occupied |
| 1 Room | 0 (0.0%) | 10 (5.1%) |
| 2 or 3 Rooms | 0 (0.0%) | 29 (14.7%) |
| 4 or 5 Rooms | 96 (29.9%) | 63 (32.0%) |
| 6 or 7 Rooms | 161 (50.2%) | 54 (27.4%) |
| 8 or more Rooms | 64 (19.9%) | 41 (20.8%) |
| Total | 321 (100.0%) | 197 (100.0%) |
Housing Structure by Heating Type in Clymer borough
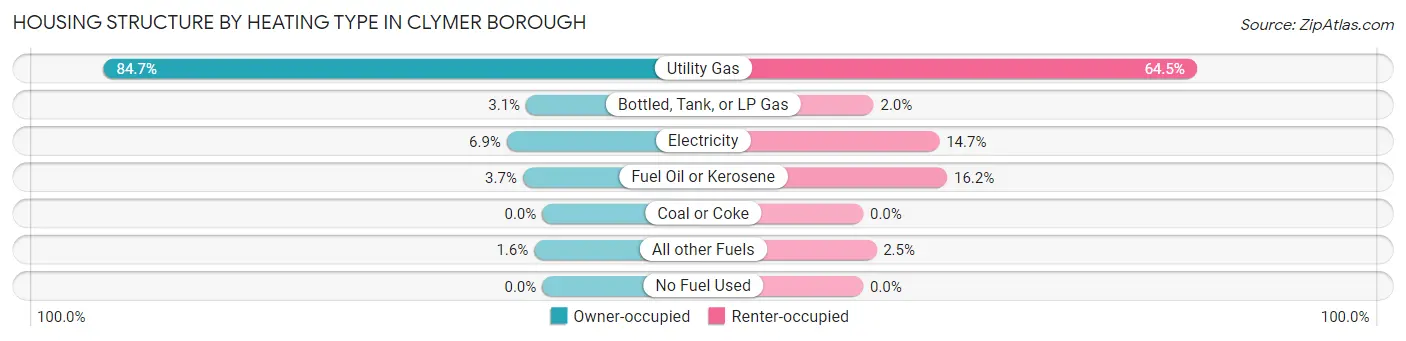
| Heating Type | Owner-occupied | Renter-occupied |
| Utility Gas | 272 (84.7%) | 127 (64.5%) |
| Bottled, Tank, or LP Gas | 10 (3.1%) | 4 (2.0%) |
| Electricity | 22 (6.9%) | 29 (14.7%) |
| Fuel Oil or Kerosene | 12 (3.7%) | 32 (16.2%) |
| Coal or Coke | 0 (0.0%) | 0 (0.0%) |
| All other Fuels | 5 (1.6%) | 5 (2.5%) |
| No Fuel Used | 0 (0.0%) | 0 (0.0%) |
| Total | 321 (100.0%) | 197 (100.0%) |
Household Vehicle Usage in Clymer borough
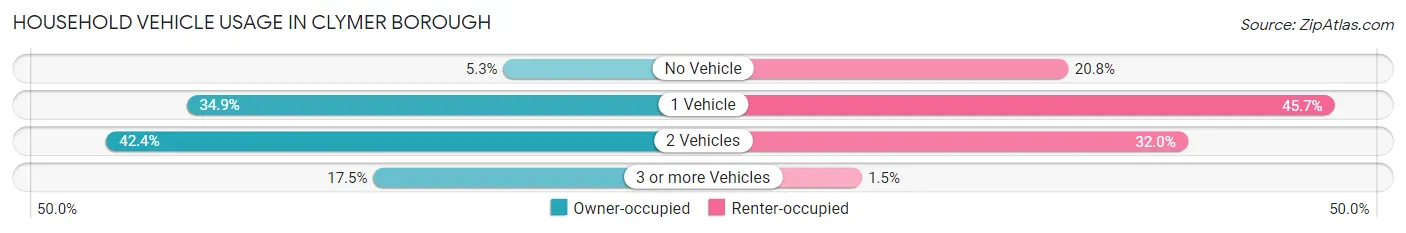
| Vehicles per Household | Owner-occupied | Renter-occupied |
| No Vehicle | 17 (5.3%) | 41 (20.8%) |
| 1 Vehicle | 112 (34.9%) | 90 (45.7%) |
| 2 Vehicles | 136 (42.4%) | 63 (32.0%) |
| 3 or more Vehicles | 56 (17.4%) | 3 (1.5%) |
| Total | 321 (100.0%) | 197 (100.0%) |
Real Estate & Mortgages in Clymer borough
Real Estate and Mortgage Overview in Clymer borough
| Characteristic | Without Mortgage | With Mortgage |
| Housing Units | 178 | 143 |
| Median Property Value | $77,100 | $87,900 |
| Median Household Income | $47,143 | $8 |
| Monthly Housing Costs | $479 | $0 |
| Real Estate Taxes | $1,330 | $0 |
Property Value by Mortgage Status in Clymer borough
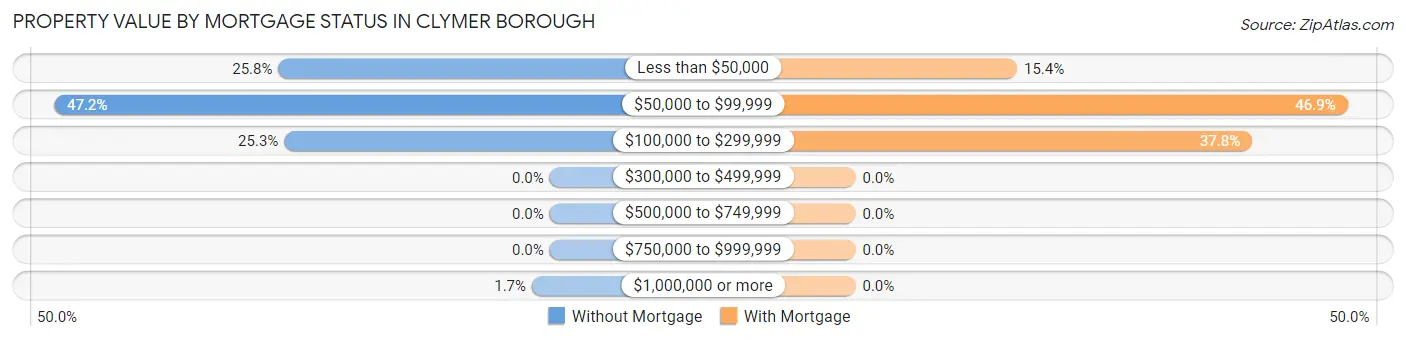
| Property Value | Without Mortgage | With Mortgage |
| Less than $50,000 | 46 (25.8%) | 22 (15.4%) |
| $50,000 to $99,999 | 84 (47.2%) | 67 (46.9%) |
| $100,000 to $299,999 | 45 (25.3%) | 54 (37.8%) |
| $300,000 to $499,999 | 0 (0.0%) | 0 (0.0%) |
| $500,000 to $749,999 | 0 (0.0%) | 0 (0.0%) |
| $750,000 to $999,999 | 0 (0.0%) | 0 (0.0%) |
| $1,000,000 or more | 3 (1.7%) | 0 (0.0%) |
| Total | 178 (100.0%) | 143 (100.0%) |
Household Income by Mortgage Status in Clymer borough
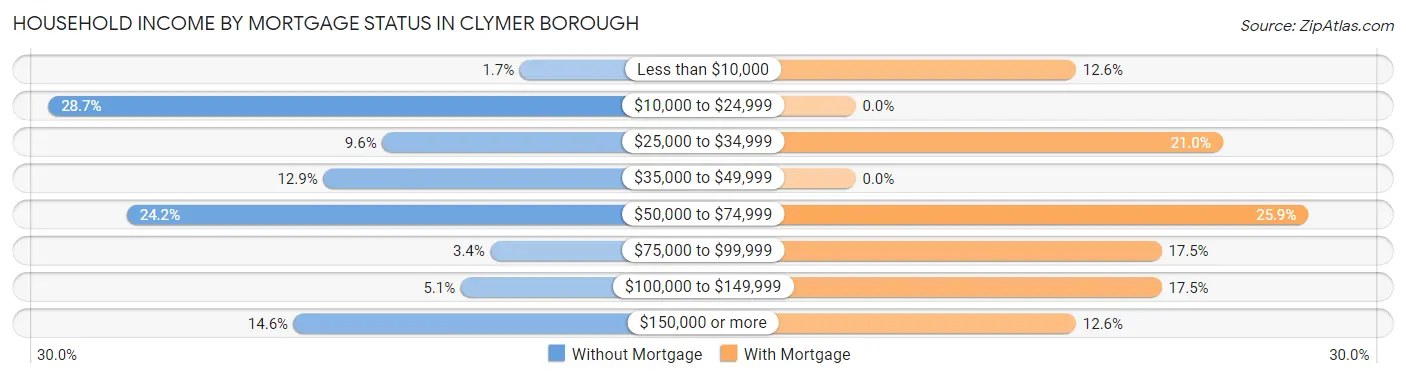
| Household Income | Without Mortgage | With Mortgage |
| Less than $10,000 | 3 (1.7%) | 18 (12.6%) |
| $10,000 to $24,999 | 51 (28.6%) | 0 (0.0%) |
| $25,000 to $34,999 | 17 (9.6%) | 30 (21.0%) |
| $35,000 to $49,999 | 23 (12.9%) | 0 (0.0%) |
| $50,000 to $74,999 | 43 (24.2%) | 37 (25.9%) |
| $75,000 to $99,999 | 6 (3.4%) | 25 (17.5%) |
| $100,000 to $149,999 | 9 (5.1%) | 25 (17.5%) |
| $150,000 or more | 26 (14.6%) | 18 (12.6%) |
| Total | 178 (100.0%) | 143 (100.0%) |
Property Value to Household Income Ratio in Clymer borough
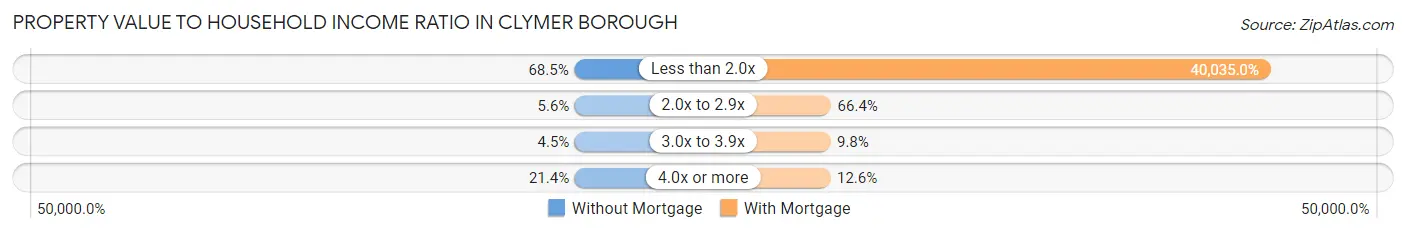
| Value-to-Income Ratio | Without Mortgage | With Mortgage |
| Less than 2.0x | 122 (68.5%) | 57,250 (40,035.0%) |
| 2.0x to 2.9x | 10 (5.6%) | 95 (66.4%) |
| 3.0x to 3.9x | 8 (4.5%) | 14 (9.8%) |
| 4.0x or more | 38 (21.3%) | 18 (12.6%) |
| Total | 178 (100.0%) | 143 (100.0%) |
Real Estate Taxes by Mortgage Status in Clymer borough
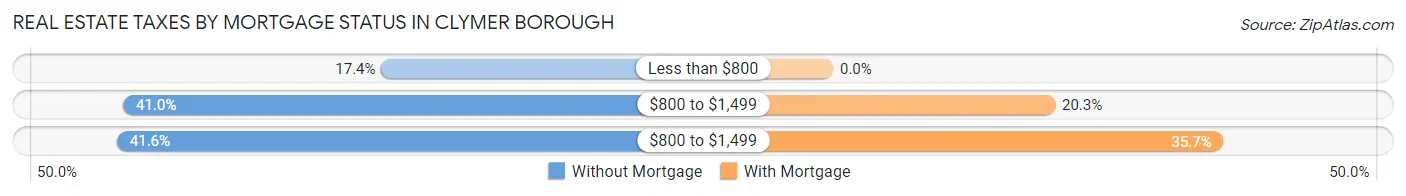
| Property Taxes | Without Mortgage | With Mortgage |
| Less than $800 | 31 (17.4%) | 0 (0.0%) |
| $800 to $1,499 | 73 (41.0%) | 29 (20.3%) |
| $800 to $1,499 | 74 (41.6%) | 51 (35.7%) |
| Total | 178 (100.0%) | 143 (100.0%) |
Health & Disability in Clymer borough
Health Insurance Coverage by Age in Clymer borough
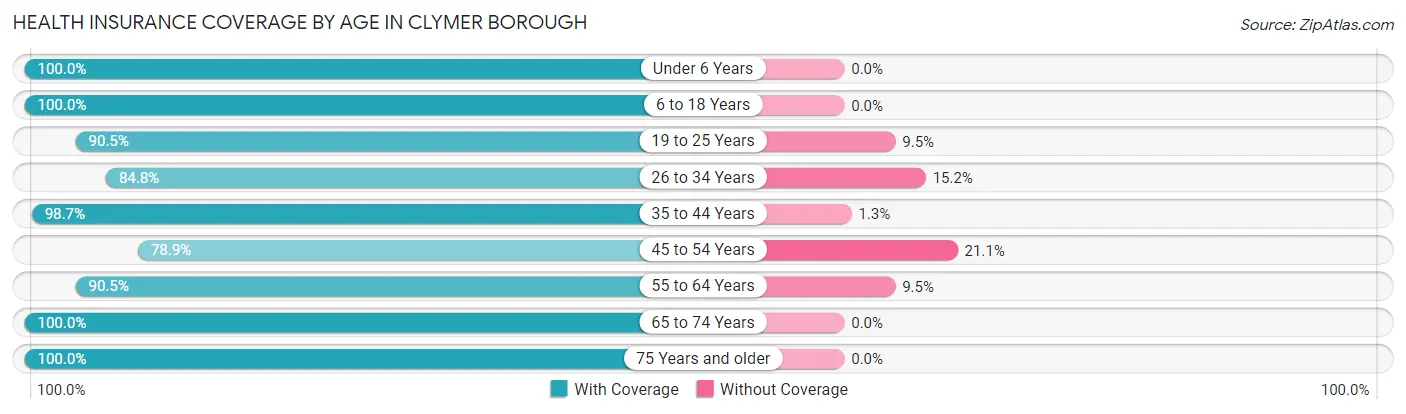
| Age Bracket | With Coverage | Without Coverage |
| Under 6 Years | 57 (100.0%) | 0 (0.0%) |
| 6 to 18 Years | 176 (100.0%) | 0 (0.0%) |
| 19 to 25 Years | 57 (90.5%) | 6 (9.5%) |
| 26 to 34 Years | 95 (84.8%) | 17 (15.2%) |
| 35 to 44 Years | 147 (98.7%) | 2 (1.3%) |
| 45 to 54 Years | 138 (78.9%) | 37 (21.1%) |
| 55 to 64 Years | 162 (90.5%) | 17 (9.5%) |
| 65 to 74 Years | 135 (100.0%) | 0 (0.0%) |
| 75 Years and older | 63 (100.0%) | 0 (0.0%) |
| Total | 1,030 (92.9%) | 79 (7.1%) |
Health Insurance Coverage by Citizenship Status in Clymer borough
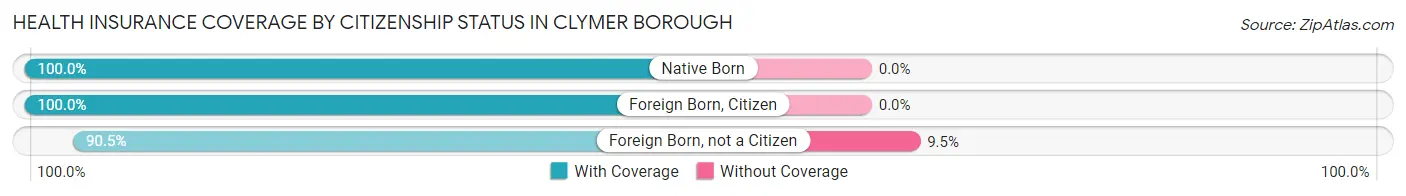
| Citizenship Status | With Coverage | Without Coverage |
| Native Born | 57 (100.0%) | 0 (0.0%) |
| Foreign Born, Citizen | 176 (100.0%) | 0 (0.0%) |
| Foreign Born, not a Citizen | 57 (90.5%) | 6 (9.5%) |
Health Insurance Coverage by Household Income in Clymer borough
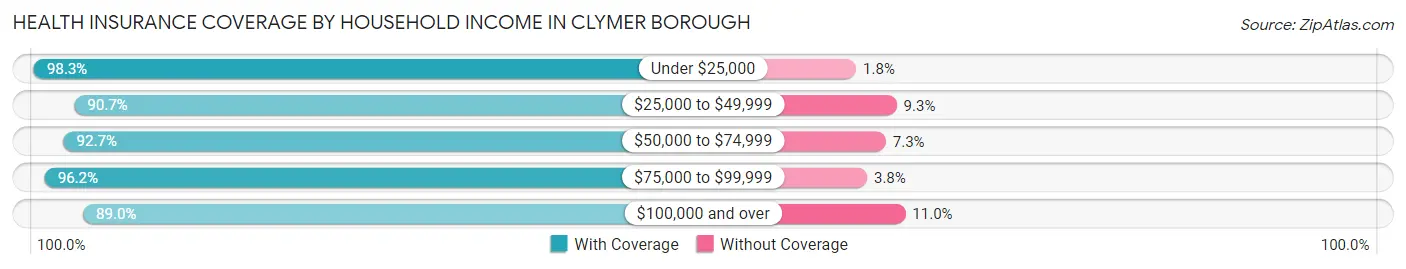
| Household Income | With Coverage | Without Coverage |
| Under $25,000 | 224 (98.3%) | 4 (1.8%) |
| $25,000 to $49,999 | 262 (90.7%) | 27 (9.3%) |
| $50,000 to $74,999 | 190 (92.7%) | 15 (7.3%) |
| $75,000 to $99,999 | 127 (96.2%) | 5 (3.8%) |
| $100,000 and over | 227 (89.0%) | 28 (11.0%) |
Public vs Private Health Insurance Coverage by Age in Clymer borough
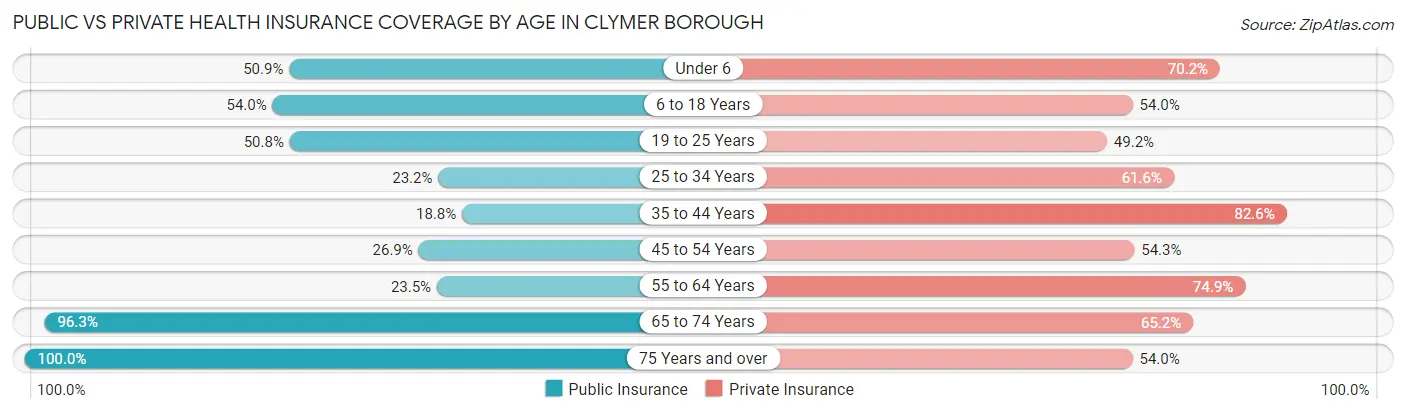
| Age Bracket | Public Insurance | Private Insurance |
| Under 6 | 29 (50.9%) | 40 (70.2%) |
| 6 to 18 Years | 95 (54.0%) | 95 (54.0%) |
| 19 to 25 Years | 32 (50.8%) | 31 (49.2%) |
| 25 to 34 Years | 26 (23.2%) | 69 (61.6%) |
| 35 to 44 Years | 28 (18.8%) | 123 (82.6%) |
| 45 to 54 Years | 47 (26.9%) | 95 (54.3%) |
| 55 to 64 Years | 42 (23.5%) | 134 (74.9%) |
| 65 to 74 Years | 130 (96.3%) | 88 (65.2%) |
| 75 Years and over | 63 (100.0%) | 34 (54.0%) |
| Total | 492 (44.4%) | 709 (63.9%) |
Disability Status by Sex by Age in Clymer borough
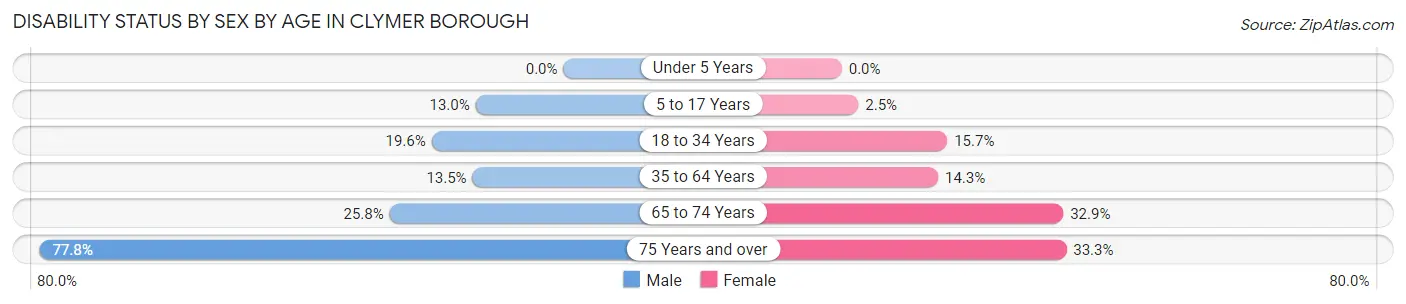
| Age Bracket | Male | Female |
| Under 5 Years | 0 (0.0%) | 0 (0.0%) |
| 5 to 17 Years | 9 (13.0%) | 3 (2.5%) |
| 18 to 34 Years | 18 (19.6%) | 13 (15.7%) |
| 35 to 64 Years | 32 (13.5%) | 38 (14.3%) |
| 65 to 74 Years | 16 (25.8%) | 24 (32.9%) |
| 75 Years and over | 28 (77.8%) | 9 (33.3%) |
Disability Class by Sex by Age in Clymer borough
Disability Class: Hearing Difficulty
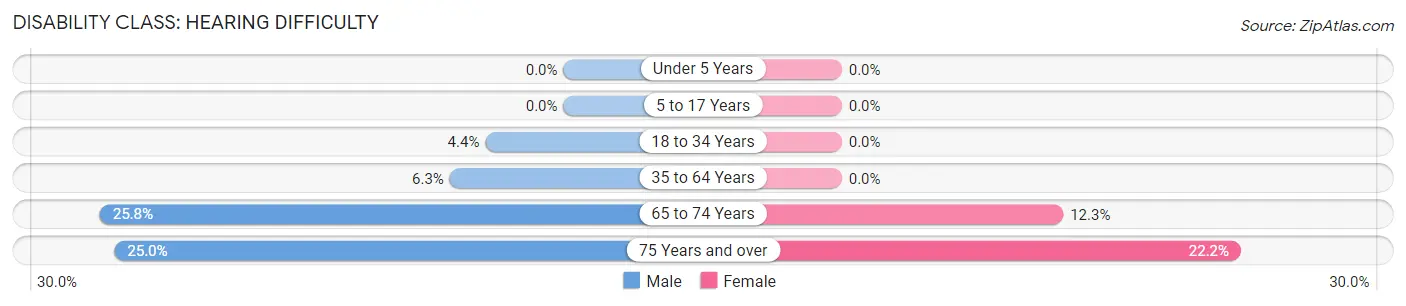
| Age Bracket | Male | Female |
| Under 5 Years | 0 (0.0%) | 0 (0.0%) |
| 5 to 17 Years | 0 (0.0%) | 0 (0.0%) |
| 18 to 34 Years | 4 (4.3%) | 0 (0.0%) |
| 35 to 64 Years | 15 (6.3%) | 0 (0.0%) |
| 65 to 74 Years | 16 (25.8%) | 9 (12.3%) |
| 75 Years and over | 9 (25.0%) | 6 (22.2%) |
Disability Class: Vision Difficulty
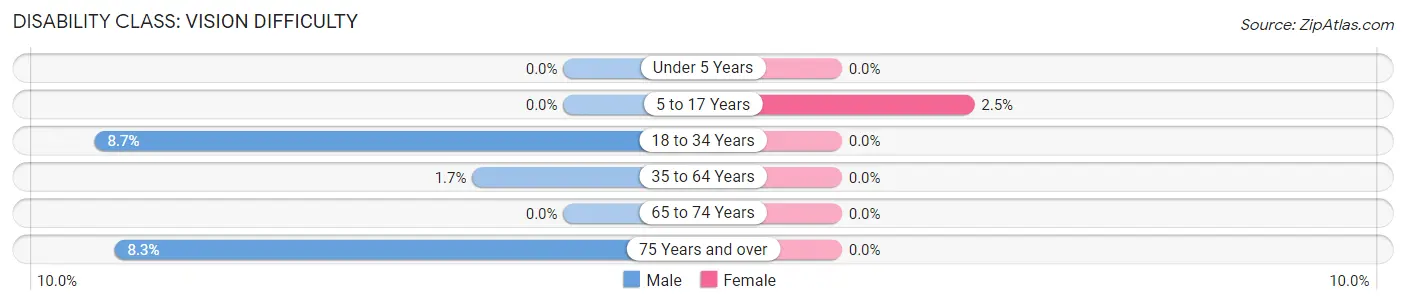
| Age Bracket | Male | Female |
| Under 5 Years | 0 (0.0%) | 0 (0.0%) |
| 5 to 17 Years | 0 (0.0%) | 3 (2.5%) |
| 18 to 34 Years | 8 (8.7%) | 0 (0.0%) |
| 35 to 64 Years | 4 (1.7%) | 0 (0.0%) |
| 65 to 74 Years | 0 (0.0%) | 0 (0.0%) |
| 75 Years and over | 3 (8.3%) | 0 (0.0%) |
Disability Class: Cognitive Difficulty
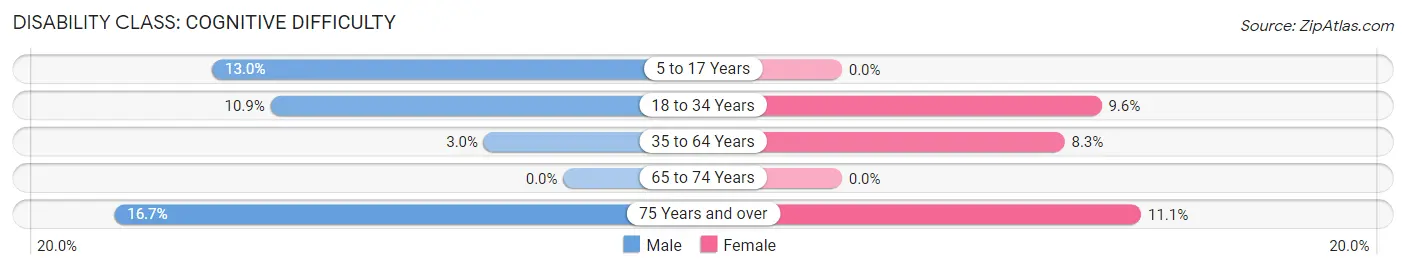
| Age Bracket | Male | Female |
| 5 to 17 Years | 9 (13.0%) | 0 (0.0%) |
| 18 to 34 Years | 10 (10.9%) | 8 (9.6%) |
| 35 to 64 Years | 7 (2.9%) | 22 (8.3%) |
| 65 to 74 Years | 0 (0.0%) | 0 (0.0%) |
| 75 Years and over | 6 (16.7%) | 3 (11.1%) |
Disability Class: Ambulatory Difficulty
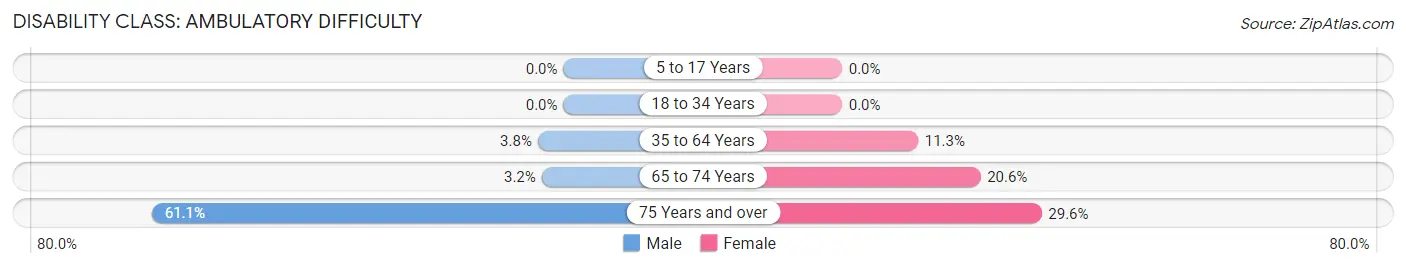
| Age Bracket | Male | Female |
| 5 to 17 Years | 0 (0.0%) | 0 (0.0%) |
| 18 to 34 Years | 0 (0.0%) | 0 (0.0%) |
| 35 to 64 Years | 9 (3.8%) | 30 (11.3%) |
| 65 to 74 Years | 2 (3.2%) | 15 (20.5%) |
| 75 Years and over | 22 (61.1%) | 8 (29.6%) |
Disability Class: Self-Care Difficulty
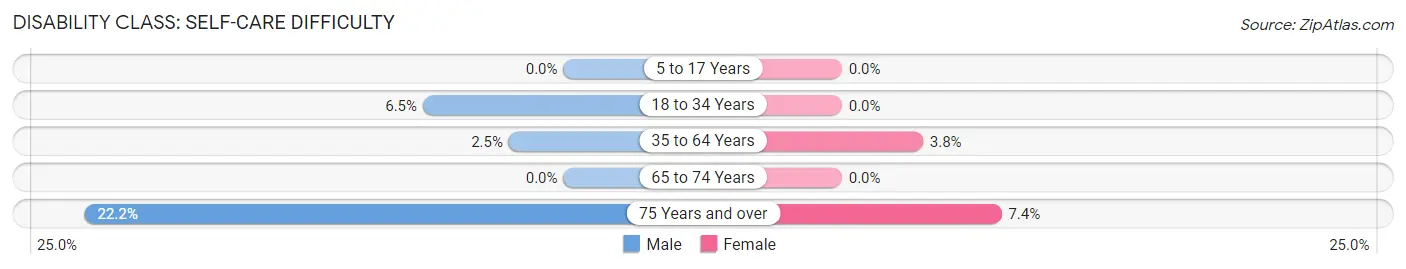
| Age Bracket | Male | Female |
| 5 to 17 Years | 0 (0.0%) | 0 (0.0%) |
| 18 to 34 Years | 6 (6.5%) | 0 (0.0%) |
| 35 to 64 Years | 6 (2.5%) | 10 (3.8%) |
| 65 to 74 Years | 0 (0.0%) | 0 (0.0%) |
| 75 Years and over | 8 (22.2%) | 2 (7.4%) |
Technology Access in Clymer borough
Computing Device Access in Clymer borough
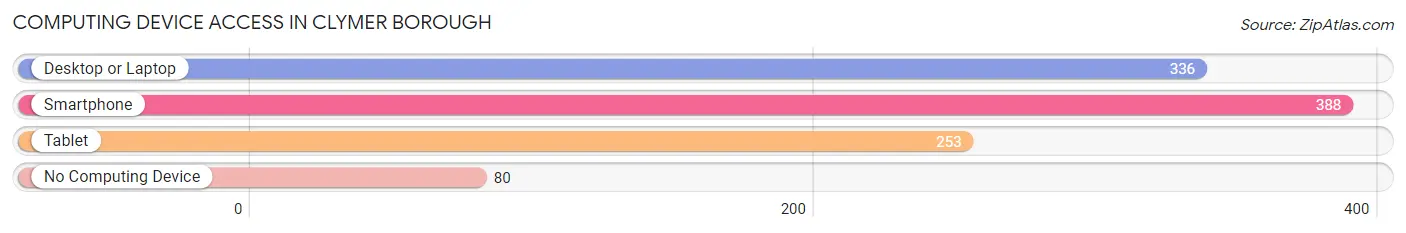
| Device Type | # Households | % Households |
| Desktop or Laptop | 336 | 64.9% |
| Smartphone | 388 | 74.9% |
| Tablet | 253 | 48.8% |
| No Computing Device | 80 | 15.4% |
| Total | 518 | 100.0% |
Internet Access in Clymer borough
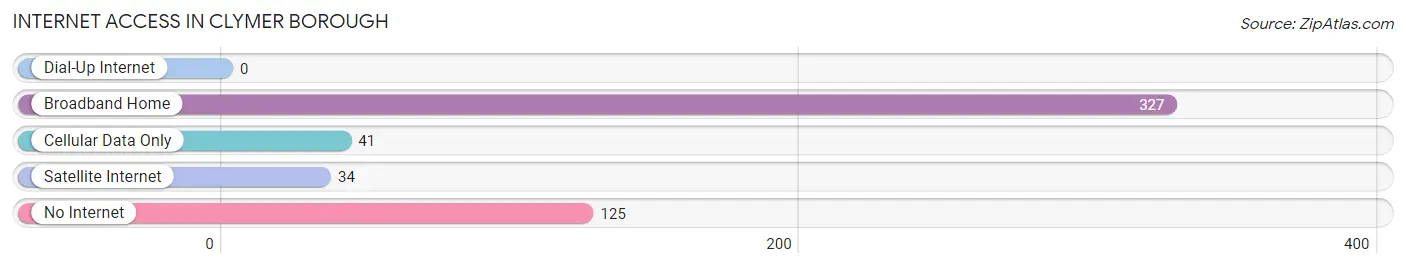
| Internet Type | # Households | % Households |
| Dial-Up Internet | 0 | 0.0% |
| Broadband Home | 327 | 63.1% |
| Cellular Data Only | 41 | 7.9% |
| Satellite Internet | 34 | 6.6% |
| No Internet | 125 | 24.1% |
| Total | 518 | 100.0% |
Clymer borough Summary
Clymer Borough is a small borough located in Indiana County, Pennsylvania. It is situated in the foothills of the Allegheny Mountains and is part of the Pittsburgh metropolitan area. The population of Clymer Borough was 1,845 at the 2010 census.
History
Clymer Borough was founded in 1845 by John Clymer, a local farmer. The town was named after him and was incorporated in 1876. The town was originally a farming community, but in the late 19th century, it became a center for coal mining and the production of steel. The town was also home to several glass factories, which produced bottles and jars for the local canning industry.
In the early 20th century, Clymer Borough experienced a period of growth and prosperity. The town was home to several banks, a movie theater, and a variety of stores and businesses. The town also had a trolley line that connected it to the nearby towns of Indiana and Blairsville.
In the 1950s, the coal and steel industries began to decline, and the town's economy shifted to a more service-oriented one. The trolley line was discontinued in the 1960s, and the town's population began to decline. In the 1970s, the town was hit hard by the recession, and many of the businesses closed.
Geography
Clymer Borough is located in western Pennsylvania, in the foothills of the Allegheny Mountains. It is situated in Indiana County, about 25 miles northeast of Pittsburgh. The borough is bordered by the townships of Center, East Mahoning, and West Mahoning.
The borough covers an area of 1.2 square miles, and is located at an elevation of 1,400 feet. The terrain is mostly hilly, with some flat areas. The borough is drained by the Little Mahoning Creek, which flows through the center of town.
Economy
Clymer Borough's economy is largely based on services and retail. The town is home to several small businesses, including restaurants, convenience stores, and a hardware store. The town also has a few manufacturing companies, including a plastics factory and a metal fabrication plant.
The town is also home to a few small farms, which produce vegetables, fruits, and dairy products. The town also has a few wineries, which produce wines from locally grown grapes.
Demographics
As of the 2010 census, the population of Clymer Borough was 1,845. The racial makeup of the borough was 97.3% White, 0.7% African American, 0.2% Native American, 0.3% Asian, 0.2% from other races, and 1.3% from two or more races. Hispanic or Latino of any race were 0.7% of the population.
The median household income in the borough was $37,917, and the median family income was $45,938. The per capita income was $19,945. About 11.3% of families and 14.2% of the population were below the poverty line, including 19.2% of those under age 18 and 8.2% of those age 65 or over.
Common Questions
What is Per Capita Income in Clymer borough?
Per Capita income in Clymer borough is $32,976.
What is the Median Family Income in Clymer borough?
Median Family Income in Clymer borough is $47,969.
What is the Median Household income in Clymer borough?
Median Household Income in Clymer borough is $45,750.
What is Income or Wage Gap in Clymer borough?
Income or Wage Gap in Clymer borough is 38.7%.
Women in Clymer borough earn 61.3 cents for every dollar earned by a man.
What is Family Income Deficit in Clymer borough?
Family Income Deficit in Clymer borough is $7,657.
Families that are below poverty line in Clymer borough earn $7,657 less on average than the poverty threshold level.
What is Inequality or Gini Index in Clymer borough?
Inequality or Gini Index in Clymer borough is 0.50.
What is the Total Population of Clymer borough?
Total Population of Clymer borough is 1,109.
What is the Total Male Population of Clymer borough?
Total Male Population of Clymer borough is 503.
What is the Total Female Population of Clymer borough?
Total Female Population of Clymer borough is 606.
What is the Ratio of Males per 100 Females in Clymer borough?
There are 83.00 Males per 100 Females in Clymer borough.
What is the Ratio of Females per 100 Males in Clymer borough?
There are 120.48 Females per 100 Males in Clymer borough.
What is the Median Population Age in Clymer borough?
Median Population Age in Clymer borough is 43.9 Years.
What is the Average Family Size in Clymer borough
Average Family Size in Clymer borough is 2.8 People.
What is the Average Household Size in Clymer borough
Average Household Size in Clymer borough is 2.1 People.
How Large is the Labor Force in Clymer borough?
There are 545 People in the Labor Forcein in Clymer borough.
What is the Percentage of People in the Labor Force in Clymer borough?
59.9% of People are in the Labor Force in Clymer borough.
What is the Unemployment Rate in Clymer borough?
Unemployment Rate in Clymer borough is 5.3%.