Wyoming County, PA Map & Demographics
Wyoming County Map
Wyoming County Overview
$36,533
PER CAPITA INCOME
$80,571
AVG FAMILY INCOME
$67,968
AVG HOUSEHOLD INCOME
35.6%
WAGE / INCOME GAP [ % ]
64.4¢/ $1
WAGE / INCOME GAP [ $ ]
$8,868
FAMILY INCOME DEFICIT
0.44
INEQUALITY / GINI INDEX
26,219
TOTAL POPULATION
13,254
MALE POPULATION
12,965
FEMALE POPULATION
102.23
MALES / 100 FEMALES
97.82
FEMALES / 100 MALES
45.3
MEDIAN AGE
2.9
AVG FAMILY SIZE
2.4
AVG HOUSEHOLD SIZE
12,625
LABOR FORCE [ PEOPLE ]
57.8%
PERCENT IN LABOR FORCE
4.5%
UNEMPLOYMENT RATE
Wyoming County Area Codes
Income in Wyoming County
Income Overview in Wyoming County
Per Capita Income in Wyoming County is $36,533, while median incomes of families and households are $80,571 and $67,968 respectively.
| Characteristic | Number | Measure |
| Per Capita Income | 26,219 | $36,533 |
| Median Family Income | 7,058 | $80,571 |
| Mean Family Income | 7,058 | $104,690 |
| Median Household Income | 10,788 | $67,968 |
| Mean Household Income | 10,788 | $87,709 |
| Income Deficit | 7,058 | $8,868 |
| Wage / Income Gap (%) | 26,219 | 35.60% |
| Wage / Income Gap ($) | 26,219 | 64.40¢ per $1 |
| Gini / Inequality Index | 26,219 | 0.44 |
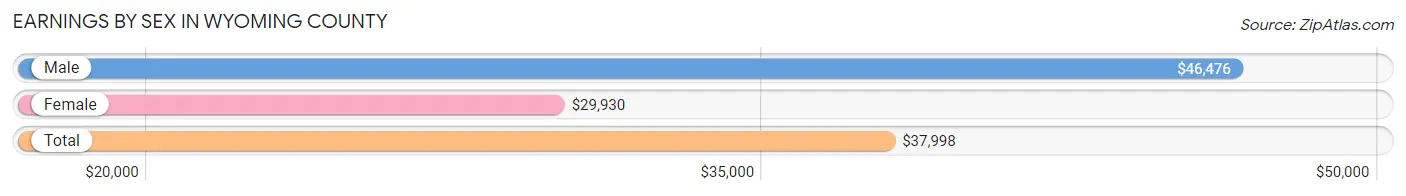
Earnings by Sex in Wyoming County
Average Earnings in Wyoming County are $37,998, $46,476 for men and $29,930 for women, a difference of 35.6%.
| Sex | Number | Average Earnings |
| Male | 7,467 (54.9%) | $46,476 |
| Female | 6,142 (45.1%) | $29,930 |
| Total | 13,609 (100.0%) | $37,998 |
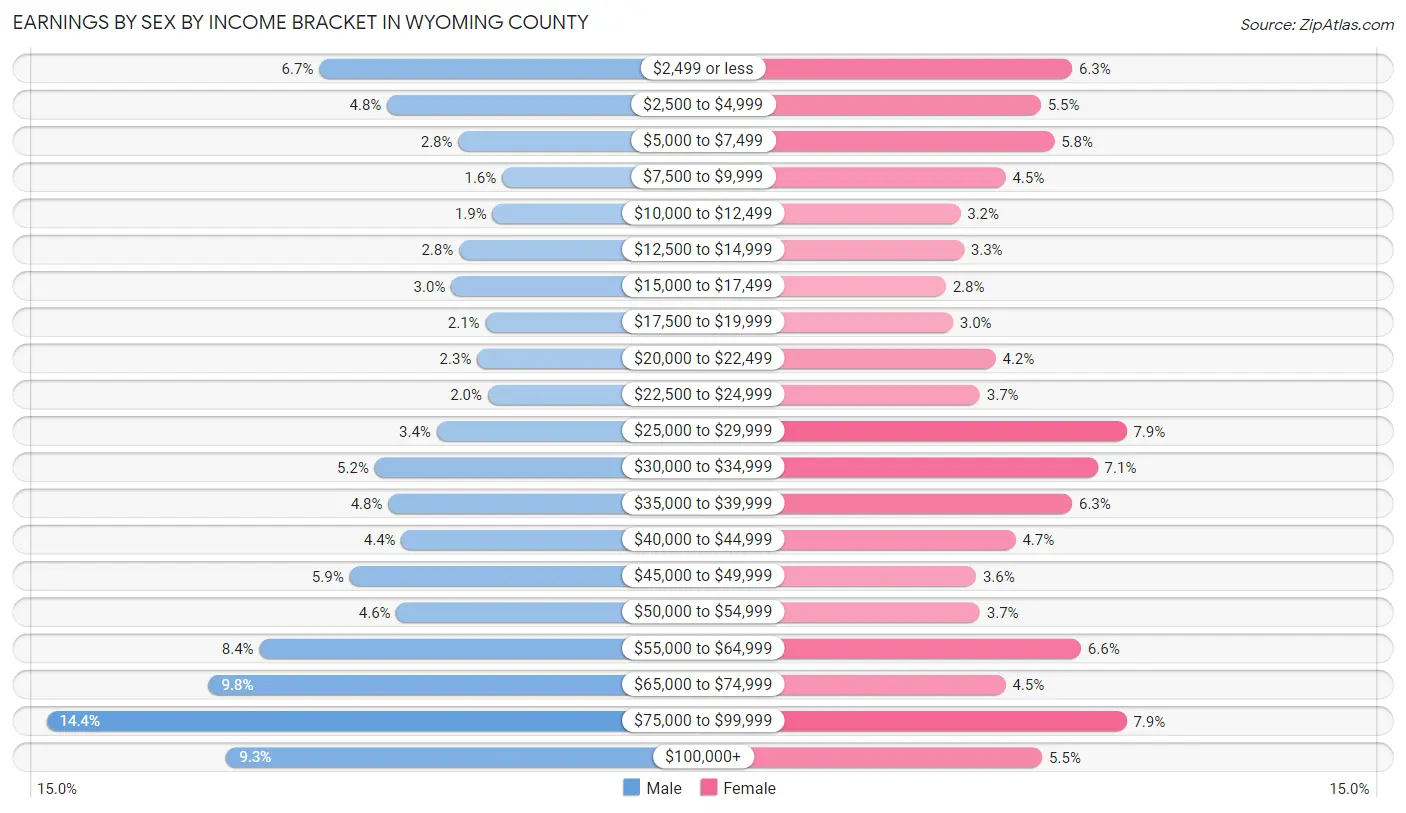
Earnings by Sex by Income Bracket in Wyoming County
The most common earnings brackets in Wyoming County are $75,000 to $99,999 for men (1,074 | 14.4%) and $25,000 to $29,999 for women (483 | 7.9%).
| Income | Male | Female |
| $2,499 or less | 502 (6.7%) | 389 (6.3%) |
| $2,500 to $4,999 | 359 (4.8%) | 335 (5.4%) |
| $5,000 to $7,499 | 210 (2.8%) | 358 (5.8%) |
| $7,500 to $9,999 | 118 (1.6%) | 274 (4.5%) |
| $10,000 to $12,499 | 138 (1.8%) | 196 (3.2%) |
| $12,500 to $14,999 | 208 (2.8%) | 202 (3.3%) |
| $15,000 to $17,499 | 225 (3.0%) | 171 (2.8%) |
| $17,500 to $19,999 | 153 (2.1%) | 183 (3.0%) |
| $20,000 to $22,499 | 170 (2.3%) | 257 (4.2%) |
| $22,500 to $24,999 | 148 (2.0%) | 230 (3.7%) |
| $25,000 to $29,999 | 255 (3.4%) | 483 (7.9%) |
| $30,000 to $34,999 | 385 (5.2%) | 433 (7.0%) |
| $35,000 to $39,999 | 357 (4.8%) | 389 (6.3%) |
| $40,000 to $44,999 | 329 (4.4%) | 291 (4.7%) |
| $45,000 to $49,999 | 438 (5.9%) | 223 (3.6%) |
| $50,000 to $54,999 | 340 (4.5%) | 230 (3.7%) |
| $55,000 to $64,999 | 627 (8.4%) | 404 (6.6%) |
| $65,000 to $74,999 | 734 (9.8%) | 274 (4.5%) |
| $75,000 to $99,999 | 1,074 (14.4%) | 483 (7.9%) |
| $100,000+ | 697 (9.3%) | 337 (5.5%) |
| Total | 7,467 (100.0%) | 6,142 (100.0%) |
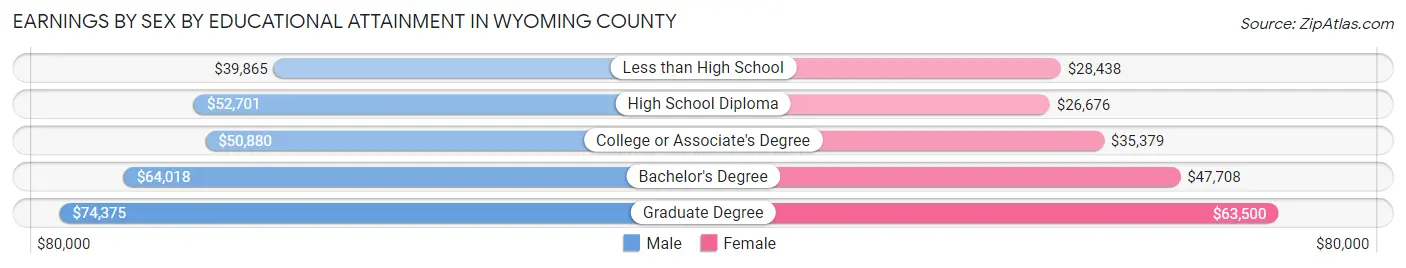
Earnings by Sex by Educational Attainment in Wyoming County
Average earnings in Wyoming County are $53,781 for men and $34,336 for women, a difference of 36.2%. Men with an educational attainment of graduate degree enjoy the highest average annual earnings of $74,375, while those with less than high school education earn the least with $39,865. Women with an educational attainment of graduate degree earn the most with the average annual earnings of $63,500, while those with high school diploma education have the smallest earnings of $26,676.
| Educational Attainment | Male Income | Female Income |
| Less than High School | $39,865 | $28,438 |
| High School Diploma | $52,701 | $26,676 |
| College or Associate's Degree | $50,880 | $35,379 |
| Bachelor's Degree | $64,018 | $47,708 |
| Graduate Degree | $74,375 | $63,500 |
| Total | $53,781 | $34,336 |
Family Income in Wyoming County
Family Income Brackets in Wyoming County
According to the Wyoming County family income data, there are 1,525 families falling into the $100,000 to $149,999 income range, which is the most common income bracket and makes up 21.6% of all families. Conversely, the $10,000 to $14,999 income bracket is the least frequent group with only 92 families (1.3%) belonging to this category.
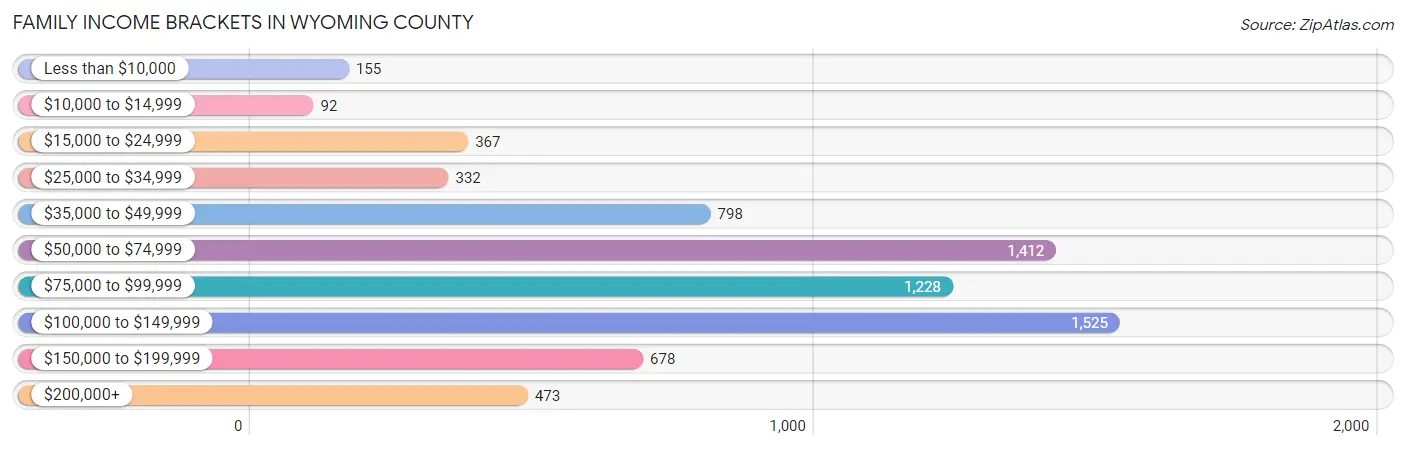
| Income Bracket | # Families | % Families |
| Less than $10,000 | 155 | 2.2% |
| $10,000 to $14,999 | 92 | 1.3% |
| $15,000 to $24,999 | 367 | 5.2% |
| $25,000 to $34,999 | 332 | 4.7% |
| $35,000 to $49,999 | 798 | 11.3% |
| $50,000 to $74,999 | 1,412 | 20.0% |
| $75,000 to $99,999 | 1,228 | 17.4% |
| $100,000 to $149,999 | 1,525 | 21.6% |
| $150,000 to $199,999 | 678 | 9.6% |
| $200,000+ | 473 | 6.7% |
Family Income by Famaliy Size in Wyoming County
6-person families (108 | 1.5%) account for the highest median family income in Wyoming County with $121,000 per family, while 2-person families (3,922 | 55.6%) have the highest median income of $37,134 per family member.
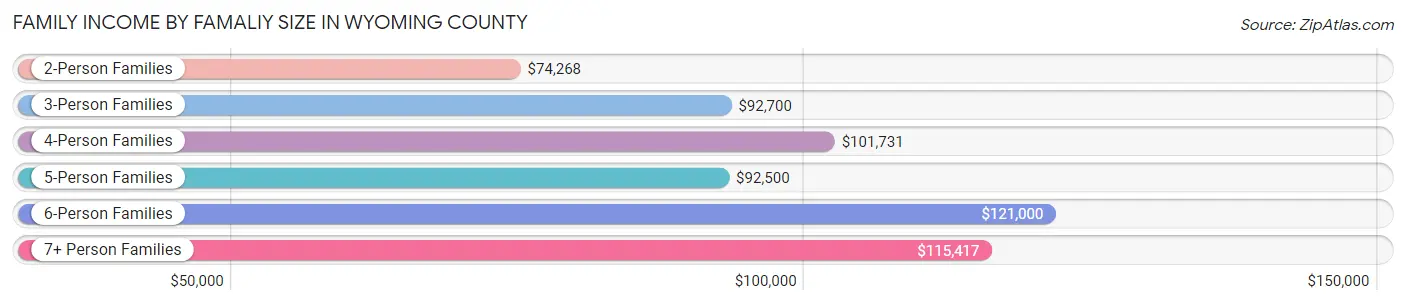
| Income Bracket | # Families | Median Income |
| 2-Person Families | 3,922 (55.6%) | $74,268 |
| 3-Person Families | 1,594 (22.6%) | $92,700 |
| 4-Person Families | 970 (13.7%) | $101,731 |
| 5-Person Families | 390 (5.5%) | $92,500 |
| 6-Person Families | 108 (1.5%) | $121,000 |
| 7+ Person Families | 74 (1.1%) | $115,417 |
| Total | 7,058 (100.0%) | $80,571 |
Family Income by Number of Earners in Wyoming County
The median family income in Wyoming County is $80,571, with families comprising 3+ earners (722) having the highest median family income of $131,250, while families with no earners (1,341) have the lowest median family income of $51,830, accounting for 10.2% and 19.0% of families, respectively.
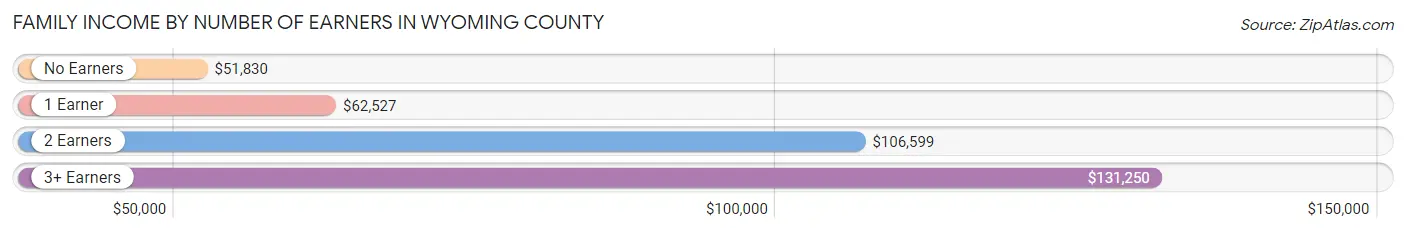
| Number of Earners | # Families | Median Income |
| No Earners | 1,341 (19.0%) | $51,830 |
| 1 Earner | 2,402 (34.0%) | $62,527 |
| 2 Earners | 2,593 (36.7%) | $106,599 |
| 3+ Earners | 722 (10.2%) | $131,250 |
| Total | 7,058 (100.0%) | $80,571 |
Household Income in Wyoming County
Household Income Brackets in Wyoming County
With 1,985 households falling in the category, the $50,000 to $74,999 income range is the most frequent in Wyoming County, accounting for 18.4% of all households. In contrast, only 280 households (2.6%) fall into the $10,000 to $14,999 income bracket, making it the least populous group.
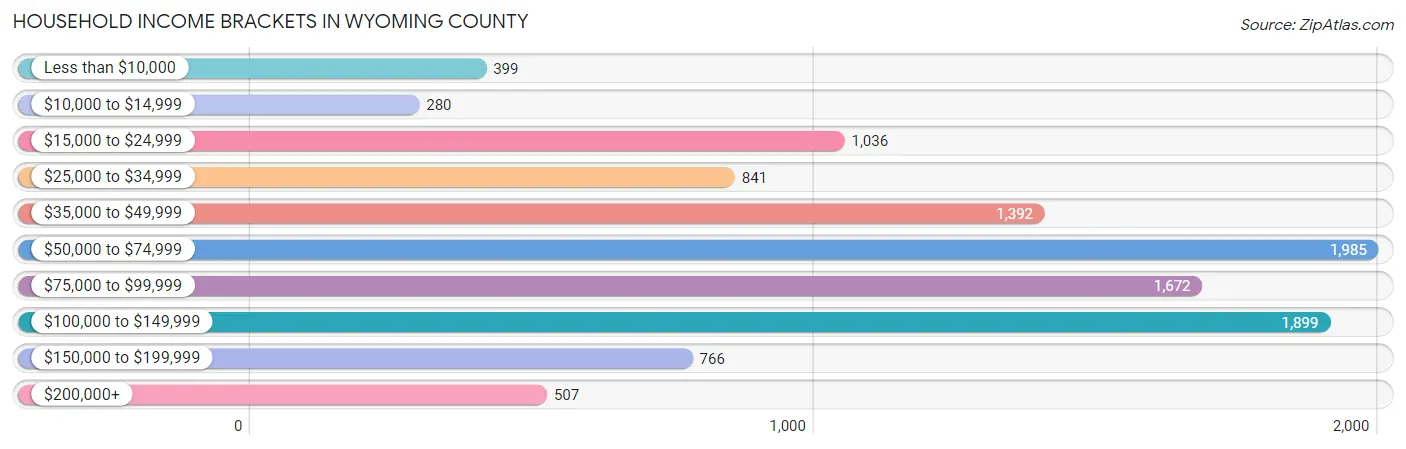
| Income Bracket | # Households | % Households |
| Less than $10,000 | 399 | 3.7% |
| $10,000 to $14,999 | 280 | 2.6% |
| $15,000 to $24,999 | 1,036 | 9.6% |
| $25,000 to $34,999 | 841 | 7.8% |
| $35,000 to $49,999 | 1,392 | 12.9% |
| $50,000 to $74,999 | 1,985 | 18.4% |
| $75,000 to $99,999 | 1,672 | 15.5% |
| $100,000 to $149,999 | 1,899 | 17.6% |
| $150,000 to $199,999 | 766 | 7.1% |
| $200,000+ | 507 | 4.7% |
Household Income by Householder Age in Wyoming County
The median household income in Wyoming County is $67,968, with the highest median household income of $84,681 found in the 45 to 64 years age bracket for the primary householder. A total of 4,041 households (37.5%) fall into this category. Meanwhile, the 65+ years age bracket for the primary householder has the lowest median household income of $49,246, with 3,683 households (34.1%) in this group.
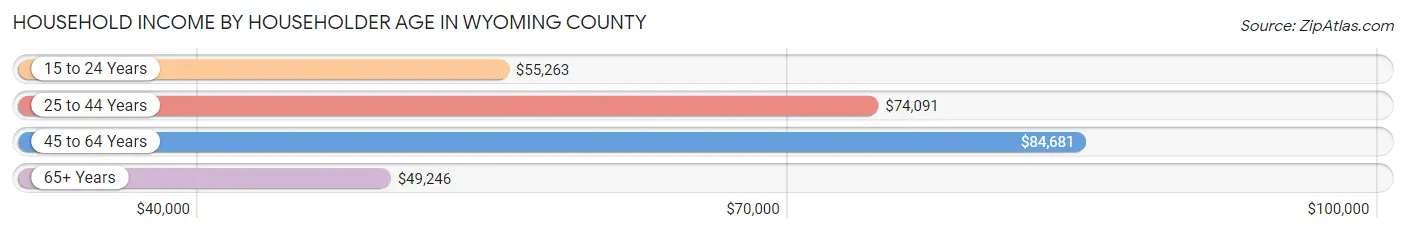
| Income Bracket | # Households | Median Income |
| 15 to 24 Years | 326 (3.0%) | $55,263 |
| 25 to 44 Years | 2,738 (25.4%) | $74,091 |
| 45 to 64 Years | 4,041 (37.5%) | $84,681 |
| 65+ Years | 3,683 (34.1%) | $49,246 |
| Total | 10,788 (100.0%) | $67,968 |
Poverty in Wyoming County
Income Below Poverty by Sex and Age in Wyoming County
With 10.1% poverty level for males and 12.3% for females among the residents of Wyoming County, under 5 year old males and 12 to 14 year old females are the most vulnerable to poverty, with 154 males (25.6%) and 81 females (22.0%) in their respective age groups living below the poverty level.
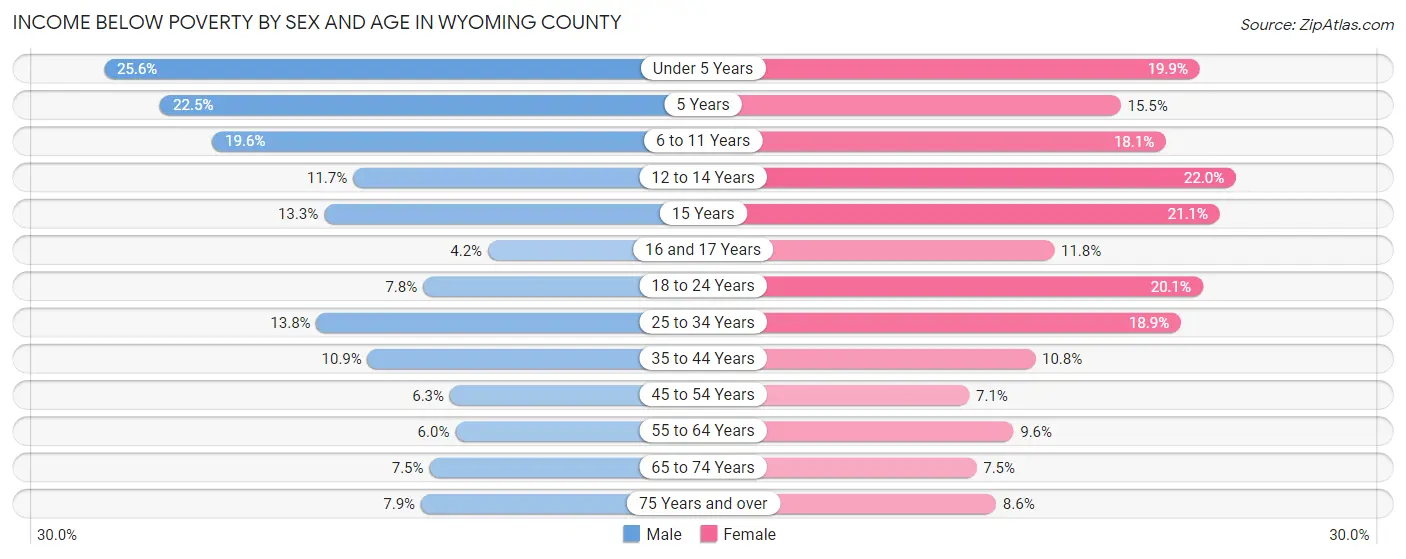
| Age Bracket | Male | Female |
| Under 5 Years | 154 (25.6%) | 114 (19.9%) |
| 5 Years | 22 (22.5%) | 18 (15.5%) |
| 6 to 11 Years | 159 (19.6%) | 154 (18.0%) |
| 12 to 14 Years | 54 (11.7%) | 81 (22.0%) |
| 15 Years | 20 (13.3%) | 32 (21.0%) |
| 16 and 17 Years | 15 (4.2%) | 35 (11.8%) |
| 18 to 24 Years | 79 (7.8%) | 164 (20.1%) |
| 25 to 34 Years | 203 (13.8%) | 259 (18.9%) |
| 35 to 44 Years | 157 (10.9%) | 150 (10.8%) |
| 45 to 54 Years | 106 (6.3%) | 121 (7.1%) |
| 55 to 64 Years | 122 (6.0%) | 192 (9.6%) |
| 65 to 74 Years | 127 (7.5%) | 128 (7.5%) |
| 75 Years and over | 81 (7.9%) | 103 (8.6%) |
| Total | 1,299 (10.1%) | 1,551 (12.3%) |
Income Above Poverty by Sex and Age in Wyoming County
According to the poverty statistics in Wyoming County, males aged 16 and 17 years and females aged 45 to 54 years are the age groups that are most secure financially, with 95.8% of males and 92.9% of females in these age groups living above the poverty line.
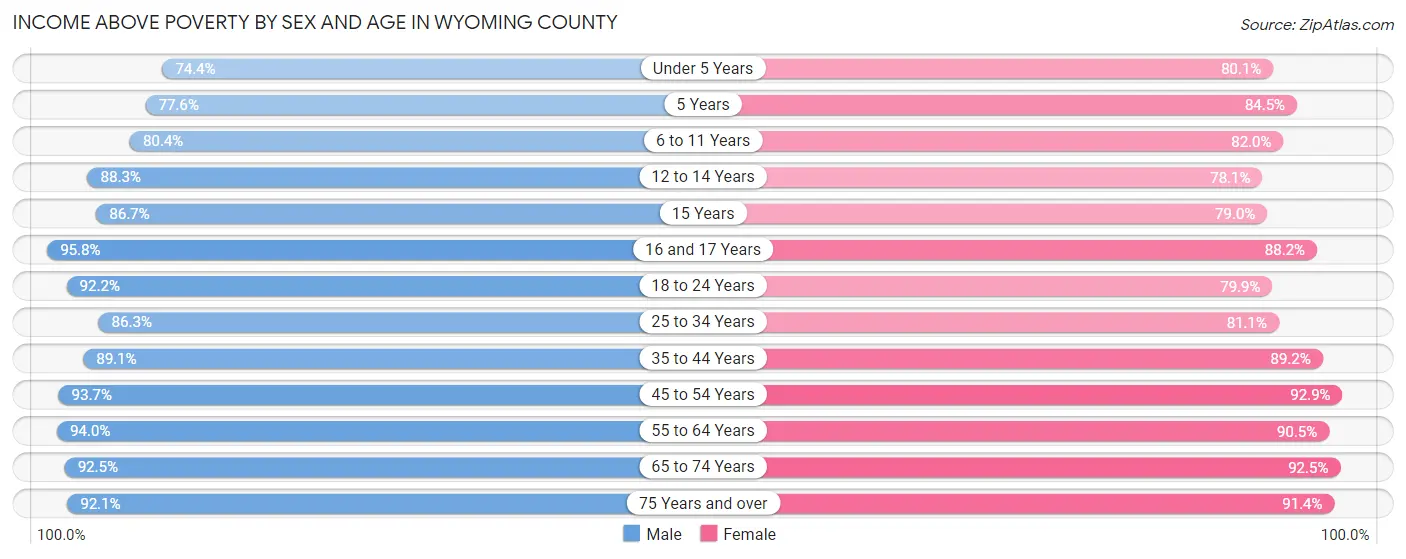
| Age Bracket | Male | Female |
| Under 5 Years | 448 (74.4%) | 458 (80.1%) |
| 5 Years | 76 (77.5%) | 98 (84.5%) |
| 6 to 11 Years | 654 (80.4%) | 699 (82.0%) |
| 12 to 14 Years | 407 (88.3%) | 288 (78.0%) |
| 15 Years | 130 (86.7%) | 120 (78.9%) |
| 16 and 17 Years | 342 (95.8%) | 261 (88.2%) |
| 18 to 24 Years | 932 (92.2%) | 652 (79.9%) |
| 25 to 34 Years | 1,273 (86.3%) | 1,112 (81.1%) |
| 35 to 44 Years | 1,283 (89.1%) | 1,244 (89.2%) |
| 45 to 54 Years | 1,571 (93.7%) | 1,585 (92.9%) |
| 55 to 64 Years | 1,905 (94.0%) | 1,818 (90.4%) |
| 65 to 74 Years | 1,576 (92.5%) | 1,580 (92.5%) |
| 75 Years and over | 941 (92.1%) | 1,098 (91.4%) |
| Total | 11,538 (89.9%) | 11,013 (87.7%) |
Income Below Poverty Among Married-Couple Families in Wyoming County
The poverty statistics for married-couple families in Wyoming County show that 3.8% or 206 of the total 5,376 families live below the poverty line. Families with 5 or more children have the highest poverty rate of 54.5%, comprising of 12 families. On the other hand, families with no children have the lowest poverty rate of 1.8%, which includes 67 families.
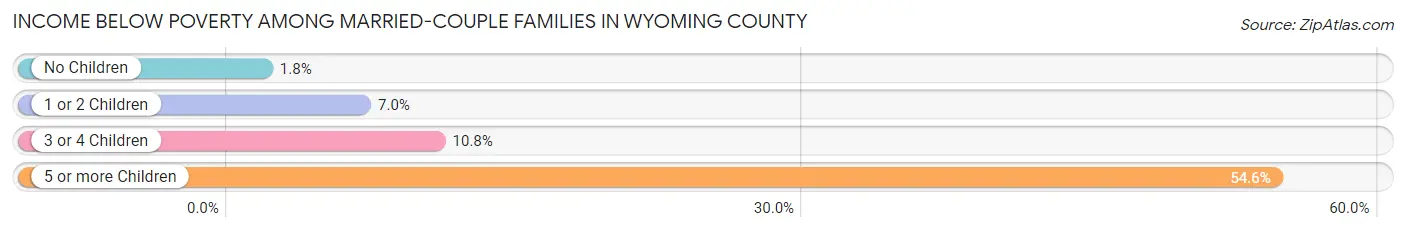
| Children | Above Poverty | Below Poverty |
| No Children | 3,619 (98.2%) | 67 (1.8%) |
| 1 or 2 Children | 1,286 (93.0%) | 96 (7.0%) |
| 3 or 4 Children | 255 (89.2%) | 31 (10.8%) |
| 5 or more Children | 10 (45.5%) | 12 (54.5%) |
| Total | 5,170 (96.2%) | 206 (3.8%) |
Income Below Poverty Among Single-Parent Households in Wyoming County
According to the poverty data in Wyoming County, 17.1% or 99 single-father households and 23.0% or 254 single-mother households are living below the poverty line. Among single-father households, those with 3 or 4 children have the highest poverty rate, with 6 households (54.5%) experiencing poverty. Likewise, among single-mother households, those with 3 or 4 children have the highest poverty rate, with 32 households (45.1%) falling below the poverty line.
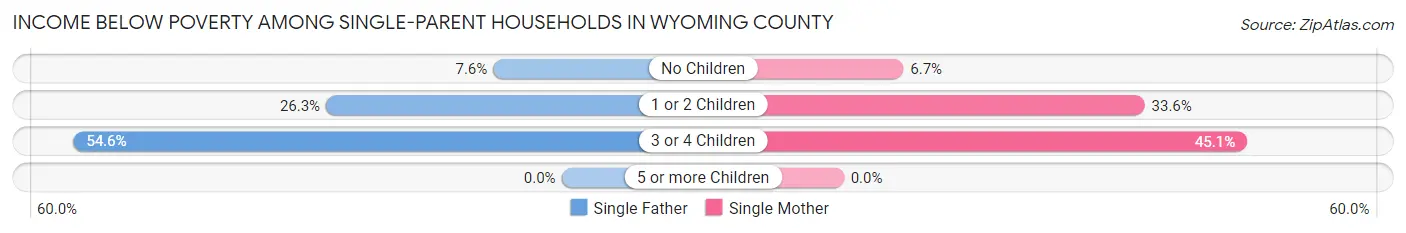
| Children | Single Father | Single Mother |
| No Children | 23 (7.6%) | 31 (6.7%) |
| 1 or 2 Children | 70 (26.3%) | 191 (33.6%) |
| 3 or 4 Children | 6 (54.5%) | 32 (45.1%) |
| 5 or more Children | 0 (0.0%) | 0 (0.0%) |
| Total | 99 (17.1%) | 254 (23.0%) |
Income Below Poverty Among Married-Couple vs Single-Parent Households in Wyoming County
The poverty data for Wyoming County shows that 206 of the married-couple family households (3.8%) and 353 of the single-parent households (21.0%) are living below the poverty level. Within the married-couple family households, those with 5 or more children have the highest poverty rate, with 12 households (54.5%) falling below the poverty line. Among the single-parent households, those with 3 or 4 children have the highest poverty rate, with 38 household (46.3%) living below poverty.
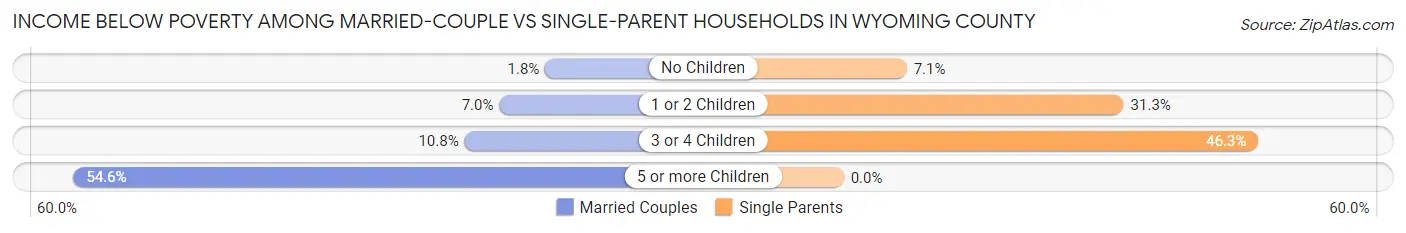
| Children | Married-Couple Families | Single-Parent Households |
| No Children | 67 (1.8%) | 54 (7.0%) |
| 1 or 2 Children | 96 (7.0%) | 261 (31.3%) |
| 3 or 4 Children | 31 (10.8%) | 38 (46.3%) |
| 5 or more Children | 12 (54.5%) | 0 (0.0%) |
| Total | 206 (3.8%) | 353 (21.0%) |
Race in Wyoming County
The most populous races in Wyoming County are White / Caucasian (24,939 | 95.1%), Two or more Races (778 | 3.0%), and Hispanic or Latino (564 | 2.1%).
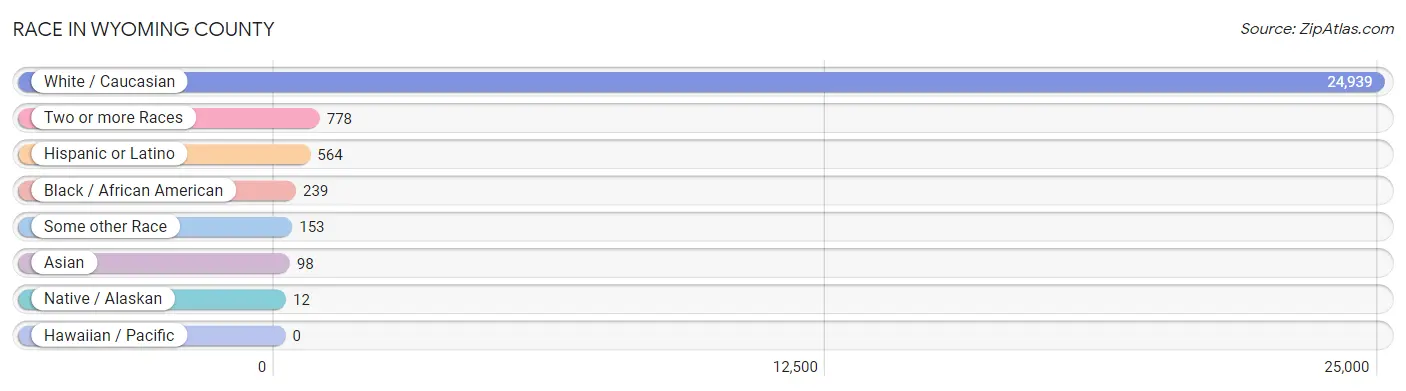
| Race | # Population | % Population |
| Asian | 98 | 0.4% |
| Black / African American | 239 | 0.9% |
| Hawaiian / Pacific | 0 | 0.0% |
| Hispanic or Latino | 564 | 2.1% |
| Native / Alaskan | 12 | 0.1% |
| White / Caucasian | 24,939 | 95.1% |
| Two or more Races | 778 | 3.0% |
| Some other Race | 153 | 0.6% |
| Total | 26,219 | 100.0% |
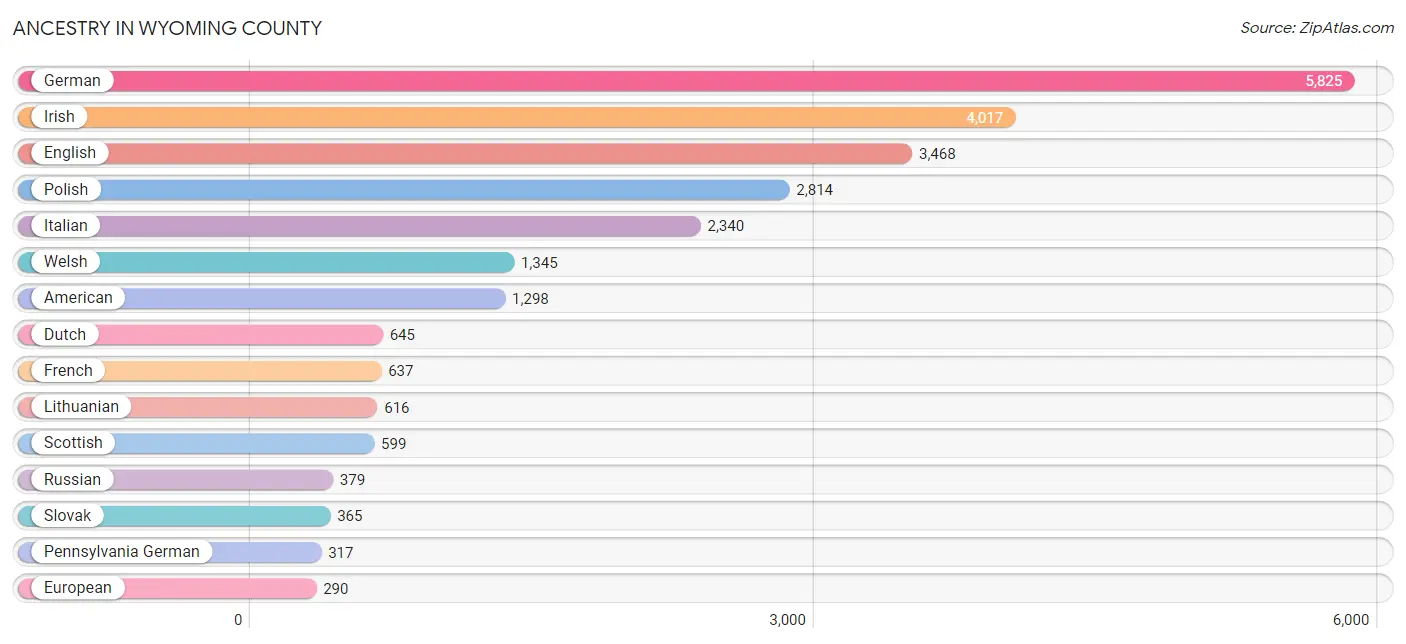
Ancestry in Wyoming County
The most populous ancestries reported in Wyoming County are German (5,825 | 22.2%), Irish (4,017 | 15.3%), English (3,468 | 13.2%), Polish (2,814 | 10.7%), and Italian (2,340 | 8.9%), together accounting for 70.4% of all Wyoming County residents.
| Ancestry | # Population | % Population |
| African | 12 | 0.1% |
| American | 1,298 | 5.0% |
| Apache | 1 | 0.0% |
| Arab | 104 | 0.4% |
| Argentinean | 2 | 0.0% |
| Australian | 3 | 0.0% |
| Austrian | 92 | 0.4% |
| Belgian | 12 | 0.1% |
| Bhutanese | 8 | 0.0% |
| Blackfeet | 2 | 0.0% |
| British | 72 | 0.3% |
| British West Indian | 5 | 0.0% |
| Burmese | 12 | 0.1% |
| Canadian | 25 | 0.1% |
| Central American | 140 | 0.5% |
| Cherokee | 15 | 0.1% |
| Chilean | 3 | 0.0% |
| Crow | 1 | 0.0% |
| Cuban | 32 | 0.1% |
| Czech | 83 | 0.3% |
| Czechoslovakian | 52 | 0.2% |
| Danish | 44 | 0.2% |
| Delaware | 18 | 0.1% |
| Dominican | 4 | 0.0% |
| Dutch | 645 | 2.5% |
| Eastern European | 113 | 0.4% |
| Ecuadorian | 35 | 0.1% |
| English | 3,468 | 13.2% |
| European | 290 | 1.1% |
| Filipino | 13 | 0.1% |
| Finnish | 13 | 0.1% |
| French | 637 | 2.4% |
| French American Indian | 1 | 0.0% |
| French Canadian | 38 | 0.1% |
| German | 5,825 | 22.2% |
| Greek | 64 | 0.2% |
| Guamanian / Chamorro | 5 | 0.0% |
| Guatemalan | 12 | 0.1% |
| Haitian | 2 | 0.0% |
| Honduran | 42 | 0.2% |
| Hungarian | 71 | 0.3% |
| Indian (Asian) | 24 | 0.1% |
| Iranian | 2 | 0.0% |
| Irish | 4,017 | 15.3% |
| Iroquois | 37 | 0.1% |
| Italian | 2,340 | 8.9% |
| Jamaican | 7 | 0.0% |
| Japanese | 22 | 0.1% |
| Korean | 40 | 0.2% |
| Laotian | 4 | 0.0% |
| Lebanese | 46 | 0.2% |
| Liberian | 1 | 0.0% |
| Lithuanian | 616 | 2.4% |
| Malaysian | 2 | 0.0% |
| Mexican | 130 | 0.5% |
| Moroccan | 50 | 0.2% |
| Native Hawaiian | 2 | 0.0% |
| Navajo | 1 | 0.0% |
| Nicaraguan | 44 | 0.2% |
| Nigerian | 2 | 0.0% |
| Northern European | 20 | 0.1% |
| Norwegian | 115 | 0.4% |
| Pennsylvania German | 317 | 1.2% |
| Peruvian | 38 | 0.1% |
| Polish | 2,814 | 10.7% |
| Portuguese | 15 | 0.1% |
| Puerto Rican | 137 | 0.5% |
| Romanian | 13 | 0.1% |
| Russian | 379 | 1.5% |
| Salvadoran | 42 | 0.2% |
| Samoan | 2 | 0.0% |
| Scandinavian | 78 | 0.3% |
| Scotch-Irish | 168 | 0.6% |
| Scottish | 599 | 2.3% |
| Serbian | 15 | 0.1% |
| Sioux | 2 | 0.0% |
| Slavic | 3 | 0.0% |
| Slovak | 365 | 1.4% |
| Slovene | 13 | 0.1% |
| South African | 4 | 0.0% |
| South American | 78 | 0.3% |
| Spaniard | 6 | 0.0% |
| Spanish | 2 | 0.0% |
| Subsaharan African | 19 | 0.1% |
| Swedish | 215 | 0.8% |
| Swiss | 24 | 0.1% |
| Syrian | 7 | 0.0% |
| Thai | 44 | 0.2% |
| Ukrainian | 145 | 0.5% |
| Welsh | 1,345 | 5.1% |
| Yugoslavian | 4 | 0.0% | View All 91 Rows |
Immigrants in Wyoming County
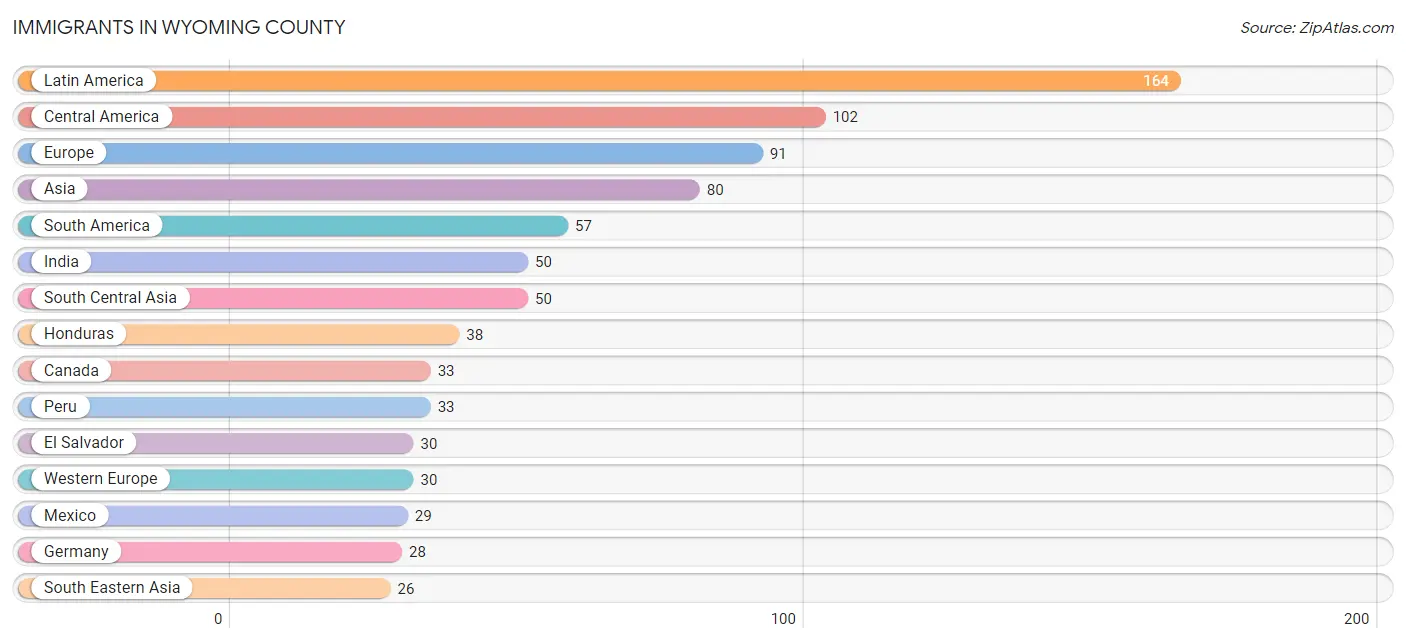
The most numerous immigrant groups reported in Wyoming County came from Latin America (164 | 0.6%), Central America (102 | 0.4%), Europe (91 | 0.4%), Asia (80 | 0.3%), and South America (57 | 0.2%), together accounting for 1.9% of all Wyoming County residents.
| Immigration Origin | # Population | % Population |
| Africa | 5 | 0.0% |
| Argentina | 2 | 0.0% |
| Asia | 80 | 0.3% |
| Australia | 12 | 0.1% |
| Canada | 33 | 0.1% |
| Caribbean | 5 | 0.0% |
| Central America | 102 | 0.4% |
| Chile | 1 | 0.0% |
| China | 4 | 0.0% |
| Czechoslovakia | 8 | 0.0% |
| Eastern Asia | 4 | 0.0% |
| Eastern Europe | 21 | 0.1% |
| Ecuador | 21 | 0.1% |
| El Salvador | 30 | 0.1% |
| England | 2 | 0.0% |
| Europe | 91 | 0.4% |
| Germany | 28 | 0.1% |
| Haiti | 2 | 0.0% |
| Honduras | 38 | 0.1% |
| India | 50 | 0.2% |
| Italy | 19 | 0.1% |
| Laos | 2 | 0.0% |
| Latin America | 164 | 0.6% |
| Liberia | 1 | 0.0% |
| Mexico | 29 | 0.1% |
| Netherlands | 2 | 0.0% |
| Nicaragua | 5 | 0.0% |
| Northern Europe | 17 | 0.1% |
| Oceania | 12 | 0.1% |
| Peru | 33 | 0.1% |
| Philippines | 24 | 0.1% |
| Poland | 8 | 0.0% |
| Russia | 5 | 0.0% |
| Scotland | 8 | 0.0% |
| South Africa | 4 | 0.0% |
| South America | 57 | 0.2% |
| South Central Asia | 50 | 0.2% |
| South Eastern Asia | 26 | 0.1% |
| Southern Europe | 23 | 0.1% |
| Spain | 4 | 0.0% |
| Trinidad and Tobago | 1 | 0.0% |
| Western Africa | 1 | 0.0% |
| Western Europe | 30 | 0.1% | View All 43 Rows |
Sex and Age in Wyoming County
Sex and Age in Wyoming County
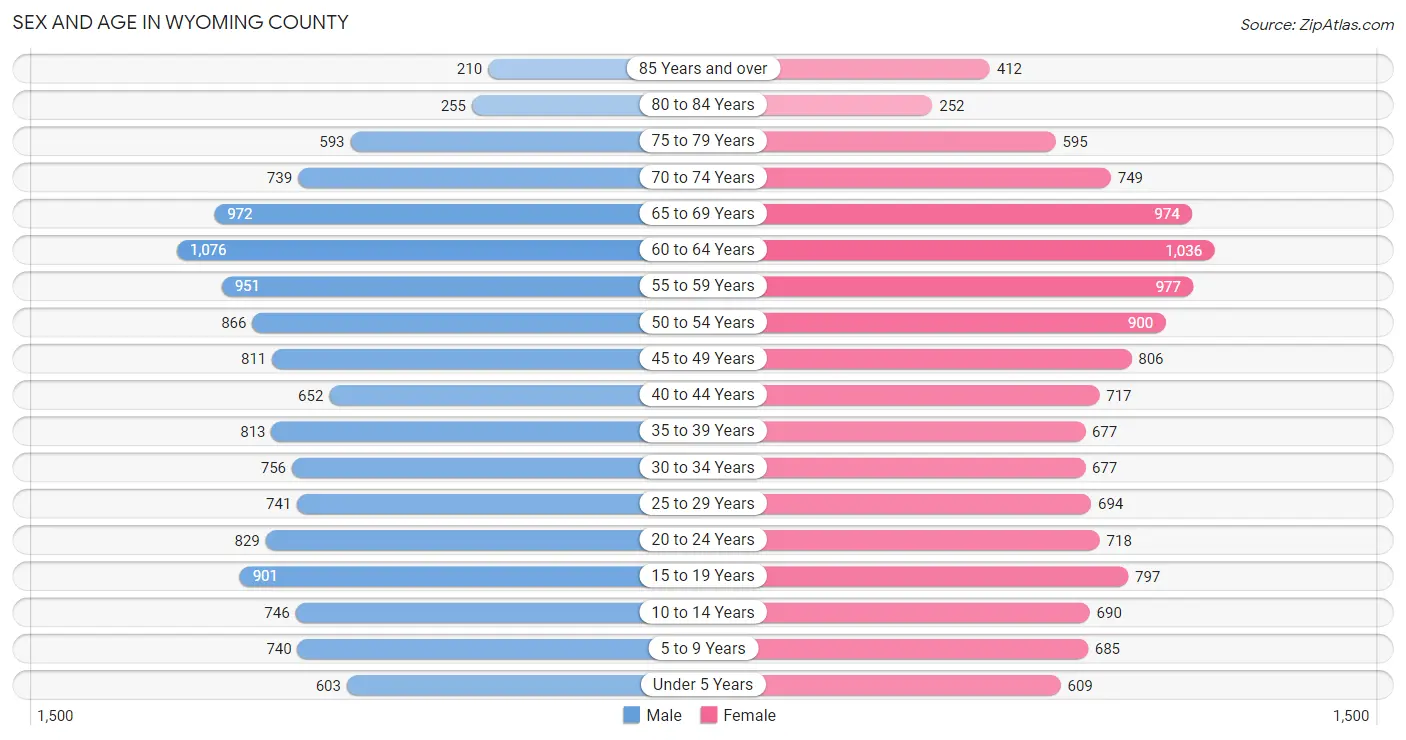
The most populous age groups in Wyoming County are 60 to 64 Years (1,076 | 8.1%) for men and 60 to 64 Years (1,036 | 8.0%) for women.
| Age Bracket | Male | Female |
| Under 5 Years | 603 (4.5%) | 609 (4.7%) |
| 5 to 9 Years | 740 (5.6%) | 685 (5.3%) |
| 10 to 14 Years | 746 (5.6%) | 690 (5.3%) |
| 15 to 19 Years | 901 (6.8%) | 797 (6.1%) |
| 20 to 24 Years | 829 (6.2%) | 718 (5.5%) |
| 25 to 29 Years | 741 (5.6%) | 694 (5.3%) |
| 30 to 34 Years | 756 (5.7%) | 677 (5.2%) |
| 35 to 39 Years | 813 (6.1%) | 677 (5.2%) |
| 40 to 44 Years | 652 (4.9%) | 717 (5.5%) |
| 45 to 49 Years | 811 (6.1%) | 806 (6.2%) |
| 50 to 54 Years | 866 (6.5%) | 900 (6.9%) |
| 55 to 59 Years | 951 (7.2%) | 977 (7.5%) |
| 60 to 64 Years | 1,076 (8.1%) | 1,036 (8.0%) |
| 65 to 69 Years | 972 (7.3%) | 974 (7.5%) |
| 70 to 74 Years | 739 (5.6%) | 749 (5.8%) |
| 75 to 79 Years | 593 (4.5%) | 595 (4.6%) |
| 80 to 84 Years | 255 (1.9%) | 252 (1.9%) |
| 85 Years and over | 210 (1.6%) | 412 (3.2%) |
| Total | 13,254 (100.0%) | 12,965 (100.0%) |
Families and Households in Wyoming County
Median Family Size in Wyoming County
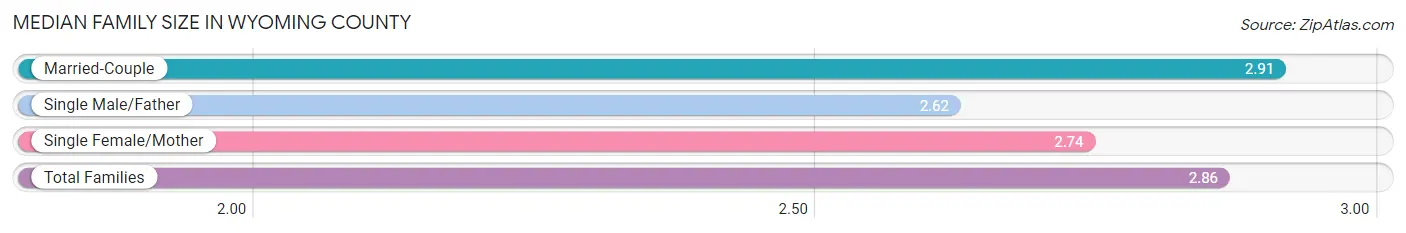
The median family size in Wyoming County is 2.86 persons per family, with married-couple families (5,376 | 76.2%) accounting for the largest median family size of 2.91 persons per family. On the other hand, single male/father families (578 | 8.2%) represent the smallest median family size with 2.62 persons per family.
| Family Type | # Families | Family Size |
| Married-Couple | 5,376 (76.2%) | 2.91 |
| Single Male/Father | 578 (8.2%) | 2.62 |
| Single Female/Mother | 1,104 (15.6%) | 2.74 |
| Total Families | 7,058 (100.0%) | 2.86 |
Median Household Size in Wyoming County
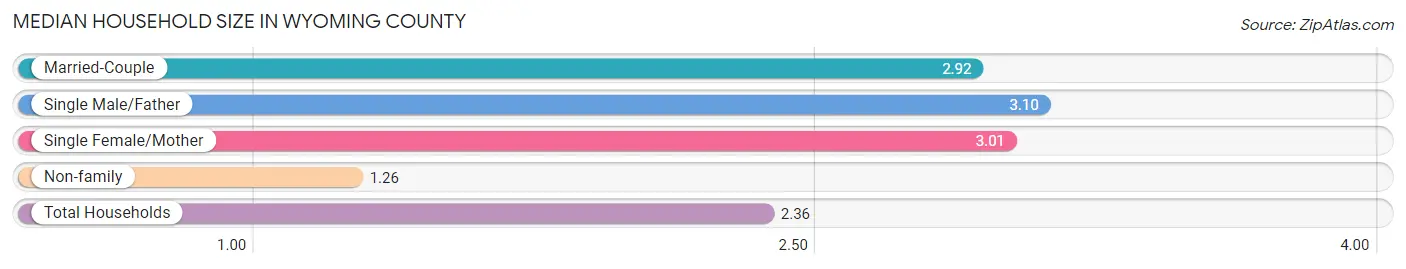
The median household size in Wyoming County is 2.36 persons per household, with single male/father households (578 | 5.4%) accounting for the largest median household size of 3.1 persons per household. non-family households (3,730 | 34.6%) represent the smallest median household size with 1.26 persons per household.
| Household Type | # Households | Household Size |
| Married-Couple | 5,376 (49.8%) | 2.92 |
| Single Male/Father | 578 (5.4%) | 3.10 |
| Single Female/Mother | 1,104 (10.2%) | 3.01 |
| Non-family | 3,730 (34.6%) | 1.26 |
| Total Households | 10,788 (100.0%) | 2.36 |
Household Size by Marriage Status in Wyoming County
Out of a total of 10,788 households in Wyoming County, 7,058 (65.4%) are family households, while 3,730 (34.6%) are nonfamily households. The most numerous type of family households are 2-person households, comprising 3,599, and the most common type of nonfamily households are 1-person households, comprising 2,962.
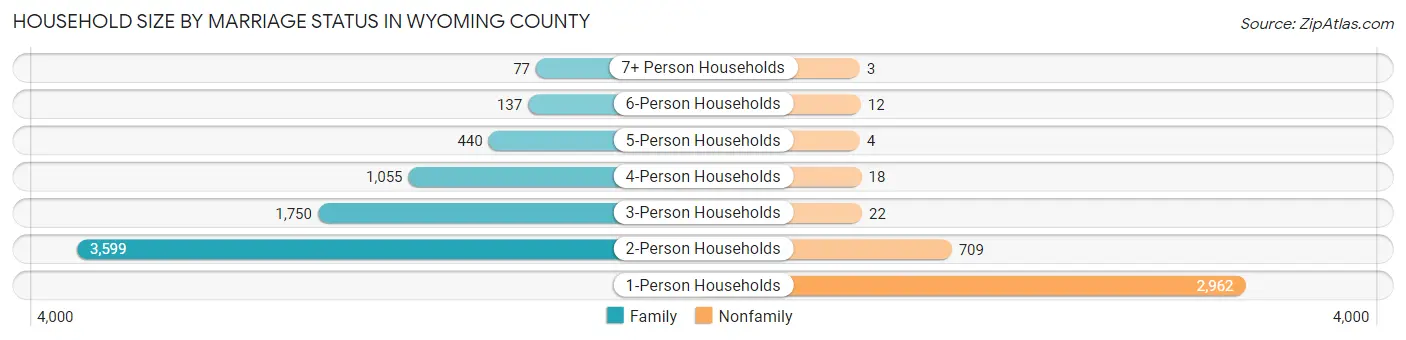
| Household Size | Family Households | Nonfamily Households |
| 1-Person Households | - | 2,962 (27.5%) |
| 2-Person Households | 3,599 (33.4%) | 709 (6.6%) |
| 3-Person Households | 1,750 (16.2%) | 22 (0.2%) |
| 4-Person Households | 1,055 (9.8%) | 18 (0.2%) |
| 5-Person Households | 440 (4.1%) | 4 (0.0%) |
| 6-Person Households | 137 (1.3%) | 12 (0.1%) |
| 7+ Person Households | 77 (0.7%) | 3 (0.0%) |
| Total | 7,058 (65.4%) | 3,730 (34.6%) |
Female Fertility in Wyoming County
Fertility by Age in Wyoming County
Average fertility rate in Wyoming County is 67.0 births per 1,000 women. Women in the age bracket of 20 to 34 years have the highest fertility rate with 119.0 births per 1,000 women. Women in the age bracket of 20 to 34 years acount for 71.1% of all women with births.
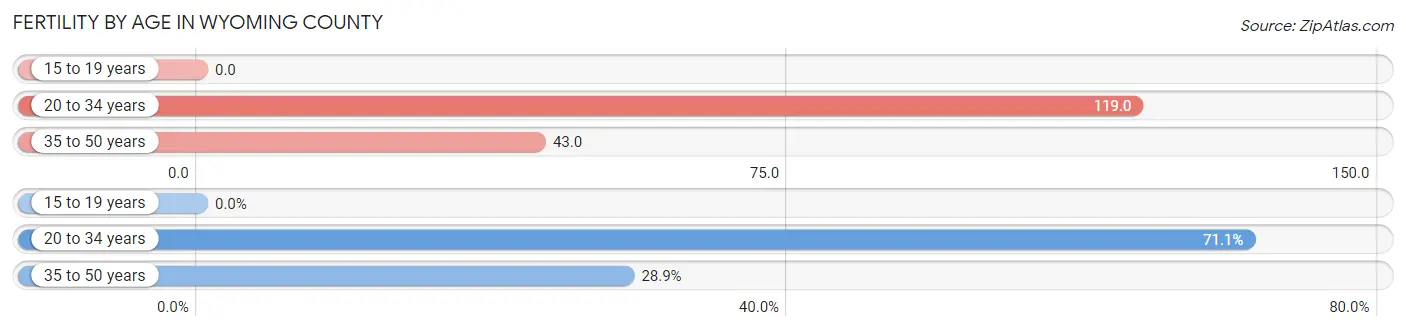
| Age Bracket | Women with Births | Births / 1,000 Women |
| 15 to 19 years | 0 (0.0%) | 0.0 |
| 20 to 34 years | 248 (71.1%) | 119.0 |
| 35 to 50 years | 101 (28.9%) | 43.0 |
| Total | 349 (100.0%) | 67.0 |
Fertility by Age by Marriage Status in Wyoming County
57.9% of women with births (349) in Wyoming County are married. The highest percentage of unmarried women with births falls into 20 to 34 years age bracket with 59.3% of them unmarried at the time of birth, while the lowest percentage of unmarried women with births belong to 35 to 50 years age bracket with 0.0% of them unmarried.
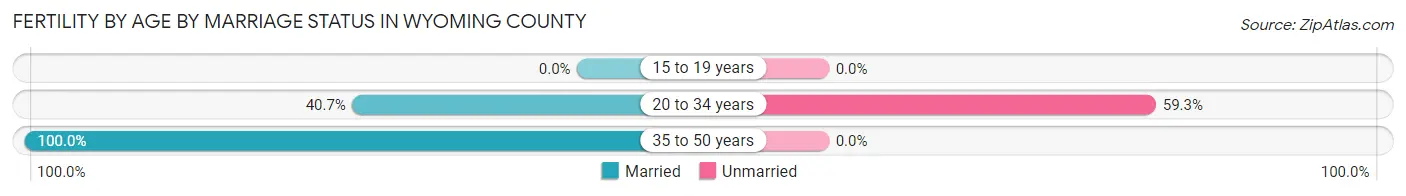
| Age Bracket | Married | Unmarried |
| 15 to 19 years | 0 (0.0%) | 0 (0.0%) |
| 20 to 34 years | 101 (40.7%) | 147 (59.3%) |
| 35 to 50 years | 101 (100.0%) | 0 (0.0%) |
| Total | 202 (57.9%) | 147 (42.1%) |
Fertility by Education in Wyoming County
Average fertility rate in Wyoming County is 67.0 births per 1,000 women. Women with the education attainment of high school diploma have the highest fertility rate of 112.0 births per 1,000 women, while women with the education attainment of less than high school have the lowest fertility at 12.0 births per 1,000 women. Women with the education attainment of high school diploma represent 54.4% of all women with births.
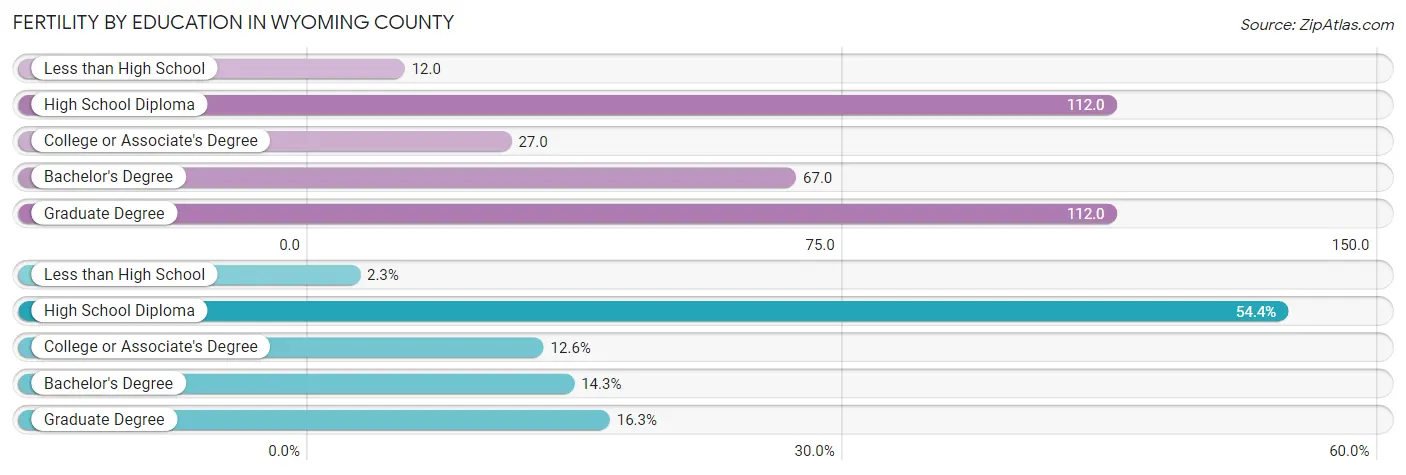
| Educational Attainment | Women with Births | Births / 1,000 Women |
| Less than High School | 8 (2.3%) | 12.0 |
| High School Diploma | 190 (54.4%) | 112.0 |
| College or Associate's Degree | 44 (12.6%) | 27.0 |
| Bachelor's Degree | 50 (14.3%) | 67.0 |
| Graduate Degree | 57 (16.3%) | 112.0 |
| Total | 349 (100.0%) | 67.0 |
Fertility by Education by Marriage Status in Wyoming County
42.1% of women with births in Wyoming County are unmarried. Women with the educational attainment of bachelor's degree are most likely to be married with 90.0% of them married at childbirth, while women with the educational attainment of less than high school are least likely to be married with 87.5% of them unmarried at childbirth.
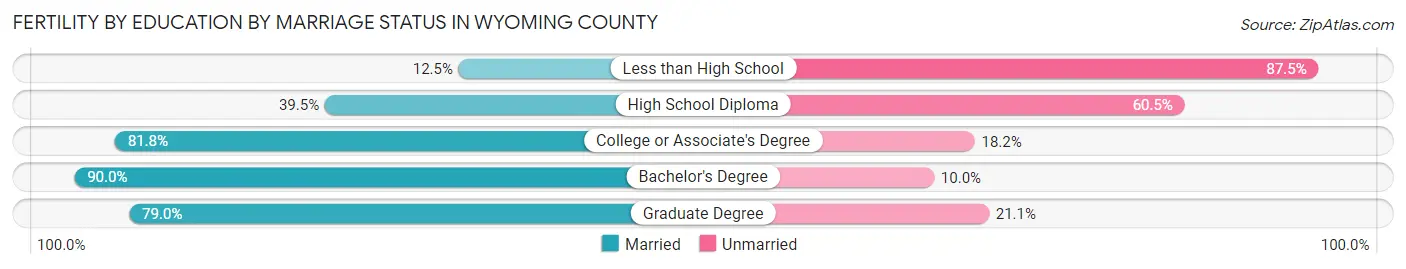
| Educational Attainment | Married | Unmarried |
| Less than High School | 1 (12.5%) | 7 (87.5%) |
| High School Diploma | 75 (39.5%) | 115 (60.5%) |
| College or Associate's Degree | 36 (81.8%) | 8 (18.2%) |
| Bachelor's Degree | 45 (90.0%) | 5 (10.0%) |
| Graduate Degree | 45 (78.9%) | 12 (21.0%) |
| Total | 202 (57.9%) | 147 (42.1%) |
Employment Characteristics in Wyoming County
Employment by Class of Employer in Wyoming County
Among the 11,892 employed individuals in Wyoming County, private company employees (8,538 | 71.8%), not-for-profit organizations (1,031 | 8.7%), and local government employees (751 | 6.3%) make up the most common classes of employment.
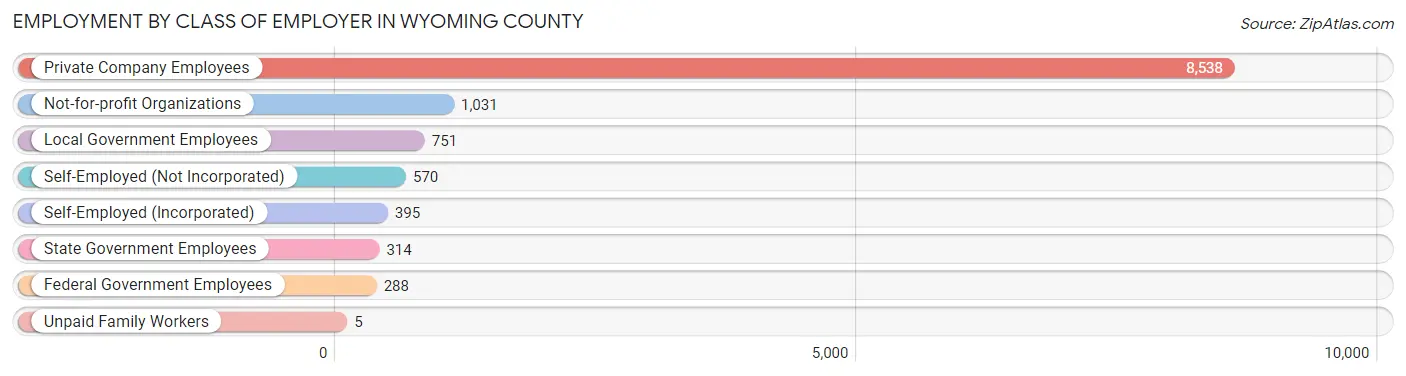
| Employer Class | # Employees | % Employees |
| Private Company Employees | 8,538 | 71.8% |
| Self-Employed (Incorporated) | 395 | 3.3% |
| Self-Employed (Not Incorporated) | 570 | 4.8% |
| Not-for-profit Organizations | 1,031 | 8.7% |
| Local Government Employees | 751 | 6.3% |
| State Government Employees | 314 | 2.6% |
| Federal Government Employees | 288 | 2.4% |
| Unpaid Family Workers | 5 | 0.0% |
| Total | 11,892 | 100.0% |
Employment Status by Age in Wyoming County
According to the labor force statistics for Wyoming County, out of the total population over 16 years of age (21,842), 57.8% or 12,625 individuals are in the labor force, with 4.5% or 568 of them unemployed. The age group with the highest labor force participation rate is 25 to 29 years, with 84.3% or 1,210 individuals in the labor force. Within the labor force, the 16 to 19 years age range has the highest percentage of unemployed individuals, with 8.9% or 58 of them being unemployed.
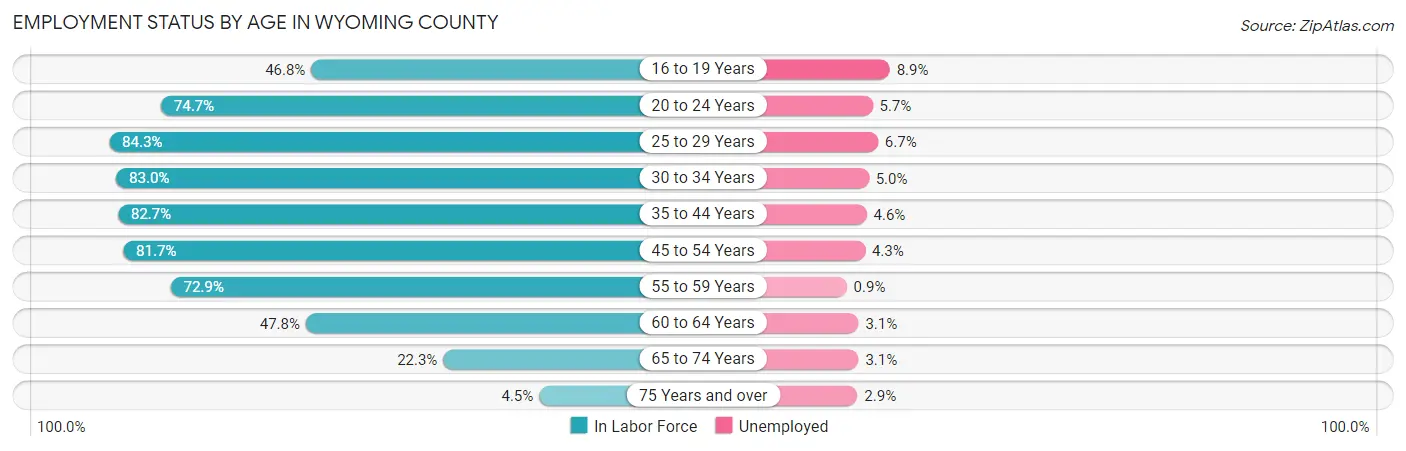
| Age Bracket | In Labor Force | Unemployed |
| 16 to 19 Years | 652 (46.8%) | 58 (8.9%) |
| 20 to 24 Years | 1,156 (74.7%) | 66 (5.7%) |
| 25 to 29 Years | 1,210 (84.3%) | 81 (6.7%) |
| 30 to 34 Years | 1,189 (83.0%) | 59 (5.0%) |
| 35 to 44 Years | 2,364 (82.7%) | 109 (4.6%) |
| 45 to 54 Years | 2,764 (81.7%) | 119 (4.3%) |
| 55 to 59 Years | 1,406 (72.9%) | 13 (0.9%) |
| 60 to 64 Years | 1,010 (47.8%) | 31 (3.1%) |
| 65 to 74 Years | 766 (22.3%) | 24 (3.1%) |
| 75 Years and over | 104 (4.5%) | 3 (2.9%) |
| Total | 12,625 (57.8%) | 568 (4.5%) |
Employment Status by Educational Attainment in Wyoming County
According to labor force statistics for Wyoming County, 75.6% of individuals (9,941) out of the total population between 25 and 64 years of age (13,150) are in the labor force, with 4.1% or 408 of them being unemployed. The group with the highest labor force participation rate are those with the educational attainment of bachelor's degree or higher, with 87.0% or 2,533 individuals in the labor force. Within the labor force, individuals with less than high school education have the highest percentage of unemployment, with 13.4% or 60 of them being unemployed.
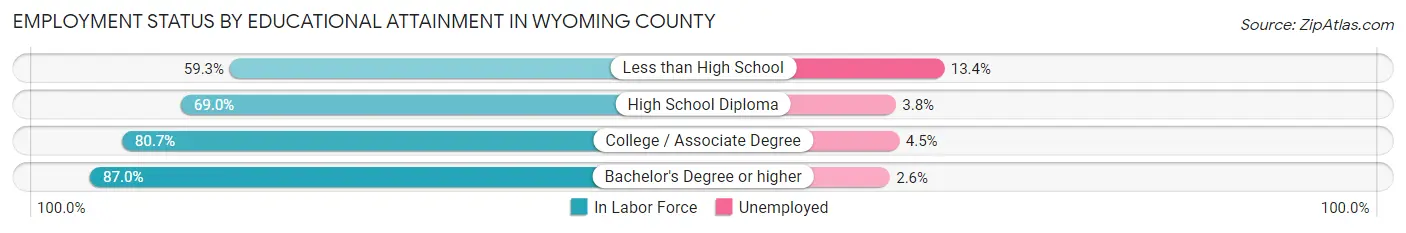
| Educational Attainment | In Labor Force | Unemployed |
| Less than High School | 447 (59.3%) | 101 (13.4%) |
| High School Diploma | 4,062 (69.0%) | 224 (3.8%) |
| College / Associate Degree | 2,903 (80.7%) | 162 (4.5%) |
| Bachelor's Degree or higher | 2,533 (87.0%) | 76 (2.6%) |
| Total | 9,941 (75.6%) | 539 (4.1%) |
Employment Occupations by Sex in Wyoming County
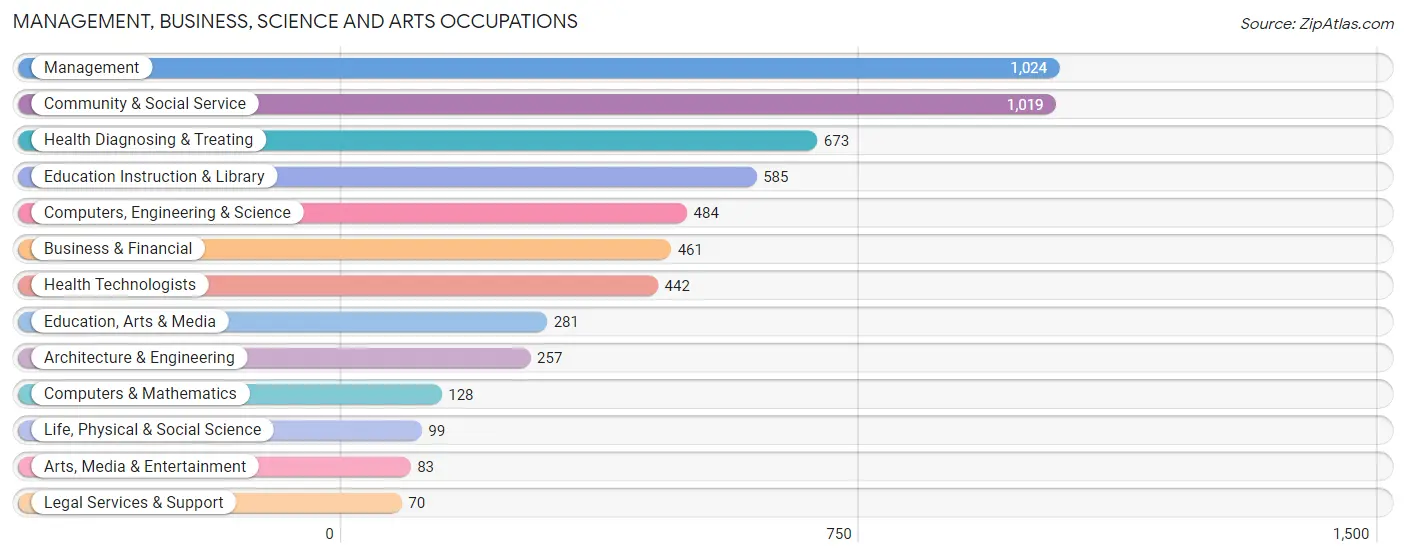
Management, Business, Science and Arts Occupations
The most common Management, Business, Science and Arts occupations in Wyoming County are Management (1,024 | 8.5%), Community & Social Service (1,019 | 8.5%), Health Diagnosing & Treating (673 | 5.6%), Education Instruction & Library (585 | 4.9%), and Computers, Engineering & Science (484 | 4.0%).
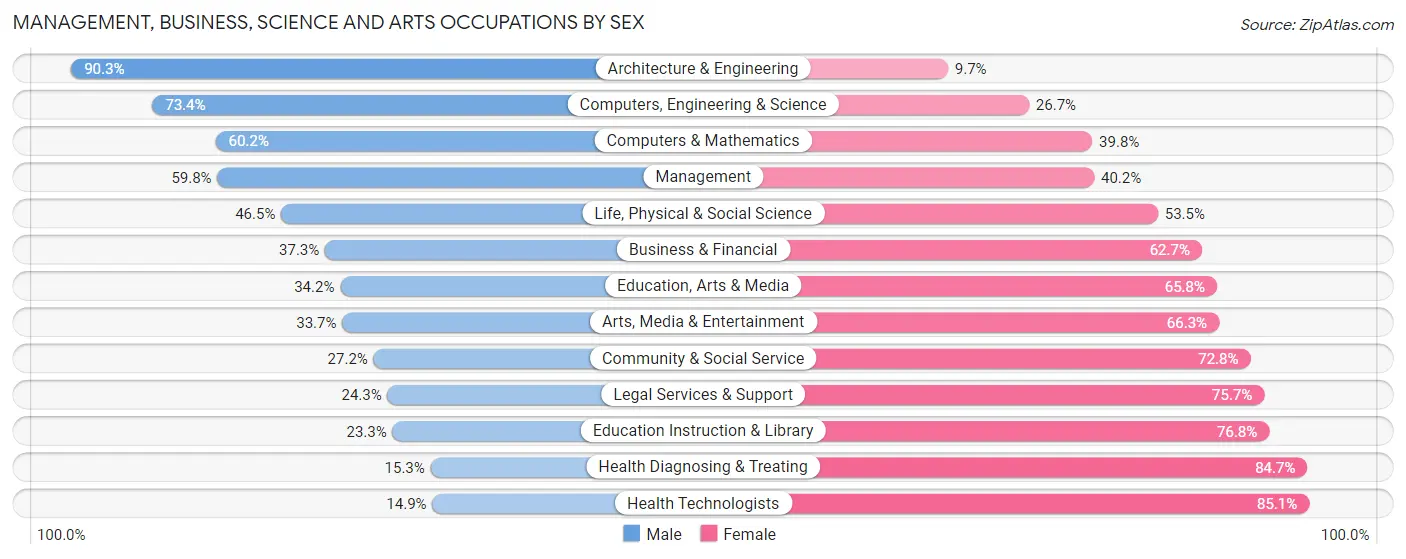
Management, Business, Science and Arts Occupations by Sex
Within the Management, Business, Science and Arts occupations in Wyoming County, the most male-oriented occupations are Architecture & Engineering (90.3%), Computers, Engineering & Science (73.4%), and Computers & Mathematics (60.2%), while the most female-oriented occupations are Health Technologists (85.1%), Health Diagnosing & Treating (84.7%), and Education Instruction & Library (76.7%).
| Occupation | Male | Female |
| Management | 612 (59.8%) | 412 (40.2%) |
| Business & Financial | 172 (37.3%) | 289 (62.7%) |
| Computers, Engineering & Science | 355 (73.4%) | 129 (26.7%) |
| Computers & Mathematics | 77 (60.2%) | 51 (39.8%) |
| Architecture & Engineering | 232 (90.3%) | 25 (9.7%) |
| Life, Physical & Social Science | 46 (46.5%) | 53 (53.5%) |
| Community & Social Service | 277 (27.2%) | 742 (72.8%) |
| Education, Arts & Media | 96 (34.2%) | 185 (65.8%) |
| Legal Services & Support | 17 (24.3%) | 53 (75.7%) |
| Education Instruction & Library | 136 (23.3%) | 449 (76.7%) |
| Arts, Media & Entertainment | 28 (33.7%) | 55 (66.3%) |
| Health Diagnosing & Treating | 103 (15.3%) | 570 (84.7%) |
| Health Technologists | 66 (14.9%) | 376 (85.1%) |
| Total (Category) | 1,519 (41.5%) | 2,142 (58.5%) |
| Total (Overall) | 6,528 (54.2%) | 5,520 (45.8%) |
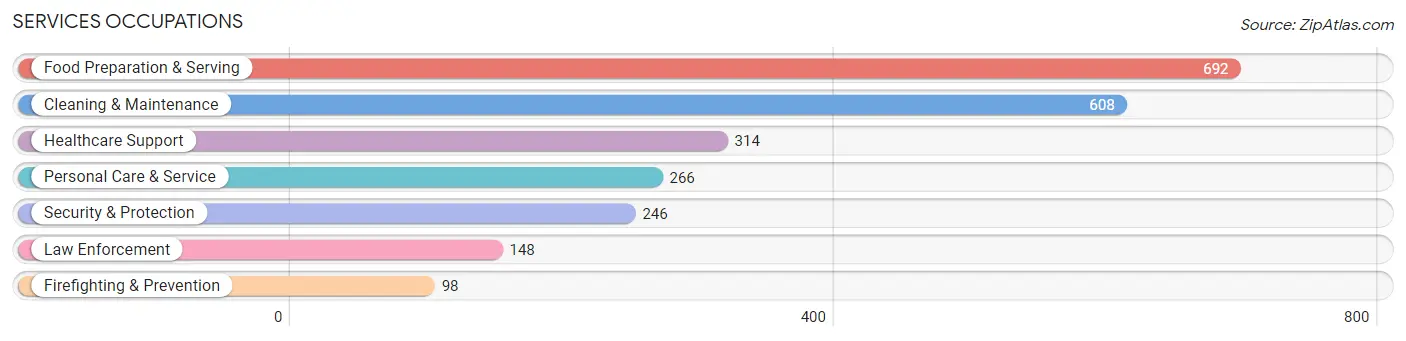
Services Occupations
The most common Services occupations in Wyoming County are Food Preparation & Serving (692 | 5.7%), Cleaning & Maintenance (608 | 5.1%), Healthcare Support (314 | 2.6%), Personal Care & Service (266 | 2.2%), and Security & Protection (246 | 2.0%).
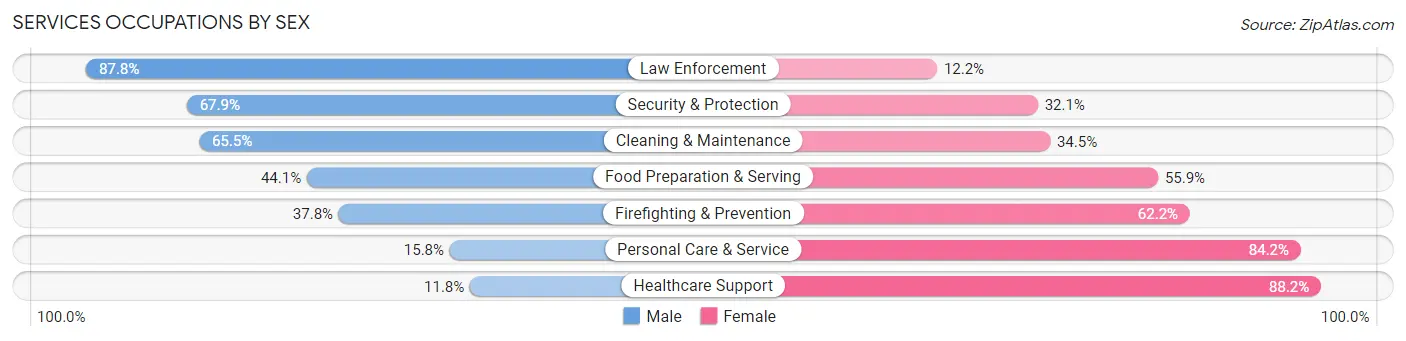
Services Occupations by Sex
Within the Services occupations in Wyoming County, the most male-oriented occupations are Law Enforcement (87.8%), Security & Protection (67.9%), and Cleaning & Maintenance (65.5%), while the most female-oriented occupations are Healthcare Support (88.2%), Personal Care & Service (84.2%), and Firefighting & Prevention (62.2%).
| Occupation | Male | Female |
| Healthcare Support | 37 (11.8%) | 277 (88.2%) |
| Security & Protection | 167 (67.9%) | 79 (32.1%) |
| Firefighting & Prevention | 37 (37.8%) | 61 (62.2%) |
| Law Enforcement | 130 (87.8%) | 18 (12.2%) |
| Food Preparation & Serving | 305 (44.1%) | 387 (55.9%) |
| Cleaning & Maintenance | 398 (65.5%) | 210 (34.5%) |
| Personal Care & Service | 42 (15.8%) | 224 (84.2%) |
| Total (Category) | 949 (44.6%) | 1,177 (55.4%) |
| Total (Overall) | 6,528 (54.2%) | 5,520 (45.8%) |
Sales and Office Occupations
The most common Sales and Office occupations in Wyoming County are Office & Administration (1,204 | 10.0%), and Sales & Related (1,018 | 8.5%).

Sales and Office Occupations by Sex

| Occupation | Male | Female |
| Sales & Related | 453 (44.5%) | 565 (55.5%) |
| Office & Administration | 246 (20.4%) | 958 (79.6%) |
| Total (Category) | 699 (31.5%) | 1,523 (68.5%) |
| Total (Overall) | 6,528 (54.2%) | 5,520 (45.8%) |
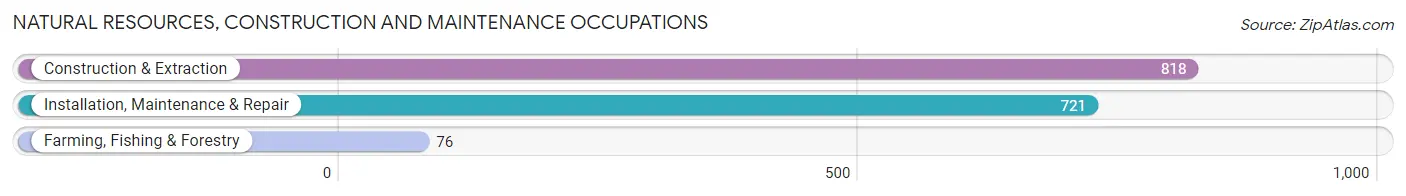
Natural Resources, Construction and Maintenance Occupations
The most common Natural Resources, Construction and Maintenance occupations in Wyoming County are Construction & Extraction (818 | 6.8%), Installation, Maintenance & Repair (721 | 6.0%), and Farming, Fishing & Forestry (76 | 0.6%).
Natural Resources, Construction and Maintenance Occupations by Sex
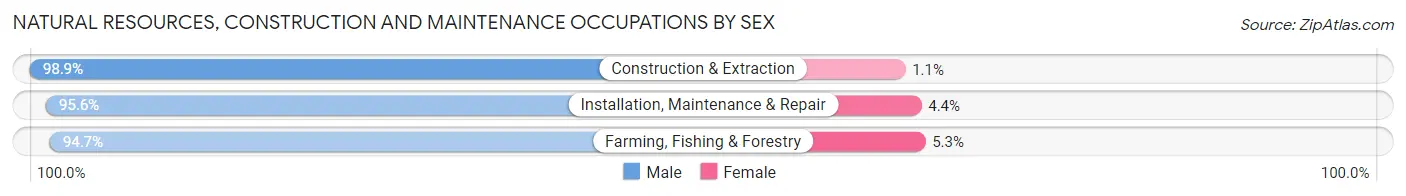
| Occupation | Male | Female |
| Farming, Fishing & Forestry | 72 (94.7%) | 4 (5.3%) |
| Construction & Extraction | 809 (98.9%) | 9 (1.1%) |
| Installation, Maintenance & Repair | 689 (95.6%) | 32 (4.4%) |
| Total (Category) | 1,570 (97.2%) | 45 (2.8%) |
| Total (Overall) | 6,528 (54.2%) | 5,520 (45.8%) |
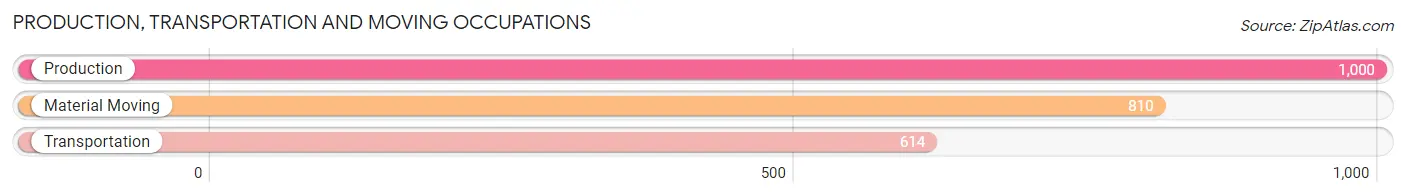
Production, Transportation and Moving Occupations
The most common Production, Transportation and Moving occupations in Wyoming County are Production (1,000 | 8.3%), Material Moving (810 | 6.7%), and Transportation (614 | 5.1%).
Production, Transportation and Moving Occupations by Sex
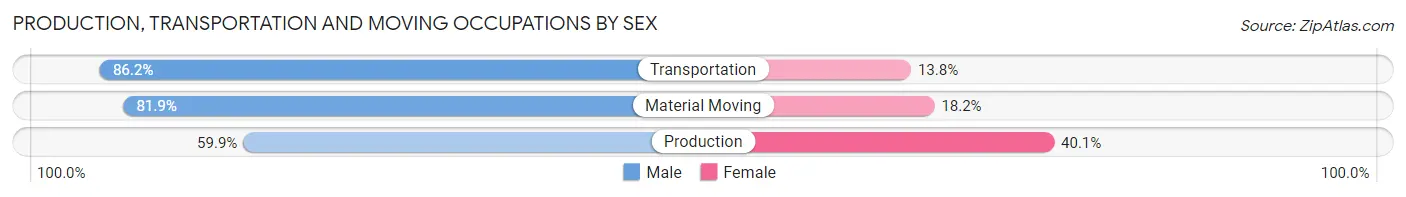
| Occupation | Male | Female |
| Production | 599 (59.9%) | 401 (40.1%) |
| Transportation | 529 (86.2%) | 85 (13.8%) |
| Material Moving | 663 (81.9%) | 147 (18.1%) |
| Total (Category) | 1,791 (73.9%) | 633 (26.1%) |
| Total (Overall) | 6,528 (54.2%) | 5,520 (45.8%) |
Employment Industries by Sex in Wyoming County
Employment Industries in Wyoming County
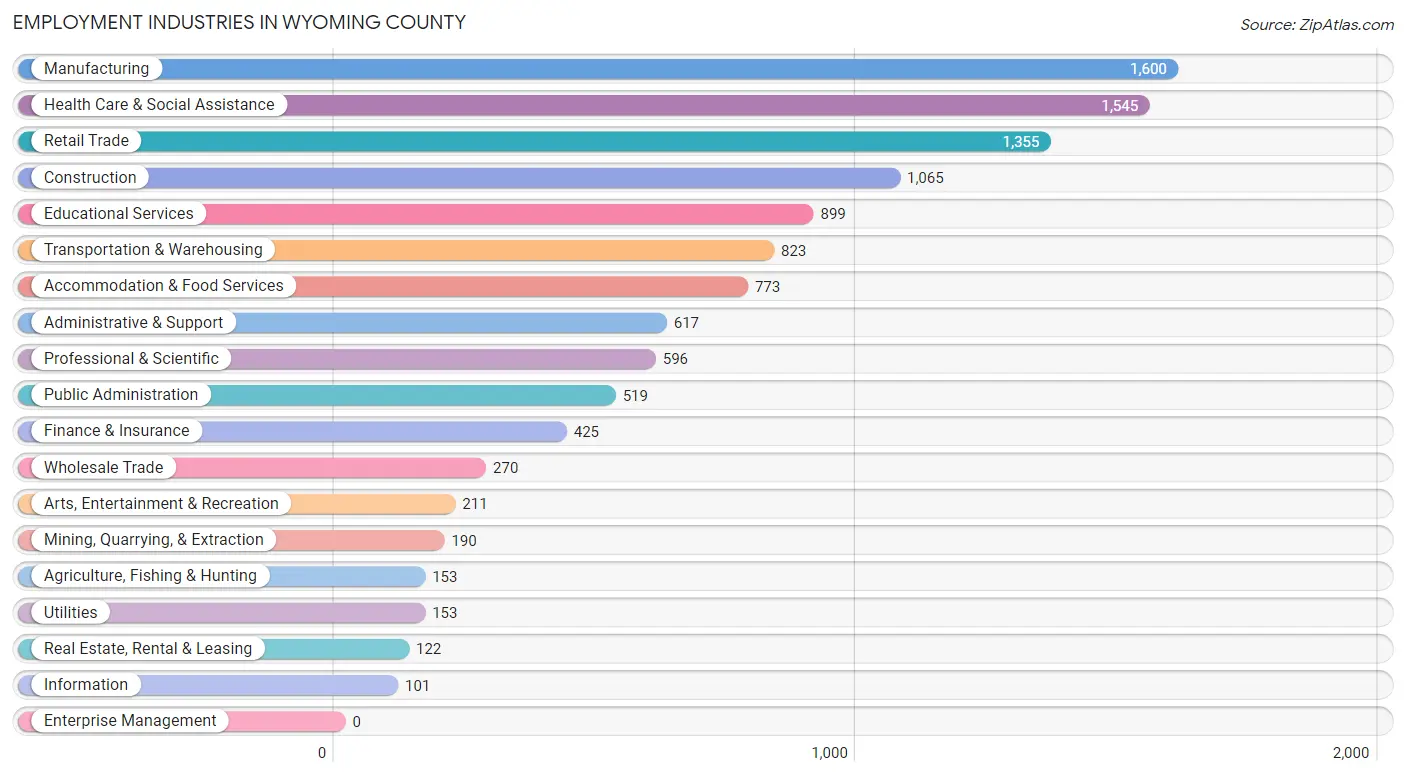
The major employment industries in Wyoming County include Manufacturing (1,600 | 13.3%), Health Care & Social Assistance (1,545 | 12.8%), Retail Trade (1,355 | 11.3%), Construction (1,065 | 8.8%), and Educational Services (899 | 7.5%).
Employment Industries by Sex in Wyoming County
The Wyoming County industries that see more men than women are Construction (97.2%), Utilities (94.8%), and Mining, Quarrying, & Extraction (88.9%), whereas the industries that tend to have a higher number of women are Health Care & Social Assistance (83.5%), Finance & Insurance (71.8%), and Educational Services (67.8%).
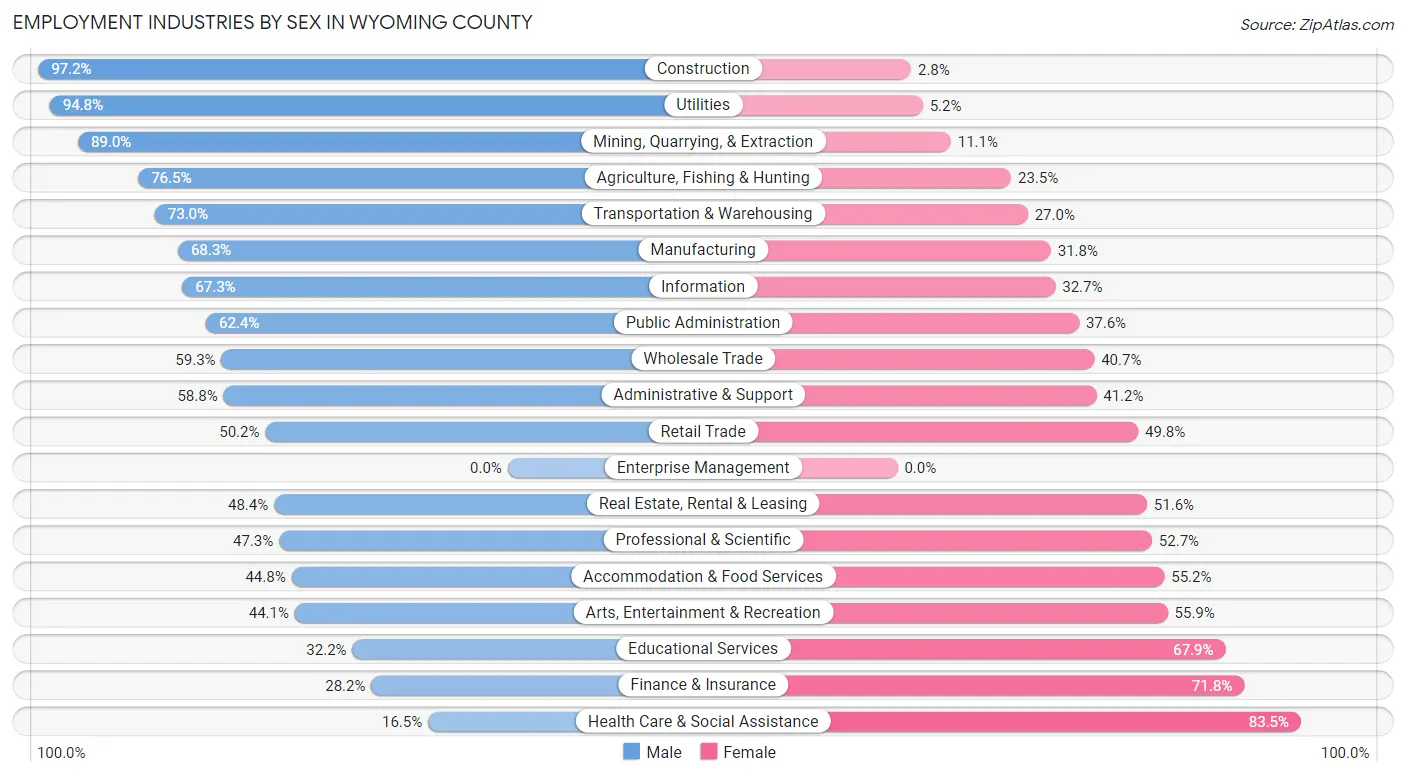
| Industry | Male | Female |
| Agriculture, Fishing & Hunting | 117 (76.5%) | 36 (23.5%) |
| Mining, Quarrying, & Extraction | 169 (88.9%) | 21 (11.1%) |
| Construction | 1,035 (97.2%) | 30 (2.8%) |
| Manufacturing | 1,092 (68.2%) | 508 (31.8%) |
| Wholesale Trade | 160 (59.3%) | 110 (40.7%) |
| Retail Trade | 680 (50.2%) | 675 (49.8%) |
| Transportation & Warehousing | 601 (73.0%) | 222 (27.0%) |
| Utilities | 145 (94.8%) | 8 (5.2%) |
| Information | 68 (67.3%) | 33 (32.7%) |
| Finance & Insurance | 120 (28.2%) | 305 (71.8%) |
| Real Estate, Rental & Leasing | 59 (48.4%) | 63 (51.6%) |
| Professional & Scientific | 282 (47.3%) | 314 (52.7%) |
| Enterprise Management | 0 (0.0%) | 0 (0.0%) |
| Administrative & Support | 363 (58.8%) | 254 (41.2%) |
| Educational Services | 289 (32.2%) | 610 (67.8%) |
| Health Care & Social Assistance | 255 (16.5%) | 1,290 (83.5%) |
| Arts, Entertainment & Recreation | 93 (44.1%) | 118 (55.9%) |
| Accommodation & Food Services | 346 (44.8%) | 427 (55.2%) |
| Public Administration | 324 (62.4%) | 195 (37.6%) |
| Total | 6,528 (54.2%) | 5,520 (45.8%) |
Education in Wyoming County
School Enrollment in Wyoming County
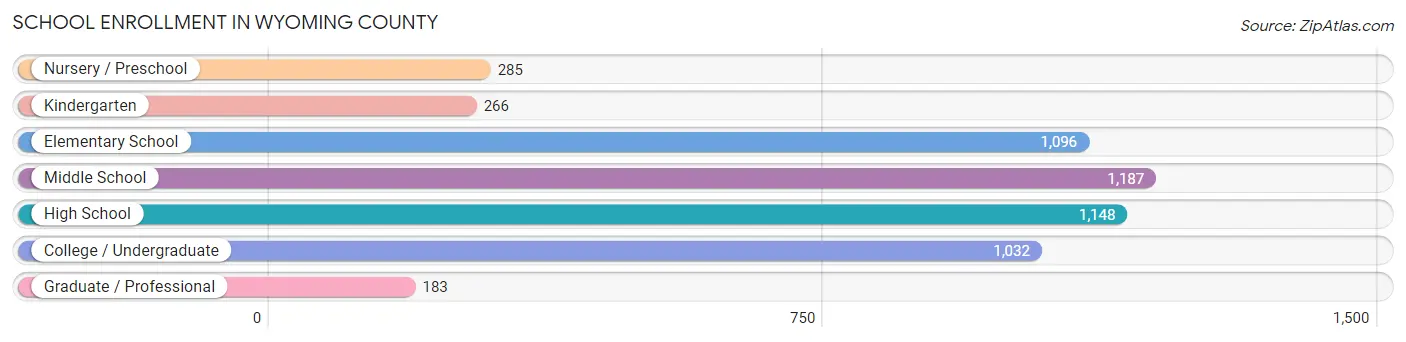
The most common levels of schooling among the 5,197 students in Wyoming County are middle school (1,187 | 22.8%), high school (1,148 | 22.1%), and elementary school (1,096 | 21.1%).
| School Level | # Students | % Students |
| Nursery / Preschool | 285 | 5.5% |
| Kindergarten | 266 | 5.1% |
| Elementary School | 1,096 | 21.1% |
| Middle School | 1,187 | 22.8% |
| High School | 1,148 | 22.1% |
| College / Undergraduate | 1,032 | 19.9% |
| Graduate / Professional | 183 | 3.5% |
| Total | 5,197 | 100.0% |
School Enrollment by Age by Funding Source in Wyoming County
Out of a total of 5,197 students who are enrolled in schools in Wyoming County, 1,206 (23.2%) attend a private institution, while the remaining 3,991 (76.8%) are enrolled in public schools. The age group of 18 to 19 year olds has the highest likelihood of being enrolled in private schools, with 350 (64.0% in the age bracket) enrolled. Conversely, the age group of 15 to 17 year olds has the lowest likelihood of being enrolled in a private school, with 830 (90.4% in the age bracket) attending a public institution.
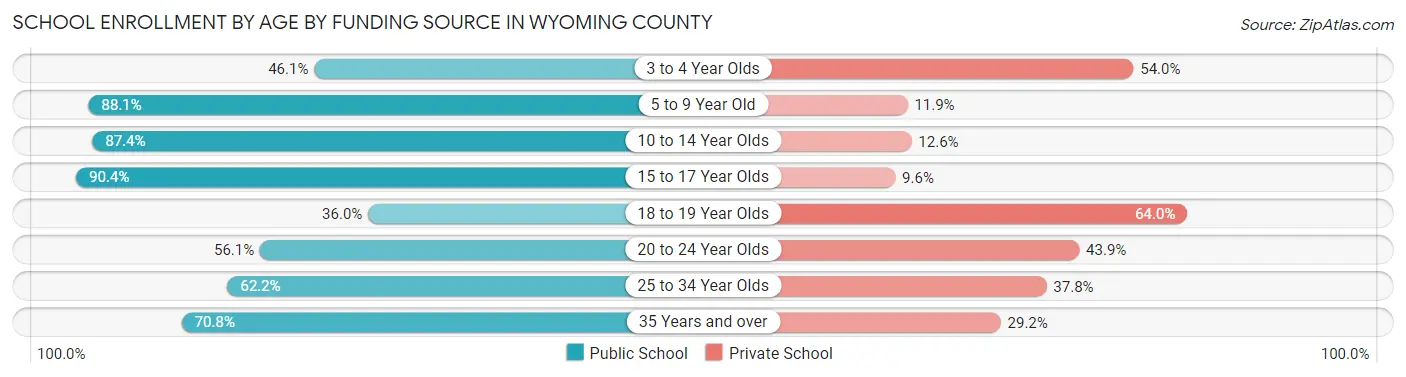
| Age Bracket | Public School | Private School |
| 3 to 4 Year Olds | 99 (46.1%) | 116 (53.9%) |
| 5 to 9 Year Old | 1,150 (88.1%) | 155 (11.9%) |
| 10 to 14 Year Olds | 1,225 (87.4%) | 177 (12.6%) |
| 15 to 17 Year Olds | 830 (90.4%) | 88 (9.6%) |
| 18 to 19 Year Olds | 197 (36.0%) | 350 (64.0%) |
| 20 to 24 Year Olds | 265 (56.1%) | 207 (43.9%) |
| 25 to 34 Year Olds | 89 (62.2%) | 54 (37.8%) |
| 35 Years and over | 138 (70.8%) | 57 (29.2%) |
| Total | 3,991 (76.8%) | 1,206 (23.2%) |
Educational Attainment by Field of Study in Wyoming County
Education (832 | 18.8%), business (633 | 14.3%), science & technology (579 | 13.1%), arts & humanities (440 | 10.0%), and bio, nature & agricultural (320 | 7.2%) are the most common fields of study among 4,416 individuals in Wyoming County who have obtained a bachelor's degree or higher.
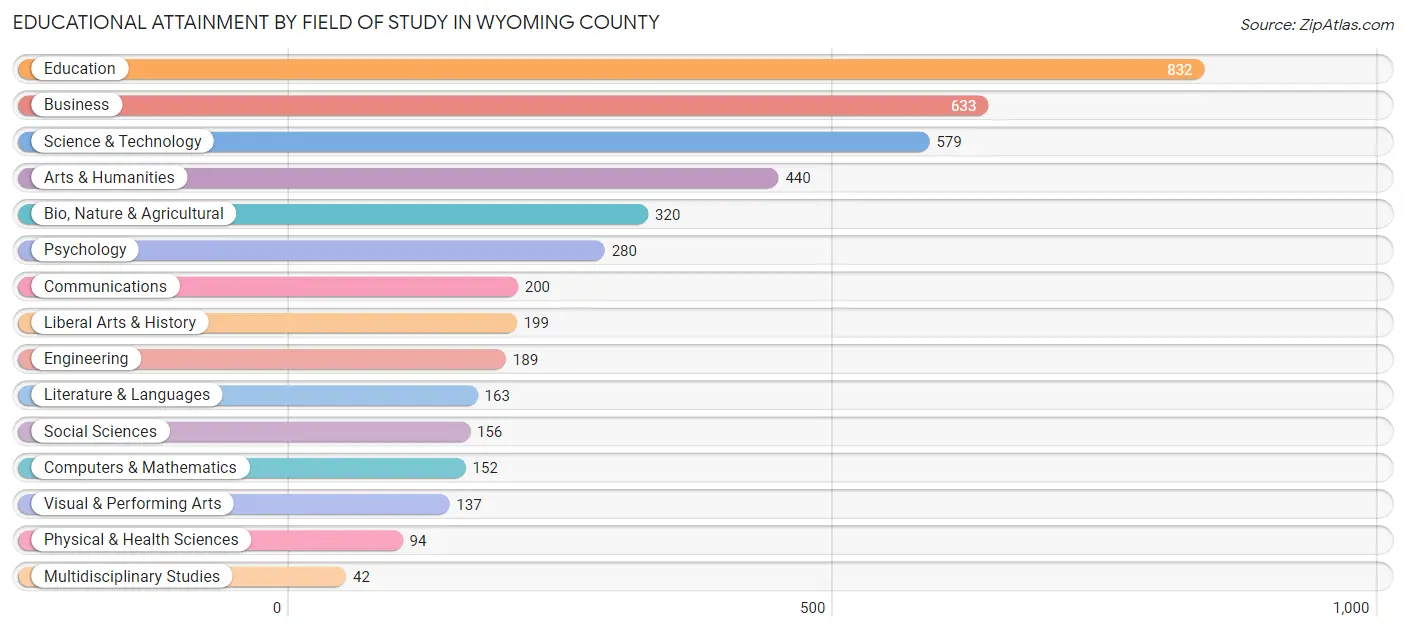
| Field of Study | # Graduates | % Graduates |
| Computers & Mathematics | 152 | 3.4% |
| Bio, Nature & Agricultural | 320 | 7.2% |
| Physical & Health Sciences | 94 | 2.1% |
| Psychology | 280 | 6.3% |
| Social Sciences | 156 | 3.5% |
| Engineering | 189 | 4.3% |
| Multidisciplinary Studies | 42 | 0.9% |
| Science & Technology | 579 | 13.1% |
| Business | 633 | 14.3% |
| Education | 832 | 18.8% |
| Literature & Languages | 163 | 3.7% |
| Liberal Arts & History | 199 | 4.5% |
| Visual & Performing Arts | 137 | 3.1% |
| Communications | 200 | 4.5% |
| Arts & Humanities | 440 | 10.0% |
| Total | 4,416 | 100.0% |
Transportation & Commute in Wyoming County
Vehicle Availability by Sex in Wyoming County
The most prevalent vehicle ownership categories in Wyoming County are males with 2 vehicles (2,944, accounting for 45.8%) and females with 2 vehicles (2,382, making up 55.4%).
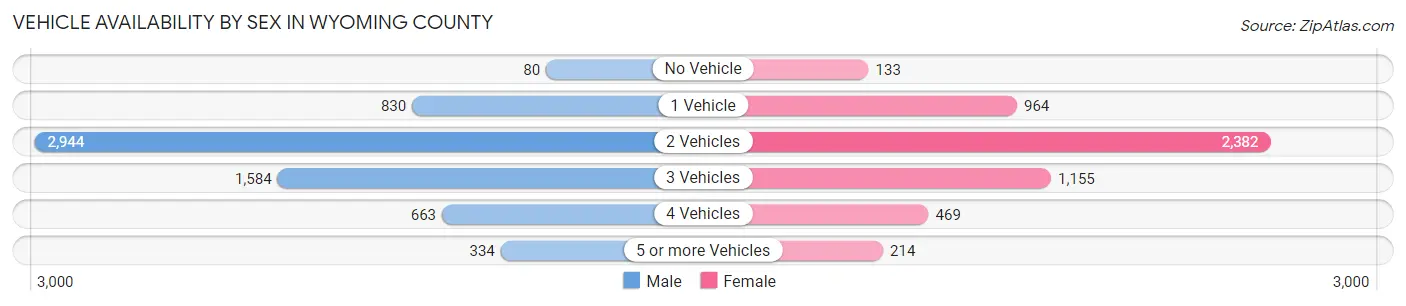
| Vehicles Available | Male | Female |
| No Vehicle | 80 (1.2%) | 133 (2.5%) |
| 1 Vehicle | 830 (12.9%) | 964 (18.1%) |
| 2 Vehicles | 2,944 (45.8%) | 2,382 (44.8%) |
| 3 Vehicles | 1,584 (24.6%) | 1,155 (21.7%) |
| 4 Vehicles | 663 (10.3%) | 469 (8.8%) |
| 5 or more Vehicles | 334 (5.2%) | 214 (4.0%) |
| Total | 6,435 (100.0%) | 5,317 (100.0%) |
Commute Time in Wyoming County
The most frequently occuring commute durations in Wyoming County are 15 to 19 minutes (1,911 commuters, 17.3%), 20 to 24 minutes (1,541 commuters, 13.9%), and 30 to 34 minutes (1,524 commuters, 13.8%).
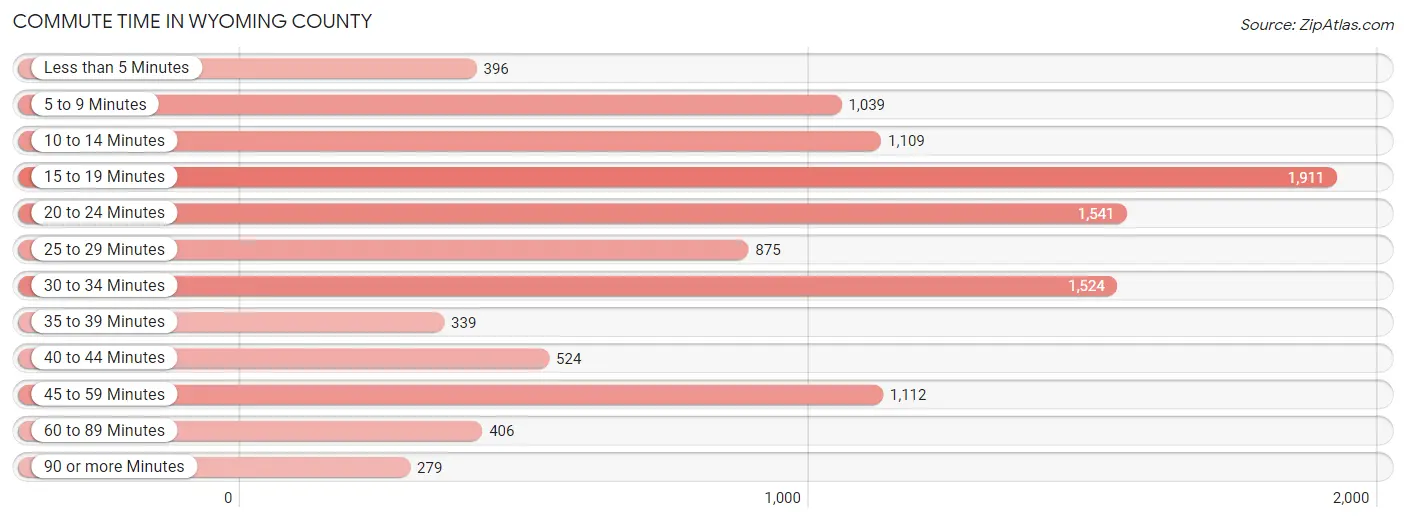
| Commute Time | # Commuters | % Commuters |
| Less than 5 Minutes | 396 | 3.6% |
| 5 to 9 Minutes | 1,039 | 9.4% |
| 10 to 14 Minutes | 1,109 | 10.0% |
| 15 to 19 Minutes | 1,911 | 17.3% |
| 20 to 24 Minutes | 1,541 | 13.9% |
| 25 to 29 Minutes | 875 | 7.9% |
| 30 to 34 Minutes | 1,524 | 13.8% |
| 35 to 39 Minutes | 339 | 3.1% |
| 40 to 44 Minutes | 524 | 4.7% |
| 45 to 59 Minutes | 1,112 | 10.1% |
| 60 to 89 Minutes | 406 | 3.7% |
| 90 or more Minutes | 279 | 2.5% |
Commute Time by Sex in Wyoming County
The most common commute times in Wyoming County are 15 to 19 minutes (945 commuters, 15.4%) for males and 15 to 19 minutes (966 commuters, 19.6%) for females.
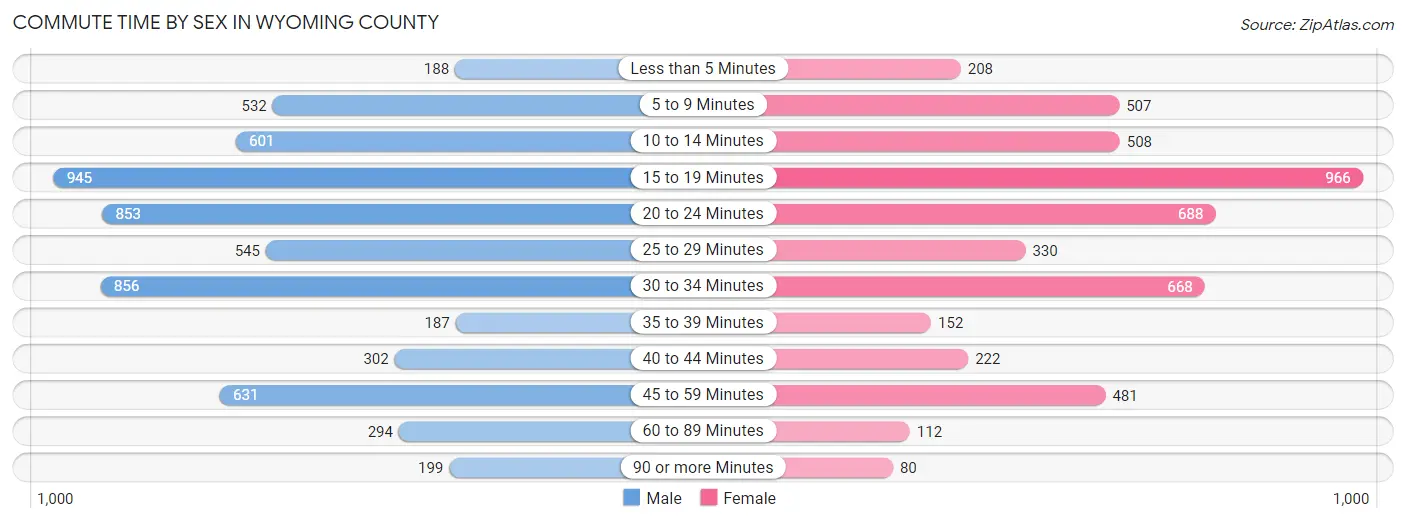
| Commute Time | Male | Female |
| Less than 5 Minutes | 188 (3.1%) | 208 (4.2%) |
| 5 to 9 Minutes | 532 (8.7%) | 507 (10.3%) |
| 10 to 14 Minutes | 601 (9.8%) | 508 (10.3%) |
| 15 to 19 Minutes | 945 (15.4%) | 966 (19.6%) |
| 20 to 24 Minutes | 853 (13.9%) | 688 (14.0%) |
| 25 to 29 Minutes | 545 (8.9%) | 330 (6.7%) |
| 30 to 34 Minutes | 856 (14.0%) | 668 (13.6%) |
| 35 to 39 Minutes | 187 (3.0%) | 152 (3.1%) |
| 40 to 44 Minutes | 302 (4.9%) | 222 (4.5%) |
| 45 to 59 Minutes | 631 (10.3%) | 481 (9.8%) |
| 60 to 89 Minutes | 294 (4.8%) | 112 (2.3%) |
| 90 or more Minutes | 199 (3.2%) | 80 (1.6%) |
Time of Departure to Work by Sex in Wyoming County
The most frequent times of departure to work in Wyoming County are 6:00 AM to 6:29 AM (958, 15.6%) for males and 7:00 AM to 7:29 AM (876, 17.8%) for females.
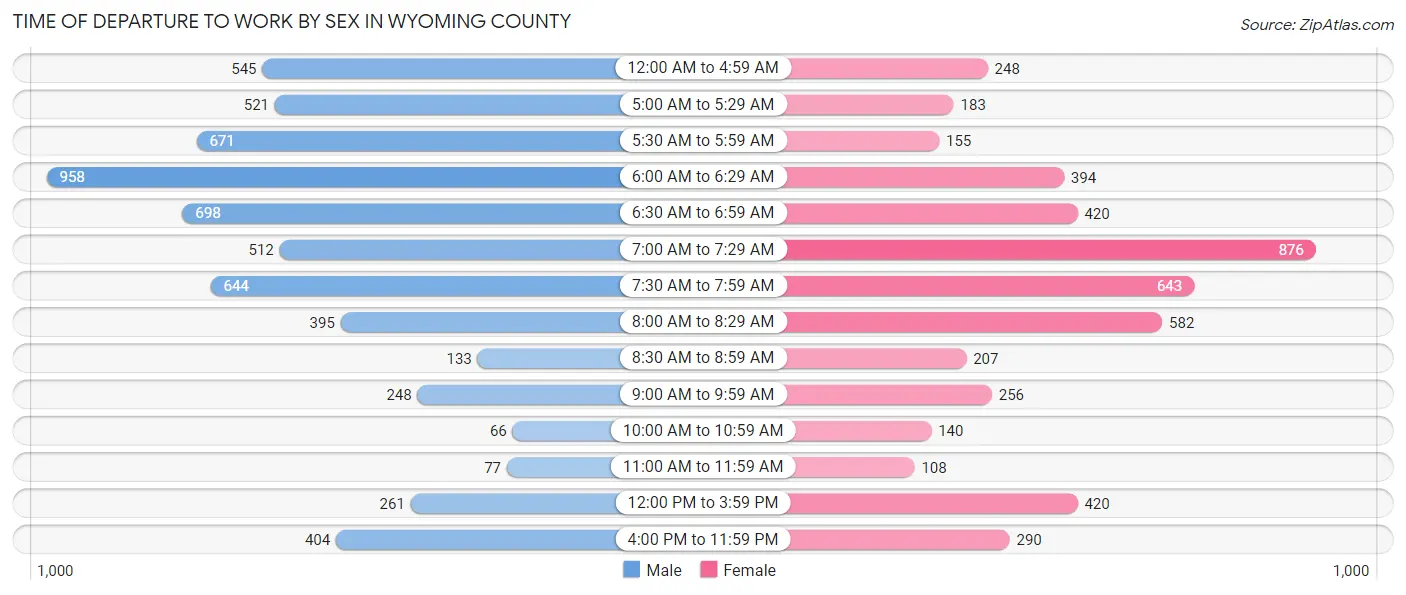
| Time of Departure | Male | Female |
| 12:00 AM to 4:59 AM | 545 (8.9%) | 248 (5.0%) |
| 5:00 AM to 5:29 AM | 521 (8.5%) | 183 (3.7%) |
| 5:30 AM to 5:59 AM | 671 (10.9%) | 155 (3.2%) |
| 6:00 AM to 6:29 AM | 958 (15.6%) | 394 (8.0%) |
| 6:30 AM to 6:59 AM | 698 (11.4%) | 420 (8.5%) |
| 7:00 AM to 7:29 AM | 512 (8.4%) | 876 (17.8%) |
| 7:30 AM to 7:59 AM | 644 (10.5%) | 643 (13.1%) |
| 8:00 AM to 8:29 AM | 395 (6.4%) | 582 (11.8%) |
| 8:30 AM to 8:59 AM | 133 (2.2%) | 207 (4.2%) |
| 9:00 AM to 9:59 AM | 248 (4.0%) | 256 (5.2%) |
| 10:00 AM to 10:59 AM | 66 (1.1%) | 140 (2.8%) |
| 11:00 AM to 11:59 AM | 77 (1.3%) | 108 (2.2%) |
| 12:00 PM to 3:59 PM | 261 (4.3%) | 420 (8.5%) |
| 4:00 PM to 11:59 PM | 404 (6.6%) | 290 (5.9%) |
| Total | 6,133 (100.0%) | 4,922 (100.0%) |
Housing Occupancy in Wyoming County
Occupancy by Ownership in Wyoming County
Of the total 10,788 dwellings in Wyoming County, owner-occupied units account for 8,353 (77.4%), while renter-occupied units make up 2,435 (22.6%).
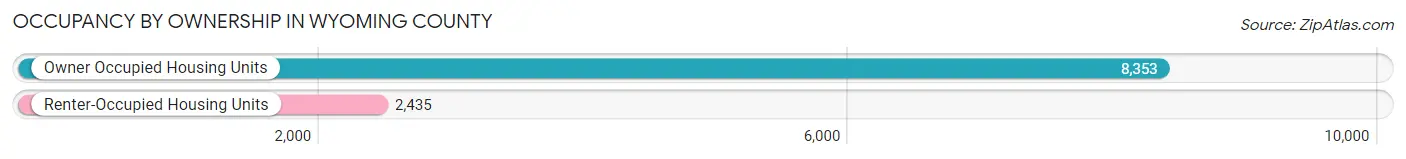
| Occupancy | # Housing Units | % Housing Units |
| Owner Occupied Housing Units | 8,353 | 77.4% |
| Renter-Occupied Housing Units | 2,435 | 22.6% |
| Total Occupied Housing Units | 10,788 | 100.0% |
Occupancy by Household Size in Wyoming County
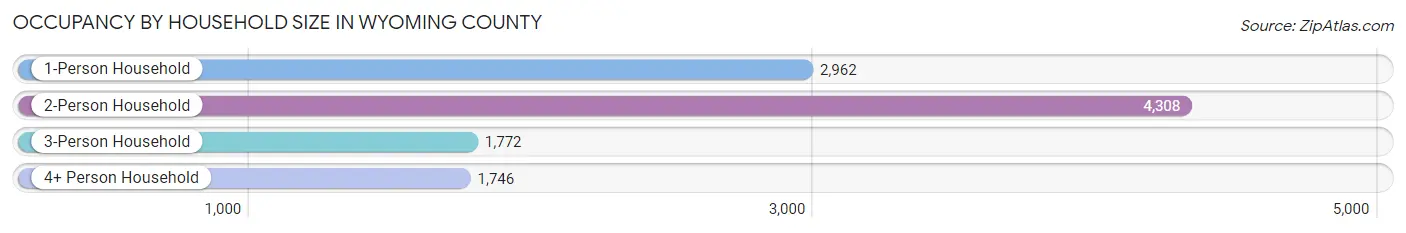
| Household Size | # Housing Units | % Housing Units |
| 1-Person Household | 2,962 | 27.5% |
| 2-Person Household | 4,308 | 39.9% |
| 3-Person Household | 1,772 | 16.4% |
| 4+ Person Household | 1,746 | 16.2% |
| Total Housing Units | 10,788 | 100.0% |
Occupancy by Ownership by Household Size in Wyoming County
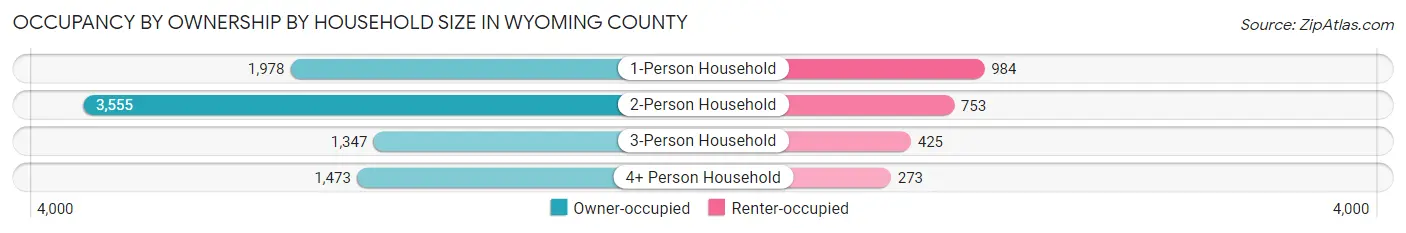
| Household Size | Owner-occupied | Renter-occupied |
| 1-Person Household | 1,978 (66.8%) | 984 (33.2%) |
| 2-Person Household | 3,555 (82.5%) | 753 (17.5%) |
| 3-Person Household | 1,347 (76.0%) | 425 (24.0%) |
| 4+ Person Household | 1,473 (84.4%) | 273 (15.6%) |
| Total Housing Units | 8,353 (77.4%) | 2,435 (22.6%) |
Occupancy by Educational Attainment in Wyoming County
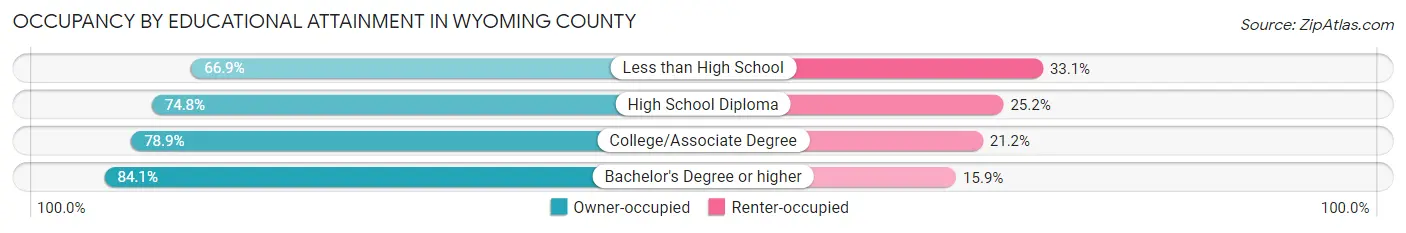
| Household Size | Owner-occupied | Renter-occupied |
| Less than High School | 506 (66.9%) | 250 (33.1%) |
| High School Diploma | 3,495 (74.8%) | 1,180 (25.2%) |
| College/Associate Degree | 2,315 (78.8%) | 621 (21.1%) |
| Bachelor's Degree or higher | 2,037 (84.1%) | 384 (15.9%) |
Occupancy by Age of Householder in Wyoming County
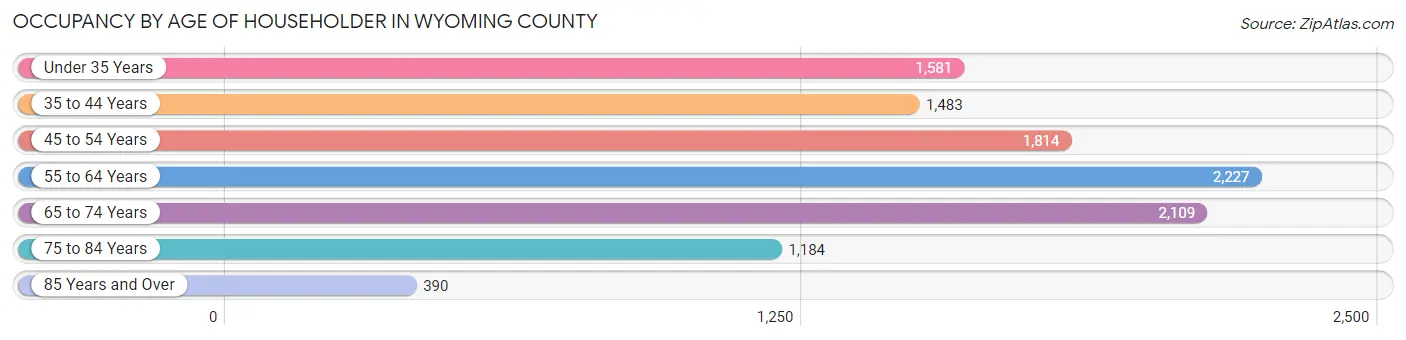
| Age Bracket | # Households | % Households |
| Under 35 Years | 1,581 | 14.7% |
| 35 to 44 Years | 1,483 | 13.8% |
| 45 to 54 Years | 1,814 | 16.8% |
| 55 to 64 Years | 2,227 | 20.6% |
| 65 to 74 Years | 2,109 | 19.6% |
| 75 to 84 Years | 1,184 | 11.0% |
| 85 Years and Over | 390 | 3.6% |
| Total | 10,788 | 100.0% |
Housing Finances in Wyoming County
Median Income by Occupancy in Wyoming County
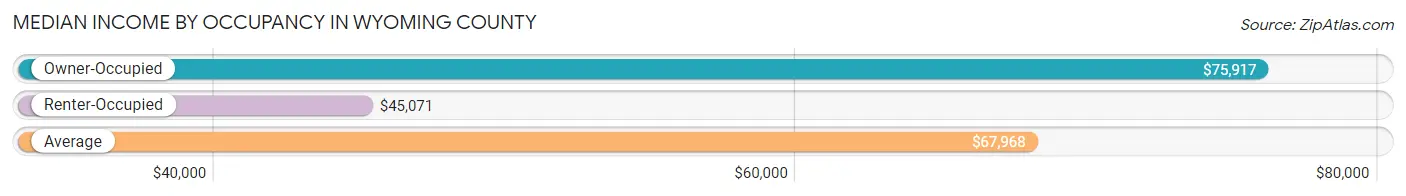
| Occupancy Type | # Households | Median Income |
| Owner-Occupied | 8,353 (77.4%) | $75,917 |
| Renter-Occupied | 2,435 (22.6%) | $45,071 |
| Average | 10,788 (100.0%) | $67,968 |
Occupancy by Householder Income Bracket in Wyoming County
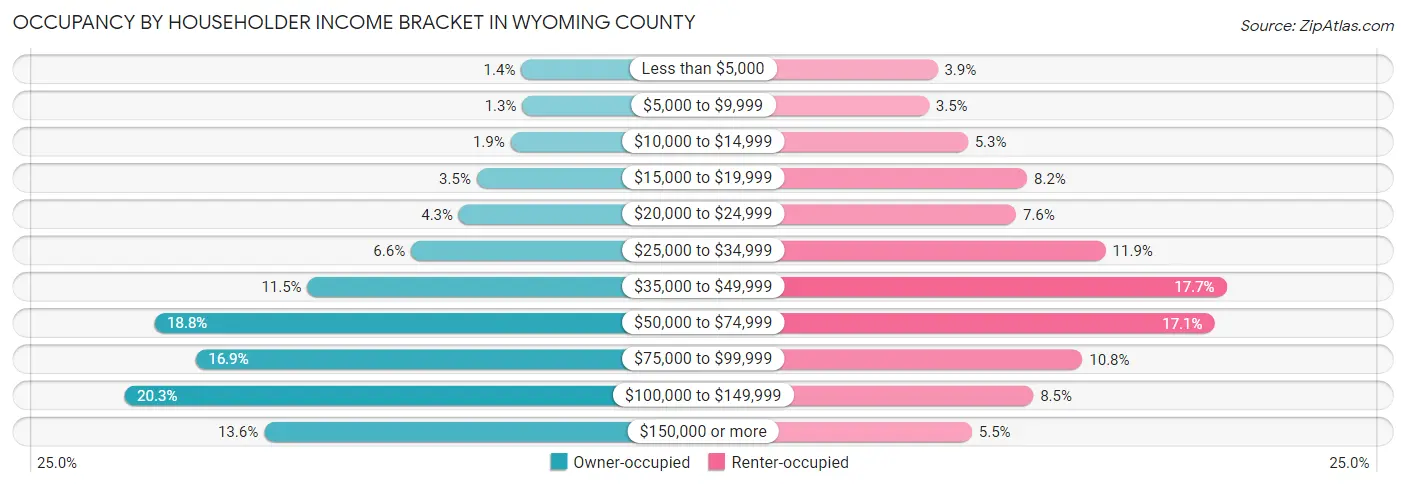
| Income Bracket | Owner-occupied | Renter-occupied |
| Less than $5,000 | 113 (1.3%) | 95 (3.9%) |
| $5,000 to $9,999 | 109 (1.3%) | 85 (3.5%) |
| $10,000 to $14,999 | 155 (1.9%) | 130 (5.3%) |
| $15,000 to $19,999 | 290 (3.5%) | 199 (8.2%) |
| $20,000 to $24,999 | 361 (4.3%) | 186 (7.6%) |
| $25,000 to $34,999 | 551 (6.6%) | 290 (11.9%) |
| $35,000 to $49,999 | 963 (11.5%) | 430 (17.7%) |
| $50,000 to $74,999 | 1,574 (18.8%) | 416 (17.1%) |
| $75,000 to $99,999 | 1,409 (16.9%) | 263 (10.8%) |
| $100,000 to $149,999 | 1,692 (20.3%) | 206 (8.5%) |
| $150,000 or more | 1,136 (13.6%) | 135 (5.5%) |
| Total | 8,353 (100.0%) | 2,435 (100.0%) |
Monthly Housing Cost Tiers in Wyoming County
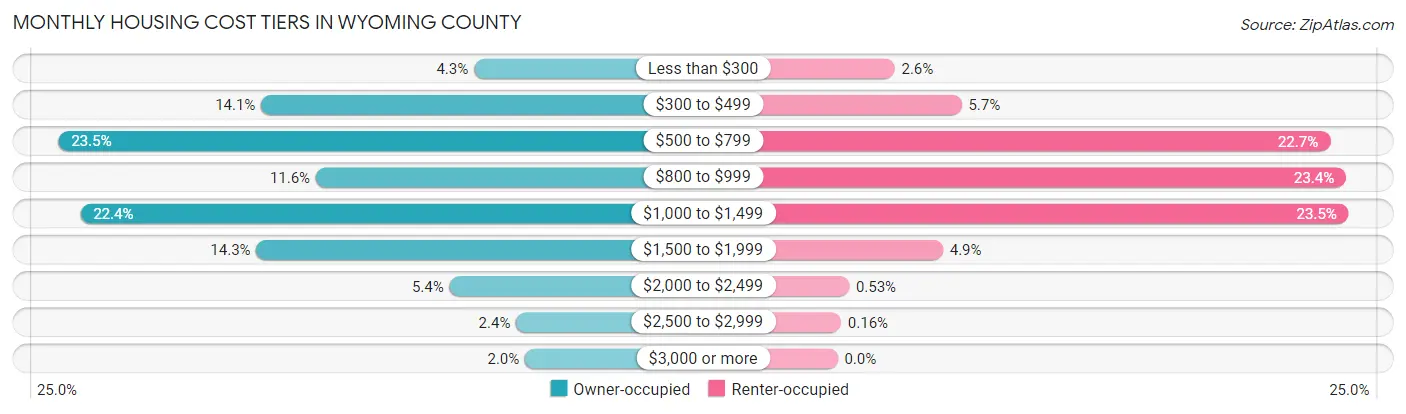
| Monthly Cost | Owner-occupied | Renter-occupied |
| Less than $300 | 360 (4.3%) | 64 (2.6%) |
| $300 to $499 | 1,179 (14.1%) | 139 (5.7%) |
| $500 to $799 | 1,959 (23.4%) | 552 (22.7%) |
| $800 to $999 | 968 (11.6%) | 570 (23.4%) |
| $1,000 to $1,499 | 1,874 (22.4%) | 573 (23.5%) |
| $1,500 to $1,999 | 1,197 (14.3%) | 118 (4.9%) |
| $2,000 to $2,499 | 454 (5.4%) | 13 (0.5%) |
| $2,500 to $2,999 | 198 (2.4%) | 4 (0.2%) |
| $3,000 or more | 164 (2.0%) | 0 (0.0%) |
| Total | 8,353 (100.0%) | 2,435 (100.0%) |
Physical Housing Characteristics in Wyoming County
Housing Structures in Wyoming County
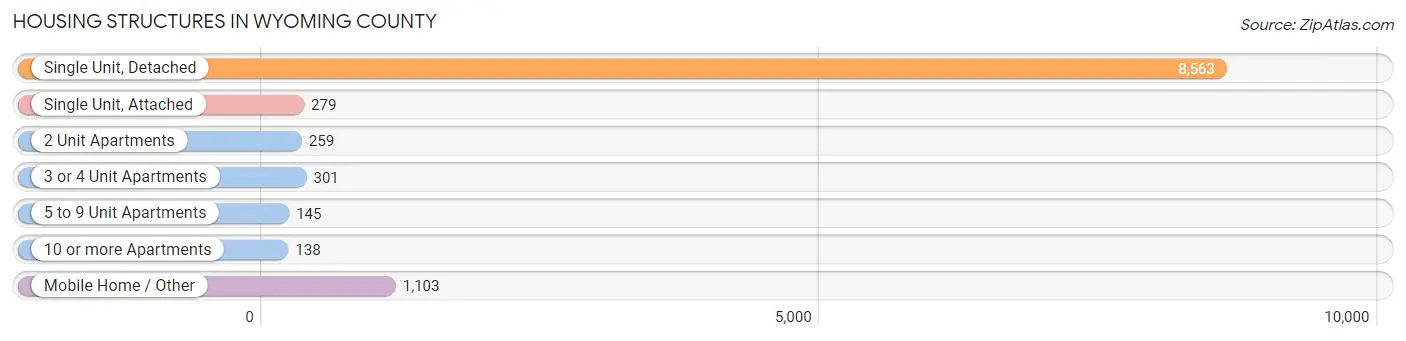
| Structure Type | # Housing Units | % Housing Units |
| Single Unit, Detached | 8,563 | 79.4% |
| Single Unit, Attached | 279 | 2.6% |
| 2 Unit Apartments | 259 | 2.4% |
| 3 or 4 Unit Apartments | 301 | 2.8% |
| 5 to 9 Unit Apartments | 145 | 1.3% |
| 10 or more Apartments | 138 | 1.3% |
| Mobile Home / Other | 1,103 | 10.2% |
| Total | 10,788 | 100.0% |
Housing Structures by Occupancy in Wyoming County
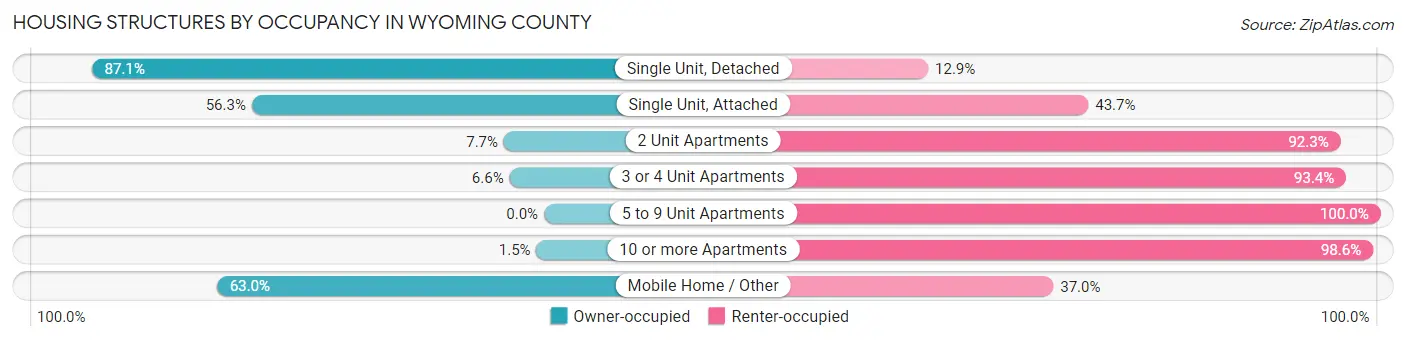
| Structure Type | Owner-occupied | Renter-occupied |
| Single Unit, Detached | 7,459 (87.1%) | 1,104 (12.9%) |
| Single Unit, Attached | 157 (56.3%) | 122 (43.7%) |
| 2 Unit Apartments | 20 (7.7%) | 239 (92.3%) |
| 3 or 4 Unit Apartments | 20 (6.6%) | 281 (93.4%) |
| 5 to 9 Unit Apartments | 0 (0.0%) | 145 (100.0%) |
| 10 or more Apartments | 2 (1.5%) | 136 (98.6%) |
| Mobile Home / Other | 695 (63.0%) | 408 (37.0%) |
| Total | 8,353 (77.4%) | 2,435 (22.6%) |
Housing Structures by Number of Rooms in Wyoming County
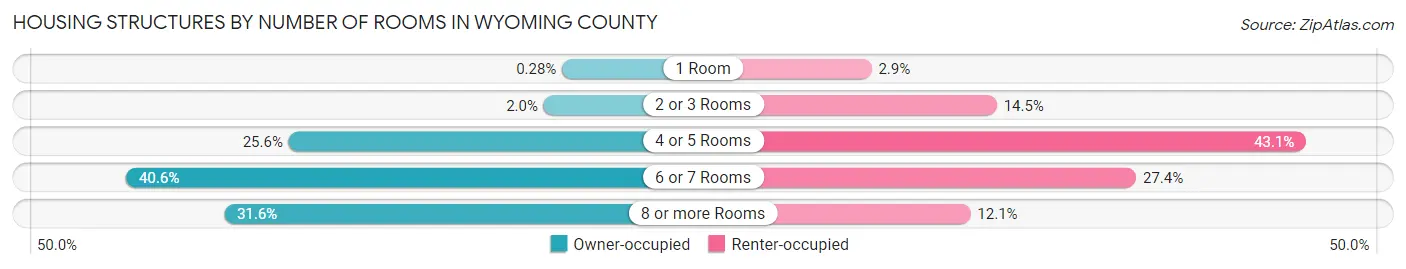
| Number of Rooms | Owner-occupied | Renter-occupied |
| 1 Room | 23 (0.3%) | 71 (2.9%) |
| 2 or 3 Rooms | 165 (2.0%) | 353 (14.5%) |
| 4 or 5 Rooms | 2,136 (25.6%) | 1,050 (43.1%) |
| 6 or 7 Rooms | 3,393 (40.6%) | 667 (27.4%) |
| 8 or more Rooms | 2,636 (31.6%) | 294 (12.1%) |
| Total | 8,353 (100.0%) | 2,435 (100.0%) |
Housing Structure by Heating Type in Wyoming County
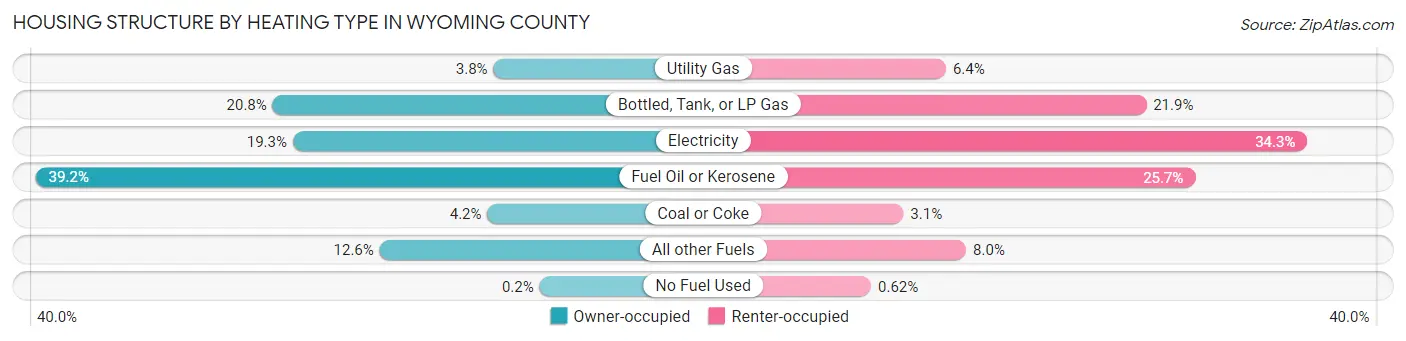
| Heating Type | Owner-occupied | Renter-occupied |
| Utility Gas | 314 (3.8%) | 156 (6.4%) |
| Bottled, Tank, or LP Gas | 1,740 (20.8%) | 533 (21.9%) |
| Electricity | 1,610 (19.3%) | 836 (34.3%) |
| Fuel Oil or Kerosene | 3,270 (39.2%) | 625 (25.7%) |
| Coal or Coke | 353 (4.2%) | 76 (3.1%) |
| All other Fuels | 1,049 (12.6%) | 194 (8.0%) |
| No Fuel Used | 17 (0.2%) | 15 (0.6%) |
| Total | 8,353 (100.0%) | 2,435 (100.0%) |
Household Vehicle Usage in Wyoming County
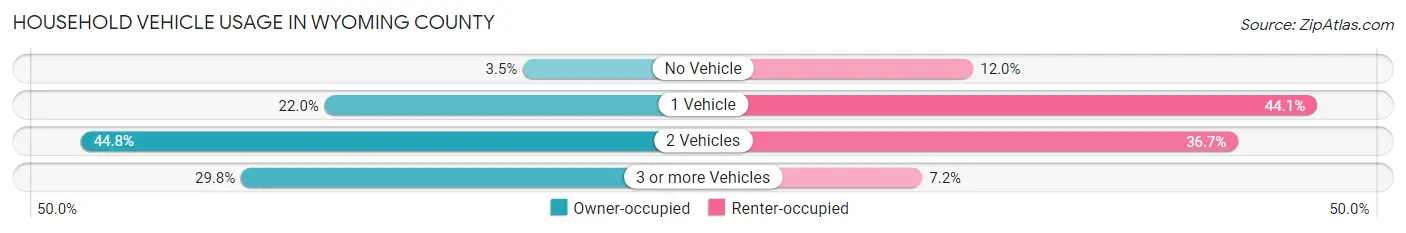
| Vehicles per Household | Owner-occupied | Renter-occupied |
| No Vehicle | 289 (3.5%) | 292 (12.0%) |
| 1 Vehicle | 1,837 (22.0%) | 1,073 (44.1%) |
| 2 Vehicles | 3,739 (44.8%) | 894 (36.7%) |
| 3 or more Vehicles | 2,488 (29.8%) | 176 (7.2%) |
| Total | 8,353 (100.0%) | 2,435 (100.0%) |
Real Estate & Mortgages in Wyoming County
Real Estate and Mortgage Overview in Wyoming County
| Characteristic | Without Mortgage | With Mortgage |
| Housing Units | 4,204 | 4,149 |
| Median Property Value | $189,000 | $199,800 |
| Median Household Income | $56,443 | $771 |
| Monthly Housing Costs | $590 | $150 |
| Real Estate Taxes | $2,678 | $43 |
Property Value by Mortgage Status in Wyoming County
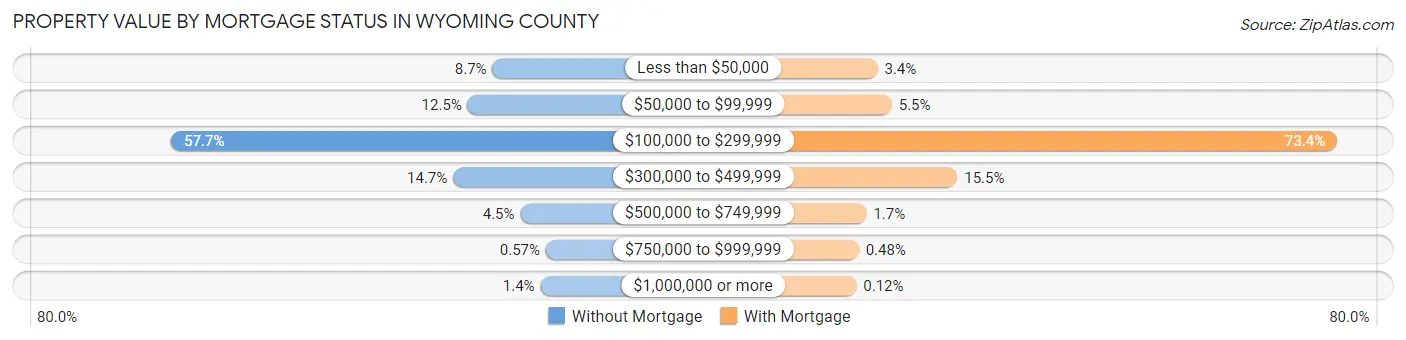
| Property Value | Without Mortgage | With Mortgage |
| Less than $50,000 | 366 (8.7%) | 139 (3.4%) |
| $50,000 to $99,999 | 525 (12.5%) | 229 (5.5%) |
| $100,000 to $299,999 | 2,425 (57.7%) | 3,044 (73.4%) |
| $300,000 to $499,999 | 618 (14.7%) | 643 (15.5%) |
| $500,000 to $749,999 | 187 (4.4%) | 69 (1.7%) |
| $750,000 to $999,999 | 24 (0.6%) | 20 (0.5%) |
| $1,000,000 or more | 59 (1.4%) | 5 (0.1%) |
| Total | 4,204 (100.0%) | 4,149 (100.0%) |
Household Income by Mortgage Status in Wyoming County
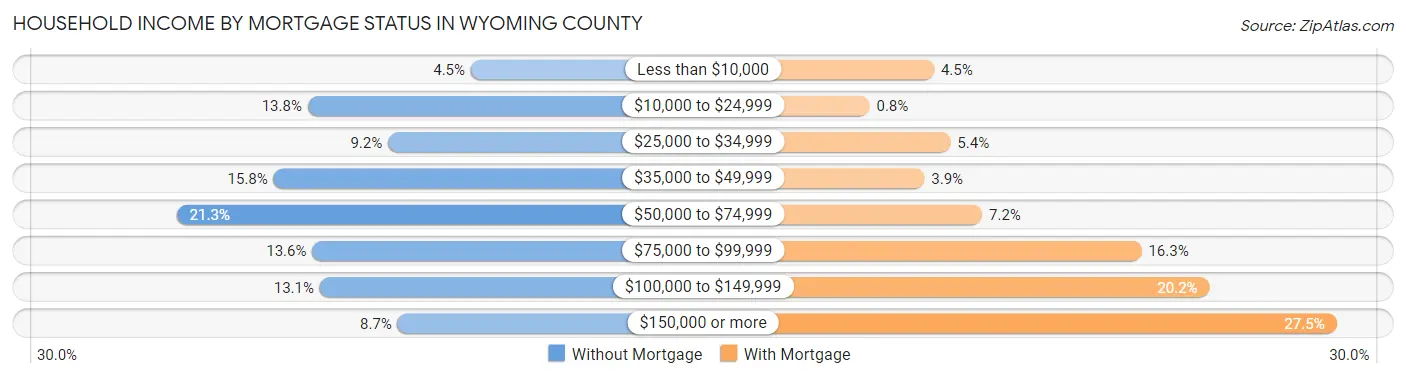
| Household Income | Without Mortgage | With Mortgage |
| Less than $10,000 | 189 (4.5%) | 186 (4.5%) |
| $10,000 to $24,999 | 581 (13.8%) | 33 (0.8%) |
| $25,000 to $34,999 | 388 (9.2%) | 225 (5.4%) |
| $35,000 to $49,999 | 663 (15.8%) | 163 (3.9%) |
| $50,000 to $74,999 | 896 (21.3%) | 300 (7.2%) |
| $75,000 to $99,999 | 570 (13.6%) | 678 (16.3%) |
| $100,000 to $149,999 | 552 (13.1%) | 839 (20.2%) |
| $150,000 or more | 365 (8.7%) | 1,140 (27.5%) |
| Total | 4,204 (100.0%) | 4,149 (100.0%) |
Property Value to Household Income Ratio in Wyoming County
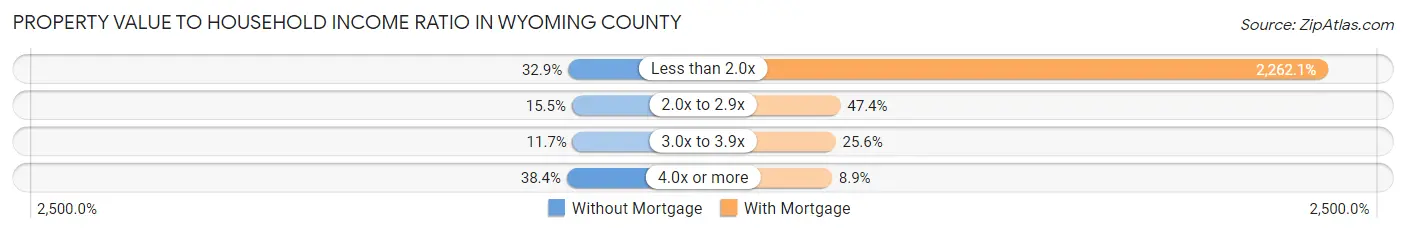
| Value-to-Income Ratio | Without Mortgage | With Mortgage |
| Less than 2.0x | 1,383 (32.9%) | 93,856 (2,262.1%) |
| 2.0x to 2.9x | 653 (15.5%) | 1,967 (47.4%) |
| 3.0x to 3.9x | 490 (11.7%) | 1,060 (25.6%) |
| 4.0x or more | 1,614 (38.4%) | 371 (8.9%) |
| Total | 4,204 (100.0%) | 4,149 (100.0%) |
Real Estate Taxes by Mortgage Status in Wyoming County
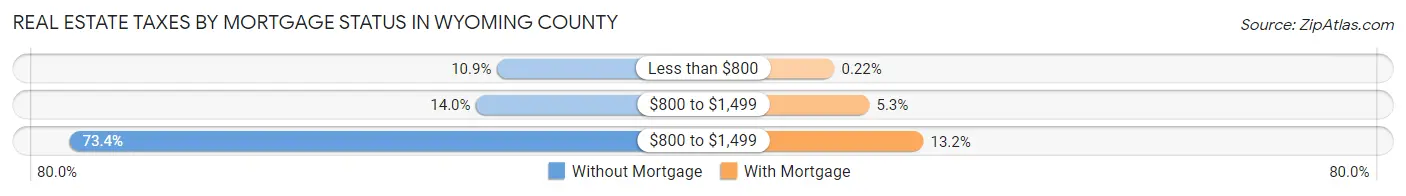
| Property Taxes | Without Mortgage | With Mortgage |
| Less than $800 | 460 (10.9%) | 9 (0.2%) |
| $800 to $1,499 | 588 (14.0%) | 221 (5.3%) |
| $800 to $1,499 | 3,086 (73.4%) | 549 (13.2%) |
| Total | 4,204 (100.0%) | 4,149 (100.0%) |
Health & Disability in Wyoming County
Health Insurance Coverage by Age in Wyoming County
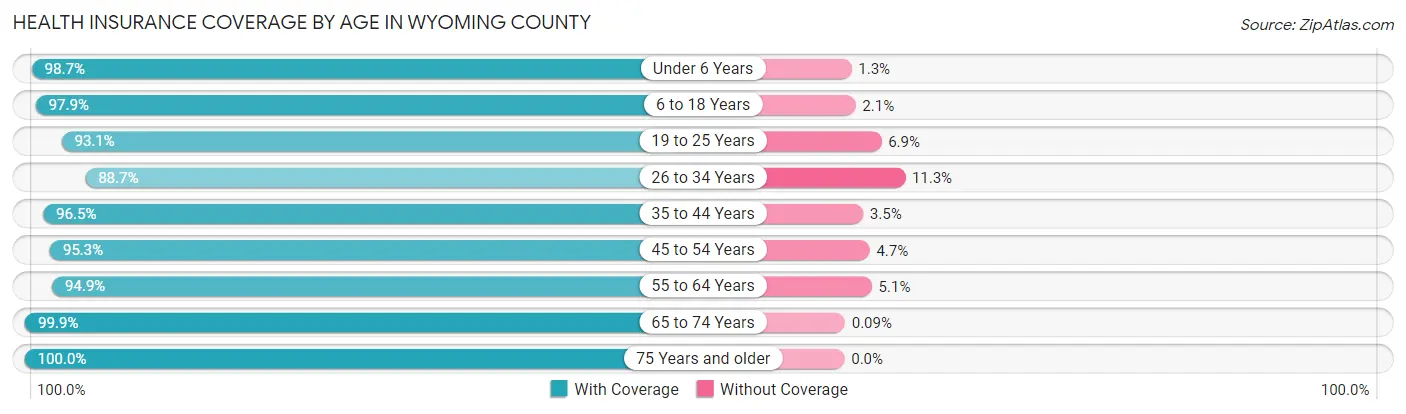
| Age Bracket | With Coverage | Without Coverage |
| Under 6 Years | 1,421 (98.7%) | 19 (1.3%) |
| 6 to 18 Years | 3,838 (97.9%) | 81 (2.1%) |
| 19 to 25 Years | 2,043 (93.1%) | 151 (6.9%) |
| 26 to 34 Years | 2,289 (88.7%) | 292 (11.3%) |
| 35 to 44 Years | 2,730 (96.5%) | 98 (3.5%) |
| 45 to 54 Years | 3,224 (95.3%) | 159 (4.7%) |
| 55 to 64 Years | 3,831 (94.9%) | 206 (5.1%) |
| 65 to 74 Years | 3,408 (99.9%) | 3 (0.1%) |
| 75 Years and older | 2,223 (100.0%) | 0 (0.0%) |
| Total | 25,007 (96.1%) | 1,009 (3.9%) |
Health Insurance Coverage by Citizenship Status in Wyoming County
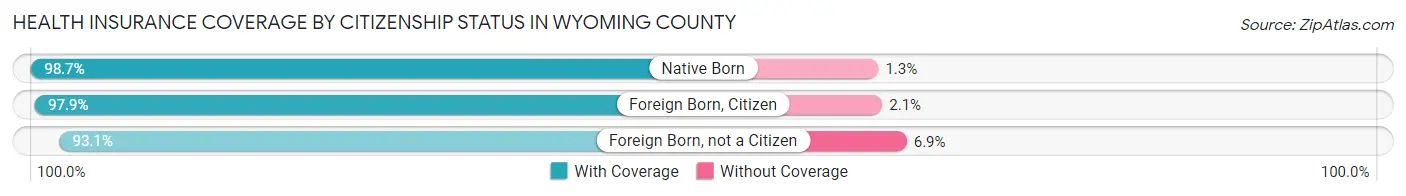
| Citizenship Status | With Coverage | Without Coverage |
| Native Born | 1,421 (98.7%) | 19 (1.3%) |
| Foreign Born, Citizen | 3,838 (97.9%) | 81 (2.1%) |
| Foreign Born, not a Citizen | 2,043 (93.1%) | 151 (6.9%) |
Health Insurance Coverage by Household Income in Wyoming County
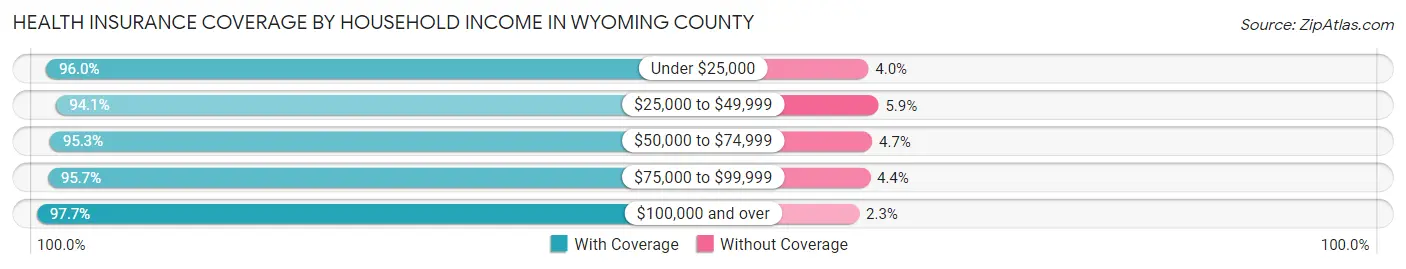
| Household Income | With Coverage | Without Coverage |
| Under $25,000 | 2,589 (96.0%) | 109 (4.0%) |
| $25,000 to $49,999 | 4,070 (94.1%) | 257 (5.9%) |
| $50,000 to $74,999 | 4,506 (95.3%) | 224 (4.7%) |
| $75,000 to $99,999 | 4,153 (95.7%) | 189 (4.3%) |
| $100,000 and over | 9,181 (97.7%) | 217 (2.3%) |
Public vs Private Health Insurance Coverage by Age in Wyoming County
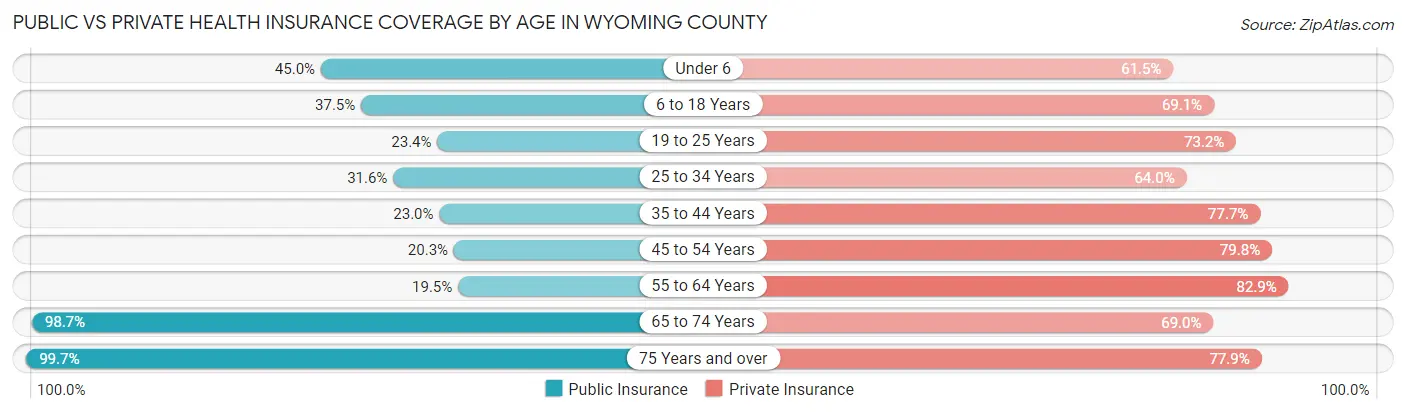
| Age Bracket | Public Insurance | Private Insurance |
| Under 6 | 648 (45.0%) | 886 (61.5%) |
| 6 to 18 Years | 1,471 (37.5%) | 2,707 (69.1%) |
| 19 to 25 Years | 513 (23.4%) | 1,606 (73.2%) |
| 25 to 34 Years | 815 (31.6%) | 1,651 (64.0%) |
| 35 to 44 Years | 651 (23.0%) | 2,196 (77.6%) |
| 45 to 54 Years | 687 (20.3%) | 2,701 (79.8%) |
| 55 to 64 Years | 789 (19.5%) | 3,348 (82.9%) |
| 65 to 74 Years | 3,365 (98.7%) | 2,352 (69.0%) |
| 75 Years and over | 2,216 (99.7%) | 1,732 (77.9%) |
| Total | 11,155 (42.9%) | 19,179 (73.7%) |
Disability Status by Sex by Age in Wyoming County
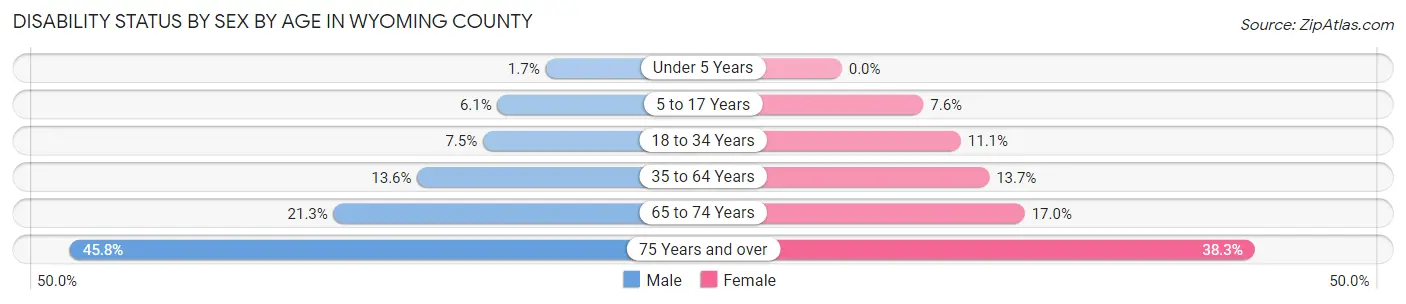
| Age Bracket | Male | Female |
| Under 5 Years | 10 (1.7%) | 0 (0.0%) |
| 5 to 17 Years | 121 (6.1%) | 138 (7.6%) |
| 18 to 34 Years | 200 (7.4%) | 269 (11.1%) |
| 35 to 64 Years | 696 (13.6%) | 699 (13.7%) |
| 65 to 74 Years | 363 (21.3%) | 290 (17.0%) |
| 75 Years and over | 468 (45.8%) | 460 (38.3%) |
Disability Class by Sex by Age in Wyoming County
Disability Class: Hearing Difficulty
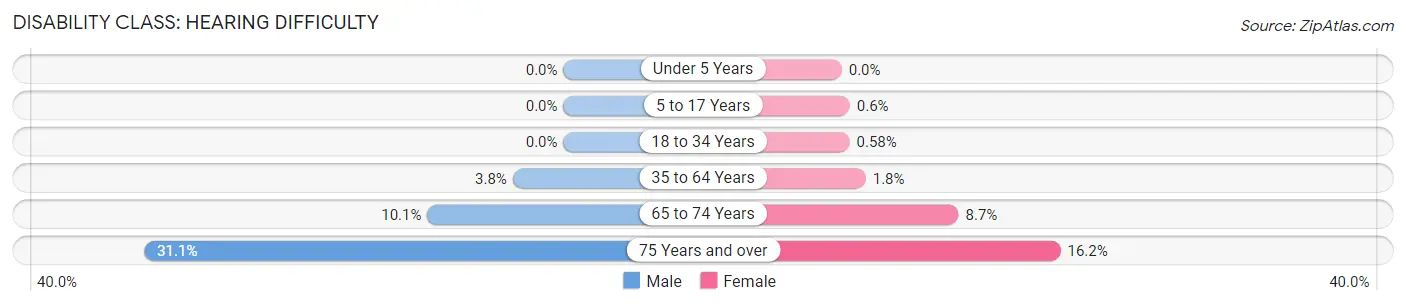
| Age Bracket | Male | Female |
| Under 5 Years | 0 (0.0%) | 0 (0.0%) |
| 5 to 17 Years | 0 (0.0%) | 11 (0.6%) |
| 18 to 34 Years | 0 (0.0%) | 14 (0.6%) |
| 35 to 64 Years | 193 (3.8%) | 91 (1.8%) |
| 65 to 74 Years | 172 (10.1%) | 148 (8.7%) |
| 75 Years and over | 318 (31.1%) | 195 (16.2%) |
Disability Class: Vision Difficulty
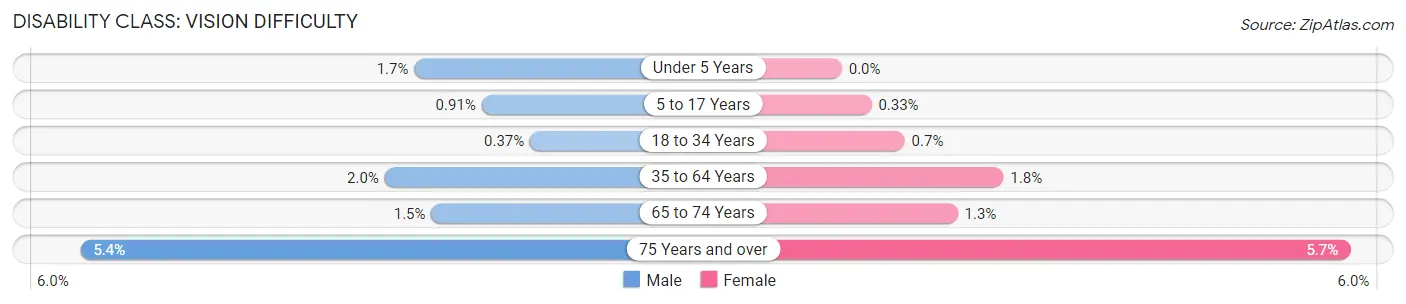
| Age Bracket | Male | Female |
| Under 5 Years | 10 (1.7%) | 0 (0.0%) |
| 5 to 17 Years | 18 (0.9%) | 6 (0.3%) |
| 18 to 34 Years | 10 (0.4%) | 17 (0.7%) |
| 35 to 64 Years | 102 (2.0%) | 92 (1.8%) |
| 65 to 74 Years | 25 (1.5%) | 22 (1.3%) |
| 75 Years and over | 55 (5.4%) | 68 (5.7%) |
Disability Class: Cognitive Difficulty
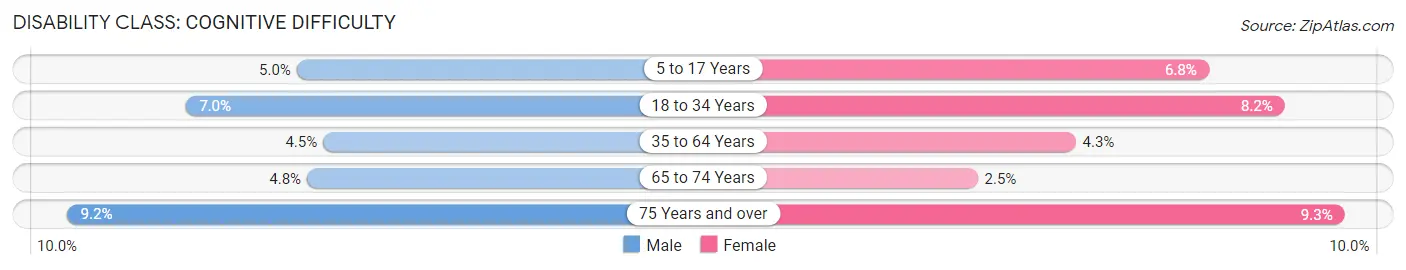
| Age Bracket | Male | Female |
| 5 to 17 Years | 98 (5.0%) | 124 (6.8%) |
| 18 to 34 Years | 188 (7.0%) | 200 (8.2%) |
| 35 to 64 Years | 229 (4.5%) | 222 (4.3%) |
| 65 to 74 Years | 81 (4.8%) | 43 (2.5%) |
| 75 Years and over | 94 (9.2%) | 112 (9.3%) |
Disability Class: Ambulatory Difficulty
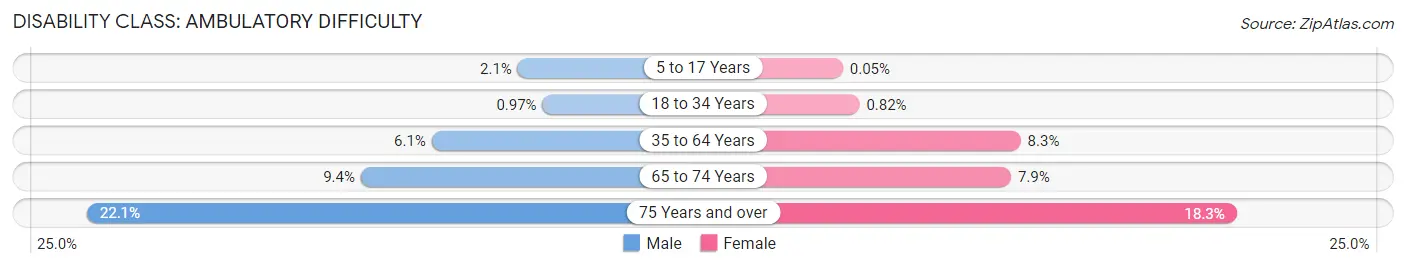
| Age Bracket | Male | Female |
| 5 to 17 Years | 42 (2.1%) | 1 (0.1%) |
| 18 to 34 Years | 26 (1.0%) | 20 (0.8%) |
| 35 to 64 Years | 314 (6.1%) | 424 (8.3%) |
| 65 to 74 Years | 160 (9.4%) | 134 (7.9%) |
| 75 Years and over | 226 (22.1%) | 220 (18.3%) |
Disability Class: Self-Care Difficulty
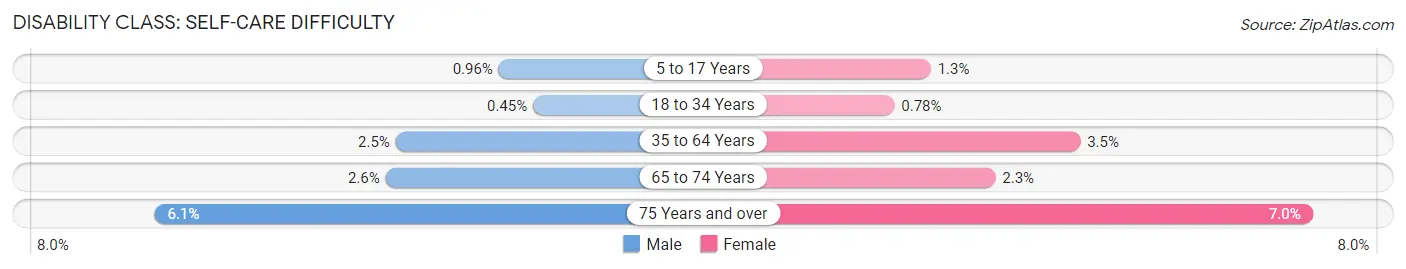
| Age Bracket | Male | Female |
| 5 to 17 Years | 19 (1.0%) | 24 (1.3%) |
| 18 to 34 Years | 12 (0.4%) | 19 (0.8%) |
| 35 to 64 Years | 128 (2.5%) | 181 (3.5%) |
| 65 to 74 Years | 45 (2.6%) | 39 (2.3%) |
| 75 Years and over | 62 (6.1%) | 84 (7.0%) |
Technology Access in Wyoming County
Computing Device Access in Wyoming County
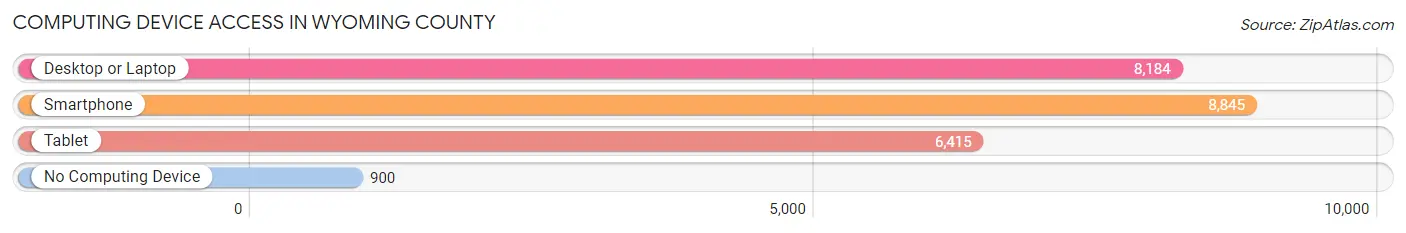
| Device Type | # Households | % Households |
| Desktop or Laptop | 8,184 | 75.9% |
| Smartphone | 8,845 | 82.0% |
| Tablet | 6,415 | 59.5% |
| No Computing Device | 900 | 8.3% |
| Total | 10,788 | 100.0% |
Internet Access in Wyoming County
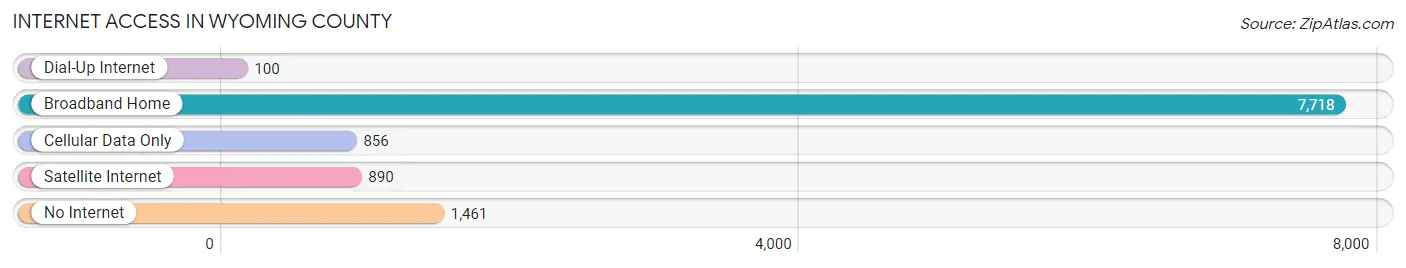
| Internet Type | # Households | % Households |
| Dial-Up Internet | 100 | 0.9% |
| Broadband Home | 7,718 | 71.5% |
| Cellular Data Only | 856 | 7.9% |
| Satellite Internet | 890 | 8.3% |
| No Internet | 1,461 | 13.5% |
| Total | 10,788 | 100.0% |
Wyoming County Summary
Wyoming County is a county located in the U.S. state of Pennsylvania. As of the 2010 census, the population was 28,276. The county seat is Tunkhannock. Wyoming County was created on April 16, 1842, from part of Luzerne County. It is named for the Wyoming Valley, which is in turn named for the Munsee word xwé:wamənk, meaning "at the smaller river hills."
Geography
Wyoming County is located in the northeastern part of Pennsylvania, in the Endless Mountains region. It is bordered by Susquehanna County to the north, Bradford County to the east, Sullivan County to the south, and Luzerne County to the west. The county has a total area of 545 square miles, of which 543 square miles is land and 2.2 square miles (0.4%) is water.
The county is drained by the Susquehanna River and its tributaries, including Tunkhannock Creek, Mehoopany Creek, and Meshoppen Creek. The highest point in the county is the summit of North Knob, at 2,890 feet (881 m) above sea level.
Demographics
As of the 2010 census, there were 28,276 people, 11,541 households, and 7,945 families residing in the county. The population density was 52 people per square mile (20/km²). There were 13,890 housing units at an average density of 25 per square mile (10/km²). The racial makeup of the county was 97.9% White, 0.6% Black or African American, 0.2% Native American, 0.2% Asian, 0.2% from other races, and 0.9% from two or more races. 1.2% of the population were Hispanic or Latino of any race.
There were 11,541 households, out of which 28.2% had children under the age of 18 living with them, 56.2% were married couples living together, 9.2% had a female householder with no husband present, and 30.2% were non-families. 25.2% of all households were made up of individuals, and 11.2% had someone living alone who was 65 years of age or older. The average household size was 2.44 and the average family size was 2.90.
In the county, the population was spread out, with 22.2% under the age of 18, 59.2% from 18 to 64, and 18.6% who were 65 years of age or older. The median age was 43.3 years.
The median income for a household in the county was $41,945, and the median income for a family was $50,945. Males had a median income of $41,945 versus $30,945 for females. The per capita income for the county was $21,945. About 8.2% of families and 11.2% of the population were below the poverty line, including 15.2% of those under age 18 and 8.2% of those age 65 or over.
Economy
The economy of Wyoming County is largely based on agriculture and natural resources. The county is home to several dairy farms, as well as a number of other farms that produce a variety of crops, including corn, soybeans, hay, and wheat. The county is also home to several timber companies, which harvest and process timber for use in construction and other industries.
The county is also home to several manufacturing companies, including a paper mill, a plastics manufacturer, and a metal fabrication plant. The county is also home to several retail businesses, including a number of antique stores, a variety of restaurants, and several small shops.
The county is served by the Tunkhannock Area School District, which includes five elementary schools, one middle school, and one high school. The county is also home to a number of higher education institutions, including Keystone College, Lackawanna College, and Wilkes University.
Conclusion
Wyoming County is a rural county located in northeastern Pennsylvania. The county is home to a variety of industries, including agriculture, timber, and manufacturing. The county is also home to several higher education institutions, as well as a number of retail businesses. The county has a population of 28,276, and the median household income is $41,945.
Common Questions
What is Per Capita Income in Wyoming County?
Per Capita income in Wyoming County is $36,533.
What is the Median Family Income in Wyoming County?
Median Family Income in Wyoming County is $80,571.
What is the Median Household income in Wyoming County?
Median Household Income in Wyoming County is $67,968.
What is Income or Wage Gap in Wyoming County?
Income or Wage Gap in Wyoming County is 35.6%.
Women in Wyoming County earn 64.4 cents for every dollar earned by a man.
What is Family Income Deficit in Wyoming County?
Family Income Deficit in Wyoming County is $8,868.
Families that are below poverty line in Wyoming County earn $8,868 less on average than the poverty threshold level.
What is Inequality or Gini Index in Wyoming County?
Inequality or Gini Index in Wyoming County is 0.44.
What is the Total Population of Wyoming County?
Total Population of Wyoming County is 26,219.
What is the Total Male Population of Wyoming County?
Total Male Population of Wyoming County is 13,254.
What is the Total Female Population of Wyoming County?
Total Female Population of Wyoming County is 12,965.
What is the Ratio of Males per 100 Females in Wyoming County?
There are 102.23 Males per 100 Females in Wyoming County.
What is the Ratio of Females per 100 Males in Wyoming County?
There are 97.82 Females per 100 Males in Wyoming County.
What is the Median Population Age in Wyoming County?
Median Population Age in Wyoming County is 45.3 Years.
What is the Average Family Size in Wyoming County
Average Family Size in Wyoming County is 2.9 People.
What is the Average Household Size in Wyoming County
Average Household Size in Wyoming County is 2.4 People.
How Large is the Labor Force in Wyoming County?
There are 12,625 People in the Labor Forcein in Wyoming County.
What is the Percentage of People in the Labor Force in Wyoming County?
57.8% of People are in the Labor Force in Wyoming County.
What is the Unemployment Rate in Wyoming County?
Unemployment Rate in Wyoming County is 4.5%.