Wayne County, PA Map & Demographics
Wayne County Map
Wayne County Overview
$32,207
PER CAPITA INCOME
$74,661
AVG FAMILY INCOME
$59,240
AVG HOUSEHOLD INCOME
25.5%
WAGE / INCOME GAP [ % ]
74.5¢/ $1
WAGE / INCOME GAP [ $ ]
$7,796
FAMILY INCOME DEFICIT
0.42
INEQUALITY / GINI INDEX
51,227
TOTAL POPULATION
27,289
MALE POPULATION
23,938
FEMALE POPULATION
114.00
MALES / 100 FEMALES
87.72
FEMALES / 100 MALES
48.8
MEDIAN AGE
3.0
AVG FAMILY SIZE
2.4
AVG HOUSEHOLD SIZE
22,573
LABOR FORCE [ PEOPLE ]
51.6%
PERCENT IN LABOR FORCE
5.9%
UNEMPLOYMENT RATE
Income in Wayne County
Income Overview in Wayne County
Per Capita Income in Wayne County is $32,207, while median incomes of families and households are $74,661 and $59,240 respectively.
| Characteristic | Number | Measure |
| Per Capita Income | 51,227 | $32,207 |
| Median Family Income | 12,759 | $74,661 |
| Mean Family Income | 12,759 | $90,900 |
| Median Household Income | 19,747 | $59,240 |
| Mean Household Income | 19,747 | $77,823 |
| Income Deficit | 12,759 | $7,796 |
| Wage / Income Gap (%) | 51,227 | 25.48% |
| Wage / Income Gap ($) | 51,227 | 74.52¢ per $1 |
| Gini / Inequality Index | 51,227 | 0.42 |
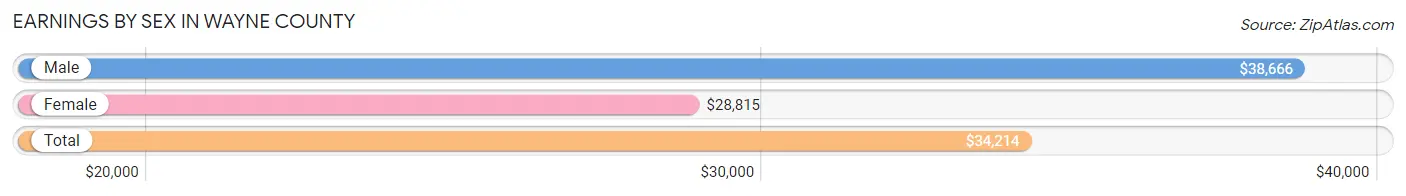
Earnings by Sex in Wayne County
Average Earnings in Wayne County are $34,214, $38,666 for men and $28,815 for women, a difference of 25.5%.
| Sex | Number | Average Earnings |
| Male | 13,248 (54.5%) | $38,666 |
| Female | 11,058 (45.5%) | $28,815 |
| Total | 24,306 (100.0%) | $34,214 |
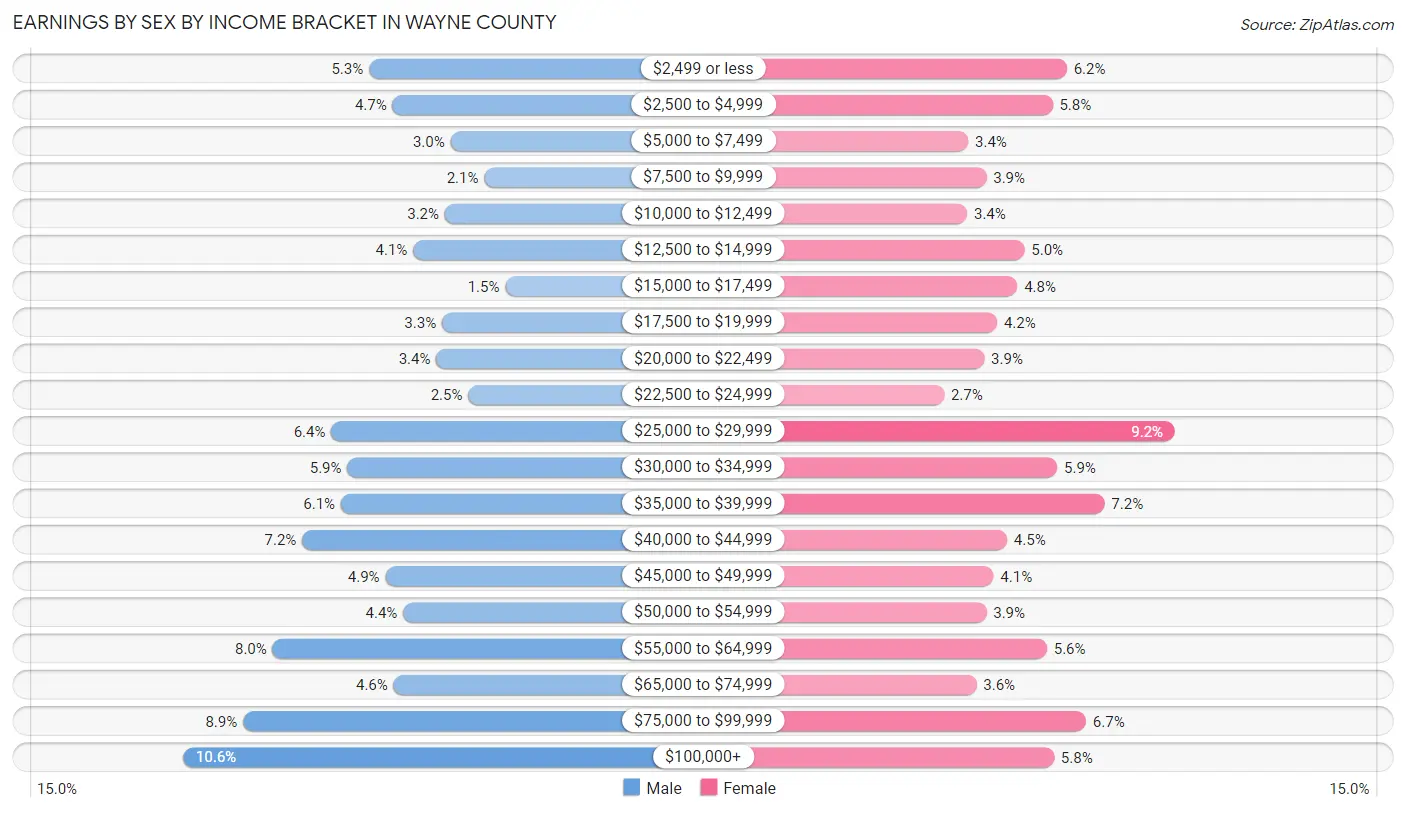
Earnings by Sex by Income Bracket in Wayne County
The most common earnings brackets in Wayne County are $100,000+ for men (1,398 | 10.5%) and $25,000 to $29,999 for women (1,019 | 9.2%).
| Income | Male | Female |
| $2,499 or less | 705 (5.3%) | 683 (6.2%) |
| $2,500 to $4,999 | 617 (4.7%) | 639 (5.8%) |
| $5,000 to $7,499 | 402 (3.0%) | 377 (3.4%) |
| $7,500 to $9,999 | 275 (2.1%) | 434 (3.9%) |
| $10,000 to $12,499 | 423 (3.2%) | 374 (3.4%) |
| $12,500 to $14,999 | 540 (4.1%) | 552 (5.0%) |
| $15,000 to $17,499 | 198 (1.5%) | 530 (4.8%) |
| $17,500 to $19,999 | 433 (3.3%) | 467 (4.2%) |
| $20,000 to $22,499 | 454 (3.4%) | 427 (3.9%) |
| $22,500 to $24,999 | 335 (2.5%) | 302 (2.7%) |
| $25,000 to $29,999 | 845 (6.4%) | 1,019 (9.2%) |
| $30,000 to $34,999 | 786 (5.9%) | 654 (5.9%) |
| $35,000 to $39,999 | 809 (6.1%) | 801 (7.2%) |
| $40,000 to $44,999 | 954 (7.2%) | 498 (4.5%) |
| $45,000 to $49,999 | 644 (4.9%) | 456 (4.1%) |
| $50,000 to $54,999 | 578 (4.4%) | 433 (3.9%) |
| $55,000 to $64,999 | 1,064 (8.0%) | 622 (5.6%) |
| $65,000 to $74,999 | 614 (4.6%) | 403 (3.6%) |
| $75,000 to $99,999 | 1,174 (8.9%) | 743 (6.7%) |
| $100,000+ | 1,398 (10.5%) | 644 (5.8%) |
| Total | 13,248 (100.0%) | 11,058 (100.0%) |
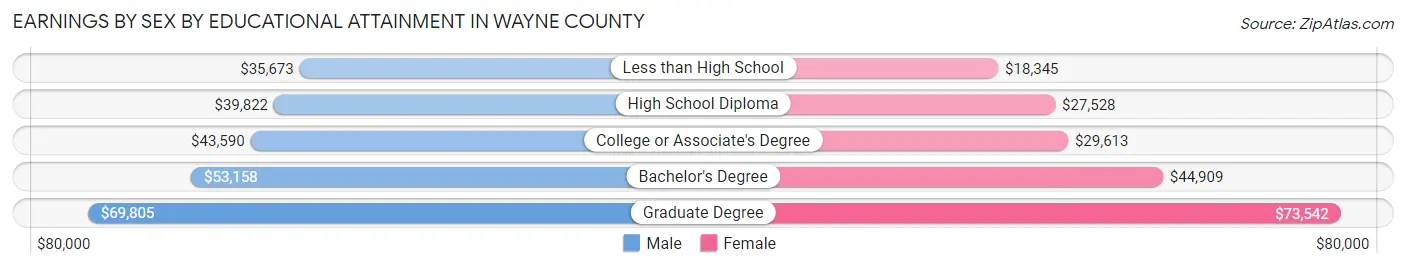
Earnings by Sex by Educational Attainment in Wayne County
Average earnings in Wayne County are $43,240 for men and $33,558 for women, a difference of 22.4%. Men with an educational attainment of graduate degree enjoy the highest average annual earnings of $69,805, while those with less than high school education earn the least with $35,673. Women with an educational attainment of graduate degree earn the most with the average annual earnings of $73,542, while those with less than high school education have the smallest earnings of $18,345.
| Educational Attainment | Male Income | Female Income |
| Less than High School | $35,673 | $18,345 |
| High School Diploma | $39,822 | $27,528 |
| College or Associate's Degree | $43,590 | $29,613 |
| Bachelor's Degree | $53,158 | $44,909 |
| Graduate Degree | $69,805 | $73,542 |
| Total | $43,240 | $33,558 |
Family Income in Wayne County
Family Income Brackets in Wayne County
According to the Wayne County family income data, there are 2,730 families falling into the $50,000 to $74,999 income range, which is the most common income bracket and makes up 21.4% of all families. Conversely, the $10,000 to $14,999 income bracket is the least frequent group with only 128 families (1.0%) belonging to this category.
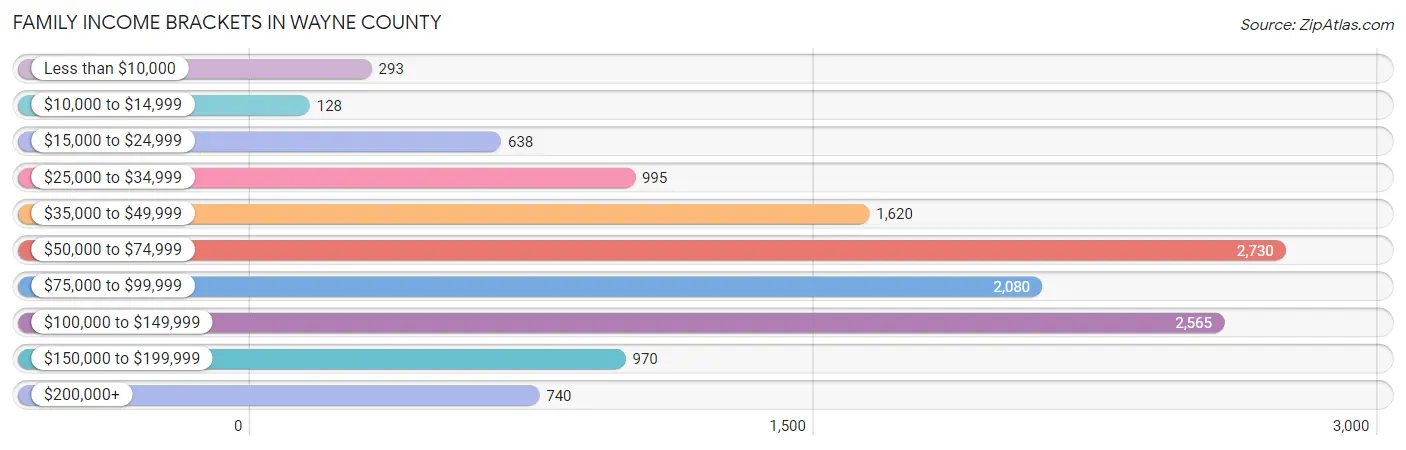
| Income Bracket | # Families | % Families |
| Less than $10,000 | 293 | 2.3% |
| $10,000 to $14,999 | 128 | 1.0% |
| $15,000 to $24,999 | 638 | 5.0% |
| $25,000 to $34,999 | 995 | 7.8% |
| $35,000 to $49,999 | 1,620 | 12.7% |
| $50,000 to $74,999 | 2,730 | 21.4% |
| $75,000 to $99,999 | 2,080 | 16.3% |
| $100,000 to $149,999 | 2,565 | 20.1% |
| $150,000 to $199,999 | 970 | 7.6% |
| $200,000+ | 740 | 5.8% |
Family Income by Famaliy Size in Wayne County
7+ person families (168 | 1.3%) account for the highest median family income in Wayne County with $139,010 per family, while 2-person families (7,377 | 57.8%) have the highest median income of $33,918 per family member.
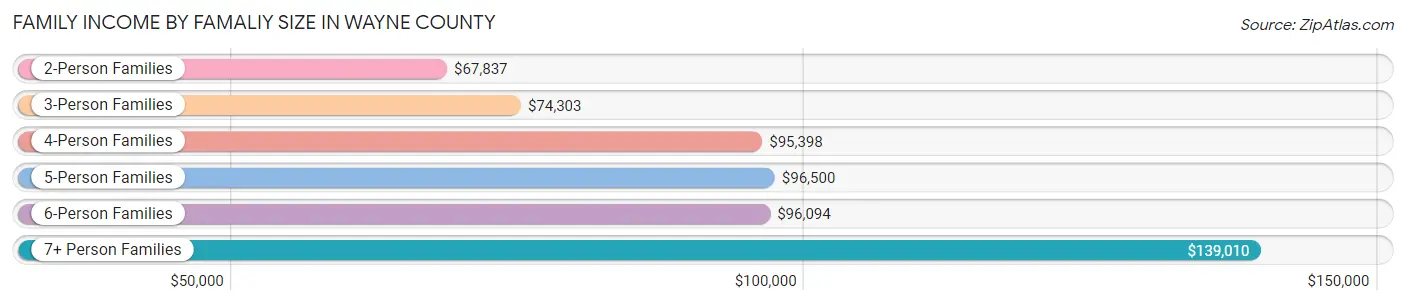
| Income Bracket | # Families | Median Income |
| 2-Person Families | 7,377 (57.8%) | $67,837 |
| 3-Person Families | 2,459 (19.3%) | $74,303 |
| 4-Person Families | 1,782 (14.0%) | $95,398 |
| 5-Person Families | 718 (5.6%) | $96,500 |
| 6-Person Families | 255 (2.0%) | $96,094 |
| 7+ Person Families | 168 (1.3%) | $139,010 |
| Total | 12,759 (100.0%) | $74,661 |
Family Income by Number of Earners in Wayne County
The median family income in Wayne County is $74,661, with families comprising 3+ earners (1,354) having the highest median family income of $126,359, while families with no earners (3,170) have the lowest median family income of $52,814, accounting for 10.6% and 24.8% of families, respectively.
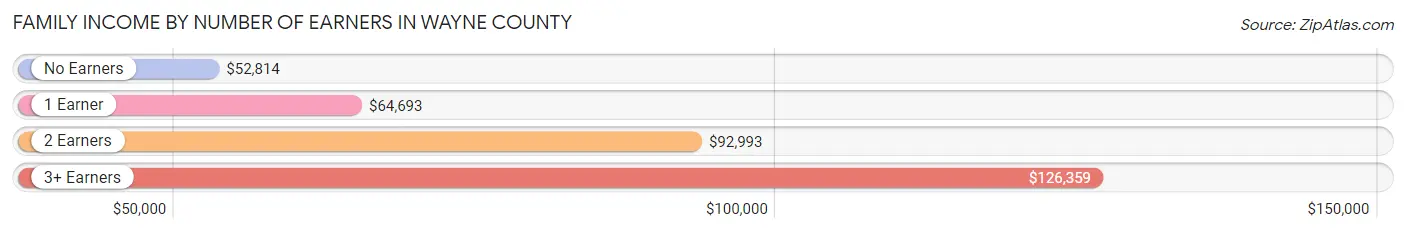
| Number of Earners | # Families | Median Income |
| No Earners | 3,170 (24.8%) | $52,814 |
| 1 Earner | 3,886 (30.5%) | $64,693 |
| 2 Earners | 4,349 (34.1%) | $92,993 |
| 3+ Earners | 1,354 (10.6%) | $126,359 |
| Total | 12,759 (100.0%) | $74,661 |
Household Income in Wayne County
Household Income Brackets in Wayne County
With 3,811 households falling in the category, the $50,000 to $74,999 income range is the most frequent in Wayne County, accounting for 19.3% of all households. In contrast, only 592 households (3.0%) fall into the $10,000 to $14,999 income bracket, making it the least populous group.
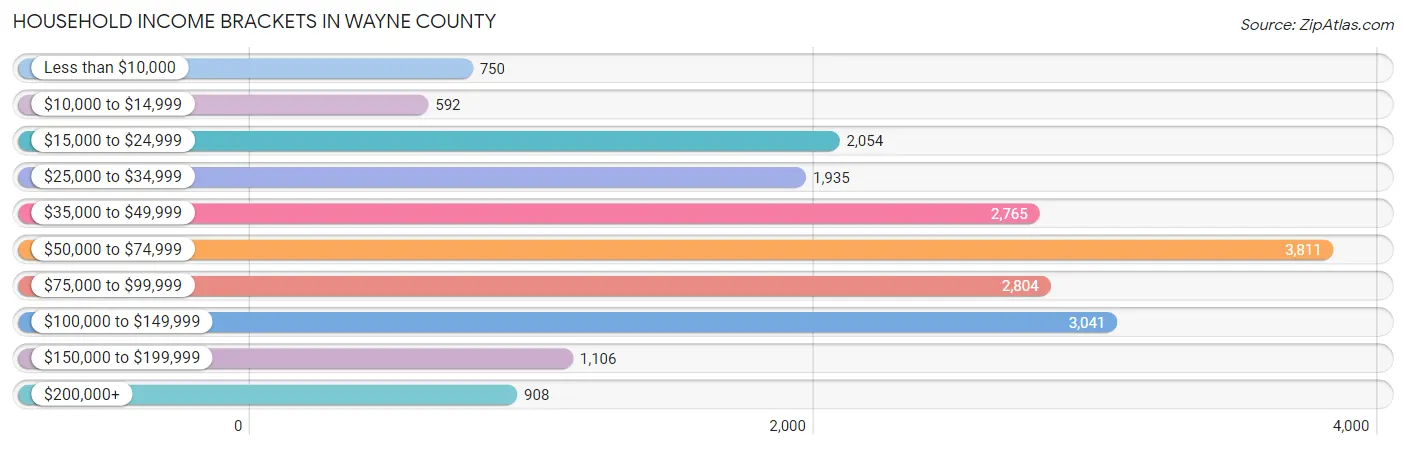
| Income Bracket | # Households | % Households |
| Less than $10,000 | 750 | 3.8% |
| $10,000 to $14,999 | 592 | 3.0% |
| $15,000 to $24,999 | 2,054 | 10.4% |
| $25,000 to $34,999 | 1,935 | 9.8% |
| $35,000 to $49,999 | 2,765 | 14.0% |
| $50,000 to $74,999 | 3,811 | 19.3% |
| $75,000 to $99,999 | 2,804 | 14.2% |
| $100,000 to $149,999 | 3,041 | 15.4% |
| $150,000 to $199,999 | 1,106 | 5.6% |
| $200,000+ | 908 | 4.6% |
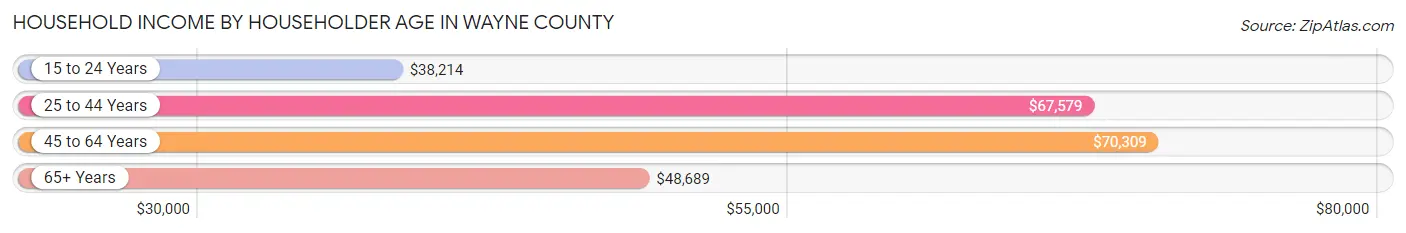
Household Income by Householder Age in Wayne County
The median household income in Wayne County is $59,240, with the highest median household income of $70,309 found in the 45 to 64 years age bracket for the primary householder. A total of 8,062 households (40.8%) fall into this category. Meanwhile, the 15 to 24 years age bracket for the primary householder has the lowest median household income of $38,214, with 216 households (1.1%) in this group.
| Income Bracket | # Households | Median Income |
| 15 to 24 Years | 216 (1.1%) | $38,214 |
| 25 to 44 Years | 3,955 (20.0%) | $67,579 |
| 45 to 64 Years | 8,062 (40.8%) | $70,309 |
| 65+ Years | 7,514 (38.1%) | $48,689 |
| Total | 19,747 (100.0%) | $59,240 |
Poverty in Wayne County
Income Below Poverty by Sex and Age in Wayne County
With 10.1% poverty level for males and 11.9% for females among the residents of Wayne County, 16 and 17 year old males and 18 to 24 year old females are the most vulnerable to poverty, with 145 males (28.3%) and 350 females (22.5%) in their respective age groups living below the poverty level.
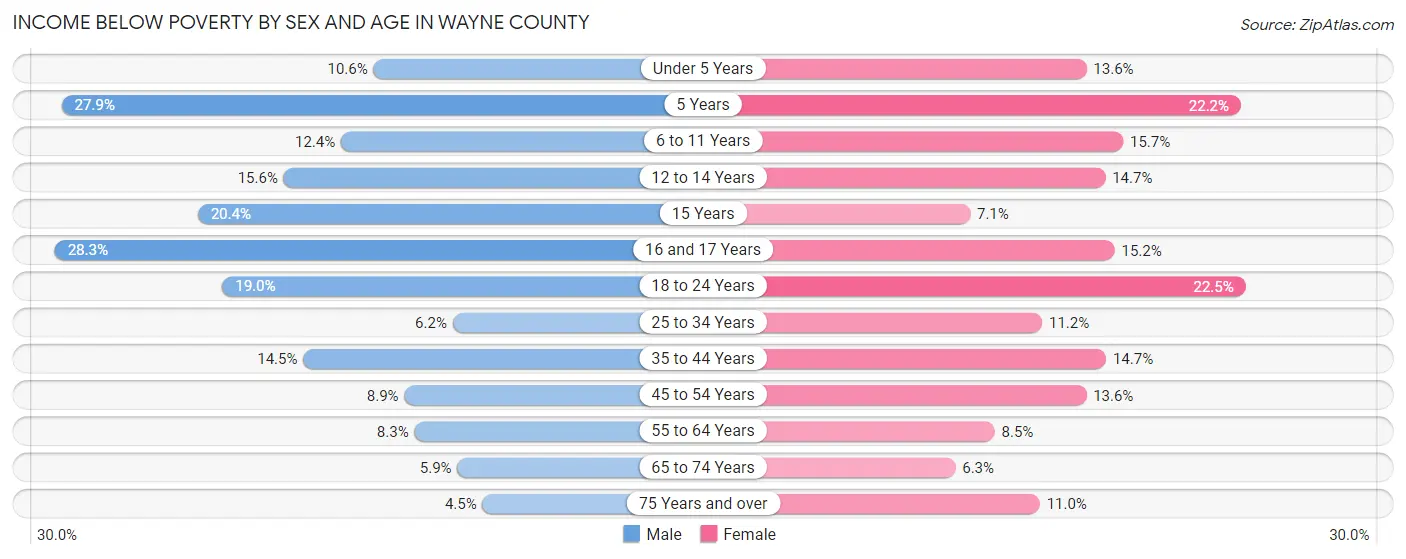
| Age Bracket | Male | Female |
| Under 5 Years | 112 (10.6%) | 134 (13.6%) |
| 5 Years | 38 (27.9%) | 34 (22.2%) |
| 6 to 11 Years | 206 (12.4%) | 233 (15.7%) |
| 12 to 14 Years | 95 (15.6%) | 82 (14.7%) |
| 15 Years | 68 (20.4%) | 18 (7.1%) |
| 16 and 17 Years | 145 (28.3%) | 77 (15.2%) |
| 18 to 24 Years | 323 (19.0%) | 350 (22.5%) |
| 25 to 34 Years | 152 (6.2%) | 268 (11.2%) |
| 35 to 44 Years | 369 (14.5%) | 363 (14.7%) |
| 45 to 54 Years | 285 (8.8%) | 403 (13.6%) |
| 55 to 64 Years | 345 (8.3%) | 340 (8.5%) |
| 65 to 74 Years | 217 (5.9%) | 240 (6.3%) |
| 75 Years and over | 102 (4.5%) | 273 (11.0%) |
| Total | 2,457 (10.1%) | 2,815 (11.9%) |
Income Above Poverty by Sex and Age in Wayne County
According to the poverty statistics in Wayne County, males aged 75 years and over and females aged 65 to 74 years are the age groups that are most secure financially, with 95.5% of males and 93.7% of females in these age groups living above the poverty line.
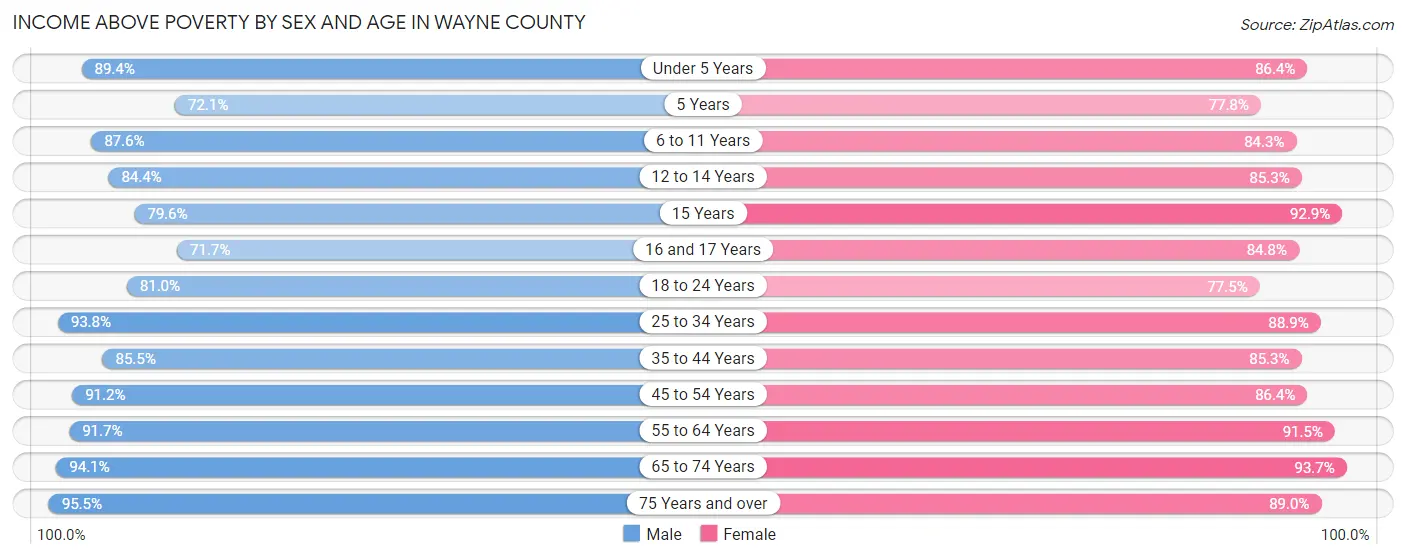
| Age Bracket | Male | Female |
| Under 5 Years | 948 (89.4%) | 850 (86.4%) |
| 5 Years | 98 (72.1%) | 119 (77.8%) |
| 6 to 11 Years | 1,458 (87.6%) | 1,255 (84.3%) |
| 12 to 14 Years | 515 (84.4%) | 477 (85.3%) |
| 15 Years | 266 (79.6%) | 234 (92.9%) |
| 16 and 17 Years | 367 (71.7%) | 430 (84.8%) |
| 18 to 24 Years | 1,378 (81.0%) | 1,207 (77.5%) |
| 25 to 34 Years | 2,315 (93.8%) | 2,136 (88.8%) |
| 35 to 44 Years | 2,179 (85.5%) | 2,104 (85.3%) |
| 45 to 54 Years | 2,937 (91.1%) | 2,557 (86.4%) |
| 55 to 64 Years | 3,815 (91.7%) | 3,656 (91.5%) |
| 65 to 74 Years | 3,458 (94.1%) | 3,557 (93.7%) |
| 75 Years and over | 2,167 (95.5%) | 2,204 (89.0%) |
| Total | 21,901 (89.9%) | 20,786 (88.1%) |
Income Below Poverty Among Married-Couple Families in Wayne County
The poverty statistics for married-couple families in Wayne County show that 4.2% or 426 of the total 10,271 families live below the poverty line. Families with 5 or more children have the highest poverty rate of 14.5%, comprising of 8 families. On the other hand, families with no children have the lowest poverty rate of 3.5%, which includes 266 families.
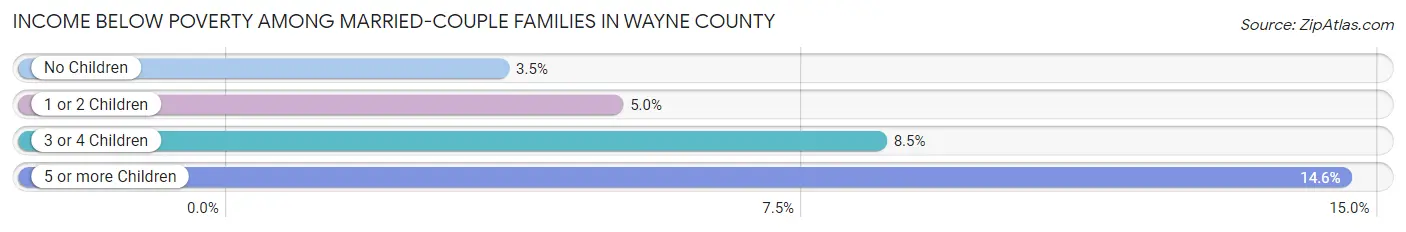
| Children | Above Poverty | Below Poverty |
| No Children | 7,251 (96.5%) | 266 (3.5%) |
| 1 or 2 Children | 2,115 (95.0%) | 112 (5.0%) |
| 3 or 4 Children | 432 (91.5%) | 40 (8.5%) |
| 5 or more Children | 47 (85.5%) | 8 (14.5%) |
| Total | 9,845 (95.9%) | 426 (4.2%) |
Income Below Poverty Among Single-Parent Households in Wayne County
According to the poverty data in Wayne County, 10.7% or 86 single-father households and 27.6% or 466 single-mother households are living below the poverty line. Among single-father households, those with 3 or 4 children have the highest poverty rate, with 8 households (27.6%) experiencing poverty. Likewise, among single-mother households, those with 3 or 4 children have the highest poverty rate, with 83 households (82.2%) falling below the poverty line.

| Children | Single Father | Single Mother |
| No Children | 15 (4.7%) | 23 (4.4%) |
| 1 or 2 Children | 63 (13.9%) | 360 (33.8%) |
| 3 or 4 Children | 8 (27.6%) | 83 (82.2%) |
| 5 or more Children | 0 (0.0%) | 0 (0.0%) |
| Total | 86 (10.7%) | 466 (27.6%) |
Income Below Poverty Among Married-Couple vs Single-Parent Households in Wayne County
The poverty data for Wayne County shows that 426 of the married-couple family households (4.2%) and 552 of the single-parent households (22.2%) are living below the poverty level. Within the married-couple family households, those with 5 or more children have the highest poverty rate, with 8 households (14.5%) falling below the poverty line. Among the single-parent households, those with 3 or 4 children have the highest poverty rate, with 91 household (70.0%) living below poverty.
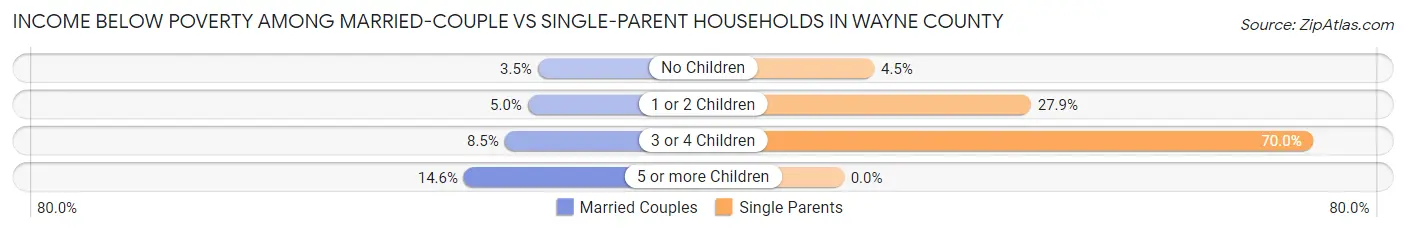
| Children | Married-Couple Families | Single-Parent Households |
| No Children | 266 (3.5%) | 38 (4.5%) |
| 1 or 2 Children | 112 (5.0%) | 423 (27.9%) |
| 3 or 4 Children | 40 (8.5%) | 91 (70.0%) |
| 5 or more Children | 8 (14.5%) | 0 (0.0%) |
| Total | 426 (4.2%) | 552 (22.2%) |
Race in Wayne County
The most populous races in Wayne County are White / Caucasian (46,747 | 91.2%), Hispanic or Latino (2,518 | 4.9%), and Two or more Races (1,962 | 3.8%).
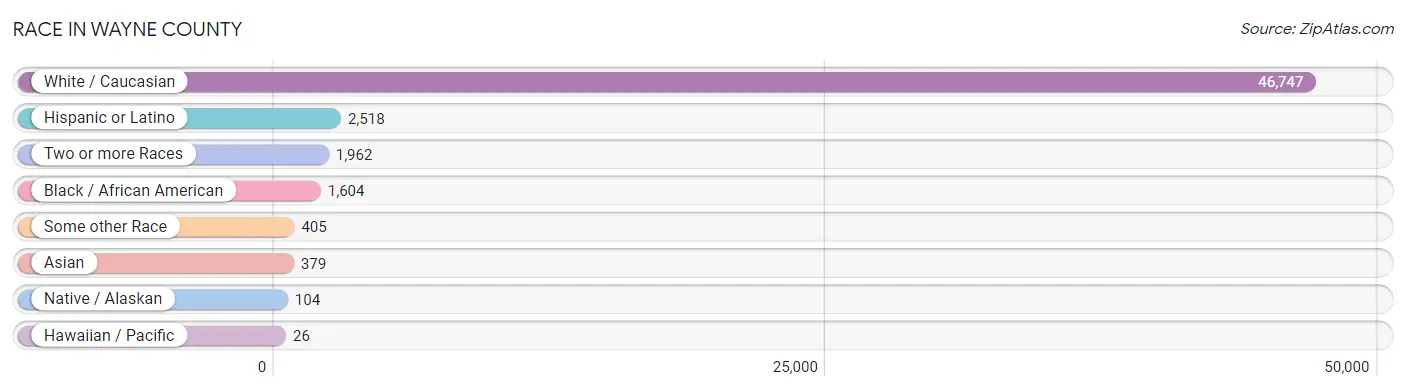
| Race | # Population | % Population |
| Asian | 379 | 0.7% |
| Black / African American | 1,604 | 3.1% |
| Hawaiian / Pacific | 26 | 0.1% |
| Hispanic or Latino | 2,518 | 4.9% |
| Native / Alaskan | 104 | 0.2% |
| White / Caucasian | 46,747 | 91.2% |
| Two or more Races | 1,962 | 3.8% |
| Some other Race | 405 | 0.8% |
| Total | 51,227 | 100.0% |
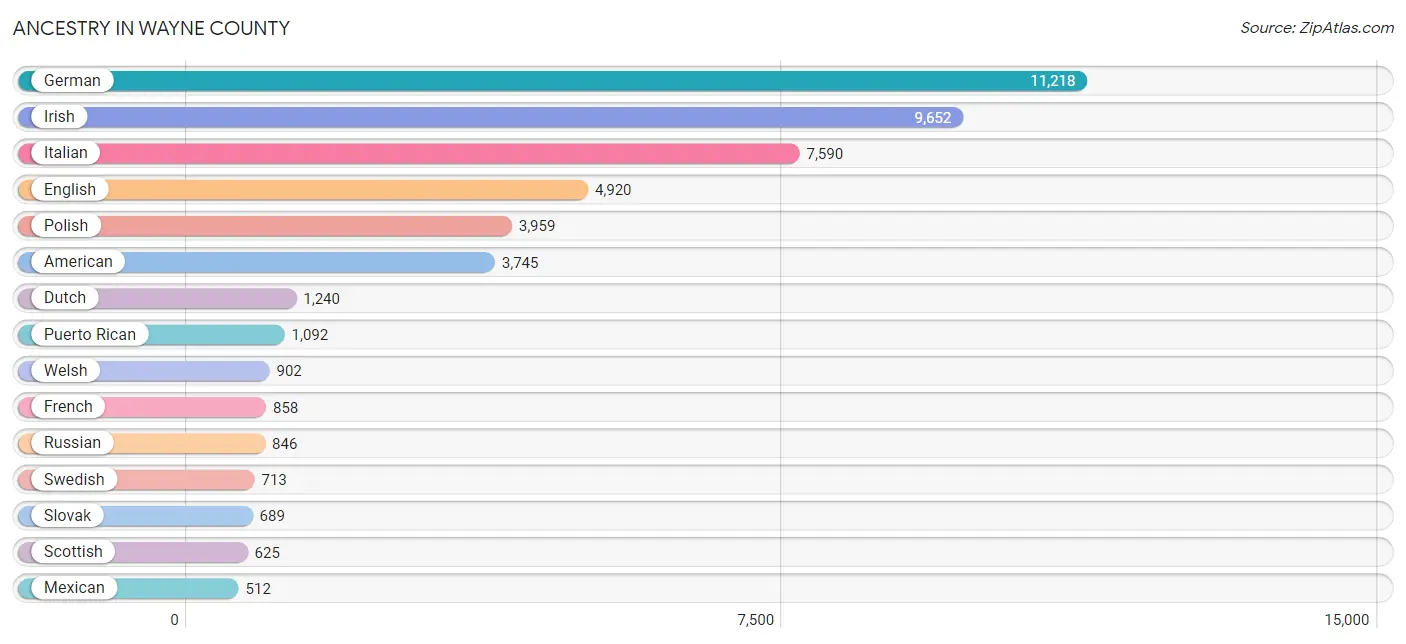
Ancestry in Wayne County
The most populous ancestries reported in Wayne County are German (11,218 | 21.9%), Irish (9,652 | 18.8%), Italian (7,590 | 14.8%), English (4,920 | 9.6%), and Polish (3,959 | 7.7%), together accounting for 72.9% of all Wayne County residents.
| Ancestry | # Population | % Population |
| Afghan | 3 | 0.0% |
| African | 22 | 0.0% |
| American | 3,745 | 7.3% |
| Apache | 8 | 0.0% |
| Arab | 115 | 0.2% |
| Armenian | 13 | 0.0% |
| Austrian | 232 | 0.4% |
| Belgian | 92 | 0.2% |
| Bhutanese | 115 | 0.2% |
| Blackfeet | 64 | 0.1% |
| Bolivian | 37 | 0.1% |
| Brazilian | 32 | 0.1% |
| British | 154 | 0.3% |
| British West Indian | 7 | 0.0% |
| Bulgarian | 5 | 0.0% |
| Burmese | 109 | 0.2% |
| Canadian | 58 | 0.1% |
| Central American | 24 | 0.1% |
| Central American Indian | 70 | 0.1% |
| Cherokee | 99 | 0.2% |
| Colombian | 62 | 0.1% |
| Costa Rican | 3 | 0.0% |
| Croatian | 112 | 0.2% |
| Cuban | 84 | 0.2% |
| Czech | 49 | 0.1% |
| Czechoslovakian | 124 | 0.2% |
| Danish | 81 | 0.2% |
| Delaware | 14 | 0.0% |
| Dominican | 274 | 0.5% |
| Dutch | 1,240 | 2.4% |
| Dutch West Indian | 28 | 0.1% |
| Eastern European | 116 | 0.2% |
| Ecuadorian | 7 | 0.0% |
| Egyptian | 13 | 0.0% |
| English | 4,920 | 9.6% |
| Estonian | 4 | 0.0% |
| Ethiopian | 9 | 0.0% |
| European | 501 | 1.0% |
| Finnish | 107 | 0.2% |
| French | 858 | 1.7% |
| French American Indian | 4 | 0.0% |
| French Canadian | 137 | 0.3% |
| German | 11,218 | 21.9% |
| German Russian | 12 | 0.0% |
| Greek | 183 | 0.4% |
| Guatemalan | 9 | 0.0% |
| Haitian | 6 | 0.0% |
| Hungarian | 406 | 0.8% |
| Icelander | 11 | 0.0% |
| Indian (Asian) | 63 | 0.1% |
| Iranian | 28 | 0.1% |
| Irish | 9,652 | 18.8% |
| Iroquois | 24 | 0.1% |
| Israeli | 11 | 0.0% |
| Italian | 7,590 | 14.8% |
| Jamaican | 14 | 0.0% |
| Japanese | 21 | 0.0% |
| Korean | 101 | 0.2% |
| Lebanese | 95 | 0.2% |
| Lithuanian | 368 | 0.7% |
| Macedonian | 6 | 0.0% |
| Mexican | 512 | 1.0% |
| Mongolian | 9 | 0.0% |
| Northern European | 4 | 0.0% |
| Norwegian | 214 | 0.4% |
| Pakistani | 13 | 0.0% |
| Panamanian | 12 | 0.0% |
| Pennsylvania German | 126 | 0.3% |
| Polish | 3,959 | 7.7% |
| Portuguese | 29 | 0.1% |
| Puerto Rican | 1,092 | 2.1% |
| Romanian | 61 | 0.1% |
| Russian | 846 | 1.7% |
| Scandinavian | 172 | 0.3% |
| Scotch-Irish | 282 | 0.5% |
| Scottish | 625 | 1.2% |
| Seminole | 59 | 0.1% |
| Senegalese | 3 | 0.0% |
| Serbian | 10 | 0.0% |
| Sioux | 17 | 0.0% |
| Slavic | 38 | 0.1% |
| Slovak | 689 | 1.3% |
| Slovene | 132 | 0.3% |
| South American | 117 | 0.2% |
| Spaniard | 88 | 0.2% |
| Spanish | 42 | 0.1% |
| Sri Lankan | 11 | 0.0% |
| Subsaharan African | 36 | 0.1% |
| Swedish | 713 | 1.4% |
| Swiss | 155 | 0.3% |
| Syrian | 7 | 0.0% |
| Thai | 3 | 0.0% |
| Trinidadian and Tobagonian | 13 | 0.0% |
| Turkish | 23 | 0.0% |
| Ugandan | 1 | 0.0% |
| Ukrainian | 444 | 0.9% |
| Uruguayan | 11 | 0.0% |
| Welsh | 902 | 1.8% |
| West Indian | 62 | 0.1% |
| Yugoslavian | 44 | 0.1% | View All 100 Rows |
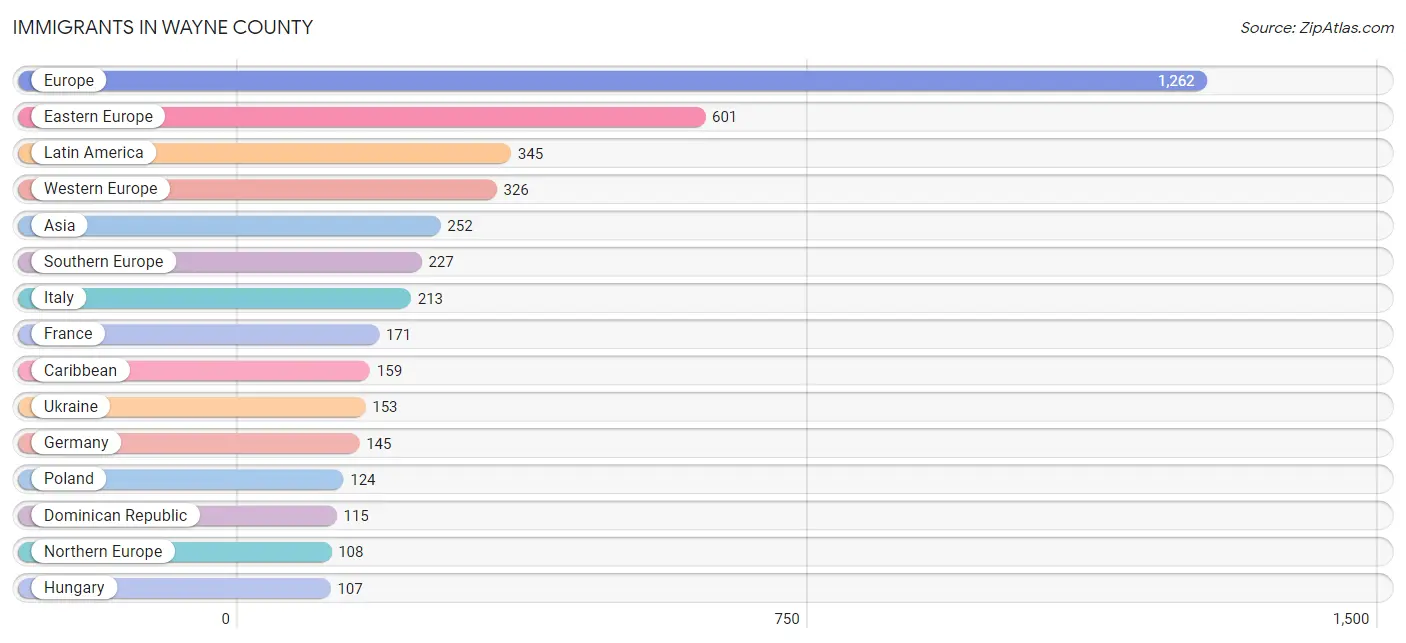
Immigrants in Wayne County
The most numerous immigrant groups reported in Wayne County came from Europe (1,262 | 2.5%), Eastern Europe (601 | 1.2%), Latin America (345 | 0.7%), Western Europe (326 | 0.6%), and Asia (252 | 0.5%), together accounting for 5.4% of all Wayne County residents.
| Immigration Origin | # Population | % Population |
| Afghanistan | 3 | 0.0% |
| Africa | 9 | 0.0% |
| Asia | 252 | 0.5% |
| Australia | 8 | 0.0% |
| Austria | 3 | 0.0% |
| Bolivia | 37 | 0.1% |
| Bosnia and Herzegovina | 28 | 0.1% |
| Brazil | 18 | 0.0% |
| Bulgaria | 5 | 0.0% |
| Cambodia | 18 | 0.0% |
| Canada | 40 | 0.1% |
| Caribbean | 159 | 0.3% |
| Central America | 92 | 0.2% |
| China | 28 | 0.1% |
| Colombia | 4 | 0.0% |
| Costa Rica | 3 | 0.0% |
| Croatia | 34 | 0.1% |
| Cuba | 16 | 0.0% |
| Czechoslovakia | 23 | 0.0% |
| Dominican Republic | 115 | 0.2% |
| Eastern Africa | 3 | 0.0% |
| Eastern Asia | 105 | 0.2% |
| Eastern Europe | 601 | 1.2% |
| Egypt | 6 | 0.0% |
| England | 41 | 0.1% |
| Europe | 1,262 | 2.5% |
| France | 171 | 0.3% |
| Germany | 145 | 0.3% |
| Guatemala | 9 | 0.0% |
| Haiti | 10 | 0.0% |
| Hungary | 107 | 0.2% |
| India | 18 | 0.0% |
| Indonesia | 4 | 0.0% |
| Italy | 213 | 0.4% |
| Jamaica | 7 | 0.0% |
| Japan | 38 | 0.1% |
| Korea | 39 | 0.1% |
| Latin America | 345 | 0.7% |
| Lithuania | 6 | 0.0% |
| Malaysia | 9 | 0.0% |
| Mexico | 68 | 0.1% |
| Micronesia | 26 | 0.1% |
| Moldova | 10 | 0.0% |
| Netherlands | 7 | 0.0% |
| Northern Africa | 6 | 0.0% |
| Northern Europe | 108 | 0.2% |
| Norway | 2 | 0.0% |
| Oceania | 34 | 0.1% |
| Pakistan | 20 | 0.0% |
| Panama | 12 | 0.0% |
| Philippines | 25 | 0.1% |
| Poland | 124 | 0.2% |
| Romania | 49 | 0.1% |
| Russia | 33 | 0.1% |
| Scotland | 57 | 0.1% |
| Serbia | 10 | 0.0% |
| South America | 94 | 0.2% |
| South Central Asia | 43 | 0.1% |
| South Eastern Asia | 86 | 0.2% |
| Southern Europe | 227 | 0.4% |
| Spain | 14 | 0.0% |
| Sri Lanka | 2 | 0.0% |
| Thailand | 13 | 0.0% |
| Trinidad and Tobago | 4 | 0.0% |
| Turkey | 18 | 0.0% |
| Uganda | 1 | 0.0% |
| Ukraine | 153 | 0.3% |
| Venezuela | 35 | 0.1% |
| Vietnam | 10 | 0.0% |
| Western Asia | 18 | 0.0% |
| Western Europe | 326 | 0.6% | View All 71 Rows |
Sex and Age in Wayne County
Sex and Age in Wayne County
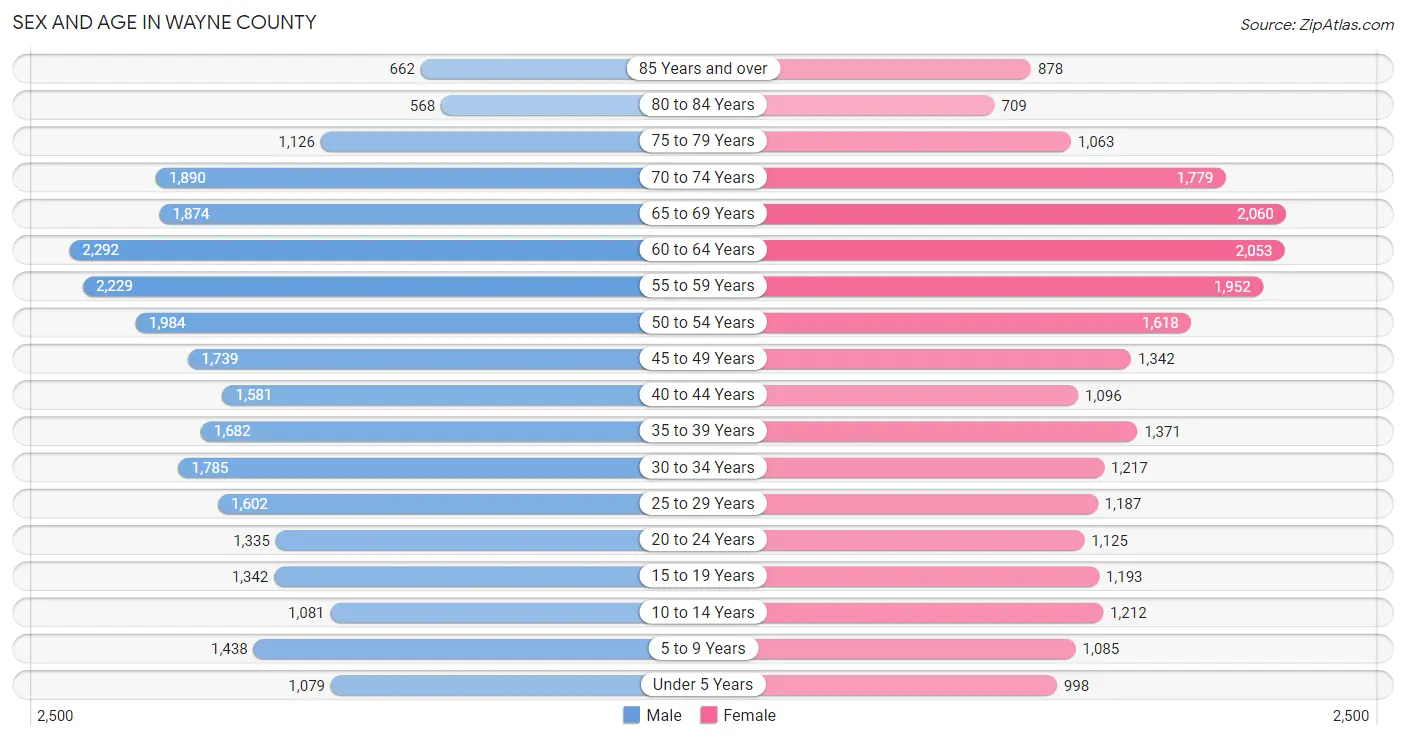
The most populous age groups in Wayne County are 60 to 64 Years (2,292 | 8.4%) for men and 65 to 69 Years (2,060 | 8.6%) for women.
| Age Bracket | Male | Female |
| Under 5 Years | 1,079 (4.0%) | 998 (4.2%) |
| 5 to 9 Years | 1,438 (5.3%) | 1,085 (4.5%) |
| 10 to 14 Years | 1,081 (4.0%) | 1,212 (5.1%) |
| 15 to 19 Years | 1,342 (4.9%) | 1,193 (5.0%) |
| 20 to 24 Years | 1,335 (4.9%) | 1,125 (4.7%) |
| 25 to 29 Years | 1,602 (5.9%) | 1,187 (5.0%) |
| 30 to 34 Years | 1,785 (6.5%) | 1,217 (5.1%) |
| 35 to 39 Years | 1,682 (6.2%) | 1,371 (5.7%) |
| 40 to 44 Years | 1,581 (5.8%) | 1,096 (4.6%) |
| 45 to 49 Years | 1,739 (6.4%) | 1,342 (5.6%) |
| 50 to 54 Years | 1,984 (7.3%) | 1,618 (6.8%) |
| 55 to 59 Years | 2,229 (8.2%) | 1,952 (8.2%) |
| 60 to 64 Years | 2,292 (8.4%) | 2,053 (8.6%) |
| 65 to 69 Years | 1,874 (6.9%) | 2,060 (8.6%) |
| 70 to 74 Years | 1,890 (6.9%) | 1,779 (7.4%) |
| 75 to 79 Years | 1,126 (4.1%) | 1,063 (4.4%) |
| 80 to 84 Years | 568 (2.1%) | 709 (3.0%) |
| 85 Years and over | 662 (2.4%) | 878 (3.7%) |
| Total | 27,289 (100.0%) | 23,938 (100.0%) |
Families and Households in Wayne County
Median Family Size in Wayne County
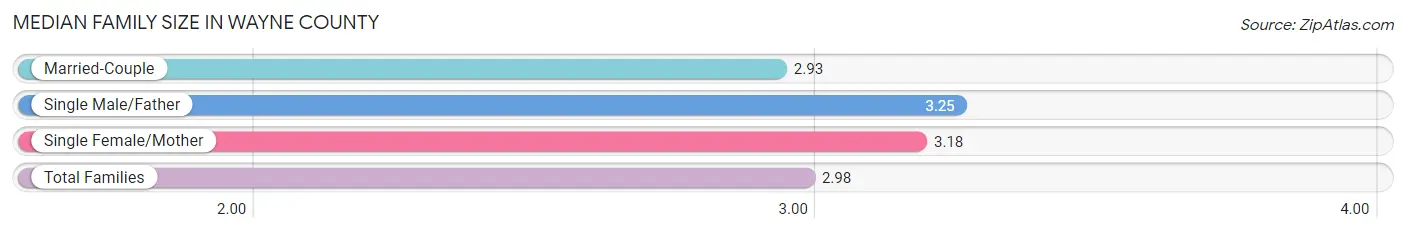
The median family size in Wayne County is 2.98 persons per family, with single male/father families (802 | 6.3%) accounting for the largest median family size of 3.25 persons per family. On the other hand, married-couple families (10,271 | 80.5%) represent the smallest median family size with 2.93 persons per family.
| Family Type | # Families | Family Size |
| Married-Couple | 10,271 (80.5%) | 2.93 |
| Single Male/Father | 802 (6.3%) | 3.25 |
| Single Female/Mother | 1,686 (13.2%) | 3.18 |
| Total Families | 12,759 (100.0%) | 2.98 |
Median Household Size in Wayne County
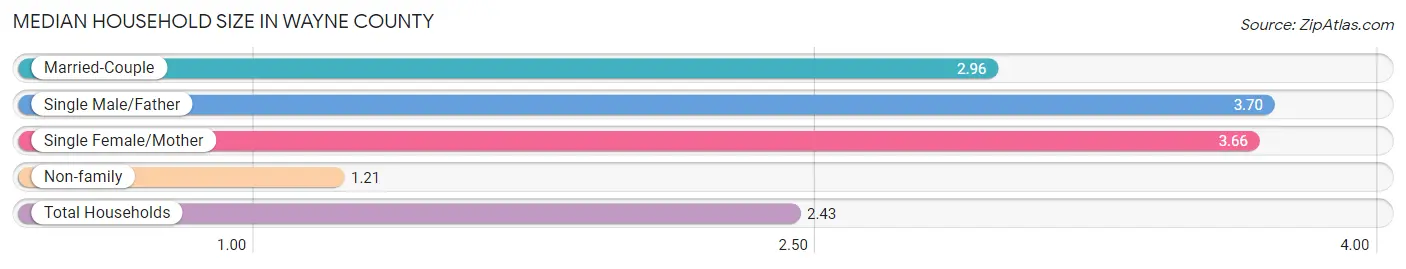
The median household size in Wayne County is 2.43 persons per household, with single male/father households (802 | 4.1%) accounting for the largest median household size of 3.7 persons per household. non-family households (6,988 | 35.4%) represent the smallest median household size with 1.21 persons per household.
| Household Type | # Households | Household Size |
| Married-Couple | 10,271 (52.0%) | 2.96 |
| Single Male/Father | 802 (4.1%) | 3.70 |
| Single Female/Mother | 1,686 (8.5%) | 3.66 |
| Non-family | 6,988 (35.4%) | 1.21 |
| Total Households | 19,747 (100.0%) | 2.43 |
Household Size by Marriage Status in Wayne County
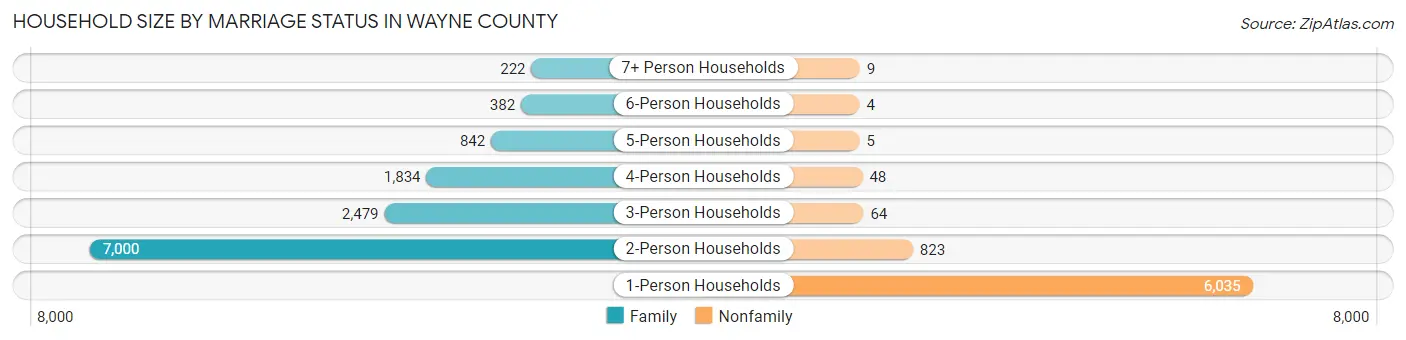
Out of a total of 19,747 households in Wayne County, 12,759 (64.6%) are family households, while 6,988 (35.4%) are nonfamily households. The most numerous type of family households are 2-person households, comprising 7,000, and the most common type of nonfamily households are 1-person households, comprising 6,035.
| Household Size | Family Households | Nonfamily Households |
| 1-Person Households | - | 6,035 (30.6%) |
| 2-Person Households | 7,000 (35.4%) | 823 (4.2%) |
| 3-Person Households | 2,479 (12.6%) | 64 (0.3%) |
| 4-Person Households | 1,834 (9.3%) | 48 (0.2%) |
| 5-Person Households | 842 (4.3%) | 5 (0.0%) |
| 6-Person Households | 382 (1.9%) | 4 (0.0%) |
| 7+ Person Households | 222 (1.1%) | 9 (0.1%) |
| Total | 12,759 (64.6%) | 6,988 (35.4%) |
Female Fertility in Wayne County
Fertility by Age in Wayne County
Average fertility rate in Wayne County is 41.0 births per 1,000 women. Women in the age bracket of 20 to 34 years have the highest fertility rate with 60.0 births per 1,000 women. Women in the age bracket of 20 to 34 years acount for 57.5% of all women with births.
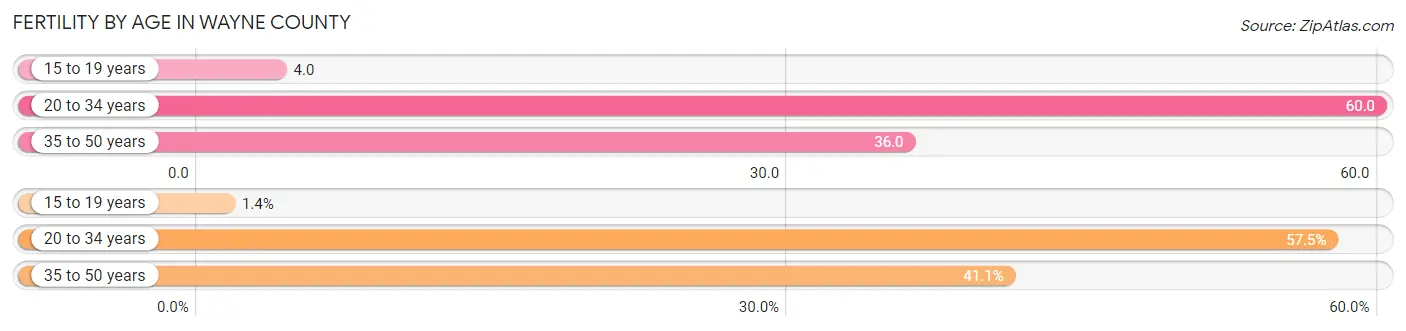
| Age Bracket | Women with Births | Births / 1,000 Women |
| 15 to 19 years | 5 (1.4%) | 4.0 |
| 20 to 34 years | 210 (57.5%) | 60.0 |
| 35 to 50 years | 150 (41.1%) | 36.0 |
| Total | 365 (100.0%) | 41.0 |
Fertility by Age by Marriage Status in Wayne County
73.4% of women with births (365) in Wayne County are married. The highest percentage of unmarried women with births falls into 15 to 19 years age bracket with 100.0% of them unmarried at the time of birth, while the lowest percentage of unmarried women with births belong to 35 to 50 years age bracket with 12.7% of them unmarried.
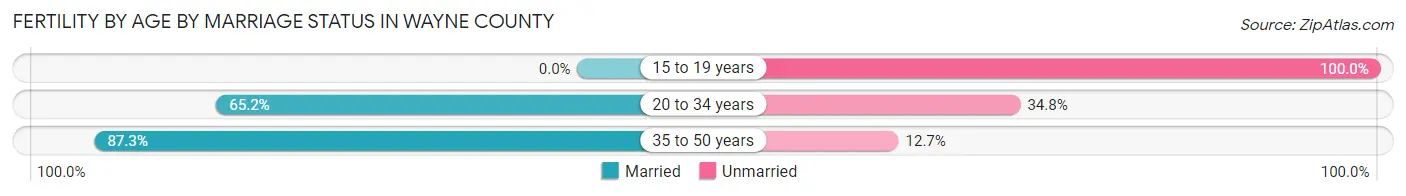
| Age Bracket | Married | Unmarried |
| 15 to 19 years | 0 (0.0%) | 5 (100.0%) |
| 20 to 34 years | 137 (65.2%) | 73 (34.8%) |
| 35 to 50 years | 131 (87.3%) | 19 (12.7%) |
| Total | 268 (73.4%) | 97 (26.6%) |
Fertility by Education in Wayne County
Average fertility rate in Wayne County is 41.0 births per 1,000 women. Women with the education attainment of graduate degree have the highest fertility rate of 86.0 births per 1,000 women, while women with the education attainment of less than high school have the lowest fertility at 10.0 births per 1,000 women. Women with the education attainment of high school diploma represent 39.7% of all women with births.
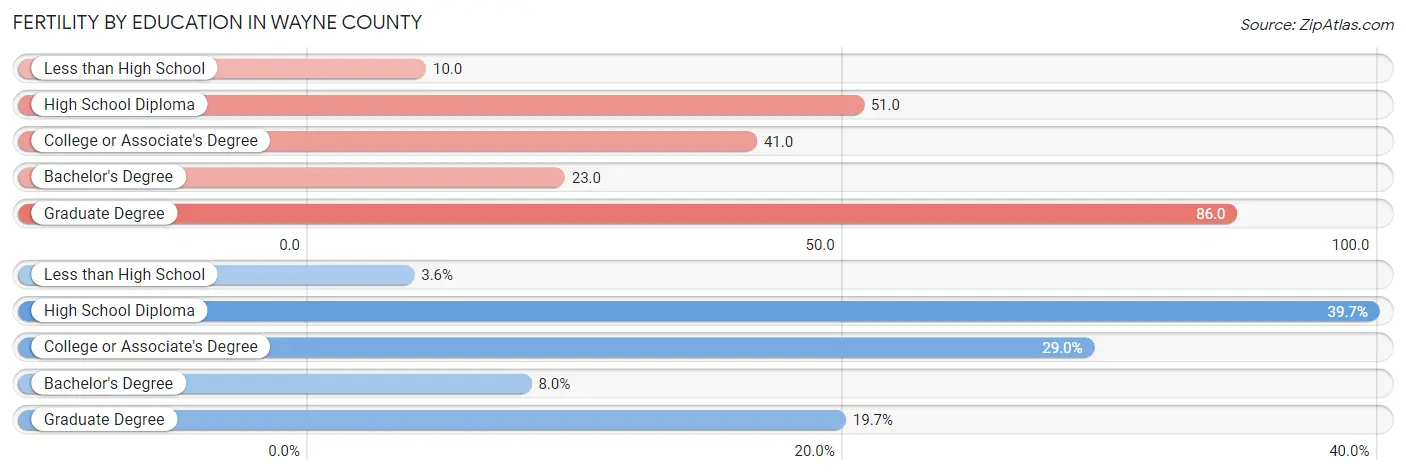
| Educational Attainment | Women with Births | Births / 1,000 Women |
| Less than High School | 13 (3.6%) | 10.0 |
| High School Diploma | 145 (39.7%) | 51.0 |
| College or Associate's Degree | 106 (29.0%) | 41.0 |
| Bachelor's Degree | 29 (8.0%) | 23.0 |
| Graduate Degree | 72 (19.7%) | 86.0 |
| Total | 365 (100.0%) | 41.0 |
Fertility by Education by Marriage Status in Wayne County
26.6% of women with births in Wayne County are unmarried. Women with the educational attainment of graduate degree are most likely to be married with 86.1% of them married at childbirth, while women with the educational attainment of bachelor's degree are least likely to be married with 44.8% of them unmarried at childbirth.
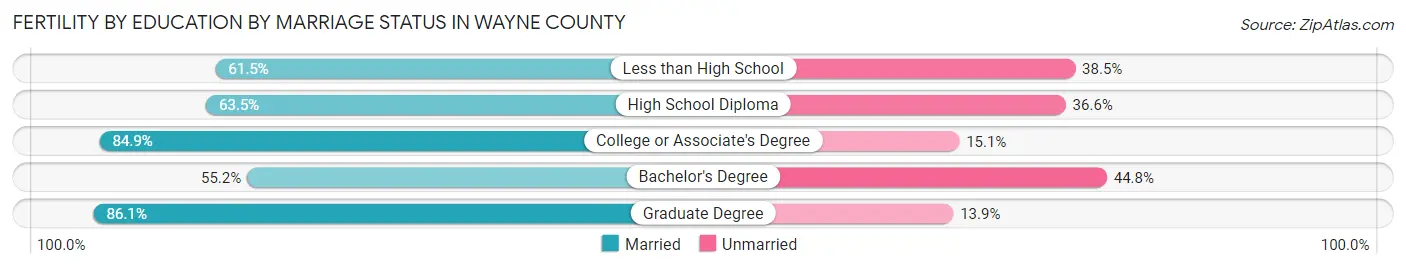
| Educational Attainment | Married | Unmarried |
| Less than High School | 8 (61.5%) | 5 (38.5%) |
| High School Diploma | 92 (63.4%) | 53 (36.5%) |
| College or Associate's Degree | 90 (84.9%) | 16 (15.1%) |
| Bachelor's Degree | 16 (55.2%) | 13 (44.8%) |
| Graduate Degree | 62 (86.1%) | 10 (13.9%) |
| Total | 268 (73.4%) | 97 (26.6%) |
Employment Characteristics in Wayne County
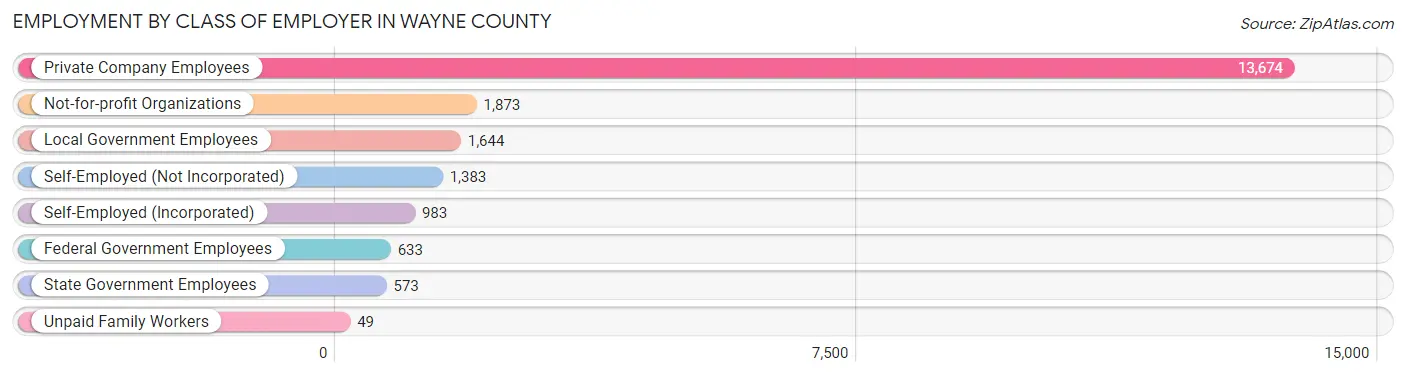
Employment by Class of Employer in Wayne County
Among the 20,812 employed individuals in Wayne County, private company employees (13,674 | 65.7%), not-for-profit organizations (1,873 | 9.0%), and local government employees (1,644 | 7.9%) make up the most common classes of employment.
| Employer Class | # Employees | % Employees |
| Private Company Employees | 13,674 | 65.7% |
| Self-Employed (Incorporated) | 983 | 4.7% |
| Self-Employed (Not Incorporated) | 1,383 | 6.7% |
| Not-for-profit Organizations | 1,873 | 9.0% |
| Local Government Employees | 1,644 | 7.9% |
| State Government Employees | 573 | 2.8% |
| Federal Government Employees | 633 | 3.0% |
| Unpaid Family Workers | 49 | 0.2% |
| Total | 20,812 | 100.0% |
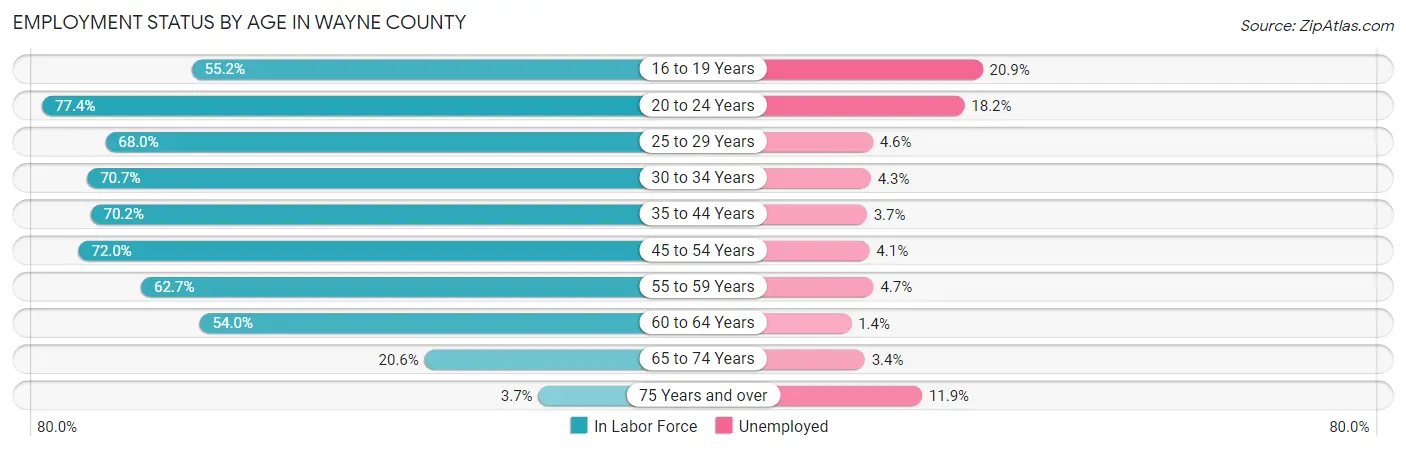
Employment Status by Age in Wayne County
According to the labor force statistics for Wayne County, out of the total population over 16 years of age (43,747), 51.6% or 22,573 individuals are in the labor force, with 5.9% or 1,332 of them unemployed. The age group with the highest labor force participation rate is 20 to 24 years, with 77.4% or 1,904 individuals in the labor force. Within the labor force, the 16 to 19 years age range has the highest percentage of unemployed individuals, with 20.9% or 225 of them being unemployed.
| Age Bracket | In Labor Force | Unemployed |
| 16 to 19 Years | 1,075 (55.2%) | 225 (20.9%) |
| 20 to 24 Years | 1,904 (77.4%) | 347 (18.2%) |
| 25 to 29 Years | 1,897 (68.0%) | 87 (4.6%) |
| 30 to 34 Years | 2,122 (70.7%) | 91 (4.3%) |
| 35 to 44 Years | 4,022 (70.2%) | 149 (3.7%) |
| 45 to 54 Years | 4,812 (72.0%) | 197 (4.1%) |
| 55 to 59 Years | 2,621 (62.7%) | 123 (4.7%) |
| 60 to 64 Years | 2,346 (54.0%) | 33 (1.4%) |
| 65 to 74 Years | 1,566 (20.6%) | 53 (3.4%) |
| 75 Years and over | 185 (3.7%) | 22 (11.9%) |
| Total | 22,573 (51.6%) | 1,332 (5.9%) |
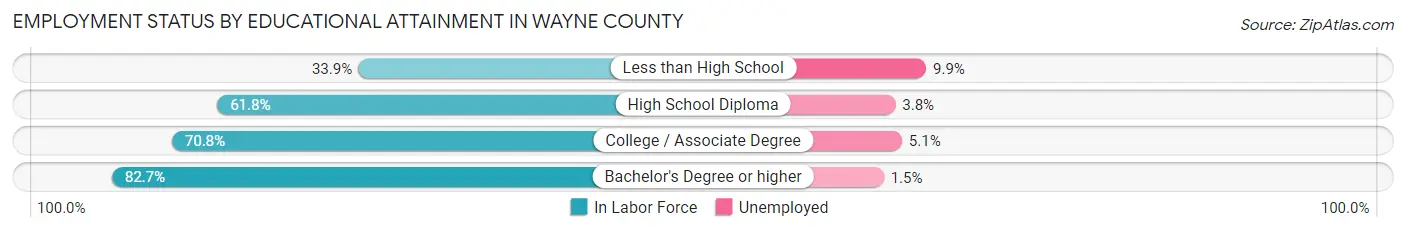
Employment Status by Educational Attainment in Wayne County
According to labor force statistics for Wayne County, 66.7% of individuals (17,829) out of the total population between 25 and 64 years of age (26,730) are in the labor force, with 3.8% or 678 of them being unemployed. The group with the highest labor force participation rate are those with the educational attainment of bachelor's degree or higher, with 82.7% or 4,455 individuals in the labor force. Within the labor force, individuals with less than high school education have the highest percentage of unemployment, with 9.9% or 63 of them being unemployed.
| Educational Attainment | In Labor Force | Unemployed |
| Less than High School | 637 (33.9%) | 186 (9.9%) |
| High School Diploma | 7,247 (61.8%) | 446 (3.8%) |
| College / Associate Degree | 5,479 (70.8%) | 395 (5.1%) |
| Bachelor's Degree or higher | 4,455 (82.7%) | 81 (1.5%) |
| Total | 17,829 (66.7%) | 1,016 (3.8%) |
Employment Occupations by Sex in Wayne County
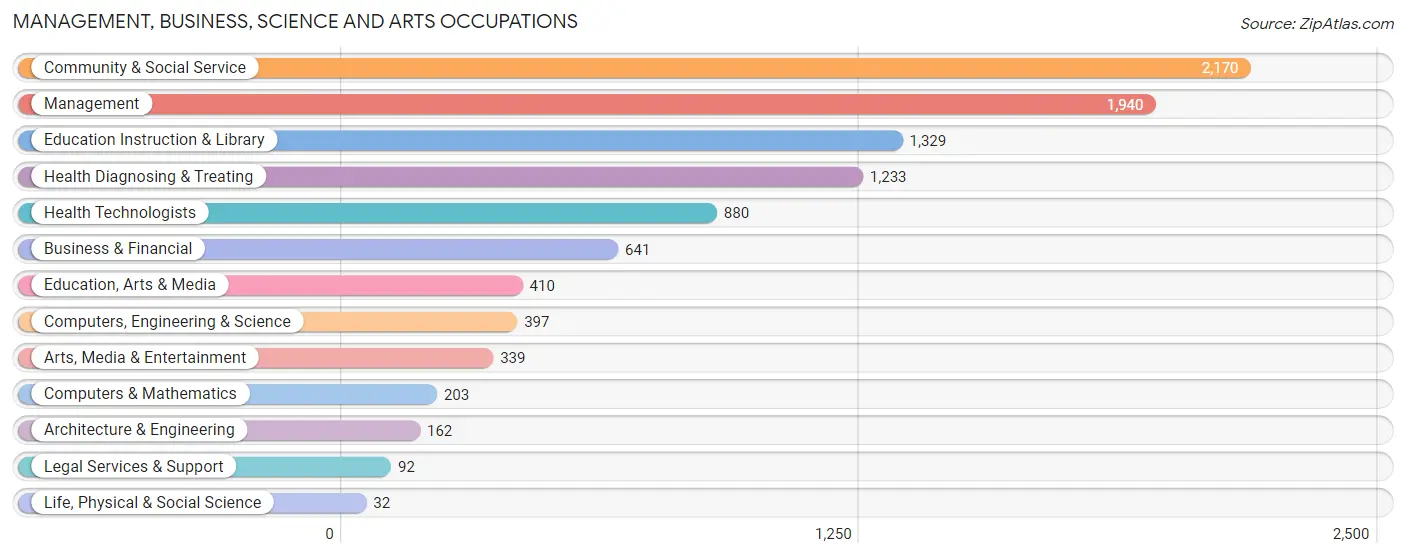
Management, Business, Science and Arts Occupations
The most common Management, Business, Science and Arts occupations in Wayne County are Community & Social Service (2,170 | 10.2%), Management (1,940 | 9.1%), Education Instruction & Library (1,329 | 6.3%), Health Diagnosing & Treating (1,233 | 5.8%), and Health Technologists (880 | 4.2%).
Management, Business, Science and Arts Occupations by Sex
Within the Management, Business, Science and Arts occupations in Wayne County, the most male-oriented occupations are Architecture & Engineering (89.5%), Life, Physical & Social Science (84.4%), and Computers, Engineering & Science (79.1%), while the most female-oriented occupations are Health Diagnosing & Treating (80.7%), Health Technologists (80.3%), and Education Instruction & Library (78.5%).
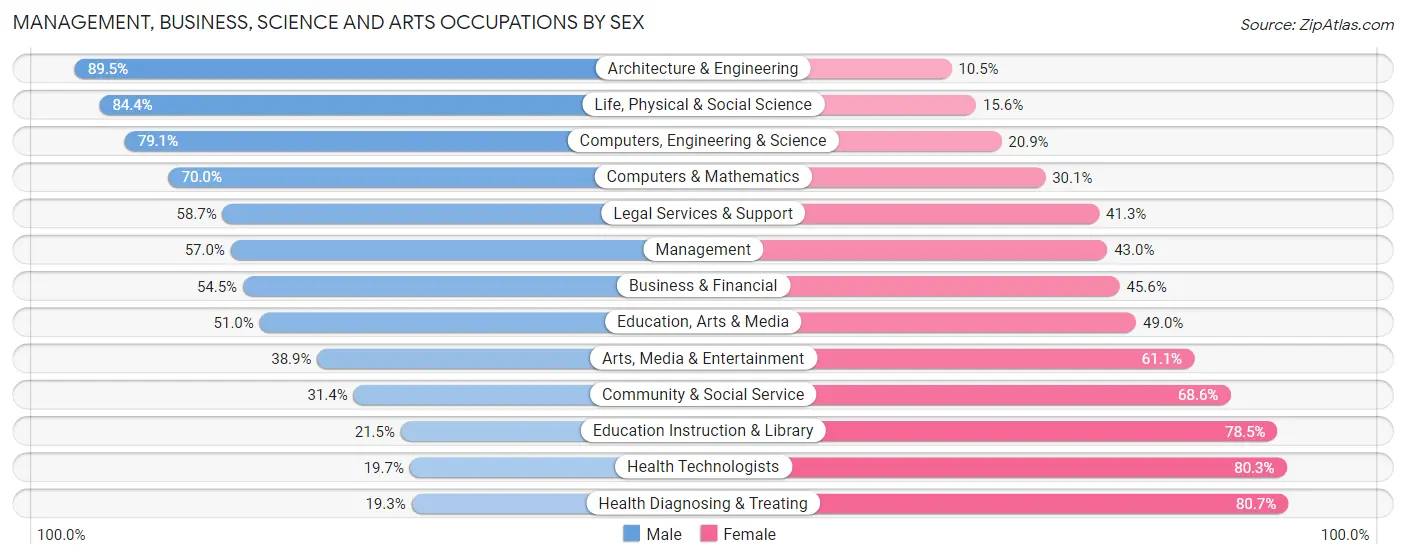
| Occupation | Male | Female |
| Management | 1,106 (57.0%) | 834 (43.0%) |
| Business & Financial | 349 (54.4%) | 292 (45.6%) |
| Computers, Engineering & Science | 314 (79.1%) | 83 (20.9%) |
| Computers & Mathematics | 142 (70.0%) | 61 (30.0%) |
| Architecture & Engineering | 145 (89.5%) | 17 (10.5%) |
| Life, Physical & Social Science | 27 (84.4%) | 5 (15.6%) |
| Community & Social Service | 681 (31.4%) | 1,489 (68.6%) |
| Education, Arts & Media | 209 (51.0%) | 201 (49.0%) |
| Legal Services & Support | 54 (58.7%) | 38 (41.3%) |
| Education Instruction & Library | 286 (21.5%) | 1,043 (78.5%) |
| Arts, Media & Entertainment | 132 (38.9%) | 207 (61.1%) |
| Health Diagnosing & Treating | 238 (19.3%) | 995 (80.7%) |
| Health Technologists | 173 (19.7%) | 707 (80.3%) |
| Total (Category) | 2,688 (42.1%) | 3,693 (57.9%) |
| Total (Overall) | 11,427 (53.9%) | 9,790 (46.1%) |
Services Occupations
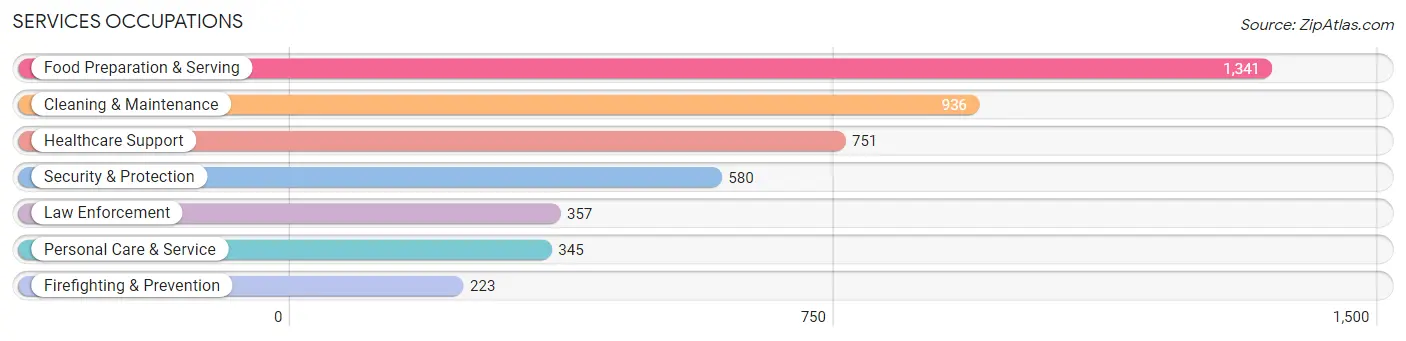
The most common Services occupations in Wayne County are Food Preparation & Serving (1,341 | 6.3%), Cleaning & Maintenance (936 | 4.4%), Healthcare Support (751 | 3.5%), Security & Protection (580 | 2.7%), and Law Enforcement (357 | 1.7%).
Services Occupations by Sex
Within the Services occupations in Wayne County, the most male-oriented occupations are Law Enforcement (78.1%), Security & Protection (77.6%), and Firefighting & Prevention (76.7%), while the most female-oriented occupations are Healthcare Support (91.3%), Personal Care & Service (80.9%), and Food Preparation & Serving (60.9%).
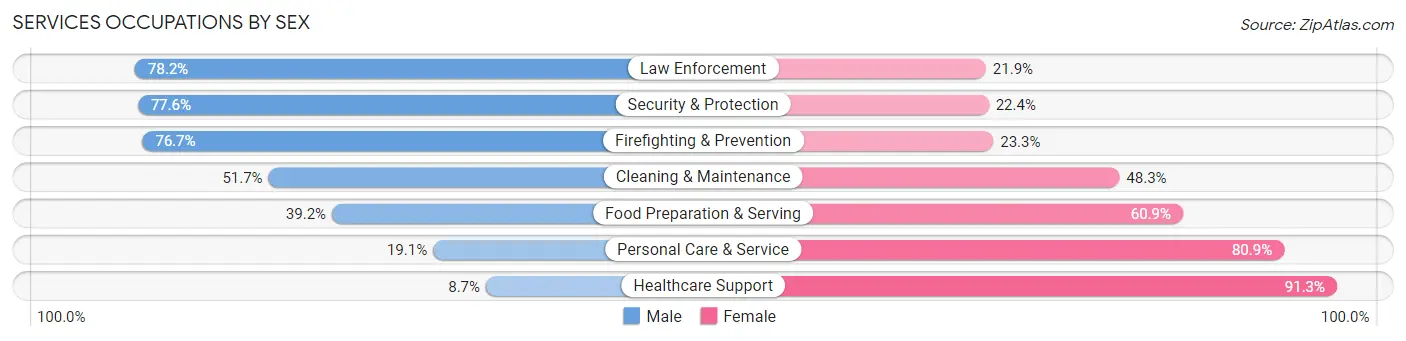
| Occupation | Male | Female |
| Healthcare Support | 65 (8.7%) | 686 (91.3%) |
| Security & Protection | 450 (77.6%) | 130 (22.4%) |
| Firefighting & Prevention | 171 (76.7%) | 52 (23.3%) |
| Law Enforcement | 279 (78.1%) | 78 (21.8%) |
| Food Preparation & Serving | 525 (39.2%) | 816 (60.9%) |
| Cleaning & Maintenance | 484 (51.7%) | 452 (48.3%) |
| Personal Care & Service | 66 (19.1%) | 279 (80.9%) |
| Total (Category) | 1,590 (40.2%) | 2,363 (59.8%) |
| Total (Overall) | 11,427 (53.9%) | 9,790 (46.1%) |
Sales and Office Occupations
The most common Sales and Office occupations in Wayne County are Office & Administration (2,392 | 11.3%), and Sales & Related (2,022 | 9.5%).

Sales and Office Occupations by Sex
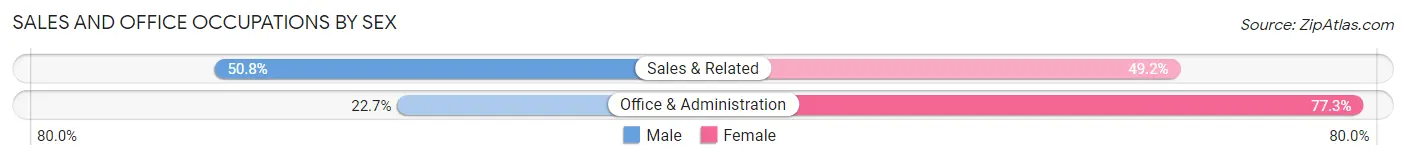
| Occupation | Male | Female |
| Sales & Related | 1,027 (50.8%) | 995 (49.2%) |
| Office & Administration | 542 (22.7%) | 1,850 (77.3%) |
| Total (Category) | 1,569 (35.5%) | 2,845 (64.4%) |
| Total (Overall) | 11,427 (53.9%) | 9,790 (46.1%) |
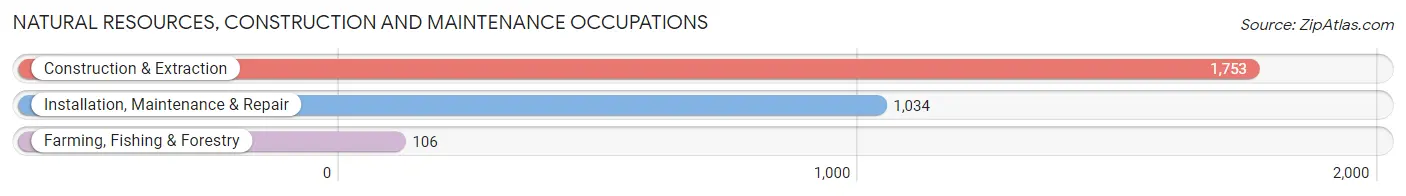
Natural Resources, Construction and Maintenance Occupations
The most common Natural Resources, Construction and Maintenance occupations in Wayne County are Construction & Extraction (1,753 | 8.3%), Installation, Maintenance & Repair (1,034 | 4.9%), and Farming, Fishing & Forestry (106 | 0.5%).
Natural Resources, Construction and Maintenance Occupations by Sex
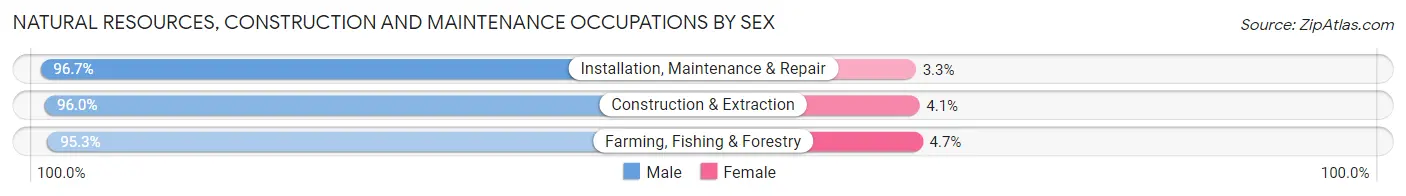
| Occupation | Male | Female |
| Farming, Fishing & Forestry | 101 (95.3%) | 5 (4.7%) |
| Construction & Extraction | 1,682 (96.0%) | 71 (4.1%) |
| Installation, Maintenance & Repair | 1,000 (96.7%) | 34 (3.3%) |
| Total (Category) | 2,783 (96.2%) | 110 (3.8%) |
| Total (Overall) | 11,427 (53.9%) | 9,790 (46.1%) |
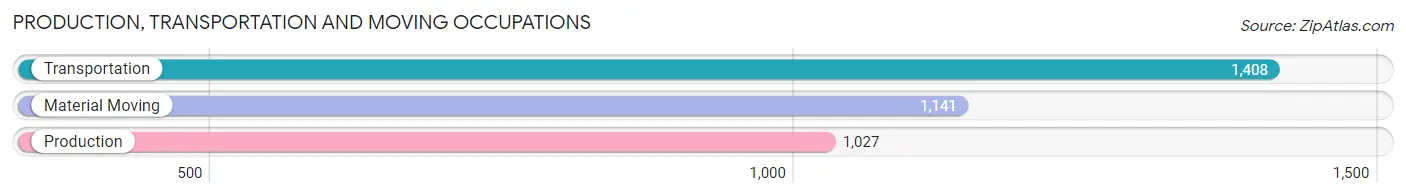
Production, Transportation and Moving Occupations
The most common Production, Transportation and Moving occupations in Wayne County are Transportation (1,408 | 6.6%), Material Moving (1,141 | 5.4%), and Production (1,027 | 4.8%).
Production, Transportation and Moving Occupations by Sex
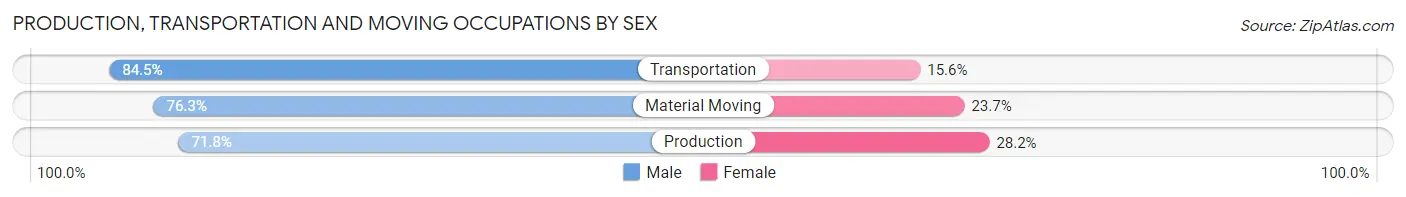
| Occupation | Male | Female |
| Production | 737 (71.8%) | 290 (28.2%) |
| Transportation | 1,189 (84.5%) | 219 (15.5%) |
| Material Moving | 871 (76.3%) | 270 (23.7%) |
| Total (Category) | 2,797 (78.2%) | 779 (21.8%) |
| Total (Overall) | 11,427 (53.9%) | 9,790 (46.1%) |
Employment Industries by Sex in Wayne County
Employment Industries in Wayne County
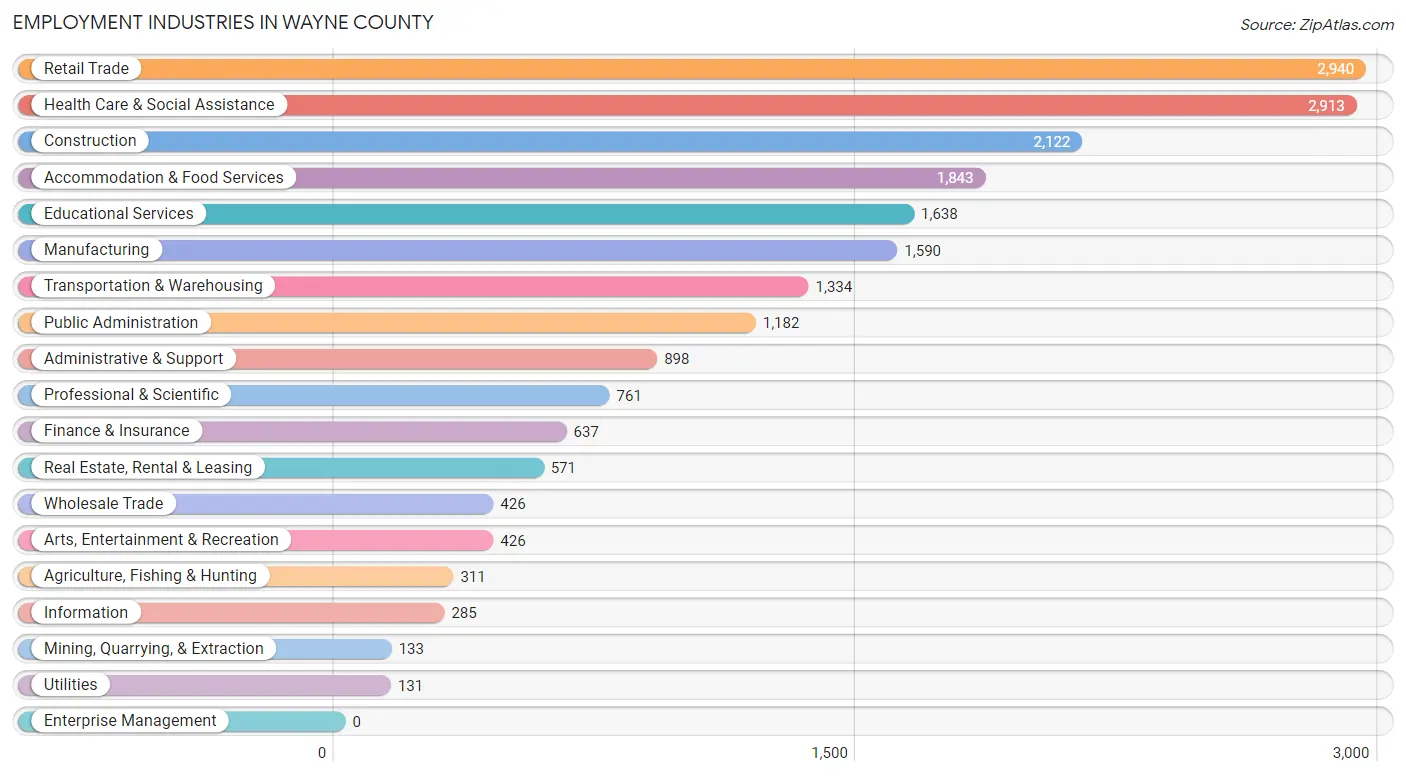
The major employment industries in Wayne County include Retail Trade (2,940 | 13.9%), Health Care & Social Assistance (2,913 | 13.7%), Construction (2,122 | 10.0%), Accommodation & Food Services (1,843 | 8.7%), and Educational Services (1,638 | 7.7%).
Employment Industries by Sex in Wayne County
The Wayne County industries that see more men than women are Mining, Quarrying, & Extraction (97.0%), Construction (90.0%), and Utilities (87.8%), whereas the industries that tend to have a higher number of women are Health Care & Social Assistance (83.3%), Educational Services (74.6%), and Finance & Insurance (74.3%).
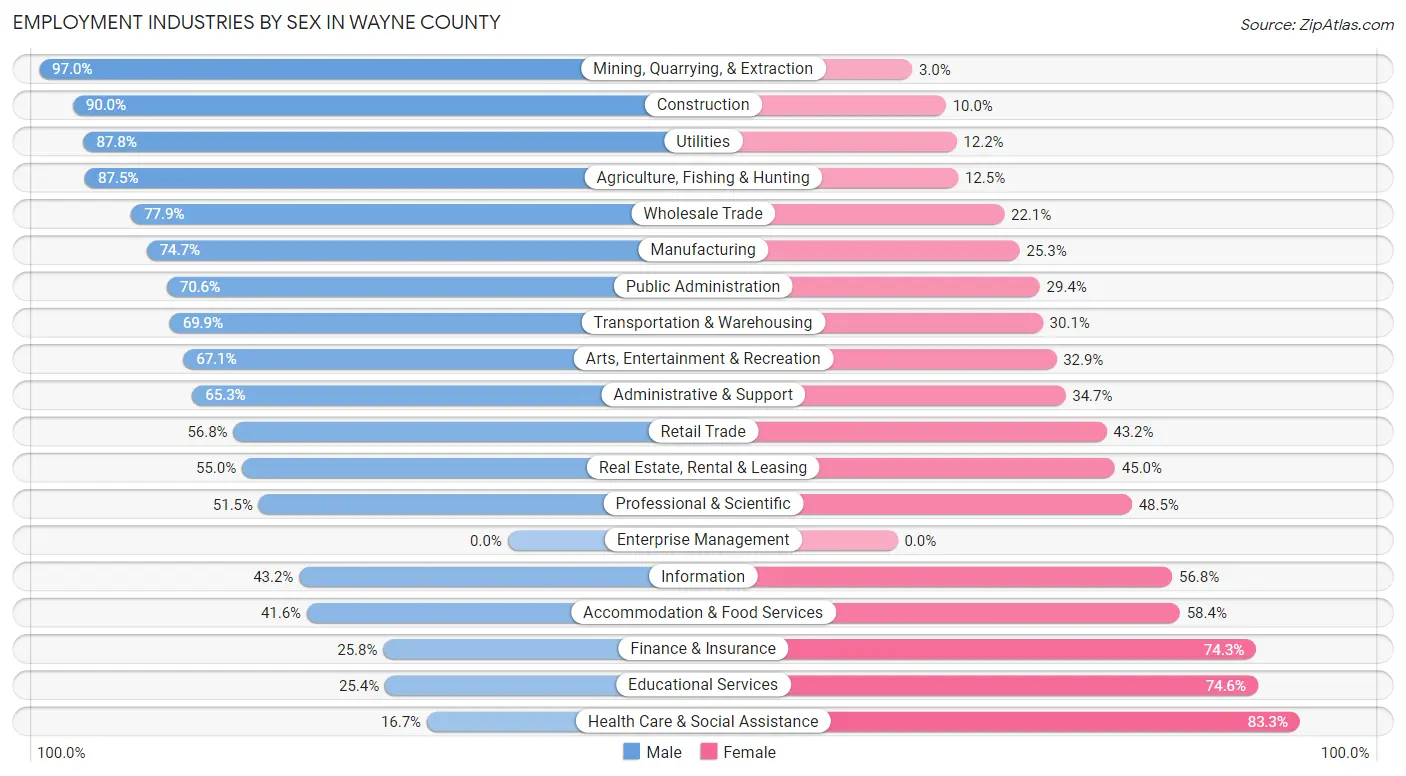
| Industry | Male | Female |
| Agriculture, Fishing & Hunting | 272 (87.5%) | 39 (12.5%) |
| Mining, Quarrying, & Extraction | 129 (97.0%) | 4 (3.0%) |
| Construction | 1,910 (90.0%) | 212 (10.0%) |
| Manufacturing | 1,188 (74.7%) | 402 (25.3%) |
| Wholesale Trade | 332 (77.9%) | 94 (22.1%) |
| Retail Trade | 1,669 (56.8%) | 1,271 (43.2%) |
| Transportation & Warehousing | 933 (69.9%) | 401 (30.1%) |
| Utilities | 115 (87.8%) | 16 (12.2%) |
| Information | 123 (43.2%) | 162 (56.8%) |
| Finance & Insurance | 164 (25.8%) | 473 (74.3%) |
| Real Estate, Rental & Leasing | 314 (55.0%) | 257 (45.0%) |
| Professional & Scientific | 392 (51.5%) | 369 (48.5%) |
| Enterprise Management | 0 (0.0%) | 0 (0.0%) |
| Administrative & Support | 586 (65.3%) | 312 (34.7%) |
| Educational Services | 416 (25.4%) | 1,222 (74.6%) |
| Health Care & Social Assistance | 487 (16.7%) | 2,426 (83.3%) |
| Arts, Entertainment & Recreation | 286 (67.1%) | 140 (32.9%) |
| Accommodation & Food Services | 766 (41.6%) | 1,077 (58.4%) |
| Public Administration | 834 (70.6%) | 348 (29.4%) |
| Total | 11,427 (53.9%) | 9,790 (46.1%) |
Education in Wayne County
School Enrollment in Wayne County
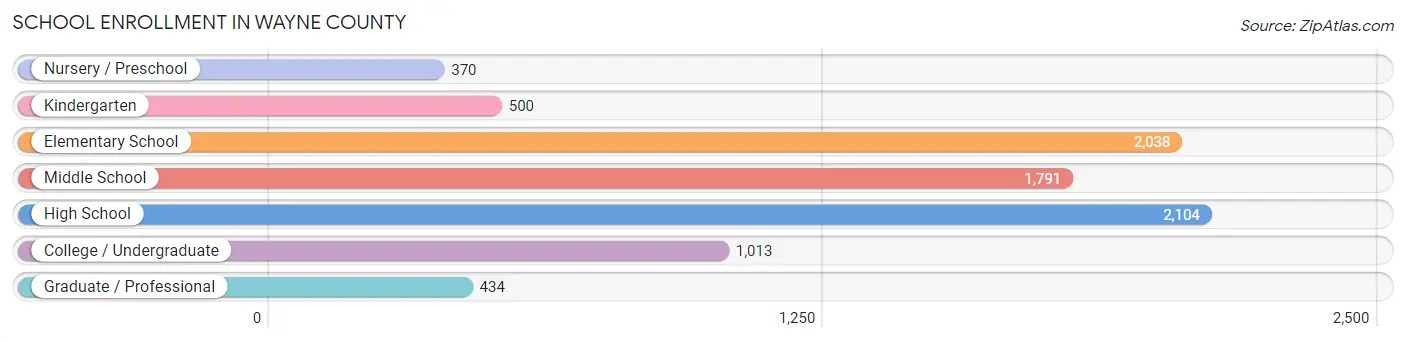
The most common levels of schooling among the 8,250 students in Wayne County are high school (2,104 | 25.5%), elementary school (2,038 | 24.7%), and middle school (1,791 | 21.7%).
| School Level | # Students | % Students |
| Nursery / Preschool | 370 | 4.5% |
| Kindergarten | 500 | 6.1% |
| Elementary School | 2,038 | 24.7% |
| Middle School | 1,791 | 21.7% |
| High School | 2,104 | 25.5% |
| College / Undergraduate | 1,013 | 12.3% |
| Graduate / Professional | 434 | 5.3% |
| Total | 8,250 | 100.0% |
School Enrollment by Age by Funding Source in Wayne County
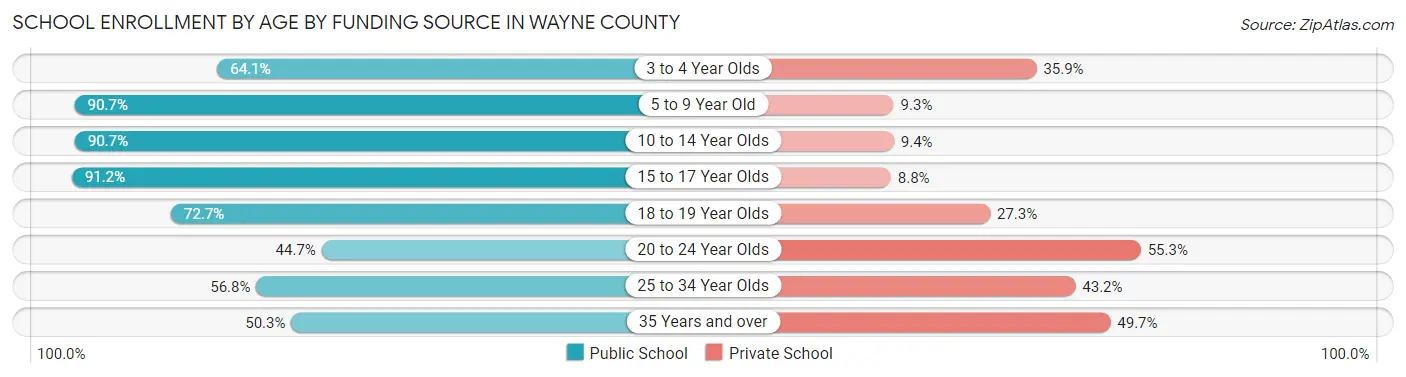
Out of a total of 8,250 students who are enrolled in schools in Wayne County, 1,477 (17.9%) attend a private institution, while the remaining 6,773 (82.1%) are enrolled in public schools. The age group of 20 to 24 year olds has the highest likelihood of being enrolled in private schools, with 301 (55.3% in the age bracket) enrolled. Conversely, the age group of 15 to 17 year olds has the lowest likelihood of being enrolled in a private school, with 1,401 (91.2% in the age bracket) attending a public institution.
| Age Bracket | Public School | Private School |
| 3 to 4 Year Olds | 207 (64.1%) | 116 (35.9%) |
| 5 to 9 Year Old | 2,163 (90.7%) | 222 (9.3%) |
| 10 to 14 Year Olds | 1,959 (90.6%) | 202 (9.3%) |
| 15 to 17 Year Olds | 1,401 (91.2%) | 135 (8.8%) |
| 18 to 19 Year Olds | 411 (72.7%) | 154 (27.3%) |
| 20 to 24 Year Olds | 243 (44.7%) | 301 (55.3%) |
| 25 to 34 Year Olds | 162 (56.8%) | 123 (43.2%) |
| 35 Years and over | 227 (50.3%) | 224 (49.7%) |
| Total | 6,773 (82.1%) | 1,477 (17.9%) |
Educational Attainment by Field of Study in Wayne County
Business (1,631 | 18.6%), education (1,556 | 17.7%), science & technology (1,314 | 15.0%), bio, nature & agricultural (526 | 6.0%), and liberal arts & history (475 | 5.4%) are the most common fields of study among 8,771 individuals in Wayne County who have obtained a bachelor's degree or higher.
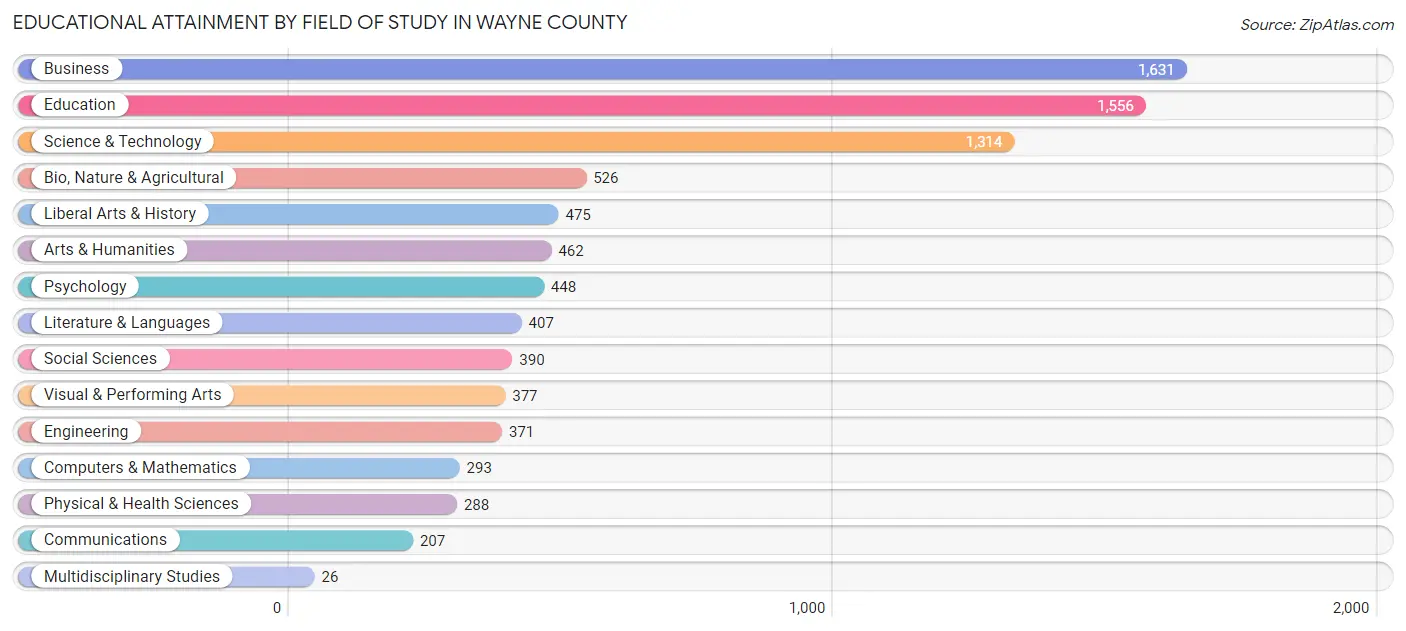
| Field of Study | # Graduates | % Graduates |
| Computers & Mathematics | 293 | 3.3% |
| Bio, Nature & Agricultural | 526 | 6.0% |
| Physical & Health Sciences | 288 | 3.3% |
| Psychology | 448 | 5.1% |
| Social Sciences | 390 | 4.4% |
| Engineering | 371 | 4.2% |
| Multidisciplinary Studies | 26 | 0.3% |
| Science & Technology | 1,314 | 15.0% |
| Business | 1,631 | 18.6% |
| Education | 1,556 | 17.7% |
| Literature & Languages | 407 | 4.6% |
| Liberal Arts & History | 475 | 5.4% |
| Visual & Performing Arts | 377 | 4.3% |
| Communications | 207 | 2.4% |
| Arts & Humanities | 462 | 5.3% |
| Total | 8,771 | 100.0% |
Transportation & Commute in Wayne County
Vehicle Availability by Sex in Wayne County
The most prevalent vehicle ownership categories in Wayne County are males with 2 vehicles (4,604, accounting for 41.4%) and females with 2 vehicles (3,944, making up 48.0%).
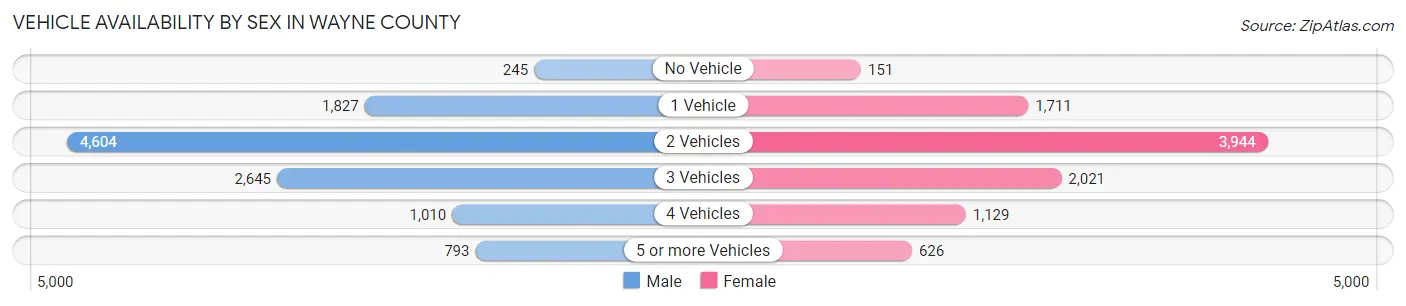
| Vehicles Available | Male | Female |
| No Vehicle | 245 (2.2%) | 151 (1.6%) |
| 1 Vehicle | 1,827 (16.4%) | 1,711 (17.9%) |
| 2 Vehicles | 4,604 (41.4%) | 3,944 (41.2%) |
| 3 Vehicles | 2,645 (23.8%) | 2,021 (21.1%) |
| 4 Vehicles | 1,010 (9.1%) | 1,129 (11.8%) |
| 5 or more Vehicles | 793 (7.1%) | 626 (6.5%) |
| Total | 11,124 (100.0%) | 9,582 (100.0%) |
Commute Time in Wayne County
The most frequently occuring commute durations in Wayne County are 10 to 14 minutes (2,674 commuters, 14.0%), 15 to 19 minutes (2,633 commuters, 13.8%), and 20 to 24 minutes (2,370 commuters, 12.4%).
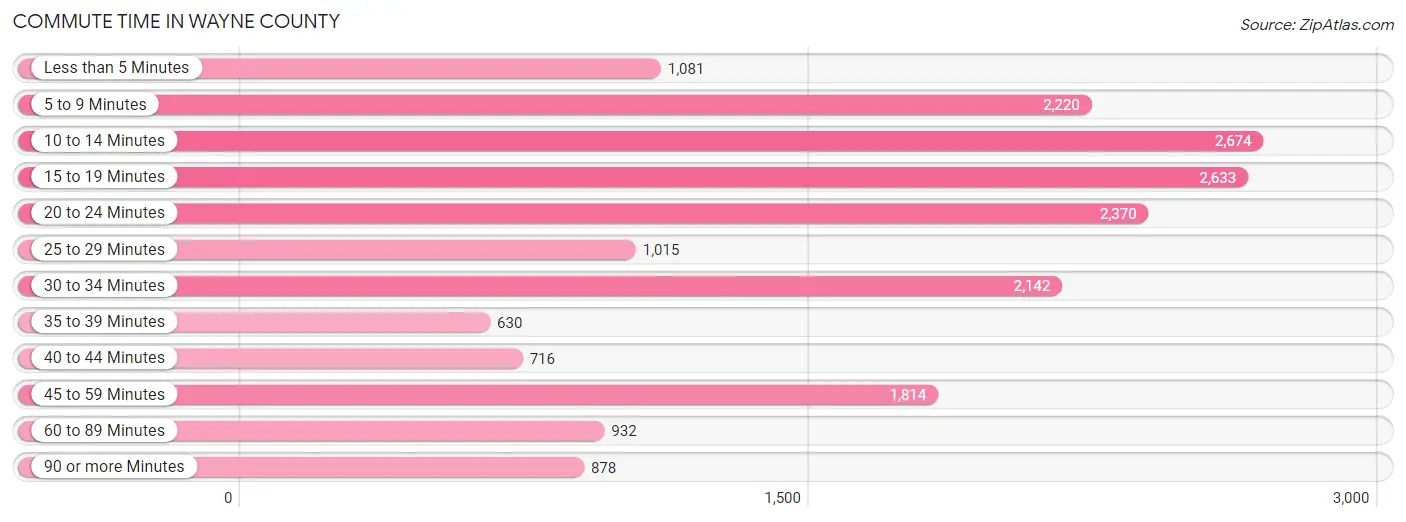
| Commute Time | # Commuters | % Commuters |
| Less than 5 Minutes | 1,081 | 5.7% |
| 5 to 9 Minutes | 2,220 | 11.6% |
| 10 to 14 Minutes | 2,674 | 14.0% |
| 15 to 19 Minutes | 2,633 | 13.8% |
| 20 to 24 Minutes | 2,370 | 12.4% |
| 25 to 29 Minutes | 1,015 | 5.3% |
| 30 to 34 Minutes | 2,142 | 11.2% |
| 35 to 39 Minutes | 630 | 3.3% |
| 40 to 44 Minutes | 716 | 3.7% |
| 45 to 59 Minutes | 1,814 | 9.5% |
| 60 to 89 Minutes | 932 | 4.9% |
| 90 or more Minutes | 878 | 4.6% |
Commute Time by Sex in Wayne County
The most common commute times in Wayne County are 10 to 14 minutes (1,399 commuters, 13.6%) for males and 15 to 19 minutes (1,364 commuters, 15.5%) for females.
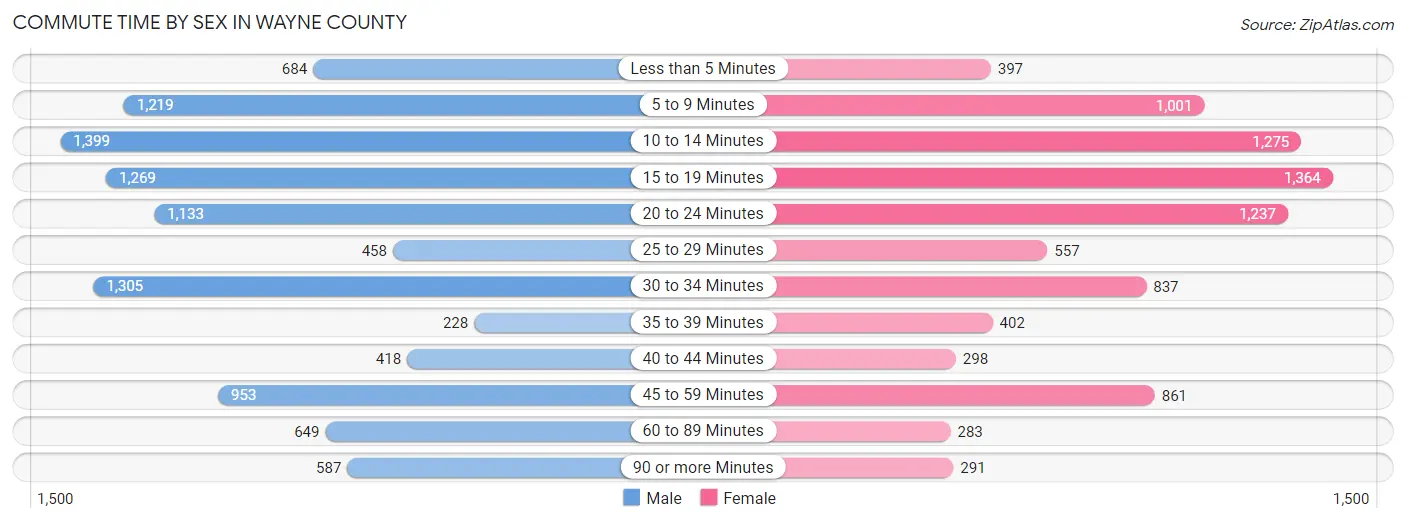
| Commute Time | Male | Female |
| Less than 5 Minutes | 684 (6.6%) | 397 (4.5%) |
| 5 to 9 Minutes | 1,219 (11.8%) | 1,001 (11.4%) |
| 10 to 14 Minutes | 1,399 (13.6%) | 1,275 (14.5%) |
| 15 to 19 Minutes | 1,269 (12.3%) | 1,364 (15.5%) |
| 20 to 24 Minutes | 1,133 (11.0%) | 1,237 (14.1%) |
| 25 to 29 Minutes | 458 (4.4%) | 557 (6.3%) |
| 30 to 34 Minutes | 1,305 (12.7%) | 837 (9.5%) |
| 35 to 39 Minutes | 228 (2.2%) | 402 (4.6%) |
| 40 to 44 Minutes | 418 (4.1%) | 298 (3.4%) |
| 45 to 59 Minutes | 953 (9.2%) | 861 (9.8%) |
| 60 to 89 Minutes | 649 (6.3%) | 283 (3.2%) |
| 90 or more Minutes | 587 (5.7%) | 291 (3.3%) |
Time of Departure to Work by Sex in Wayne County
The most frequent times of departure to work in Wayne County are 7:00 AM to 7:29 AM (1,714, 16.6%) for males and 7:00 AM to 7:29 AM (1,546, 17.6%) for females.
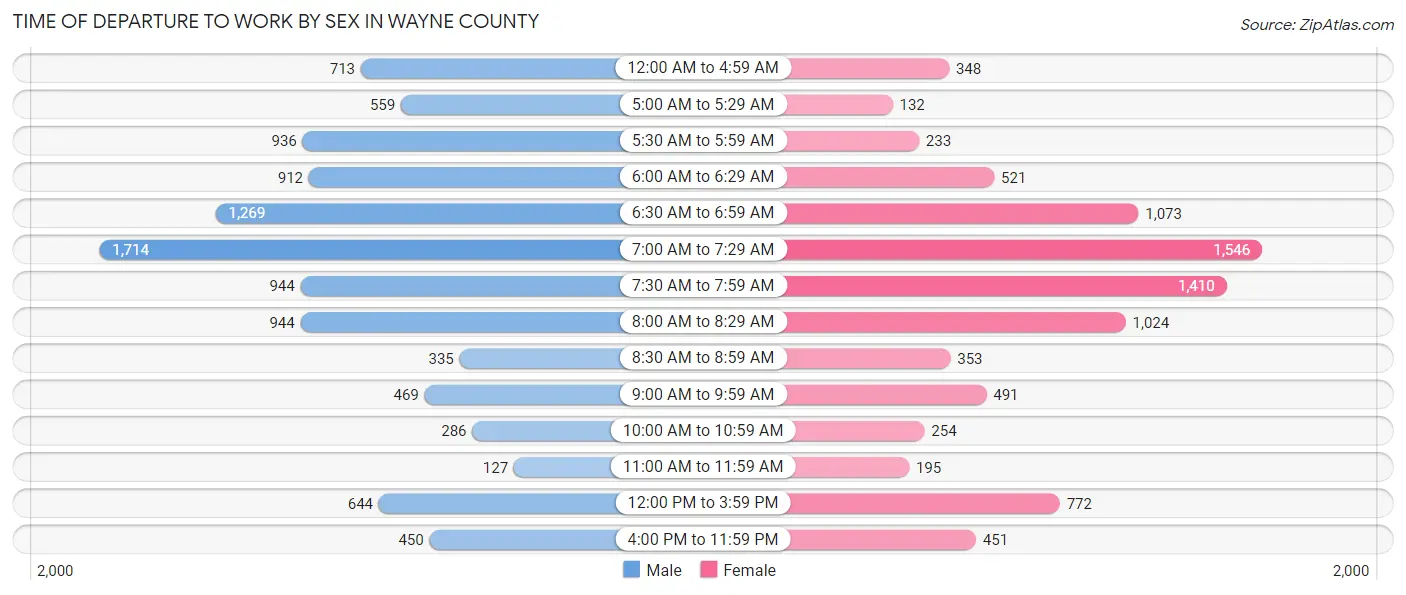
| Time of Departure | Male | Female |
| 12:00 AM to 4:59 AM | 713 (6.9%) | 348 (4.0%) |
| 5:00 AM to 5:29 AM | 559 (5.4%) | 132 (1.5%) |
| 5:30 AM to 5:59 AM | 936 (9.1%) | 233 (2.6%) |
| 6:00 AM to 6:29 AM | 912 (8.8%) | 521 (5.9%) |
| 6:30 AM to 6:59 AM | 1,269 (12.3%) | 1,073 (12.2%) |
| 7:00 AM to 7:29 AM | 1,714 (16.6%) | 1,546 (17.6%) |
| 7:30 AM to 7:59 AM | 944 (9.2%) | 1,410 (16.0%) |
| 8:00 AM to 8:29 AM | 944 (9.2%) | 1,024 (11.6%) |
| 8:30 AM to 8:59 AM | 335 (3.3%) | 353 (4.0%) |
| 9:00 AM to 9:59 AM | 469 (4.5%) | 491 (5.6%) |
| 10:00 AM to 10:59 AM | 286 (2.8%) | 254 (2.9%) |
| 11:00 AM to 11:59 AM | 127 (1.2%) | 195 (2.2%) |
| 12:00 PM to 3:59 PM | 644 (6.2%) | 772 (8.8%) |
| 4:00 PM to 11:59 PM | 450 (4.4%) | 451 (5.1%) |
| Total | 10,302 (100.0%) | 8,803 (100.0%) |
Housing Occupancy in Wayne County
Occupancy by Ownership in Wayne County
Of the total 19,747 dwellings in Wayne County, owner-occupied units account for 16,182 (82.0%), while renter-occupied units make up 3,565 (18.0%).
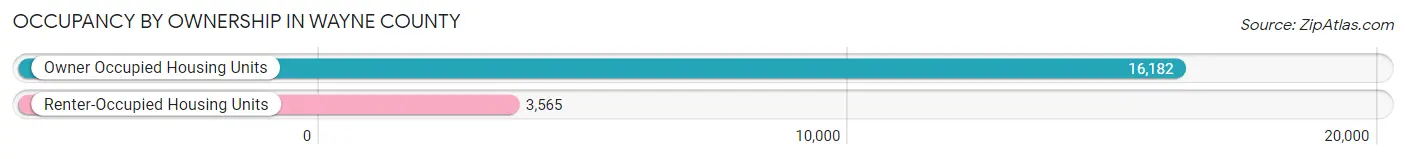
| Occupancy | # Housing Units | % Housing Units |
| Owner Occupied Housing Units | 16,182 | 82.0% |
| Renter-Occupied Housing Units | 3,565 | 18.0% |
| Total Occupied Housing Units | 19,747 | 100.0% |
Occupancy by Household Size in Wayne County
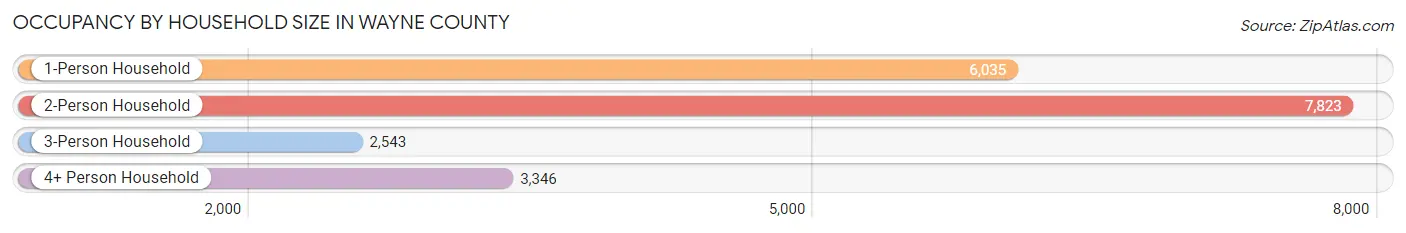
| Household Size | # Housing Units | % Housing Units |
| 1-Person Household | 6,035 | 30.6% |
| 2-Person Household | 7,823 | 39.6% |
| 3-Person Household | 2,543 | 12.9% |
| 4+ Person Household | 3,346 | 16.9% |
| Total Housing Units | 19,747 | 100.0% |
Occupancy by Ownership by Household Size in Wayne County
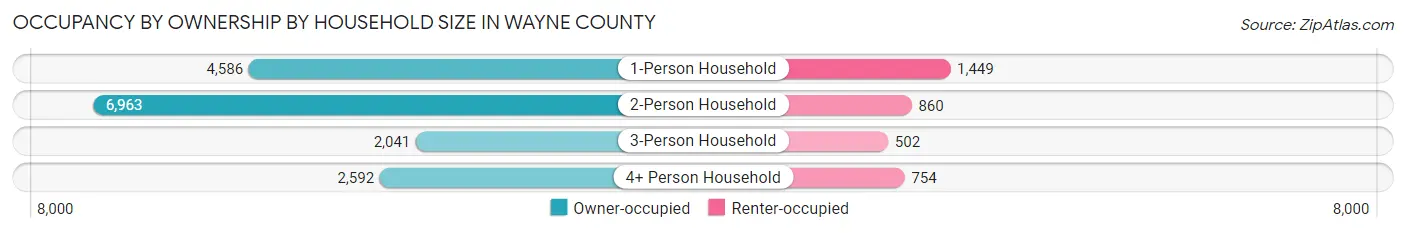
| Household Size | Owner-occupied | Renter-occupied |
| 1-Person Household | 4,586 (76.0%) | 1,449 (24.0%) |
| 2-Person Household | 6,963 (89.0%) | 860 (11.0%) |
| 3-Person Household | 2,041 (80.3%) | 502 (19.7%) |
| 4+ Person Household | 2,592 (77.5%) | 754 (22.5%) |
| Total Housing Units | 16,182 (82.0%) | 3,565 (18.0%) |
Occupancy by Educational Attainment in Wayne County
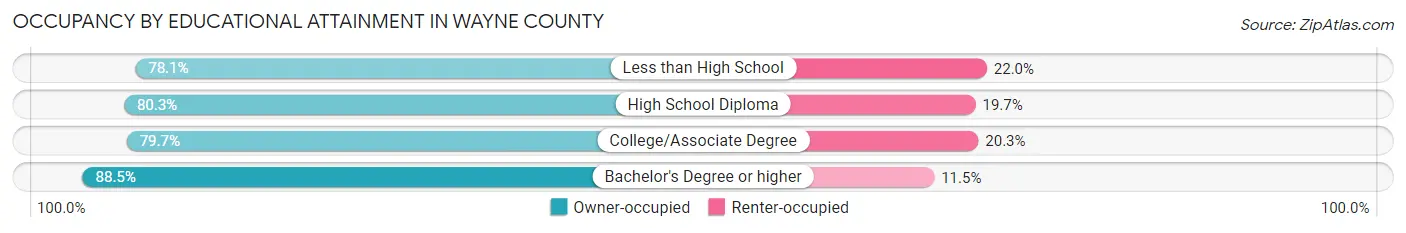
| Household Size | Owner-occupied | Renter-occupied |
| Less than High School | 1,131 (78.0%) | 318 (22.0%) |
| High School Diploma | 6,389 (80.3%) | 1,567 (19.7%) |
| College/Associate Degree | 4,464 (79.7%) | 1,134 (20.3%) |
| Bachelor's Degree or higher | 4,198 (88.5%) | 546 (11.5%) |
Occupancy by Age of Householder in Wayne County
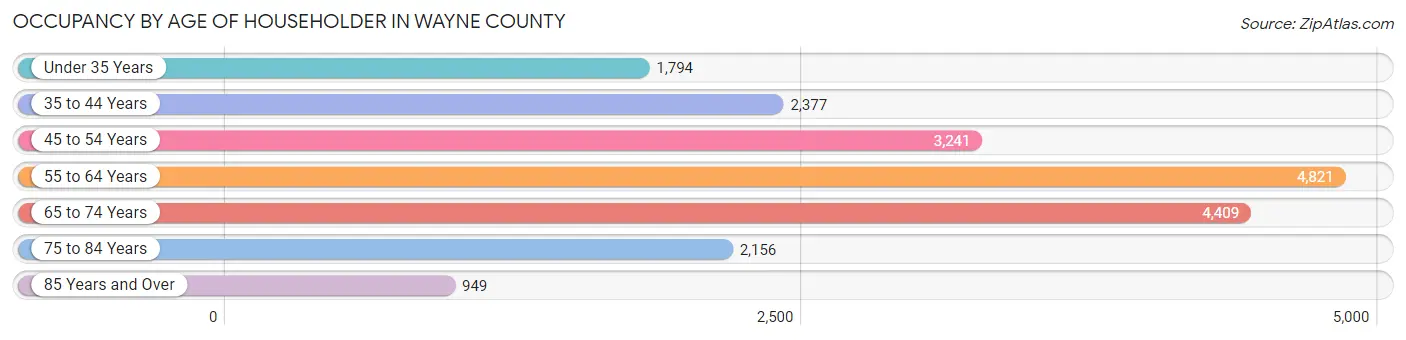
| Age Bracket | # Households | % Households |
| Under 35 Years | 1,794 | 9.1% |
| 35 to 44 Years | 2,377 | 12.0% |
| 45 to 54 Years | 3,241 | 16.4% |
| 55 to 64 Years | 4,821 | 24.4% |
| 65 to 74 Years | 4,409 | 22.3% |
| 75 to 84 Years | 2,156 | 10.9% |
| 85 Years and Over | 949 | 4.8% |
| Total | 19,747 | 100.0% |
Housing Finances in Wayne County
Median Income by Occupancy in Wayne County
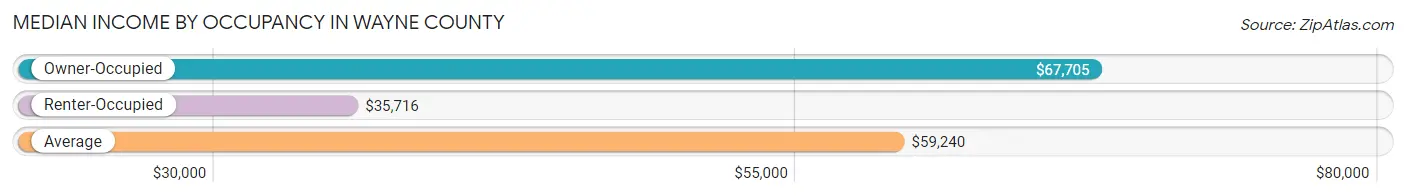
| Occupancy Type | # Households | Median Income |
| Owner-Occupied | 16,182 (82.0%) | $67,705 |
| Renter-Occupied | 3,565 (18.0%) | $35,716 |
| Average | 19,747 (100.0%) | $59,240 |
Occupancy by Householder Income Bracket in Wayne County
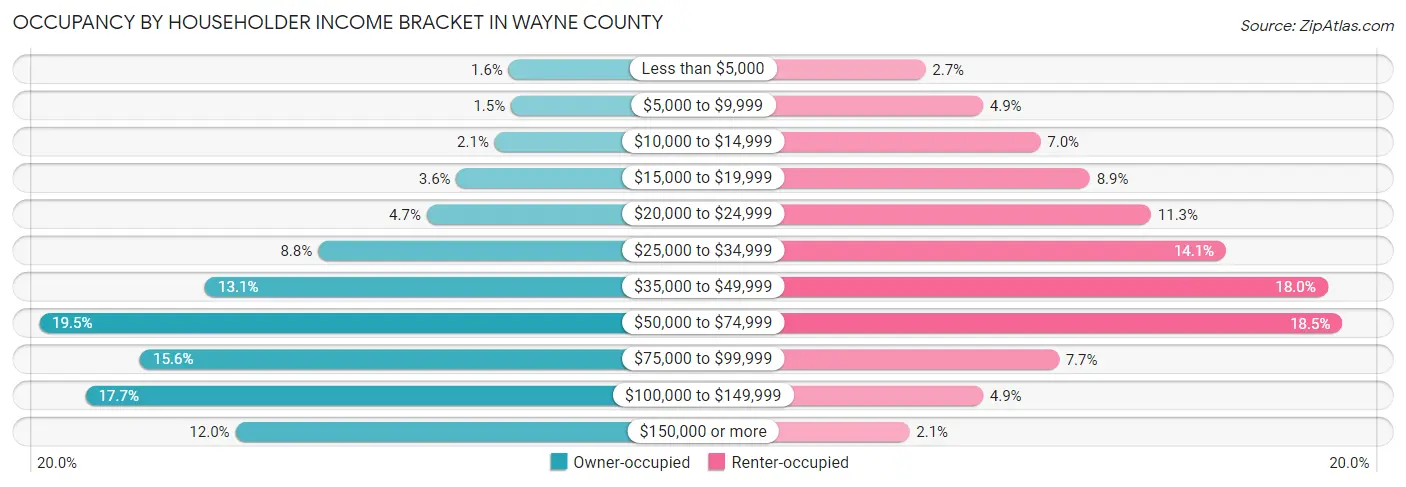
| Income Bracket | Owner-occupied | Renter-occupied |
| Less than $5,000 | 252 (1.6%) | 95 (2.7%) |
| $5,000 to $9,999 | 238 (1.5%) | 173 (4.9%) |
| $10,000 to $14,999 | 339 (2.1%) | 251 (7.0%) |
| $15,000 to $19,999 | 575 (3.5%) | 318 (8.9%) |
| $20,000 to $24,999 | 758 (4.7%) | 401 (11.3%) |
| $25,000 to $34,999 | 1,428 (8.8%) | 503 (14.1%) |
| $35,000 to $49,999 | 2,123 (13.1%) | 641 (18.0%) |
| $50,000 to $74,999 | 3,147 (19.5%) | 661 (18.5%) |
| $75,000 to $99,999 | 2,524 (15.6%) | 276 (7.7%) |
| $100,000 to $149,999 | 2,861 (17.7%) | 173 (4.9%) |
| $150,000 or more | 1,937 (12.0%) | 73 (2.1%) |
| Total | 16,182 (100.0%) | 3,565 (100.0%) |
Monthly Housing Cost Tiers in Wayne County
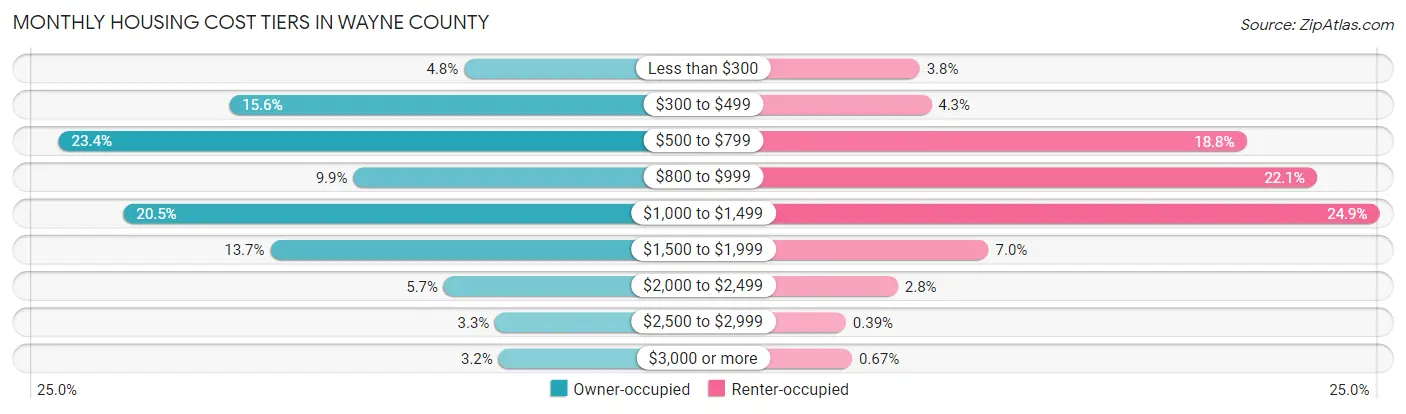
| Monthly Cost | Owner-occupied | Renter-occupied |
| Less than $300 | 772 (4.8%) | 135 (3.8%) |
| $300 to $499 | 2,521 (15.6%) | 154 (4.3%) |
| $500 to $799 | 3,792 (23.4%) | 671 (18.8%) |
| $800 to $999 | 1,597 (9.9%) | 786 (22.1%) |
| $1,000 to $1,499 | 3,309 (20.4%) | 889 (24.9%) |
| $1,500 to $1,999 | 2,215 (13.7%) | 248 (7.0%) |
| $2,000 to $2,499 | 922 (5.7%) | 99 (2.8%) |
| $2,500 to $2,999 | 540 (3.3%) | 14 (0.4%) |
| $3,000 or more | 514 (3.2%) | 24 (0.7%) |
| Total | 16,182 (100.0%) | 3,565 (100.0%) |
Physical Housing Characteristics in Wayne County
Housing Structures in Wayne County
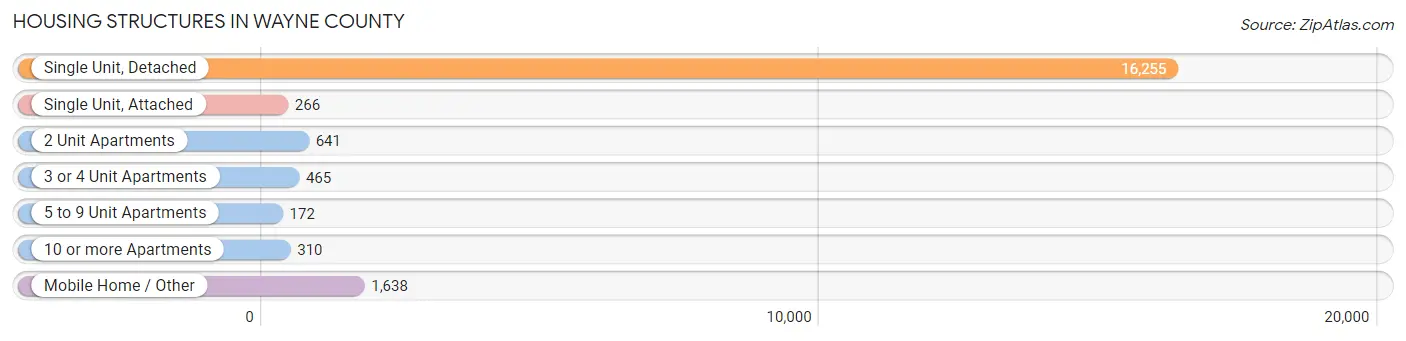
| Structure Type | # Housing Units | % Housing Units |
| Single Unit, Detached | 16,255 | 82.3% |
| Single Unit, Attached | 266 | 1.3% |
| 2 Unit Apartments | 641 | 3.3% |
| 3 or 4 Unit Apartments | 465 | 2.4% |
| 5 to 9 Unit Apartments | 172 | 0.9% |
| 10 or more Apartments | 310 | 1.6% |
| Mobile Home / Other | 1,638 | 8.3% |
| Total | 19,747 | 100.0% |
Housing Structures by Occupancy in Wayne County
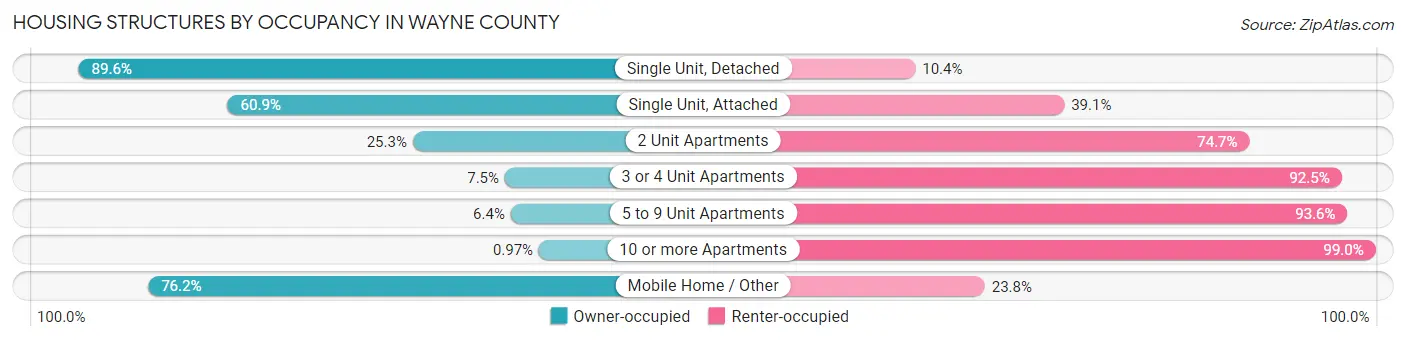
| Structure Type | Owner-occupied | Renter-occupied |
| Single Unit, Detached | 14,561 (89.6%) | 1,694 (10.4%) |
| Single Unit, Attached | 162 (60.9%) | 104 (39.1%) |
| 2 Unit Apartments | 162 (25.3%) | 479 (74.7%) |
| 3 or 4 Unit Apartments | 35 (7.5%) | 430 (92.5%) |
| 5 to 9 Unit Apartments | 11 (6.4%) | 161 (93.6%) |
| 10 or more Apartments | 3 (1.0%) | 307 (99.0%) |
| Mobile Home / Other | 1,248 (76.2%) | 390 (23.8%) |
| Total | 16,182 (82.0%) | 3,565 (18.0%) |
Housing Structures by Number of Rooms in Wayne County
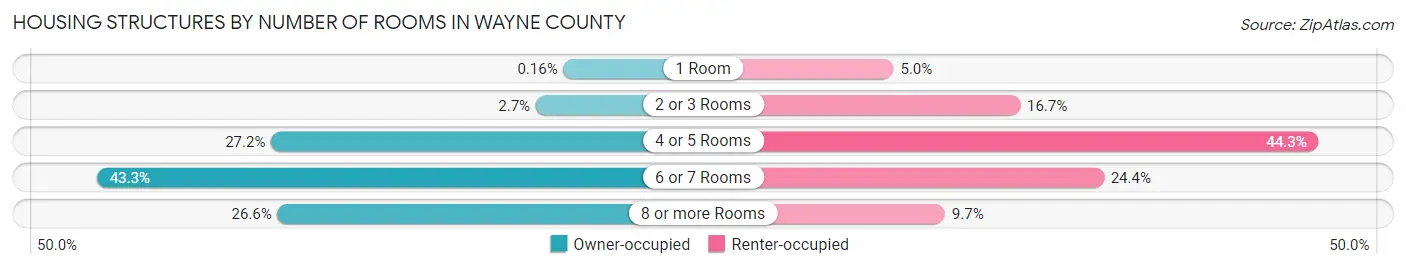
| Number of Rooms | Owner-occupied | Renter-occupied |
| 1 Room | 26 (0.2%) | 177 (5.0%) |
| 2 or 3 Rooms | 439 (2.7%) | 594 (16.7%) |
| 4 or 5 Rooms | 4,400 (27.2%) | 1,578 (44.3%) |
| 6 or 7 Rooms | 7,012 (43.3%) | 870 (24.4%) |
| 8 or more Rooms | 4,305 (26.6%) | 346 (9.7%) |
| Total | 16,182 (100.0%) | 3,565 (100.0%) |
Housing Structure by Heating Type in Wayne County
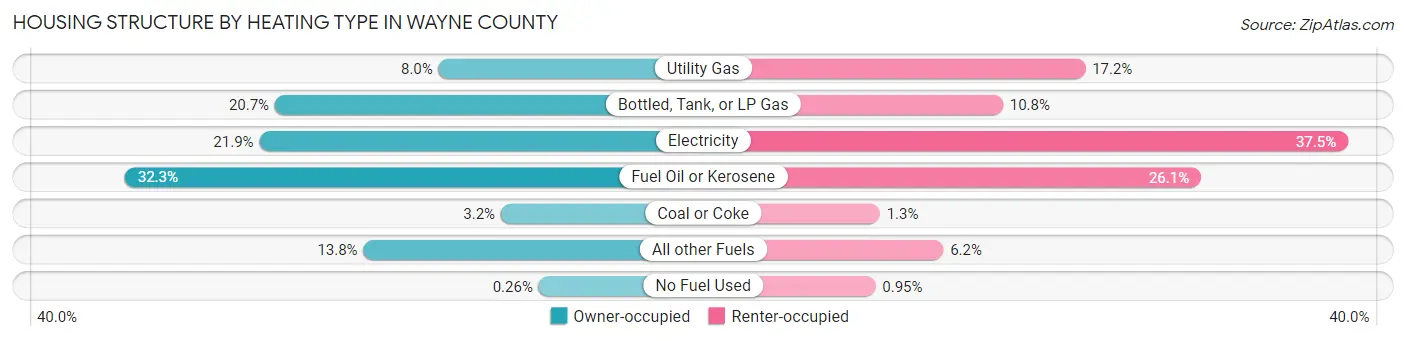
| Heating Type | Owner-occupied | Renter-occupied |
| Utility Gas | 1,295 (8.0%) | 612 (17.2%) |
| Bottled, Tank, or LP Gas | 3,342 (20.6%) | 385 (10.8%) |
| Electricity | 3,535 (21.8%) | 1,336 (37.5%) |
| Fuel Oil or Kerosene | 5,218 (32.3%) | 931 (26.1%) |
| Coal or Coke | 515 (3.2%) | 46 (1.3%) |
| All other Fuels | 2,235 (13.8%) | 221 (6.2%) |
| No Fuel Used | 42 (0.3%) | 34 (0.9%) |
| Total | 16,182 (100.0%) | 3,565 (100.0%) |
Household Vehicle Usage in Wayne County
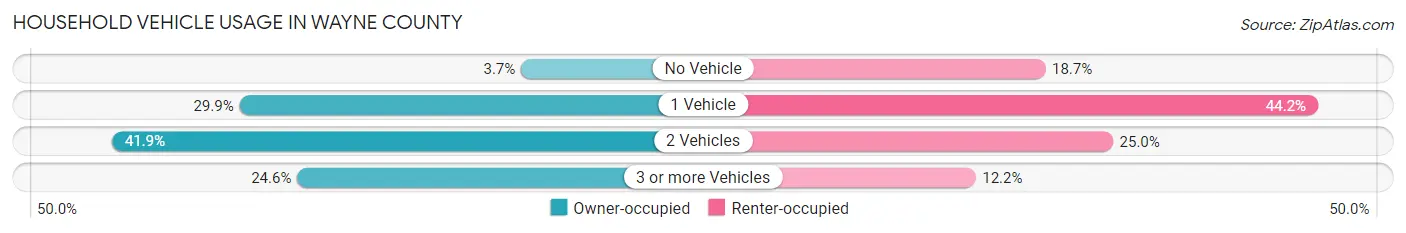
| Vehicles per Household | Owner-occupied | Renter-occupied |
| No Vehicle | 591 (3.6%) | 666 (18.7%) |
| 1 Vehicle | 4,845 (29.9%) | 1,574 (44.2%) |
| 2 Vehicles | 6,774 (41.9%) | 891 (25.0%) |
| 3 or more Vehicles | 3,972 (24.5%) | 434 (12.2%) |
| Total | 16,182 (100.0%) | 3,565 (100.0%) |
Real Estate & Mortgages in Wayne County
Real Estate and Mortgage Overview in Wayne County
| Characteristic | Without Mortgage | With Mortgage |
| Housing Units | 8,538 | 7,644 |
| Median Property Value | $202,400 | $220,300 |
| Median Household Income | $53,957 | $1,281 |
| Monthly Housing Costs | $585 | $476 |
| Real Estate Taxes | $2,612 | $130 |
Property Value by Mortgage Status in Wayne County
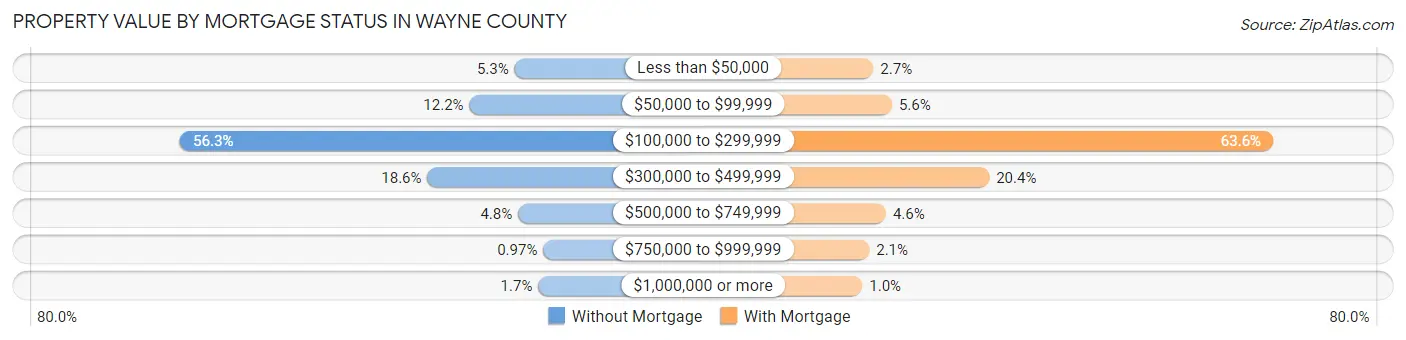
| Property Value | Without Mortgage | With Mortgage |
| Less than $50,000 | 456 (5.3%) | 208 (2.7%) |
| $50,000 to $99,999 | 1,043 (12.2%) | 424 (5.6%) |
| $100,000 to $299,999 | 4,806 (56.3%) | 4,861 (63.6%) |
| $300,000 to $499,999 | 1,591 (18.6%) | 1,557 (20.4%) |
| $500,000 to $749,999 | 411 (4.8%) | 355 (4.6%) |
| $750,000 to $999,999 | 83 (1.0%) | 160 (2.1%) |
| $1,000,000 or more | 148 (1.7%) | 79 (1.0%) |
| Total | 8,538 (100.0%) | 7,644 (100.0%) |
Household Income by Mortgage Status in Wayne County
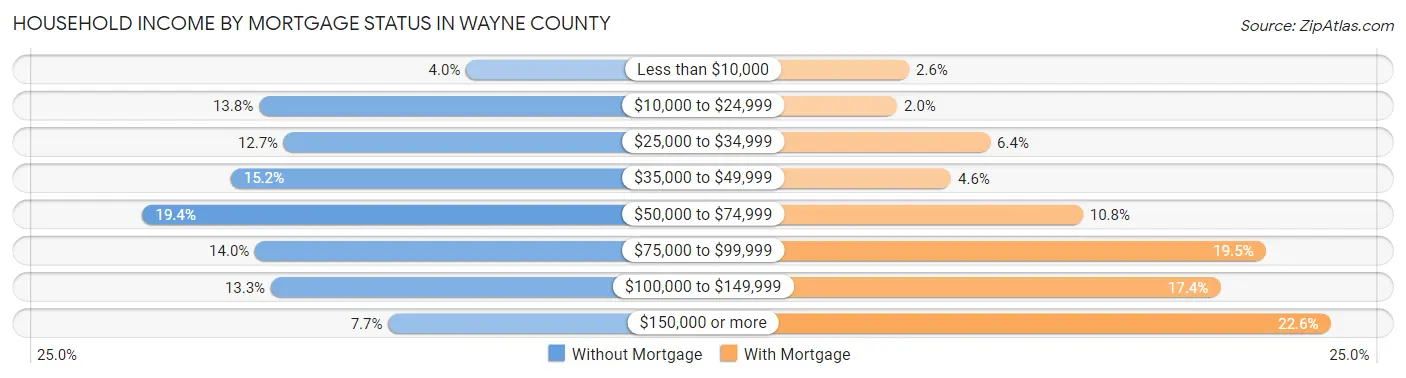
| Household Income | Without Mortgage | With Mortgage |
| Less than $10,000 | 339 (4.0%) | 195 (2.5%) |
| $10,000 to $24,999 | 1,182 (13.8%) | 151 (2.0%) |
| $25,000 to $34,999 | 1,080 (12.7%) | 490 (6.4%) |
| $35,000 to $49,999 | 1,296 (15.2%) | 348 (4.5%) |
| $50,000 to $74,999 | 1,655 (19.4%) | 827 (10.8%) |
| $75,000 to $99,999 | 1,197 (14.0%) | 1,492 (19.5%) |
| $100,000 to $149,999 | 1,133 (13.3%) | 1,327 (17.4%) |
| $150,000 or more | 656 (7.7%) | 1,728 (22.6%) |
| Total | 8,538 (100.0%) | 7,644 (100.0%) |
Property Value to Household Income Ratio in Wayne County
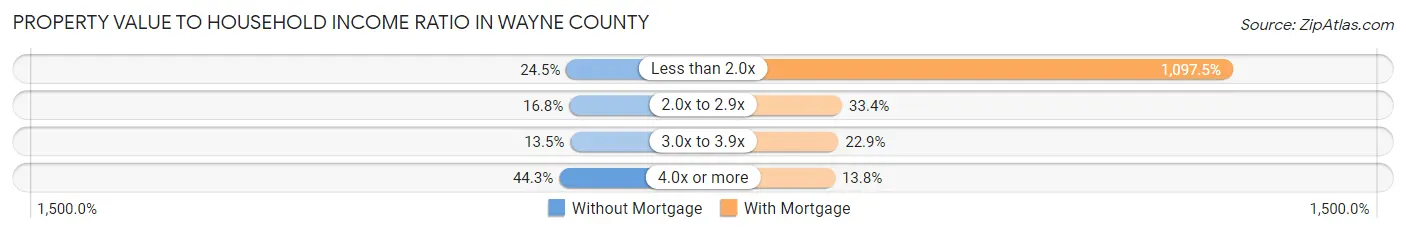
| Value-to-Income Ratio | Without Mortgage | With Mortgage |
| Less than 2.0x | 2,088 (24.5%) | 83,889 (1,097.5%) |
| 2.0x to 2.9x | 1,431 (16.8%) | 2,549 (33.4%) |
| 3.0x to 3.9x | 1,155 (13.5%) | 1,752 (22.9%) |
| 4.0x or more | 3,783 (44.3%) | 1,051 (13.8%) |
| Total | 8,538 (100.0%) | 7,644 (100.0%) |
Real Estate Taxes by Mortgage Status in Wayne County
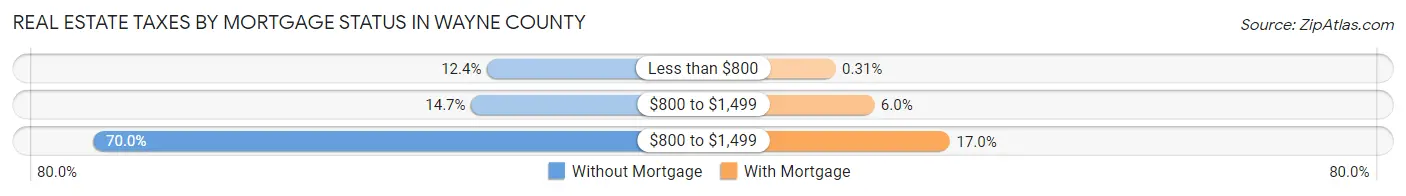
| Property Taxes | Without Mortgage | With Mortgage |
| Less than $800 | 1,059 (12.4%) | 24 (0.3%) |
| $800 to $1,499 | 1,257 (14.7%) | 456 (6.0%) |
| $800 to $1,499 | 5,976 (70.0%) | 1,301 (17.0%) |
| Total | 8,538 (100.0%) | 7,644 (100.0%) |
Health & Disability in Wayne County
Health Insurance Coverage by Age in Wayne County
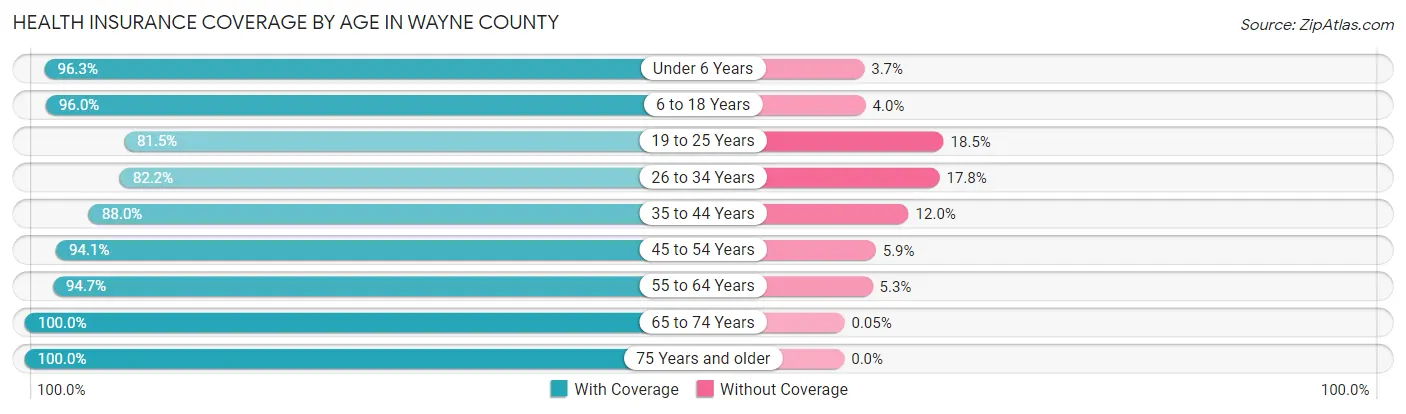
| Age Bracket | With Coverage | Without Coverage |
| Under 6 Years | 2,298 (96.3%) | 89 (3.7%) |
| 6 to 18 Years | 6,313 (96.0%) | 262 (4.0%) |
| 19 to 25 Years | 2,730 (81.5%) | 621 (18.5%) |
| 26 to 34 Years | 3,568 (82.2%) | 771 (17.8%) |
| 35 to 44 Years | 4,413 (88.0%) | 602 (12.0%) |
| 45 to 54 Years | 5,816 (94.1%) | 363 (5.9%) |
| 55 to 64 Years | 7,725 (94.7%) | 431 (5.3%) |
| 65 to 74 Years | 7,468 (100.0%) | 4 (0.1%) |
| 75 Years and older | 4,746 (100.0%) | 0 (0.0%) |
| Total | 45,077 (93.5%) | 3,143 (6.5%) |
Health Insurance Coverage by Citizenship Status in Wayne County
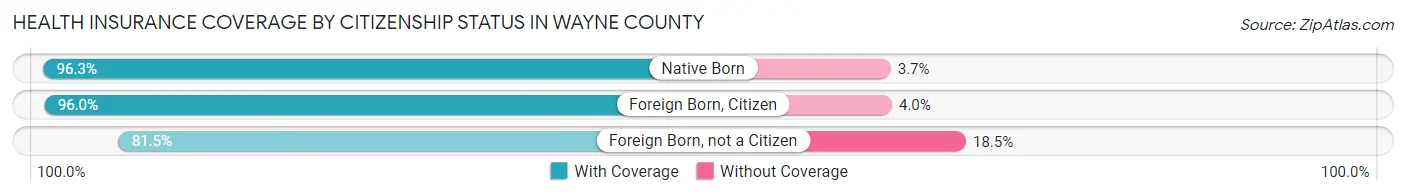
| Citizenship Status | With Coverage | Without Coverage |
| Native Born | 2,298 (96.3%) | 89 (3.7%) |
| Foreign Born, Citizen | 6,313 (96.0%) | 262 (4.0%) |
| Foreign Born, not a Citizen | 2,730 (81.5%) | 621 (18.5%) |
Health Insurance Coverage by Household Income in Wayne County
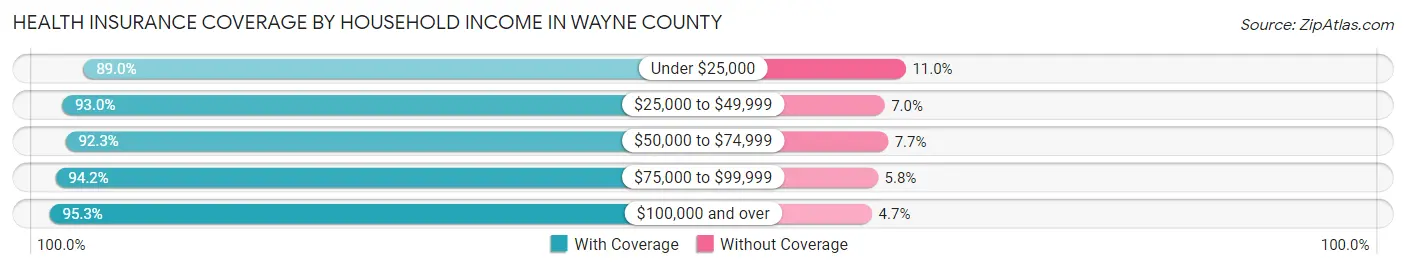
| Household Income | With Coverage | Without Coverage |
| Under $25,000 | 4,561 (89.0%) | 563 (11.0%) |
| $25,000 to $49,999 | 8,712 (93.0%) | 657 (7.0%) |
| $50,000 to $74,999 | 8,557 (92.3%) | 710 (7.7%) |
| $75,000 to $99,999 | 6,936 (94.2%) | 425 (5.8%) |
| $100,000 and over | 16,033 (95.3%) | 783 (4.7%) |
Public vs Private Health Insurance Coverage by Age in Wayne County
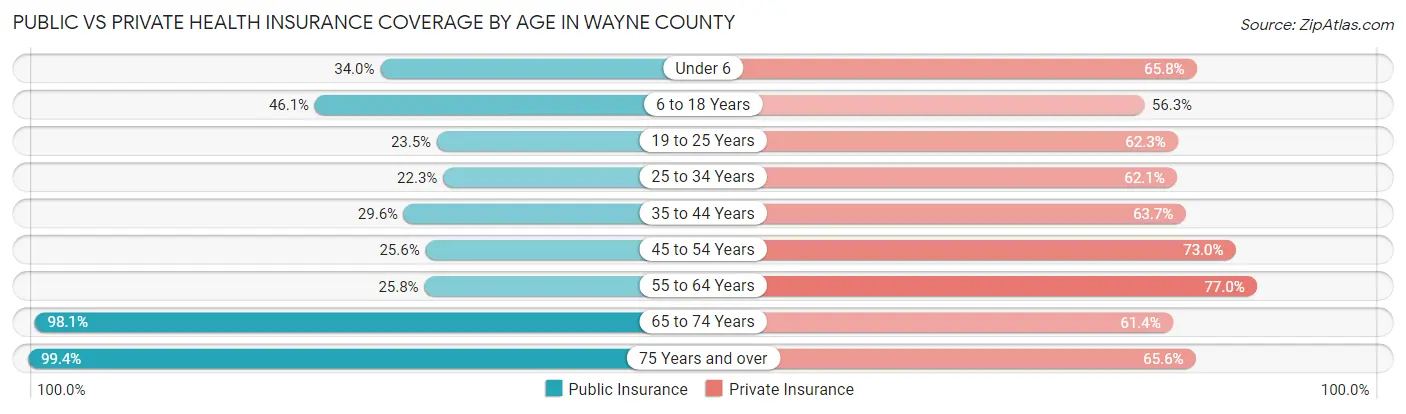
| Age Bracket | Public Insurance | Private Insurance |
| Under 6 | 811 (34.0%) | 1,571 (65.8%) |
| 6 to 18 Years | 3,032 (46.1%) | 3,699 (56.3%) |
| 19 to 25 Years | 786 (23.5%) | 2,088 (62.3%) |
| 25 to 34 Years | 968 (22.3%) | 2,696 (62.1%) |
| 35 to 44 Years | 1,484 (29.6%) | 3,196 (63.7%) |
| 45 to 54 Years | 1,581 (25.6%) | 4,513 (73.0%) |
| 55 to 64 Years | 2,103 (25.8%) | 6,280 (77.0%) |
| 65 to 74 Years | 7,332 (98.1%) | 4,586 (61.4%) |
| 75 Years and over | 4,716 (99.4%) | 3,115 (65.6%) |
| Total | 22,813 (47.3%) | 31,744 (65.8%) |
Disability Status by Sex by Age in Wayne County
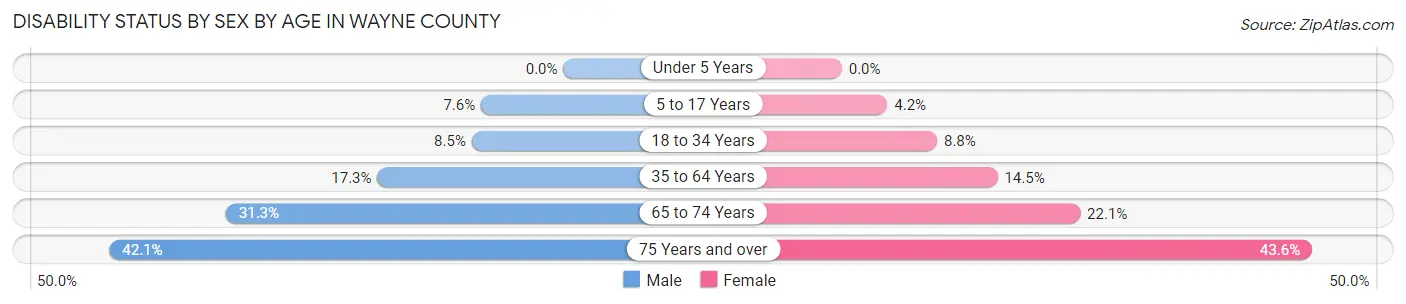
| Age Bracket | Male | Female |
| Under 5 Years | 0 (0.0%) | 0 (0.0%) |
| 5 to 17 Years | 257 (7.6%) | 129 (4.2%) |
| 18 to 34 Years | 357 (8.5%) | 350 (8.8%) |
| 35 to 64 Years | 1,713 (17.3%) | 1,362 (14.4%) |
| 65 to 74 Years | 1,151 (31.3%) | 840 (22.1%) |
| 75 Years and over | 956 (42.1%) | 1,081 (43.6%) |
Disability Class by Sex by Age in Wayne County
Disability Class: Hearing Difficulty
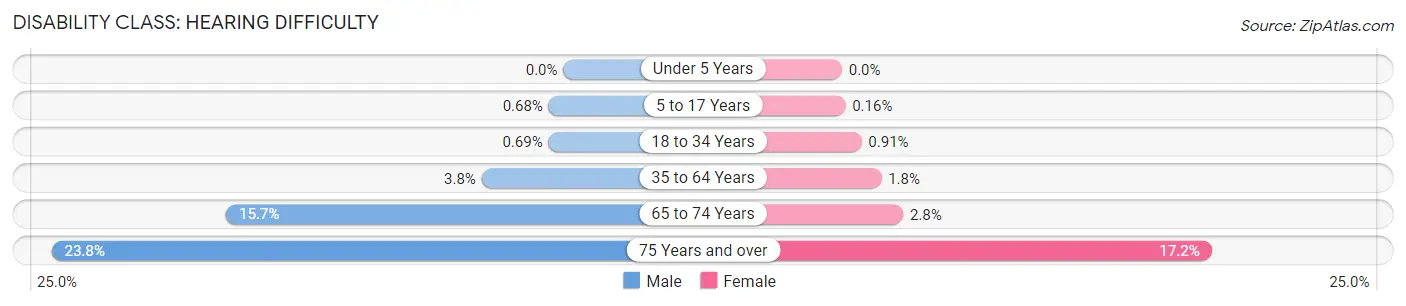
| Age Bracket | Male | Female |
| Under 5 Years | 0 (0.0%) | 0 (0.0%) |
| 5 to 17 Years | 23 (0.7%) | 5 (0.2%) |
| 18 to 34 Years | 29 (0.7%) | 36 (0.9%) |
| 35 to 64 Years | 376 (3.8%) | 172 (1.8%) |
| 65 to 74 Years | 575 (15.7%) | 108 (2.8%) |
| 75 Years and over | 539 (23.7%) | 425 (17.2%) |
Disability Class: Vision Difficulty
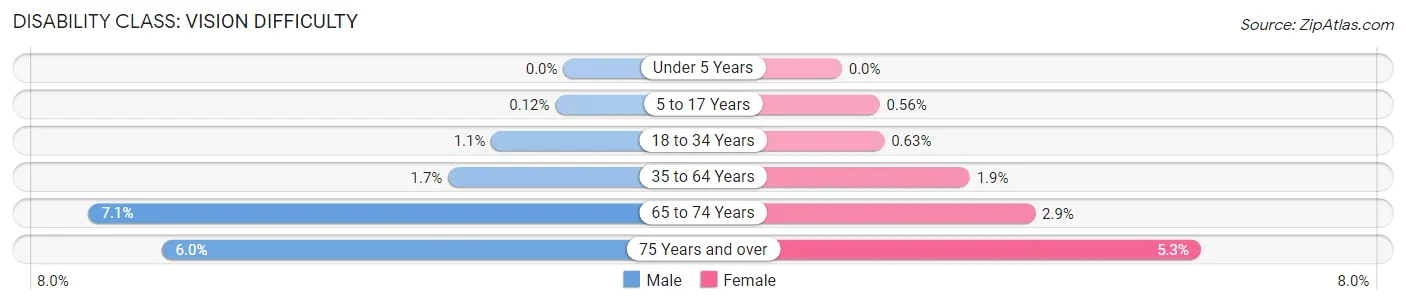
| Age Bracket | Male | Female |
| Under 5 Years | 0 (0.0%) | 0 (0.0%) |
| 5 to 17 Years | 4 (0.1%) | 17 (0.6%) |
| 18 to 34 Years | 45 (1.1%) | 25 (0.6%) |
| 35 to 64 Years | 170 (1.7%) | 179 (1.9%) |
| 65 to 74 Years | 259 (7.0%) | 109 (2.9%) |
| 75 Years and over | 135 (5.9%) | 132 (5.3%) |
Disability Class: Cognitive Difficulty
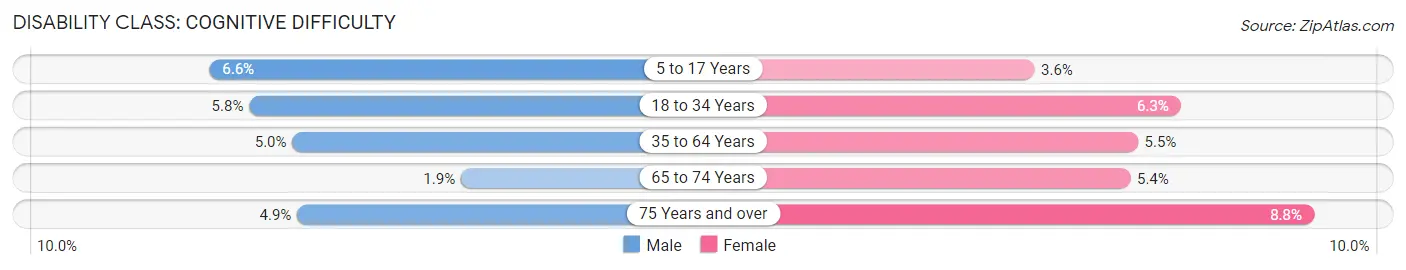
| Age Bracket | Male | Female |
| 5 to 17 Years | 221 (6.6%) | 109 (3.6%) |
| 18 to 34 Years | 245 (5.8%) | 249 (6.3%) |
| 35 to 64 Years | 499 (5.0%) | 517 (5.5%) |
| 65 to 74 Years | 70 (1.9%) | 203 (5.3%) |
| 75 Years and over | 112 (4.9%) | 217 (8.8%) |
Disability Class: Ambulatory Difficulty
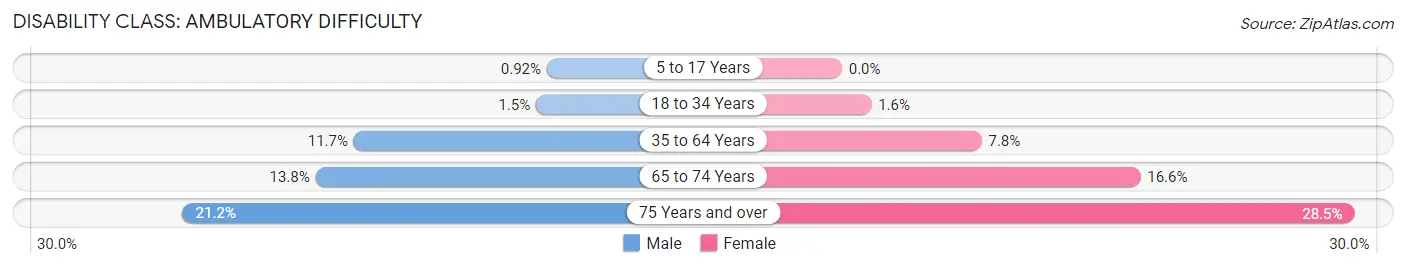
| Age Bracket | Male | Female |
| 5 to 17 Years | 31 (0.9%) | 0 (0.0%) |
| 18 to 34 Years | 64 (1.5%) | 65 (1.6%) |
| 35 to 64 Years | 1,158 (11.7%) | 733 (7.8%) |
| 65 to 74 Years | 507 (13.8%) | 631 (16.6%) |
| 75 Years and over | 481 (21.2%) | 707 (28.5%) |
Disability Class: Self-Care Difficulty
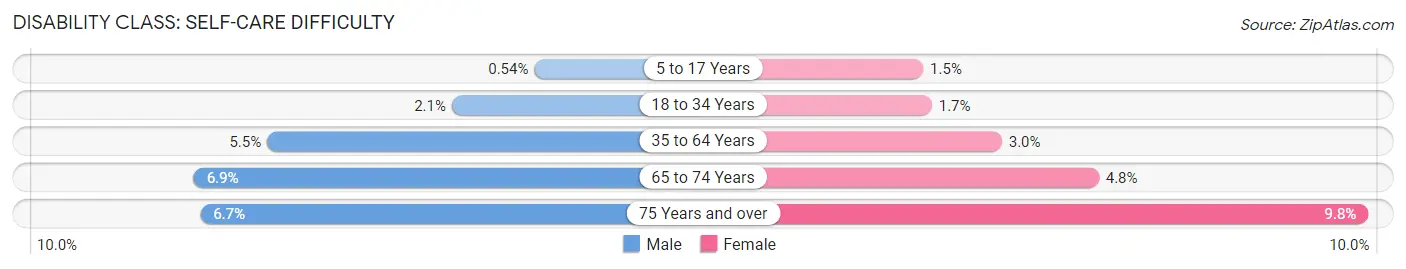
| Age Bracket | Male | Female |
| 5 to 17 Years | 18 (0.5%) | 46 (1.5%) |
| 18 to 34 Years | 87 (2.1%) | 66 (1.7%) |
| 35 to 64 Years | 546 (5.5%) | 280 (3.0%) |
| 65 to 74 Years | 252 (6.9%) | 181 (4.8%) |
| 75 Years and over | 153 (6.7%) | 242 (9.8%) |
Technology Access in Wayne County
Computing Device Access in Wayne County
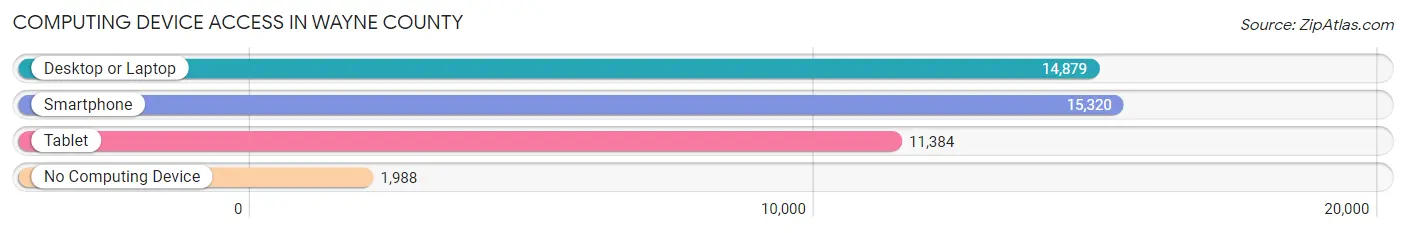
| Device Type | # Households | % Households |
| Desktop or Laptop | 14,879 | 75.3% |
| Smartphone | 15,320 | 77.6% |
| Tablet | 11,384 | 57.7% |
| No Computing Device | 1,988 | 10.1% |
| Total | 19,747 | 100.0% |
Internet Access in Wayne County
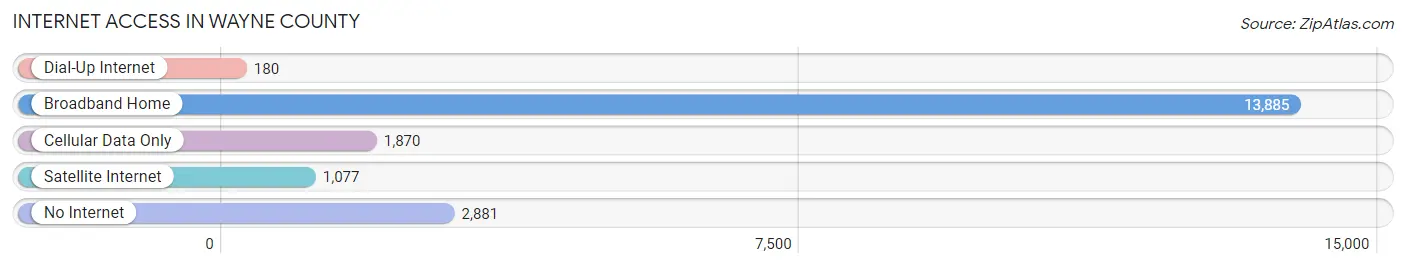
| Internet Type | # Households | % Households |
| Dial-Up Internet | 180 | 0.9% |
| Broadband Home | 13,885 | 70.3% |
| Cellular Data Only | 1,870 | 9.5% |
| Satellite Internet | 1,077 | 5.4% |
| No Internet | 2,881 | 14.6% |
| Total | 19,747 | 100.0% |
Wayne County Summary
Wayne County is a county located in the northeastern part of the U.S. state of Pennsylvania. As of the 2010 census, the population was 52,822. The county seat is Honesdale. The county was named for General Anthony Wayne, a hero of the American Revolution.
History
Wayne County was formed on March 21, 1798, from part of Northampton County. It was named for General Anthony Wayne, a hero of the American Revolution. The first settlers in the area were mostly of German and English descent. The first county seat was at Milford, but it was moved to Honesdale in 1841.
The county was home to the Delaware and Lackawanna Railroad, which was the first railroad in the United States to use a steam locomotive. The railroad was instrumental in the development of the coal and iron industries in the county.
Geography
Wayne County is located in the northeastern part of Pennsylvania. It is bordered by Pike County to the north, Monroe County to the east, Lackawanna County to the south, and Susquehanna County to the west. The county has a total area of 726 square miles, of which 717 square miles is land and 9 square miles is water.
The terrain of Wayne County is mostly hilly and mountainous, with some flat areas in the valleys. The highest point in the county is Mount Ararat, which has an elevation of 2,624 feet. The county is drained by the Lackawaxen River and its tributaries.
Economy
The economy of Wayne County is largely based on agriculture, manufacturing, and tourism. The county is home to several large farms, which produce dairy products, beef, and vegetables. The manufacturing sector is dominated by the production of paper products, plastics, and chemicals.
Tourism is an important part of the economy, with the county being home to several popular attractions, such as the Lackawaxen River, Promised Land State Park, and the Delaware and Lackawanna Railroad.
Demographics
As of the 2010 census, there were 52,822 people, 20,845 households, and 14,717 families living in the county. The population density was 73.3 people per square mile. The racial makeup of the county was 97.2% White, 0.7% Black or African American, 0.2% Native American, 0.5% Asian, 0.1% Pacific Islander, 0.4% from other races, and 0.9% from two or more races.
The median income for a household in the county was $45,945, and the median income for a family was $54,945. The per capita income for the county was $22,945. About 8.2% of families and 11.2% of the population were below the poverty line, including 15.2% of those under age 18 and 8.2% of those age 65 or over.
Common Questions
What is Per Capita Income in Wayne County?
Per Capita income in Wayne County is $32,207.
What is the Median Family Income in Wayne County?
Median Family Income in Wayne County is $74,661.
What is the Median Household income in Wayne County?
Median Household Income in Wayne County is $59,240.
What is Income or Wage Gap in Wayne County?
Income or Wage Gap in Wayne County is 25.5%.
Women in Wayne County earn 74.5 cents for every dollar earned by a man.
What is Family Income Deficit in Wayne County?
Family Income Deficit in Wayne County is $7,796.
Families that are below poverty line in Wayne County earn $7,796 less on average than the poverty threshold level.
What is Inequality or Gini Index in Wayne County?
Inequality or Gini Index in Wayne County is 0.42.
What is the Total Population of Wayne County?
Total Population of Wayne County is 51,227.
What is the Total Male Population of Wayne County?
Total Male Population of Wayne County is 27,289.
What is the Total Female Population of Wayne County?
Total Female Population of Wayne County is 23,938.
What is the Ratio of Males per 100 Females in Wayne County?
There are 114.00 Males per 100 Females in Wayne County.
What is the Ratio of Females per 100 Males in Wayne County?
There are 87.72 Females per 100 Males in Wayne County.
What is the Median Population Age in Wayne County?
Median Population Age in Wayne County is 48.8 Years.
What is the Average Family Size in Wayne County
Average Family Size in Wayne County is 3.0 People.
What is the Average Household Size in Wayne County
Average Household Size in Wayne County is 2.4 People.
How Large is the Labor Force in Wayne County?
There are 22,573 People in the Labor Forcein in Wayne County.
What is the Percentage of People in the Labor Force in Wayne County?
51.6% of People are in the Labor Force in Wayne County.
What is the Unemployment Rate in Wayne County?
Unemployment Rate in Wayne County is 5.9%.