Washington County, PA Map & Demographics
Washington County Map
Washington County Overview
$42,859
PER CAPITA INCOME
$98,930
AVG FAMILY INCOME
$74,403
AVG HOUSEHOLD INCOME
39.3%
WAGE / INCOME GAP [ % ]
60.7¢/ $1
WAGE / INCOME GAP [ $ ]
$10,864
FAMILY INCOME DEFICIT
0.46
INEQUALITY / GINI INDEX
209,631
TOTAL POPULATION
103,708
MALE POPULATION
105,923
FEMALE POPULATION
97.91
MALES / 100 FEMALES
102.14
FEMALES / 100 MALES
44.2
MEDIAN AGE
2.9
AVG FAMILY SIZE
2.3
AVG HOUSEHOLD SIZE
107,776
LABOR FORCE [ PEOPLE ]
62.1%
PERCENT IN LABOR FORCE
5.0%
UNEMPLOYMENT RATE
Income in Washington County
Income Overview in Washington County
Per Capita Income in Washington County is $42,859, while median incomes of families and households are $98,930 and $74,403 respectively.
| Characteristic | Number | Measure |
| Per Capita Income | 209,631 | $42,859 |
| Median Family Income | 55,273 | $98,930 |
| Mean Family Income | 55,273 | $124,695 |
| Median Household Income | 87,200 | $74,403 |
| Mean Household Income | 87,200 | $100,823 |
| Income Deficit | 55,273 | $10,864 |
| Wage / Income Gap (%) | 209,631 | 39.32% |
| Wage / Income Gap ($) | 209,631 | 60.68¢ per $1 |
| Gini / Inequality Index | 209,631 | 0.46 |
Earnings by Sex in Washington County
Average Earnings in Washington County are $44,632, $56,709 for men and $34,412 for women, a difference of 39.3%.
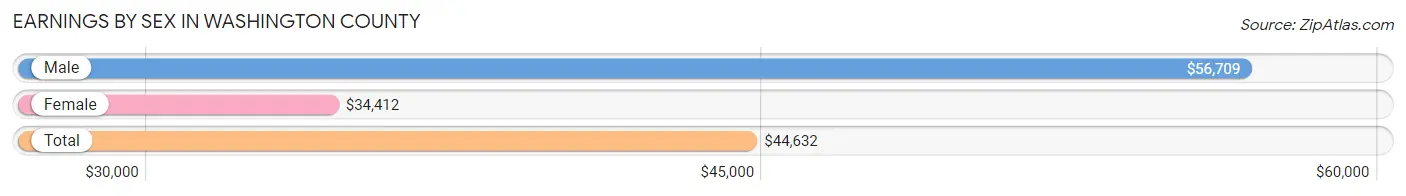
| Sex | Number | Average Earnings |
| Male | 59,794 (53.0%) | $56,709 |
| Female | 53,091 (47.0%) | $34,412 |
| Total | 112,885 (100.0%) | $44,632 |
Earnings by Sex by Income Bracket in Washington County
The most common earnings brackets in Washington County are $100,000+ for men (13,383 | 22.4%) and $100,000+ for women (4,544 | 8.6%).
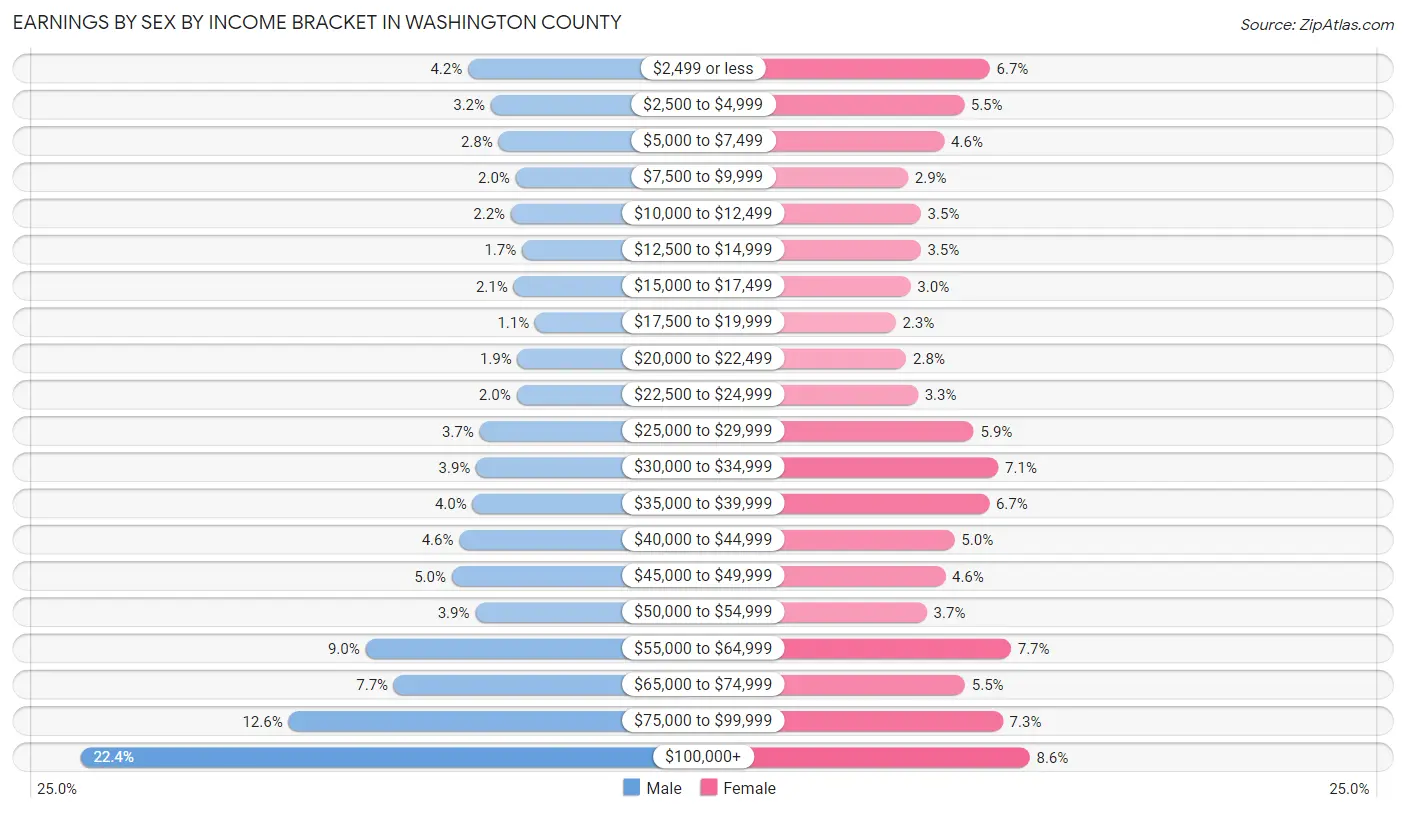
| Income | Male | Female |
| $2,499 or less | 2,532 (4.2%) | 3,552 (6.7%) |
| $2,500 to $4,999 | 1,890 (3.2%) | 2,911 (5.5%) |
| $5,000 to $7,499 | 1,674 (2.8%) | 2,422 (4.6%) |
| $7,500 to $9,999 | 1,194 (2.0%) | 1,517 (2.9%) |
| $10,000 to $12,499 | 1,325 (2.2%) | 1,837 (3.5%) |
| $12,500 to $14,999 | 1,019 (1.7%) | 1,831 (3.5%) |
| $15,000 to $17,499 | 1,256 (2.1%) | 1,582 (3.0%) |
| $17,500 to $19,999 | 654 (1.1%) | 1,208 (2.3%) |
| $20,000 to $22,499 | 1,140 (1.9%) | 1,478 (2.8%) |
| $22,500 to $24,999 | 1,171 (2.0%) | 1,764 (3.3%) |
| $25,000 to $29,999 | 2,207 (3.7%) | 3,155 (5.9%) |
| $30,000 to $34,999 | 2,300 (3.8%) | 3,766 (7.1%) |
| $35,000 to $39,999 | 2,404 (4.0%) | 3,535 (6.7%) |
| $40,000 to $44,999 | 2,777 (4.6%) | 2,674 (5.0%) |
| $45,000 to $49,999 | 2,982 (5.0%) | 2,440 (4.6%) |
| $50,000 to $54,999 | 2,326 (3.9%) | 1,985 (3.7%) |
| $55,000 to $64,999 | 5,398 (9.0%) | 4,080 (7.7%) |
| $65,000 to $74,999 | 4,607 (7.7%) | 2,934 (5.5%) |
| $75,000 to $99,999 | 7,555 (12.6%) | 3,876 (7.3%) |
| $100,000+ | 13,383 (22.4%) | 4,544 (8.6%) |
| Total | 59,794 (100.0%) | 53,091 (100.0%) |
Earnings by Sex by Educational Attainment in Washington County
Average earnings in Washington County are $63,163 for men and $39,839 for women, a difference of 36.9%. Men with an educational attainment of graduate degree enjoy the highest average annual earnings of $102,478, while those with less than high school education earn the least with $29,902. Women with an educational attainment of graduate degree earn the most with the average annual earnings of $69,186, while those with less than high school education have the smallest earnings of $16,952.
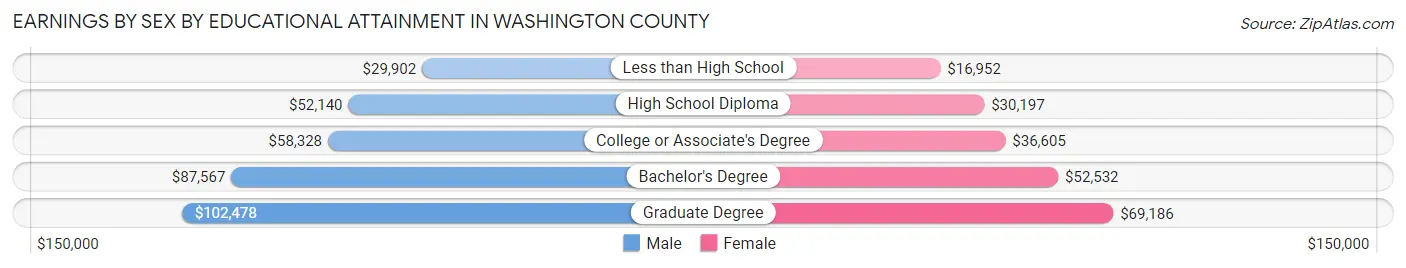
| Educational Attainment | Male Income | Female Income |
| Less than High School | $29,902 | $16,952 |
| High School Diploma | $52,140 | $30,197 |
| College or Associate's Degree | $58,328 | $36,605 |
| Bachelor's Degree | $87,567 | $52,532 |
| Graduate Degree | $102,478 | $69,186 |
| Total | $63,163 | $39,839 |
Family Income in Washington County
Family Income Brackets in Washington County
According to the Washington County family income data, there are 11,994 families falling into the $100,000 to $149,999 income range, which is the most common income bracket and makes up 21.7% of all families. Conversely, the $10,000 to $14,999 income bracket is the least frequent group with only 553 families (1.0%) belonging to this category.
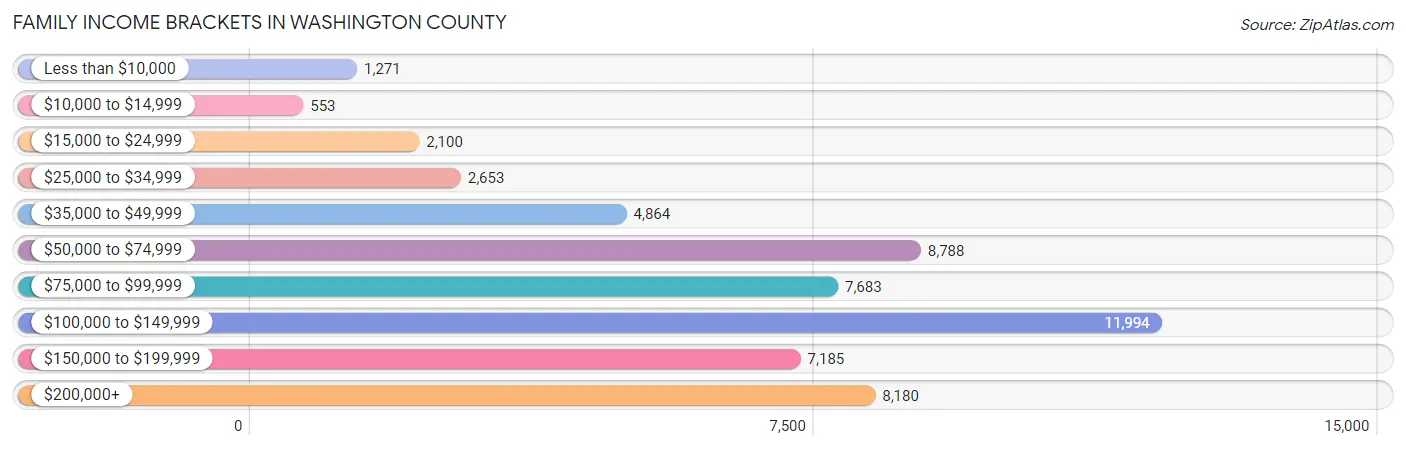
| Income Bracket | # Families | % Families |
| Less than $10,000 | 1,271 | 2.3% |
| $10,000 to $14,999 | 553 | 1.0% |
| $15,000 to $24,999 | 2,100 | 3.8% |
| $25,000 to $34,999 | 2,653 | 4.8% |
| $35,000 to $49,999 | 4,864 | 8.8% |
| $50,000 to $74,999 | 8,788 | 15.9% |
| $75,000 to $99,999 | 7,683 | 13.9% |
| $100,000 to $149,999 | 11,994 | 21.7% |
| $150,000 to $199,999 | 7,185 | 13.0% |
| $200,000+ | 8,180 | 14.8% |
Family Income by Famaliy Size in Washington County
7+ person families (414 | 0.7%) account for the highest median family income in Washington County with $148,148 per family, while 2-person families (29,620 | 53.6%) have the highest median income of $40,294 per family member.
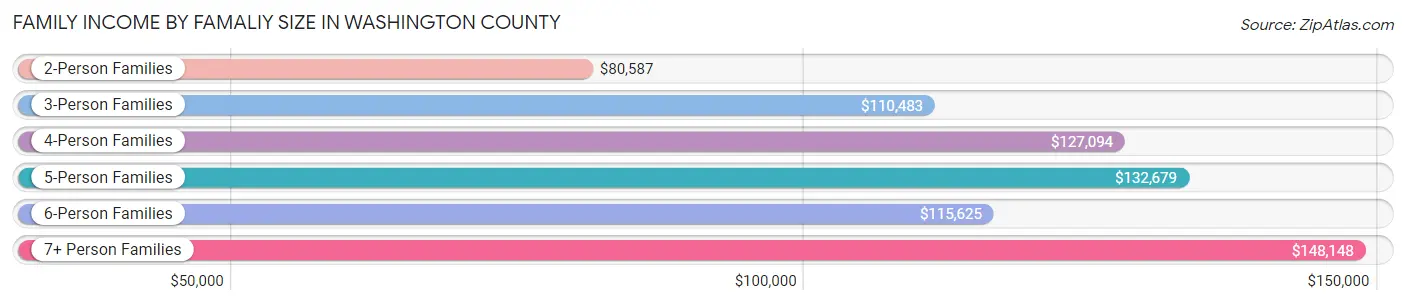
| Income Bracket | # Families | Median Income |
| 2-Person Families | 29,620 (53.6%) | $80,587 |
| 3-Person Families | 10,906 (19.7%) | $110,483 |
| 4-Person Families | 9,715 (17.6%) | $127,094 |
| 5-Person Families | 3,606 (6.5%) | $132,679 |
| 6-Person Families | 1,012 (1.8%) | $115,625 |
| 7+ Person Families | 414 (0.7%) | $148,148 |
| Total | 55,273 (100.0%) | $98,930 |
Family Income by Number of Earners in Washington County
The median family income in Washington County is $98,930, with families comprising 3+ earners (6,241) having the highest median family income of $165,525, while families with no earners (9,835) have the lowest median family income of $51,764, accounting for 11.3% and 17.8% of families, respectively.
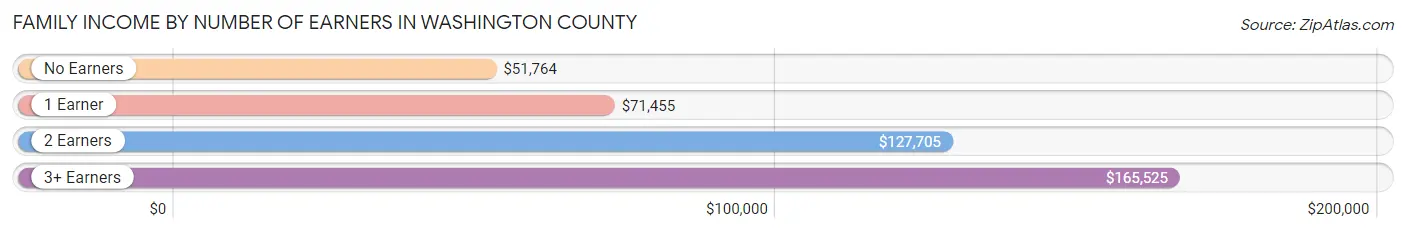
| Number of Earners | # Families | Median Income |
| No Earners | 9,835 (17.8%) | $51,764 |
| 1 Earner | 15,924 (28.8%) | $71,455 |
| 2 Earners | 23,273 (42.1%) | $127,705 |
| 3+ Earners | 6,241 (11.3%) | $165,525 |
| Total | 55,273 (100.0%) | $98,930 |
Household Income in Washington County
Household Income Brackets in Washington County
With 14,824 households falling in the category, the $100,000 to $149,999 income range is the most frequent in Washington County, accounting for 17.0% of all households. In contrast, only 2,965 households (3.4%) fall into the $10,000 to $14,999 income bracket, making it the least populous group.
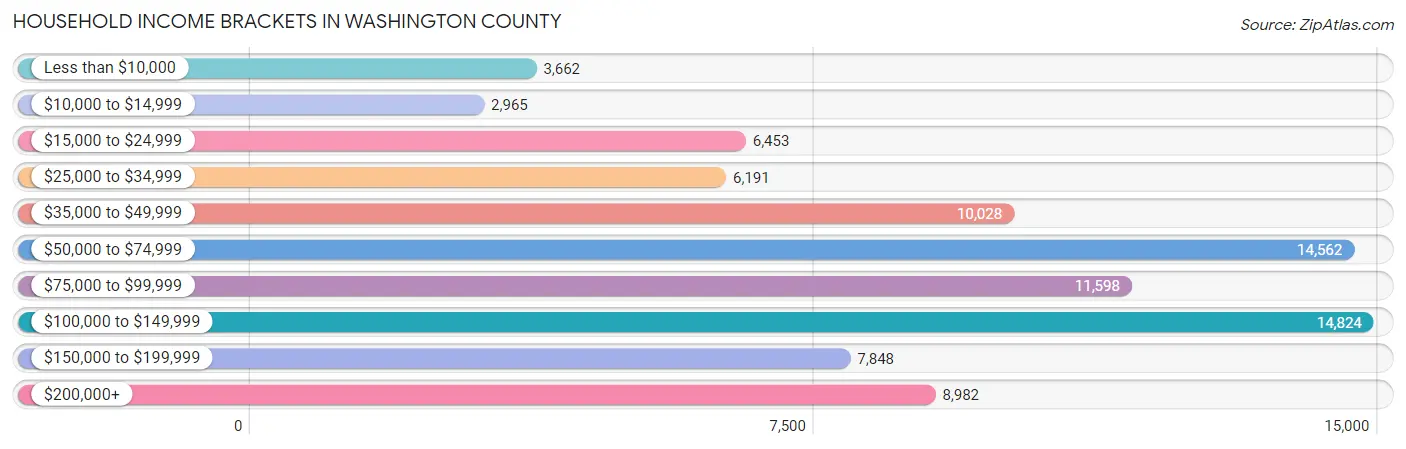
| Income Bracket | # Households | % Households |
| Less than $10,000 | 3,662 | 4.2% |
| $10,000 to $14,999 | 2,965 | 3.4% |
| $15,000 to $24,999 | 6,453 | 7.4% |
| $25,000 to $34,999 | 6,191 | 7.1% |
| $35,000 to $49,999 | 10,028 | 11.5% |
| $50,000 to $74,999 | 14,562 | 16.7% |
| $75,000 to $99,999 | 11,598 | 13.3% |
| $100,000 to $149,999 | 14,824 | 17.0% |
| $150,000 to $199,999 | 7,848 | 9.0% |
| $200,000+ | 8,982 | 10.3% |
Household Income by Householder Age in Washington County
The median household income in Washington County is $74,403, with the highest median household income of $93,956 found in the 25 to 44 years age bracket for the primary householder. A total of 22,925 households (26.3%) fall into this category. Meanwhile, the 15 to 24 years age bracket for the primary householder has the lowest median household income of $43,344, with 2,229 households (2.6%) in this group.
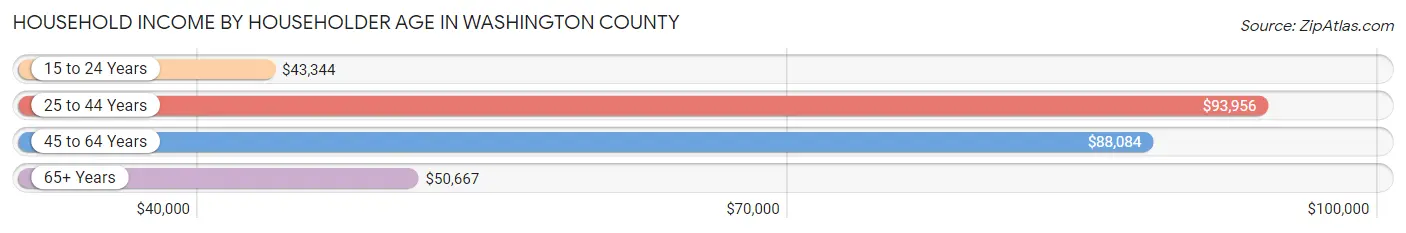
| Income Bracket | # Households | Median Income |
| 15 to 24 Years | 2,229 (2.6%) | $43,344 |
| 25 to 44 Years | 22,925 (26.3%) | $93,956 |
| 45 to 64 Years | 33,567 (38.5%) | $88,084 |
| 65+ Years | 28,479 (32.7%) | $50,667 |
| Total | 87,200 (100.0%) | $74,403 |
Poverty in Washington County
Income Below Poverty by Sex and Age in Washington County
With 8.4% poverty level for males and 10.5% for females among the residents of Washington County, 15 year old males and 18 to 24 year old females are the most vulnerable to poverty, with 221 males (15.7%) and 1,101 females (15.4%) in their respective age groups living below the poverty level.
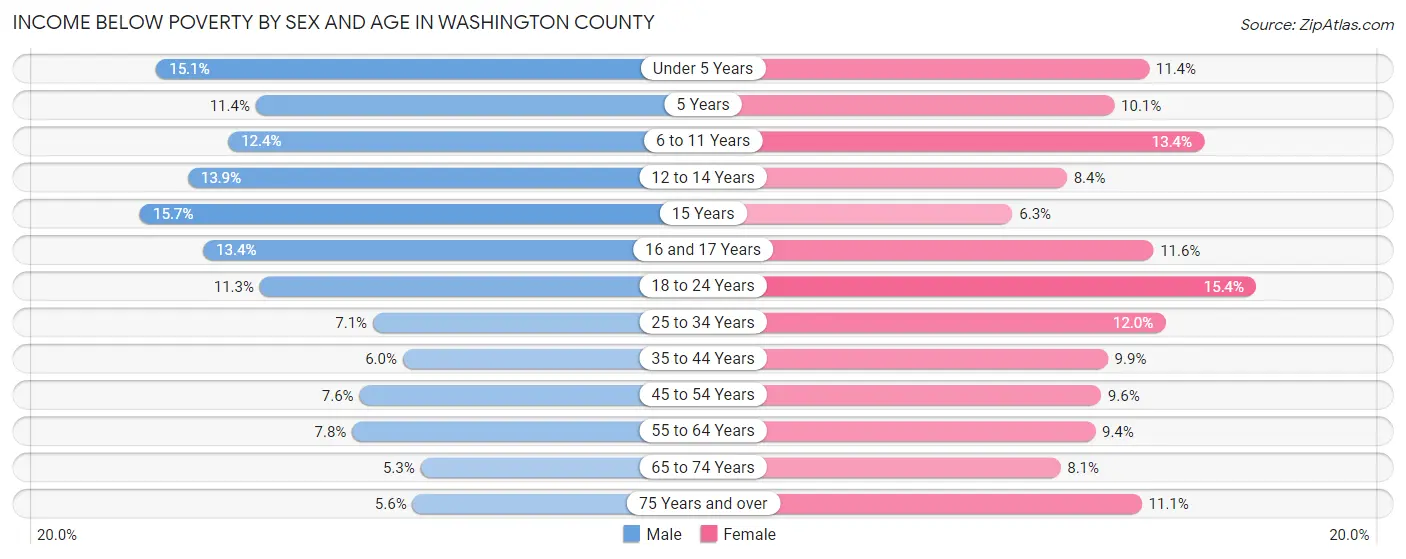
| Age Bracket | Male | Female |
| Under 5 Years | 772 (15.1%) | 581 (11.4%) |
| 5 Years | 151 (11.4%) | 143 (10.1%) |
| 6 to 11 Years | 943 (12.4%) | 896 (13.4%) |
| 12 to 14 Years | 404 (13.9%) | 245 (8.4%) |
| 15 Years | 221 (15.7%) | 68 (6.3%) |
| 16 and 17 Years | 302 (13.4%) | 289 (11.6%) |
| 18 to 24 Years | 823 (11.3%) | 1,101 (15.4%) |
| 25 to 34 Years | 837 (7.1%) | 1,342 (12.0%) |
| 35 to 44 Years | 756 (6.0%) | 1,191 (9.9%) |
| 45 to 54 Years | 1,024 (7.6%) | 1,277 (9.6%) |
| 55 to 64 Years | 1,218 (7.8%) | 1,506 (9.4%) |
| 65 to 74 Years | 652 (5.3%) | 1,081 (8.1%) |
| 75 Years and over | 405 (5.6%) | 1,164 (11.1%) |
| Total | 8,508 (8.4%) | 10,884 (10.5%) |
Income Above Poverty by Sex and Age in Washington County
According to the poverty statistics in Washington County, males aged 65 to 74 years and females aged 15 years are the age groups that are most secure financially, with 94.7% of males and 93.7% of females in these age groups living above the poverty line.
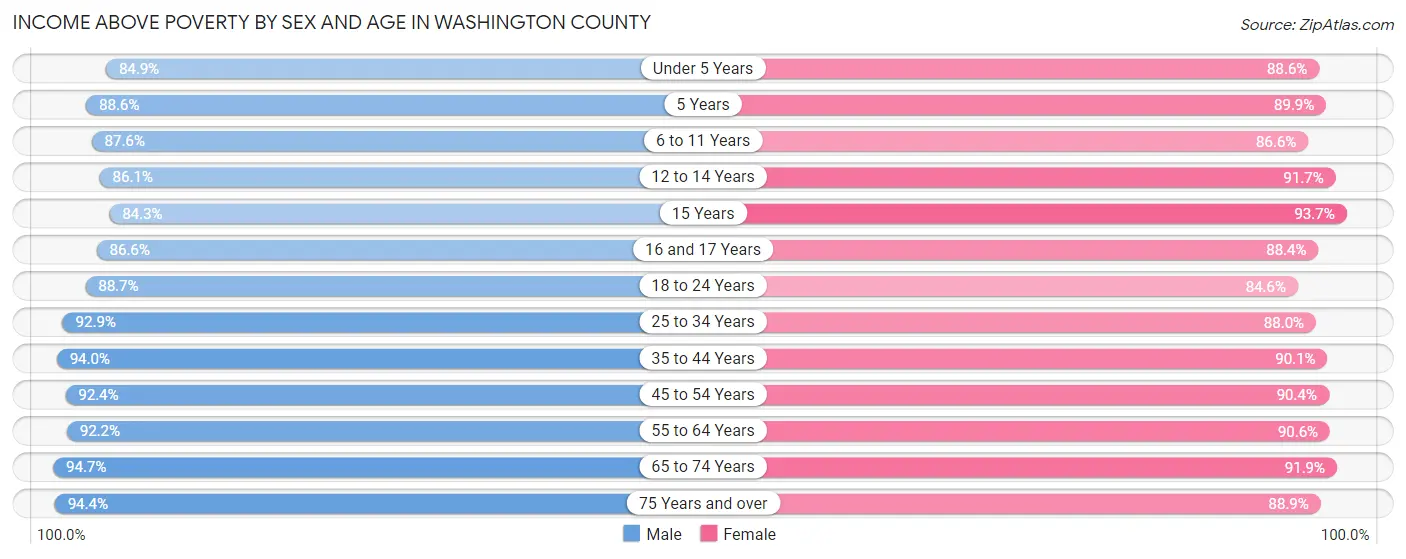
| Age Bracket | Male | Female |
| Under 5 Years | 4,337 (84.9%) | 4,515 (88.6%) |
| 5 Years | 1,171 (88.6%) | 1,271 (89.9%) |
| 6 to 11 Years | 6,638 (87.6%) | 5,773 (86.6%) |
| 12 to 14 Years | 2,495 (86.1%) | 2,688 (91.6%) |
| 15 Years | 1,186 (84.3%) | 1,007 (93.7%) |
| 16 and 17 Years | 1,956 (86.6%) | 2,211 (88.4%) |
| 18 to 24 Years | 6,482 (88.7%) | 6,064 (84.6%) |
| 25 to 34 Years | 11,004 (92.9%) | 9,840 (88.0%) |
| 35 to 44 Years | 11,938 (94.0%) | 10,873 (90.1%) |
| 45 to 54 Years | 12,497 (92.4%) | 11,996 (90.4%) |
| 55 to 64 Years | 14,326 (92.2%) | 14,522 (90.6%) |
| 65 to 74 Years | 11,643 (94.7%) | 12,253 (91.9%) |
| 75 Years and over | 6,826 (94.4%) | 9,297 (88.9%) |
| Total | 92,499 (91.6%) | 92,310 (89.4%) |
Income Below Poverty Among Married-Couple Families in Washington County
The poverty statistics for married-couple families in Washington County show that 2.6% or 1,124 of the total 43,586 families live below the poverty line. Families with 5 or more children have the highest poverty rate of 9.1%, comprising of 9 families. On the other hand, families with 1 or 2 children have the lowest poverty rate of 1.8%, which includes 216 families.
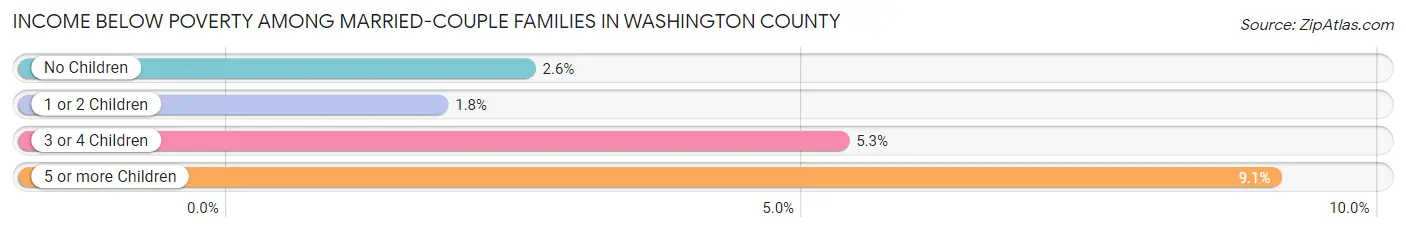
| Children | Above Poverty | Below Poverty |
| No Children | 28,073 (97.4%) | 745 (2.6%) |
| 1 or 2 Children | 11,556 (98.2%) | 216 (1.8%) |
| 3 or 4 Children | 2,743 (94.7%) | 154 (5.3%) |
| 5 or more Children | 90 (90.9%) | 9 (9.1%) |
| Total | 42,462 (97.4%) | 1,124 (2.6%) |
Income Below Poverty Among Single-Parent Households in Washington County
According to the poverty data in Washington County, 14.9% or 516 single-father households and 20.2% or 1,661 single-mother households are living below the poverty line. Among single-father households, those with 3 or 4 children have the highest poverty rate, with 68 households (26.3%) experiencing poverty. Likewise, among single-mother households, those with 5 or more children have the highest poverty rate, with 68 households (100.0%) falling below the poverty line.
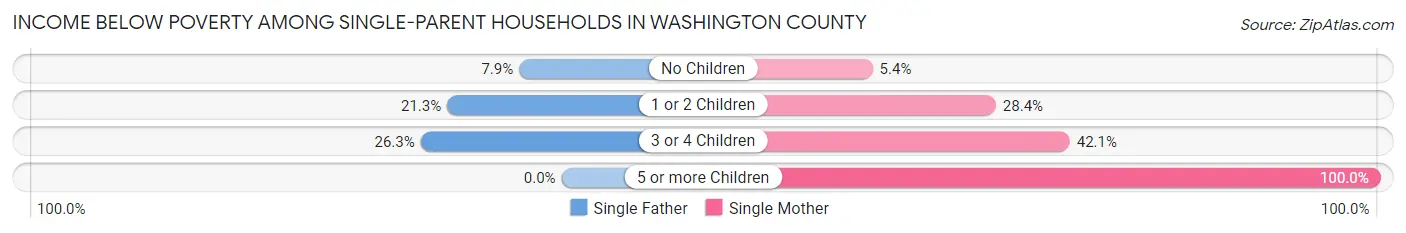
| Children | Single Father | Single Mother |
| No Children | 138 (7.9%) | 197 (5.4%) |
| 1 or 2 Children | 310 (21.3%) | 1,038 (28.4%) |
| 3 or 4 Children | 68 (26.3%) | 358 (42.1%) |
| 5 or more Children | 0 (0.0%) | 68 (100.0%) |
| Total | 516 (14.9%) | 1,661 (20.2%) |
Income Below Poverty Among Married-Couple vs Single-Parent Households in Washington County
The poverty data for Washington County shows that 1,124 of the married-couple family households (2.6%) and 2,177 of the single-parent households (18.6%) are living below the poverty level. Within the married-couple family households, those with 5 or more children have the highest poverty rate, with 9 households (9.1%) falling below the poverty line. Among the single-parent households, those with 5 or more children have the highest poverty rate, with 68 household (100.0%) living below poverty.
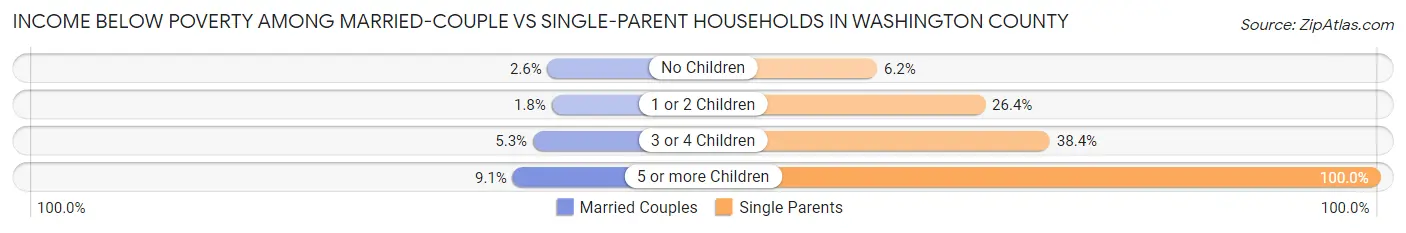
| Children | Married-Couple Families | Single-Parent Households |
| No Children | 745 (2.6%) | 335 (6.2%) |
| 1 or 2 Children | 216 (1.8%) | 1,348 (26.4%) |
| 3 or 4 Children | 154 (5.3%) | 426 (38.4%) |
| 5 or more Children | 9 (9.1%) | 68 (100.0%) |
| Total | 1,124 (2.6%) | 2,177 (18.6%) |
Race in Washington County
The most populous races in Washington County are White / Caucasian (191,587 | 91.4%), Two or more Races (7,412 | 3.5%), and Black / African American (6,750 | 3.2%).
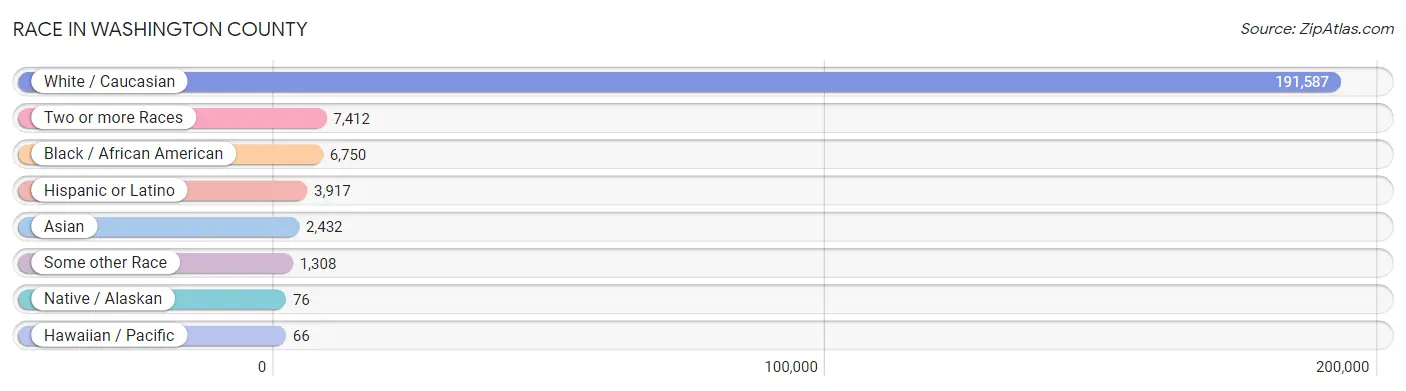
| Race | # Population | % Population |
| Asian | 2,432 | 1.2% |
| Black / African American | 6,750 | 3.2% |
| Hawaiian / Pacific | 66 | 0.0% |
| Hispanic or Latino | 3,917 | 1.9% |
| Native / Alaskan | 76 | 0.0% |
| White / Caucasian | 191,587 | 91.4% |
| Two or more Races | 7,412 | 3.5% |
| Some other Race | 1,308 | 0.6% |
| Total | 209,631 | 100.0% |
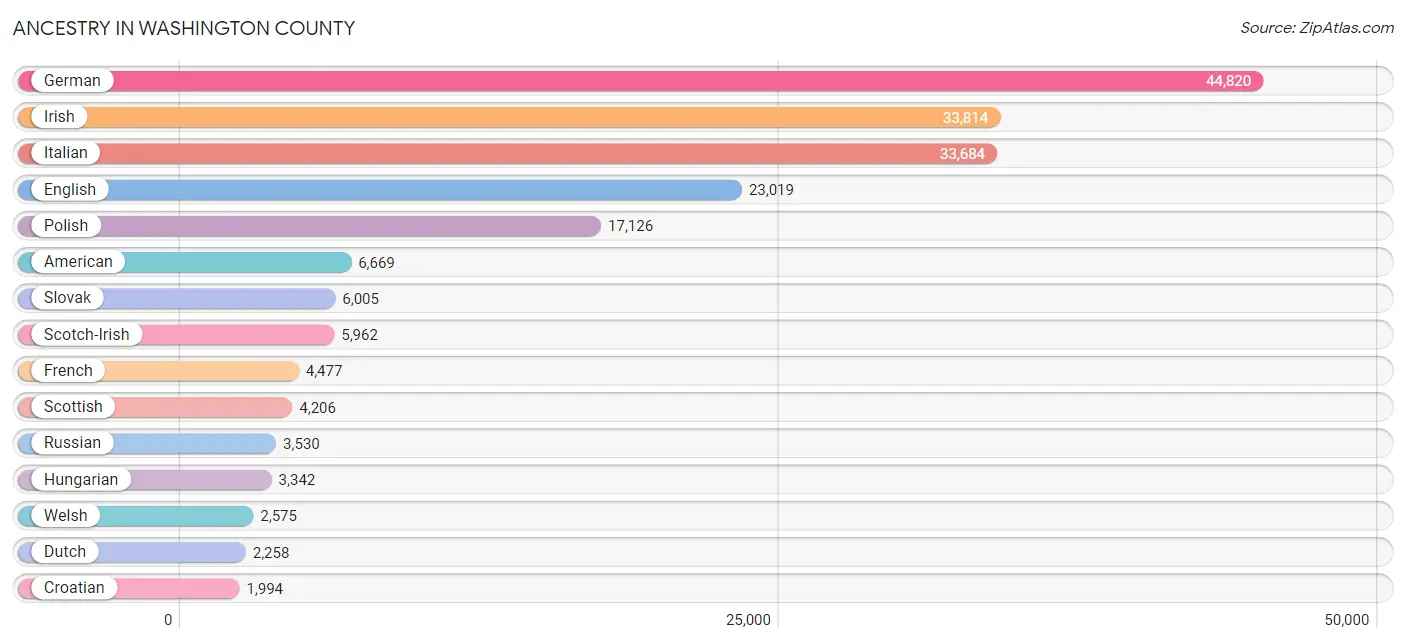
Ancestry in Washington County
The most populous ancestries reported in Washington County are German (44,820 | 21.4%), Irish (33,814 | 16.1%), Italian (33,684 | 16.1%), English (23,019 | 11.0%), and Polish (17,126 | 8.2%), together accounting for 72.7% of all Washington County residents.
| Ancestry | # Population | % Population |
| African | 339 | 0.2% |
| Albanian | 19 | 0.0% |
| American | 6,669 | 3.2% |
| Apache | 3 | 0.0% |
| Arab | 1,044 | 0.5% |
| Argentinean | 83 | 0.0% |
| Armenian | 14 | 0.0% |
| Australian | 60 | 0.0% |
| Austrian | 637 | 0.3% |
| Bangladeshi | 6 | 0.0% |
| Belgian | 868 | 0.4% |
| Bhutanese | 112 | 0.1% |
| Blackfeet | 76 | 0.0% |
| Bolivian | 22 | 0.0% |
| British | 856 | 0.4% |
| British West Indian | 5 | 0.0% |
| Burmese | 299 | 0.1% |
| Cajun | 12 | 0.0% |
| Cambodian | 15 | 0.0% |
| Canadian | 91 | 0.0% |
| Carpatho Rusyn | 49 | 0.0% |
| Celtic | 2 | 0.0% |
| Central American | 464 | 0.2% |
| Cherokee | 417 | 0.2% |
| Cheyenne | 12 | 0.0% |
| Chilean | 12 | 0.0% |
| Colombian | 75 | 0.0% |
| Creek | 5 | 0.0% |
| Croatian | 1,994 | 0.9% |
| Cuban | 380 | 0.2% |
| Czech | 1,333 | 0.6% |
| Czechoslovakian | 834 | 0.4% |
| Danish | 133 | 0.1% |
| Delaware | 6 | 0.0% |
| Dominican | 207 | 0.1% |
| Dutch | 2,258 | 1.1% |
| Eastern European | 851 | 0.4% |
| Ecuadorian | 8 | 0.0% |
| Egyptian | 7 | 0.0% |
| English | 23,019 | 11.0% |
| Ethiopian | 18 | 0.0% |
| European | 1,747 | 0.8% |
| Filipino | 23 | 0.0% |
| Finnish | 218 | 0.1% |
| French | 4,477 | 2.1% |
| French Canadian | 302 | 0.1% |
| German | 44,820 | 21.4% |
| German Russian | 12 | 0.0% |
| Greek | 1,438 | 0.7% |
| Guamanian / Chamorro | 35 | 0.0% |
| Guatemalan | 82 | 0.0% |
| Guyanese | 11 | 0.0% |
| Honduran | 131 | 0.1% |
| Hopi | 12 | 0.0% |
| Hungarian | 3,342 | 1.6% |
| Indian (Asian) | 495 | 0.2% |
| Iranian | 97 | 0.1% |
| Irish | 33,814 | 16.1% |
| Iroquois | 14 | 0.0% |
| Israeli | 28 | 0.0% |
| Italian | 33,684 | 16.1% |
| Jamaican | 117 | 0.1% |
| Kenyan | 4 | 0.0% |
| Korean | 533 | 0.3% |
| Laotian | 18 | 0.0% |
| Latvian | 3 | 0.0% |
| Lebanese | 352 | 0.2% |
| Liberian | 82 | 0.0% |
| Lithuanian | 943 | 0.4% |
| Macedonian | 23 | 0.0% |
| Malaysian | 7 | 0.0% |
| Maltese | 65 | 0.0% |
| Mexican | 1,212 | 0.6% |
| Mexican American Indian | 71 | 0.0% |
| Moroccan | 8 | 0.0% |
| Native Hawaiian | 24 | 0.0% |
| Navajo | 3 | 0.0% |
| Nicaraguan | 9 | 0.0% |
| Nigerian | 6 | 0.0% |
| Northern European | 137 | 0.1% |
| Norwegian | 335 | 0.2% |
| Pakistani | 147 | 0.1% |
| Pennsylvania German | 140 | 0.1% |
| Peruvian | 12 | 0.0% |
| Polish | 17,126 | 8.2% |
| Portuguese | 109 | 0.1% |
| Puerto Rican | 837 | 0.4% |
| Romanian | 153 | 0.1% |
| Russian | 3,530 | 1.7% |
| Salvadoran | 242 | 0.1% |
| Samoan | 20 | 0.0% |
| Scandinavian | 165 | 0.1% |
| Scotch-Irish | 5,962 | 2.8% |
| Scottish | 4,206 | 2.0% |
| Seminole | 3 | 0.0% |
| Serbian | 892 | 0.4% |
| Sioux | 35 | 0.0% |
| Slavic | 262 | 0.1% |
| Slovak | 6,005 | 2.9% |
| Slovene | 1,825 | 0.9% |
| South African | 21 | 0.0% |
| South American | 212 | 0.1% |
| Spaniard | 110 | 0.1% |
| Spanish | 314 | 0.2% |
| Spanish American | 23 | 0.0% |
| Spanish American Indian | 2 | 0.0% |
| Sri Lankan | 294 | 0.1% |
| Subsaharan African | 474 | 0.2% |
| Swedish | 1,298 | 0.6% |
| Swiss | 458 | 0.2% |
| Syrian | 561 | 0.3% |
| Thai | 999 | 0.5% |
| Turkish | 82 | 0.0% |
| Ukrainian | 1,438 | 0.7% |
| Ute | 17 | 0.0% |
| Welsh | 2,575 | 1.2% |
| Yakama | 17 | 0.0% |
| Yugoslavian | 206 | 0.1% | View All 118 Rows |
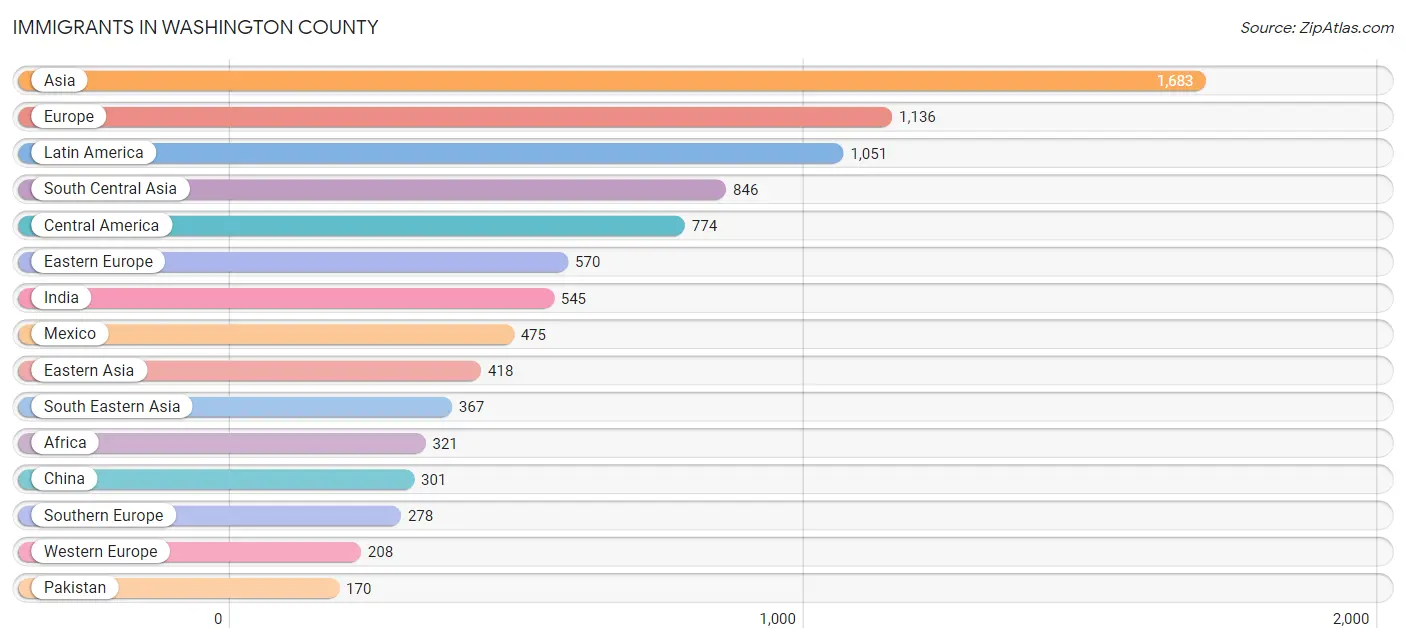
Immigrants in Washington County
The most numerous immigrant groups reported in Washington County came from Asia (1,683 | 0.8%), Europe (1,136 | 0.5%), Latin America (1,051 | 0.5%), South Central Asia (846 | 0.4%), and Central America (774 | 0.4%), together accounting for 2.6% of all Washington County residents.
| Immigration Origin | # Population | % Population |
| Africa | 321 | 0.2% |
| Albania | 20 | 0.0% |
| Argentina | 32 | 0.0% |
| Asia | 1,683 | 0.8% |
| Australia | 10 | 0.0% |
| Belarus | 7 | 0.0% |
| Brazil | 17 | 0.0% |
| Cameroon | 49 | 0.0% |
| Canada | 114 | 0.1% |
| Caribbean | 153 | 0.1% |
| Central America | 774 | 0.4% |
| Chile | 14 | 0.0% |
| China | 301 | 0.1% |
| Colombia | 53 | 0.0% |
| Congo | 35 | 0.0% |
| Croatia | 10 | 0.0% |
| Cuba | 41 | 0.0% |
| Czechoslovakia | 136 | 0.1% |
| Dominican Republic | 70 | 0.0% |
| Eastern Africa | 4 | 0.0% |
| Eastern Asia | 418 | 0.2% |
| Eastern Europe | 570 | 0.3% |
| Ecuador | 8 | 0.0% |
| Egypt | 14 | 0.0% |
| El Salvador | 126 | 0.1% |
| England | 62 | 0.0% |
| Europe | 1,136 | 0.5% |
| Fiji | 11 | 0.0% |
| France | 15 | 0.0% |
| Germany | 145 | 0.1% |
| Greece | 119 | 0.1% |
| Guatemala | 52 | 0.0% |
| Haiti | 19 | 0.0% |
| Honduras | 121 | 0.1% |
| Hong Kong | 4 | 0.0% |
| Hungary | 68 | 0.0% |
| India | 545 | 0.3% |
| Indonesia | 35 | 0.0% |
| Iran | 11 | 0.0% |
| Ireland | 3 | 0.0% |
| Israel | 16 | 0.0% |
| Italy | 126 | 0.1% |
| Jamaica | 23 | 0.0% |
| Kenya | 4 | 0.0% |
| Korea | 100 | 0.1% |
| Kuwait | 5 | 0.0% |
| Latin America | 1,051 | 0.5% |
| Latvia | 3 | 0.0% |
| Liberia | 68 | 0.0% |
| Mexico | 475 | 0.2% |
| Middle Africa | 134 | 0.1% |
| Morocco | 4 | 0.0% |
| Netherlands | 48 | 0.0% |
| Northern Africa | 84 | 0.0% |
| Northern Europe | 80 | 0.0% |
| Oceania | 23 | 0.0% |
| Pakistan | 170 | 0.1% |
| Philippines | 119 | 0.1% |
| Poland | 64 | 0.0% |
| Romania | 48 | 0.0% |
| Russia | 141 | 0.1% |
| Saudi Arabia | 9 | 0.0% |
| Serbia | 3 | 0.0% |
| South Africa | 31 | 0.0% |
| South America | 124 | 0.1% |
| South Central Asia | 846 | 0.4% |
| South Eastern Asia | 367 | 0.2% |
| Southern Europe | 278 | 0.1% |
| Spain | 9 | 0.0% |
| Sweden | 2 | 0.0% |
| Taiwan | 17 | 0.0% |
| Thailand | 67 | 0.0% |
| Turkey | 22 | 0.0% |
| Ukraine | 7 | 0.0% |
| Vietnam | 146 | 0.1% |
| Western Africa | 68 | 0.0% |
| Western Asia | 52 | 0.0% |
| Western Europe | 208 | 0.1% |
| Zaire | 21 | 0.0% | View All 79 Rows |
Sex and Age in Washington County
Sex and Age in Washington County
The most populous age groups in Washington County are 60 to 64 Years (8,421 | 8.1%) for men and 55 to 59 Years (8,105 | 7.6%) for women.
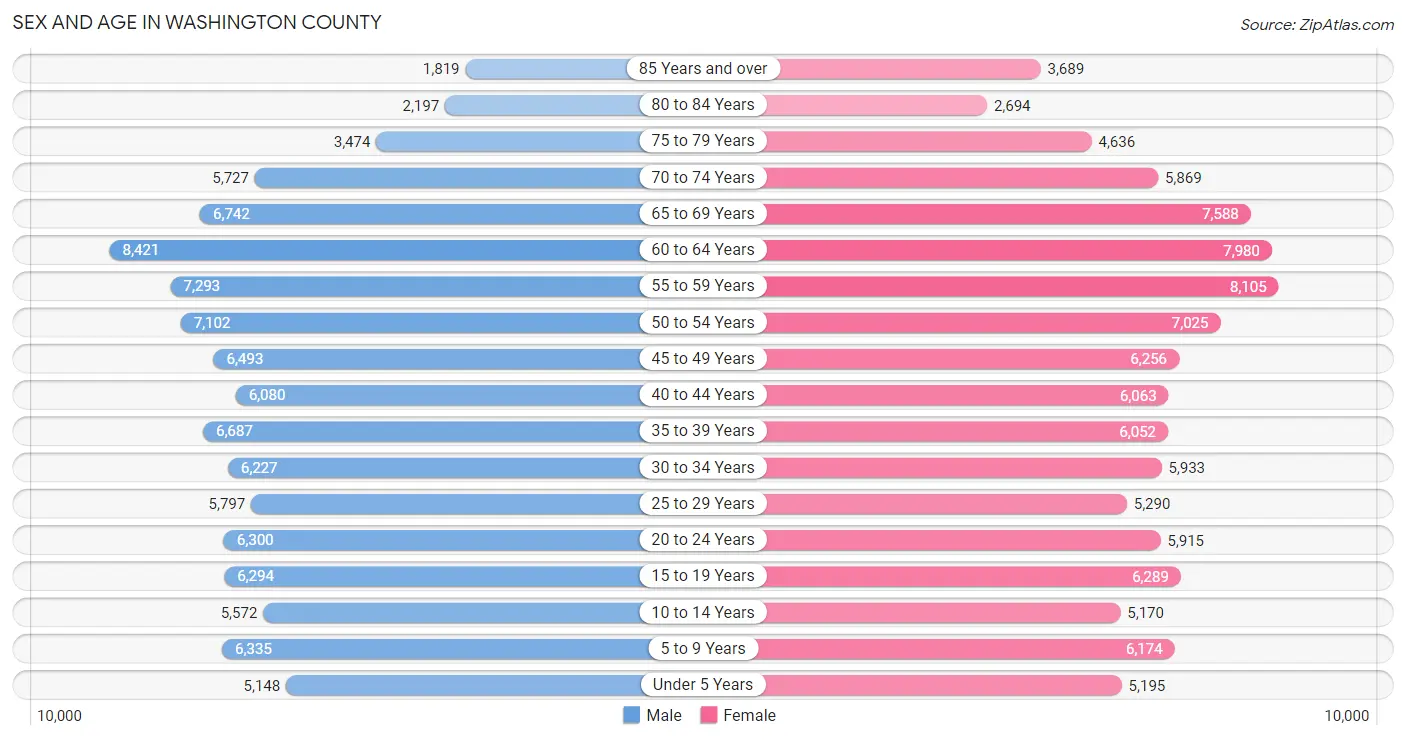
| Age Bracket | Male | Female |
| Under 5 Years | 5,148 (5.0%) | 5,195 (4.9%) |
| 5 to 9 Years | 6,335 (6.1%) | 6,174 (5.8%) |
| 10 to 14 Years | 5,572 (5.4%) | 5,170 (4.9%) |
| 15 to 19 Years | 6,294 (6.1%) | 6,289 (5.9%) |
| 20 to 24 Years | 6,300 (6.1%) | 5,915 (5.6%) |
| 25 to 29 Years | 5,797 (5.6%) | 5,290 (5.0%) |
| 30 to 34 Years | 6,227 (6.0%) | 5,933 (5.6%) |
| 35 to 39 Years | 6,687 (6.5%) | 6,052 (5.7%) |
| 40 to 44 Years | 6,080 (5.9%) | 6,063 (5.7%) |
| 45 to 49 Years | 6,493 (6.3%) | 6,256 (5.9%) |
| 50 to 54 Years | 7,102 (6.9%) | 7,025 (6.6%) |
| 55 to 59 Years | 7,293 (7.0%) | 8,105 (7.6%) |
| 60 to 64 Years | 8,421 (8.1%) | 7,980 (7.5%) |
| 65 to 69 Years | 6,742 (6.5%) | 7,588 (7.2%) |
| 70 to 74 Years | 5,727 (5.5%) | 5,869 (5.5%) |
| 75 to 79 Years | 3,474 (3.4%) | 4,636 (4.4%) |
| 80 to 84 Years | 2,197 (2.1%) | 2,694 (2.5%) |
| 85 Years and over | 1,819 (1.8%) | 3,689 (3.5%) |
| Total | 103,708 (100.0%) | 105,923 (100.0%) |
Families and Households in Washington County
Median Family Size in Washington County
The median family size in Washington County is 2.94 persons per family, with married-couple families (43,586 | 78.9%) accounting for the largest median family size of 2.97 persons per family. On the other hand, single male/father families (3,460 | 6.3%) represent the smallest median family size with 2.68 persons per family.
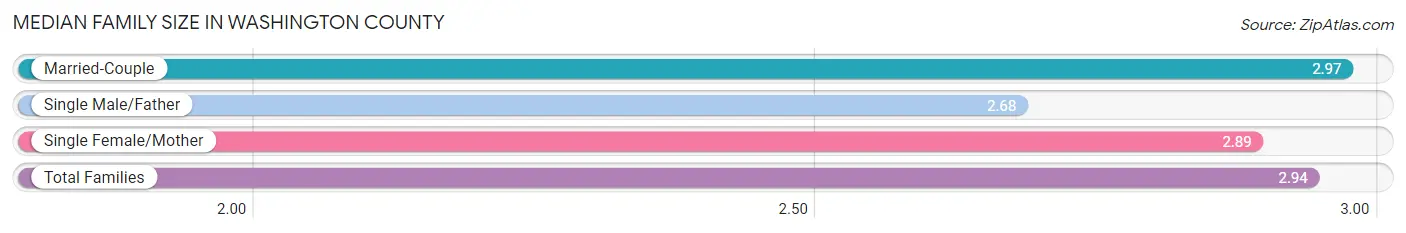
| Family Type | # Families | Family Size |
| Married-Couple | 43,586 (78.9%) | 2.97 |
| Single Male/Father | 3,460 (6.3%) | 2.68 |
| Single Female/Mother | 8,227 (14.9%) | 2.89 |
| Total Families | 55,273 (100.0%) | 2.94 |
Median Household Size in Washington County
The median household size in Washington County is 2.34 persons per household, with single female/mother households (8,227 | 9.4%) accounting for the largest median household size of 3.1 persons per household. non-family households (31,927 | 36.6%) represent the smallest median household size with 1.19 persons per household.
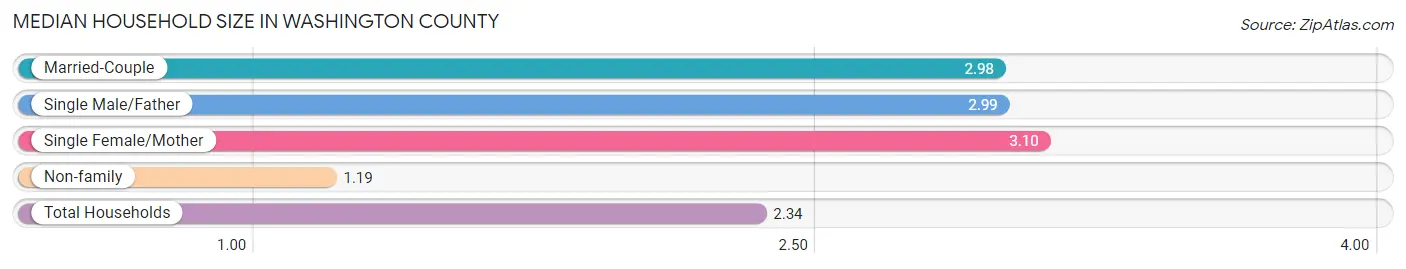
| Household Type | # Households | Household Size |
| Married-Couple | 43,586 (50.0%) | 2.98 |
| Single Male/Father | 3,460 (4.0%) | 2.99 |
| Single Female/Mother | 8,227 (9.4%) | 3.10 |
| Non-family | 31,927 (36.6%) | 1.19 |
| Total Households | 87,200 (100.0%) | 2.34 |
Household Size by Marriage Status in Washington County
Out of a total of 87,200 households in Washington County, 55,273 (63.4%) are family households, while 31,927 (36.6%) are nonfamily households. The most numerous type of family households are 2-person households, comprising 28,338, and the most common type of nonfamily households are 1-person households, comprising 26,847.
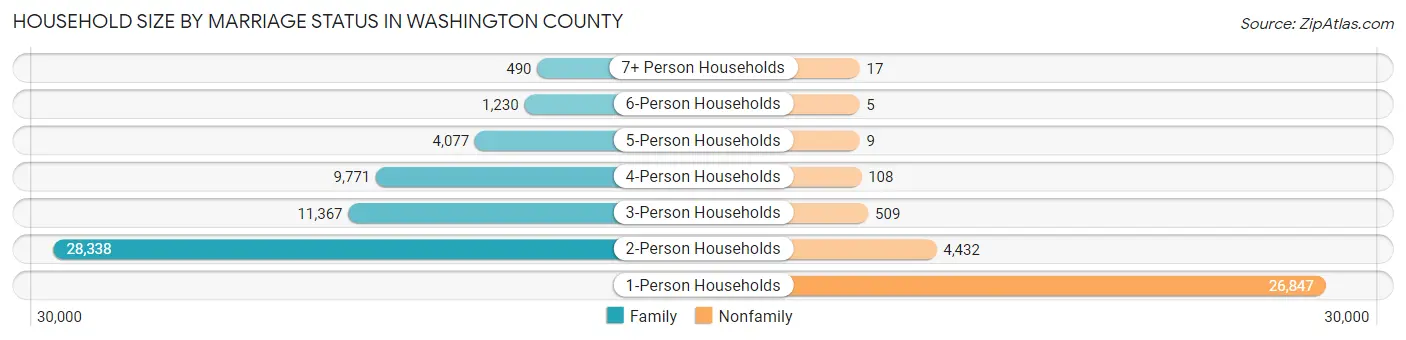
| Household Size | Family Households | Nonfamily Households |
| 1-Person Households | - | 26,847 (30.8%) |
| 2-Person Households | 28,338 (32.5%) | 4,432 (5.1%) |
| 3-Person Households | 11,367 (13.0%) | 509 (0.6%) |
| 4-Person Households | 9,771 (11.2%) | 108 (0.1%) |
| 5-Person Households | 4,077 (4.7%) | 9 (0.0%) |
| 6-Person Households | 1,230 (1.4%) | 5 (0.0%) |
| 7+ Person Households | 490 (0.6%) | 17 (0.0%) |
| Total | 55,273 (63.4%) | 31,927 (36.6%) |
Female Fertility in Washington County
Fertility by Age in Washington County
Average fertility rate in Washington County is 41.0 births per 1,000 women. Women in the age bracket of 20 to 34 years have the highest fertility rate with 90.0 births per 1,000 women. Women in the age bracket of 20 to 34 years acount for 86.9% of all women with births.
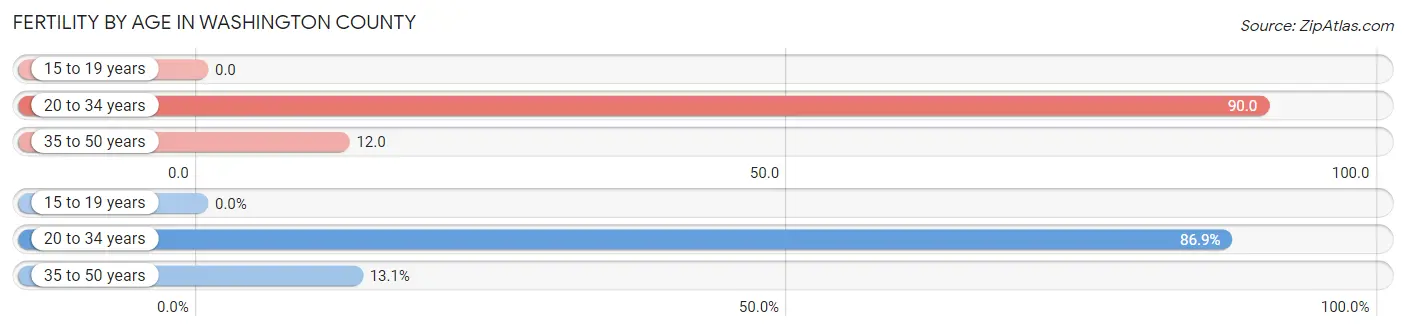
| Age Bracket | Women with Births | Births / 1,000 Women |
| 15 to 19 years | 0 (0.0%) | 0.0 |
| 20 to 34 years | 1,550 (86.9%) | 90.0 |
| 35 to 50 years | 234 (13.1%) | 12.0 |
| Total | 1,784 (100.0%) | 41.0 |
Fertility by Age by Marriage Status in Washington County
83.0% of women with births (1,784) in Washington County are married. The highest percentage of unmarried women with births falls into 35 to 50 years age bracket with 22.2% of them unmarried at the time of birth, while the lowest percentage of unmarried women with births belong to 20 to 34 years age bracket with 16.3% of them unmarried.
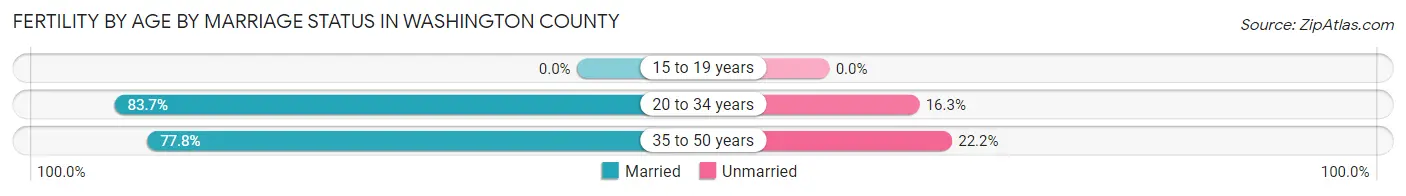
| Age Bracket | Married | Unmarried |
| 15 to 19 years | 0 (0.0%) | 0 (0.0%) |
| 20 to 34 years | 1,297 (83.7%) | 253 (16.3%) |
| 35 to 50 years | 182 (77.8%) | 52 (22.2%) |
| Total | 1,481 (83.0%) | 303 (17.0%) |
Fertility by Education in Washington County
Average fertility rate in Washington County is 41.0 births per 1,000 women. Women with the education attainment of graduate degree have the highest fertility rate of 89.0 births per 1,000 women, while women with the education attainment of less than high school have the lowest fertility at 21.0 births per 1,000 women. Women with the education attainment of college or associate's degree represent 40.3% of all women with births.
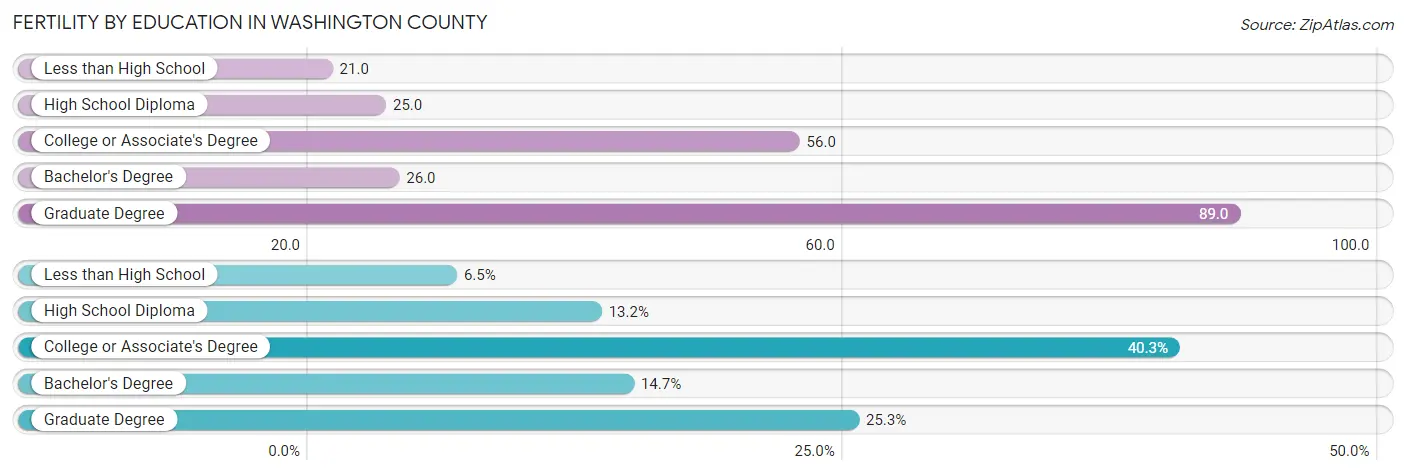
| Educational Attainment | Women with Births | Births / 1,000 Women |
| Less than High School | 115 (6.5%) | 21.0 |
| High School Diploma | 236 (13.2%) | 25.0 |
| College or Associate's Degree | 719 (40.3%) | 56.0 |
| Bachelor's Degree | 263 (14.7%) | 26.0 |
| Graduate Degree | 451 (25.3%) | 89.0 |
| Total | 1,784 (100.0%) | 41.0 |
Fertility by Education by Marriage Status in Washington County
17.0% of women with births in Washington County are unmarried. Women with the educational attainment of graduate degree are most likely to be married with 100.0% of them married at childbirth, while women with the educational attainment of less than high school are least likely to be married with 34.8% of them unmarried at childbirth.
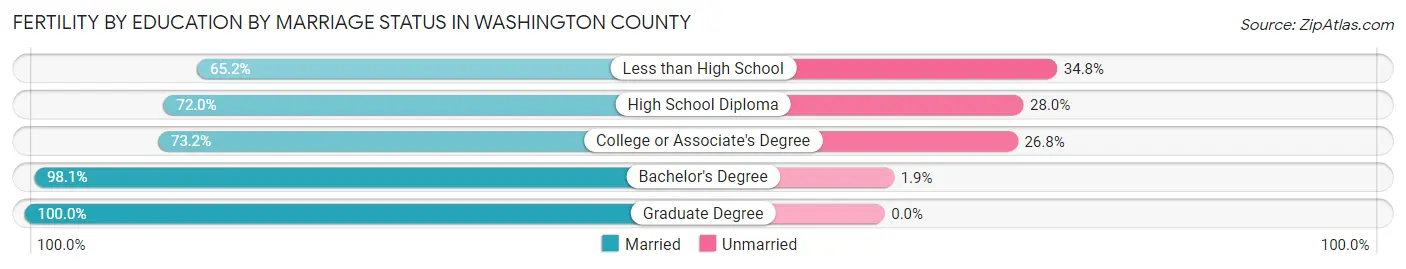
| Educational Attainment | Married | Unmarried |
| Less than High School | 75 (65.2%) | 40 (34.8%) |
| High School Diploma | 170 (72.0%) | 66 (28.0%) |
| College or Associate's Degree | 526 (73.2%) | 193 (26.8%) |
| Bachelor's Degree | 258 (98.1%) | 5 (1.9%) |
| Graduate Degree | 451 (100.0%) | 0 (0.0%) |
| Total | 1,481 (83.0%) | 303 (17.0%) |
Employment Characteristics in Washington County
Employment by Class of Employer in Washington County
Among the 100,001 employed individuals in Washington County, private company employees (70,274 | 70.3%), not-for-profit organizations (11,421 | 11.4%), and local government employees (5,578 | 5.6%) make up the most common classes of employment.
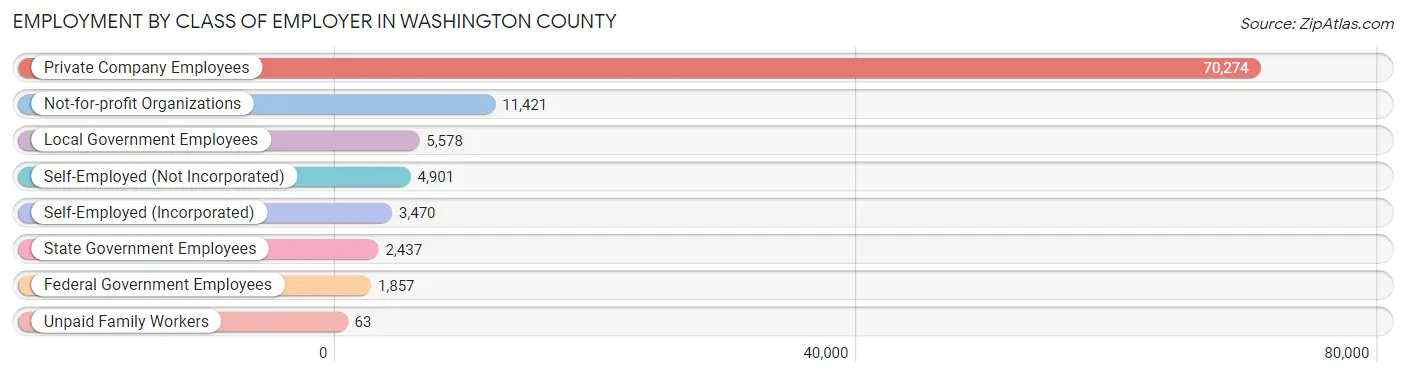
| Employer Class | # Employees | % Employees |
| Private Company Employees | 70,274 | 70.3% |
| Self-Employed (Incorporated) | 3,470 | 3.5% |
| Self-Employed (Not Incorporated) | 4,901 | 4.9% |
| Not-for-profit Organizations | 11,421 | 11.4% |
| Local Government Employees | 5,578 | 5.6% |
| State Government Employees | 2,437 | 2.4% |
| Federal Government Employees | 1,857 | 1.9% |
| Unpaid Family Workers | 63 | 0.1% |
| Total | 100,001 | 100.0% |
Employment Status by Age in Washington County
According to the labor force statistics for Washington County, out of the total population over 16 years of age (173,553), 62.1% or 107,776 individuals are in the labor force, with 5.0% or 5,389 of them unemployed. The age group with the highest labor force participation rate is 25 to 29 years, with 87.5% or 9,701 individuals in the labor force. Within the labor force, the 16 to 19 years age range has the highest percentage of unemployed individuals, with 12.2% or 636 of them being unemployed.
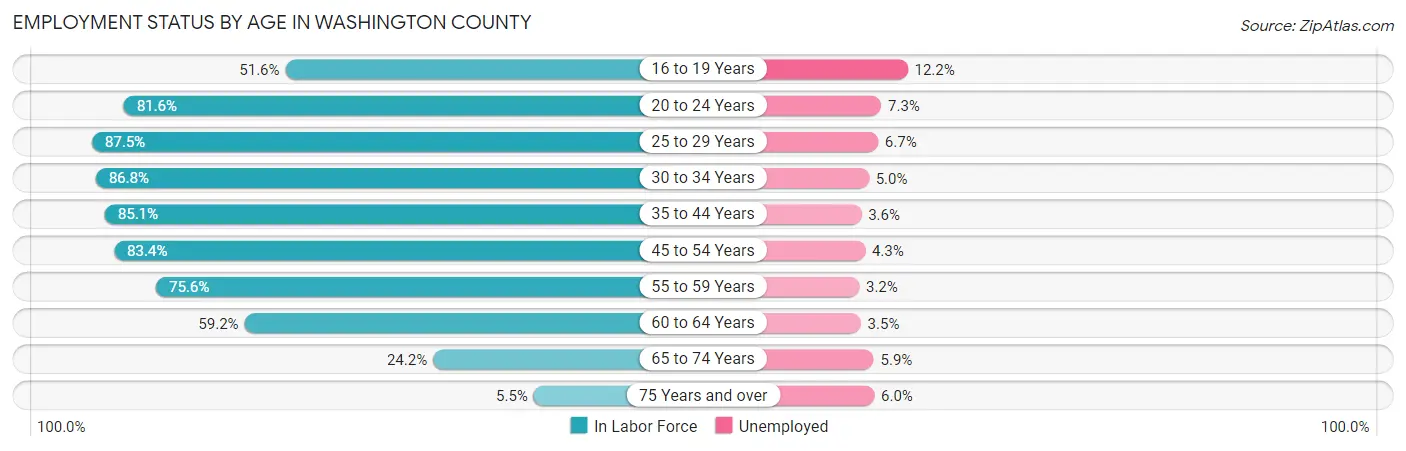
| Age Bracket | In Labor Force | Unemployed |
| 16 to 19 Years | 5,211 (51.6%) | 636 (12.2%) |
| 20 to 24 Years | 9,967 (81.6%) | 728 (7.3%) |
| 25 to 29 Years | 9,701 (87.5%) | 650 (6.7%) |
| 30 to 34 Years | 10,555 (86.8%) | 528 (5.0%) |
| 35 to 44 Years | 21,175 (85.1%) | 762 (3.6%) |
| 45 to 54 Years | 22,415 (83.4%) | 964 (4.3%) |
| 55 to 59 Years | 11,641 (75.6%) | 373 (3.2%) |
| 60 to 64 Years | 9,709 (59.2%) | 340 (3.5%) |
| 65 to 74 Years | 6,274 (24.2%) | 370 (5.9%) |
| 75 Years and over | 1,018 (5.5%) | 61 (6.0%) |
| Total | 107,776 (62.1%) | 5,389 (5.0%) |
Employment Status by Educational Attainment in Washington County
According to labor force statistics for Washington County, 79.8% of individuals (85,230) out of the total population between 25 and 64 years of age (106,804) are in the labor force, with 4.2% or 3,580 of them being unemployed. The group with the highest labor force participation rate are those with the educational attainment of bachelor's degree or higher, with 89.5% or 34,285 individuals in the labor force. Within the labor force, individuals with less than high school education have the highest percentage of unemployment, with 9.5% or 243 of them being unemployed.
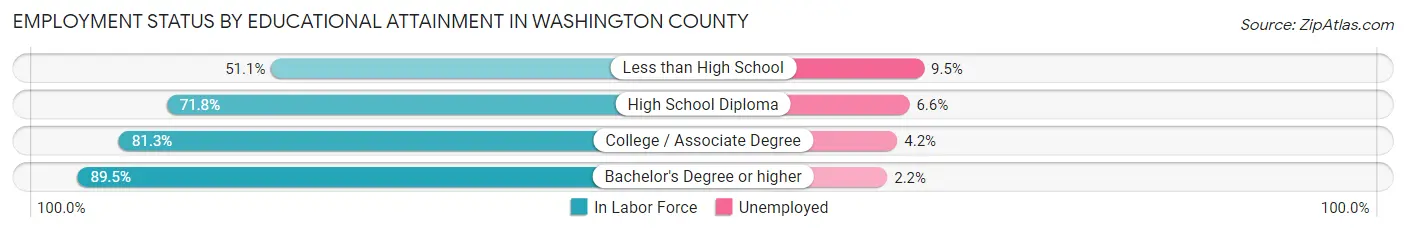
| Educational Attainment | In Labor Force | Unemployed |
| Less than High School | 2,553 (51.1%) | 475 (9.5%) |
| High School Diploma | 24,359 (71.8%) | 2,239 (6.6%) |
| College / Associate Degree | 24,044 (81.3%) | 1,242 (4.2%) |
| Bachelor's Degree or higher | 34,285 (89.5%) | 843 (2.2%) |
| Total | 85,230 (79.8%) | 4,486 (4.2%) |
Employment Occupations by Sex in Washington County
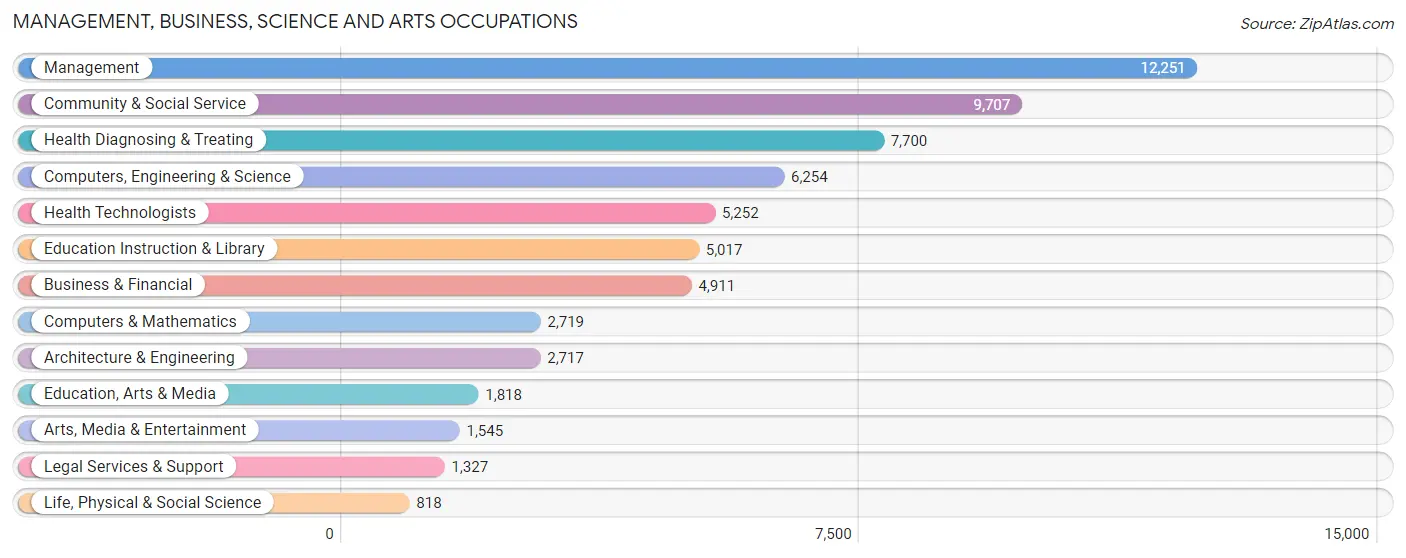
Management, Business, Science and Arts Occupations
The most common Management, Business, Science and Arts occupations in Washington County are Management (12,251 | 12.0%), Community & Social Service (9,707 | 9.5%), Health Diagnosing & Treating (7,700 | 7.5%), Computers, Engineering & Science (6,254 | 6.1%), and Health Technologists (5,252 | 5.1%).
Management, Business, Science and Arts Occupations by Sex
Within the Management, Business, Science and Arts occupations in Washington County, the most male-oriented occupations are Architecture & Engineering (78.9%), Computers & Mathematics (76.8%), and Computers, Engineering & Science (76.5%), while the most female-oriented occupations are Health Diagnosing & Treating (75.9%), Health Technologists (75.6%), and Education Instruction & Library (73.3%).
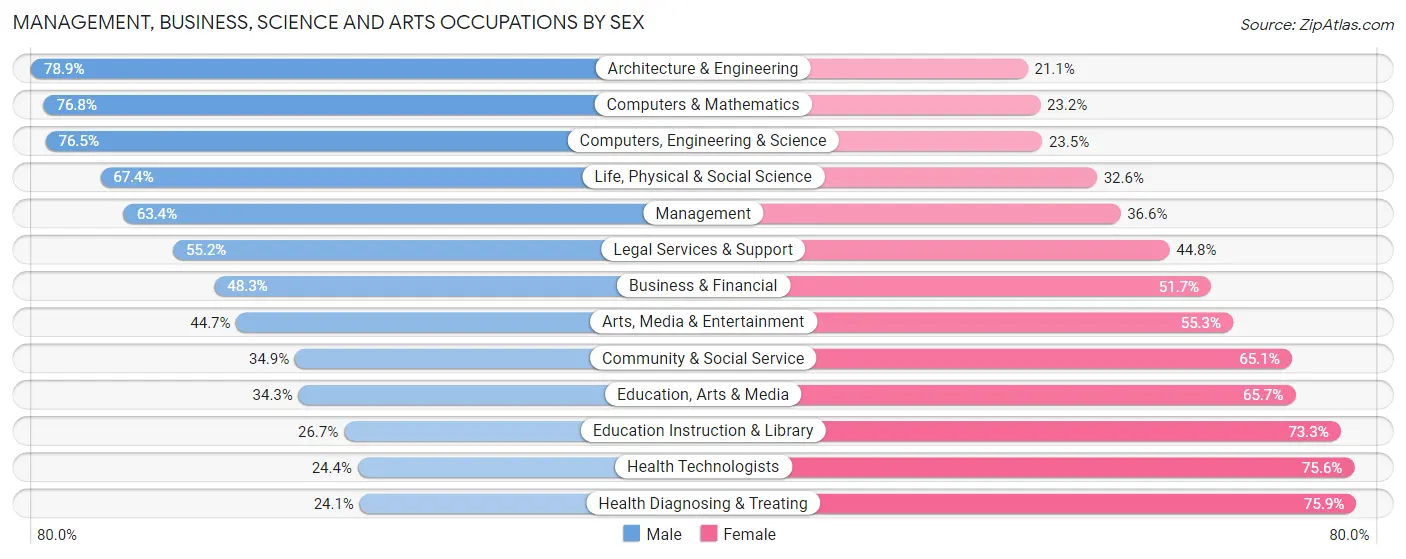
| Occupation | Male | Female |
| Management | 7,772 (63.4%) | 4,479 (36.6%) |
| Business & Financial | 2,373 (48.3%) | 2,538 (51.7%) |
| Computers, Engineering & Science | 4,784 (76.5%) | 1,470 (23.5%) |
| Computers & Mathematics | 2,089 (76.8%) | 630 (23.2%) |
| Architecture & Engineering | 2,144 (78.9%) | 573 (21.1%) |
| Life, Physical & Social Science | 551 (67.4%) | 267 (32.6%) |
| Community & Social Service | 3,385 (34.9%) | 6,322 (65.1%) |
| Education, Arts & Media | 623 (34.3%) | 1,195 (65.7%) |
| Legal Services & Support | 733 (55.2%) | 594 (44.8%) |
| Education Instruction & Library | 1,339 (26.7%) | 3,678 (73.3%) |
| Arts, Media & Entertainment | 690 (44.7%) | 855 (55.3%) |
| Health Diagnosing & Treating | 1,854 (24.1%) | 5,846 (75.9%) |
| Health Technologists | 1,282 (24.4%) | 3,970 (75.6%) |
| Total (Category) | 20,168 (49.4%) | 20,655 (50.6%) |
| Total (Overall) | 54,354 (53.2%) | 47,794 (46.8%) |
Services Occupations
The most common Services occupations in Washington County are Food Preparation & Serving (4,996 | 4.9%), Cleaning & Maintenance (3,504 | 3.4%), Healthcare Support (3,429 | 3.4%), Personal Care & Service (2,926 | 2.9%), and Security & Protection (1,637 | 1.6%).

Services Occupations by Sex
Within the Services occupations in Washington County, the most male-oriented occupations are Law Enforcement (95.6%), Security & Protection (86.4%), and Firefighting & Prevention (77.8%), while the most female-oriented occupations are Healthcare Support (91.9%), Personal Care & Service (78.2%), and Food Preparation & Serving (64.2%).
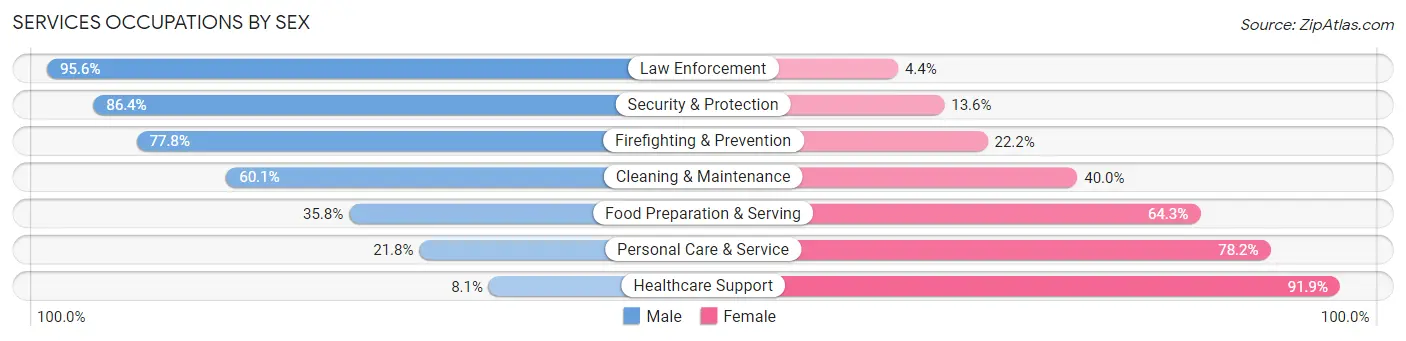
| Occupation | Male | Female |
| Healthcare Support | 277 (8.1%) | 3,152 (91.9%) |
| Security & Protection | 1,414 (86.4%) | 223 (13.6%) |
| Firefighting & Prevention | 660 (77.8%) | 188 (22.2%) |
| Law Enforcement | 754 (95.6%) | 35 (4.4%) |
| Food Preparation & Serving | 1,786 (35.7%) | 3,210 (64.2%) |
| Cleaning & Maintenance | 2,104 (60.1%) | 1,400 (40.0%) |
| Personal Care & Service | 639 (21.8%) | 2,287 (78.2%) |
| Total (Category) | 6,220 (37.7%) | 10,272 (62.3%) |
| Total (Overall) | 54,354 (53.2%) | 47,794 (46.8%) |
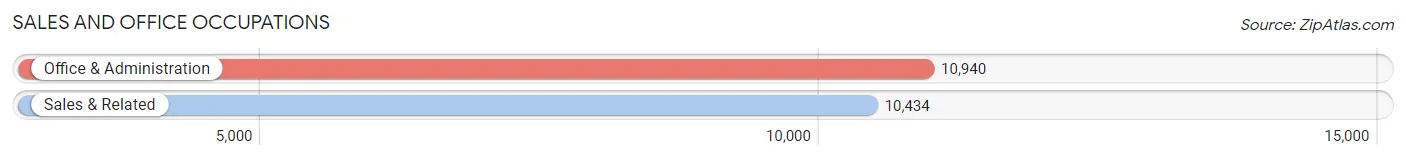
Sales and Office Occupations
The most common Sales and Office occupations in Washington County are Office & Administration (10,940 | 10.7%), and Sales & Related (10,434 | 10.2%).
Sales and Office Occupations by Sex
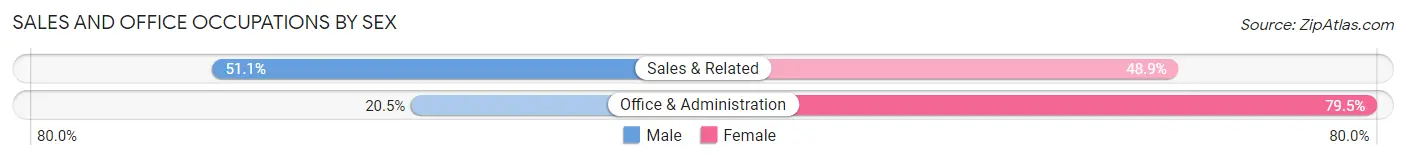
| Occupation | Male | Female |
| Sales & Related | 5,331 (51.1%) | 5,103 (48.9%) |
| Office & Administration | 2,245 (20.5%) | 8,695 (79.5%) |
| Total (Category) | 7,576 (35.4%) | 13,798 (64.6%) |
| Total (Overall) | 54,354 (53.2%) | 47,794 (46.8%) |
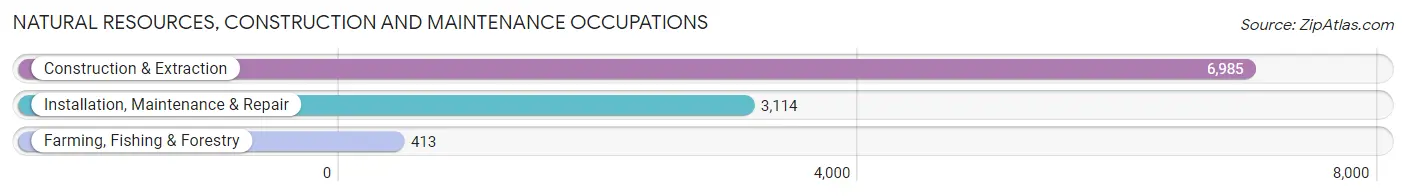
Natural Resources, Construction and Maintenance Occupations
The most common Natural Resources, Construction and Maintenance occupations in Washington County are Construction & Extraction (6,985 | 6.8%), Installation, Maintenance & Repair (3,114 | 3.0%), and Farming, Fishing & Forestry (413 | 0.4%).
Natural Resources, Construction and Maintenance Occupations by Sex
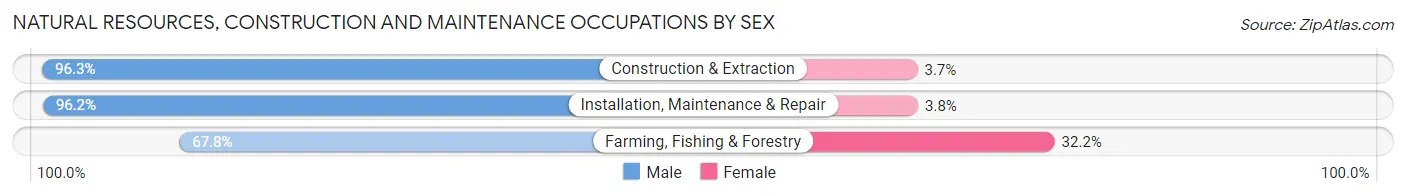
| Occupation | Male | Female |
| Farming, Fishing & Forestry | 280 (67.8%) | 133 (32.2%) |
| Construction & Extraction | 6,729 (96.3%) | 256 (3.7%) |
| Installation, Maintenance & Repair | 2,996 (96.2%) | 118 (3.8%) |
| Total (Category) | 10,005 (95.2%) | 507 (4.8%) |
| Total (Overall) | 54,354 (53.2%) | 47,794 (46.8%) |
Production, Transportation and Moving Occupations
The most common Production, Transportation and Moving occupations in Washington County are Production (5,061 | 5.0%), Transportation (4,244 | 4.2%), and Material Moving (3,642 | 3.6%).
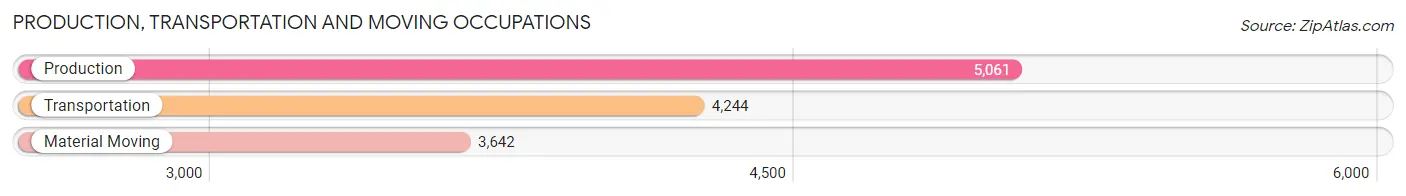
Production, Transportation and Moving Occupations by Sex
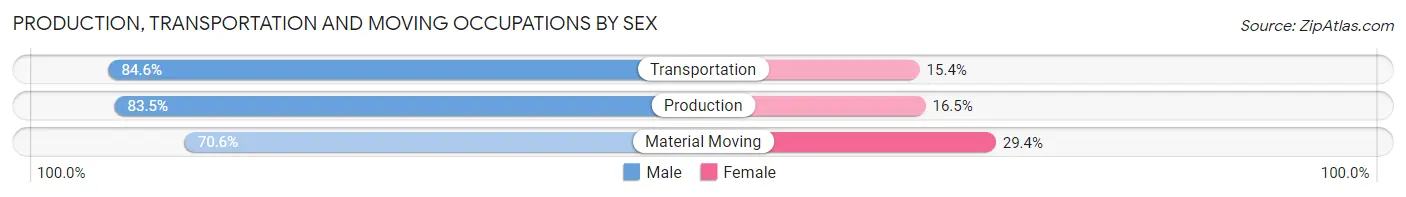
| Occupation | Male | Female |
| Production | 4,225 (83.5%) | 836 (16.5%) |
| Transportation | 3,589 (84.6%) | 655 (15.4%) |
| Material Moving | 2,571 (70.6%) | 1,071 (29.4%) |
| Total (Category) | 10,385 (80.2%) | 2,562 (19.8%) |
| Total (Overall) | 54,354 (53.2%) | 47,794 (46.8%) |
Employment Industries by Sex in Washington County
Employment Industries in Washington County
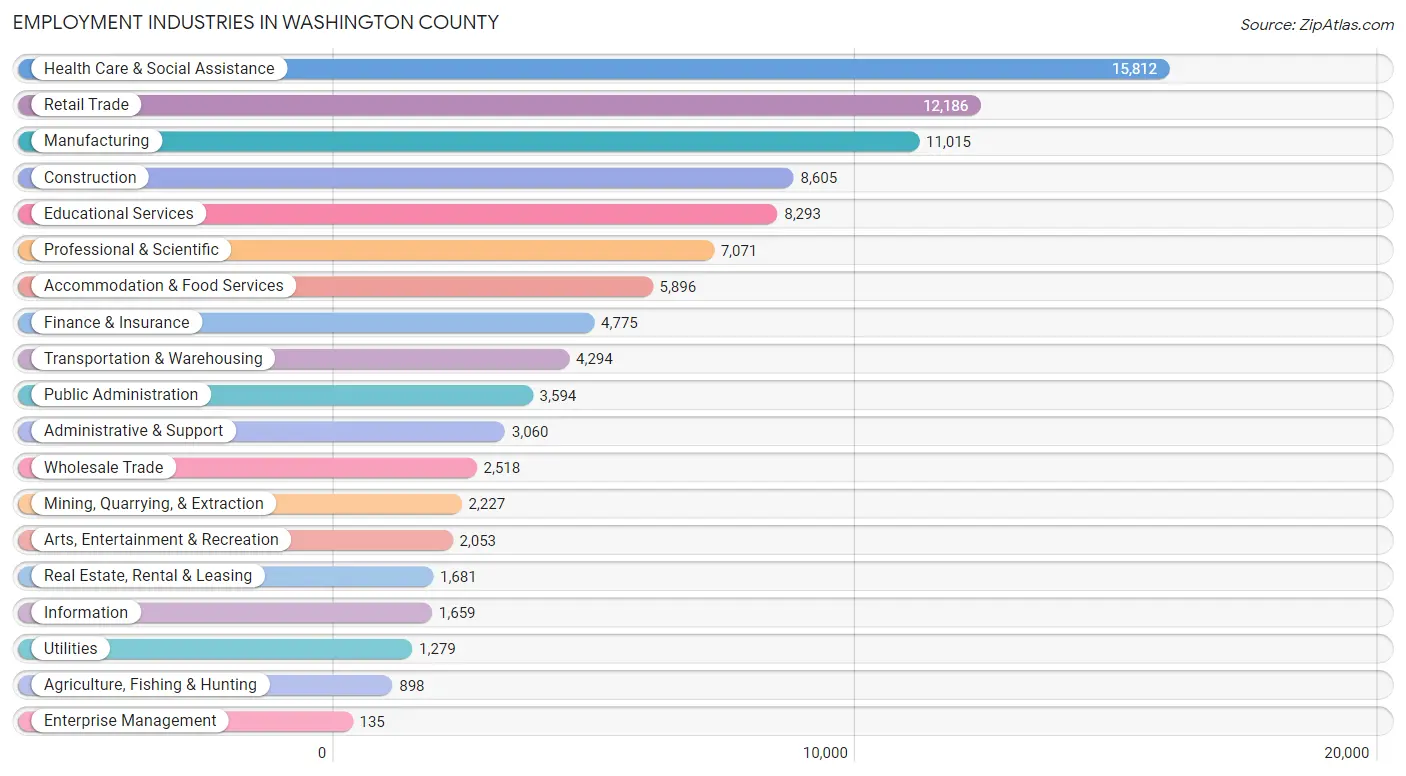
The major employment industries in Washington County include Health Care & Social Assistance (15,812 | 15.5%), Retail Trade (12,186 | 11.9%), Manufacturing (11,015 | 10.8%), Construction (8,605 | 8.4%), and Educational Services (8,293 | 8.1%).
Employment Industries by Sex in Washington County
The Washington County industries that see more men than women are Construction (89.9%), Mining, Quarrying, & Extraction (87.2%), and Enterprise Management (78.5%), whereas the industries that tend to have a higher number of women are Health Care & Social Assistance (80.6%), Educational Services (66.2%), and Finance & Insurance (59.7%).
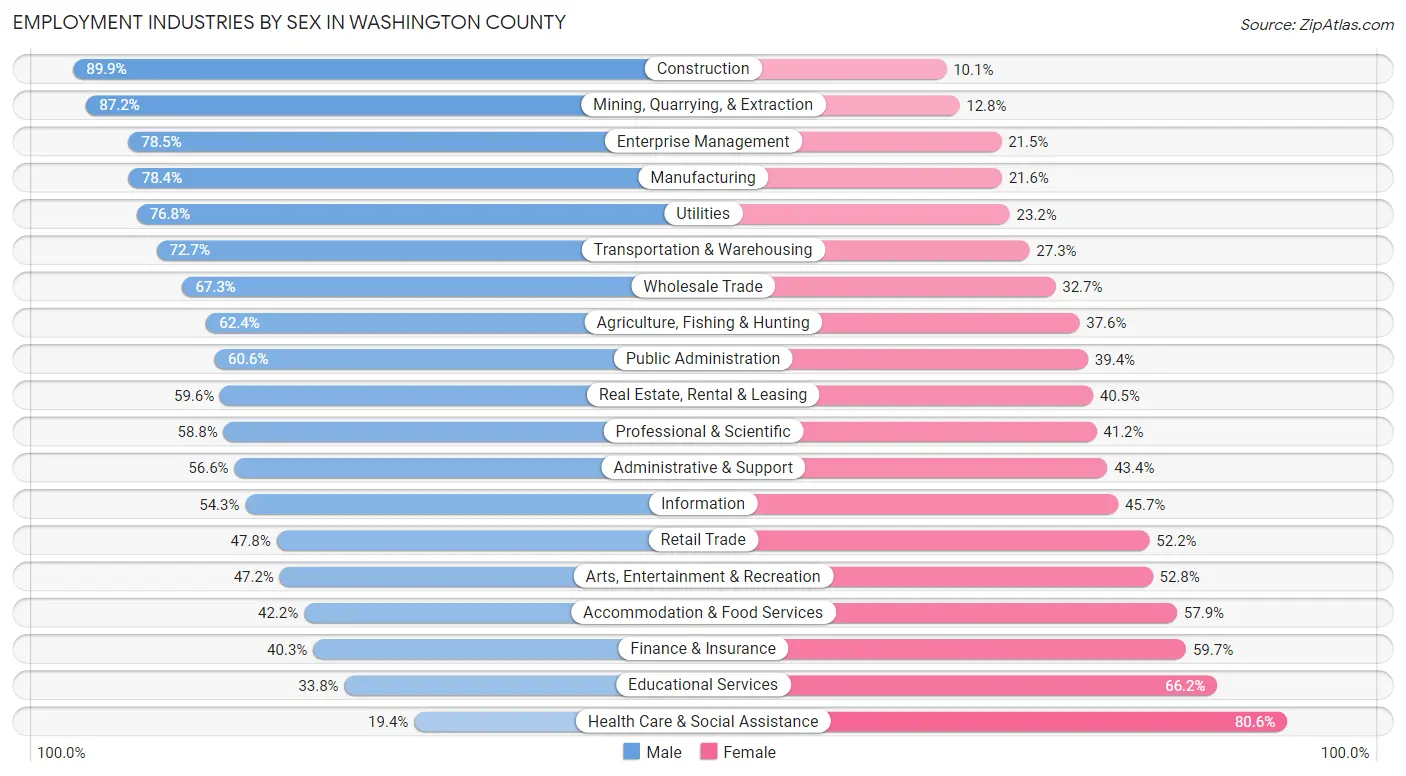
| Industry | Male | Female |
| Agriculture, Fishing & Hunting | 560 (62.4%) | 338 (37.6%) |
| Mining, Quarrying, & Extraction | 1,942 (87.2%) | 285 (12.8%) |
| Construction | 7,736 (89.9%) | 869 (10.1%) |
| Manufacturing | 8,638 (78.4%) | 2,377 (21.6%) |
| Wholesale Trade | 1,695 (67.3%) | 823 (32.7%) |
| Retail Trade | 5,830 (47.8%) | 6,356 (52.2%) |
| Transportation & Warehousing | 3,121 (72.7%) | 1,173 (27.3%) |
| Utilities | 982 (76.8%) | 297 (23.2%) |
| Information | 901 (54.3%) | 758 (45.7%) |
| Finance & Insurance | 1,923 (40.3%) | 2,852 (59.7%) |
| Real Estate, Rental & Leasing | 1,001 (59.6%) | 680 (40.5%) |
| Professional & Scientific | 4,159 (58.8%) | 2,912 (41.2%) |
| Enterprise Management | 106 (78.5%) | 29 (21.5%) |
| Administrative & Support | 1,731 (56.6%) | 1,329 (43.4%) |
| Educational Services | 2,803 (33.8%) | 5,490 (66.2%) |
| Health Care & Social Assistance | 3,062 (19.4%) | 12,750 (80.6%) |
| Arts, Entertainment & Recreation | 969 (47.2%) | 1,084 (52.8%) |
| Accommodation & Food Services | 2,485 (42.1%) | 3,411 (57.9%) |
| Public Administration | 2,177 (60.6%) | 1,417 (39.4%) |
| Total | 54,354 (53.2%) | 47,794 (46.8%) |
Education in Washington County
School Enrollment in Washington County
The most common levels of schooling among the 43,238 students in Washington County are high school (9,580 | 22.2%), elementary school (9,496 | 22.0%), and college / undergraduate (8,458 | 19.6%).
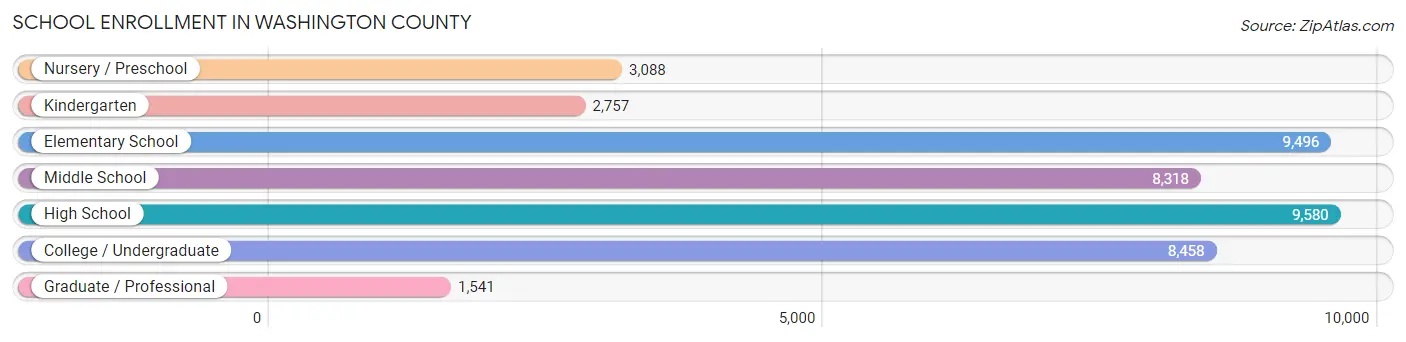
| School Level | # Students | % Students |
| Nursery / Preschool | 3,088 | 7.1% |
| Kindergarten | 2,757 | 6.4% |
| Elementary School | 9,496 | 22.0% |
| Middle School | 8,318 | 19.2% |
| High School | 9,580 | 22.2% |
| College / Undergraduate | 8,458 | 19.6% |
| Graduate / Professional | 1,541 | 3.6% |
| Total | 43,238 | 100.0% |
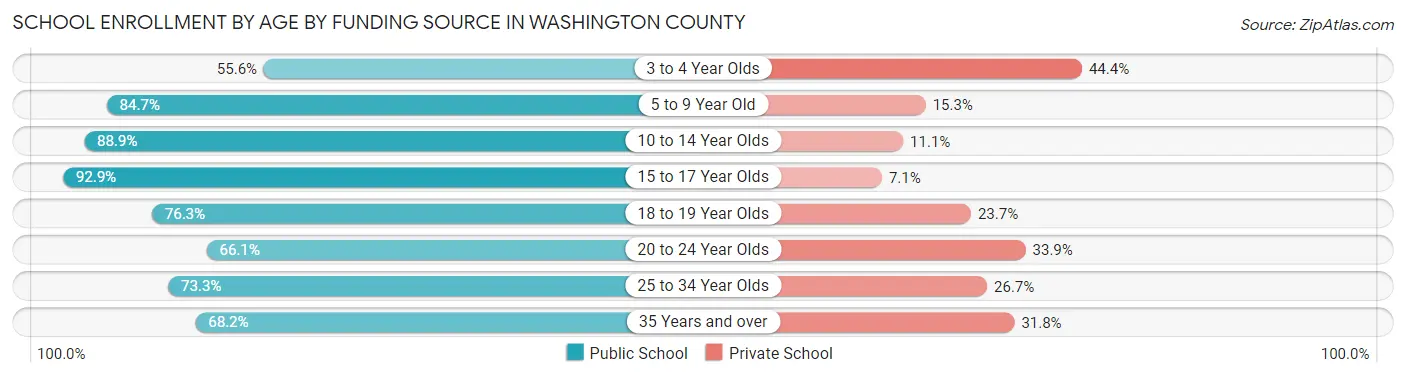
School Enrollment by Age by Funding Source in Washington County
Out of a total of 43,238 students who are enrolled in schools in Washington County, 7,826 (18.1%) attend a private institution, while the remaining 35,412 (81.9%) are enrolled in public schools. The age group of 3 to 4 year olds has the highest likelihood of being enrolled in private schools, with 921 (44.4% in the age bracket) enrolled. Conversely, the age group of 15 to 17 year olds has the lowest likelihood of being enrolled in a private school, with 6,611 (92.9% in the age bracket) attending a public institution.
| Age Bracket | Public School | Private School |
| 3 to 4 Year Olds | 1,154 (55.6%) | 921 (44.4%) |
| 5 to 9 Year Old | 9,956 (84.7%) | 1,795 (15.3%) |
| 10 to 14 Year Olds | 9,321 (88.9%) | 1,162 (11.1%) |
| 15 to 17 Year Olds | 6,611 (92.9%) | 508 (7.1%) |
| 18 to 19 Year Olds | 3,134 (76.3%) | 974 (23.7%) |
| 20 to 24 Year Olds | 3,084 (66.1%) | 1,581 (33.9%) |
| 25 to 34 Year Olds | 1,182 (73.3%) | 431 (26.7%) |
| 35 Years and over | 971 (68.2%) | 453 (31.8%) |
| Total | 35,412 (81.9%) | 7,826 (18.1%) |
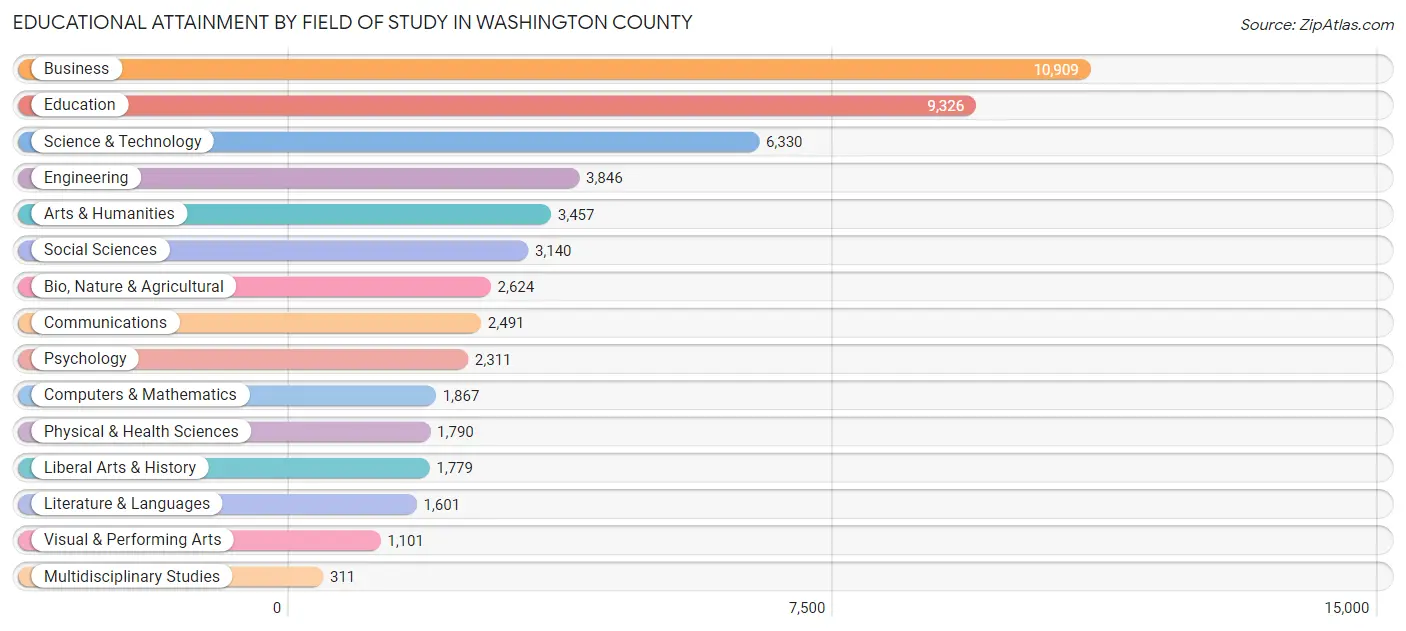
Educational Attainment by Field of Study in Washington County
Business (10,909 | 20.6%), education (9,326 | 17.6%), science & technology (6,330 | 12.0%), engineering (3,846 | 7.3%), and arts & humanities (3,457 | 6.5%) are the most common fields of study among 52,883 individuals in Washington County who have obtained a bachelor's degree or higher.
| Field of Study | # Graduates | % Graduates |
| Computers & Mathematics | 1,867 | 3.5% |
| Bio, Nature & Agricultural | 2,624 | 5.0% |
| Physical & Health Sciences | 1,790 | 3.4% |
| Psychology | 2,311 | 4.4% |
| Social Sciences | 3,140 | 5.9% |
| Engineering | 3,846 | 7.3% |
| Multidisciplinary Studies | 311 | 0.6% |
| Science & Technology | 6,330 | 12.0% |
| Business | 10,909 | 20.6% |
| Education | 9,326 | 17.6% |
| Literature & Languages | 1,601 | 3.0% |
| Liberal Arts & History | 1,779 | 3.4% |
| Visual & Performing Arts | 1,101 | 2.1% |
| Communications | 2,491 | 4.7% |
| Arts & Humanities | 3,457 | 6.5% |
| Total | 52,883 | 100.0% |
Transportation & Commute in Washington County
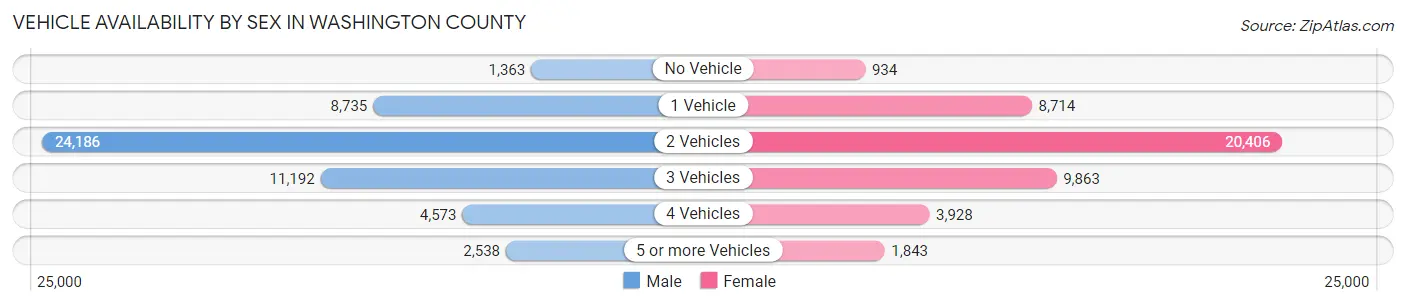
Vehicle Availability by Sex in Washington County
The most prevalent vehicle ownership categories in Washington County are males with 2 vehicles (24,186, accounting for 46.0%) and females with 2 vehicles (20,406, making up 52.9%).
| Vehicles Available | Male | Female |
| No Vehicle | 1,363 (2.6%) | 934 (2.0%) |
| 1 Vehicle | 8,735 (16.6%) | 8,714 (19.1%) |
| 2 Vehicles | 24,186 (46.0%) | 20,406 (44.7%) |
| 3 Vehicles | 11,192 (21.3%) | 9,863 (21.6%) |
| 4 Vehicles | 4,573 (8.7%) | 3,928 (8.6%) |
| 5 or more Vehicles | 2,538 (4.8%) | 1,843 (4.0%) |
| Total | 52,587 (100.0%) | 45,688 (100.0%) |
Commute Time in Washington County
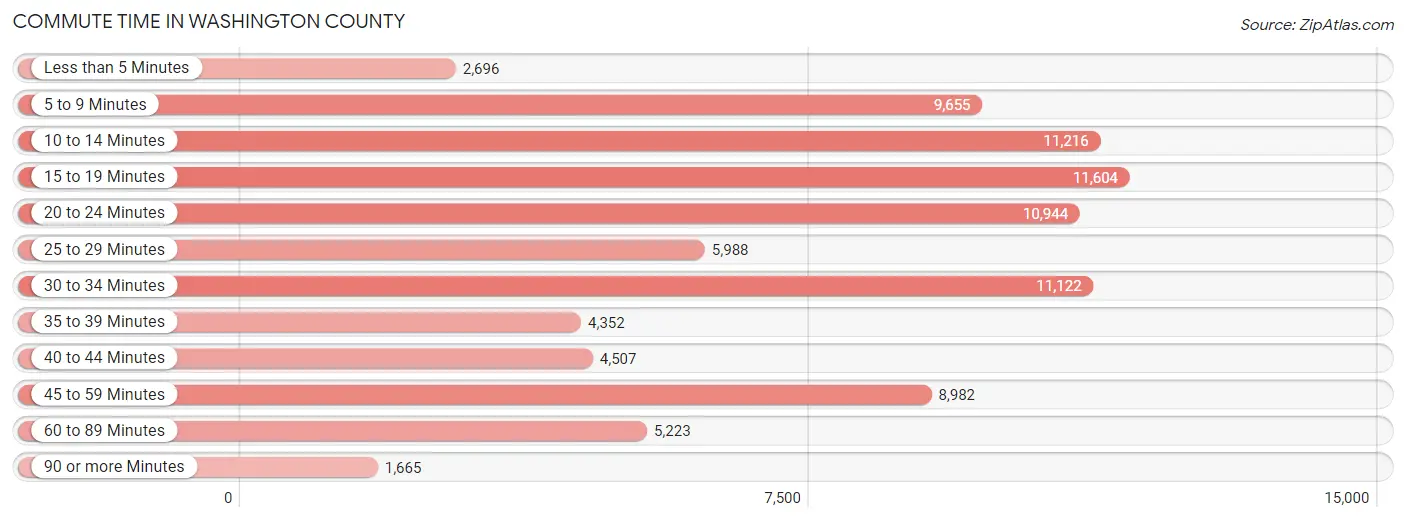
The most frequently occuring commute durations in Washington County are 15 to 19 minutes (11,604 commuters, 13.2%), 10 to 14 minutes (11,216 commuters, 12.8%), and 30 to 34 minutes (11,122 commuters, 12.7%).
| Commute Time | # Commuters | % Commuters |
| Less than 5 Minutes | 2,696 | 3.1% |
| 5 to 9 Minutes | 9,655 | 11.0% |
| 10 to 14 Minutes | 11,216 | 12.8% |
| 15 to 19 Minutes | 11,604 | 13.2% |
| 20 to 24 Minutes | 10,944 | 12.4% |
| 25 to 29 Minutes | 5,988 | 6.8% |
| 30 to 34 Minutes | 11,122 | 12.7% |
| 35 to 39 Minutes | 4,352 | 5.0% |
| 40 to 44 Minutes | 4,507 | 5.1% |
| 45 to 59 Minutes | 8,982 | 10.2% |
| 60 to 89 Minutes | 5,223 | 5.9% |
| 90 or more Minutes | 1,665 | 1.9% |
Commute Time by Sex in Washington County
The most common commute times in Washington County are 30 to 34 minutes (6,720 commuters, 14.2%) for males and 10 to 14 minutes (5,897 commuters, 14.5%) for females.
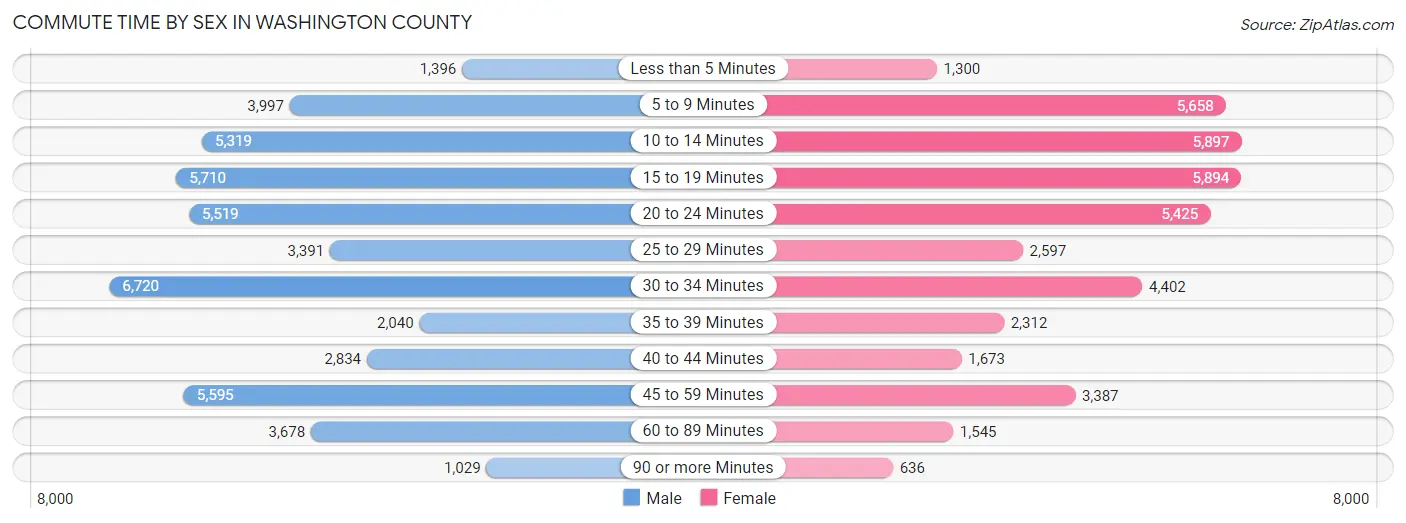
| Commute Time | Male | Female |
| Less than 5 Minutes | 1,396 (3.0%) | 1,300 (3.2%) |
| 5 to 9 Minutes | 3,997 (8.5%) | 5,658 (13.9%) |
| 10 to 14 Minutes | 5,319 (11.3%) | 5,897 (14.5%) |
| 15 to 19 Minutes | 5,710 (12.1%) | 5,894 (14.5%) |
| 20 to 24 Minutes | 5,519 (11.7%) | 5,425 (13.3%) |
| 25 to 29 Minutes | 3,391 (7.2%) | 2,597 (6.4%) |
| 30 to 34 Minutes | 6,720 (14.2%) | 4,402 (10.8%) |
| 35 to 39 Minutes | 2,040 (4.3%) | 2,312 (5.7%) |
| 40 to 44 Minutes | 2,834 (6.0%) | 1,673 (4.1%) |
| 45 to 59 Minutes | 5,595 (11.8%) | 3,387 (8.3%) |
| 60 to 89 Minutes | 3,678 (7.8%) | 1,545 (3.8%) |
| 90 or more Minutes | 1,029 (2.2%) | 636 (1.6%) |
Time of Departure to Work by Sex in Washington County
The most frequent times of departure to work in Washington County are 7:00 AM to 7:29 AM (6,289, 13.3%) for males and 7:30 AM to 7:59 AM (5,382, 13.2%) for females.
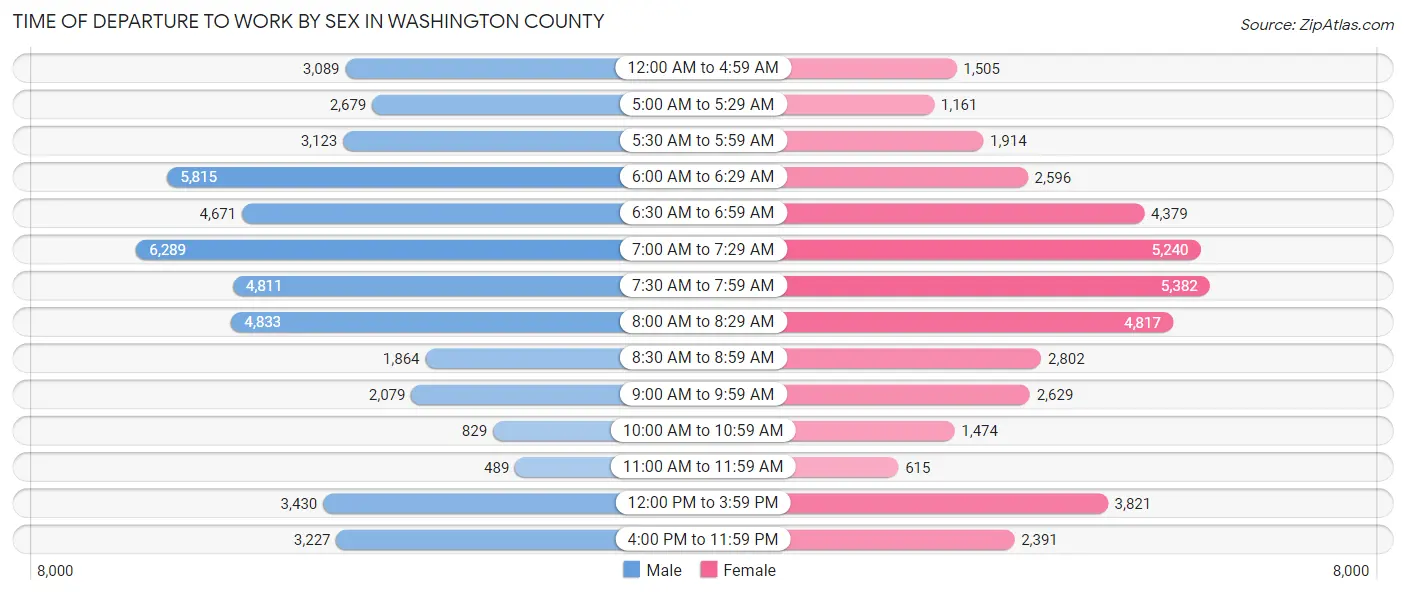
| Time of Departure | Male | Female |
| 12:00 AM to 4:59 AM | 3,089 (6.5%) | 1,505 (3.7%) |
| 5:00 AM to 5:29 AM | 2,679 (5.7%) | 1,161 (2.9%) |
| 5:30 AM to 5:59 AM | 3,123 (6.6%) | 1,914 (4.7%) |
| 6:00 AM to 6:29 AM | 5,815 (12.3%) | 2,596 (6.4%) |
| 6:30 AM to 6:59 AM | 4,671 (9.9%) | 4,379 (10.7%) |
| 7:00 AM to 7:29 AM | 6,289 (13.3%) | 5,240 (12.9%) |
| 7:30 AM to 7:59 AM | 4,811 (10.2%) | 5,382 (13.2%) |
| 8:00 AM to 8:29 AM | 4,833 (10.2%) | 4,817 (11.8%) |
| 8:30 AM to 8:59 AM | 1,864 (4.0%) | 2,802 (6.9%) |
| 9:00 AM to 9:59 AM | 2,079 (4.4%) | 2,629 (6.5%) |
| 10:00 AM to 10:59 AM | 829 (1.8%) | 1,474 (3.6%) |
| 11:00 AM to 11:59 AM | 489 (1.0%) | 615 (1.5%) |
| 12:00 PM to 3:59 PM | 3,430 (7.3%) | 3,821 (9.4%) |
| 4:00 PM to 11:59 PM | 3,227 (6.8%) | 2,391 (5.9%) |
| Total | 47,228 (100.0%) | 40,726 (100.0%) |
Housing Occupancy in Washington County
Occupancy by Ownership in Washington County
Of the total 87,200 dwellings in Washington County, owner-occupied units account for 66,254 (76.0%), while renter-occupied units make up 20,946 (24.0%).
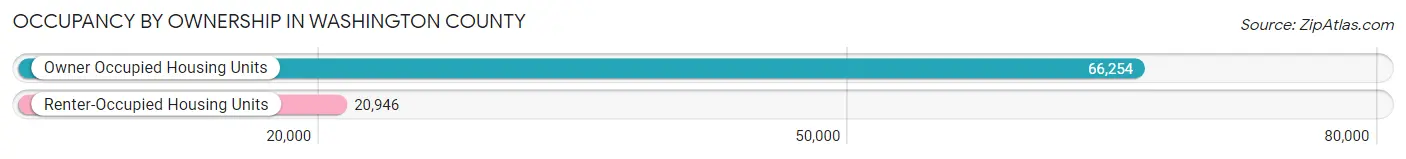
| Occupancy | # Housing Units | % Housing Units |
| Owner Occupied Housing Units | 66,254 | 76.0% |
| Renter-Occupied Housing Units | 20,946 | 24.0% |
| Total Occupied Housing Units | 87,200 | 100.0% |
Occupancy by Household Size in Washington County
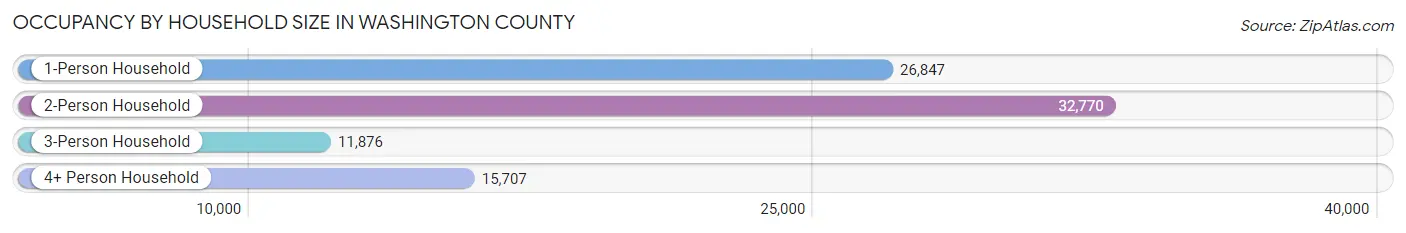
| Household Size | # Housing Units | % Housing Units |
| 1-Person Household | 26,847 | 30.8% |
| 2-Person Household | 32,770 | 37.6% |
| 3-Person Household | 11,876 | 13.6% |
| 4+ Person Household | 15,707 | 18.0% |
| Total Housing Units | 87,200 | 100.0% |
Occupancy by Ownership by Household Size in Washington County
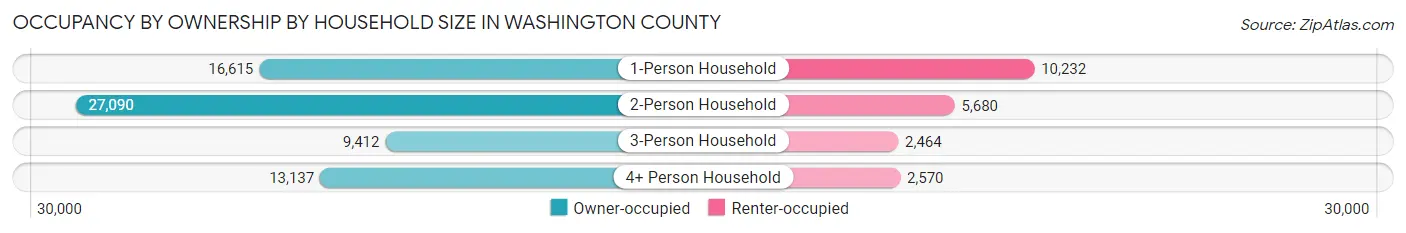
| Household Size | Owner-occupied | Renter-occupied |
| 1-Person Household | 16,615 (61.9%) | 10,232 (38.1%) |
| 2-Person Household | 27,090 (82.7%) | 5,680 (17.3%) |
| 3-Person Household | 9,412 (79.2%) | 2,464 (20.7%) |
| 4+ Person Household | 13,137 (83.6%) | 2,570 (16.4%) |
| Total Housing Units | 66,254 (76.0%) | 20,946 (24.0%) |
Occupancy by Educational Attainment in Washington County
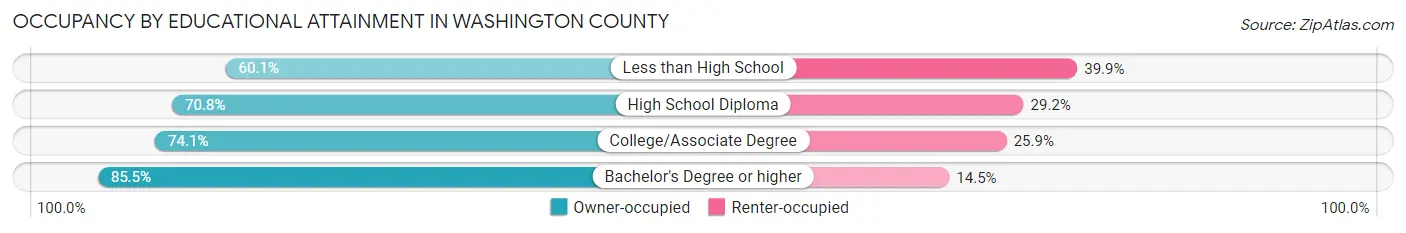
| Household Size | Owner-occupied | Renter-occupied |
| Less than High School | 2,941 (60.1%) | 1,950 (39.9%) |
| High School Diploma | 21,113 (70.8%) | 8,724 (29.2%) |
| College/Associate Degree | 17,292 (74.1%) | 6,041 (25.9%) |
| Bachelor's Degree or higher | 24,908 (85.5%) | 4,231 (14.5%) |
Occupancy by Age of Householder in Washington County
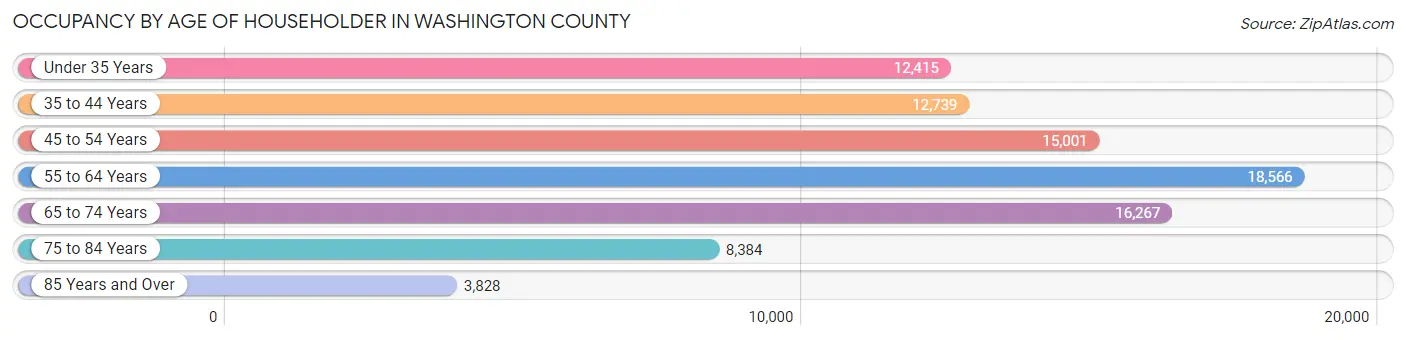
| Age Bracket | # Households | % Households |
| Under 35 Years | 12,415 | 14.2% |
| 35 to 44 Years | 12,739 | 14.6% |
| 45 to 54 Years | 15,001 | 17.2% |
| 55 to 64 Years | 18,566 | 21.3% |
| 65 to 74 Years | 16,267 | 18.6% |
| 75 to 84 Years | 8,384 | 9.6% |
| 85 Years and Over | 3,828 | 4.4% |
| Total | 87,200 | 100.0% |
Housing Finances in Washington County
Median Income by Occupancy in Washington County
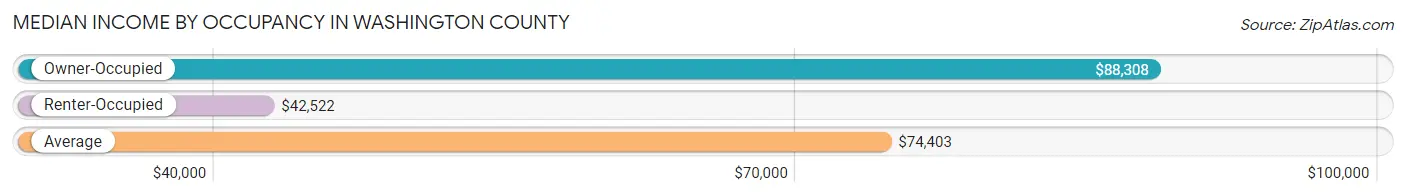
| Occupancy Type | # Households | Median Income |
| Owner-Occupied | 66,254 (76.0%) | $88,308 |
| Renter-Occupied | 20,946 (24.0%) | $42,522 |
| Average | 87,200 (100.0%) | $74,403 |
Occupancy by Householder Income Bracket in Washington County
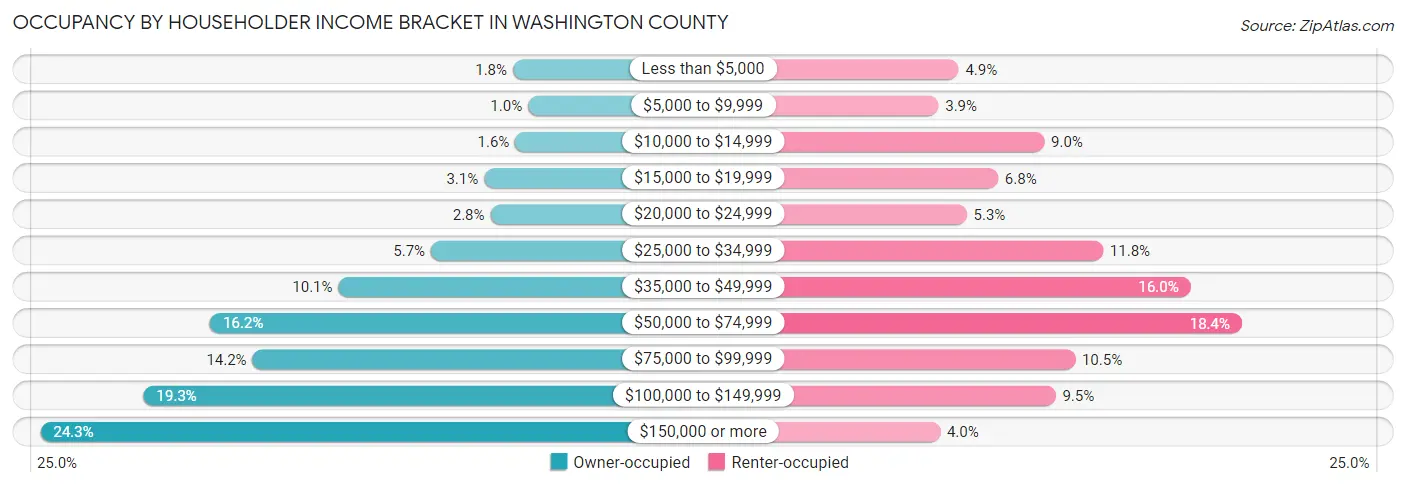
| Income Bracket | Owner-occupied | Renter-occupied |
| Less than $5,000 | 1,161 (1.8%) | 1,027 (4.9%) |
| $5,000 to $9,999 | 682 (1.0%) | 825 (3.9%) |
| $10,000 to $14,999 | 1,089 (1.6%) | 1,880 (9.0%) |
| $15,000 to $19,999 | 2,069 (3.1%) | 1,421 (6.8%) |
| $20,000 to $24,999 | 1,871 (2.8%) | 1,109 (5.3%) |
| $25,000 to $34,999 | 3,742 (5.7%) | 2,467 (11.8%) |
| $35,000 to $49,999 | 6,666 (10.1%) | 3,341 (16.0%) |
| $50,000 to $74,999 | 10,715 (16.2%) | 3,852 (18.4%) |
| $75,000 to $99,999 | 9,376 (14.1%) | 2,188 (10.4%) |
| $100,000 to $149,999 | 12,815 (19.3%) | 1,995 (9.5%) |
| $150,000 or more | 16,068 (24.2%) | 841 (4.0%) |
| Total | 66,254 (100.0%) | 20,946 (100.0%) |
Monthly Housing Cost Tiers in Washington County
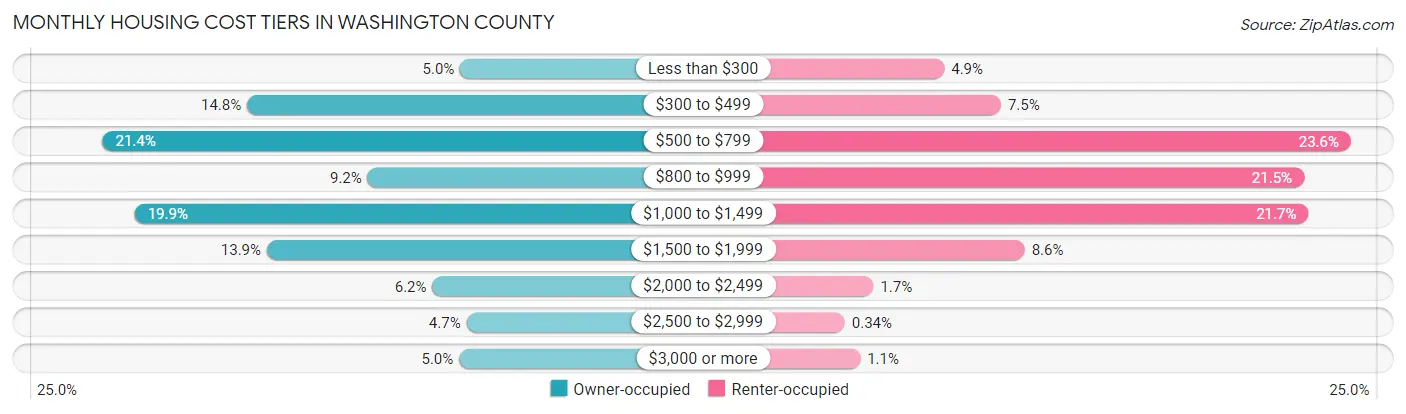
| Monthly Cost | Owner-occupied | Renter-occupied |
| Less than $300 | 3,278 (5.0%) | 1,030 (4.9%) |
| $300 to $499 | 9,778 (14.8%) | 1,577 (7.5%) |
| $500 to $799 | 14,188 (21.4%) | 4,949 (23.6%) |
| $800 to $999 | 6,100 (9.2%) | 4,498 (21.5%) |
| $1,000 to $1,499 | 13,204 (19.9%) | 4,538 (21.7%) |
| $1,500 to $1,999 | 9,175 (13.9%) | 1,805 (8.6%) |
| $2,000 to $2,499 | 4,128 (6.2%) | 347 (1.7%) |
| $2,500 to $2,999 | 3,089 (4.7%) | 72 (0.3%) |
| $3,000 or more | 3,314 (5.0%) | 220 (1.1%) |
| Total | 66,254 (100.0%) | 20,946 (100.0%) |
Physical Housing Characteristics in Washington County
Housing Structures in Washington County
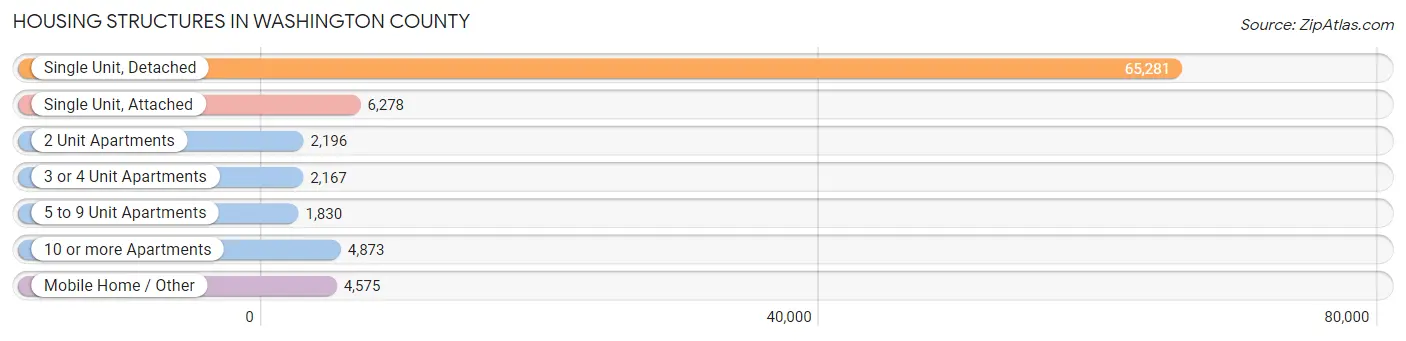
| Structure Type | # Housing Units | % Housing Units |
| Single Unit, Detached | 65,281 | 74.9% |
| Single Unit, Attached | 6,278 | 7.2% |
| 2 Unit Apartments | 2,196 | 2.5% |
| 3 or 4 Unit Apartments | 2,167 | 2.5% |
| 5 to 9 Unit Apartments | 1,830 | 2.1% |
| 10 or more Apartments | 4,873 | 5.6% |
| Mobile Home / Other | 4,575 | 5.2% |
| Total | 87,200 | 100.0% |
Housing Structures by Occupancy in Washington County
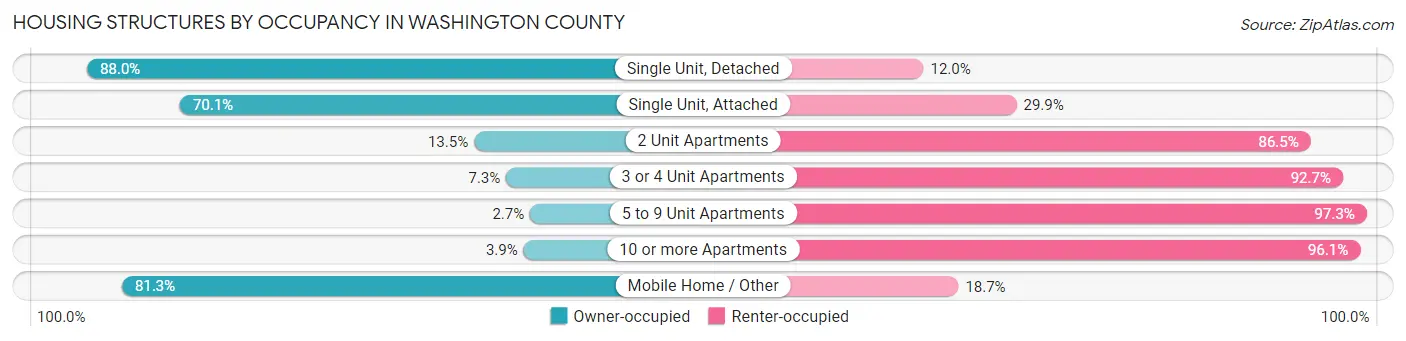
| Structure Type | Owner-occupied | Renter-occupied |
| Single Unit, Detached | 57,441 (88.0%) | 7,840 (12.0%) |
| Single Unit, Attached | 4,400 (70.1%) | 1,878 (29.9%) |
| 2 Unit Apartments | 296 (13.5%) | 1,900 (86.5%) |
| 3 or 4 Unit Apartments | 158 (7.3%) | 2,009 (92.7%) |
| 5 to 9 Unit Apartments | 49 (2.7%) | 1,781 (97.3%) |
| 10 or more Apartments | 192 (3.9%) | 4,681 (96.1%) |
| Mobile Home / Other | 3,718 (81.3%) | 857 (18.7%) |
| Total | 66,254 (76.0%) | 20,946 (24.0%) |
Housing Structures by Number of Rooms in Washington County
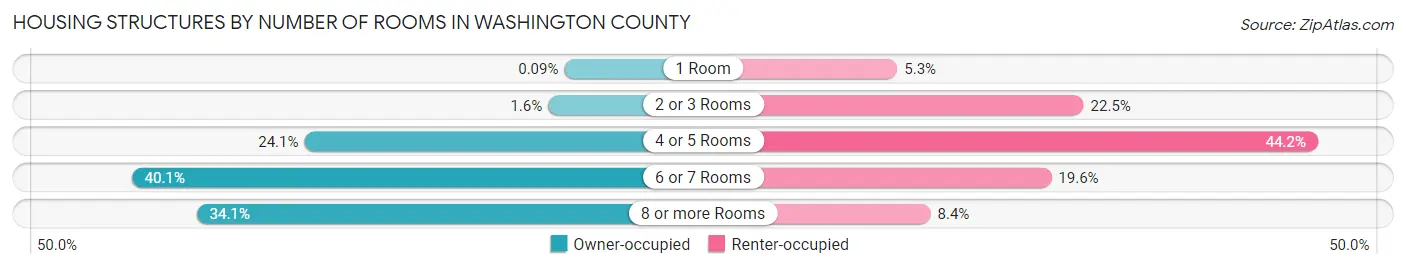
| Number of Rooms | Owner-occupied | Renter-occupied |
| 1 Room | 61 (0.1%) | 1,113 (5.3%) |
| 2 or 3 Rooms | 1,052 (1.6%) | 4,721 (22.5%) |
| 4 or 5 Rooms | 15,989 (24.1%) | 9,257 (44.2%) |
| 6 or 7 Rooms | 26,568 (40.1%) | 4,097 (19.6%) |
| 8 or more Rooms | 22,584 (34.1%) | 1,758 (8.4%) |
| Total | 66,254 (100.0%) | 20,946 (100.0%) |
Housing Structure by Heating Type in Washington County
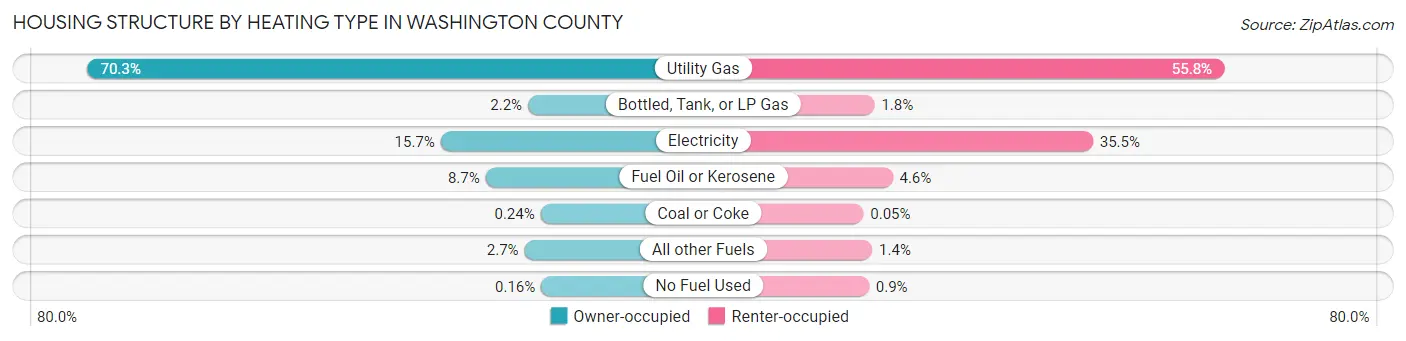
| Heating Type | Owner-occupied | Renter-occupied |
| Utility Gas | 46,549 (70.3%) | 11,684 (55.8%) |
| Bottled, Tank, or LP Gas | 1,454 (2.2%) | 370 (1.8%) |
| Electricity | 10,387 (15.7%) | 7,441 (35.5%) |
| Fuel Oil or Kerosene | 5,790 (8.7%) | 956 (4.6%) |
| Coal or Coke | 160 (0.2%) | 10 (0.1%) |
| All other Fuels | 1,811 (2.7%) | 296 (1.4%) |
| No Fuel Used | 103 (0.2%) | 189 (0.9%) |
| Total | 66,254 (100.0%) | 20,946 (100.0%) |
Household Vehicle Usage in Washington County
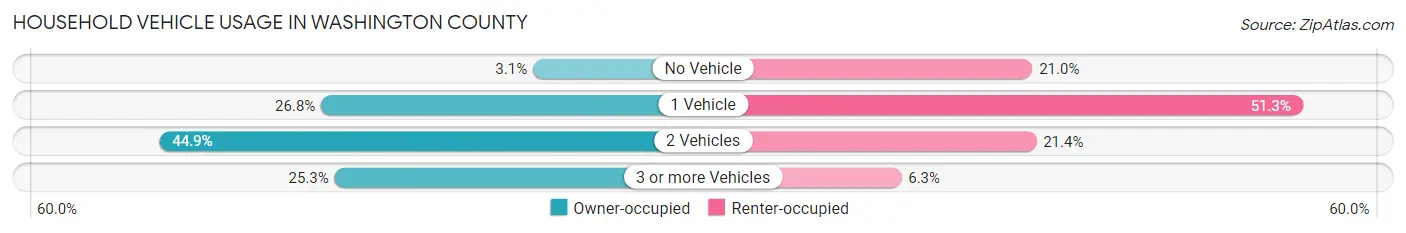
| Vehicles per Household | Owner-occupied | Renter-occupied |
| No Vehicle | 2,023 (3.0%) | 4,395 (21.0%) |
| 1 Vehicle | 17,745 (26.8%) | 10,741 (51.3%) |
| 2 Vehicles | 29,745 (44.9%) | 4,489 (21.4%) |
| 3 or more Vehicles | 16,741 (25.3%) | 1,321 (6.3%) |
| Total | 66,254 (100.0%) | 20,946 (100.0%) |
Real Estate & Mortgages in Washington County
Real Estate and Mortgage Overview in Washington County
| Characteristic | Without Mortgage | With Mortgage |
| Housing Units | 29,517 | 36,737 |
| Median Property Value | $174,600 | $229,100 |
| Median Household Income | $65,133 | $11,276 |
| Monthly Housing Costs | $540 | $3,265 |
| Real Estate Taxes | $1,999 | $539 |
Property Value by Mortgage Status in Washington County
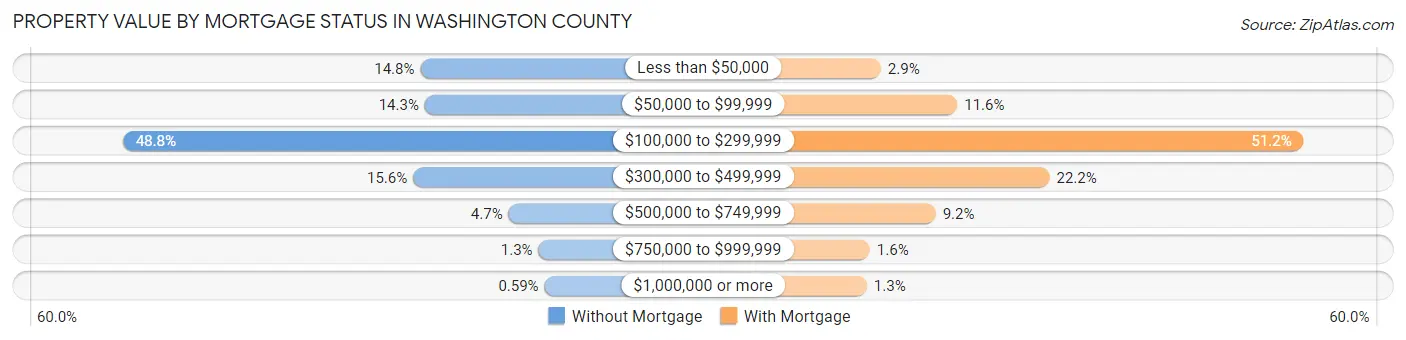
| Property Value | Without Mortgage | With Mortgage |
| Less than $50,000 | 4,362 (14.8%) | 1,066 (2.9%) |
| $50,000 to $99,999 | 4,212 (14.3%) | 4,272 (11.6%) |
| $100,000 to $299,999 | 14,397 (48.8%) | 18,809 (51.2%) |
| $300,000 to $499,999 | 4,607 (15.6%) | 8,145 (22.2%) |
| $500,000 to $749,999 | 1,386 (4.7%) | 3,365 (9.2%) |
| $750,000 to $999,999 | 378 (1.3%) | 604 (1.6%) |
| $1,000,000 or more | 175 (0.6%) | 476 (1.3%) |
| Total | 29,517 (100.0%) | 36,737 (100.0%) |
Household Income by Mortgage Status in Washington County
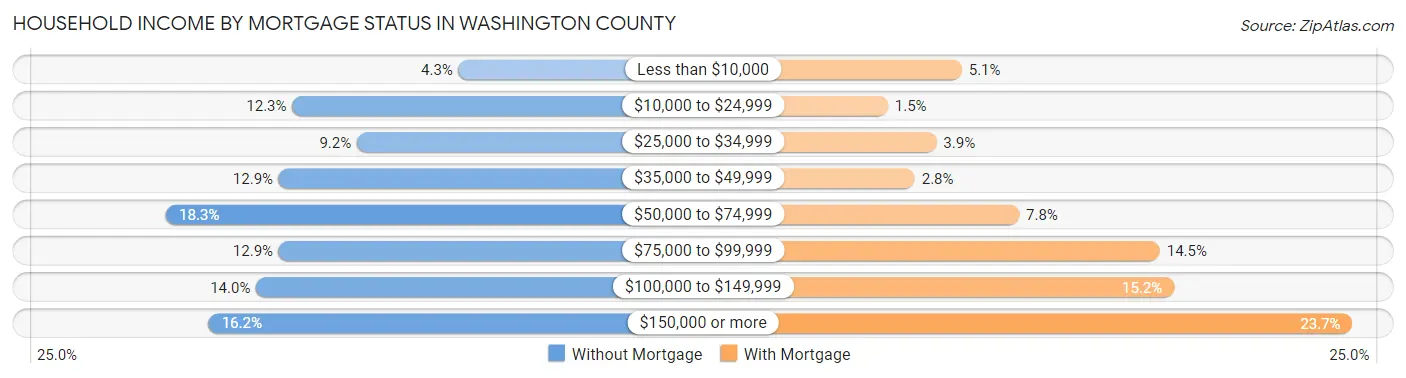
| Household Income | Without Mortgage | With Mortgage |
| Less than $10,000 | 1,279 (4.3%) | 1,860 (5.1%) |
| $10,000 to $24,999 | 3,616 (12.2%) | 564 (1.5%) |
| $25,000 to $34,999 | 2,706 (9.2%) | 1,413 (3.8%) |
| $35,000 to $49,999 | 3,806 (12.9%) | 1,036 (2.8%) |
| $50,000 to $74,999 | 5,390 (18.3%) | 2,860 (7.8%) |
| $75,000 to $99,999 | 3,804 (12.9%) | 5,325 (14.5%) |
| $100,000 to $149,999 | 4,124 (14.0%) | 5,572 (15.2%) |
| $150,000 or more | 4,792 (16.2%) | 8,691 (23.7%) |
| Total | 29,517 (100.0%) | 36,737 (100.0%) |
Property Value to Household Income Ratio in Washington County
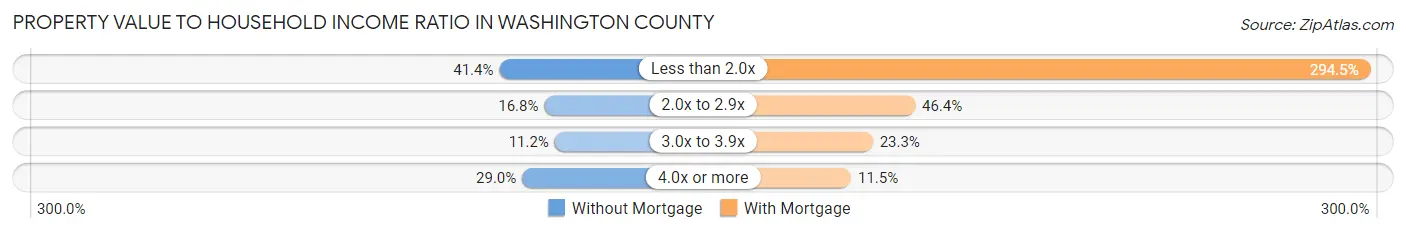
| Value-to-Income Ratio | Without Mortgage | With Mortgage |
| Less than 2.0x | 12,216 (41.4%) | 108,188 (294.5%) |
| 2.0x to 2.9x | 4,971 (16.8%) | 17,032 (46.4%) |
| 3.0x to 3.9x | 3,302 (11.2%) | 8,560 (23.3%) |
| 4.0x or more | 8,546 (28.9%) | 4,226 (11.5%) |
| Total | 29,517 (100.0%) | 36,737 (100.0%) |
Real Estate Taxes by Mortgage Status in Washington County
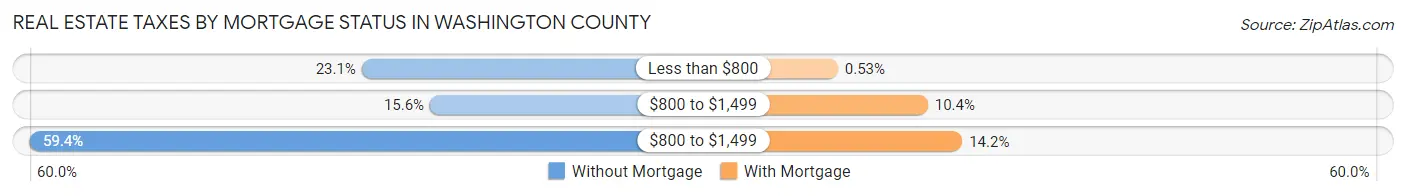
| Property Taxes | Without Mortgage | With Mortgage |
| Less than $800 | 6,808 (23.1%) | 195 (0.5%) |
| $800 to $1,499 | 4,599 (15.6%) | 3,813 (10.4%) |
| $800 to $1,499 | 17,535 (59.4%) | 5,203 (14.2%) |
| Total | 29,517 (100.0%) | 36,737 (100.0%) |
Health & Disability in Washington County
Health Insurance Coverage by Age in Washington County
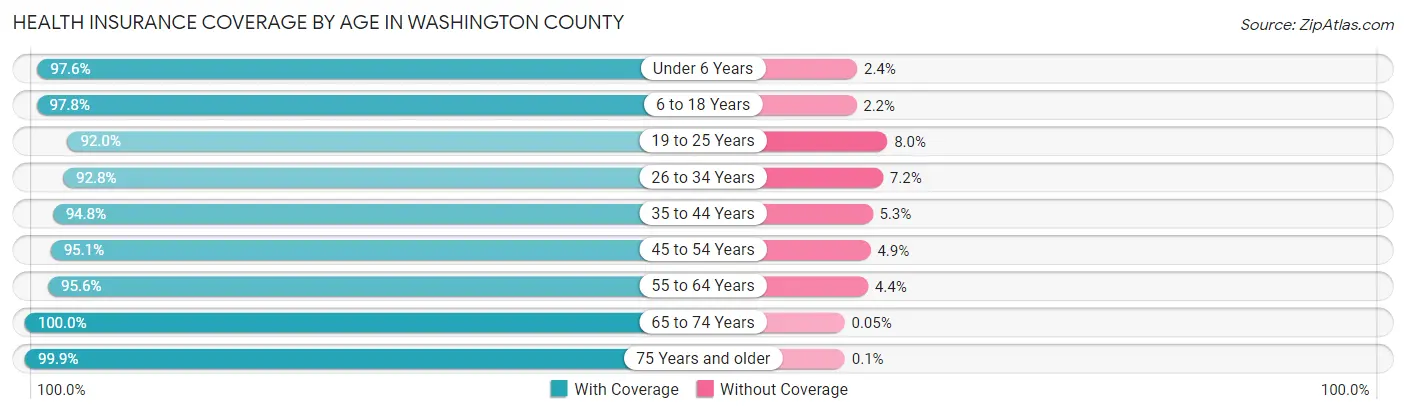
| Age Bracket | With Coverage | Without Coverage |
| Under 6 Years | 12,846 (97.6%) | 313 (2.4%) |
| 6 to 18 Years | 29,745 (97.8%) | 678 (2.2%) |
| 19 to 25 Years | 15,314 (92.0%) | 1,332 (8.0%) |
| 26 to 34 Years | 19,610 (92.8%) | 1,522 (7.2%) |
| 35 to 44 Years | 23,399 (94.8%) | 1,297 (5.2%) |
| 45 to 54 Years | 25,458 (95.1%) | 1,306 (4.9%) |
| 55 to 64 Years | 30,184 (95.6%) | 1,388 (4.4%) |
| 65 to 74 Years | 25,616 (100.0%) | 13 (0.1%) |
| 75 Years and older | 17,675 (99.9%) | 17 (0.1%) |
| Total | 199,847 (96.2%) | 7,866 (3.8%) |
Health Insurance Coverage by Citizenship Status in Washington County
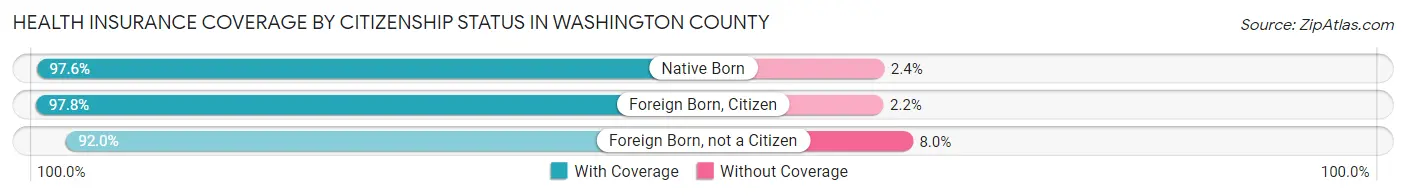
| Citizenship Status | With Coverage | Without Coverage |
| Native Born | 12,846 (97.6%) | 313 (2.4%) |
| Foreign Born, Citizen | 29,745 (97.8%) | 678 (2.2%) |
| Foreign Born, not a Citizen | 15,314 (92.0%) | 1,332 (8.0%) |
Health Insurance Coverage by Household Income in Washington County
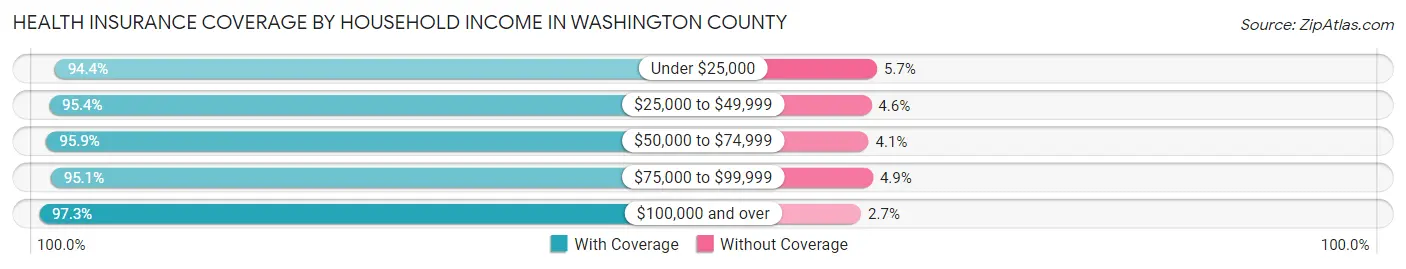
| Household Income | With Coverage | Without Coverage |
| Under $25,000 | 18,608 (94.4%) | 1,114 (5.7%) |
| $25,000 to $49,999 | 28,056 (95.4%) | 1,355 (4.6%) |
| $50,000 to $74,999 | 29,708 (95.9%) | 1,267 (4.1%) |
| $75,000 to $99,999 | 26,579 (95.1%) | 1,372 (4.9%) |
| $100,000 and over | 93,265 (97.3%) | 2,580 (2.7%) |
Public vs Private Health Insurance Coverage by Age in Washington County
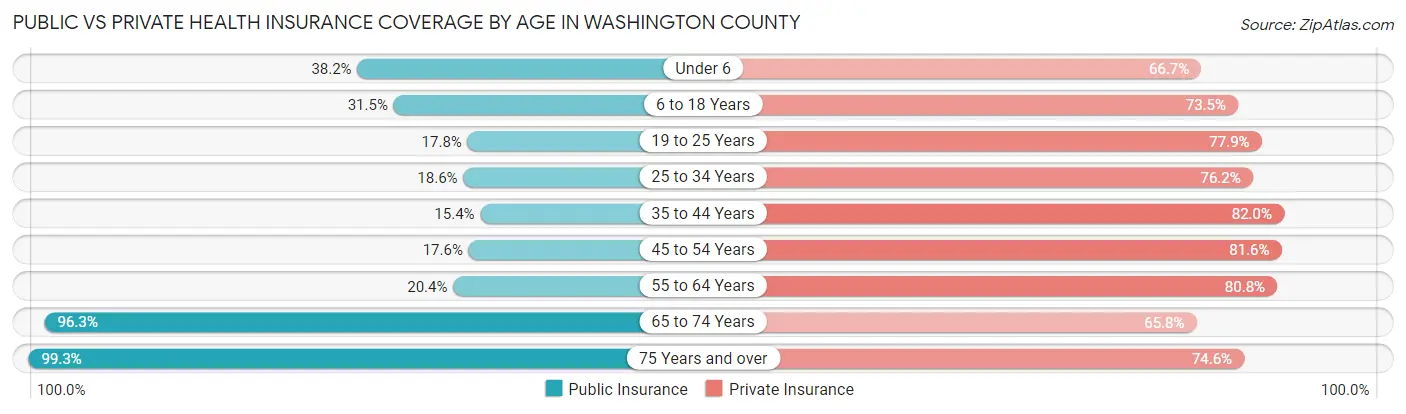
| Age Bracket | Public Insurance | Private Insurance |
| Under 6 | 5,030 (38.2%) | 8,776 (66.7%) |
| 6 to 18 Years | 9,576 (31.5%) | 22,358 (73.5%) |
| 19 to 25 Years | 2,956 (17.8%) | 12,964 (77.9%) |
| 25 to 34 Years | 3,919 (18.5%) | 16,111 (76.2%) |
| 35 to 44 Years | 3,804 (15.4%) | 20,260 (82.0%) |
| 45 to 54 Years | 4,699 (17.6%) | 21,834 (81.6%) |
| 55 to 64 Years | 6,450 (20.4%) | 25,499 (80.8%) |
| 65 to 74 Years | 24,680 (96.3%) | 16,864 (65.8%) |
| 75 Years and over | 17,565 (99.3%) | 13,206 (74.6%) |
| Total | 78,679 (37.9%) | 157,872 (76.0%) |
Disability Status by Sex by Age in Washington County
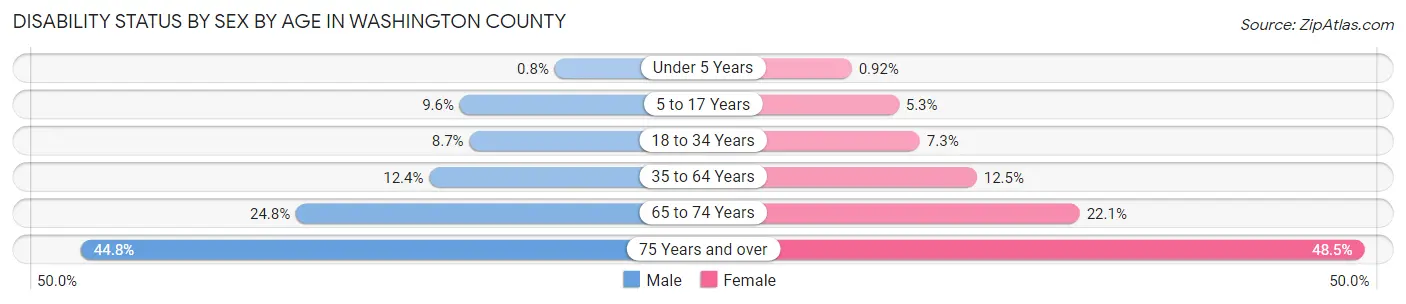
| Age Bracket | Male | Female |
| Under 5 Years | 41 (0.8%) | 48 (0.9%) |
| 5 to 17 Years | 1,498 (9.6%) | 790 (5.3%) |
| 18 to 34 Years | 1,805 (8.7%) | 1,437 (7.2%) |
| 35 to 64 Years | 5,183 (12.4%) | 5,180 (12.5%) |
| 65 to 74 Years | 3,051 (24.8%) | 2,944 (22.1%) |
| 75 Years and over | 3,237 (44.8%) | 5,073 (48.5%) |
Disability Class by Sex by Age in Washington County
Disability Class: Hearing Difficulty
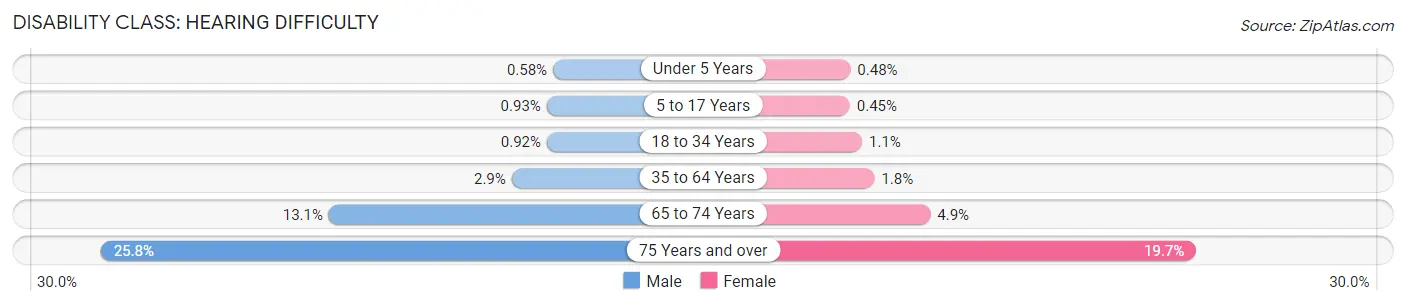
| Age Bracket | Male | Female |
| Under 5 Years | 30 (0.6%) | 25 (0.5%) |
| 5 to 17 Years | 145 (0.9%) | 67 (0.4%) |
| 18 to 34 Years | 191 (0.9%) | 224 (1.1%) |
| 35 to 64 Years | 1,200 (2.9%) | 752 (1.8%) |
| 65 to 74 Years | 1,606 (13.1%) | 657 (4.9%) |
| 75 Years and over | 1,863 (25.8%) | 2,064 (19.7%) |
Disability Class: Vision Difficulty
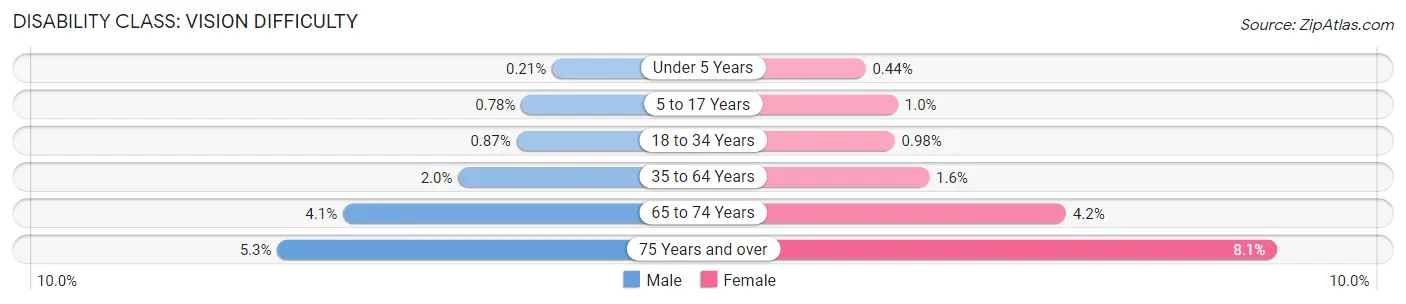
| Age Bracket | Male | Female |
| Under 5 Years | 11 (0.2%) | 23 (0.4%) |
| 5 to 17 Years | 121 (0.8%) | 155 (1.0%) |
| 18 to 34 Years | 181 (0.9%) | 194 (1.0%) |
| 35 to 64 Years | 812 (1.9%) | 670 (1.6%) |
| 65 to 74 Years | 503 (4.1%) | 555 (4.2%) |
| 75 Years and over | 384 (5.3%) | 845 (8.1%) |
Disability Class: Cognitive Difficulty
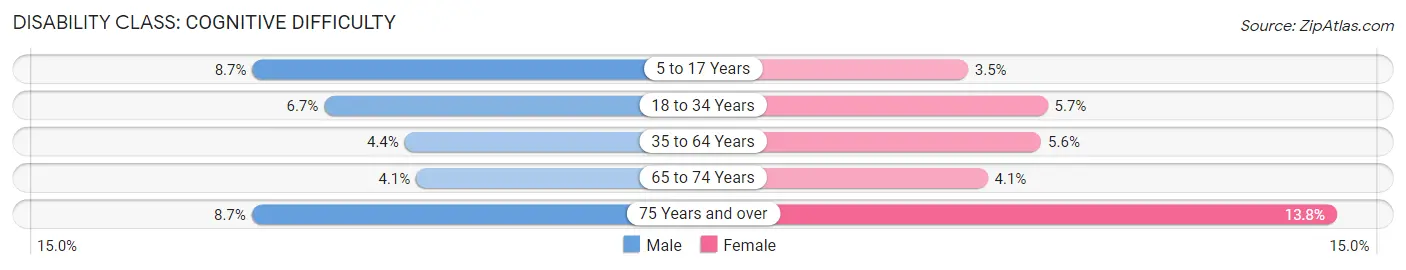
| Age Bracket | Male | Female |
| 5 to 17 Years | 1,350 (8.7%) | 524 (3.5%) |
| 18 to 34 Years | 1,378 (6.7%) | 1,135 (5.7%) |
| 35 to 64 Years | 1,843 (4.4%) | 2,297 (5.6%) |
| 65 to 74 Years | 504 (4.1%) | 541 (4.1%) |
| 75 Years and over | 628 (8.7%) | 1,442 (13.8%) |
Disability Class: Ambulatory Difficulty
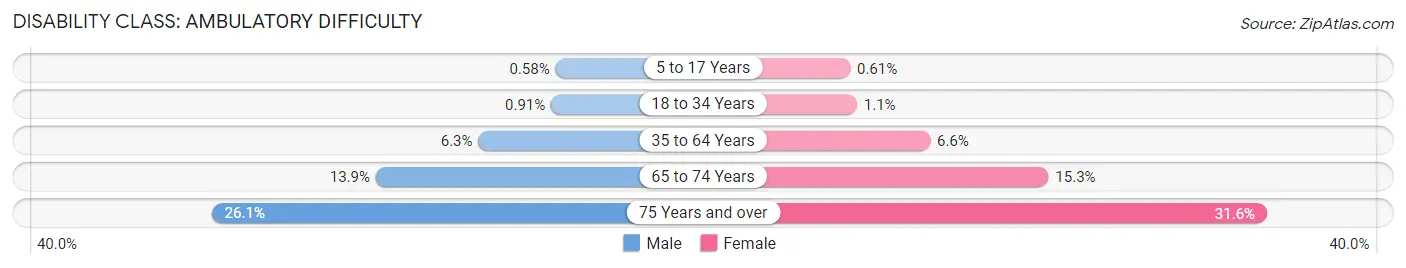
| Age Bracket | Male | Female |
| 5 to 17 Years | 90 (0.6%) | 91 (0.6%) |
| 18 to 34 Years | 189 (0.9%) | 221 (1.1%) |
| 35 to 64 Years | 2,631 (6.3%) | 2,708 (6.6%) |
| 65 to 74 Years | 1,711 (13.9%) | 2,046 (15.3%) |
| 75 Years and over | 1,888 (26.1%) | 3,302 (31.6%) |
Disability Class: Self-Care Difficulty
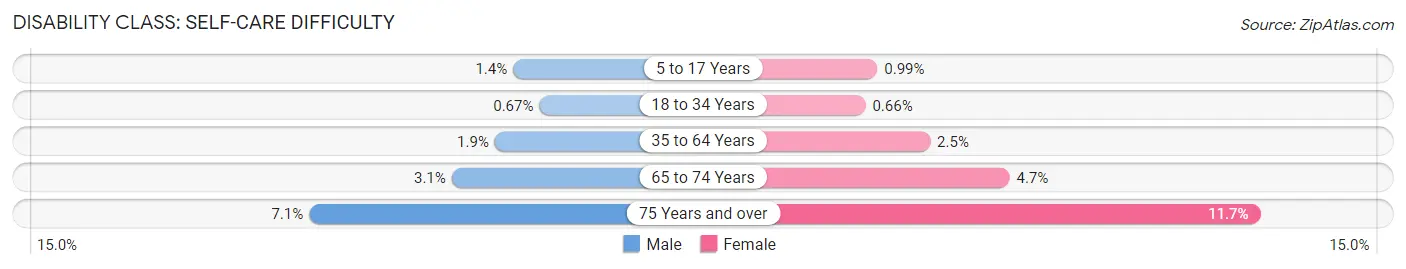
| Age Bracket | Male | Female |
| 5 to 17 Years | 218 (1.4%) | 148 (1.0%) |
| 18 to 34 Years | 138 (0.7%) | 131 (0.7%) |
| 35 to 64 Years | 794 (1.9%) | 1,016 (2.5%) |
| 65 to 74 Years | 382 (3.1%) | 623 (4.7%) |
| 75 Years and over | 512 (7.1%) | 1,219 (11.7%) |
Technology Access in Washington County
Computing Device Access in Washington County
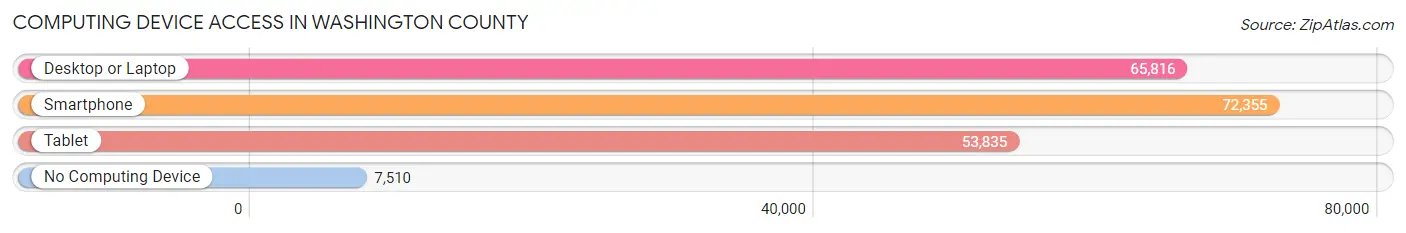
| Device Type | # Households | % Households |
| Desktop or Laptop | 65,816 | 75.5% |
| Smartphone | 72,355 | 83.0% |
| Tablet | 53,835 | 61.7% |
| No Computing Device | 7,510 | 8.6% |
| Total | 87,200 | 100.0% |
Internet Access in Washington County
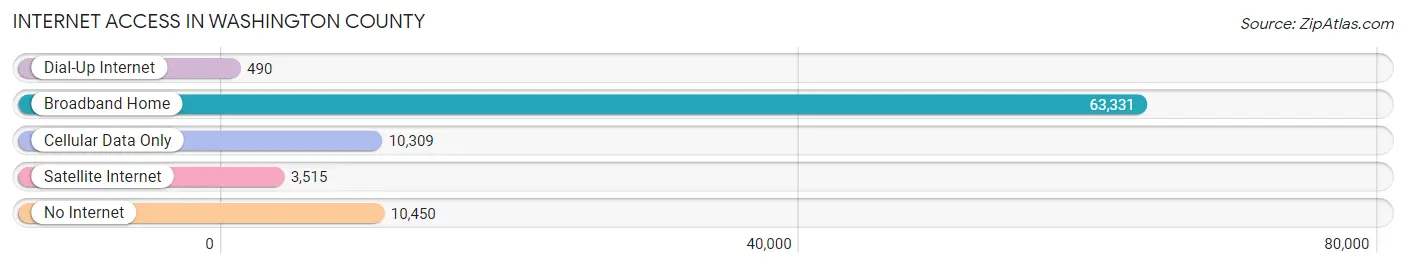
| Internet Type | # Households | % Households |
| Dial-Up Internet | 490 | 0.6% |
| Broadband Home | 63,331 | 72.6% |
| Cellular Data Only | 10,309 | 11.8% |
| Satellite Internet | 3,515 | 4.0% |
| No Internet | 10,450 | 12.0% |
| Total | 87,200 | 100.0% |
Washington County Summary
Introduction
Washington County, Pennsylvania is located in the southwestern corner of the state and is part of the Pittsburgh metropolitan area. It is bordered by Allegheny County to the north, Westmoreland County to the east, Greene County to the south, and the state of West Virginia to the west. The county seat is Washington, and the county has a population of 207,820 as of the 2010 census.
History
Washington County was formed in 1781 from part of Westmoreland County. It was named after George Washington, the first President of the United States. The county was originally part of the Ohio Country, a vast area of land claimed by the British and French during the French and Indian War. The area was ceded to the United States in 1783, and the county was officially established in 1781.
The county was home to several Native American tribes, including the Shawnee, Delaware, and Mingo. The first European settlers arrived in the area in the late 1700s, and the county was quickly settled by farmers and tradesmen. The county was an important part of the Whiskey Rebellion of 1794, when farmers in the area refused to pay a federal tax on whiskey.
The county was an important part of the Underground Railroad, with many of the county’s residents helping to hide and transport escaped slaves. The county was also an important part of the oil and gas industry, with the first oil well being drilled in 1859.
Geography
Washington County is located in the southwestern corner of Pennsylvania, and is bordered by Allegheny County to the north, Westmoreland County to the east, Greene County to the south, and the state of West Virginia to the west. The county has a total area of 819 square miles, of which 817 square miles is land and 2 square miles is water.
The county is located in the Appalachian Mountains, and is home to several mountain ranges, including the Allegheny Mountains, the Laurel Highlands, and the Chestnut Ridge. The county is also home to several rivers, including the Monongahela River, the Youghiogheny River, and the Cheat River.
Economy
Washington County’s economy is largely based on manufacturing, with the county being home to several large manufacturing companies, including Consol Energy, PPG Industries, and U.S. Steel. The county is also home to several smaller manufacturing companies, including several food processing companies.
The county is also home to several large retail companies, including Walmart, Target, and Lowe’s. The county is also home to several large healthcare companies, including UPMC and Highmark.
Demographics
As of the 2010 census, the population of Washington County was 207,820. The racial makeup of the county was 94.3% White, 2.7% African American, 0.3% Native American, 0.7% Asian, 0.1% Pacific Islander, 0.9% from other races, and 1.0% from two or more races. Hispanic or Latino of any race were 2.2% of the population.
The median income for a household in the county was $45,837, and the median income for a family was $54,817. The per capita income for the county was $22,945. About 8.7% of families and 11.3% of the population were below the poverty line, including 15.2% of those under age 18 and 8.2% of those age 65 or over.
Conclusion
Washington County, Pennsylvania is located in the southwestern corner of the state and is part of the Pittsburgh metropolitan area. It is bordered by Allegheny County to the north, Westmoreland County to the east, Greene County to the south, and the state of West Virginia to the west. The county was formed in 1781 from part of Westmoreland County and was named after George Washington, the first President of the United States. The county has a total area of 819 square miles, and a population of 207,820 as of the 2010 census. The county’s economy is largely based on manufacturing, with the county being home to several large manufacturing companies, as well as several large retail companies and healthcare companies. The racial makeup of the county was 94.3% White, 2.7% African American, 0.3% Native American, 0.7% Asian, 0.1% Pacific Islander, 0.9% from other races, and 1.0% from two or more races. The median income for a household in the county was $45,837, and the median income for a family was $54,817.
Common Questions
What is Per Capita Income in Washington County?
Per Capita income in Washington County is $42,859.
What is the Median Family Income in Washington County?
Median Family Income in Washington County is $98,930.
What is the Median Household income in Washington County?
Median Household Income in Washington County is $74,403.
What is Income or Wage Gap in Washington County?
Income or Wage Gap in Washington County is 39.3%.
Women in Washington County earn 60.7 cents for every dollar earned by a man.
What is Family Income Deficit in Washington County?
Family Income Deficit in Washington County is $10,864.
Families that are below poverty line in Washington County earn $10,864 less on average than the poverty threshold level.
What is Inequality or Gini Index in Washington County?
Inequality or Gini Index in Washington County is 0.46.
What is the Total Population of Washington County?
Total Population of Washington County is 209,631.
What is the Total Male Population of Washington County?
Total Male Population of Washington County is 103,708.
What is the Total Female Population of Washington County?
Total Female Population of Washington County is 105,923.
What is the Ratio of Males per 100 Females in Washington County?
There are 97.91 Males per 100 Females in Washington County.
What is the Ratio of Females per 100 Males in Washington County?
There are 102.14 Females per 100 Males in Washington County.
What is the Median Population Age in Washington County?
Median Population Age in Washington County is 44.2 Years.
What is the Average Family Size in Washington County
Average Family Size in Washington County is 2.9 People.
What is the Average Household Size in Washington County
Average Household Size in Washington County is 2.3 People.
How Large is the Labor Force in Washington County?
There are 107,776 People in the Labor Forcein in Washington County.
What is the Percentage of People in the Labor Force in Washington County?
62.1% of People are in the Labor Force in Washington County.
What is the Unemployment Rate in Washington County?
Unemployment Rate in Washington County is 5.0%.