Warren County, PA Map & Demographics
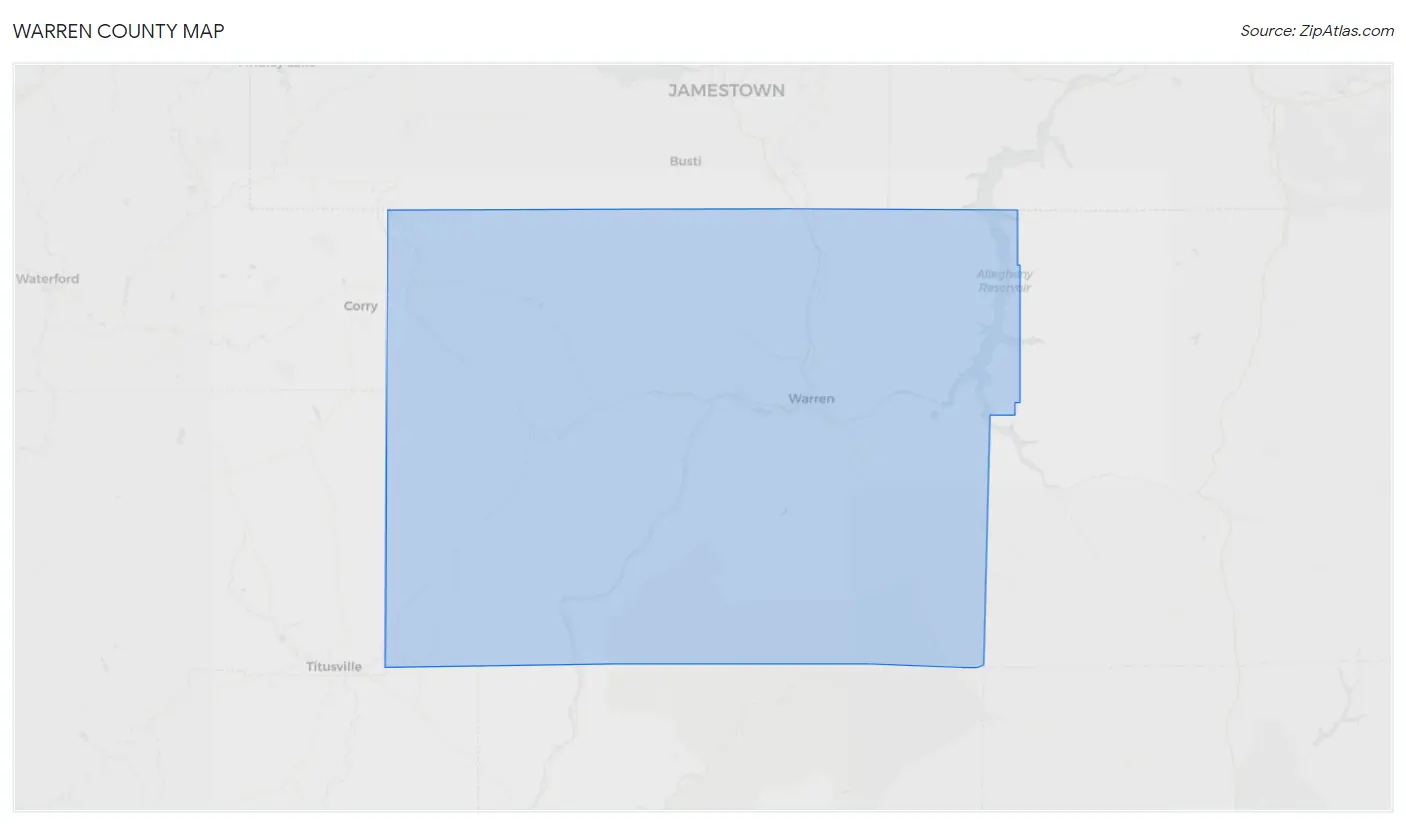
Warren County Map
Warren County Overview
$32,319
PER CAPITA INCOME
$73,750
AVG FAMILY INCOME
$57,925
AVG HOUSEHOLD INCOME
32.3%
WAGE / INCOME GAP [ % ]
67.7¢/ $1
WAGE / INCOME GAP [ $ ]
$8,434
FAMILY INCOME DEFICIT
0.42
INEQUALITY / GINI INDEX
38,492
TOTAL POPULATION
19,478
MALE POPULATION
19,014
FEMALE POPULATION
102.44
MALES / 100 FEMALES
97.62
FEMALES / 100 MALES
47.4
MEDIAN AGE
2.9
AVG FAMILY SIZE
2.3
AVG HOUSEHOLD SIZE
18,139
LABOR FORCE [ PEOPLE ]
56.8%
PERCENT IN LABOR FORCE
4.3%
UNEMPLOYMENT RATE
Warren County Area Codes
Income in Warren County
Income Overview in Warren County
Per Capita Income in Warren County is $32,319, while median incomes of families and households are $73,750 and $57,925 respectively.
| Characteristic | Number | Measure |
| Per Capita Income | 38,492 | $32,319 |
| Median Family Income | 10,276 | $73,750 |
| Mean Family Income | 10,276 | $88,705 |
| Median Household Income | 16,209 | $57,925 |
| Mean Household Income | 16,209 | $74,092 |
| Income Deficit | 10,276 | $8,434 |
| Wage / Income Gap (%) | 38,492 | 32.27% |
| Wage / Income Gap ($) | 38,492 | 67.73¢ per $1 |
| Gini / Inequality Index | 38,492 | 0.42 |
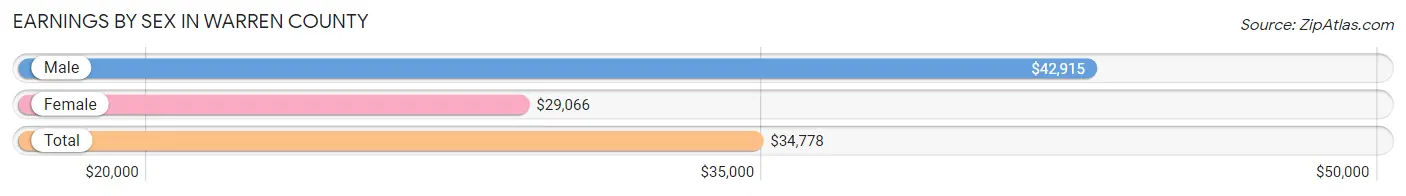
Earnings by Sex in Warren County
Average Earnings in Warren County are $34,778, $42,915 for men and $29,066 for women, a difference of 32.3%.
| Sex | Number | Average Earnings |
| Male | 10,194 (53.5%) | $42,915 |
| Female | 8,858 (46.5%) | $29,066 |
| Total | 19,052 (100.0%) | $34,778 |
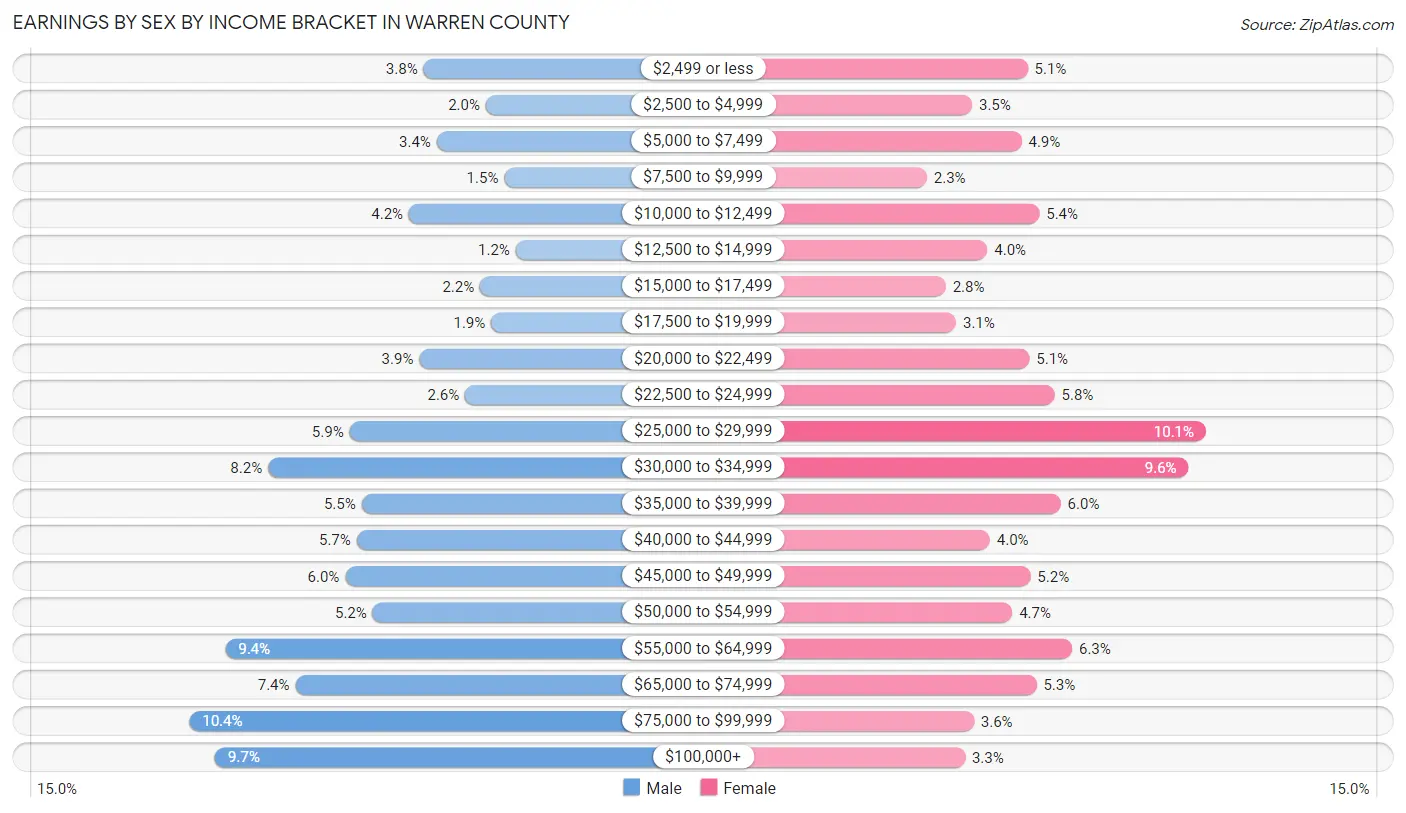
Earnings by Sex by Income Bracket in Warren County
The most common earnings brackets in Warren County are $75,000 to $99,999 for men (1,057 | 10.4%) and $25,000 to $29,999 for women (894 | 10.1%).
| Income | Male | Female |
| $2,499 or less | 386 (3.8%) | 450 (5.1%) |
| $2,500 to $4,999 | 208 (2.0%) | 312 (3.5%) |
| $5,000 to $7,499 | 349 (3.4%) | 435 (4.9%) |
| $7,500 to $9,999 | 155 (1.5%) | 199 (2.2%) |
| $10,000 to $12,499 | 428 (4.2%) | 479 (5.4%) |
| $12,500 to $14,999 | 122 (1.2%) | 350 (4.0%) |
| $15,000 to $17,499 | 224 (2.2%) | 246 (2.8%) |
| $17,500 to $19,999 | 193 (1.9%) | 272 (3.1%) |
| $20,000 to $22,499 | 399 (3.9%) | 454 (5.1%) |
| $22,500 to $24,999 | 267 (2.6%) | 517 (5.8%) |
| $25,000 to $29,999 | 598 (5.9%) | 894 (10.1%) |
| $30,000 to $34,999 | 832 (8.2%) | 850 (9.6%) |
| $35,000 to $39,999 | 564 (5.5%) | 532 (6.0%) |
| $40,000 to $44,999 | 578 (5.7%) | 356 (4.0%) |
| $45,000 to $49,999 | 611 (6.0%) | 457 (5.2%) |
| $50,000 to $54,999 | 532 (5.2%) | 412 (4.6%) |
| $55,000 to $64,999 | 954 (9.4%) | 561 (6.3%) |
| $65,000 to $74,999 | 753 (7.4%) | 472 (5.3%) |
| $75,000 to $99,999 | 1,057 (10.4%) | 316 (3.6%) |
| $100,000+ | 984 (9.7%) | 294 (3.3%) |
| Total | 10,194 (100.0%) | 8,858 (100.0%) |
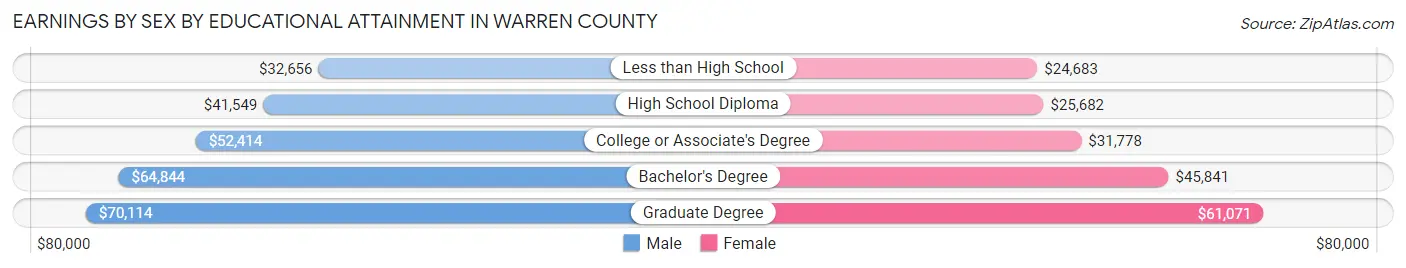
Earnings by Sex by Educational Attainment in Warren County
Average earnings in Warren County are $47,618 for men and $31,811 for women, a difference of 33.2%. Men with an educational attainment of graduate degree enjoy the highest average annual earnings of $70,114, while those with less than high school education earn the least with $32,656. Women with an educational attainment of graduate degree earn the most with the average annual earnings of $61,071, while those with less than high school education have the smallest earnings of $24,683.
| Educational Attainment | Male Income | Female Income |
| Less than High School | $32,656 | $24,683 |
| High School Diploma | $41,549 | $25,682 |
| College or Associate's Degree | $52,414 | $31,778 |
| Bachelor's Degree | $64,844 | $45,841 |
| Graduate Degree | $70,114 | $61,071 |
| Total | $47,618 | $31,811 |
Family Income in Warren County
Family Income Brackets in Warren County
According to the Warren County family income data, there are 2,230 families falling into the $50,000 to $74,999 income range, which is the most common income bracket and makes up 21.7% of all families. Conversely, the less than $10,000 income bracket is the least frequent group with only 185 families (1.8%) belonging to this category.
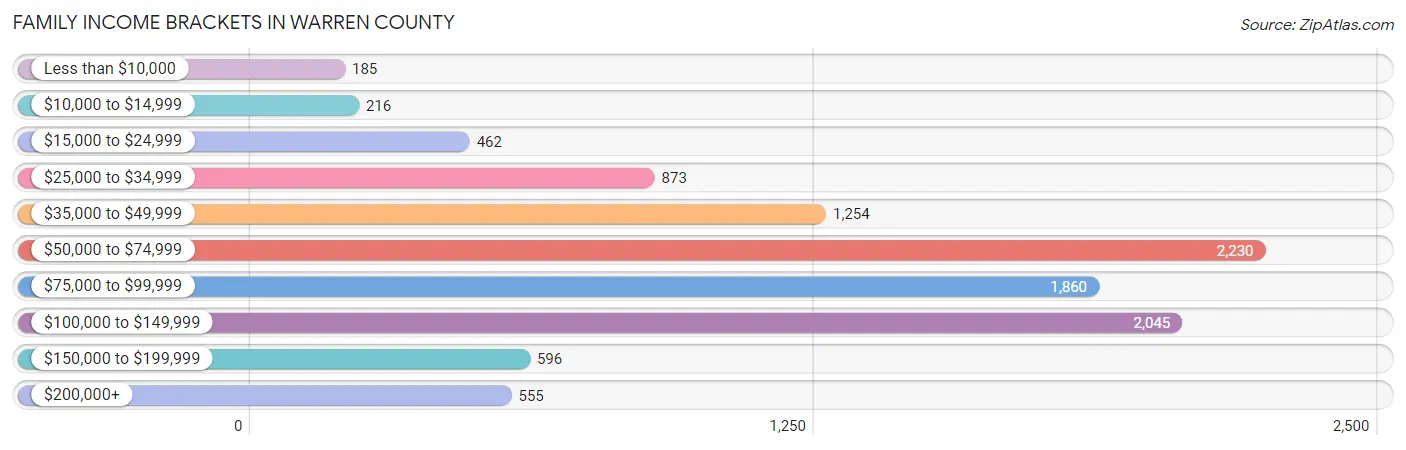
| Income Bracket | # Families | % Families |
| Less than $10,000 | 185 | 1.8% |
| $10,000 to $14,999 | 216 | 2.1% |
| $15,000 to $24,999 | 462 | 4.5% |
| $25,000 to $34,999 | 873 | 8.5% |
| $35,000 to $49,999 | 1,254 | 12.2% |
| $50,000 to $74,999 | 2,230 | 21.7% |
| $75,000 to $99,999 | 1,860 | 18.1% |
| $100,000 to $149,999 | 2,045 | 19.9% |
| $150,000 to $199,999 | 596 | 5.8% |
| $200,000+ | 555 | 5.4% |
Family Income by Famaliy Size in Warren County
6-person families (251 | 2.4%) account for the highest median family income in Warren County with $151,302 per family, while 2-person families (6,118 | 59.5%) have the highest median income of $33,390 per family member.
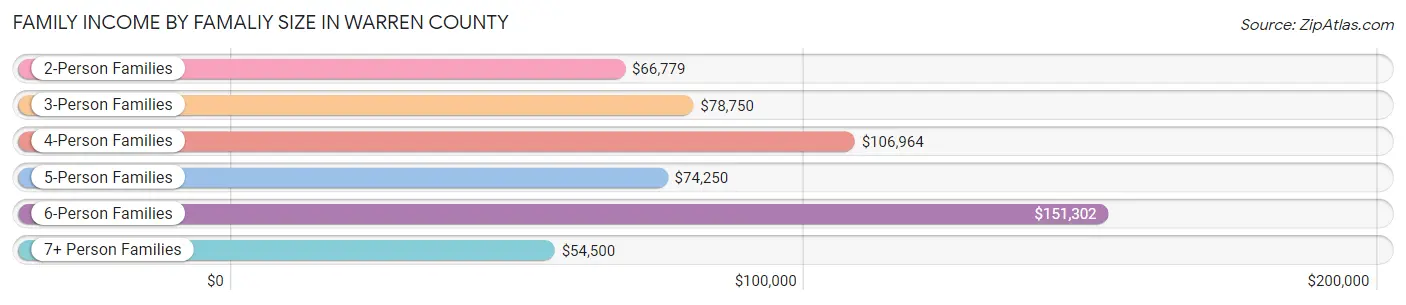
| Income Bracket | # Families | Median Income |
| 2-Person Families | 6,118 (59.5%) | $66,779 |
| 3-Person Families | 2,225 (21.6%) | $78,750 |
| 4-Person Families | 1,277 (12.4%) | $106,964 |
| 5-Person Families | 301 (2.9%) | $74,250 |
| 6-Person Families | 251 (2.4%) | $151,302 |
| 7+ Person Families | 104 (1.0%) | $54,500 |
| Total | 10,276 (100.0%) | $73,750 |
Family Income by Number of Earners in Warren County
The median family income in Warren County is $73,750, with families comprising 3+ earners (817) having the highest median family income of $114,875, while families with no earners (2,456) have the lowest median family income of $48,429, accounting for 8.0% and 23.9% of families, respectively.
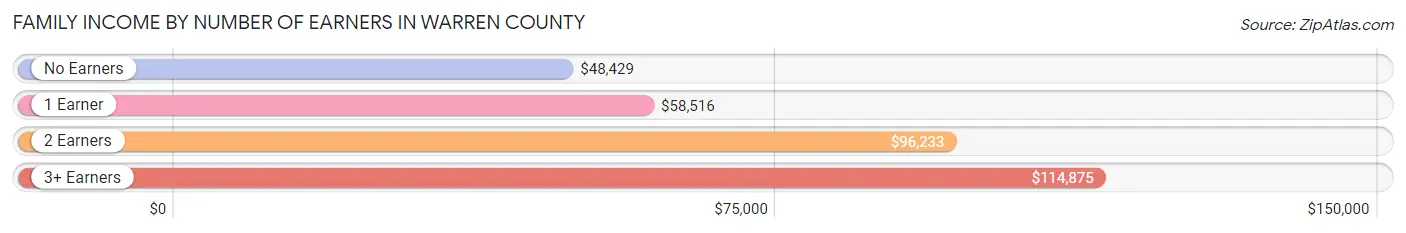
| Number of Earners | # Families | Median Income |
| No Earners | 2,456 (23.9%) | $48,429 |
| 1 Earner | 3,107 (30.2%) | $58,516 |
| 2 Earners | 3,896 (37.9%) | $96,233 |
| 3+ Earners | 817 (8.0%) | $114,875 |
| Total | 10,276 (100.0%) | $73,750 |
Household Income in Warren County
Household Income Brackets in Warren County
With 3,371 households falling in the category, the $50,000 to $74,999 income range is the most frequent in Warren County, accounting for 20.8% of all households. In contrast, only 600 households (3.7%) fall into the $200,000+ income bracket, making it the least populous group.
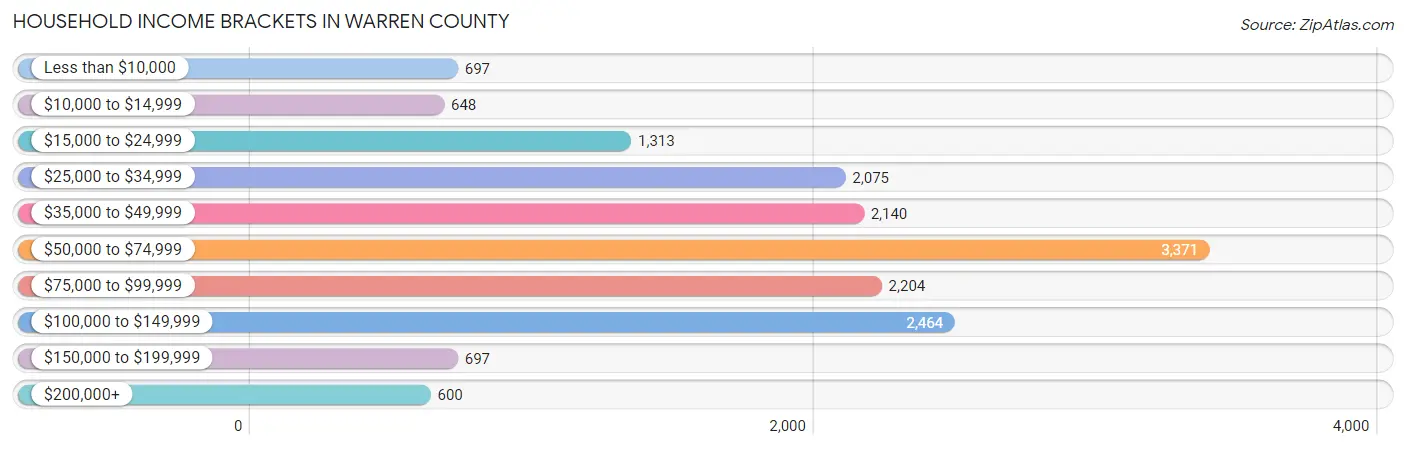
| Income Bracket | # Households | % Households |
| Less than $10,000 | 697 | 4.3% |
| $10,000 to $14,999 | 648 | 4.0% |
| $15,000 to $24,999 | 1,313 | 8.1% |
| $25,000 to $34,999 | 2,075 | 12.8% |
| $35,000 to $49,999 | 2,140 | 13.2% |
| $50,000 to $74,999 | 3,371 | 20.8% |
| $75,000 to $99,999 | 2,204 | 13.6% |
| $100,000 to $149,999 | 2,464 | 15.2% |
| $150,000 to $199,999 | 697 | 4.3% |
| $200,000+ | 600 | 3.7% |
Household Income by Householder Age in Warren County
The median household income in Warren County is $57,925, with the highest median household income of $73,914 found in the 25 to 44 years age bracket for the primary householder. A total of 3,574 households (22.1%) fall into this category. Meanwhile, the 15 to 24 years age bracket for the primary householder has the lowest median household income of $34,643, with 318 households (2.0%) in this group.
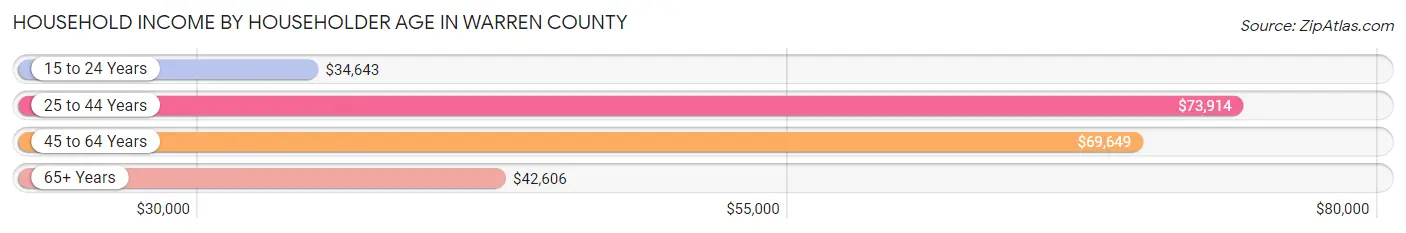
| Income Bracket | # Households | Median Income |
| 15 to 24 Years | 318 (2.0%) | $34,643 |
| 25 to 44 Years | 3,574 (22.1%) | $73,914 |
| 45 to 64 Years | 6,794 (41.9%) | $69,649 |
| 65+ Years | 5,523 (34.1%) | $42,606 |
| Total | 16,209 (100.0%) | $57,925 |
Poverty in Warren County
Income Below Poverty by Sex and Age in Warren County
With 10.2% poverty level for males and 13.1% for females among the residents of Warren County, 5 year old males and 18 to 24 year old females are the most vulnerable to poverty, with 59 males (34.5%) and 361 females (29.6%) in their respective age groups living below the poverty level.
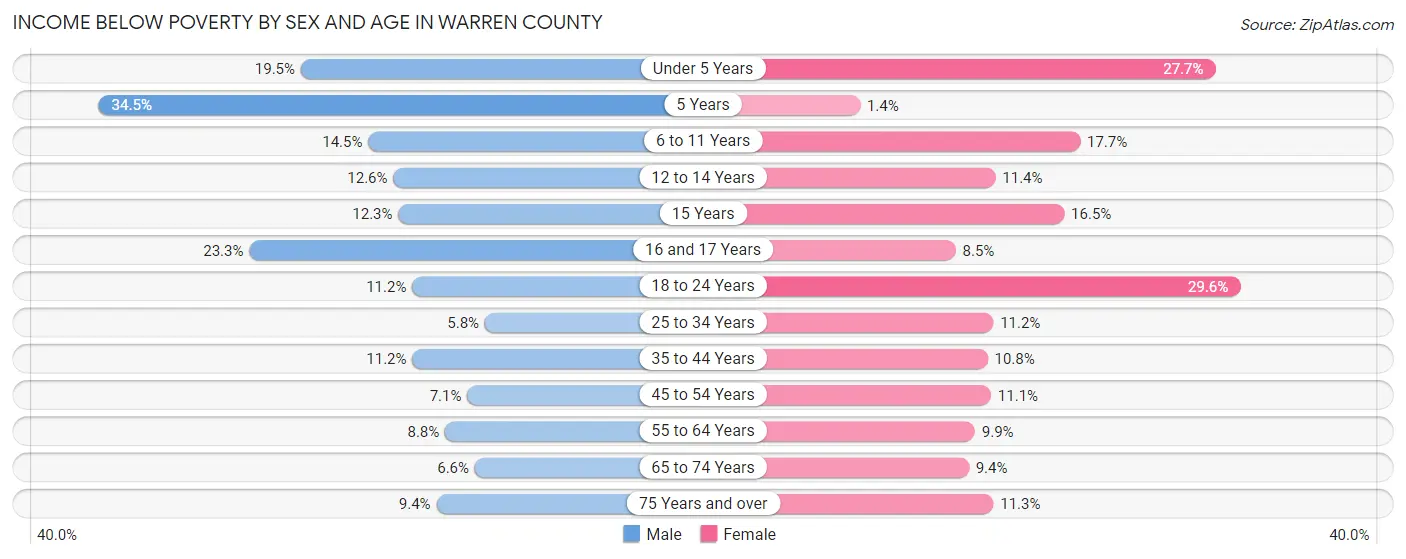
| Age Bracket | Male | Female |
| Under 5 Years | 192 (19.5%) | 264 (27.7%) |
| 5 Years | 59 (34.5%) | 2 (1.3%) |
| 6 to 11 Years | 187 (14.5%) | 205 (17.7%) |
| 12 to 14 Years | 78 (12.6%) | 82 (11.4%) |
| 15 Years | 25 (12.2%) | 35 (16.5%) |
| 16 and 17 Years | 118 (23.3%) | 35 (8.5%) |
| 18 to 24 Years | 160 (11.2%) | 361 (29.6%) |
| 25 to 34 Years | 118 (5.8%) | 208 (11.2%) |
| 35 to 44 Years | 230 (11.2%) | 215 (10.8%) |
| 45 to 54 Years | 174 (7.1%) | 259 (11.1%) |
| 55 to 64 Years | 283 (8.8%) | 304 (9.9%) |
| 65 to 74 Years | 169 (6.6%) | 242 (9.4%) |
| 75 Years and over | 159 (9.4%) | 225 (11.3%) |
| Total | 1,952 (10.2%) | 2,437 (13.1%) |
Income Above Poverty by Sex and Age in Warren County
According to the poverty statistics in Warren County, males aged 25 to 34 years and females aged 5 years are the age groups that are most secure financially, with 94.2% of males and 98.7% of females in these age groups living above the poverty line.
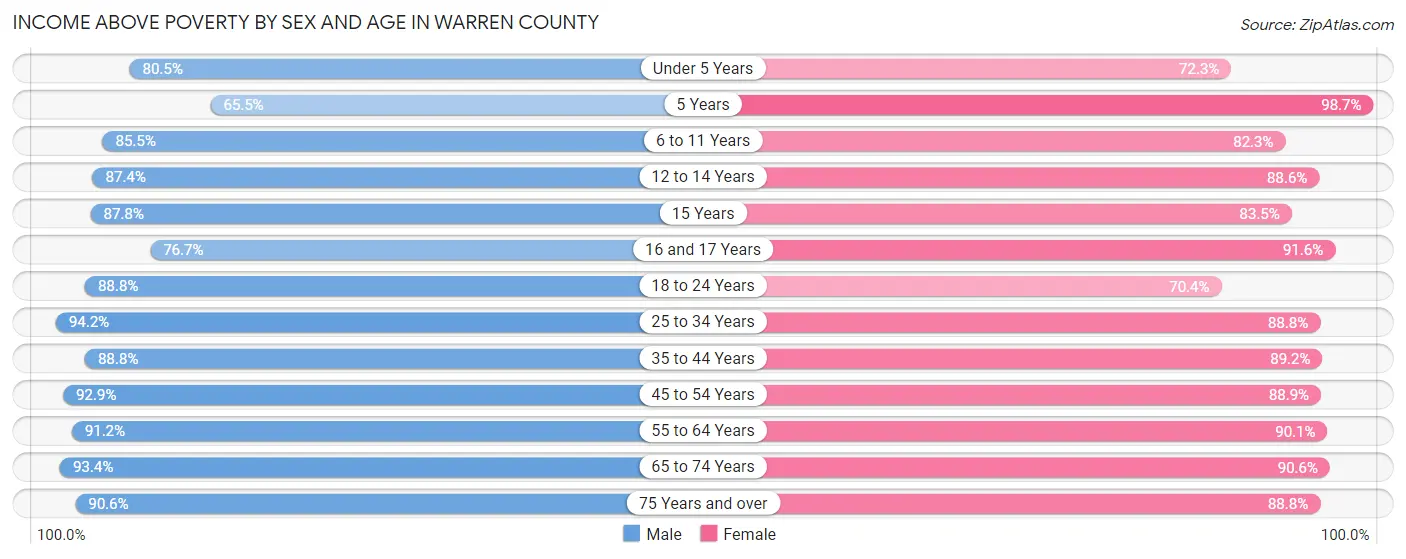
| Age Bracket | Male | Female |
| Under 5 Years | 793 (80.5%) | 688 (72.3%) |
| 5 Years | 112 (65.5%) | 146 (98.7%) |
| 6 to 11 Years | 1,104 (85.5%) | 954 (82.3%) |
| 12 to 14 Years | 540 (87.4%) | 637 (88.6%) |
| 15 Years | 179 (87.7%) | 177 (83.5%) |
| 16 and 17 Years | 388 (76.7%) | 379 (91.5%) |
| 18 to 24 Years | 1,266 (88.8%) | 860 (70.4%) |
| 25 to 34 Years | 1,910 (94.2%) | 1,643 (88.8%) |
| 35 to 44 Years | 1,821 (88.8%) | 1,772 (89.2%) |
| 45 to 54 Years | 2,266 (92.9%) | 2,081 (88.9%) |
| 55 to 64 Years | 2,942 (91.2%) | 2,773 (90.1%) |
| 65 to 74 Years | 2,404 (93.4%) | 2,327 (90.6%) |
| 75 Years and over | 1,529 (90.6%) | 1,775 (88.7%) |
| Total | 17,254 (89.8%) | 16,212 (86.9%) |
Income Below Poverty Among Married-Couple Families in Warren County
The poverty statistics for married-couple families in Warren County show that 3.6% or 291 of the total 8,136 families live below the poverty line. Families with 5 or more children have the highest poverty rate of 31.8%, comprising of 27 families. On the other hand, families with no children have the lowest poverty rate of 2.9%, which includes 167 families.
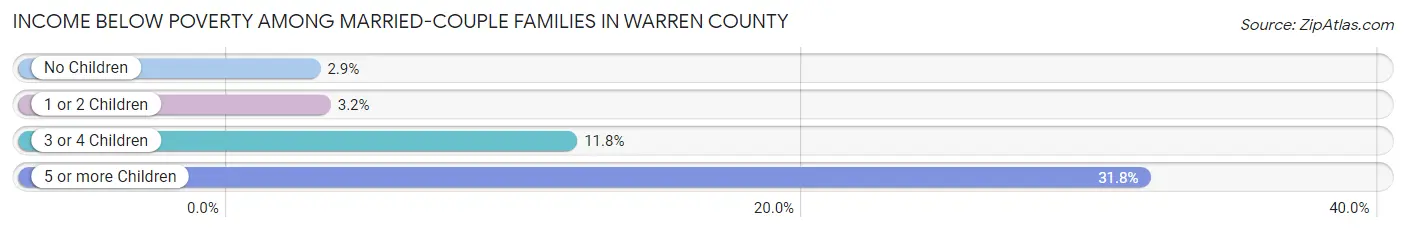
| Children | Above Poverty | Below Poverty |
| No Children | 5,645 (97.1%) | 167 (2.9%) |
| 1 or 2 Children | 1,888 (96.8%) | 63 (3.2%) |
| 3 or 4 Children | 254 (88.2%) | 34 (11.8%) |
| 5 or more Children | 58 (68.2%) | 27 (31.8%) |
| Total | 7,845 (96.4%) | 291 (3.6%) |
Income Below Poverty Among Single-Parent Households in Warren County
According to the poverty data in Warren County, 21.3% or 163 single-father households and 21.2% or 291 single-mother households are living below the poverty line. Among single-father households, those with 3 or 4 children have the highest poverty rate, with 18 households (45.0%) experiencing poverty. Likewise, among single-mother households, those with 5 or more children have the highest poverty rate, with 2 households (100.0%) falling below the poverty line.
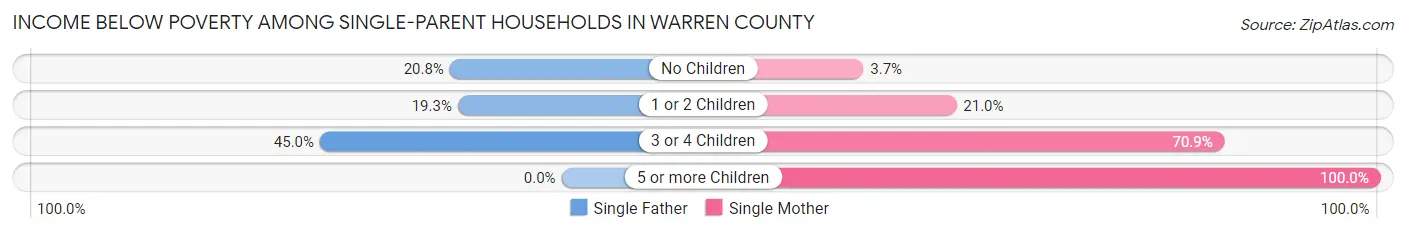
| Children | Single Father | Single Mother |
| No Children | 66 (20.8%) | 18 (3.7%) |
| 1 or 2 Children | 79 (19.3%) | 149 (21.0%) |
| 3 or 4 Children | 18 (45.0%) | 122 (70.9%) |
| 5 or more Children | 0 (0.0%) | 2 (100.0%) |
| Total | 163 (21.3%) | 291 (21.2%) |
Income Below Poverty Among Married-Couple vs Single-Parent Households in Warren County
The poverty data for Warren County shows that 291 of the married-couple family households (3.6%) and 454 of the single-parent households (21.2%) are living below the poverty level. Within the married-couple family households, those with 5 or more children have the highest poverty rate, with 27 households (31.8%) falling below the poverty line. Among the single-parent households, those with 5 or more children have the highest poverty rate, with 2 household (100.0%) living below poverty.
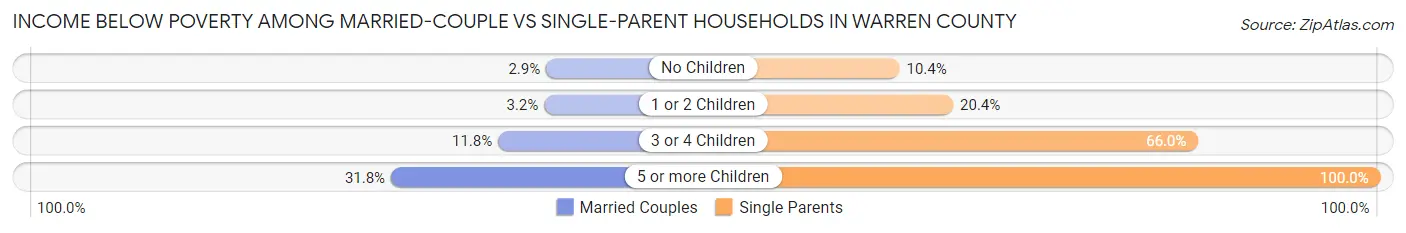
| Children | Married-Couple Families | Single-Parent Households |
| No Children | 167 (2.9%) | 84 (10.4%) |
| 1 or 2 Children | 63 (3.2%) | 228 (20.4%) |
| 3 or 4 Children | 34 (11.8%) | 140 (66.0%) |
| 5 or more Children | 27 (31.8%) | 2 (100.0%) |
| Total | 291 (3.6%) | 454 (21.2%) |
Race in Warren County
The most populous races in Warren County are White / Caucasian (36,672 | 95.3%), Two or more Races (1,132 | 2.9%), and Hispanic or Latino (527 | 1.4%).
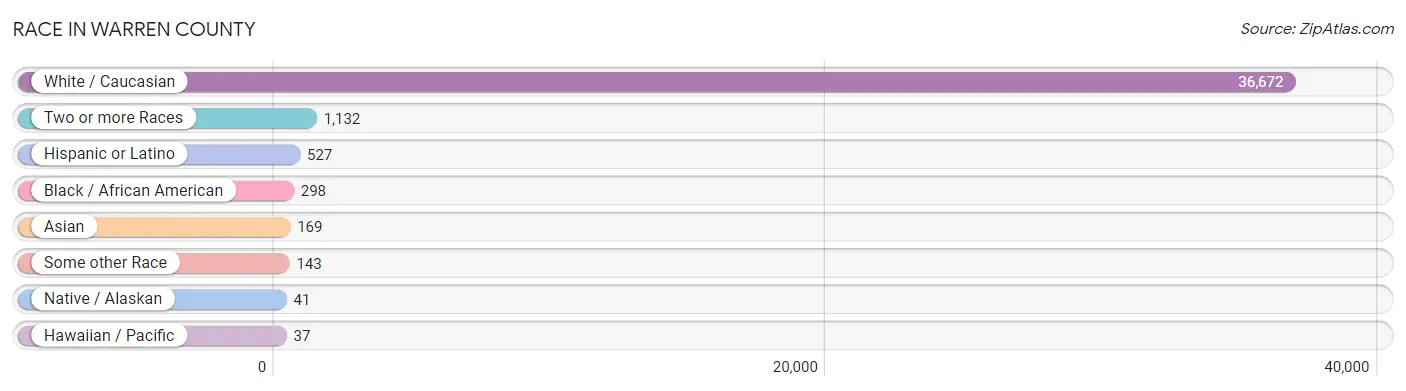
| Race | # Population | % Population |
| Asian | 169 | 0.4% |
| Black / African American | 298 | 0.8% |
| Hawaiian / Pacific | 37 | 0.1% |
| Hispanic or Latino | 527 | 1.4% |
| Native / Alaskan | 41 | 0.1% |
| White / Caucasian | 36,672 | 95.3% |
| Two or more Races | 1,132 | 2.9% |
| Some other Race | 143 | 0.4% |
| Total | 38,492 | 100.0% |
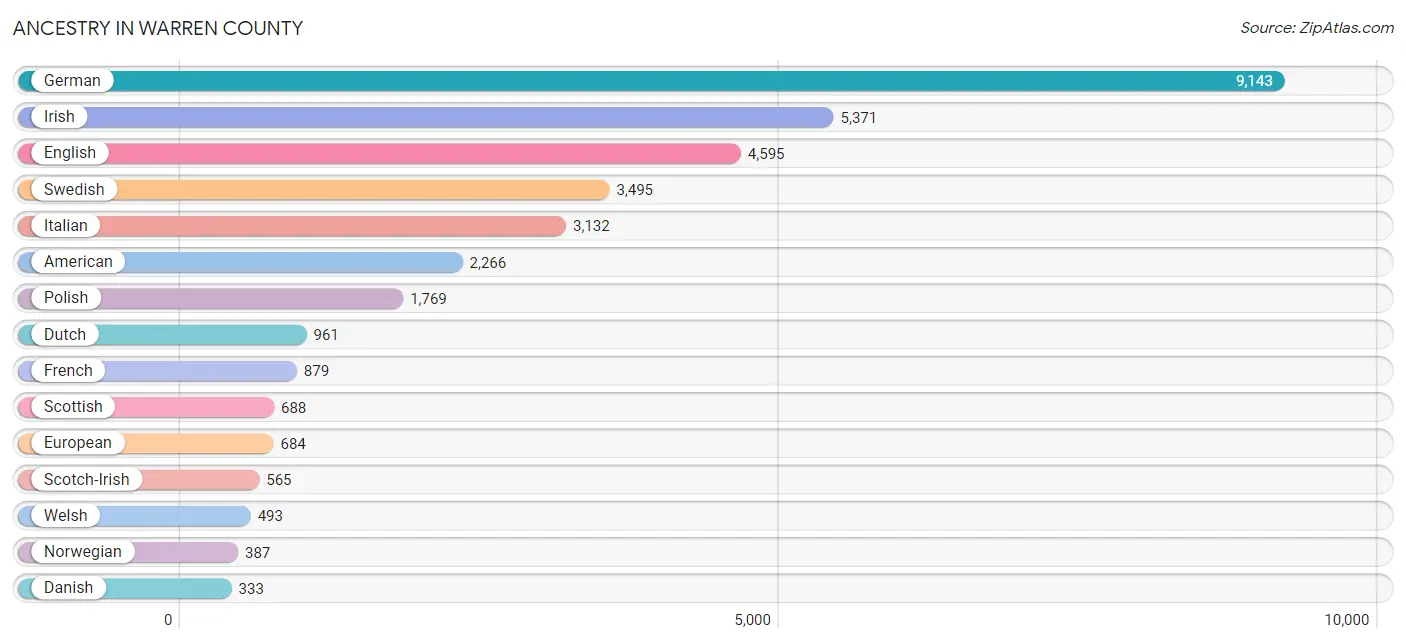
Ancestry in Warren County
The most populous ancestries reported in Warren County are German (9,143 | 23.7%), Irish (5,371 | 14.0%), English (4,595 | 11.9%), Swedish (3,495 | 9.1%), and Italian (3,132 | 8.1%), together accounting for 66.9% of all Warren County residents.
| Ancestry | # Population | % Population |
| African | 19 | 0.1% |
| American | 2,266 | 5.9% |
| Apache | 10 | 0.0% |
| Arab | 17 | 0.0% |
| Austrian | 48 | 0.1% |
| Belgian | 6 | 0.0% |
| Bhutanese | 10 | 0.0% |
| Blackfeet | 11 | 0.0% |
| British | 126 | 0.3% |
| Bulgarian | 5 | 0.0% |
| Burmese | 33 | 0.1% |
| Canadian | 19 | 0.1% |
| Central American | 45 | 0.1% |
| Central American Indian | 7 | 0.0% |
| Cherokee | 47 | 0.1% |
| Cheyenne | 1 | 0.0% |
| Chippewa | 2 | 0.0% |
| Choctaw | 1 | 0.0% |
| Colombian | 46 | 0.1% |
| Croatian | 67 | 0.2% |
| Cuban | 32 | 0.1% |
| Czech | 53 | 0.1% |
| Czechoslovakian | 111 | 0.3% |
| Danish | 333 | 0.9% |
| Delaware | 3 | 0.0% |
| Dominican | 24 | 0.1% |
| Dutch | 961 | 2.5% |
| Eastern European | 127 | 0.3% |
| English | 4,595 | 11.9% |
| Ethiopian | 2 | 0.0% |
| European | 684 | 1.8% |
| Fijian | 10 | 0.0% |
| Finnish | 62 | 0.2% |
| French | 879 | 2.3% |
| French Canadian | 210 | 0.5% |
| German | 9,143 | 23.7% |
| German Russian | 10 | 0.0% |
| Greek | 34 | 0.1% |
| Guatemalan | 18 | 0.1% |
| Honduran | 26 | 0.1% |
| Hungarian | 91 | 0.2% |
| Indian (Asian) | 15 | 0.0% |
| Irish | 5,371 | 14.0% |
| Iroquois | 25 | 0.1% |
| Italian | 3,132 | 8.1% |
| Jamaican | 11 | 0.0% |
| Korean | 89 | 0.2% |
| Latvian | 3 | 0.0% |
| Lebanese | 17 | 0.0% |
| Lithuanian | 30 | 0.1% |
| Malaysian | 10 | 0.0% |
| Mexican | 125 | 0.3% |
| Mongolian | 9 | 0.0% |
| Native Hawaiian | 28 | 0.1% |
| Nigerian | 56 | 0.2% |
| Northern European | 77 | 0.2% |
| Norwegian | 387 | 1.0% |
| Pennsylvania German | 197 | 0.5% |
| Polish | 1,769 | 4.6% |
| Portuguese | 60 | 0.2% |
| Puerto Rican | 148 | 0.4% |
| Romanian | 32 | 0.1% |
| Russian | 187 | 0.5% |
| Salvadoran | 1 | 0.0% |
| Scandinavian | 313 | 0.8% |
| Scotch-Irish | 565 | 1.5% |
| Scottish | 688 | 1.8% |
| Seminole | 2 | 0.0% |
| Serbian | 13 | 0.0% |
| Slavic | 23 | 0.1% |
| Slovak | 213 | 0.5% |
| Slovene | 27 | 0.1% |
| South American | 85 | 0.2% |
| Spaniard | 6 | 0.0% |
| Spanish | 8 | 0.0% |
| Sri Lankan | 86 | 0.2% |
| Subsaharan African | 77 | 0.2% |
| Swedish | 3,495 | 9.1% |
| Swiss | 259 | 0.7% |
| Thai | 29 | 0.1% |
| Turkish | 4 | 0.0% |
| Ukrainian | 125 | 0.3% |
| Welsh | 493 | 1.3% |
| Yugoslavian | 18 | 0.1% | View All 84 Rows |
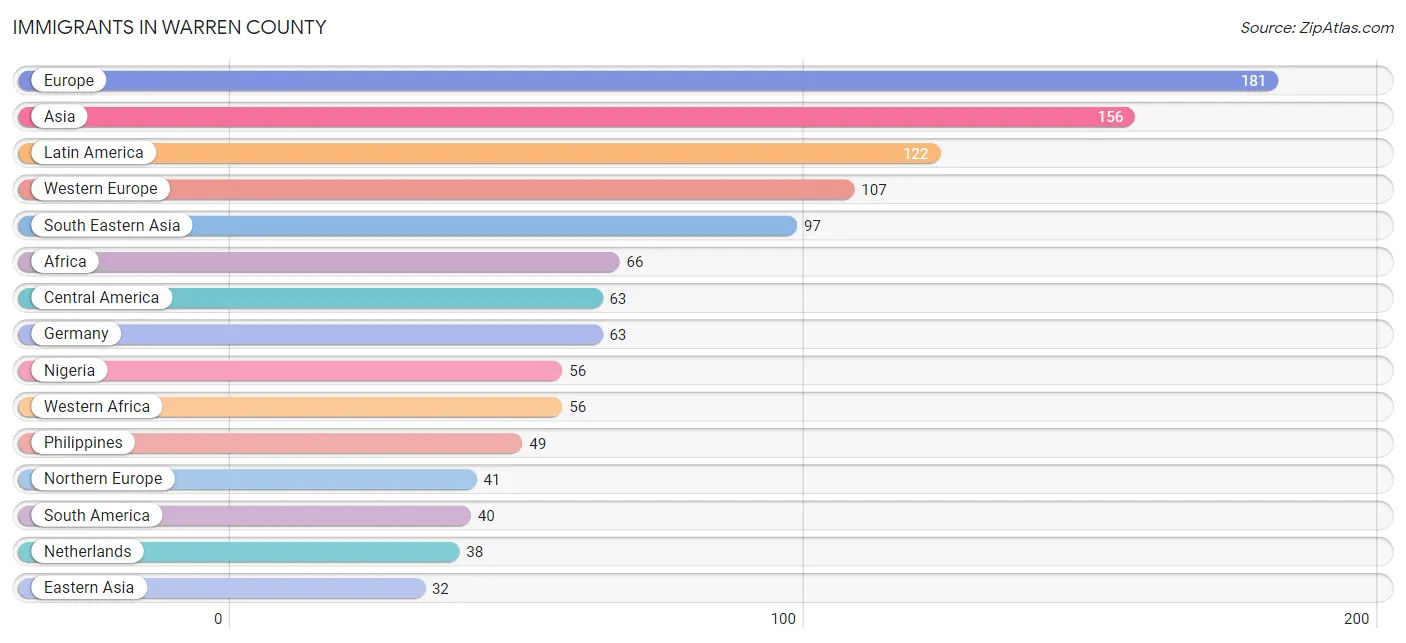
Immigrants in Warren County
The most numerous immigrant groups reported in Warren County came from Europe (181 | 0.5%), Asia (156 | 0.4%), Latin America (122 | 0.3%), Western Europe (107 | 0.3%), and South Eastern Asia (97 | 0.3%), together accounting for 1.7% of all Warren County residents.
| Immigration Origin | # Population | % Population |
| Africa | 66 | 0.2% |
| Asia | 156 | 0.4% |
| Austria | 6 | 0.0% |
| Brazil | 31 | 0.1% |
| Bulgaria | 5 | 0.0% |
| Canada | 12 | 0.0% |
| Caribbean | 19 | 0.1% |
| Central America | 63 | 0.2% |
| China | 6 | 0.0% |
| Colombia | 9 | 0.0% |
| Cuba | 13 | 0.0% |
| Dominican Republic | 1 | 0.0% |
| Eastern Africa | 10 | 0.0% |
| Eastern Asia | 32 | 0.1% |
| Eastern Europe | 23 | 0.1% |
| England | 25 | 0.1% |
| Europe | 181 | 0.5% |
| Germany | 63 | 0.2% |
| Guatemala | 27 | 0.1% |
| Honduras | 17 | 0.0% |
| India | 18 | 0.1% |
| Ireland | 4 | 0.0% |
| Italy | 10 | 0.0% |
| Jamaica | 5 | 0.0% |
| Japan | 3 | 0.0% |
| Korea | 23 | 0.1% |
| Laos | 10 | 0.0% |
| Latin America | 122 | 0.3% |
| Malaysia | 9 | 0.0% |
| Mexico | 19 | 0.1% |
| Nepal | 6 | 0.0% |
| Netherlands | 38 | 0.1% |
| Nigeria | 56 | 0.2% |
| Northern Europe | 41 | 0.1% |
| Philippines | 49 | 0.1% |
| Romania | 4 | 0.0% |
| Russia | 14 | 0.0% |
| Scotland | 5 | 0.0% |
| South America | 40 | 0.1% |
| South Central Asia | 27 | 0.1% |
| South Eastern Asia | 97 | 0.3% |
| Southern Europe | 10 | 0.0% |
| Taiwan | 6 | 0.0% |
| Vietnam | 29 | 0.1% |
| Western Africa | 56 | 0.2% |
| Western Europe | 107 | 0.3% | View All 46 Rows |
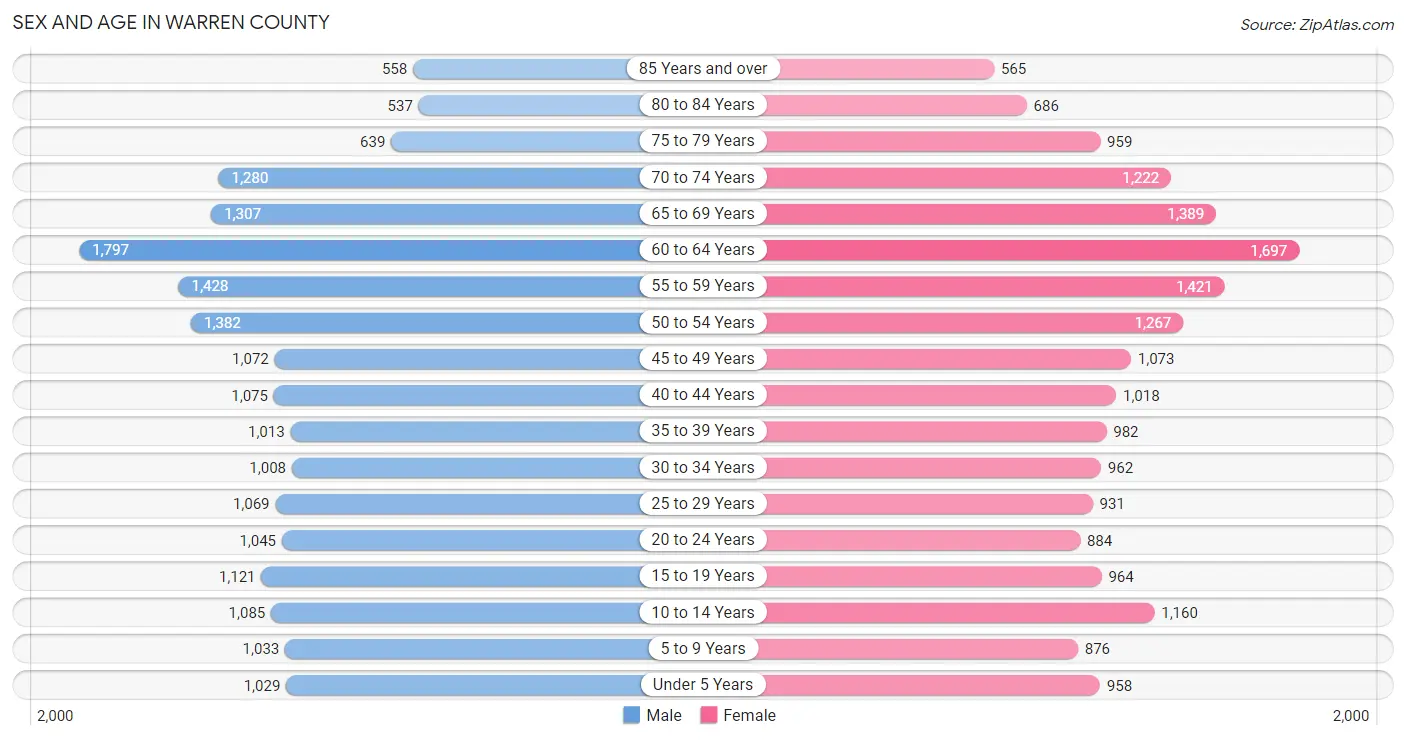
Sex and Age in Warren County
Sex and Age in Warren County
The most populous age groups in Warren County are 60 to 64 Years (1,797 | 9.2%) for men and 60 to 64 Years (1,697 | 8.9%) for women.
| Age Bracket | Male | Female |
| Under 5 Years | 1,029 (5.3%) | 958 (5.0%) |
| 5 to 9 Years | 1,033 (5.3%) | 876 (4.6%) |
| 10 to 14 Years | 1,085 (5.6%) | 1,160 (6.1%) |
| 15 to 19 Years | 1,121 (5.8%) | 964 (5.1%) |
| 20 to 24 Years | 1,045 (5.4%) | 884 (4.6%) |
| 25 to 29 Years | 1,069 (5.5%) | 931 (4.9%) |
| 30 to 34 Years | 1,008 (5.2%) | 962 (5.1%) |
| 35 to 39 Years | 1,013 (5.2%) | 982 (5.2%) |
| 40 to 44 Years | 1,075 (5.5%) | 1,018 (5.3%) |
| 45 to 49 Years | 1,072 (5.5%) | 1,073 (5.6%) |
| 50 to 54 Years | 1,382 (7.1%) | 1,267 (6.7%) |
| 55 to 59 Years | 1,428 (7.3%) | 1,421 (7.5%) |
| 60 to 64 Years | 1,797 (9.2%) | 1,697 (8.9%) |
| 65 to 69 Years | 1,307 (6.7%) | 1,389 (7.3%) |
| 70 to 74 Years | 1,280 (6.6%) | 1,222 (6.4%) |
| 75 to 79 Years | 639 (3.3%) | 959 (5.0%) |
| 80 to 84 Years | 537 (2.8%) | 686 (3.6%) |
| 85 Years and over | 558 (2.9%) | 565 (3.0%) |
| Total | 19,478 (100.0%) | 19,014 (100.0%) |
Families and Households in Warren County
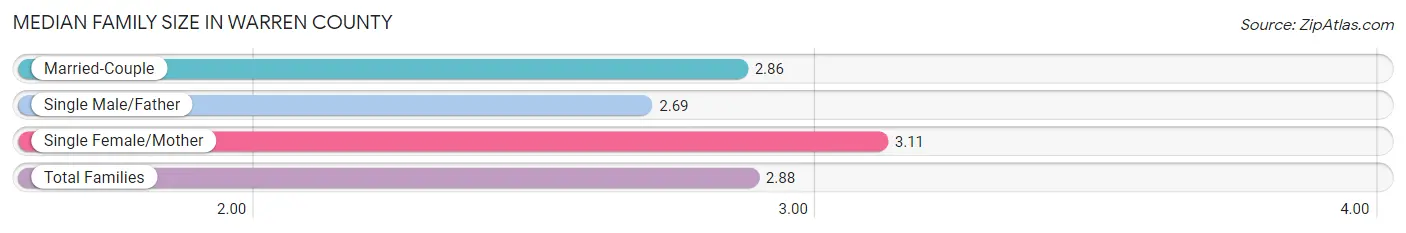
Median Family Size in Warren County
The median family size in Warren County is 2.88 persons per family, with single female/mother families (1,374 | 13.4%) accounting for the largest median family size of 3.11 persons per family. On the other hand, single male/father families (766 | 7.4%) represent the smallest median family size with 2.69 persons per family.
| Family Type | # Families | Family Size |
| Married-Couple | 8,136 (79.2%) | 2.86 |
| Single Male/Father | 766 (7.4%) | 2.69 |
| Single Female/Mother | 1,374 (13.4%) | 3.11 |
| Total Families | 10,276 (100.0%) | 2.88 |
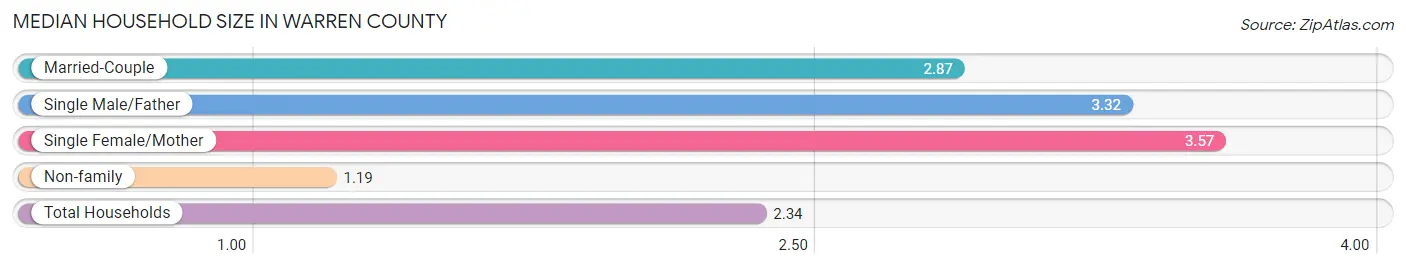
Median Household Size in Warren County
The median household size in Warren County is 2.34 persons per household, with single female/mother households (1,374 | 8.5%) accounting for the largest median household size of 3.57 persons per household. non-family households (5,933 | 36.6%) represent the smallest median household size with 1.19 persons per household.
| Household Type | # Households | Household Size |
| Married-Couple | 8,136 (50.2%) | 2.87 |
| Single Male/Father | 766 (4.7%) | 3.32 |
| Single Female/Mother | 1,374 (8.5%) | 3.57 |
| Non-family | 5,933 (36.6%) | 1.19 |
| Total Households | 16,209 (100.0%) | 2.34 |
Household Size by Marriage Status in Warren County
Out of a total of 16,209 households in Warren County, 10,276 (63.4%) are family households, while 5,933 (36.6%) are nonfamily households. The most numerous type of family households are 2-person households, comprising 5,691, and the most common type of nonfamily households are 1-person households, comprising 5,098.
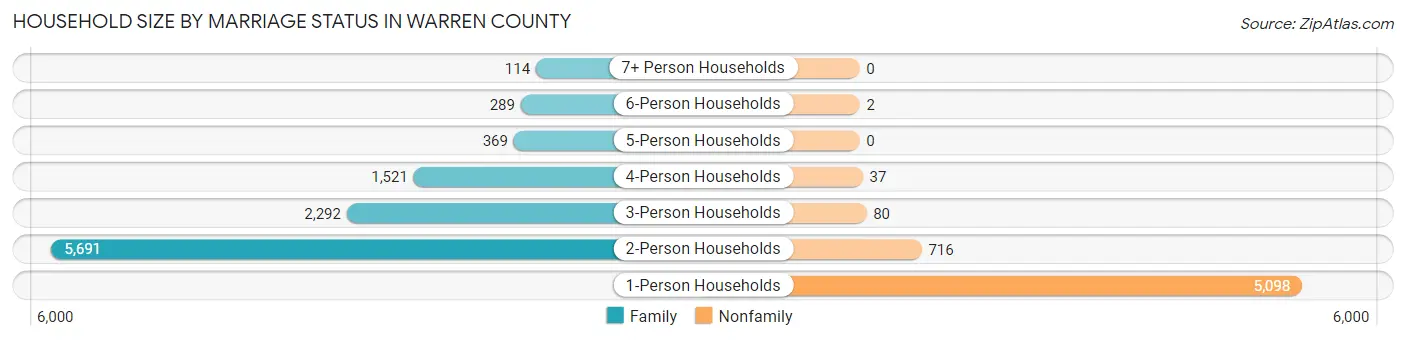
| Household Size | Family Households | Nonfamily Households |
| 1-Person Households | - | 5,098 (31.5%) |
| 2-Person Households | 5,691 (35.1%) | 716 (4.4%) |
| 3-Person Households | 2,292 (14.1%) | 80 (0.5%) |
| 4-Person Households | 1,521 (9.4%) | 37 (0.2%) |
| 5-Person Households | 369 (2.3%) | 0 (0.0%) |
| 6-Person Households | 289 (1.8%) | 2 (0.0%) |
| 7+ Person Households | 114 (0.7%) | 0 (0.0%) |
| Total | 10,276 (63.4%) | 5,933 (36.6%) |
Female Fertility in Warren County
Fertility by Age in Warren County
Average fertility rate in Warren County is 42.0 births per 1,000 women. Women in the age bracket of 20 to 34 years have the highest fertility rate with 79.0 births per 1,000 women. Women in the age bracket of 20 to 34 years acount for 73.2% of all women with births.
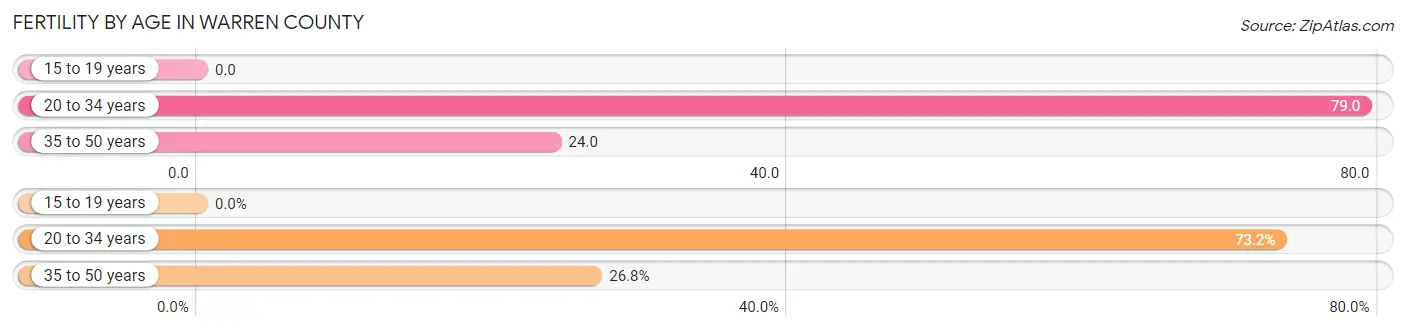
| Age Bracket | Women with Births | Births / 1,000 Women |
| 15 to 19 years | 0 (0.0%) | 0.0 |
| 20 to 34 years | 219 (73.2%) | 79.0 |
| 35 to 50 years | 80 (26.8%) | 24.0 |
| Total | 299 (100.0%) | 42.0 |
Fertility by Age by Marriage Status in Warren County
46.8% of women with births (299) in Warren County are married. The highest percentage of unmarried women with births falls into 35 to 50 years age bracket with 61.3% of them unmarried at the time of birth, while the lowest percentage of unmarried women with births belong to 20 to 34 years age bracket with 50.2% of them unmarried.
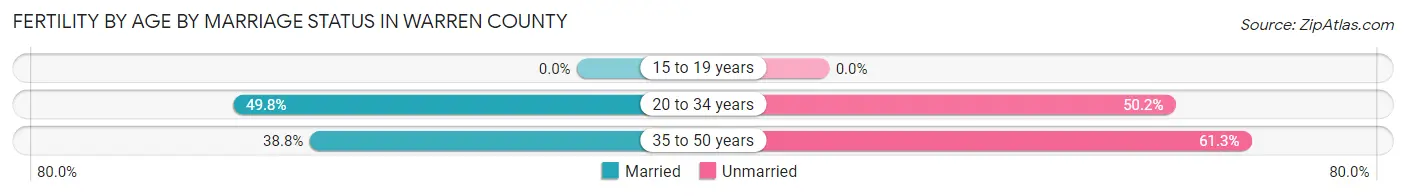
| Age Bracket | Married | Unmarried |
| 15 to 19 years | 0 (0.0%) | 0 (0.0%) |
| 20 to 34 years | 109 (49.8%) | 110 (50.2%) |
| 35 to 50 years | 31 (38.8%) | 49 (61.3%) |
| Total | 140 (46.8%) | 159 (53.2%) |
Fertility by Education in Warren County
Average fertility rate in Warren County is 42.0 births per 1,000 women. Women with the education attainment of high school diploma have the highest fertility rate of 52.0 births per 1,000 women, while women with the education attainment of less than high school have the lowest fertility at 11.0 births per 1,000 women. Women with the education attainment of high school diploma represent 42.1% of all women with births.
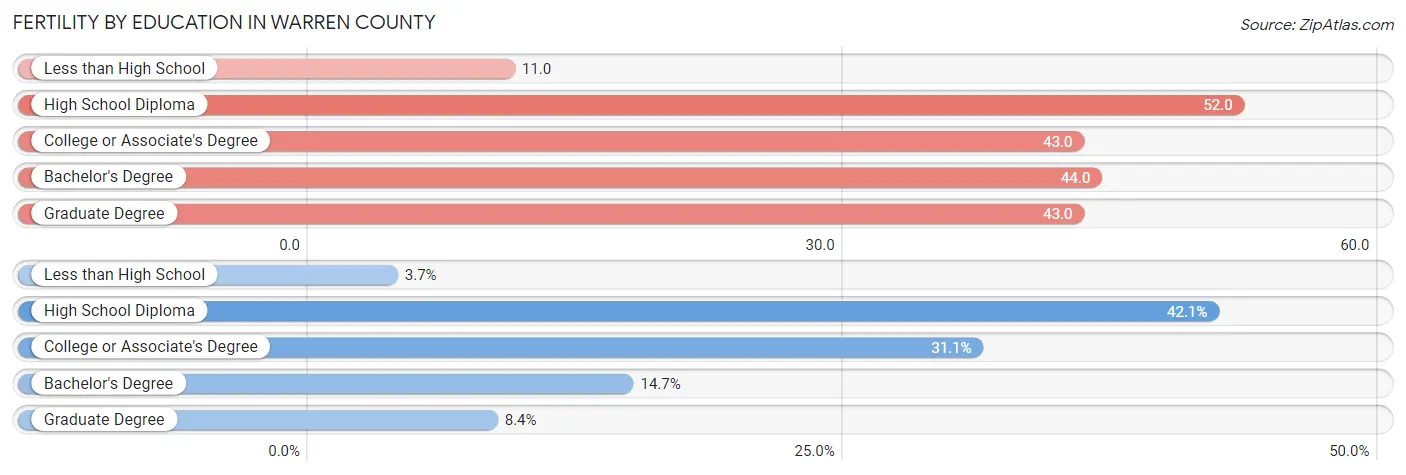
| Educational Attainment | Women with Births | Births / 1,000 Women |
| Less than High School | 11 (3.7%) | 11.0 |
| High School Diploma | 126 (42.1%) | 52.0 |
| College or Associate's Degree | 93 (31.1%) | 43.0 |
| Bachelor's Degree | 44 (14.7%) | 44.0 |
| Graduate Degree | 25 (8.4%) | 43.0 |
| Total | 299 (100.0%) | 42.0 |
Fertility by Education by Marriage Status in Warren County
53.2% of women with births in Warren County are unmarried. Women with the educational attainment of less than high school are most likely to be married with 100.0% of them married at childbirth, while women with the educational attainment of high school diploma are least likely to be married with 86.5% of them unmarried at childbirth.
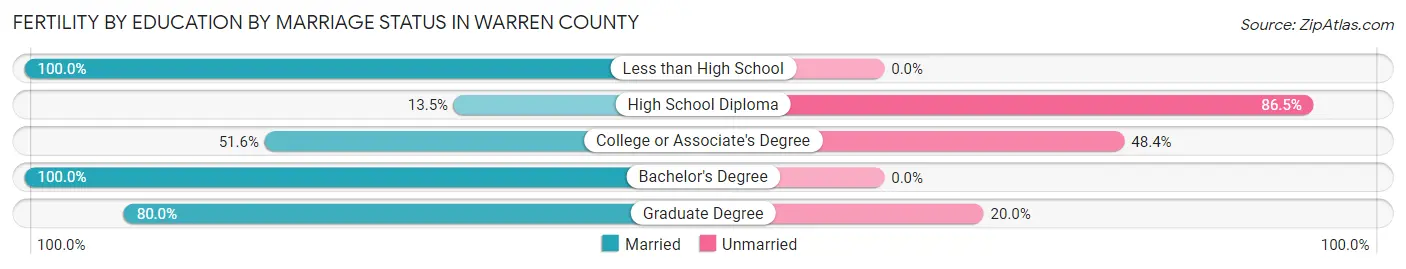
| Educational Attainment | Married | Unmarried |
| Less than High School | 11 (100.0%) | 0 (0.0%) |
| High School Diploma | 17 (13.5%) | 109 (86.5%) |
| College or Associate's Degree | 48 (51.6%) | 45 (48.4%) |
| Bachelor's Degree | 44 (100.0%) | 0 (0.0%) |
| Graduate Degree | 20 (80.0%) | 5 (20.0%) |
| Total | 140 (46.8%) | 159 (53.2%) |
Employment Characteristics in Warren County
Employment by Class of Employer in Warren County
Among the 16,977 employed individuals in Warren County, private company employees (11,585 | 68.2%), not-for-profit organizations (1,906 | 11.2%), and local government employees (954 | 5.6%) make up the most common classes of employment.
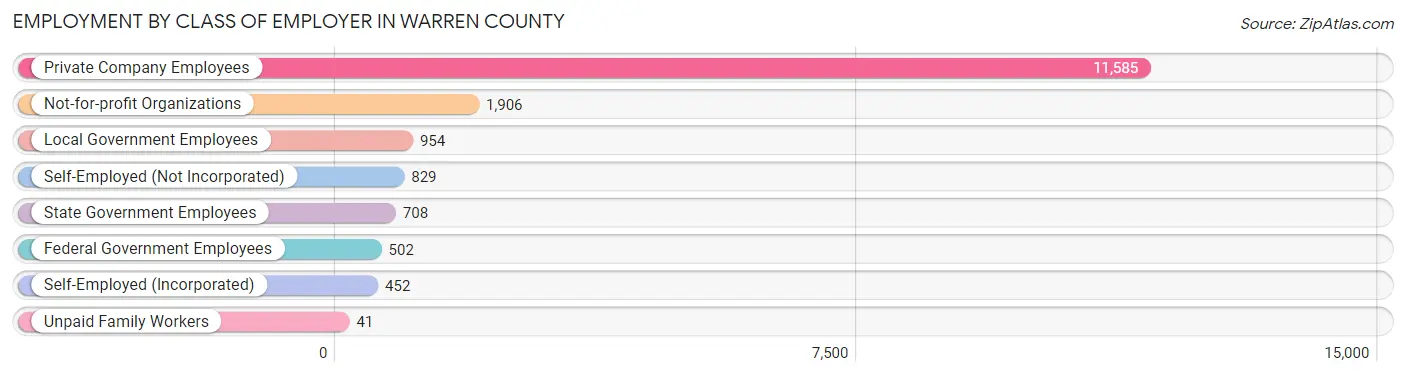
| Employer Class | # Employees | % Employees |
| Private Company Employees | 11,585 | 68.2% |
| Self-Employed (Incorporated) | 452 | 2.7% |
| Self-Employed (Not Incorporated) | 829 | 4.9% |
| Not-for-profit Organizations | 1,906 | 11.2% |
| Local Government Employees | 954 | 5.6% |
| State Government Employees | 708 | 4.2% |
| Federal Government Employees | 502 | 3.0% |
| Unpaid Family Workers | 41 | 0.2% |
| Total | 16,977 | 100.0% |
Employment Status by Age in Warren County
According to the labor force statistics for Warren County, out of the total population over 16 years of age (31,934), 56.8% or 18,139 individuals are in the labor force, with 4.3% or 780 of them unemployed. The age group with the highest labor force participation rate is 30 to 34 years, with 87.7% or 1,728 individuals in the labor force. Within the labor force, the 16 to 19 years age range has the highest percentage of unemployed individuals, with 9.9% or 79 of them being unemployed.
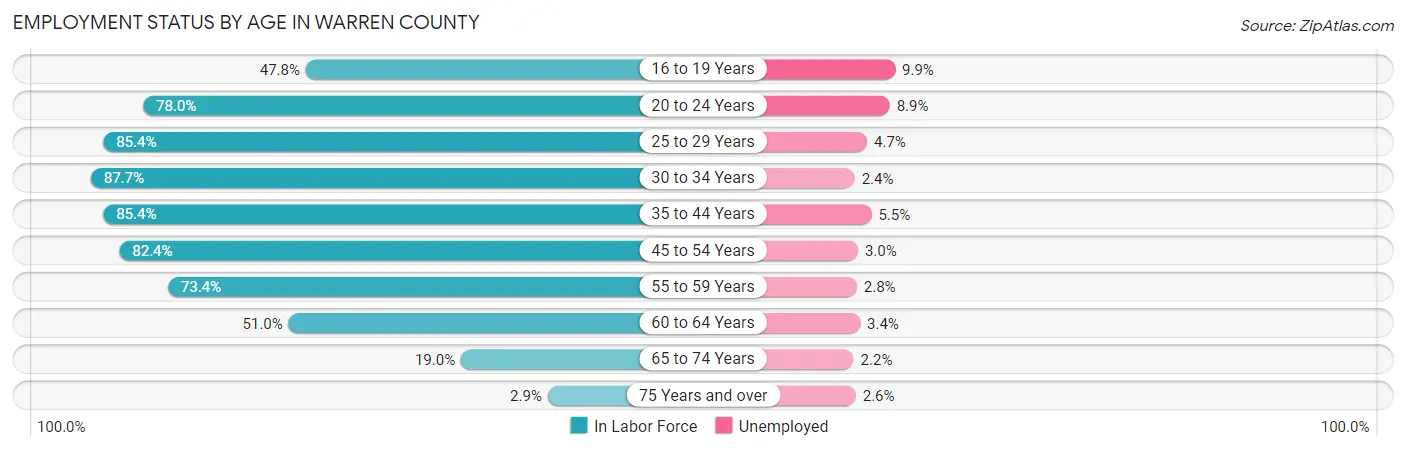
| Age Bracket | In Labor Force | Unemployed |
| 16 to 19 Years | 797 (47.8%) | 79 (9.9%) |
| 20 to 24 Years | 1,505 (78.0%) | 134 (8.9%) |
| 25 to 29 Years | 1,708 (85.4%) | 80 (4.7%) |
| 30 to 34 Years | 1,728 (87.7%) | 41 (2.4%) |
| 35 to 44 Years | 3,491 (85.4%) | 192 (5.5%) |
| 45 to 54 Years | 3,950 (82.4%) | 118 (3.0%) |
| 55 to 59 Years | 2,091 (73.4%) | 59 (2.8%) |
| 60 to 64 Years | 1,782 (51.0%) | 61 (3.4%) |
| 65 to 74 Years | 988 (19.0%) | 22 (2.2%) |
| 75 Years and over | 114 (2.9%) | 3 (2.6%) |
| Total | 18,139 (56.8%) | 780 (4.3%) |
Employment Status by Educational Attainment in Warren County
According to labor force statistics for Warren County, 76.8% of individuals (14,742) out of the total population between 25 and 64 years of age (19,195) are in the labor force, with 3.7% or 545 of them being unemployed. The group with the highest labor force participation rate are those with the educational attainment of bachelor's degree or higher, with 84.8% or 3,290 individuals in the labor force. Within the labor force, individuals with college / associate degree education have the highest percentage of unemployment, with 4.1% or 191 of them being unemployed.
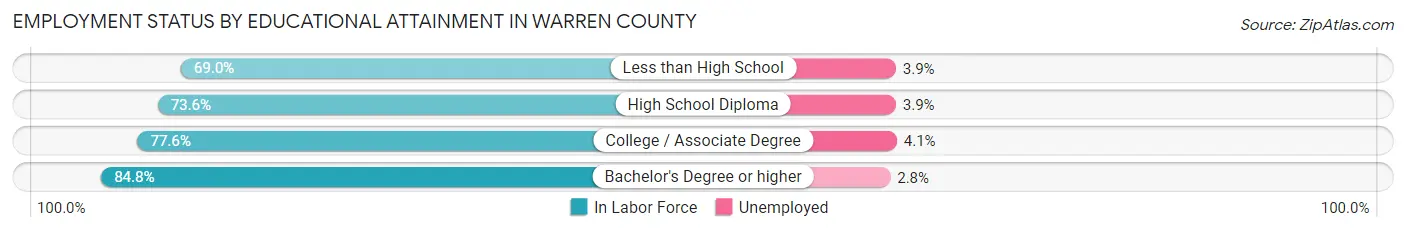
| Educational Attainment | In Labor Force | Unemployed |
| Less than High School | 785 (69.0%) | 44 (3.9%) |
| High School Diploma | 6,020 (73.6%) | 319 (3.9%) |
| College / Associate Degree | 4,654 (77.6%) | 246 (4.1%) |
| Bachelor's Degree or higher | 3,290 (84.8%) | 109 (2.8%) |
| Total | 14,742 (76.8%) | 710 (3.7%) |
Employment Occupations by Sex in Warren County
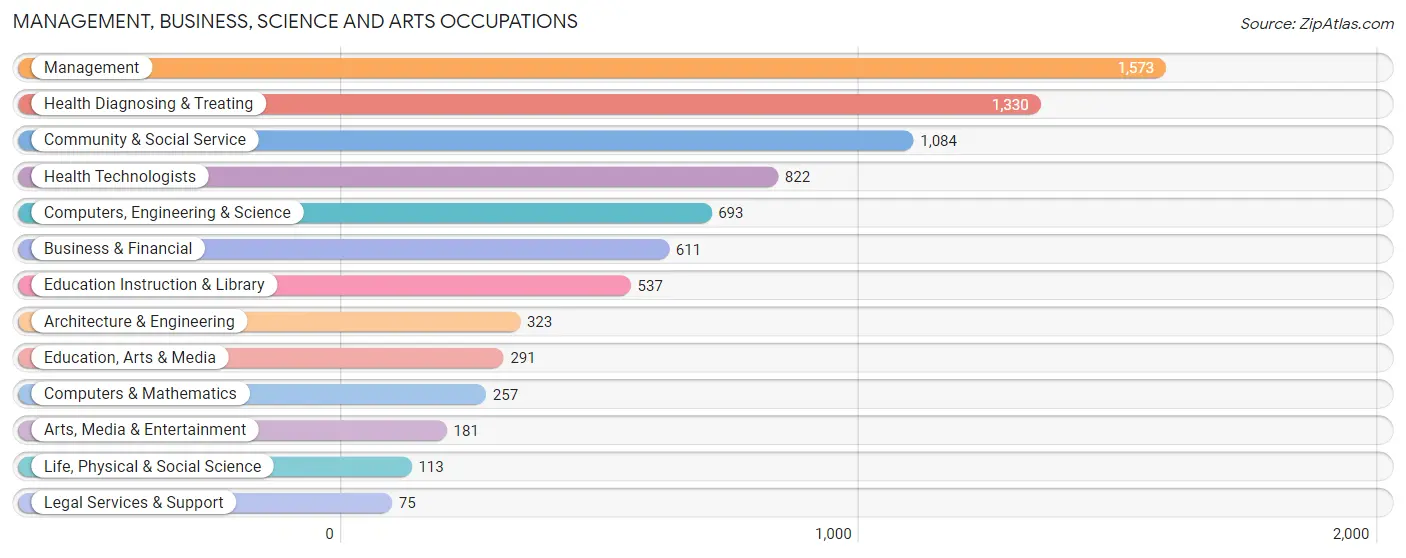
Management, Business, Science and Arts Occupations
The most common Management, Business, Science and Arts occupations in Warren County are Management (1,573 | 9.1%), Health Diagnosing & Treating (1,330 | 7.7%), Community & Social Service (1,084 | 6.2%), Health Technologists (822 | 4.7%), and Computers, Engineering & Science (693 | 4.0%).
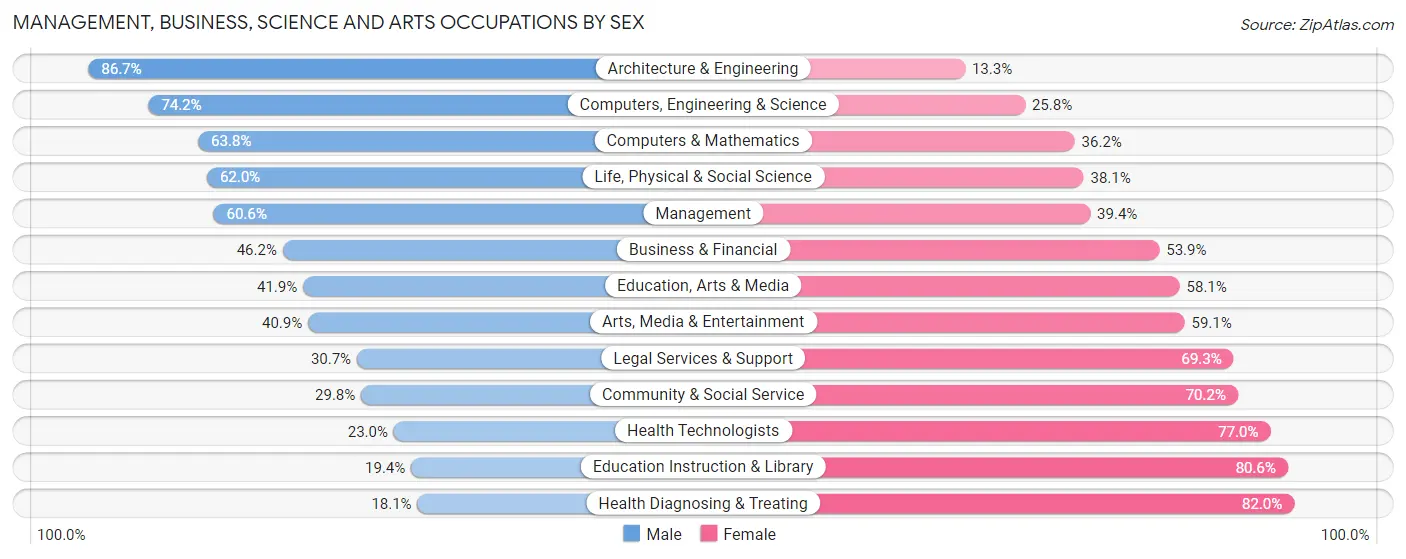
Management, Business, Science and Arts Occupations by Sex
Within the Management, Business, Science and Arts occupations in Warren County, the most male-oriented occupations are Architecture & Engineering (86.7%), Computers, Engineering & Science (74.2%), and Computers & Mathematics (63.8%), while the most female-oriented occupations are Health Diagnosing & Treating (82.0%), Education Instruction & Library (80.6%), and Health Technologists (77.0%).
| Occupation | Male | Female |
| Management | 953 (60.6%) | 620 (39.4%) |
| Business & Financial | 282 (46.2%) | 329 (53.8%) |
| Computers, Engineering & Science | 514 (74.2%) | 179 (25.8%) |
| Computers & Mathematics | 164 (63.8%) | 93 (36.2%) |
| Architecture & Engineering | 280 (86.7%) | 43 (13.3%) |
| Life, Physical & Social Science | 70 (62.0%) | 43 (38.1%) |
| Community & Social Service | 323 (29.8%) | 761 (70.2%) |
| Education, Arts & Media | 122 (41.9%) | 169 (58.1%) |
| Legal Services & Support | 23 (30.7%) | 52 (69.3%) |
| Education Instruction & Library | 104 (19.4%) | 433 (80.6%) |
| Arts, Media & Entertainment | 74 (40.9%) | 107 (59.1%) |
| Health Diagnosing & Treating | 240 (18.0%) | 1,090 (82.0%) |
| Health Technologists | 189 (23.0%) | 633 (77.0%) |
| Total (Category) | 2,312 (43.7%) | 2,979 (56.3%) |
| Total (Overall) | 9,451 (54.4%) | 7,912 (45.6%) |
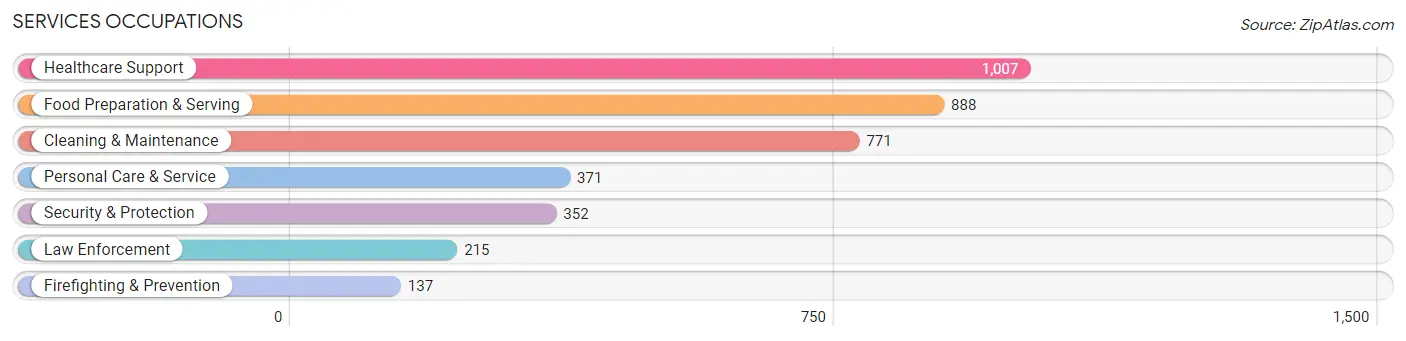
Services Occupations
The most common Services occupations in Warren County are Healthcare Support (1,007 | 5.8%), Food Preparation & Serving (888 | 5.1%), Cleaning & Maintenance (771 | 4.4%), Personal Care & Service (371 | 2.1%), and Security & Protection (352 | 2.0%).
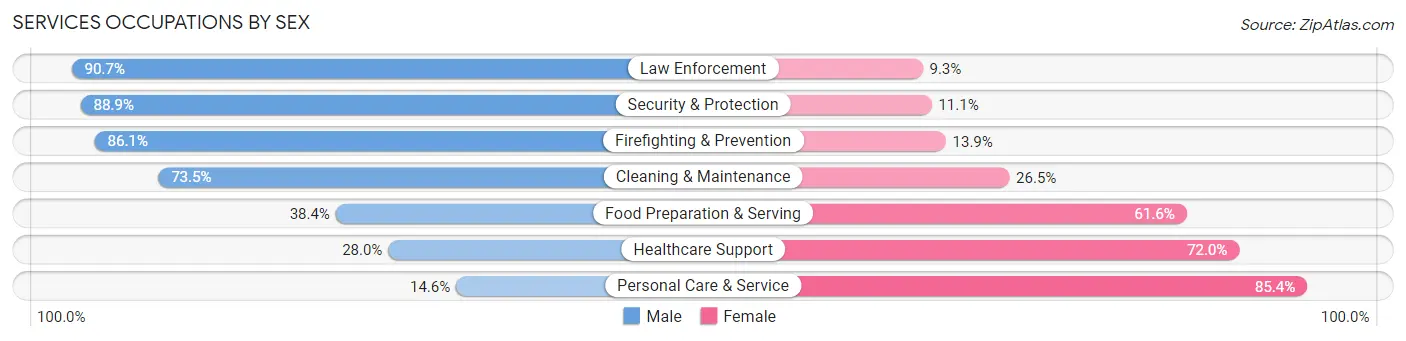
Services Occupations by Sex
Within the Services occupations in Warren County, the most male-oriented occupations are Law Enforcement (90.7%), Security & Protection (88.9%), and Firefighting & Prevention (86.1%), while the most female-oriented occupations are Personal Care & Service (85.4%), Healthcare Support (72.0%), and Food Preparation & Serving (61.6%).
| Occupation | Male | Female |
| Healthcare Support | 282 (28.0%) | 725 (72.0%) |
| Security & Protection | 313 (88.9%) | 39 (11.1%) |
| Firefighting & Prevention | 118 (86.1%) | 19 (13.9%) |
| Law Enforcement | 195 (90.7%) | 20 (9.3%) |
| Food Preparation & Serving | 341 (38.4%) | 547 (61.6%) |
| Cleaning & Maintenance | 567 (73.5%) | 204 (26.5%) |
| Personal Care & Service | 54 (14.6%) | 317 (85.4%) |
| Total (Category) | 1,557 (45.9%) | 1,832 (54.1%) |
| Total (Overall) | 9,451 (54.4%) | 7,912 (45.6%) |
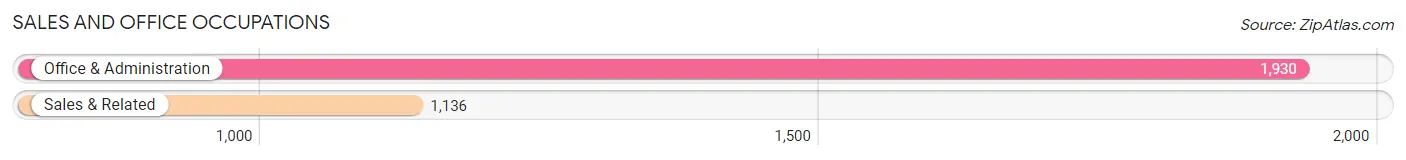
Sales and Office Occupations
The most common Sales and Office occupations in Warren County are Office & Administration (1,930 | 11.1%), and Sales & Related (1,136 | 6.5%).
Sales and Office Occupations by Sex
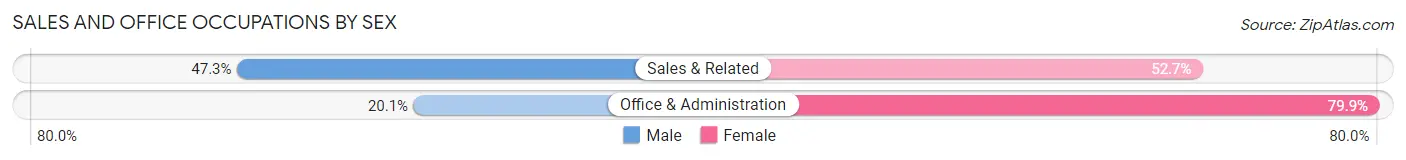
| Occupation | Male | Female |
| Sales & Related | 537 (47.3%) | 599 (52.7%) |
| Office & Administration | 388 (20.1%) | 1,542 (79.9%) |
| Total (Category) | 925 (30.2%) | 2,141 (69.8%) |
| Total (Overall) | 9,451 (54.4%) | 7,912 (45.6%) |
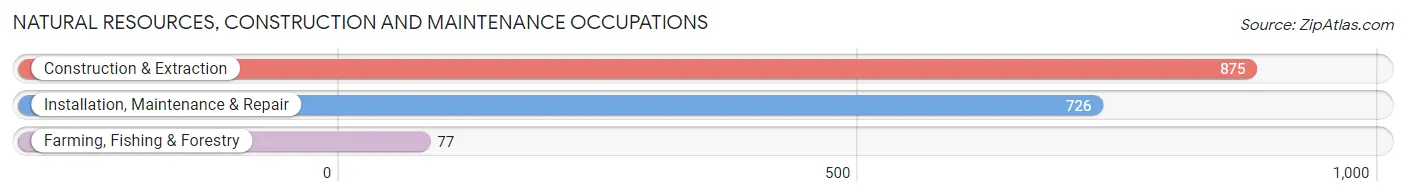
Natural Resources, Construction and Maintenance Occupations
The most common Natural Resources, Construction and Maintenance occupations in Warren County are Construction & Extraction (875 | 5.0%), Installation, Maintenance & Repair (726 | 4.2%), and Farming, Fishing & Forestry (77 | 0.4%).
Natural Resources, Construction and Maintenance Occupations by Sex
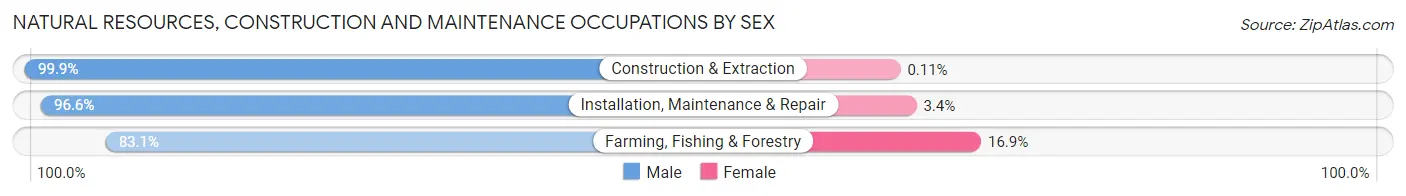
| Occupation | Male | Female |
| Farming, Fishing & Forestry | 64 (83.1%) | 13 (16.9%) |
| Construction & Extraction | 874 (99.9%) | 1 (0.1%) |
| Installation, Maintenance & Repair | 701 (96.6%) | 25 (3.4%) |
| Total (Category) | 1,639 (97.7%) | 39 (2.3%) |
| Total (Overall) | 9,451 (54.4%) | 7,912 (45.6%) |
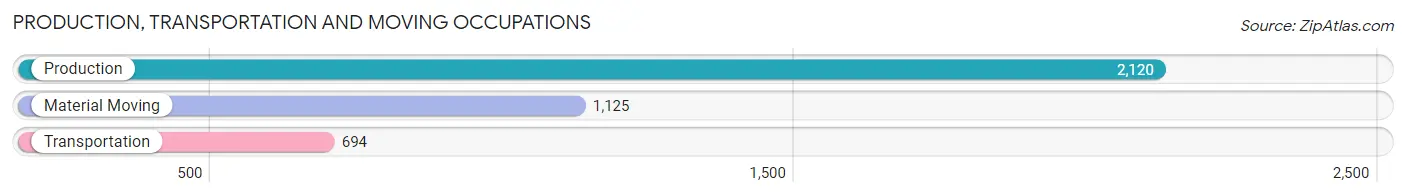
Production, Transportation and Moving Occupations
The most common Production, Transportation and Moving occupations in Warren County are Production (2,120 | 12.2%), Material Moving (1,125 | 6.5%), and Transportation (694 | 4.0%).
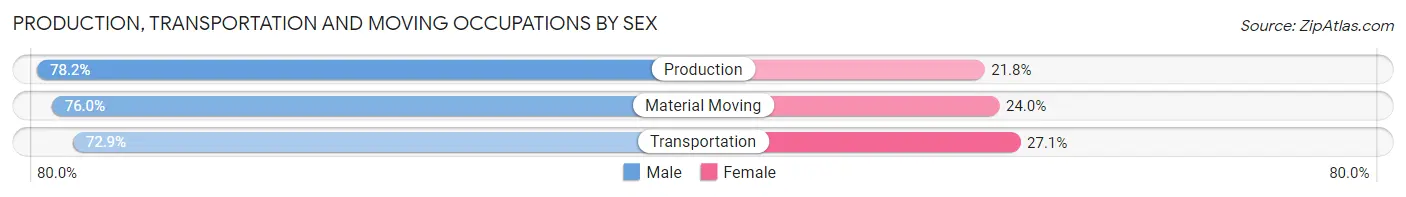
Production, Transportation and Moving Occupations by Sex
| Occupation | Male | Female |
| Production | 1,657 (78.2%) | 463 (21.8%) |
| Transportation | 506 (72.9%) | 188 (27.1%) |
| Material Moving | 855 (76.0%) | 270 (24.0%) |
| Total (Category) | 3,018 (76.6%) | 921 (23.4%) |
| Total (Overall) | 9,451 (54.4%) | 7,912 (45.6%) |
Employment Industries by Sex in Warren County
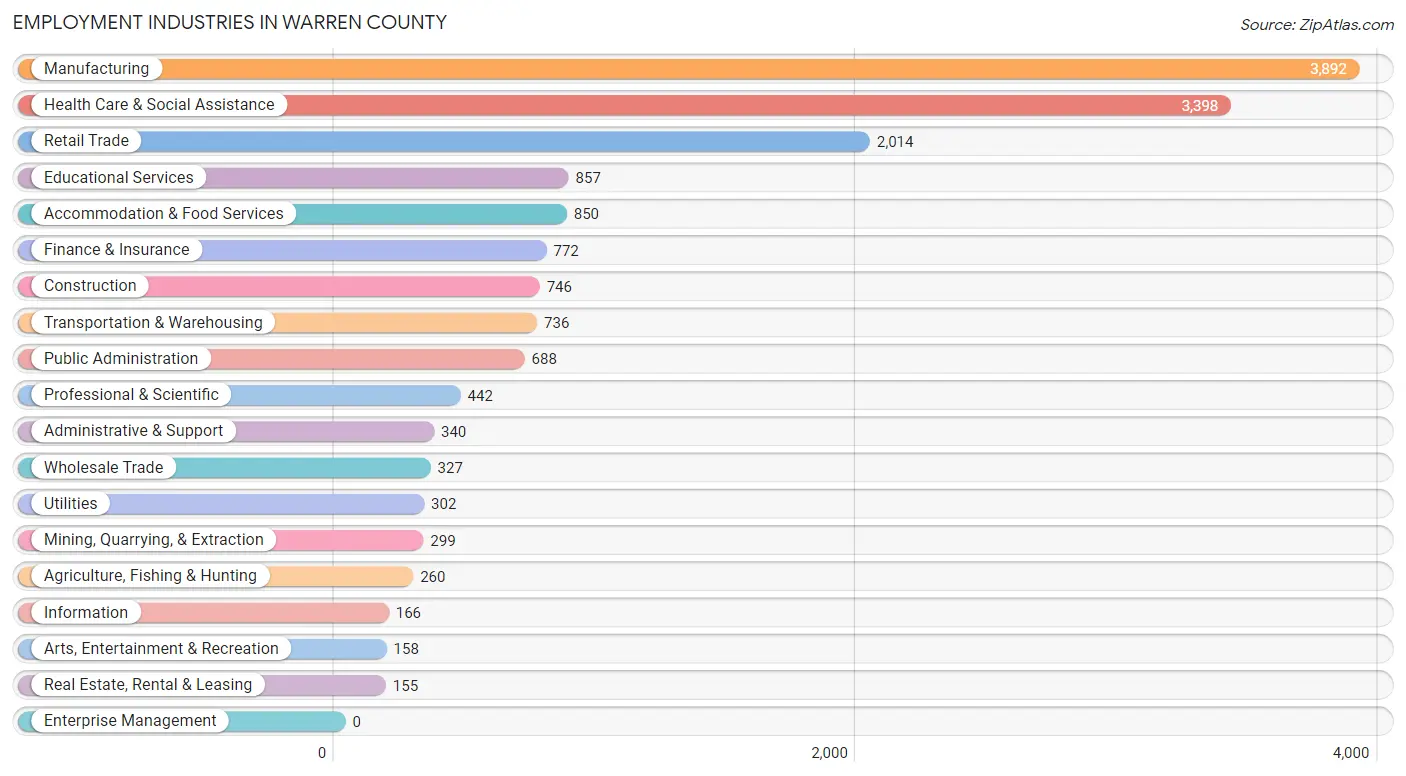
Employment Industries in Warren County
The major employment industries in Warren County include Manufacturing (3,892 | 22.4%), Health Care & Social Assistance (3,398 | 19.6%), Retail Trade (2,014 | 11.6%), Educational Services (857 | 4.9%), and Accommodation & Food Services (850 | 4.9%).
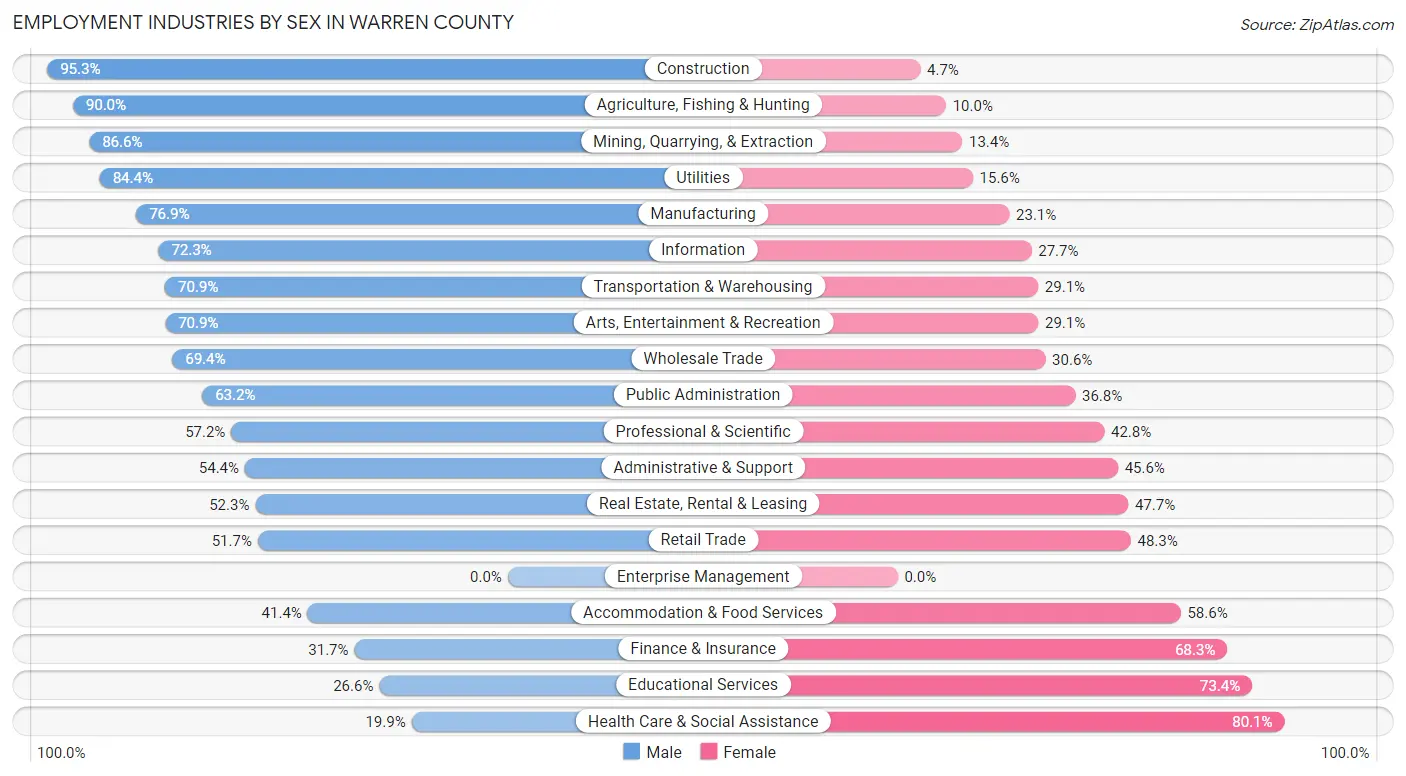
Employment Industries by Sex in Warren County
The Warren County industries that see more men than women are Construction (95.3%), Agriculture, Fishing & Hunting (90.0%), and Mining, Quarrying, & Extraction (86.6%), whereas the industries that tend to have a higher number of women are Health Care & Social Assistance (80.1%), Educational Services (73.4%), and Finance & Insurance (68.3%).
| Industry | Male | Female |
| Agriculture, Fishing & Hunting | 234 (90.0%) | 26 (10.0%) |
| Mining, Quarrying, & Extraction | 259 (86.6%) | 40 (13.4%) |
| Construction | 711 (95.3%) | 35 (4.7%) |
| Manufacturing | 2,992 (76.9%) | 900 (23.1%) |
| Wholesale Trade | 227 (69.4%) | 100 (30.6%) |
| Retail Trade | 1,042 (51.7%) | 972 (48.3%) |
| Transportation & Warehousing | 522 (70.9%) | 214 (29.1%) |
| Utilities | 255 (84.4%) | 47 (15.6%) |
| Information | 120 (72.3%) | 46 (27.7%) |
| Finance & Insurance | 245 (31.7%) | 527 (68.3%) |
| Real Estate, Rental & Leasing | 81 (52.3%) | 74 (47.7%) |
| Professional & Scientific | 253 (57.2%) | 189 (42.8%) |
| Enterprise Management | 0 (0.0%) | 0 (0.0%) |
| Administrative & Support | 185 (54.4%) | 155 (45.6%) |
| Educational Services | 228 (26.6%) | 629 (73.4%) |
| Health Care & Social Assistance | 677 (19.9%) | 2,721 (80.1%) |
| Arts, Entertainment & Recreation | 112 (70.9%) | 46 (29.1%) |
| Accommodation & Food Services | 352 (41.4%) | 498 (58.6%) |
| Public Administration | 435 (63.2%) | 253 (36.8%) |
| Total | 9,451 (54.4%) | 7,912 (45.6%) |
Education in Warren County
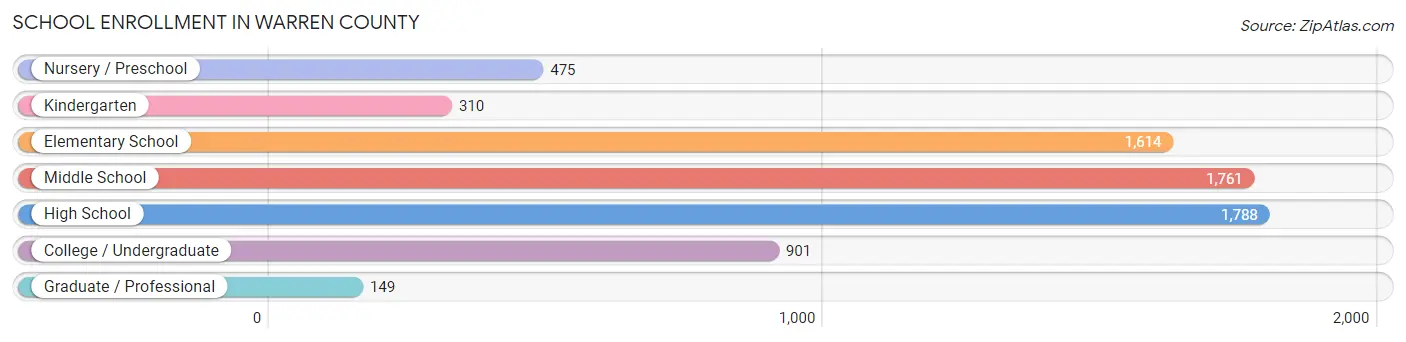
School Enrollment in Warren County
The most common levels of schooling among the 6,998 students in Warren County are high school (1,788 | 25.6%), middle school (1,761 | 25.2%), and elementary school (1,614 | 23.1%).
| School Level | # Students | % Students |
| Nursery / Preschool | 475 | 6.8% |
| Kindergarten | 310 | 4.4% |
| Elementary School | 1,614 | 23.1% |
| Middle School | 1,761 | 25.2% |
| High School | 1,788 | 25.6% |
| College / Undergraduate | 901 | 12.9% |
| Graduate / Professional | 149 | 2.1% |
| Total | 6,998 | 100.0% |
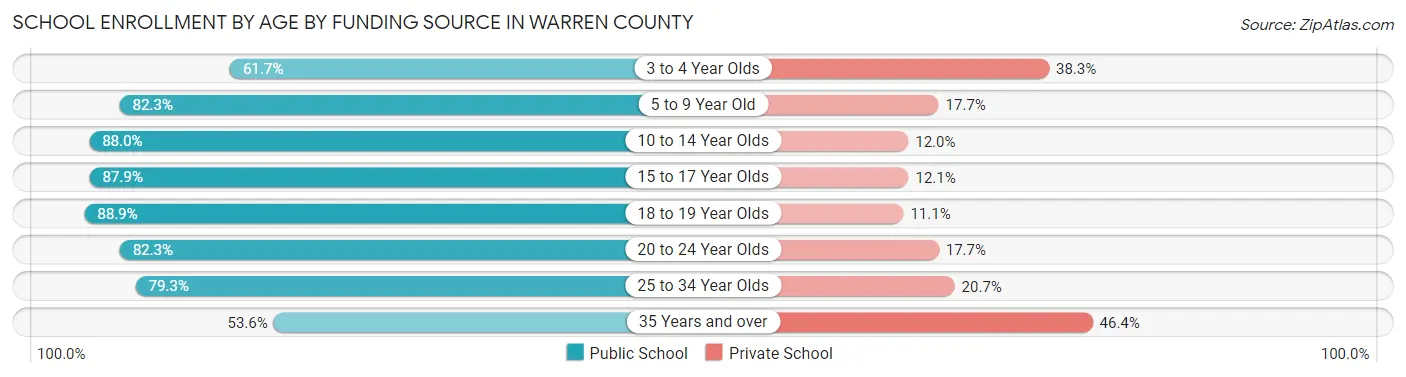
School Enrollment by Age by Funding Source in Warren County
Out of a total of 6,998 students who are enrolled in schools in Warren County, 1,183 (16.9%) attend a private institution, while the remaining 5,815 (83.1%) are enrolled in public schools. The age group of 35 years and over has the highest likelihood of being enrolled in private schools, with 166 (46.4% in the age bracket) enrolled. Conversely, the age group of 18 to 19 year olds has the lowest likelihood of being enrolled in a private school, with 391 (88.9% in the age bracket) attending a public institution.
| Age Bracket | Public School | Private School |
| 3 to 4 Year Olds | 192 (61.7%) | 119 (38.3%) |
| 5 to 9 Year Old | 1,494 (82.3%) | 321 (17.7%) |
| 10 to 14 Year Olds | 1,921 (88.0%) | 263 (12.0%) |
| 15 to 17 Year Olds | 1,142 (87.9%) | 157 (12.1%) |
| 18 to 19 Year Olds | 391 (88.9%) | 49 (11.1%) |
| 20 to 24 Year Olds | 339 (82.3%) | 73 (17.7%) |
| 25 to 34 Year Olds | 142 (79.3%) | 37 (20.7%) |
| 35 Years and over | 192 (53.6%) | 166 (46.4%) |
| Total | 5,815 (83.1%) | 1,183 (16.9%) |
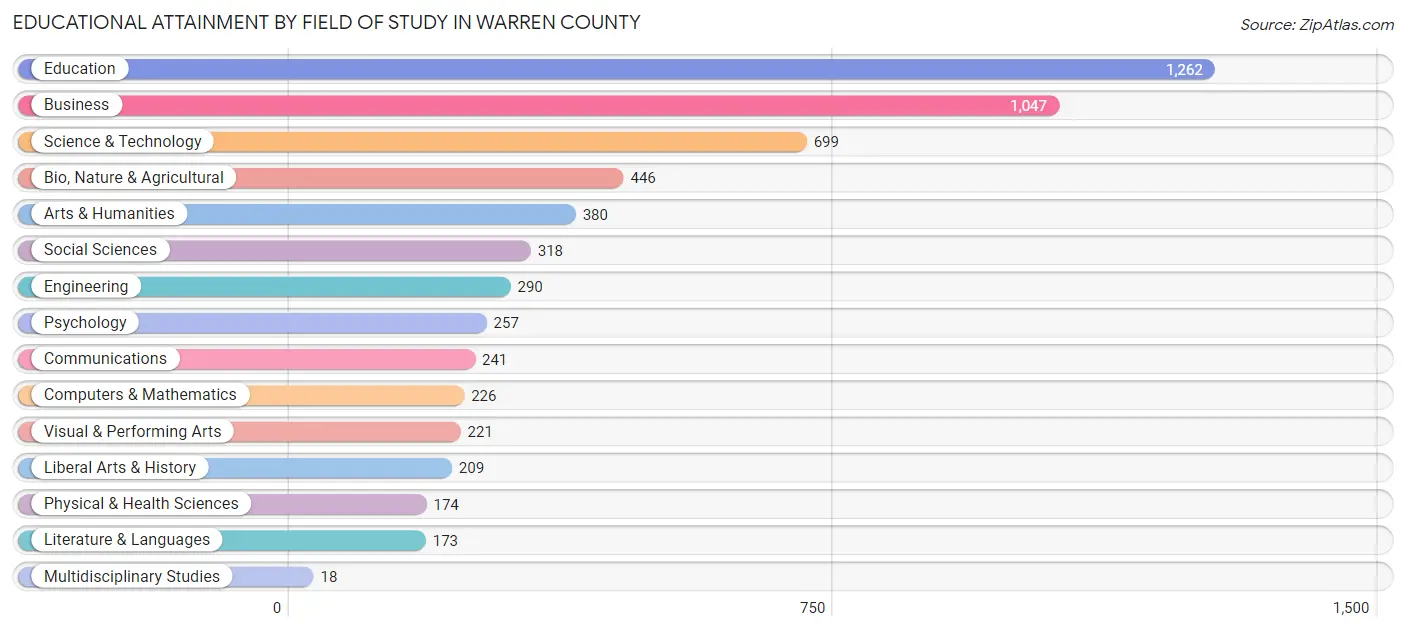
Educational Attainment by Field of Study in Warren County
Education (1,262 | 21.2%), business (1,047 | 17.6%), science & technology (699 | 11.7%), bio, nature & agricultural (446 | 7.5%), and arts & humanities (380 | 6.4%) are the most common fields of study among 5,961 individuals in Warren County who have obtained a bachelor's degree or higher.
| Field of Study | # Graduates | % Graduates |
| Computers & Mathematics | 226 | 3.8% |
| Bio, Nature & Agricultural | 446 | 7.5% |
| Physical & Health Sciences | 174 | 2.9% |
| Psychology | 257 | 4.3% |
| Social Sciences | 318 | 5.3% |
| Engineering | 290 | 4.9% |
| Multidisciplinary Studies | 18 | 0.3% |
| Science & Technology | 699 | 11.7% |
| Business | 1,047 | 17.6% |
| Education | 1,262 | 21.2% |
| Literature & Languages | 173 | 2.9% |
| Liberal Arts & History | 209 | 3.5% |
| Visual & Performing Arts | 221 | 3.7% |
| Communications | 241 | 4.0% |
| Arts & Humanities | 380 | 6.4% |
| Total | 5,961 | 100.0% |
Transportation & Commute in Warren County
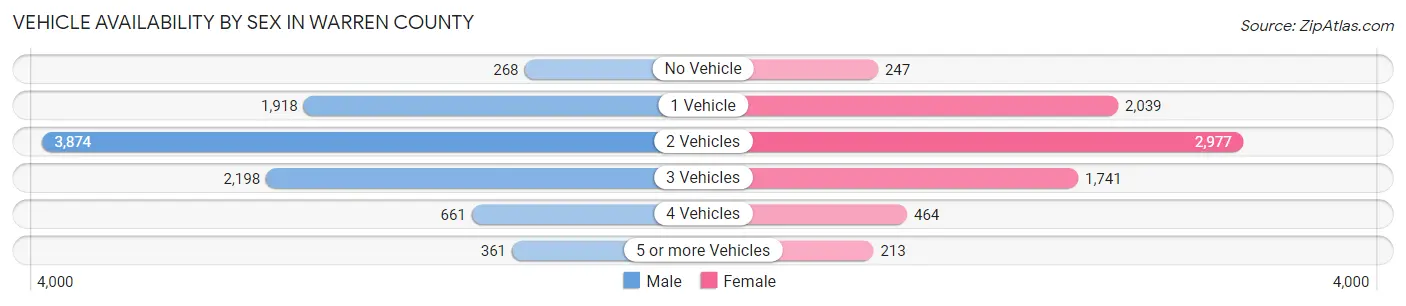
Vehicle Availability by Sex in Warren County
The most prevalent vehicle ownership categories in Warren County are males with 2 vehicles (3,874, accounting for 41.7%) and females with 2 vehicles (2,977, making up 50.4%).
| Vehicles Available | Male | Female |
| No Vehicle | 268 (2.9%) | 247 (3.2%) |
| 1 Vehicle | 1,918 (20.7%) | 2,039 (26.6%) |
| 2 Vehicles | 3,874 (41.7%) | 2,977 (38.8%) |
| 3 Vehicles | 2,198 (23.7%) | 1,741 (22.7%) |
| 4 Vehicles | 661 (7.1%) | 464 (6.0%) |
| 5 or more Vehicles | 361 (3.9%) | 213 (2.8%) |
| Total | 9,280 (100.0%) | 7,681 (100.0%) |
Commute Time in Warren County
The most frequently occuring commute durations in Warren County are 15 to 19 minutes (2,969 commuters, 18.3%), 10 to 14 minutes (2,858 commuters, 17.6%), and 5 to 9 minutes (2,822 commuters, 17.4%).
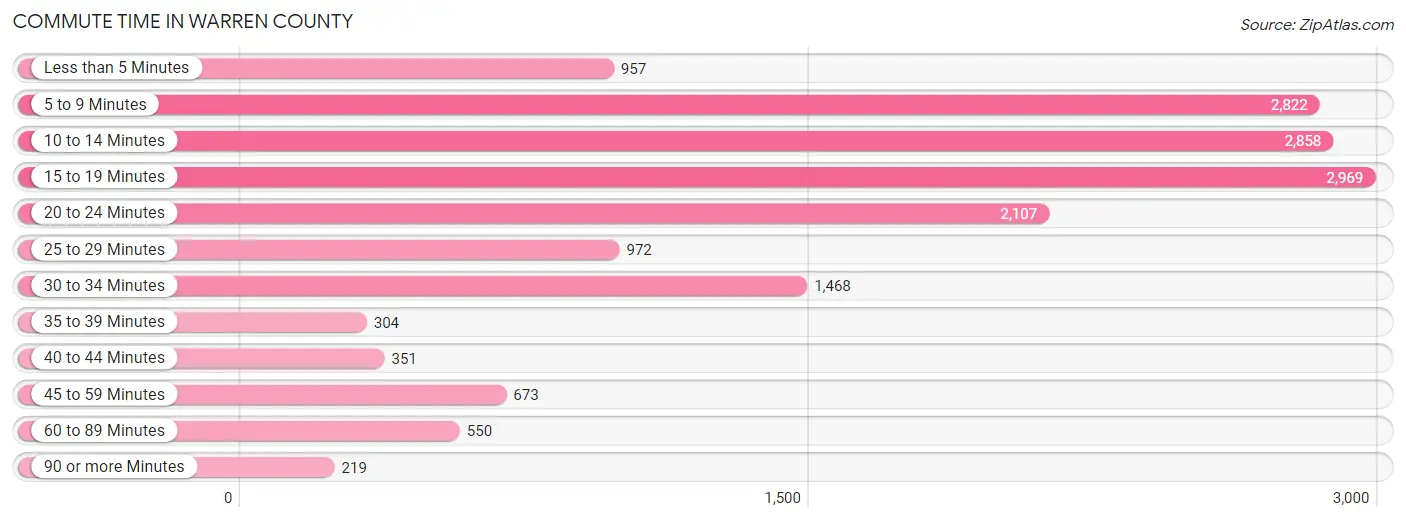
| Commute Time | # Commuters | % Commuters |
| Less than 5 Minutes | 957 | 5.9% |
| 5 to 9 Minutes | 2,822 | 17.4% |
| 10 to 14 Minutes | 2,858 | 17.6% |
| 15 to 19 Minutes | 2,969 | 18.3% |
| 20 to 24 Minutes | 2,107 | 13.0% |
| 25 to 29 Minutes | 972 | 6.0% |
| 30 to 34 Minutes | 1,468 | 9.0% |
| 35 to 39 Minutes | 304 | 1.9% |
| 40 to 44 Minutes | 351 | 2.2% |
| 45 to 59 Minutes | 673 | 4.1% |
| 60 to 89 Minutes | 550 | 3.4% |
| 90 or more Minutes | 219 | 1.3% |
Commute Time by Sex in Warren County
The most common commute times in Warren County are 15 to 19 minutes (1,633 commuters, 18.2%) for males and 5 to 9 minutes (1,440 commuters, 19.8%) for females.
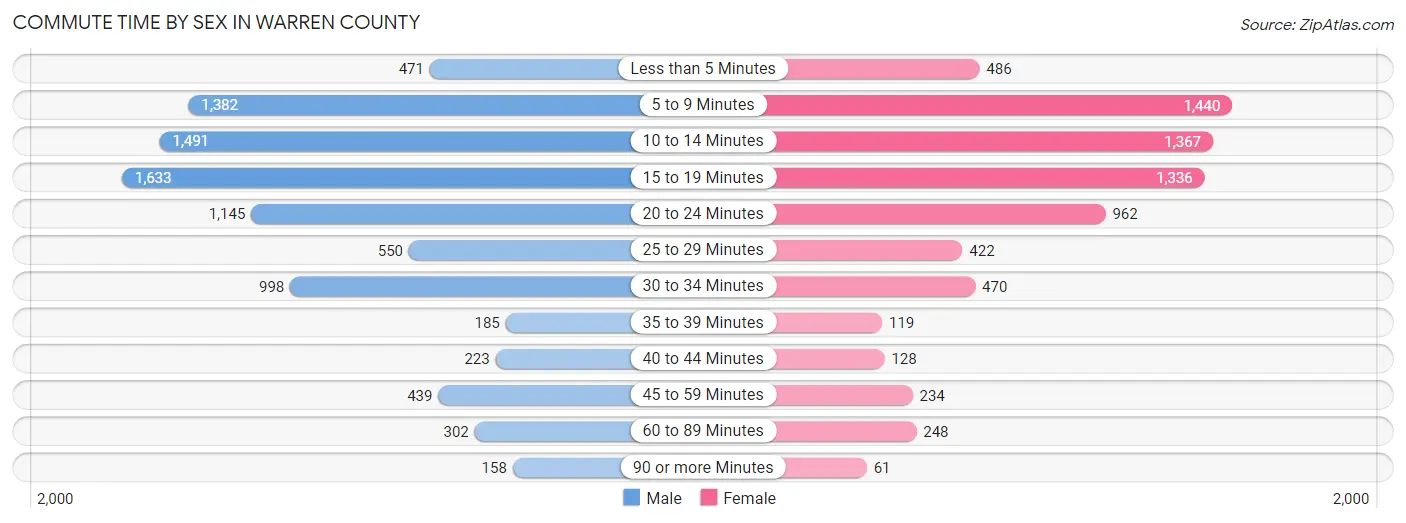
| Commute Time | Male | Female |
| Less than 5 Minutes | 471 (5.2%) | 486 (6.7%) |
| 5 to 9 Minutes | 1,382 (15.4%) | 1,440 (19.8%) |
| 10 to 14 Minutes | 1,491 (16.6%) | 1,367 (18.8%) |
| 15 to 19 Minutes | 1,633 (18.2%) | 1,336 (18.4%) |
| 20 to 24 Minutes | 1,145 (12.8%) | 962 (13.2%) |
| 25 to 29 Minutes | 550 (6.1%) | 422 (5.8%) |
| 30 to 34 Minutes | 998 (11.1%) | 470 (6.5%) |
| 35 to 39 Minutes | 185 (2.1%) | 119 (1.6%) |
| 40 to 44 Minutes | 223 (2.5%) | 128 (1.8%) |
| 45 to 59 Minutes | 439 (4.9%) | 234 (3.2%) |
| 60 to 89 Minutes | 302 (3.4%) | 248 (3.4%) |
| 90 or more Minutes | 158 (1.8%) | 61 (0.8%) |
Time of Departure to Work by Sex in Warren County
The most frequent times of departure to work in Warren County are 6:30 AM to 6:59 AM (1,357, 15.1%) for males and 7:30 AM to 7:59 AM (1,151, 15.8%) for females.
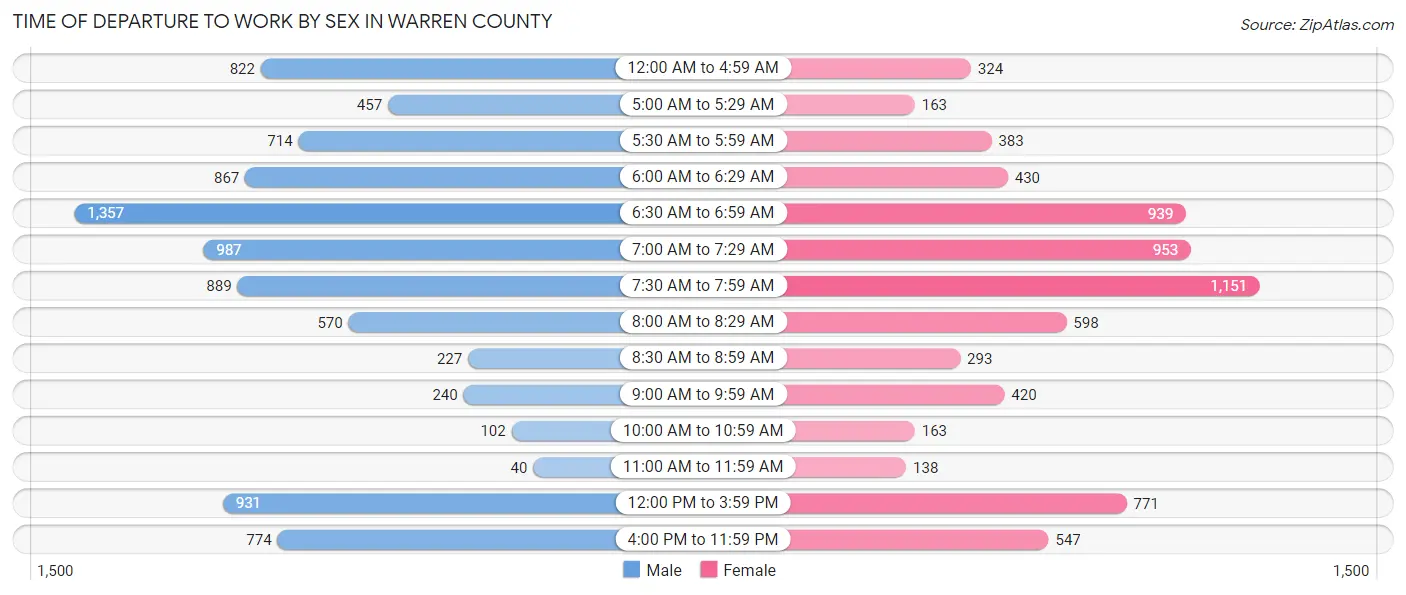
| Time of Departure | Male | Female |
| 12:00 AM to 4:59 AM | 822 (9.2%) | 324 (4.4%) |
| 5:00 AM to 5:29 AM | 457 (5.1%) | 163 (2.2%) |
| 5:30 AM to 5:59 AM | 714 (8.0%) | 383 (5.3%) |
| 6:00 AM to 6:29 AM | 867 (9.7%) | 430 (5.9%) |
| 6:30 AM to 6:59 AM | 1,357 (15.1%) | 939 (12.9%) |
| 7:00 AM to 7:29 AM | 987 (11.0%) | 953 (13.1%) |
| 7:30 AM to 7:59 AM | 889 (9.9%) | 1,151 (15.8%) |
| 8:00 AM to 8:29 AM | 570 (6.4%) | 598 (8.2%) |
| 8:30 AM to 8:59 AM | 227 (2.5%) | 293 (4.0%) |
| 9:00 AM to 9:59 AM | 240 (2.7%) | 420 (5.8%) |
| 10:00 AM to 10:59 AM | 102 (1.1%) | 163 (2.2%) |
| 11:00 AM to 11:59 AM | 40 (0.4%) | 138 (1.9%) |
| 12:00 PM to 3:59 PM | 931 (10.4%) | 771 (10.6%) |
| 4:00 PM to 11:59 PM | 774 (8.6%) | 547 (7.5%) |
| Total | 8,977 (100.0%) | 7,273 (100.0%) |
Housing Occupancy in Warren County
Occupancy by Ownership in Warren County
Of the total 16,209 dwellings in Warren County, owner-occupied units account for 12,624 (77.9%), while renter-occupied units make up 3,585 (22.1%).
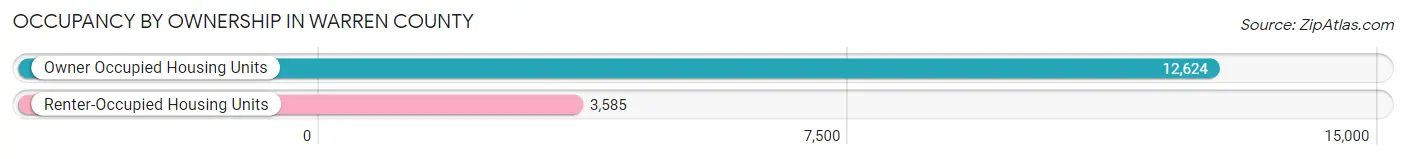
| Occupancy | # Housing Units | % Housing Units |
| Owner Occupied Housing Units | 12,624 | 77.9% |
| Renter-Occupied Housing Units | 3,585 | 22.1% |
| Total Occupied Housing Units | 16,209 | 100.0% |
Occupancy by Household Size in Warren County
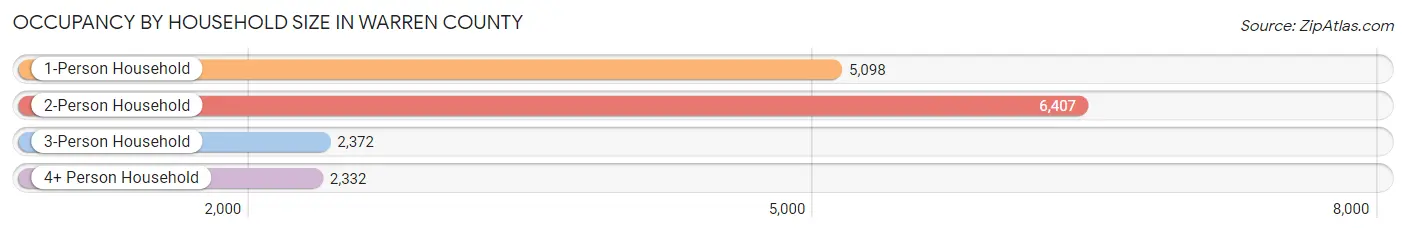
| Household Size | # Housing Units | % Housing Units |
| 1-Person Household | 5,098 | 31.5% |
| 2-Person Household | 6,407 | 39.5% |
| 3-Person Household | 2,372 | 14.6% |
| 4+ Person Household | 2,332 | 14.4% |
| Total Housing Units | 16,209 | 100.0% |
Occupancy by Ownership by Household Size in Warren County
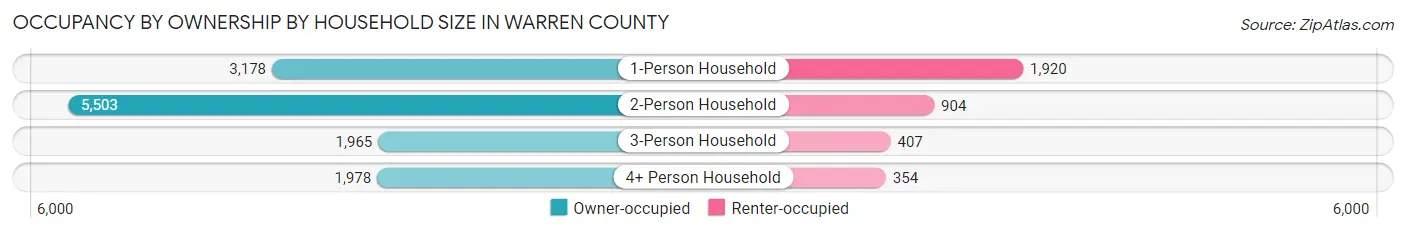
| Household Size | Owner-occupied | Renter-occupied |
| 1-Person Household | 3,178 (62.3%) | 1,920 (37.7%) |
| 2-Person Household | 5,503 (85.9%) | 904 (14.1%) |
| 3-Person Household | 1,965 (82.8%) | 407 (17.2%) |
| 4+ Person Household | 1,978 (84.8%) | 354 (15.2%) |
| Total Housing Units | 12,624 (77.9%) | 3,585 (22.1%) |
Occupancy by Educational Attainment in Warren County
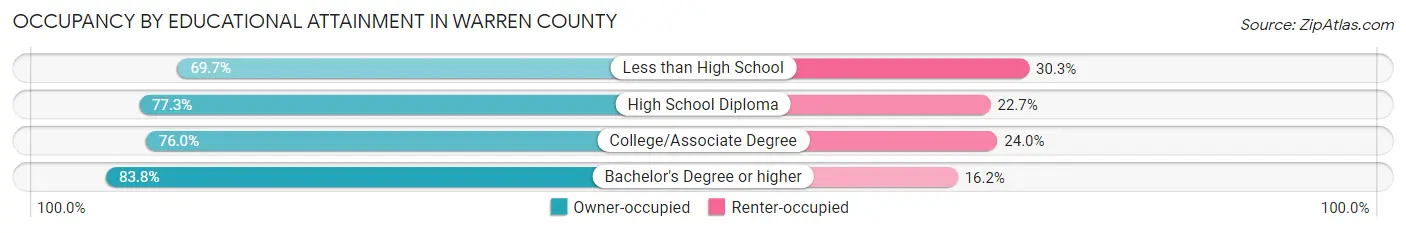
| Household Size | Owner-occupied | Renter-occupied |
| Less than High School | 616 (69.7%) | 268 (30.3%) |
| High School Diploma | 5,488 (77.3%) | 1,610 (22.7%) |
| College/Associate Degree | 3,645 (76.0%) | 1,153 (24.0%) |
| Bachelor's Degree or higher | 2,875 (83.8%) | 554 (16.2%) |
Occupancy by Age of Householder in Warren County
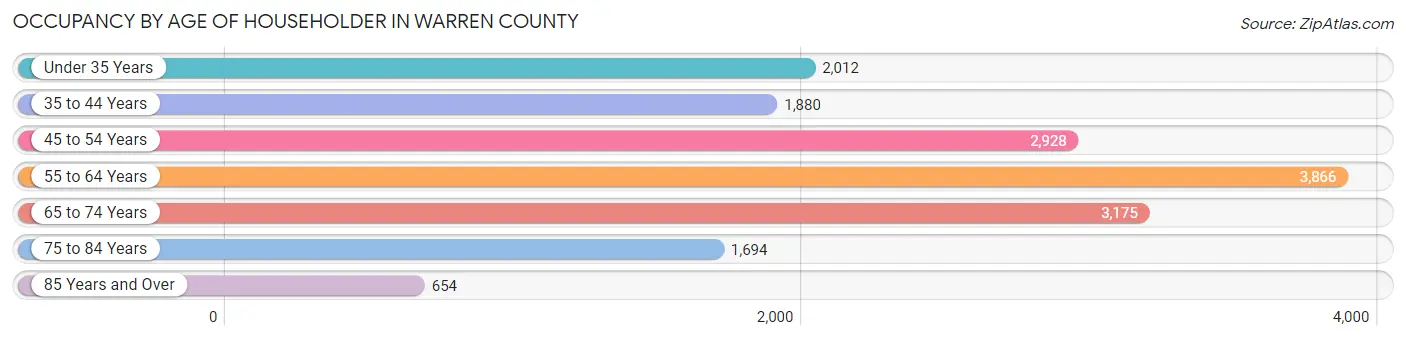
| Age Bracket | # Households | % Households |
| Under 35 Years | 2,012 | 12.4% |
| 35 to 44 Years | 1,880 | 11.6% |
| 45 to 54 Years | 2,928 | 18.1% |
| 55 to 64 Years | 3,866 | 23.8% |
| 65 to 74 Years | 3,175 | 19.6% |
| 75 to 84 Years | 1,694 | 10.4% |
| 85 Years and Over | 654 | 4.0% |
| Total | 16,209 | 100.0% |
Housing Finances in Warren County
Median Income by Occupancy in Warren County
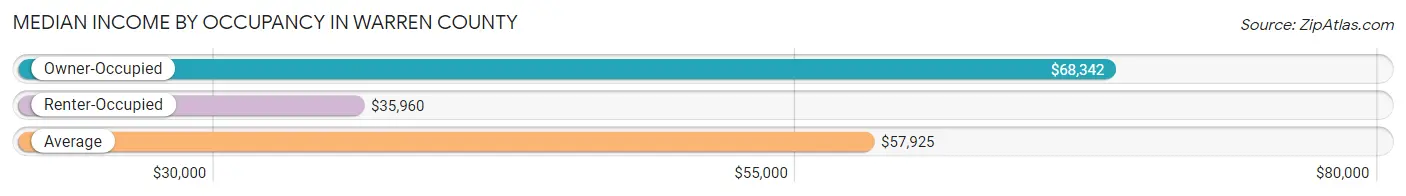
| Occupancy Type | # Households | Median Income |
| Owner-Occupied | 12,624 (77.9%) | $68,342 |
| Renter-Occupied | 3,585 (22.1%) | $35,960 |
| Average | 16,209 (100.0%) | $57,925 |
Occupancy by Householder Income Bracket in Warren County
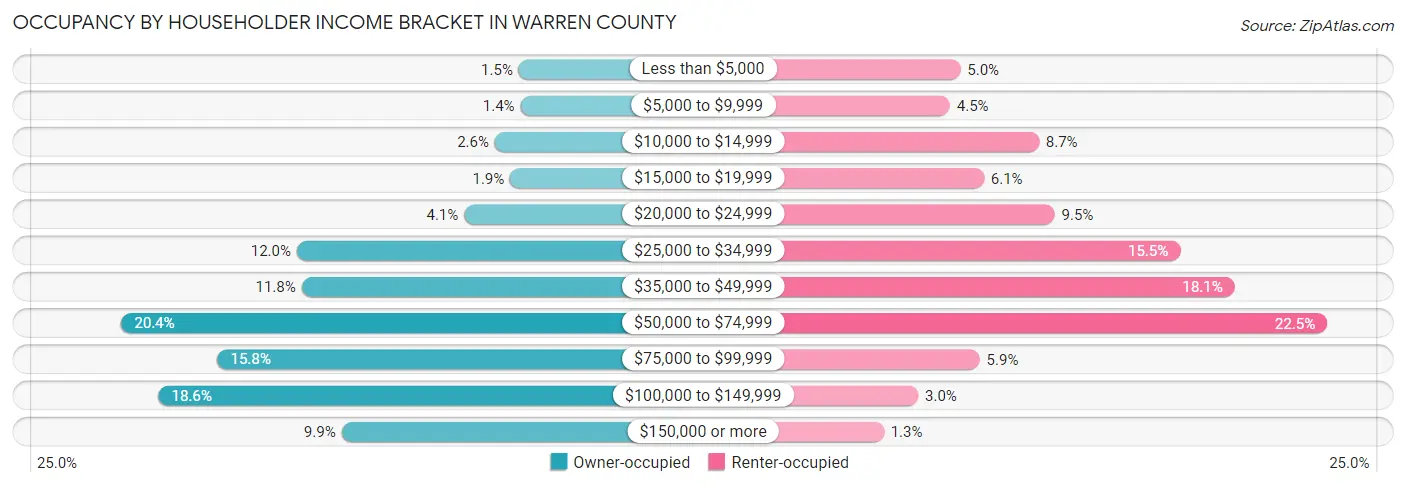
| Income Bracket | Owner-occupied | Renter-occupied |
| Less than $5,000 | 186 (1.5%) | 179 (5.0%) |
| $5,000 to $9,999 | 175 (1.4%) | 161 (4.5%) |
| $10,000 to $14,999 | 330 (2.6%) | 313 (8.7%) |
| $15,000 to $19,999 | 237 (1.9%) | 219 (6.1%) |
| $20,000 to $24,999 | 514 (4.1%) | 340 (9.5%) |
| $25,000 to $34,999 | 1,520 (12.0%) | 554 (15.4%) |
| $35,000 to $49,999 | 1,491 (11.8%) | 647 (18.0%) |
| $50,000 to $74,999 | 2,574 (20.4%) | 805 (22.5%) |
| $75,000 to $99,999 | 1,996 (15.8%) | 212 (5.9%) |
| $100,000 to $149,999 | 2,350 (18.6%) | 107 (3.0%) |
| $150,000 or more | 1,251 (9.9%) | 48 (1.3%) |
| Total | 12,624 (100.0%) | 3,585 (100.0%) |
Monthly Housing Cost Tiers in Warren County
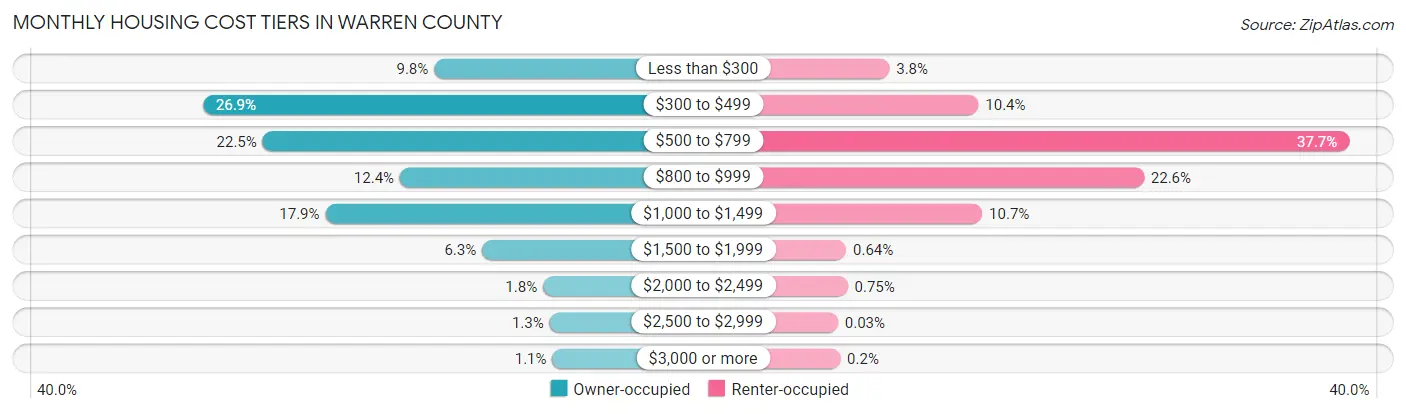
| Monthly Cost | Owner-occupied | Renter-occupied |
| Less than $300 | 1,242 (9.8%) | 137 (3.8%) |
| $300 to $499 | 3,392 (26.9%) | 372 (10.4%) |
| $500 to $799 | 2,837 (22.5%) | 1,351 (37.7%) |
| $800 to $999 | 1,560 (12.4%) | 809 (22.6%) |
| $1,000 to $1,499 | 2,254 (17.8%) | 382 (10.7%) |
| $1,500 to $1,999 | 797 (6.3%) | 23 (0.6%) |
| $2,000 to $2,499 | 230 (1.8%) | 27 (0.7%) |
| $2,500 to $2,999 | 169 (1.3%) | 1 (0.0%) |
| $3,000 or more | 143 (1.1%) | 7 (0.2%) |
| Total | 12,624 (100.0%) | 3,585 (100.0%) |
Physical Housing Characteristics in Warren County
Housing Structures in Warren County
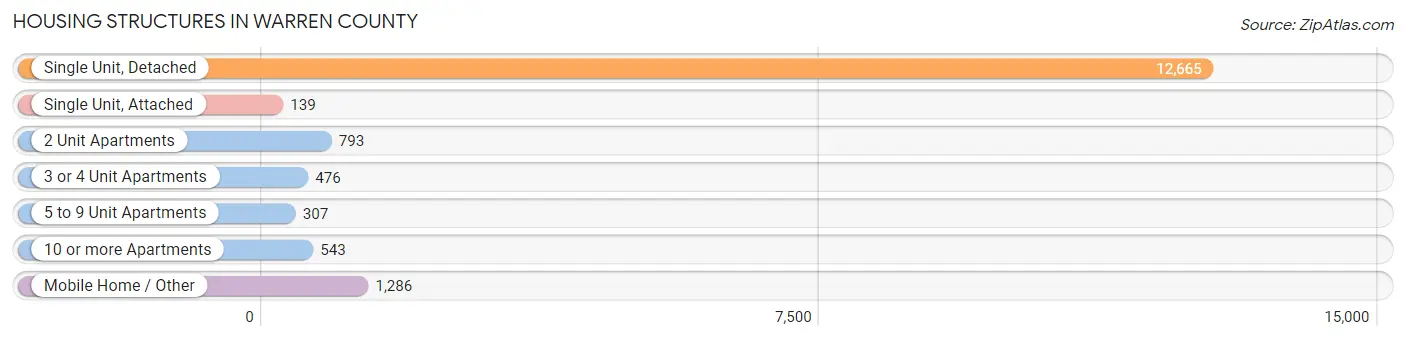
| Structure Type | # Housing Units | % Housing Units |
| Single Unit, Detached | 12,665 | 78.1% |
| Single Unit, Attached | 139 | 0.9% |
| 2 Unit Apartments | 793 | 4.9% |
| 3 or 4 Unit Apartments | 476 | 2.9% |
| 5 to 9 Unit Apartments | 307 | 1.9% |
| 10 or more Apartments | 543 | 3.4% |
| Mobile Home / Other | 1,286 | 7.9% |
| Total | 16,209 | 100.0% |
Housing Structures by Occupancy in Warren County
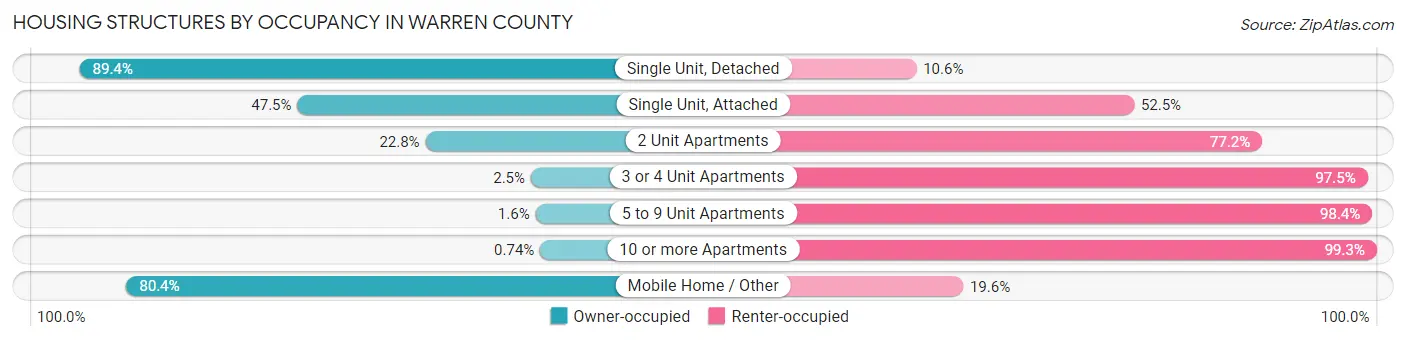
| Structure Type | Owner-occupied | Renter-occupied |
| Single Unit, Detached | 11,322 (89.4%) | 1,343 (10.6%) |
| Single Unit, Attached | 66 (47.5%) | 73 (52.5%) |
| 2 Unit Apartments | 181 (22.8%) | 612 (77.2%) |
| 3 or 4 Unit Apartments | 12 (2.5%) | 464 (97.5%) |
| 5 to 9 Unit Apartments | 5 (1.6%) | 302 (98.4%) |
| 10 or more Apartments | 4 (0.7%) | 539 (99.3%) |
| Mobile Home / Other | 1,034 (80.4%) | 252 (19.6%) |
| Total | 12,624 (77.9%) | 3,585 (22.1%) |
Housing Structures by Number of Rooms in Warren County
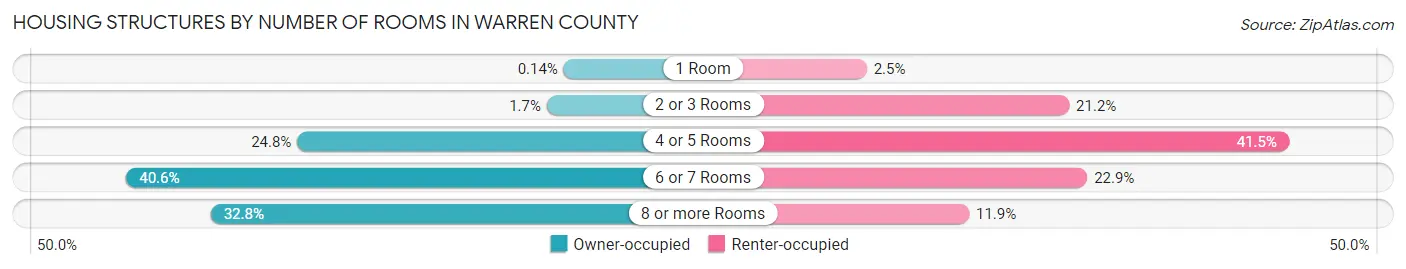
| Number of Rooms | Owner-occupied | Renter-occupied |
| 1 Room | 18 (0.1%) | 89 (2.5%) |
| 2 or 3 Rooms | 215 (1.7%) | 760 (21.2%) |
| 4 or 5 Rooms | 3,129 (24.8%) | 1,488 (41.5%) |
| 6 or 7 Rooms | 5,124 (40.6%) | 820 (22.9%) |
| 8 or more Rooms | 4,138 (32.8%) | 428 (11.9%) |
| Total | 12,624 (100.0%) | 3,585 (100.0%) |
Housing Structure by Heating Type in Warren County
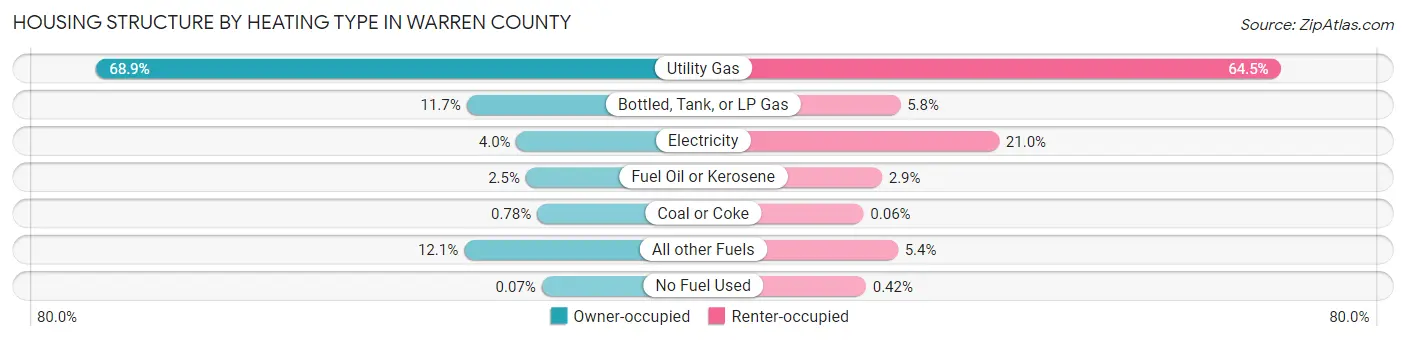
| Heating Type | Owner-occupied | Renter-occupied |
| Utility Gas | 8,698 (68.9%) | 2,313 (64.5%) |
| Bottled, Tank, or LP Gas | 1,475 (11.7%) | 206 (5.8%) |
| Electricity | 501 (4.0%) | 753 (21.0%) |
| Fuel Oil or Kerosene | 318 (2.5%) | 104 (2.9%) |
| Coal or Coke | 98 (0.8%) | 2 (0.1%) |
| All other Fuels | 1,525 (12.1%) | 192 (5.4%) |
| No Fuel Used | 9 (0.1%) | 15 (0.4%) |
| Total | 12,624 (100.0%) | 3,585 (100.0%) |
Household Vehicle Usage in Warren County
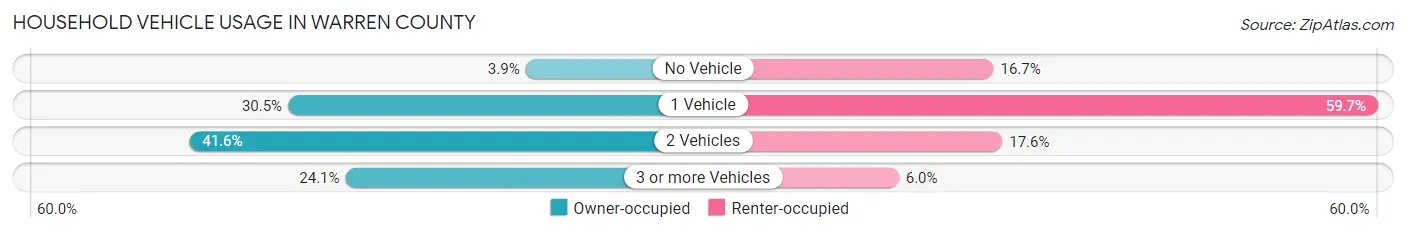
| Vehicles per Household | Owner-occupied | Renter-occupied |
| No Vehicle | 491 (3.9%) | 597 (16.7%) |
| 1 Vehicle | 3,850 (30.5%) | 2,140 (59.7%) |
| 2 Vehicles | 5,245 (41.5%) | 632 (17.6%) |
| 3 or more Vehicles | 3,038 (24.1%) | 216 (6.0%) |
| Total | 12,624 (100.0%) | 3,585 (100.0%) |
Real Estate & Mortgages in Warren County
Real Estate and Mortgage Overview in Warren County
| Characteristic | Without Mortgage | With Mortgage |
| Housing Units | 7,211 | 5,413 |
| Median Property Value | $104,000 | $132,200 |
| Median Household Income | $53,988 | $690 |
| Monthly Housing Costs | $455 | $123 |
| Real Estate Taxes | $1,536 | $99 |
Property Value by Mortgage Status in Warren County
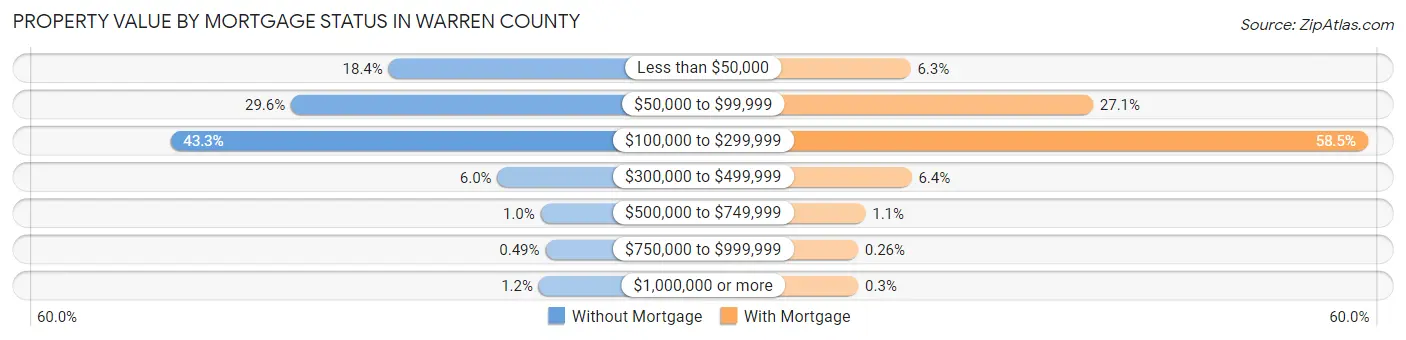
| Property Value | Without Mortgage | With Mortgage |
| Less than $50,000 | 1,327 (18.4%) | 340 (6.3%) |
| $50,000 to $99,999 | 2,131 (29.5%) | 1,468 (27.1%) |
| $100,000 to $299,999 | 3,125 (43.3%) | 3,169 (58.5%) |
| $300,000 to $499,999 | 430 (6.0%) | 346 (6.4%) |
| $500,000 to $749,999 | 74 (1.0%) | 60 (1.1%) |
| $750,000 to $999,999 | 35 (0.5%) | 14 (0.3%) |
| $1,000,000 or more | 89 (1.2%) | 16 (0.3%) |
| Total | 7,211 (100.0%) | 5,413 (100.0%) |
Household Income by Mortgage Status in Warren County
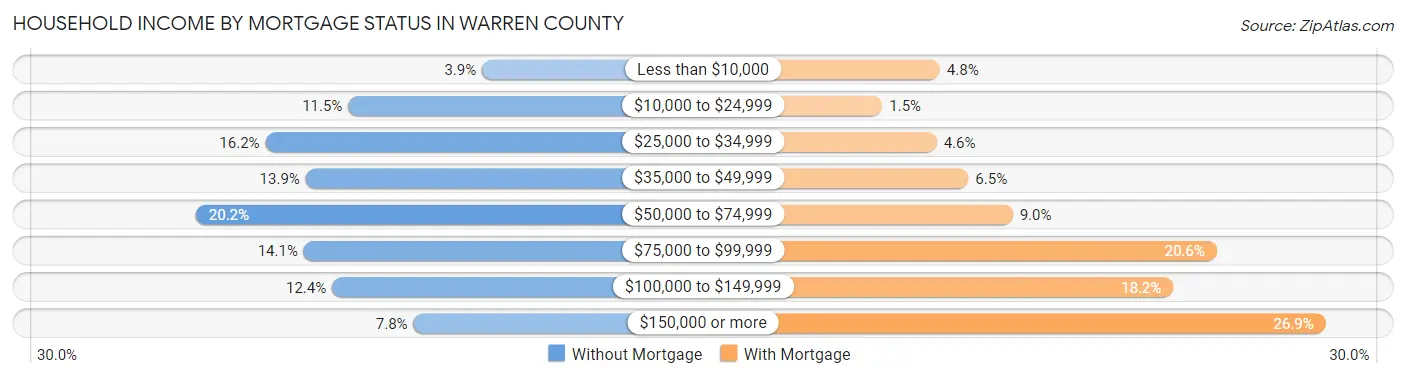
| Household Income | Without Mortgage | With Mortgage |
| Less than $10,000 | 278 (3.9%) | 261 (4.8%) |
| $10,000 to $24,999 | 830 (11.5%) | 83 (1.5%) |
| $25,000 to $34,999 | 1,171 (16.2%) | 251 (4.6%) |
| $35,000 to $49,999 | 1,005 (13.9%) | 349 (6.5%) |
| $50,000 to $74,999 | 1,457 (20.2%) | 486 (9.0%) |
| $75,000 to $99,999 | 1,013 (14.1%) | 1,117 (20.6%) |
| $100,000 to $149,999 | 896 (12.4%) | 983 (18.2%) |
| $150,000 or more | 561 (7.8%) | 1,454 (26.9%) |
| Total | 7,211 (100.0%) | 5,413 (100.0%) |
Property Value to Household Income Ratio in Warren County
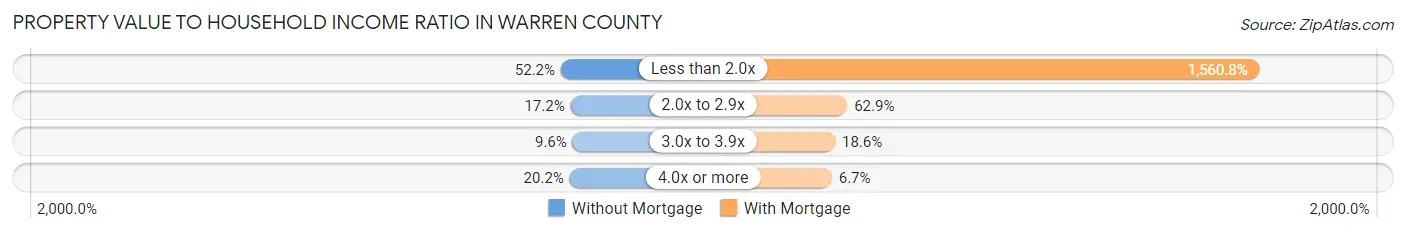
| Value-to-Income Ratio | Without Mortgage | With Mortgage |
| Less than 2.0x | 3,761 (52.2%) | 84,485 (1,560.8%) |
| 2.0x to 2.9x | 1,243 (17.2%) | 3,403 (62.9%) |
| 3.0x to 3.9x | 690 (9.6%) | 1,008 (18.6%) |
| 4.0x or more | 1,458 (20.2%) | 361 (6.7%) |
| Total | 7,211 (100.0%) | 5,413 (100.0%) |
Real Estate Taxes by Mortgage Status in Warren County
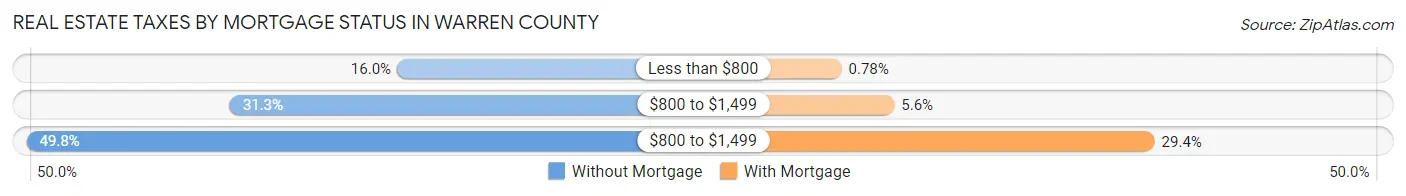
| Property Taxes | Without Mortgage | With Mortgage |
| Less than $800 | 1,154 (16.0%) | 42 (0.8%) |
| $800 to $1,499 | 2,254 (31.3%) | 303 (5.6%) |
| $800 to $1,499 | 3,593 (49.8%) | 1,590 (29.4%) |
| Total | 7,211 (100.0%) | 5,413 (100.0%) |
Health & Disability in Warren County
Health Insurance Coverage by Age in Warren County
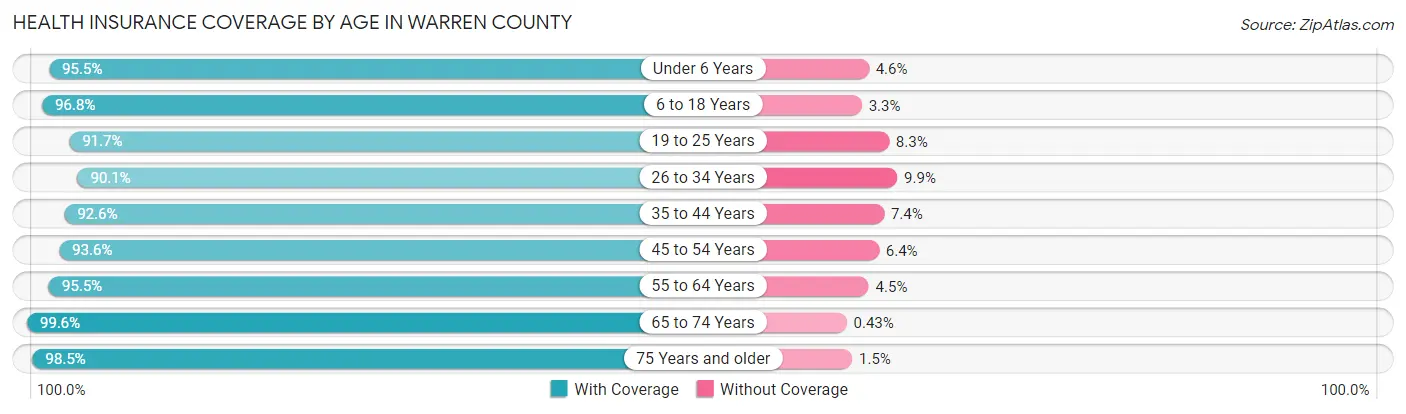
| Age Bracket | With Coverage | Without Coverage |
| Under 6 Years | 2,201 (95.5%) | 105 (4.5%) |
| 6 to 18 Years | 5,454 (96.8%) | 183 (3.3%) |
| 19 to 25 Years | 2,313 (91.7%) | 210 (8.3%) |
| 26 to 34 Years | 3,182 (90.1%) | 348 (9.9%) |
| 35 to 44 Years | 3,739 (92.6%) | 299 (7.4%) |
| 45 to 54 Years | 4,472 (93.6%) | 308 (6.4%) |
| 55 to 64 Years | 6,016 (95.5%) | 286 (4.5%) |
| 65 to 74 Years | 5,120 (99.6%) | 22 (0.4%) |
| 75 Years and older | 3,634 (98.5%) | 54 (1.5%) |
| Total | 36,131 (95.2%) | 1,815 (4.8%) |
Health Insurance Coverage by Citizenship Status in Warren County
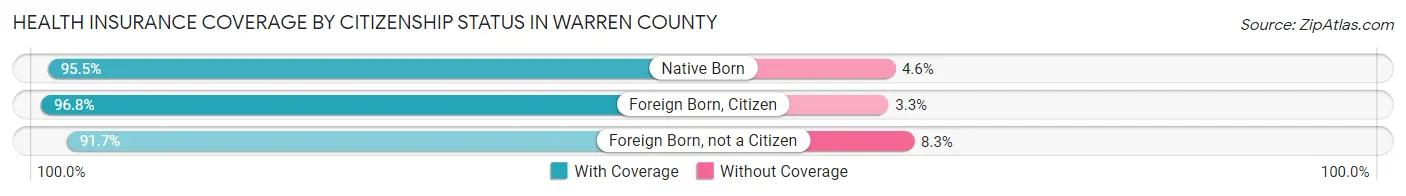
| Citizenship Status | With Coverage | Without Coverage |
| Native Born | 2,201 (95.5%) | 105 (4.5%) |
| Foreign Born, Citizen | 5,454 (96.8%) | 183 (3.3%) |
| Foreign Born, not a Citizen | 2,313 (91.7%) | 210 (8.3%) |
Health Insurance Coverage by Household Income in Warren County
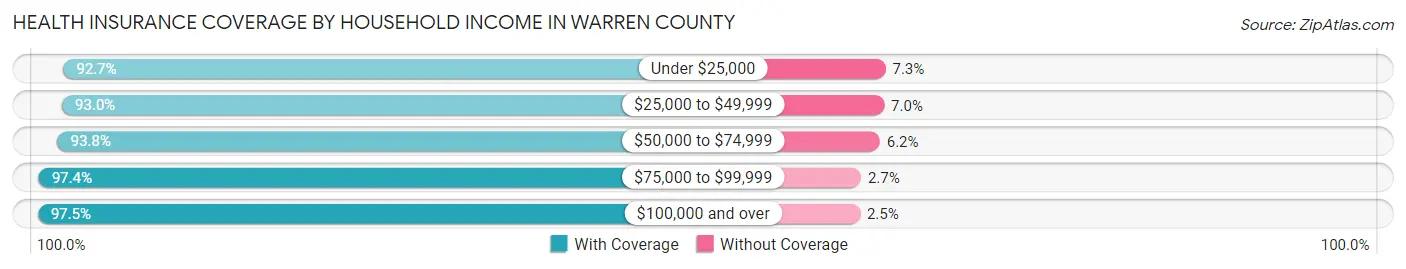
| Household Income | With Coverage | Without Coverage |
| Under $25,000 | 3,766 (92.7%) | 295 (7.3%) |
| $25,000 to $49,999 | 7,652 (93.0%) | 576 (7.0%) |
| $50,000 to $74,999 | 7,621 (93.8%) | 502 (6.2%) |
| $75,000 to $99,999 | 5,555 (97.4%) | 151 (2.6%) |
| $100,000 and over | 11,458 (97.5%) | 289 (2.5%) |
Public vs Private Health Insurance Coverage by Age in Warren County
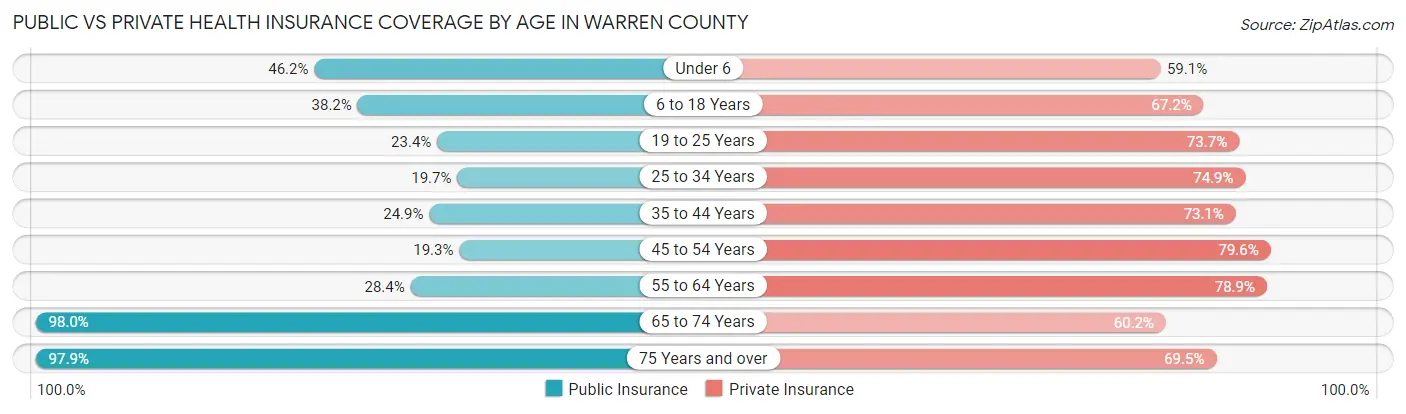
| Age Bracket | Public Insurance | Private Insurance |
| Under 6 | 1,066 (46.2%) | 1,362 (59.1%) |
| 6 to 18 Years | 2,153 (38.2%) | 3,785 (67.1%) |
| 19 to 25 Years | 591 (23.4%) | 1,860 (73.7%) |
| 25 to 34 Years | 695 (19.7%) | 2,644 (74.9%) |
| 35 to 44 Years | 1,005 (24.9%) | 2,952 (73.1%) |
| 45 to 54 Years | 923 (19.3%) | 3,804 (79.6%) |
| 55 to 64 Years | 1,788 (28.4%) | 4,971 (78.9%) |
| 65 to 74 Years | 5,038 (98.0%) | 3,093 (60.2%) |
| 75 Years and over | 3,612 (97.9%) | 2,563 (69.5%) |
| Total | 16,871 (44.5%) | 27,034 (71.2%) |
Disability Status by Sex by Age in Warren County
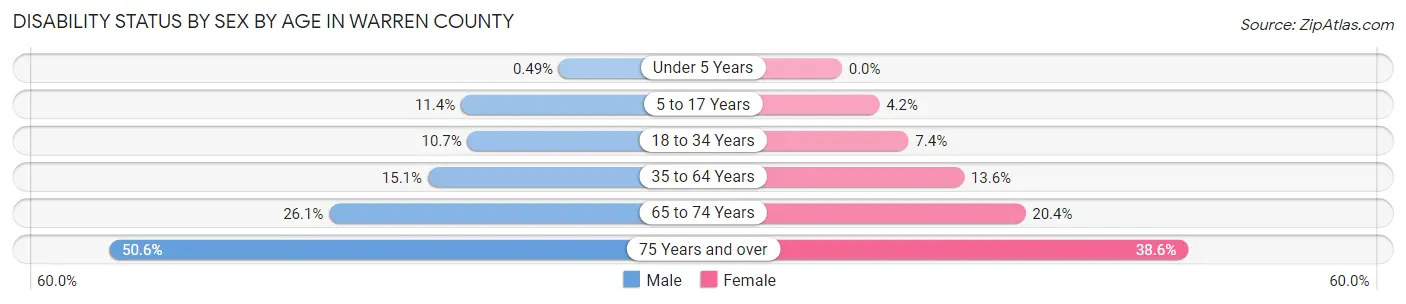
| Age Bracket | Male | Female |
| Under 5 Years | 5 (0.5%) | 0 (0.0%) |
| 5 to 17 Years | 322 (11.4%) | 111 (4.2%) |
| 18 to 34 Years | 368 (10.7%) | 228 (7.4%) |
| 35 to 64 Years | 1,164 (15.1%) | 1,007 (13.6%) |
| 65 to 74 Years | 671 (26.1%) | 525 (20.4%) |
| 75 Years and over | 854 (50.6%) | 771 (38.6%) |
Disability Class by Sex by Age in Warren County
Disability Class: Hearing Difficulty
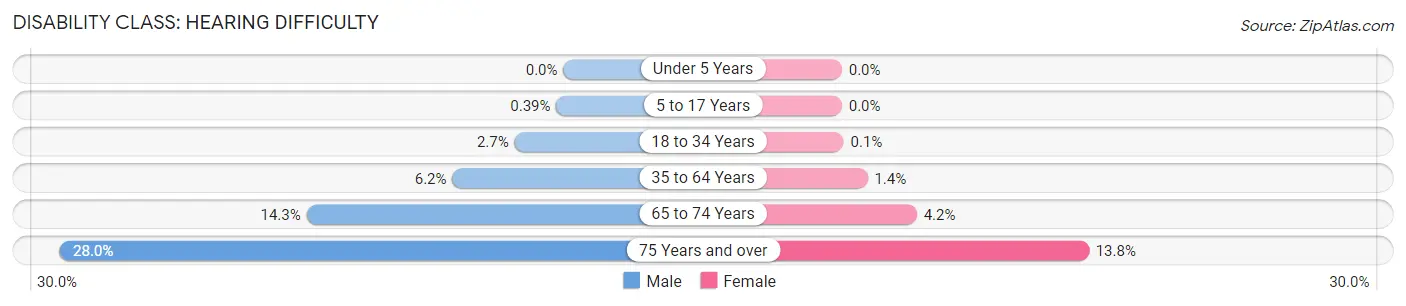
| Age Bracket | Male | Female |
| Under 5 Years | 0 (0.0%) | 0 (0.0%) |
| 5 to 17 Years | 11 (0.4%) | 0 (0.0%) |
| 18 to 34 Years | 94 (2.7%) | 3 (0.1%) |
| 35 to 64 Years | 477 (6.2%) | 106 (1.4%) |
| 65 to 74 Years | 368 (14.3%) | 107 (4.2%) |
| 75 Years and over | 473 (28.0%) | 275 (13.8%) |
Disability Class: Vision Difficulty
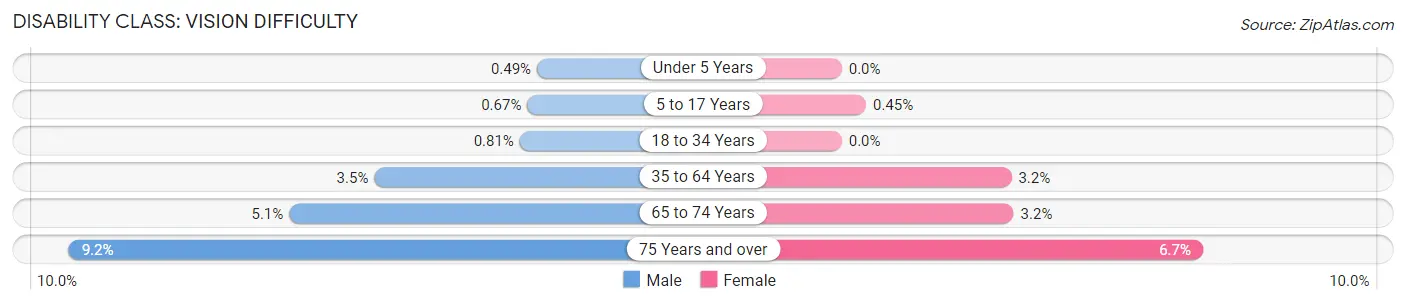
| Age Bracket | Male | Female |
| Under 5 Years | 5 (0.5%) | 0 (0.0%) |
| 5 to 17 Years | 19 (0.7%) | 12 (0.4%) |
| 18 to 34 Years | 28 (0.8%) | 0 (0.0%) |
| 35 to 64 Years | 271 (3.5%) | 233 (3.2%) |
| 65 to 74 Years | 131 (5.1%) | 82 (3.2%) |
| 75 Years and over | 155 (9.2%) | 134 (6.7%) |
Disability Class: Cognitive Difficulty
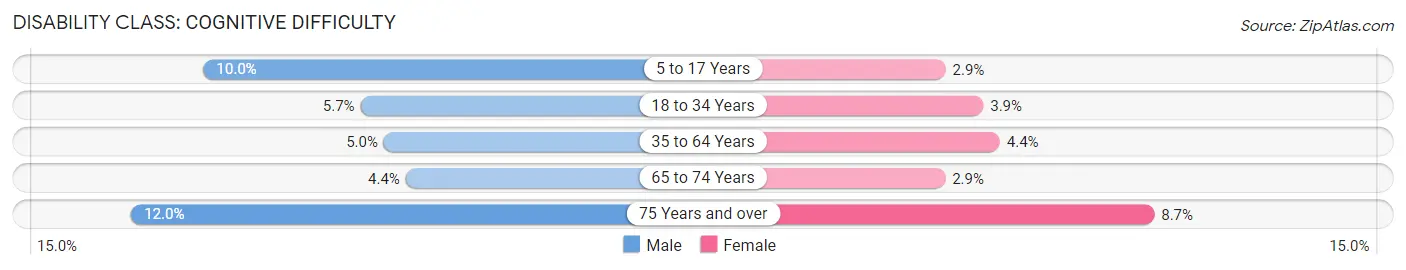
| Age Bracket | Male | Female |
| 5 to 17 Years | 283 (10.0%) | 77 (2.9%) |
| 18 to 34 Years | 195 (5.7%) | 121 (3.9%) |
| 35 to 64 Years | 386 (5.0%) | 326 (4.4%) |
| 65 to 74 Years | 113 (4.4%) | 74 (2.9%) |
| 75 Years and over | 203 (12.0%) | 174 (8.7%) |
Disability Class: Ambulatory Difficulty
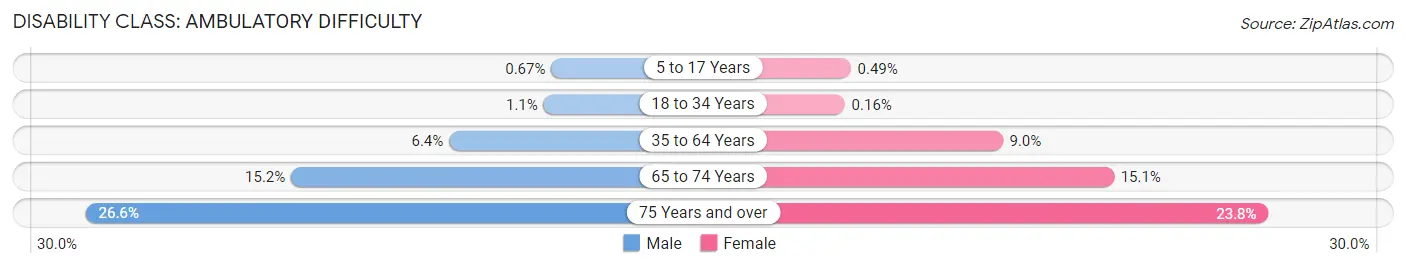
| Age Bracket | Male | Female |
| 5 to 17 Years | 19 (0.7%) | 13 (0.5%) |
| 18 to 34 Years | 38 (1.1%) | 5 (0.2%) |
| 35 to 64 Years | 491 (6.4%) | 663 (8.9%) |
| 65 to 74 Years | 390 (15.2%) | 389 (15.1%) |
| 75 Years and over | 449 (26.6%) | 475 (23.7%) |
Disability Class: Self-Care Difficulty
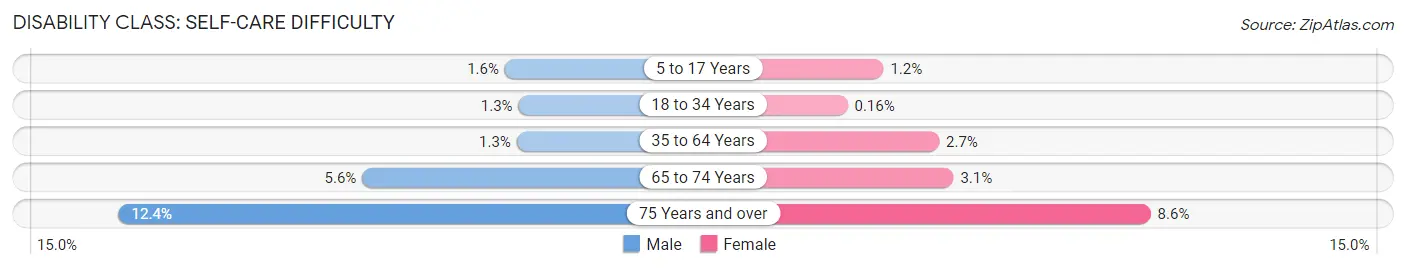
| Age Bracket | Male | Female |
| 5 to 17 Years | 46 (1.6%) | 31 (1.2%) |
| 18 to 34 Years | 43 (1.3%) | 5 (0.2%) |
| 35 to 64 Years | 100 (1.3%) | 201 (2.7%) |
| 65 to 74 Years | 144 (5.6%) | 80 (3.1%) |
| 75 Years and over | 209 (12.4%) | 172 (8.6%) |
Technology Access in Warren County
Computing Device Access in Warren County
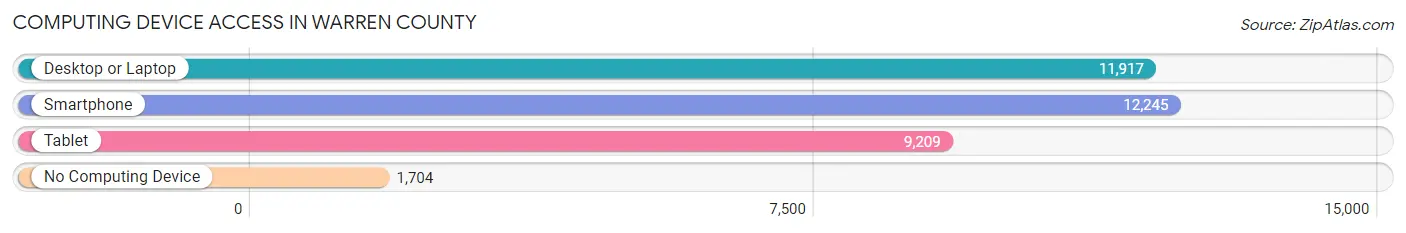
| Device Type | # Households | % Households |
| Desktop or Laptop | 11,917 | 73.5% |
| Smartphone | 12,245 | 75.5% |
| Tablet | 9,209 | 56.8% |
| No Computing Device | 1,704 | 10.5% |
| Total | 16,209 | 100.0% |
Internet Access in Warren County
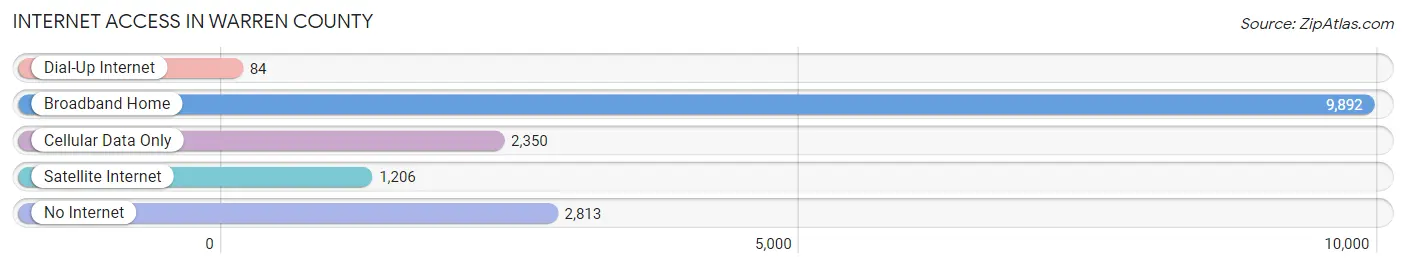
| Internet Type | # Households | % Households |
| Dial-Up Internet | 84 | 0.5% |
| Broadband Home | 9,892 | 61.0% |
| Cellular Data Only | 2,350 | 14.5% |
| Satellite Internet | 1,206 | 7.4% |
| No Internet | 2,813 | 17.3% |
| Total | 16,209 | 100.0% |
Warren County Summary
Warren County is located in the northwestern corner of Pennsylvania, and is bordered by the states of New York and Ohio. It is part of the Erie Metropolitan Statistical Area and is the northernmost county in the state. The county seat is Warren, and the county has a population of approximately 41,000 people.
Geography
Warren County is located in the northwestern corner of Pennsylvania, and is bordered by the states of New York and Ohio. It is part of the Erie Metropolitan Statistical Area and is the northernmost county in the state. The county is situated in the Appalachian Plateau region of the Appalachian Mountains, and is characterized by rolling hills and valleys. The Allegheny River forms the northern border of the county, and the Conewango Creek forms the eastern border. The county is home to several state parks, including Allegheny National Forest, Chapman State Park, and Kinzua Bridge State Park.
History
Warren County was formed in 1800 from parts of Lycoming and Venango counties. It was named after General Joseph Warren, a hero of the American Revolution. The county was originally home to the Seneca Nation of the Iroquois Confederacy, and the area was known as the Cornplanter Tract. The first settlers arrived in the area in the late 1700s, and the county was officially established in 1800.
The county was an important center of the lumber industry in the 19th century, and the county seat of Warren was an important port on the Allegheny River. The county was also home to several iron furnaces, and the county was an important center of the iron industry. The county was also home to several oil and gas wells, and the county was an important center of the oil and gas industry.
Economy
The economy of Warren County is largely based on agriculture, manufacturing, and tourism. The county is home to several large farms, and the county is an important producer of dairy products, beef, and poultry. The county is also home to several manufacturing companies, including a paper mill, a plastics plant, and a metal fabrication plant. The county is also home to several tourist attractions, including the Allegheny National Forest, Chapman State Park, and Kinzua Bridge State Park.
Demographics
As of the 2010 census, Warren County had a population of 41,815 people. The racial makeup of the county was 95.3% White, 1.3% African American, 0.3% Native American, 0.6% Asian, 0.1% Pacific Islander, 0.7% from other races, and 1.7% from two or more races. Hispanic or Latino of any race were 2.2% of the population.
The median income for a household in the county was $41,945, and the median income for a family was $50,945. The per capita income for the county was $20,945. About 11.2% of families and 14.3% of the population were below the poverty line, including 19.2% of those under age 18 and 8.2% of those age 65 or over.
Common Questions
What is Per Capita Income in Warren County?
Per Capita income in Warren County is $32,319.
What is the Median Family Income in Warren County?
Median Family Income in Warren County is $73,750.
What is the Median Household income in Warren County?
Median Household Income in Warren County is $57,925.
What is Income or Wage Gap in Warren County?
Income or Wage Gap in Warren County is 32.3%.
Women in Warren County earn 67.7 cents for every dollar earned by a man.
What is Family Income Deficit in Warren County?
Family Income Deficit in Warren County is $8,434.
Families that are below poverty line in Warren County earn $8,434 less on average than the poverty threshold level.
What is Inequality or Gini Index in Warren County?
Inequality or Gini Index in Warren County is 0.42.
What is the Total Population of Warren County?
Total Population of Warren County is 38,492.
What is the Total Male Population of Warren County?
Total Male Population of Warren County is 19,478.
What is the Total Female Population of Warren County?
Total Female Population of Warren County is 19,014.
What is the Ratio of Males per 100 Females in Warren County?
There are 102.44 Males per 100 Females in Warren County.
What is the Ratio of Females per 100 Males in Warren County?
There are 97.62 Females per 100 Males in Warren County.
What is the Median Population Age in Warren County?
Median Population Age in Warren County is 47.4 Years.
What is the Average Family Size in Warren County
Average Family Size in Warren County is 2.9 People.
What is the Average Household Size in Warren County
Average Household Size in Warren County is 2.3 People.
How Large is the Labor Force in Warren County?
There are 18,139 People in the Labor Forcein in Warren County.
What is the Percentage of People in the Labor Force in Warren County?
56.8% of People are in the Labor Force in Warren County.
What is the Unemployment Rate in Warren County?
Unemployment Rate in Warren County is 4.3%.