Venango County, PA Map & Demographics
Venango County Overview
$31,667
PER CAPITA INCOME
$72,627
AVG FAMILY INCOME
$59,278
AVG HOUSEHOLD INCOME
28.9%
WAGE / INCOME GAP [ % ]
71.1¢/ $1
WAGE / INCOME GAP [ $ ]
$10,527
FAMILY INCOME DEFICIT
0.42
INEQUALITY / GINI INDEX
50,475
TOTAL POPULATION
25,174
MALE POPULATION
25,301
FEMALE POPULATION
99.50
MALES / 100 FEMALES
100.50
FEMALES / 100 MALES
47.6
MEDIAN AGE
2.8
AVG FAMILY SIZE
2.3
AVG HOUSEHOLD SIZE
23,323
LABOR FORCE [ PEOPLE ]
55.3%
PERCENT IN LABOR FORCE
6.7%
UNEMPLOYMENT RATE
Income in Venango County
Income Overview in Venango County
Per Capita Income in Venango County is $31,667, while median incomes of families and households are $72,627 and $59,278 respectively.
| Characteristic | Number | Measure |
| Per Capita Income | 50,475 | $31,667 |
| Median Family Income | 13,861 | $72,627 |
| Mean Family Income | 13,861 | $84,506 |
| Median Household Income | 21,323 | $59,278 |
| Mean Household Income | 21,323 | $73,406 |
| Income Deficit | 13,861 | $10,527 |
| Wage / Income Gap (%) | 50,475 | 28.90% |
| Wage / Income Gap ($) | 50,475 | 71.10¢ per $1 |
| Gini / Inequality Index | 50,475 | 0.42 |
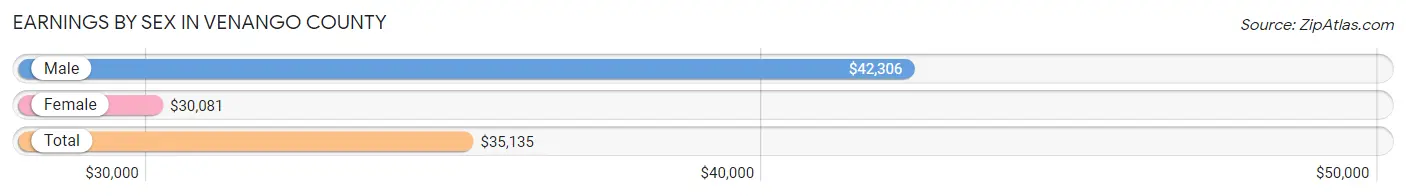
Earnings by Sex in Venango County
Average Earnings in Venango County are $35,135, $42,306 for men and $30,081 for women, a difference of 28.9%.
| Sex | Number | Average Earnings |
| Male | 13,010 (53.4%) | $42,306 |
| Female | 11,335 (46.6%) | $30,081 |
| Total | 24,345 (100.0%) | $35,135 |
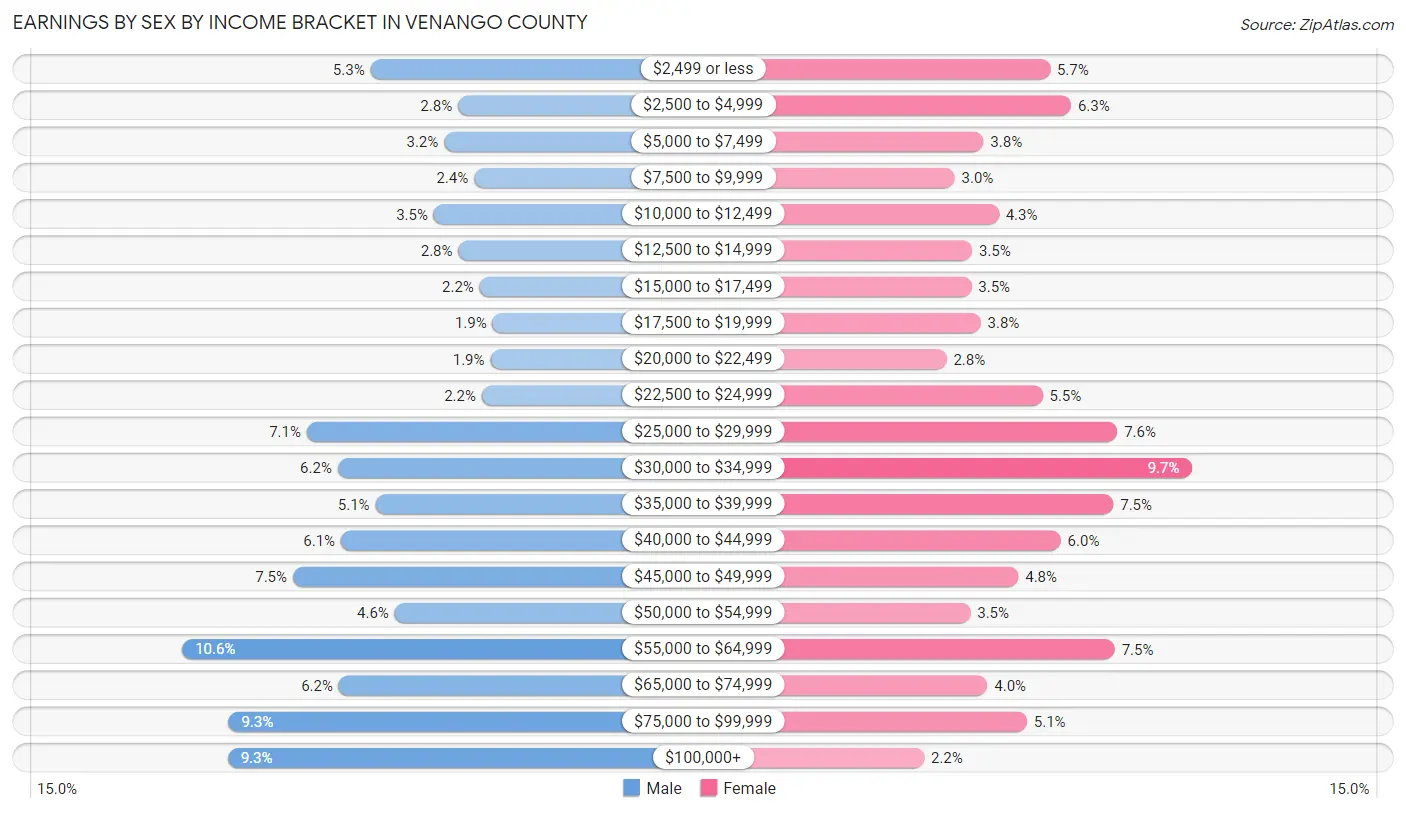
Earnings by Sex by Income Bracket in Venango County
The most common earnings brackets in Venango County are $55,000 to $64,999 for men (1,375 | 10.6%) and $30,000 to $34,999 for women (1,097 | 9.7%).
| Income | Male | Female |
| $2,499 or less | 687 (5.3%) | 647 (5.7%) |
| $2,500 to $4,999 | 367 (2.8%) | 714 (6.3%) |
| $5,000 to $7,499 | 417 (3.2%) | 435 (3.8%) |
| $7,500 to $9,999 | 308 (2.4%) | 344 (3.0%) |
| $10,000 to $12,499 | 456 (3.5%) | 484 (4.3%) |
| $12,500 to $14,999 | 365 (2.8%) | 399 (3.5%) |
| $15,000 to $17,499 | 288 (2.2%) | 397 (3.5%) |
| $17,500 to $19,999 | 241 (1.8%) | 426 (3.8%) |
| $20,000 to $22,499 | 249 (1.9%) | 317 (2.8%) |
| $22,500 to $24,999 | 280 (2.1%) | 623 (5.5%) |
| $25,000 to $29,999 | 920 (7.1%) | 861 (7.6%) |
| $30,000 to $34,999 | 807 (6.2%) | 1,097 (9.7%) |
| $35,000 to $39,999 | 669 (5.1%) | 849 (7.5%) |
| $40,000 to $44,999 | 795 (6.1%) | 681 (6.0%) |
| $45,000 to $49,999 | 970 (7.5%) | 546 (4.8%) |
| $50,000 to $54,999 | 599 (4.6%) | 393 (3.5%) |
| $55,000 to $64,999 | 1,375 (10.6%) | 854 (7.5%) |
| $65,000 to $74,999 | 803 (6.2%) | 448 (4.0%) |
| $75,000 to $99,999 | 1,206 (9.3%) | 574 (5.1%) |
| $100,000+ | 1,208 (9.3%) | 246 (2.2%) |
| Total | 13,010 (100.0%) | 11,335 (100.0%) |
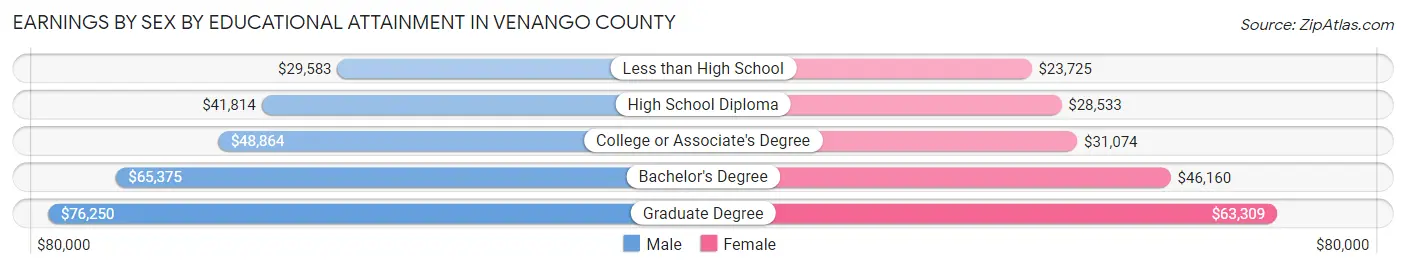
Earnings by Sex by Educational Attainment in Venango County
Average earnings in Venango County are $46,189 for men and $32,503 for women, a difference of 29.6%. Men with an educational attainment of graduate degree enjoy the highest average annual earnings of $76,250, while those with less than high school education earn the least with $29,583. Women with an educational attainment of graduate degree earn the most with the average annual earnings of $63,309, while those with less than high school education have the smallest earnings of $23,725.
| Educational Attainment | Male Income | Female Income |
| Less than High School | $29,583 | $23,725 |
| High School Diploma | $41,814 | $28,533 |
| College or Associate's Degree | $48,864 | $31,074 |
| Bachelor's Degree | $65,375 | $46,160 |
| Graduate Degree | $76,250 | $63,309 |
| Total | $46,189 | $32,503 |
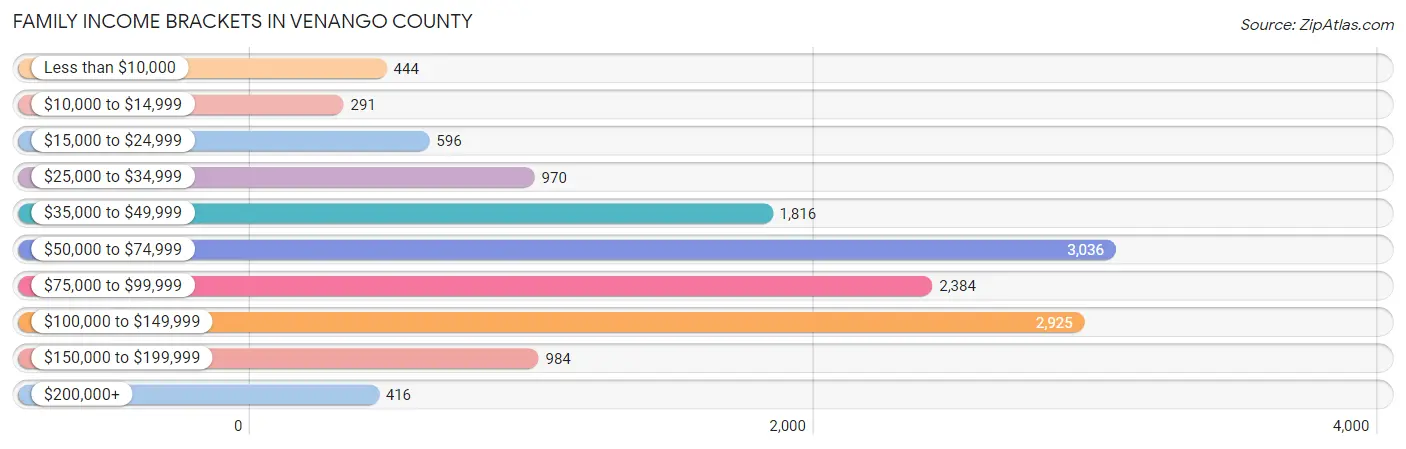
Family Income in Venango County
Family Income Brackets in Venango County
According to the Venango County family income data, there are 3,036 families falling into the $50,000 to $74,999 income range, which is the most common income bracket and makes up 21.9% of all families. Conversely, the $10,000 to $14,999 income bracket is the least frequent group with only 291 families (2.1%) belonging to this category.
| Income Bracket | # Families | % Families |
| Less than $10,000 | 444 | 3.2% |
| $10,000 to $14,999 | 291 | 2.1% |
| $15,000 to $24,999 | 596 | 4.3% |
| $25,000 to $34,999 | 970 | 7.0% |
| $35,000 to $49,999 | 1,816 | 13.1% |
| $50,000 to $74,999 | 3,036 | 21.9% |
| $75,000 to $99,999 | 2,384 | 17.2% |
| $100,000 to $149,999 | 2,925 | 21.1% |
| $150,000 to $199,999 | 984 | 7.1% |
| $200,000+ | 416 | 3.0% |
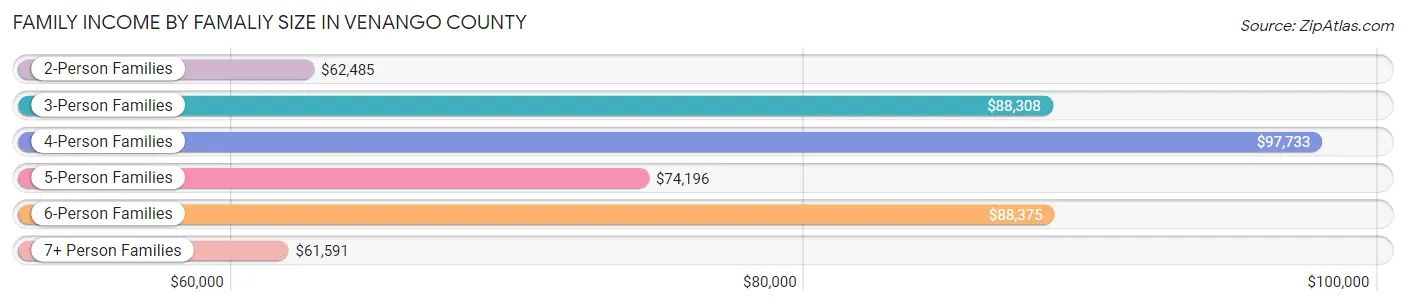
Family Income by Famaliy Size in Venango County
4-person families (1,863 | 13.4%) account for the highest median family income in Venango County with $97,733 per family, while 2-person families (7,728 | 55.7%) have the highest median income of $31,242 per family member.
| Income Bracket | # Families | Median Income |
| 2-Person Families | 7,728 (55.7%) | $62,485 |
| 3-Person Families | 2,960 (21.3%) | $88,308 |
| 4-Person Families | 1,863 (13.4%) | $97,733 |
| 5-Person Families | 783 (5.7%) | $74,196 |
| 6-Person Families | 169 (1.2%) | $88,375 |
| 7+ Person Families | 358 (2.6%) | $61,591 |
| Total | 13,861 (100.0%) | $72,627 |
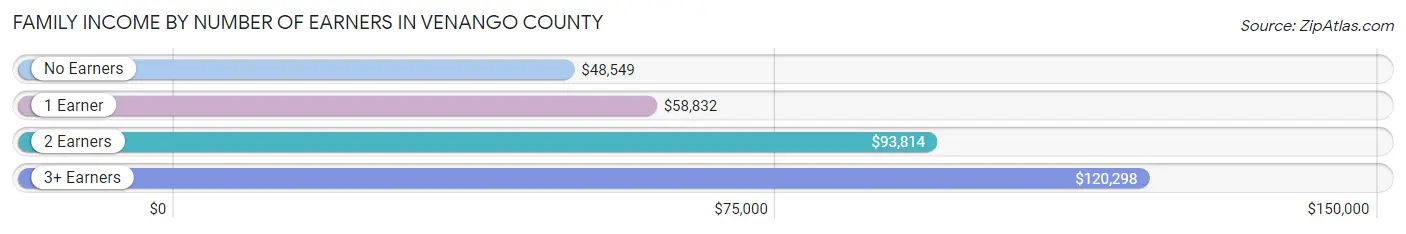
Family Income by Number of Earners in Venango County
The median family income in Venango County is $72,627, with families comprising 3+ earners (1,365) having the highest median family income of $120,298, while families with no earners (3,338) have the lowest median family income of $48,549, accounting for 9.9% and 24.1% of families, respectively.
| Number of Earners | # Families | Median Income |
| No Earners | 3,338 (24.1%) | $48,549 |
| 1 Earner | 4,243 (30.6%) | $58,832 |
| 2 Earners | 4,915 (35.5%) | $93,814 |
| 3+ Earners | 1,365 (9.9%) | $120,298 |
| Total | 13,861 (100.0%) | $72,627 |
Household Income in Venango County
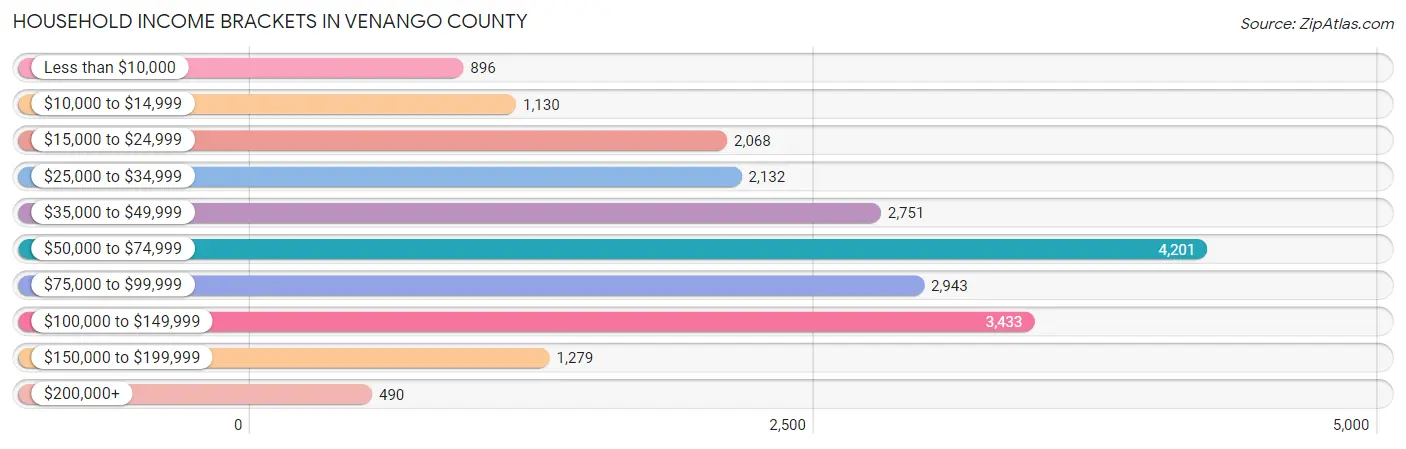
Household Income Brackets in Venango County
With 4,201 households falling in the category, the $50,000 to $74,999 income range is the most frequent in Venango County, accounting for 19.7% of all households. In contrast, only 490 households (2.3%) fall into the $200,000+ income bracket, making it the least populous group.
| Income Bracket | # Households | % Households |
| Less than $10,000 | 896 | 4.2% |
| $10,000 to $14,999 | 1,130 | 5.3% |
| $15,000 to $24,999 | 2,068 | 9.7% |
| $25,000 to $34,999 | 2,132 | 10.0% |
| $35,000 to $49,999 | 2,751 | 12.9% |
| $50,000 to $74,999 | 4,201 | 19.7% |
| $75,000 to $99,999 | 2,943 | 13.8% |
| $100,000 to $149,999 | 3,433 | 16.1% |
| $150,000 to $199,999 | 1,279 | 6.0% |
| $200,000+ | 490 | 2.3% |
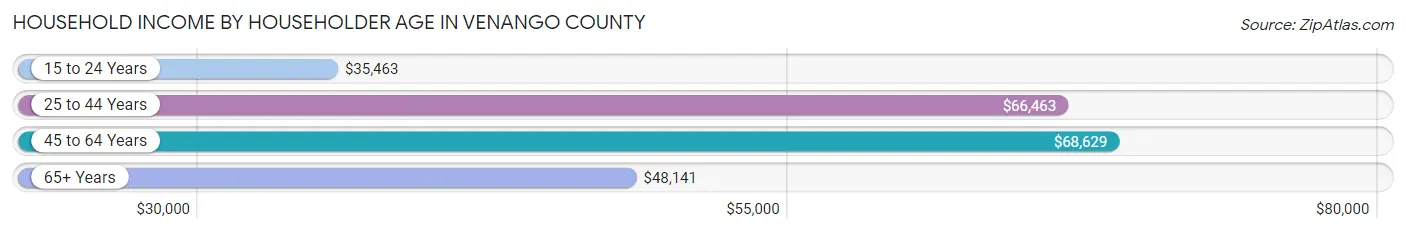
Household Income by Householder Age in Venango County
The median household income in Venango County is $59,278, with the highest median household income of $68,629 found in the 45 to 64 years age bracket for the primary householder. A total of 8,657 households (40.6%) fall into this category. Meanwhile, the 15 to 24 years age bracket for the primary householder has the lowest median household income of $35,463, with 486 households (2.3%) in this group.
| Income Bracket | # Households | Median Income |
| 15 to 24 Years | 486 (2.3%) | $35,463 |
| 25 to 44 Years | 4,995 (23.4%) | $66,463 |
| 45 to 64 Years | 8,657 (40.6%) | $68,629 |
| 65+ Years | 7,185 (33.7%) | $48,141 |
| Total | 21,323 (100.0%) | $59,278 |
Poverty in Venango County
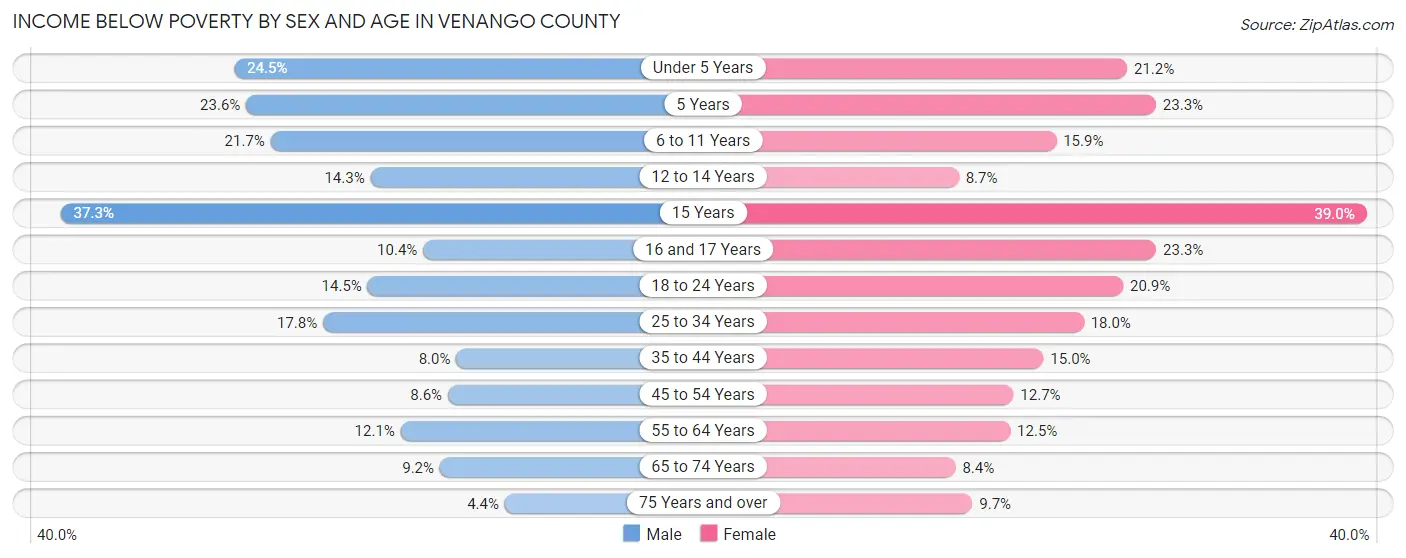
Income Below Poverty by Sex and Age in Venango County
With 12.6% poverty level for males and 14.1% for females among the residents of Venango County, 15 year old males and 15 year old females are the most vulnerable to poverty, with 106 males (37.3%) and 90 females (39.0%) in their respective age groups living below the poverty level.
| Age Bracket | Male | Female |
| Under 5 Years | 313 (24.4%) | 241 (21.2%) |
| 5 Years | 65 (23.5%) | 66 (23.3%) |
| 6 to 11 Years | 340 (21.7%) | 225 (15.9%) |
| 12 to 14 Years | 115 (14.3%) | 73 (8.7%) |
| 15 Years | 106 (37.3%) | 90 (39.0%) |
| 16 and 17 Years | 59 (10.4%) | 148 (23.3%) |
| 18 to 24 Years | 251 (14.5%) | 323 (20.9%) |
| 25 to 34 Years | 457 (17.8%) | 450 (18.0%) |
| 35 to 44 Years | 217 (8.0%) | 410 (15.0%) |
| 45 to 54 Years | 278 (8.6%) | 391 (12.7%) |
| 55 to 64 Years | 510 (12.1%) | 531 (12.5%) |
| 65 to 74 Years | 316 (9.2%) | 301 (8.4%) |
| 75 Years and over | 84 (4.3%) | 259 (9.7%) |
| Total | 3,111 (12.6%) | 3,508 (14.1%) |
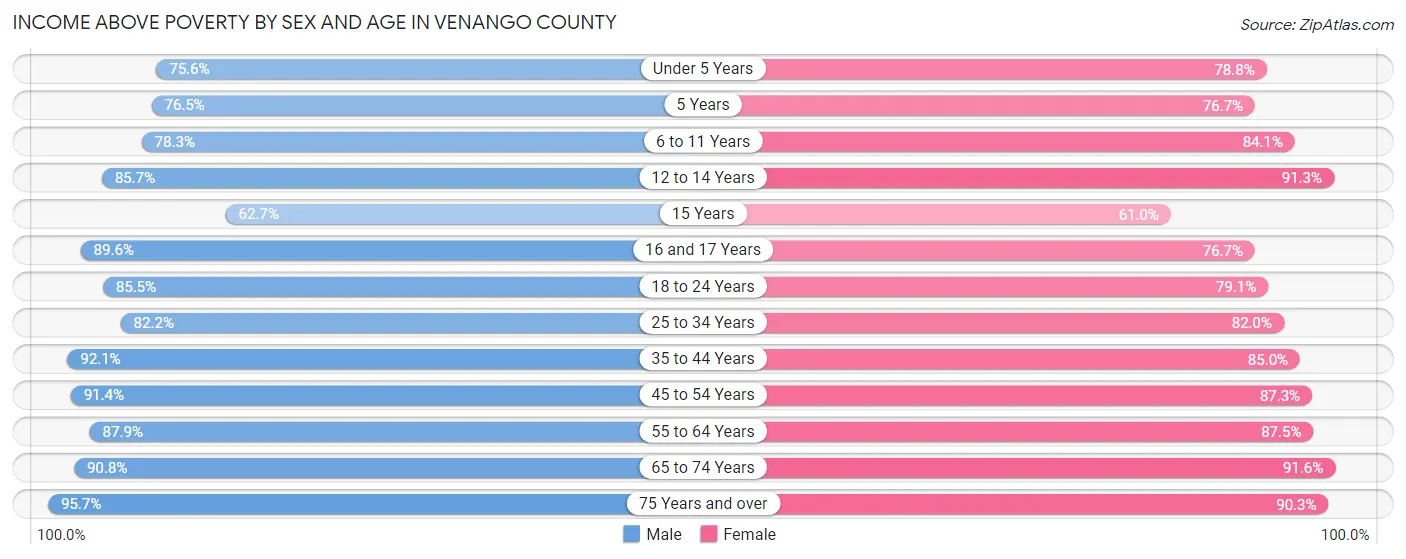
Income Above Poverty by Sex and Age in Venango County
According to the poverty statistics in Venango County, males aged 75 years and over and females aged 65 to 74 years are the age groups that are most secure financially, with 95.7% of males and 91.6% of females in these age groups living above the poverty line.
| Age Bracket | Male | Female |
| Under 5 Years | 967 (75.5%) | 897 (78.8%) |
| 5 Years | 211 (76.4%) | 217 (76.7%) |
| 6 to 11 Years | 1,225 (78.3%) | 1,188 (84.1%) |
| 12 to 14 Years | 688 (85.7%) | 768 (91.3%) |
| 15 Years | 178 (62.7%) | 141 (61.0%) |
| 16 and 17 Years | 508 (89.6%) | 486 (76.7%) |
| 18 to 24 Years | 1,476 (85.5%) | 1,224 (79.1%) |
| 25 to 34 Years | 2,104 (82.2%) | 2,056 (82.0%) |
| 35 to 44 Years | 2,512 (92.0%) | 2,328 (85.0%) |
| 45 to 54 Years | 2,967 (91.4%) | 2,679 (87.3%) |
| 55 to 64 Years | 3,711 (87.9%) | 3,717 (87.5%) |
| 65 to 74 Years | 3,131 (90.8%) | 3,266 (91.6%) |
| 75 Years and over | 1,846 (95.7%) | 2,414 (90.3%) |
| Total | 21,524 (87.4%) | 21,381 (85.9%) |
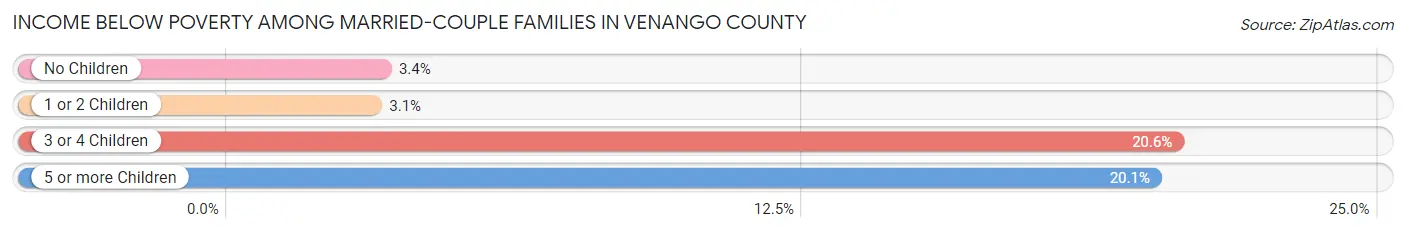
Income Below Poverty Among Married-Couple Families in Venango County
The poverty statistics for married-couple families in Venango County show that 4.6% or 492 of the total 10,718 families live below the poverty line. Families with 3 or 4 children have the highest poverty rate of 20.6%, comprising of 125 families. On the other hand, families with 1 or 2 children have the lowest poverty rate of 3.1%, which includes 86 families.
| Children | Above Poverty | Below Poverty |
| No Children | 6,924 (96.7%) | 240 (3.4%) |
| 1 or 2 Children | 2,657 (96.9%) | 86 (3.1%) |
| 3 or 4 Children | 482 (79.4%) | 125 (20.6%) |
| 5 or more Children | 163 (79.9%) | 41 (20.1%) |
| Total | 10,226 (95.4%) | 492 (4.6%) |
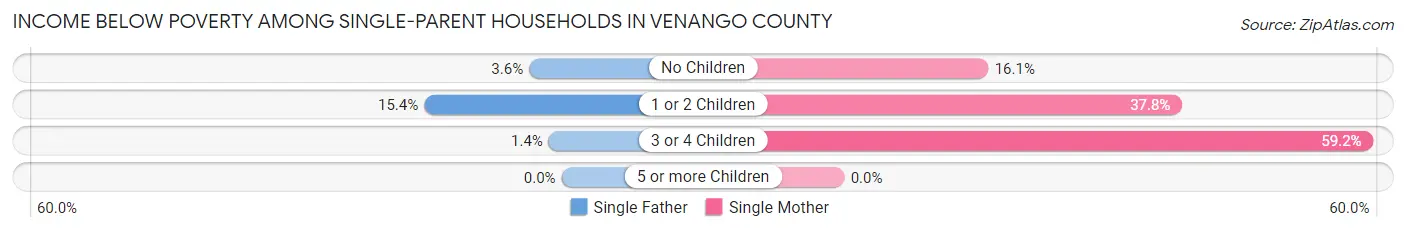
Income Below Poverty Among Single-Parent Households in Venango County
According to the poverty data in Venango County, 9.8% or 104 single-father households and 31.2% or 648 single-mother households are living below the poverty line. Among single-father households, those with 1 or 2 children have the highest poverty rate, with 88 households (15.4%) experiencing poverty. Likewise, among single-mother households, those with 3 or 4 children have the highest poverty rate, with 148 households (59.2%) falling below the poverty line.
| Children | Single Father | Single Mother |
| No Children | 15 (3.6%) | 141 (16.1%) |
| 1 or 2 Children | 88 (15.4%) | 359 (37.8%) |
| 3 or 4 Children | 1 (1.4%) | 148 (59.2%) |
| 5 or more Children | 0 (0.0%) | 0 (0.0%) |
| Total | 104 (9.8%) | 648 (31.2%) |
Income Below Poverty Among Married-Couple vs Single-Parent Households in Venango County
The poverty data for Venango County shows that 492 of the married-couple family households (4.6%) and 752 of the single-parent households (23.9%) are living below the poverty level. Within the married-couple family households, those with 3 or 4 children have the highest poverty rate, with 125 households (20.6%) falling below the poverty line. Among the single-parent households, those with 3 or 4 children have the highest poverty rate, with 149 household (46.6%) living below poverty.
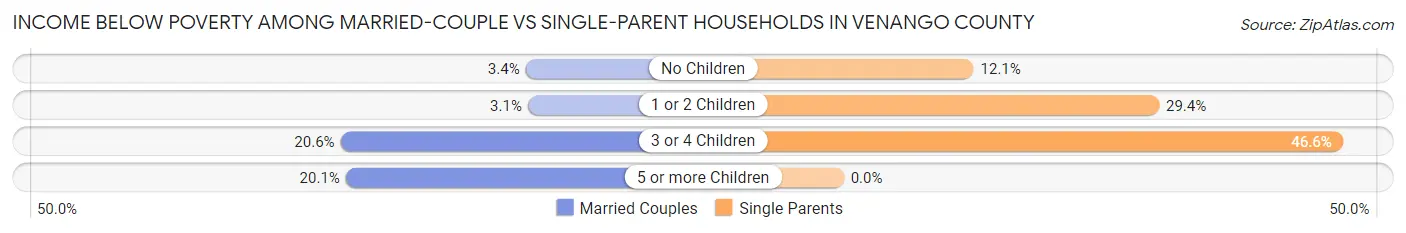
| Children | Married-Couple Families | Single-Parent Households |
| No Children | 240 (3.4%) | 156 (12.1%) |
| 1 or 2 Children | 86 (3.1%) | 447 (29.4%) |
| 3 or 4 Children | 125 (20.6%) | 149 (46.6%) |
| 5 or more Children | 41 (20.1%) | 0 (0.0%) |
| Total | 492 (4.6%) | 752 (23.9%) |
Race in Venango County
The most populous races in Venango County are White / Caucasian (47,943 | 95.0%), Two or more Races (1,428 | 2.8%), and Black / African American (612 | 1.2%).
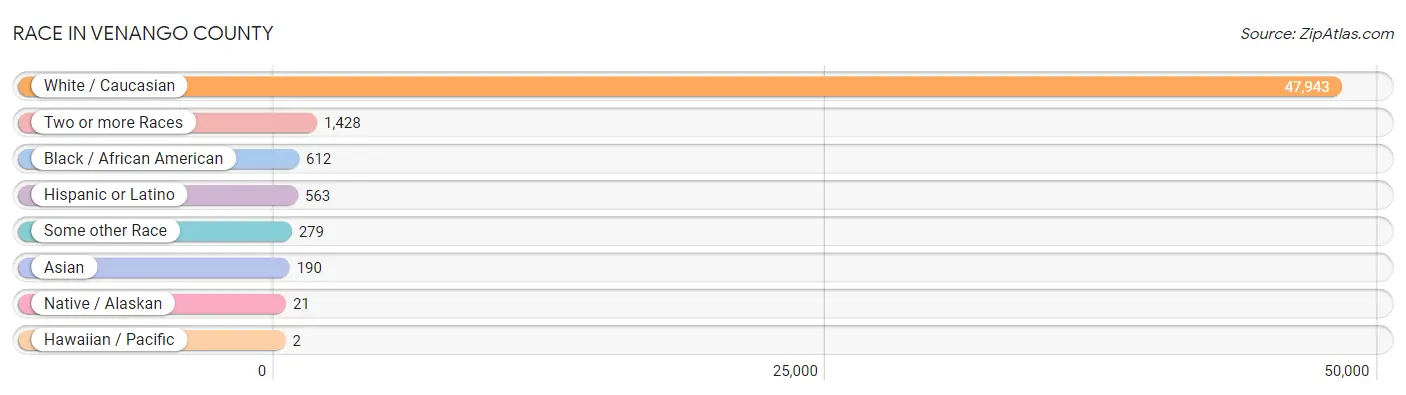
| Race | # Population | % Population |
| Asian | 190 | 0.4% |
| Black / African American | 612 | 1.2% |
| Hawaiian / Pacific | 2 | 0.0% |
| Hispanic or Latino | 563 | 1.1% |
| Native / Alaskan | 21 | 0.0% |
| White / Caucasian | 47,943 | 95.0% |
| Two or more Races | 1,428 | 2.8% |
| Some other Race | 279 | 0.5% |
| Total | 50,475 | 100.0% |
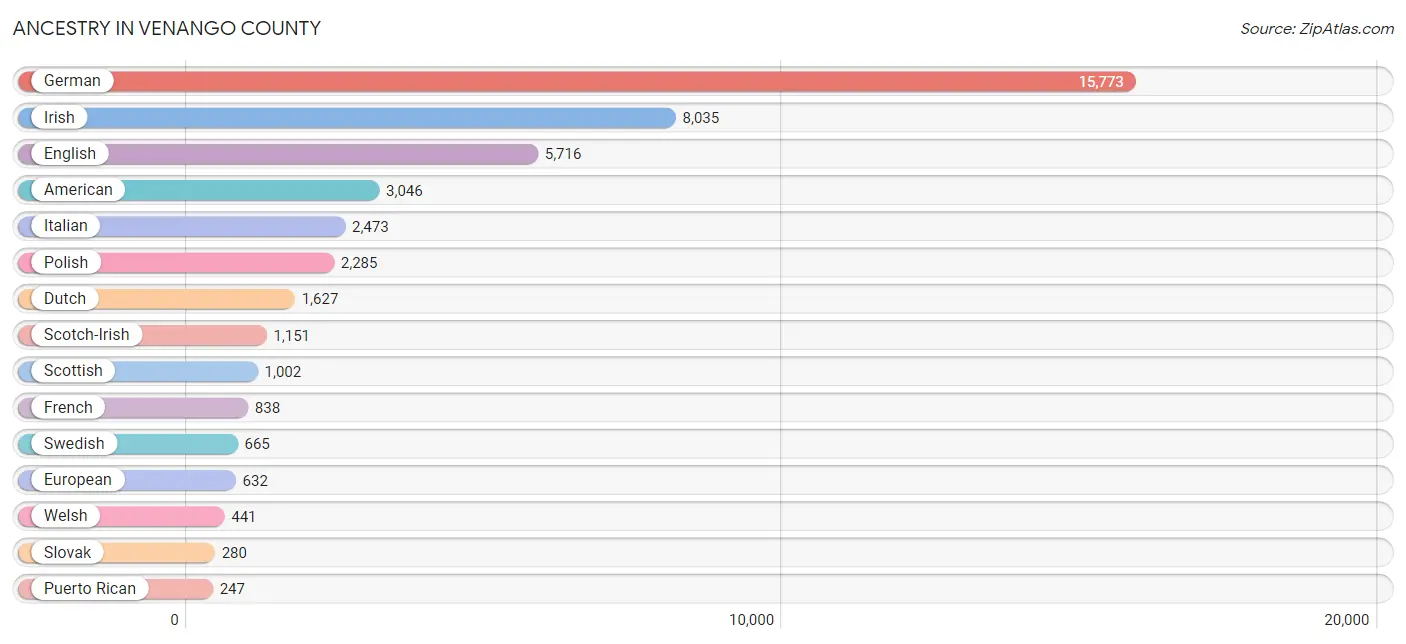
Ancestry in Venango County
The most populous ancestries reported in Venango County are German (15,773 | 31.2%), Irish (8,035 | 15.9%), English (5,716 | 11.3%), American (3,046 | 6.0%), and Italian (2,473 | 4.9%), together accounting for 69.4% of all Venango County residents.
| Ancestry | # Population | % Population |
| African | 30 | 0.1% |
| American | 3,046 | 6.0% |
| Apache | 1 | 0.0% |
| Arab | 20 | 0.0% |
| Australian | 4 | 0.0% |
| Austrian | 122 | 0.2% |
| Belgian | 23 | 0.1% |
| Belizean | 2 | 0.0% |
| Bhutanese | 17 | 0.0% |
| Blackfeet | 31 | 0.1% |
| British | 98 | 0.2% |
| Burmese | 52 | 0.1% |
| Cajun | 4 | 0.0% |
| Canadian | 51 | 0.1% |
| Celtic | 24 | 0.1% |
| Central American | 13 | 0.0% |
| Central American Indian | 9 | 0.0% |
| Cherokee | 172 | 0.3% |
| Chilean | 3 | 0.0% |
| Chinese | 7 | 0.0% |
| Colville | 5 | 0.0% |
| Cree | 8 | 0.0% |
| Croatian | 36 | 0.1% |
| Crow | 2 | 0.0% |
| Cuban | 9 | 0.0% |
| Czech | 58 | 0.1% |
| Czechoslovakian | 31 | 0.1% |
| Danish | 78 | 0.2% |
| Delaware | 2 | 0.0% |
| Dominican | 72 | 0.1% |
| Dutch | 1,627 | 3.2% |
| Eastern European | 60 | 0.1% |
| Ecuadorian | 2 | 0.0% |
| English | 5,716 | 11.3% |
| European | 632 | 1.3% |
| Finnish | 19 | 0.0% |
| French | 838 | 1.7% |
| French American Indian | 5 | 0.0% |
| French Canadian | 44 | 0.1% |
| German | 15,773 | 31.2% |
| Greek | 199 | 0.4% |
| Guatemalan | 3 | 0.0% |
| Haitian | 2 | 0.0% |
| Hungarian | 211 | 0.4% |
| Icelander | 36 | 0.1% |
| Indian (Asian) | 51 | 0.1% |
| Inupiat | 12 | 0.0% |
| Irish | 8,035 | 15.9% |
| Iroquois | 24 | 0.1% |
| Israeli | 7 | 0.0% |
| Italian | 2,473 | 4.9% |
| Jamaican | 10 | 0.0% |
| Korean | 82 | 0.2% |
| Latvian | 9 | 0.0% |
| Lebanese | 13 | 0.0% |
| Lithuanian | 81 | 0.2% |
| Luxembourger | 12 | 0.0% |
| Malaysian | 15 | 0.0% |
| Mexican | 151 | 0.3% |
| Native Hawaiian | 29 | 0.1% |
| Navajo | 3 | 0.0% |
| New Zealander | 2 | 0.0% |
| Northern European | 16 | 0.0% |
| Norwegian | 191 | 0.4% |
| Pakistani | 9 | 0.0% |
| Panamanian | 10 | 0.0% |
| Pennsylvania German | 234 | 0.5% |
| Polish | 2,285 | 4.5% |
| Portuguese | 25 | 0.1% |
| Puerto Rican | 247 | 0.5% |
| Russian | 94 | 0.2% |
| Samoan | 4 | 0.0% |
| Scandinavian | 59 | 0.1% |
| Scotch-Irish | 1,151 | 2.3% |
| Scottish | 1,002 | 2.0% |
| Serbian | 77 | 0.2% |
| Sioux | 5 | 0.0% |
| Slavic | 49 | 0.1% |
| Slovak | 280 | 0.5% |
| Slovene | 43 | 0.1% |
| South African | 5 | 0.0% |
| South American | 5 | 0.0% |
| Spaniard | 6 | 0.0% |
| Spanish | 21 | 0.0% |
| Sri Lankan | 19 | 0.0% |
| Subsaharan African | 35 | 0.1% |
| Swedish | 665 | 1.3% |
| Swiss | 86 | 0.2% |
| Syrian | 7 | 0.0% |
| Thai | 132 | 0.3% |
| Trinidadian and Tobagonian | 32 | 0.1% |
| Turkish | 4 | 0.0% |
| Ugandan | 1 | 0.0% |
| Ukrainian | 116 | 0.2% |
| Welsh | 441 | 0.9% |
| Yugoslavian | 2 | 0.0% | View All 96 Rows |
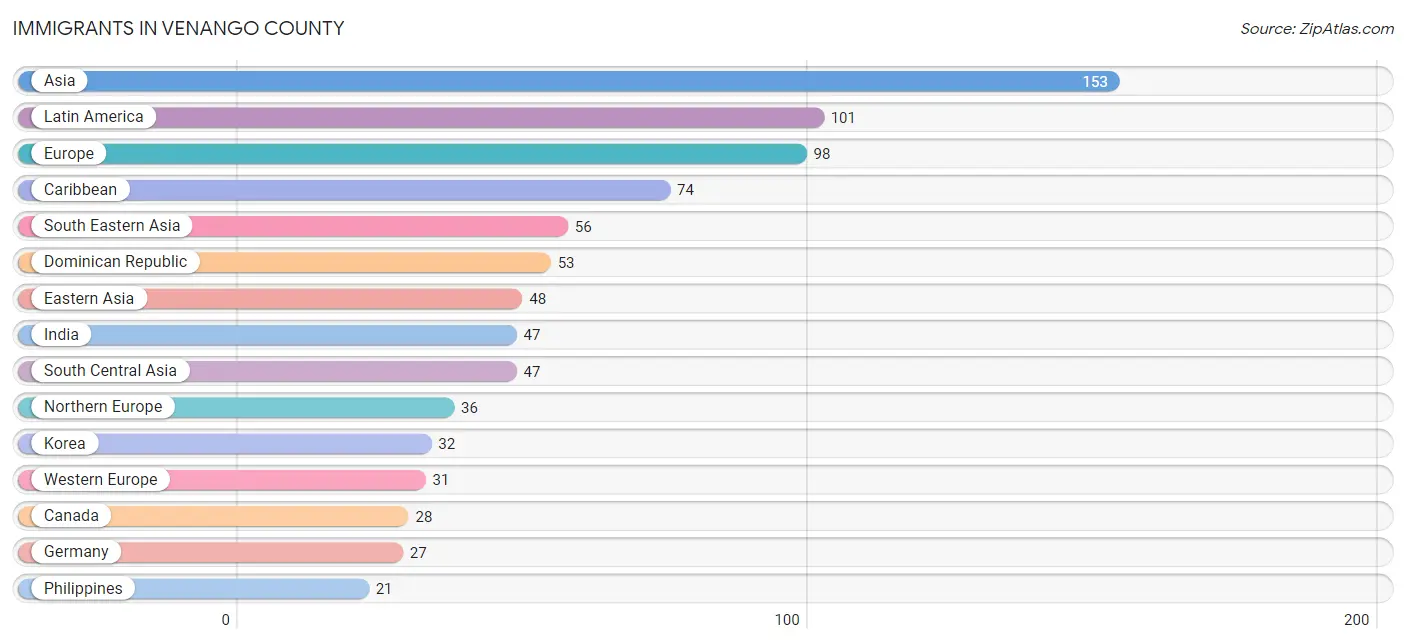
Immigrants in Venango County
The most numerous immigrant groups reported in Venango County came from Asia (153 | 0.3%), Latin America (101 | 0.2%), Europe (98 | 0.2%), Caribbean (74 | 0.2%), and South Eastern Asia (56 | 0.1%), together accounting for 0.9% of all Venango County residents.
| Immigration Origin | # Population | % Population |
| Africa | 11 | 0.0% |
| Asia | 153 | 0.3% |
| Bolivia | 12 | 0.0% |
| Canada | 28 | 0.1% |
| Caribbean | 74 | 0.2% |
| Central America | 10 | 0.0% |
| Chile | 3 | 0.0% |
| China | 11 | 0.0% |
| Congo | 2 | 0.0% |
| Dominican Republic | 53 | 0.1% |
| Eastern Africa | 7 | 0.0% |
| Eastern Asia | 48 | 0.1% |
| Eastern Europe | 20 | 0.0% |
| Ecuador | 2 | 0.0% |
| England | 2 | 0.0% |
| Europe | 98 | 0.2% |
| Germany | 27 | 0.1% |
| Guatemala | 3 | 0.0% |
| India | 47 | 0.1% |
| Italy | 11 | 0.0% |
| Japan | 5 | 0.0% |
| Korea | 32 | 0.1% |
| Laos | 7 | 0.0% |
| Latin America | 101 | 0.2% |
| Mexico | 7 | 0.0% |
| Middle Africa | 2 | 0.0% |
| Northern Europe | 36 | 0.1% |
| Oceania | 2 | 0.0% |
| Philippines | 21 | 0.0% |
| Poland | 9 | 0.0% |
| Romania | 2 | 0.0% |
| South Africa | 2 | 0.0% |
| South America | 17 | 0.0% |
| South Central Asia | 47 | 0.1% |
| South Eastern Asia | 56 | 0.1% |
| Southern Europe | 11 | 0.0% |
| Sweden | 2 | 0.0% |
| Switzerland | 4 | 0.0% |
| Thailand | 9 | 0.0% |
| Trinidad and Tobago | 21 | 0.0% |
| Turkey | 2 | 0.0% |
| Uganda | 1 | 0.0% |
| Vietnam | 19 | 0.0% |
| Western Asia | 2 | 0.0% |
| Western Europe | 31 | 0.1% |
| Zimbabwe | 3 | 0.0% | View All 46 Rows |
Sex and Age in Venango County
Sex and Age in Venango County
The most populous age groups in Venango County are 60 to 64 Years (2,275 | 9.0%) for men and 60 to 64 Years (2,324 | 9.2%) for women.
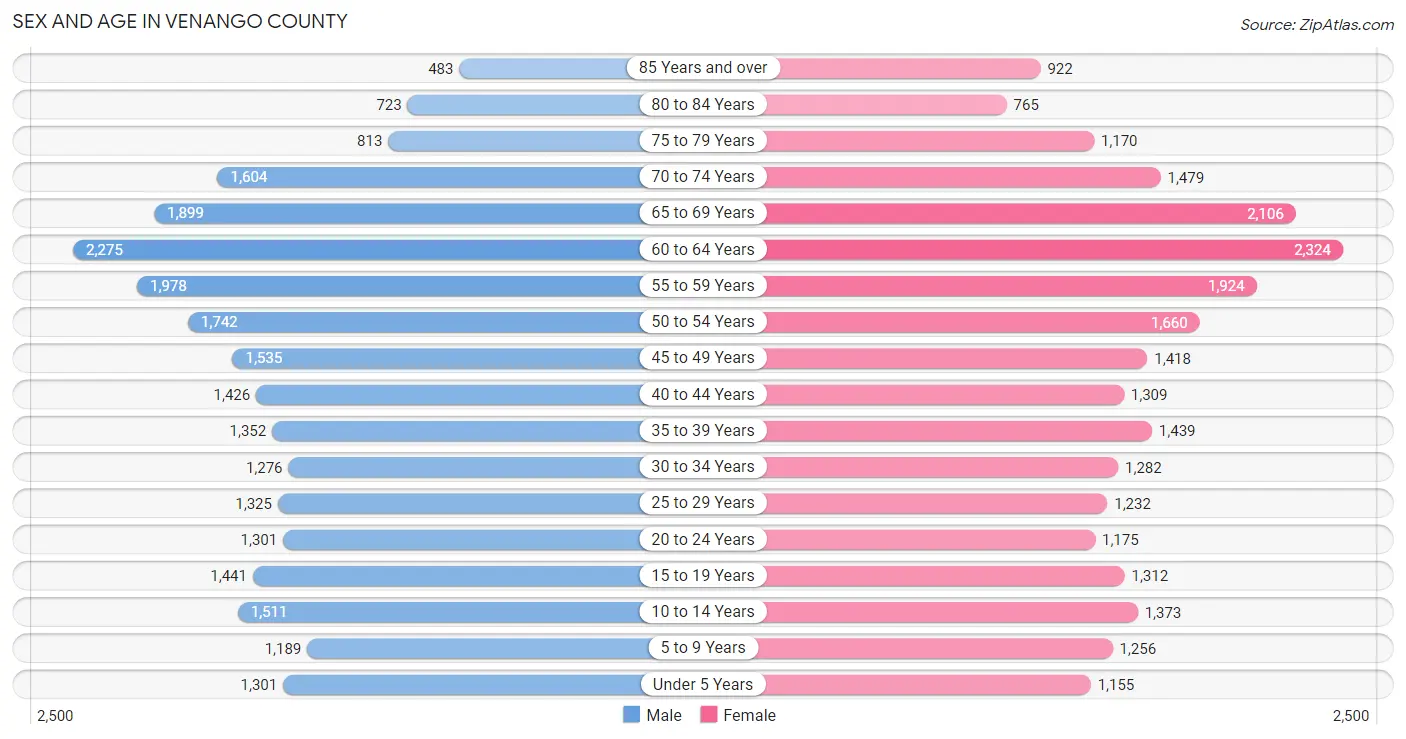
| Age Bracket | Male | Female |
| Under 5 Years | 1,301 (5.2%) | 1,155 (4.6%) |
| 5 to 9 Years | 1,189 (4.7%) | 1,256 (5.0%) |
| 10 to 14 Years | 1,511 (6.0%) | 1,373 (5.4%) |
| 15 to 19 Years | 1,441 (5.7%) | 1,312 (5.2%) |
| 20 to 24 Years | 1,301 (5.2%) | 1,175 (4.6%) |
| 25 to 29 Years | 1,325 (5.3%) | 1,232 (4.9%) |
| 30 to 34 Years | 1,276 (5.1%) | 1,282 (5.1%) |
| 35 to 39 Years | 1,352 (5.4%) | 1,439 (5.7%) |
| 40 to 44 Years | 1,426 (5.7%) | 1,309 (5.2%) |
| 45 to 49 Years | 1,535 (6.1%) | 1,418 (5.6%) |
| 50 to 54 Years | 1,742 (6.9%) | 1,660 (6.6%) |
| 55 to 59 Years | 1,978 (7.9%) | 1,924 (7.6%) |
| 60 to 64 Years | 2,275 (9.0%) | 2,324 (9.2%) |
| 65 to 69 Years | 1,899 (7.5%) | 2,106 (8.3%) |
| 70 to 74 Years | 1,604 (6.4%) | 1,479 (5.9%) |
| 75 to 79 Years | 813 (3.2%) | 1,170 (4.6%) |
| 80 to 84 Years | 723 (2.9%) | 765 (3.0%) |
| 85 Years and over | 483 (1.9%) | 922 (3.6%) |
| Total | 25,174 (100.0%) | 25,301 (100.0%) |
Families and Households in Venango County
Median Family Size in Venango County
The median family size in Venango County is 2.83 persons per family, with married-couple families (10,718 | 77.3%) accounting for the largest median family size of 2.87 persons per family. On the other hand, single male/father families (1,065 | 7.7%) represent the smallest median family size with 2.59 persons per family.
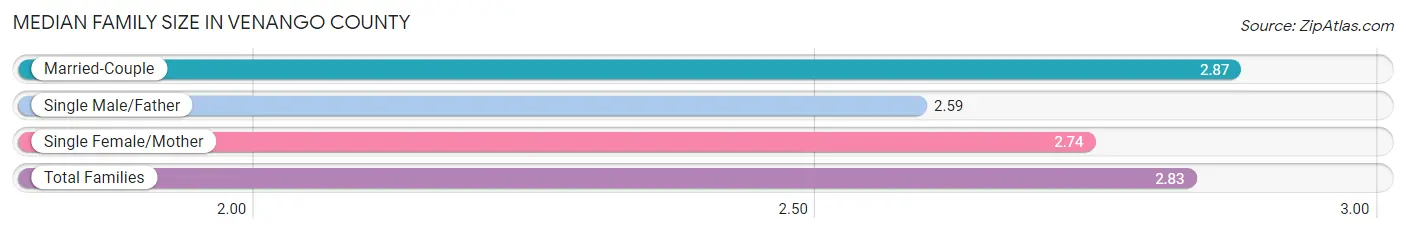
| Family Type | # Families | Family Size |
| Married-Couple | 10,718 (77.3%) | 2.87 |
| Single Male/Father | 1,065 (7.7%) | 2.59 |
| Single Female/Mother | 2,078 (15.0%) | 2.74 |
| Total Families | 13,861 (100.0%) | 2.83 |
Median Household Size in Venango County
The median household size in Venango County is 2.31 persons per household, with single male/father households (1,065 | 5.0%) accounting for the largest median household size of 3.01 persons per household. non-family households (7,462 | 35.0%) represent the smallest median household size with 1.19 persons per household.
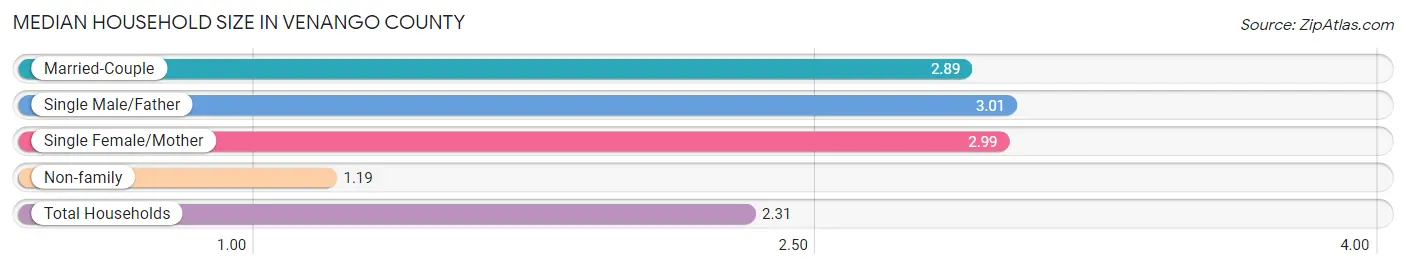
| Household Type | # Households | Household Size |
| Married-Couple | 10,718 (50.3%) | 2.89 |
| Single Male/Father | 1,065 (5.0%) | 3.01 |
| Single Female/Mother | 2,078 (9.8%) | 2.99 |
| Non-family | 7,462 (35.0%) | 1.19 |
| Total Households | 21,323 (100.0%) | 2.31 |
Household Size by Marriage Status in Venango County
Out of a total of 21,323 households in Venango County, 13,861 (65.0%) are family households, while 7,462 (35.0%) are nonfamily households. The most numerous type of family households are 2-person households, comprising 7,307, and the most common type of nonfamily households are 1-person households, comprising 6,273.
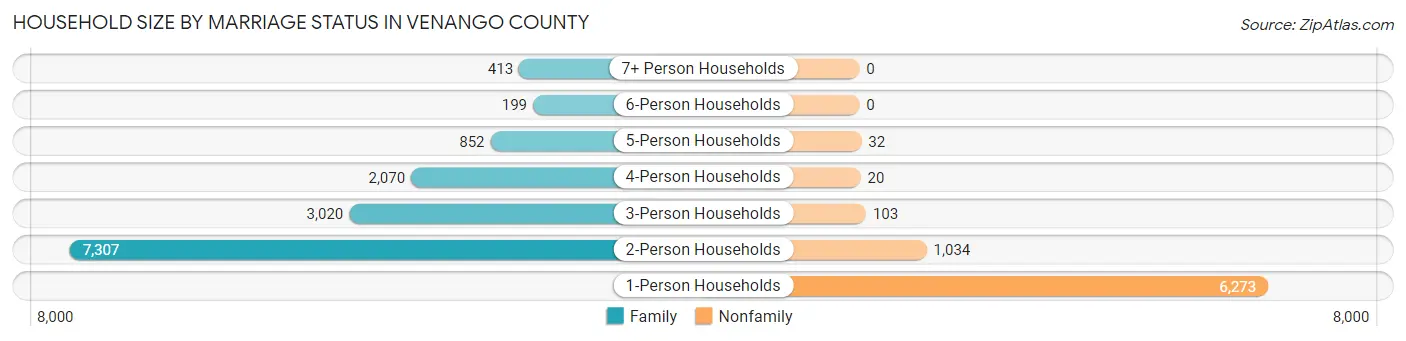
| Household Size | Family Households | Nonfamily Households |
| 1-Person Households | - | 6,273 (29.4%) |
| 2-Person Households | 7,307 (34.3%) | 1,034 (4.9%) |
| 3-Person Households | 3,020 (14.2%) | 103 (0.5%) |
| 4-Person Households | 2,070 (9.7%) | 20 (0.1%) |
| 5-Person Households | 852 (4.0%) | 32 (0.2%) |
| 6-Person Households | 199 (0.9%) | 0 (0.0%) |
| 7+ Person Households | 413 (1.9%) | 0 (0.0%) |
| Total | 13,861 (65.0%) | 7,462 (35.0%) |
Female Fertility in Venango County
Fertility by Age in Venango County
Average fertility rate in Venango County is 46.0 births per 1,000 women. Women in the age bracket of 20 to 34 years have the highest fertility rate with 98.0 births per 1,000 women. Women in the age bracket of 20 to 34 years acount for 83.2% of all women with births.
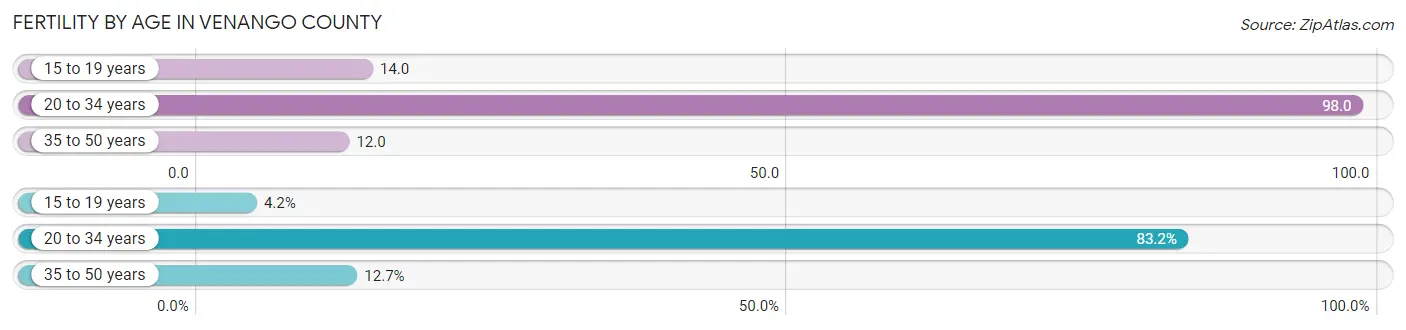
| Age Bracket | Women with Births | Births / 1,000 Women |
| 15 to 19 years | 18 (4.2%) | 14.0 |
| 20 to 34 years | 361 (83.2%) | 98.0 |
| 35 to 50 years | 55 (12.7%) | 12.0 |
| Total | 434 (100.0%) | 46.0 |
Fertility by Age by Marriage Status in Venango County
68.9% of women with births (434) in Venango County are married. The highest percentage of unmarried women with births falls into 15 to 19 years age bracket with 100.0% of them unmarried at the time of birth, while the lowest percentage of unmarried women with births belong to 35 to 50 years age bracket with 21.8% of them unmarried.
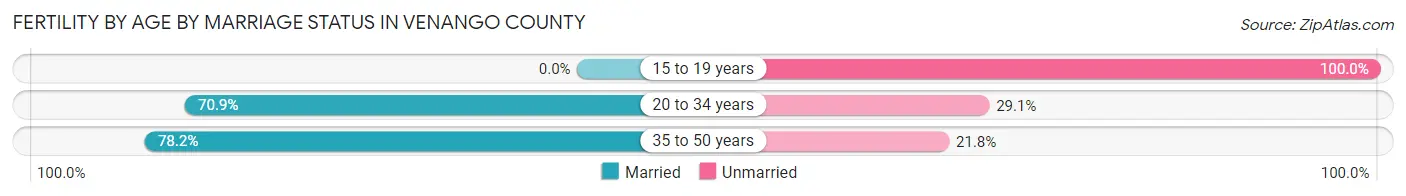
| Age Bracket | Married | Unmarried |
| 15 to 19 years | 0 (0.0%) | 18 (100.0%) |
| 20 to 34 years | 256 (70.9%) | 105 (29.1%) |
| 35 to 50 years | 43 (78.2%) | 12 (21.8%) |
| Total | 299 (68.9%) | 135 (31.1%) |
Fertility by Education in Venango County
Average fertility rate in Venango County is 46.0 births per 1,000 women. Women with the education attainment of graduate degree have the highest fertility rate of 72.0 births per 1,000 women, while women with the education attainment of bachelor's degree have the lowest fertility at 28.0 births per 1,000 women. Women with the education attainment of high school diploma represent 30.2% of all women with births.
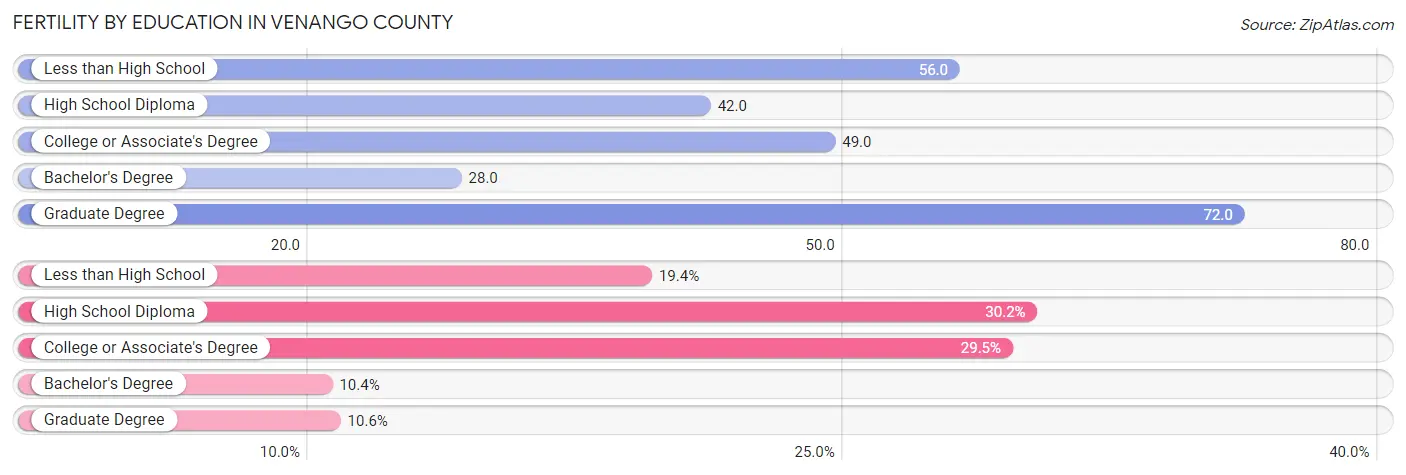
| Educational Attainment | Women with Births | Births / 1,000 Women |
| Less than High School | 84 (19.4%) | 56.0 |
| High School Diploma | 131 (30.2%) | 42.0 |
| College or Associate's Degree | 128 (29.5%) | 49.0 |
| Bachelor's Degree | 45 (10.4%) | 28.0 |
| Graduate Degree | 46 (10.6%) | 72.0 |
| Total | 434 (100.0%) | 46.0 |
Fertility by Education by Marriage Status in Venango County
31.1% of women with births in Venango County are unmarried. Women with the educational attainment of bachelor's degree are most likely to be married with 100.0% of them married at childbirth, while women with the educational attainment of high school diploma are least likely to be married with 42.7% of them unmarried at childbirth.
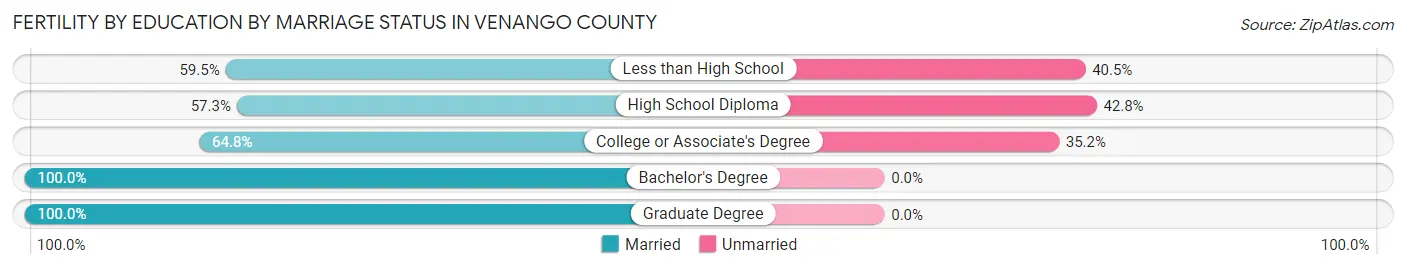
| Educational Attainment | Married | Unmarried |
| Less than High School | 50 (59.5%) | 34 (40.5%) |
| High School Diploma | 75 (57.3%) | 56 (42.7%) |
| College or Associate's Degree | 83 (64.8%) | 45 (35.2%) |
| Bachelor's Degree | 45 (100.0%) | 0 (0.0%) |
| Graduate Degree | 46 (100.0%) | 0 (0.0%) |
| Total | 299 (68.9%) | 135 (31.1%) |
Employment Characteristics in Venango County
Employment by Class of Employer in Venango County
Among the 21,359 employed individuals in Venango County, private company employees (13,482 | 63.1%), not-for-profit organizations (2,647 | 12.4%), and local government employees (1,506 | 7.0%) make up the most common classes of employment.
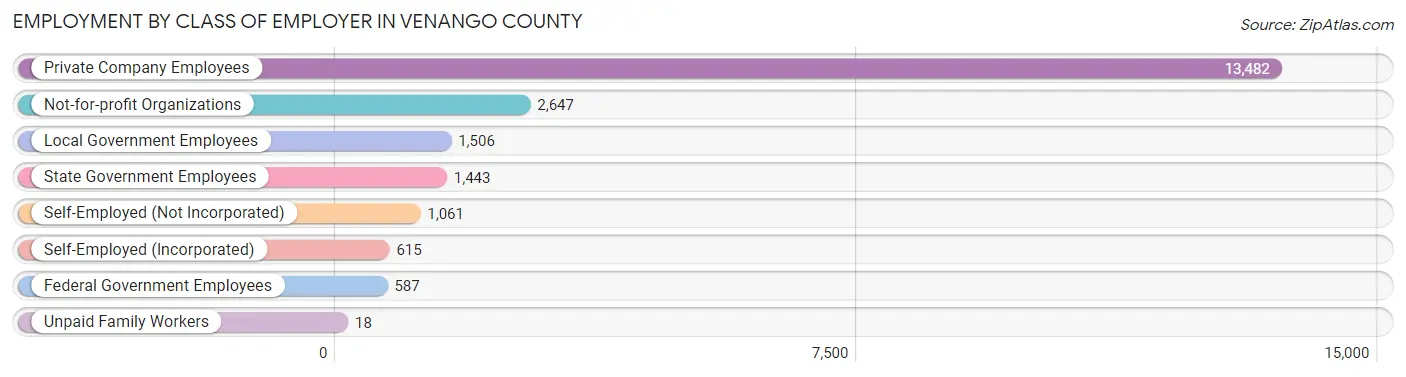
| Employer Class | # Employees | % Employees |
| Private Company Employees | 13,482 | 63.1% |
| Self-Employed (Incorporated) | 615 | 2.9% |
| Self-Employed (Not Incorporated) | 1,061 | 5.0% |
| Not-for-profit Organizations | 2,647 | 12.4% |
| Local Government Employees | 1,506 | 7.0% |
| State Government Employees | 1,443 | 6.8% |
| Federal Government Employees | 587 | 2.8% |
| Unpaid Family Workers | 18 | 0.1% |
| Total | 21,359 | 100.0% |
Employment Status by Age in Venango County
According to the labor force statistics for Venango County, out of the total population over 16 years of age (42,175), 55.3% or 23,323 individuals are in the labor force, with 6.7% or 1,563 of them unemployed. The age group with the highest labor force participation rate is 25 to 29 years, with 83.8% or 2,143 individuals in the labor force. Within the labor force, the 25 to 29 years age range has the highest percentage of unemployed individuals, with 14.2% or 304 of them being unemployed.
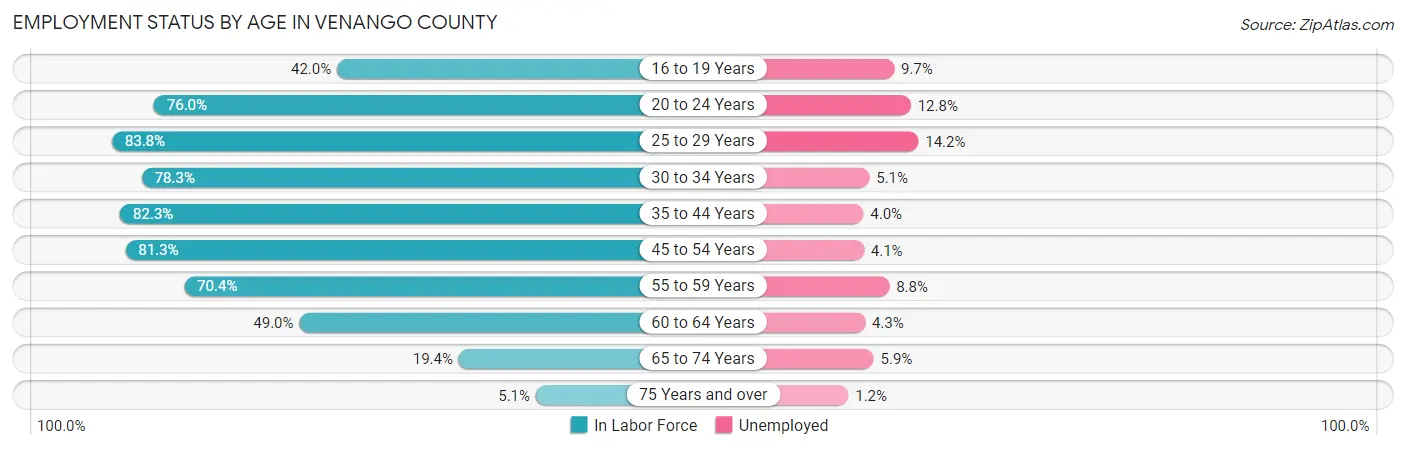
| Age Bracket | In Labor Force | Unemployed |
| 16 to 19 Years | 940 (42.0%) | 91 (9.7%) |
| 20 to 24 Years | 1,882 (76.0%) | 241 (12.8%) |
| 25 to 29 Years | 2,143 (83.8%) | 304 (14.2%) |
| 30 to 34 Years | 2,003 (78.3%) | 102 (5.1%) |
| 35 to 44 Years | 4,548 (82.3%) | 182 (4.0%) |
| 45 to 54 Years | 5,167 (81.3%) | 212 (4.1%) |
| 55 to 59 Years | 2,747 (70.4%) | 242 (8.8%) |
| 60 to 64 Years | 2,254 (49.0%) | 97 (4.3%) |
| 65 to 74 Years | 1,375 (19.4%) | 81 (5.9%) |
| 75 Years and over | 249 (5.1%) | 3 (1.2%) |
| Total | 23,323 (55.3%) | 1,563 (6.7%) |
Employment Status by Educational Attainment in Venango County
According to labor force statistics for Venango County, 74.0% of individuals (18,868) out of the total population between 25 and 64 years of age (25,497) are in the labor force, with 6.0% or 1,132 of them being unemployed. The group with the highest labor force participation rate are those with the educational attainment of bachelor's degree or higher, with 85.2% or 4,417 individuals in the labor force. Within the labor force, individuals with less than high school education have the highest percentage of unemployment, with 14.7% or 132 of them being unemployed.
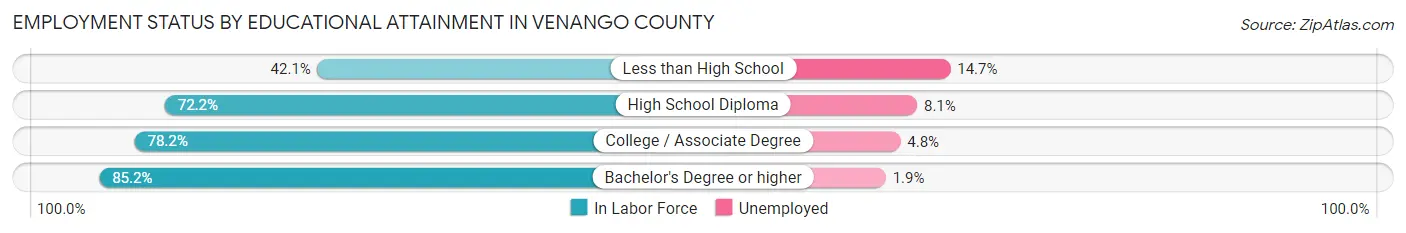
| Educational Attainment | In Labor Force | Unemployed |
| Less than High School | 896 (42.1%) | 313 (14.7%) |
| High School Diploma | 8,110 (72.2%) | 910 (8.1%) |
| College / Associate Degree | 5,436 (78.2%) | 334 (4.8%) |
| Bachelor's Degree or higher | 4,417 (85.2%) | 98 (1.9%) |
| Total | 18,868 (74.0%) | 1,530 (6.0%) |
Employment Occupations by Sex in Venango County
Management, Business, Science and Arts Occupations
The most common Management, Business, Science and Arts occupations in Venango County are Community & Social Service (2,095 | 9.6%), Health Diagnosing & Treating (1,607 | 7.4%), Management (1,463 | 6.7%), Education Instruction & Library (1,166 | 5.4%), and Health Technologists (827 | 3.8%).
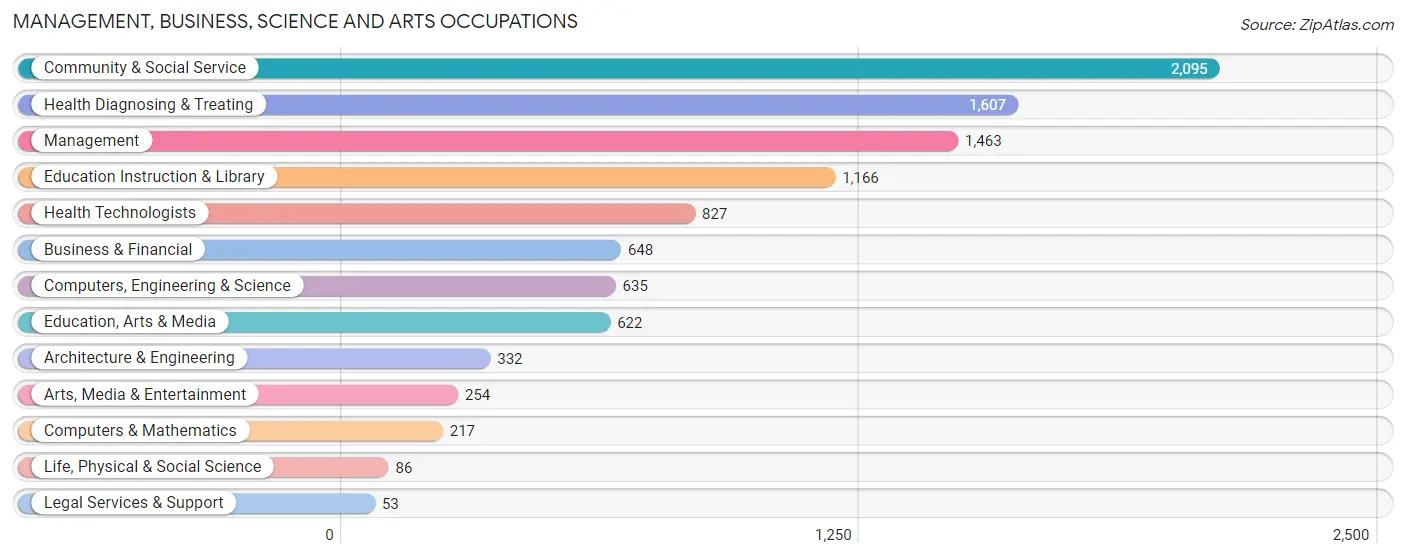
Management, Business, Science and Arts Occupations by Sex
Within the Management, Business, Science and Arts occupations in Venango County, the most male-oriented occupations are Architecture & Engineering (79.5%), Computers, Engineering & Science (64.9%), and Business & Financial (58.3%), while the most female-oriented occupations are Health Diagnosing & Treating (81.2%), Health Technologists (80.9%), and Education Instruction & Library (72.8%).
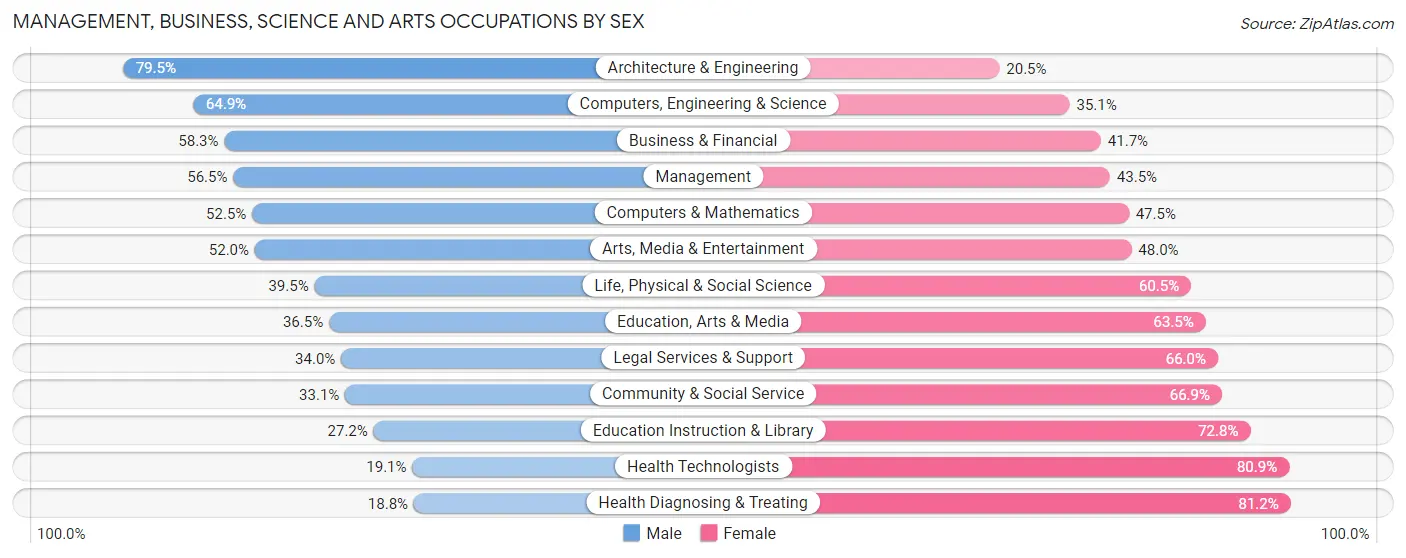
| Occupation | Male | Female |
| Management | 826 (56.5%) | 637 (43.5%) |
| Business & Financial | 378 (58.3%) | 270 (41.7%) |
| Computers, Engineering & Science | 412 (64.9%) | 223 (35.1%) |
| Computers & Mathematics | 114 (52.5%) | 103 (47.5%) |
| Architecture & Engineering | 264 (79.5%) | 68 (20.5%) |
| Life, Physical & Social Science | 34 (39.5%) | 52 (60.5%) |
| Community & Social Service | 694 (33.1%) | 1,401 (66.9%) |
| Education, Arts & Media | 227 (36.5%) | 395 (63.5%) |
| Legal Services & Support | 18 (34.0%) | 35 (66.0%) |
| Education Instruction & Library | 317 (27.2%) | 849 (72.8%) |
| Arts, Media & Entertainment | 132 (52.0%) | 122 (48.0%) |
| Health Diagnosing & Treating | 302 (18.8%) | 1,305 (81.2%) |
| Health Technologists | 158 (19.1%) | 669 (80.9%) |
| Total (Category) | 2,612 (40.5%) | 3,836 (59.5%) |
| Total (Overall) | 11,709 (53.9%) | 10,024 (46.1%) |
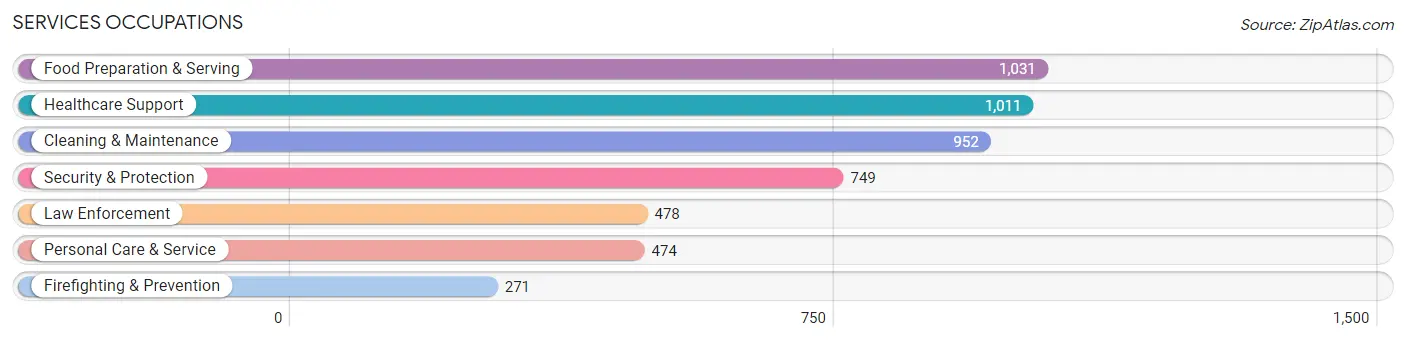
Services Occupations
The most common Services occupations in Venango County are Food Preparation & Serving (1,031 | 4.7%), Healthcare Support (1,011 | 4.6%), Cleaning & Maintenance (952 | 4.4%), Security & Protection (749 | 3.5%), and Law Enforcement (478 | 2.2%).
Services Occupations by Sex
Within the Services occupations in Venango County, the most male-oriented occupations are Law Enforcement (81.6%), Security & Protection (74.5%), and Cleaning & Maintenance (66.0%), while the most female-oriented occupations are Personal Care & Service (85.2%), Healthcare Support (80.1%), and Food Preparation & Serving (72.8%).
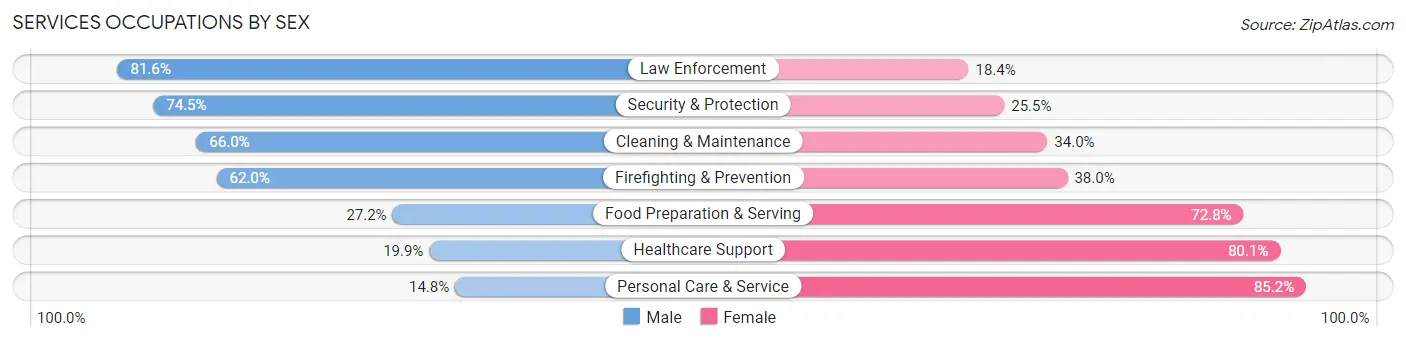
| Occupation | Male | Female |
| Healthcare Support | 201 (19.9%) | 810 (80.1%) |
| Security & Protection | 558 (74.5%) | 191 (25.5%) |
| Firefighting & Prevention | 168 (62.0%) | 103 (38.0%) |
| Law Enforcement | 390 (81.6%) | 88 (18.4%) |
| Food Preparation & Serving | 280 (27.2%) | 751 (72.8%) |
| Cleaning & Maintenance | 628 (66.0%) | 324 (34.0%) |
| Personal Care & Service | 70 (14.8%) | 404 (85.2%) |
| Total (Category) | 1,737 (41.2%) | 2,480 (58.8%) |
| Total (Overall) | 11,709 (53.9%) | 10,024 (46.1%) |
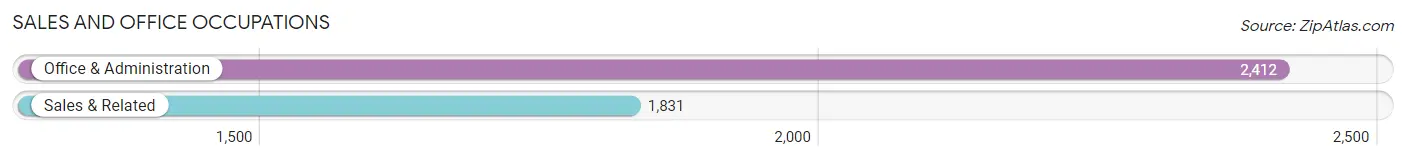
Sales and Office Occupations
The most common Sales and Office occupations in Venango County are Office & Administration (2,412 | 11.1%), and Sales & Related (1,831 | 8.4%).
Sales and Office Occupations by Sex
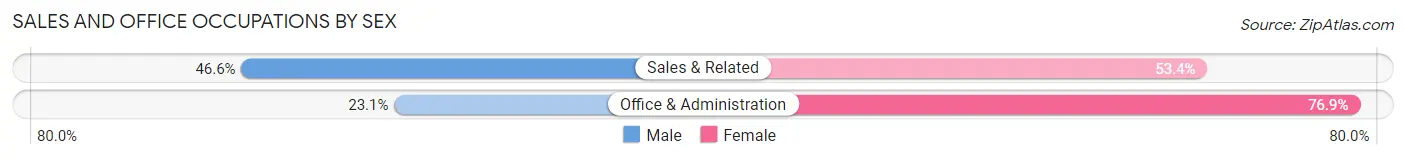
| Occupation | Male | Female |
| Sales & Related | 854 (46.6%) | 977 (53.4%) |
| Office & Administration | 558 (23.1%) | 1,854 (76.9%) |
| Total (Category) | 1,412 (33.3%) | 2,831 (66.7%) |
| Total (Overall) | 11,709 (53.9%) | 10,024 (46.1%) |
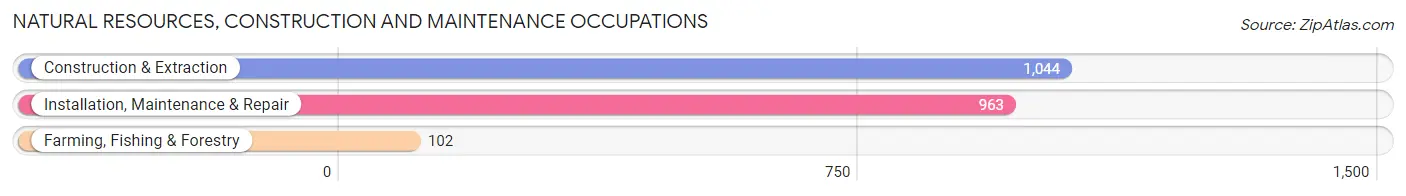
Natural Resources, Construction and Maintenance Occupations
The most common Natural Resources, Construction and Maintenance occupations in Venango County are Construction & Extraction (1,044 | 4.8%), Installation, Maintenance & Repair (963 | 4.4%), and Farming, Fishing & Forestry (102 | 0.5%).
Natural Resources, Construction and Maintenance Occupations by Sex
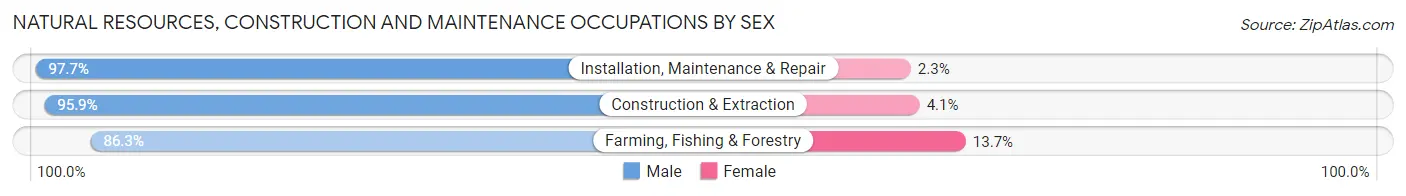
| Occupation | Male | Female |
| Farming, Fishing & Forestry | 88 (86.3%) | 14 (13.7%) |
| Construction & Extraction | 1,001 (95.9%) | 43 (4.1%) |
| Installation, Maintenance & Repair | 941 (97.7%) | 22 (2.3%) |
| Total (Category) | 2,030 (96.3%) | 79 (3.7%) |
| Total (Overall) | 11,709 (53.9%) | 10,024 (46.1%) |
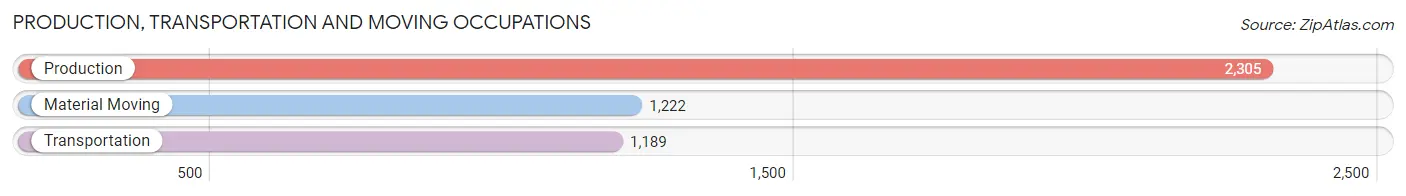
Production, Transportation and Moving Occupations
The most common Production, Transportation and Moving occupations in Venango County are Production (2,305 | 10.6%), Material Moving (1,222 | 5.6%), and Transportation (1,189 | 5.5%).
Production, Transportation and Moving Occupations by Sex
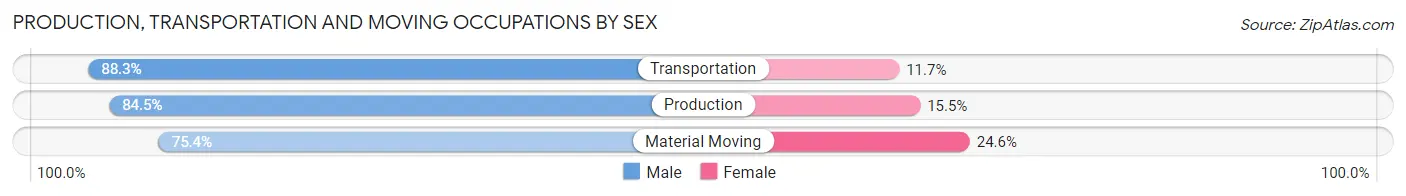
| Occupation | Male | Female |
| Production | 1,947 (84.5%) | 358 (15.5%) |
| Transportation | 1,050 (88.3%) | 139 (11.7%) |
| Material Moving | 921 (75.4%) | 301 (24.6%) |
| Total (Category) | 3,918 (83.1%) | 798 (16.9%) |
| Total (Overall) | 11,709 (53.9%) | 10,024 (46.1%) |
Employment Industries by Sex in Venango County
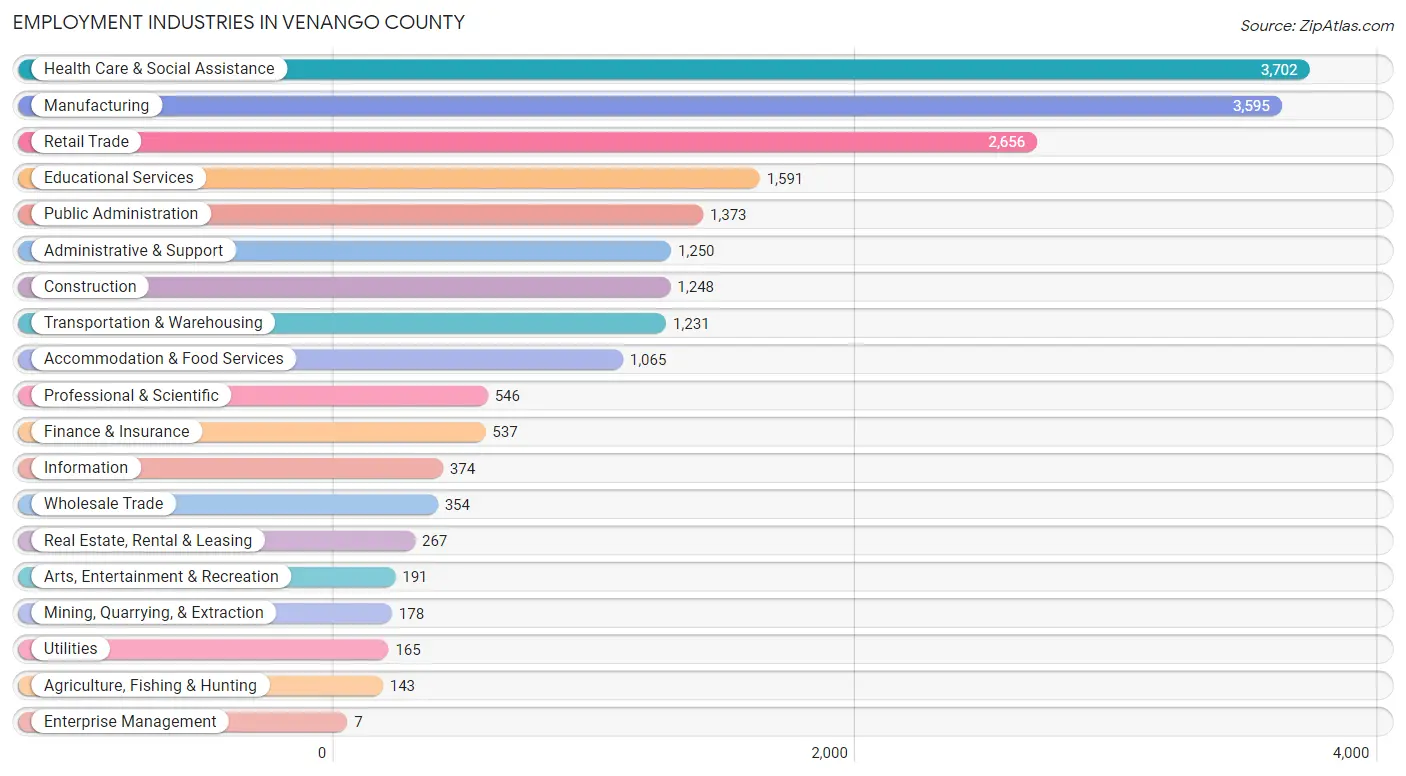
Employment Industries in Venango County
The major employment industries in Venango County include Health Care & Social Assistance (3,702 | 17.0%), Manufacturing (3,595 | 16.5%), Retail Trade (2,656 | 12.2%), Educational Services (1,591 | 7.3%), and Public Administration (1,373 | 6.3%).
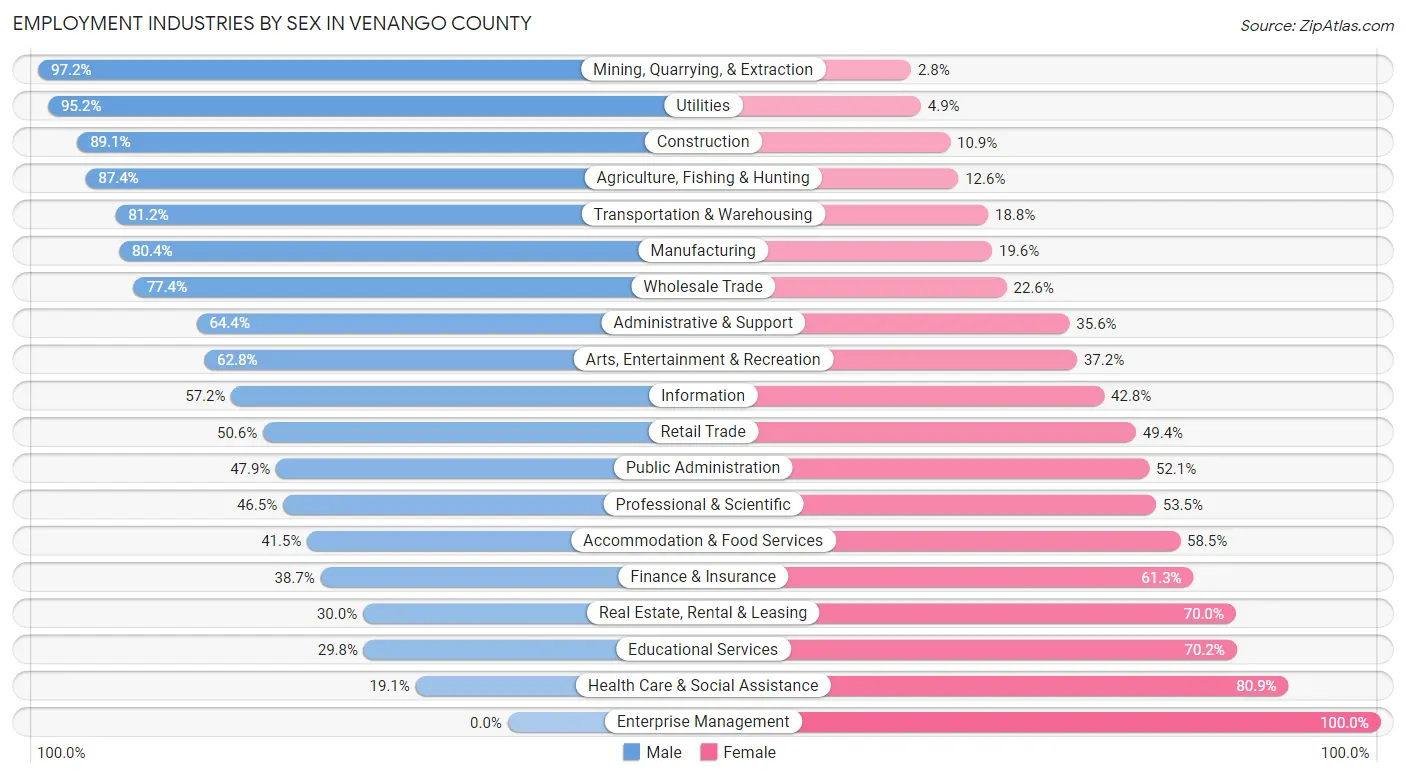
Employment Industries by Sex in Venango County
The Venango County industries that see more men than women are Mining, Quarrying, & Extraction (97.2%), Utilities (95.2%), and Construction (89.1%), whereas the industries that tend to have a higher number of women are Enterprise Management (100.0%), Health Care & Social Assistance (80.9%), and Educational Services (70.2%).
| Industry | Male | Female |
| Agriculture, Fishing & Hunting | 125 (87.4%) | 18 (12.6%) |
| Mining, Quarrying, & Extraction | 173 (97.2%) | 5 (2.8%) |
| Construction | 1,112 (89.1%) | 136 (10.9%) |
| Manufacturing | 2,891 (80.4%) | 704 (19.6%) |
| Wholesale Trade | 274 (77.4%) | 80 (22.6%) |
| Retail Trade | 1,345 (50.6%) | 1,311 (49.4%) |
| Transportation & Warehousing | 1,000 (81.2%) | 231 (18.8%) |
| Utilities | 157 (95.2%) | 8 (4.9%) |
| Information | 214 (57.2%) | 160 (42.8%) |
| Finance & Insurance | 208 (38.7%) | 329 (61.3%) |
| Real Estate, Rental & Leasing | 80 (30.0%) | 187 (70.0%) |
| Professional & Scientific | 254 (46.5%) | 292 (53.5%) |
| Enterprise Management | 0 (0.0%) | 7 (100.0%) |
| Administrative & Support | 805 (64.4%) | 445 (35.6%) |
| Educational Services | 474 (29.8%) | 1,117 (70.2%) |
| Health Care & Social Assistance | 706 (19.1%) | 2,996 (80.9%) |
| Arts, Entertainment & Recreation | 120 (62.8%) | 71 (37.2%) |
| Accommodation & Food Services | 442 (41.5%) | 623 (58.5%) |
| Public Administration | 658 (47.9%) | 715 (52.1%) |
| Total | 11,709 (53.9%) | 10,024 (46.1%) |
Education in Venango County
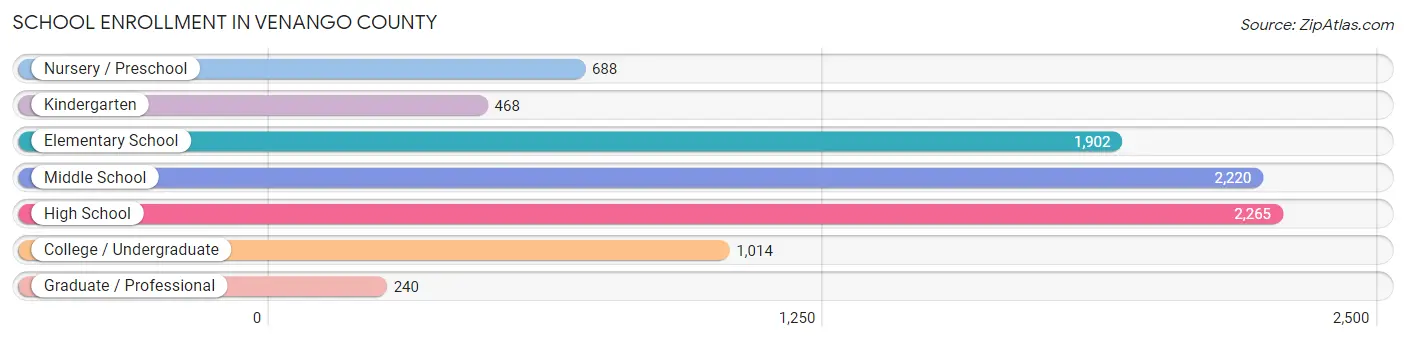
School Enrollment in Venango County
The most common levels of schooling among the 8,797 students in Venango County are high school (2,265 | 25.8%), middle school (2,220 | 25.2%), and elementary school (1,902 | 21.6%).
| School Level | # Students | % Students |
| Nursery / Preschool | 688 | 7.8% |
| Kindergarten | 468 | 5.3% |
| Elementary School | 1,902 | 21.6% |
| Middle School | 2,220 | 25.2% |
| High School | 2,265 | 25.8% |
| College / Undergraduate | 1,014 | 11.5% |
| Graduate / Professional | 240 | 2.7% |
| Total | 8,797 | 100.0% |
School Enrollment by Age by Funding Source in Venango County
Out of a total of 8,797 students who are enrolled in schools in Venango County, 1,768 (20.1%) attend a private institution, while the remaining 7,029 (79.9%) are enrolled in public schools. The age group of 20 to 24 year olds has the highest likelihood of being enrolled in private schools, with 196 (37.3% in the age bracket) enrolled. Conversely, the age group of 10 to 14 year olds has the lowest likelihood of being enrolled in a private school, with 2,413 (84.3% in the age bracket) attending a public institution.
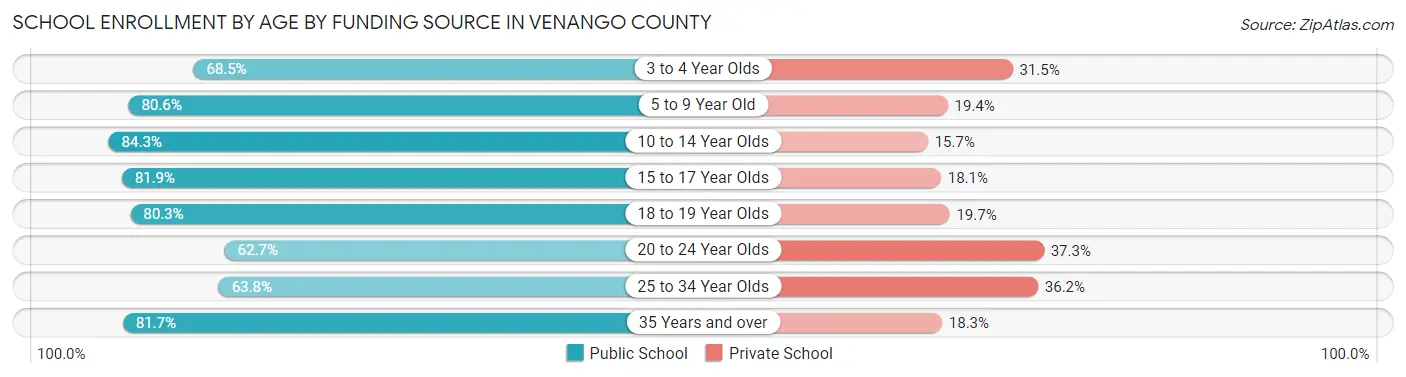
| Age Bracket | Public School | Private School |
| 3 to 4 Year Olds | 329 (68.5%) | 151 (31.5%) |
| 5 to 9 Year Old | 1,795 (80.6%) | 431 (19.4%) |
| 10 to 14 Year Olds | 2,413 (84.3%) | 448 (15.7%) |
| 15 to 17 Year Olds | 1,372 (81.9%) | 303 (18.1%) |
| 18 to 19 Year Olds | 440 (80.3%) | 108 (19.7%) |
| 20 to 24 Year Olds | 330 (62.7%) | 196 (37.3%) |
| 25 to 34 Year Olds | 150 (63.8%) | 85 (36.2%) |
| 35 Years and over | 201 (81.7%) | 45 (18.3%) |
| Total | 7,029 (79.9%) | 1,768 (20.1%) |
Educational Attainment by Field of Study in Venango County
Education (1,891 | 23.7%), business (1,041 | 13.1%), science & technology (1,033 | 13.0%), psychology (616 | 7.7%), and liberal arts & history (544 | 6.8%) are the most common fields of study among 7,973 individuals in Venango County who have obtained a bachelor's degree or higher.
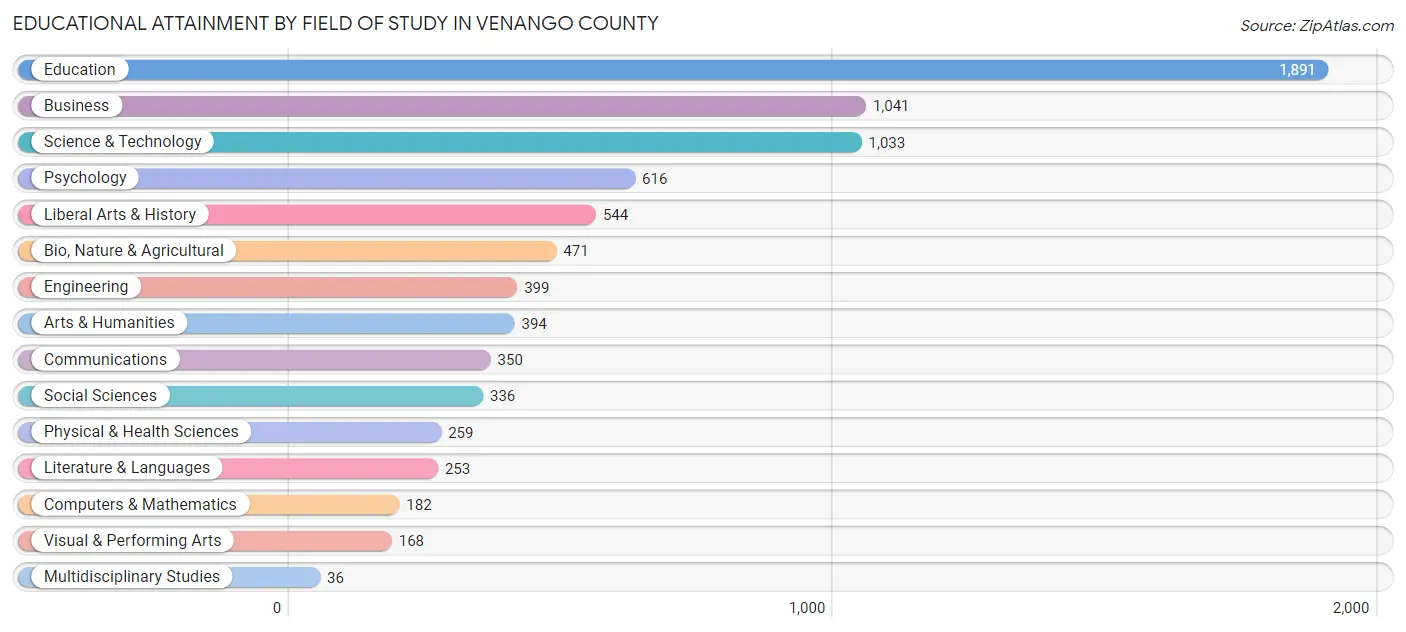
| Field of Study | # Graduates | % Graduates |
| Computers & Mathematics | 182 | 2.3% |
| Bio, Nature & Agricultural | 471 | 5.9% |
| Physical & Health Sciences | 259 | 3.3% |
| Psychology | 616 | 7.7% |
| Social Sciences | 336 | 4.2% |
| Engineering | 399 | 5.0% |
| Multidisciplinary Studies | 36 | 0.4% |
| Science & Technology | 1,033 | 13.0% |
| Business | 1,041 | 13.1% |
| Education | 1,891 | 23.7% |
| Literature & Languages | 253 | 3.2% |
| Liberal Arts & History | 544 | 6.8% |
| Visual & Performing Arts | 168 | 2.1% |
| Communications | 350 | 4.4% |
| Arts & Humanities | 394 | 4.9% |
| Total | 7,973 | 100.0% |
Transportation & Commute in Venango County
Vehicle Availability by Sex in Venango County
The most prevalent vehicle ownership categories in Venango County are males with 2 vehicles (4,949, accounting for 43.0%) and females with 2 vehicles (4,335, making up 50.4%).
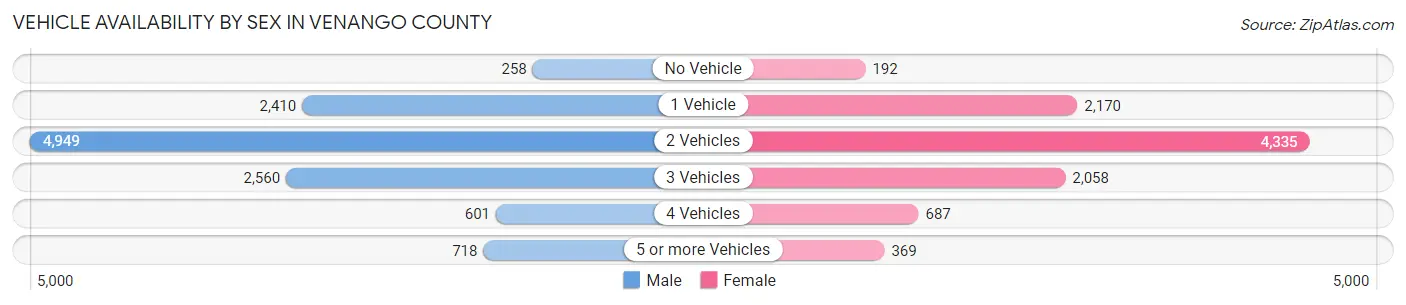
| Vehicles Available | Male | Female |
| No Vehicle | 258 (2.2%) | 192 (2.0%) |
| 1 Vehicle | 2,410 (21.0%) | 2,170 (22.1%) |
| 2 Vehicles | 4,949 (43.0%) | 4,335 (44.2%) |
| 3 Vehicles | 2,560 (22.3%) | 2,058 (21.0%) |
| 4 Vehicles | 601 (5.2%) | 687 (7.0%) |
| 5 or more Vehicles | 718 (6.2%) | 369 (3.8%) |
| Total | 11,496 (100.0%) | 9,811 (100.0%) |
Commute Time in Venango County
The most frequently occuring commute durations in Venango County are 15 to 19 minutes (3,307 commuters, 16.8%), 10 to 14 minutes (3,146 commuters, 15.9%), and 20 to 24 minutes (3,045 commuters, 15.4%).
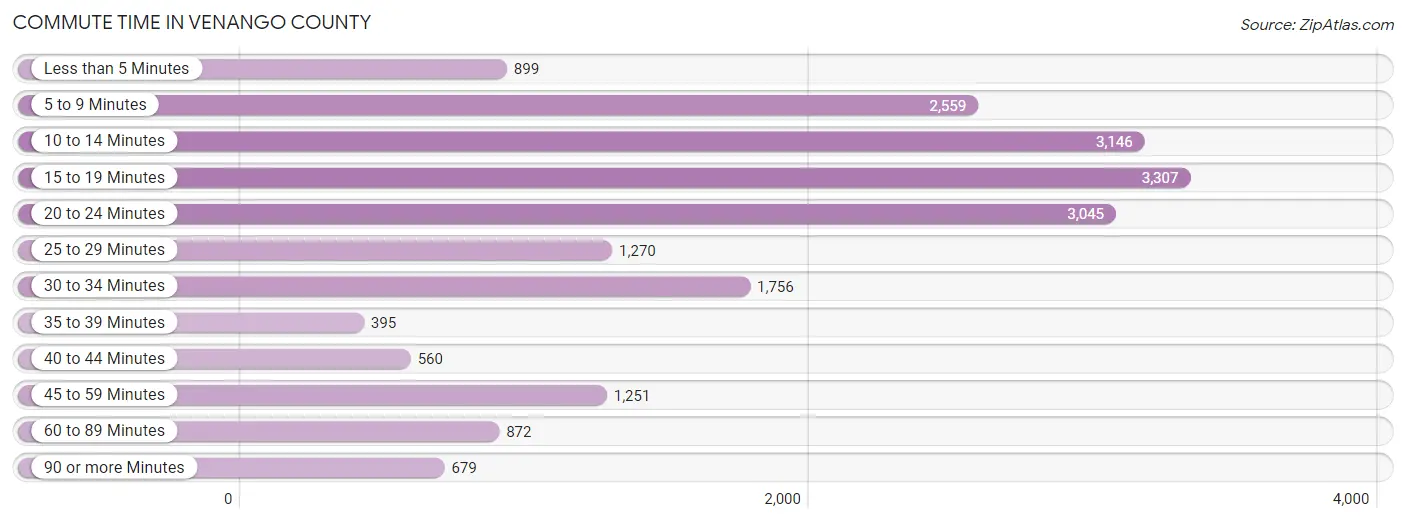
| Commute Time | # Commuters | % Commuters |
| Less than 5 Minutes | 899 | 4.5% |
| 5 to 9 Minutes | 2,559 | 13.0% |
| 10 to 14 Minutes | 3,146 | 15.9% |
| 15 to 19 Minutes | 3,307 | 16.8% |
| 20 to 24 Minutes | 3,045 | 15.4% |
| 25 to 29 Minutes | 1,270 | 6.4% |
| 30 to 34 Minutes | 1,756 | 8.9% |
| 35 to 39 Minutes | 395 | 2.0% |
| 40 to 44 Minutes | 560 | 2.8% |
| 45 to 59 Minutes | 1,251 | 6.3% |
| 60 to 89 Minutes | 872 | 4.4% |
| 90 or more Minutes | 679 | 3.4% |
Commute Time by Sex in Venango County
The most common commute times in Venango County are 15 to 19 minutes (1,825 commuters, 16.8%) for males and 10 to 14 minutes (1,734 commuters, 19.6%) for females.
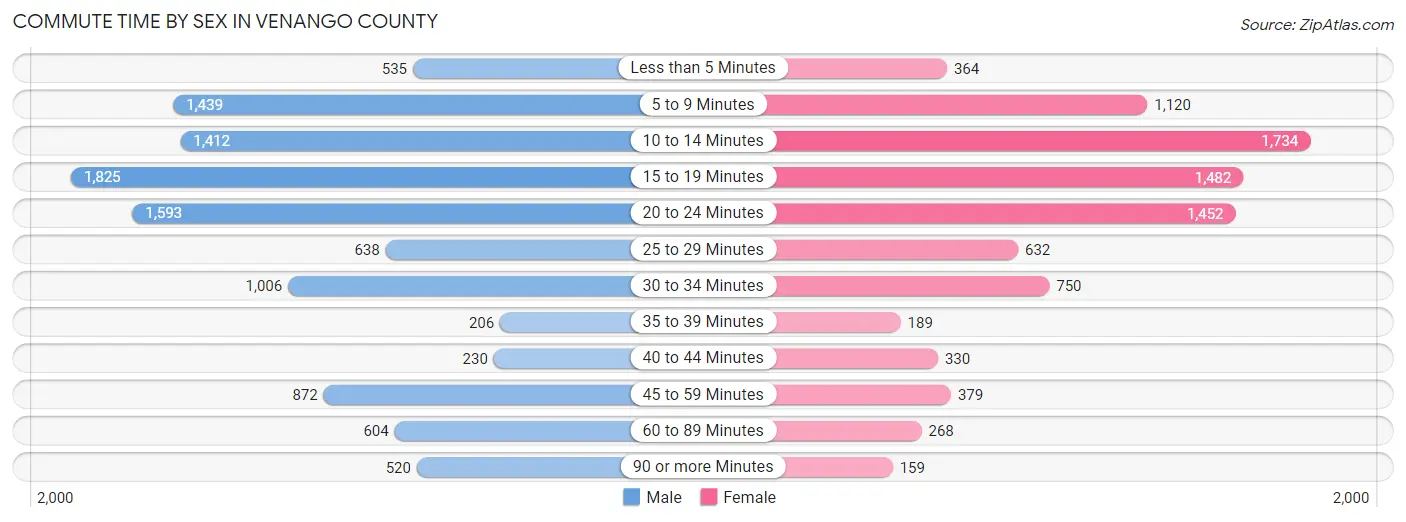
| Commute Time | Male | Female |
| Less than 5 Minutes | 535 (4.9%) | 364 (4.1%) |
| 5 to 9 Minutes | 1,439 (13.2%) | 1,120 (12.6%) |
| 10 to 14 Minutes | 1,412 (13.0%) | 1,734 (19.6%) |
| 15 to 19 Minutes | 1,825 (16.8%) | 1,482 (16.7%) |
| 20 to 24 Minutes | 1,593 (14.6%) | 1,452 (16.4%) |
| 25 to 29 Minutes | 638 (5.9%) | 632 (7.1%) |
| 30 to 34 Minutes | 1,006 (9.2%) | 750 (8.5%) |
| 35 to 39 Minutes | 206 (1.9%) | 189 (2.1%) |
| 40 to 44 Minutes | 230 (2.1%) | 330 (3.7%) |
| 45 to 59 Minutes | 872 (8.0%) | 379 (4.3%) |
| 60 to 89 Minutes | 604 (5.6%) | 268 (3.0%) |
| 90 or more Minutes | 520 (4.8%) | 159 (1.8%) |
Time of Departure to Work by Sex in Venango County
The most frequent times of departure to work in Venango County are 7:00 AM to 7:29 AM (1,463, 13.5%) for males and 7:30 AM to 7:59 AM (1,259, 14.2%) for females.
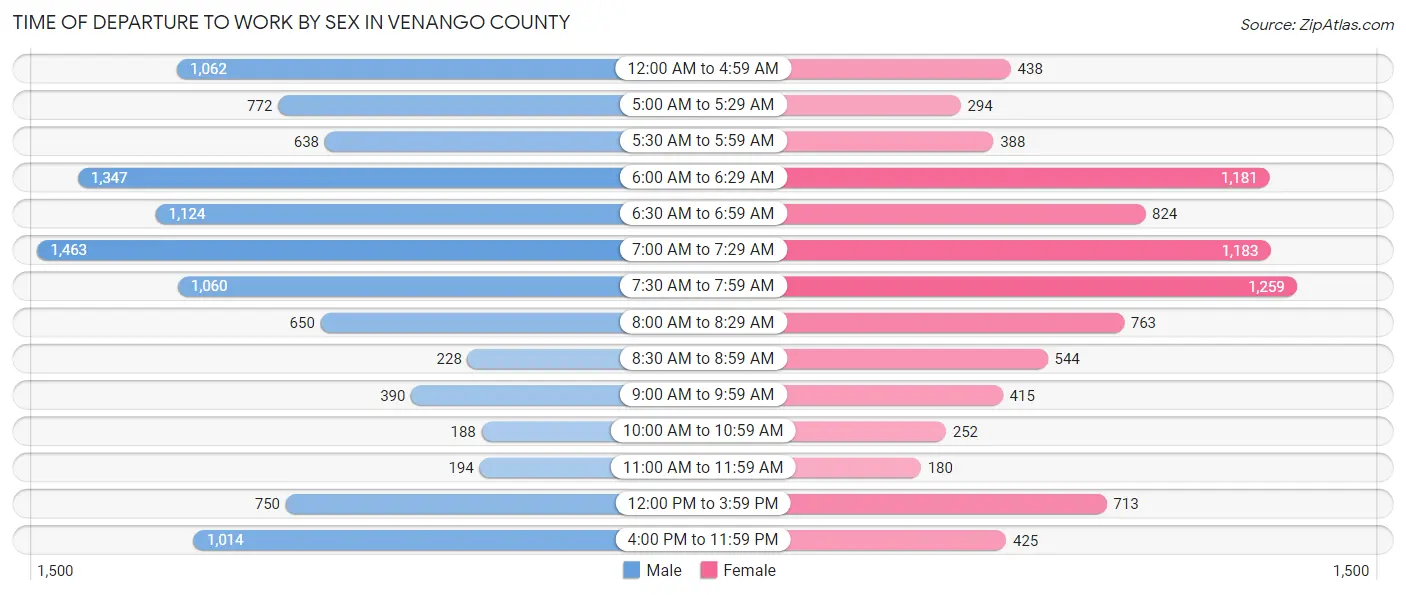
| Time of Departure | Male | Female |
| 12:00 AM to 4:59 AM | 1,062 (9.8%) | 438 (4.9%) |
| 5:00 AM to 5:29 AM | 772 (7.1%) | 294 (3.3%) |
| 5:30 AM to 5:59 AM | 638 (5.9%) | 388 (4.4%) |
| 6:00 AM to 6:29 AM | 1,347 (12.4%) | 1,181 (13.3%) |
| 6:30 AM to 6:59 AM | 1,124 (10.3%) | 824 (9.3%) |
| 7:00 AM to 7:29 AM | 1,463 (13.5%) | 1,183 (13.4%) |
| 7:30 AM to 7:59 AM | 1,060 (9.7%) | 1,259 (14.2%) |
| 8:00 AM to 8:29 AM | 650 (6.0%) | 763 (8.6%) |
| 8:30 AM to 8:59 AM | 228 (2.1%) | 544 (6.1%) |
| 9:00 AM to 9:59 AM | 390 (3.6%) | 415 (4.7%) |
| 10:00 AM to 10:59 AM | 188 (1.7%) | 252 (2.8%) |
| 11:00 AM to 11:59 AM | 194 (1.8%) | 180 (2.0%) |
| 12:00 PM to 3:59 PM | 750 (6.9%) | 713 (8.1%) |
| 4:00 PM to 11:59 PM | 1,014 (9.3%) | 425 (4.8%) |
| Total | 10,880 (100.0%) | 8,859 (100.0%) |
Housing Occupancy in Venango County
Occupancy by Ownership in Venango County
Of the total 21,323 dwellings in Venango County, owner-occupied units account for 16,024 (75.1%), while renter-occupied units make up 5,299 (24.8%).
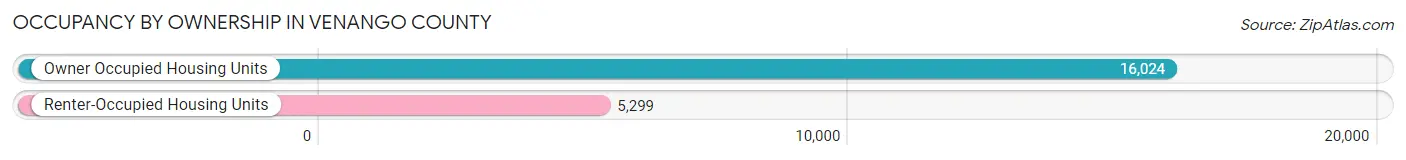
| Occupancy | # Housing Units | % Housing Units |
| Owner Occupied Housing Units | 16,024 | 75.1% |
| Renter-Occupied Housing Units | 5,299 | 24.8% |
| Total Occupied Housing Units | 21,323 | 100.0% |
Occupancy by Household Size in Venango County
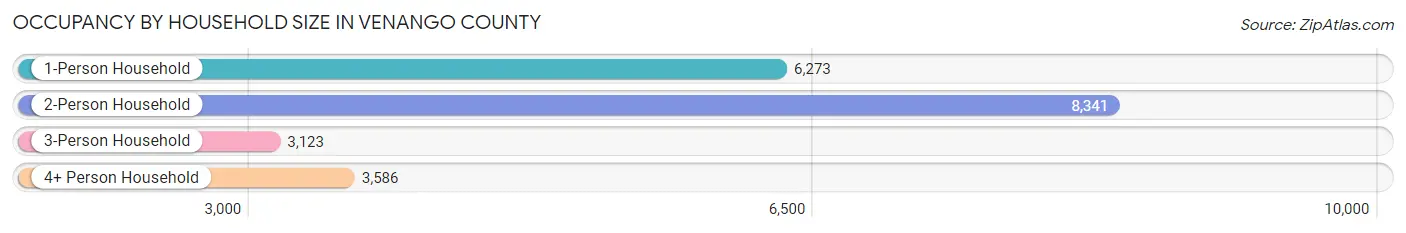
| Household Size | # Housing Units | % Housing Units |
| 1-Person Household | 6,273 | 29.4% |
| 2-Person Household | 8,341 | 39.1% |
| 3-Person Household | 3,123 | 14.6% |
| 4+ Person Household | 3,586 | 16.8% |
| Total Housing Units | 21,323 | 100.0% |
Occupancy by Ownership by Household Size in Venango County
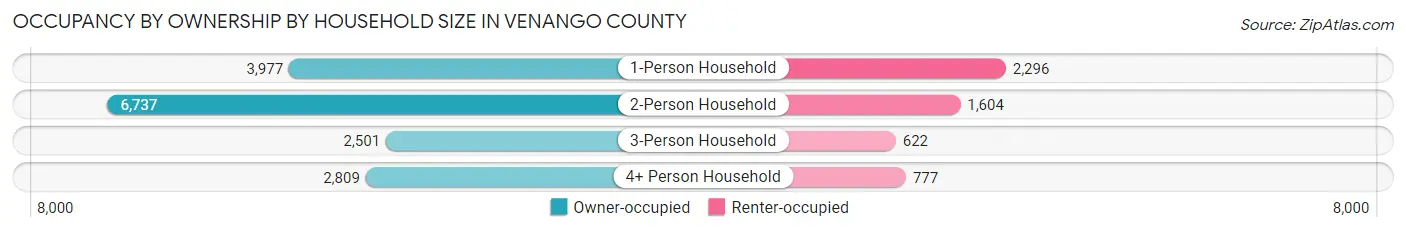
| Household Size | Owner-occupied | Renter-occupied |
| 1-Person Household | 3,977 (63.4%) | 2,296 (36.6%) |
| 2-Person Household | 6,737 (80.8%) | 1,604 (19.2%) |
| 3-Person Household | 2,501 (80.1%) | 622 (19.9%) |
| 4+ Person Household | 2,809 (78.3%) | 777 (21.7%) |
| Total Housing Units | 16,024 (75.1%) | 5,299 (24.8%) |
Occupancy by Educational Attainment in Venango County
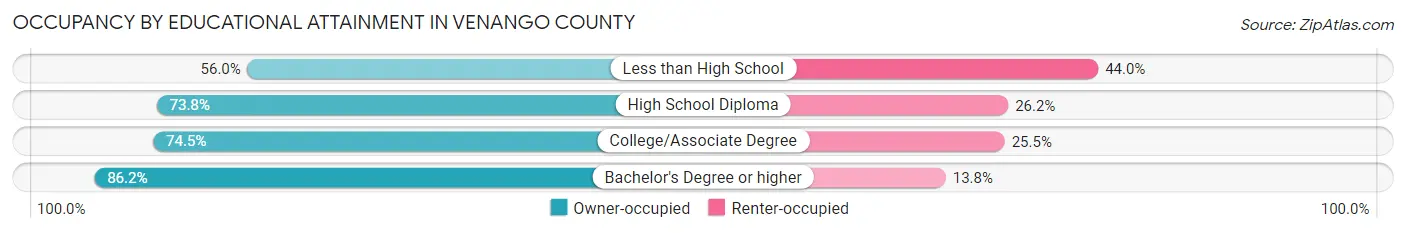
| Household Size | Owner-occupied | Renter-occupied |
| Less than High School | 992 (56.0%) | 780 (44.0%) |
| High School Diploma | 6,994 (73.8%) | 2,480 (26.2%) |
| College/Associate Degree | 4,130 (74.5%) | 1,413 (25.5%) |
| Bachelor's Degree or higher | 3,908 (86.2%) | 626 (13.8%) |
Occupancy by Age of Householder in Venango County
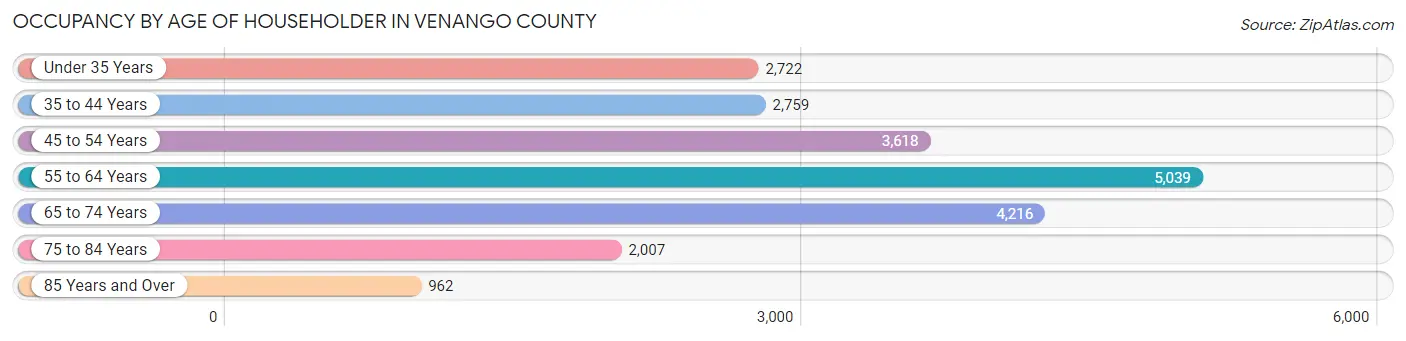
| Age Bracket | # Households | % Households |
| Under 35 Years | 2,722 | 12.8% |
| 35 to 44 Years | 2,759 | 12.9% |
| 45 to 54 Years | 3,618 | 17.0% |
| 55 to 64 Years | 5,039 | 23.6% |
| 65 to 74 Years | 4,216 | 19.8% |
| 75 to 84 Years | 2,007 | 9.4% |
| 85 Years and Over | 962 | 4.5% |
| Total | 21,323 | 100.0% |
Housing Finances in Venango County
Median Income by Occupancy in Venango County
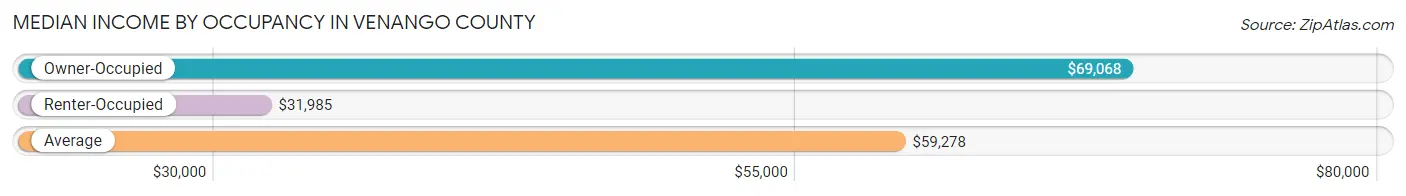
| Occupancy Type | # Households | Median Income |
| Owner-Occupied | 16,024 (75.1%) | $69,068 |
| Renter-Occupied | 5,299 (24.8%) | $31,985 |
| Average | 21,323 (100.0%) | $59,278 |
Occupancy by Householder Income Bracket in Venango County
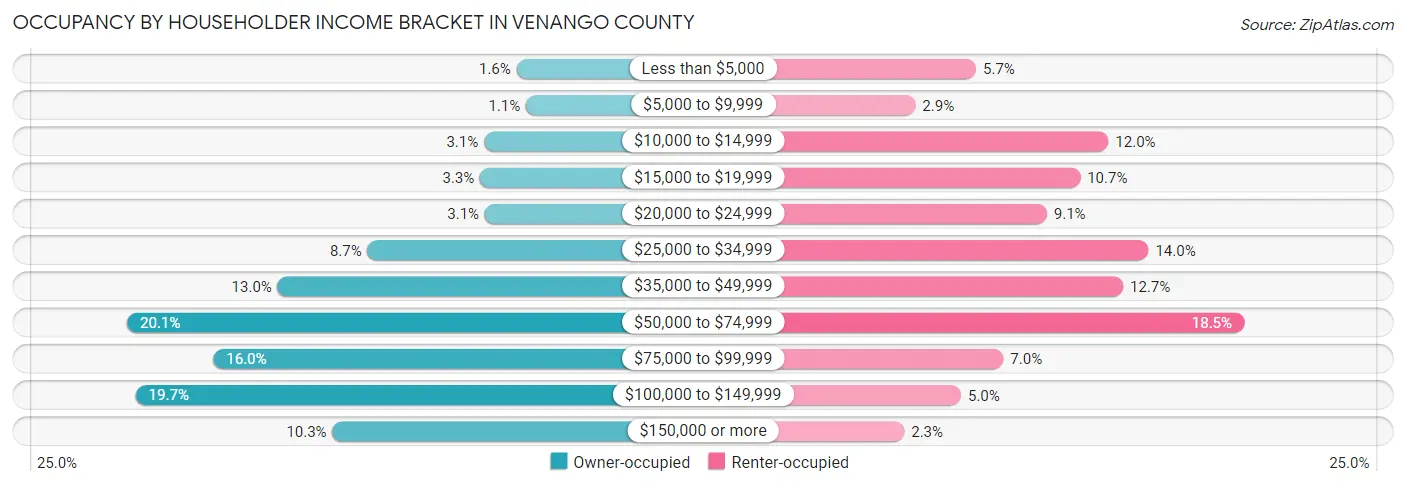
| Income Bracket | Owner-occupied | Renter-occupied |
| Less than $5,000 | 252 (1.6%) | 304 (5.7%) |
| $5,000 to $9,999 | 179 (1.1%) | 151 (2.9%) |
| $10,000 to $14,999 | 500 (3.1%) | 638 (12.0%) |
| $15,000 to $19,999 | 530 (3.3%) | 567 (10.7%) |
| $20,000 to $24,999 | 493 (3.1%) | 483 (9.1%) |
| $25,000 to $34,999 | 1,389 (8.7%) | 739 (14.0%) |
| $35,000 to $49,999 | 2,075 (13.0%) | 675 (12.7%) |
| $50,000 to $74,999 | 3,224 (20.1%) | 980 (18.5%) |
| $75,000 to $99,999 | 2,566 (16.0%) | 373 (7.0%) |
| $100,000 to $149,999 | 3,159 (19.7%) | 266 (5.0%) |
| $150,000 or more | 1,657 (10.3%) | 123 (2.3%) |
| Total | 16,024 (100.0%) | 5,299 (100.0%) |
Monthly Housing Cost Tiers in Venango County
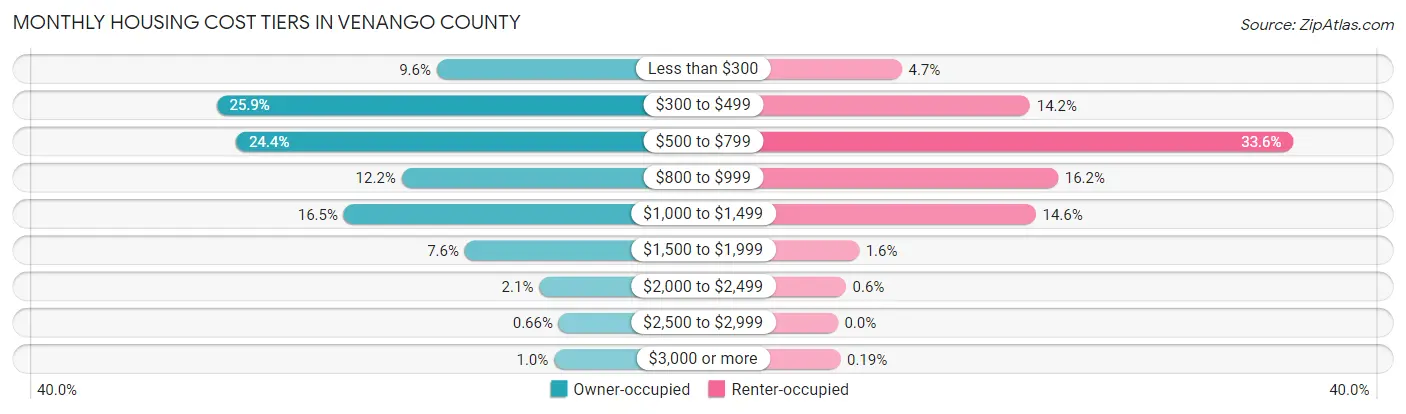
| Monthly Cost | Owner-occupied | Renter-occupied |
| Less than $300 | 1,545 (9.6%) | 250 (4.7%) |
| $300 to $499 | 4,145 (25.9%) | 751 (14.2%) |
| $500 to $799 | 3,915 (24.4%) | 1,779 (33.6%) |
| $800 to $999 | 1,959 (12.2%) | 860 (16.2%) |
| $1,000 to $1,499 | 2,642 (16.5%) | 773 (14.6%) |
| $1,500 to $1,999 | 1,215 (7.6%) | 83 (1.6%) |
| $2,000 to $2,499 | 337 (2.1%) | 32 (0.6%) |
| $2,500 to $2,999 | 105 (0.7%) | 0 (0.0%) |
| $3,000 or more | 161 (1.0%) | 10 (0.2%) |
| Total | 16,024 (100.0%) | 5,299 (100.0%) |
Physical Housing Characteristics in Venango County
Housing Structures in Venango County
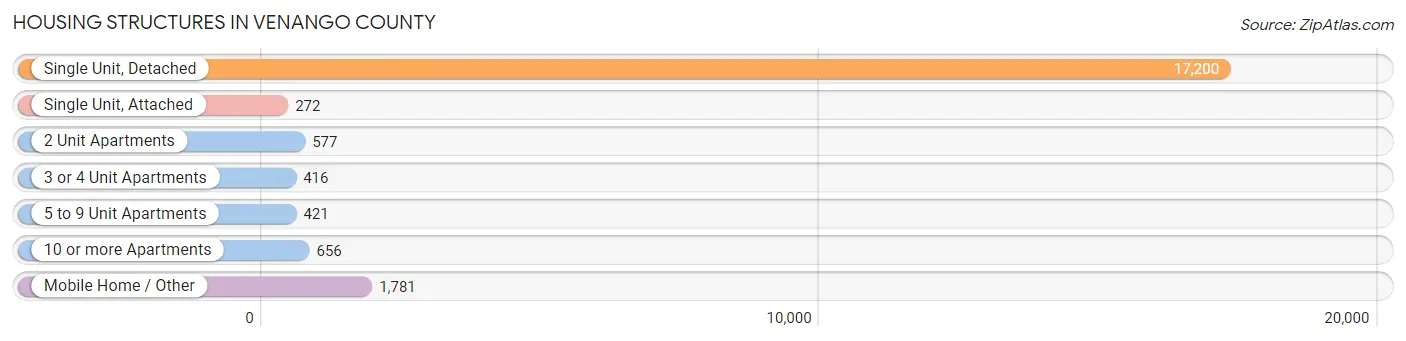
| Structure Type | # Housing Units | % Housing Units |
| Single Unit, Detached | 17,200 | 80.7% |
| Single Unit, Attached | 272 | 1.3% |
| 2 Unit Apartments | 577 | 2.7% |
| 3 or 4 Unit Apartments | 416 | 1.9% |
| 5 to 9 Unit Apartments | 421 | 2.0% |
| 10 or more Apartments | 656 | 3.1% |
| Mobile Home / Other | 1,781 | 8.4% |
| Total | 21,323 | 100.0% |
Housing Structures by Occupancy in Venango County
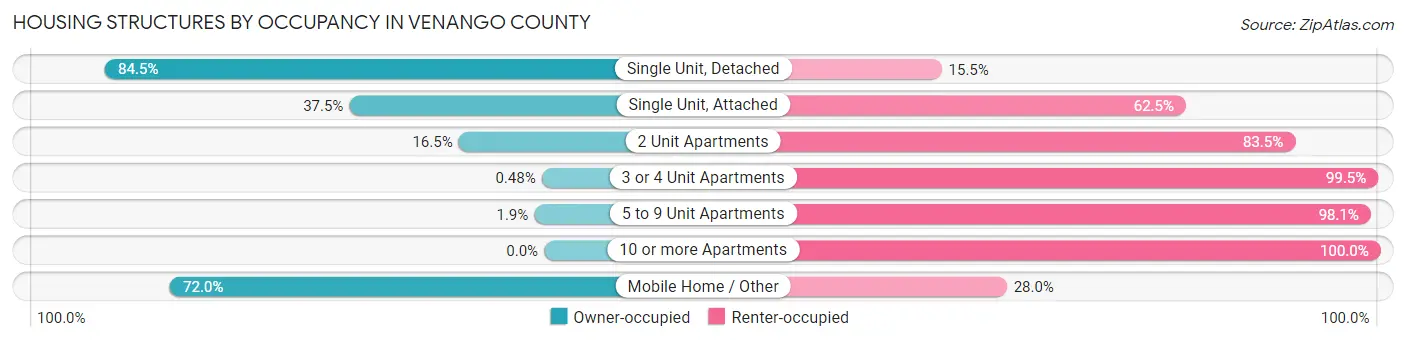
| Structure Type | Owner-occupied | Renter-occupied |
| Single Unit, Detached | 14,535 (84.5%) | 2,665 (15.5%) |
| Single Unit, Attached | 102 (37.5%) | 170 (62.5%) |
| 2 Unit Apartments | 95 (16.5%) | 482 (83.5%) |
| 3 or 4 Unit Apartments | 2 (0.5%) | 414 (99.5%) |
| 5 to 9 Unit Apartments | 8 (1.9%) | 413 (98.1%) |
| 10 or more Apartments | 0 (0.0%) | 656 (100.0%) |
| Mobile Home / Other | 1,282 (72.0%) | 499 (28.0%) |
| Total | 16,024 (75.1%) | 5,299 (24.8%) |
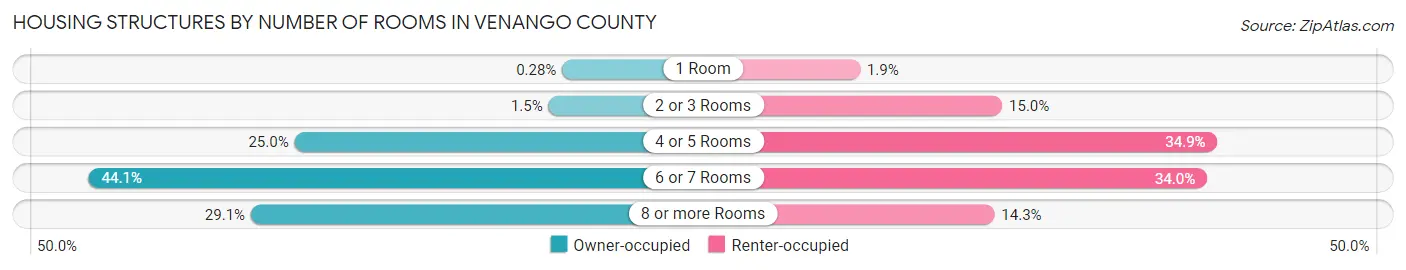
Housing Structures by Number of Rooms in Venango County
| Number of Rooms | Owner-occupied | Renter-occupied |
| 1 Room | 45 (0.3%) | 98 (1.8%) |
| 2 or 3 Rooms | 247 (1.5%) | 795 (15.0%) |
| 4 or 5 Rooms | 4,013 (25.0%) | 1,850 (34.9%) |
| 6 or 7 Rooms | 7,061 (44.1%) | 1,799 (34.0%) |
| 8 or more Rooms | 4,658 (29.1%) | 757 (14.3%) |
| Total | 16,024 (100.0%) | 5,299 (100.0%) |
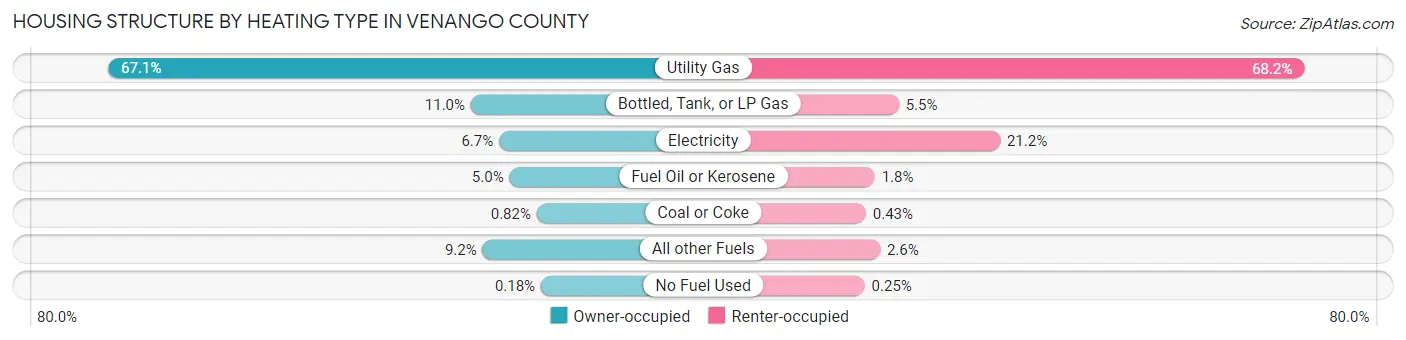
Housing Structure by Heating Type in Venango County
| Heating Type | Owner-occupied | Renter-occupied |
| Utility Gas | 10,751 (67.1%) | 3,614 (68.2%) |
| Bottled, Tank, or LP Gas | 1,764 (11.0%) | 292 (5.5%) |
| Electricity | 1,066 (6.7%) | 1,122 (21.2%) |
| Fuel Oil or Kerosene | 807 (5.0%) | 96 (1.8%) |
| Coal or Coke | 132 (0.8%) | 23 (0.4%) |
| All other Fuels | 1,475 (9.2%) | 139 (2.6%) |
| No Fuel Used | 29 (0.2%) | 13 (0.3%) |
| Total | 16,024 (100.0%) | 5,299 (100.0%) |
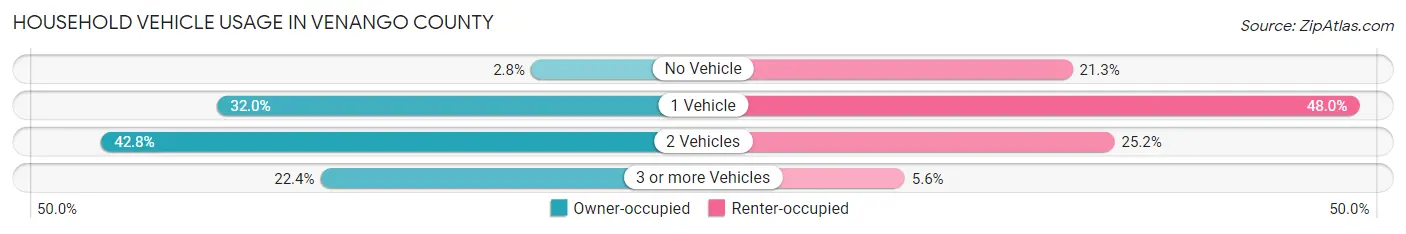
Household Vehicle Usage in Venango County
| Vehicles per Household | Owner-occupied | Renter-occupied |
| No Vehicle | 441 (2.8%) | 1,126 (21.2%) |
| 1 Vehicle | 5,129 (32.0%) | 2,543 (48.0%) |
| 2 Vehicles | 6,865 (42.8%) | 1,334 (25.2%) |
| 3 or more Vehicles | 3,589 (22.4%) | 296 (5.6%) |
| Total | 16,024 (100.0%) | 5,299 (100.0%) |
Real Estate & Mortgages in Venango County
Real Estate and Mortgage Overview in Venango County
| Characteristic | Without Mortgage | With Mortgage |
| Housing Units | 8,929 | 7,095 |
| Median Property Value | $94,300 | $132,600 |
| Median Household Income | $55,525 | $1,002 |
| Monthly Housing Costs | $445 | $152 |
| Real Estate Taxes | $1,308 | $84 |
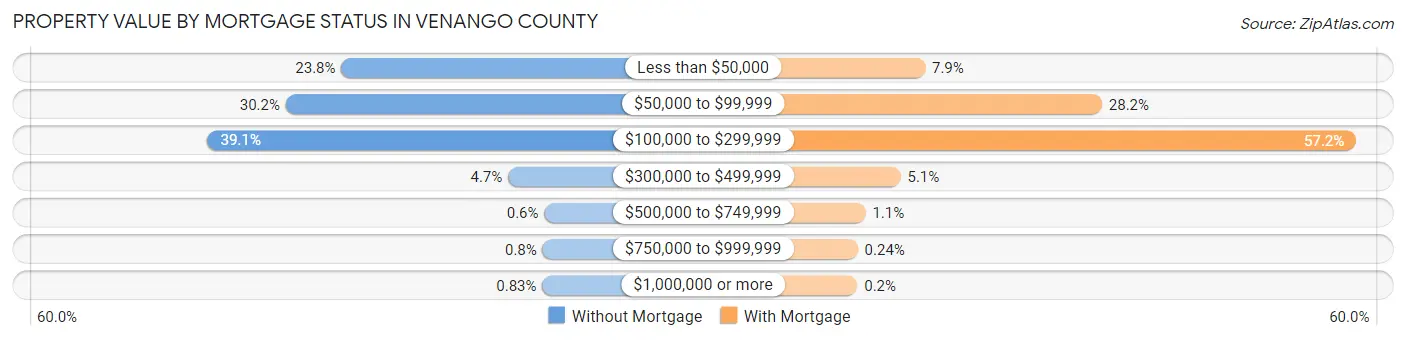
Property Value by Mortgage Status in Venango County
| Property Value | Without Mortgage | With Mortgage |
| Less than $50,000 | 2,125 (23.8%) | 563 (7.9%) |
| $50,000 to $99,999 | 2,692 (30.1%) | 1,997 (28.1%) |
| $100,000 to $299,999 | 3,490 (39.1%) | 4,059 (57.2%) |
| $300,000 to $499,999 | 423 (4.7%) | 365 (5.1%) |
| $500,000 to $749,999 | 54 (0.6%) | 80 (1.1%) |
| $750,000 to $999,999 | 71 (0.8%) | 17 (0.2%) |
| $1,000,000 or more | 74 (0.8%) | 14 (0.2%) |
| Total | 8,929 (100.0%) | 7,095 (100.0%) |
Household Income by Mortgage Status in Venango County
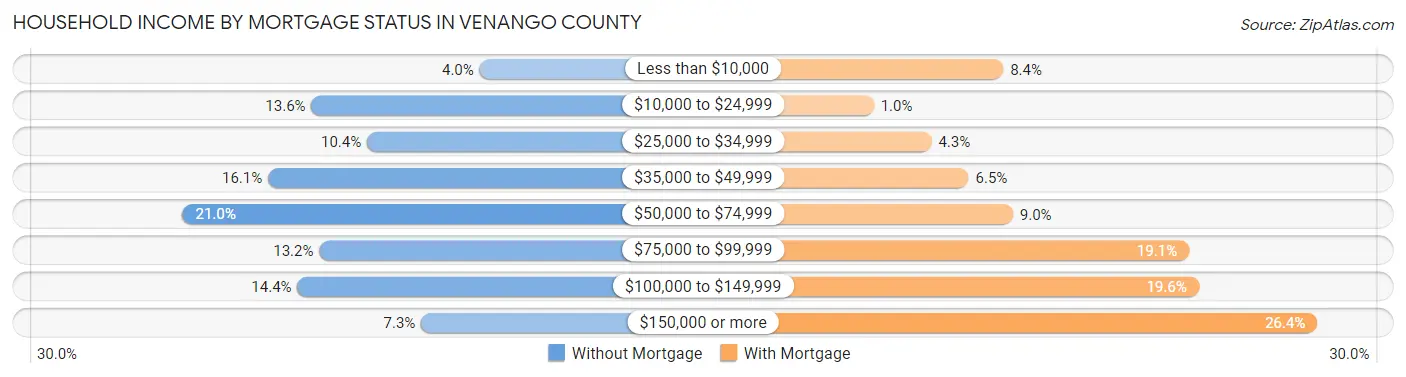
| Household Income | Without Mortgage | With Mortgage |
| Less than $10,000 | 357 (4.0%) | 599 (8.4%) |
| $10,000 to $24,999 | 1,215 (13.6%) | 74 (1.0%) |
| $25,000 to $34,999 | 931 (10.4%) | 308 (4.3%) |
| $35,000 to $49,999 | 1,437 (16.1%) | 458 (6.5%) |
| $50,000 to $74,999 | 1,872 (21.0%) | 638 (9.0%) |
| $75,000 to $99,999 | 1,175 (13.2%) | 1,352 (19.1%) |
| $100,000 to $149,999 | 1,287 (14.4%) | 1,391 (19.6%) |
| $150,000 or more | 655 (7.3%) | 1,872 (26.4%) |
| Total | 8,929 (100.0%) | 7,095 (100.0%) |
Property Value to Household Income Ratio in Venango County
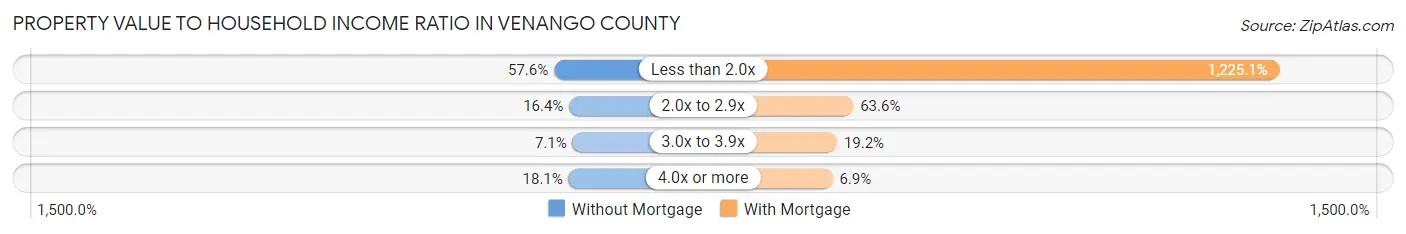
| Value-to-Income Ratio | Without Mortgage | With Mortgage |
| Less than 2.0x | 5,142 (57.6%) | 86,917 (1,225.1%) |
| 2.0x to 2.9x | 1,464 (16.4%) | 4,510 (63.6%) |
| 3.0x to 3.9x | 633 (7.1%) | 1,359 (19.2%) |
| 4.0x or more | 1,614 (18.1%) | 489 (6.9%) |
| Total | 8,929 (100.0%) | 7,095 (100.0%) |
Real Estate Taxes by Mortgage Status in Venango County
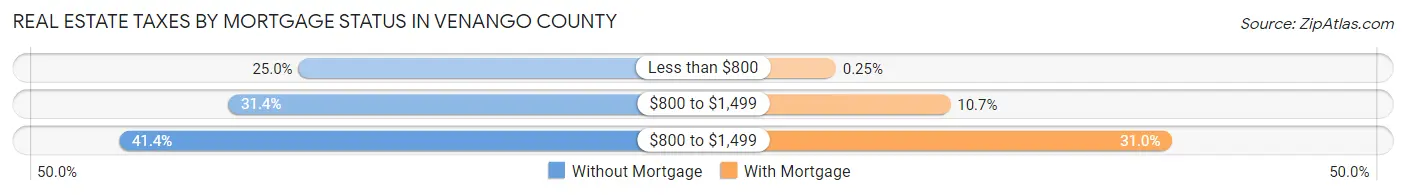
| Property Taxes | Without Mortgage | With Mortgage |
| Less than $800 | 2,231 (25.0%) | 18 (0.3%) |
| $800 to $1,499 | 2,805 (31.4%) | 760 (10.7%) |
| $800 to $1,499 | 3,695 (41.4%) | 2,198 (31.0%) |
| Total | 8,929 (100.0%) | 7,095 (100.0%) |
Health & Disability in Venango County
Health Insurance Coverage by Age in Venango County
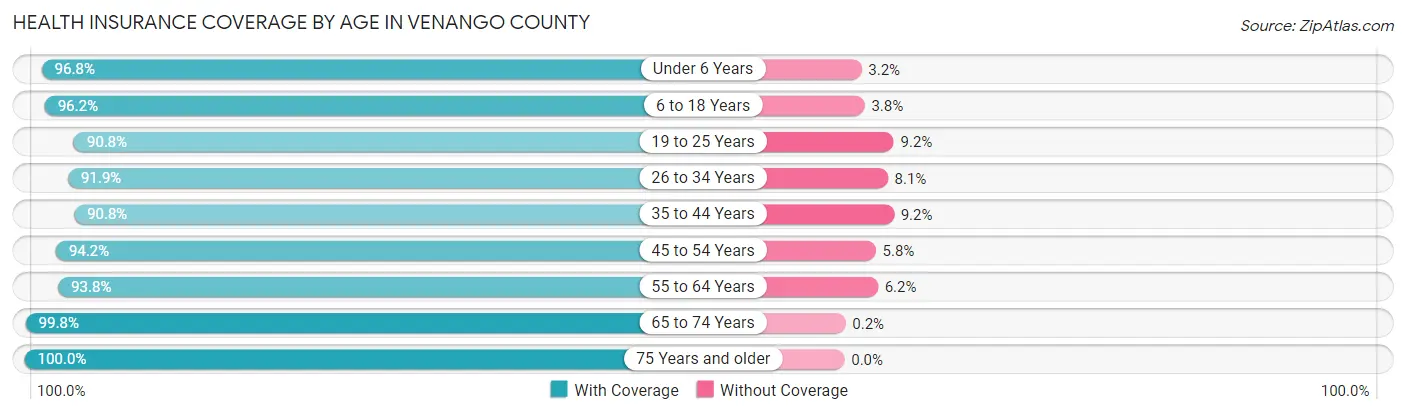
| Age Bracket | With Coverage | Without Coverage |
| Under 6 Years | 2,923 (96.8%) | 96 (3.2%) |
| 6 to 18 Years | 6,609 (96.2%) | 258 (3.8%) |
| 19 to 25 Years | 3,200 (90.8%) | 324 (9.2%) |
| 26 to 34 Years | 4,209 (91.9%) | 370 (8.1%) |
| 35 to 44 Years | 4,968 (90.8%) | 504 (9.2%) |
| 45 to 54 Years | 5,946 (94.2%) | 369 (5.8%) |
| 55 to 64 Years | 7,941 (93.8%) | 528 (6.2%) |
| 65 to 74 Years | 7,000 (99.8%) | 14 (0.2%) |
| 75 Years and older | 4,603 (100.0%) | 0 (0.0%) |
| Total | 47,399 (95.1%) | 2,463 (4.9%) |
Health Insurance Coverage by Citizenship Status in Venango County
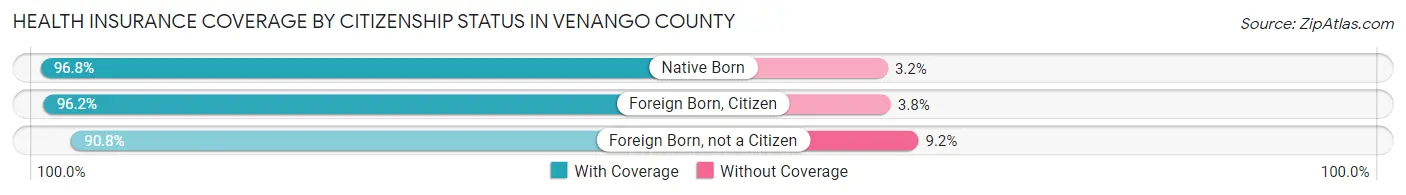
| Citizenship Status | With Coverage | Without Coverage |
| Native Born | 2,923 (96.8%) | 96 (3.2%) |
| Foreign Born, Citizen | 6,609 (96.2%) | 258 (3.8%) |
| Foreign Born, not a Citizen | 3,200 (90.8%) | 324 (9.2%) |
Health Insurance Coverage by Household Income in Venango County
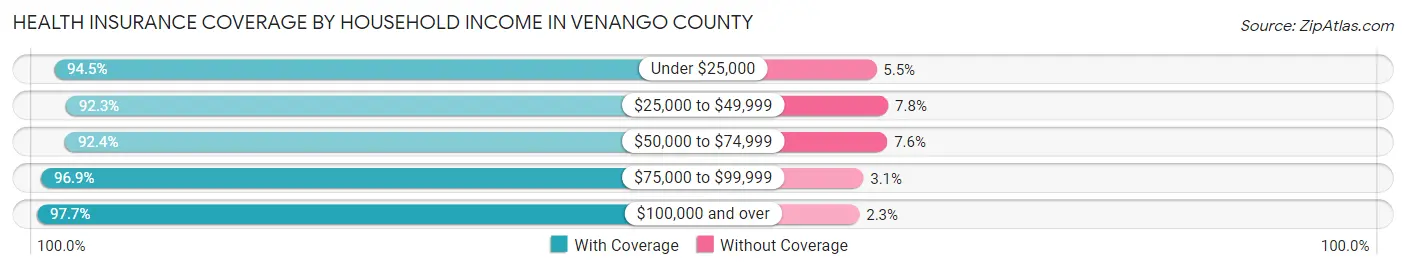
| Household Income | With Coverage | Without Coverage |
| Under $25,000 | 5,851 (94.5%) | 343 (5.5%) |
| $25,000 to $49,999 | 8,693 (92.2%) | 730 (7.7%) |
| $50,000 to $74,999 | 9,492 (92.4%) | 777 (7.6%) |
| $75,000 to $99,999 | 7,907 (96.9%) | 252 (3.1%) |
| $100,000 and over | 14,910 (97.7%) | 357 (2.3%) |
Public vs Private Health Insurance Coverage by Age in Venango County
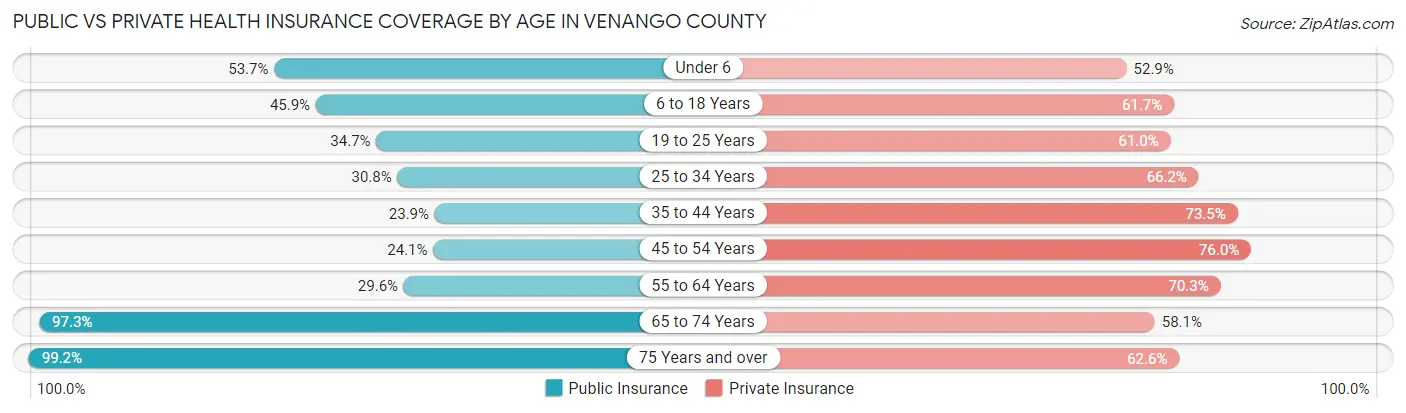
| Age Bracket | Public Insurance | Private Insurance |
| Under 6 | 1,620 (53.7%) | 1,596 (52.9%) |
| 6 to 18 Years | 3,153 (45.9%) | 4,235 (61.7%) |
| 19 to 25 Years | 1,223 (34.7%) | 2,150 (61.0%) |
| 25 to 34 Years | 1,409 (30.8%) | 3,033 (66.2%) |
| 35 to 44 Years | 1,305 (23.8%) | 4,019 (73.5%) |
| 45 to 54 Years | 1,524 (24.1%) | 4,798 (76.0%) |
| 55 to 64 Years | 2,507 (29.6%) | 5,954 (70.3%) |
| 65 to 74 Years | 6,824 (97.3%) | 4,075 (58.1%) |
| 75 Years and over | 4,566 (99.2%) | 2,883 (62.6%) |
| Total | 24,131 (48.4%) | 32,743 (65.7%) |
Disability Status by Sex by Age in Venango County
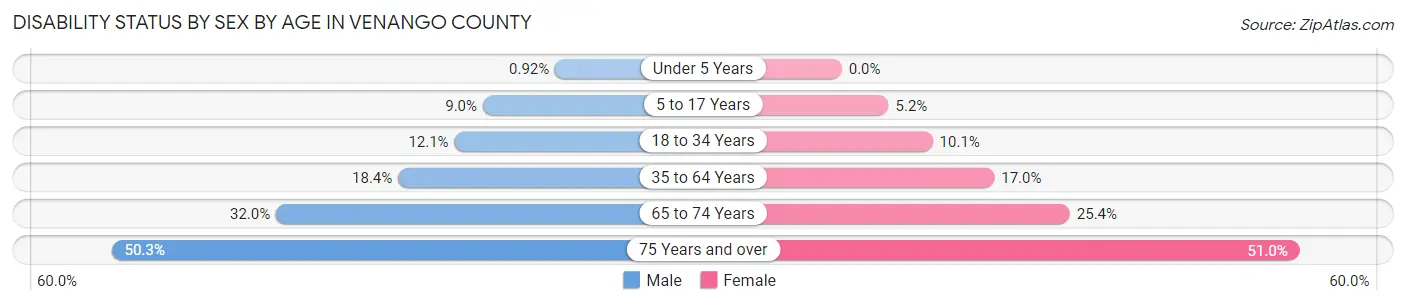
| Age Bracket | Male | Female |
| Under 5 Years | 12 (0.9%) | 0 (0.0%) |
| 5 to 17 Years | 318 (9.0%) | 182 (5.2%) |
| 18 to 34 Years | 530 (12.1%) | 417 (10.1%) |
| 35 to 64 Years | 1,877 (18.4%) | 1,708 (17.0%) |
| 65 to 74 Years | 1,103 (32.0%) | 906 (25.4%) |
| 75 Years and over | 971 (50.3%) | 1,363 (51.0%) |
Disability Class by Sex by Age in Venango County
Disability Class: Hearing Difficulty
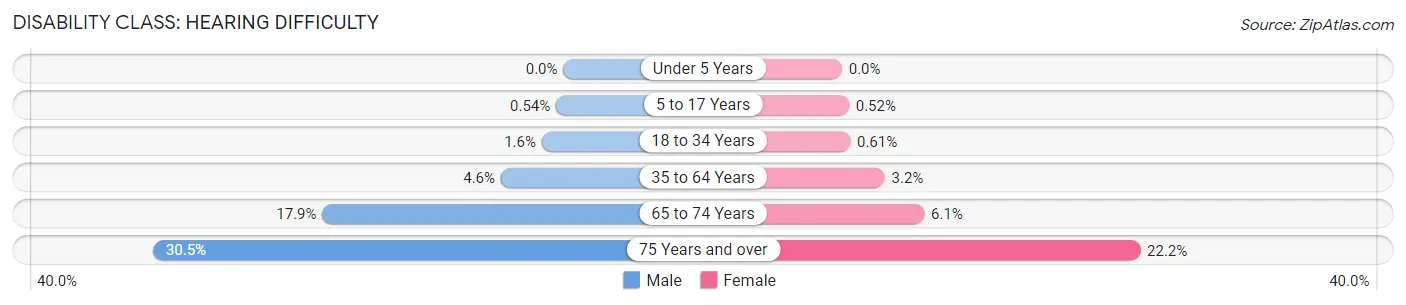
| Age Bracket | Male | Female |
| Under 5 Years | 0 (0.0%) | 0 (0.0%) |
| 5 to 17 Years | 19 (0.5%) | 18 (0.5%) |
| 18 to 34 Years | 70 (1.6%) | 25 (0.6%) |
| 35 to 64 Years | 473 (4.6%) | 320 (3.2%) |
| 65 to 74 Years | 617 (17.9%) | 218 (6.1%) |
| 75 Years and over | 588 (30.5%) | 592 (22.2%) |
Disability Class: Vision Difficulty
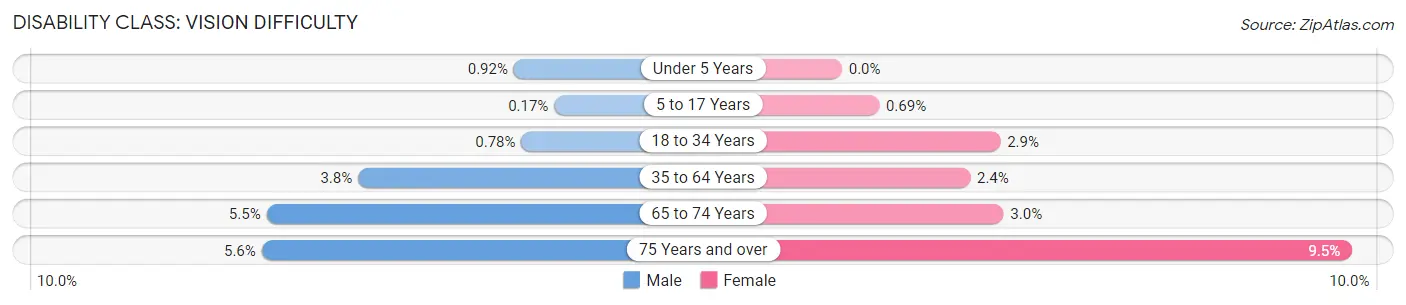
| Age Bracket | Male | Female |
| Under 5 Years | 12 (0.9%) | 0 (0.0%) |
| 5 to 17 Years | 6 (0.2%) | 24 (0.7%) |
| 18 to 34 Years | 34 (0.8%) | 121 (2.9%) |
| 35 to 64 Years | 389 (3.8%) | 239 (2.4%) |
| 65 to 74 Years | 190 (5.5%) | 107 (3.0%) |
| 75 Years and over | 108 (5.6%) | 253 (9.5%) |
Disability Class: Cognitive Difficulty
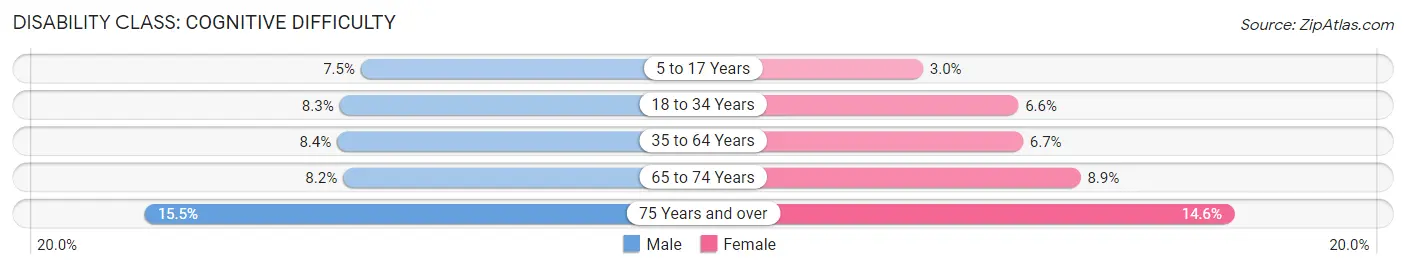
| Age Bracket | Male | Female |
| 5 to 17 Years | 267 (7.5%) | 105 (3.0%) |
| 18 to 34 Years | 363 (8.3%) | 270 (6.6%) |
| 35 to 64 Years | 857 (8.4%) | 676 (6.7%) |
| 65 to 74 Years | 282 (8.2%) | 316 (8.9%) |
| 75 Years and over | 300 (15.5%) | 389 (14.5%) |
Disability Class: Ambulatory Difficulty
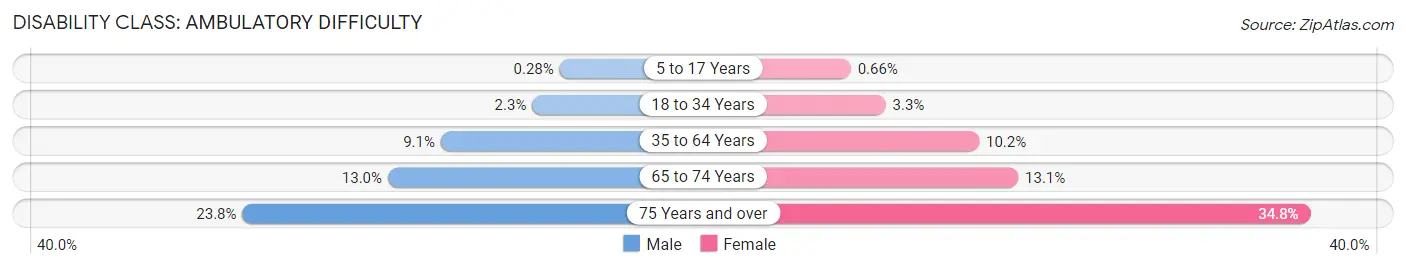
| Age Bracket | Male | Female |
| 5 to 17 Years | 10 (0.3%) | 23 (0.7%) |
| 18 to 34 Years | 101 (2.3%) | 134 (3.3%) |
| 35 to 64 Years | 928 (9.1%) | 1,025 (10.2%) |
| 65 to 74 Years | 449 (13.0%) | 467 (13.1%) |
| 75 Years and over | 460 (23.8%) | 930 (34.8%) |
Disability Class: Self-Care Difficulty
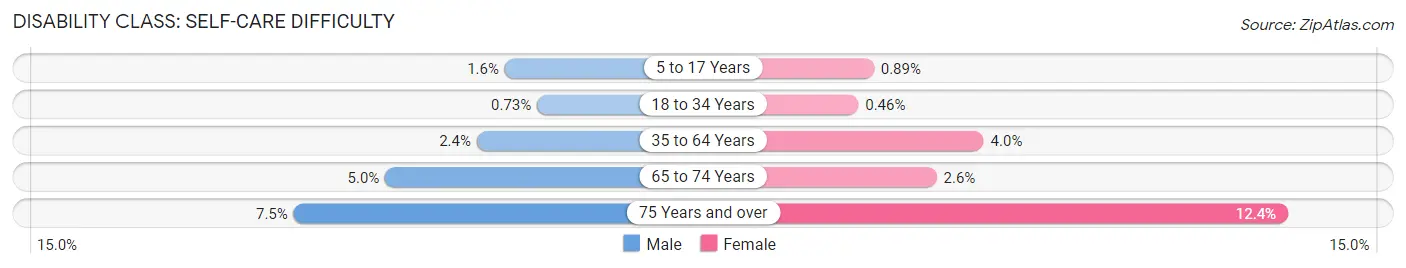
| Age Bracket | Male | Female |
| 5 to 17 Years | 58 (1.6%) | 31 (0.9%) |
| 18 to 34 Years | 32 (0.7%) | 19 (0.5%) |
| 35 to 64 Years | 246 (2.4%) | 397 (4.0%) |
| 65 to 74 Years | 171 (5.0%) | 94 (2.6%) |
| 75 Years and over | 145 (7.5%) | 332 (12.4%) |
Technology Access in Venango County
Computing Device Access in Venango County
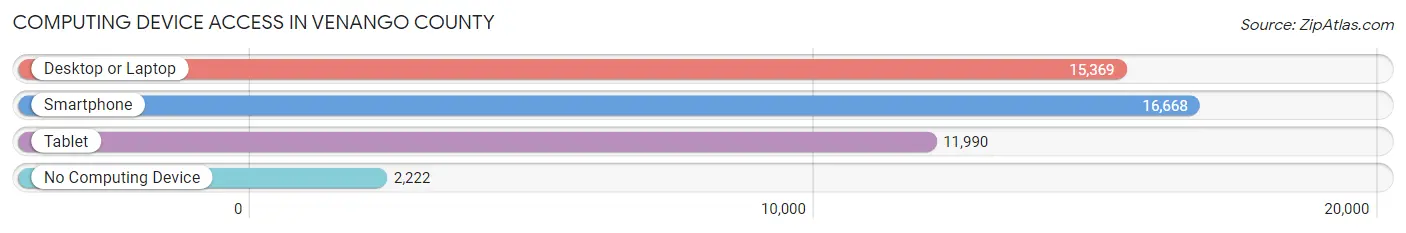
| Device Type | # Households | % Households |
| Desktop or Laptop | 15,369 | 72.1% |
| Smartphone | 16,668 | 78.2% |
| Tablet | 11,990 | 56.2% |
| No Computing Device | 2,222 | 10.4% |
| Total | 21,323 | 100.0% |
Internet Access in Venango County
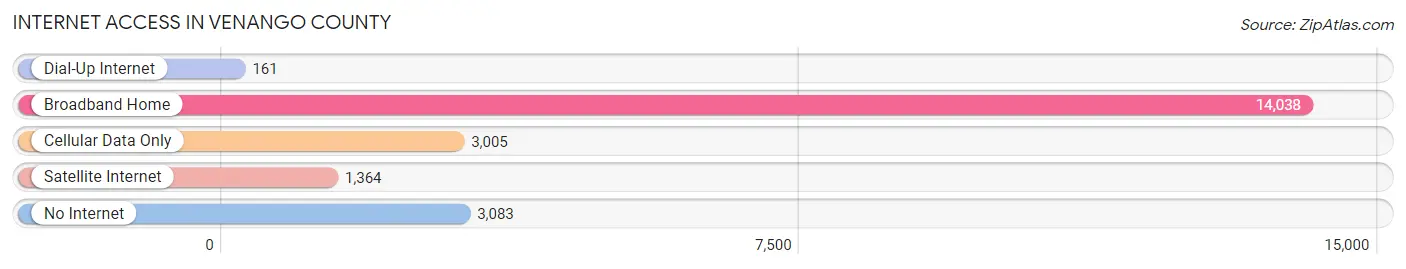
| Internet Type | # Households | % Households |
| Dial-Up Internet | 161 | 0.8% |
| Broadband Home | 14,038 | 65.8% |
| Cellular Data Only | 3,005 | 14.1% |
| Satellite Internet | 1,364 | 6.4% |
| No Internet | 3,083 | 14.5% |
| Total | 21,323 | 100.0% |
Venango County Summary
Introduction
Venango County is located in the northwestern part of Pennsylvania, and is part of the Pittsburgh metropolitan area. It is bordered by Clarion County to the north, Forest County to the east, Crawford County to the south, and Butler County to the west. The county seat is Franklin, and the county was created in 1800 from parts of Allegheny and Lycoming counties. The county has a total area of 745 square miles, and a population of 54,984 as of the 2010 census.
History
The area that is now Venango County was originally inhabited by the Iroquois and Erie Native American tribes. The first European settlers arrived in the area in the late 1700s, and the county was officially established in 1800. The county was named after the Venango River, which was named by the Iroquois for the “otter” that lived in the river.
The county was initially a major producer of oil and natural gas, and the first oil well was drilled in 1859. The oil industry was a major part of the economy for many years, and the county was home to several oil refineries. The county also had a thriving lumber industry, and the first sawmill was built in 1820.
The county was also home to several important historical figures, including the famous frontiersman and explorer, Daniel Boone. Boone lived in the county for several years, and his cabin still stands in the county today.
Geography
Venango County is located in the northwestern part of Pennsylvania, and is part of the Pittsburgh metropolitan area. It is bordered by Clarion County to the north, Forest County to the east, Crawford County to the south, and Butler County to the west. The county has a total area of 745 square miles, and is mostly rural. The terrain is mostly rolling hills, with some flat areas in the northern part of the county. The highest point in the county is 1,890 feet above sea level, and the lowest point is 1,000 feet above sea level.
The county is home to several rivers and streams, including the Allegheny River, French Creek, and the Venango River. The county also has several lakes, including Lake Pleasant, Lake Arthur, and Lake Wilhelm.
Economy
The economy of Venango County is largely based on the oil and gas industry, which has been a major part of the economy since the first oil well was drilled in 1859. The county is home to several oil refineries, and is also home to several natural gas processing plants. The county is also home to several manufacturing companies, including a steel mill and a paper mill.
The county is also home to several tourist attractions, including the Oil Creek State Park, the Drake Well Museum, and the Venango Museum of Art, Science, and Industry. The county is also home to several wineries, and is a popular destination for outdoor recreation.
Demographics
As of the 2010 census, the population of Venango County was 54,984. The population is mostly white (94.3%), with small percentages of African American (2.3%), Asian (0.7%), and Hispanic (1.3%) residents. The median household income is $45,845, and the median age is 43.7 years.
Conclusion
Venango County is located in the northwestern part of Pennsylvania, and is part of the Pittsburgh metropolitan area. The county has a total area of 745 square miles, and a population of 54,984 as of the 2010 census. The economy of the county is largely based on the oil and gas industry, and the county is also home to several manufacturing companies and tourist attractions. The population is mostly white, with small percentages of African American, Asian, and Hispanic residents.
Common Questions
What is Per Capita Income in Venango County?
Per Capita income in Venango County is $31,667.
What is the Median Family Income in Venango County?
Median Family Income in Venango County is $72,627.
What is the Median Household income in Venango County?
Median Household Income in Venango County is $59,278.
What is Income or Wage Gap in Venango County?
Income or Wage Gap in Venango County is 28.9%.
Women in Venango County earn 71.1 cents for every dollar earned by a man.
What is Family Income Deficit in Venango County?
Family Income Deficit in Venango County is $10,527.
Families that are below poverty line in Venango County earn $10,527 less on average than the poverty threshold level.
What is Inequality or Gini Index in Venango County?
Inequality or Gini Index in Venango County is 0.42.
What is the Total Population of Venango County?
Total Population of Venango County is 50,475.
What is the Total Male Population of Venango County?
Total Male Population of Venango County is 25,174.
What is the Total Female Population of Venango County?
Total Female Population of Venango County is 25,301.
What is the Ratio of Males per 100 Females in Venango County?
There are 99.50 Males per 100 Females in Venango County.
What is the Ratio of Females per 100 Males in Venango County?
There are 100.50 Females per 100 Males in Venango County.
What is the Median Population Age in Venango County?
Median Population Age in Venango County is 47.6 Years.
What is the Average Family Size in Venango County
Average Family Size in Venango County is 2.8 People.
What is the Average Household Size in Venango County
Average Household Size in Venango County is 2.3 People.
How Large is the Labor Force in Venango County?
There are 23,323 People in the Labor Forcein in Venango County.
What is the Percentage of People in the Labor Force in Venango County?
55.3% of People are in the Labor Force in Venango County.
What is the Unemployment Rate in Venango County?
Unemployment Rate in Venango County is 6.7%.