Union County, PA Map & Demographics
Union County Overview
$33,566
PER CAPITA INCOME
$89,083
AVG FAMILY INCOME
$64,914
AVG HOUSEHOLD INCOME
25.7%
WAGE / INCOME GAP [ % ]
74.3¢/ $1
WAGE / INCOME GAP [ $ ]
$9,300
FAMILY INCOME DEFICIT
0.49
INEQUALITY / GINI INDEX
42,908
TOTAL POPULATION
23,217
MALE POPULATION
19,691
FEMALE POPULATION
117.91
MALES / 100 FEMALES
84.81
FEMALES / 100 MALES
39.7
MEDIAN AGE
3.0
AVG FAMILY SIZE
2.4
AVG HOUSEHOLD SIZE
17,481
LABOR FORCE [ PEOPLE ]
48.1%
PERCENT IN LABOR FORCE
3.5%
UNEMPLOYMENT RATE
Union County Area Codes
Income in Union County
Income Overview in Union County
Per Capita Income in Union County is $33,566, while median incomes of families and households are $89,083 and $64,914 respectively.
| Characteristic | Number | Measure |
| Per Capita Income | 42,908 | $33,566 |
| Median Family Income | 9,156 | $89,083 |
| Mean Family Income | 9,156 | $114,145 |
| Median Household Income | 14,172 | $64,914 |
| Mean Household Income | 14,172 | $96,921 |
| Income Deficit | 9,156 | $9,300 |
| Wage / Income Gap (%) | 42,908 | 25.73% |
| Wage / Income Gap ($) | 42,908 | 74.27¢ per $1 |
| Gini / Inequality Index | 42,908 | 0.49 |
Earnings by Sex in Union County
Average Earnings in Union County are $31,755, $36,478 for men and $27,093 for women, a difference of 25.7%.
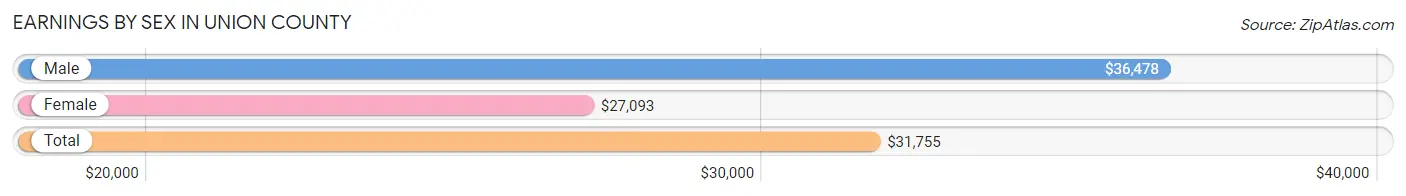
| Sex | Number | Average Earnings |
| Male | 12,185 (56.6%) | $36,478 |
| Female | 9,347 (43.4%) | $27,093 |
| Total | 21,532 (100.0%) | $31,755 |
Earnings by Sex by Income Bracket in Union County
The most common earnings brackets in Union County are $100,000+ for men (1,629 | 13.4%) and $2,499 or less for women (883 | 9.5%).
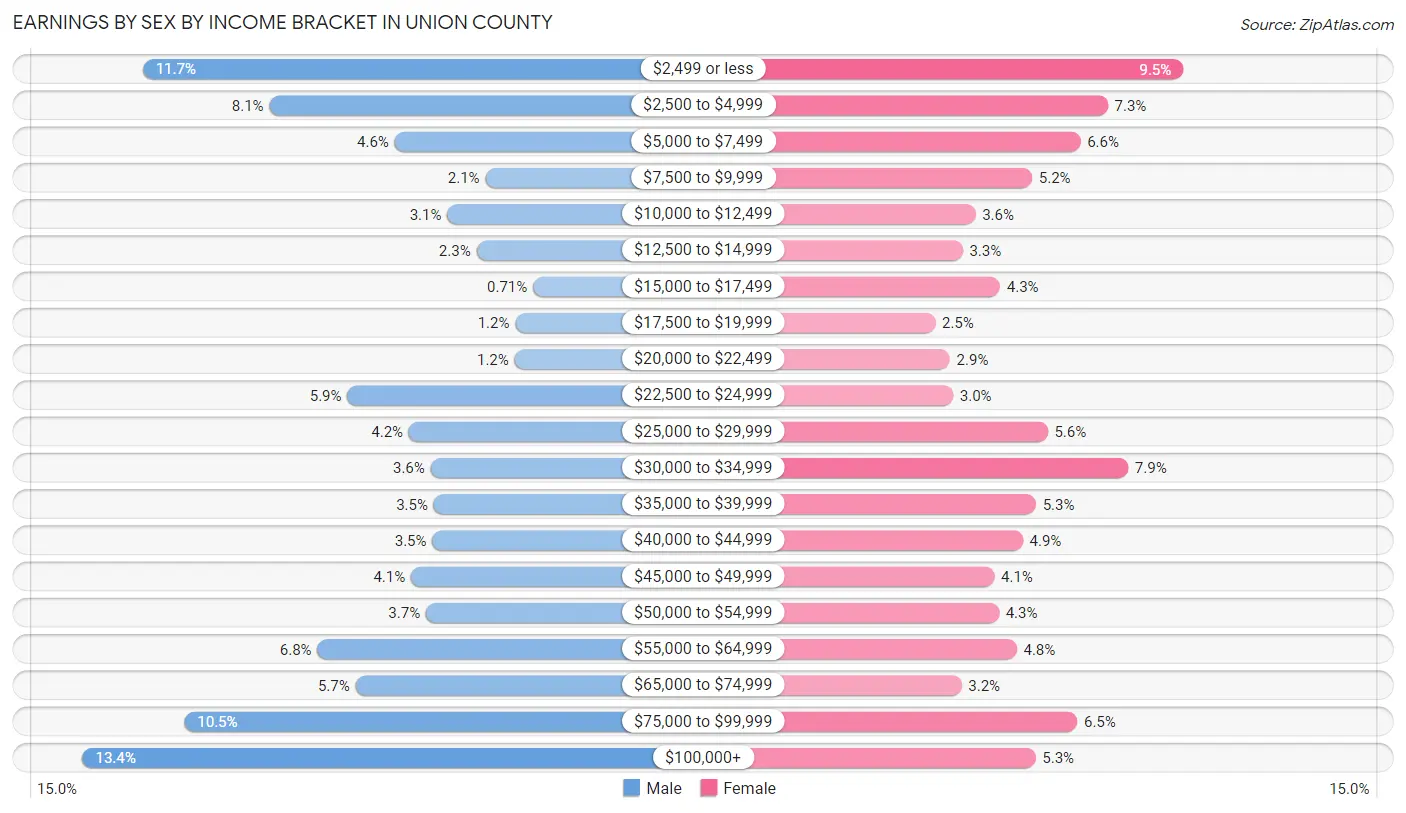
| Income | Male | Female |
| $2,499 or less | 1,423 (11.7%) | 883 (9.5%) |
| $2,500 to $4,999 | 990 (8.1%) | 685 (7.3%) |
| $5,000 to $7,499 | 561 (4.6%) | 613 (6.6%) |
| $7,500 to $9,999 | 250 (2.1%) | 486 (5.2%) |
| $10,000 to $12,499 | 380 (3.1%) | 337 (3.6%) |
| $12,500 to $14,999 | 280 (2.3%) | 304 (3.3%) |
| $15,000 to $17,499 | 86 (0.7%) | 402 (4.3%) |
| $17,500 to $19,999 | 148 (1.2%) | 232 (2.5%) |
| $20,000 to $22,499 | 150 (1.2%) | 270 (2.9%) |
| $22,500 to $24,999 | 723 (5.9%) | 279 (3.0%) |
| $25,000 to $29,999 | 512 (4.2%) | 527 (5.6%) |
| $30,000 to $34,999 | 437 (3.6%) | 738 (7.9%) |
| $35,000 to $39,999 | 426 (3.5%) | 496 (5.3%) |
| $40,000 to $44,999 | 431 (3.5%) | 462 (4.9%) |
| $45,000 to $49,999 | 505 (4.1%) | 387 (4.1%) |
| $50,000 to $54,999 | 453 (3.7%) | 399 (4.3%) |
| $55,000 to $64,999 | 825 (6.8%) | 446 (4.8%) |
| $65,000 to $74,999 | 695 (5.7%) | 301 (3.2%) |
| $75,000 to $99,999 | 1,281 (10.5%) | 605 (6.5%) |
| $100,000+ | 1,629 (13.4%) | 495 (5.3%) |
| Total | 12,185 (100.0%) | 9,347 (100.0%) |
Earnings by Sex by Educational Attainment in Union County
Average earnings in Union County are $47,386 for men and $34,728 for women, a difference of 26.7%. Men with an educational attainment of graduate degree enjoy the highest average annual earnings of $89,231, while those with high school diploma education earn the least with $30,295. Women with an educational attainment of graduate degree earn the most with the average annual earnings of $75,887, while those with less than high school education have the smallest earnings of $21,544.
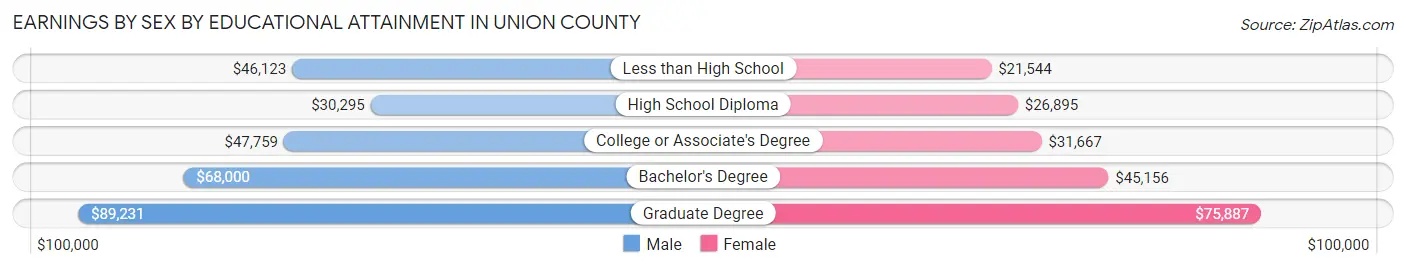
| Educational Attainment | Male Income | Female Income |
| Less than High School | $46,123 | $21,544 |
| High School Diploma | $30,295 | $26,895 |
| College or Associate's Degree | $47,759 | $31,667 |
| Bachelor's Degree | $68,000 | $45,156 |
| Graduate Degree | $89,231 | $75,887 |
| Total | $47,386 | $34,728 |
Family Income in Union County
Family Income Brackets in Union County
According to the Union County family income data, there are 2,188 families falling into the $100,000 to $149,999 income range, which is the most common income bracket and makes up 23.9% of all families. Conversely, the less than $10,000 income bracket is the least frequent group with only 156 families (1.7%) belonging to this category.
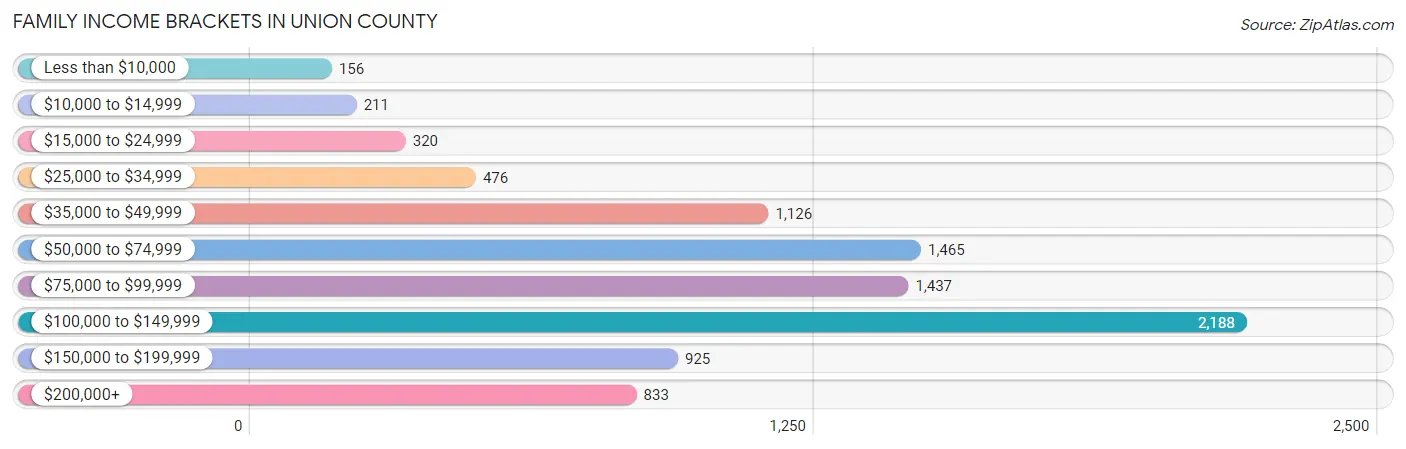
| Income Bracket | # Families | % Families |
| Less than $10,000 | 156 | 1.7% |
| $10,000 to $14,999 | 211 | 2.3% |
| $15,000 to $24,999 | 320 | 3.5% |
| $25,000 to $34,999 | 476 | 5.2% |
| $35,000 to $49,999 | 1,126 | 12.3% |
| $50,000 to $74,999 | 1,465 | 16.0% |
| $75,000 to $99,999 | 1,437 | 15.7% |
| $100,000 to $149,999 | 2,188 | 23.9% |
| $150,000 to $199,999 | 925 | 10.1% |
| $200,000+ | 833 | 9.1% |
Family Income by Famaliy Size in Union County
4-person families (1,173 | 12.8%) account for the highest median family income in Union County with $120,528 per family, while 2-person families (4,967 | 54.2%) have the highest median income of $34,762 per family member.
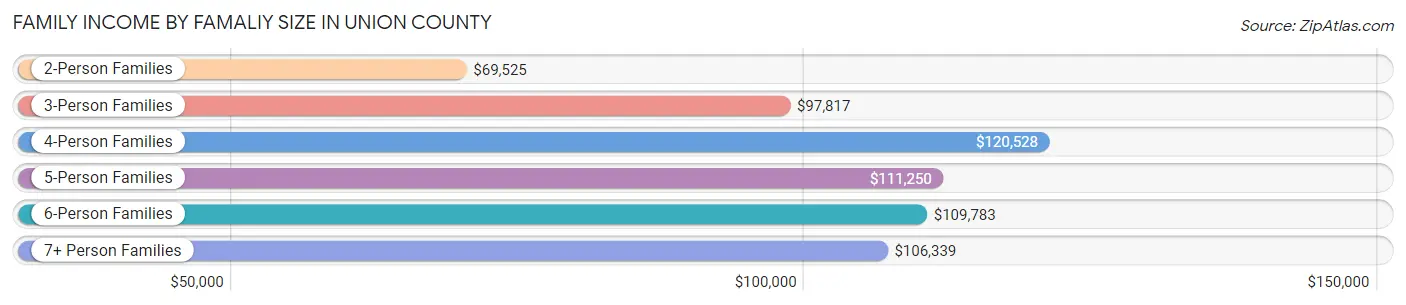
| Income Bracket | # Families | Median Income |
| 2-Person Families | 4,967 (54.2%) | $69,525 |
| 3-Person Families | 1,839 (20.1%) | $97,817 |
| 4-Person Families | 1,173 (12.8%) | $120,528 |
| 5-Person Families | 790 (8.6%) | $111,250 |
| 6-Person Families | 196 (2.1%) | $109,783 |
| 7+ Person Families | 191 (2.1%) | $106,339 |
| Total | 9,156 (100.0%) | $89,083 |
Family Income by Number of Earners in Union County
The median family income in Union County is $89,083, with families comprising 3+ earners (1,001) having the highest median family income of $154,632, while families with no earners (1,726) have the lowest median family income of $53,818, accounting for 10.9% and 18.9% of families, respectively.
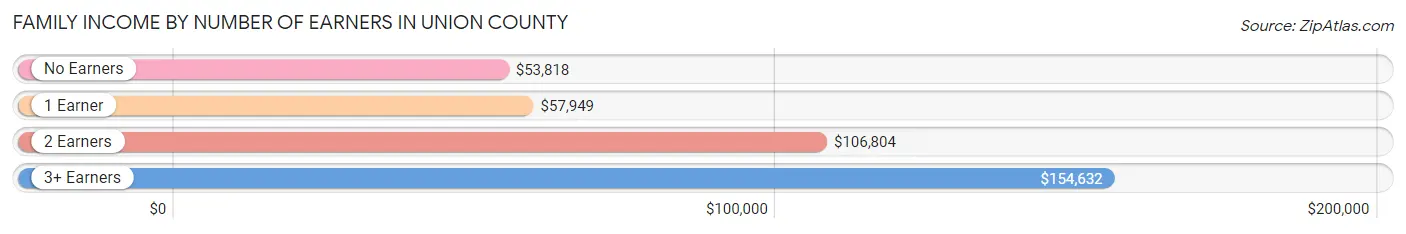
| Number of Earners | # Families | Median Income |
| No Earners | 1,726 (18.9%) | $53,818 |
| 1 Earner | 2,626 (28.7%) | $57,949 |
| 2 Earners | 3,803 (41.5%) | $106,804 |
| 3+ Earners | 1,001 (10.9%) | $154,632 |
| Total | 9,156 (100.0%) | $89,083 |
Household Income in Union County
Household Income Brackets in Union County
With 2,466 households falling in the category, the $100,000 to $149,999 income range is the most frequent in Union County, accounting for 17.4% of all households. In contrast, only 468 households (3.3%) fall into the less than $10,000 income bracket, making it the least populous group.
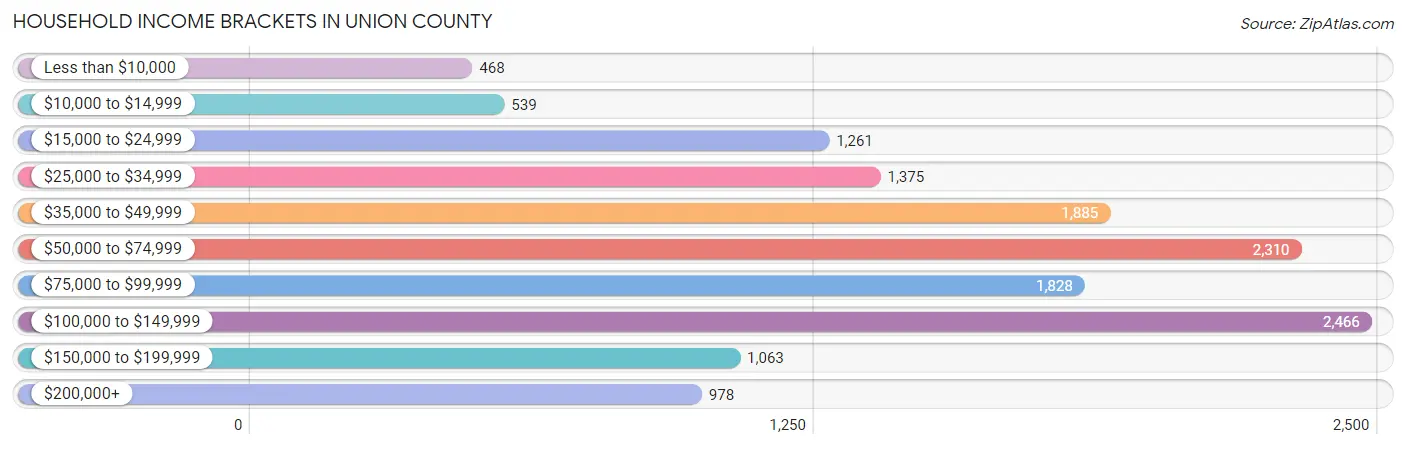
| Income Bracket | # Households | % Households |
| Less than $10,000 | 468 | 3.3% |
| $10,000 to $14,999 | 539 | 3.8% |
| $15,000 to $24,999 | 1,261 | 8.9% |
| $25,000 to $34,999 | 1,375 | 9.7% |
| $35,000 to $49,999 | 1,885 | 13.3% |
| $50,000 to $74,999 | 2,310 | 16.3% |
| $75,000 to $99,999 | 1,828 | 12.9% |
| $100,000 to $149,999 | 2,466 | 17.4% |
| $150,000 to $199,999 | 1,063 | 7.5% |
| $200,000+ | 978 | 6.9% |
Household Income by Householder Age in Union County
The median household income in Union County is $64,914, with the highest median household income of $90,554 found in the 25 to 44 years age bracket for the primary householder. A total of 3,458 households (24.4%) fall into this category. Meanwhile, the 15 to 24 years age bracket for the primary householder has the lowest median household income of $32,829, with 453 households (3.2%) in this group.
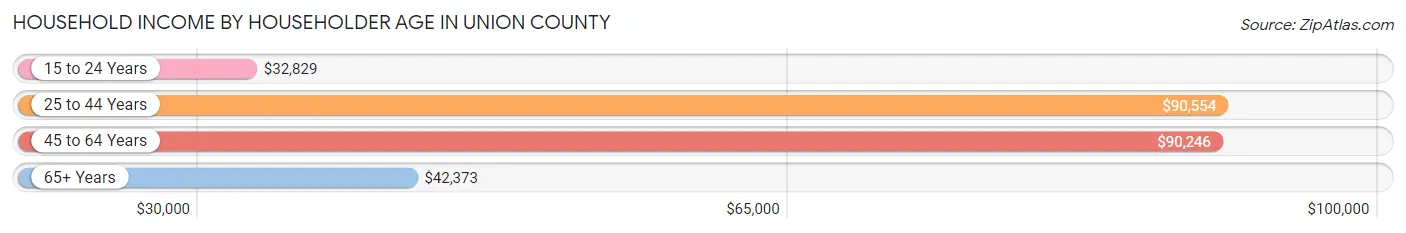
| Income Bracket | # Households | Median Income |
| 15 to 24 Years | 453 (3.2%) | $32,829 |
| 25 to 44 Years | 3,458 (24.4%) | $90,554 |
| 45 to 64 Years | 5,102 (36.0%) | $90,246 |
| 65+ Years | 5,159 (36.4%) | $42,373 |
| Total | 14,172 (100.0%) | $64,914 |
Poverty in Union County
Income Below Poverty by Sex and Age in Union County
With 10.7% poverty level for males and 10.9% for females among the residents of Union County, 15 year old males and 5 year old females are the most vulnerable to poverty, with 54 males (26.3%) and 22 females (24.4%) in their respective age groups living below the poverty level.

| Age Bracket | Male | Female |
| Under 5 Years | 89 (9.8%) | 111 (11.6%) |
| 5 Years | 21 (7.7%) | 22 (24.4%) |
| 6 to 11 Years | 76 (7.7%) | 177 (12.1%) |
| 12 to 14 Years | 117 (12.3%) | 66 (13.8%) |
| 15 Years | 54 (26.3%) | 12 (7.7%) |
| 16 and 17 Years | 114 (18.4%) | 39 (7.9%) |
| 18 to 24 Years | 108 (9.3%) | 288 (22.2%) |
| 25 to 34 Years | 311 (15.3%) | 221 (11.8%) |
| 35 to 44 Years | 194 (10.7%) | 258 (13.3%) |
| 45 to 54 Years | 158 (7.5%) | 198 (9.2%) |
| 55 to 64 Years | 333 (13.7%) | 158 (6.4%) |
| 65 to 74 Years | 146 (7.4%) | 211 (9.7%) |
| 75 Years and over | 84 (5.9%) | 165 (8.0%) |
| Total | 1,805 (10.7%) | 1,926 (10.9%) |
Income Above Poverty by Sex and Age in Union County
According to the poverty statistics in Union County, males aged 75 years and over and females aged 55 to 64 years are the age groups that are most secure financially, with 94.1% of males and 93.6% of females in these age groups living above the poverty line.
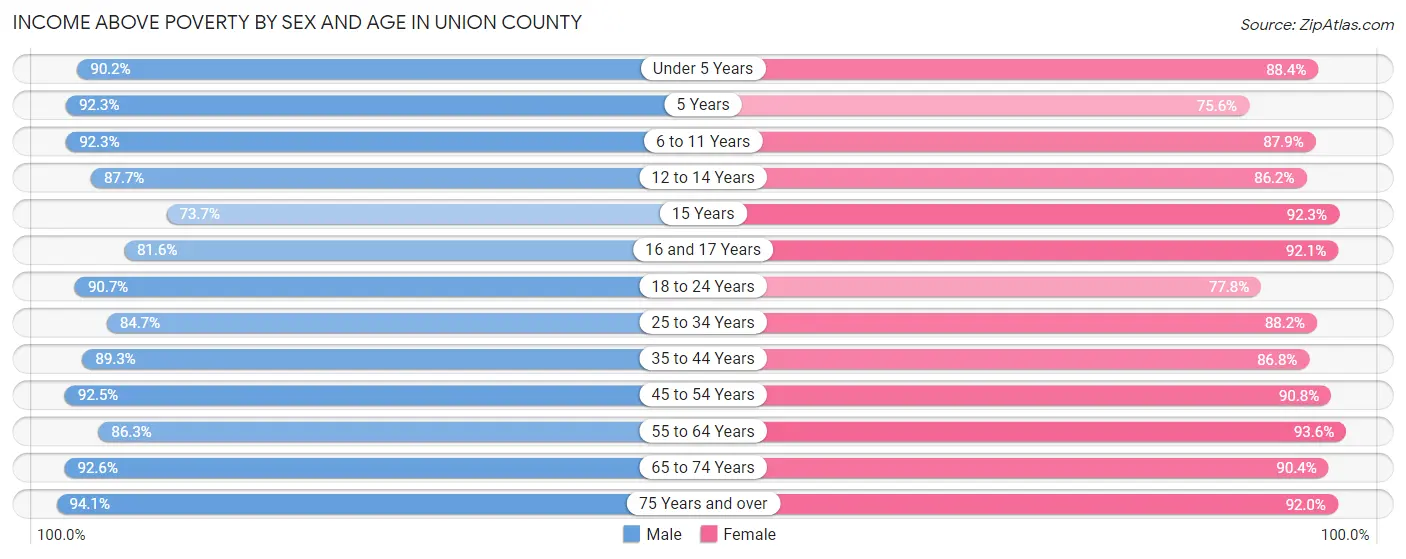
| Age Bracket | Male | Female |
| Under 5 Years | 820 (90.2%) | 848 (88.4%) |
| 5 Years | 252 (92.3%) | 68 (75.6%) |
| 6 to 11 Years | 907 (92.3%) | 1,288 (87.9%) |
| 12 to 14 Years | 833 (87.7%) | 413 (86.2%) |
| 15 Years | 151 (73.7%) | 143 (92.3%) |
| 16 and 17 Years | 504 (81.6%) | 456 (92.1%) |
| 18 to 24 Years | 1,047 (90.6%) | 1,010 (77.8%) |
| 25 to 34 Years | 1,726 (84.7%) | 1,650 (88.2%) |
| 35 to 44 Years | 1,613 (89.3%) | 1,689 (86.8%) |
| 45 to 54 Years | 1,952 (92.5%) | 1,956 (90.8%) |
| 55 to 64 Years | 2,096 (86.3%) | 2,304 (93.6%) |
| 65 to 74 Years | 1,823 (92.6%) | 1,976 (90.3%) |
| 75 Years and over | 1,332 (94.1%) | 1,909 (92.0%) |
| Total | 15,056 (89.3%) | 15,710 (89.1%) |
Income Below Poverty Among Married-Couple Families in Union County
The poverty statistics for married-couple families in Union County show that 3.6% or 286 of the total 7,877 families live below the poverty line. Families with 5 or more children have the highest poverty rate of 31.2%, comprising of 48 families. On the other hand, families with 1 or 2 children have the lowest poverty rate of 1.9%, which includes 39 families.
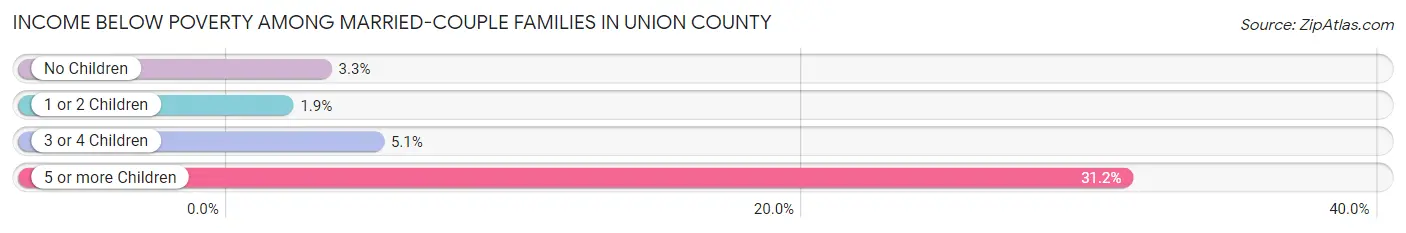
| Children | Above Poverty | Below Poverty |
| No Children | 4,807 (96.7%) | 162 (3.3%) |
| 1 or 2 Children | 1,986 (98.1%) | 39 (1.9%) |
| 3 or 4 Children | 692 (94.9%) | 37 (5.1%) |
| 5 or more Children | 106 (68.8%) | 48 (31.2%) |
| Total | 7,591 (96.4%) | 286 (3.6%) |
Income Below Poverty Among Single-Parent Households in Union County
According to the poverty data in Union County, 3.3% or 11 single-father households and 29.1% or 274 single-mother households are living below the poverty line. Among single-father households, those with 1 or 2 children have the highest poverty rate, with 11 households (6.4%) experiencing poverty. Likewise, among single-mother households, those with no children have the highest poverty rate, with 110 households (32.5%) falling below the poverty line.
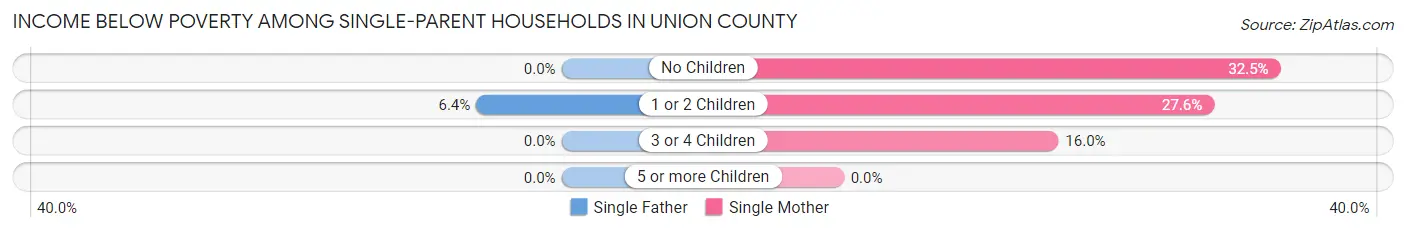
| Children | Single Father | Single Mother |
| No Children | 0 (0.0%) | 110 (32.5%) |
| 1 or 2 Children | 11 (6.4%) | 160 (27.6%) |
| 3 or 4 Children | 0 (0.0%) | 4 (16.0%) |
| 5 or more Children | 0 (0.0%) | 0 (0.0%) |
| Total | 11 (3.3%) | 274 (29.1%) |
Income Below Poverty Among Married-Couple vs Single-Parent Households in Union County
The poverty data for Union County shows that 286 of the married-couple family households (3.6%) and 285 of the single-parent households (22.3%) are living below the poverty level. Within the married-couple family households, those with 5 or more children have the highest poverty rate, with 48 households (31.2%) falling below the poverty line. Among the single-parent households, those with 1 or 2 children have the highest poverty rate, with 171 household (22.7%) living below poverty.
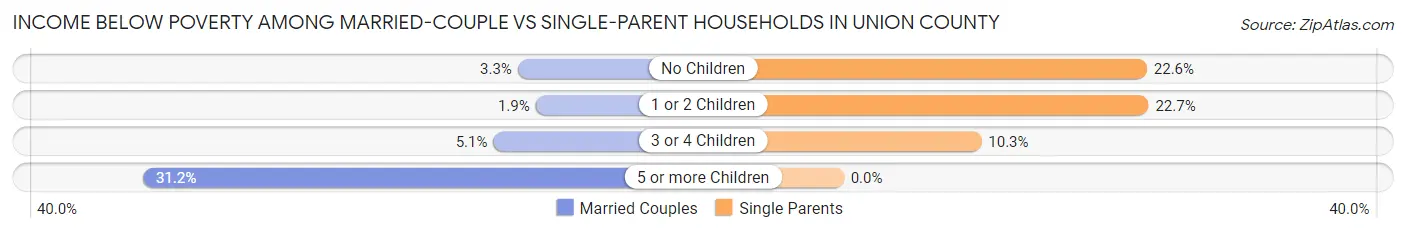
| Children | Married-Couple Families | Single-Parent Households |
| No Children | 162 (3.3%) | 110 (22.6%) |
| 1 or 2 Children | 39 (1.9%) | 171 (22.7%) |
| 3 or 4 Children | 37 (5.1%) | 4 (10.3%) |
| 5 or more Children | 48 (31.2%) | 0 (0.0%) |
| Total | 286 (3.6%) | 285 (22.3%) |
Race in Union County
The most populous races in Union County are White / Caucasian (38,101 | 88.8%), Black / African American (2,818 | 6.6%), and Hispanic or Latino (2,406 | 5.6%).
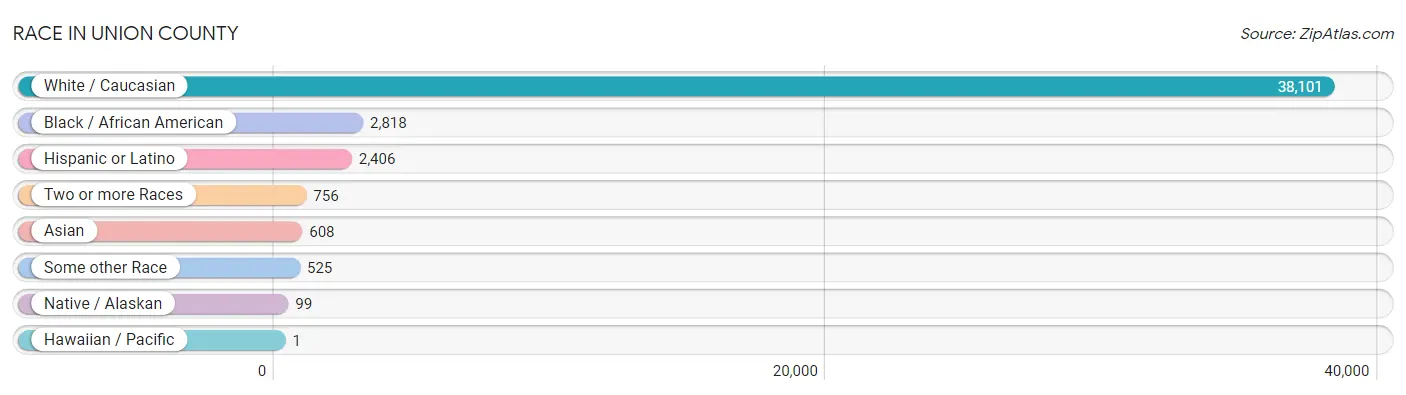
| Race | # Population | % Population |
| Asian | 608 | 1.4% |
| Black / African American | 2,818 | 6.6% |
| Hawaiian / Pacific | 1 | 0.0% |
| Hispanic or Latino | 2,406 | 5.6% |
| Native / Alaskan | 99 | 0.2% |
| White / Caucasian | 38,101 | 88.8% |
| Two or more Races | 756 | 1.8% |
| Some other Race | 525 | 1.2% |
| Total | 42,908 | 100.0% |
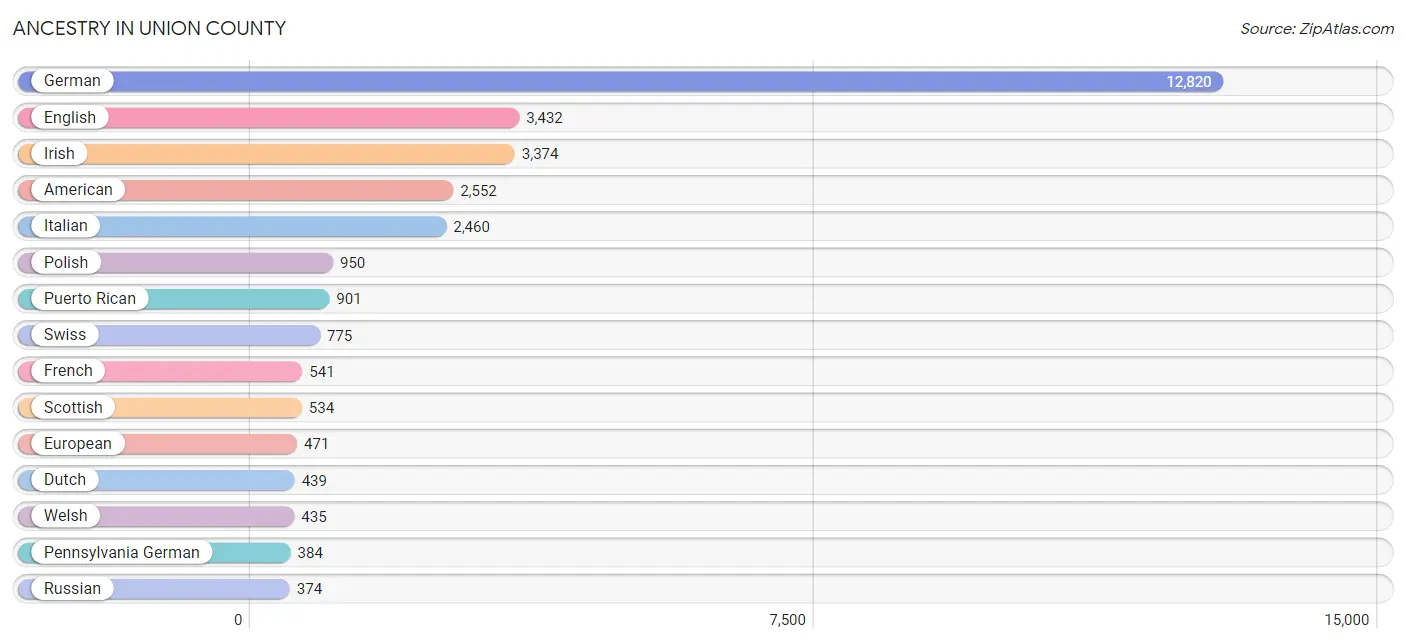
Ancestry in Union County
The most populous ancestries reported in Union County are German (12,820 | 29.9%), English (3,432 | 8.0%), Irish (3,374 | 7.9%), American (2,552 | 5.9%), and Italian (2,460 | 5.7%), together accounting for 57.4% of all Union County residents.
| Ancestry | # Population | % Population |
| African | 71 | 0.2% |
| Alsatian | 13 | 0.0% |
| American | 2,552 | 5.9% |
| Arab | 66 | 0.2% |
| Austrian | 41 | 0.1% |
| Basque | 11 | 0.0% |
| Belgian | 8 | 0.0% |
| Bhutanese | 24 | 0.1% |
| Blackfeet | 11 | 0.0% |
| Bolivian | 11 | 0.0% |
| British | 101 | 0.2% |
| Burmese | 262 | 0.6% |
| Canadian | 18 | 0.0% |
| Central American | 166 | 0.4% |
| Cherokee | 5 | 0.0% |
| Chippewa | 4 | 0.0% |
| Colombian | 57 | 0.1% |
| Costa Rican | 43 | 0.1% |
| Croatian | 25 | 0.1% |
| Cuban | 28 | 0.1% |
| Czech | 74 | 0.2% |
| Czechoslovakian | 34 | 0.1% |
| Danish | 47 | 0.1% |
| Delaware | 4 | 0.0% |
| Dominican | 26 | 0.1% |
| Dutch | 439 | 1.0% |
| Eastern European | 95 | 0.2% |
| Ecuadorian | 6 | 0.0% |
| Egyptian | 3 | 0.0% |
| English | 3,432 | 8.0% |
| European | 471 | 1.1% |
| Finnish | 40 | 0.1% |
| French | 541 | 1.3% |
| French Canadian | 61 | 0.1% |
| German | 12,820 | 29.9% |
| Ghanaian | 24 | 0.1% |
| Greek | 63 | 0.2% |
| Guatemalan | 123 | 0.3% |
| Hungarian | 52 | 0.1% |
| Indian (Asian) | 111 | 0.3% |
| Iranian | 5 | 0.0% |
| Irish | 3,374 | 7.9% |
| Iroquois | 14 | 0.0% |
| Israeli | 43 | 0.1% |
| Italian | 2,460 | 5.7% |
| Jamaican | 13 | 0.0% |
| Korean | 81 | 0.2% |
| Latvian | 34 | 0.1% |
| Lebanese | 21 | 0.1% |
| Liberian | 9 | 0.0% |
| Lithuanian | 68 | 0.2% |
| Mexican | 268 | 0.6% |
| Mexican American Indian | 13 | 0.0% |
| Moroccan | 36 | 0.1% |
| Native Hawaiian | 20 | 0.1% |
| Navajo | 5 | 0.0% |
| Norwegian | 219 | 0.5% |
| Osage | 19 | 0.0% |
| Pennsylvania German | 384 | 0.9% |
| Polish | 950 | 2.2% |
| Portuguese | 18 | 0.0% |
| Puerto Rican | 901 | 2.1% |
| Romanian | 10 | 0.0% |
| Russian | 374 | 0.9% |
| Samoan | 5 | 0.0% |
| Scandinavian | 14 | 0.0% |
| Scotch-Irish | 348 | 0.8% |
| Scottish | 534 | 1.2% |
| Sioux | 7 | 0.0% |
| Slavic | 37 | 0.1% |
| Slovak | 132 | 0.3% |
| Slovene | 22 | 0.1% |
| South American | 121 | 0.3% |
| Spanish | 1 | 0.0% |
| Sri Lankan | 15 | 0.0% |
| Subsaharan African | 104 | 0.2% |
| Swedish | 153 | 0.4% |
| Swiss | 775 | 1.8% |
| Thai | 161 | 0.4% |
| Turkish | 33 | 0.1% |
| Ukrainian | 231 | 0.5% |
| Venezuelan | 47 | 0.1% |
| Vietnamese | 37 | 0.1% |
| Welsh | 435 | 1.0% | View All 84 Rows |
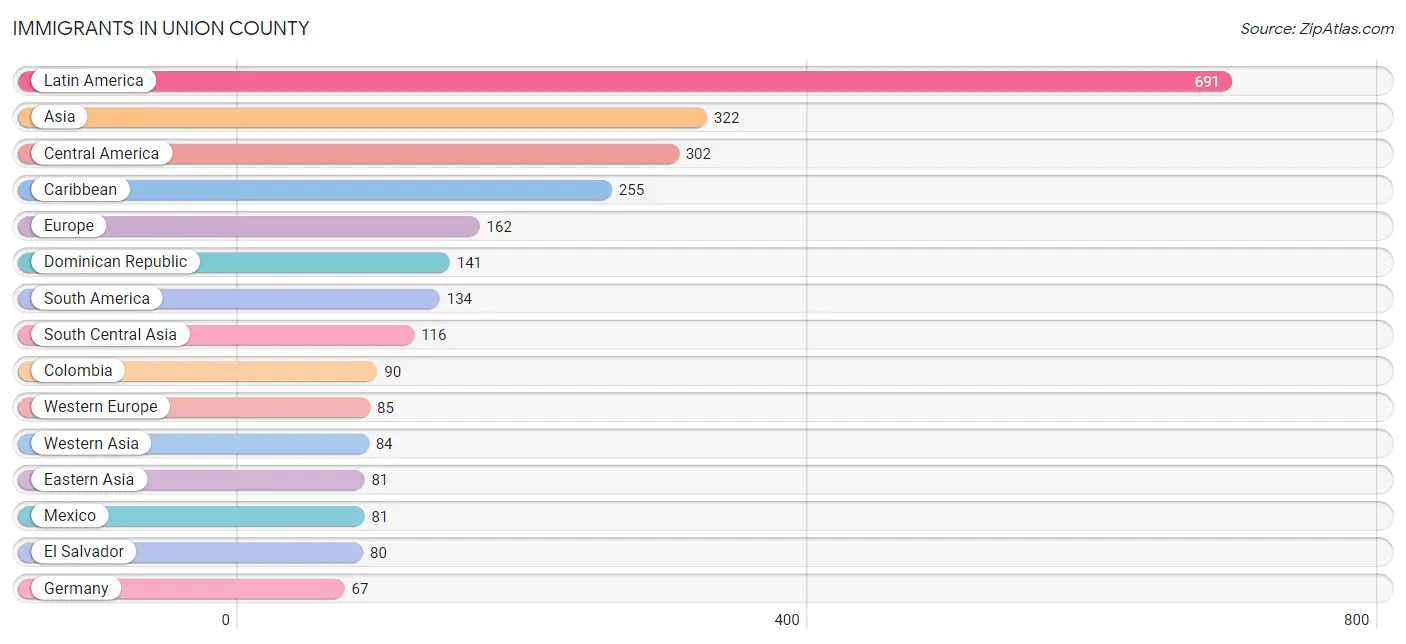
Immigrants in Union County
The most numerous immigrant groups reported in Union County came from Latin America (691 | 1.6%), Asia (322 | 0.7%), Central America (302 | 0.7%), Caribbean (255 | 0.6%), and Europe (162 | 0.4%), together accounting for 4.0% of all Union County residents.
| Immigration Origin | # Population | % Population |
| Africa | 53 | 0.1% |
| Asia | 322 | 0.7% |
| Australia | 1 | 0.0% |
| Bangladesh | 24 | 0.1% |
| Belarus | 6 | 0.0% |
| Belgium | 18 | 0.0% |
| Bolivia | 11 | 0.0% |
| Brazil | 12 | 0.0% |
| Canada | 62 | 0.1% |
| Caribbean | 255 | 0.6% |
| Central America | 302 | 0.7% |
| China | 58 | 0.1% |
| Colombia | 90 | 0.2% |
| Costa Rica | 43 | 0.1% |
| Cuba | 40 | 0.1% |
| Dominican Republic | 141 | 0.3% |
| Eastern Asia | 81 | 0.2% |
| Eastern Europe | 59 | 0.1% |
| Ecuador | 6 | 0.0% |
| Egypt | 15 | 0.0% |
| El Salvador | 80 | 0.2% |
| England | 13 | 0.0% |
| Europe | 162 | 0.4% |
| Germany | 67 | 0.2% |
| Ghana | 22 | 0.1% |
| Guatemala | 17 | 0.0% |
| Guyana | 10 | 0.0% |
| Haiti | 11 | 0.0% |
| Honduras | 16 | 0.0% |
| India | 55 | 0.1% |
| Iran | 5 | 0.0% |
| Ireland | 3 | 0.0% |
| Israel | 26 | 0.1% |
| Jamaica | 41 | 0.1% |
| Japan | 10 | 0.0% |
| Kazakhstan | 4 | 0.0% |
| Korea | 13 | 0.0% |
| Latin America | 691 | 1.6% |
| Lebanon | 15 | 0.0% |
| Mexico | 81 | 0.2% |
| Northern Africa | 31 | 0.1% |
| Northern Europe | 18 | 0.0% |
| Oceania | 33 | 0.1% |
| Pakistan | 11 | 0.0% |
| Panama | 65 | 0.2% |
| Philippines | 2 | 0.0% |
| Romania | 10 | 0.0% |
| South America | 134 | 0.3% |
| South Central Asia | 116 | 0.3% |
| South Eastern Asia | 41 | 0.1% |
| Sri Lanka | 8 | 0.0% |
| Sudan | 10 | 0.0% |
| Thailand | 23 | 0.1% |
| Trinidad and Tobago | 22 | 0.1% |
| Turkey | 33 | 0.1% |
| Ukraine | 43 | 0.1% |
| Venezuela | 5 | 0.0% |
| Vietnam | 5 | 0.0% |
| Western Africa | 22 | 0.1% |
| Western Asia | 84 | 0.2% |
| Western Europe | 85 | 0.2% |
| Yemen | 10 | 0.0% | View All 62 Rows |
Sex and Age in Union County
Sex and Age in Union County
The most populous age groups in Union County are 15 to 19 Years (2,310 | 10.0%) for men and 15 to 19 Years (2,047 | 10.4%) for women.
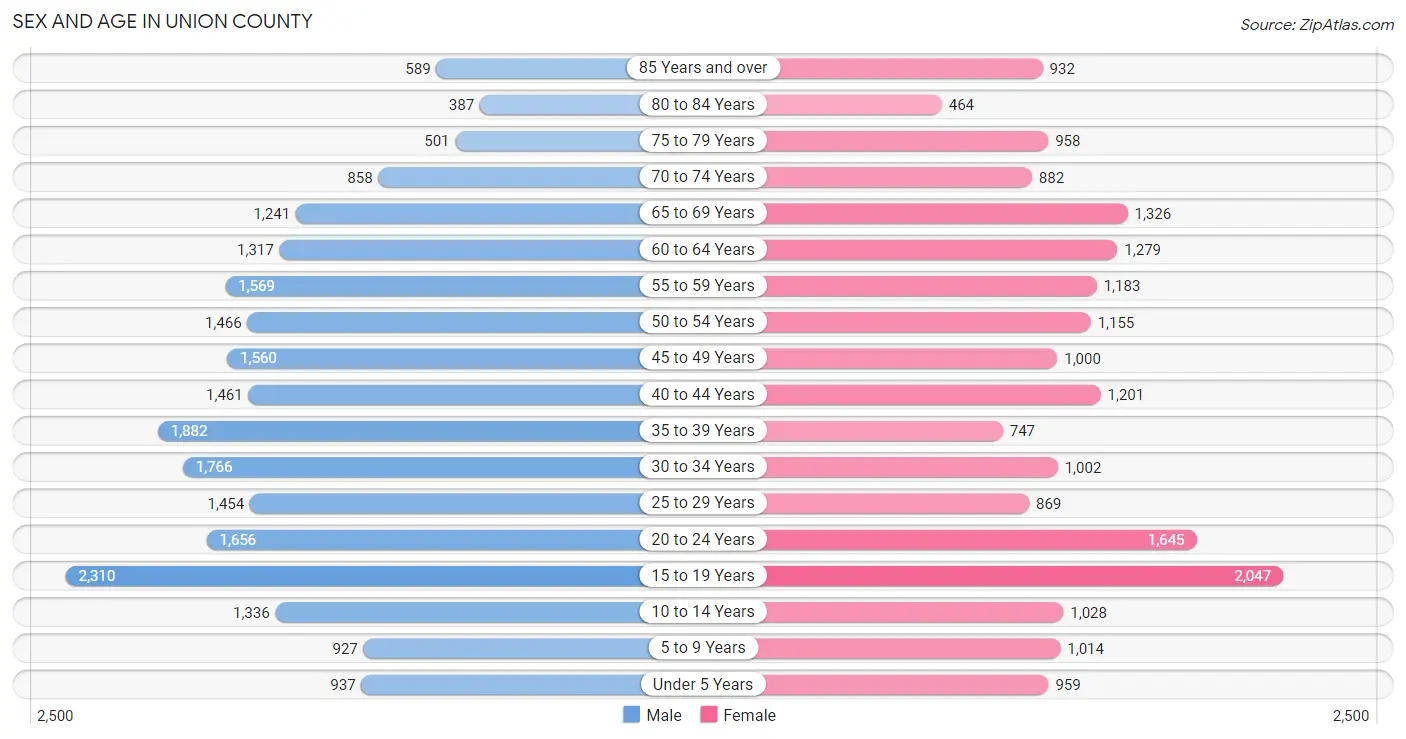
| Age Bracket | Male | Female |
| Under 5 Years | 937 (4.0%) | 959 (4.9%) |
| 5 to 9 Years | 927 (4.0%) | 1,014 (5.1%) |
| 10 to 14 Years | 1,336 (5.8%) | 1,028 (5.2%) |
| 15 to 19 Years | 2,310 (10.0%) | 2,047 (10.4%) |
| 20 to 24 Years | 1,656 (7.1%) | 1,645 (8.4%) |
| 25 to 29 Years | 1,454 (6.3%) | 869 (4.4%) |
| 30 to 34 Years | 1,766 (7.6%) | 1,002 (5.1%) |
| 35 to 39 Years | 1,882 (8.1%) | 747 (3.8%) |
| 40 to 44 Years | 1,461 (6.3%) | 1,201 (6.1%) |
| 45 to 49 Years | 1,560 (6.7%) | 1,000 (5.1%) |
| 50 to 54 Years | 1,466 (6.3%) | 1,155 (5.9%) |
| 55 to 59 Years | 1,569 (6.8%) | 1,183 (6.0%) |
| 60 to 64 Years | 1,317 (5.7%) | 1,279 (6.5%) |
| 65 to 69 Years | 1,241 (5.3%) | 1,326 (6.7%) |
| 70 to 74 Years | 858 (3.7%) | 882 (4.5%) |
| 75 to 79 Years | 501 (2.2%) | 958 (4.9%) |
| 80 to 84 Years | 387 (1.7%) | 464 (2.4%) |
| 85 Years and over | 589 (2.5%) | 932 (4.7%) |
| Total | 23,217 (100.0%) | 19,691 (100.0%) |
Families and Households in Union County
Median Family Size in Union County
The median family size in Union County is 3.02 persons per family, with married-couple families (7,877 | 86.0%) accounting for the largest median family size of 3.07 persons per family. On the other hand, single male/father families (336 | 3.7%) represent the smallest median family size with 2.62 persons per family.
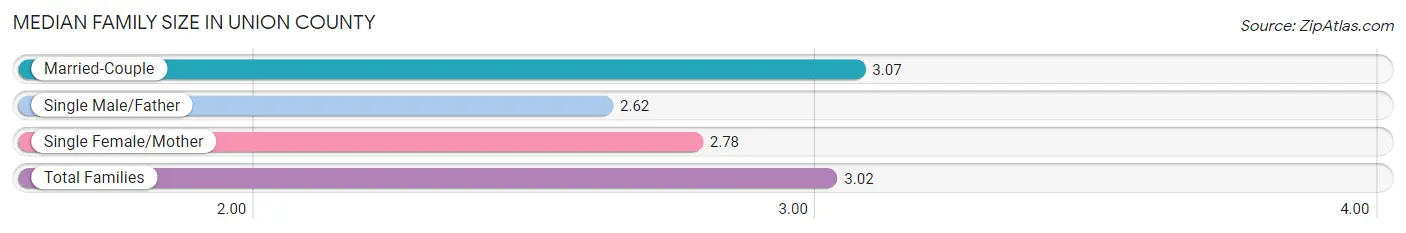
| Family Type | # Families | Family Size |
| Married-Couple | 7,877 (86.0%) | 3.07 |
| Single Male/Father | 336 (3.7%) | 2.62 |
| Single Female/Mother | 943 (10.3%) | 2.78 |
| Total Families | 9,156 (100.0%) | 3.02 |
Median Household Size in Union County
The median household size in Union County is 2.41 persons per household, with married-couple households (7,877 | 55.6%) accounting for the largest median household size of 3.09 persons per household. non-family households (5,016 | 35.4%) represent the smallest median household size with 1.18 persons per household.
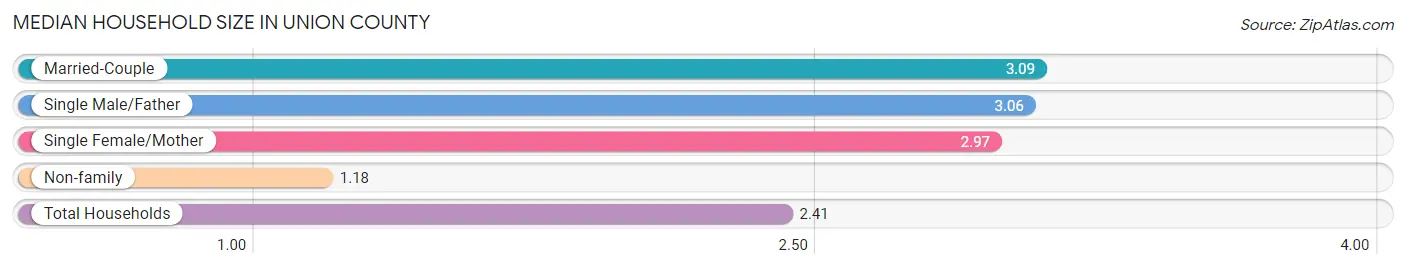
| Household Type | # Households | Household Size |
| Married-Couple | 7,877 (55.6%) | 3.09 |
| Single Male/Father | 336 (2.4%) | 3.06 |
| Single Female/Mother | 943 (6.7%) | 2.97 |
| Non-family | 5,016 (35.4%) | 1.18 |
| Total Households | 14,172 (100.0%) | 2.41 |
Household Size by Marriage Status in Union County
Out of a total of 14,172 households in Union County, 9,156 (64.6%) are family households, while 5,016 (35.4%) are nonfamily households. The most numerous type of family households are 2-person households, comprising 4,814, and the most common type of nonfamily households are 1-person households, comprising 4,364.
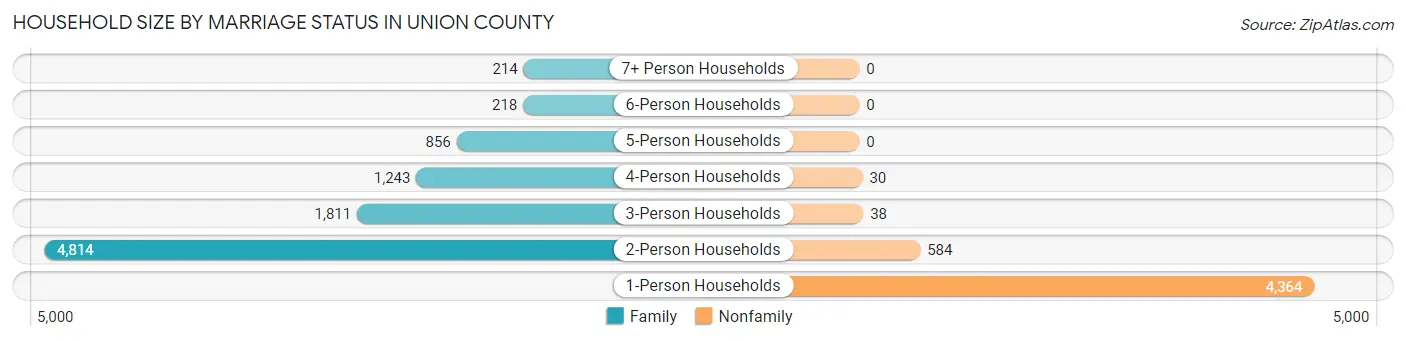
| Household Size | Family Households | Nonfamily Households |
| 1-Person Households | - | 4,364 (30.8%) |
| 2-Person Households | 4,814 (34.0%) | 584 (4.1%) |
| 3-Person Households | 1,811 (12.8%) | 38 (0.3%) |
| 4-Person Households | 1,243 (8.8%) | 30 (0.2%) |
| 5-Person Households | 856 (6.0%) | 0 (0.0%) |
| 6-Person Households | 218 (1.5%) | 0 (0.0%) |
| 7+ Person Households | 214 (1.5%) | 0 (0.0%) |
| Total | 9,156 (64.6%) | 5,016 (35.4%) |
Female Fertility in Union County
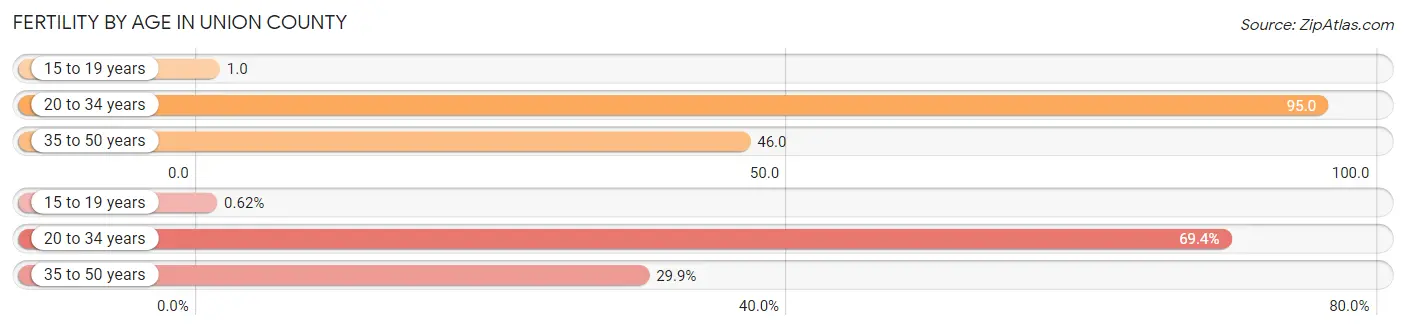
Fertility by Age in Union County
Average fertility rate in Union County is 55.0 births per 1,000 women. Women in the age bracket of 20 to 34 years have the highest fertility rate with 95.0 births per 1,000 women. Women in the age bracket of 20 to 34 years acount for 69.4% of all women with births.
| Age Bracket | Women with Births | Births / 1,000 Women |
| 15 to 19 years | 3 (0.6%) | 1.0 |
| 20 to 34 years | 334 (69.4%) | 95.0 |
| 35 to 50 years | 144 (29.9%) | 46.0 |
| Total | 481 (100.0%) | 55.0 |
Fertility by Age by Marriage Status in Union County
85.2% of women with births (481) in Union County are married. The highest percentage of unmarried women with births falls into 15 to 19 years age bracket with 100.0% of them unmarried at the time of birth, while the lowest percentage of unmarried women with births belong to 20 to 34 years age bracket with 14.1% of them unmarried.
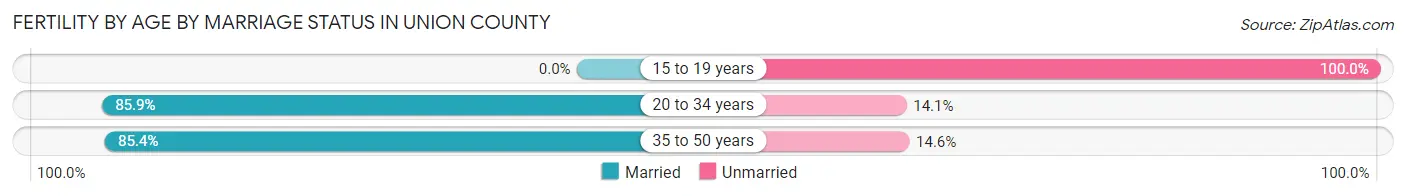
| Age Bracket | Married | Unmarried |
| 15 to 19 years | 0 (0.0%) | 3 (100.0%) |
| 20 to 34 years | 287 (85.9%) | 47 (14.1%) |
| 35 to 50 years | 123 (85.4%) | 21 (14.6%) |
| Total | 410 (85.2%) | 71 (14.8%) |
Fertility by Education in Union County
Average fertility rate in Union County is 55.0 births per 1,000 women. Women with the education attainment of graduate degree have the highest fertility rate of 152.0 births per 1,000 women, while women with the education attainment of college or associate's degree have the lowest fertility at 16.0 births per 1,000 women. Women with the education attainment of high school diploma represent 28.7% of all women with births.
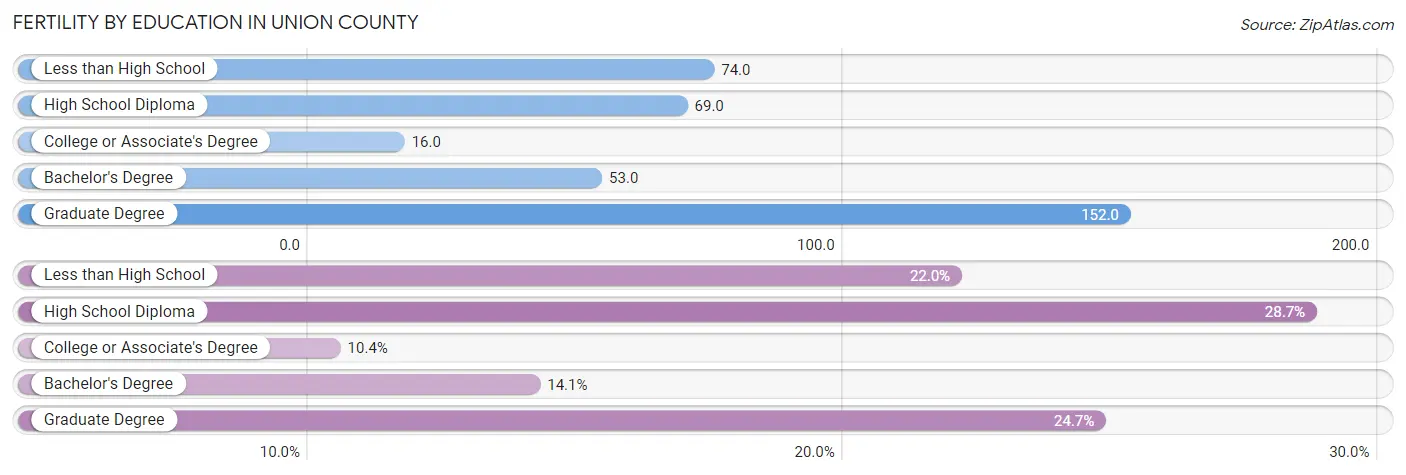
| Educational Attainment | Women with Births | Births / 1,000 Women |
| Less than High School | 106 (22.0%) | 74.0 |
| High School Diploma | 138 (28.7%) | 69.0 |
| College or Associate's Degree | 50 (10.4%) | 16.0 |
| Bachelor's Degree | 68 (14.1%) | 53.0 |
| Graduate Degree | 119 (24.7%) | 152.0 |
| Total | 481 (100.0%) | 55.0 |
Fertility by Education by Marriage Status in Union County
14.8% of women with births in Union County are unmarried. Women with the educational attainment of graduate degree are most likely to be married with 100.0% of them married at childbirth, while women with the educational attainment of high school diploma are least likely to be married with 37.0% of them unmarried at childbirth.
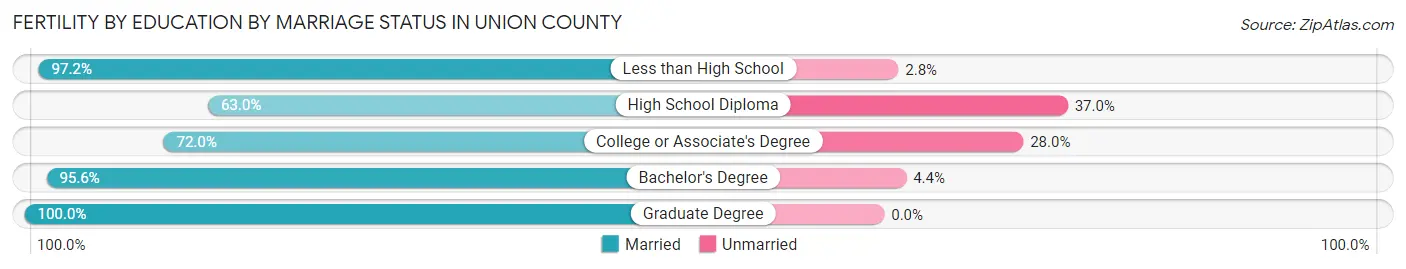
| Educational Attainment | Married | Unmarried |
| Less than High School | 103 (97.2%) | 3 (2.8%) |
| High School Diploma | 87 (63.0%) | 51 (37.0%) |
| College or Associate's Degree | 36 (72.0%) | 14 (28.0%) |
| Bachelor's Degree | 65 (95.6%) | 3 (4.4%) |
| Graduate Degree | 119 (100.0%) | 0 (0.0%) |
| Total | 410 (85.2%) | 71 (14.8%) |
Employment Characteristics in Union County
Employment by Class of Employer in Union County
Among the 16,432 employed individuals in Union County, private company employees (9,059 | 55.1%), not-for-profit organizations (3,454 | 21.0%), and self-employed (not incorporated) (1,330 | 8.1%) make up the most common classes of employment.
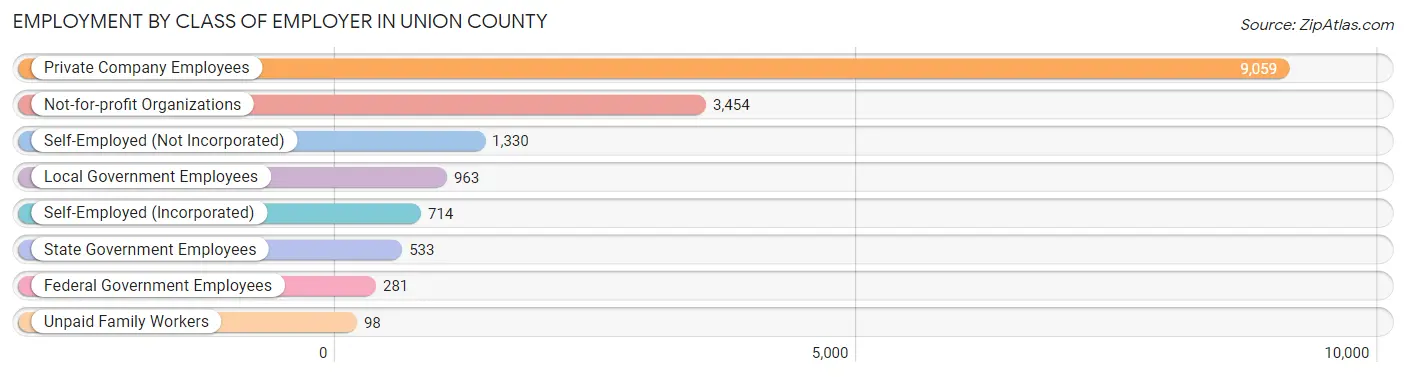
| Employer Class | # Employees | % Employees |
| Private Company Employees | 9,059 | 55.1% |
| Self-Employed (Incorporated) | 714 | 4.3% |
| Self-Employed (Not Incorporated) | 1,330 | 8.1% |
| Not-for-profit Organizations | 3,454 | 21.0% |
| Local Government Employees | 963 | 5.9% |
| State Government Employees | 533 | 3.2% |
| Federal Government Employees | 281 | 1.7% |
| Unpaid Family Workers | 98 | 0.6% |
| Total | 16,432 | 100.0% |
Employment Status by Age in Union County
According to the labor force statistics for Union County, out of the total population over 16 years of age (36,344), 48.1% or 17,481 individuals are in the labor force, with 3.5% or 612 of them unemployed. The age group with the highest labor force participation rate is 45 to 54 years, with 69.0% or 3,575 individuals in the labor force. Within the labor force, the 16 to 19 years age range has the highest percentage of unemployed individuals, with 13.0% or 188 of them being unemployed.
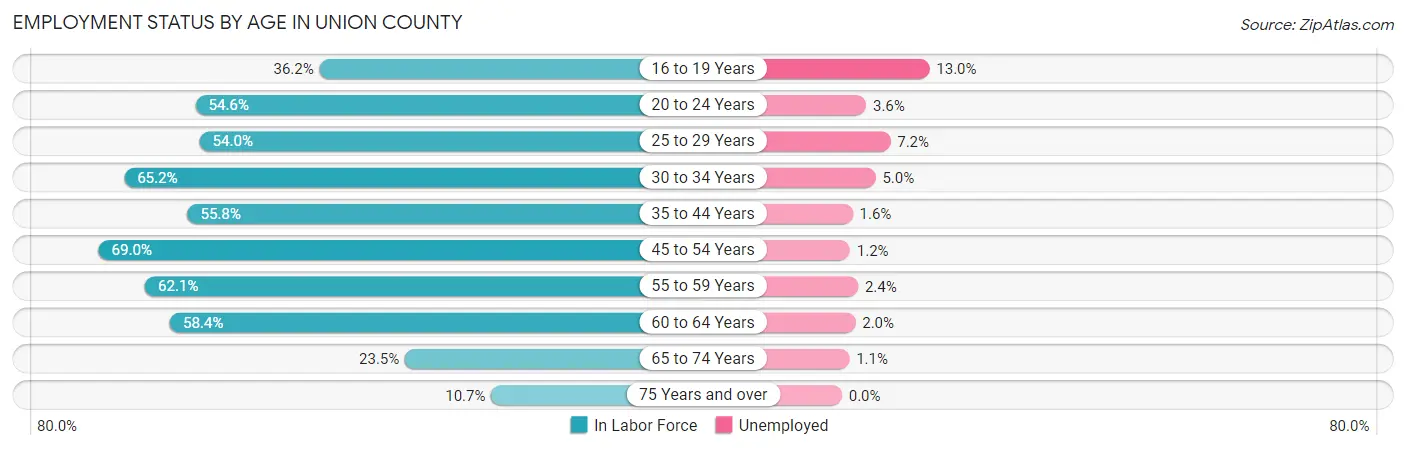
| Age Bracket | In Labor Force | Unemployed |
| 16 to 19 Years | 1,446 (36.2%) | 188 (13.0%) |
| 20 to 24 Years | 1,802 (54.6%) | 65 (3.6%) |
| 25 to 29 Years | 1,254 (54.0%) | 90 (7.2%) |
| 30 to 34 Years | 1,805 (65.2%) | 90 (5.0%) |
| 35 to 44 Years | 2,952 (55.8%) | 47 (1.6%) |
| 45 to 54 Years | 3,575 (69.0%) | 43 (1.2%) |
| 55 to 59 Years | 1,709 (62.1%) | 41 (2.4%) |
| 60 to 64 Years | 1,516 (58.4%) | 30 (2.0%) |
| 65 to 74 Years | 1,012 (23.5%) | 11 (1.1%) |
| 75 Years and over | 410 (10.7%) | 0 (0.0%) |
| Total | 17,481 (48.1%) | 612 (3.5%) |
Employment Status by Educational Attainment in Union County
According to labor force statistics for Union County, 61.3% of individuals (12,818) out of the total population between 25 and 64 years of age (20,911) are in the labor force, with 2.7% or 346 of them being unemployed. The group with the highest labor force participation rate are those with the educational attainment of bachelor's degree or higher, with 85.5% or 4,489 individuals in the labor force. Within the labor force, individuals with less than high school education have the highest percentage of unemployment, with 6.4% or 66 of them being unemployed.
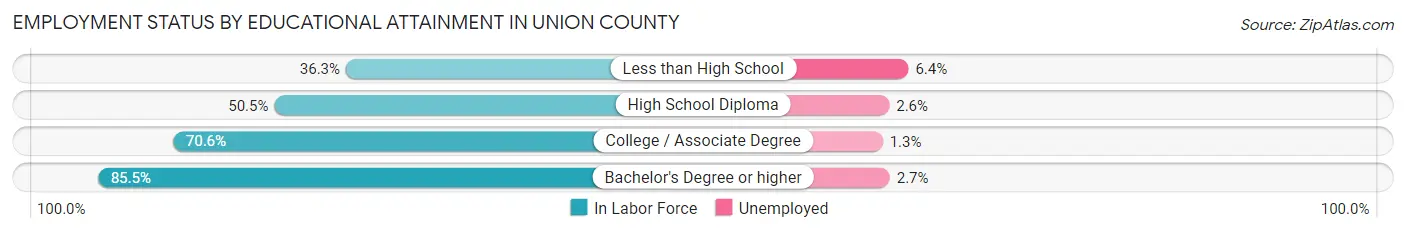
| Educational Attainment | In Labor Force | Unemployed |
| Less than High School | 1,034 (36.3%) | 182 (6.4%) |
| High School Diploma | 4,428 (50.5%) | 228 (2.6%) |
| College / Associate Degree | 2,855 (70.6%) | 53 (1.3%) |
| Bachelor's Degree or higher | 4,489 (85.5%) | 142 (2.7%) |
| Total | 12,818 (61.3%) | 565 (2.7%) |
Employment Occupations by Sex in Union County
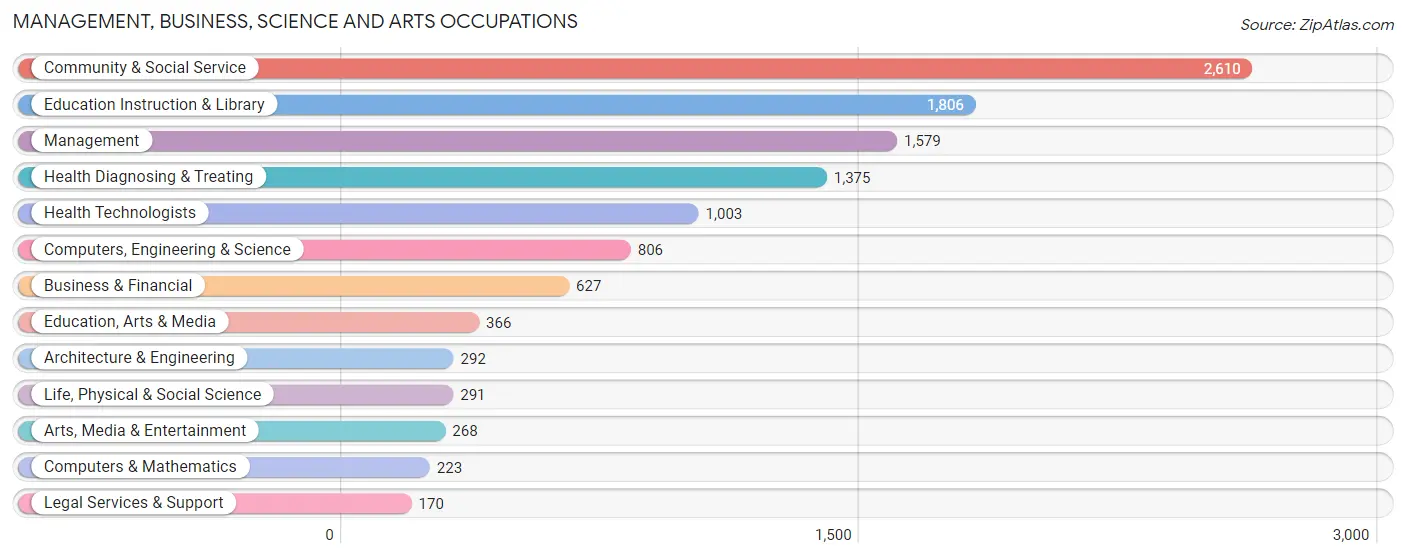
Management, Business, Science and Arts Occupations
The most common Management, Business, Science and Arts occupations in Union County are Community & Social Service (2,610 | 15.5%), Education Instruction & Library (1,806 | 10.7%), Management (1,579 | 9.4%), Health Diagnosing & Treating (1,375 | 8.2%), and Health Technologists (1,003 | 5.9%).
Management, Business, Science and Arts Occupations by Sex
Within the Management, Business, Science and Arts occupations in Union County, the most male-oriented occupations are Computers & Mathematics (91.5%), Architecture & Engineering (69.5%), and Computers, Engineering & Science (67.5%), while the most female-oriented occupations are Health Diagnosing & Treating (73.9%), Health Technologists (69.2%), and Legal Services & Support (68.8%).
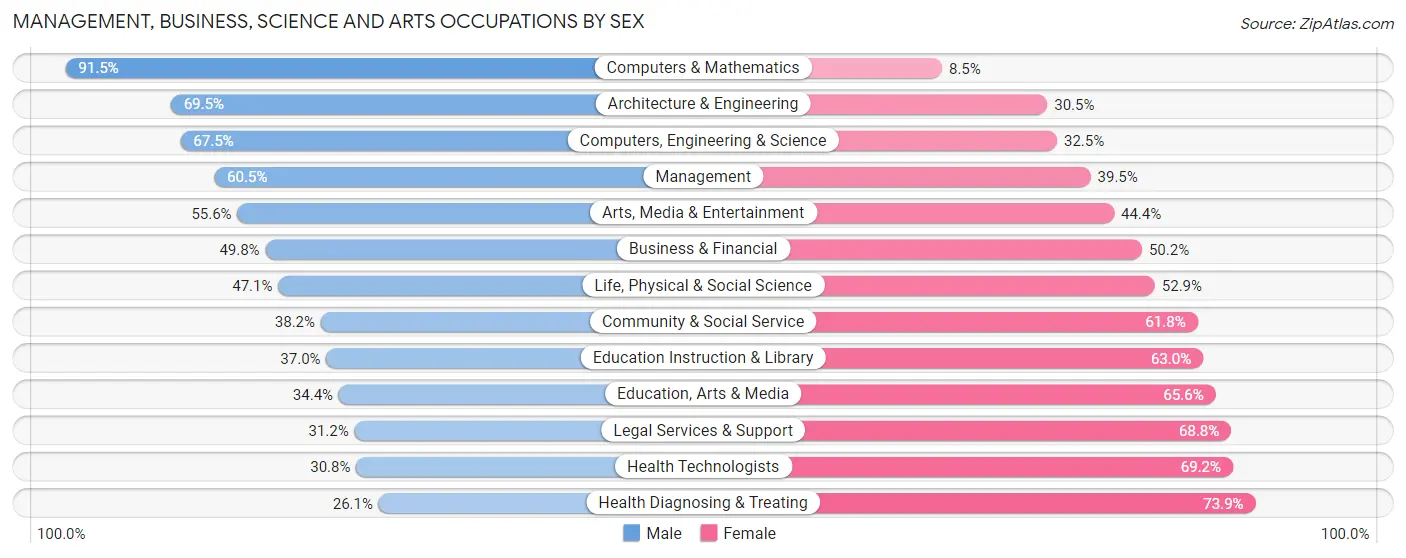
| Occupation | Male | Female |
| Management | 955 (60.5%) | 624 (39.5%) |
| Business & Financial | 312 (49.8%) | 315 (50.2%) |
| Computers, Engineering & Science | 544 (67.5%) | 262 (32.5%) |
| Computers & Mathematics | 204 (91.5%) | 19 (8.5%) |
| Architecture & Engineering | 203 (69.5%) | 89 (30.5%) |
| Life, Physical & Social Science | 137 (47.1%) | 154 (52.9%) |
| Community & Social Service | 997 (38.2%) | 1,613 (61.8%) |
| Education, Arts & Media | 126 (34.4%) | 240 (65.6%) |
| Legal Services & Support | 53 (31.2%) | 117 (68.8%) |
| Education Instruction & Library | 669 (37.0%) | 1,137 (63.0%) |
| Arts, Media & Entertainment | 149 (55.6%) | 119 (44.4%) |
| Health Diagnosing & Treating | 359 (26.1%) | 1,016 (73.9%) |
| Health Technologists | 309 (30.8%) | 694 (69.2%) |
| Total (Category) | 3,167 (45.3%) | 3,830 (54.7%) |
| Total (Overall) | 8,766 (51.9%) | 8,110 (48.1%) |
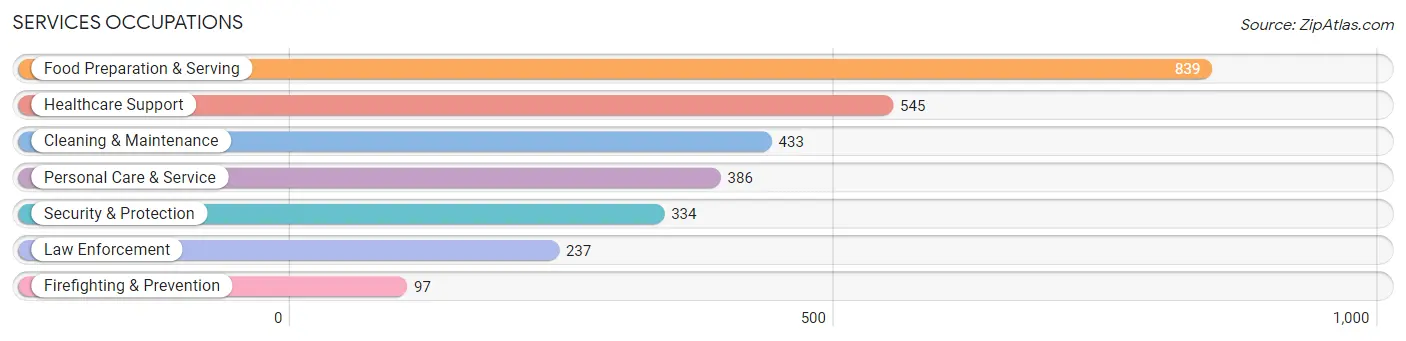
Services Occupations
The most common Services occupations in Union County are Food Preparation & Serving (839 | 5.0%), Healthcare Support (545 | 3.2%), Cleaning & Maintenance (433 | 2.6%), Personal Care & Service (386 | 2.3%), and Security & Protection (334 | 2.0%).
Services Occupations by Sex
Within the Services occupations in Union County, the most male-oriented occupations are Law Enforcement (91.6%), Security & Protection (70.1%), and Food Preparation & Serving (33.1%), while the most female-oriented occupations are Healthcare Support (89.0%), Firefighting & Prevention (82.5%), and Personal Care & Service (71.0%).
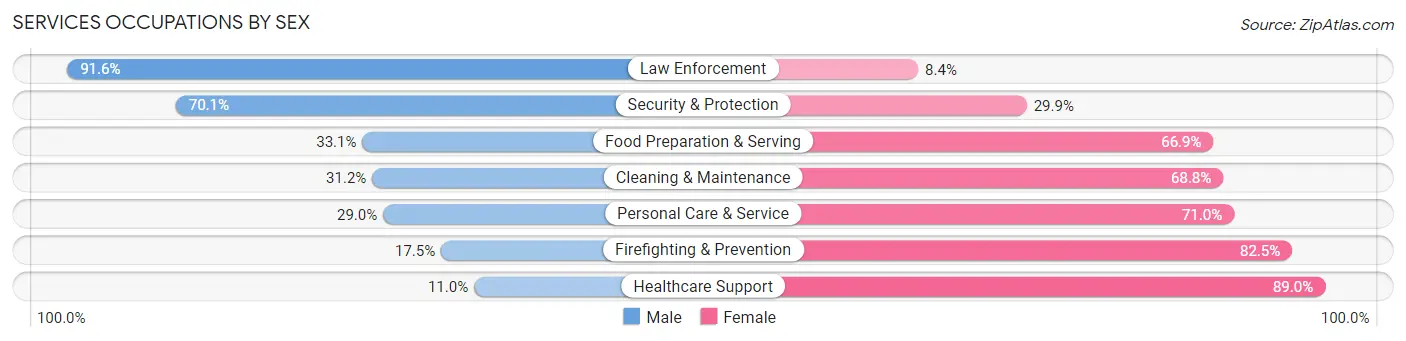
| Occupation | Male | Female |
| Healthcare Support | 60 (11.0%) | 485 (89.0%) |
| Security & Protection | 234 (70.1%) | 100 (29.9%) |
| Firefighting & Prevention | 17 (17.5%) | 80 (82.5%) |
| Law Enforcement | 217 (91.6%) | 20 (8.4%) |
| Food Preparation & Serving | 278 (33.1%) | 561 (66.9%) |
| Cleaning & Maintenance | 135 (31.2%) | 298 (68.8%) |
| Personal Care & Service | 112 (29.0%) | 274 (71.0%) |
| Total (Category) | 819 (32.3%) | 1,718 (67.7%) |
| Total (Overall) | 8,766 (51.9%) | 8,110 (48.1%) |
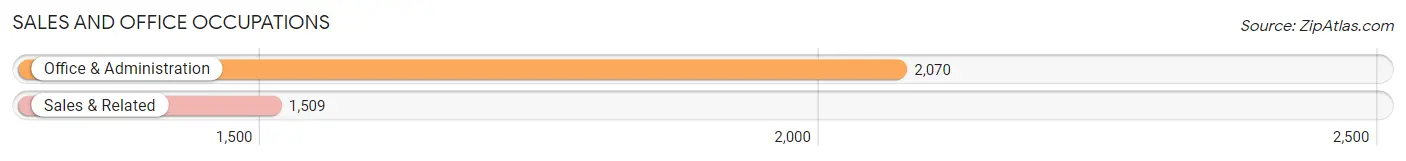
Sales and Office Occupations
The most common Sales and Office occupations in Union County are Office & Administration (2,070 | 12.3%), and Sales & Related (1,509 | 8.9%).
Sales and Office Occupations by Sex
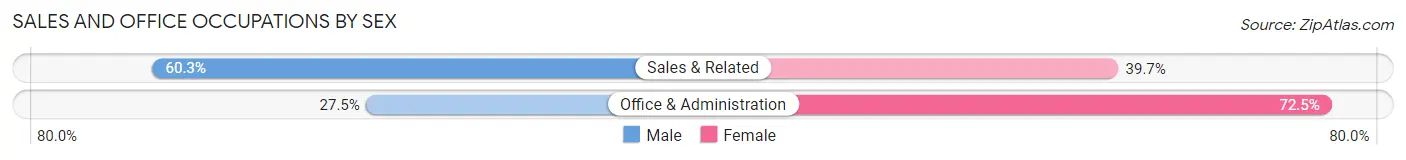
| Occupation | Male | Female |
| Sales & Related | 910 (60.3%) | 599 (39.7%) |
| Office & Administration | 570 (27.5%) | 1,500 (72.5%) |
| Total (Category) | 1,480 (41.3%) | 2,099 (58.7%) |
| Total (Overall) | 8,766 (51.9%) | 8,110 (48.1%) |
Natural Resources, Construction and Maintenance Occupations
The most common Natural Resources, Construction and Maintenance occupations in Union County are Construction & Extraction (747 | 4.4%), Installation, Maintenance & Repair (641 | 3.8%), and Farming, Fishing & Forestry (150 | 0.9%).
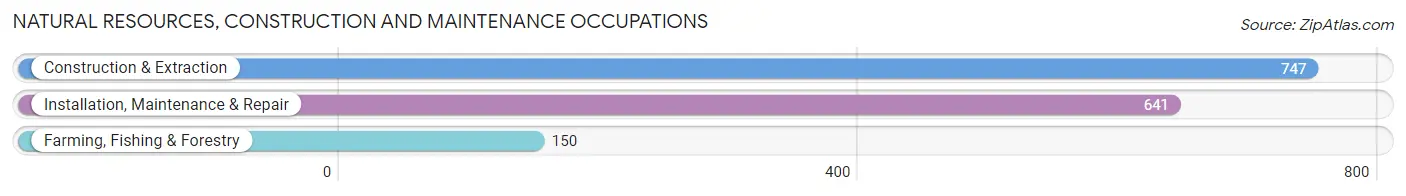
Natural Resources, Construction and Maintenance Occupations by Sex
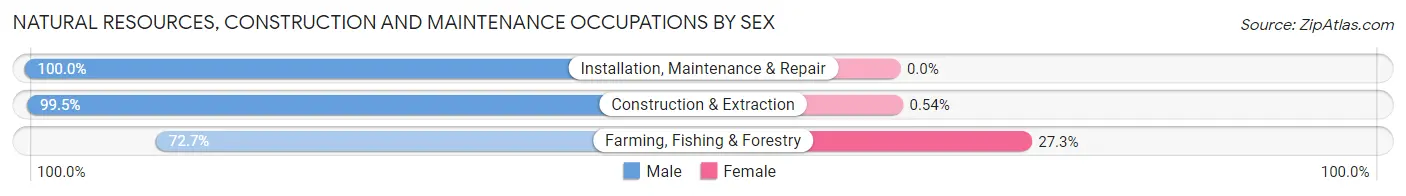
| Occupation | Male | Female |
| Farming, Fishing & Forestry | 109 (72.7%) | 41 (27.3%) |
| Construction & Extraction | 743 (99.5%) | 4 (0.5%) |
| Installation, Maintenance & Repair | 641 (100.0%) | 0 (0.0%) |
| Total (Category) | 1,493 (97.1%) | 45 (2.9%) |
| Total (Overall) | 8,766 (51.9%) | 8,110 (48.1%) |
Production, Transportation and Moving Occupations
The most common Production, Transportation and Moving occupations in Union County are Production (919 | 5.4%), Material Moving (743 | 4.4%), and Transportation (563 | 3.3%).
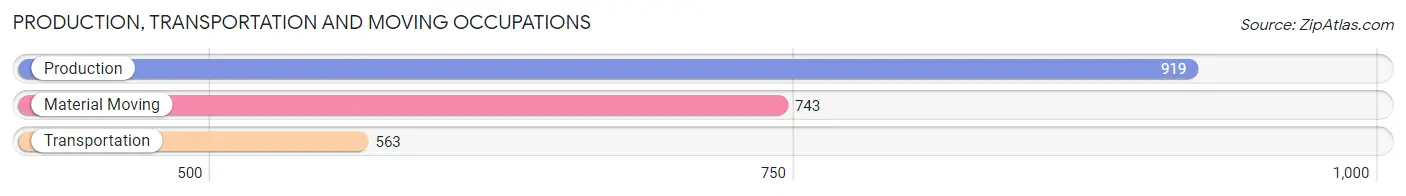
Production, Transportation and Moving Occupations by Sex
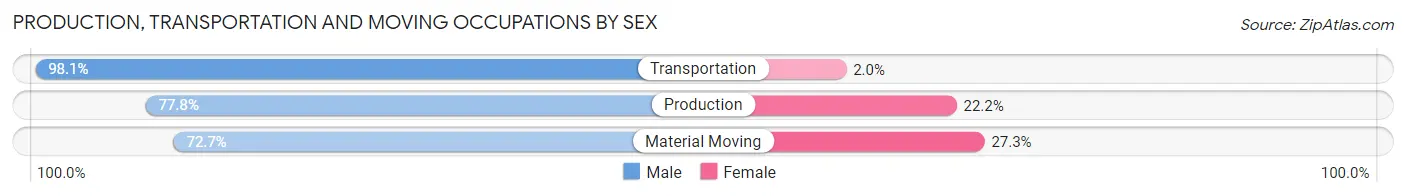
| Occupation | Male | Female |
| Production | 715 (77.8%) | 204 (22.2%) |
| Transportation | 552 (98.1%) | 11 (1.9%) |
| Material Moving | 540 (72.7%) | 203 (27.3%) |
| Total (Category) | 1,807 (81.2%) | 418 (18.8%) |
| Total (Overall) | 8,766 (51.9%) | 8,110 (48.1%) |
Employment Industries by Sex in Union County
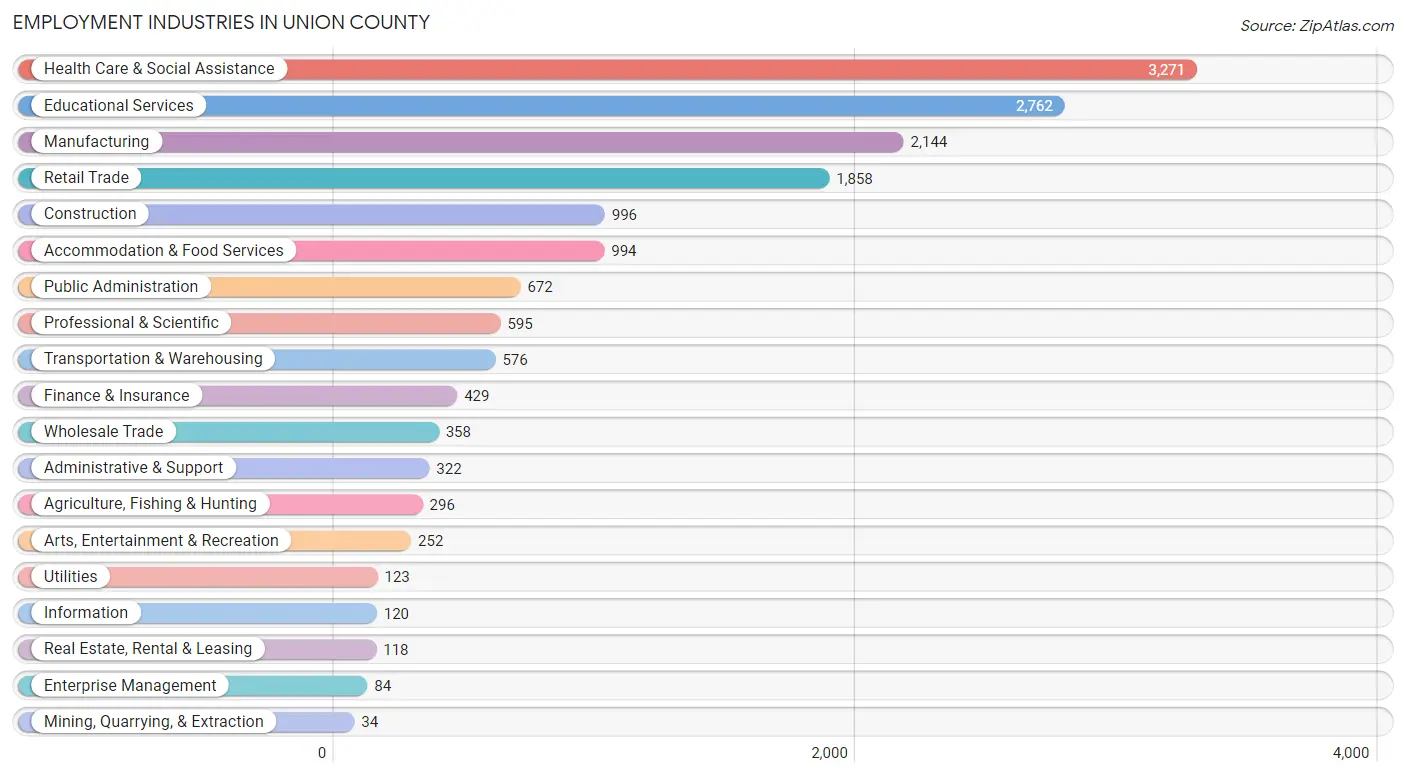
Employment Industries in Union County
The major employment industries in Union County include Health Care & Social Assistance (3,271 | 19.4%), Educational Services (2,762 | 16.4%), Manufacturing (2,144 | 12.7%), Retail Trade (1,858 | 11.0%), and Construction (996 | 5.9%).
Employment Industries by Sex in Union County
The Union County industries that see more men than women are Construction (94.4%), Wholesale Trade (91.3%), and Agriculture, Fishing & Hunting (80.4%), whereas the industries that tend to have a higher number of women are Enterprise Management (90.5%), Health Care & Social Assistance (77.0%), and Finance & Insurance (76.0%).
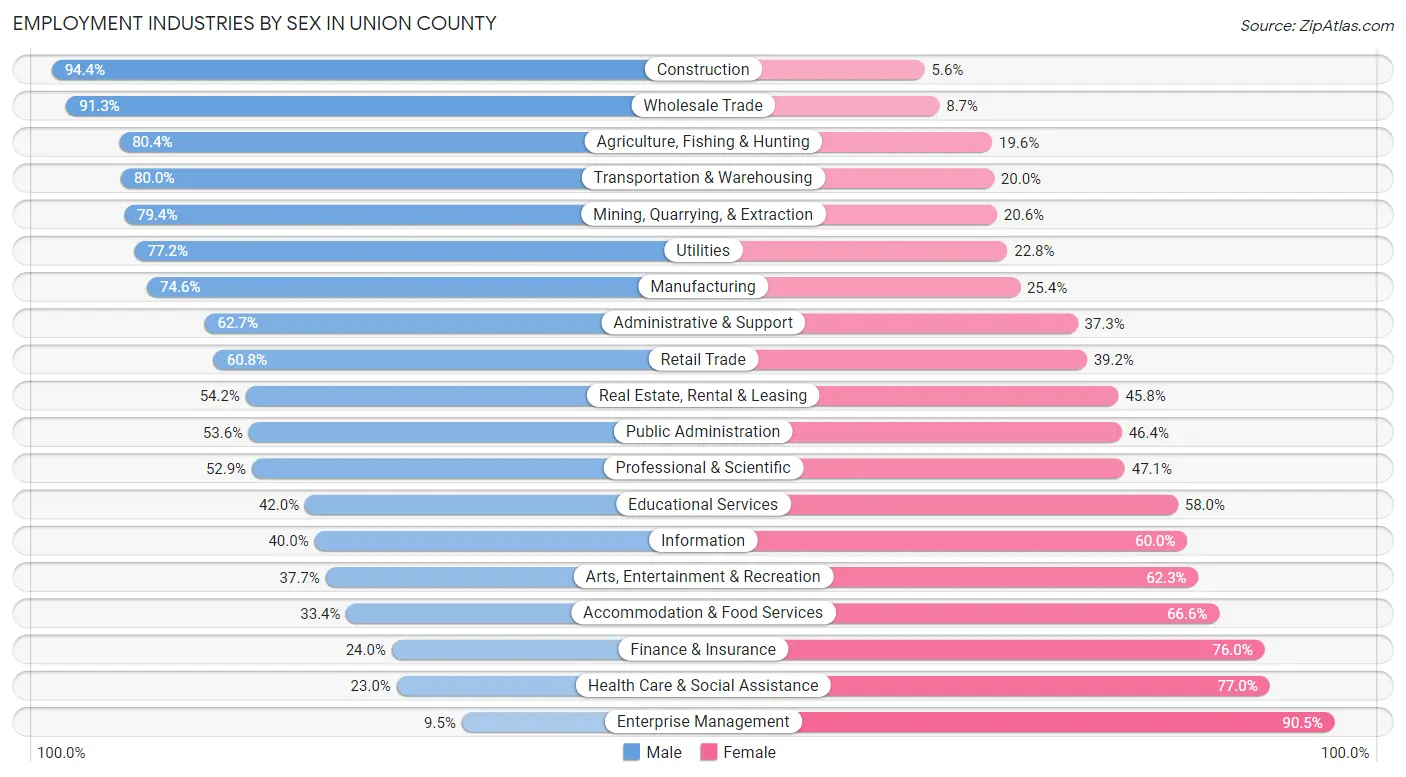
| Industry | Male | Female |
| Agriculture, Fishing & Hunting | 238 (80.4%) | 58 (19.6%) |
| Mining, Quarrying, & Extraction | 27 (79.4%) | 7 (20.6%) |
| Construction | 940 (94.4%) | 56 (5.6%) |
| Manufacturing | 1,600 (74.6%) | 544 (25.4%) |
| Wholesale Trade | 327 (91.3%) | 31 (8.7%) |
| Retail Trade | 1,130 (60.8%) | 728 (39.2%) |
| Transportation & Warehousing | 461 (80.0%) | 115 (20.0%) |
| Utilities | 95 (77.2%) | 28 (22.8%) |
| Information | 48 (40.0%) | 72 (60.0%) |
| Finance & Insurance | 103 (24.0%) | 326 (76.0%) |
| Real Estate, Rental & Leasing | 64 (54.2%) | 54 (45.8%) |
| Professional & Scientific | 315 (52.9%) | 280 (47.1%) |
| Enterprise Management | 8 (9.5%) | 76 (90.5%) |
| Administrative & Support | 202 (62.7%) | 120 (37.3%) |
| Educational Services | 1,159 (42.0%) | 1,603 (58.0%) |
| Health Care & Social Assistance | 752 (23.0%) | 2,519 (77.0%) |
| Arts, Entertainment & Recreation | 95 (37.7%) | 157 (62.3%) |
| Accommodation & Food Services | 332 (33.4%) | 662 (66.6%) |
| Public Administration | 360 (53.6%) | 312 (46.4%) |
| Total | 8,766 (51.9%) | 8,110 (48.1%) |
Education in Union County
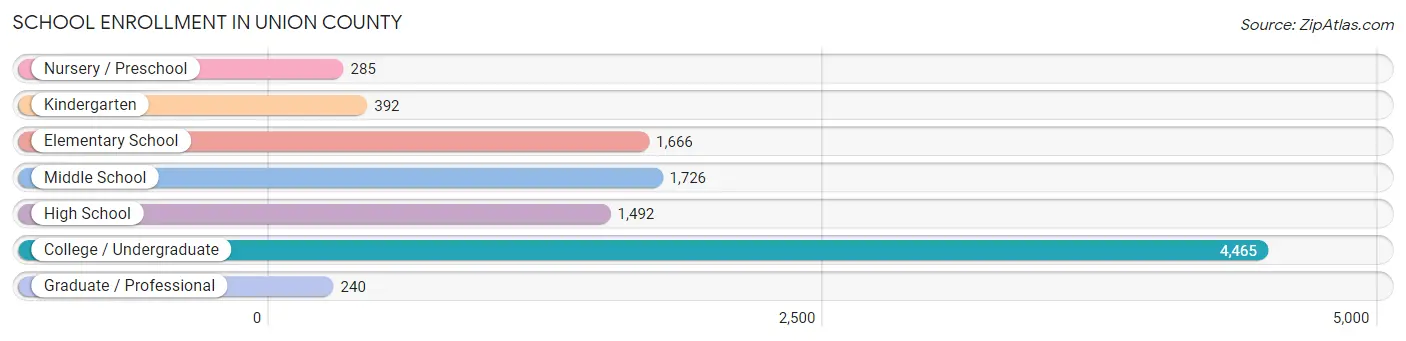
School Enrollment in Union County
The most common levels of schooling among the 10,266 students in Union County are college / undergraduate (4,465 | 43.5%), middle school (1,726 | 16.8%), and elementary school (1,666 | 16.2%).
| School Level | # Students | % Students |
| Nursery / Preschool | 285 | 2.8% |
| Kindergarten | 392 | 3.8% |
| Elementary School | 1,666 | 16.2% |
| Middle School | 1,726 | 16.8% |
| High School | 1,492 | 14.5% |
| College / Undergraduate | 4,465 | 43.5% |
| Graduate / Professional | 240 | 2.3% |
| Total | 10,266 | 100.0% |
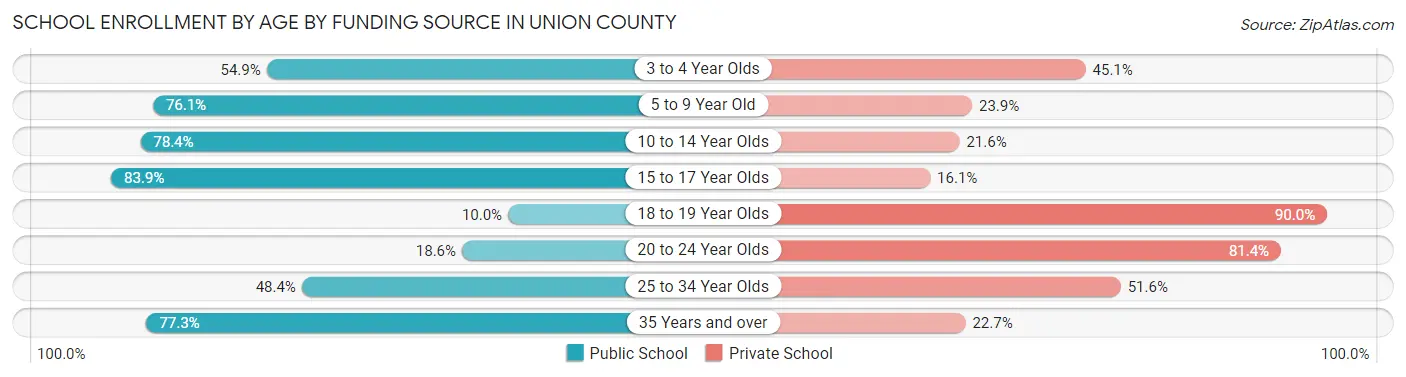
School Enrollment by Age by Funding Source in Union County
Out of a total of 10,266 students who are enrolled in schools in Union County, 5,174 (50.4%) attend a private institution, while the remaining 5,092 (49.6%) are enrolled in public schools. The age group of 18 to 19 year olds has the highest likelihood of being enrolled in private schools, with 2,221 (90.0% in the age bracket) enrolled. Conversely, the age group of 15 to 17 year olds has the lowest likelihood of being enrolled in a private school, with 927 (83.9% in the age bracket) attending a public institution.
| Age Bracket | Public School | Private School |
| 3 to 4 Year Olds | 139 (54.9%) | 114 (45.1%) |
| 5 to 9 Year Old | 1,349 (76.1%) | 424 (23.9%) |
| 10 to 14 Year Olds | 1,760 (78.4%) | 484 (21.6%) |
| 15 to 17 Year Olds | 927 (83.9%) | 178 (16.1%) |
| 18 to 19 Year Olds | 246 (10.0%) | 2,221 (90.0%) |
| 20 to 24 Year Olds | 354 (18.6%) | 1,553 (81.4%) |
| 25 to 34 Year Olds | 135 (48.4%) | 144 (51.6%) |
| 35 Years and over | 184 (77.3%) | 54 (22.7%) |
| Total | 5,092 (49.6%) | 5,174 (50.4%) |
Educational Attainment by Field of Study in Union County
Science & technology (1,092 | 13.6%), education (1,076 | 13.4%), business (767 | 9.6%), arts & humanities (652 | 8.2%), and bio, nature & agricultural (558 | 7.0%) are the most common fields of study among 8,004 individuals in Union County who have obtained a bachelor's degree or higher.
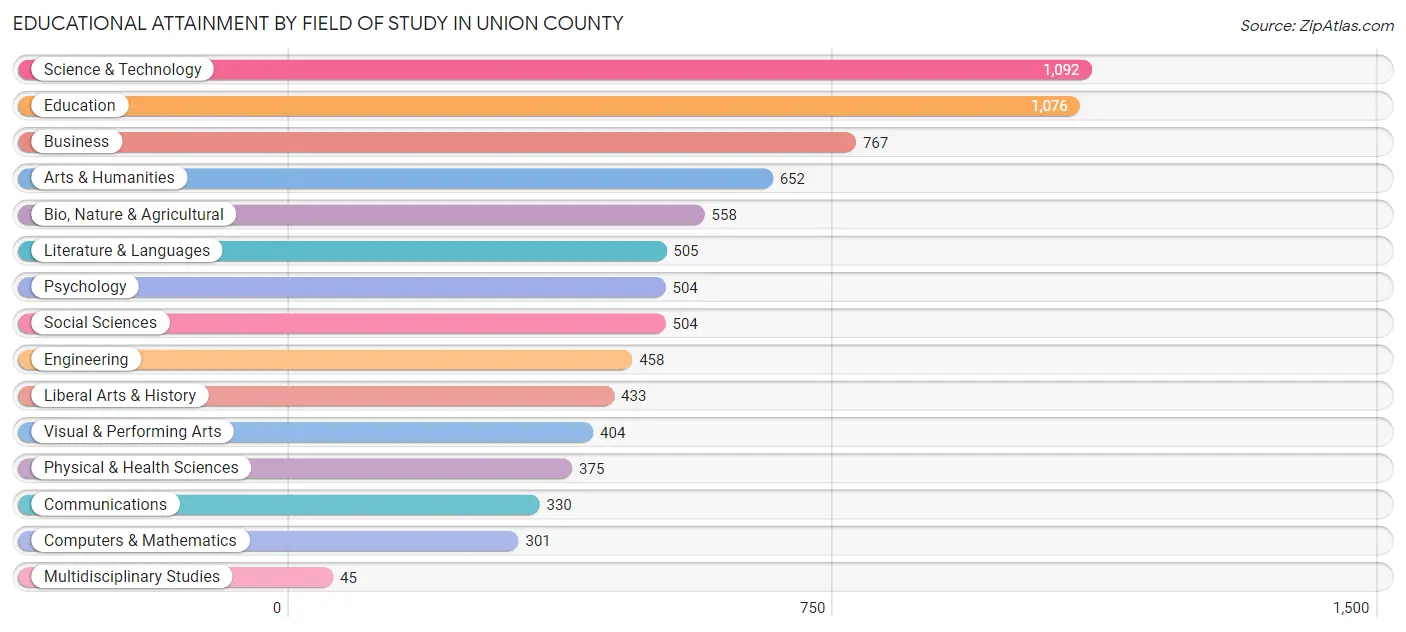
| Field of Study | # Graduates | % Graduates |
| Computers & Mathematics | 301 | 3.8% |
| Bio, Nature & Agricultural | 558 | 7.0% |
| Physical & Health Sciences | 375 | 4.7% |
| Psychology | 504 | 6.3% |
| Social Sciences | 504 | 6.3% |
| Engineering | 458 | 5.7% |
| Multidisciplinary Studies | 45 | 0.6% |
| Science & Technology | 1,092 | 13.6% |
| Business | 767 | 9.6% |
| Education | 1,076 | 13.4% |
| Literature & Languages | 505 | 6.3% |
| Liberal Arts & History | 433 | 5.4% |
| Visual & Performing Arts | 404 | 5.1% |
| Communications | 330 | 4.1% |
| Arts & Humanities | 652 | 8.2% |
| Total | 8,004 | 100.0% |
Transportation & Commute in Union County
Vehicle Availability by Sex in Union County
The most prevalent vehicle ownership categories in Union County are males with 2 vehicles (3,580, accounting for 43.7%) and females with 2 vehicles (2,973, making up 49.5%).
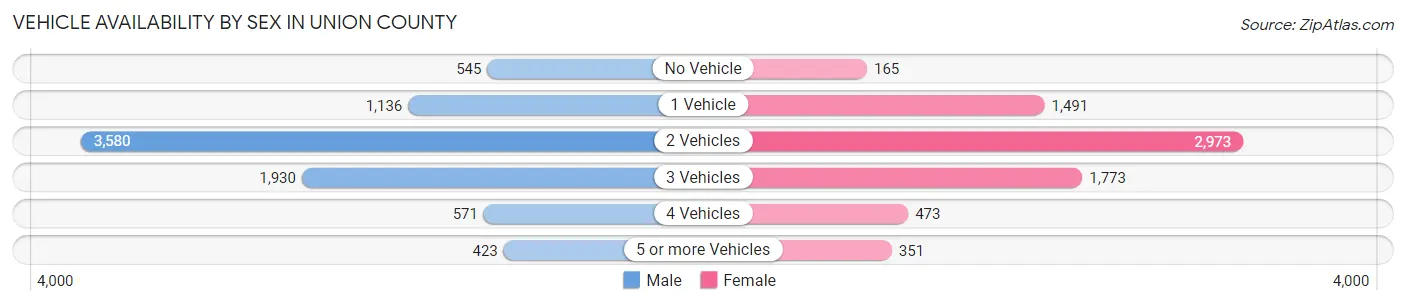
| Vehicles Available | Male | Female |
| No Vehicle | 545 (6.7%) | 165 (2.3%) |
| 1 Vehicle | 1,136 (13.9%) | 1,491 (20.6%) |
| 2 Vehicles | 3,580 (43.7%) | 2,973 (41.1%) |
| 3 Vehicles | 1,930 (23.6%) | 1,773 (24.5%) |
| 4 Vehicles | 571 (7.0%) | 473 (6.6%) |
| 5 or more Vehicles | 423 (5.2%) | 351 (4.9%) |
| Total | 8,185 (100.0%) | 7,226 (100.0%) |
Commute Time in Union County
The most frequently occuring commute durations in Union County are 10 to 14 minutes (2,980 commuters, 19.4%), 15 to 19 minutes (2,905 commuters, 18.9%), and 5 to 9 minutes (2,742 commuters, 17.9%).
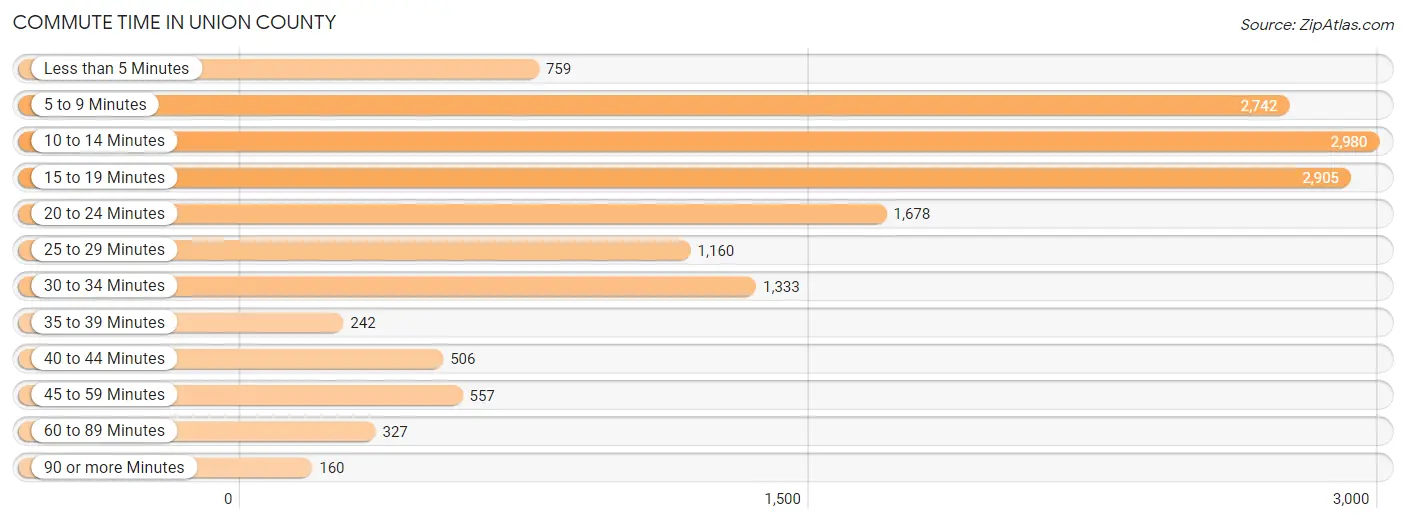
| Commute Time | # Commuters | % Commuters |
| Less than 5 Minutes | 759 | 4.9% |
| 5 to 9 Minutes | 2,742 | 17.9% |
| 10 to 14 Minutes | 2,980 | 19.4% |
| 15 to 19 Minutes | 2,905 | 18.9% |
| 20 to 24 Minutes | 1,678 | 10.9% |
| 25 to 29 Minutes | 1,160 | 7.6% |
| 30 to 34 Minutes | 1,333 | 8.7% |
| 35 to 39 Minutes | 242 | 1.6% |
| 40 to 44 Minutes | 506 | 3.3% |
| 45 to 59 Minutes | 557 | 3.6% |
| 60 to 89 Minutes | 327 | 2.1% |
| 90 or more Minutes | 160 | 1.0% |
Commute Time by Sex in Union County
The most common commute times in Union County are 15 to 19 minutes (1,555 commuters, 19.3%) for males and 10 to 14 minutes (1,470 commuters, 20.2%) for females.
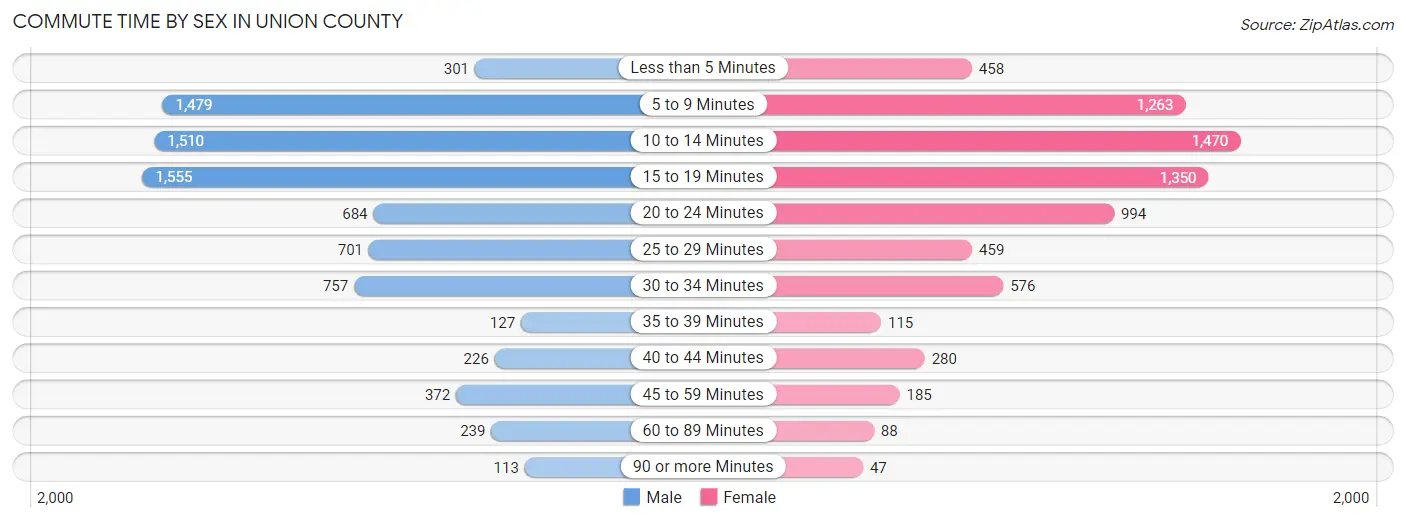
| Commute Time | Male | Female |
| Less than 5 Minutes | 301 (3.7%) | 458 (6.3%) |
| 5 to 9 Minutes | 1,479 (18.3%) | 1,263 (17.3%) |
| 10 to 14 Minutes | 1,510 (18.7%) | 1,470 (20.2%) |
| 15 to 19 Minutes | 1,555 (19.3%) | 1,350 (18.5%) |
| 20 to 24 Minutes | 684 (8.5%) | 994 (13.6%) |
| 25 to 29 Minutes | 701 (8.7%) | 459 (6.3%) |
| 30 to 34 Minutes | 757 (9.4%) | 576 (7.9%) |
| 35 to 39 Minutes | 127 (1.6%) | 115 (1.6%) |
| 40 to 44 Minutes | 226 (2.8%) | 280 (3.8%) |
| 45 to 59 Minutes | 372 (4.6%) | 185 (2.5%) |
| 60 to 89 Minutes | 239 (3.0%) | 88 (1.2%) |
| 90 or more Minutes | 113 (1.4%) | 47 (0.6%) |
Time of Departure to Work by Sex in Union County
The most frequent times of departure to work in Union County are 6:30 AM to 6:59 AM (1,024, 12.7%) for males and 7:00 AM to 7:29 AM (1,138, 15.6%) for females.
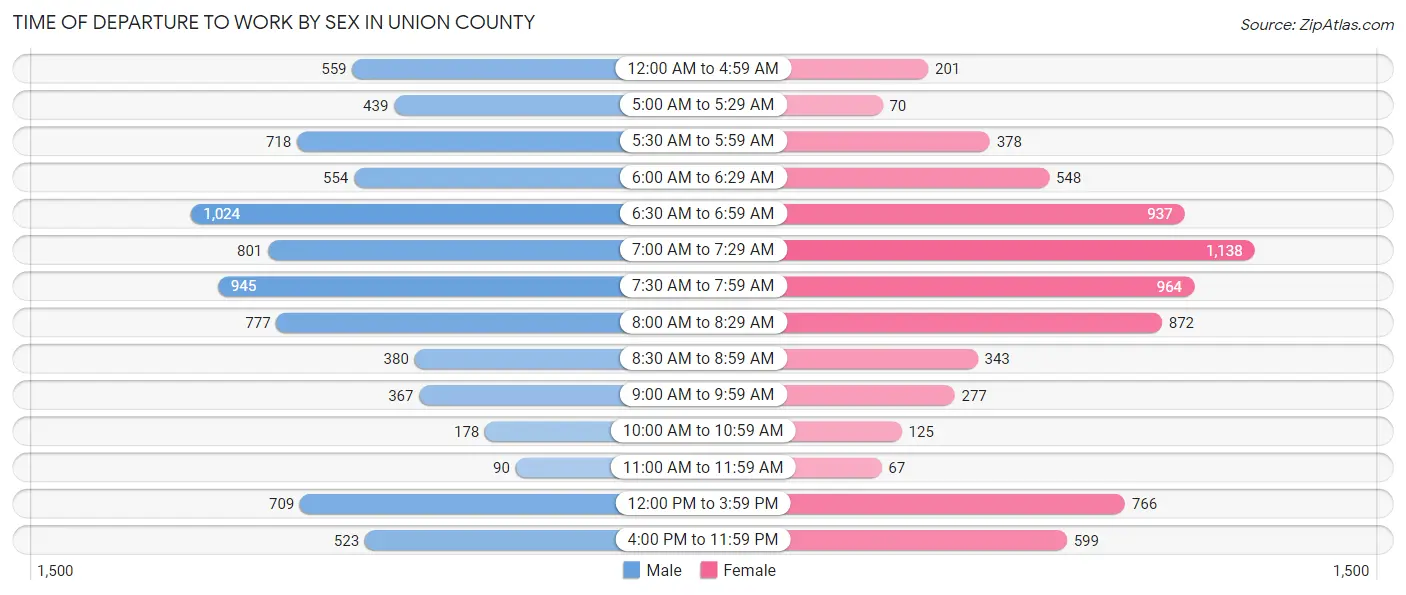
| Time of Departure | Male | Female |
| 12:00 AM to 4:59 AM | 559 (6.9%) | 201 (2.8%) |
| 5:00 AM to 5:29 AM | 439 (5.4%) | 70 (1.0%) |
| 5:30 AM to 5:59 AM | 718 (8.9%) | 378 (5.2%) |
| 6:00 AM to 6:29 AM | 554 (6.9%) | 548 (7.5%) |
| 6:30 AM to 6:59 AM | 1,024 (12.7%) | 937 (12.9%) |
| 7:00 AM to 7:29 AM | 801 (9.9%) | 1,138 (15.6%) |
| 7:30 AM to 7:59 AM | 945 (11.7%) | 964 (13.2%) |
| 8:00 AM to 8:29 AM | 777 (9.6%) | 872 (12.0%) |
| 8:30 AM to 8:59 AM | 380 (4.7%) | 343 (4.7%) |
| 9:00 AM to 9:59 AM | 367 (4.5%) | 277 (3.8%) |
| 10:00 AM to 10:59 AM | 178 (2.2%) | 125 (1.7%) |
| 11:00 AM to 11:59 AM | 90 (1.1%) | 67 (0.9%) |
| 12:00 PM to 3:59 PM | 709 (8.8%) | 766 (10.5%) |
| 4:00 PM to 11:59 PM | 523 (6.5%) | 599 (8.2%) |
| Total | 8,064 (100.0%) | 7,285 (100.0%) |
Housing Occupancy in Union County
Occupancy by Ownership in Union County
Of the total 14,172 dwellings in Union County, owner-occupied units account for 10,156 (71.7%), while renter-occupied units make up 4,016 (28.3%).
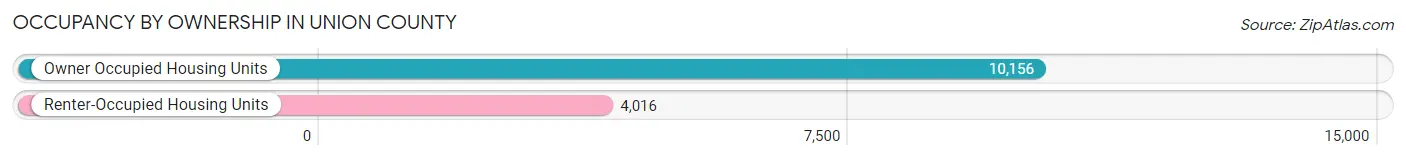
| Occupancy | # Housing Units | % Housing Units |
| Owner Occupied Housing Units | 10,156 | 71.7% |
| Renter-Occupied Housing Units | 4,016 | 28.3% |
| Total Occupied Housing Units | 14,172 | 100.0% |
Occupancy by Household Size in Union County
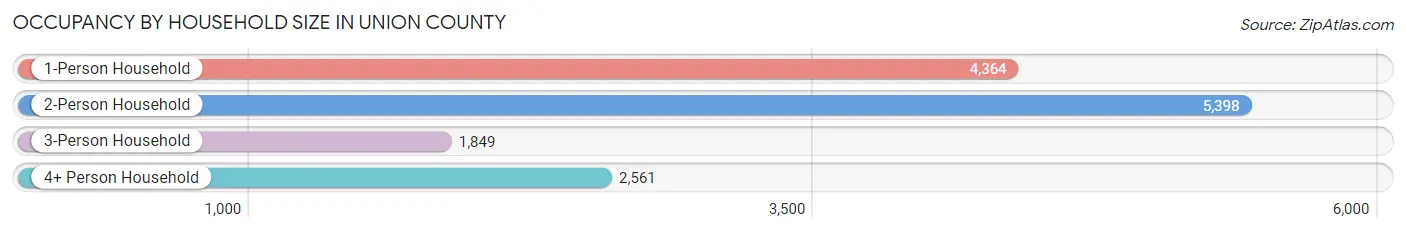
| Household Size | # Housing Units | % Housing Units |
| 1-Person Household | 4,364 | 30.8% |
| 2-Person Household | 5,398 | 38.1% |
| 3-Person Household | 1,849 | 13.1% |
| 4+ Person Household | 2,561 | 18.1% |
| Total Housing Units | 14,172 | 100.0% |
Occupancy by Ownership by Household Size in Union County

| Household Size | Owner-occupied | Renter-occupied |
| 1-Person Household | 2,383 (54.6%) | 1,981 (45.4%) |
| 2-Person Household | 4,081 (75.6%) | 1,317 (24.4%) |
| 3-Person Household | 1,597 (86.4%) | 252 (13.6%) |
| 4+ Person Household | 2,095 (81.8%) | 466 (18.2%) |
| Total Housing Units | 10,156 (71.7%) | 4,016 (28.3%) |
Occupancy by Educational Attainment in Union County
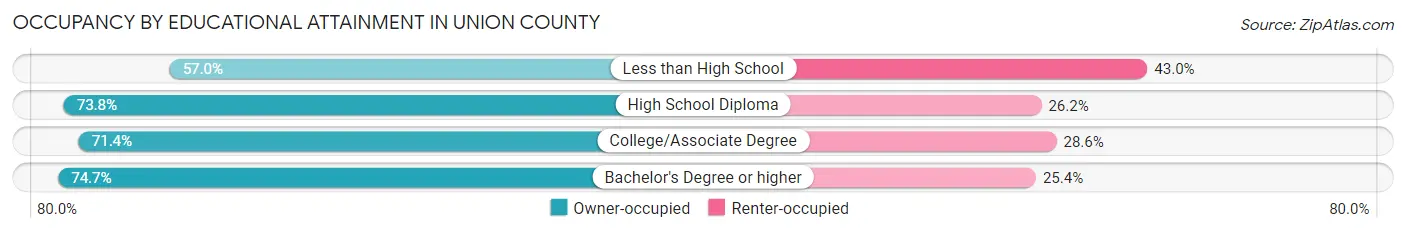
| Household Size | Owner-occupied | Renter-occupied |
| Less than High School | 873 (57.0%) | 659 (43.0%) |
| High School Diploma | 3,746 (73.8%) | 1,331 (26.2%) |
| College/Associate Degree | 2,380 (71.4%) | 954 (28.6%) |
| Bachelor's Degree or higher | 3,157 (74.7%) | 1,072 (25.4%) |
Occupancy by Age of Householder in Union County
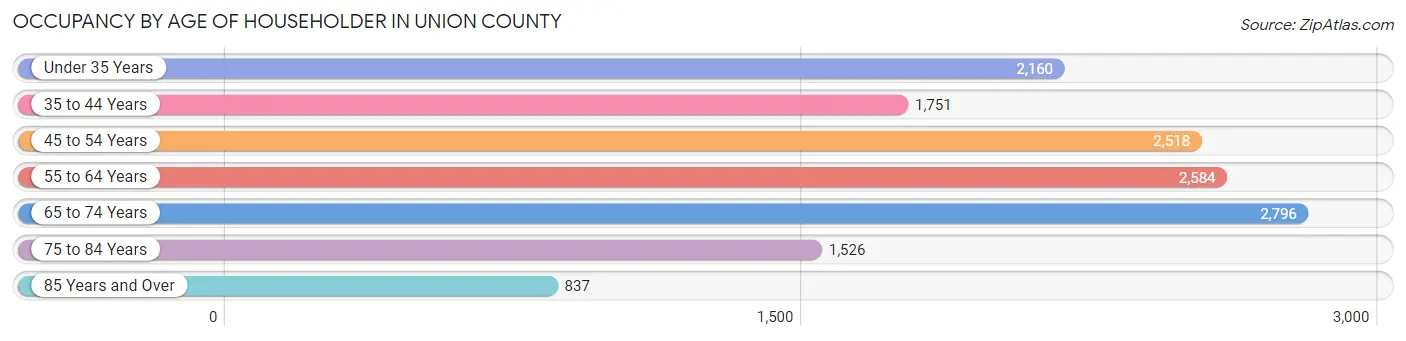
| Age Bracket | # Households | % Households |
| Under 35 Years | 2,160 | 15.2% |
| 35 to 44 Years | 1,751 | 12.4% |
| 45 to 54 Years | 2,518 | 17.8% |
| 55 to 64 Years | 2,584 | 18.2% |
| 65 to 74 Years | 2,796 | 19.7% |
| 75 to 84 Years | 1,526 | 10.8% |
| 85 Years and Over | 837 | 5.9% |
| Total | 14,172 | 100.0% |
Housing Finances in Union County
Median Income by Occupancy in Union County
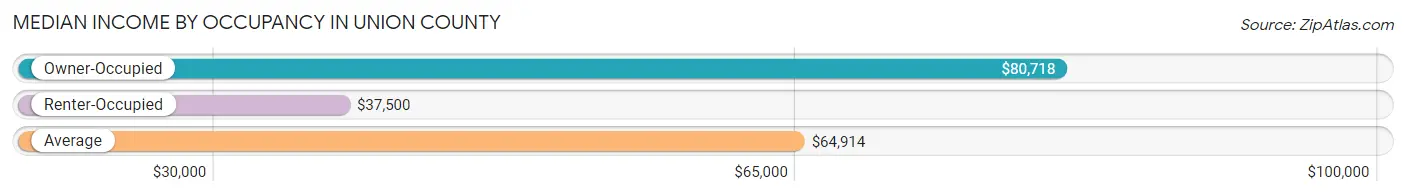
| Occupancy Type | # Households | Median Income |
| Owner-Occupied | 10,156 (71.7%) | $80,718 |
| Renter-Occupied | 4,016 (28.3%) | $37,500 |
| Average | 14,172 (100.0%) | $64,914 |
Occupancy by Householder Income Bracket in Union County
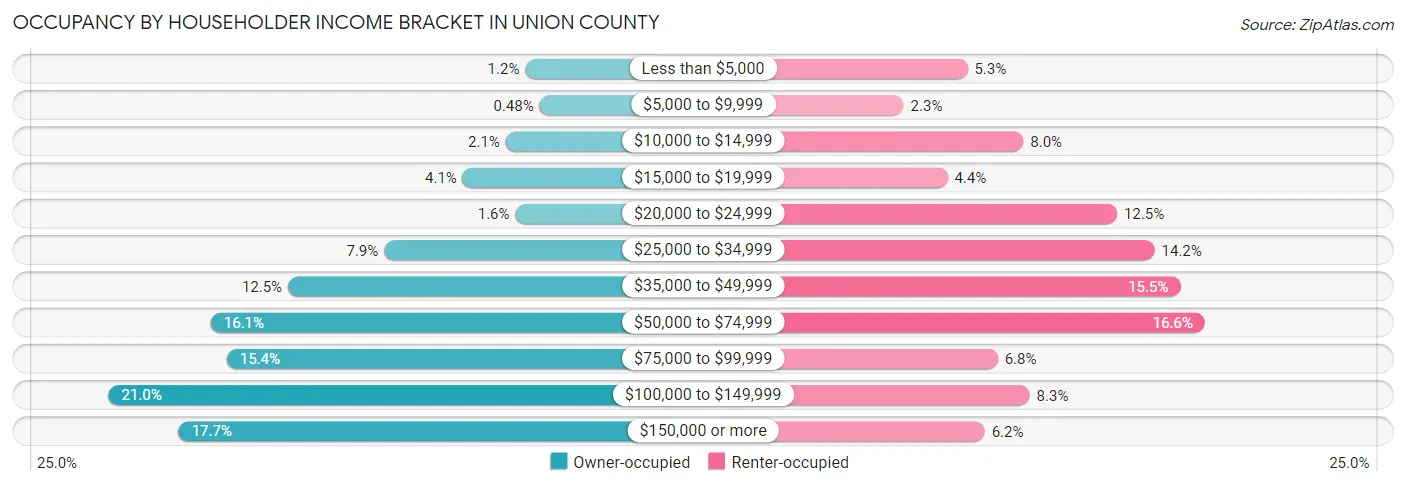
| Income Bracket | Owner-occupied | Renter-occupied |
| Less than $5,000 | 118 (1.2%) | 214 (5.3%) |
| $5,000 to $9,999 | 49 (0.5%) | 92 (2.3%) |
| $10,000 to $14,999 | 212 (2.1%) | 321 (8.0%) |
| $15,000 to $19,999 | 420 (4.1%) | 176 (4.4%) |
| $20,000 to $24,999 | 166 (1.6%) | 500 (12.4%) |
| $25,000 to $34,999 | 800 (7.9%) | 572 (14.2%) |
| $35,000 to $49,999 | 1,265 (12.5%) | 621 (15.5%) |
| $50,000 to $74,999 | 1,638 (16.1%) | 668 (16.6%) |
| $75,000 to $99,999 | 1,561 (15.4%) | 272 (6.8%) |
| $100,000 to $149,999 | 2,133 (21.0%) | 333 (8.3%) |
| $150,000 or more | 1,794 (17.7%) | 247 (6.1%) |
| Total | 10,156 (100.0%) | 4,016 (100.0%) |
Monthly Housing Cost Tiers in Union County
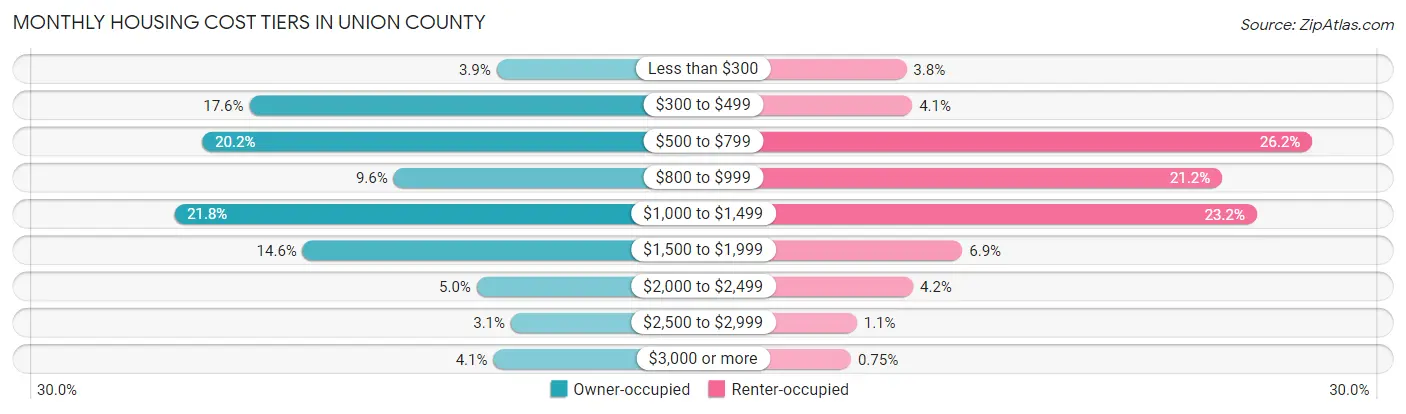
| Monthly Cost | Owner-occupied | Renter-occupied |
| Less than $300 | 399 (3.9%) | 153 (3.8%) |
| $300 to $499 | 1,786 (17.6%) | 166 (4.1%) |
| $500 to $799 | 2,051 (20.2%) | 1,053 (26.2%) |
| $800 to $999 | 977 (9.6%) | 853 (21.2%) |
| $1,000 to $1,499 | 2,209 (21.7%) | 930 (23.2%) |
| $1,500 to $1,999 | 1,487 (14.6%) | 277 (6.9%) |
| $2,000 to $2,499 | 511 (5.0%) | 168 (4.2%) |
| $2,500 to $2,999 | 319 (3.1%) | 43 (1.1%) |
| $3,000 or more | 417 (4.1%) | 30 (0.7%) |
| Total | 10,156 (100.0%) | 4,016 (100.0%) |
Physical Housing Characteristics in Union County
Housing Structures in Union County
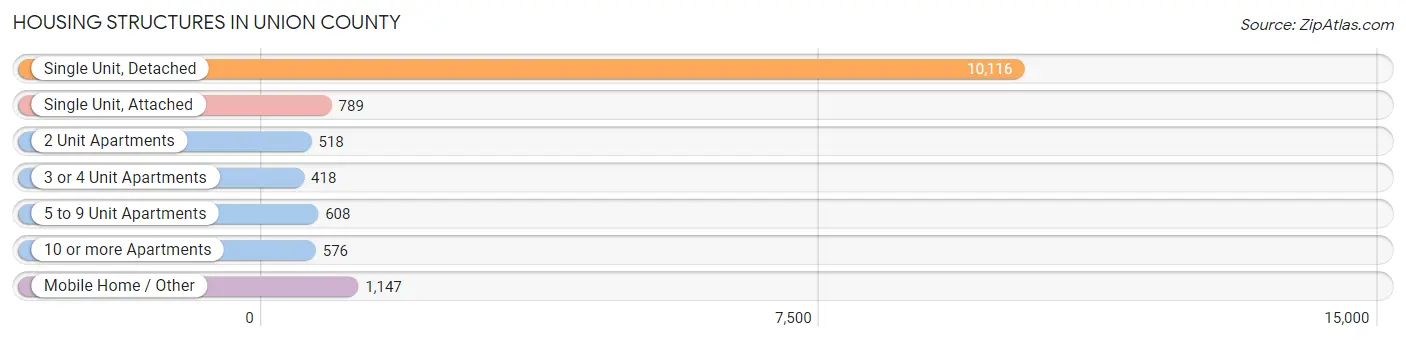
| Structure Type | # Housing Units | % Housing Units |
| Single Unit, Detached | 10,116 | 71.4% |
| Single Unit, Attached | 789 | 5.6% |
| 2 Unit Apartments | 518 | 3.7% |
| 3 or 4 Unit Apartments | 418 | 2.9% |
| 5 to 9 Unit Apartments | 608 | 4.3% |
| 10 or more Apartments | 576 | 4.1% |
| Mobile Home / Other | 1,147 | 8.1% |
| Total | 14,172 | 100.0% |
Housing Structures by Occupancy in Union County
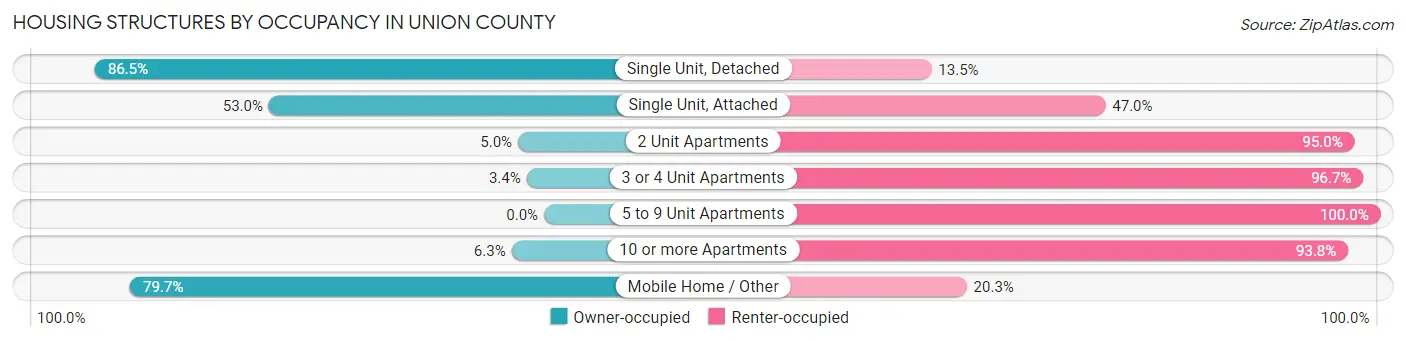
| Structure Type | Owner-occupied | Renter-occupied |
| Single Unit, Detached | 8,748 (86.5%) | 1,368 (13.5%) |
| Single Unit, Attached | 418 (53.0%) | 371 (47.0%) |
| 2 Unit Apartments | 26 (5.0%) | 492 (95.0%) |
| 3 or 4 Unit Apartments | 14 (3.4%) | 404 (96.7%) |
| 5 to 9 Unit Apartments | 0 (0.0%) | 608 (100.0%) |
| 10 or more Apartments | 36 (6.2%) | 540 (93.8%) |
| Mobile Home / Other | 914 (79.7%) | 233 (20.3%) |
| Total | 10,156 (71.7%) | 4,016 (28.3%) |
Housing Structures by Number of Rooms in Union County
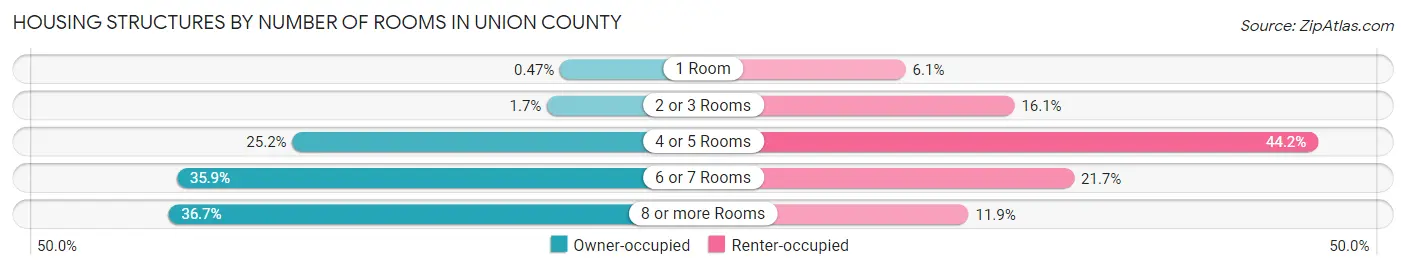
| Number of Rooms | Owner-occupied | Renter-occupied |
| 1 Room | 48 (0.5%) | 244 (6.1%) |
| 2 or 3 Rooms | 170 (1.7%) | 648 (16.1%) |
| 4 or 5 Rooms | 2,562 (25.2%) | 1,776 (44.2%) |
| 6 or 7 Rooms | 3,648 (35.9%) | 870 (21.7%) |
| 8 or more Rooms | 3,728 (36.7%) | 478 (11.9%) |
| Total | 10,156 (100.0%) | 4,016 (100.0%) |
Housing Structure by Heating Type in Union County

| Heating Type | Owner-occupied | Renter-occupied |
| Utility Gas | 1,101 (10.8%) | 661 (16.5%) |
| Bottled, Tank, or LP Gas | 860 (8.5%) | 282 (7.0%) |
| Electricity | 3,737 (36.8%) | 1,870 (46.6%) |
| Fuel Oil or Kerosene | 3,192 (31.4%) | 949 (23.6%) |
| Coal or Coke | 331 (3.3%) | 25 (0.6%) |
| All other Fuels | 853 (8.4%) | 116 (2.9%) |
| No Fuel Used | 82 (0.8%) | 113 (2.8%) |
| Total | 10,156 (100.0%) | 4,016 (100.0%) |
Household Vehicle Usage in Union County
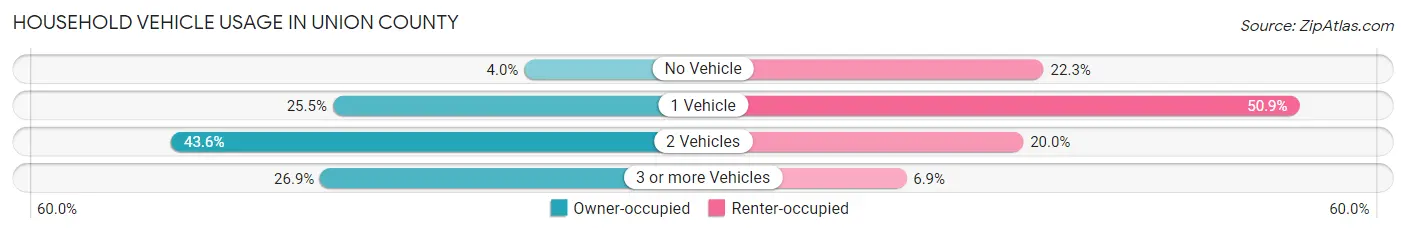
| Vehicles per Household | Owner-occupied | Renter-occupied |
| No Vehicle | 410 (4.0%) | 894 (22.3%) |
| 1 Vehicle | 2,588 (25.5%) | 2,044 (50.9%) |
| 2 Vehicles | 4,427 (43.6%) | 802 (20.0%) |
| 3 or more Vehicles | 2,731 (26.9%) | 276 (6.9%) |
| Total | 10,156 (100.0%) | 4,016 (100.0%) |
Real Estate & Mortgages in Union County
Real Estate and Mortgage Overview in Union County
| Characteristic | Without Mortgage | With Mortgage |
| Housing Units | 4,733 | 5,423 |
| Median Property Value | $183,400 | $227,900 |
| Median Household Income | $53,373 | $1,196 |
| Monthly Housing Costs | $538 | $398 |
| Real Estate Taxes | $2,333 | $48 |
Property Value by Mortgage Status in Union County
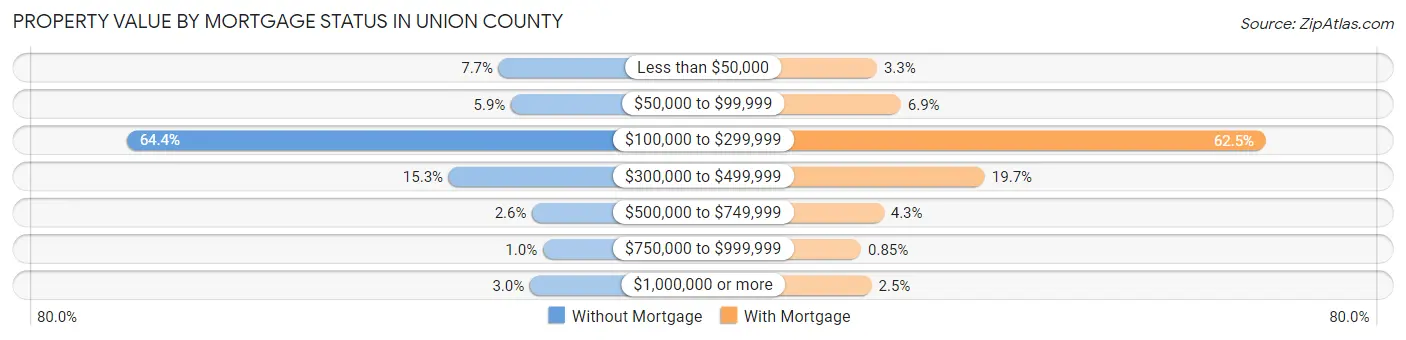
| Property Value | Without Mortgage | With Mortgage |
| Less than $50,000 | 366 (7.7%) | 177 (3.3%) |
| $50,000 to $99,999 | 277 (5.9%) | 374 (6.9%) |
| $100,000 to $299,999 | 3,050 (64.4%) | 3,391 (62.5%) |
| $300,000 to $499,999 | 726 (15.3%) | 1,069 (19.7%) |
| $500,000 to $749,999 | 125 (2.6%) | 233 (4.3%) |
| $750,000 to $999,999 | 48 (1.0%) | 46 (0.9%) |
| $1,000,000 or more | 141 (3.0%) | 133 (2.5%) |
| Total | 4,733 (100.0%) | 5,423 (100.0%) |
Household Income by Mortgage Status in Union County
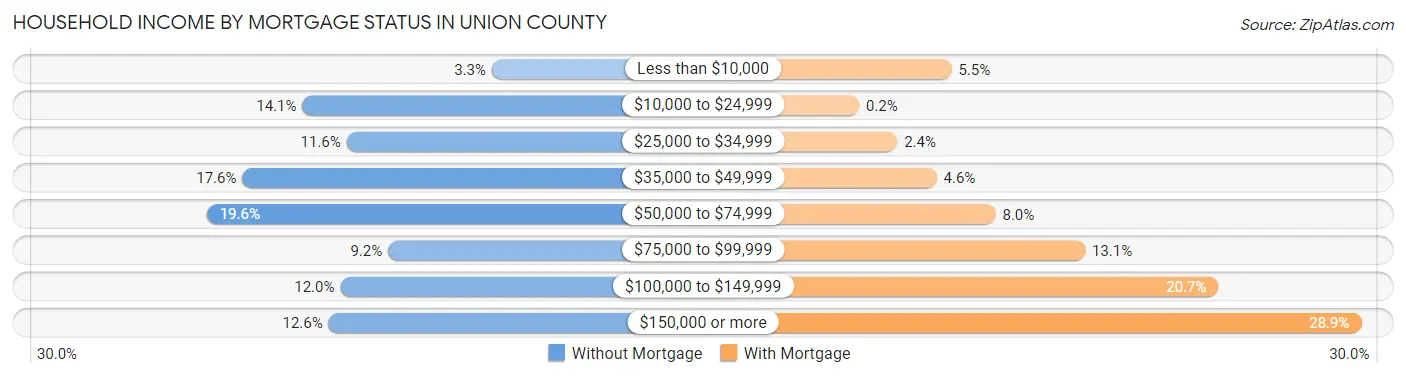
| Household Income | Without Mortgage | With Mortgage |
| Less than $10,000 | 156 (3.3%) | 297 (5.5%) |
| $10,000 to $24,999 | 669 (14.1%) | 11 (0.2%) |
| $25,000 to $34,999 | 549 (11.6%) | 129 (2.4%) |
| $35,000 to $49,999 | 831 (17.6%) | 251 (4.6%) |
| $50,000 to $74,999 | 927 (19.6%) | 434 (8.0%) |
| $75,000 to $99,999 | 437 (9.2%) | 711 (13.1%) |
| $100,000 to $149,999 | 566 (12.0%) | 1,124 (20.7%) |
| $150,000 or more | 598 (12.6%) | 1,567 (28.9%) |
| Total | 4,733 (100.0%) | 5,423 (100.0%) |
Property Value to Household Income Ratio in Union County
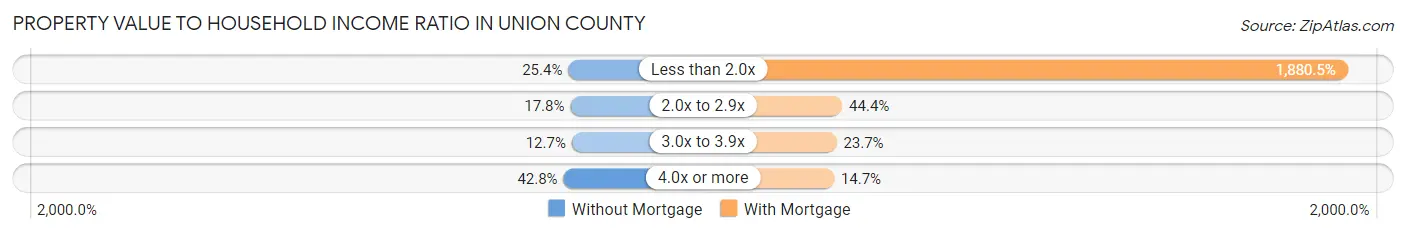
| Value-to-Income Ratio | Without Mortgage | With Mortgage |
| Less than 2.0x | 1,202 (25.4%) | 101,981 (1,880.5%) |
| 2.0x to 2.9x | 843 (17.8%) | 2,406 (44.4%) |
| 3.0x to 3.9x | 602 (12.7%) | 1,284 (23.7%) |
| 4.0x or more | 2,025 (42.8%) | 795 (14.7%) |
| Total | 4,733 (100.0%) | 5,423 (100.0%) |
Real Estate Taxes by Mortgage Status in Union County
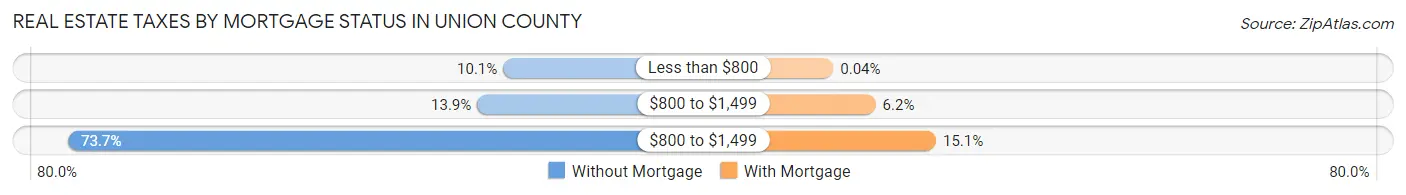
| Property Taxes | Without Mortgage | With Mortgage |
| Less than $800 | 477 (10.1%) | 2 (0.0%) |
| $800 to $1,499 | 657 (13.9%) | 338 (6.2%) |
| $800 to $1,499 | 3,486 (73.7%) | 816 (15.0%) |
| Total | 4,733 (100.0%) | 5,423 (100.0%) |
Health & Disability in Union County
Health Insurance Coverage by Age in Union County
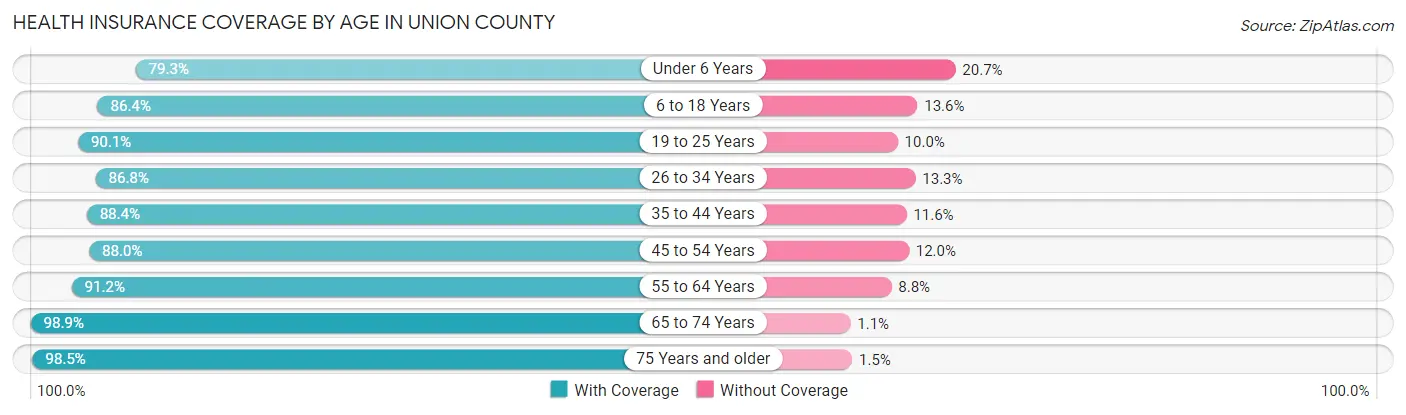
| Age Bracket | With Coverage | Without Coverage |
| Under 6 Years | 1,791 (79.3%) | 468 (20.7%) |
| 6 to 18 Years | 5,834 (86.4%) | 920 (13.6%) |
| 19 to 25 Years | 4,488 (90.0%) | 496 (10.0%) |
| 26 to 34 Years | 3,196 (86.8%) | 488 (13.3%) |
| 35 to 44 Years | 3,319 (88.4%) | 435 (11.6%) |
| 45 to 54 Years | 3,751 (88.0%) | 513 (12.0%) |
| 55 to 64 Years | 4,462 (91.2%) | 429 (8.8%) |
| 65 to 74 Years | 4,109 (98.9%) | 47 (1.1%) |
| 75 Years and older | 3,439 (98.5%) | 51 (1.5%) |
| Total | 34,389 (89.9%) | 3,847 (10.1%) |
Health Insurance Coverage by Citizenship Status in Union County
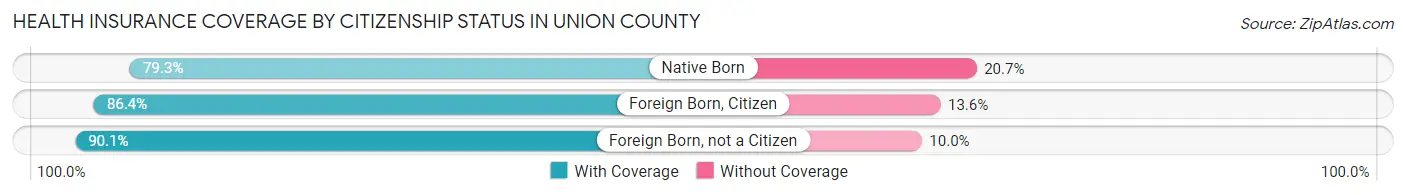
| Citizenship Status | With Coverage | Without Coverage |
| Native Born | 1,791 (79.3%) | 468 (20.7%) |
| Foreign Born, Citizen | 5,834 (86.4%) | 920 (13.6%) |
| Foreign Born, not a Citizen | 4,488 (90.0%) | 496 (10.0%) |
Health Insurance Coverage by Household Income in Union County
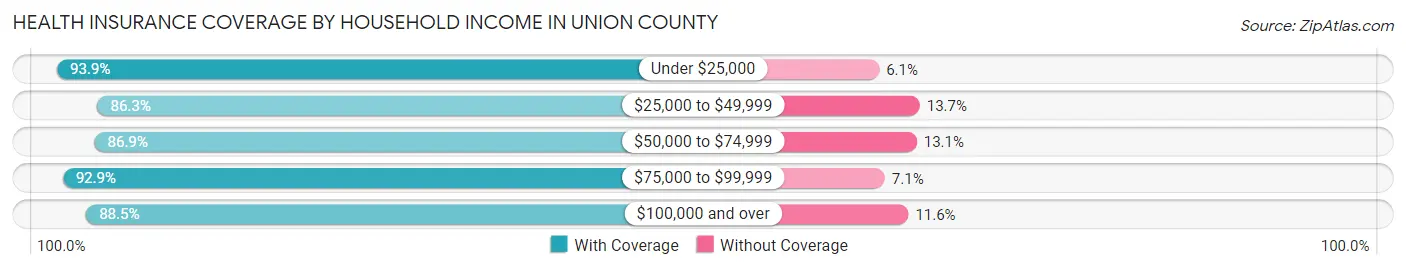
| Household Income | With Coverage | Without Coverage |
| Under $25,000 | 3,104 (93.9%) | 201 (6.1%) |
| $25,000 to $49,999 | 5,144 (86.3%) | 815 (13.7%) |
| $50,000 to $74,999 | 4,503 (86.9%) | 680 (13.1%) |
| $75,000 to $99,999 | 4,867 (92.9%) | 374 (7.1%) |
| $100,000 and over | 12,786 (88.4%) | 1,670 (11.6%) |
Public vs Private Health Insurance Coverage by Age in Union County
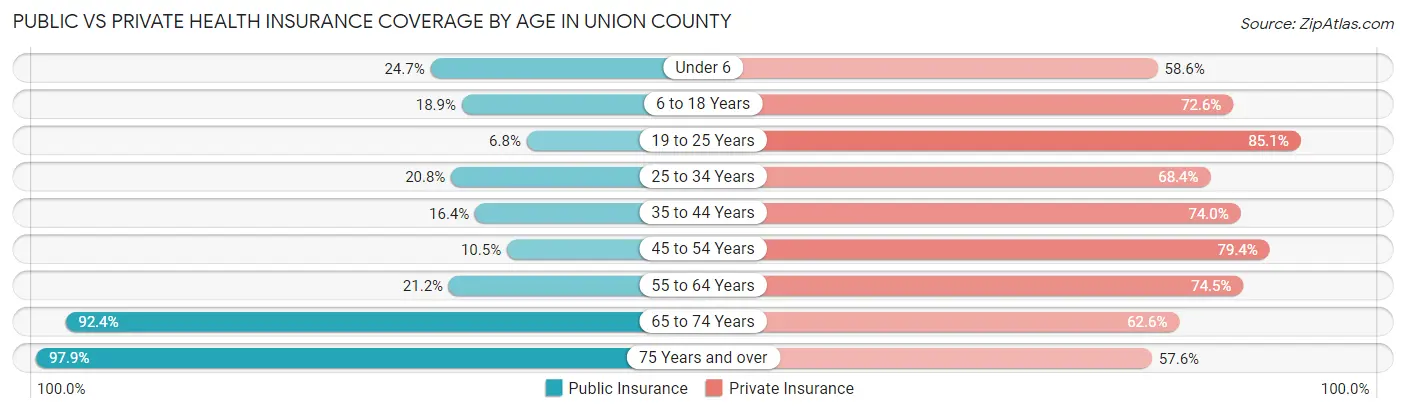
| Age Bracket | Public Insurance | Private Insurance |
| Under 6 | 557 (24.7%) | 1,324 (58.6%) |
| 6 to 18 Years | 1,273 (18.9%) | 4,906 (72.6%) |
| 19 to 25 Years | 339 (6.8%) | 4,243 (85.1%) |
| 25 to 34 Years | 767 (20.8%) | 2,520 (68.4%) |
| 35 to 44 Years | 615 (16.4%) | 2,778 (74.0%) |
| 45 to 54 Years | 446 (10.5%) | 3,386 (79.4%) |
| 55 to 64 Years | 1,039 (21.2%) | 3,645 (74.5%) |
| 65 to 74 Years | 3,842 (92.4%) | 2,603 (62.6%) |
| 75 Years and over | 3,416 (97.9%) | 2,009 (57.6%) |
| Total | 12,294 (32.2%) | 27,414 (71.7%) |
Disability Status by Sex by Age in Union County
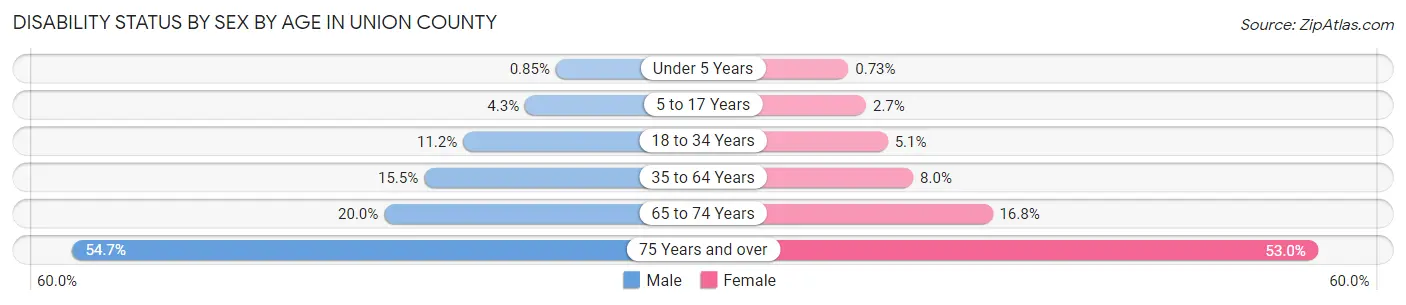
| Age Bracket | Male | Female |
| Under 5 Years | 8 (0.9%) | 7 (0.7%) |
| 5 to 17 Years | 132 (4.3%) | 73 (2.7%) |
| 18 to 34 Years | 568 (11.2%) | 250 (5.1%) |
| 35 to 64 Years | 984 (15.5%) | 522 (8.0%) |
| 65 to 74 Years | 393 (20.0%) | 367 (16.8%) |
| 75 Years and over | 774 (54.7%) | 1,099 (53.0%) |
Disability Class by Sex by Age in Union County
Disability Class: Hearing Difficulty
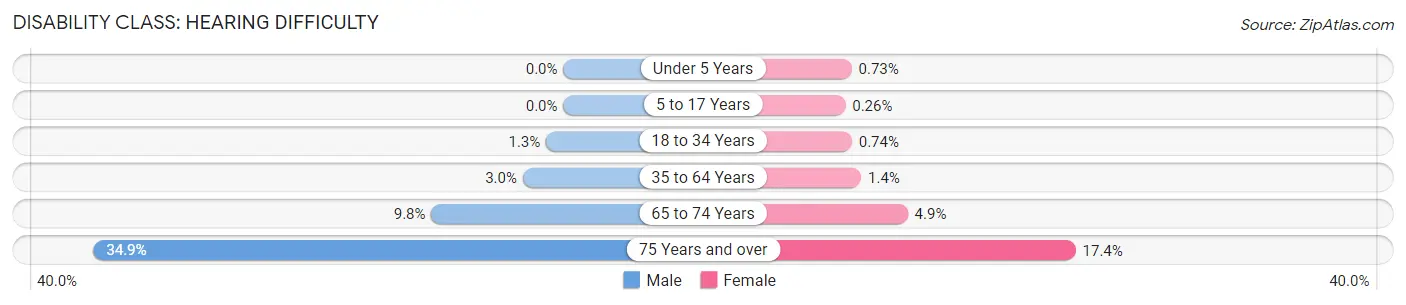
| Age Bracket | Male | Female |
| Under 5 Years | 0 (0.0%) | 7 (0.7%) |
| 5 to 17 Years | 0 (0.0%) | 7 (0.3%) |
| 18 to 34 Years | 65 (1.3%) | 36 (0.7%) |
| 35 to 64 Years | 191 (3.0%) | 94 (1.4%) |
| 65 to 74 Years | 193 (9.8%) | 107 (4.9%) |
| 75 Years and over | 494 (34.9%) | 360 (17.4%) |
Disability Class: Vision Difficulty
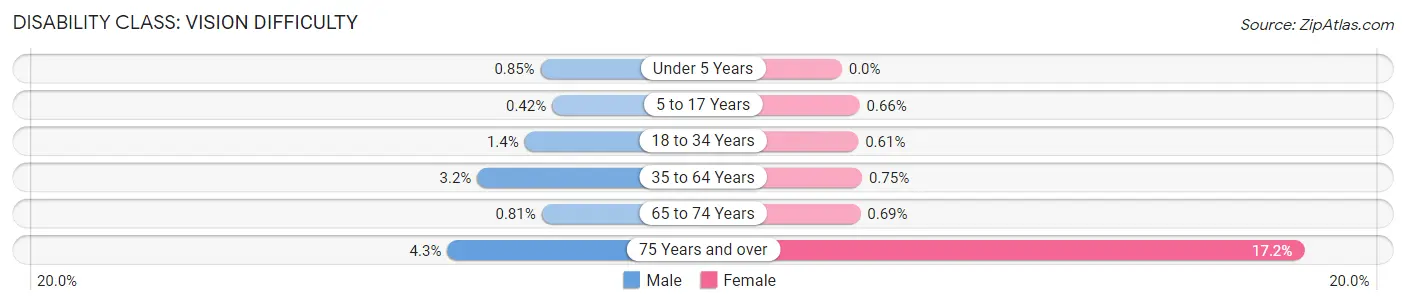
| Age Bracket | Male | Female |
| Under 5 Years | 8 (0.9%) | 0 (0.0%) |
| 5 to 17 Years | 13 (0.4%) | 18 (0.7%) |
| 18 to 34 Years | 73 (1.4%) | 30 (0.6%) |
| 35 to 64 Years | 203 (3.2%) | 49 (0.7%) |
| 65 to 74 Years | 16 (0.8%) | 15 (0.7%) |
| 75 Years and over | 61 (4.3%) | 356 (17.2%) |
Disability Class: Cognitive Difficulty
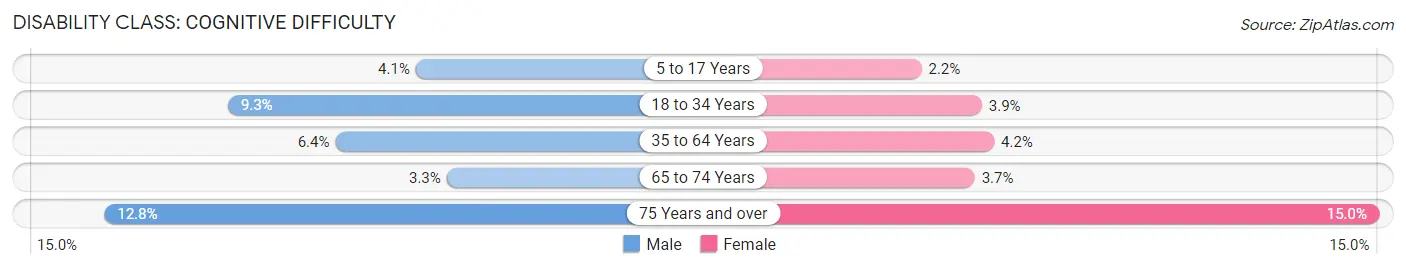
| Age Bracket | Male | Female |
| 5 to 17 Years | 127 (4.1%) | 60 (2.2%) |
| 18 to 34 Years | 475 (9.3%) | 191 (3.9%) |
| 35 to 64 Years | 403 (6.4%) | 278 (4.2%) |
| 65 to 74 Years | 64 (3.3%) | 81 (3.7%) |
| 75 Years and over | 181 (12.8%) | 310 (14.9%) |
Disability Class: Ambulatory Difficulty
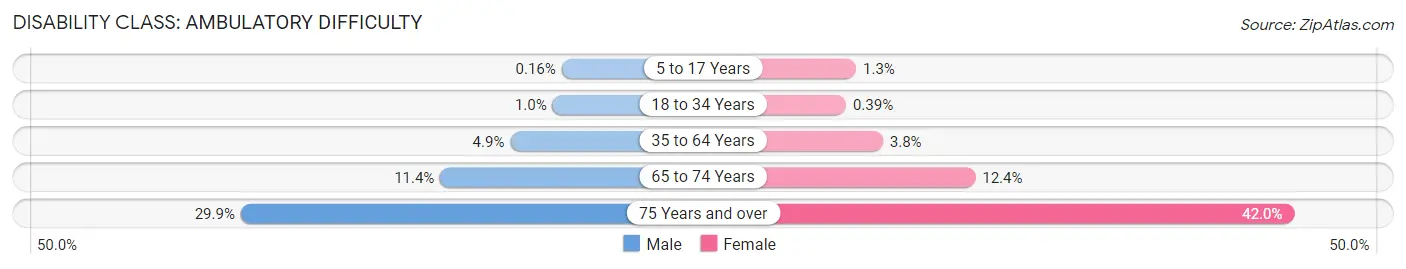
| Age Bracket | Male | Female |
| 5 to 17 Years | 5 (0.2%) | 36 (1.3%) |
| 18 to 34 Years | 51 (1.0%) | 19 (0.4%) |
| 35 to 64 Years | 313 (4.9%) | 250 (3.8%) |
| 65 to 74 Years | 225 (11.4%) | 271 (12.4%) |
| 75 Years and over | 424 (29.9%) | 871 (42.0%) |
Disability Class: Self-Care Difficulty
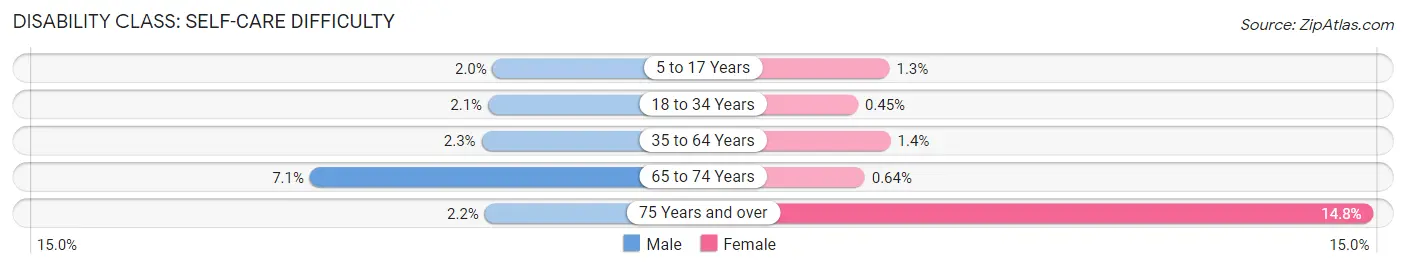
| Age Bracket | Male | Female |
| 5 to 17 Years | 61 (2.0%) | 36 (1.3%) |
| 18 to 34 Years | 107 (2.1%) | 22 (0.4%) |
| 35 to 64 Years | 145 (2.3%) | 89 (1.4%) |
| 65 to 74 Years | 139 (7.1%) | 14 (0.6%) |
| 75 Years and over | 31 (2.2%) | 307 (14.8%) |
Technology Access in Union County
Computing Device Access in Union County
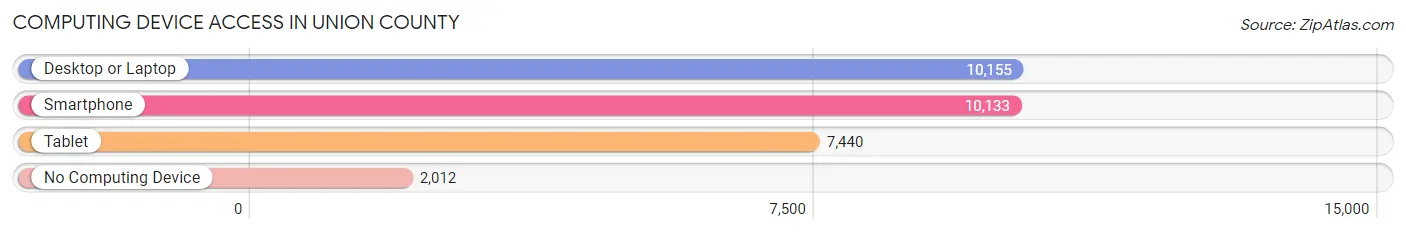
| Device Type | # Households | % Households |
| Desktop or Laptop | 10,155 | 71.7% |
| Smartphone | 10,133 | 71.5% |
| Tablet | 7,440 | 52.5% |
| No Computing Device | 2,012 | 14.2% |
| Total | 14,172 | 100.0% |
Internet Access in Union County
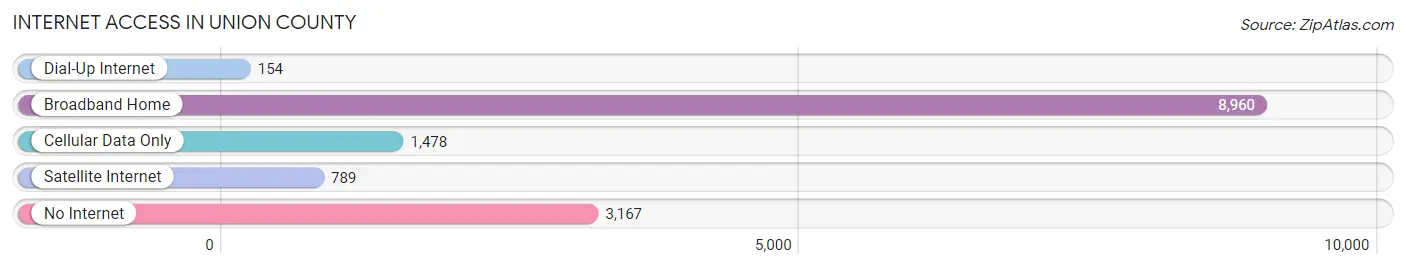
| Internet Type | # Households | % Households |
| Dial-Up Internet | 154 | 1.1% |
| Broadband Home | 8,960 | 63.2% |
| Cellular Data Only | 1,478 | 10.4% |
| Satellite Internet | 789 | 5.6% |
| No Internet | 3,167 | 22.4% |
| Total | 14,172 | 100.0% |
Union County Summary
County History
Union County, Pennsylvania is located in the north-central part of the state and is part of the Susquehanna Valley region. The county was created in 1813 from parts of Northumberland and Lycoming counties. It was named for the union of the two counties. The county seat is Lewisburg, which was founded in 1785 and is the oldest town in the county.
The first settlers in the area were German immigrants who arrived in the early 1700s. They were followed by Scots-Irish and English settlers in the mid-1700s. The county was largely agricultural until the mid-1800s when the Pennsylvania Canal and the Sunbury and Erie Railroad were built. This allowed for the development of industry and commerce in the area.
The county was also home to several Civil War battles, including the Battle of Lewisburg in 1863. The county was also the site of the first oil well in the United States, which was drilled in 1859.
Geography
Union County is located in the north-central part of Pennsylvania and is bordered by Northumberland County to the north, Snyder County to the east, Lycoming County to the south, and Centre County to the west. The county covers an area of 437 square miles and is home to a population of 44,845 people, as of the 2010 census.
The county is mostly rural, with the majority of the land being used for agricultural purposes. The Susquehanna River runs through the county, and there are several small lakes and streams. The county is also home to several state parks, including Bald Eagle State Park, Little Buffalo State Park, and Shikellamy State Park.
Economy
Union County has a diverse economy, with the largest industries being manufacturing, health care, and retail trade. The county is home to several large employers, including Weis Markets, Geisinger Health System, and Wegmans.
The county is also home to several small businesses, including farms, restaurants, and shops. The county is also home to several colleges and universities, including Bucknell University, Susquehanna University, and Bloomsburg University.
Demographics
As of the 2010 census, the population of Union County was 44,845, with a population density of 102 people per square mile. The median age of the population was 41.7 years, and the median household income was $50,945.
The racial makeup of the county was 95.3% White, 1.7% African American, 0.3% Native American, 0.7% Asian, 0.1% Pacific Islander, 0.7% from other races, and 1.2% from two or more races. Hispanic or Latino of any race were 2.2% of the population.
The largest ancestry groups in the county were German (30.2%), Irish (17.2%), English (14.7%), Italian (7.2%), and Polish (4.7%). The majority of the population (90.2%) spoke English as their primary language, while 4.2% spoke Spanish and 1.2% spoke German.
Conclusion
Union County, Pennsylvania is a rural county located in the north-central part of the state. It was created in 1813 and is home to a population of 44,845 people, as of the 2010 census. The county has a diverse economy, with the largest industries being manufacturing, health care, and retail trade. The county is also home to several colleges and universities, as well as several state parks. The population is mostly White, with the largest ancestry groups being German, Irish, English, Italian, and Polish.
Common Questions
What is Per Capita Income in Union County?
Per Capita income in Union County is $33,566.
What is the Median Family Income in Union County?
Median Family Income in Union County is $89,083.
What is the Median Household income in Union County?
Median Household Income in Union County is $64,914.
What is Income or Wage Gap in Union County?
Income or Wage Gap in Union County is 25.7%.
Women in Union County earn 74.3 cents for every dollar earned by a man.
What is Family Income Deficit in Union County?
Family Income Deficit in Union County is $9,300.
Families that are below poverty line in Union County earn $9,300 less on average than the poverty threshold level.
What is Inequality or Gini Index in Union County?
Inequality or Gini Index in Union County is 0.49.
What is the Total Population of Union County?
Total Population of Union County is 42,908.
What is the Total Male Population of Union County?
Total Male Population of Union County is 23,217.
What is the Total Female Population of Union County?
Total Female Population of Union County is 19,691.
What is the Ratio of Males per 100 Females in Union County?
There are 117.91 Males per 100 Females in Union County.
What is the Ratio of Females per 100 Males in Union County?
There are 84.81 Females per 100 Males in Union County.
What is the Median Population Age in Union County?
Median Population Age in Union County is 39.7 Years.
What is the Average Family Size in Union County
Average Family Size in Union County is 3.0 People.
What is the Average Household Size in Union County
Average Household Size in Union County is 2.4 People.
How Large is the Labor Force in Union County?
There are 17,481 People in the Labor Forcein in Union County.
What is the Percentage of People in the Labor Force in Union County?
48.1% of People are in the Labor Force in Union County.
What is the Unemployment Rate in Union County?
Unemployment Rate in Union County is 3.5%.