Tioga County, PA Map & Demographics
Tioga County Map
Tioga County Overview
$31,131
PER CAPITA INCOME
$73,094
AVG FAMILY INCOME
$59,707
AVG HOUSEHOLD INCOME
39.9%
WAGE / INCOME GAP [ % ]
60.1¢/ $1
WAGE / INCOME GAP [ $ ]
$10,067
FAMILY INCOME DEFICIT
0.42
INEQUALITY / GINI INDEX
41,186
TOTAL POPULATION
20,676
MALE POPULATION
20,510
FEMALE POPULATION
100.81
MALES / 100 FEMALES
99.20
FEMALES / 100 MALES
45.0
MEDIAN AGE
3.0
AVG FAMILY SIZE
2.4
AVG HOUSEHOLD SIZE
19,404
LABOR FORCE [ PEOPLE ]
56.8%
PERCENT IN LABOR FORCE
4.5%
UNEMPLOYMENT RATE
Income in Tioga County
Income Overview in Tioga County
Per Capita Income in Tioga County is $31,131, while median incomes of families and households are $73,094 and $59,707 respectively.
| Characteristic | Number | Measure |
| Per Capita Income | 41,186 | $31,131 |
| Median Family Income | 11,065 | $73,094 |
| Mean Family Income | 11,065 | $87,155 |
| Median Household Income | 16,583 | $59,707 |
| Mean Household Income | 16,583 | $74,629 |
| Income Deficit | 11,065 | $10,067 |
| Wage / Income Gap (%) | 41,186 | 39.87% |
| Wage / Income Gap ($) | 41,186 | 60.13¢ per $1 |
| Gini / Inequality Index | 41,186 | 0.42 |
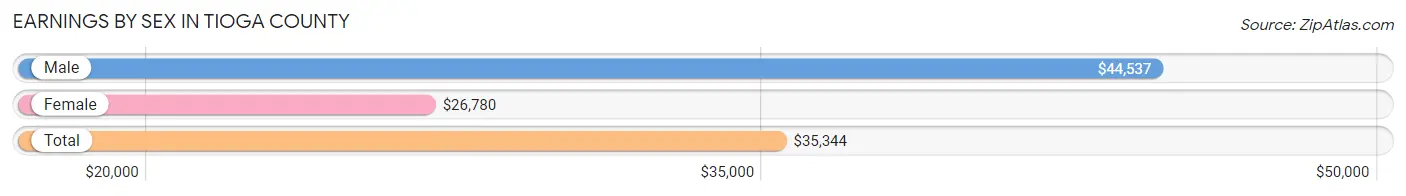
Earnings by Sex in Tioga County
Average Earnings in Tioga County are $35,344, $44,537 for men and $26,780 for women, a difference of 39.9%.
| Sex | Number | Average Earnings |
| Male | 10,727 (52.2%) | $44,537 |
| Female | 9,826 (47.8%) | $26,780 |
| Total | 20,553 (100.0%) | $35,344 |
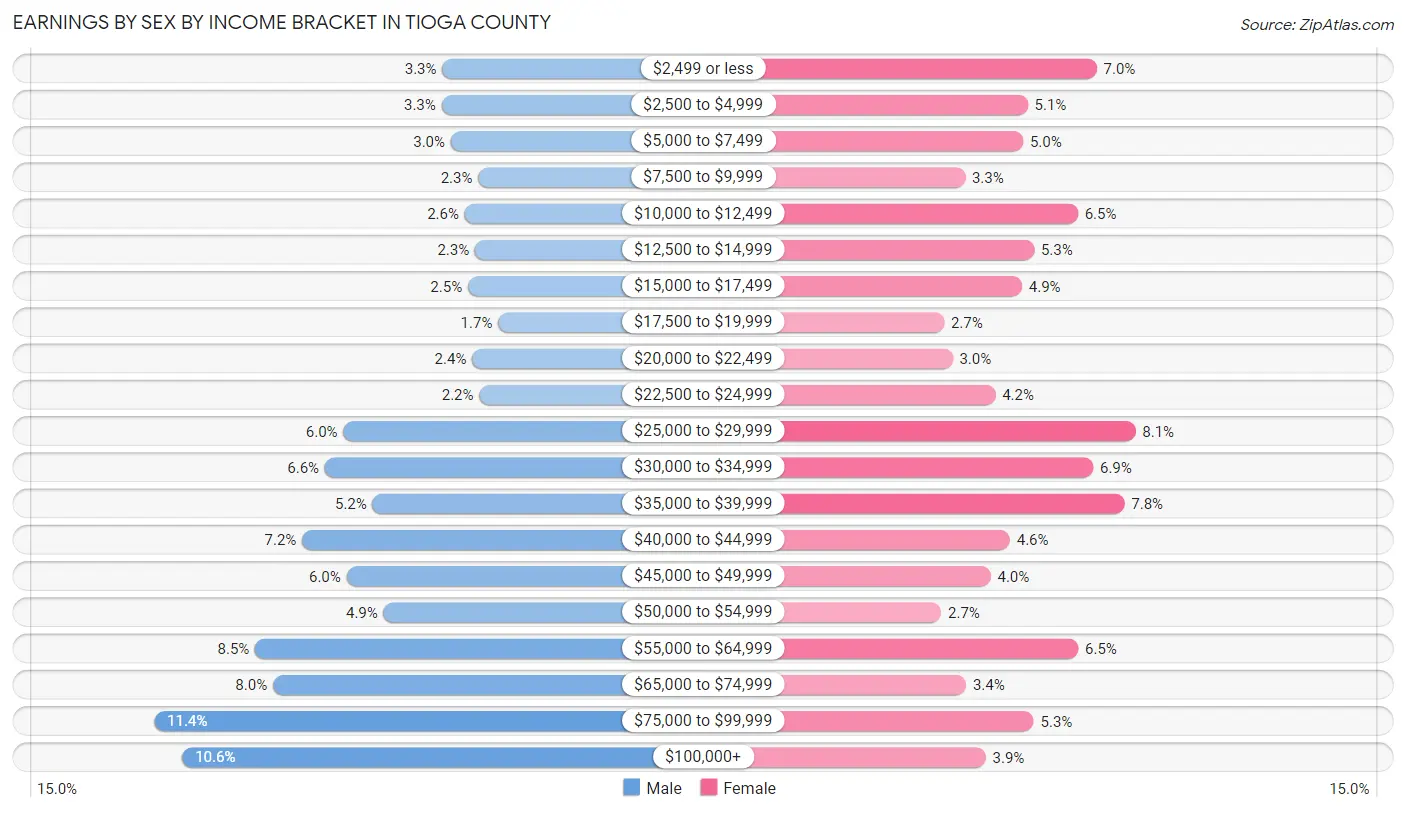
Earnings by Sex by Income Bracket in Tioga County
The most common earnings brackets in Tioga County are $75,000 to $99,999 for men (1,219 | 11.4%) and $25,000 to $29,999 for women (797 | 8.1%).
| Income | Male | Female |
| $2,499 or less | 350 (3.3%) | 690 (7.0%) |
| $2,500 to $4,999 | 352 (3.3%) | 499 (5.1%) |
| $5,000 to $7,499 | 324 (3.0%) | 486 (5.0%) |
| $7,500 to $9,999 | 241 (2.2%) | 326 (3.3%) |
| $10,000 to $12,499 | 282 (2.6%) | 638 (6.5%) |
| $12,500 to $14,999 | 251 (2.3%) | 517 (5.3%) |
| $15,000 to $17,499 | 272 (2.5%) | 483 (4.9%) |
| $17,500 to $19,999 | 181 (1.7%) | 268 (2.7%) |
| $20,000 to $22,499 | 260 (2.4%) | 292 (3.0%) |
| $22,500 to $24,999 | 238 (2.2%) | 410 (4.2%) |
| $25,000 to $29,999 | 648 (6.0%) | 797 (8.1%) |
| $30,000 to $34,999 | 704 (6.6%) | 680 (6.9%) |
| $35,000 to $39,999 | 560 (5.2%) | 766 (7.8%) |
| $40,000 to $44,999 | 772 (7.2%) | 450 (4.6%) |
| $45,000 to $49,999 | 638 (5.9%) | 397 (4.0%) |
| $50,000 to $54,999 | 527 (4.9%) | 260 (2.6%) |
| $55,000 to $64,999 | 914 (8.5%) | 639 (6.5%) |
| $65,000 to $74,999 | 860 (8.0%) | 329 (3.4%) |
| $75,000 to $99,999 | 1,219 (11.4%) | 516 (5.2%) |
| $100,000+ | 1,134 (10.6%) | 383 (3.9%) |
| Total | 10,727 (100.0%) | 9,826 (100.0%) |
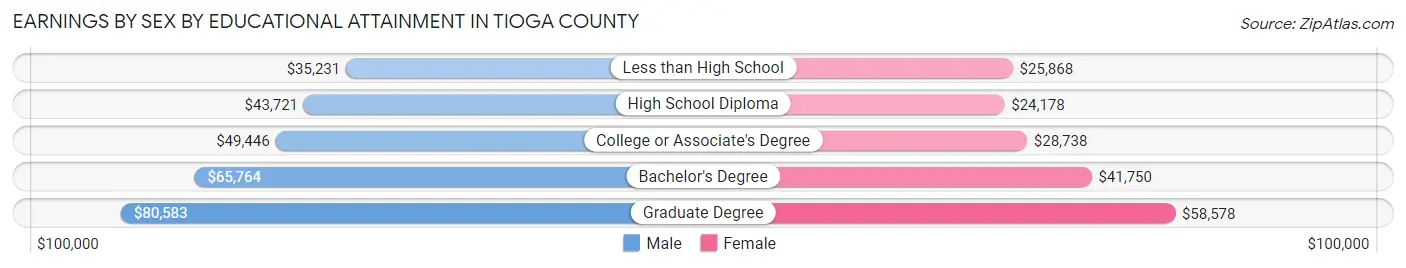
Earnings by Sex by Educational Attainment in Tioga County
Average earnings in Tioga County are $48,674 for men and $30,880 for women, a difference of 36.6%. Men with an educational attainment of graduate degree enjoy the highest average annual earnings of $80,583, while those with less than high school education earn the least with $35,231. Women with an educational attainment of graduate degree earn the most with the average annual earnings of $58,578, while those with high school diploma education have the smallest earnings of $24,178.
| Educational Attainment | Male Income | Female Income |
| Less than High School | $35,231 | $25,868 |
| High School Diploma | $43,721 | $24,178 |
| College or Associate's Degree | $49,446 | $28,738 |
| Bachelor's Degree | $65,764 | $41,750 |
| Graduate Degree | $80,583 | $58,578 |
| Total | $48,674 | $30,880 |
Family Income in Tioga County
Family Income Brackets in Tioga County
According to the Tioga County family income data, there are 2,379 families falling into the $50,000 to $74,999 income range, which is the most common income bracket and makes up 21.5% of all families. Conversely, the $10,000 to $14,999 income bracket is the least frequent group with only 232 families (2.1%) belonging to this category.
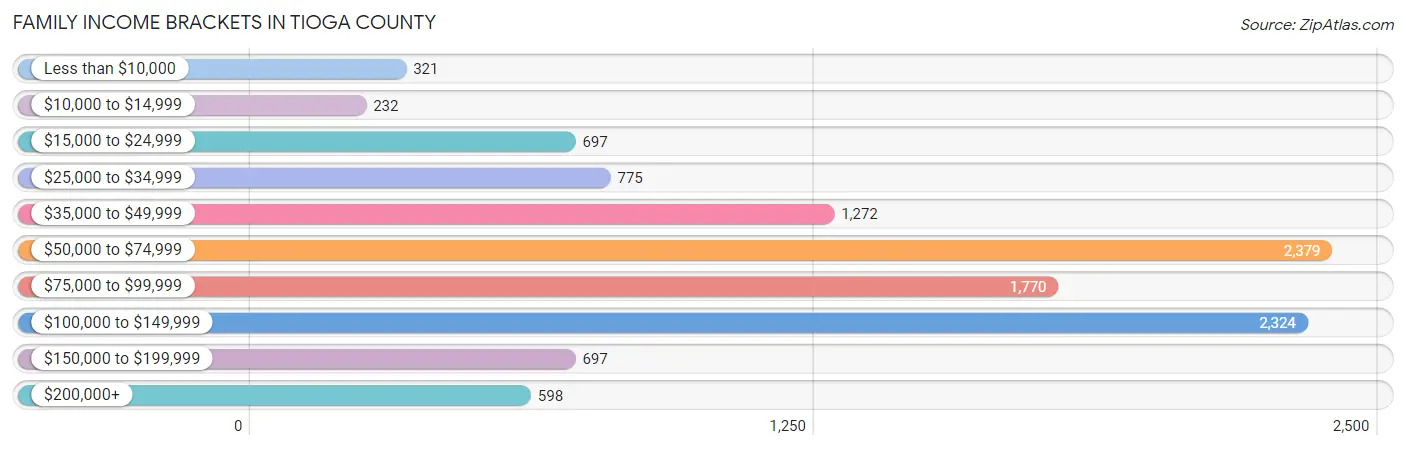
| Income Bracket | # Families | % Families |
| Less than $10,000 | 321 | 2.9% |
| $10,000 to $14,999 | 232 | 2.1% |
| $15,000 to $24,999 | 697 | 6.3% |
| $25,000 to $34,999 | 775 | 7.0% |
| $35,000 to $49,999 | 1,272 | 11.5% |
| $50,000 to $74,999 | 2,379 | 21.5% |
| $75,000 to $99,999 | 1,770 | 16.0% |
| $100,000 to $149,999 | 2,324 | 21.0% |
| $150,000 to $199,999 | 697 | 6.3% |
| $200,000+ | 598 | 5.4% |
Family Income by Famaliy Size in Tioga County
7+ person families (161 | 1.5%) account for the highest median family income in Tioga County with $107,083 per family, while 2-person families (5,924 | 53.5%) have the highest median income of $31,715 per family member.
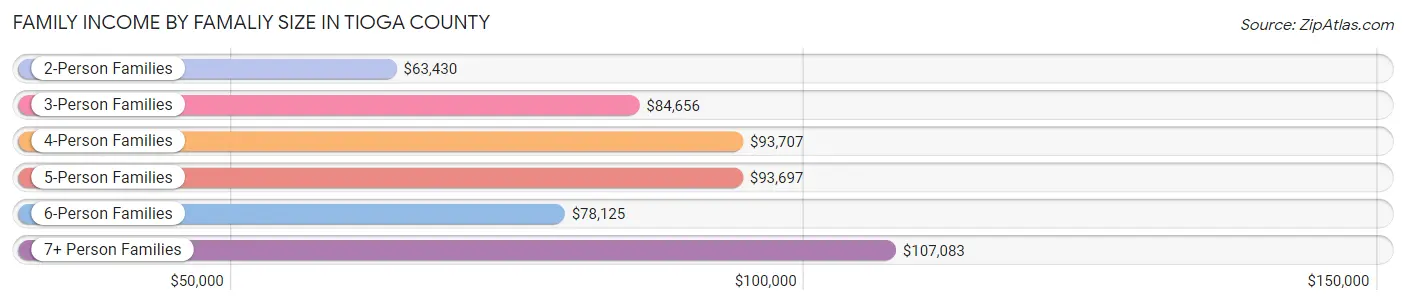
| Income Bracket | # Families | Median Income |
| 2-Person Families | 5,924 (53.5%) | $63,430 |
| 3-Person Families | 2,390 (21.6%) | $84,656 |
| 4-Person Families | 1,514 (13.7%) | $93,707 |
| 5-Person Families | 823 (7.4%) | $93,697 |
| 6-Person Families | 253 (2.3%) | $78,125 |
| 7+ Person Families | 161 (1.5%) | $107,083 |
| Total | 11,065 (100.0%) | $73,094 |
Family Income by Number of Earners in Tioga County
The median family income in Tioga County is $73,094, with families comprising 3+ earners (998) having the highest median family income of $129,904, while families with no earners (2,478) have the lowest median family income of $48,594, accounting for 9.0% and 22.4% of families, respectively.
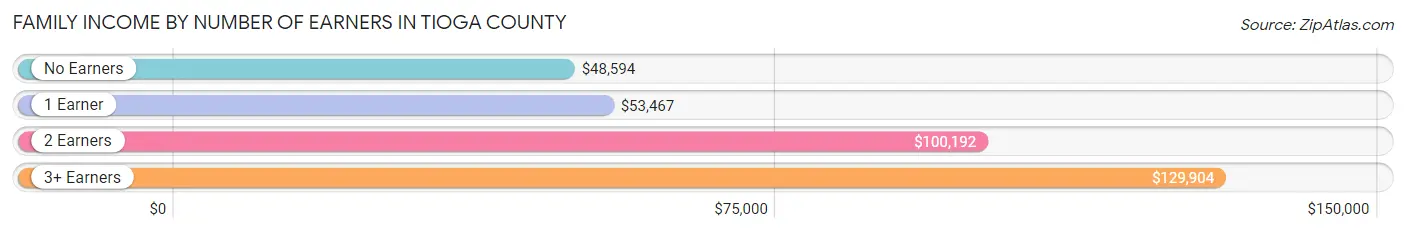
| Number of Earners | # Families | Median Income |
| No Earners | 2,478 (22.4%) | $48,594 |
| 1 Earner | 3,479 (31.4%) | $53,467 |
| 2 Earners | 4,110 (37.1%) | $100,192 |
| 3+ Earners | 998 (9.0%) | $129,904 |
| Total | 11,065 (100.0%) | $73,094 |
Household Income in Tioga County
Household Income Brackets in Tioga County
With 3,184 households falling in the category, the $50,000 to $74,999 income range is the most frequent in Tioga County, accounting for 19.2% of all households. In contrast, only 663 households (4.0%) fall into the $200,000+ income bracket, making it the least populous group.
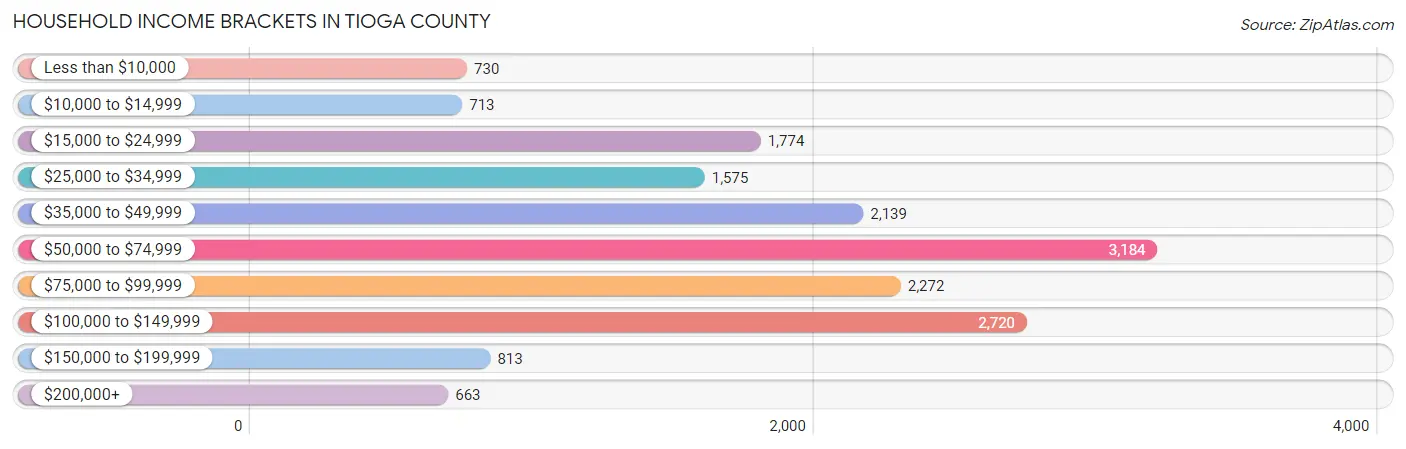
| Income Bracket | # Households | % Households |
| Less than $10,000 | 730 | 4.4% |
| $10,000 to $14,999 | 713 | 4.3% |
| $15,000 to $24,999 | 1,774 | 10.7% |
| $25,000 to $34,999 | 1,575 | 9.5% |
| $35,000 to $49,999 | 2,139 | 12.9% |
| $50,000 to $74,999 | 3,184 | 19.2% |
| $75,000 to $99,999 | 2,272 | 13.7% |
| $100,000 to $149,999 | 2,720 | 16.4% |
| $150,000 to $199,999 | 813 | 4.9% |
| $200,000+ | 663 | 4.0% |
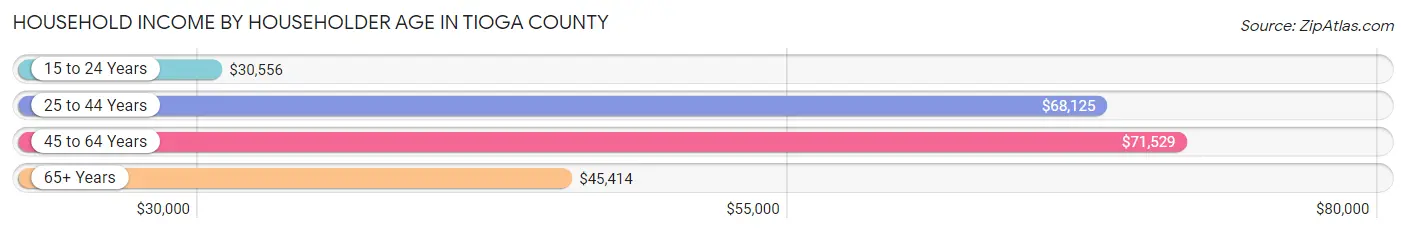
Household Income by Householder Age in Tioga County
The median household income in Tioga County is $59,707, with the highest median household income of $71,529 found in the 45 to 64 years age bracket for the primary householder. A total of 6,156 households (37.1%) fall into this category. Meanwhile, the 15 to 24 years age bracket for the primary householder has the lowest median household income of $30,556, with 534 households (3.2%) in this group.
| Income Bracket | # Households | Median Income |
| 15 to 24 Years | 534 (3.2%) | $30,556 |
| 25 to 44 Years | 4,118 (24.8%) | $68,125 |
| 45 to 64 Years | 6,156 (37.1%) | $71,529 |
| 65+ Years | 5,775 (34.8%) | $45,414 |
| Total | 16,583 (100.0%) | $59,707 |
Poverty in Tioga County
Income Below Poverty by Sex and Age in Tioga County
With 10.4% poverty level for males and 14.0% for females among the residents of Tioga County, 5 year old males and 16 and 17 year old females are the most vulnerable to poverty, with 35 males (18.9%) and 129 females (25.2%) in their respective age groups living below the poverty level.
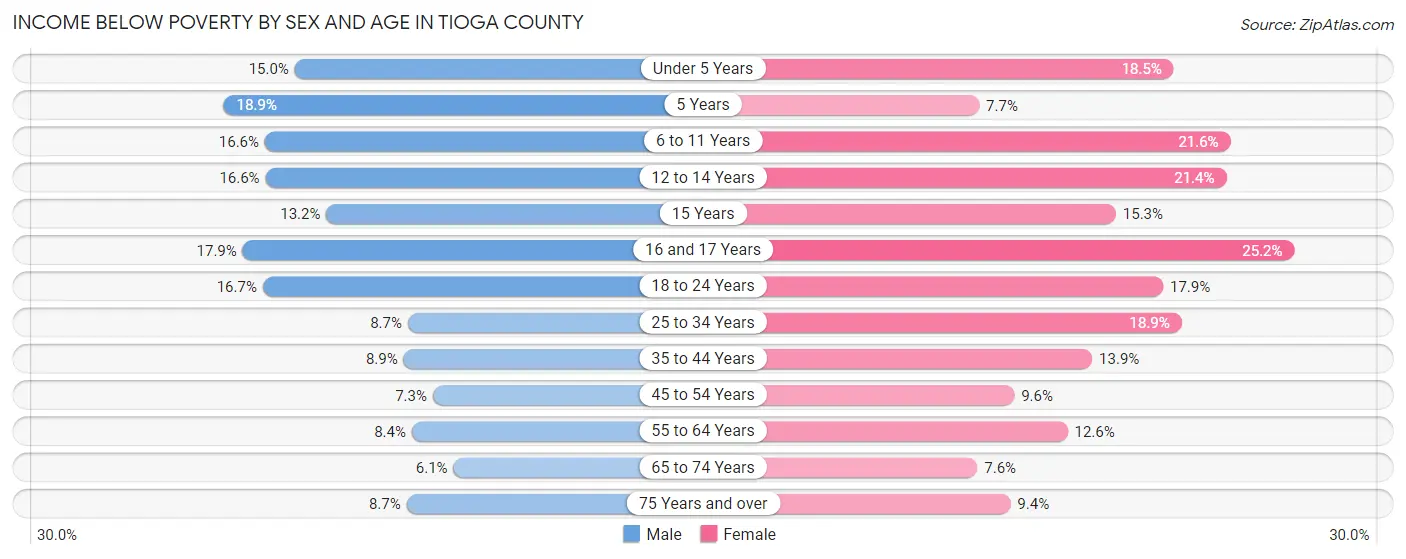
| Age Bracket | Male | Female |
| Under 5 Years | 164 (15.0%) | 177 (18.5%) |
| 5 Years | 35 (18.9%) | 14 (7.6%) |
| 6 to 11 Years | 254 (16.6%) | 283 (21.6%) |
| 12 to 14 Years | 115 (16.6%) | 131 (21.4%) |
| 15 Years | 26 (13.2%) | 29 (15.3%) |
| 16 and 17 Years | 95 (17.9%) | 129 (25.2%) |
| 18 to 24 Years | 271 (16.7%) | 309 (17.9%) |
| 25 to 34 Years | 193 (8.7%) | 408 (18.9%) |
| 35 to 44 Years | 200 (8.9%) | 307 (13.9%) |
| 45 to 54 Years | 183 (7.3%) | 237 (9.6%) |
| 55 to 64 Years | 262 (8.4%) | 394 (12.6%) |
| 65 to 74 Years | 161 (6.1%) | 198 (7.5%) |
| 75 Years and over | 156 (8.7%) | 195 (9.4%) |
| Total | 2,115 (10.4%) | 2,811 (14.0%) |
Income Above Poverty by Sex and Age in Tioga County
According to the poverty statistics in Tioga County, males aged 65 to 74 years and females aged 65 to 74 years are the age groups that are most secure financially, with 93.9% of males and 92.4% of females in these age groups living above the poverty line.
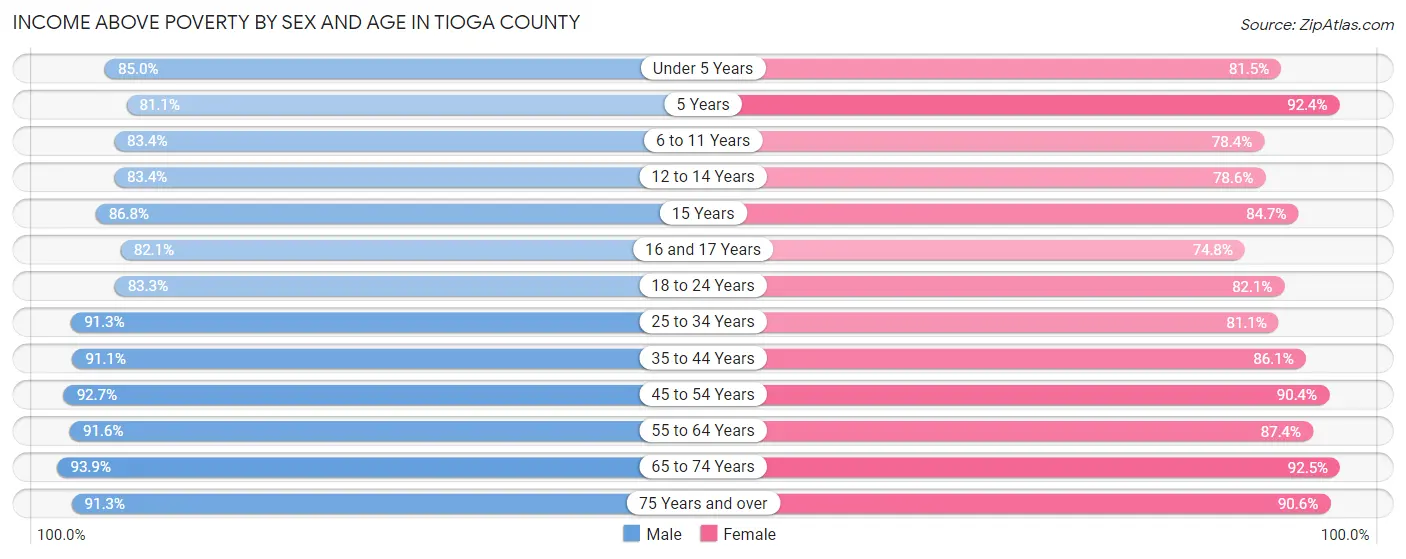
| Age Bracket | Male | Female |
| Under 5 Years | 932 (85.0%) | 781 (81.5%) |
| 5 Years | 150 (81.1%) | 169 (92.3%) |
| 6 to 11 Years | 1,274 (83.4%) | 1,025 (78.4%) |
| 12 to 14 Years | 578 (83.4%) | 481 (78.6%) |
| 15 Years | 171 (86.8%) | 161 (84.7%) |
| 16 and 17 Years | 437 (82.1%) | 383 (74.8%) |
| 18 to 24 Years | 1,348 (83.3%) | 1,418 (82.1%) |
| 25 to 34 Years | 2,036 (91.3%) | 1,748 (81.1%) |
| 35 to 44 Years | 2,048 (91.1%) | 1,896 (86.1%) |
| 45 to 54 Years | 2,333 (92.7%) | 2,232 (90.4%) |
| 55 to 64 Years | 2,842 (91.6%) | 2,740 (87.4%) |
| 65 to 74 Years | 2,470 (93.9%) | 2,425 (92.4%) |
| 75 Years and over | 1,630 (91.3%) | 1,882 (90.6%) |
| Total | 18,249 (89.6%) | 17,341 (86.1%) |
Income Below Poverty Among Married-Couple Families in Tioga County
The poverty statistics for married-couple families in Tioga County show that 3.5% or 307 of the total 8,689 families live below the poverty line. Families with 3 or 4 children have the highest poverty rate of 7.6%, comprising of 60 families. On the other hand, families with no children have the lowest poverty rate of 2.9%, which includes 170 families.
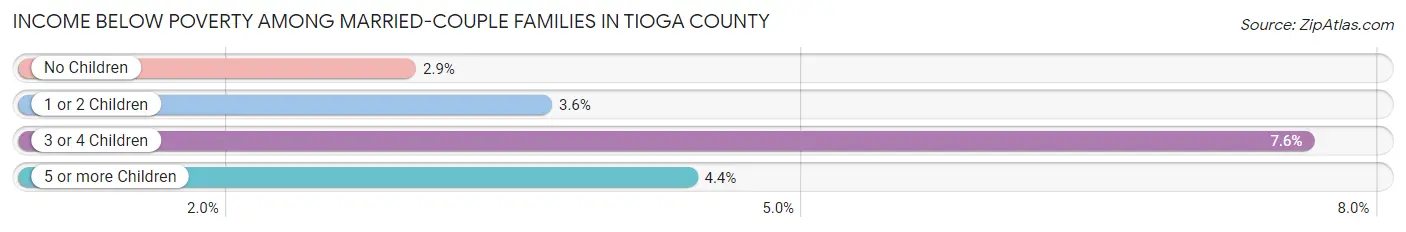
| Children | Above Poverty | Below Poverty |
| No Children | 5,638 (97.1%) | 170 (2.9%) |
| 1 or 2 Children | 1,930 (96.4%) | 73 (3.6%) |
| 3 or 4 Children | 727 (92.4%) | 60 (7.6%) |
| 5 or more Children | 87 (95.6%) | 4 (4.4%) |
| Total | 8,382 (96.5%) | 307 (3.5%) |
Income Below Poverty Among Single-Parent Households in Tioga County
According to the poverty data in Tioga County, 14.8% or 111 single-father households and 32.6% or 531 single-mother households are living below the poverty line. Among single-father households, those with 1 or 2 children have the highest poverty rate, with 79 households (21.8%) experiencing poverty. Likewise, among single-mother households, those with 3 or 4 children have the highest poverty rate, with 165 households (63.9%) falling below the poverty line.
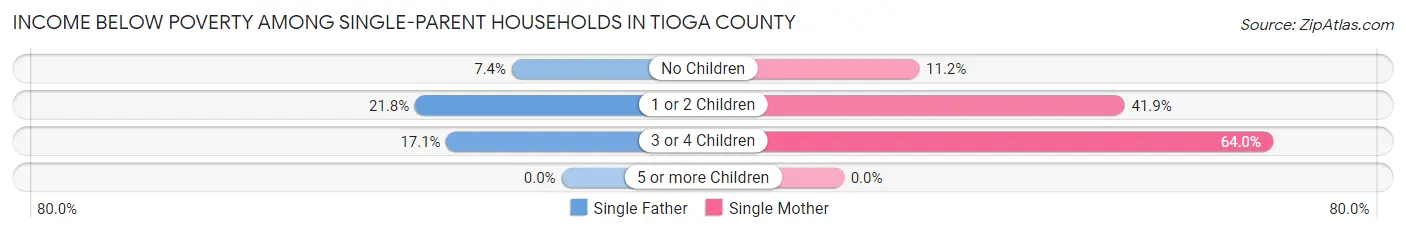
| Children | Single Father | Single Mother |
| No Children | 26 (7.4%) | 76 (11.2%) |
| 1 or 2 Children | 79 (21.8%) | 290 (41.8%) |
| 3 or 4 Children | 6 (17.1%) | 165 (63.9%) |
| 5 or more Children | 0 (0.0%) | 0 (0.0%) |
| Total | 111 (14.8%) | 531 (32.6%) |
Income Below Poverty Among Married-Couple vs Single-Parent Households in Tioga County
The poverty data for Tioga County shows that 307 of the married-couple family households (3.5%) and 642 of the single-parent households (27.0%) are living below the poverty level. Within the married-couple family households, those with 3 or 4 children have the highest poverty rate, with 60 households (7.6%) falling below the poverty line. Among the single-parent households, those with 3 or 4 children have the highest poverty rate, with 171 household (58.4%) living below poverty.
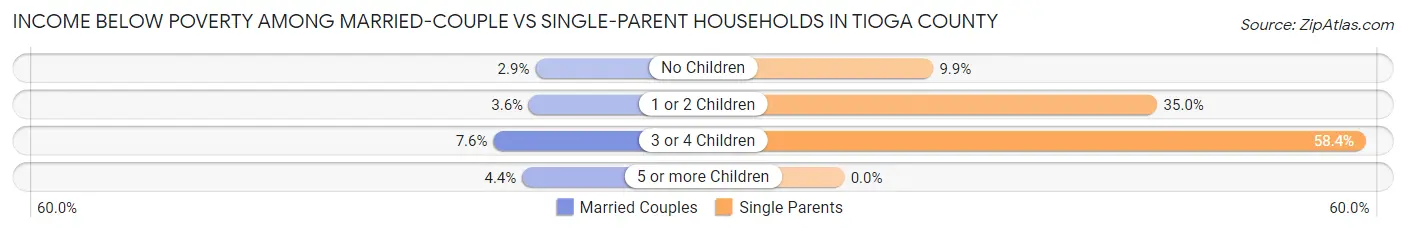
| Children | Married-Couple Families | Single-Parent Households |
| No Children | 170 (2.9%) | 102 (9.9%) |
| 1 or 2 Children | 73 (3.6%) | 369 (35.0%) |
| 3 or 4 Children | 60 (7.6%) | 171 (58.4%) |
| 5 or more Children | 4 (4.4%) | 0 (0.0%) |
| Total | 307 (3.5%) | 642 (27.0%) |
Race in Tioga County
The most populous races in Tioga County are White / Caucasian (39,649 | 96.3%), Two or more Races (814 | 2.0%), and Hispanic or Latino (558 | 1.3%).
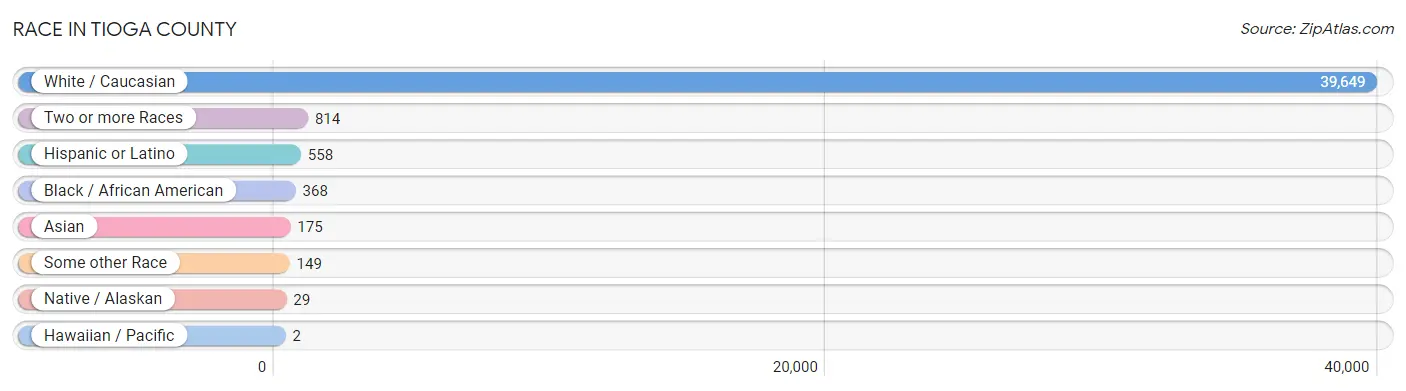
| Race | # Population | % Population |
| Asian | 175 | 0.4% |
| Black / African American | 368 | 0.9% |
| Hawaiian / Pacific | 2 | 0.0% |
| Hispanic or Latino | 558 | 1.3% |
| Native / Alaskan | 29 | 0.1% |
| White / Caucasian | 39,649 | 96.3% |
| Two or more Races | 814 | 2.0% |
| Some other Race | 149 | 0.4% |
| Total | 41,186 | 100.0% |
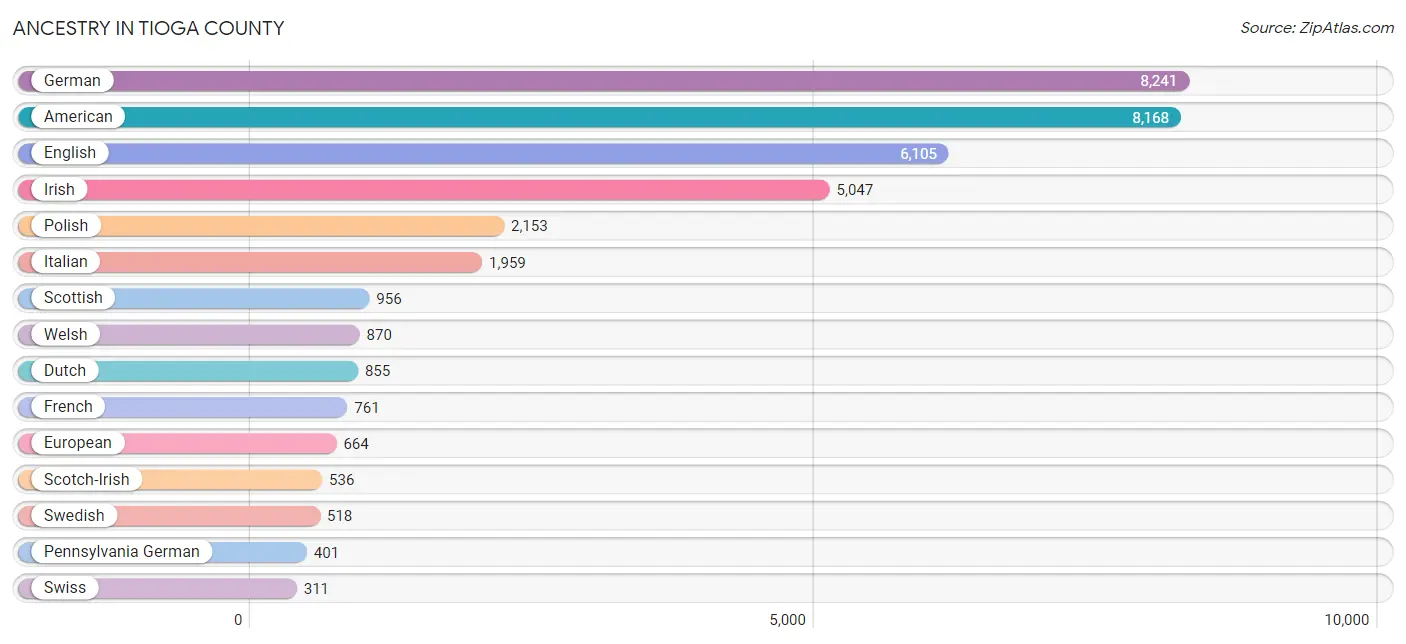
Ancestry in Tioga County
The most populous ancestries reported in Tioga County are German (8,241 | 20.0%), American (8,168 | 19.8%), English (6,105 | 14.8%), Irish (5,047 | 12.2%), and Polish (2,153 | 5.2%), together accounting for 72.1% of all Tioga County residents.
| Ancestry | # Population | % Population |
| African | 33 | 0.1% |
| Alaska Native | 7 | 0.0% |
| American | 8,168 | 19.8% |
| Apache | 1 | 0.0% |
| Arab | 28 | 0.1% |
| Austrian | 92 | 0.2% |
| Bahamian | 7 | 0.0% |
| Barbadian | 4 | 0.0% |
| Belgian | 2 | 0.0% |
| Bermudan | 11 | 0.0% |
| Bhutanese | 1 | 0.0% |
| Blackfeet | 5 | 0.0% |
| British | 163 | 0.4% |
| British West Indian | 3 | 0.0% |
| Burmese | 64 | 0.2% |
| Canadian | 55 | 0.1% |
| Celtic | 2 | 0.0% |
| Central American | 99 | 0.2% |
| Central American Indian | 1 | 0.0% |
| Cherokee | 49 | 0.1% |
| Chilean | 1 | 0.0% |
| Chippewa | 2 | 0.0% |
| Colombian | 17 | 0.0% |
| Creek | 5 | 0.0% |
| Croatian | 34 | 0.1% |
| Cuban | 6 | 0.0% |
| Czech | 104 | 0.3% |
| Czechoslovakian | 25 | 0.1% |
| Danish | 41 | 0.1% |
| Delaware | 7 | 0.0% |
| Dominican | 23 | 0.1% |
| Dutch | 855 | 2.1% |
| Eastern European | 27 | 0.1% |
| Egyptian | 5 | 0.0% |
| English | 6,105 | 14.8% |
| Ethiopian | 4 | 0.0% |
| European | 664 | 1.6% |
| Finnish | 39 | 0.1% |
| French | 761 | 1.8% |
| French American Indian | 3 | 0.0% |
| French Canadian | 114 | 0.3% |
| German | 8,241 | 20.0% |
| Greek | 162 | 0.4% |
| Guamanian / Chamorro | 2 | 0.0% |
| Guatemalan | 29 | 0.1% |
| Guyanese | 8 | 0.0% |
| Haitian | 11 | 0.0% |
| Honduran | 12 | 0.0% |
| Hungarian | 121 | 0.3% |
| Indian (Asian) | 48 | 0.1% |
| Iranian | 7 | 0.0% |
| Irish | 5,047 | 12.2% |
| Iroquois | 24 | 0.1% |
| Italian | 1,959 | 4.8% |
| Kenyan | 7 | 0.0% |
| Korean | 133 | 0.3% |
| Lebanese | 2 | 0.0% |
| Lithuanian | 82 | 0.2% |
| Lumbee | 2 | 0.0% |
| Mexican | 135 | 0.3% |
| Mexican American Indian | 14 | 0.0% |
| Navajo | 19 | 0.1% |
| Northern European | 89 | 0.2% |
| Norwegian | 138 | 0.3% |
| Okinawan | 6 | 0.0% |
| Panamanian | 10 | 0.0% |
| Pennsylvania German | 401 | 1.0% |
| Polish | 2,153 | 5.2% |
| Portuguese | 23 | 0.1% |
| Puerto Rican | 121 | 0.3% |
| Romanian | 17 | 0.0% |
| Russian | 105 | 0.3% |
| Salvadoran | 47 | 0.1% |
| Scandinavian | 53 | 0.1% |
| Scotch-Irish | 536 | 1.3% |
| Scottish | 956 | 2.3% |
| Serbian | 6 | 0.0% |
| Sioux | 17 | 0.0% |
| Slavic | 21 | 0.1% |
| Slovak | 76 | 0.2% |
| Slovene | 16 | 0.0% |
| South African | 1 | 0.0% |
| South American | 18 | 0.0% |
| Spaniard | 4 | 0.0% |
| Spanish | 51 | 0.1% |
| Sri Lankan | 7 | 0.0% |
| Subsaharan African | 47 | 0.1% |
| Swedish | 518 | 1.3% |
| Swiss | 311 | 0.8% |
| Syrian | 21 | 0.1% |
| Thai | 38 | 0.1% |
| Ukrainian | 113 | 0.3% |
| Welsh | 870 | 2.1% |
| West Indian | 1 | 0.0% |
| Yugoslavian | 8 | 0.0% | View All 95 Rows |
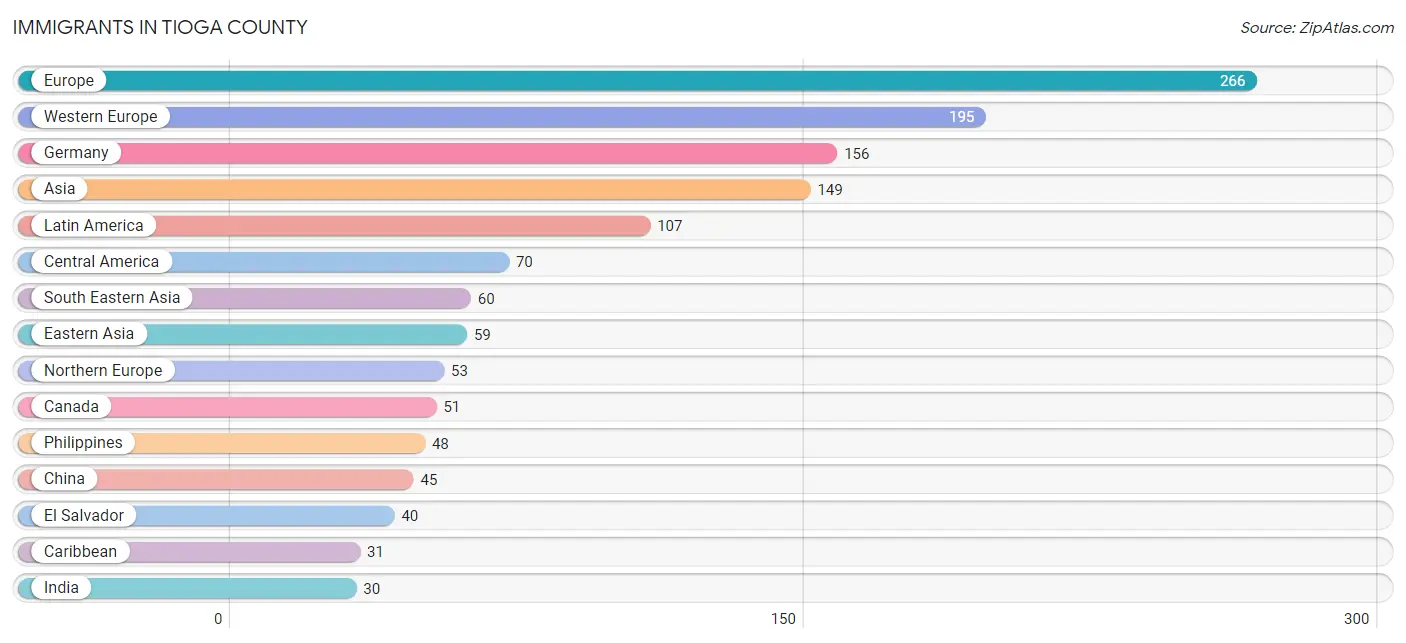
Immigrants in Tioga County
The most numerous immigrant groups reported in Tioga County came from Europe (266 | 0.6%), Western Europe (195 | 0.5%), Germany (156 | 0.4%), Asia (149 | 0.4%), and Latin America (107 | 0.3%), together accounting for 2.1% of all Tioga County residents.
| Immigration Origin | # Population | % Population |
| Africa | 23 | 0.1% |
| Asia | 149 | 0.4% |
| Austria | 27 | 0.1% |
| Bulgaria | 2 | 0.0% |
| Canada | 51 | 0.1% |
| Caribbean | 31 | 0.1% |
| Central America | 70 | 0.2% |
| China | 45 | 0.1% |
| Colombia | 5 | 0.0% |
| Cuba | 1 | 0.0% |
| Czechoslovakia | 5 | 0.0% |
| Dominican Republic | 11 | 0.0% |
| Eastern Africa | 12 | 0.0% |
| Eastern Asia | 59 | 0.1% |
| Eastern Europe | 14 | 0.0% |
| Egypt | 3 | 0.0% |
| El Salvador | 40 | 0.1% |
| England | 21 | 0.1% |
| Ethiopia | 4 | 0.0% |
| Europe | 266 | 0.6% |
| France | 1 | 0.0% |
| Germany | 156 | 0.4% |
| Greece | 4 | 0.0% |
| Guatemala | 15 | 0.0% |
| Haiti | 19 | 0.1% |
| India | 30 | 0.1% |
| Ireland | 2 | 0.0% |
| Kenya | 3 | 0.0% |
| Korea | 14 | 0.0% |
| Latin America | 107 | 0.3% |
| Liberia | 7 | 0.0% |
| Mexico | 15 | 0.0% |
| Netherlands | 11 | 0.0% |
| Northern Africa | 3 | 0.0% |
| Northern Europe | 53 | 0.1% |
| Norway | 5 | 0.0% |
| Oceania | 1 | 0.0% |
| Peru | 1 | 0.0% |
| Philippines | 48 | 0.1% |
| Romania | 5 | 0.0% |
| Scotland | 2 | 0.0% |
| Singapore | 11 | 0.0% |
| South Africa | 1 | 0.0% |
| South America | 6 | 0.0% |
| South Central Asia | 30 | 0.1% |
| South Eastern Asia | 60 | 0.2% |
| Southern Europe | 4 | 0.0% |
| Taiwan | 10 | 0.0% |
| Ukraine | 2 | 0.0% |
| Vietnam | 1 | 0.0% |
| Western Africa | 7 | 0.0% |
| Western Europe | 195 | 0.5% |
| Zimbabwe | 3 | 0.0% | View All 53 Rows |
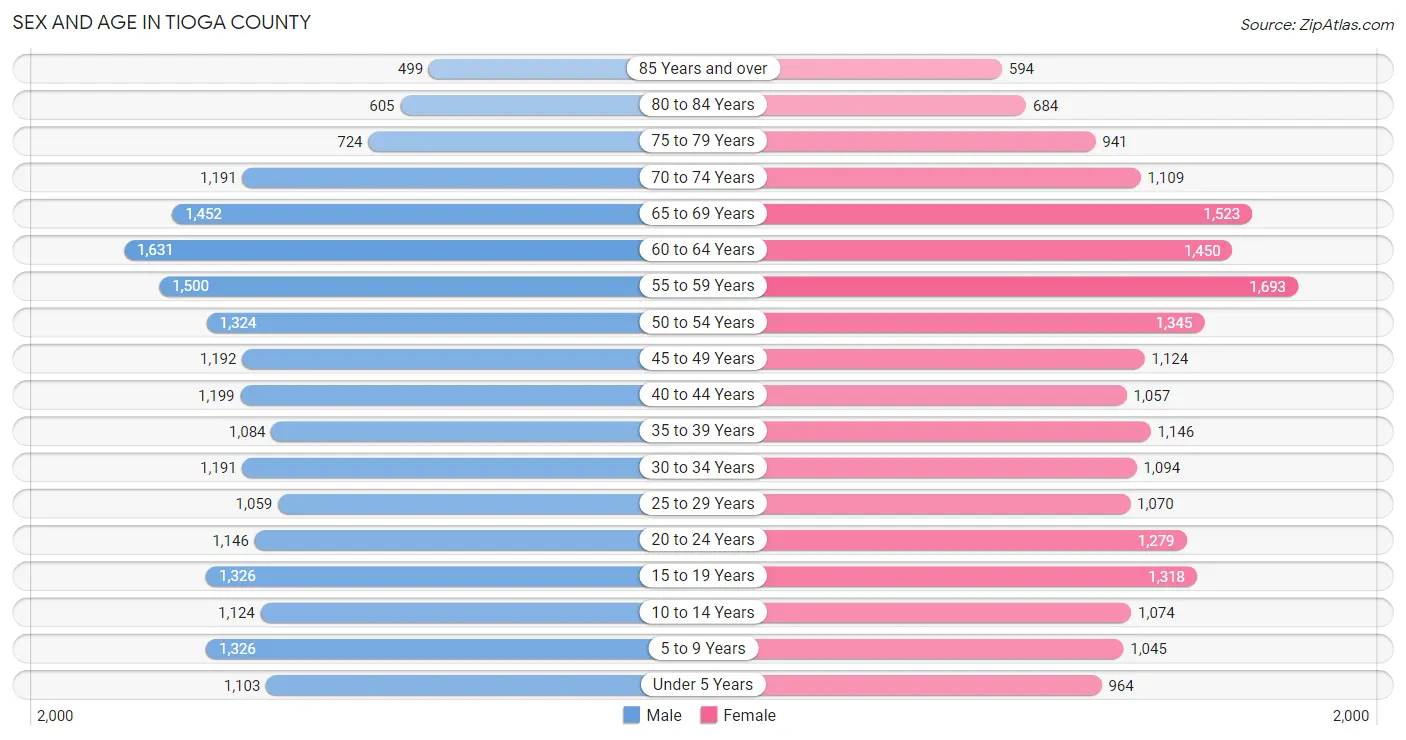
Sex and Age in Tioga County
Sex and Age in Tioga County
The most populous age groups in Tioga County are 60 to 64 Years (1,631 | 7.9%) for men and 55 to 59 Years (1,693 | 8.3%) for women.
| Age Bracket | Male | Female |
| Under 5 Years | 1,103 (5.3%) | 964 (4.7%) |
| 5 to 9 Years | 1,326 (6.4%) | 1,045 (5.1%) |
| 10 to 14 Years | 1,124 (5.4%) | 1,074 (5.2%) |
| 15 to 19 Years | 1,326 (6.4%) | 1,318 (6.4%) |
| 20 to 24 Years | 1,146 (5.5%) | 1,279 (6.2%) |
| 25 to 29 Years | 1,059 (5.1%) | 1,070 (5.2%) |
| 30 to 34 Years | 1,191 (5.8%) | 1,094 (5.3%) |
| 35 to 39 Years | 1,084 (5.2%) | 1,146 (5.6%) |
| 40 to 44 Years | 1,199 (5.8%) | 1,057 (5.1%) |
| 45 to 49 Years | 1,192 (5.8%) | 1,124 (5.5%) |
| 50 to 54 Years | 1,324 (6.4%) | 1,345 (6.6%) |
| 55 to 59 Years | 1,500 (7.2%) | 1,693 (8.3%) |
| 60 to 64 Years | 1,631 (7.9%) | 1,450 (7.1%) |
| 65 to 69 Years | 1,452 (7.0%) | 1,523 (7.4%) |
| 70 to 74 Years | 1,191 (5.8%) | 1,109 (5.4%) |
| 75 to 79 Years | 724 (3.5%) | 941 (4.6%) |
| 80 to 84 Years | 605 (2.9%) | 684 (3.3%) |
| 85 Years and over | 499 (2.4%) | 594 (2.9%) |
| Total | 20,676 (100.0%) | 20,510 (100.0%) |
Families and Households in Tioga County
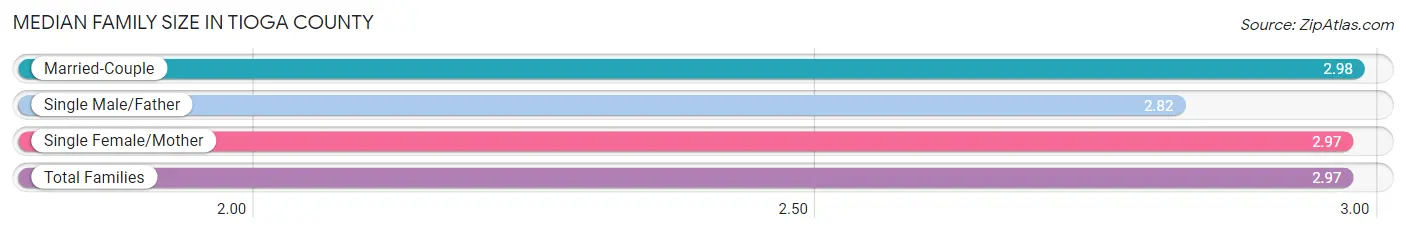
Median Family Size in Tioga County
The median family size in Tioga County is 2.97 persons per family, with married-couple families (8,689 | 78.5%) accounting for the largest median family size of 2.98 persons per family. On the other hand, single male/father families (749 | 6.8%) represent the smallest median family size with 2.82 persons per family.
| Family Type | # Families | Family Size |
| Married-Couple | 8,689 (78.5%) | 2.98 |
| Single Male/Father | 749 (6.8%) | 2.82 |
| Single Female/Mother | 1,627 (14.7%) | 2.97 |
| Total Families | 11,065 (100.0%) | 2.97 |
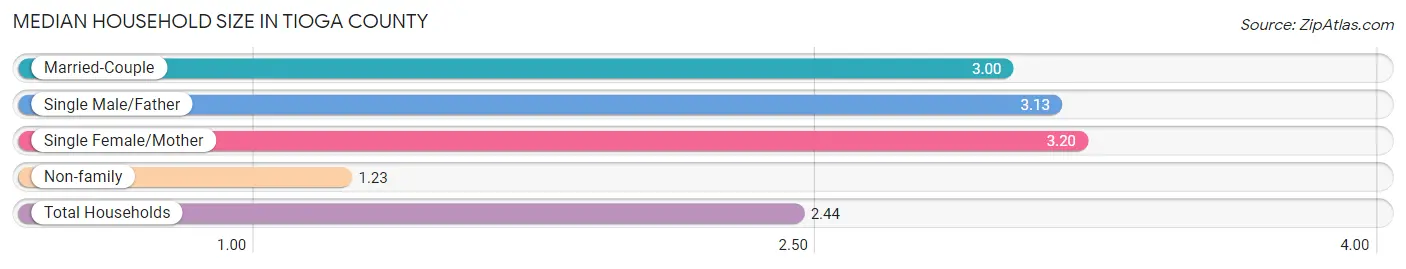
Median Household Size in Tioga County
The median household size in Tioga County is 2.44 persons per household, with single female/mother households (1,627 | 9.8%) accounting for the largest median household size of 3.2 persons per household. non-family households (5,518 | 33.3%) represent the smallest median household size with 1.23 persons per household.
| Household Type | # Households | Household Size |
| Married-Couple | 8,689 (52.4%) | 3.00 |
| Single Male/Father | 749 (4.5%) | 3.13 |
| Single Female/Mother | 1,627 (9.8%) | 3.20 |
| Non-family | 5,518 (33.3%) | 1.23 |
| Total Households | 16,583 (100.0%) | 2.44 |
Household Size by Marriage Status in Tioga County
Out of a total of 16,583 households in Tioga County, 11,065 (66.7%) are family households, while 5,518 (33.3%) are nonfamily households. The most numerous type of family households are 2-person households, comprising 5,630, and the most common type of nonfamily households are 1-person households, comprising 4,503.
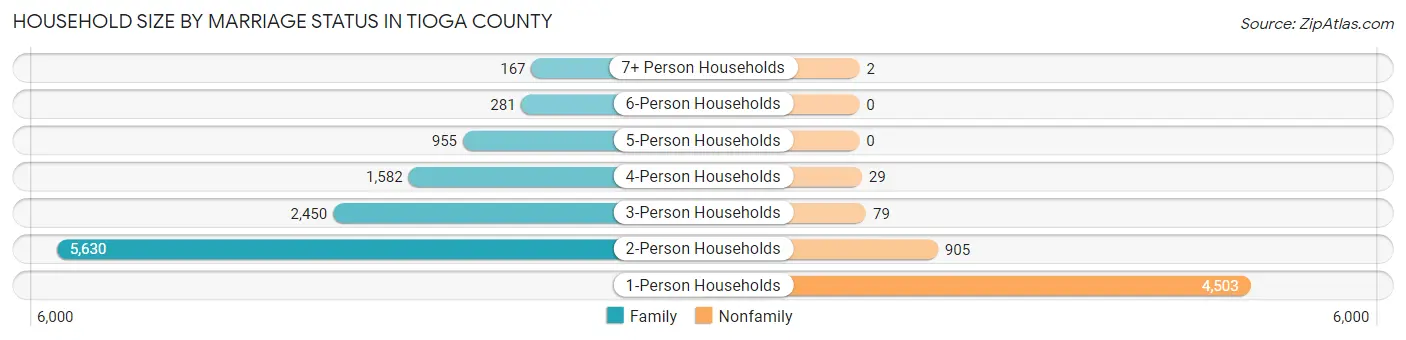
| Household Size | Family Households | Nonfamily Households |
| 1-Person Households | - | 4,503 (27.2%) |
| 2-Person Households | 5,630 (34.0%) | 905 (5.5%) |
| 3-Person Households | 2,450 (14.8%) | 79 (0.5%) |
| 4-Person Households | 1,582 (9.5%) | 29 (0.2%) |
| 5-Person Households | 955 (5.8%) | 0 (0.0%) |
| 6-Person Households | 281 (1.7%) | 0 (0.0%) |
| 7+ Person Households | 167 (1.0%) | 2 (0.0%) |
| Total | 11,065 (66.7%) | 5,518 (33.3%) |
Female Fertility in Tioga County
Fertility by Age in Tioga County
Average fertility rate in Tioga County is 57.0 births per 1,000 women. Women in the age bracket of 20 to 34 years have the highest fertility rate with 105.0 births per 1,000 women. Women in the age bracket of 20 to 34 years acount for 75.0% of all women with births.
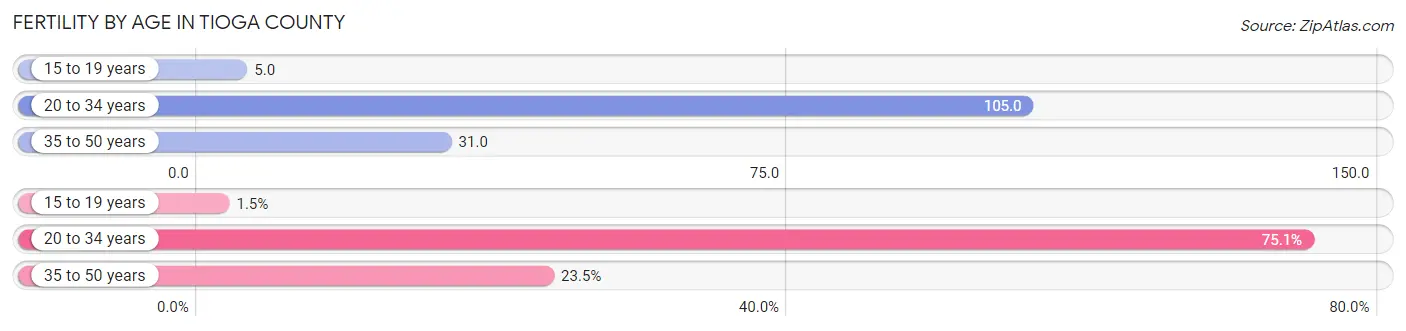
| Age Bracket | Women with Births | Births / 1,000 Women |
| 15 to 19 years | 7 (1.5%) | 5.0 |
| 20 to 34 years | 361 (75.0%) | 105.0 |
| 35 to 50 years | 113 (23.5%) | 31.0 |
| Total | 481 (100.0%) | 57.0 |
Fertility by Age by Marriage Status in Tioga County
70.5% of women with births (481) in Tioga County are married. The highest percentage of unmarried women with births falls into 15 to 19 years age bracket with 100.0% of them unmarried at the time of birth, while the lowest percentage of unmarried women with births belong to 35 to 50 years age bracket with 22.1% of them unmarried.
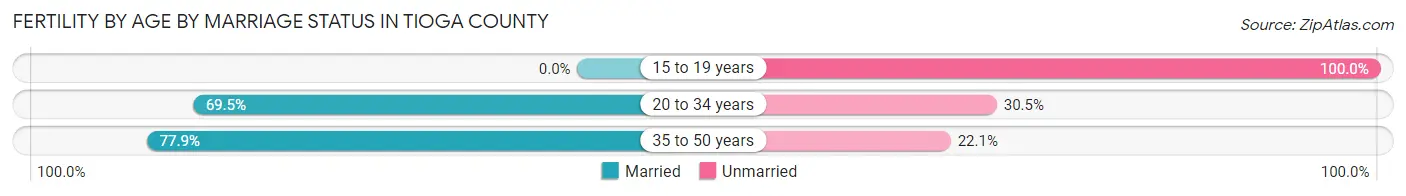
| Age Bracket | Married | Unmarried |
| 15 to 19 years | 0 (0.0%) | 7 (100.0%) |
| 20 to 34 years | 251 (69.5%) | 110 (30.5%) |
| 35 to 50 years | 88 (77.9%) | 25 (22.1%) |
| Total | 339 (70.5%) | 142 (29.5%) |
Fertility by Education in Tioga County
Average fertility rate in Tioga County is 57.0 births per 1,000 women. Women with the education attainment of bachelor's degree have the highest fertility rate of 126.0 births per 1,000 women, while women with the education attainment of less than high school have the lowest fertility at 29.0 births per 1,000 women. Women with the education attainment of bachelor's degree represent 37.2% of all women with births.
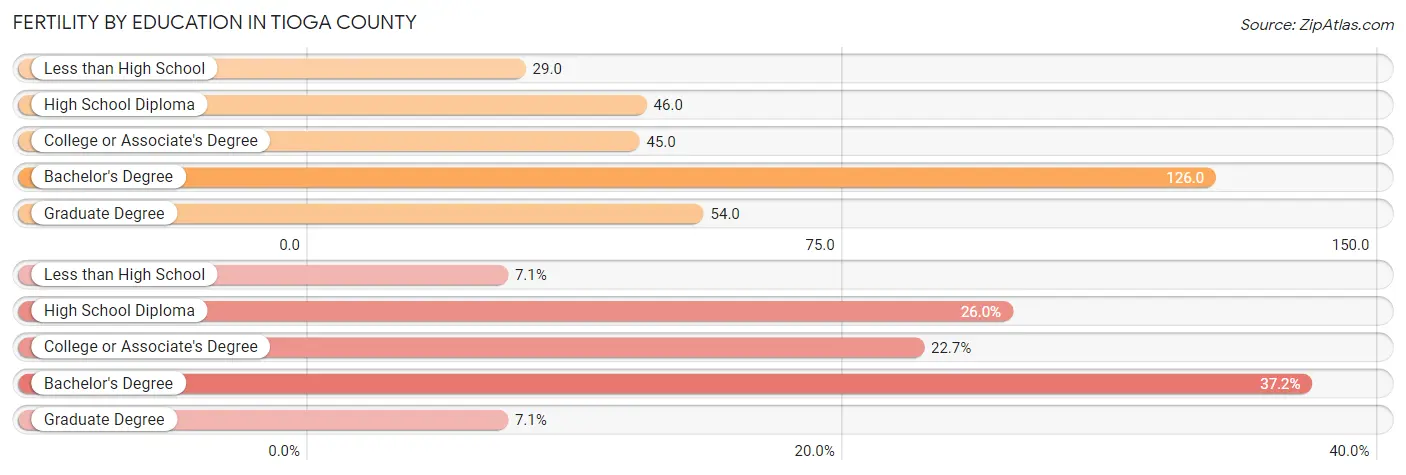
| Educational Attainment | Women with Births | Births / 1,000 Women |
| Less than High School | 34 (7.1%) | 29.0 |
| High School Diploma | 125 (26.0%) | 46.0 |
| College or Associate's Degree | 109 (22.7%) | 45.0 |
| Bachelor's Degree | 179 (37.2%) | 126.0 |
| Graduate Degree | 34 (7.1%) | 54.0 |
| Total | 481 (100.0%) | 57.0 |
Fertility by Education by Marriage Status in Tioga County
29.5% of women with births in Tioga County are unmarried. Women with the educational attainment of graduate degree are most likely to be married with 100.0% of them married at childbirth, while women with the educational attainment of less than high school are least likely to be married with 58.8% of them unmarried at childbirth.
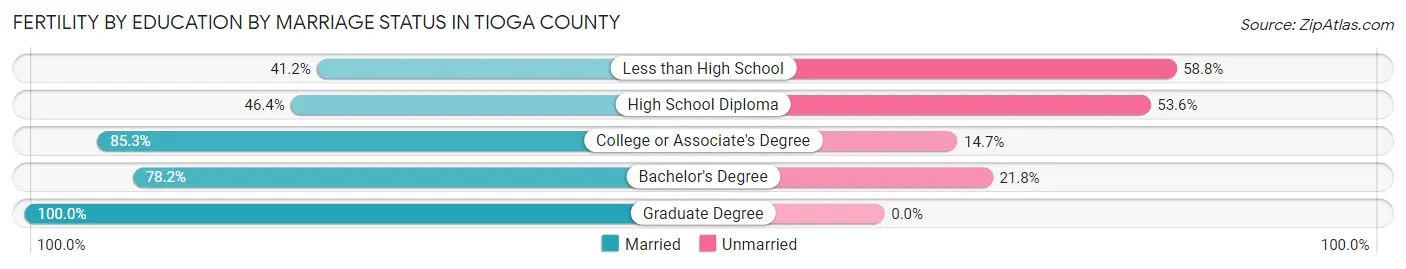
| Educational Attainment | Married | Unmarried |
| Less than High School | 14 (41.2%) | 20 (58.8%) |
| High School Diploma | 58 (46.4%) | 67 (53.6%) |
| College or Associate's Degree | 93 (85.3%) | 16 (14.7%) |
| Bachelor's Degree | 140 (78.2%) | 39 (21.8%) |
| Graduate Degree | 34 (100.0%) | 0 (0.0%) |
| Total | 339 (70.5%) | 142 (29.5%) |
Employment Characteristics in Tioga County
Employment by Class of Employer in Tioga County
Among the 18,275 employed individuals in Tioga County, private company employees (11,409 | 62.4%), not-for-profit organizations (2,152 | 11.8%), and self-employed (not incorporated) (1,650 | 9.0%) make up the most common classes of employment.
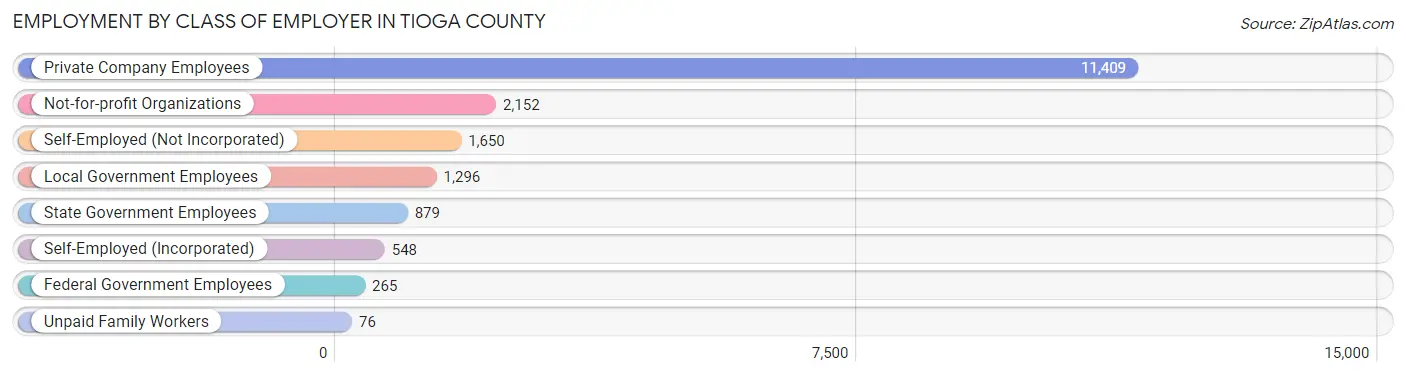
| Employer Class | # Employees | % Employees |
| Private Company Employees | 11,409 | 62.4% |
| Self-Employed (Incorporated) | 548 | 3.0% |
| Self-Employed (Not Incorporated) | 1,650 | 9.0% |
| Not-for-profit Organizations | 2,152 | 11.8% |
| Local Government Employees | 1,296 | 7.1% |
| State Government Employees | 879 | 4.8% |
| Federal Government Employees | 265 | 1.5% |
| Unpaid Family Workers | 76 | 0.4% |
| Total | 18,275 | 100.0% |
Employment Status by Age in Tioga County
According to the labor force statistics for Tioga County, out of the total population over 16 years of age (34,162), 56.8% or 19,404 individuals are in the labor force, with 4.5% or 873 of them unemployed. The age group with the highest labor force participation rate is 30 to 34 years, with 84.1% or 1,922 individuals in the labor force. Within the labor force, the 16 to 19 years age range has the highest percentage of unemployed individuals, with 15.6% or 140 of them being unemployed.
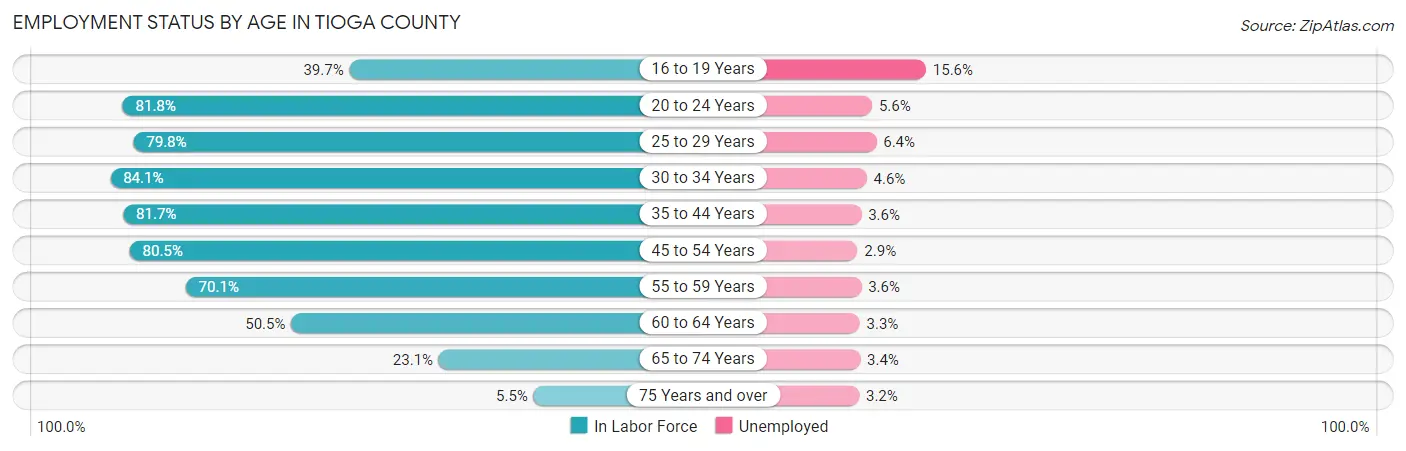
| Age Bracket | In Labor Force | Unemployed |
| 16 to 19 Years | 896 (39.7%) | 140 (15.6%) |
| 20 to 24 Years | 1,984 (81.8%) | 111 (5.6%) |
| 25 to 29 Years | 1,699 (79.8%) | 109 (6.4%) |
| 30 to 34 Years | 1,922 (84.1%) | 88 (4.6%) |
| 35 to 44 Years | 3,665 (81.7%) | 132 (3.6%) |
| 45 to 54 Years | 4,013 (80.5%) | 116 (2.9%) |
| 55 to 59 Years | 2,238 (70.1%) | 81 (3.6%) |
| 60 to 64 Years | 1,556 (50.5%) | 51 (3.3%) |
| 65 to 74 Years | 1,219 (23.1%) | 41 (3.4%) |
| 75 Years and over | 223 (5.5%) | 7 (3.2%) |
| Total | 19,404 (56.8%) | 873 (4.5%) |
Employment Status by Educational Attainment in Tioga County
According to labor force statistics for Tioga County, 74.9% of individuals (15,099) out of the total population between 25 and 64 years of age (20,159) are in the labor force, with 3.8% or 574 of them being unemployed. The group with the highest labor force participation rate are those with the educational attainment of bachelor's degree or higher, with 84.4% or 3,893 individuals in the labor force. Within the labor force, individuals with less than high school education have the highest percentage of unemployment, with 8.7% or 73 of them being unemployed.
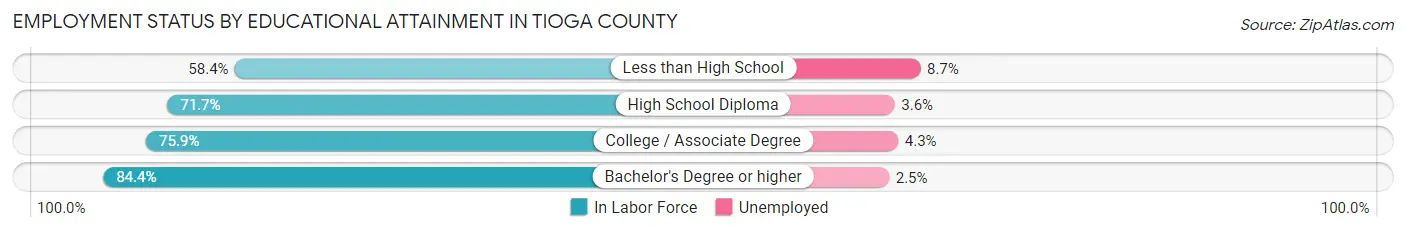
| Educational Attainment | In Labor Force | Unemployed |
| Less than High School | 840 (58.4%) | 125 (8.7%) |
| High School Diploma | 6,008 (71.7%) | 302 (3.6%) |
| College / Associate Degree | 4,349 (75.9%) | 246 (4.3%) |
| Bachelor's Degree or higher | 3,893 (84.4%) | 115 (2.5%) |
| Total | 15,099 (74.9%) | 766 (3.8%) |
Employment Occupations by Sex in Tioga County
Management, Business, Science and Arts Occupations
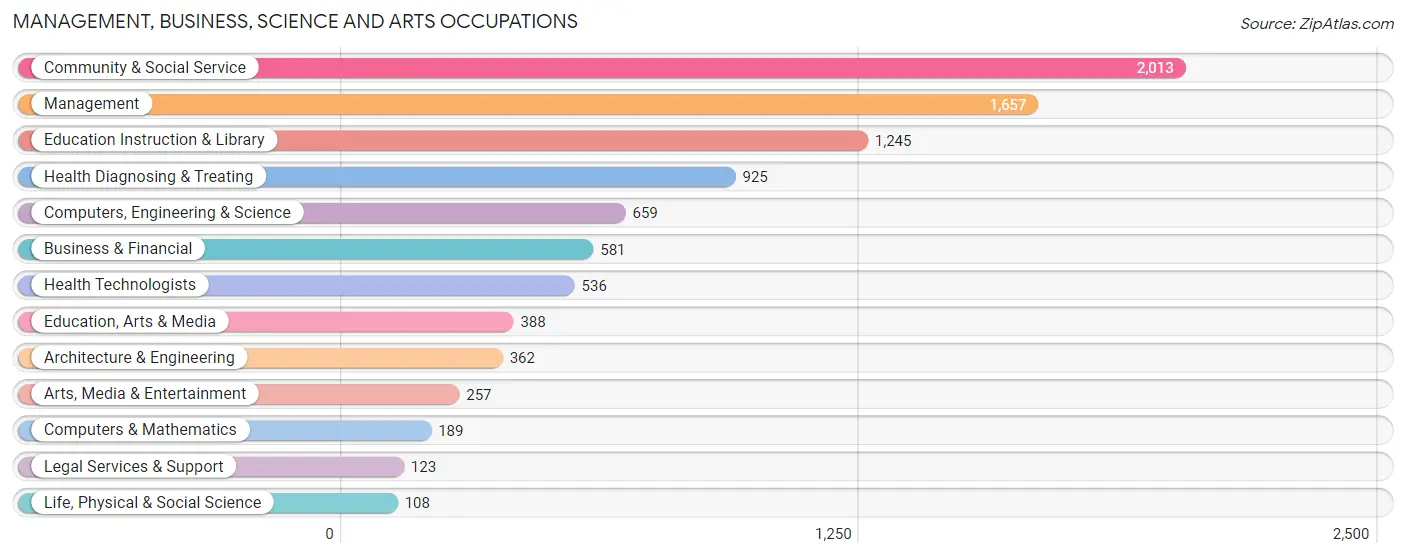
The most common Management, Business, Science and Arts occupations in Tioga County are Community & Social Service (2,013 | 10.9%), Management (1,657 | 8.9%), Education Instruction & Library (1,245 | 6.7%), Health Diagnosing & Treating (925 | 5.0%), and Computers, Engineering & Science (659 | 3.6%).
Management, Business, Science and Arts Occupations by Sex
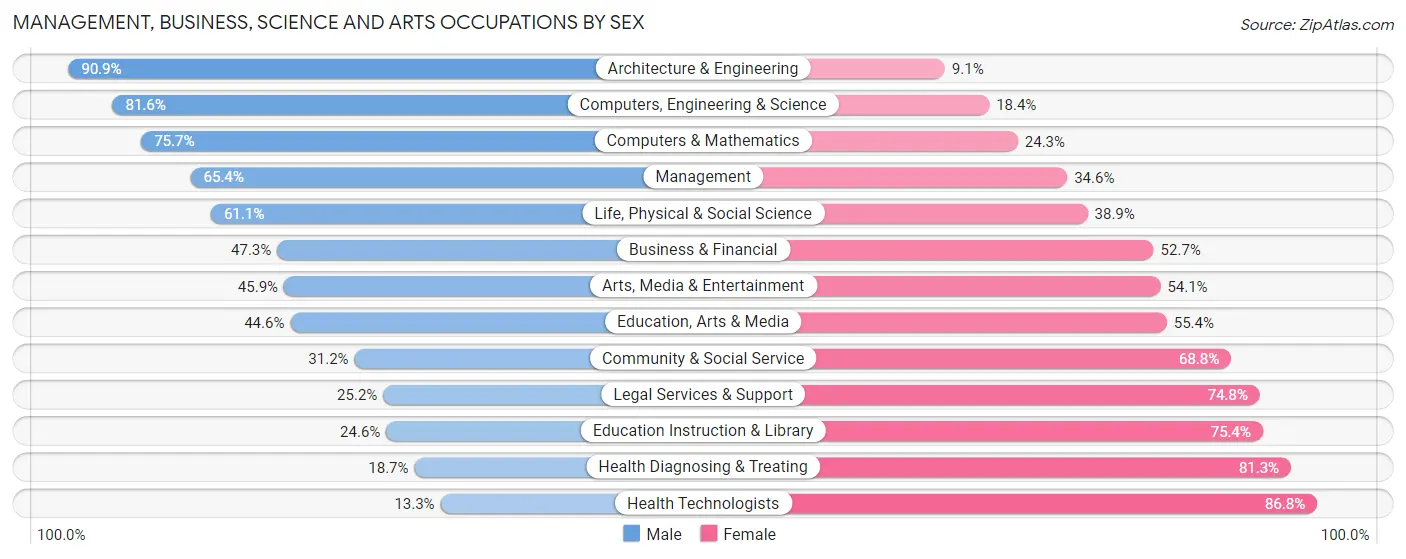
Within the Management, Business, Science and Arts occupations in Tioga County, the most male-oriented occupations are Architecture & Engineering (90.9%), Computers, Engineering & Science (81.6%), and Computers & Mathematics (75.7%), while the most female-oriented occupations are Health Technologists (86.8%), Health Diagnosing & Treating (81.3%), and Education Instruction & Library (75.4%).
| Occupation | Male | Female |
| Management | 1,083 (65.4%) | 574 (34.6%) |
| Business & Financial | 275 (47.3%) | 306 (52.7%) |
| Computers, Engineering & Science | 538 (81.6%) | 121 (18.4%) |
| Computers & Mathematics | 143 (75.7%) | 46 (24.3%) |
| Architecture & Engineering | 329 (90.9%) | 33 (9.1%) |
| Life, Physical & Social Science | 66 (61.1%) | 42 (38.9%) |
| Community & Social Service | 628 (31.2%) | 1,385 (68.8%) |
| Education, Arts & Media | 173 (44.6%) | 215 (55.4%) |
| Legal Services & Support | 31 (25.2%) | 92 (74.8%) |
| Education Instruction & Library | 306 (24.6%) | 939 (75.4%) |
| Arts, Media & Entertainment | 118 (45.9%) | 139 (54.1%) |
| Health Diagnosing & Treating | 173 (18.7%) | 752 (81.3%) |
| Health Technologists | 71 (13.3%) | 465 (86.8%) |
| Total (Category) | 2,697 (46.2%) | 3,138 (53.8%) |
| Total (Overall) | 9,828 (53.0%) | 8,701 (47.0%) |
Services Occupations
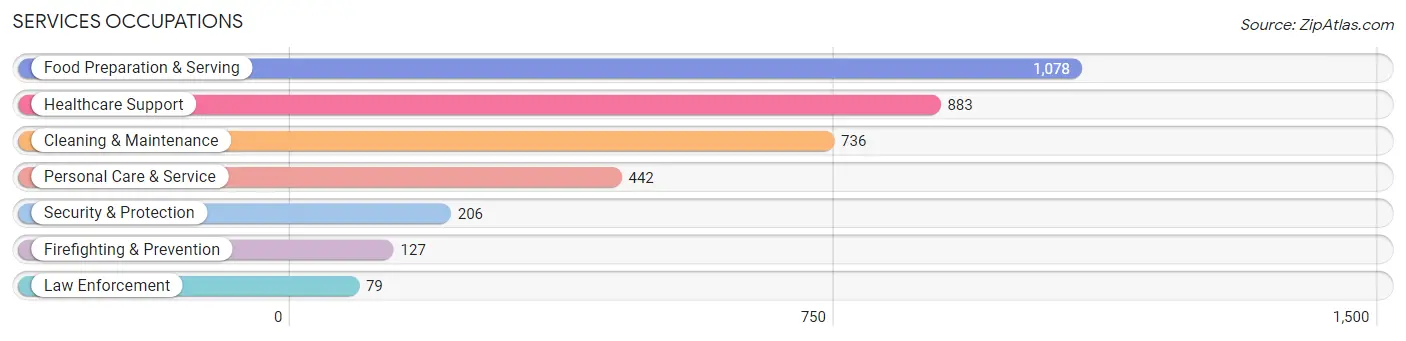
The most common Services occupations in Tioga County are Food Preparation & Serving (1,078 | 5.8%), Healthcare Support (883 | 4.8%), Cleaning & Maintenance (736 | 4.0%), Personal Care & Service (442 | 2.4%), and Security & Protection (206 | 1.1%).
Services Occupations by Sex
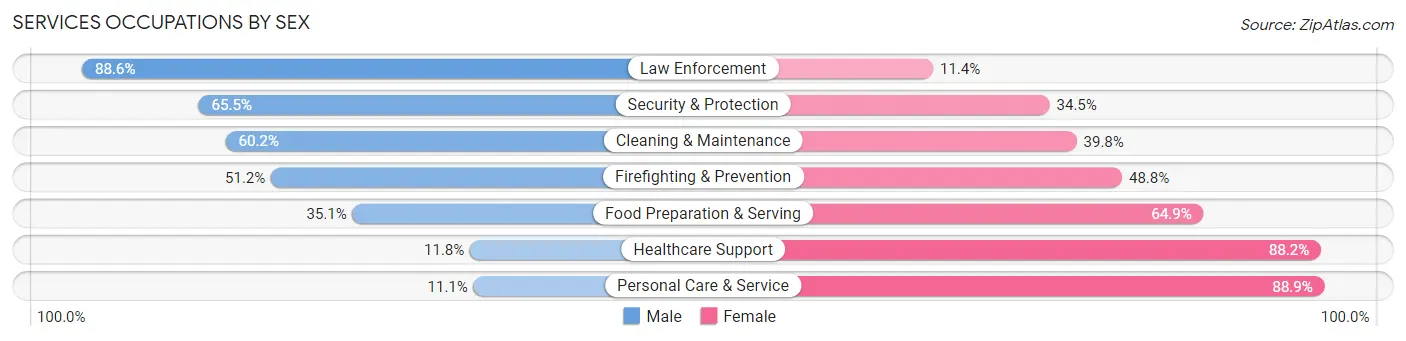
Within the Services occupations in Tioga County, the most male-oriented occupations are Law Enforcement (88.6%), Security & Protection (65.5%), and Cleaning & Maintenance (60.2%), while the most female-oriented occupations are Personal Care & Service (88.9%), Healthcare Support (88.2%), and Food Preparation & Serving (64.9%).
| Occupation | Male | Female |
| Healthcare Support | 104 (11.8%) | 779 (88.2%) |
| Security & Protection | 135 (65.5%) | 71 (34.5%) |
| Firefighting & Prevention | 65 (51.2%) | 62 (48.8%) |
| Law Enforcement | 70 (88.6%) | 9 (11.4%) |
| Food Preparation & Serving | 378 (35.1%) | 700 (64.9%) |
| Cleaning & Maintenance | 443 (60.2%) | 293 (39.8%) |
| Personal Care & Service | 49 (11.1%) | 393 (88.9%) |
| Total (Category) | 1,109 (33.2%) | 2,236 (66.8%) |
| Total (Overall) | 9,828 (53.0%) | 8,701 (47.0%) |
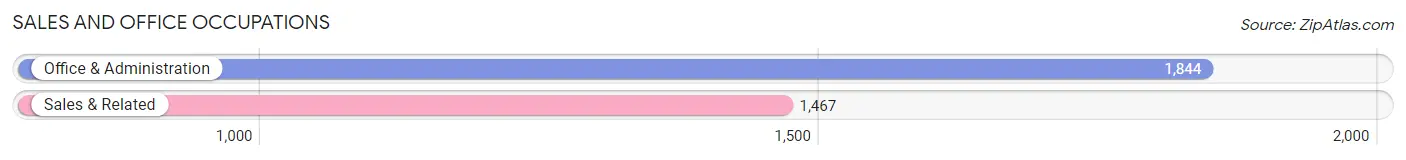
Sales and Office Occupations
The most common Sales and Office occupations in Tioga County are Office & Administration (1,844 | 10.0%), and Sales & Related (1,467 | 7.9%).
Sales and Office Occupations by Sex
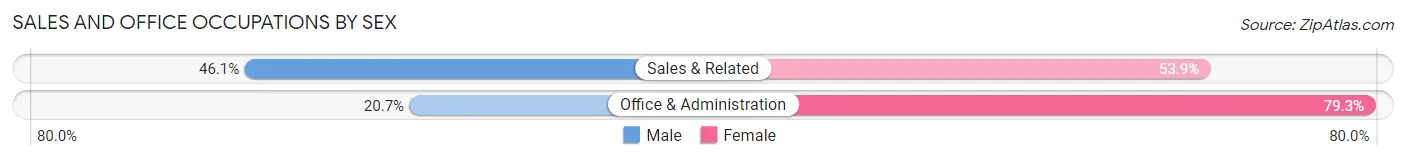
| Occupation | Male | Female |
| Sales & Related | 676 (46.1%) | 791 (53.9%) |
| Office & Administration | 382 (20.7%) | 1,462 (79.3%) |
| Total (Category) | 1,058 (32.0%) | 2,253 (68.0%) |
| Total (Overall) | 9,828 (53.0%) | 8,701 (47.0%) |
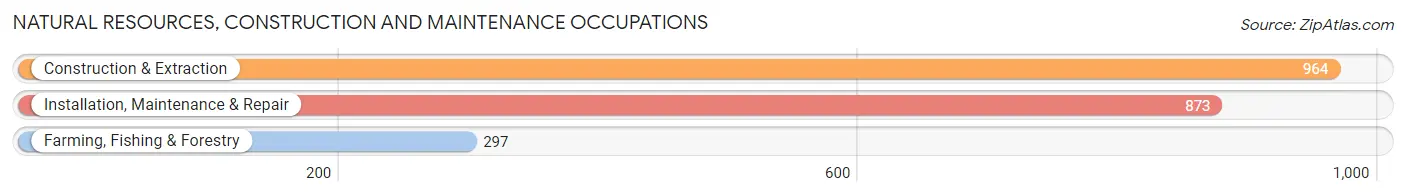
Natural Resources, Construction and Maintenance Occupations
The most common Natural Resources, Construction and Maintenance occupations in Tioga County are Construction & Extraction (964 | 5.2%), Installation, Maintenance & Repair (873 | 4.7%), and Farming, Fishing & Forestry (297 | 1.6%).
Natural Resources, Construction and Maintenance Occupations by Sex
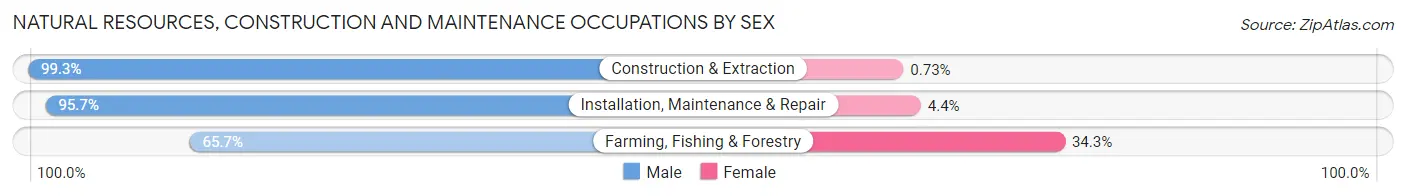
| Occupation | Male | Female |
| Farming, Fishing & Forestry | 195 (65.7%) | 102 (34.3%) |
| Construction & Extraction | 957 (99.3%) | 7 (0.7%) |
| Installation, Maintenance & Repair | 835 (95.7%) | 38 (4.3%) |
| Total (Category) | 1,987 (93.1%) | 147 (6.9%) |
| Total (Overall) | 9,828 (53.0%) | 8,701 (47.0%) |
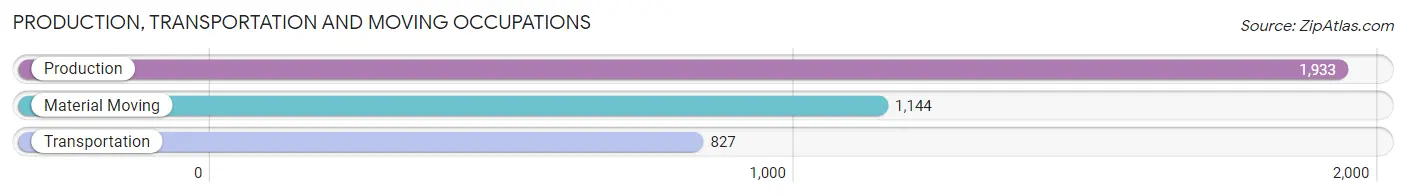
Production, Transportation and Moving Occupations
The most common Production, Transportation and Moving occupations in Tioga County are Production (1,933 | 10.4%), Material Moving (1,144 | 6.2%), and Transportation (827 | 4.5%).
Production, Transportation and Moving Occupations by Sex
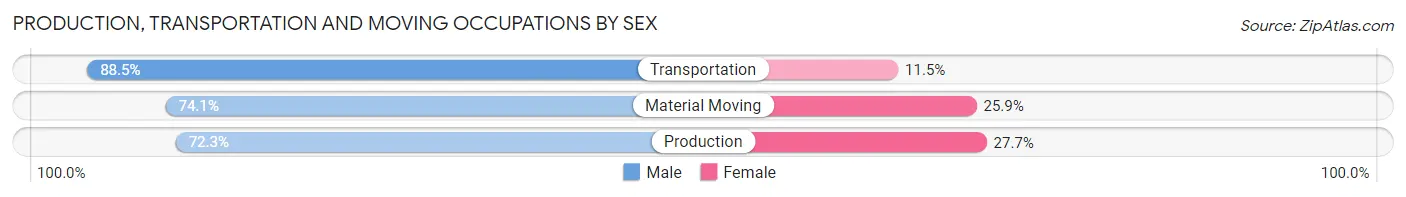
| Occupation | Male | Female |
| Production | 1,397 (72.3%) | 536 (27.7%) |
| Transportation | 732 (88.5%) | 95 (11.5%) |
| Material Moving | 848 (74.1%) | 296 (25.9%) |
| Total (Category) | 2,977 (76.3%) | 927 (23.7%) |
| Total (Overall) | 9,828 (53.0%) | 8,701 (47.0%) |
Employment Industries by Sex in Tioga County
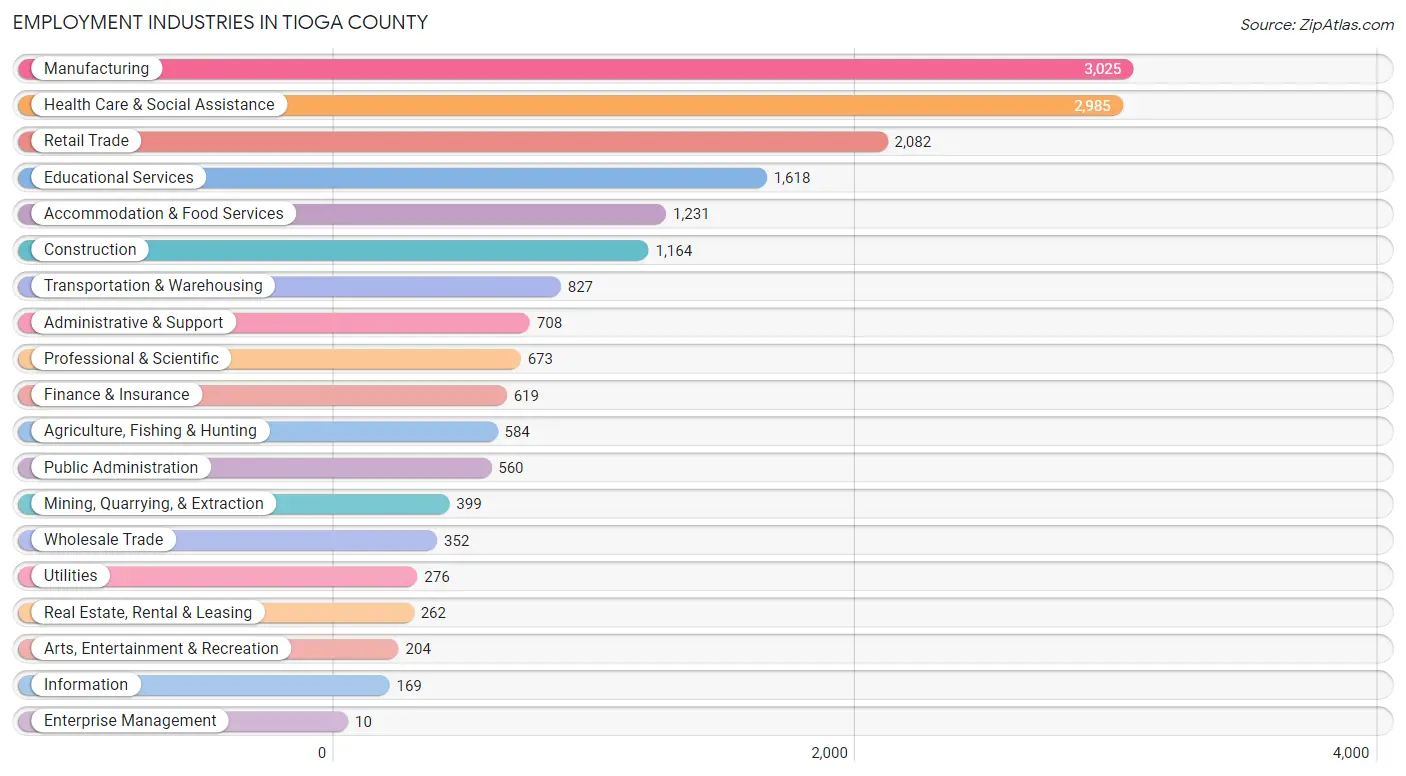
Employment Industries in Tioga County
The major employment industries in Tioga County include Manufacturing (3,025 | 16.3%), Health Care & Social Assistance (2,985 | 16.1%), Retail Trade (2,082 | 11.2%), Educational Services (1,618 | 8.7%), and Accommodation & Food Services (1,231 | 6.6%).
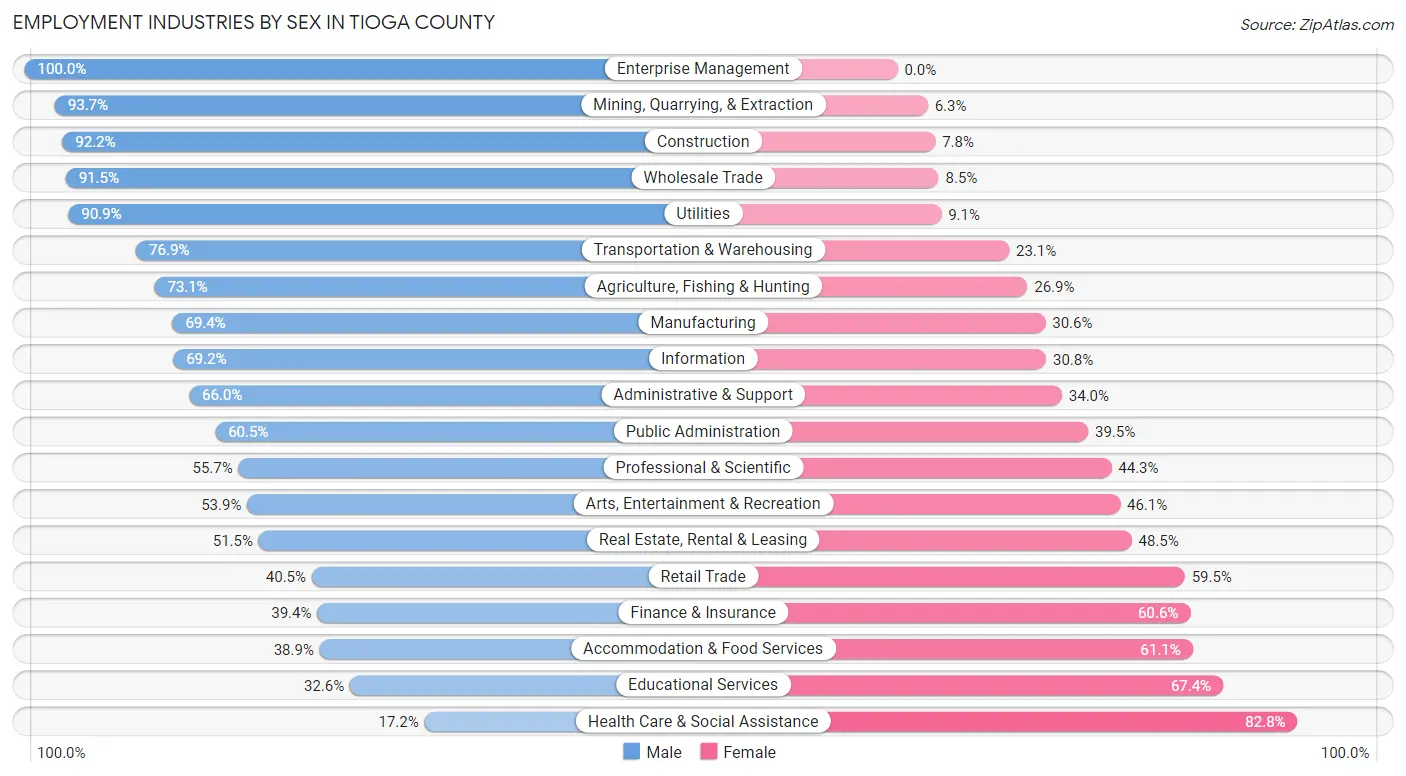
Employment Industries by Sex in Tioga County
The Tioga County industries that see more men than women are Enterprise Management (100.0%), Mining, Quarrying, & Extraction (93.7%), and Construction (92.2%), whereas the industries that tend to have a higher number of women are Health Care & Social Assistance (82.8%), Educational Services (67.4%), and Accommodation & Food Services (61.1%).
| Industry | Male | Female |
| Agriculture, Fishing & Hunting | 427 (73.1%) | 157 (26.9%) |
| Mining, Quarrying, & Extraction | 374 (93.7%) | 25 (6.3%) |
| Construction | 1,073 (92.2%) | 91 (7.8%) |
| Manufacturing | 2,099 (69.4%) | 926 (30.6%) |
| Wholesale Trade | 322 (91.5%) | 30 (8.5%) |
| Retail Trade | 844 (40.5%) | 1,238 (59.5%) |
| Transportation & Warehousing | 636 (76.9%) | 191 (23.1%) |
| Utilities | 251 (90.9%) | 25 (9.1%) |
| Information | 117 (69.2%) | 52 (30.8%) |
| Finance & Insurance | 244 (39.4%) | 375 (60.6%) |
| Real Estate, Rental & Leasing | 135 (51.5%) | 127 (48.5%) |
| Professional & Scientific | 375 (55.7%) | 298 (44.3%) |
| Enterprise Management | 10 (100.0%) | 0 (0.0%) |
| Administrative & Support | 467 (66.0%) | 241 (34.0%) |
| Educational Services | 528 (32.6%) | 1,090 (67.4%) |
| Health Care & Social Assistance | 514 (17.2%) | 2,471 (82.8%) |
| Arts, Entertainment & Recreation | 110 (53.9%) | 94 (46.1%) |
| Accommodation & Food Services | 479 (38.9%) | 752 (61.1%) |
| Public Administration | 339 (60.5%) | 221 (39.5%) |
| Total | 9,828 (53.0%) | 8,701 (47.0%) |
Education in Tioga County
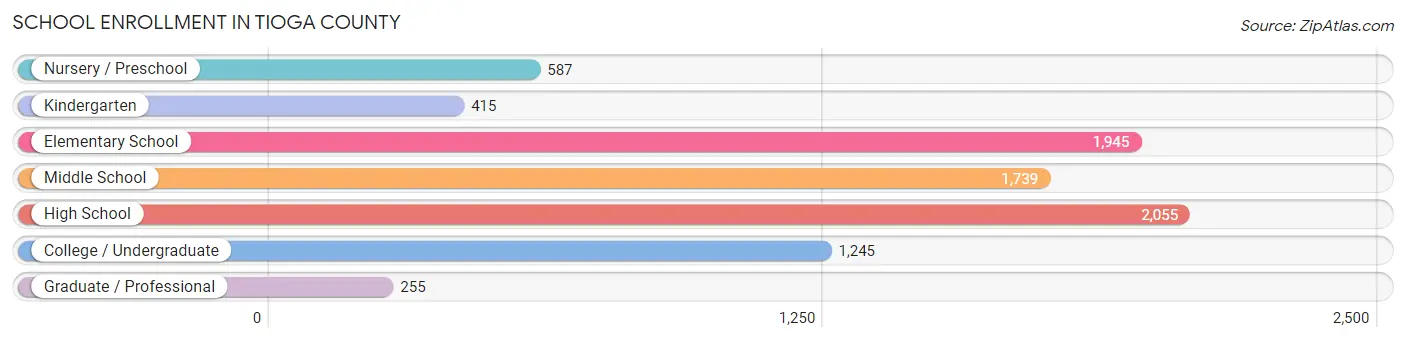
School Enrollment in Tioga County
The most common levels of schooling among the 8,241 students in Tioga County are high school (2,055 | 24.9%), elementary school (1,945 | 23.6%), and middle school (1,739 | 21.1%).
| School Level | # Students | % Students |
| Nursery / Preschool | 587 | 7.1% |
| Kindergarten | 415 | 5.0% |
| Elementary School | 1,945 | 23.6% |
| Middle School | 1,739 | 21.1% |
| High School | 2,055 | 24.9% |
| College / Undergraduate | 1,245 | 15.1% |
| Graduate / Professional | 255 | 3.1% |
| Total | 8,241 | 100.0% |
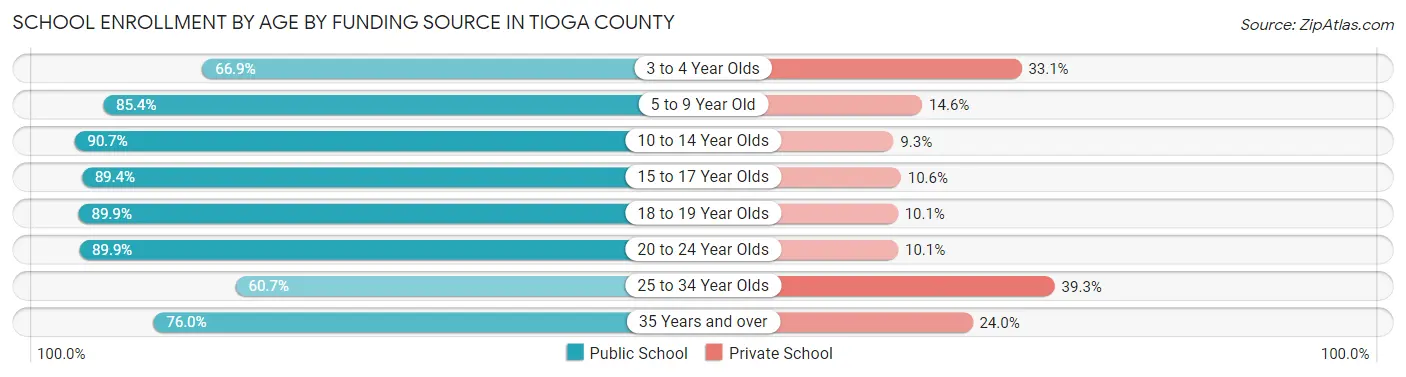
School Enrollment by Age by Funding Source in Tioga County
Out of a total of 8,241 students who are enrolled in schools in Tioga County, 1,137 (13.8%) attend a private institution, while the remaining 7,104 (86.2%) are enrolled in public schools. The age group of 25 to 34 year olds has the highest likelihood of being enrolled in private schools, with 101 (39.3% in the age bracket) enrolled. Conversely, the age group of 10 to 14 year olds has the lowest likelihood of being enrolled in a private school, with 1,921 (90.7% in the age bracket) attending a public institution.
| Age Bracket | Public School | Private School |
| 3 to 4 Year Olds | 295 (66.9%) | 146 (33.1%) |
| 5 to 9 Year Old | 1,916 (85.4%) | 328 (14.6%) |
| 10 to 14 Year Olds | 1,921 (90.7%) | 196 (9.3%) |
| 15 to 17 Year Olds | 1,251 (89.4%) | 149 (10.6%) |
| 18 to 19 Year Olds | 706 (89.9%) | 79 (10.1%) |
| 20 to 24 Year Olds | 630 (89.9%) | 71 (10.1%) |
| 25 to 34 Year Olds | 156 (60.7%) | 101 (39.3%) |
| 35 Years and over | 225 (76.0%) | 71 (24.0%) |
| Total | 7,104 (86.2%) | 1,137 (13.8%) |
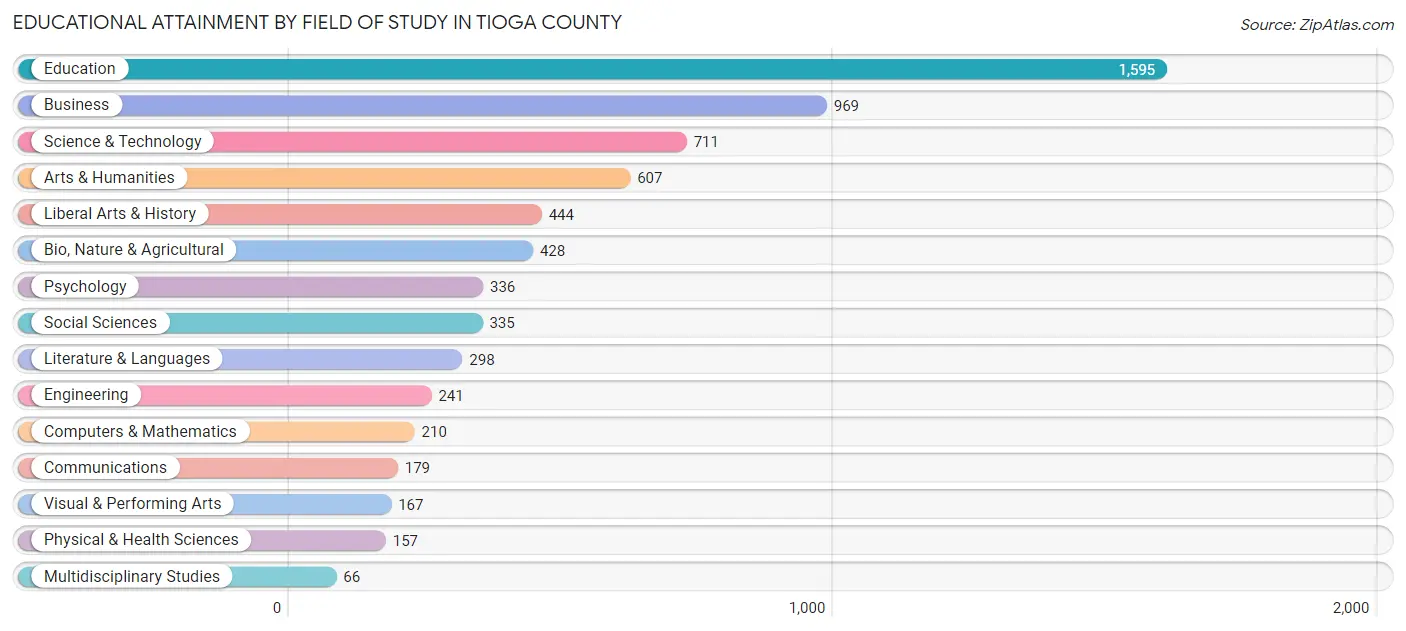
Educational Attainment by Field of Study in Tioga County
Education (1,595 | 23.6%), business (969 | 14.4%), science & technology (711 | 10.5%), arts & humanities (607 | 9.0%), and liberal arts & history (444 | 6.6%) are the most common fields of study among 6,743 individuals in Tioga County who have obtained a bachelor's degree or higher.
| Field of Study | # Graduates | % Graduates |
| Computers & Mathematics | 210 | 3.1% |
| Bio, Nature & Agricultural | 428 | 6.4% |
| Physical & Health Sciences | 157 | 2.3% |
| Psychology | 336 | 5.0% |
| Social Sciences | 335 | 5.0% |
| Engineering | 241 | 3.6% |
| Multidisciplinary Studies | 66 | 1.0% |
| Science & Technology | 711 | 10.5% |
| Business | 969 | 14.4% |
| Education | 1,595 | 23.6% |
| Literature & Languages | 298 | 4.4% |
| Liberal Arts & History | 444 | 6.6% |
| Visual & Performing Arts | 167 | 2.5% |
| Communications | 179 | 2.6% |
| Arts & Humanities | 607 | 9.0% |
| Total | 6,743 | 100.0% |
Transportation & Commute in Tioga County
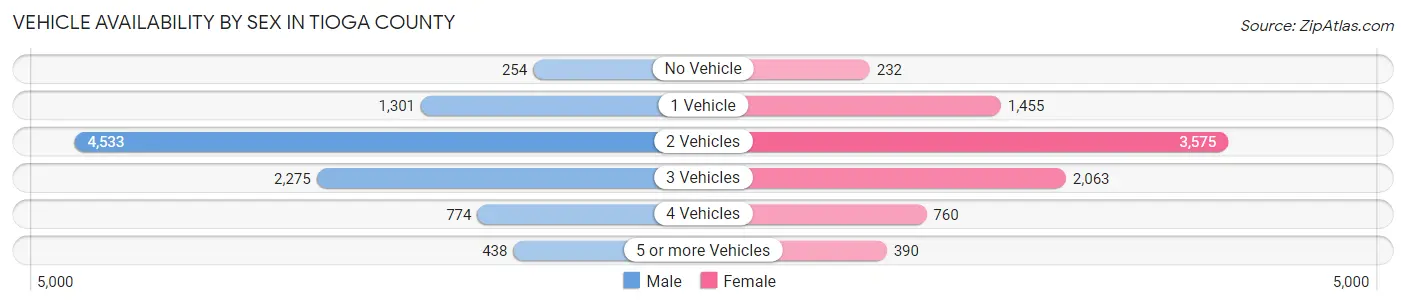
Vehicle Availability by Sex in Tioga County
The most prevalent vehicle ownership categories in Tioga County are males with 2 vehicles (4,533, accounting for 47.3%) and females with 2 vehicles (3,575, making up 53.5%).
| Vehicles Available | Male | Female |
| No Vehicle | 254 (2.6%) | 232 (2.7%) |
| 1 Vehicle | 1,301 (13.6%) | 1,455 (17.2%) |
| 2 Vehicles | 4,533 (47.3%) | 3,575 (42.2%) |
| 3 Vehicles | 2,275 (23.8%) | 2,063 (24.3%) |
| 4 Vehicles | 774 (8.1%) | 760 (9.0%) |
| 5 or more Vehicles | 438 (4.6%) | 390 (4.6%) |
| Total | 9,575 (100.0%) | 8,475 (100.0%) |
Commute Time in Tioga County
The most frequently occuring commute durations in Tioga County are 5 to 9 minutes (2,495 commuters, 14.7%), 20 to 24 minutes (2,436 commuters, 14.3%), and 10 to 14 minutes (2,366 commuters, 13.9%).
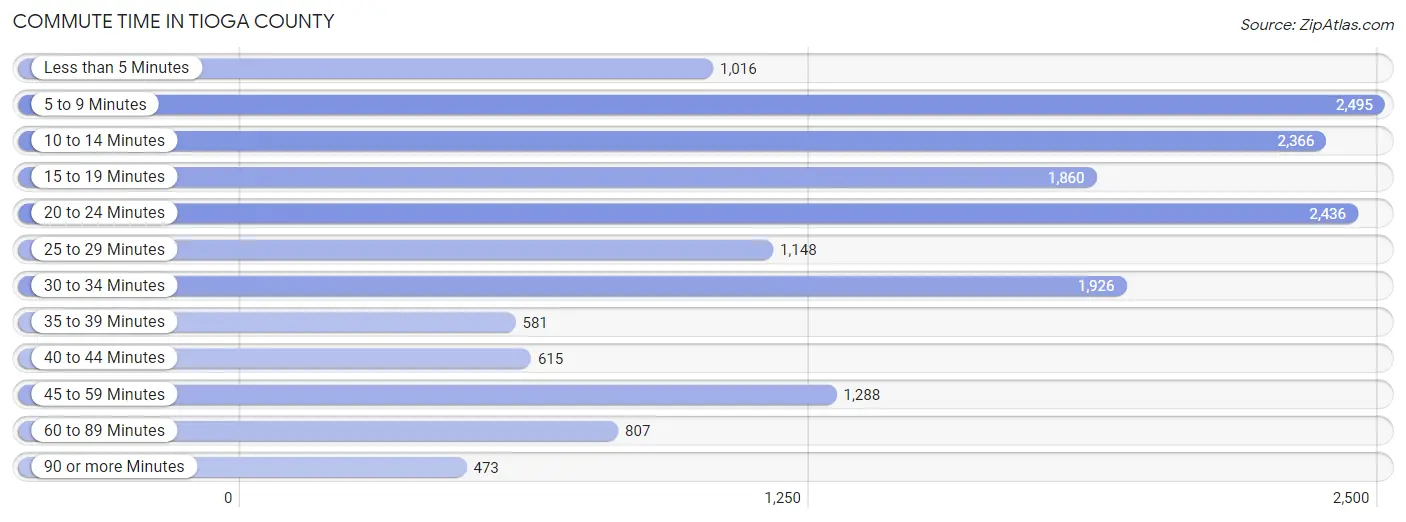
| Commute Time | # Commuters | % Commuters |
| Less than 5 Minutes | 1,016 | 6.0% |
| 5 to 9 Minutes | 2,495 | 14.7% |
| 10 to 14 Minutes | 2,366 | 13.9% |
| 15 to 19 Minutes | 1,860 | 10.9% |
| 20 to 24 Minutes | 2,436 | 14.3% |
| 25 to 29 Minutes | 1,148 | 6.8% |
| 30 to 34 Minutes | 1,926 | 11.3% |
| 35 to 39 Minutes | 581 | 3.4% |
| 40 to 44 Minutes | 615 | 3.6% |
| 45 to 59 Minutes | 1,288 | 7.6% |
| 60 to 89 Minutes | 807 | 4.7% |
| 90 or more Minutes | 473 | 2.8% |
Commute Time by Sex in Tioga County
The most common commute times in Tioga County are 5 to 9 minutes (1,225 commuters, 13.6%) for males and 10 to 14 minutes (1,293 commuters, 16.2%) for females.
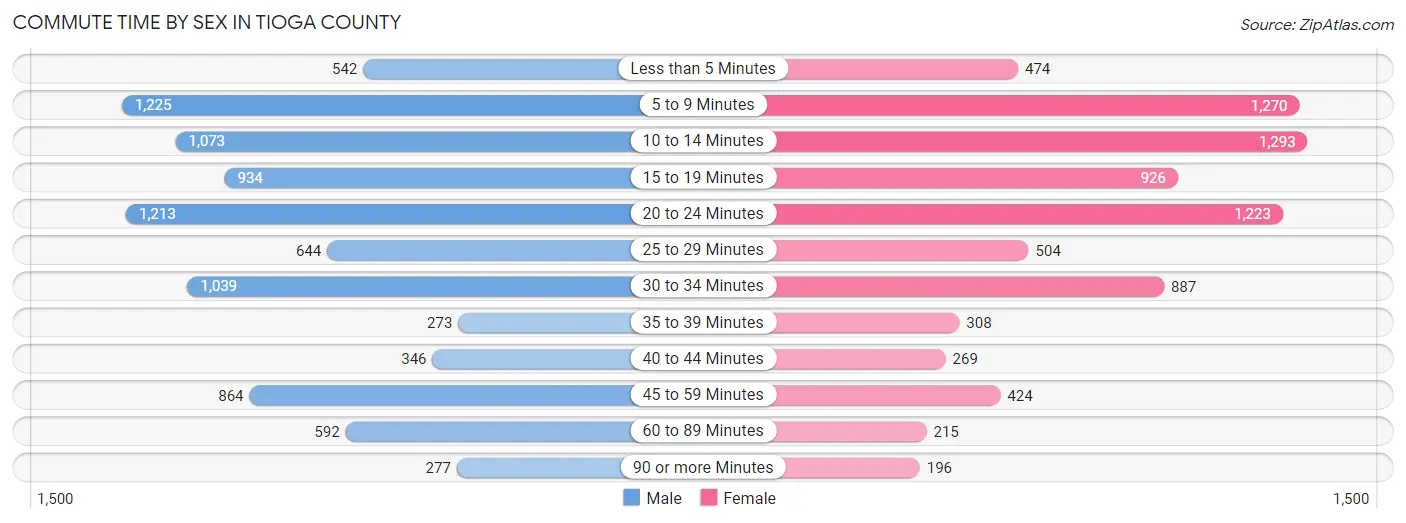
| Commute Time | Male | Female |
| Less than 5 Minutes | 542 (6.0%) | 474 (5.9%) |
| 5 to 9 Minutes | 1,225 (13.6%) | 1,270 (15.9%) |
| 10 to 14 Minutes | 1,073 (11.9%) | 1,293 (16.2%) |
| 15 to 19 Minutes | 934 (10.3%) | 926 (11.6%) |
| 20 to 24 Minutes | 1,213 (13.4%) | 1,223 (15.3%) |
| 25 to 29 Minutes | 644 (7.1%) | 504 (6.3%) |
| 30 to 34 Minutes | 1,039 (11.5%) | 887 (11.1%) |
| 35 to 39 Minutes | 273 (3.0%) | 308 (3.9%) |
| 40 to 44 Minutes | 346 (3.8%) | 269 (3.4%) |
| 45 to 59 Minutes | 864 (9.6%) | 424 (5.3%) |
| 60 to 89 Minutes | 592 (6.6%) | 215 (2.7%) |
| 90 or more Minutes | 277 (3.1%) | 196 (2.5%) |
Time of Departure to Work by Sex in Tioga County
The most frequent times of departure to work in Tioga County are 6:00 AM to 6:29 AM (1,177, 13.1%) for males and 7:30 AM to 7:59 AM (1,316, 16.5%) for females.
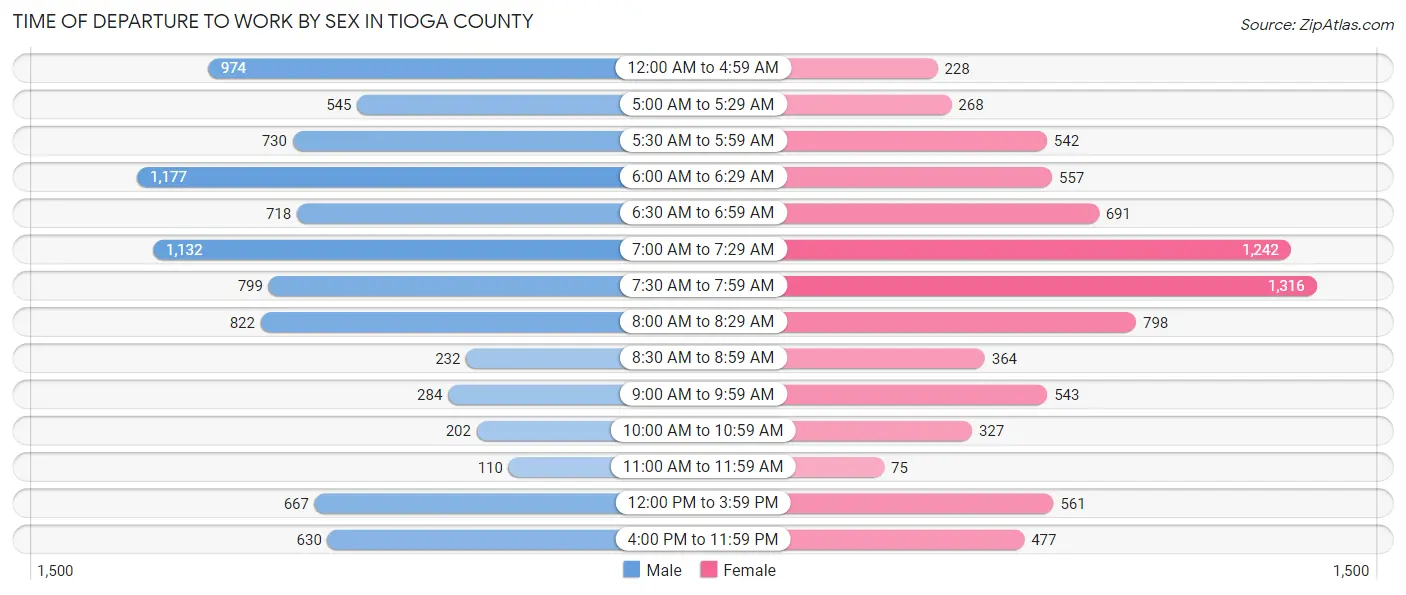
| Time of Departure | Male | Female |
| 12:00 AM to 4:59 AM | 974 (10.8%) | 228 (2.9%) |
| 5:00 AM to 5:29 AM | 545 (6.0%) | 268 (3.4%) |
| 5:30 AM to 5:59 AM | 730 (8.1%) | 542 (6.8%) |
| 6:00 AM to 6:29 AM | 1,177 (13.1%) | 557 (7.0%) |
| 6:30 AM to 6:59 AM | 718 (8.0%) | 691 (8.6%) |
| 7:00 AM to 7:29 AM | 1,132 (12.6%) | 1,242 (15.5%) |
| 7:30 AM to 7:59 AM | 799 (8.9%) | 1,316 (16.5%) |
| 8:00 AM to 8:29 AM | 822 (9.1%) | 798 (10.0%) |
| 8:30 AM to 8:59 AM | 232 (2.6%) | 364 (4.6%) |
| 9:00 AM to 9:59 AM | 284 (3.2%) | 543 (6.8%) |
| 10:00 AM to 10:59 AM | 202 (2.2%) | 327 (4.1%) |
| 11:00 AM to 11:59 AM | 110 (1.2%) | 75 (0.9%) |
| 12:00 PM to 3:59 PM | 667 (7.4%) | 561 (7.0%) |
| 4:00 PM to 11:59 PM | 630 (7.0%) | 477 (6.0%) |
| Total | 9,022 (100.0%) | 7,989 (100.0%) |
Housing Occupancy in Tioga County
Occupancy by Ownership in Tioga County
Of the total 16,583 dwellings in Tioga County, owner-occupied units account for 12,666 (76.4%), while renter-occupied units make up 3,917 (23.6%).
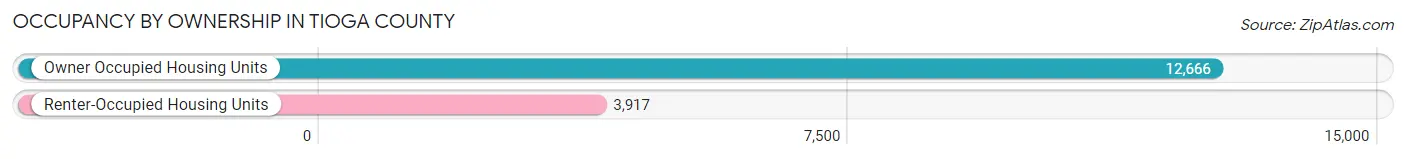
| Occupancy | # Housing Units | % Housing Units |
| Owner Occupied Housing Units | 12,666 | 76.4% |
| Renter-Occupied Housing Units | 3,917 | 23.6% |
| Total Occupied Housing Units | 16,583 | 100.0% |
Occupancy by Household Size in Tioga County
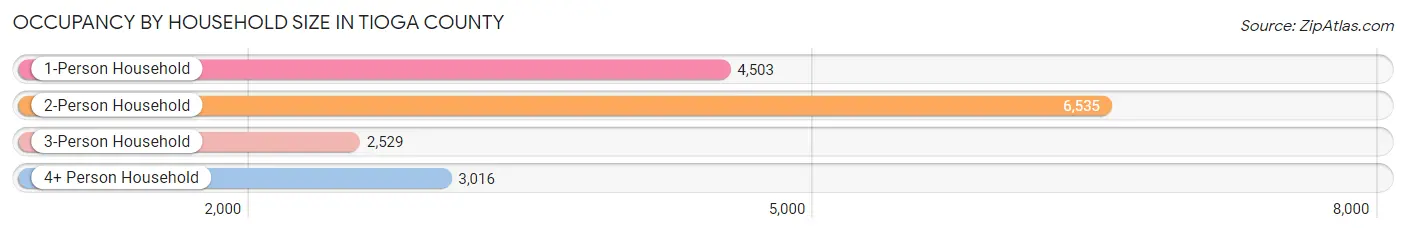
| Household Size | # Housing Units | % Housing Units |
| 1-Person Household | 4,503 | 27.2% |
| 2-Person Household | 6,535 | 39.4% |
| 3-Person Household | 2,529 | 15.2% |
| 4+ Person Household | 3,016 | 18.2% |
| Total Housing Units | 16,583 | 100.0% |
Occupancy by Ownership by Household Size in Tioga County
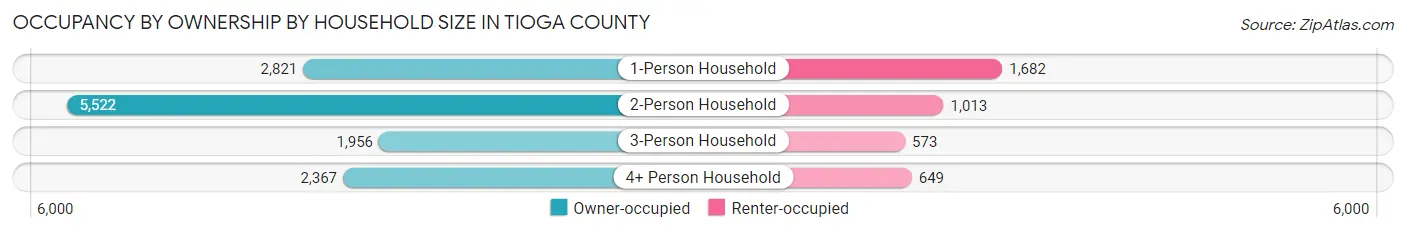
| Household Size | Owner-occupied | Renter-occupied |
| 1-Person Household | 2,821 (62.6%) | 1,682 (37.3%) |
| 2-Person Household | 5,522 (84.5%) | 1,013 (15.5%) |
| 3-Person Household | 1,956 (77.3%) | 573 (22.7%) |
| 4+ Person Household | 2,367 (78.5%) | 649 (21.5%) |
| Total Housing Units | 12,666 (76.4%) | 3,917 (23.6%) |
Occupancy by Educational Attainment in Tioga County
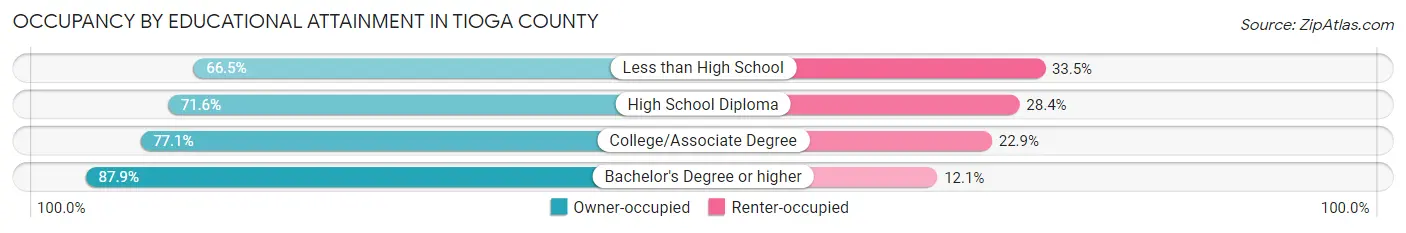
| Household Size | Owner-occupied | Renter-occupied |
| Less than High School | 891 (66.5%) | 448 (33.5%) |
| High School Diploma | 4,781 (71.6%) | 1,896 (28.4%) |
| College/Associate Degree | 3,818 (77.1%) | 1,136 (22.9%) |
| Bachelor's Degree or higher | 3,176 (87.9%) | 437 (12.1%) |
Occupancy by Age of Householder in Tioga County
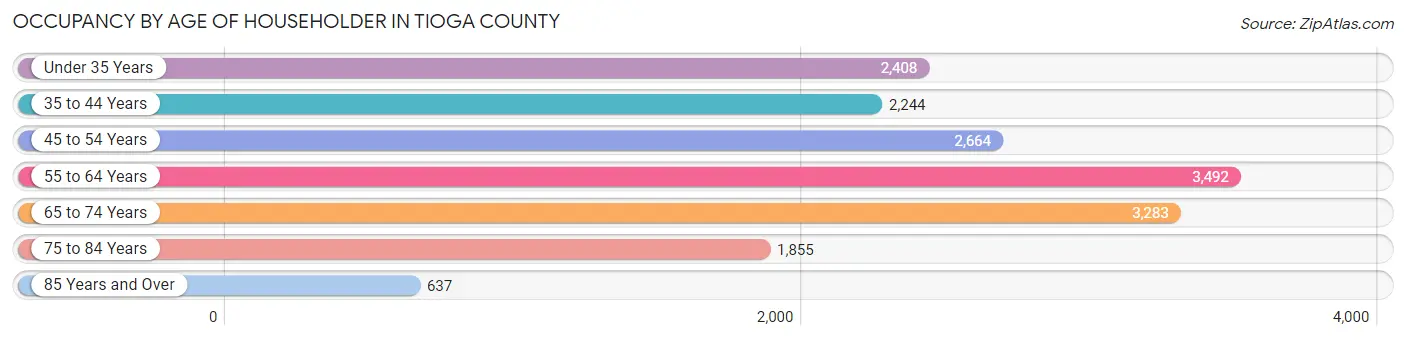
| Age Bracket | # Households | % Households |
| Under 35 Years | 2,408 | 14.5% |
| 35 to 44 Years | 2,244 | 13.5% |
| 45 to 54 Years | 2,664 | 16.1% |
| 55 to 64 Years | 3,492 | 21.1% |
| 65 to 74 Years | 3,283 | 19.8% |
| 75 to 84 Years | 1,855 | 11.2% |
| 85 Years and Over | 637 | 3.8% |
| Total | 16,583 | 100.0% |
Housing Finances in Tioga County
Median Income by Occupancy in Tioga County
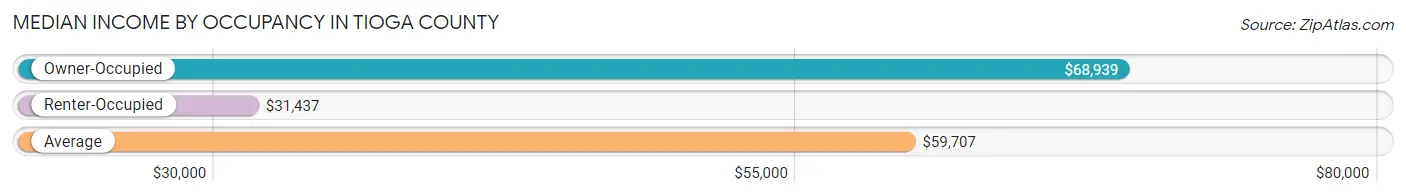
| Occupancy Type | # Households | Median Income |
| Owner-Occupied | 12,666 (76.4%) | $68,939 |
| Renter-Occupied | 3,917 (23.6%) | $31,437 |
| Average | 16,583 (100.0%) | $59,707 |
Occupancy by Householder Income Bracket in Tioga County
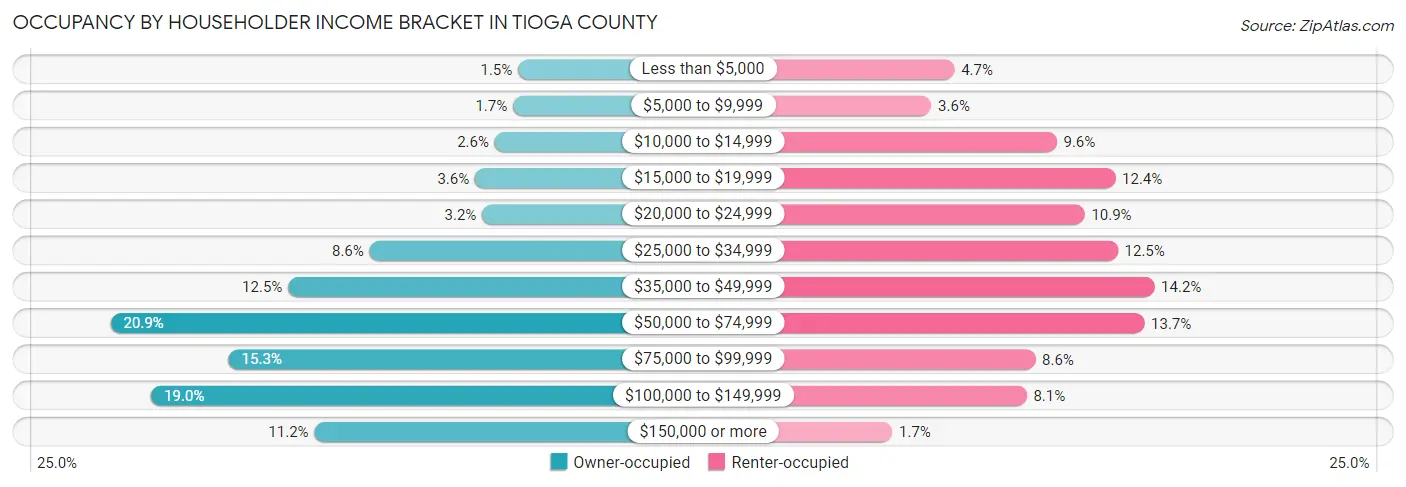
| Income Bracket | Owner-occupied | Renter-occupied |
| Less than $5,000 | 190 (1.5%) | 184 (4.7%) |
| $5,000 to $9,999 | 221 (1.7%) | 141 (3.6%) |
| $10,000 to $14,999 | 331 (2.6%) | 375 (9.6%) |
| $15,000 to $19,999 | 450 (3.5%) | 484 (12.4%) |
| $20,000 to $24,999 | 406 (3.2%) | 427 (10.9%) |
| $25,000 to $34,999 | 1,086 (8.6%) | 489 (12.5%) |
| $35,000 to $49,999 | 1,577 (12.4%) | 557 (14.2%) |
| $50,000 to $74,999 | 2,648 (20.9%) | 538 (13.7%) |
| $75,000 to $99,999 | 1,935 (15.3%) | 335 (8.6%) |
| $100,000 to $149,999 | 2,404 (19.0%) | 319 (8.1%) |
| $150,000 or more | 1,418 (11.2%) | 68 (1.7%) |
| Total | 12,666 (100.0%) | 3,917 (100.0%) |
Monthly Housing Cost Tiers in Tioga County
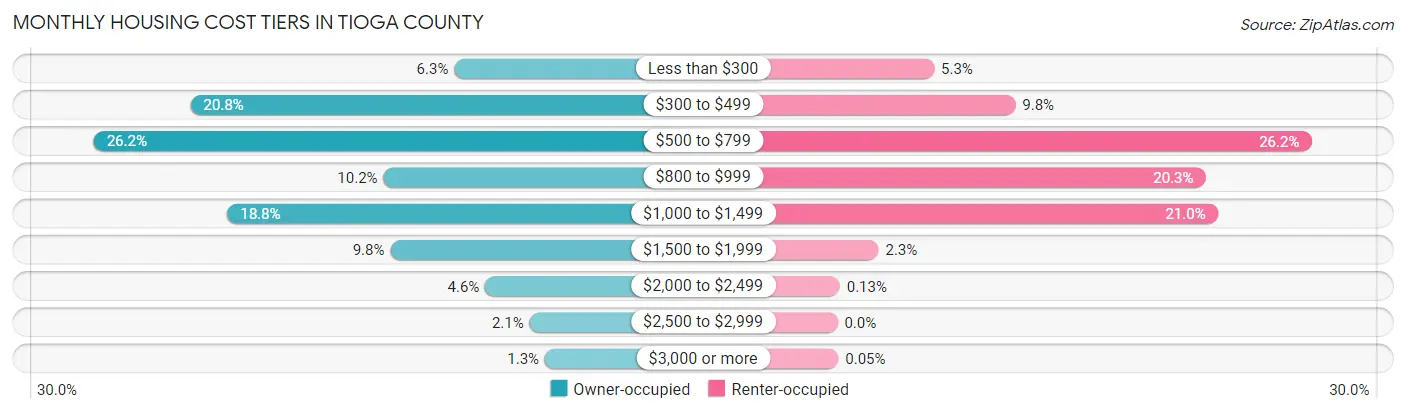
| Monthly Cost | Owner-occupied | Renter-occupied |
| Less than $300 | 794 (6.3%) | 209 (5.3%) |
| $300 to $499 | 2,639 (20.8%) | 385 (9.8%) |
| $500 to $799 | 3,316 (26.2%) | 1,025 (26.2%) |
| $800 to $999 | 1,290 (10.2%) | 796 (20.3%) |
| $1,000 to $1,499 | 2,381 (18.8%) | 822 (21.0%) |
| $1,500 to $1,999 | 1,241 (9.8%) | 89 (2.3%) |
| $2,000 to $2,499 | 578 (4.6%) | 5 (0.1%) |
| $2,500 to $2,999 | 267 (2.1%) | 0 (0.0%) |
| $3,000 or more | 160 (1.3%) | 2 (0.1%) |
| Total | 12,666 (100.0%) | 3,917 (100.0%) |
Physical Housing Characteristics in Tioga County
Housing Structures in Tioga County
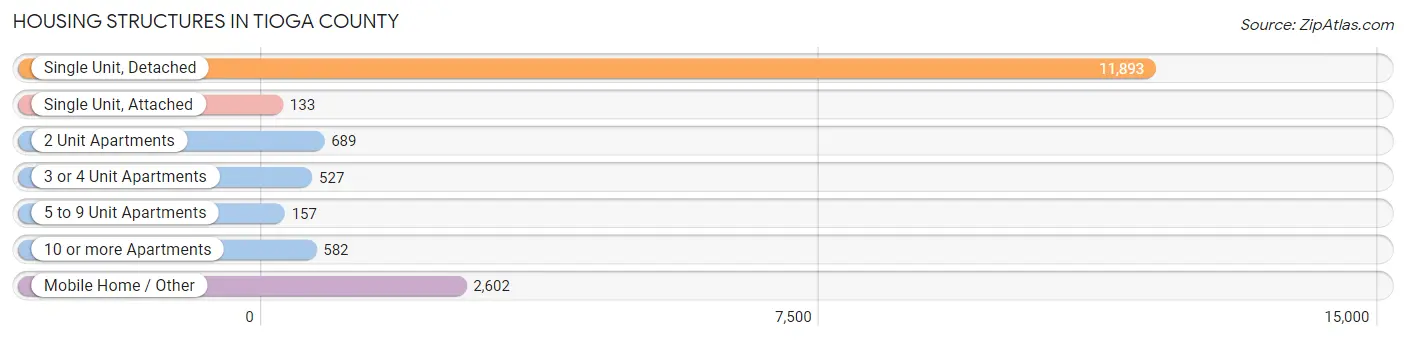
| Structure Type | # Housing Units | % Housing Units |
| Single Unit, Detached | 11,893 | 71.7% |
| Single Unit, Attached | 133 | 0.8% |
| 2 Unit Apartments | 689 | 4.2% |
| 3 or 4 Unit Apartments | 527 | 3.2% |
| 5 to 9 Unit Apartments | 157 | 0.9% |
| 10 or more Apartments | 582 | 3.5% |
| Mobile Home / Other | 2,602 | 15.7% |
| Total | 16,583 | 100.0% |
Housing Structures by Occupancy in Tioga County
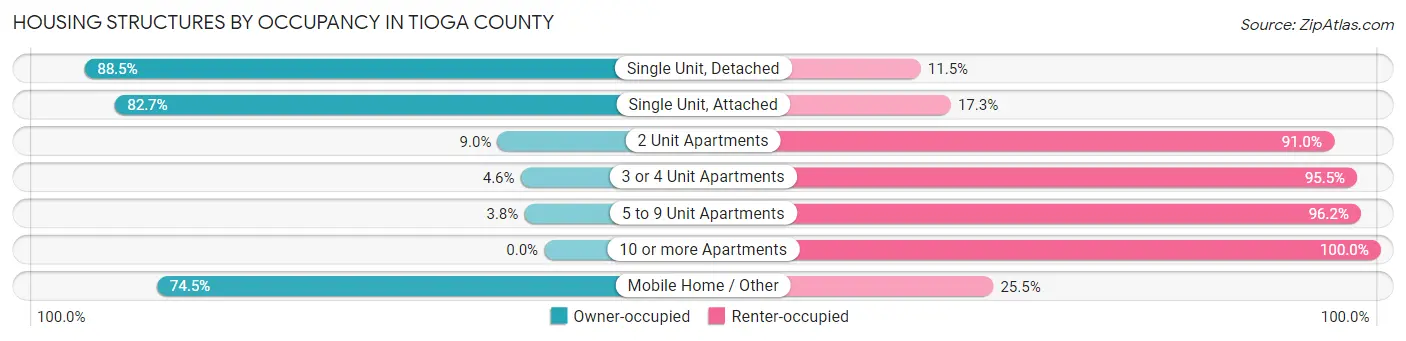
| Structure Type | Owner-occupied | Renter-occupied |
| Single Unit, Detached | 10,525 (88.5%) | 1,368 (11.5%) |
| Single Unit, Attached | 110 (82.7%) | 23 (17.3%) |
| 2 Unit Apartments | 62 (9.0%) | 627 (91.0%) |
| 3 or 4 Unit Apartments | 24 (4.5%) | 503 (95.5%) |
| 5 to 9 Unit Apartments | 6 (3.8%) | 151 (96.2%) |
| 10 or more Apartments | 0 (0.0%) | 582 (100.0%) |
| Mobile Home / Other | 1,939 (74.5%) | 663 (25.5%) |
| Total | 12,666 (76.4%) | 3,917 (23.6%) |
Housing Structures by Number of Rooms in Tioga County
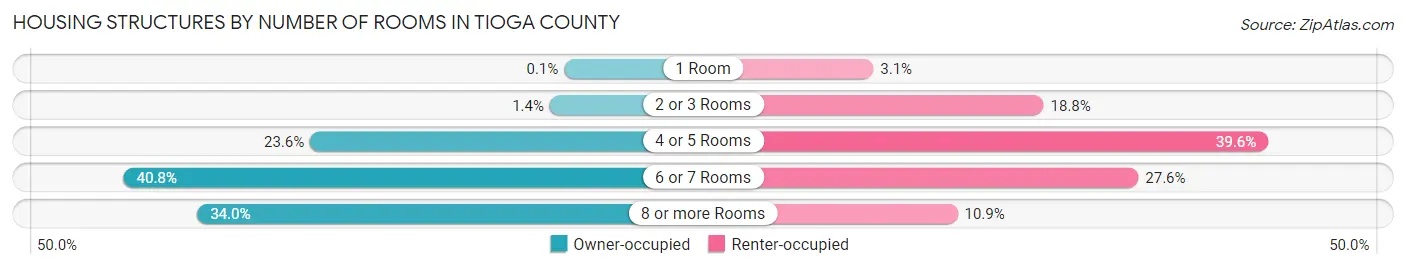
| Number of Rooms | Owner-occupied | Renter-occupied |
| 1 Room | 13 (0.1%) | 121 (3.1%) |
| 2 or 3 Rooms | 181 (1.4%) | 738 (18.8%) |
| 4 or 5 Rooms | 2,989 (23.6%) | 1,551 (39.6%) |
| 6 or 7 Rooms | 5,173 (40.8%) | 1,081 (27.6%) |
| 8 or more Rooms | 4,310 (34.0%) | 426 (10.9%) |
| Total | 12,666 (100.0%) | 3,917 (100.0%) |
Housing Structure by Heating Type in Tioga County
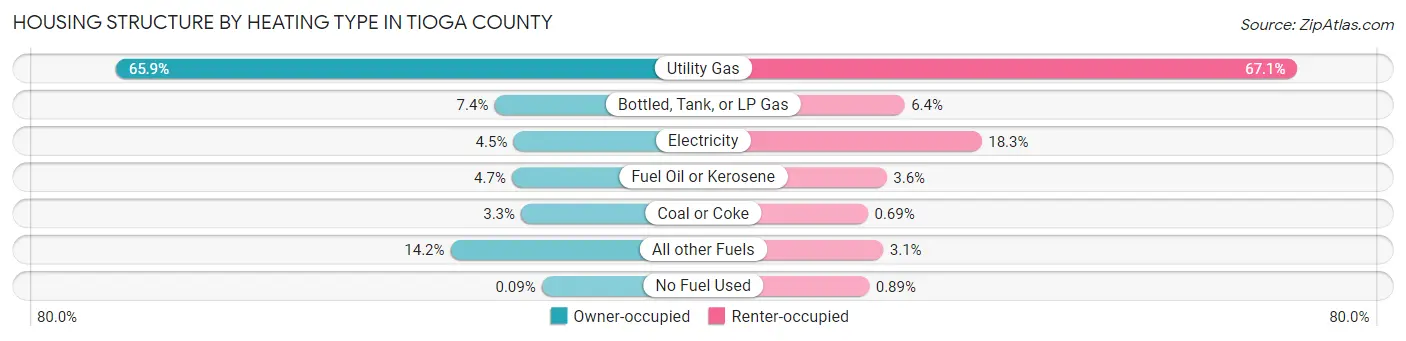
| Heating Type | Owner-occupied | Renter-occupied |
| Utility Gas | 8,347 (65.9%) | 2,629 (67.1%) |
| Bottled, Tank, or LP Gas | 937 (7.4%) | 249 (6.4%) |
| Electricity | 565 (4.5%) | 716 (18.3%) |
| Fuel Oil or Kerosene | 594 (4.7%) | 141 (3.6%) |
| Coal or Coke | 415 (3.3%) | 27 (0.7%) |
| All other Fuels | 1,796 (14.2%) | 120 (3.1%) |
| No Fuel Used | 12 (0.1%) | 35 (0.9%) |
| Total | 12,666 (100.0%) | 3,917 (100.0%) |
Household Vehicle Usage in Tioga County
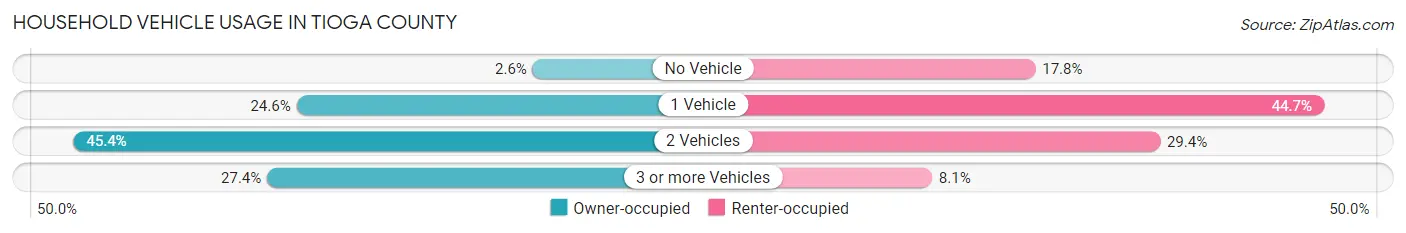
| Vehicles per Household | Owner-occupied | Renter-occupied |
| No Vehicle | 326 (2.6%) | 696 (17.8%) |
| 1 Vehicle | 3,118 (24.6%) | 1,751 (44.7%) |
| 2 Vehicles | 5,756 (45.4%) | 1,152 (29.4%) |
| 3 or more Vehicles | 3,466 (27.4%) | 318 (8.1%) |
| Total | 12,666 (100.0%) | 3,917 (100.0%) |
Real Estate & Mortgages in Tioga County
Real Estate and Mortgage Overview in Tioga County
| Characteristic | Without Mortgage | With Mortgage |
| Housing Units | 6,964 | 5,702 |
| Median Property Value | $160,800 | $168,800 |
| Median Household Income | $54,549 | $788 |
| Monthly Housing Costs | $510 | $160 |
| Real Estate Taxes | $1,992 | $77 |
Property Value by Mortgage Status in Tioga County
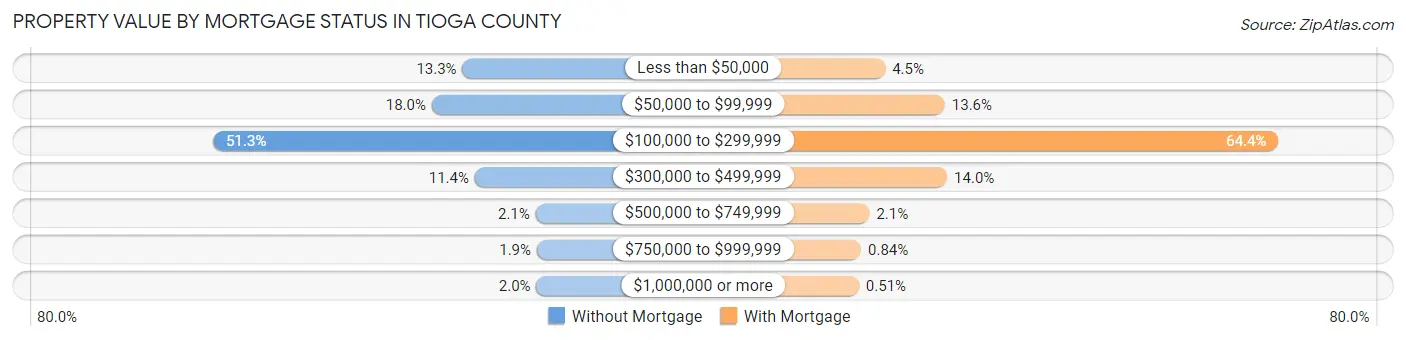
| Property Value | Without Mortgage | With Mortgage |
| Less than $50,000 | 925 (13.3%) | 258 (4.5%) |
| $50,000 to $99,999 | 1,250 (17.9%) | 776 (13.6%) |
| $100,000 to $299,999 | 3,572 (51.3%) | 3,674 (64.4%) |
| $300,000 to $499,999 | 794 (11.4%) | 796 (14.0%) |
| $500,000 to $749,999 | 148 (2.1%) | 121 (2.1%) |
| $750,000 to $999,999 | 135 (1.9%) | 48 (0.8%) |
| $1,000,000 or more | 140 (2.0%) | 29 (0.5%) |
| Total | 6,964 (100.0%) | 5,702 (100.0%) |
Household Income by Mortgage Status in Tioga County
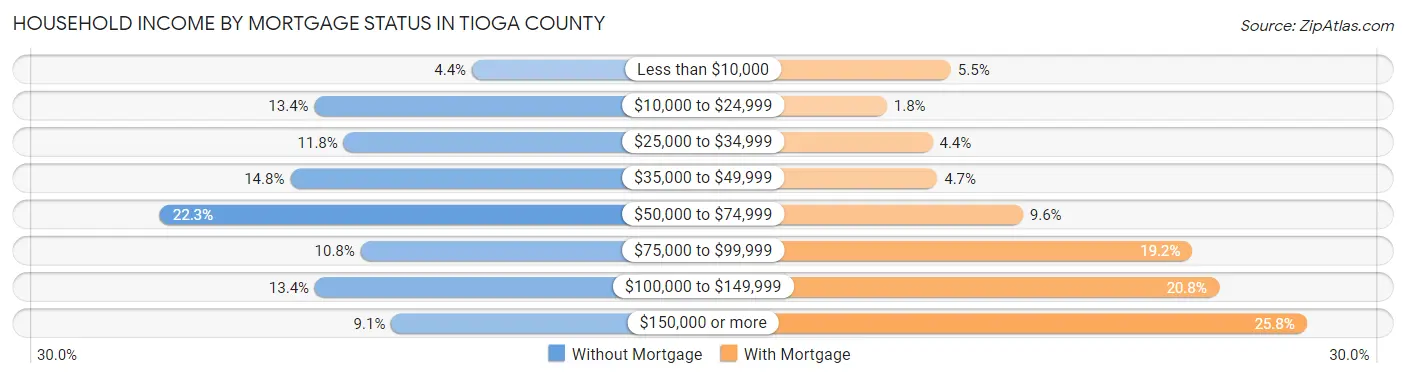
| Household Income | Without Mortgage | With Mortgage |
| Less than $10,000 | 309 (4.4%) | 311 (5.4%) |
| $10,000 to $24,999 | 936 (13.4%) | 102 (1.8%) |
| $25,000 to $34,999 | 820 (11.8%) | 251 (4.4%) |
| $35,000 to $49,999 | 1,032 (14.8%) | 266 (4.7%) |
| $50,000 to $74,999 | 1,551 (22.3%) | 545 (9.6%) |
| $75,000 to $99,999 | 752 (10.8%) | 1,097 (19.2%) |
| $100,000 to $149,999 | 934 (13.4%) | 1,183 (20.7%) |
| $150,000 or more | 630 (9.0%) | 1,470 (25.8%) |
| Total | 6,964 (100.0%) | 5,702 (100.0%) |
Property Value to Household Income Ratio in Tioga County
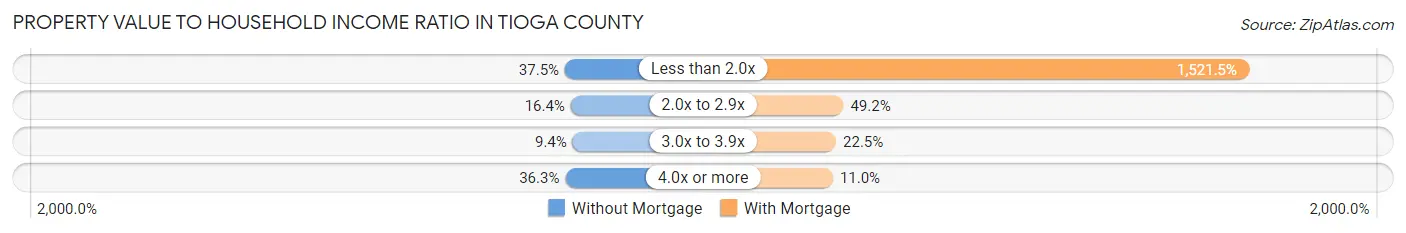
| Value-to-Income Ratio | Without Mortgage | With Mortgage |
| Less than 2.0x | 2,612 (37.5%) | 86,757 (1,521.5%) |
| 2.0x to 2.9x | 1,142 (16.4%) | 2,804 (49.2%) |
| 3.0x to 3.9x | 656 (9.4%) | 1,280 (22.5%) |
| 4.0x or more | 2,527 (36.3%) | 628 (11.0%) |
| Total | 6,964 (100.0%) | 5,702 (100.0%) |
Real Estate Taxes by Mortgage Status in Tioga County
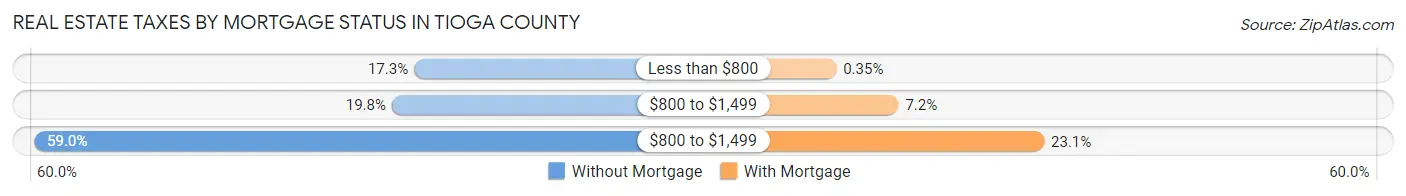
| Property Taxes | Without Mortgage | With Mortgage |
| Less than $800 | 1,207 (17.3%) | 20 (0.4%) |
| $800 to $1,499 | 1,376 (19.8%) | 409 (7.2%) |
| $800 to $1,499 | 4,107 (59.0%) | 1,319 (23.1%) |
| Total | 6,964 (100.0%) | 5,702 (100.0%) |
Health & Disability in Tioga County
Health Insurance Coverage by Age in Tioga County
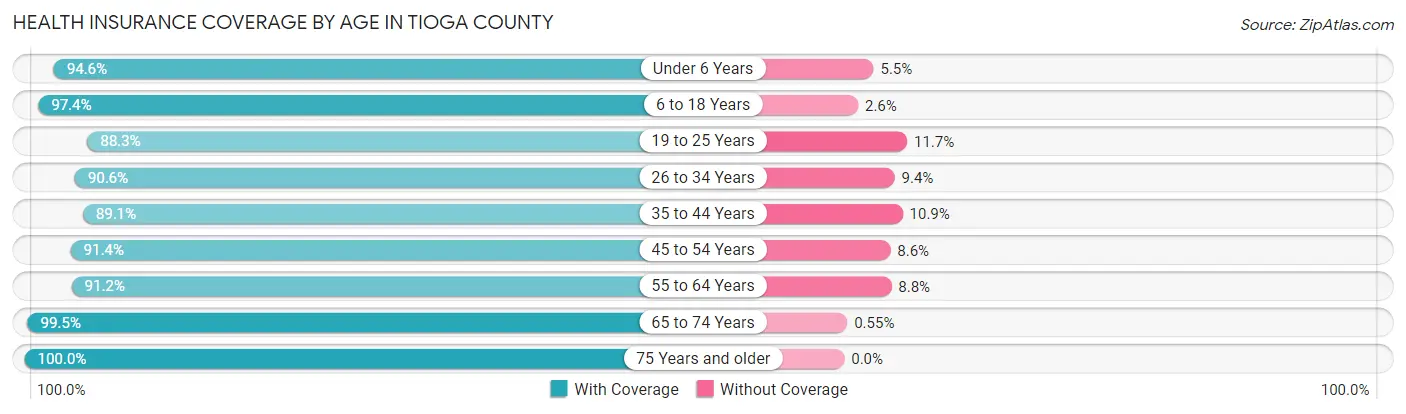
| Age Bracket | With Coverage | Without Coverage |
| Under 6 Years | 2,306 (94.6%) | 133 (5.4%) |
| 6 to 18 Years | 6,012 (97.4%) | 158 (2.6%) |
| 19 to 25 Years | 3,133 (88.3%) | 415 (11.7%) |
| 26 to 34 Years | 3,538 (90.6%) | 366 (9.4%) |
| 35 to 44 Years | 3,967 (89.1%) | 484 (10.9%) |
| 45 to 54 Years | 4,557 (91.4%) | 428 (8.6%) |
| 55 to 64 Years | 5,687 (91.2%) | 547 (8.8%) |
| 65 to 74 Years | 5,225 (99.5%) | 29 (0.5%) |
| 75 Years and older | 3,863 (100.0%) | 0 (0.0%) |
| Total | 38,288 (93.7%) | 2,560 (6.3%) |
Health Insurance Coverage by Citizenship Status in Tioga County
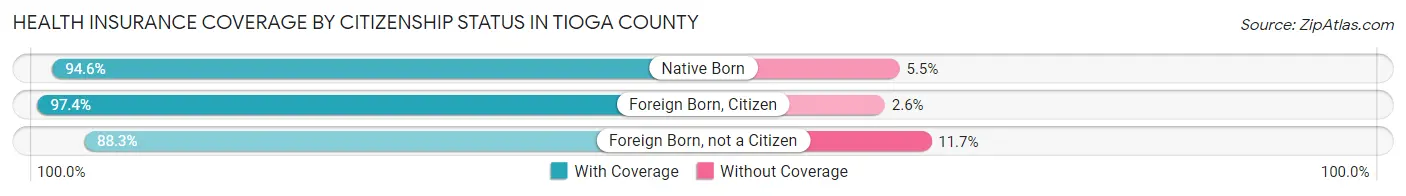
| Citizenship Status | With Coverage | Without Coverage |
| Native Born | 2,306 (94.6%) | 133 (5.4%) |
| Foreign Born, Citizen | 6,012 (97.4%) | 158 (2.6%) |
| Foreign Born, not a Citizen | 3,133 (88.3%) | 415 (11.7%) |
Health Insurance Coverage by Household Income in Tioga County
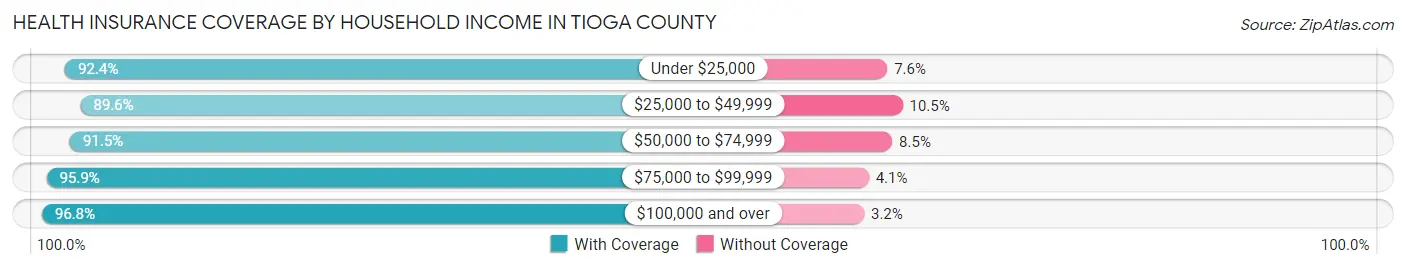
| Household Income | With Coverage | Without Coverage |
| Under $25,000 | 4,835 (92.4%) | 396 (7.6%) |
| $25,000 to $49,999 | 6,717 (89.5%) | 784 (10.4%) |
| $50,000 to $74,999 | 7,305 (91.5%) | 679 (8.5%) |
| $75,000 to $99,999 | 6,287 (95.9%) | 269 (4.1%) |
| $100,000 and over | 12,731 (96.8%) | 425 (3.2%) |
Public vs Private Health Insurance Coverage by Age in Tioga County
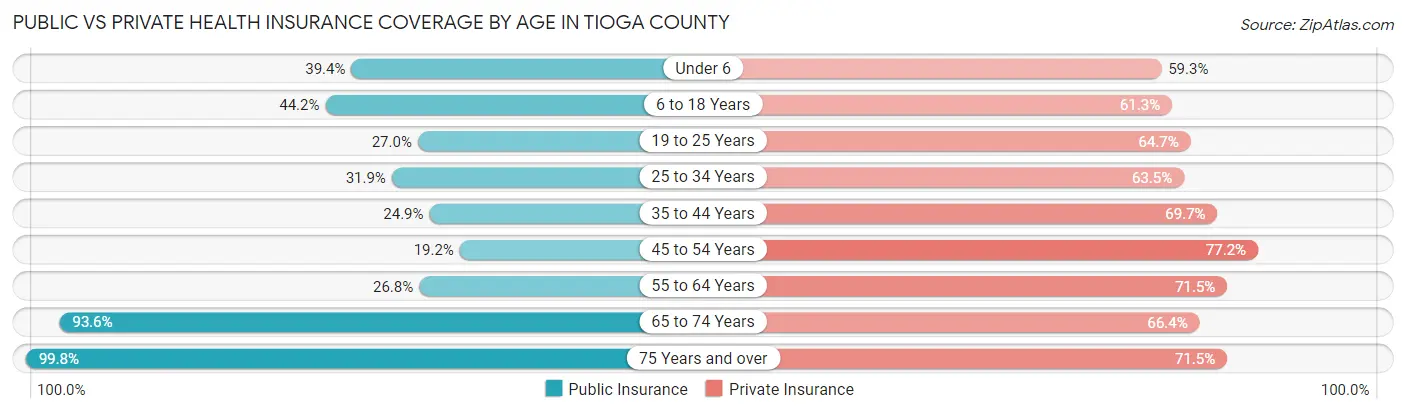
| Age Bracket | Public Insurance | Private Insurance |
| Under 6 | 960 (39.4%) | 1,446 (59.3%) |
| 6 to 18 Years | 2,726 (44.2%) | 3,782 (61.3%) |
| 19 to 25 Years | 959 (27.0%) | 2,297 (64.7%) |
| 25 to 34 Years | 1,244 (31.9%) | 2,480 (63.5%) |
| 35 to 44 Years | 1,107 (24.9%) | 3,103 (69.7%) |
| 45 to 54 Years | 959 (19.2%) | 3,850 (77.2%) |
| 55 to 64 Years | 1,670 (26.8%) | 4,459 (71.5%) |
| 65 to 74 Years | 4,915 (93.5%) | 3,488 (66.4%) |
| 75 Years and over | 3,855 (99.8%) | 2,762 (71.5%) |
| Total | 18,395 (45.0%) | 27,667 (67.7%) |
Disability Status by Sex by Age in Tioga County
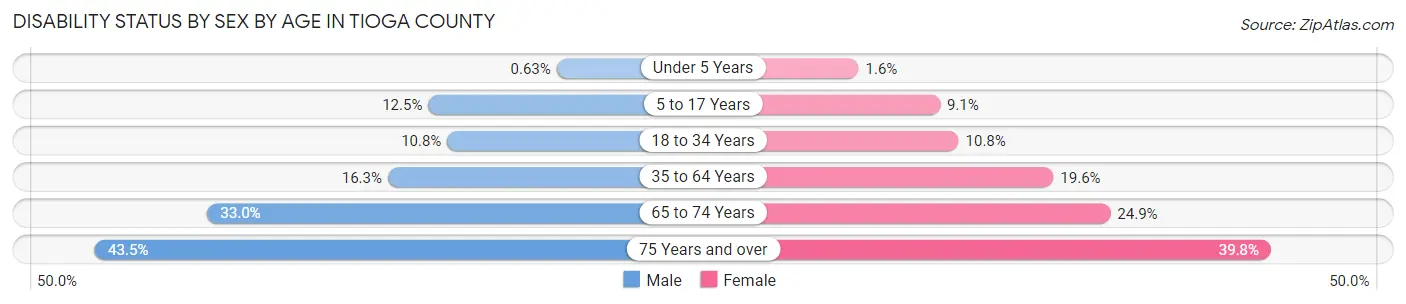
| Age Bracket | Male | Female |
| Under 5 Years | 7 (0.6%) | 15 (1.6%) |
| 5 to 17 Years | 399 (12.5%) | 257 (9.1%) |
| 18 to 34 Years | 425 (10.8%) | 439 (10.8%) |
| 35 to 64 Years | 1,281 (16.3%) | 1,533 (19.6%) |
| 65 to 74 Years | 869 (33.0%) | 654 (24.9%) |
| 75 Years and over | 776 (43.4%) | 827 (39.8%) |
Disability Class by Sex by Age in Tioga County
Disability Class: Hearing Difficulty
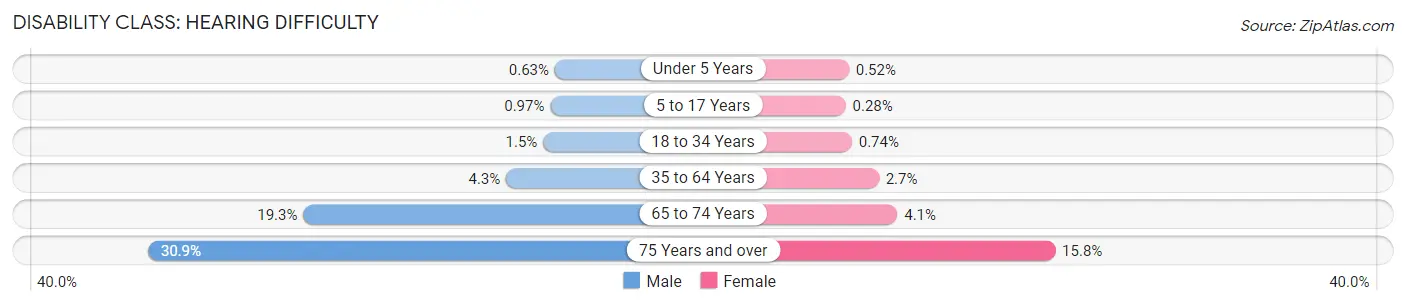
| Age Bracket | Male | Female |
| Under 5 Years | 7 (0.6%) | 5 (0.5%) |
| 5 to 17 Years | 31 (1.0%) | 8 (0.3%) |
| 18 to 34 Years | 59 (1.5%) | 30 (0.7%) |
| 35 to 64 Years | 334 (4.3%) | 214 (2.7%) |
| 65 to 74 Years | 508 (19.3%) | 108 (4.1%) |
| 75 Years and over | 551 (30.8%) | 329 (15.8%) |
Disability Class: Vision Difficulty
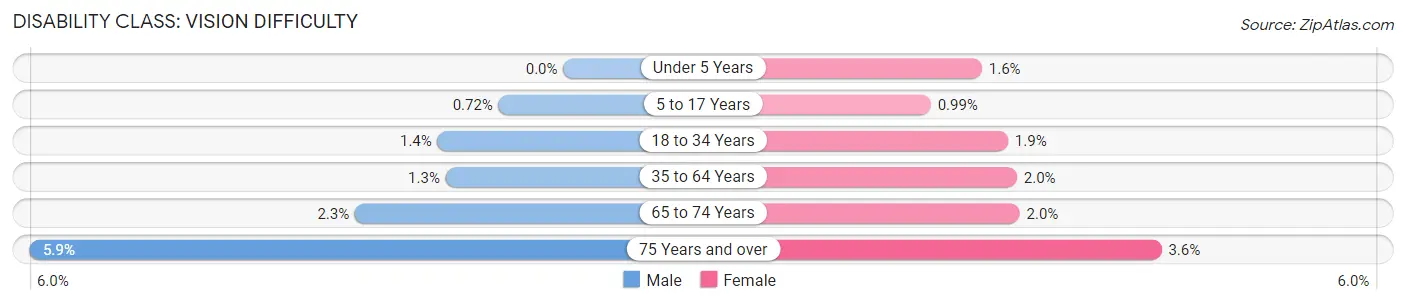
| Age Bracket | Male | Female |
| Under 5 Years | 0 (0.0%) | 15 (1.6%) |
| 5 to 17 Years | 23 (0.7%) | 28 (1.0%) |
| 18 to 34 Years | 55 (1.4%) | 75 (1.8%) |
| 35 to 64 Years | 103 (1.3%) | 152 (1.9%) |
| 65 to 74 Years | 61 (2.3%) | 52 (2.0%) |
| 75 Years and over | 106 (5.9%) | 74 (3.6%) |
Disability Class: Cognitive Difficulty
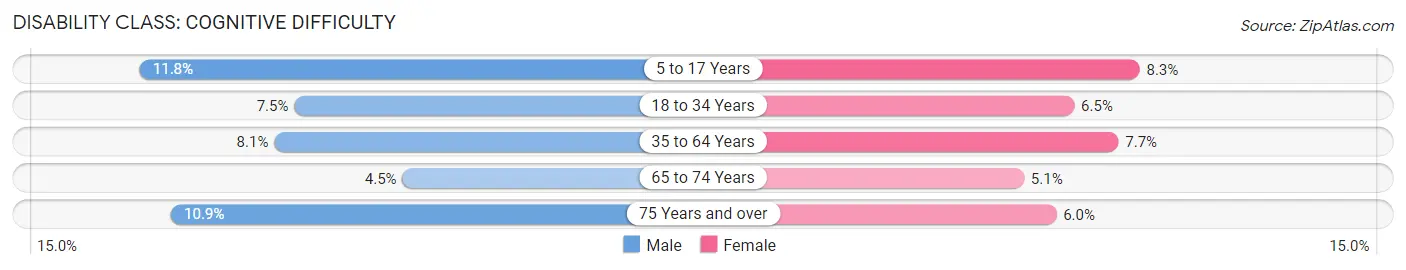
| Age Bracket | Male | Female |
| 5 to 17 Years | 375 (11.8%) | 234 (8.3%) |
| 18 to 34 Years | 295 (7.5%) | 262 (6.5%) |
| 35 to 64 Years | 633 (8.1%) | 601 (7.7%) |
| 65 to 74 Years | 118 (4.5%) | 133 (5.1%) |
| 75 Years and over | 195 (10.9%) | 124 (6.0%) |
Disability Class: Ambulatory Difficulty
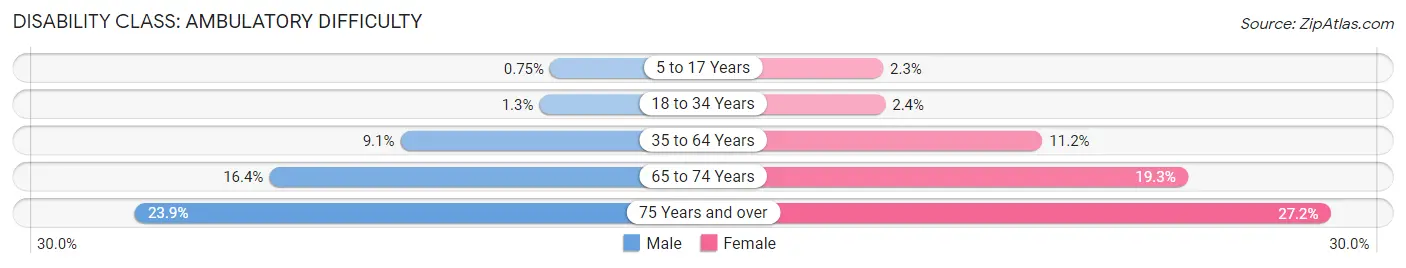
| Age Bracket | Male | Female |
| 5 to 17 Years | 24 (0.7%) | 65 (2.3%) |
| 18 to 34 Years | 53 (1.3%) | 98 (2.4%) |
| 35 to 64 Years | 714 (9.1%) | 872 (11.2%) |
| 65 to 74 Years | 431 (16.4%) | 505 (19.3%) |
| 75 Years and over | 426 (23.8%) | 565 (27.2%) |
Disability Class: Self-Care Difficulty
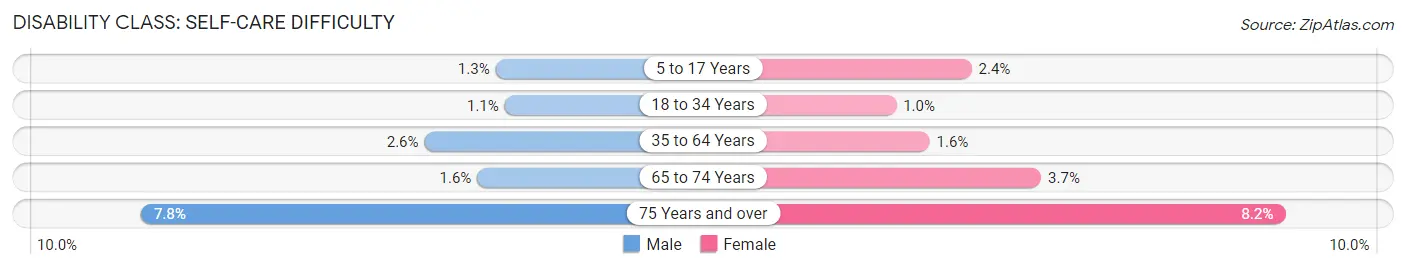
| Age Bracket | Male | Female |
| 5 to 17 Years | 40 (1.3%) | 68 (2.4%) |
| 18 to 34 Years | 43 (1.1%) | 41 (1.0%) |
| 35 to 64 Years | 203 (2.6%) | 127 (1.6%) |
| 65 to 74 Years | 42 (1.6%) | 97 (3.7%) |
| 75 Years and over | 140 (7.8%) | 171 (8.2%) |
Technology Access in Tioga County
Computing Device Access in Tioga County
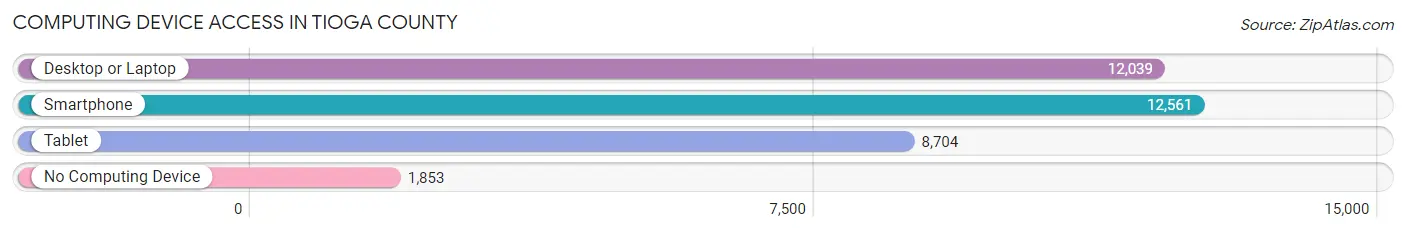
| Device Type | # Households | % Households |
| Desktop or Laptop | 12,039 | 72.6% |
| Smartphone | 12,561 | 75.7% |
| Tablet | 8,704 | 52.5% |
| No Computing Device | 1,853 | 11.2% |
| Total | 16,583 | 100.0% |
Internet Access in Tioga County
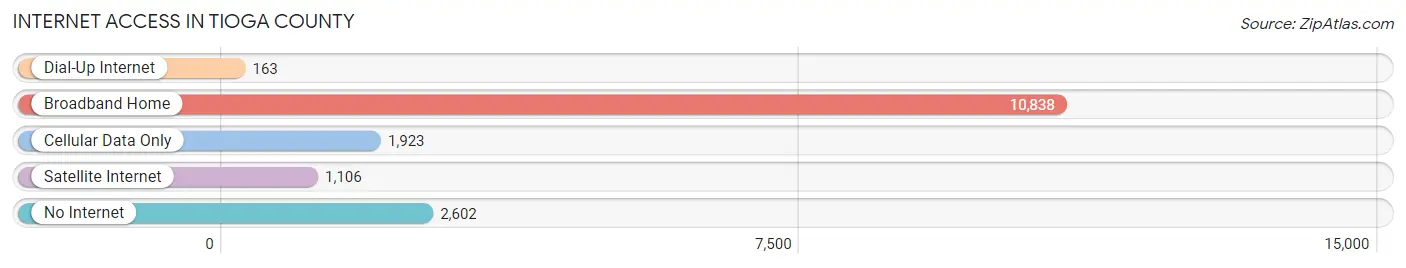
| Internet Type | # Households | % Households |
| Dial-Up Internet | 163 | 1.0% |
| Broadband Home | 10,838 | 65.4% |
| Cellular Data Only | 1,923 | 11.6% |
| Satellite Internet | 1,106 | 6.7% |
| No Internet | 2,602 | 15.7% |
| Total | 16,583 | 100.0% |
Tioga County Summary
Tioga County is located in the north-central region of Pennsylvania, and is part of the Endless Mountains region. It is bordered by Bradford County to the north, Lycoming County to the east, Potter County to the south, and Chemung County, New York to the west. The county seat is Wellsboro, and the county has a total area of 545 square miles, of which 543 square miles is land and 2 square miles is water.
History
Tioga County was formed in 1804 from parts of Lycoming and Luzerne counties. It was named after the Tioga River, which flows through the county. The county was originally inhabited by the Iroquois and Susquehannock Native American tribes. The first European settlers arrived in the area in the late 1700s, and the county was officially established in 1804.
During the 19th century, the county was an important center for the lumber industry, and the population grew rapidly. The county was also home to several iron furnaces, which produced iron for the Union Army during the Civil War.
In the late 19th century, the county was a major producer of coal, and the population continued to grow. The county was also home to several glass factories, which produced glass for the automobile industry.
Geography
Tioga County is located in the north-central region of Pennsylvania, and is part of the Endless Mountains region. It is bordered by Bradford County to the north, Lycoming County to the east, Potter County to the south, and Chemung County, New York to the west. The county seat is Wellsboro, and the county has a total area of 545 square miles, of which 543 square miles is land and 2 square miles is water.
The terrain of the county is mostly hilly, with some flat areas in the valleys. The highest point in the county is Pine Creek Mountain, which has an elevation of 2,890 feet. The county is home to several state parks, including Leonard Harrison State Park, Colton Point State Park, and Hills Creek State Park.
Economy
The economy of Tioga County is largely based on agriculture and tourism. The county is home to several dairy farms, as well as beef and poultry farms. The county is also home to several wineries and breweries, which produce a variety of wines and beers.
The county is also home to several manufacturing companies, including a paper mill, a plastics factory, and a metal fabrication plant. The county is also home to several retail stores, restaurants, and hotels.
Demographics
As of the 2010 census, the population of Tioga County was 41,981. The population density was 77.2 people per square mile. The racial makeup of the county was 95.3% White, 1.3% African American, 0.3% Native American, 0.7% Asian, 0.1% Pacific Islander, 0.7% from other races, and 1.6% from two or more races. Hispanic or Latino of any race were 2.2% of the population.
The median income for a household in the county was $41,945, and the median income for a family was $50,945. The per capita income for the county was $21,845. About 11.2% of the population was below the poverty line.
Common Questions
What is Per Capita Income in Tioga County?
Per Capita income in Tioga County is $31,131.
What is the Median Family Income in Tioga County?
Median Family Income in Tioga County is $73,094.
What is the Median Household income in Tioga County?
Median Household Income in Tioga County is $59,707.
What is Income or Wage Gap in Tioga County?
Income or Wage Gap in Tioga County is 39.9%.
Women in Tioga County earn 60.1 cents for every dollar earned by a man.
What is Family Income Deficit in Tioga County?
Family Income Deficit in Tioga County is $10,067.
Families that are below poverty line in Tioga County earn $10,067 less on average than the poverty threshold level.
What is Inequality or Gini Index in Tioga County?
Inequality or Gini Index in Tioga County is 0.42.
What is the Total Population of Tioga County?
Total Population of Tioga County is 41,186.
What is the Total Male Population of Tioga County?
Total Male Population of Tioga County is 20,676.
What is the Total Female Population of Tioga County?
Total Female Population of Tioga County is 20,510.
What is the Ratio of Males per 100 Females in Tioga County?
There are 100.81 Males per 100 Females in Tioga County.
What is the Ratio of Females per 100 Males in Tioga County?
There are 99.20 Females per 100 Males in Tioga County.
What is the Median Population Age in Tioga County?
Median Population Age in Tioga County is 45.0 Years.
What is the Average Family Size in Tioga County
Average Family Size in Tioga County is 3.0 People.
What is the Average Household Size in Tioga County
Average Household Size in Tioga County is 2.4 People.
How Large is the Labor Force in Tioga County?
There are 19,404 People in the Labor Forcein in Tioga County.
What is the Percentage of People in the Labor Force in Tioga County?
56.8% of People are in the Labor Force in Tioga County.
What is the Unemployment Rate in Tioga County?
Unemployment Rate in Tioga County is 4.5%.