Susquehanna County, PA Map & Demographics
Susquehanna County Map
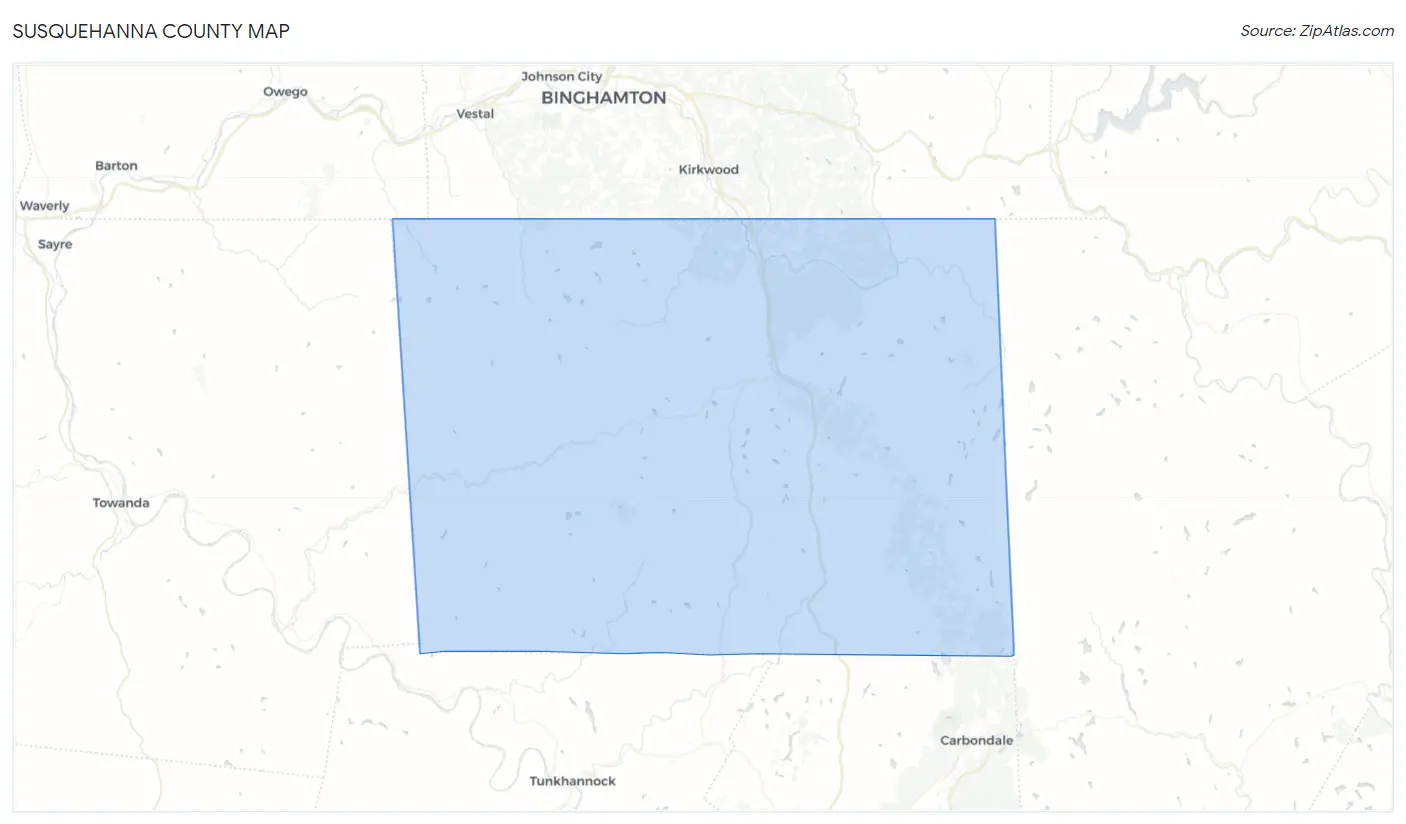
Susquehanna County Overview
$37,532
PER CAPITA INCOME
$79,488
AVG FAMILY INCOME
$63,968
AVG HOUSEHOLD INCOME
32.6%
WAGE / INCOME GAP [ % ]
67.4¢/ $1
WAGE / INCOME GAP [ $ ]
$10,926
FAMILY INCOME DEFICIT
0.46
INEQUALITY / GINI INDEX
38,540
TOTAL POPULATION
19,522
MALE POPULATION
19,018
FEMALE POPULATION
102.65
MALES / 100 FEMALES
97.42
FEMALES / 100 MALES
48.5
MEDIAN AGE
3.0
AVG FAMILY SIZE
2.4
AVG HOUSEHOLD SIZE
17,876
LABOR FORCE [ PEOPLE ]
55.5%
PERCENT IN LABOR FORCE
5.8%
UNEMPLOYMENT RATE
Susquehanna County Area Codes
Income in Susquehanna County
Income Overview in Susquehanna County
Per Capita Income in Susquehanna County is $37,532, while median incomes of families and households are $79,488 and $63,968 respectively.
| Characteristic | Number | Measure |
| Per Capita Income | 38,540 | $37,532 |
| Median Family Income | 10,203 | $79,488 |
| Mean Family Income | 10,203 | $101,885 |
| Median Household Income | 15,641 | $63,968 |
| Mean Household Income | 15,641 | $88,716 |
| Income Deficit | 10,203 | $10,926 |
| Wage / Income Gap (%) | 38,540 | 32.56% |
| Wage / Income Gap ($) | 38,540 | 67.44¢ per $1 |
| Gini / Inequality Index | 38,540 | 0.46 |
Earnings by Sex in Susquehanna County
Average Earnings in Susquehanna County are $37,872, $45,341 for men and $30,578 for women, a difference of 32.6%.
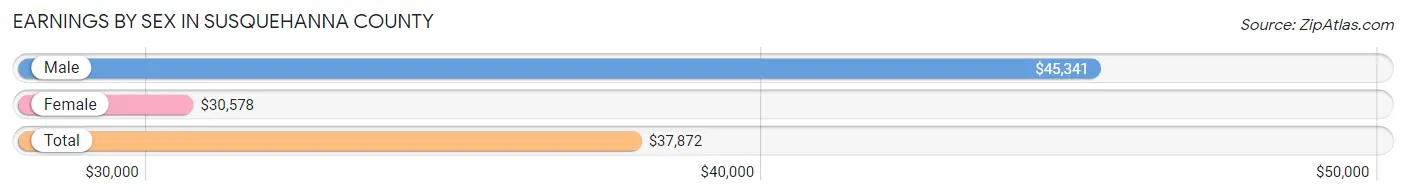
| Sex | Number | Average Earnings |
| Male | 10,356 (55.3%) | $45,341 |
| Female | 8,354 (44.7%) | $30,578 |
| Total | 18,710 (100.0%) | $37,872 |
Earnings by Sex by Income Bracket in Susquehanna County
The most common earnings brackets in Susquehanna County are $75,000 to $99,999 for men (1,217 | 11.7%) and $25,000 to $29,999 for women (770 | 9.2%).
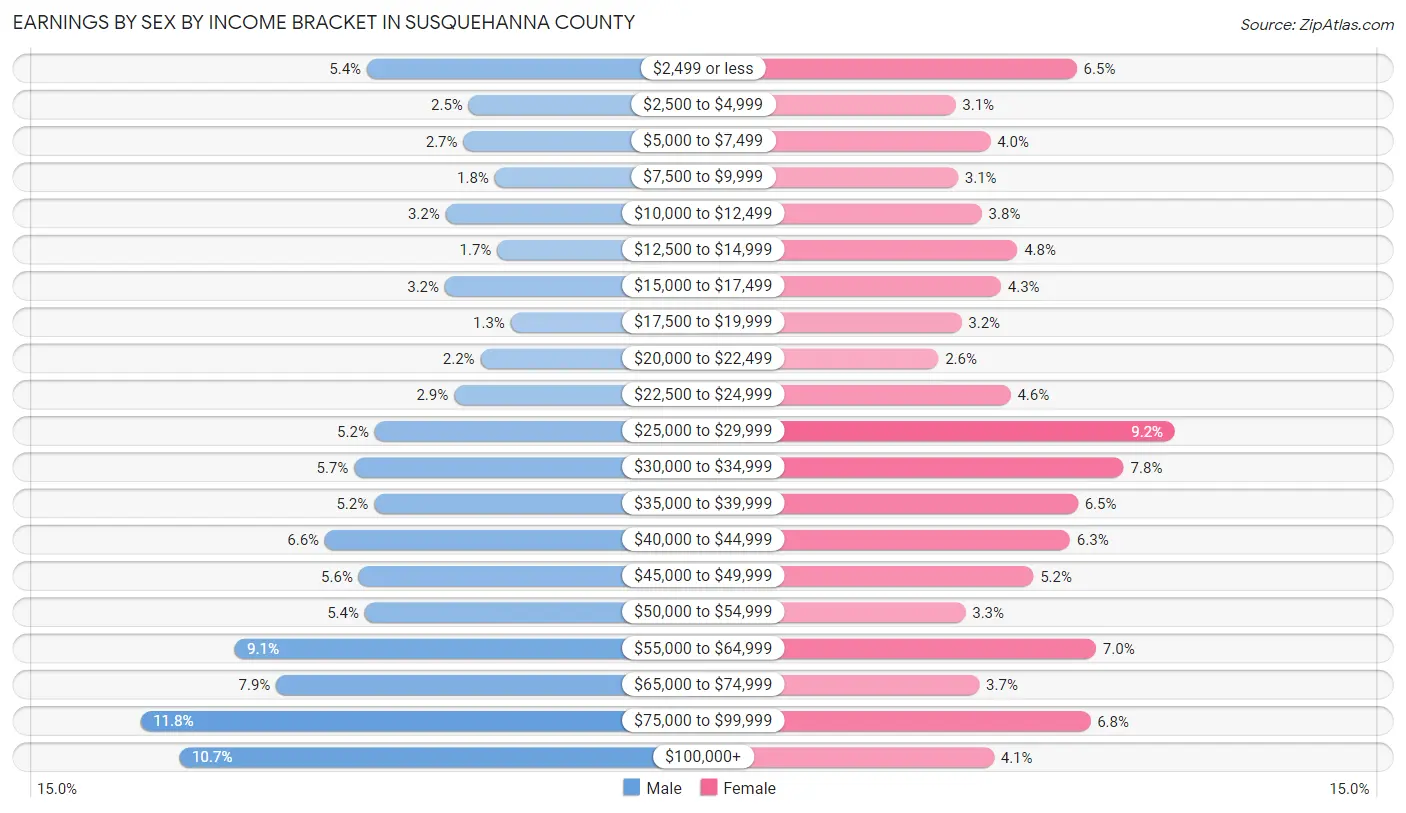
| Income | Male | Female |
| $2,499 or less | 557 (5.4%) | 540 (6.5%) |
| $2,500 to $4,999 | 261 (2.5%) | 255 (3.0%) |
| $5,000 to $7,499 | 276 (2.7%) | 337 (4.0%) |
| $7,500 to $9,999 | 185 (1.8%) | 261 (3.1%) |
| $10,000 to $12,499 | 328 (3.2%) | 317 (3.8%) |
| $12,500 to $14,999 | 178 (1.7%) | 400 (4.8%) |
| $15,000 to $17,499 | 330 (3.2%) | 362 (4.3%) |
| $17,500 to $19,999 | 139 (1.3%) | 269 (3.2%) |
| $20,000 to $22,499 | 227 (2.2%) | 215 (2.6%) |
| $22,500 to $24,999 | 303 (2.9%) | 384 (4.6%) |
| $25,000 to $29,999 | 534 (5.2%) | 770 (9.2%) |
| $30,000 to $34,999 | 594 (5.7%) | 650 (7.8%) |
| $35,000 to $39,999 | 536 (5.2%) | 542 (6.5%) |
| $40,000 to $44,999 | 679 (6.6%) | 524 (6.3%) |
| $45,000 to $49,999 | 581 (5.6%) | 438 (5.2%) |
| $50,000 to $54,999 | 563 (5.4%) | 278 (3.3%) |
| $55,000 to $64,999 | 943 (9.1%) | 585 (7.0%) |
| $65,000 to $74,999 | 821 (7.9%) | 311 (3.7%) |
| $75,000 to $99,999 | 1,217 (11.7%) | 571 (6.8%) |
| $100,000+ | 1,104 (10.7%) | 345 (4.1%) |
| Total | 10,356 (100.0%) | 8,354 (100.0%) |
Earnings by Sex by Educational Attainment in Susquehanna County
Average earnings in Susquehanna County are $49,929 for men and $33,831 for women, a difference of 32.2%. Men with an educational attainment of graduate degree enjoy the highest average annual earnings of $71,543, while those with less than high school education earn the least with $37,474. Women with an educational attainment of graduate degree earn the most with the average annual earnings of $70,208, while those with less than high school education have the smallest earnings of $16,705.
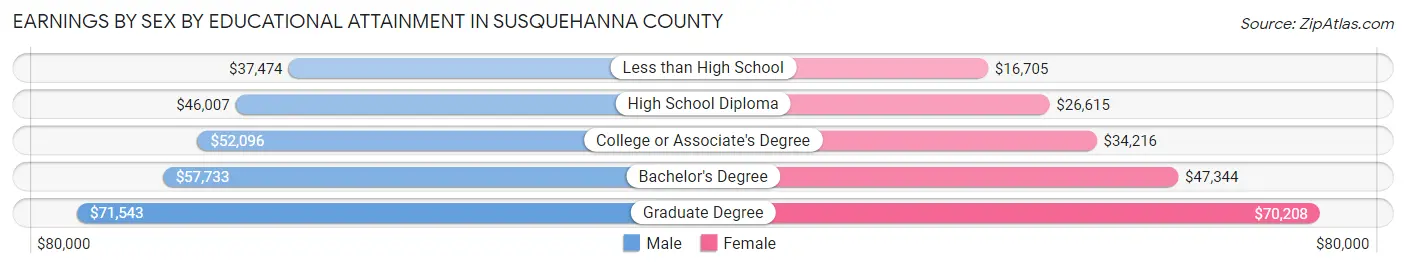
| Educational Attainment | Male Income | Female Income |
| Less than High School | $37,474 | $16,705 |
| High School Diploma | $46,007 | $26,615 |
| College or Associate's Degree | $52,096 | $34,216 |
| Bachelor's Degree | $57,733 | $47,344 |
| Graduate Degree | $71,543 | $70,208 |
| Total | $49,929 | $33,831 |
Family Income in Susquehanna County
Family Income Brackets in Susquehanna County
According to the Susquehanna County family income data, there are 2,020 families falling into the $100,000 to $149,999 income range, which is the most common income bracket and makes up 19.8% of all families. Conversely, the $10,000 to $14,999 income bracket is the least frequent group with only 143 families (1.4%) belonging to this category.
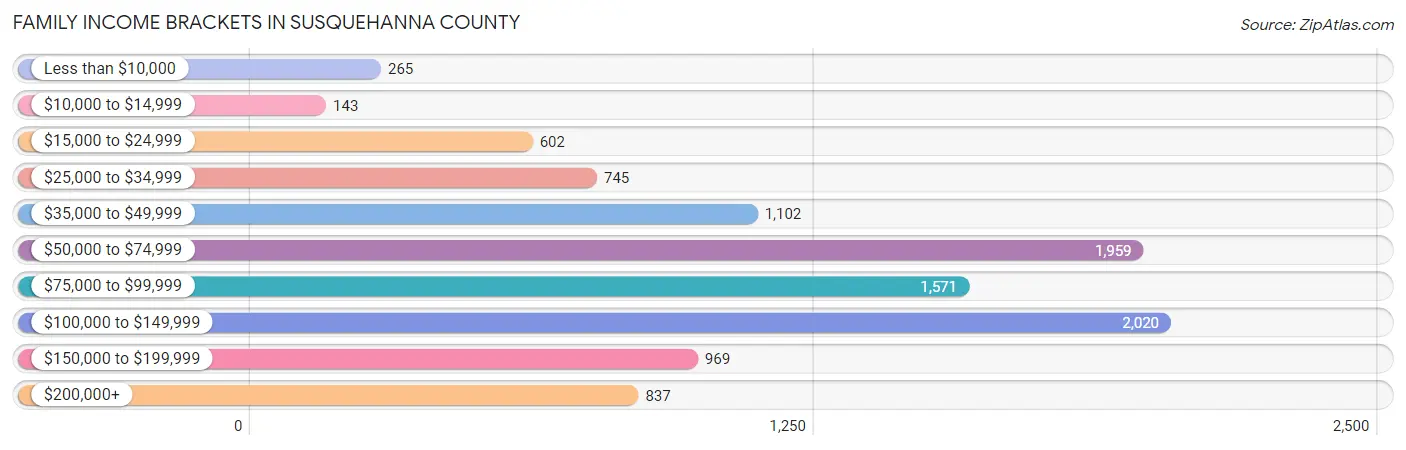
| Income Bracket | # Families | % Families |
| Less than $10,000 | 265 | 2.6% |
| $10,000 to $14,999 | 143 | 1.4% |
| $15,000 to $24,999 | 602 | 5.9% |
| $25,000 to $34,999 | 745 | 7.3% |
| $35,000 to $49,999 | 1,102 | 10.8% |
| $50,000 to $74,999 | 1,959 | 19.2% |
| $75,000 to $99,999 | 1,571 | 15.4% |
| $100,000 to $149,999 | 2,020 | 19.8% |
| $150,000 to $199,999 | 969 | 9.5% |
| $200,000+ | 837 | 8.2% |
Family Income by Famaliy Size in Susquehanna County
5-person families (657 | 6.4%) account for the highest median family income in Susquehanna County with $103,750 per family, while 2-person families (5,865 | 57.5%) have the highest median income of $35,378 per family member.
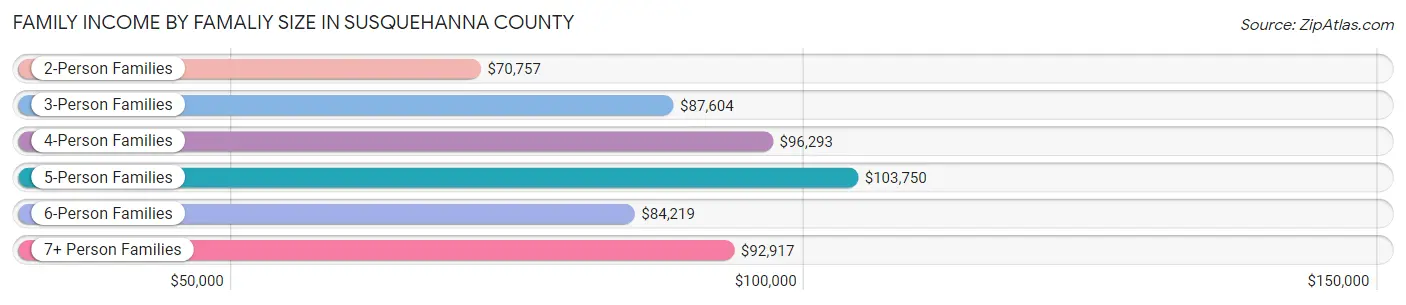
| Income Bracket | # Families | Median Income |
| 2-Person Families | 5,865 (57.5%) | $70,757 |
| 3-Person Families | 2,029 (19.9%) | $87,604 |
| 4-Person Families | 1,390 (13.6%) | $96,293 |
| 5-Person Families | 657 (6.4%) | $103,750 |
| 6-Person Families | 163 (1.6%) | $84,219 |
| 7+ Person Families | 99 (1.0%) | $92,917 |
| Total | 10,203 (100.0%) | $79,488 |
Family Income by Number of Earners in Susquehanna County
The median family income in Susquehanna County is $79,488, with families comprising 3+ earners (987) having the highest median family income of $126,042, while families with no earners (2,296) have the lowest median family income of $48,333, accounting for 9.7% and 22.5% of families, respectively.
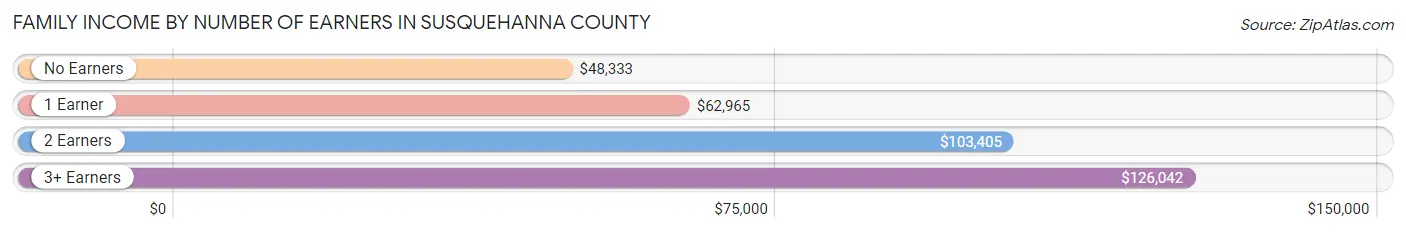
| Number of Earners | # Families | Median Income |
| No Earners | 2,296 (22.5%) | $48,333 |
| 1 Earner | 3,607 (35.3%) | $62,965 |
| 2 Earners | 3,313 (32.5%) | $103,405 |
| 3+ Earners | 987 (9.7%) | $126,042 |
| Total | 10,203 (100.0%) | $79,488 |
Household Income in Susquehanna County
Household Income Brackets in Susquehanna County
With 2,878 households falling in the category, the $50,000 to $74,999 income range is the most frequent in Susquehanna County, accounting for 18.4% of all households. In contrast, only 563 households (3.6%) fall into the less than $10,000 income bracket, making it the least populous group.
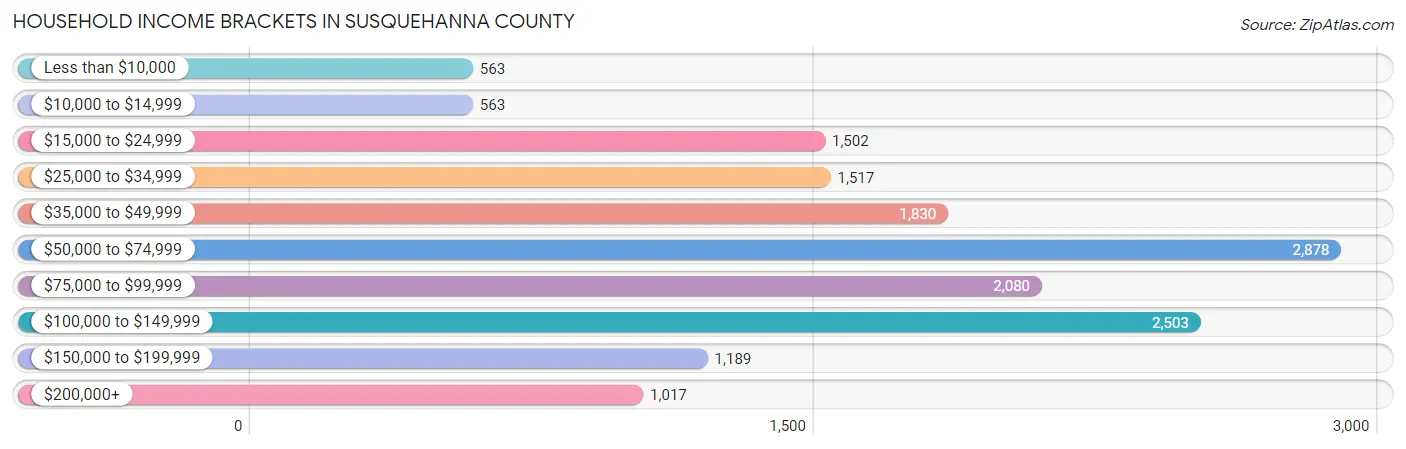
| Income Bracket | # Households | % Households |
| Less than $10,000 | 563 | 3.6% |
| $10,000 to $14,999 | 563 | 3.6% |
| $15,000 to $24,999 | 1,502 | 9.6% |
| $25,000 to $34,999 | 1,517 | 9.7% |
| $35,000 to $49,999 | 1,830 | 11.7% |
| $50,000 to $74,999 | 2,878 | 18.4% |
| $75,000 to $99,999 | 2,080 | 13.3% |
| $100,000 to $149,999 | 2,503 | 16.0% |
| $150,000 to $199,999 | 1,189 | 7.6% |
| $200,000+ | 1,017 | 6.5% |
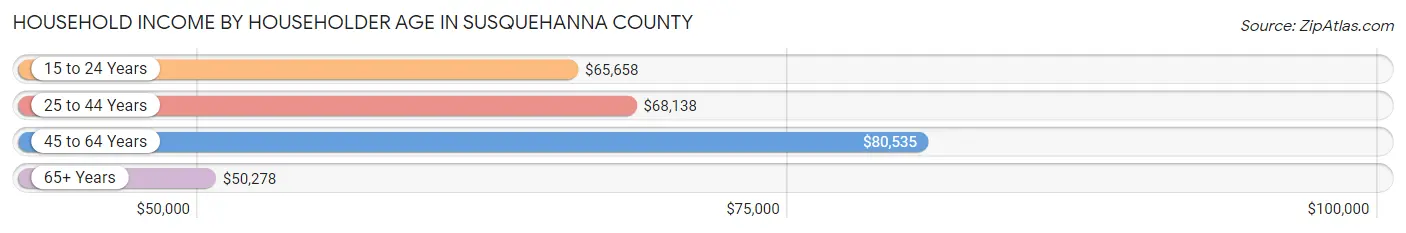
Household Income by Householder Age in Susquehanna County
The median household income in Susquehanna County is $63,968, with the highest median household income of $80,535 found in the 45 to 64 years age bracket for the primary householder. A total of 6,245 households (39.9%) fall into this category. Meanwhile, the 65+ years age bracket for the primary householder has the lowest median household income of $50,278, with 5,674 households (36.3%) in this group.
| Income Bracket | # Households | Median Income |
| 15 to 24 Years | 346 (2.2%) | $65,658 |
| 25 to 44 Years | 3,376 (21.6%) | $68,138 |
| 45 to 64 Years | 6,245 (39.9%) | $80,535 |
| 65+ Years | 5,674 (36.3%) | $50,278 |
| Total | 15,641 (100.0%) | $63,968 |
Poverty in Susquehanna County
Income Below Poverty by Sex and Age in Susquehanna County
With 9.8% poverty level for males and 12.6% for females among the residents of Susquehanna County, under 5 year old males and 5 year old females are the most vulnerable to poverty, with 202 males (22.4%) and 41 females (36.3%) in their respective age groups living below the poverty level.
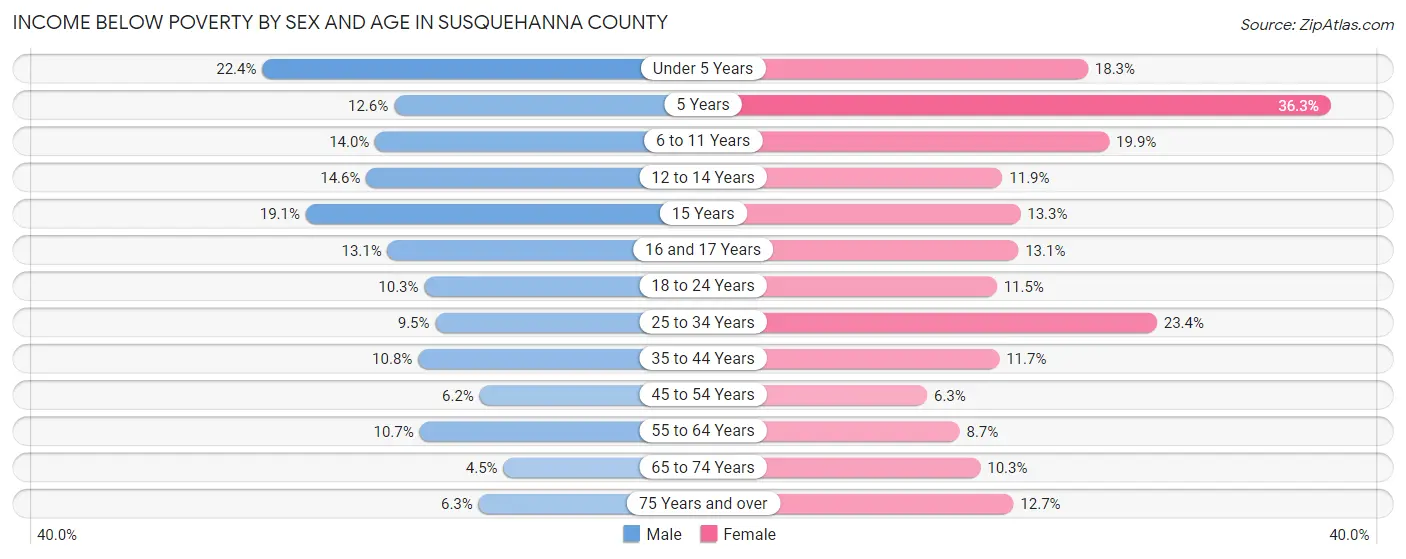
| Age Bracket | Male | Female |
| Under 5 Years | 202 (22.4%) | 161 (18.3%) |
| 5 Years | 21 (12.6%) | 41 (36.3%) |
| 6 to 11 Years | 160 (14.0%) | 242 (19.9%) |
| 12 to 14 Years | 90 (14.6%) | 75 (11.9%) |
| 15 Years | 48 (19.1%) | 31 (13.3%) |
| 16 and 17 Years | 59 (13.1%) | 52 (13.1%) |
| 18 to 24 Years | 151 (10.3%) | 143 (11.5%) |
| 25 to 34 Years | 191 (9.5%) | 425 (23.4%) |
| 35 to 44 Years | 225 (10.8%) | 230 (11.7%) |
| 45 to 54 Years | 151 (6.2%) | 147 (6.3%) |
| 55 to 64 Years | 366 (10.7%) | 281 (8.7%) |
| 65 to 74 Years | 119 (4.4%) | 282 (10.3%) |
| 75 Years and over | 106 (6.3%) | 255 (12.7%) |
| Total | 1,889 (9.8%) | 2,365 (12.6%) |
Income Above Poverty by Sex and Age in Susquehanna County
According to the poverty statistics in Susquehanna County, males aged 65 to 74 years and females aged 45 to 54 years are the age groups that are most secure financially, with 95.6% of males and 93.7% of females in these age groups living above the poverty line.
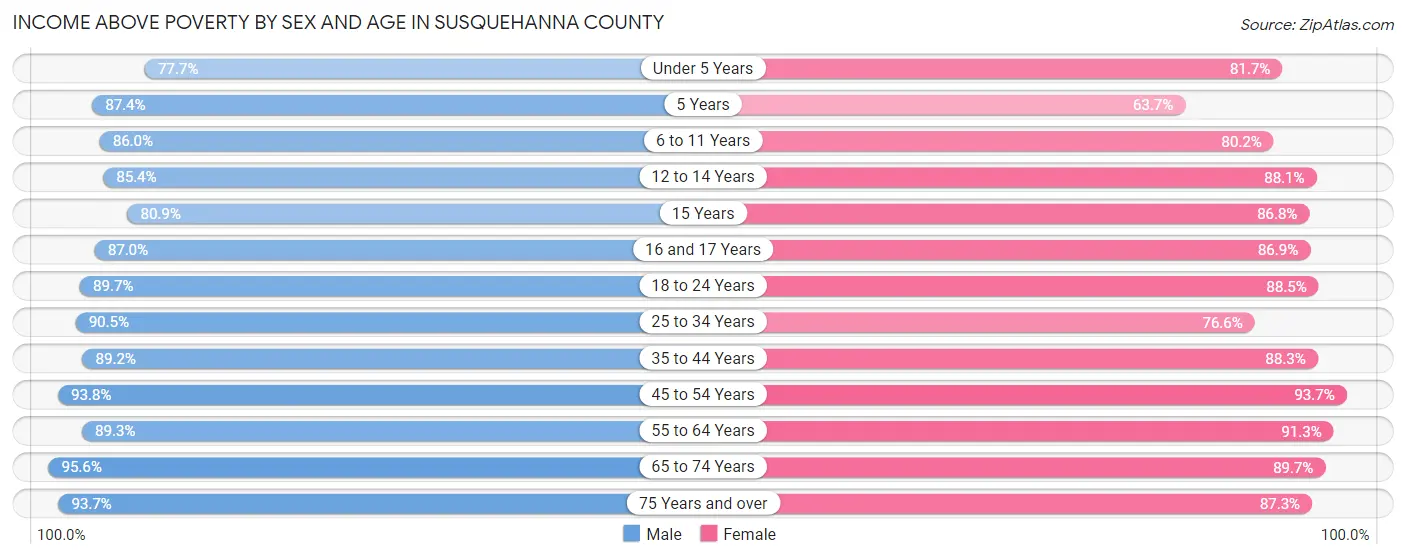
| Age Bracket | Male | Female |
| Under 5 Years | 702 (77.6%) | 720 (81.7%) |
| 5 Years | 146 (87.4%) | 72 (63.7%) |
| 6 to 11 Years | 985 (86.0%) | 977 (80.1%) |
| 12 to 14 Years | 525 (85.4%) | 554 (88.1%) |
| 15 Years | 203 (80.9%) | 203 (86.8%) |
| 16 and 17 Years | 393 (87.0%) | 345 (86.9%) |
| 18 to 24 Years | 1,312 (89.7%) | 1,101 (88.5%) |
| 25 to 34 Years | 1,819 (90.5%) | 1,392 (76.6%) |
| 35 to 44 Years | 1,863 (89.2%) | 1,737 (88.3%) |
| 45 to 54 Years | 2,280 (93.8%) | 2,177 (93.7%) |
| 55 to 64 Years | 3,061 (89.3%) | 2,933 (91.3%) |
| 65 to 74 Years | 2,557 (95.6%) | 2,462 (89.7%) |
| 75 Years and over | 1,580 (93.7%) | 1,747 (87.3%) |
| Total | 17,426 (90.2%) | 16,420 (87.4%) |
Income Below Poverty Among Married-Couple Families in Susquehanna County
The poverty statistics for married-couple families in Susquehanna County show that 3.5% or 268 of the total 7,716 families live below the poverty line. Families with 5 or more children have the highest poverty rate of 41.0%, comprising of 25 families. On the other hand, families with no children have the lowest poverty rate of 2.9%, which includes 162 families.
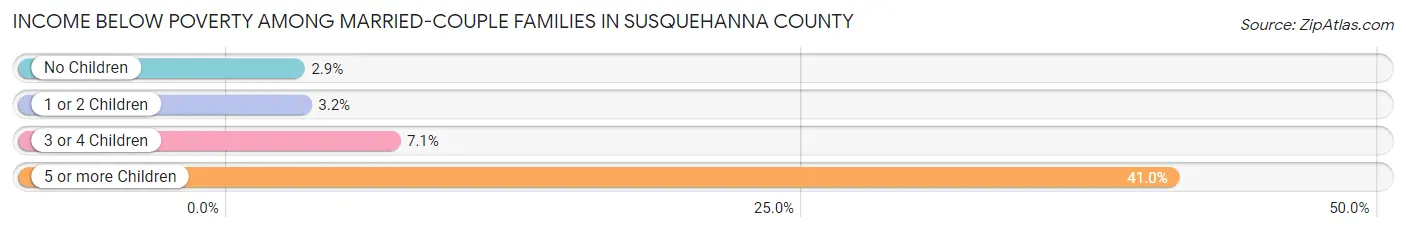
| Children | Above Poverty | Below Poverty |
| No Children | 5,436 (97.1%) | 162 (2.9%) |
| 1 or 2 Children | 1,607 (96.8%) | 53 (3.2%) |
| 3 or 4 Children | 369 (92.9%) | 28 (7.0%) |
| 5 or more Children | 36 (59.0%) | 25 (41.0%) |
| Total | 7,448 (96.5%) | 268 (3.5%) |
Income Below Poverty Among Single-Parent Households in Susquehanna County
According to the poverty data in Susquehanna County, 9.9% or 103 single-father households and 26.9% or 388 single-mother households are living below the poverty line. Among single-father households, those with 5 or more children have the highest poverty rate, with 5 households (41.7%) experiencing poverty. Likewise, among single-mother households, those with 5 or more children have the highest poverty rate, with 10 households (58.8%) falling below the poverty line.
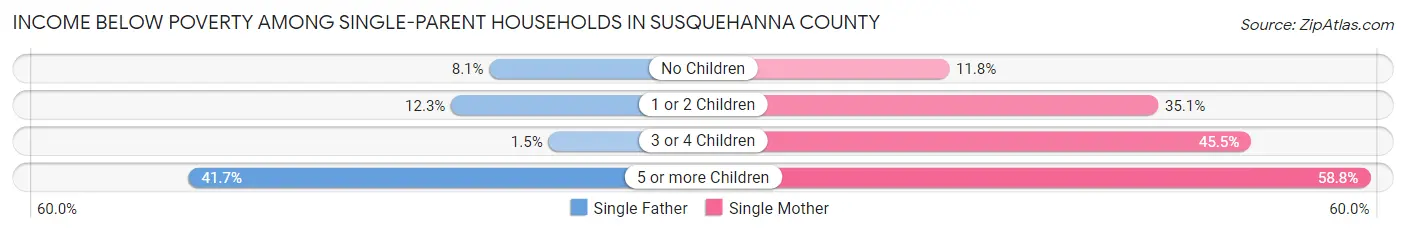
| Children | Single Father | Single Mother |
| No Children | 41 (8.1%) | 69 (11.8%) |
| 1 or 2 Children | 56 (12.3%) | 248 (35.1%) |
| 3 or 4 Children | 1 (1.5%) | 61 (45.5%) |
| 5 or more Children | 5 (41.7%) | 10 (58.8%) |
| Total | 103 (9.9%) | 388 (26.9%) |
Income Below Poverty Among Married-Couple vs Single-Parent Households in Susquehanna County
The poverty data for Susquehanna County shows that 268 of the married-couple family households (3.5%) and 491 of the single-parent households (19.7%) are living below the poverty level. Within the married-couple family households, those with 5 or more children have the highest poverty rate, with 25 households (41.0%) falling below the poverty line. Among the single-parent households, those with 5 or more children have the highest poverty rate, with 15 household (51.7%) living below poverty.
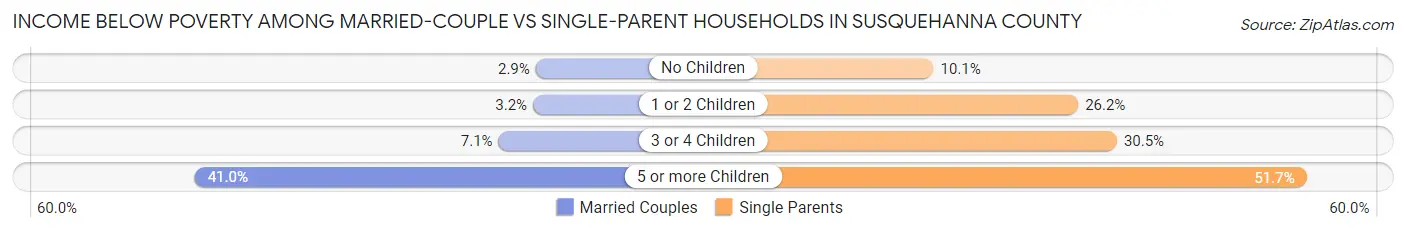
| Children | Married-Couple Families | Single-Parent Households |
| No Children | 162 (2.9%) | 110 (10.1%) |
| 1 or 2 Children | 53 (3.2%) | 304 (26.2%) |
| 3 or 4 Children | 28 (7.0%) | 62 (30.5%) |
| 5 or more Children | 25 (41.0%) | 15 (51.7%) |
| Total | 268 (3.5%) | 491 (19.7%) |
Race in Susquehanna County
The most populous races in Susquehanna County are White / Caucasian (37,134 | 96.4%), Two or more Races (973 | 2.5%), and Hispanic or Latino (739 | 1.9%).
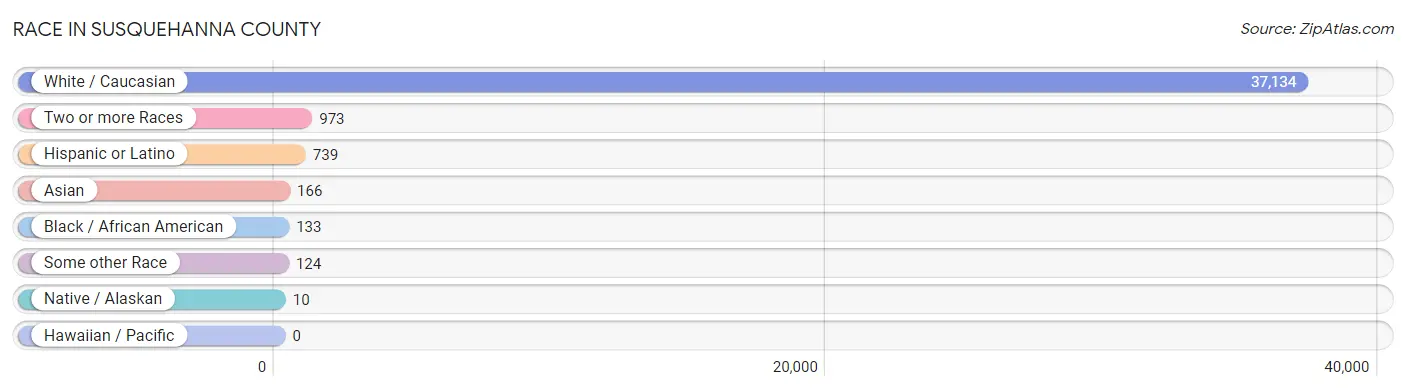
| Race | # Population | % Population |
| Asian | 166 | 0.4% |
| Black / African American | 133 | 0.4% |
| Hawaiian / Pacific | 0 | 0.0% |
| Hispanic or Latino | 739 | 1.9% |
| Native / Alaskan | 10 | 0.0% |
| White / Caucasian | 37,134 | 96.4% |
| Two or more Races | 973 | 2.5% |
| Some other Race | 124 | 0.3% |
| Total | 38,540 | 100.0% |
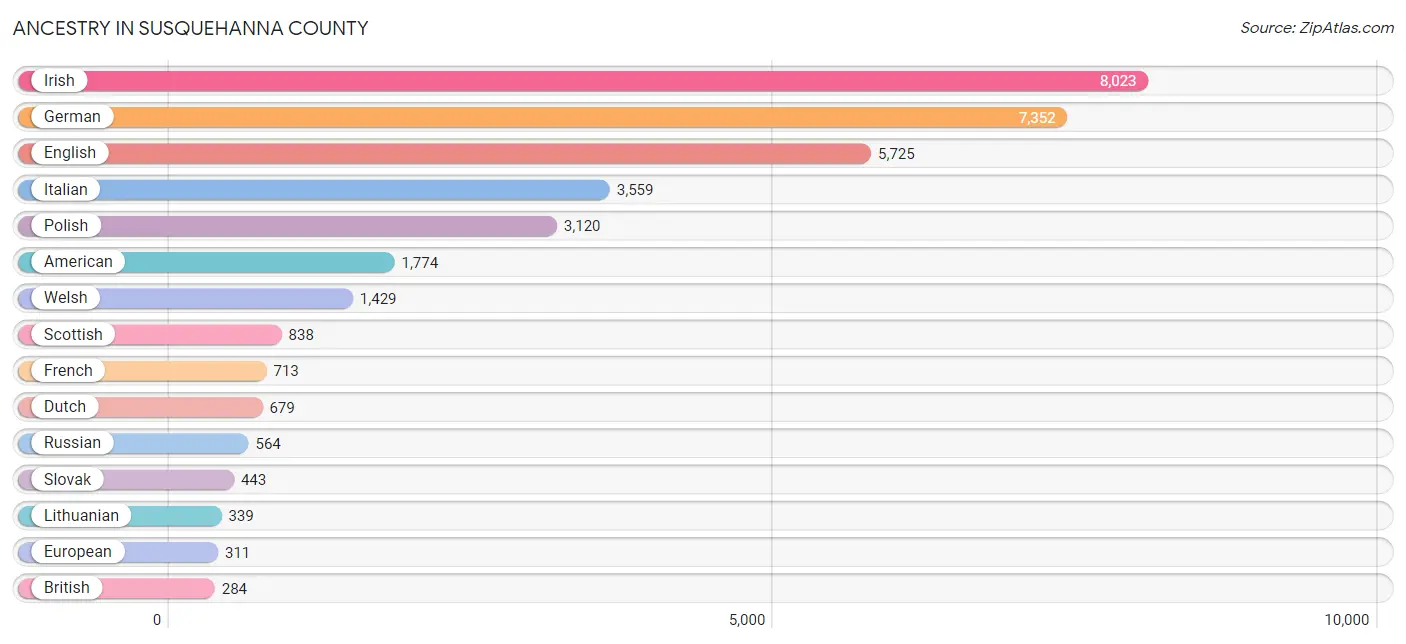
Ancestry in Susquehanna County
The most populous ancestries reported in Susquehanna County are Irish (8,023 | 20.8%), German (7,352 | 19.1%), English (5,725 | 14.8%), Italian (3,559 | 9.2%), and Polish (3,120 | 8.1%), together accounting for 72.1% of all Susquehanna County residents.
| Ancestry | # Population | % Population |
| Alsatian | 3 | 0.0% |
| American | 1,774 | 4.6% |
| Apache | 18 | 0.1% |
| Arab | 20 | 0.1% |
| Austrian | 143 | 0.4% |
| Belgian | 16 | 0.0% |
| Bhutanese | 22 | 0.1% |
| Blackfeet | 42 | 0.1% |
| Brazilian | 4 | 0.0% |
| British | 284 | 0.7% |
| Bulgarian | 2 | 0.0% |
| Burmese | 56 | 0.2% |
| Canadian | 25 | 0.1% |
| Carpatho Rusyn | 3 | 0.0% |
| Central American | 66 | 0.2% |
| Central American Indian | 3 | 0.0% |
| Cherokee | 95 | 0.3% |
| Cheyenne | 5 | 0.0% |
| Chilean | 30 | 0.1% |
| Chippewa | 6 | 0.0% |
| Colombian | 32 | 0.1% |
| Comanche | 3 | 0.0% |
| Costa Rican | 13 | 0.0% |
| Croatian | 11 | 0.0% |
| Cuban | 36 | 0.1% |
| Czech | 148 | 0.4% |
| Czechoslovakian | 94 | 0.2% |
| Danish | 96 | 0.3% |
| Delaware | 12 | 0.0% |
| Dominican | 44 | 0.1% |
| Dutch | 679 | 1.8% |
| Eastern European | 72 | 0.2% |
| Ecuadorian | 84 | 0.2% |
| Egyptian | 7 | 0.0% |
| English | 5,725 | 14.8% |
| European | 311 | 0.8% |
| Finnish | 23 | 0.1% |
| French | 713 | 1.8% |
| French Canadian | 168 | 0.4% |
| German | 7,352 | 19.1% |
| Greek | 55 | 0.1% |
| Guatemalan | 2 | 0.0% |
| Honduran | 20 | 0.1% |
| Hopi | 5 | 0.0% |
| Hungarian | 261 | 0.7% |
| Indian (Asian) | 60 | 0.2% |
| Iranian | 4 | 0.0% |
| Irish | 8,023 | 20.8% |
| Iroquois | 24 | 0.1% |
| Italian | 3,559 | 9.2% |
| Japanese | 8 | 0.0% |
| Korean | 76 | 0.2% |
| Lebanese | 11 | 0.0% |
| Lithuanian | 339 | 0.9% |
| Lumbee | 3 | 0.0% |
| Luxembourger | 1 | 0.0% |
| Mexican | 64 | 0.2% |
| Nigerian | 20 | 0.1% |
| Northern European | 29 | 0.1% |
| Norwegian | 156 | 0.4% |
| Pakistani | 7 | 0.0% |
| Panamanian | 28 | 0.1% |
| Pennsylvania German | 184 | 0.5% |
| Peruvian | 21 | 0.1% |
| Polish | 3,120 | 8.1% |
| Portuguese | 85 | 0.2% |
| Puerto Rican | 245 | 0.6% |
| Romanian | 8 | 0.0% |
| Russian | 564 | 1.5% |
| Salvadoran | 3 | 0.0% |
| Scandinavian | 44 | 0.1% |
| Scotch-Irish | 173 | 0.4% |
| Scottish | 838 | 2.2% |
| Sioux | 24 | 0.1% |
| Slavic | 40 | 0.1% |
| Slovak | 443 | 1.1% |
| Slovene | 90 | 0.2% |
| South American | 167 | 0.4% |
| Spaniard | 21 | 0.1% |
| Spanish | 44 | 0.1% |
| Sri Lankan | 24 | 0.1% |
| Subsaharan African | 29 | 0.1% |
| Swedish | 275 | 0.7% |
| Swiss | 87 | 0.2% |
| Thai | 13 | 0.0% |
| Turkish | 3 | 0.0% |
| Ukrainian | 192 | 0.5% |
| Welsh | 1,429 | 3.7% |
| West Indian | 23 | 0.1% |
| Yugoslavian | 8 | 0.0% | View All 90 Rows |
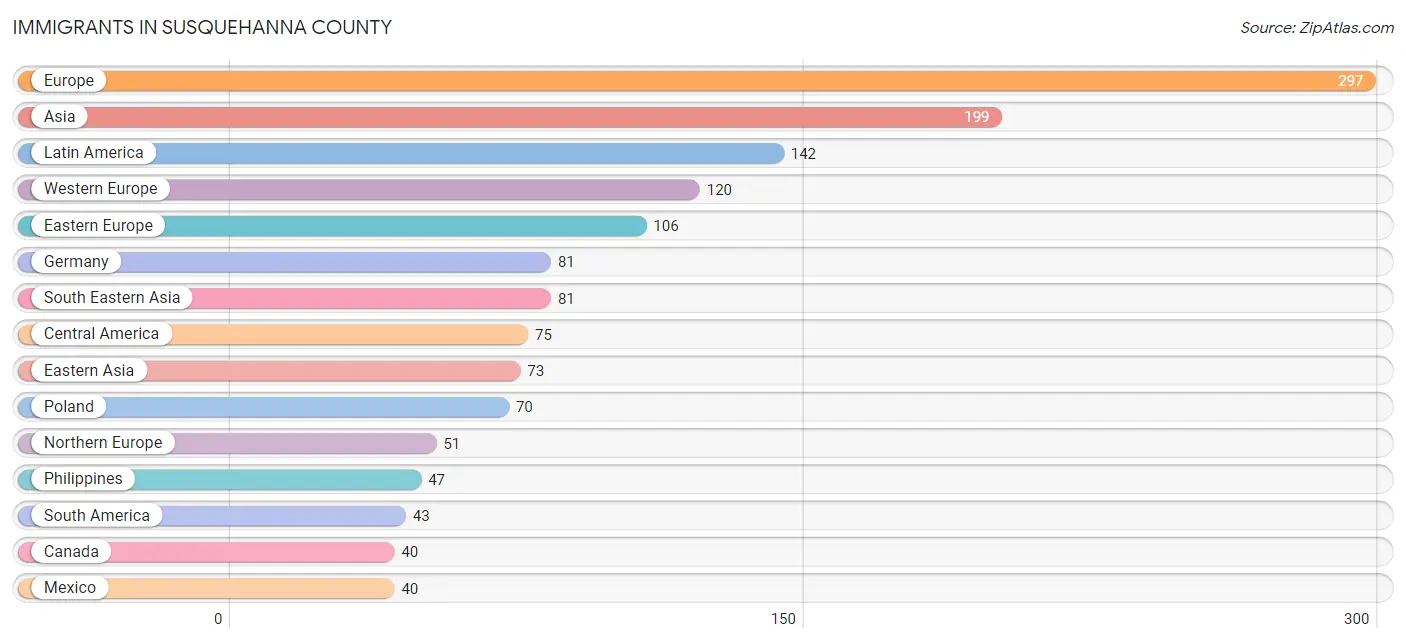
Immigrants in Susquehanna County
The most numerous immigrant groups reported in Susquehanna County came from Europe (297 | 0.8%), Asia (199 | 0.5%), Latin America (142 | 0.4%), Western Europe (120 | 0.3%), and Eastern Europe (106 | 0.3%), together accounting for 2.2% of all Susquehanna County residents.
| Immigration Origin | # Population | % Population |
| Africa | 4 | 0.0% |
| Asia | 199 | 0.5% |
| Austria | 9 | 0.0% |
| Bosnia and Herzegovina | 2 | 0.0% |
| Brazil | 4 | 0.0% |
| Cambodia | 3 | 0.0% |
| Canada | 40 | 0.1% |
| Caribbean | 24 | 0.1% |
| Central America | 75 | 0.2% |
| Chile | 11 | 0.0% |
| China | 39 | 0.1% |
| Costa Rica | 6 | 0.0% |
| Cuba | 3 | 0.0% |
| Dominican Republic | 16 | 0.0% |
| Eastern Asia | 73 | 0.2% |
| Eastern Europe | 106 | 0.3% |
| Ecuador | 20 | 0.1% |
| El Salvador | 3 | 0.0% |
| England | 15 | 0.0% |
| Europe | 297 | 0.8% |
| France | 6 | 0.0% |
| Germany | 81 | 0.2% |
| Guatemala | 2 | 0.0% |
| Guyana | 2 | 0.0% |
| Honduras | 7 | 0.0% |
| India | 13 | 0.0% |
| Iran | 8 | 0.0% |
| Italy | 18 | 0.1% |
| Jamaica | 5 | 0.0% |
| Japan | 12 | 0.0% |
| Korea | 22 | 0.1% |
| Latin America | 142 | 0.4% |
| Lebanon | 24 | 0.1% |
| Lithuania | 7 | 0.0% |
| Mexico | 40 | 0.1% |
| Middle Africa | 1 | 0.0% |
| Netherlands | 24 | 0.1% |
| Nigeria | 3 | 0.0% |
| Northern Europe | 51 | 0.1% |
| Panama | 17 | 0.0% |
| Peru | 6 | 0.0% |
| Philippines | 47 | 0.1% |
| Poland | 70 | 0.2% |
| Portugal | 2 | 0.0% |
| Romania | 1 | 0.0% |
| Russia | 14 | 0.0% |
| South America | 43 | 0.1% |
| South Central Asia | 21 | 0.1% |
| South Eastern Asia | 81 | 0.2% |
| Southern Europe | 20 | 0.1% |
| Thailand | 9 | 0.0% |
| Ukraine | 8 | 0.0% |
| Vietnam | 22 | 0.1% |
| Western Africa | 3 | 0.0% |
| Western Asia | 24 | 0.1% |
| Western Europe | 120 | 0.3% |
| Zaire | 1 | 0.0% | View All 57 Rows |
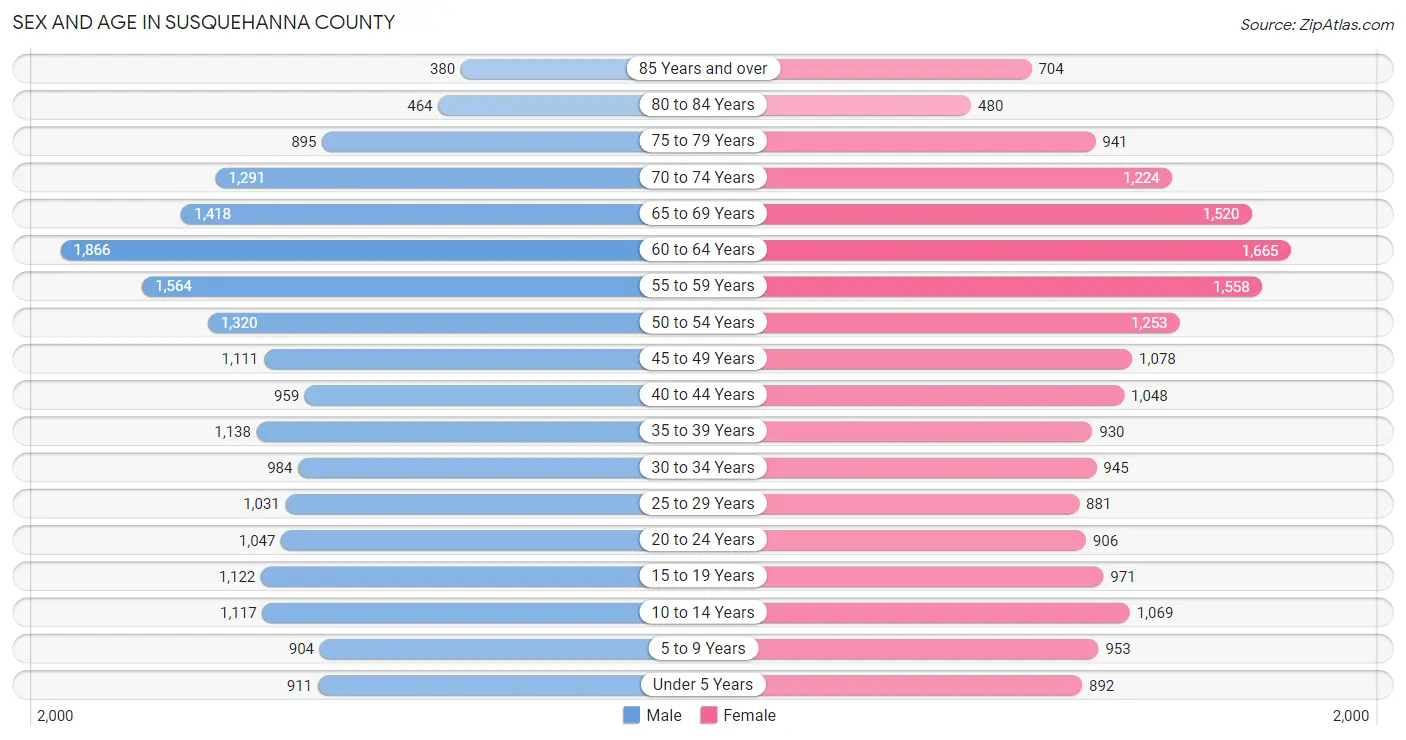
Sex and Age in Susquehanna County
Sex and Age in Susquehanna County
The most populous age groups in Susquehanna County are 60 to 64 Years (1,866 | 9.6%) for men and 60 to 64 Years (1,665 | 8.7%) for women.
| Age Bracket | Male | Female |
| Under 5 Years | 911 (4.7%) | 892 (4.7%) |
| 5 to 9 Years | 904 (4.6%) | 953 (5.0%) |
| 10 to 14 Years | 1,117 (5.7%) | 1,069 (5.6%) |
| 15 to 19 Years | 1,122 (5.8%) | 971 (5.1%) |
| 20 to 24 Years | 1,047 (5.4%) | 906 (4.8%) |
| 25 to 29 Years | 1,031 (5.3%) | 881 (4.6%) |
| 30 to 34 Years | 984 (5.0%) | 945 (5.0%) |
| 35 to 39 Years | 1,138 (5.8%) | 930 (4.9%) |
| 40 to 44 Years | 959 (4.9%) | 1,048 (5.5%) |
| 45 to 49 Years | 1,111 (5.7%) | 1,078 (5.7%) |
| 50 to 54 Years | 1,320 (6.8%) | 1,253 (6.6%) |
| 55 to 59 Years | 1,564 (8.0%) | 1,558 (8.2%) |
| 60 to 64 Years | 1,866 (9.6%) | 1,665 (8.7%) |
| 65 to 69 Years | 1,418 (7.3%) | 1,520 (8.0%) |
| 70 to 74 Years | 1,291 (6.6%) | 1,224 (6.4%) |
| 75 to 79 Years | 895 (4.6%) | 941 (5.0%) |
| 80 to 84 Years | 464 (2.4%) | 480 (2.5%) |
| 85 Years and over | 380 (1.9%) | 704 (3.7%) |
| Total | 19,522 (100.0%) | 19,018 (100.0%) |
Families and Households in Susquehanna County
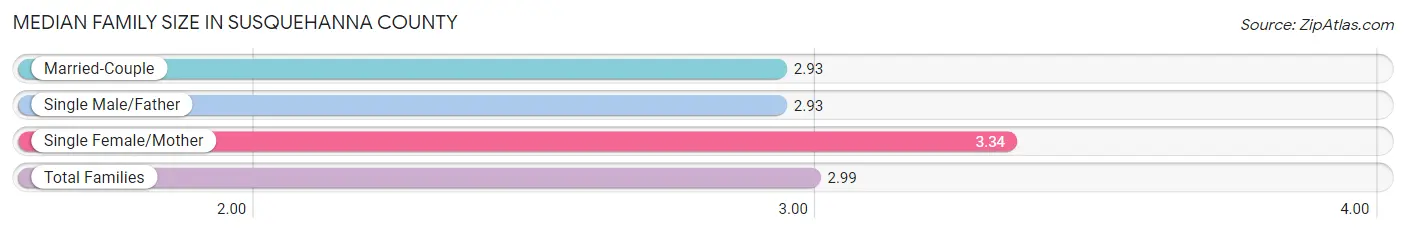
Median Family Size in Susquehanna County
The median family size in Susquehanna County is 2.99 persons per family, with single female/mother families (1,443 | 14.1%) accounting for the largest median family size of 3.34 persons per family. On the other hand, married-couple families (7,716 | 75.6%) represent the smallest median family size with 2.93 persons per family.
| Family Type | # Families | Family Size |
| Married-Couple | 7,716 (75.6%) | 2.93 |
| Single Male/Father | 1,044 (10.2%) | 2.93 |
| Single Female/Mother | 1,443 (14.1%) | 3.34 |
| Total Families | 10,203 (100.0%) | 2.99 |
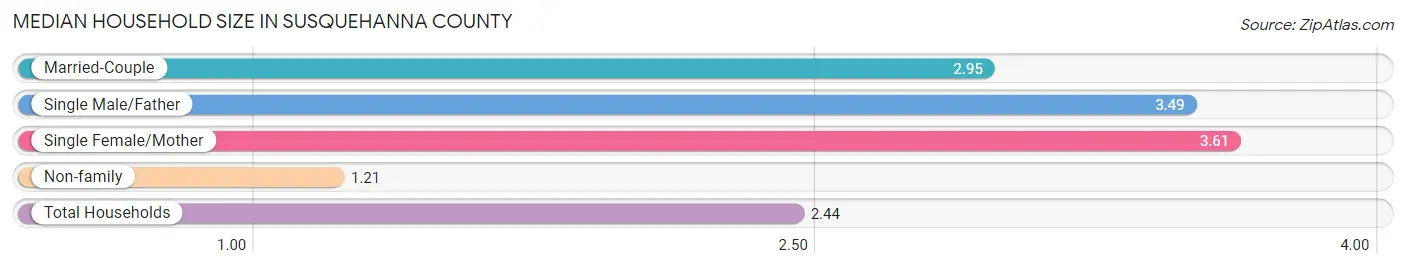
Median Household Size in Susquehanna County
The median household size in Susquehanna County is 2.44 persons per household, with single female/mother households (1,443 | 9.2%) accounting for the largest median household size of 3.61 persons per household. non-family households (5,438 | 34.8%) represent the smallest median household size with 1.21 persons per household.
| Household Type | # Households | Household Size |
| Married-Couple | 7,716 (49.3%) | 2.95 |
| Single Male/Father | 1,044 (6.7%) | 3.49 |
| Single Female/Mother | 1,443 (9.2%) | 3.61 |
| Non-family | 5,438 (34.8%) | 1.21 |
| Total Households | 15,641 (100.0%) | 2.44 |
Household Size by Marriage Status in Susquehanna County
Out of a total of 15,641 households in Susquehanna County, 10,203 (65.2%) are family households, while 5,438 (34.8%) are nonfamily households. The most numerous type of family households are 2-person households, comprising 5,537, and the most common type of nonfamily households are 1-person households, comprising 4,564.
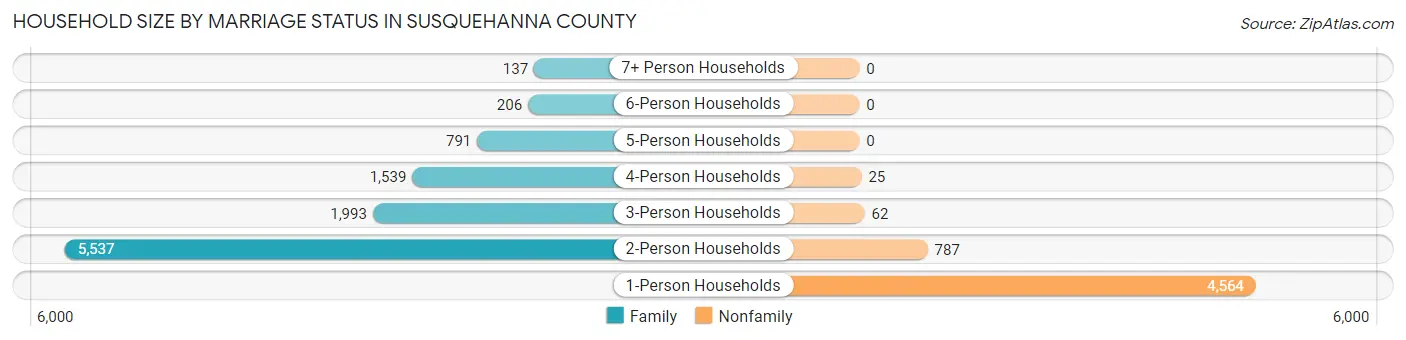
| Household Size | Family Households | Nonfamily Households |
| 1-Person Households | - | 4,564 (29.2%) |
| 2-Person Households | 5,537 (35.4%) | 787 (5.0%) |
| 3-Person Households | 1,993 (12.7%) | 62 (0.4%) |
| 4-Person Households | 1,539 (9.8%) | 25 (0.2%) |
| 5-Person Households | 791 (5.1%) | 0 (0.0%) |
| 6-Person Households | 206 (1.3%) | 0 (0.0%) |
| 7+ Person Households | 137 (0.9%) | 0 (0.0%) |
| Total | 10,203 (65.2%) | 5,438 (34.8%) |
Female Fertility in Susquehanna County
Fertility by Age in Susquehanna County
Average fertility rate in Susquehanna County is 51.0 births per 1,000 women. Women in the age bracket of 20 to 34 years have the highest fertility rate with 92.0 births per 1,000 women. Women in the age bracket of 20 to 34 years acount for 70.4% of all women with births.
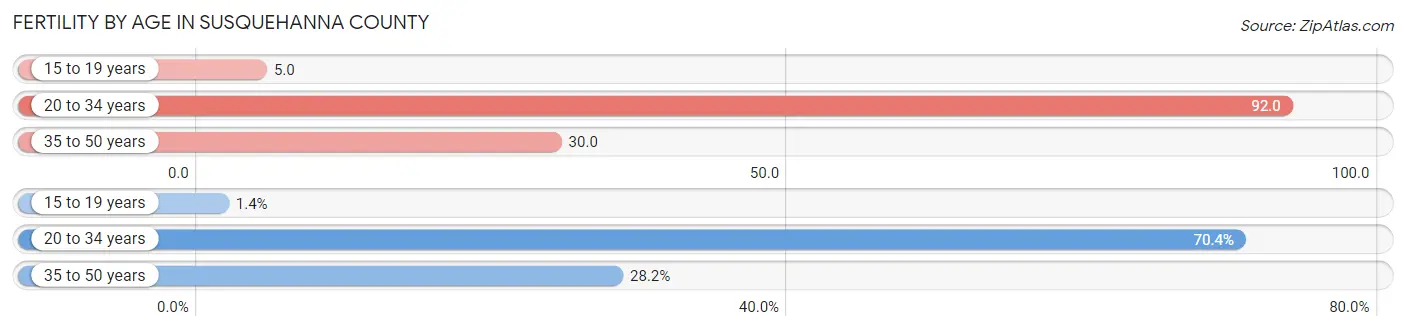
| Age Bracket | Women with Births | Births / 1,000 Women |
| 15 to 19 years | 5 (1.4%) | 5.0 |
| 20 to 34 years | 250 (70.4%) | 92.0 |
| 35 to 50 years | 100 (28.2%) | 30.0 |
| Total | 355 (100.0%) | 51.0 |
Fertility by Age by Marriage Status in Susquehanna County
67.3% of women with births (355) in Susquehanna County are married. The highest percentage of unmarried women with births falls into 15 to 19 years age bracket with 100.0% of them unmarried at the time of birth, while the lowest percentage of unmarried women with births belong to 35 to 50 years age bracket with 20.0% of them unmarried.
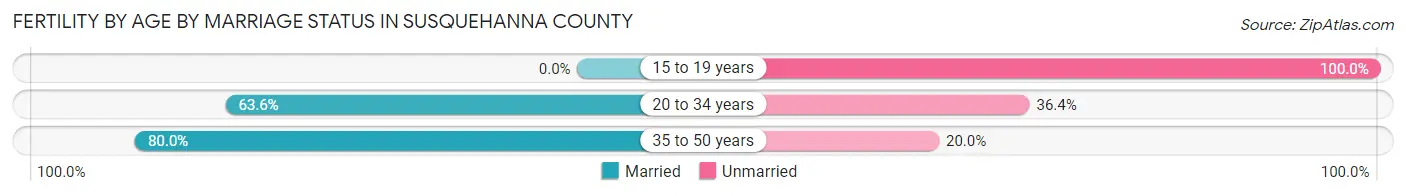
| Age Bracket | Married | Unmarried |
| 15 to 19 years | 0 (0.0%) | 5 (100.0%) |
| 20 to 34 years | 159 (63.6%) | 91 (36.4%) |
| 35 to 50 years | 80 (80.0%) | 20 (20.0%) |
| Total | 239 (67.3%) | 116 (32.7%) |
Fertility by Education in Susquehanna County
Average fertility rate in Susquehanna County is 51.0 births per 1,000 women. Women with the education attainment of college or associate's degree have the highest fertility rate of 61.0 births per 1,000 women, while women with the education attainment of less than high school have the lowest fertility at 18.0 births per 1,000 women. Women with the education attainment of college or associate's degree represent 37.5% of all women with births.
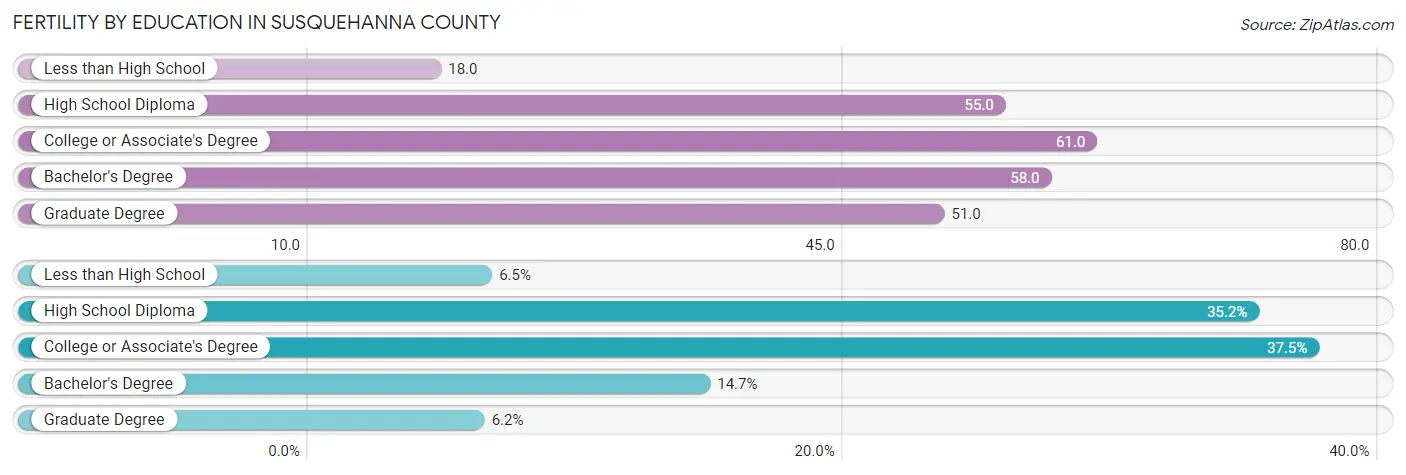
| Educational Attainment | Women with Births | Births / 1,000 Women |
| Less than High School | 23 (6.5%) | 18.0 |
| High School Diploma | 125 (35.2%) | 55.0 |
| College or Associate's Degree | 133 (37.5%) | 61.0 |
| Bachelor's Degree | 52 (14.6%) | 58.0 |
| Graduate Degree | 22 (6.2%) | 51.0 |
| Total | 355 (100.0%) | 51.0 |
Fertility by Education by Marriage Status in Susquehanna County
32.7% of women with births in Susquehanna County are unmarried. Women with the educational attainment of bachelor's degree are most likely to be married with 100.0% of them married at childbirth, while women with the educational attainment of less than high school are least likely to be married with 47.8% of them unmarried at childbirth.
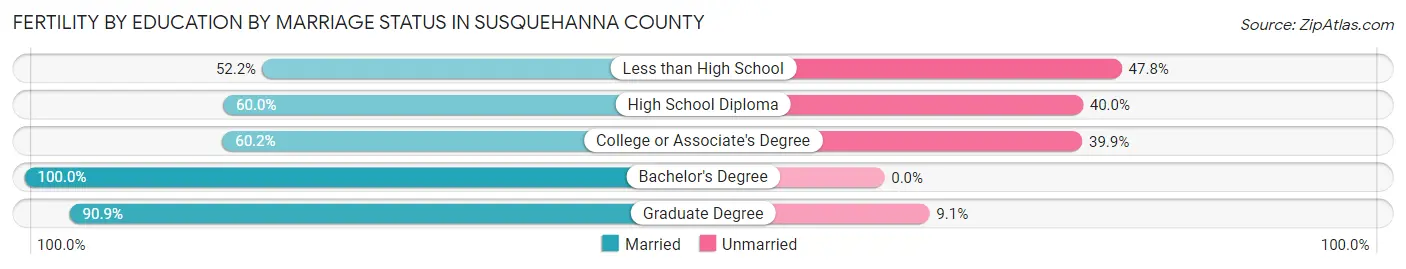
| Educational Attainment | Married | Unmarried |
| Less than High School | 12 (52.2%) | 11 (47.8%) |
| High School Diploma | 75 (60.0%) | 50 (40.0%) |
| College or Associate's Degree | 80 (60.2%) | 53 (39.9%) |
| Bachelor's Degree | 52 (100.0%) | 0 (0.0%) |
| Graduate Degree | 20 (90.9%) | 2 (9.1%) |
| Total | 239 (67.3%) | 116 (32.7%) |
Employment Characteristics in Susquehanna County
Employment by Class of Employer in Susquehanna County
Among the 16,495 employed individuals in Susquehanna County, private company employees (11,248 | 68.2%), not-for-profit organizations (1,590 | 9.6%), and self-employed (not incorporated) (1,137 | 6.9%) make up the most common classes of employment.
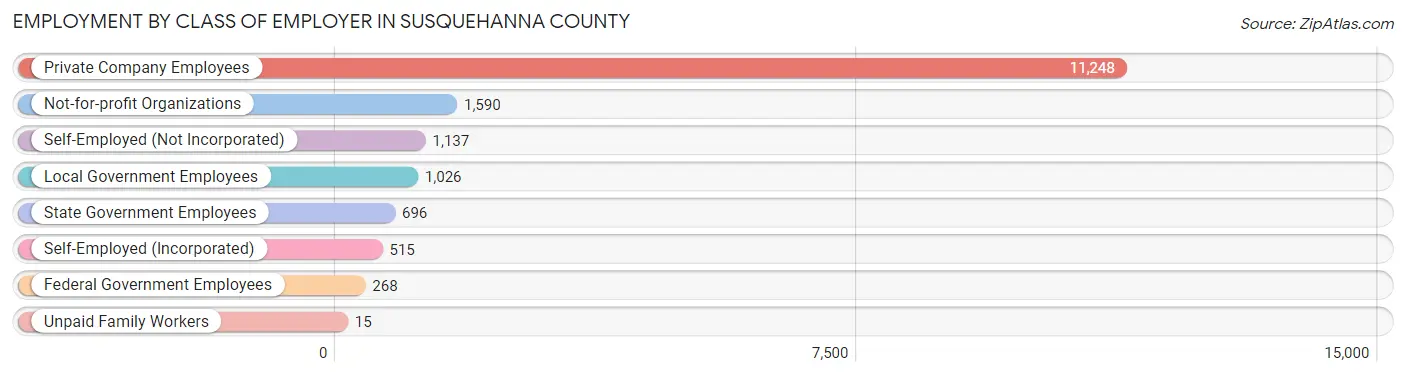
| Employer Class | # Employees | % Employees |
| Private Company Employees | 11,248 | 68.2% |
| Self-Employed (Incorporated) | 515 | 3.1% |
| Self-Employed (Not Incorporated) | 1,137 | 6.9% |
| Not-for-profit Organizations | 1,590 | 9.6% |
| Local Government Employees | 1,026 | 6.2% |
| State Government Employees | 696 | 4.2% |
| Federal Government Employees | 268 | 1.6% |
| Unpaid Family Workers | 15 | 0.1% |
| Total | 16,495 | 100.0% |
Employment Status by Age in Susquehanna County
According to the labor force statistics for Susquehanna County, out of the total population over 16 years of age (32,209), 55.5% or 17,876 individuals are in the labor force, with 5.8% or 1,037 of them unemployed. The age group with the highest labor force participation rate is 35 to 44 years, with 81.7% or 3,329 individuals in the labor force. Within the labor force, the 20 to 24 years age range has the highest percentage of unemployed individuals, with 16.0% or 242 of them being unemployed.
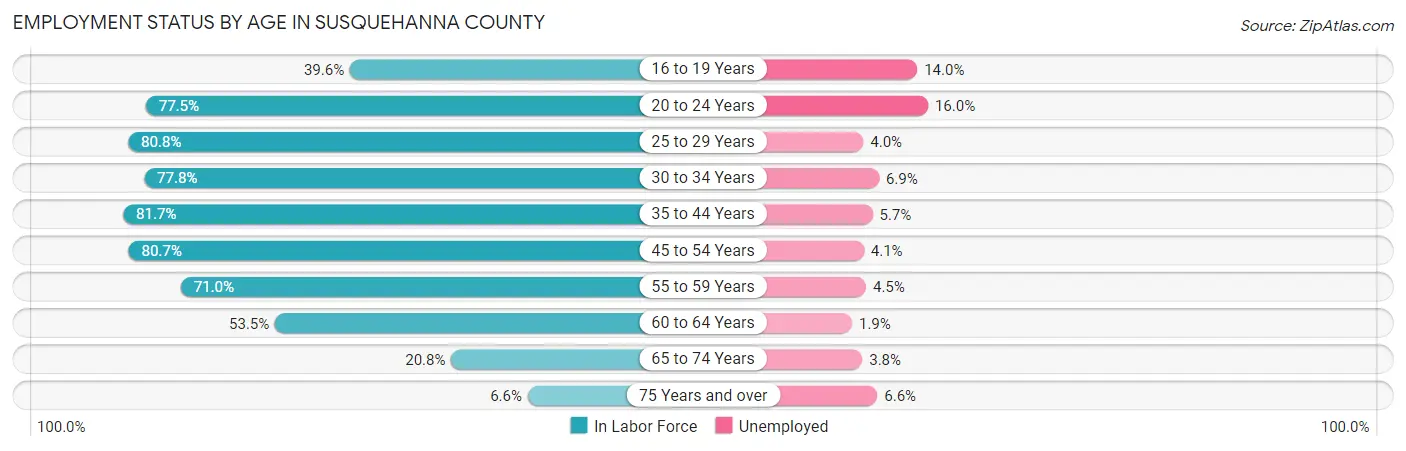
| Age Bracket | In Labor Force | Unemployed |
| 16 to 19 Years | 637 (39.6%) | 89 (14.0%) |
| 20 to 24 Years | 1,514 (77.5%) | 242 (16.0%) |
| 25 to 29 Years | 1,545 (80.8%) | 62 (4.0%) |
| 30 to 34 Years | 1,501 (77.8%) | 104 (6.9%) |
| 35 to 44 Years | 3,329 (81.7%) | 190 (5.7%) |
| 45 to 54 Years | 3,843 (80.7%) | 158 (4.1%) |
| 55 to 59 Years | 2,217 (71.0%) | 100 (4.5%) |
| 60 to 64 Years | 1,889 (53.5%) | 36 (1.9%) |
| 65 to 74 Years | 1,134 (20.8%) | 43 (3.8%) |
| 75 Years and over | 255 (6.6%) | 17 (6.6%) |
| Total | 17,876 (55.5%) | 1,037 (5.8%) |
Employment Status by Educational Attainment in Susquehanna County
According to labor force statistics for Susquehanna County, 74.1% of individuals (14,324) out of the total population between 25 and 64 years of age (19,331) are in the labor force, with 4.5% or 645 of them being unemployed. The group with the highest labor force participation rate are those with the educational attainment of bachelor's degree or higher, with 85.1% or 3,071 individuals in the labor force. Within the labor force, individuals with less than high school education have the highest percentage of unemployment, with 7.8% or 69 of them being unemployed.
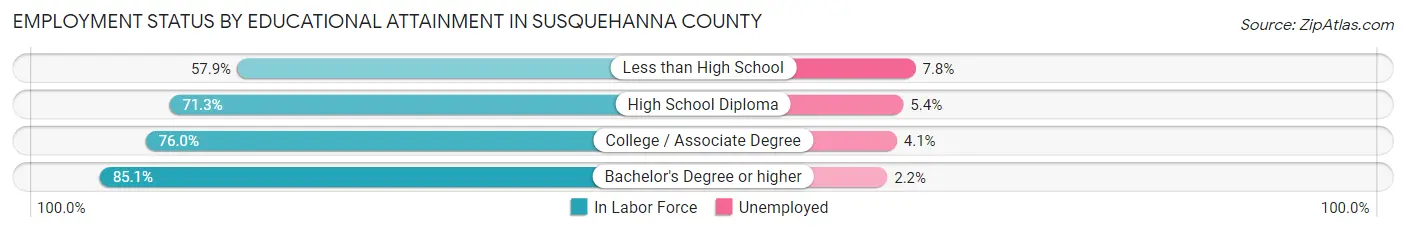
| Educational Attainment | In Labor Force | Unemployed |
| Less than High School | 885 (57.9%) | 119 (7.8%) |
| High School Diploma | 6,285 (71.3%) | 476 (5.4%) |
| College / Associate Degree | 4,087 (76.0%) | 220 (4.1%) |
| Bachelor's Degree or higher | 3,071 (85.1%) | 79 (2.2%) |
| Total | 14,324 (74.1%) | 870 (4.5%) |
Employment Occupations by Sex in Susquehanna County
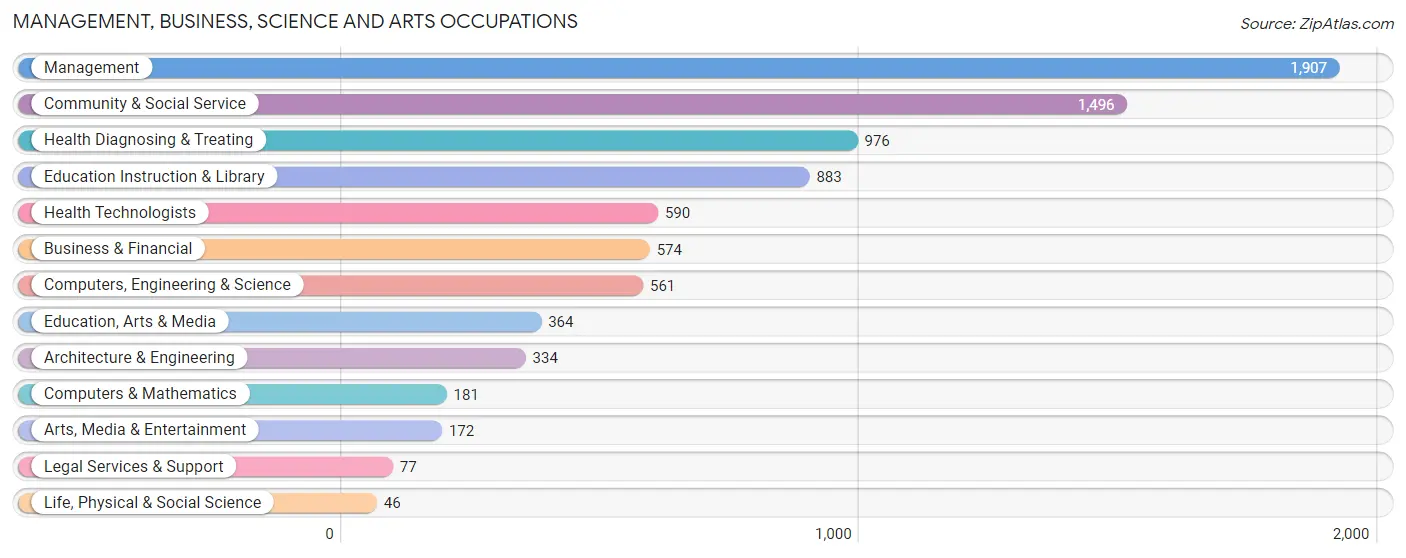
Management, Business, Science and Arts Occupations
The most common Management, Business, Science and Arts occupations in Susquehanna County are Management (1,907 | 11.3%), Community & Social Service (1,496 | 8.9%), Health Diagnosing & Treating (976 | 5.8%), Education Instruction & Library (883 | 5.2%), and Health Technologists (590 | 3.5%).
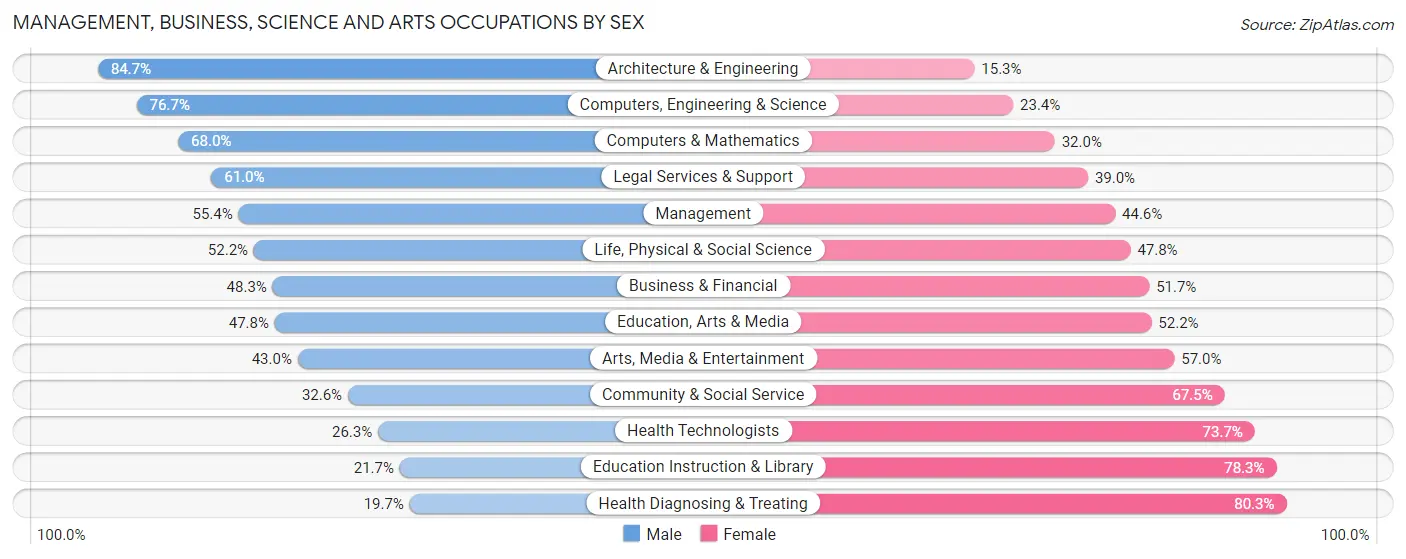
Management, Business, Science and Arts Occupations by Sex
Within the Management, Business, Science and Arts occupations in Susquehanna County, the most male-oriented occupations are Architecture & Engineering (84.7%), Computers, Engineering & Science (76.6%), and Computers & Mathematics (68.0%), while the most female-oriented occupations are Health Diagnosing & Treating (80.3%), Education Instruction & Library (78.3%), and Health Technologists (73.7%).
| Occupation | Male | Female |
| Management | 1,056 (55.4%) | 851 (44.6%) |
| Business & Financial | 277 (48.3%) | 297 (51.7%) |
| Computers, Engineering & Science | 430 (76.6%) | 131 (23.4%) |
| Computers & Mathematics | 123 (68.0%) | 58 (32.0%) |
| Architecture & Engineering | 283 (84.7%) | 51 (15.3%) |
| Life, Physical & Social Science | 24 (52.2%) | 22 (47.8%) |
| Community & Social Service | 487 (32.6%) | 1,009 (67.4%) |
| Education, Arts & Media | 174 (47.8%) | 190 (52.2%) |
| Legal Services & Support | 47 (61.0%) | 30 (39.0%) |
| Education Instruction & Library | 192 (21.7%) | 691 (78.3%) |
| Arts, Media & Entertainment | 74 (43.0%) | 98 (57.0%) |
| Health Diagnosing & Treating | 192 (19.7%) | 784 (80.3%) |
| Health Technologists | 155 (26.3%) | 435 (73.7%) |
| Total (Category) | 2,442 (44.3%) | 3,072 (55.7%) |
| Total (Overall) | 9,292 (55.3%) | 7,520 (44.7%) |
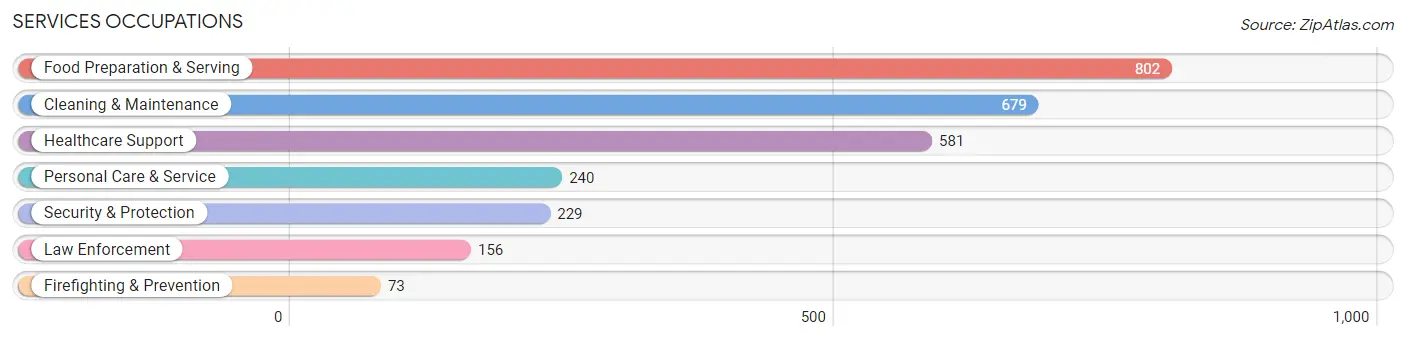
Services Occupations
The most common Services occupations in Susquehanna County are Food Preparation & Serving (802 | 4.8%), Cleaning & Maintenance (679 | 4.0%), Healthcare Support (581 | 3.5%), Personal Care & Service (240 | 1.4%), and Security & Protection (229 | 1.4%).
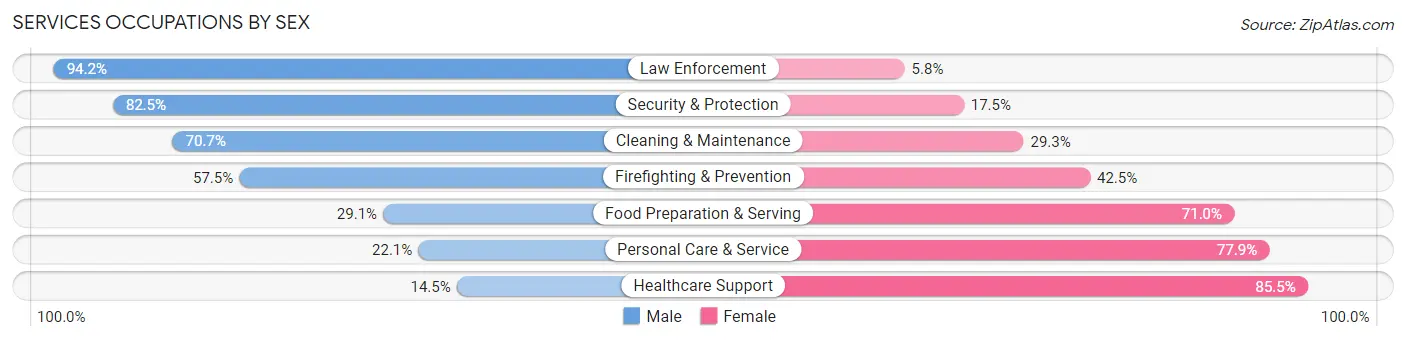
Services Occupations by Sex
Within the Services occupations in Susquehanna County, the most male-oriented occupations are Law Enforcement (94.2%), Security & Protection (82.5%), and Cleaning & Maintenance (70.7%), while the most female-oriented occupations are Healthcare Support (85.5%), Personal Care & Service (77.9%), and Food Preparation & Serving (71.0%).
| Occupation | Male | Female |
| Healthcare Support | 84 (14.5%) | 497 (85.5%) |
| Security & Protection | 189 (82.5%) | 40 (17.5%) |
| Firefighting & Prevention | 42 (57.5%) | 31 (42.5%) |
| Law Enforcement | 147 (94.2%) | 9 (5.8%) |
| Food Preparation & Serving | 233 (29.0%) | 569 (71.0%) |
| Cleaning & Maintenance | 480 (70.7%) | 199 (29.3%) |
| Personal Care & Service | 53 (22.1%) | 187 (77.9%) |
| Total (Category) | 1,039 (41.0%) | 1,492 (59.0%) |
| Total (Overall) | 9,292 (55.3%) | 7,520 (44.7%) |
Sales and Office Occupations
The most common Sales and Office occupations in Susquehanna County are Office & Administration (1,650 | 9.8%), and Sales & Related (1,647 | 9.8%).
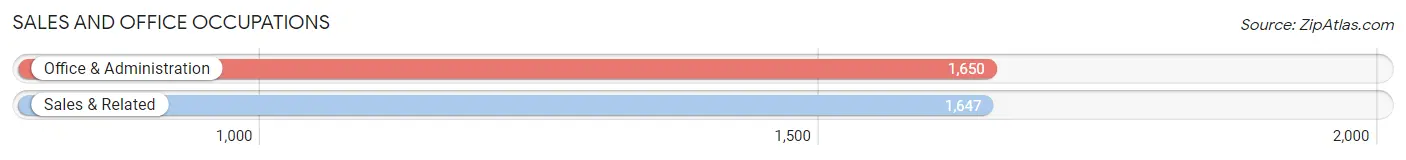
Sales and Office Occupations by Sex

| Occupation | Male | Female |
| Sales & Related | 833 (50.6%) | 814 (49.4%) |
| Office & Administration | 270 (16.4%) | 1,380 (83.6%) |
| Total (Category) | 1,103 (33.5%) | 2,194 (66.5%) |
| Total (Overall) | 9,292 (55.3%) | 7,520 (44.7%) |
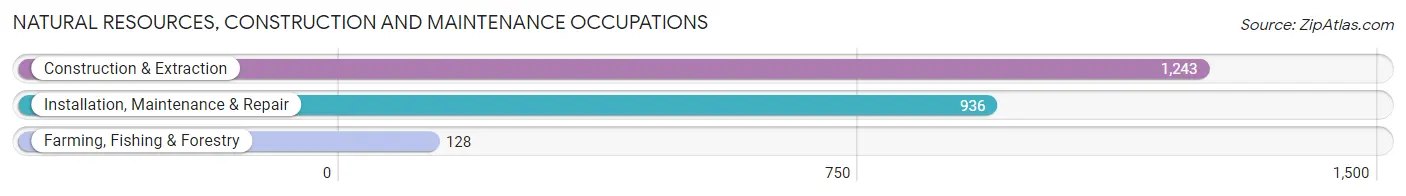
Natural Resources, Construction and Maintenance Occupations
The most common Natural Resources, Construction and Maintenance occupations in Susquehanna County are Construction & Extraction (1,243 | 7.4%), Installation, Maintenance & Repair (936 | 5.6%), and Farming, Fishing & Forestry (128 | 0.8%).
Natural Resources, Construction and Maintenance Occupations by Sex
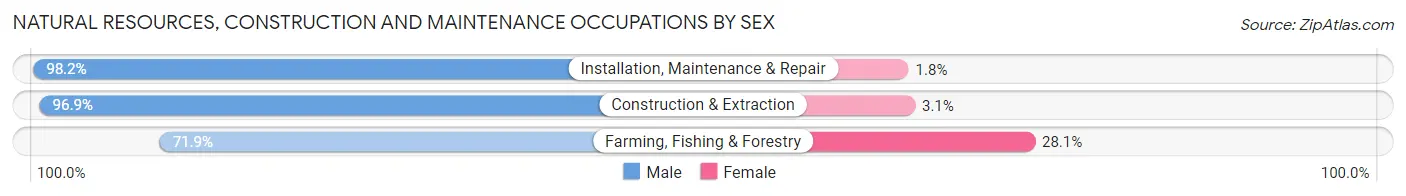
| Occupation | Male | Female |
| Farming, Fishing & Forestry | 92 (71.9%) | 36 (28.1%) |
| Construction & Extraction | 1,204 (96.9%) | 39 (3.1%) |
| Installation, Maintenance & Repair | 919 (98.2%) | 17 (1.8%) |
| Total (Category) | 2,215 (96.0%) | 92 (4.0%) |
| Total (Overall) | 9,292 (55.3%) | 7,520 (44.7%) |
Production, Transportation and Moving Occupations
The most common Production, Transportation and Moving occupations in Susquehanna County are Production (1,290 | 7.7%), Transportation (988 | 5.9%), and Material Moving (885 | 5.3%).
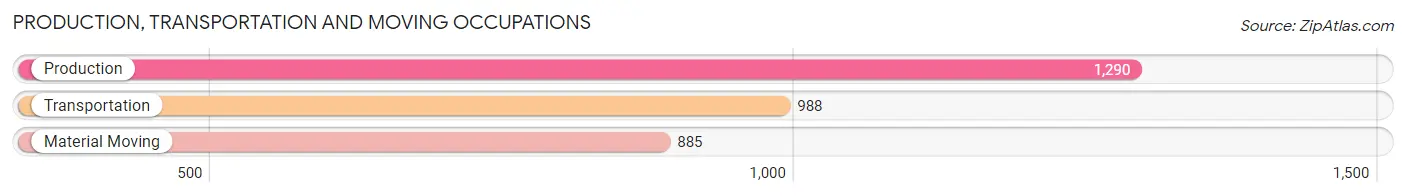
Production, Transportation and Moving Occupations by Sex
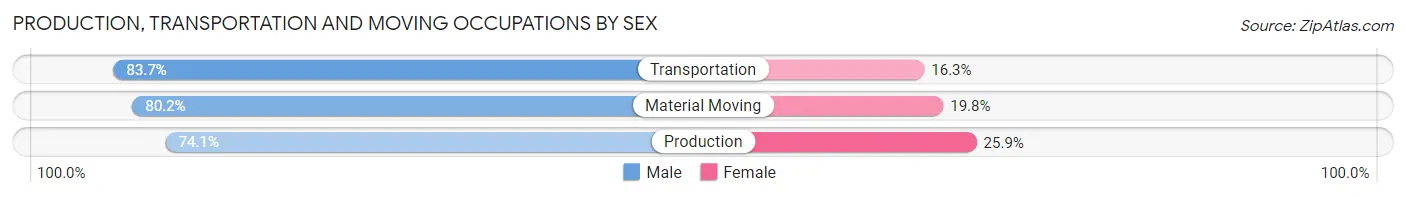
| Occupation | Male | Female |
| Production | 956 (74.1%) | 334 (25.9%) |
| Transportation | 827 (83.7%) | 161 (16.3%) |
| Material Moving | 710 (80.2%) | 175 (19.8%) |
| Total (Category) | 2,493 (78.8%) | 670 (21.2%) |
| Total (Overall) | 9,292 (55.3%) | 7,520 (44.7%) |
Employment Industries by Sex in Susquehanna County
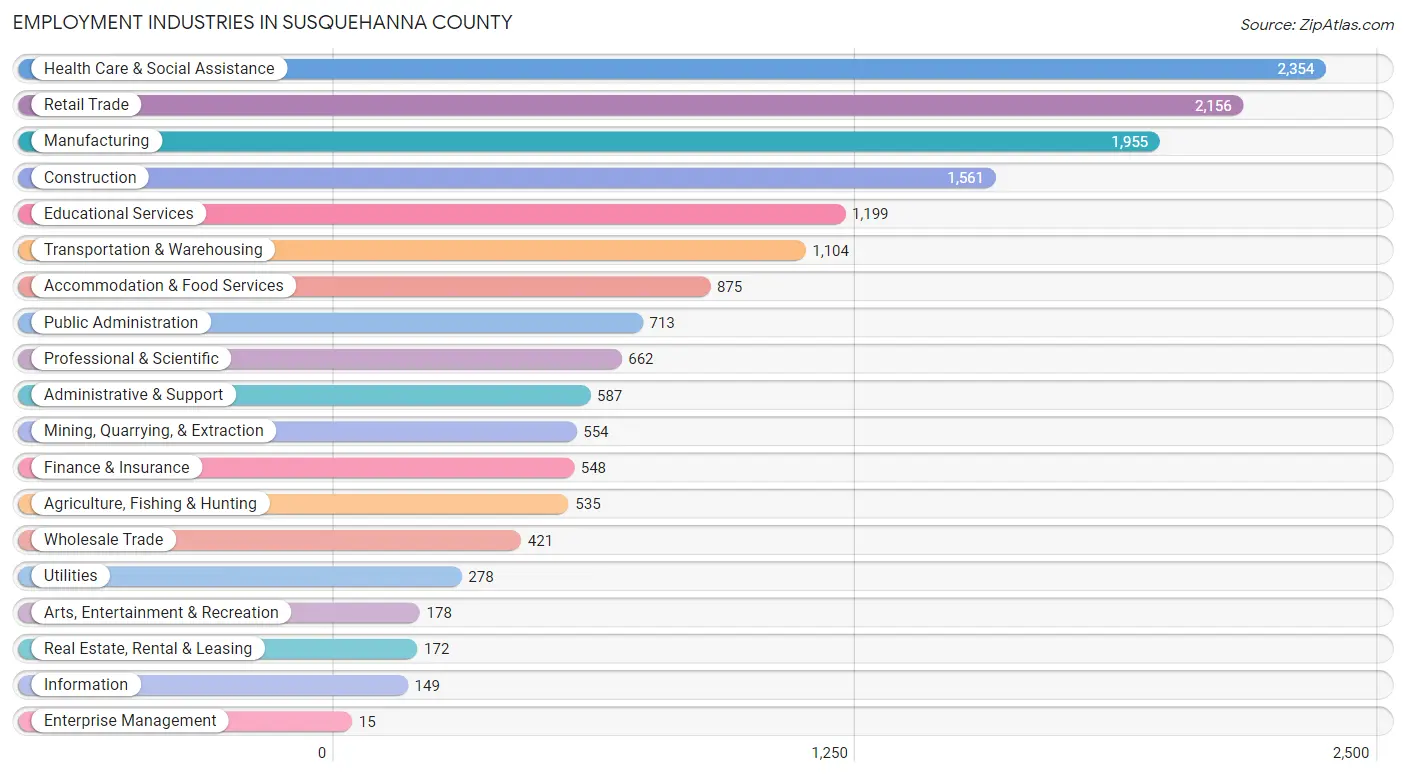
Employment Industries in Susquehanna County
The major employment industries in Susquehanna County include Health Care & Social Assistance (2,354 | 14.0%), Retail Trade (2,156 | 12.8%), Manufacturing (1,955 | 11.6%), Construction (1,561 | 9.3%), and Educational Services (1,199 | 7.1%).
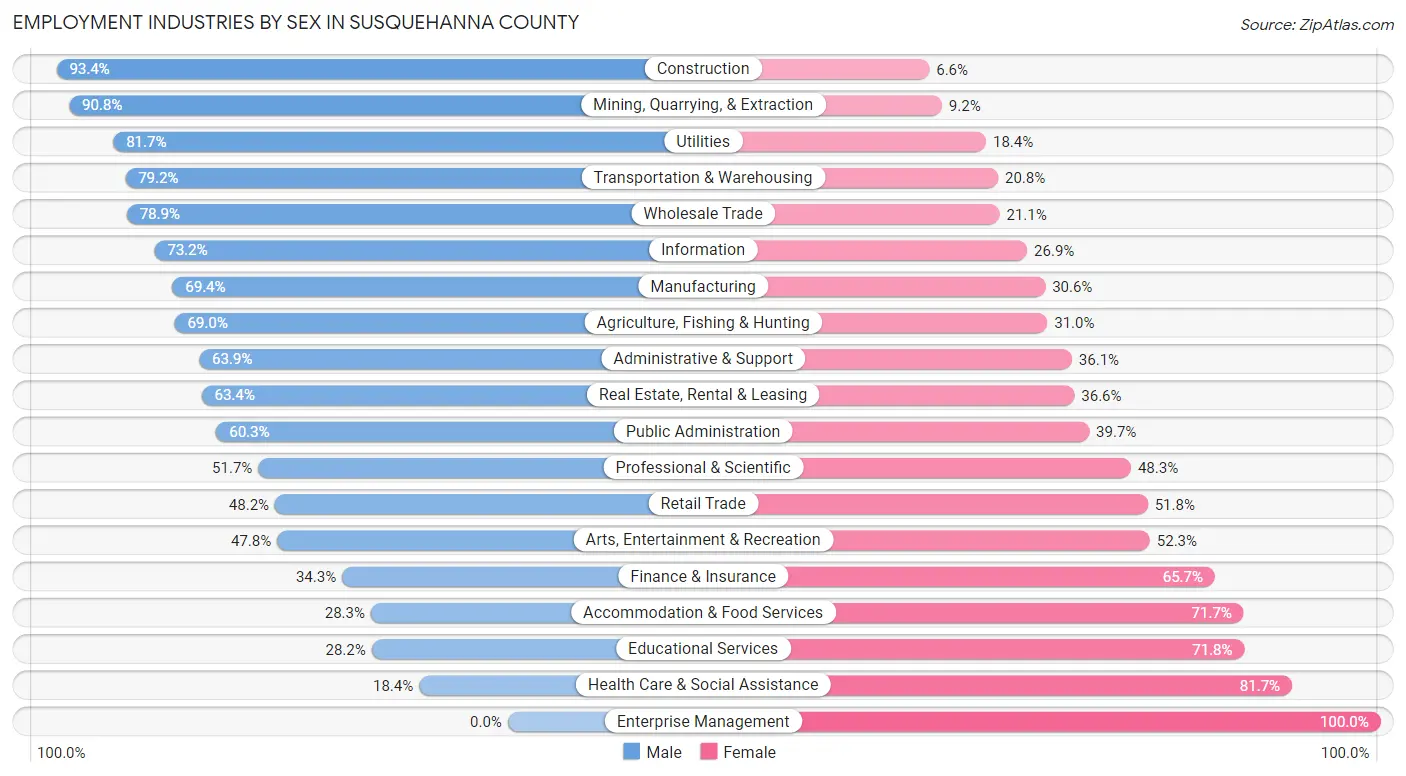
Employment Industries by Sex in Susquehanna County
The Susquehanna County industries that see more men than women are Construction (93.4%), Mining, Quarrying, & Extraction (90.8%), and Utilities (81.7%), whereas the industries that tend to have a higher number of women are Enterprise Management (100.0%), Health Care & Social Assistance (81.7%), and Educational Services (71.8%).
| Industry | Male | Female |
| Agriculture, Fishing & Hunting | 369 (69.0%) | 166 (31.0%) |
| Mining, Quarrying, & Extraction | 503 (90.8%) | 51 (9.2%) |
| Construction | 1,458 (93.4%) | 103 (6.6%) |
| Manufacturing | 1,357 (69.4%) | 598 (30.6%) |
| Wholesale Trade | 332 (78.9%) | 89 (21.1%) |
| Retail Trade | 1,039 (48.2%) | 1,117 (51.8%) |
| Transportation & Warehousing | 874 (79.2%) | 230 (20.8%) |
| Utilities | 227 (81.7%) | 51 (18.3%) |
| Information | 109 (73.2%) | 40 (26.9%) |
| Finance & Insurance | 188 (34.3%) | 360 (65.7%) |
| Real Estate, Rental & Leasing | 109 (63.4%) | 63 (36.6%) |
| Professional & Scientific | 342 (51.7%) | 320 (48.3%) |
| Enterprise Management | 0 (0.0%) | 15 (100.0%) |
| Administrative & Support | 375 (63.9%) | 212 (36.1%) |
| Educational Services | 338 (28.2%) | 861 (71.8%) |
| Health Care & Social Assistance | 432 (18.3%) | 1,922 (81.7%) |
| Arts, Entertainment & Recreation | 85 (47.7%) | 93 (52.2%) |
| Accommodation & Food Services | 248 (28.3%) | 627 (71.7%) |
| Public Administration | 430 (60.3%) | 283 (39.7%) |
| Total | 9,292 (55.3%) | 7,520 (44.7%) |
Education in Susquehanna County
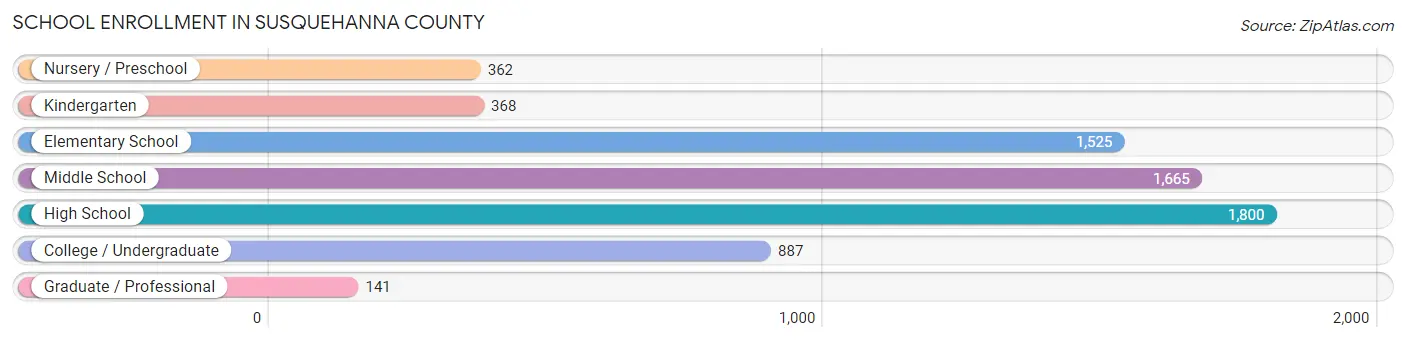
School Enrollment in Susquehanna County
The most common levels of schooling among the 6,748 students in Susquehanna County are high school (1,800 | 26.7%), middle school (1,665 | 24.7%), and elementary school (1,525 | 22.6%).
| School Level | # Students | % Students |
| Nursery / Preschool | 362 | 5.4% |
| Kindergarten | 368 | 5.4% |
| Elementary School | 1,525 | 22.6% |
| Middle School | 1,665 | 24.7% |
| High School | 1,800 | 26.7% |
| College / Undergraduate | 887 | 13.1% |
| Graduate / Professional | 141 | 2.1% |
| Total | 6,748 | 100.0% |
School Enrollment by Age by Funding Source in Susquehanna County
Out of a total of 6,748 students who are enrolled in schools in Susquehanna County, 972 (14.4%) attend a private institution, while the remaining 5,776 (85.6%) are enrolled in public schools. The age group of 35 years and over has the highest likelihood of being enrolled in private schools, with 83 (41.9% in the age bracket) enrolled. Conversely, the age group of 5 to 9 year old has the lowest likelihood of being enrolled in a private school, with 1,612 (91.3% in the age bracket) attending a public institution.
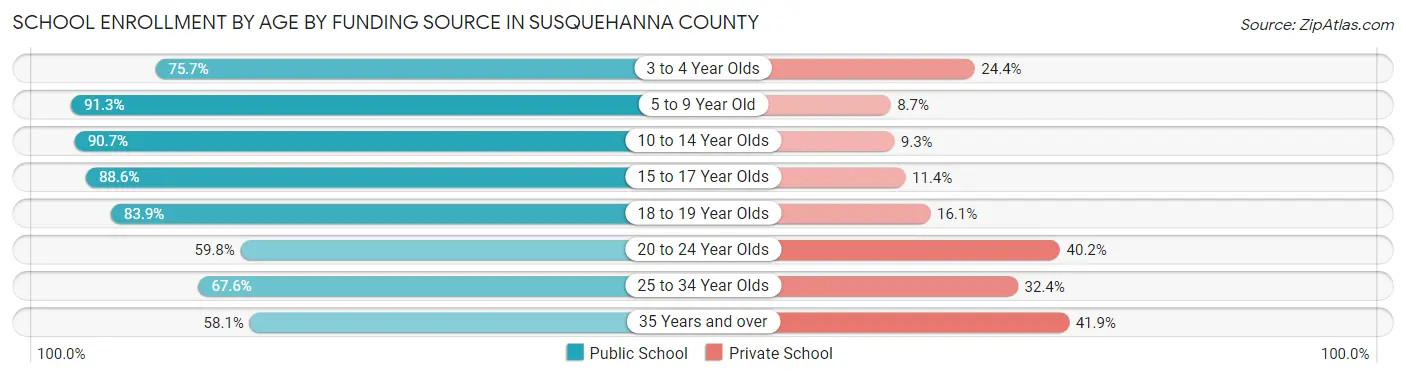
| Age Bracket | Public School | Private School |
| 3 to 4 Year Olds | 205 (75.6%) | 66 (24.3%) |
| 5 to 9 Year Old | 1,612 (91.3%) | 153 (8.7%) |
| 10 to 14 Year Olds | 1,952 (90.7%) | 201 (9.3%) |
| 15 to 17 Year Olds | 1,115 (88.6%) | 144 (11.4%) |
| 18 to 19 Year Olds | 360 (83.9%) | 69 (16.1%) |
| 20 to 24 Year Olds | 275 (59.8%) | 185 (40.2%) |
| 25 to 34 Year Olds | 144 (67.6%) | 69 (32.4%) |
| 35 Years and over | 115 (58.1%) | 83 (41.9%) |
| Total | 5,776 (85.6%) | 972 (14.4%) |
Educational Attainment by Field of Study in Susquehanna County
Education (1,465 | 24.3%), science & technology (827 | 13.7%), business (827 | 13.7%), engineering (348 | 5.8%), and bio, nature & agricultural (345 | 5.7%) are the most common fields of study among 6,029 individuals in Susquehanna County who have obtained a bachelor's degree or higher.
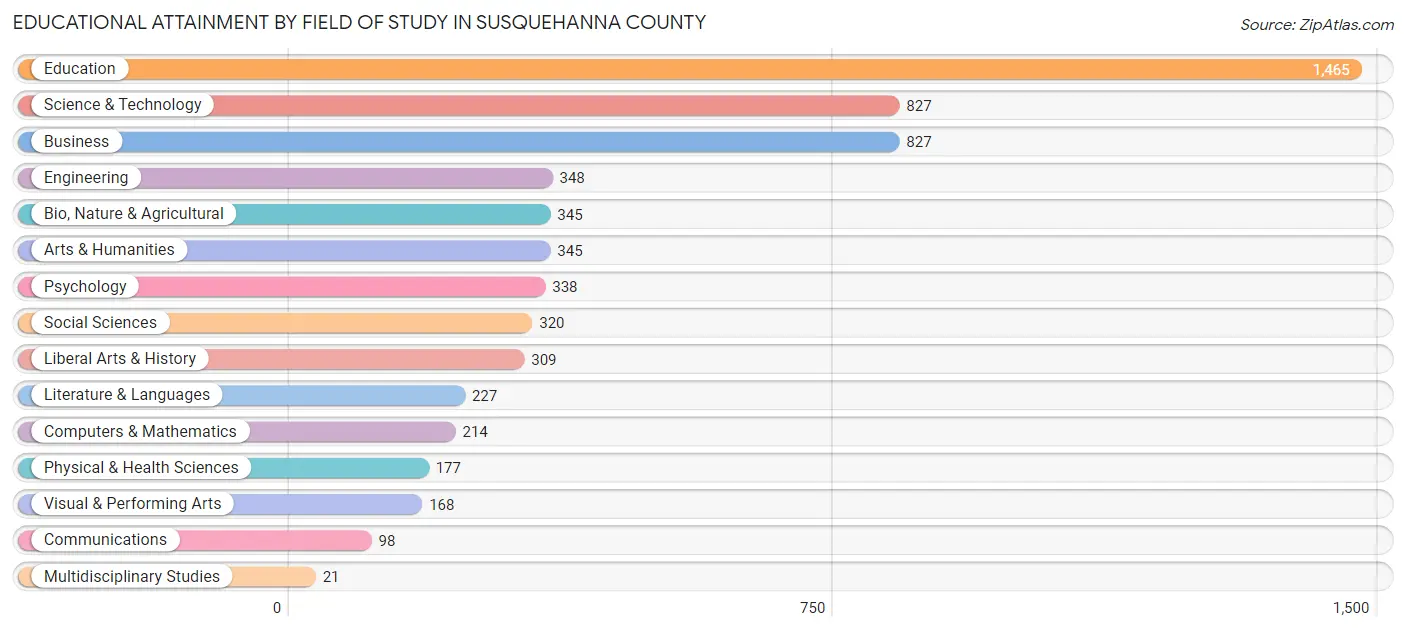
| Field of Study | # Graduates | % Graduates |
| Computers & Mathematics | 214 | 3.5% |
| Bio, Nature & Agricultural | 345 | 5.7% |
| Physical & Health Sciences | 177 | 2.9% |
| Psychology | 338 | 5.6% |
| Social Sciences | 320 | 5.3% |
| Engineering | 348 | 5.8% |
| Multidisciplinary Studies | 21 | 0.4% |
| Science & Technology | 827 | 13.7% |
| Business | 827 | 13.7% |
| Education | 1,465 | 24.3% |
| Literature & Languages | 227 | 3.8% |
| Liberal Arts & History | 309 | 5.1% |
| Visual & Performing Arts | 168 | 2.8% |
| Communications | 98 | 1.6% |
| Arts & Humanities | 345 | 5.7% |
| Total | 6,029 | 100.0% |
Transportation & Commute in Susquehanna County
Vehicle Availability by Sex in Susquehanna County
The most prevalent vehicle ownership categories in Susquehanna County are males with 2 vehicles (3,826, accounting for 42.0%) and females with 2 vehicles (2,928, making up 52.1%).
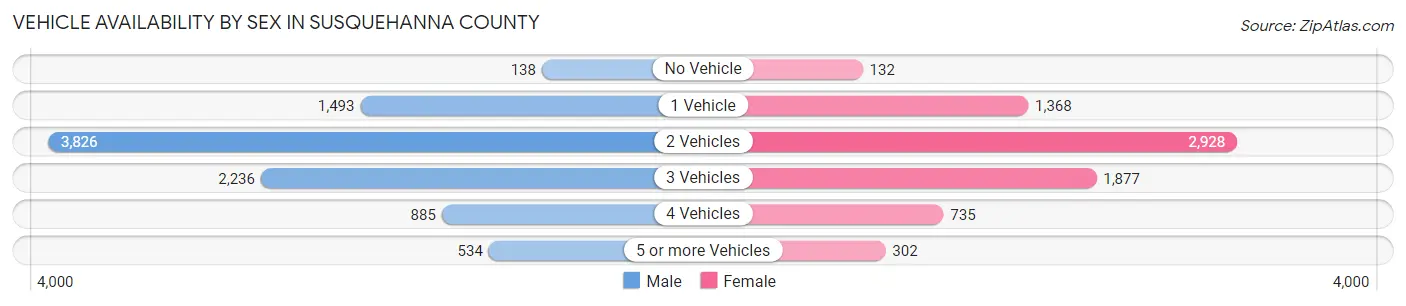
| Vehicles Available | Male | Female |
| No Vehicle | 138 (1.5%) | 132 (1.8%) |
| 1 Vehicle | 1,493 (16.4%) | 1,368 (18.6%) |
| 2 Vehicles | 3,826 (42.0%) | 2,928 (39.9%) |
| 3 Vehicles | 2,236 (24.5%) | 1,877 (25.6%) |
| 4 Vehicles | 885 (9.7%) | 735 (10.0%) |
| 5 or more Vehicles | 534 (5.9%) | 302 (4.1%) |
| Total | 9,112 (100.0%) | 7,342 (100.0%) |
Commute Time in Susquehanna County
The most frequently occuring commute durations in Susquehanna County are 30 to 34 minutes (2,350 commuters, 16.0%), 20 to 24 minutes (1,948 commuters, 13.3%), and 15 to 19 minutes (1,511 commuters, 10.3%).
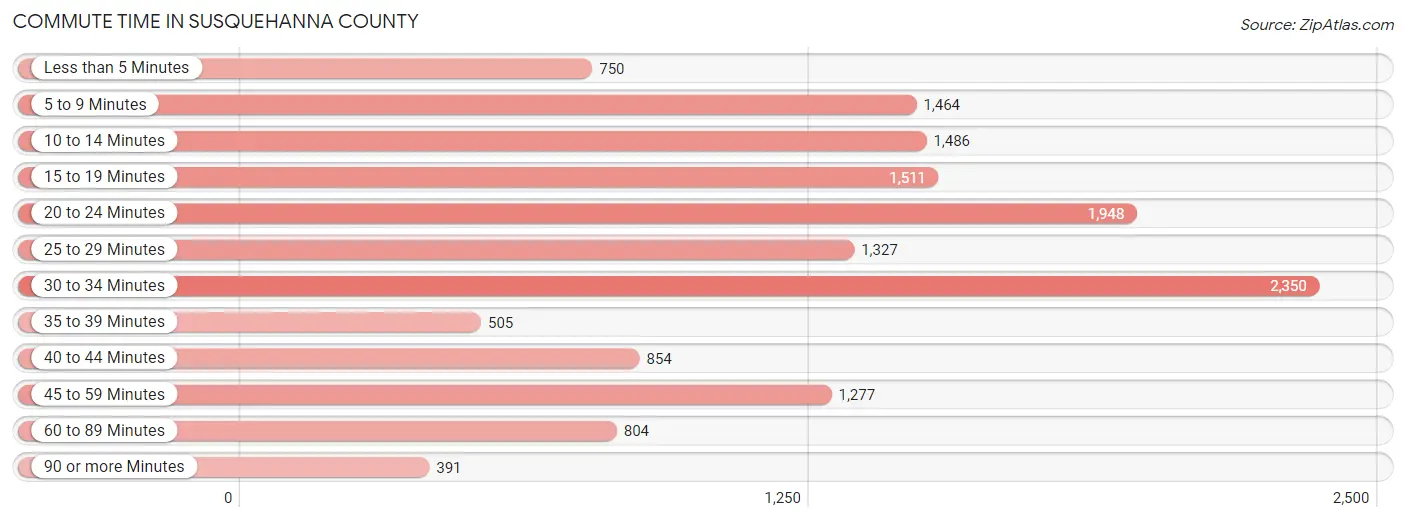
| Commute Time | # Commuters | % Commuters |
| Less than 5 Minutes | 750 | 5.1% |
| 5 to 9 Minutes | 1,464 | 10.0% |
| 10 to 14 Minutes | 1,486 | 10.1% |
| 15 to 19 Minutes | 1,511 | 10.3% |
| 20 to 24 Minutes | 1,948 | 13.3% |
| 25 to 29 Minutes | 1,327 | 9.0% |
| 30 to 34 Minutes | 2,350 | 16.0% |
| 35 to 39 Minutes | 505 | 3.4% |
| 40 to 44 Minutes | 854 | 5.8% |
| 45 to 59 Minutes | 1,277 | 8.7% |
| 60 to 89 Minutes | 804 | 5.5% |
| 90 or more Minutes | 391 | 2.7% |
Commute Time by Sex in Susquehanna County
The most common commute times in Susquehanna County are 30 to 34 minutes (1,352 commuters, 16.5%) for males and 30 to 34 minutes (998 commuters, 15.4%) for females.
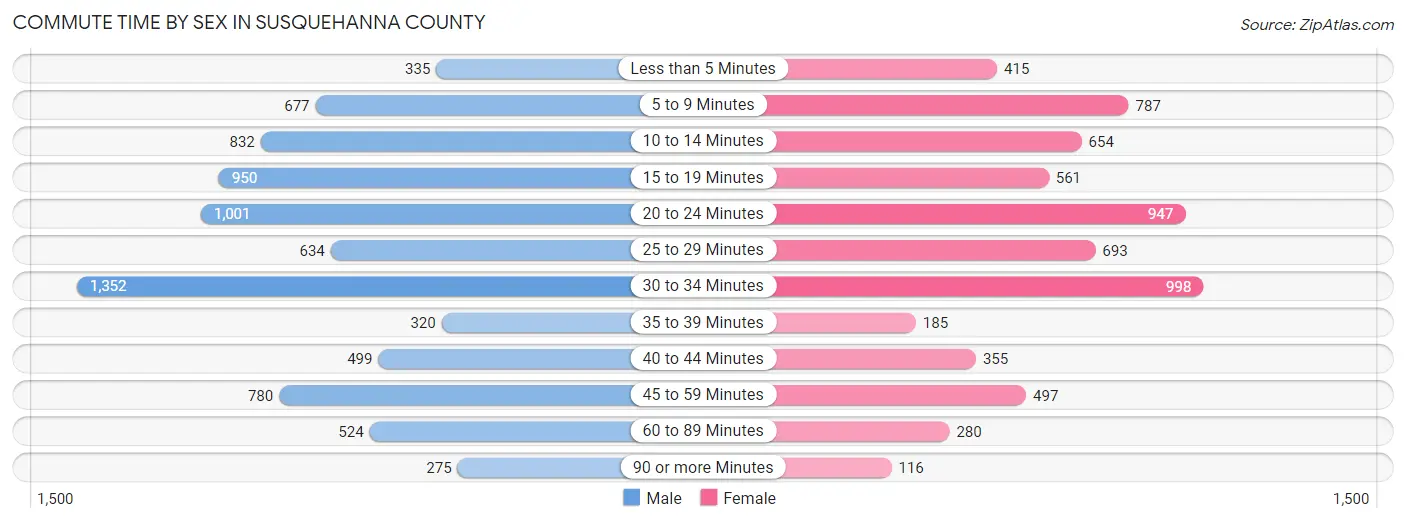
| Commute Time | Male | Female |
| Less than 5 Minutes | 335 (4.1%) | 415 (6.4%) |
| 5 to 9 Minutes | 677 (8.3%) | 787 (12.1%) |
| 10 to 14 Minutes | 832 (10.2%) | 654 (10.1%) |
| 15 to 19 Minutes | 950 (11.6%) | 561 (8.6%) |
| 20 to 24 Minutes | 1,001 (12.2%) | 947 (14.6%) |
| 25 to 29 Minutes | 634 (7.7%) | 693 (10.7%) |
| 30 to 34 Minutes | 1,352 (16.5%) | 998 (15.4%) |
| 35 to 39 Minutes | 320 (3.9%) | 185 (2.9%) |
| 40 to 44 Minutes | 499 (6.1%) | 355 (5.5%) |
| 45 to 59 Minutes | 780 (9.5%) | 497 (7.7%) |
| 60 to 89 Minutes | 524 (6.4%) | 280 (4.3%) |
| 90 or more Minutes | 275 (3.4%) | 116 (1.8%) |
Time of Departure to Work by Sex in Susquehanna County
The most frequent times of departure to work in Susquehanna County are 7:00 AM to 7:29 AM (1,195, 14.6%) for males and 7:00 AM to 7:29 AM (1,202, 18.5%) for females.
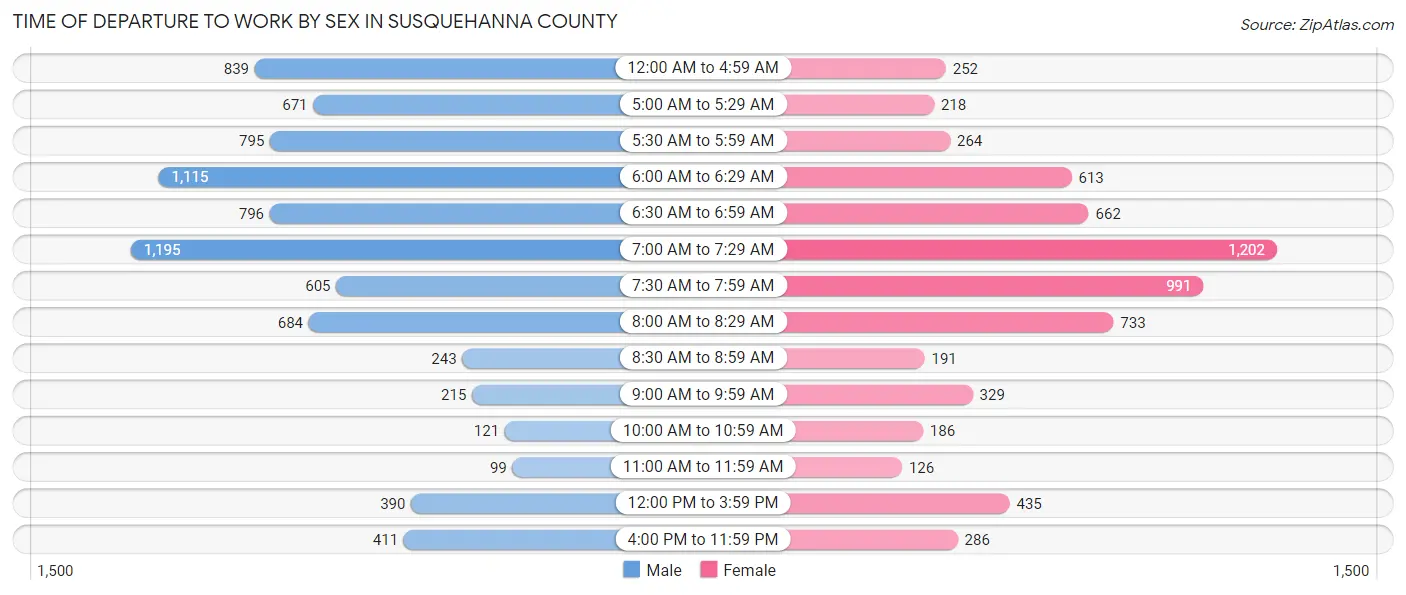
| Time of Departure | Male | Female |
| 12:00 AM to 4:59 AM | 839 (10.3%) | 252 (3.9%) |
| 5:00 AM to 5:29 AM | 671 (8.2%) | 218 (3.4%) |
| 5:30 AM to 5:59 AM | 795 (9.7%) | 264 (4.1%) |
| 6:00 AM to 6:29 AM | 1,115 (13.6%) | 613 (9.5%) |
| 6:30 AM to 6:59 AM | 796 (9.7%) | 662 (10.2%) |
| 7:00 AM to 7:29 AM | 1,195 (14.6%) | 1,202 (18.5%) |
| 7:30 AM to 7:59 AM | 605 (7.4%) | 991 (15.3%) |
| 8:00 AM to 8:29 AM | 684 (8.4%) | 733 (11.3%) |
| 8:30 AM to 8:59 AM | 243 (3.0%) | 191 (2.9%) |
| 9:00 AM to 9:59 AM | 215 (2.6%) | 329 (5.1%) |
| 10:00 AM to 10:59 AM | 121 (1.5%) | 186 (2.9%) |
| 11:00 AM to 11:59 AM | 99 (1.2%) | 126 (1.9%) |
| 12:00 PM to 3:59 PM | 390 (4.8%) | 435 (6.7%) |
| 4:00 PM to 11:59 PM | 411 (5.0%) | 286 (4.4%) |
| Total | 8,179 (100.0%) | 6,488 (100.0%) |
Housing Occupancy in Susquehanna County
Occupancy by Ownership in Susquehanna County
Of the total 15,641 dwellings in Susquehanna County, owner-occupied units account for 12,284 (78.5%), while renter-occupied units make up 3,357 (21.5%).
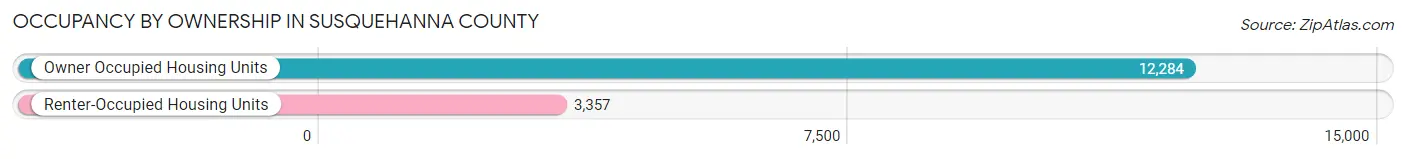
| Occupancy | # Housing Units | % Housing Units |
| Owner Occupied Housing Units | 12,284 | 78.5% |
| Renter-Occupied Housing Units | 3,357 | 21.5% |
| Total Occupied Housing Units | 15,641 | 100.0% |
Occupancy by Household Size in Susquehanna County
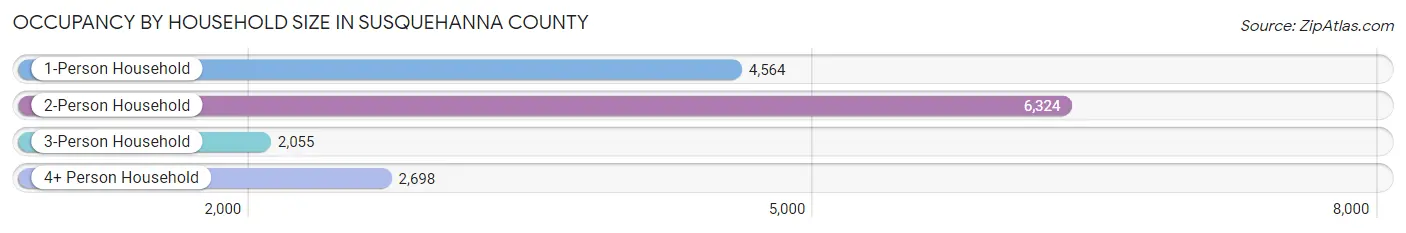
| Household Size | # Housing Units | % Housing Units |
| 1-Person Household | 4,564 | 29.2% |
| 2-Person Household | 6,324 | 40.4% |
| 3-Person Household | 2,055 | 13.1% |
| 4+ Person Household | 2,698 | 17.2% |
| Total Housing Units | 15,641 | 100.0% |
Occupancy by Ownership by Household Size in Susquehanna County
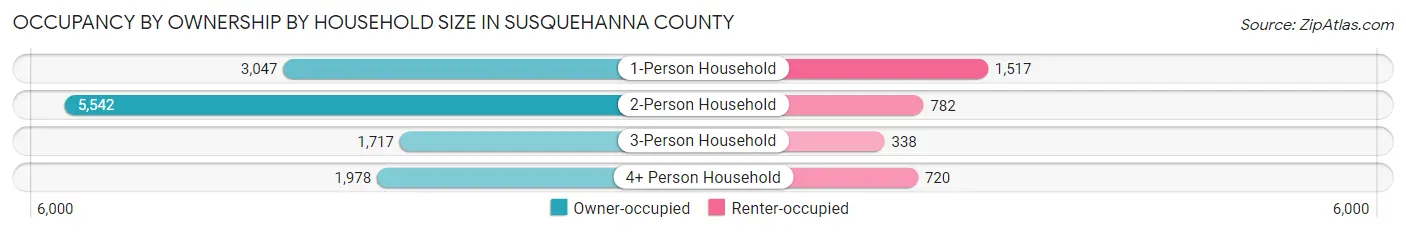
| Household Size | Owner-occupied | Renter-occupied |
| 1-Person Household | 3,047 (66.8%) | 1,517 (33.2%) |
| 2-Person Household | 5,542 (87.6%) | 782 (12.4%) |
| 3-Person Household | 1,717 (83.6%) | 338 (16.5%) |
| 4+ Person Household | 1,978 (73.3%) | 720 (26.7%) |
| Total Housing Units | 12,284 (78.5%) | 3,357 (21.5%) |
Occupancy by Educational Attainment in Susquehanna County
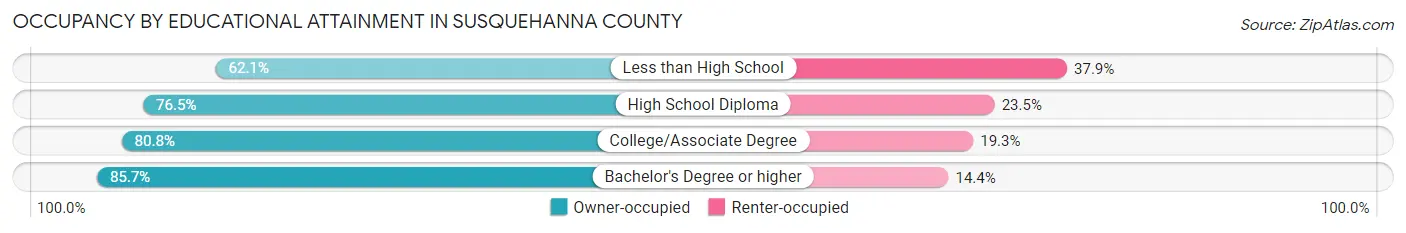
| Household Size | Owner-occupied | Renter-occupied |
| Less than High School | 745 (62.1%) | 454 (37.9%) |
| High School Diploma | 5,120 (76.5%) | 1,574 (23.5%) |
| College/Associate Degree | 3,579 (80.7%) | 853 (19.3%) |
| Bachelor's Degree or higher | 2,840 (85.7%) | 476 (14.3%) |
Occupancy by Age of Householder in Susquehanna County
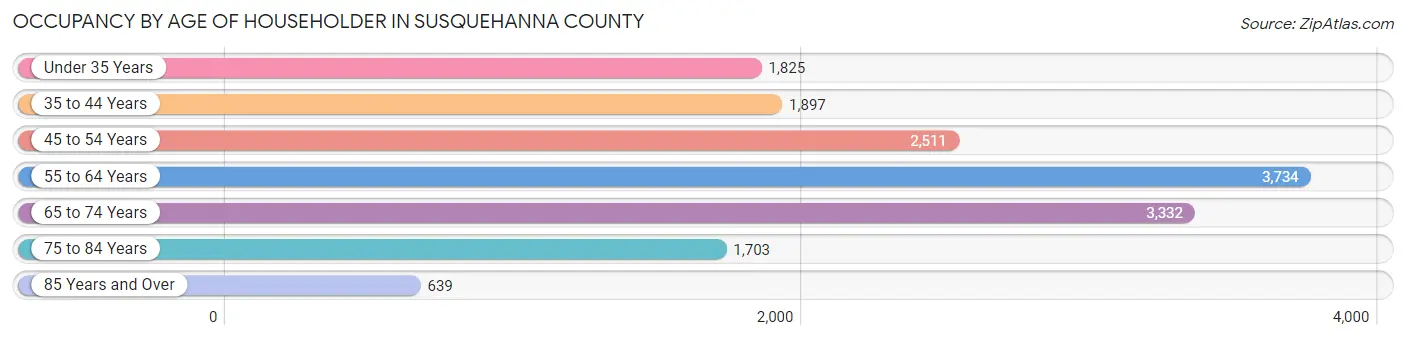
| Age Bracket | # Households | % Households |
| Under 35 Years | 1,825 | 11.7% |
| 35 to 44 Years | 1,897 | 12.1% |
| 45 to 54 Years | 2,511 | 16.1% |
| 55 to 64 Years | 3,734 | 23.9% |
| 65 to 74 Years | 3,332 | 21.3% |
| 75 to 84 Years | 1,703 | 10.9% |
| 85 Years and Over | 639 | 4.1% |
| Total | 15,641 | 100.0% |
Housing Finances in Susquehanna County
Median Income by Occupancy in Susquehanna County
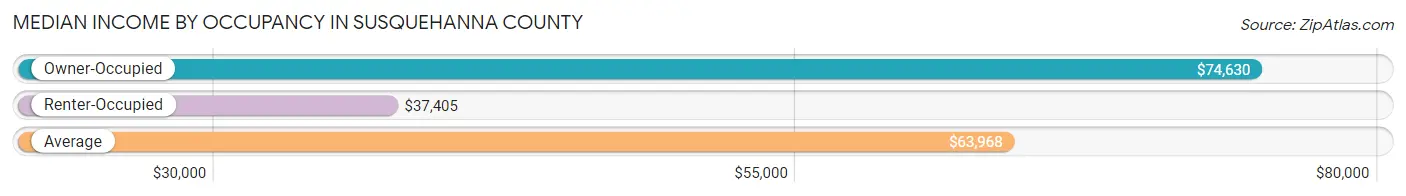
| Occupancy Type | # Households | Median Income |
| Owner-Occupied | 12,284 (78.5%) | $74,630 |
| Renter-Occupied | 3,357 (21.5%) | $37,405 |
| Average | 15,641 (100.0%) | $63,968 |
Occupancy by Householder Income Bracket in Susquehanna County
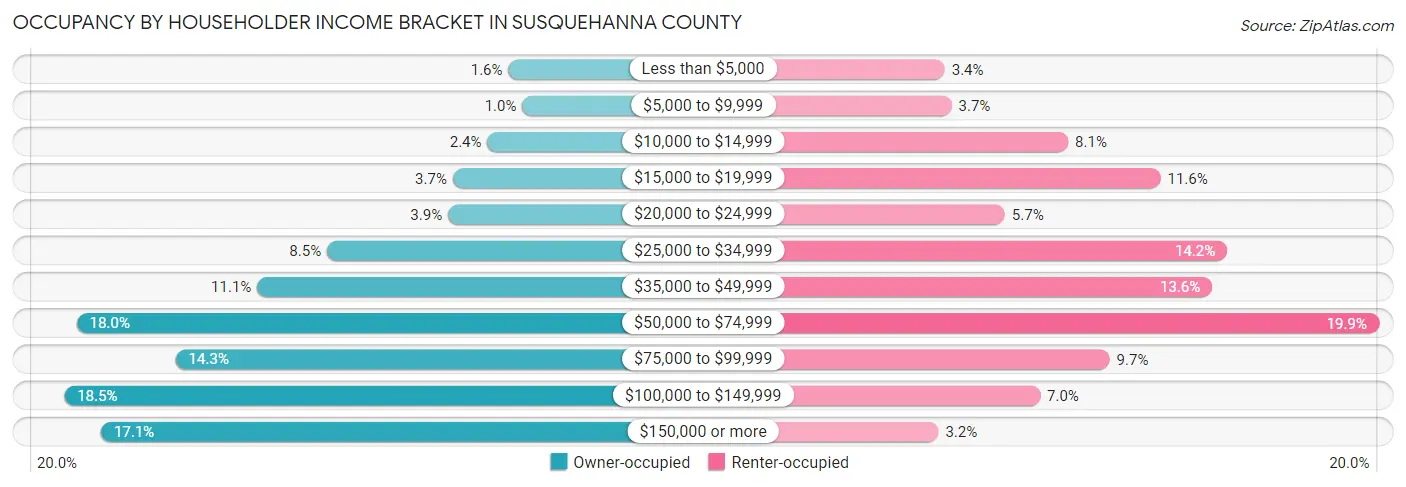
| Income Bracket | Owner-occupied | Renter-occupied |
| Less than $5,000 | 193 (1.6%) | 114 (3.4%) |
| $5,000 to $9,999 | 128 (1.0%) | 123 (3.7%) |
| $10,000 to $14,999 | 291 (2.4%) | 272 (8.1%) |
| $15,000 to $19,999 | 453 (3.7%) | 390 (11.6%) |
| $20,000 to $24,999 | 475 (3.9%) | 191 (5.7%) |
| $25,000 to $34,999 | 1,042 (8.5%) | 475 (14.1%) |
| $35,000 to $49,999 | 1,368 (11.1%) | 456 (13.6%) |
| $50,000 to $74,999 | 2,213 (18.0%) | 669 (19.9%) |
| $75,000 to $99,999 | 1,751 (14.2%) | 325 (9.7%) |
| $100,000 to $149,999 | 2,271 (18.5%) | 236 (7.0%) |
| $150,000 or more | 2,099 (17.1%) | 106 (3.2%) |
| Total | 12,284 (100.0%) | 3,357 (100.0%) |
Monthly Housing Cost Tiers in Susquehanna County
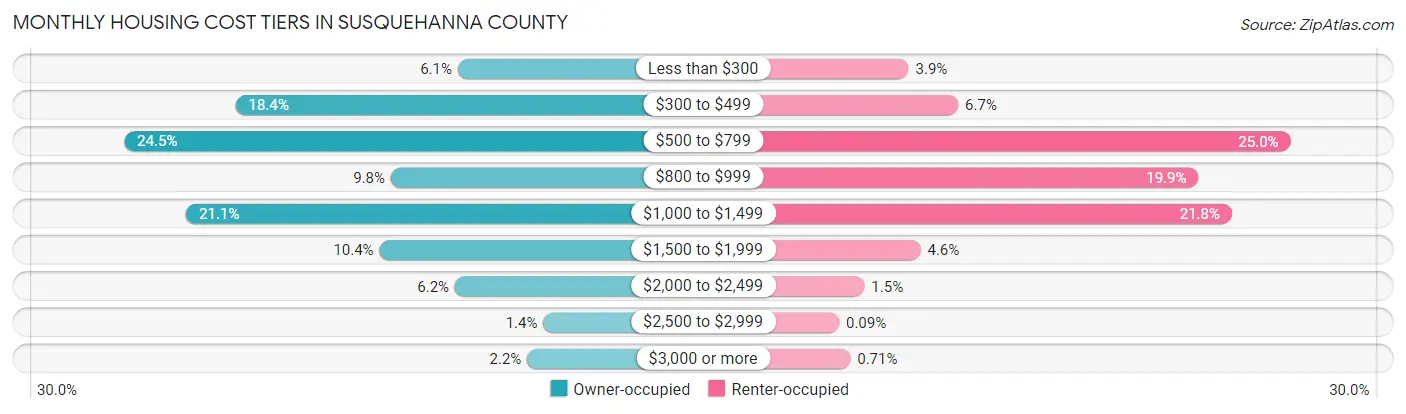
| Monthly Cost | Owner-occupied | Renter-occupied |
| Less than $300 | 746 (6.1%) | 132 (3.9%) |
| $300 to $499 | 2,254 (18.3%) | 224 (6.7%) |
| $500 to $799 | 3,010 (24.5%) | 840 (25.0%) |
| $800 to $999 | 1,200 (9.8%) | 669 (19.9%) |
| $1,000 to $1,499 | 2,590 (21.1%) | 731 (21.8%) |
| $1,500 to $1,999 | 1,278 (10.4%) | 154 (4.6%) |
| $2,000 to $2,499 | 765 (6.2%) | 50 (1.5%) |
| $2,500 to $2,999 | 166 (1.3%) | 3 (0.1%) |
| $3,000 or more | 275 (2.2%) | 24 (0.7%) |
| Total | 12,284 (100.0%) | 3,357 (100.0%) |
Physical Housing Characteristics in Susquehanna County
Housing Structures in Susquehanna County
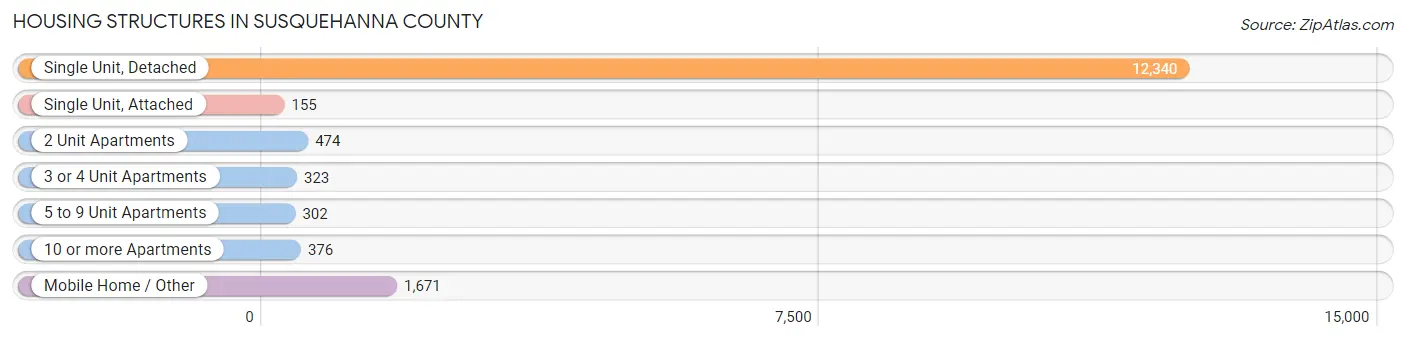
| Structure Type | # Housing Units | % Housing Units |
| Single Unit, Detached | 12,340 | 78.9% |
| Single Unit, Attached | 155 | 1.0% |
| 2 Unit Apartments | 474 | 3.0% |
| 3 or 4 Unit Apartments | 323 | 2.1% |
| 5 to 9 Unit Apartments | 302 | 1.9% |
| 10 or more Apartments | 376 | 2.4% |
| Mobile Home / Other | 1,671 | 10.7% |
| Total | 15,641 | 100.0% |
Housing Structures by Occupancy in Susquehanna County
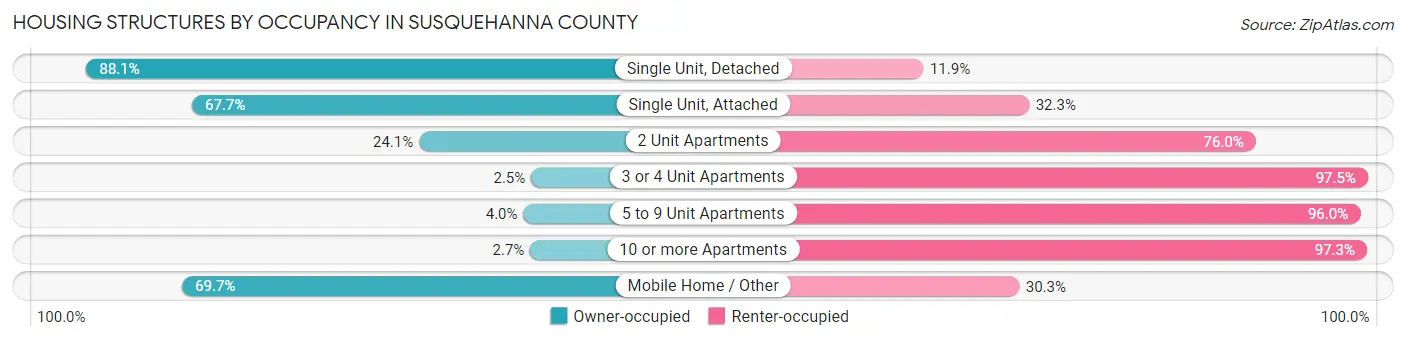
| Structure Type | Owner-occupied | Renter-occupied |
| Single Unit, Detached | 10,871 (88.1%) | 1,469 (11.9%) |
| Single Unit, Attached | 105 (67.7%) | 50 (32.3%) |
| 2 Unit Apartments | 114 (24.0%) | 360 (75.9%) |
| 3 or 4 Unit Apartments | 8 (2.5%) | 315 (97.5%) |
| 5 to 9 Unit Apartments | 12 (4.0%) | 290 (96.0%) |
| 10 or more Apartments | 10 (2.7%) | 366 (97.3%) |
| Mobile Home / Other | 1,164 (69.7%) | 507 (30.3%) |
| Total | 12,284 (78.5%) | 3,357 (21.5%) |
Housing Structures by Number of Rooms in Susquehanna County
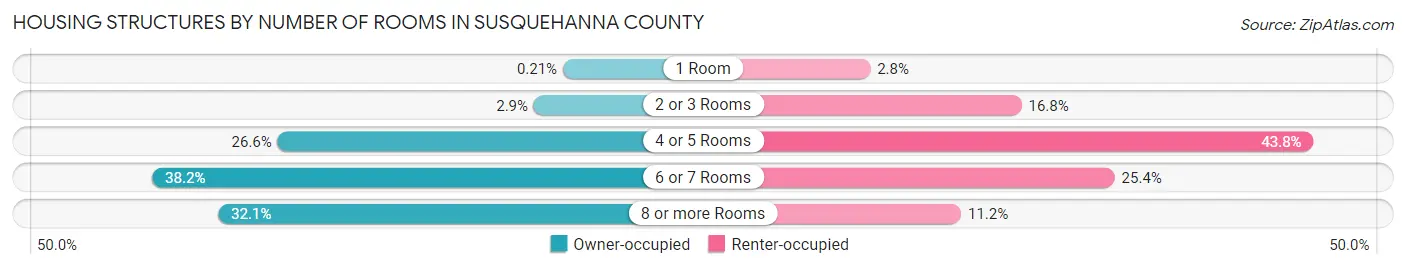
| Number of Rooms | Owner-occupied | Renter-occupied |
| 1 Room | 26 (0.2%) | 94 (2.8%) |
| 2 or 3 Rooms | 356 (2.9%) | 564 (16.8%) |
| 4 or 5 Rooms | 3,267 (26.6%) | 1,470 (43.8%) |
| 6 or 7 Rooms | 4,692 (38.2%) | 853 (25.4%) |
| 8 or more Rooms | 3,943 (32.1%) | 376 (11.2%) |
| Total | 12,284 (100.0%) | 3,357 (100.0%) |
Housing Structure by Heating Type in Susquehanna County
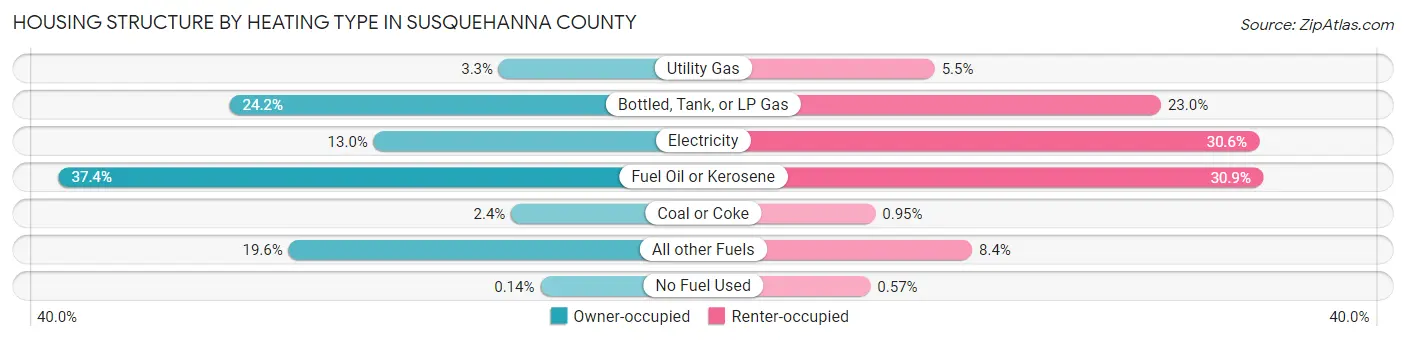
| Heating Type | Owner-occupied | Renter-occupied |
| Utility Gas | 410 (3.3%) | 186 (5.5%) |
| Bottled, Tank, or LP Gas | 2,966 (24.1%) | 773 (23.0%) |
| Electricity | 1,599 (13.0%) | 1,027 (30.6%) |
| Fuel Oil or Kerosene | 4,591 (37.4%) | 1,037 (30.9%) |
| Coal or Coke | 293 (2.4%) | 32 (0.9%) |
| All other Fuels | 2,408 (19.6%) | 283 (8.4%) |
| No Fuel Used | 17 (0.1%) | 19 (0.6%) |
| Total | 12,284 (100.0%) | 3,357 (100.0%) |
Household Vehicle Usage in Susquehanna County
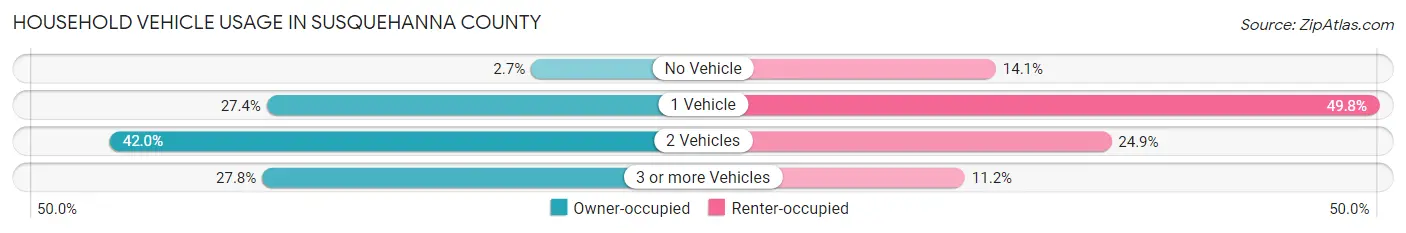
| Vehicles per Household | Owner-occupied | Renter-occupied |
| No Vehicle | 335 (2.7%) | 473 (14.1%) |
| 1 Vehicle | 3,366 (27.4%) | 1,673 (49.8%) |
| 2 Vehicles | 5,164 (42.0%) | 835 (24.9%) |
| 3 or more Vehicles | 3,419 (27.8%) | 376 (11.2%) |
| Total | 12,284 (100.0%) | 3,357 (100.0%) |
Real Estate & Mortgages in Susquehanna County
Real Estate and Mortgage Overview in Susquehanna County
| Characteristic | Without Mortgage | With Mortgage |
| Housing Units | 6,622 | 5,662 |
| Median Property Value | $187,500 | $207,600 |
| Median Household Income | $61,548 | $1,156 |
| Monthly Housing Costs | $534 | $260 |
| Real Estate Taxes | $2,258 | $130 |
Property Value by Mortgage Status in Susquehanna County
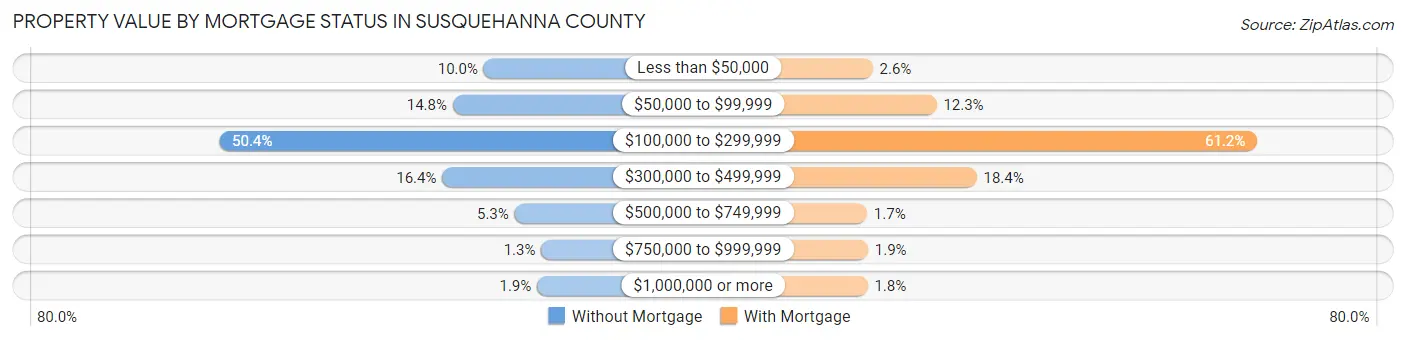
| Property Value | Without Mortgage | With Mortgage |
| Less than $50,000 | 664 (10.0%) | 147 (2.6%) |
| $50,000 to $99,999 | 977 (14.7%) | 698 (12.3%) |
| $100,000 to $299,999 | 3,335 (50.4%) | 3,466 (61.2%) |
| $300,000 to $499,999 | 1,083 (16.4%) | 1,044 (18.4%) |
| $500,000 to $749,999 | 353 (5.3%) | 98 (1.7%) |
| $750,000 to $999,999 | 84 (1.3%) | 106 (1.9%) |
| $1,000,000 or more | 126 (1.9%) | 103 (1.8%) |
| Total | 6,622 (100.0%) | 5,662 (100.0%) |
Household Income by Mortgage Status in Susquehanna County
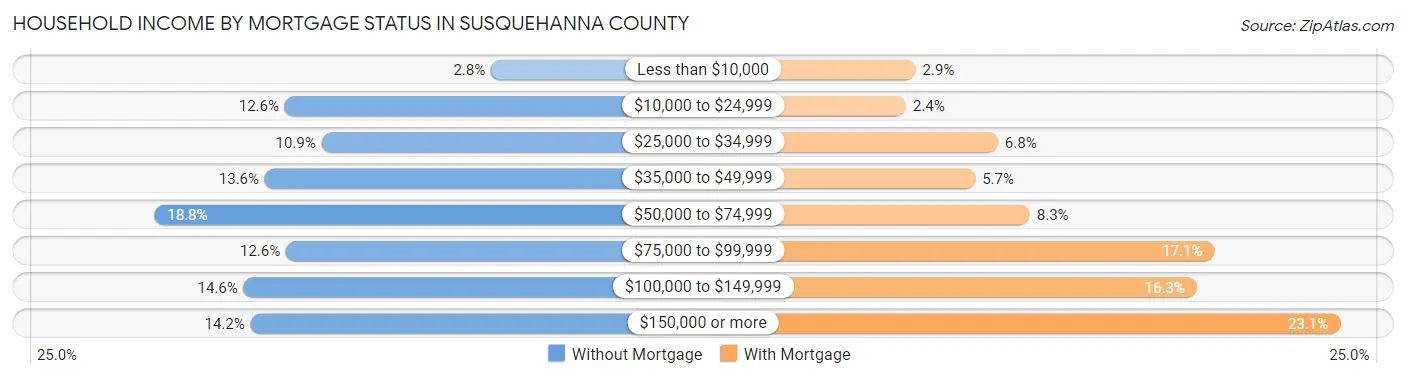
| Household Income | Without Mortgage | With Mortgage |
| Less than $10,000 | 185 (2.8%) | 162 (2.9%) |
| $10,000 to $24,999 | 835 (12.6%) | 136 (2.4%) |
| $25,000 to $34,999 | 719 (10.9%) | 384 (6.8%) |
| $35,000 to $49,999 | 898 (13.6%) | 323 (5.7%) |
| $50,000 to $74,999 | 1,246 (18.8%) | 470 (8.3%) |
| $75,000 to $99,999 | 831 (12.6%) | 967 (17.1%) |
| $100,000 to $149,999 | 965 (14.6%) | 920 (16.3%) |
| $150,000 or more | 943 (14.2%) | 1,306 (23.1%) |
| Total | 6,622 (100.0%) | 5,662 (100.0%) |
Property Value to Household Income Ratio in Susquehanna County
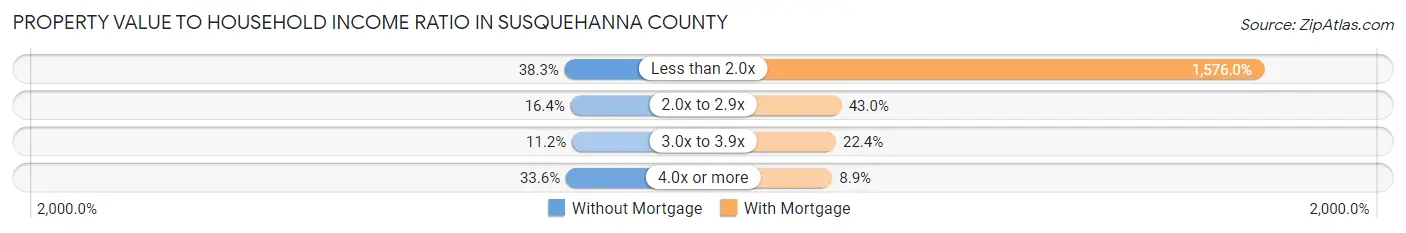
| Value-to-Income Ratio | Without Mortgage | With Mortgage |
| Less than 2.0x | 2,534 (38.3%) | 89,231 (1,576.0%) |
| 2.0x to 2.9x | 1,086 (16.4%) | 2,432 (42.9%) |
| 3.0x to 3.9x | 742 (11.2%) | 1,267 (22.4%) |
| 4.0x or more | 2,223 (33.6%) | 505 (8.9%) |
| Total | 6,622 (100.0%) | 5,662 (100.0%) |
Real Estate Taxes by Mortgage Status in Susquehanna County
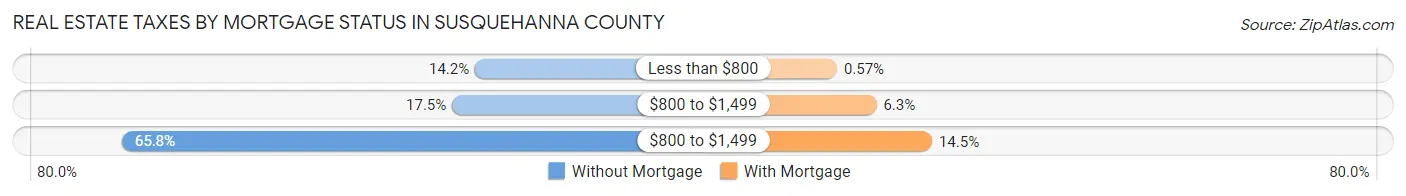
| Property Taxes | Without Mortgage | With Mortgage |
| Less than $800 | 939 (14.2%) | 32 (0.6%) |
| $800 to $1,499 | 1,161 (17.5%) | 359 (6.3%) |
| $800 to $1,499 | 4,356 (65.8%) | 819 (14.5%) |
| Total | 6,622 (100.0%) | 5,662 (100.0%) |
Health & Disability in Susquehanna County
Health Insurance Coverage by Age in Susquehanna County
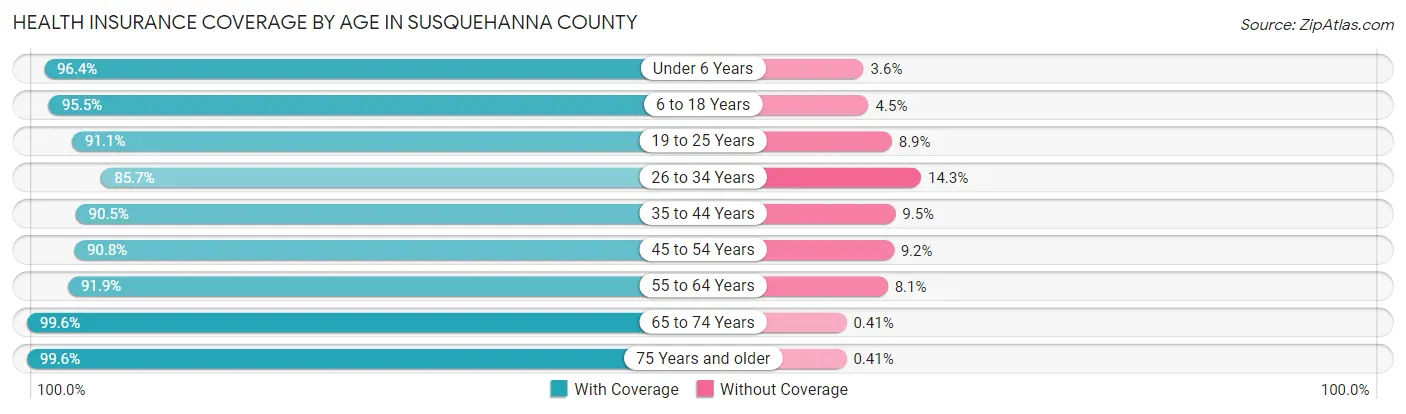
| Age Bracket | With Coverage | Without Coverage |
| Under 6 Years | 2,027 (96.4%) | 76 (3.6%) |
| 6 to 18 Years | 5,173 (95.5%) | 246 (4.5%) |
| 19 to 25 Years | 2,457 (91.1%) | 239 (8.9%) |
| 26 to 34 Years | 2,982 (85.7%) | 498 (14.3%) |
| 35 to 44 Years | 3,667 (90.5%) | 386 (9.5%) |
| 45 to 54 Years | 4,317 (90.8%) | 438 (9.2%) |
| 55 to 64 Years | 6,104 (91.9%) | 537 (8.1%) |
| 65 to 74 Years | 5,398 (99.6%) | 22 (0.4%) |
| 75 Years and older | 3,673 (99.6%) | 15 (0.4%) |
| Total | 35,798 (93.6%) | 2,457 (6.4%) |
Health Insurance Coverage by Citizenship Status in Susquehanna County
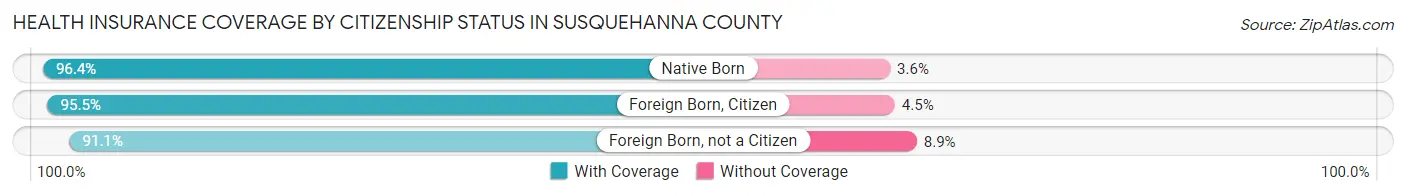
| Citizenship Status | With Coverage | Without Coverage |
| Native Born | 2,027 (96.4%) | 76 (3.6%) |
| Foreign Born, Citizen | 5,173 (95.5%) | 246 (4.5%) |
| Foreign Born, not a Citizen | 2,457 (91.1%) | 239 (8.9%) |
Health Insurance Coverage by Household Income in Susquehanna County
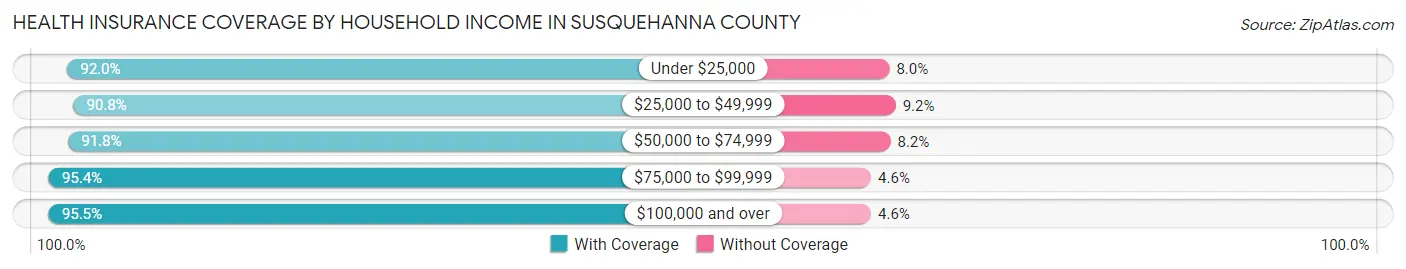
| Household Income | With Coverage | Without Coverage |
| Under $25,000 | 4,126 (92.0%) | 359 (8.0%) |
| $25,000 to $49,999 | 6,102 (90.8%) | 615 (9.2%) |
| $50,000 to $74,999 | 6,393 (91.8%) | 570 (8.2%) |
| $75,000 to $99,999 | 5,481 (95.4%) | 262 (4.6%) |
| $100,000 and over | 13,648 (95.5%) | 651 (4.5%) |
Public vs Private Health Insurance Coverage by Age in Susquehanna County
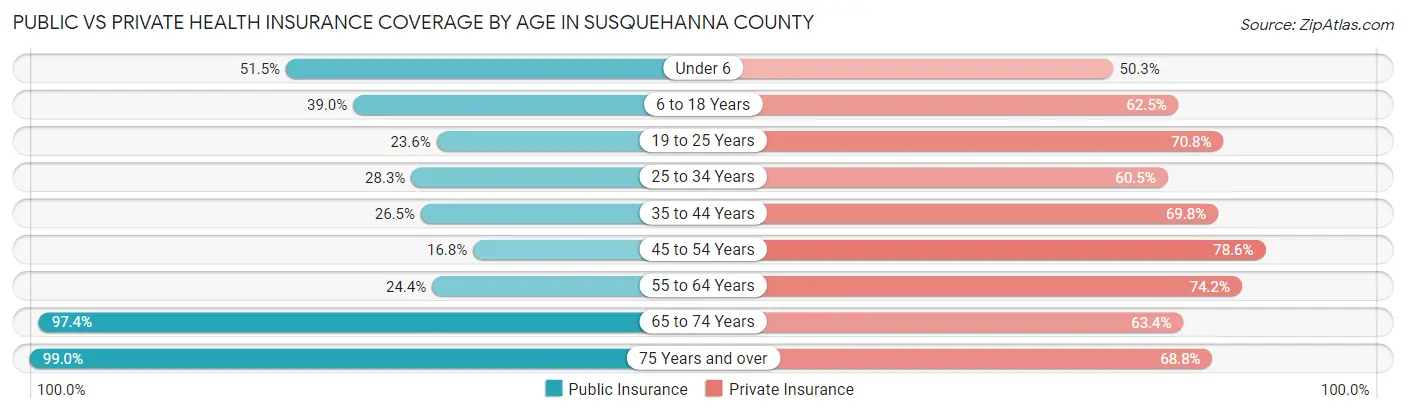
| Age Bracket | Public Insurance | Private Insurance |
| Under 6 | 1,083 (51.5%) | 1,057 (50.3%) |
| 6 to 18 Years | 2,115 (39.0%) | 3,388 (62.5%) |
| 19 to 25 Years | 635 (23.5%) | 1,909 (70.8%) |
| 25 to 34 Years | 983 (28.2%) | 2,104 (60.5%) |
| 35 to 44 Years | 1,072 (26.5%) | 2,830 (69.8%) |
| 45 to 54 Years | 797 (16.8%) | 3,738 (78.6%) |
| 55 to 64 Years | 1,619 (24.4%) | 4,930 (74.2%) |
| 65 to 74 Years | 5,277 (97.4%) | 3,435 (63.4%) |
| 75 Years and over | 3,652 (99.0%) | 2,537 (68.8%) |
| Total | 17,233 (45.1%) | 25,928 (67.8%) |
Disability Status by Sex by Age in Susquehanna County
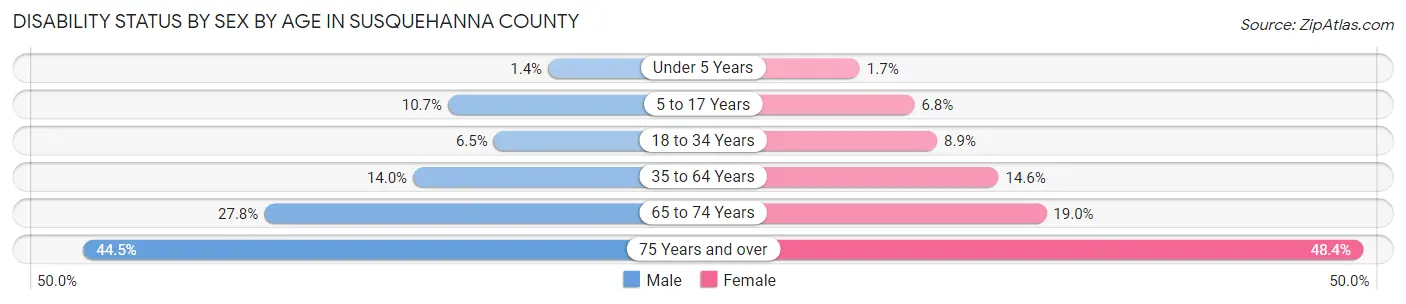
| Age Bracket | Male | Female |
| Under 5 Years | 13 (1.4%) | 15 (1.7%) |
| 5 to 17 Years | 292 (10.7%) | 179 (6.8%) |
| 18 to 34 Years | 224 (6.5%) | 271 (8.8%) |
| 35 to 64 Years | 1,109 (14.0%) | 1,092 (14.5%) |
| 65 to 74 Years | 743 (27.8%) | 521 (19.0%) |
| 75 Years and over | 751 (44.5%) | 968 (48.3%) |
Disability Class by Sex by Age in Susquehanna County
Disability Class: Hearing Difficulty
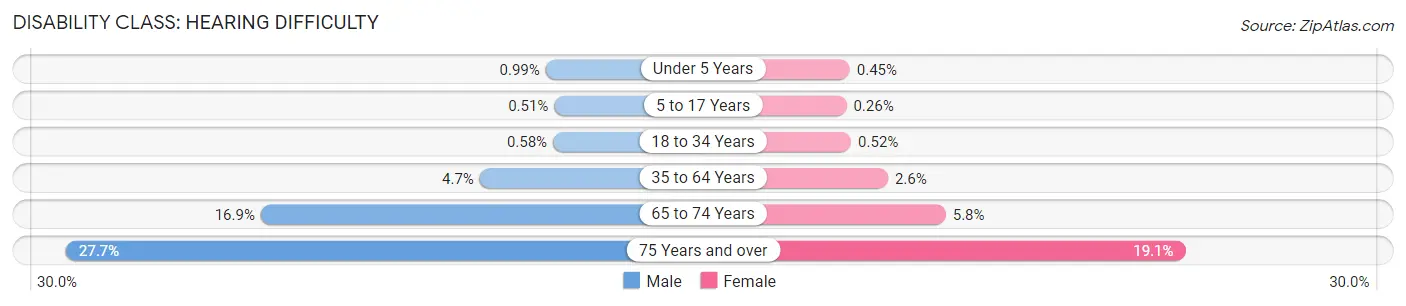
| Age Bracket | Male | Female |
| Under 5 Years | 9 (1.0%) | 4 (0.4%) |
| 5 to 17 Years | 14 (0.5%) | 7 (0.3%) |
| 18 to 34 Years | 20 (0.6%) | 16 (0.5%) |
| 35 to 64 Years | 370 (4.7%) | 193 (2.6%) |
| 65 to 74 Years | 451 (16.9%) | 159 (5.8%) |
| 75 Years and over | 467 (27.7%) | 383 (19.1%) |
Disability Class: Vision Difficulty
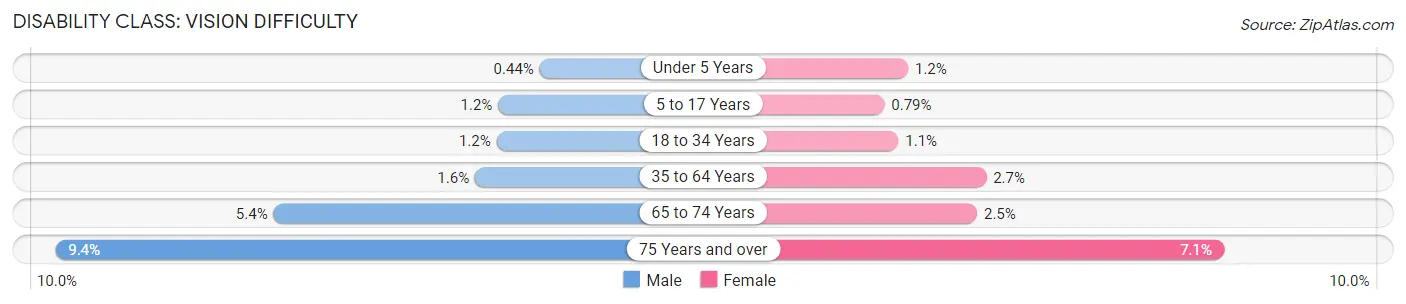
| Age Bracket | Male | Female |
| Under 5 Years | 4 (0.4%) | 11 (1.2%) |
| 5 to 17 Years | 33 (1.2%) | 21 (0.8%) |
| 18 to 34 Years | 43 (1.2%) | 32 (1.1%) |
| 35 to 64 Years | 130 (1.6%) | 201 (2.7%) |
| 65 to 74 Years | 144 (5.4%) | 69 (2.5%) |
| 75 Years and over | 159 (9.4%) | 142 (7.1%) |
Disability Class: Cognitive Difficulty
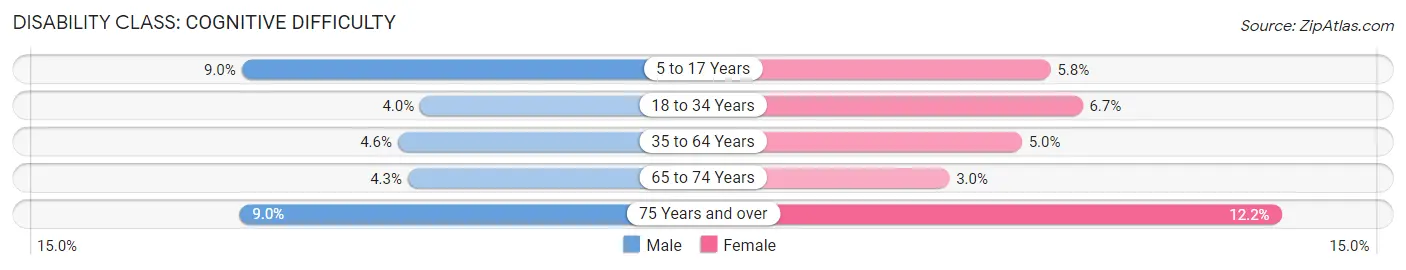
| Age Bracket | Male | Female |
| 5 to 17 Years | 244 (9.0%) | 154 (5.8%) |
| 18 to 34 Years | 138 (4.0%) | 205 (6.7%) |
| 35 to 64 Years | 366 (4.6%) | 376 (5.0%) |
| 65 to 74 Years | 116 (4.3%) | 82 (3.0%) |
| 75 Years and over | 152 (9.0%) | 245 (12.2%) |
Disability Class: Ambulatory Difficulty
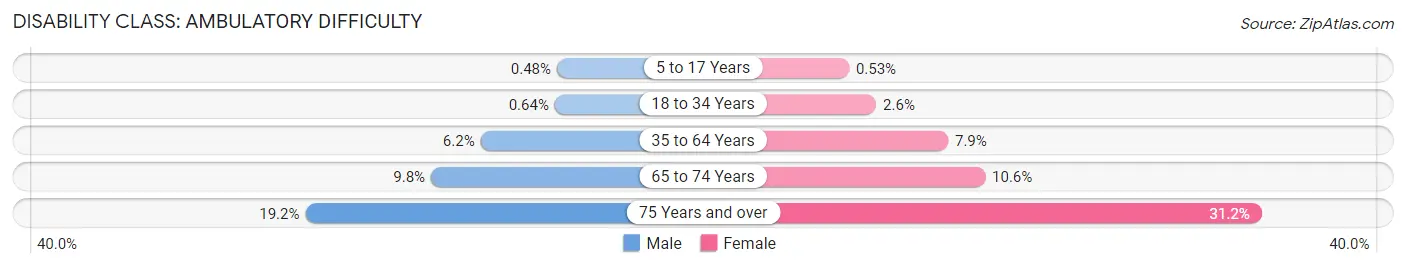
| Age Bracket | Male | Female |
| 5 to 17 Years | 13 (0.5%) | 14 (0.5%) |
| 18 to 34 Years | 22 (0.6%) | 78 (2.5%) |
| 35 to 64 Years | 489 (6.1%) | 592 (7.9%) |
| 65 to 74 Years | 263 (9.8%) | 292 (10.6%) |
| 75 Years and over | 323 (19.2%) | 624 (31.2%) |
Disability Class: Self-Care Difficulty
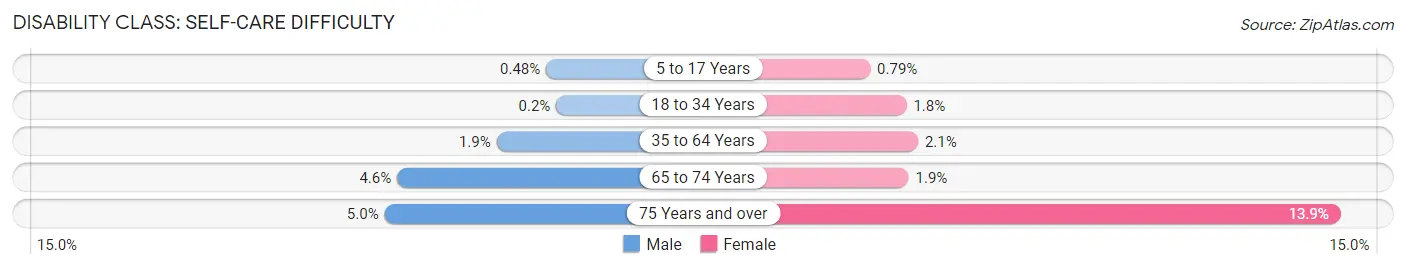
| Age Bracket | Male | Female |
| 5 to 17 Years | 13 (0.5%) | 21 (0.8%) |
| 18 to 34 Years | 7 (0.2%) | 55 (1.8%) |
| 35 to 64 Years | 148 (1.9%) | 159 (2.1%) |
| 65 to 74 Years | 124 (4.6%) | 51 (1.9%) |
| 75 Years and over | 84 (5.0%) | 278 (13.9%) |
Technology Access in Susquehanna County
Computing Device Access in Susquehanna County
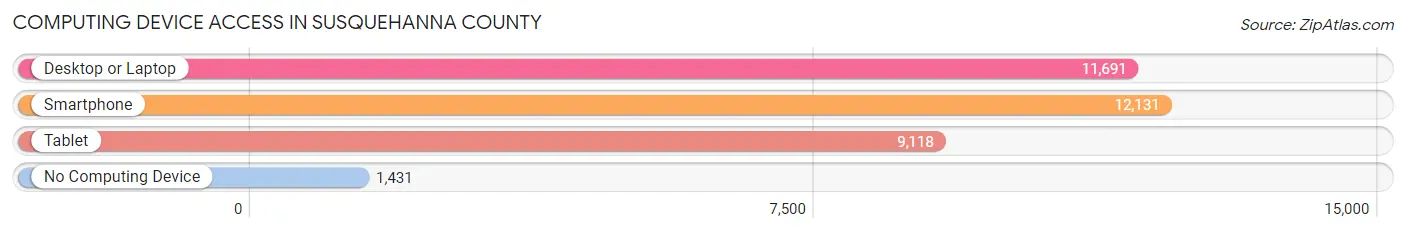
| Device Type | # Households | % Households |
| Desktop or Laptop | 11,691 | 74.8% |
| Smartphone | 12,131 | 77.6% |
| Tablet | 9,118 | 58.3% |
| No Computing Device | 1,431 | 9.1% |
| Total | 15,641 | 100.0% |
Internet Access in Susquehanna County
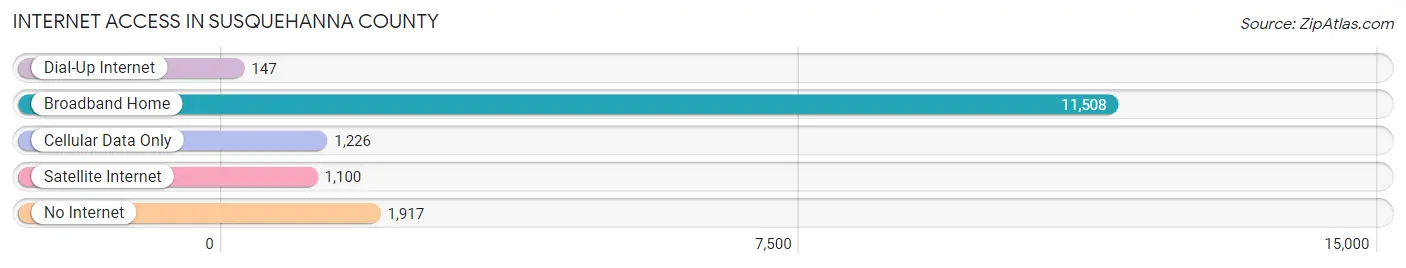
| Internet Type | # Households | % Households |
| Dial-Up Internet | 147 | 0.9% |
| Broadband Home | 11,508 | 73.6% |
| Cellular Data Only | 1,226 | 7.8% |
| Satellite Internet | 1,100 | 7.0% |
| No Internet | 1,917 | 12.3% |
| Total | 15,641 | 100.0% |
Susquehanna County Summary
Susquehanna County is a county located in the northeastern part of the U.S. state of Pennsylvania. As of the 2010 census, the population was 43,356. The county seat is Montrose. The county was created on February 21, 1810, from part of Luzerne County and later organized in 1812. It is named for the Susquehanna River.
History
The first settlers in Susquehanna County were Native Americans, who lived in the area for thousands of years before the arrival of Europeans. The first Europeans to settle in the area were Dutch and English settlers in the late 17th century. The county was created in 1810 from part of Luzerne County and was organized in 1812.
The county was an important center of the lumber industry in the 19th century, and the county seat of Montrose was a major hub for the industry. The county was also home to several coal mines, which provided employment for many of the county's residents.
Geography
Susquehanna County is located in the northeastern part of Pennsylvania, and is bordered by Wayne County to the north, Wyoming County to the east, Lackawanna County to the south, and Bradford County to the west. The county has a total area of 876 square miles, of which 864 square miles is land and 12 square miles is water. The county is located in the Appalachian Mountains and is part of the Endless Mountains region.
The highest point in the county is the summit of North Knob Mountain, at an elevation of 2,845 feet above sea level. The county is drained by the Susquehanna River and its tributaries, including the Lackawaxen River, Tunkhannock Creek, and Wyalusing Creek.
Economy
The economy of Susquehanna County is largely based on agriculture and natural resources. The county is home to several dairy farms, as well as beef and poultry farms. The county is also home to several timber and lumber companies, as well as several coal mines.
The county is also home to several manufacturing companies, including a paper mill, a plastics plant, and a metal fabrication plant. The county is also home to several tourist attractions, including the Lackawanna State Park, the Montrose Historic District, and the Starrucca Viaduct.
Demographics
As of the 2010 census, there were 43,356 people, 17,845 households, and 12,541 families living in the county. The population density was 50 people per square mile. There were 20,845 housing units at an average density of 24 per square mile. The racial makeup of the county was 97.7% White, 0.7% African American, 0.2% Native American, 0.3% Asian, 0.1% Pacific Islander, 0.3% from other races, and 0.9% from two or more races. Hispanic or Latino of any race were 1.3% of the population.
The median income for a household in the county was $41,945, and the median income for a family was $50,945. The per capita income for the county was $21,845. About 10.2% of families and 13.2% of the population were below the poverty line, including 17.2% of those under age 18 and 8.2% of those age 65 or over.
Common Questions
What is Per Capita Income in Susquehanna County?
Per Capita income in Susquehanna County is $37,532.
What is the Median Family Income in Susquehanna County?
Median Family Income in Susquehanna County is $79,488.
What is the Median Household income in Susquehanna County?
Median Household Income in Susquehanna County is $63,968.
What is Income or Wage Gap in Susquehanna County?
Income or Wage Gap in Susquehanna County is 32.6%.
Women in Susquehanna County earn 67.4 cents for every dollar earned by a man.
What is Family Income Deficit in Susquehanna County?
Family Income Deficit in Susquehanna County is $10,926.
Families that are below poverty line in Susquehanna County earn $10,926 less on average than the poverty threshold level.
What is Inequality or Gini Index in Susquehanna County?
Inequality or Gini Index in Susquehanna County is 0.46.
What is the Total Population of Susquehanna County?
Total Population of Susquehanna County is 38,540.
What is the Total Male Population of Susquehanna County?
Total Male Population of Susquehanna County is 19,522.
What is the Total Female Population of Susquehanna County?
Total Female Population of Susquehanna County is 19,018.
What is the Ratio of Males per 100 Females in Susquehanna County?
There are 102.65 Males per 100 Females in Susquehanna County.
What is the Ratio of Females per 100 Males in Susquehanna County?
There are 97.42 Females per 100 Males in Susquehanna County.
What is the Median Population Age in Susquehanna County?
Median Population Age in Susquehanna County is 48.5 Years.
What is the Average Family Size in Susquehanna County
Average Family Size in Susquehanna County is 3.0 People.
What is the Average Household Size in Susquehanna County
Average Household Size in Susquehanna County is 2.4 People.
How Large is the Labor Force in Susquehanna County?
There are 17,876 People in the Labor Forcein in Susquehanna County.
What is the Percentage of People in the Labor Force in Susquehanna County?
55.5% of People are in the Labor Force in Susquehanna County.
What is the Unemployment Rate in Susquehanna County?
Unemployment Rate in Susquehanna County is 5.8%.