Sullivan County, PA Map & Demographics
Sullivan County Map
Sullivan County Overview
$35,618
PER CAPITA INCOME
$80,104
AVG FAMILY INCOME
$62,910
AVG HOUSEHOLD INCOME
32.6%
WAGE / INCOME GAP [ % ]
67.4¢/ $1
WAGE / INCOME GAP [ $ ]
0.43
INEQUALITY / GINI INDEX
5,880
TOTAL POPULATION
3,096
MALE POPULATION
2,784
FEMALE POPULATION
111.21
MALES / 100 FEMALES
89.92
FEMALES / 100 MALES
55.0
MEDIAN AGE
2.8
AVG FAMILY SIZE
2.2
AVG HOUSEHOLD SIZE
2,700
LABOR FORCE [ PEOPLE ]
50.8%
PERCENT IN LABOR FORCE
5.5%
UNEMPLOYMENT RATE
Sullivan County Area Codes
Income in Sullivan County
Income Overview in Sullivan County
Per Capita Income in Sullivan County is $35,618, while median incomes of families and households are $80,104 and $62,910 respectively.
| Characteristic | Number | Measure |
| Per Capita Income | 5,880 | $35,618 |
| Median Family Income | 1,496 | $80,104 |
| Mean Family Income | 1,496 | $96,540 |
| Median Household Income | 2,462 | $62,910 |
| Mean Household Income | 2,462 | $78,481 |
| Income Deficit | 1,496 | $0 |
| Wage / Income Gap (%) | 5,880 | 32.58% |
| Wage / Income Gap ($) | 5,880 | 67.42¢ per $1 |
| Gini / Inequality Index | 5,880 | 0.43 |
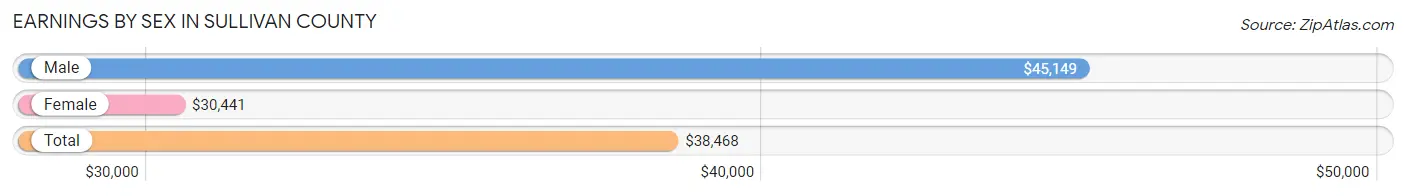
Earnings by Sex in Sullivan County
Average Earnings in Sullivan County are $38,468, $45,149 for men and $30,441 for women, a difference of 32.6%.
| Sex | Number | Average Earnings |
| Male | 1,500 (53.4%) | $45,149 |
| Female | 1,308 (46.6%) | $30,441 |
| Total | 2,808 (100.0%) | $38,468 |
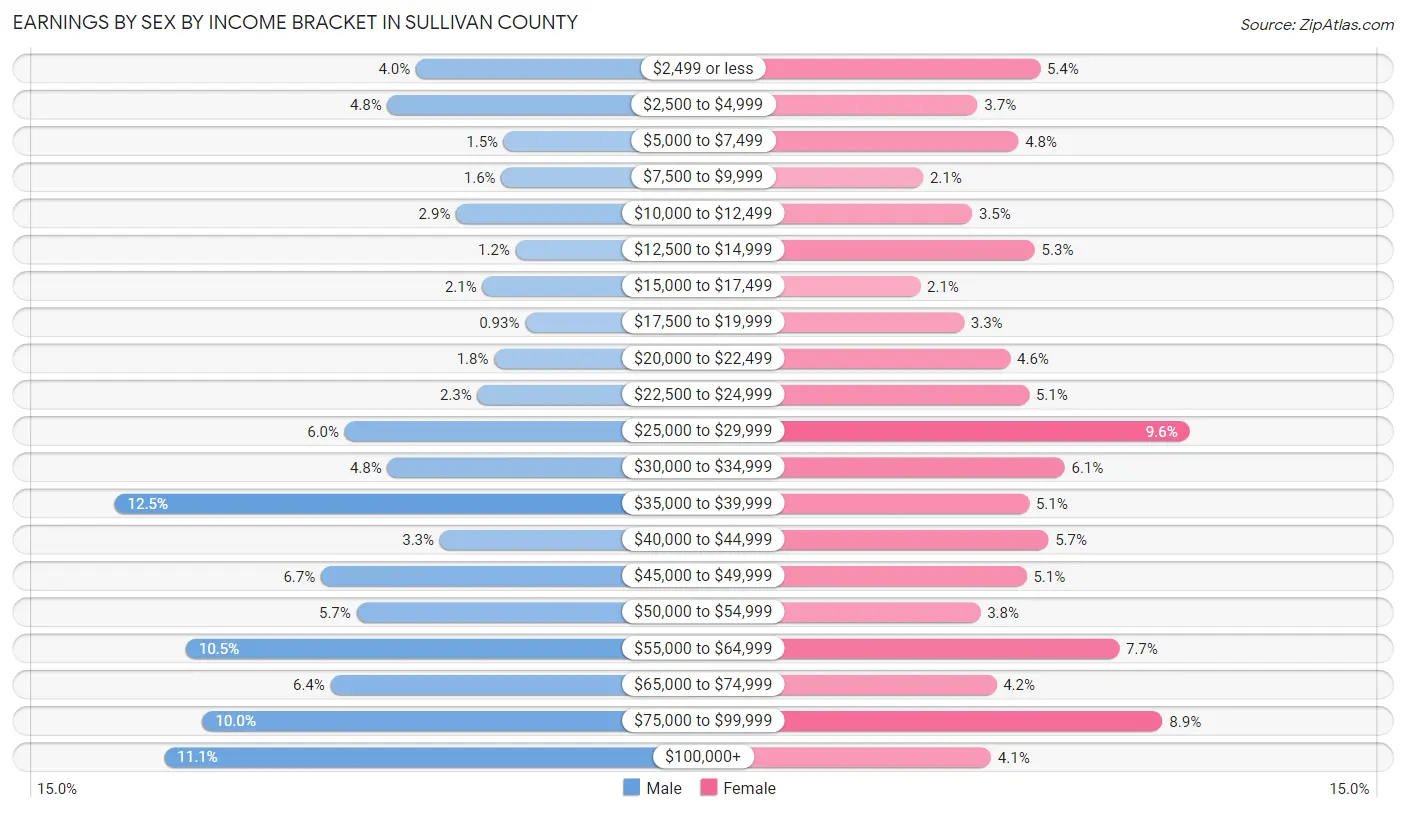
Earnings by Sex by Income Bracket in Sullivan County
The most common earnings brackets in Sullivan County are $35,000 to $39,999 for men (187 | 12.5%) and $25,000 to $29,999 for women (126 | 9.6%).
| Income | Male | Female |
| $2,499 or less | 60 (4.0%) | 71 (5.4%) |
| $2,500 to $4,999 | 72 (4.8%) | 48 (3.7%) |
| $5,000 to $7,499 | 23 (1.5%) | 63 (4.8%) |
| $7,500 to $9,999 | 24 (1.6%) | 28 (2.1%) |
| $10,000 to $12,499 | 43 (2.9%) | 46 (3.5%) |
| $12,500 to $14,999 | 18 (1.2%) | 69 (5.3%) |
| $15,000 to $17,499 | 32 (2.1%) | 27 (2.1%) |
| $17,500 to $19,999 | 14 (0.9%) | 43 (3.3%) |
| $20,000 to $22,499 | 27 (1.8%) | 60 (4.6%) |
| $22,500 to $24,999 | 34 (2.3%) | 67 (5.1%) |
| $25,000 to $29,999 | 90 (6.0%) | 126 (9.6%) |
| $30,000 to $34,999 | 72 (4.8%) | 80 (6.1%) |
| $35,000 to $39,999 | 187 (12.5%) | 67 (5.1%) |
| $40,000 to $44,999 | 50 (3.3%) | 74 (5.7%) |
| $45,000 to $49,999 | 100 (6.7%) | 66 (5.1%) |
| $50,000 to $54,999 | 85 (5.7%) | 49 (3.7%) |
| $55,000 to $64,999 | 157 (10.5%) | 100 (7.6%) |
| $65,000 to $74,999 | 96 (6.4%) | 55 (4.2%) |
| $75,000 to $99,999 | 150 (10.0%) | 116 (8.9%) |
| $100,000+ | 166 (11.1%) | 53 (4.1%) |
| Total | 1,500 (100.0%) | 1,308 (100.0%) |
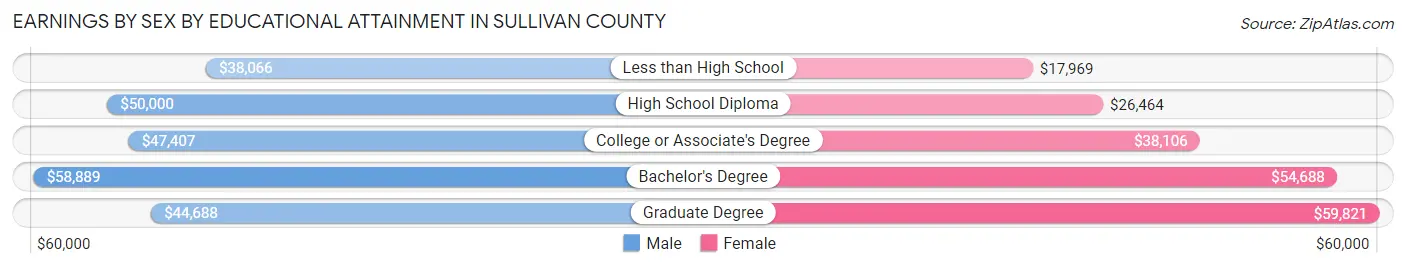
Earnings by Sex by Educational Attainment in Sullivan County
Average earnings in Sullivan County are $47,099 for men and $33,267 for women, a difference of 29.4%. Men with an educational attainment of bachelor's degree enjoy the highest average annual earnings of $58,889, while those with less than high school education earn the least with $38,066. Women with an educational attainment of graduate degree earn the most with the average annual earnings of $59,821, while those with less than high school education have the smallest earnings of $17,969.
| Educational Attainment | Male Income | Female Income |
| Less than High School | $38,066 | $17,969 |
| High School Diploma | $50,000 | $26,464 |
| College or Associate's Degree | $47,407 | $38,106 |
| Bachelor's Degree | $58,889 | $54,688 |
| Graduate Degree | $44,688 | $59,821 |
| Total | $47,099 | $33,267 |
Family Income in Sullivan County
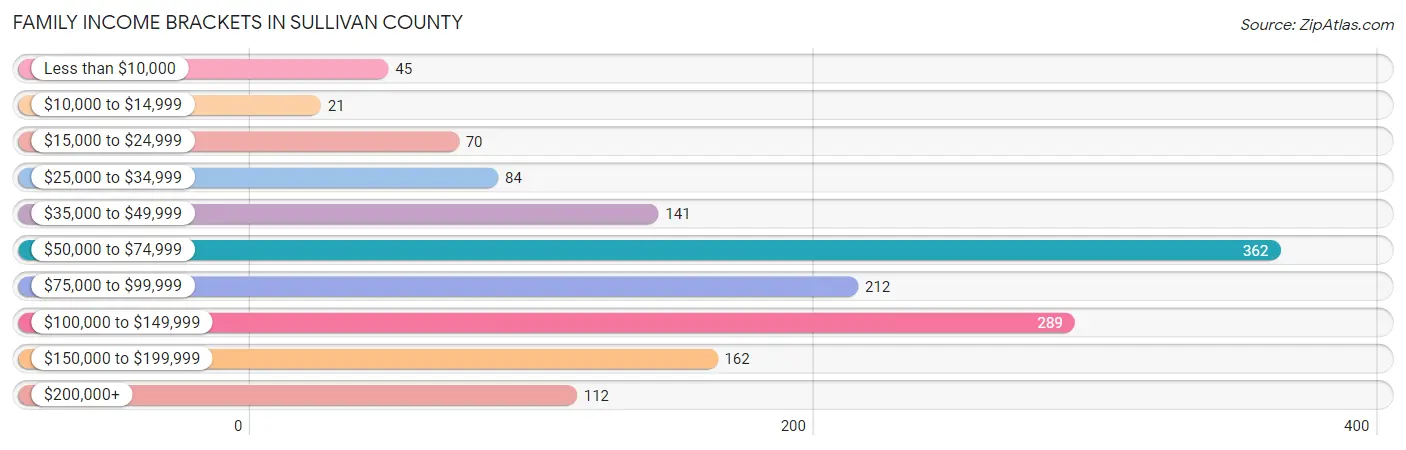
Family Income Brackets in Sullivan County
According to the Sullivan County family income data, there are 362 families falling into the $50,000 to $74,999 income range, which is the most common income bracket and makes up 24.2% of all families. Conversely, the $10,000 to $14,999 income bracket is the least frequent group with only 21 families (1.4%) belonging to this category.
| Income Bracket | # Families | % Families |
| Less than $10,000 | 45 | 3.0% |
| $10,000 to $14,999 | 21 | 1.4% |
| $15,000 to $24,999 | 70 | 4.7% |
| $25,000 to $34,999 | 84 | 5.6% |
| $35,000 to $49,999 | 141 | 9.4% |
| $50,000 to $74,999 | 362 | 24.2% |
| $75,000 to $99,999 | 212 | 14.2% |
| $100,000 to $149,999 | 289 | 19.3% |
| $150,000 to $199,999 | 162 | 10.8% |
| $200,000+ | 112 | 7.5% |
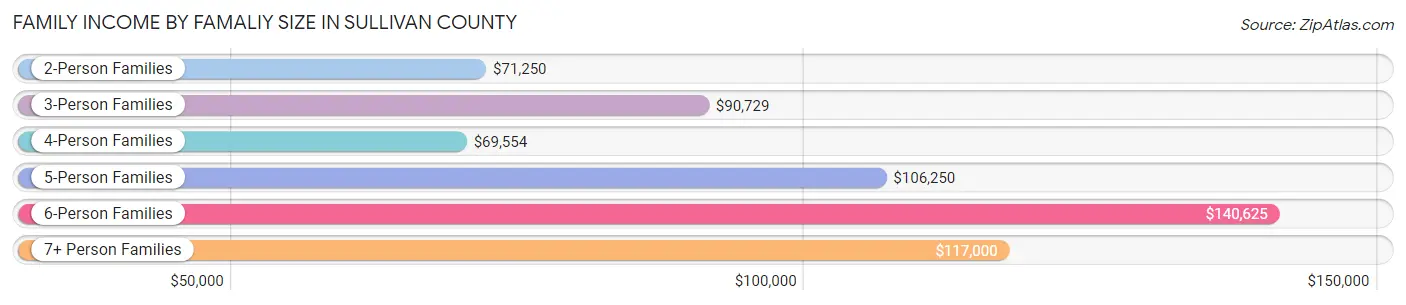
Family Income by Famaliy Size in Sullivan County
6-person families (17 | 1.1%) account for the highest median family income in Sullivan County with $140,625 per family, while 2-person families (948 | 63.4%) have the highest median income of $35,625 per family member.
| Income Bracket | # Families | Median Income |
| 2-Person Families | 948 (63.4%) | $71,250 |
| 3-Person Families | 239 (16.0%) | $90,729 |
| 4-Person Families | 163 (10.9%) | $69,554 |
| 5-Person Families | 97 (6.5%) | $106,250 |
| 6-Person Families | 17 (1.1%) | $140,625 |
| 7+ Person Families | 32 (2.1%) | $117,000 |
| Total | 1,496 (100.0%) | $80,104 |
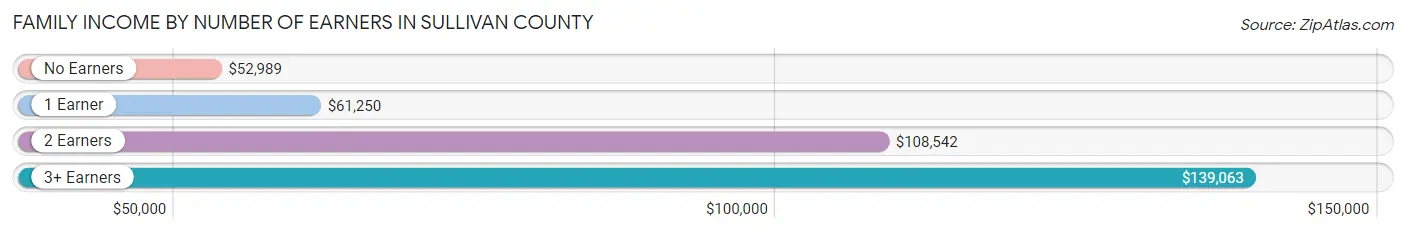
Family Income by Number of Earners in Sullivan County
The median family income in Sullivan County is $80,104, with families comprising 3+ earners (137) having the highest median family income of $139,063, while families with no earners (431) have the lowest median family income of $52,989, accounting for 9.2% and 28.8% of families, respectively.
| Number of Earners | # Families | Median Income |
| No Earners | 431 (28.8%) | $52,989 |
| 1 Earner | 421 (28.1%) | $61,250 |
| 2 Earners | 507 (33.9%) | $108,542 |
| 3+ Earners | 137 (9.2%) | $139,063 |
| Total | 1,496 (100.0%) | $80,104 |
Household Income in Sullivan County
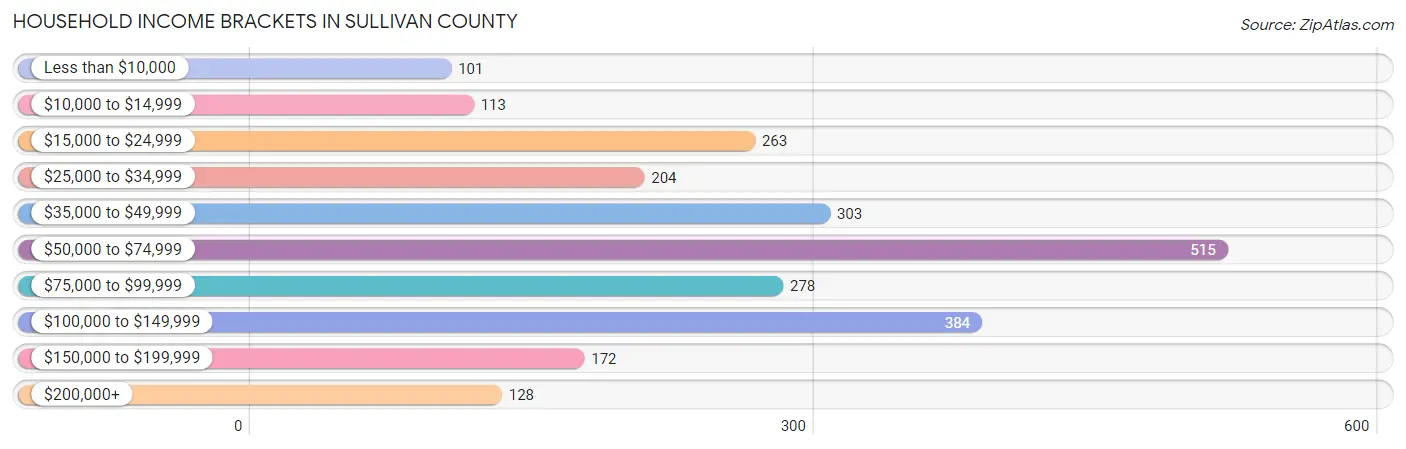
Household Income Brackets in Sullivan County
With 515 households falling in the category, the $50,000 to $74,999 income range is the most frequent in Sullivan County, accounting for 20.9% of all households. In contrast, only 101 households (4.1%) fall into the less than $10,000 income bracket, making it the least populous group.
| Income Bracket | # Households | % Households |
| Less than $10,000 | 101 | 4.1% |
| $10,000 to $14,999 | 113 | 4.6% |
| $15,000 to $24,999 | 263 | 10.7% |
| $25,000 to $34,999 | 204 | 8.3% |
| $35,000 to $49,999 | 303 | 12.3% |
| $50,000 to $74,999 | 515 | 20.9% |
| $75,000 to $99,999 | 278 | 11.3% |
| $100,000 to $149,999 | 384 | 15.6% |
| $150,000 to $199,999 | 172 | 7.0% |
| $200,000+ | 128 | 5.2% |
Household Income by Householder Age in Sullivan County
The median household income in Sullivan County is $62,910, with the highest median household income of $78,214 found in the 25 to 44 years age bracket for the primary householder. A total of 462 households (18.8%) fall into this category. Meanwhile, the 65+ years age bracket for the primary householder has the lowest median household income of $48,148, with 988 households (40.1%) in this group.
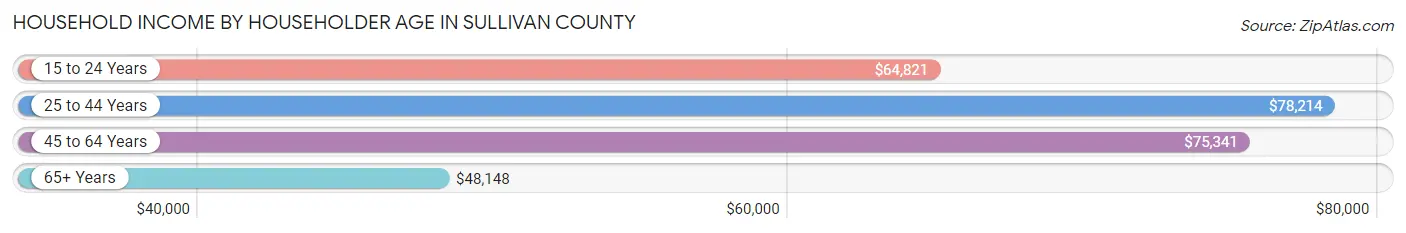
| Income Bracket | # Households | Median Income |
| 15 to 24 Years | 31 (1.3%) | $64,821 |
| 25 to 44 Years | 462 (18.8%) | $78,214 |
| 45 to 64 Years | 981 (39.9%) | $75,341 |
| 65+ Years | 988 (40.1%) | $48,148 |
| Total | 2,462 (100.0%) | $62,910 |
Poverty in Sullivan County
Income Below Poverty by Sex and Age in Sullivan County
With 12.9% poverty level for males and 11.5% for females among the residents of Sullivan County, 5 year old males and 6 to 11 year old females are the most vulnerable to poverty, with 9 males (52.9%) and 33 females (35.1%) in their respective age groups living below the poverty level.
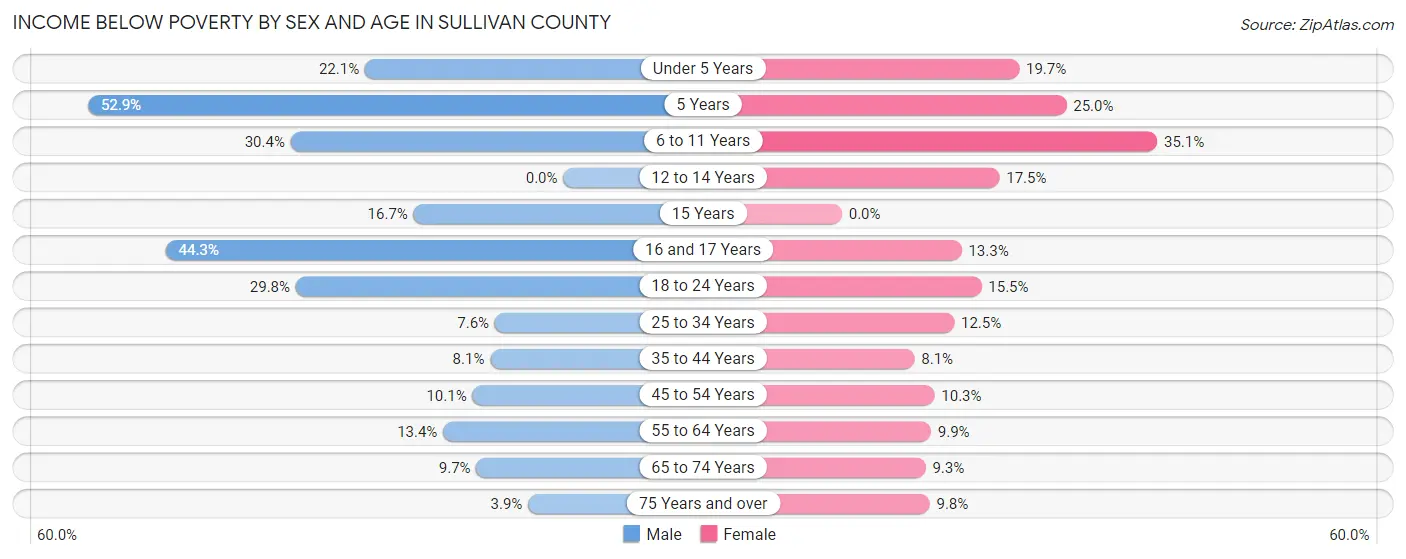
| Age Bracket | Male | Female |
| Under 5 Years | 19 (22.1%) | 15 (19.7%) |
| 5 Years | 9 (52.9%) | 1 (25.0%) |
| 6 to 11 Years | 34 (30.4%) | 33 (35.1%) |
| 12 to 14 Years | 0 (0.0%) | 10 (17.5%) |
| 15 Years | 3 (16.7%) | 0 (0.0%) |
| 16 and 17 Years | 31 (44.3%) | 4 (13.3%) |
| 18 to 24 Years | 56 (29.8%) | 23 (15.5%) |
| 25 to 34 Years | 26 (7.6%) | 31 (12.5%) |
| 35 to 44 Years | 25 (8.1%) | 24 (8.1%) |
| 45 to 54 Years | 41 (10.1%) | 33 (10.3%) |
| 55 to 64 Years | 76 (13.4%) | 60 (9.9%) |
| 65 to 74 Years | 45 (9.7%) | 44 (9.3%) |
| 75 Years and over | 12 (3.9%) | 34 (9.8%) |
| Total | 377 (12.9%) | 312 (11.5%) |
Income Above Poverty by Sex and Age in Sullivan County
According to the poverty statistics in Sullivan County, males aged 12 to 14 years and females aged 15 years are the age groups that are most secure financially, with 100.0% of males and 100.0% of females in these age groups living above the poverty line.
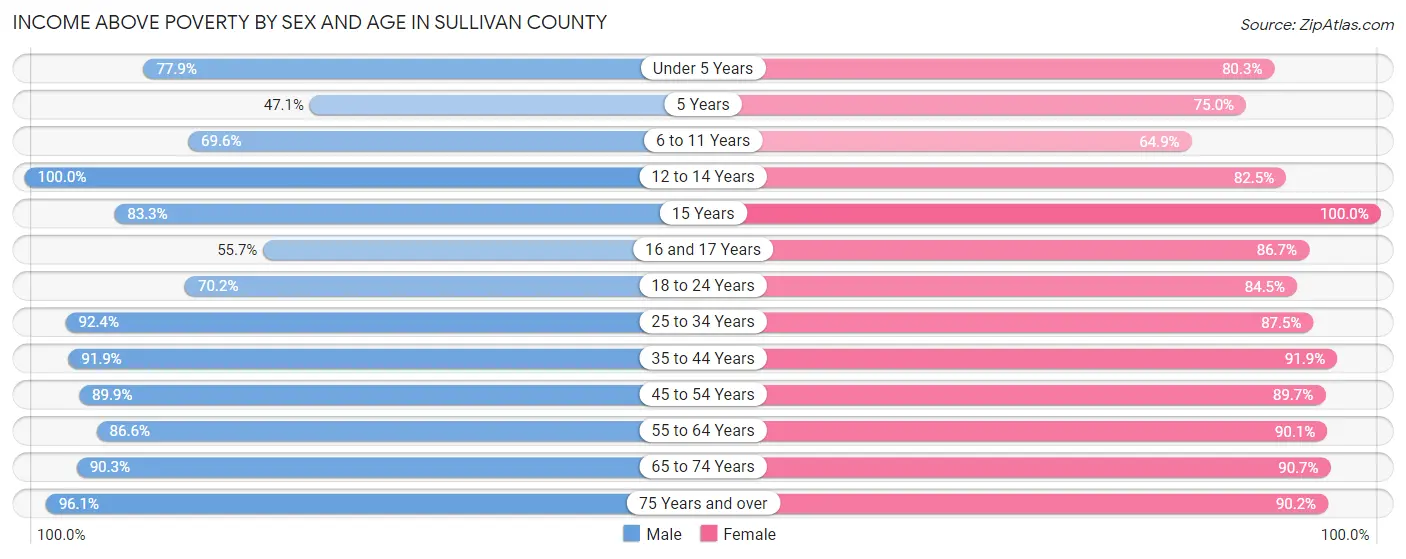
| Age Bracket | Male | Female |
| Under 5 Years | 67 (77.9%) | 61 (80.3%) |
| 5 Years | 8 (47.1%) | 3 (75.0%) |
| 6 to 11 Years | 78 (69.6%) | 61 (64.9%) |
| 12 to 14 Years | 46 (100.0%) | 47 (82.5%) |
| 15 Years | 15 (83.3%) | 8 (100.0%) |
| 16 and 17 Years | 39 (55.7%) | 26 (86.7%) |
| 18 to 24 Years | 132 (70.2%) | 125 (84.5%) |
| 25 to 34 Years | 315 (92.4%) | 217 (87.5%) |
| 35 to 44 Years | 282 (91.9%) | 273 (91.9%) |
| 45 to 54 Years | 364 (89.9%) | 287 (89.7%) |
| 55 to 64 Years | 492 (86.6%) | 545 (90.1%) |
| 65 to 74 Years | 420 (90.3%) | 428 (90.7%) |
| 75 Years and over | 294 (96.1%) | 314 (90.2%) |
| Total | 2,552 (87.1%) | 2,395 (88.5%) |
Income Below Poverty Among Married-Couple Families in Sullivan County
The poverty statistics for married-couple families in Sullivan County show that 4.8% or 60 of the total 1,255 families live below the poverty line. Families with 3 or 4 children have the highest poverty rate of 34.9%, comprising of 22 families. On the other hand, families with 5 or more children have the lowest poverty rate of 0.0%, which includes 0 families.
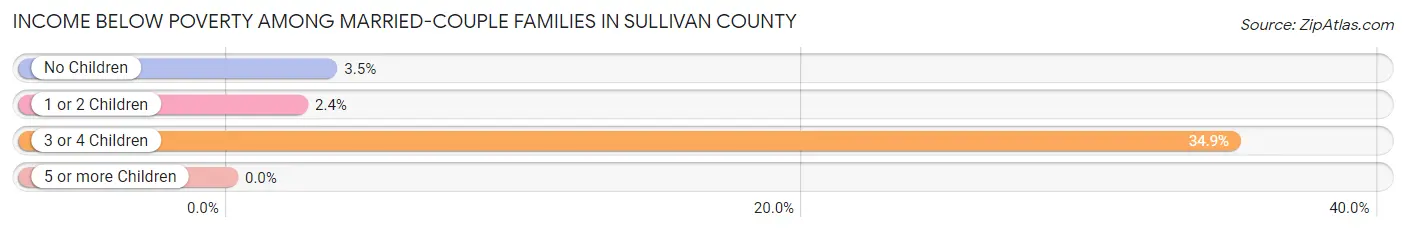
| Children | Above Poverty | Below Poverty |
| No Children | 894 (96.5%) | 32 (3.5%) |
| 1 or 2 Children | 240 (97.6%) | 6 (2.4%) |
| 3 or 4 Children | 41 (65.1%) | 22 (34.9%) |
| 5 or more Children | 20 (100.0%) | 0 (0.0%) |
| Total | 1,195 (95.2%) | 60 (4.8%) |
Income Below Poverty Among Single-Parent Households in Sullivan County
According to the poverty data in Sullivan County, 1.2% or 1 single-father households and 18.2% or 29 single-mother households are living below the poverty line. Among single-father households, those with 3 or 4 children have the highest poverty rate, with 1 households (7.1%) experiencing poverty. Likewise, among single-mother households, those with 3 or 4 children have the highest poverty rate, with 13 households (54.2%) falling below the poverty line.
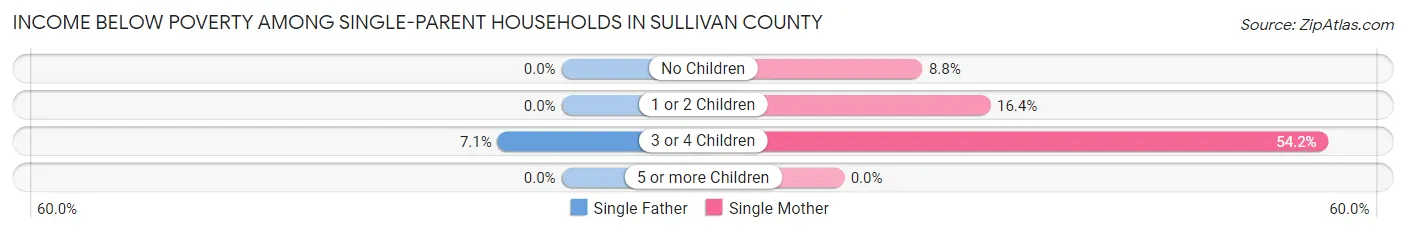
| Children | Single Father | Single Mother |
| No Children | 0 (0.0%) | 7 (8.7%) |
| 1 or 2 Children | 0 (0.0%) | 9 (16.4%) |
| 3 or 4 Children | 1 (7.1%) | 13 (54.2%) |
| 5 or more Children | 0 (0.0%) | 0 (0.0%) |
| Total | 1 (1.2%) | 29 (18.2%) |
Income Below Poverty Among Married-Couple vs Single-Parent Households in Sullivan County
The poverty data for Sullivan County shows that 60 of the married-couple family households (4.8%) and 30 of the single-parent households (12.4%) are living below the poverty level. Within the married-couple family households, those with 3 or 4 children have the highest poverty rate, with 22 households (34.9%) falling below the poverty line. Among the single-parent households, those with 3 or 4 children have the highest poverty rate, with 14 household (36.8%) living below poverty.
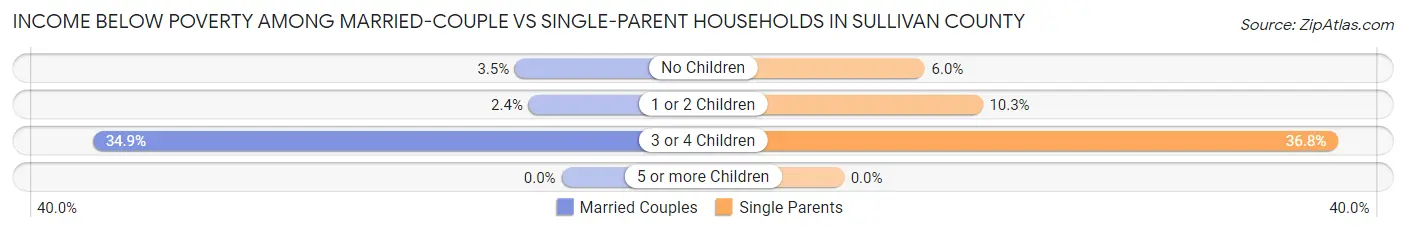
| Children | Married-Couple Families | Single-Parent Households |
| No Children | 32 (3.5%) | 7 (6.0%) |
| 1 or 2 Children | 6 (2.4%) | 9 (10.3%) |
| 3 or 4 Children | 22 (34.9%) | 14 (36.8%) |
| 5 or more Children | 0 (0.0%) | 0 (0.0%) |
| Total | 60 (4.8%) | 30 (12.4%) |
Race in Sullivan County
The most populous races in Sullivan County are White / Caucasian (5,544 | 94.3%), Black / African American (158 | 2.7%), and Hispanic or Latino (138 | 2.4%).
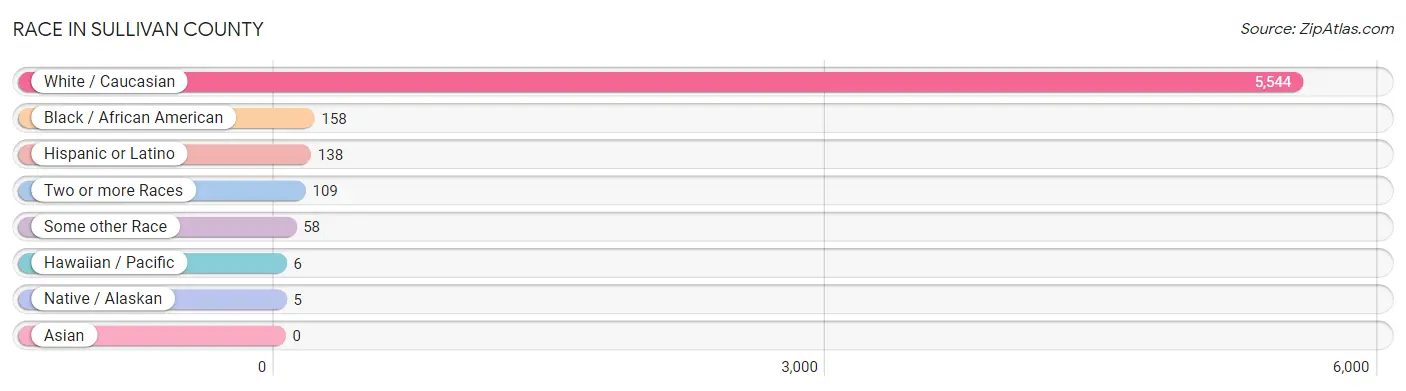
| Race | # Population | % Population |
| Asian | 0 | 0.0% |
| Black / African American | 158 | 2.7% |
| Hawaiian / Pacific | 6 | 0.1% |
| Hispanic or Latino | 138 | 2.4% |
| Native / Alaskan | 5 | 0.1% |
| White / Caucasian | 5,544 | 94.3% |
| Two or more Races | 109 | 1.8% |
| Some other Race | 58 | 1.0% |
| Total | 5,880 | 100.0% |
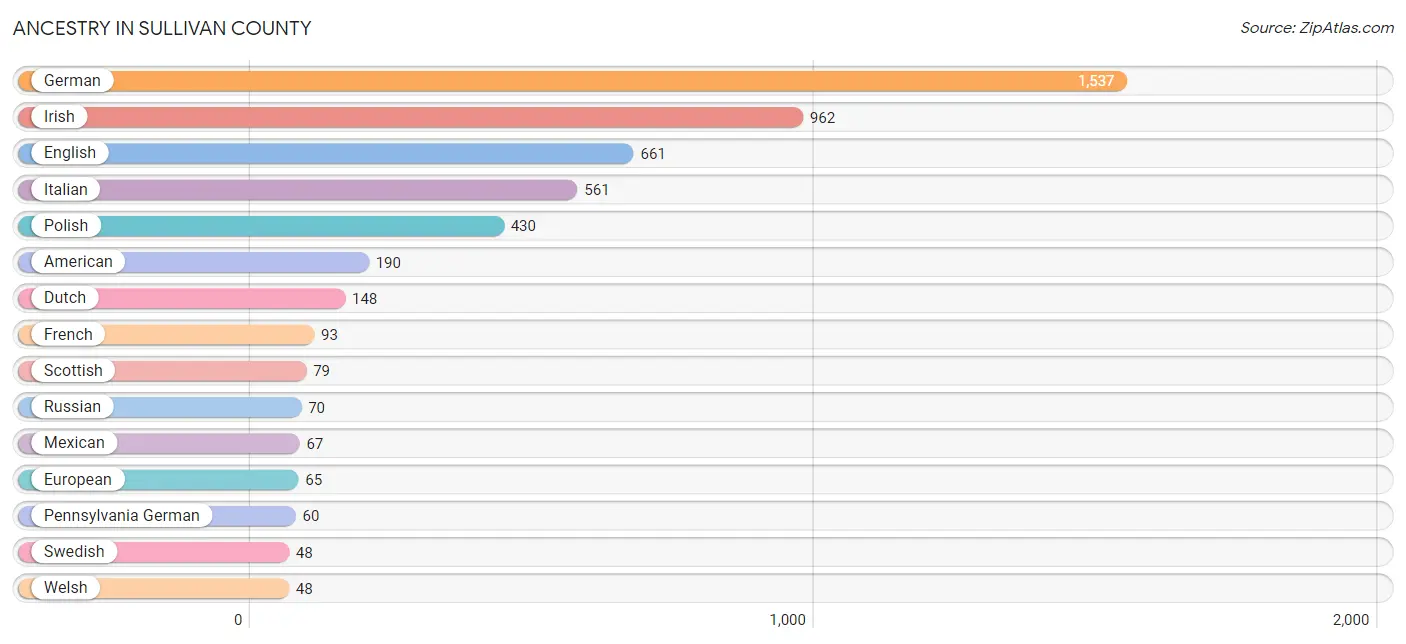
Ancestry in Sullivan County
The most populous ancestries reported in Sullivan County are German (1,537 | 26.1%), Irish (962 | 16.4%), English (661 | 11.2%), Italian (561 | 9.5%), and Polish (430 | 7.3%), together accounting for 70.6% of all Sullivan County residents.
| Ancestry | # Population | % Population |
| American | 190 | 3.2% |
| Arab | 15 | 0.3% |
| Austrian | 35 | 0.6% |
| British | 9 | 0.2% |
| Bulgarian | 3 | 0.1% |
| Burmese | 38 | 0.6% |
| Canadian | 3 | 0.1% |
| Central American | 14 | 0.2% |
| Cherokee | 2 | 0.0% |
| Colombian | 12 | 0.2% |
| Costa Rican | 12 | 0.2% |
| Cuban | 8 | 0.1% |
| Czech | 46 | 0.8% |
| Czechoslovakian | 4 | 0.1% |
| Danish | 9 | 0.2% |
| Dominican | 2 | 0.0% |
| Dutch | 148 | 2.5% |
| Eastern European | 9 | 0.2% |
| Ecuadorian | 1 | 0.0% |
| English | 661 | 11.2% |
| European | 65 | 1.1% |
| Finnish | 2 | 0.0% |
| French | 93 | 1.6% |
| French American Indian | 1 | 0.0% |
| French Canadian | 1 | 0.0% |
| German | 1,537 | 26.1% |
| Haitian | 4 | 0.1% |
| Hungarian | 4 | 0.1% |
| Irish | 962 | 16.4% |
| Italian | 561 | 9.5% |
| Jamaican | 4 | 0.1% |
| Latvian | 9 | 0.2% |
| Lebanese | 12 | 0.2% |
| Lithuanian | 47 | 0.8% |
| Mexican | 67 | 1.1% |
| Nigerian | 38 | 0.6% |
| Northern European | 4 | 0.1% |
| Norwegian | 22 | 0.4% |
| Paraguayan | 1 | 0.0% |
| Pennsylvania German | 60 | 1.0% |
| Polish | 430 | 7.3% |
| Puerto Rican | 23 | 0.4% |
| Russian | 70 | 1.2% |
| Salvadoran | 2 | 0.0% |
| Scotch-Irish | 26 | 0.4% |
| Scottish | 79 | 1.3% |
| Sioux | 12 | 0.2% |
| Slavic | 3 | 0.1% |
| Slovak | 29 | 0.5% |
| South American | 14 | 0.2% |
| Spaniard | 10 | 0.2% |
| Subsaharan African | 41 | 0.7% |
| Swedish | 48 | 0.8% |
| Swiss | 13 | 0.2% |
| Syrian | 3 | 0.1% |
| Ukrainian | 9 | 0.2% |
| Welsh | 48 | 0.8% |
| Zimbabwean | 3 | 0.1% | View All 58 Rows |
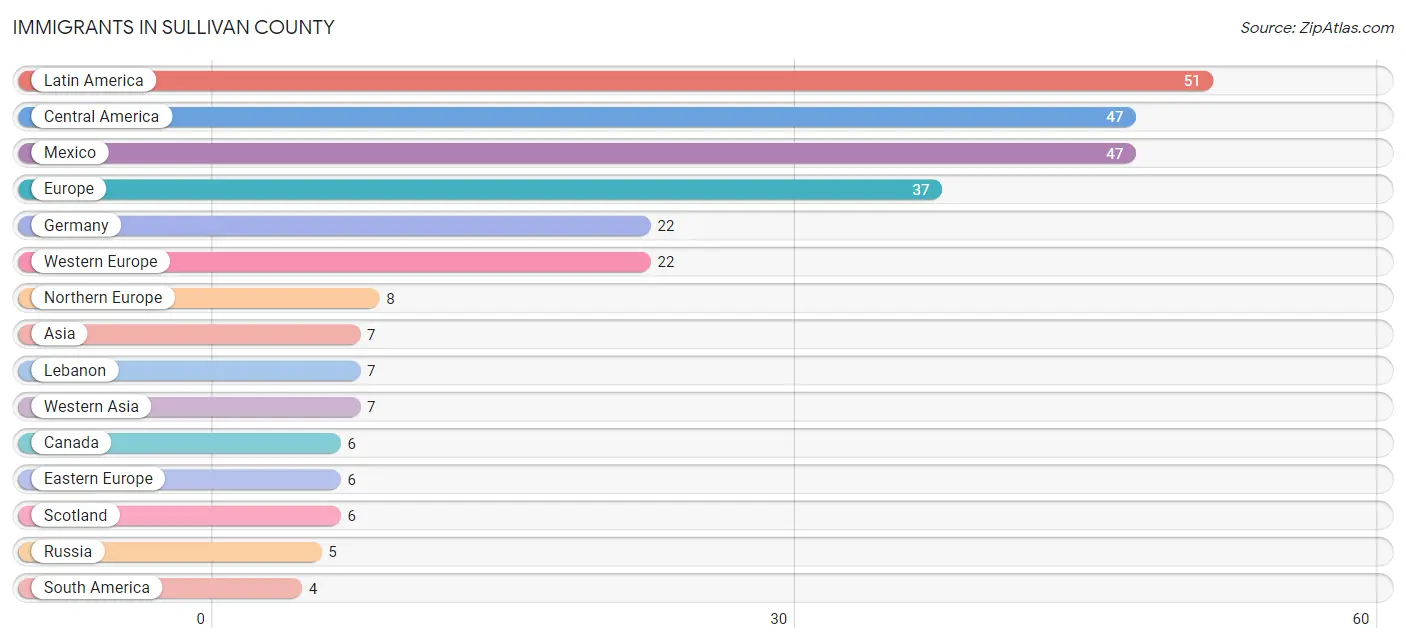
Immigrants in Sullivan County
The most numerous immigrant groups reported in Sullivan County came from Latin America (51 | 0.9%), Central America (47 | 0.8%), Mexico (47 | 0.8%), Europe (37 | 0.6%), and Germany (22 | 0.4%), together accounting for 3.5% of all Sullivan County residents.
| Immigration Origin | # Population | % Population |
| Asia | 7 | 0.1% |
| Bolivia | 1 | 0.0% |
| Canada | 6 | 0.1% |
| Central America | 47 | 0.8% |
| Colombia | 2 | 0.0% |
| Eastern Europe | 6 | 0.1% |
| Ecuador | 1 | 0.0% |
| England | 2 | 0.0% |
| Europe | 37 | 0.6% |
| Germany | 22 | 0.4% |
| Hungary | 1 | 0.0% |
| Italy | 1 | 0.0% |
| Latin America | 51 | 0.9% |
| Lebanon | 7 | 0.1% |
| Mexico | 47 | 0.8% |
| Northern Europe | 8 | 0.1% |
| Russia | 5 | 0.1% |
| Scotland | 6 | 0.1% |
| South America | 4 | 0.1% |
| Southern Europe | 1 | 0.0% |
| Western Asia | 7 | 0.1% |
| Western Europe | 22 | 0.4% | View All 22 Rows |
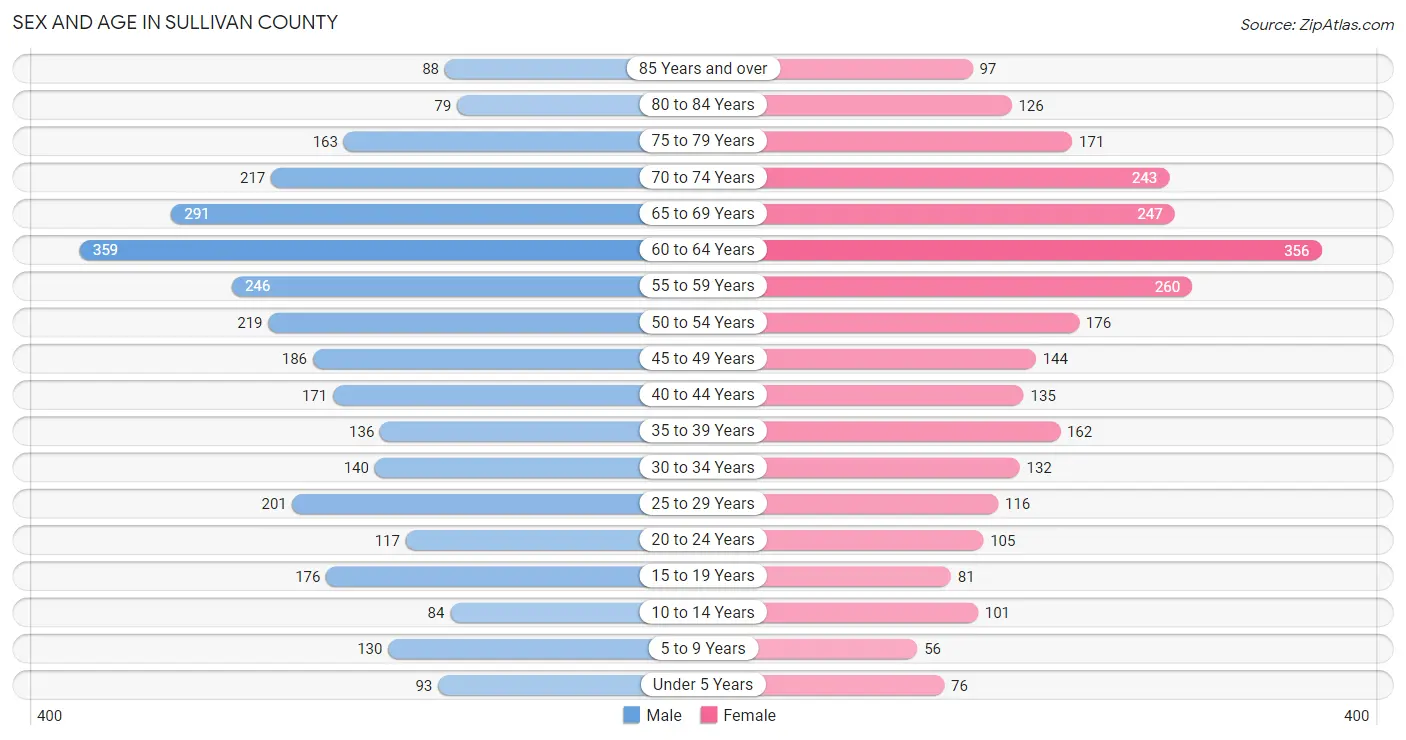
Sex and Age in Sullivan County
Sex and Age in Sullivan County
The most populous age groups in Sullivan County are 60 to 64 Years (359 | 11.6%) for men and 60 to 64 Years (356 | 12.8%) for women.
| Age Bracket | Male | Female |
| Under 5 Years | 93 (3.0%) | 76 (2.7%) |
| 5 to 9 Years | 130 (4.2%) | 56 (2.0%) |
| 10 to 14 Years | 84 (2.7%) | 101 (3.6%) |
| 15 to 19 Years | 176 (5.7%) | 81 (2.9%) |
| 20 to 24 Years | 117 (3.8%) | 105 (3.8%) |
| 25 to 29 Years | 201 (6.5%) | 116 (4.2%) |
| 30 to 34 Years | 140 (4.5%) | 132 (4.7%) |
| 35 to 39 Years | 136 (4.4%) | 162 (5.8%) |
| 40 to 44 Years | 171 (5.5%) | 135 (4.9%) |
| 45 to 49 Years | 186 (6.0%) | 144 (5.2%) |
| 50 to 54 Years | 219 (7.1%) | 176 (6.3%) |
| 55 to 59 Years | 246 (8.0%) | 260 (9.3%) |
| 60 to 64 Years | 359 (11.6%) | 356 (12.8%) |
| 65 to 69 Years | 291 (9.4%) | 247 (8.9%) |
| 70 to 74 Years | 217 (7.0%) | 243 (8.7%) |
| 75 to 79 Years | 163 (5.3%) | 171 (6.1%) |
| 80 to 84 Years | 79 (2.5%) | 126 (4.5%) |
| 85 Years and over | 88 (2.8%) | 97 (3.5%) |
| Total | 3,096 (100.0%) | 2,784 (100.0%) |
Families and Households in Sullivan County
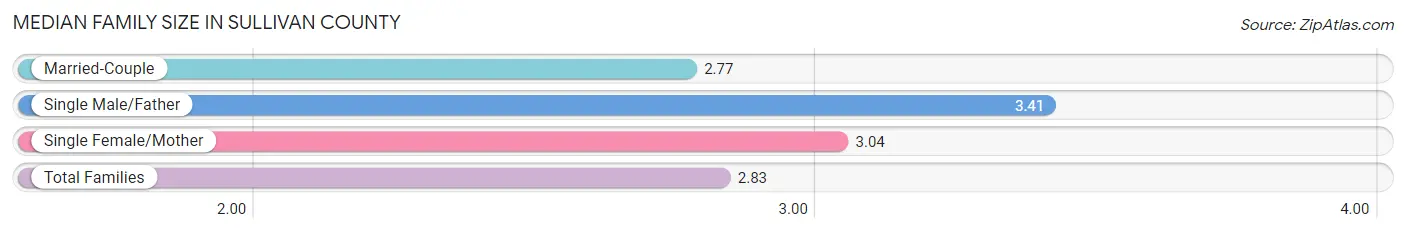
Median Family Size in Sullivan County
The median family size in Sullivan County is 2.83 persons per family, with single male/father families (82 | 5.5%) accounting for the largest median family size of 3.41 persons per family. On the other hand, married-couple families (1,255 | 83.9%) represent the smallest median family size with 2.77 persons per family.
| Family Type | # Families | Family Size |
| Married-Couple | 1,255 (83.9%) | 2.77 |
| Single Male/Father | 82 (5.5%) | 3.41 |
| Single Female/Mother | 159 (10.6%) | 3.04 |
| Total Families | 1,496 (100.0%) | 2.83 |
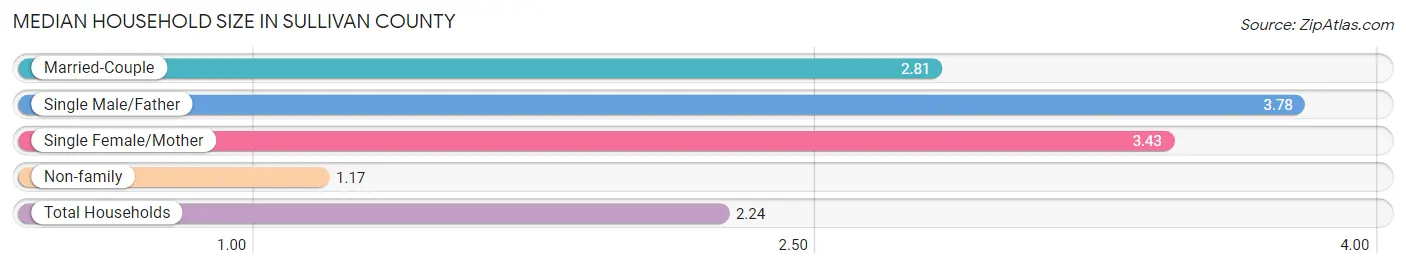
Median Household Size in Sullivan County
The median household size in Sullivan County is 2.24 persons per household, with single male/father households (82 | 3.3%) accounting for the largest median household size of 3.78 persons per household. non-family households (966 | 39.2%) represent the smallest median household size with 1.17 persons per household.
| Household Type | # Households | Household Size |
| Married-Couple | 1,255 (51.0%) | 2.81 |
| Single Male/Father | 82 (3.3%) | 3.78 |
| Single Female/Mother | 159 (6.5%) | 3.43 |
| Non-family | 966 (39.2%) | 1.17 |
| Total Households | 2,462 (100.0%) | 2.24 |
Household Size by Marriage Status in Sullivan County
Out of a total of 2,462 households in Sullivan County, 1,496 (60.8%) are family households, while 966 (39.2%) are nonfamily households. The most numerous type of family households are 2-person households, comprising 917, and the most common type of nonfamily households are 1-person households, comprising 849.
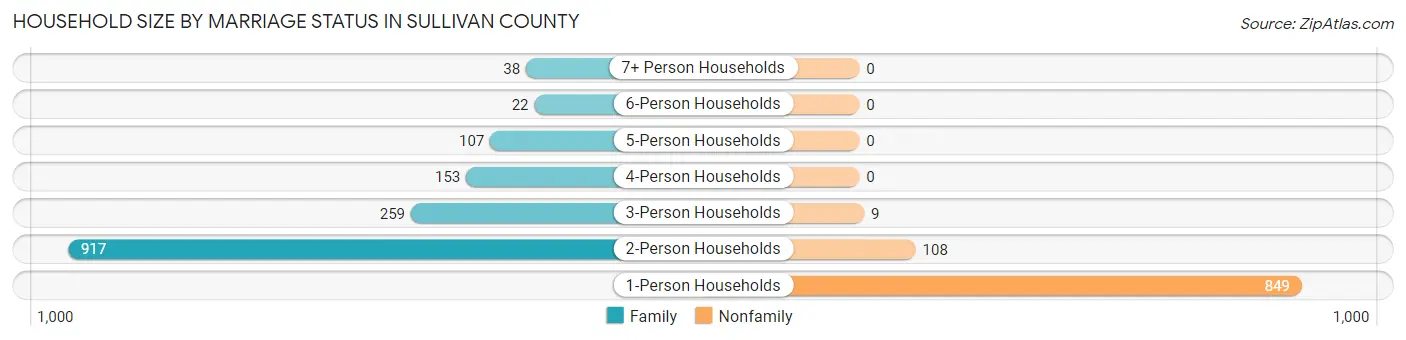
| Household Size | Family Households | Nonfamily Households |
| 1-Person Households | - | 849 (34.5%) |
| 2-Person Households | 917 (37.2%) | 108 (4.4%) |
| 3-Person Households | 259 (10.5%) | 9 (0.4%) |
| 4-Person Households | 153 (6.2%) | 0 (0.0%) |
| 5-Person Households | 107 (4.3%) | 0 (0.0%) |
| 6-Person Households | 22 (0.9%) | 0 (0.0%) |
| 7+ Person Households | 38 (1.5%) | 0 (0.0%) |
| Total | 1,496 (60.8%) | 966 (39.2%) |
Female Fertility in Sullivan County
Fertility by Age in Sullivan County
Average fertility rate in Sullivan County is 112.0 births per 1,000 women. Women in the age bracket of 20 to 34 years have the highest fertility rate with 238.0 births per 1,000 women. Women in the age bracket of 20 to 34 years acount for 84.0% of all women with births.
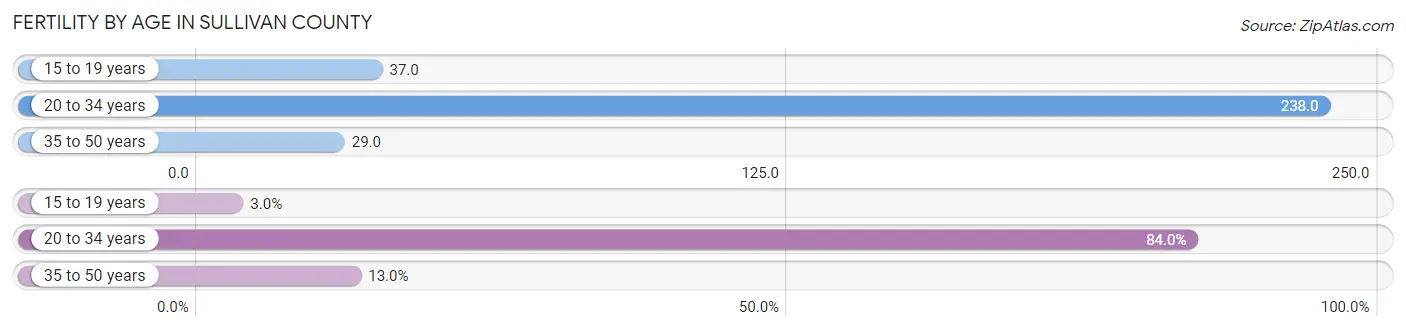
| Age Bracket | Women with Births | Births / 1,000 Women |
| 15 to 19 years | 3 (3.0%) | 37.0 |
| 20 to 34 years | 84 (84.0%) | 238.0 |
| 35 to 50 years | 13 (13.0%) | 29.0 |
| Total | 100 (100.0%) | 112.0 |
Fertility by Age by Marriage Status in Sullivan County
58.0% of women with births (100) in Sullivan County are married. The highest percentage of unmarried women with births falls into 15 to 19 years age bracket with 100.0% of them unmarried at the time of birth, while the lowest percentage of unmarried women with births belong to 35 to 50 years age bracket with 30.8% of them unmarried.
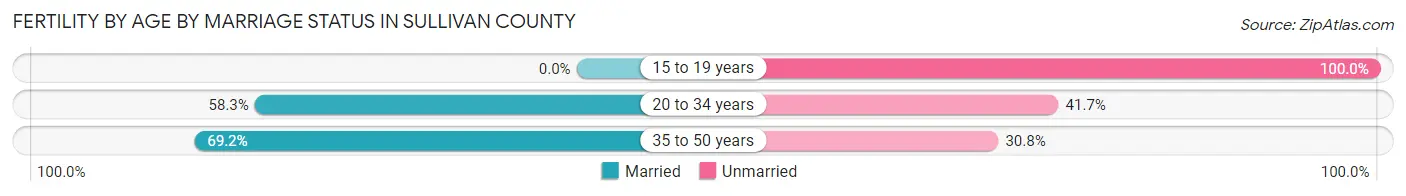
| Age Bracket | Married | Unmarried |
| 15 to 19 years | 0 (0.0%) | 3 (100.0%) |
| 20 to 34 years | 49 (58.3%) | 35 (41.7%) |
| 35 to 50 years | 9 (69.2%) | 4 (30.8%) |
| Total | 58 (58.0%) | 42 (42.0%) |
Fertility by Education in Sullivan County
Average fertility rate in Sullivan County is 112.0 births per 1,000 women. Women with the education attainment of graduate degree have the highest fertility rate of 191.0 births per 1,000 women, while women with the education attainment of high school diploma have the lowest fertility at 80.0 births per 1,000 women. Women with the education attainment of college or associate's degree represent 34.0% of all women with births.
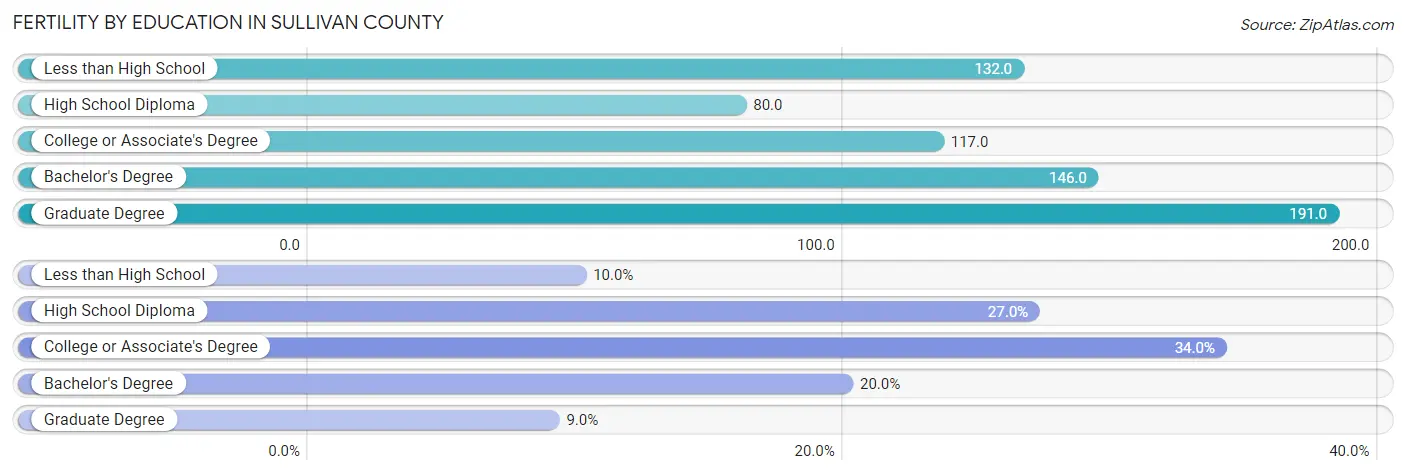
| Educational Attainment | Women with Births | Births / 1,000 Women |
| Less than High School | 10 (10.0%) | 132.0 |
| High School Diploma | 27 (27.0%) | 80.0 |
| College or Associate's Degree | 34 (34.0%) | 117.0 |
| Bachelor's Degree | 20 (20.0%) | 146.0 |
| Graduate Degree | 9 (9.0%) | 191.0 |
| Total | 100 (100.0%) | 112.0 |
Fertility by Education by Marriage Status in Sullivan County
42.0% of women with births in Sullivan County are unmarried. Women with the educational attainment of graduate degree are most likely to be married with 100.0% of them married at childbirth, while women with the educational attainment of high school diploma are least likely to be married with 92.6% of them unmarried at childbirth.
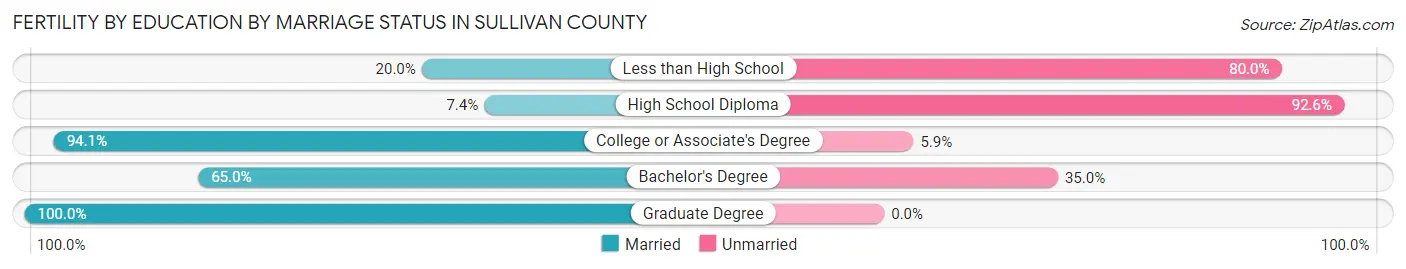
| Educational Attainment | Married | Unmarried |
| Less than High School | 2 (20.0%) | 8 (80.0%) |
| High School Diploma | 2 (7.4%) | 25 (92.6%) |
| College or Associate's Degree | 32 (94.1%) | 2 (5.9%) |
| Bachelor's Degree | 13 (65.0%) | 7 (35.0%) |
| Graduate Degree | 9 (100.0%) | 0 (0.0%) |
| Total | 58 (58.0%) | 42 (42.0%) |
Employment Characteristics in Sullivan County
Employment by Class of Employer in Sullivan County
Among the 2,507 employed individuals in Sullivan County, private company employees (1,590 | 63.4%), local government employees (227 | 9.0%), and not-for-profit organizations (195 | 7.8%) make up the most common classes of employment.
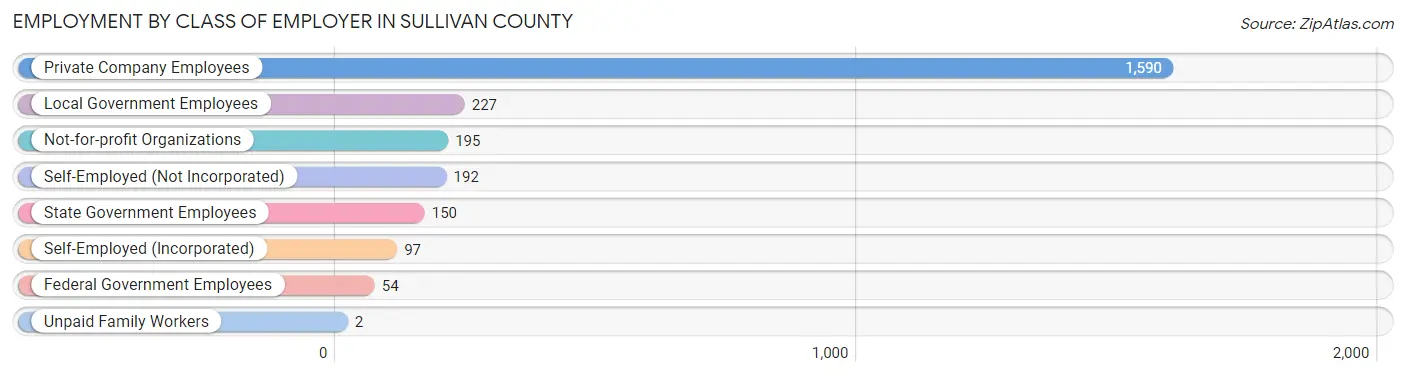
| Employer Class | # Employees | % Employees |
| Private Company Employees | 1,590 | 63.4% |
| Self-Employed (Incorporated) | 97 | 3.9% |
| Self-Employed (Not Incorporated) | 192 | 7.7% |
| Not-for-profit Organizations | 195 | 7.8% |
| Local Government Employees | 227 | 9.0% |
| State Government Employees | 150 | 6.0% |
| Federal Government Employees | 54 | 2.1% |
| Unpaid Family Workers | 2 | 0.1% |
| Total | 2,507 | 100.0% |
Employment Status by Age in Sullivan County
According to the labor force statistics for Sullivan County, out of the total population over 16 years of age (5,314), 50.8% or 2,700 individuals are in the labor force, with 5.5% or 148 of them unemployed. The age group with the highest labor force participation rate is 35 to 44 years, with 87.3% or 527 individuals in the labor force. Within the labor force, the 20 to 24 years age range has the highest percentage of unemployed individuals, with 17.1% or 29 of them being unemployed.
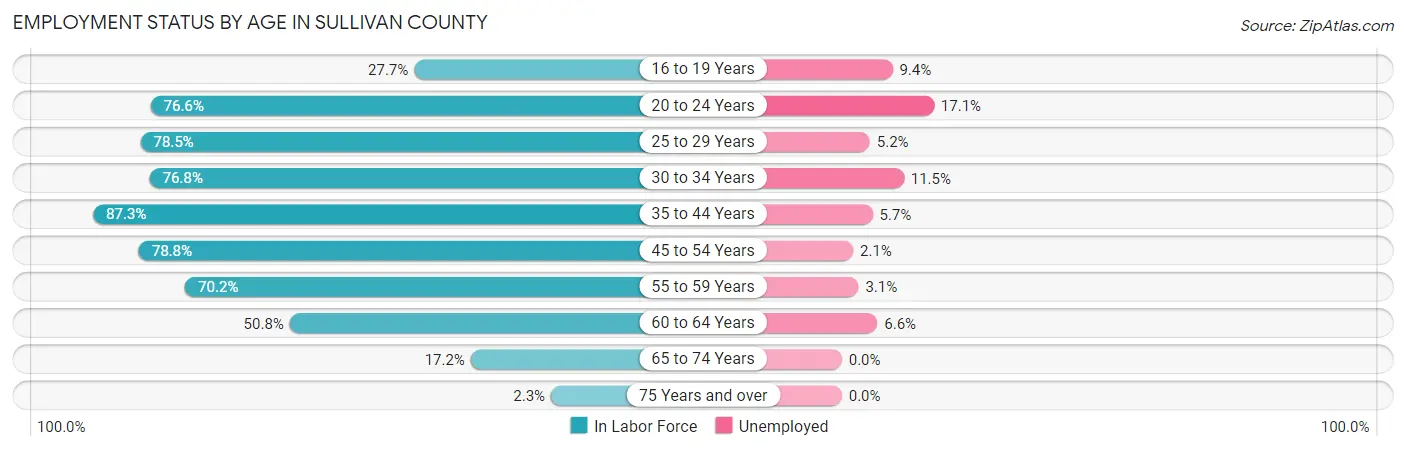
| Age Bracket | In Labor Force | Unemployed |
| 16 to 19 Years | 64 (27.7%) | 6 (9.4%) |
| 20 to 24 Years | 170 (76.6%) | 29 (17.1%) |
| 25 to 29 Years | 249 (78.5%) | 13 (5.2%) |
| 30 to 34 Years | 209 (76.8%) | 24 (11.5%) |
| 35 to 44 Years | 527 (87.3%) | 30 (5.7%) |
| 45 to 54 Years | 571 (78.8%) | 12 (2.1%) |
| 55 to 59 Years | 355 (70.2%) | 11 (3.1%) |
| 60 to 64 Years | 363 (50.8%) | 24 (6.6%) |
| 65 to 74 Years | 172 (17.2%) | 0 (0.0%) |
| 75 Years and over | 17 (2.3%) | 0 (0.0%) |
| Total | 2,700 (50.8%) | 148 (5.5%) |
Employment Status by Educational Attainment in Sullivan County
According to labor force statistics for Sullivan County, 72.4% of individuals (2,273) out of the total population between 25 and 64 years of age (3,139) are in the labor force, with 5.0% or 114 of them being unemployed. The group with the highest labor force participation rate are those with the educational attainment of college / associate degree, with 79.7% or 611 individuals in the labor force. Within the labor force, individuals with less than high school education have the highest percentage of unemployment, with 27.1% or 45 of them being unemployed.
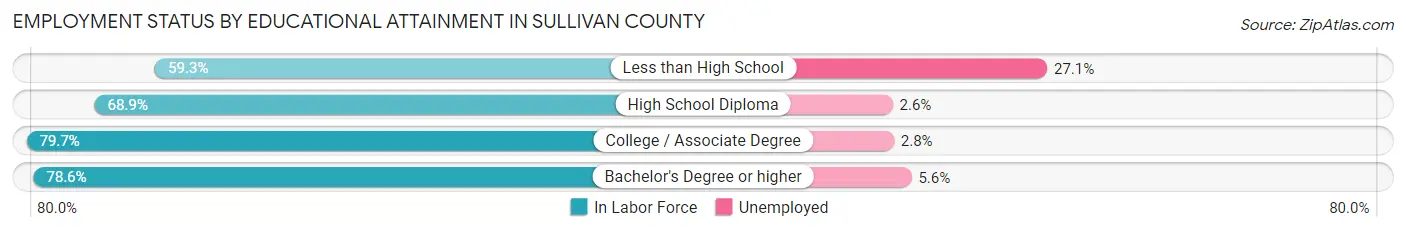
| Educational Attainment | In Labor Force | Unemployed |
| Less than High School | 166 (59.3%) | 76 (27.1%) |
| High School Diploma | 1,048 (68.9%) | 40 (2.6%) |
| College / Associate Degree | 611 (79.7%) | 21 (2.8%) |
| Bachelor's Degree or higher | 449 (78.6%) | 32 (5.6%) |
| Total | 2,273 (72.4%) | 157 (5.0%) |
Employment Occupations by Sex in Sullivan County
Management, Business, Science and Arts Occupations
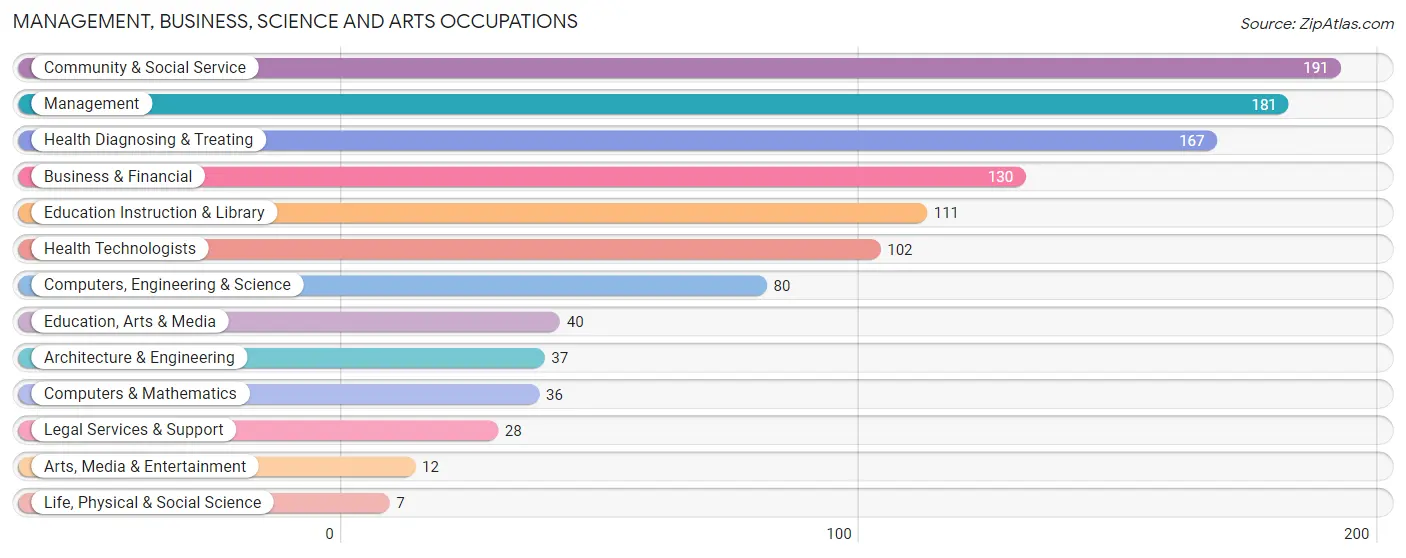
The most common Management, Business, Science and Arts occupations in Sullivan County are Community & Social Service (191 | 7.5%), Management (181 | 7.1%), Health Diagnosing & Treating (167 | 6.6%), Business & Financial (130 | 5.1%), and Education Instruction & Library (111 | 4.4%).
Management, Business, Science and Arts Occupations by Sex
Within the Management, Business, Science and Arts occupations in Sullivan County, the most male-oriented occupations are Architecture & Engineering (78.4%), Management (73.5%), and Computers, Engineering & Science (72.5%), while the most female-oriented occupations are Health Technologists (94.1%), Health Diagnosing & Treating (92.2%), and Education Instruction & Library (91.9%).
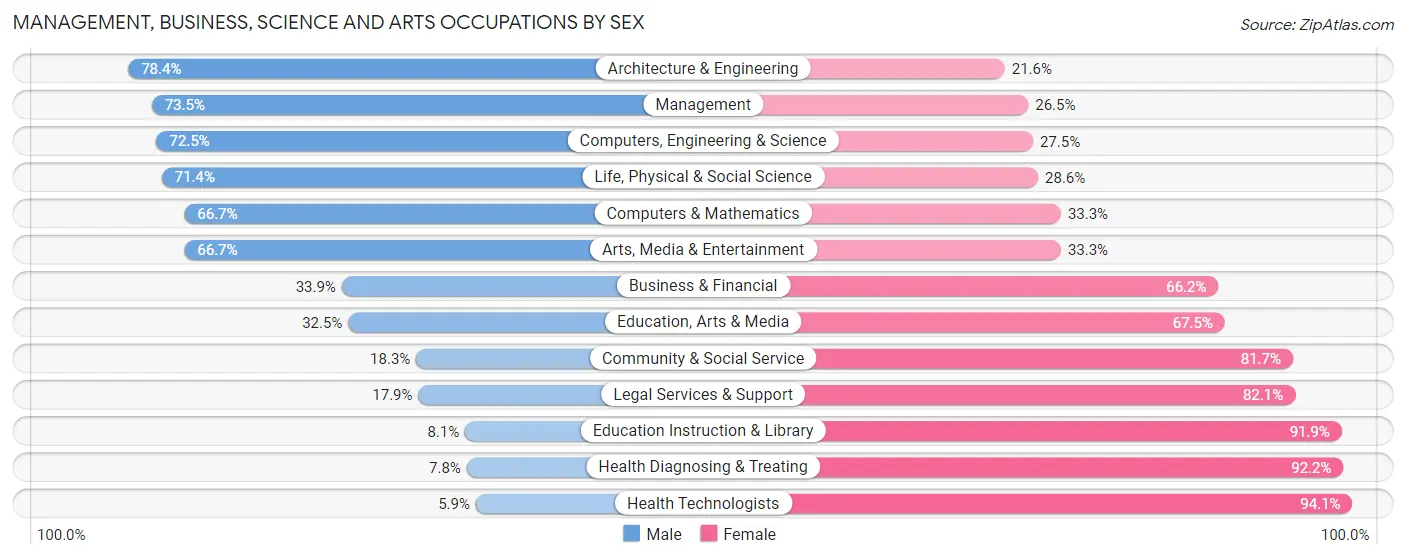
| Occupation | Male | Female |
| Management | 133 (73.5%) | 48 (26.5%) |
| Business & Financial | 44 (33.9%) | 86 (66.1%) |
| Computers, Engineering & Science | 58 (72.5%) | 22 (27.5%) |
| Computers & Mathematics | 24 (66.7%) | 12 (33.3%) |
| Architecture & Engineering | 29 (78.4%) | 8 (21.6%) |
| Life, Physical & Social Science | 5 (71.4%) | 2 (28.6%) |
| Community & Social Service | 35 (18.3%) | 156 (81.7%) |
| Education, Arts & Media | 13 (32.5%) | 27 (67.5%) |
| Legal Services & Support | 5 (17.9%) | 23 (82.1%) |
| Education Instruction & Library | 9 (8.1%) | 102 (91.9%) |
| Arts, Media & Entertainment | 8 (66.7%) | 4 (33.3%) |
| Health Diagnosing & Treating | 13 (7.8%) | 154 (92.2%) |
| Health Technologists | 6 (5.9%) | 96 (94.1%) |
| Total (Category) | 283 (37.8%) | 466 (62.2%) |
| Total (Overall) | 1,344 (52.7%) | 1,204 (47.2%) |
Services Occupations
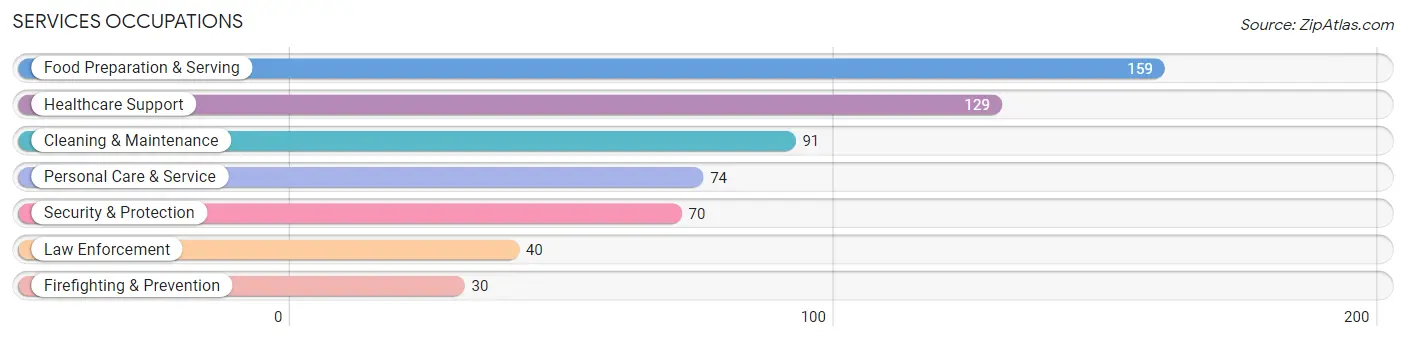
The most common Services occupations in Sullivan County are Food Preparation & Serving (159 | 6.2%), Healthcare Support (129 | 5.1%), Cleaning & Maintenance (91 | 3.6%), Personal Care & Service (74 | 2.9%), and Security & Protection (70 | 2.8%).
Services Occupations by Sex
Within the Services occupations in Sullivan County, the most male-oriented occupations are Law Enforcement (100.0%), Security & Protection (82.9%), and Cleaning & Maintenance (70.3%), while the most female-oriented occupations are Healthcare Support (99.2%), Food Preparation & Serving (81.8%), and Personal Care & Service (62.2%).
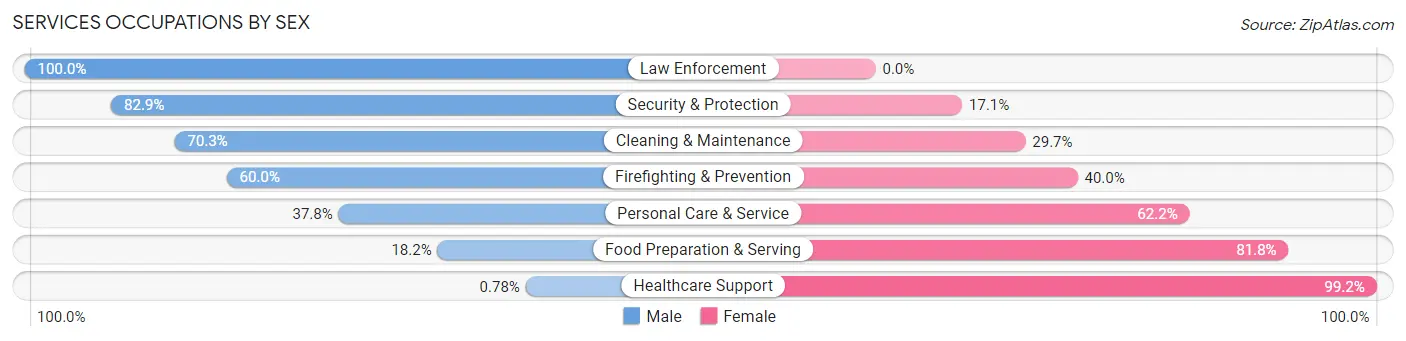
| Occupation | Male | Female |
| Healthcare Support | 1 (0.8%) | 128 (99.2%) |
| Security & Protection | 58 (82.9%) | 12 (17.1%) |
| Firefighting & Prevention | 18 (60.0%) | 12 (40.0%) |
| Law Enforcement | 40 (100.0%) | 0 (0.0%) |
| Food Preparation & Serving | 29 (18.2%) | 130 (81.8%) |
| Cleaning & Maintenance | 64 (70.3%) | 27 (29.7%) |
| Personal Care & Service | 28 (37.8%) | 46 (62.2%) |
| Total (Category) | 180 (34.4%) | 343 (65.6%) |
| Total (Overall) | 1,344 (52.7%) | 1,204 (47.2%) |
Sales and Office Occupations
The most common Sales and Office occupations in Sullivan County are Office & Administration (204 | 8.0%), and Sales & Related (143 | 5.6%).

Sales and Office Occupations by Sex

| Occupation | Male | Female |
| Sales & Related | 48 (33.6%) | 95 (66.4%) |
| Office & Administration | 33 (16.2%) | 171 (83.8%) |
| Total (Category) | 81 (23.3%) | 266 (76.7%) |
| Total (Overall) | 1,344 (52.7%) | 1,204 (47.2%) |
Natural Resources, Construction and Maintenance Occupations
The most common Natural Resources, Construction and Maintenance occupations in Sullivan County are Construction & Extraction (208 | 8.2%), Installation, Maintenance & Repair (176 | 6.9%), and Farming, Fishing & Forestry (93 | 3.6%).
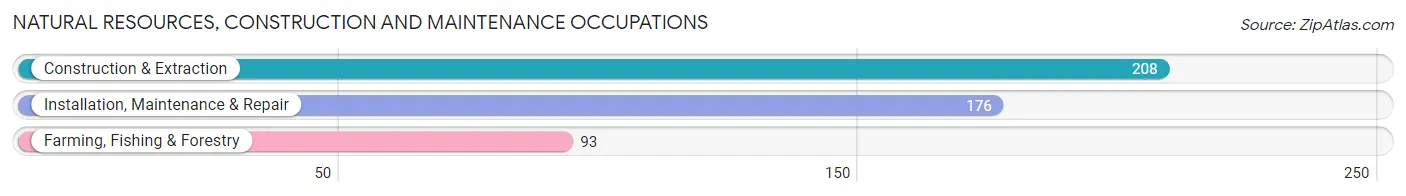
Natural Resources, Construction and Maintenance Occupations by Sex
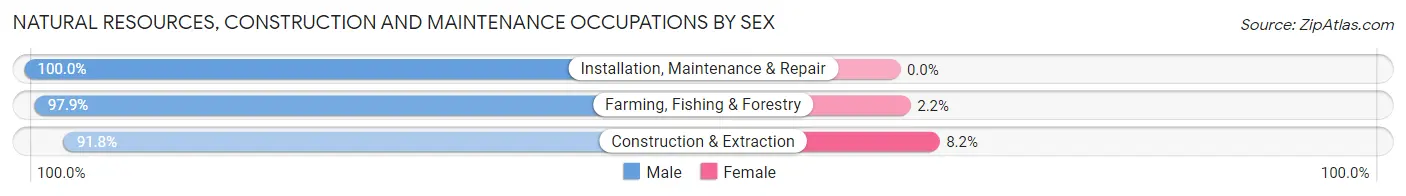
| Occupation | Male | Female |
| Farming, Fishing & Forestry | 91 (97.9%) | 2 (2.1%) |
| Construction & Extraction | 191 (91.8%) | 17 (8.2%) |
| Installation, Maintenance & Repair | 176 (100.0%) | 0 (0.0%) |
| Total (Category) | 458 (96.0%) | 19 (4.0%) |
| Total (Overall) | 1,344 (52.7%) | 1,204 (47.2%) |
Production, Transportation and Moving Occupations
The most common Production, Transportation and Moving occupations in Sullivan County are Production (165 | 6.5%), Transportation (160 | 6.3%), and Material Moving (127 | 5.0%).
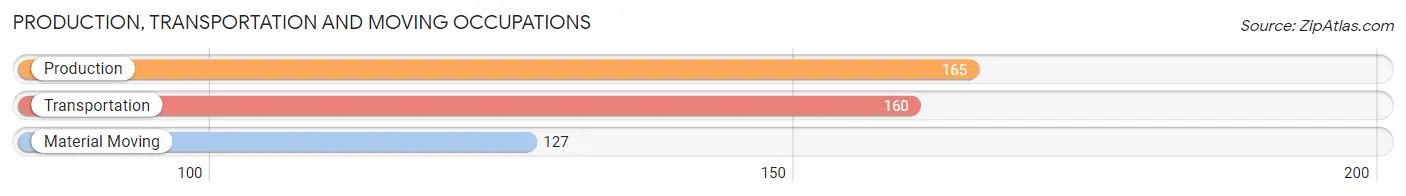
Production, Transportation and Moving Occupations by Sex
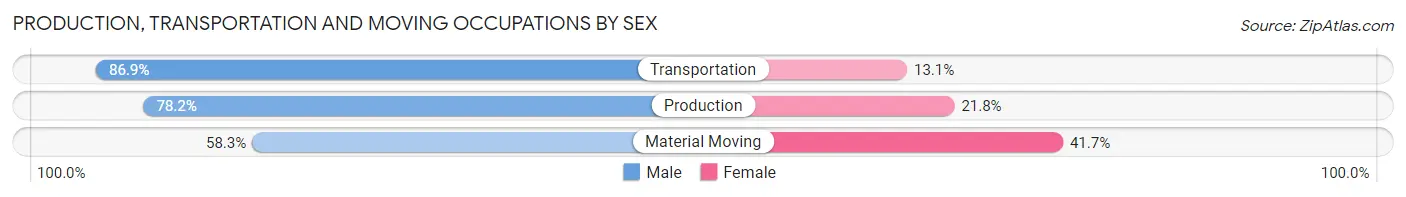
| Occupation | Male | Female |
| Production | 129 (78.2%) | 36 (21.8%) |
| Transportation | 139 (86.9%) | 21 (13.1%) |
| Material Moving | 74 (58.3%) | 53 (41.7%) |
| Total (Category) | 342 (75.7%) | 110 (24.3%) |
| Total (Overall) | 1,344 (52.7%) | 1,204 (47.2%) |
Employment Industries by Sex in Sullivan County
Employment Industries in Sullivan County
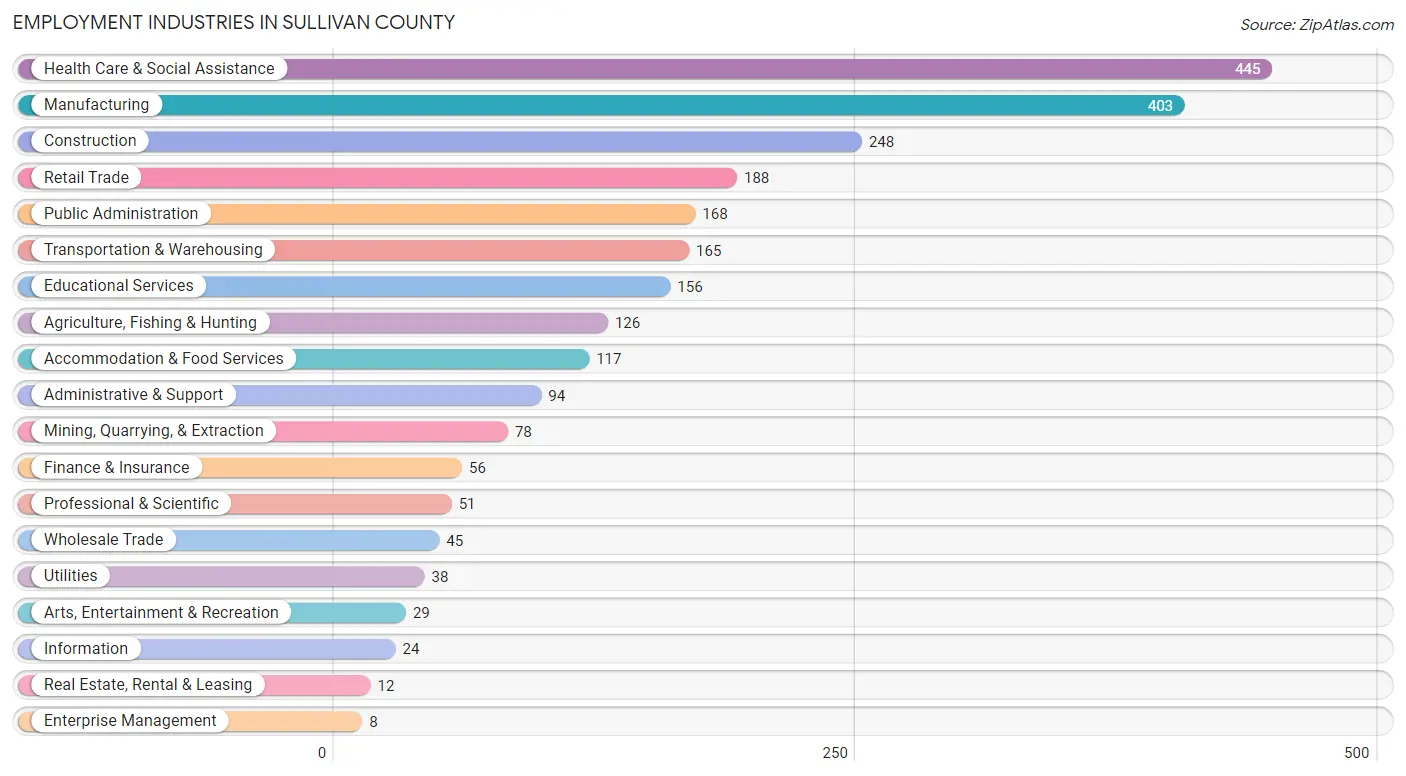
The major employment industries in Sullivan County include Health Care & Social Assistance (445 | 17.5%), Manufacturing (403 | 15.8%), Construction (248 | 9.7%), Retail Trade (188 | 7.4%), and Public Administration (168 | 6.6%).
Employment Industries by Sex in Sullivan County
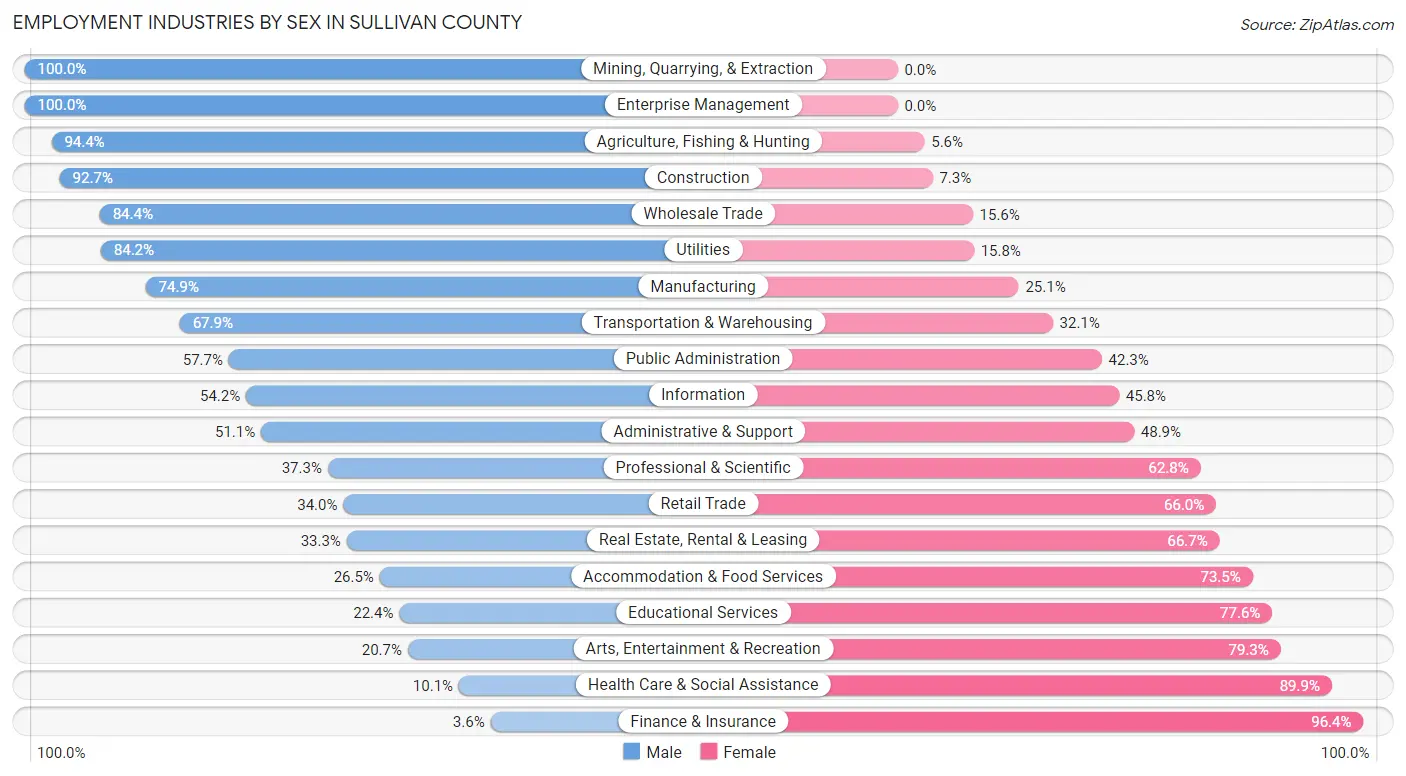
The Sullivan County industries that see more men than women are Mining, Quarrying, & Extraction (100.0%), Enterprise Management (100.0%), and Agriculture, Fishing & Hunting (94.4%), whereas the industries that tend to have a higher number of women are Finance & Insurance (96.4%), Health Care & Social Assistance (89.9%), and Arts, Entertainment & Recreation (79.3%).
| Industry | Male | Female |
| Agriculture, Fishing & Hunting | 119 (94.4%) | 7 (5.6%) |
| Mining, Quarrying, & Extraction | 78 (100.0%) | 0 (0.0%) |
| Construction | 230 (92.7%) | 18 (7.3%) |
| Manufacturing | 302 (74.9%) | 101 (25.1%) |
| Wholesale Trade | 38 (84.4%) | 7 (15.6%) |
| Retail Trade | 64 (34.0%) | 124 (66.0%) |
| Transportation & Warehousing | 112 (67.9%) | 53 (32.1%) |
| Utilities | 32 (84.2%) | 6 (15.8%) |
| Information | 13 (54.2%) | 11 (45.8%) |
| Finance & Insurance | 2 (3.6%) | 54 (96.4%) |
| Real Estate, Rental & Leasing | 4 (33.3%) | 8 (66.7%) |
| Professional & Scientific | 19 (37.2%) | 32 (62.7%) |
| Enterprise Management | 8 (100.0%) | 0 (0.0%) |
| Administrative & Support | 48 (51.1%) | 46 (48.9%) |
| Educational Services | 35 (22.4%) | 121 (77.6%) |
| Health Care & Social Assistance | 45 (10.1%) | 400 (89.9%) |
| Arts, Entertainment & Recreation | 6 (20.7%) | 23 (79.3%) |
| Accommodation & Food Services | 31 (26.5%) | 86 (73.5%) |
| Public Administration | 97 (57.7%) | 71 (42.3%) |
| Total | 1,344 (52.7%) | 1,204 (47.2%) |
Education in Sullivan County
School Enrollment in Sullivan County
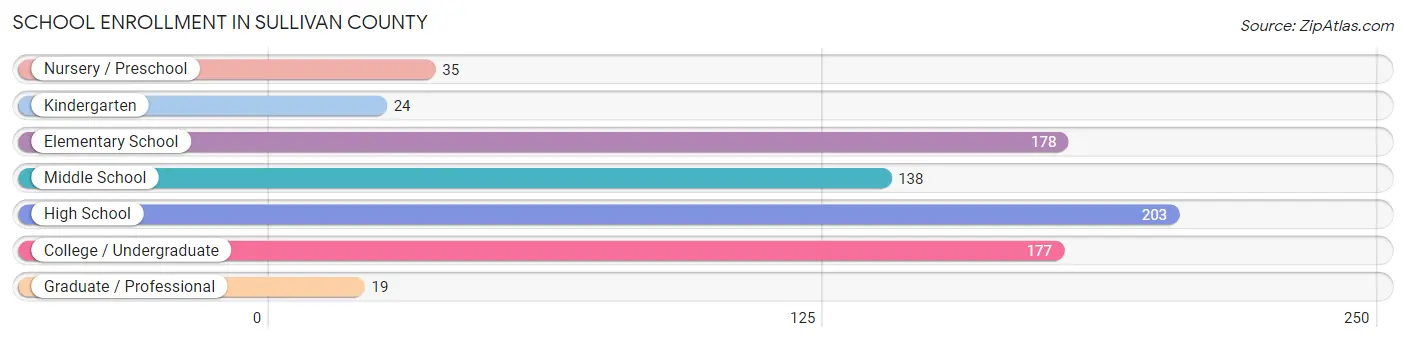
The most common levels of schooling among the 774 students in Sullivan County are high school (203 | 26.2%), elementary school (178 | 23.0%), and college / undergraduate (177 | 22.9%).
| School Level | # Students | % Students |
| Nursery / Preschool | 35 | 4.5% |
| Kindergarten | 24 | 3.1% |
| Elementary School | 178 | 23.0% |
| Middle School | 138 | 17.8% |
| High School | 203 | 26.2% |
| College / Undergraduate | 177 | 22.9% |
| Graduate / Professional | 19 | 2.5% |
| Total | 774 | 100.0% |
School Enrollment by Age by Funding Source in Sullivan County
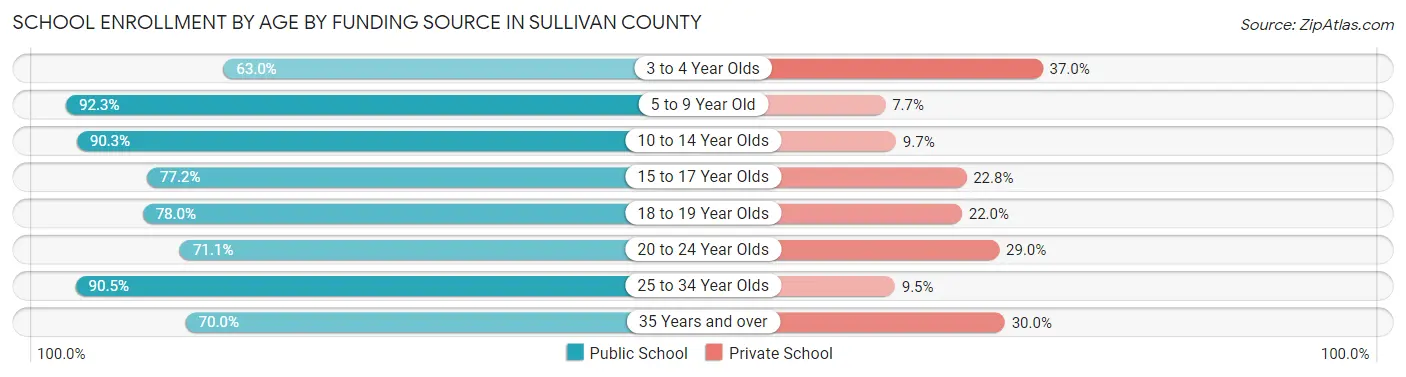
Out of a total of 774 students who are enrolled in schools in Sullivan County, 137 (17.7%) attend a private institution, while the remaining 637 (82.3%) are enrolled in public schools. The age group of 3 to 4 year olds has the highest likelihood of being enrolled in private schools, with 10 (37.0% in the age bracket) enrolled. Conversely, the age group of 5 to 9 year old has the lowest likelihood of being enrolled in a private school, with 155 (92.3% in the age bracket) attending a public institution.
| Age Bracket | Public School | Private School |
| 3 to 4 Year Olds | 17 (63.0%) | 10 (37.0%) |
| 5 to 9 Year Old | 155 (92.3%) | 13 (7.7%) |
| 10 to 14 Year Olds | 167 (90.3%) | 18 (9.7%) |
| 15 to 17 Year Olds | 98 (77.2%) | 29 (22.8%) |
| 18 to 19 Year Olds | 78 (78.0%) | 22 (22.0%) |
| 20 to 24 Year Olds | 54 (71.1%) | 22 (28.9%) |
| 25 to 34 Year Olds | 19 (90.5%) | 2 (9.5%) |
| 35 Years and over | 49 (70.0%) | 21 (30.0%) |
| Total | 637 (82.3%) | 137 (17.7%) |
Educational Attainment by Field of Study in Sullivan County
Education (222 | 22.1%), business (167 | 16.6%), science & technology (119 | 11.8%), social sciences (106 | 10.5%), and bio, nature & agricultural (103 | 10.2%) are the most common fields of study among 1,006 individuals in Sullivan County who have obtained a bachelor's degree or higher.
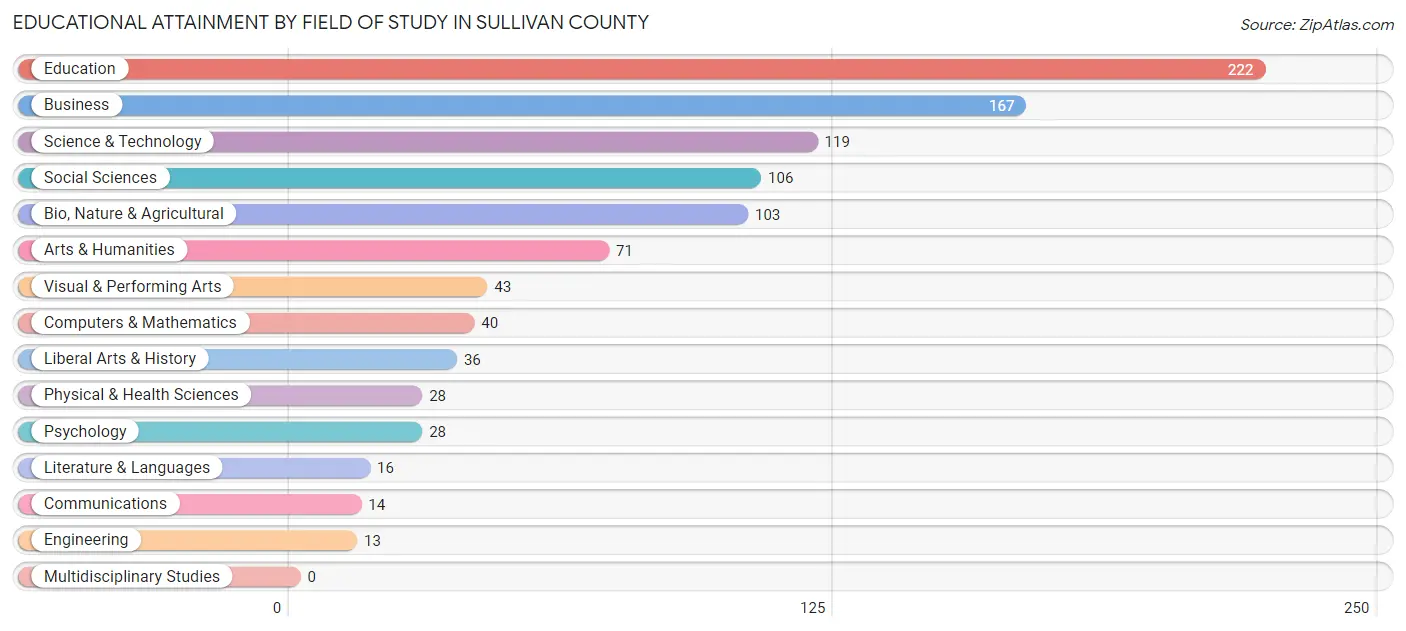
| Field of Study | # Graduates | % Graduates |
| Computers & Mathematics | 40 | 4.0% |
| Bio, Nature & Agricultural | 103 | 10.2% |
| Physical & Health Sciences | 28 | 2.8% |
| Psychology | 28 | 2.8% |
| Social Sciences | 106 | 10.5% |
| Engineering | 13 | 1.3% |
| Multidisciplinary Studies | 0 | 0.0% |
| Science & Technology | 119 | 11.8% |
| Business | 167 | 16.6% |
| Education | 222 | 22.1% |
| Literature & Languages | 16 | 1.6% |
| Liberal Arts & History | 36 | 3.6% |
| Visual & Performing Arts | 43 | 4.3% |
| Communications | 14 | 1.4% |
| Arts & Humanities | 71 | 7.1% |
| Total | 1,006 | 100.0% |
Transportation & Commute in Sullivan County
Vehicle Availability by Sex in Sullivan County
The most prevalent vehicle ownership categories in Sullivan County are males with 2 vehicles (522, accounting for 42.1%) and females with 2 vehicles (421, making up 44.3%).
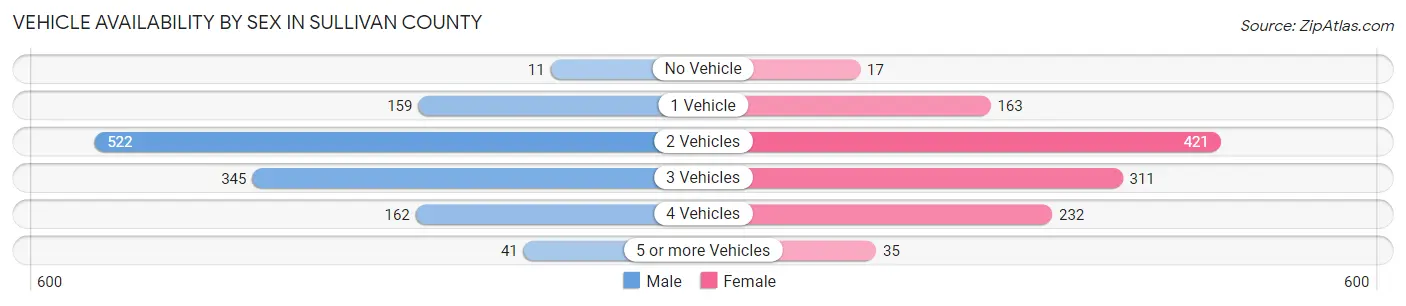
| Vehicles Available | Male | Female |
| No Vehicle | 11 (0.9%) | 17 (1.4%) |
| 1 Vehicle | 159 (12.8%) | 163 (13.8%) |
| 2 Vehicles | 522 (42.1%) | 421 (35.7%) |
| 3 Vehicles | 345 (27.8%) | 311 (26.4%) |
| 4 Vehicles | 162 (13.1%) | 232 (19.7%) |
| 5 or more Vehicles | 41 (3.3%) | 35 (3.0%) |
| Total | 1,240 (100.0%) | 1,179 (100.0%) |
Commute Time in Sullivan County
The most frequently occuring commute durations in Sullivan County are 45 to 59 minutes (332 commuters, 14.1%), less than 5 minutes (281 commuters, 12.0%), and 30 to 34 minutes (279 commuters, 11.9%).
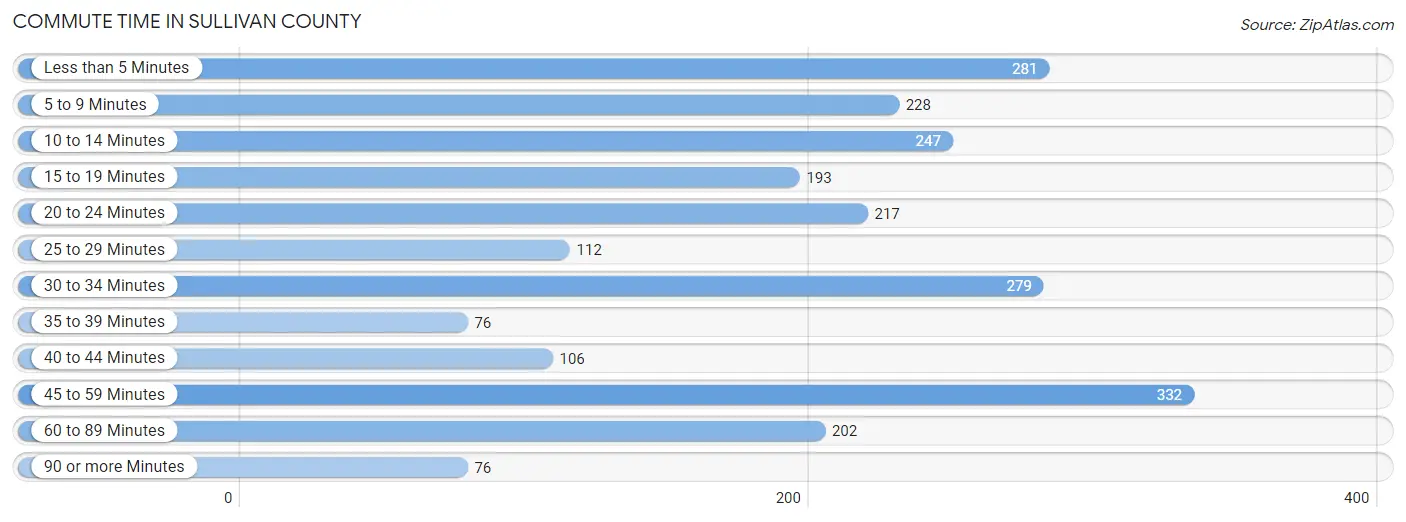
| Commute Time | # Commuters | % Commuters |
| Less than 5 Minutes | 281 | 12.0% |
| 5 to 9 Minutes | 228 | 9.7% |
| 10 to 14 Minutes | 247 | 10.5% |
| 15 to 19 Minutes | 193 | 8.2% |
| 20 to 24 Minutes | 217 | 9.2% |
| 25 to 29 Minutes | 112 | 4.8% |
| 30 to 34 Minutes | 279 | 11.9% |
| 35 to 39 Minutes | 76 | 3.2% |
| 40 to 44 Minutes | 106 | 4.5% |
| 45 to 59 Minutes | 332 | 14.1% |
| 60 to 89 Minutes | 202 | 8.6% |
| 90 or more Minutes | 76 | 3.2% |
Commute Time by Sex in Sullivan County
The most common commute times in Sullivan County are 45 to 59 minutes (206 commuters, 16.5%) for males and 10 to 14 minutes (132 commuters, 12.0%) for females.
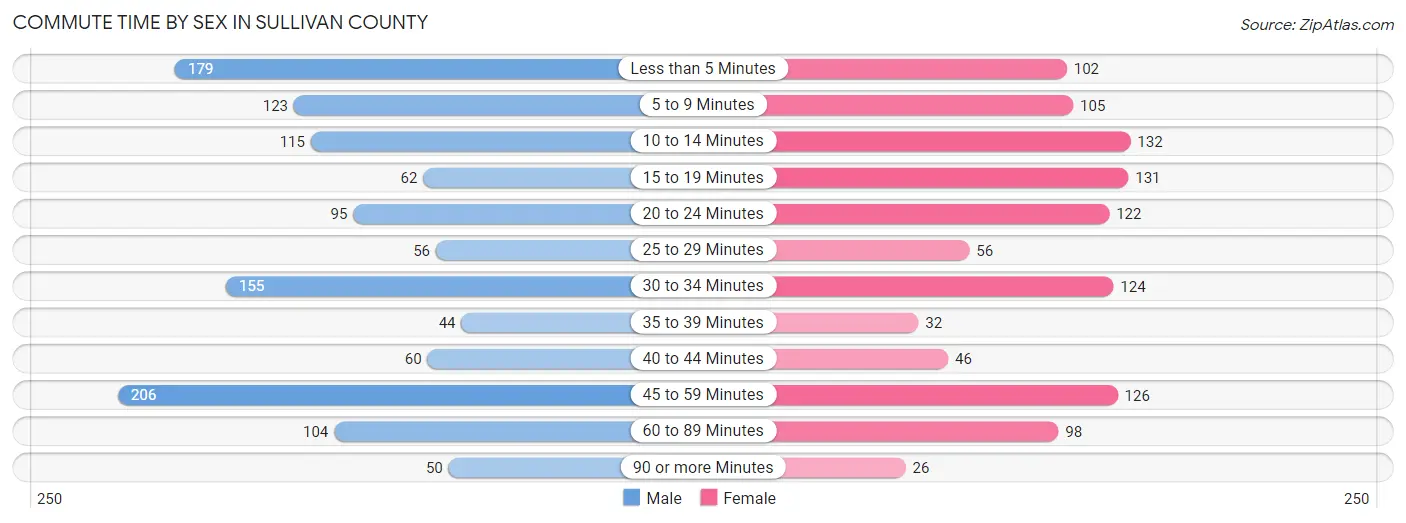
| Commute Time | Male | Female |
| Less than 5 Minutes | 179 (14.3%) | 102 (9.3%) |
| 5 to 9 Minutes | 123 (9.9%) | 105 (9.6%) |
| 10 to 14 Minutes | 115 (9.2%) | 132 (12.0%) |
| 15 to 19 Minutes | 62 (5.0%) | 131 (11.9%) |
| 20 to 24 Minutes | 95 (7.6%) | 122 (11.1%) |
| 25 to 29 Minutes | 56 (4.5%) | 56 (5.1%) |
| 30 to 34 Minutes | 155 (12.4%) | 124 (11.3%) |
| 35 to 39 Minutes | 44 (3.5%) | 32 (2.9%) |
| 40 to 44 Minutes | 60 (4.8%) | 46 (4.2%) |
| 45 to 59 Minutes | 206 (16.5%) | 126 (11.5%) |
| 60 to 89 Minutes | 104 (8.3%) | 98 (8.9%) |
| 90 or more Minutes | 50 (4.0%) | 26 (2.4%) |
Time of Departure to Work by Sex in Sullivan County
The most frequent times of departure to work in Sullivan County are 6:00 AM to 6:29 AM (180, 14.4%) for males and 7:30 AM to 7:59 AM (192, 17.4%) for females.
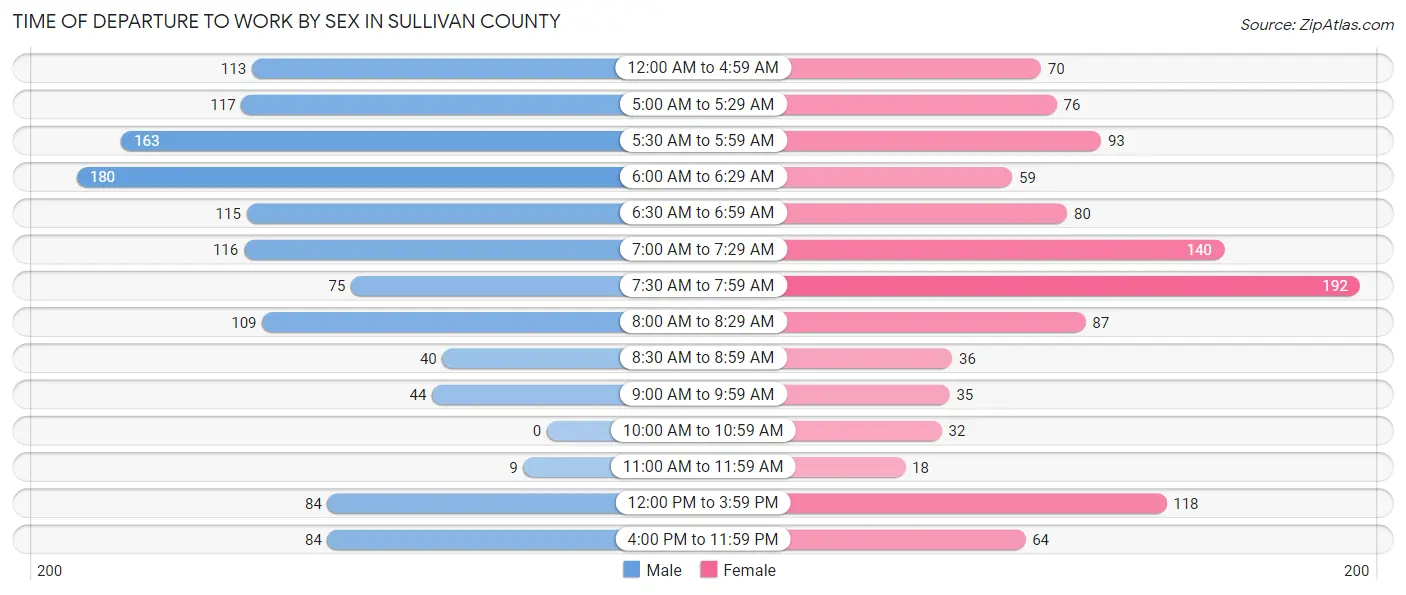
| Time of Departure | Male | Female |
| 12:00 AM to 4:59 AM | 113 (9.0%) | 70 (6.4%) |
| 5:00 AM to 5:29 AM | 117 (9.4%) | 76 (6.9%) |
| 5:30 AM to 5:59 AM | 163 (13.1%) | 93 (8.5%) |
| 6:00 AM to 6:29 AM | 180 (14.4%) | 59 (5.4%) |
| 6:30 AM to 6:59 AM | 115 (9.2%) | 80 (7.3%) |
| 7:00 AM to 7:29 AM | 116 (9.3%) | 140 (12.7%) |
| 7:30 AM to 7:59 AM | 75 (6.0%) | 192 (17.4%) |
| 8:00 AM to 8:29 AM | 109 (8.7%) | 87 (7.9%) |
| 8:30 AM to 8:59 AM | 40 (3.2%) | 36 (3.3%) |
| 9:00 AM to 9:59 AM | 44 (3.5%) | 35 (3.2%) |
| 10:00 AM to 10:59 AM | 0 (0.0%) | 32 (2.9%) |
| 11:00 AM to 11:59 AM | 9 (0.7%) | 18 (1.6%) |
| 12:00 PM to 3:59 PM | 84 (6.7%) | 118 (10.7%) |
| 4:00 PM to 11:59 PM | 84 (6.7%) | 64 (5.8%) |
| Total | 1,249 (100.0%) | 1,100 (100.0%) |
Housing Occupancy in Sullivan County
Occupancy by Ownership in Sullivan County
Of the total 2,462 dwellings in Sullivan County, owner-occupied units account for 2,081 (84.5%), while renter-occupied units make up 381 (15.5%).
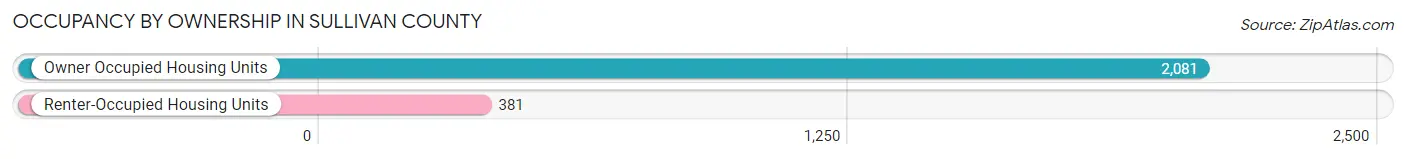
| Occupancy | # Housing Units | % Housing Units |
| Owner Occupied Housing Units | 2,081 | 84.5% |
| Renter-Occupied Housing Units | 381 | 15.5% |
| Total Occupied Housing Units | 2,462 | 100.0% |
Occupancy by Household Size in Sullivan County
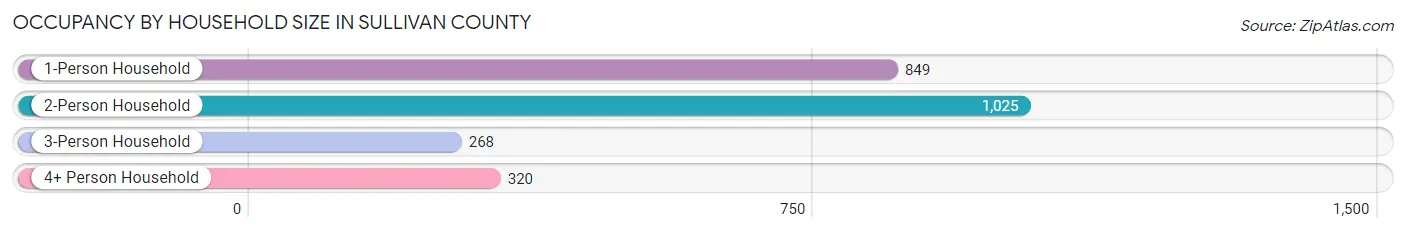
| Household Size | # Housing Units | % Housing Units |
| 1-Person Household | 849 | 34.5% |
| 2-Person Household | 1,025 | 41.6% |
| 3-Person Household | 268 | 10.9% |
| 4+ Person Household | 320 | 13.0% |
| Total Housing Units | 2,462 | 100.0% |
Occupancy by Ownership by Household Size in Sullivan County
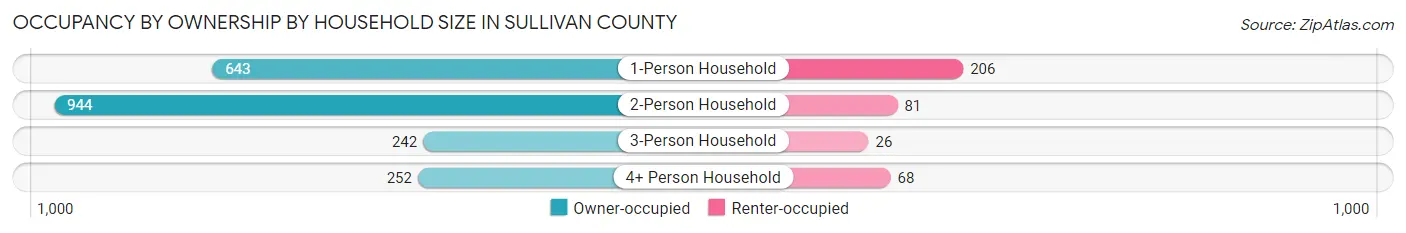
| Household Size | Owner-occupied | Renter-occupied |
| 1-Person Household | 643 (75.7%) | 206 (24.3%) |
| 2-Person Household | 944 (92.1%) | 81 (7.9%) |
| 3-Person Household | 242 (90.3%) | 26 (9.7%) |
| 4+ Person Household | 252 (78.7%) | 68 (21.2%) |
| Total Housing Units | 2,081 (84.5%) | 381 (15.5%) |
Occupancy by Educational Attainment in Sullivan County
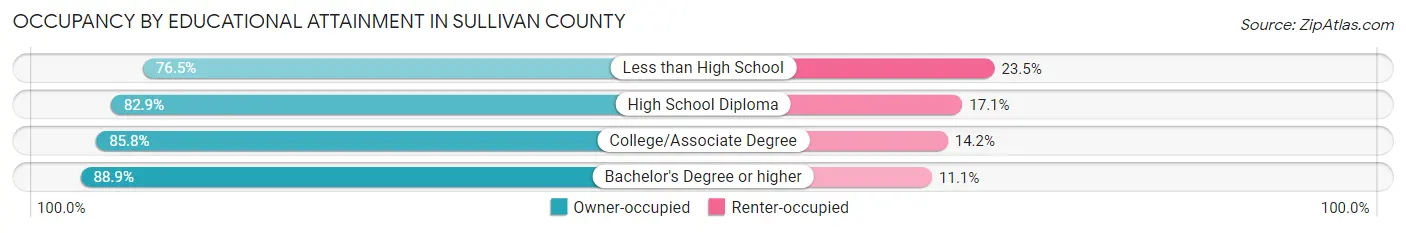
| Household Size | Owner-occupied | Renter-occupied |
| Less than High School | 137 (76.5%) | 42 (23.5%) |
| High School Diploma | 883 (82.9%) | 182 (17.1%) |
| College/Associate Degree | 604 (85.8%) | 100 (14.2%) |
| Bachelor's Degree or higher | 457 (88.9%) | 57 (11.1%) |
Occupancy by Age of Householder in Sullivan County
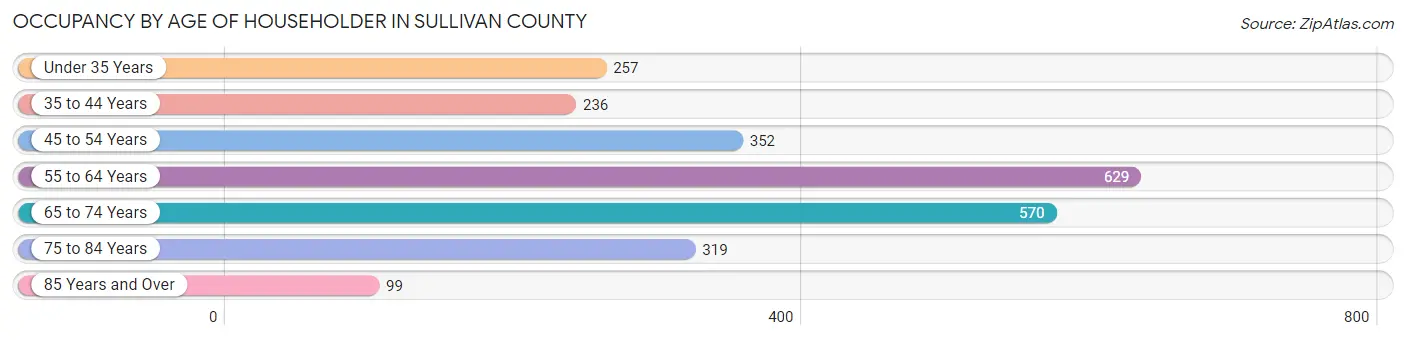
| Age Bracket | # Households | % Households |
| Under 35 Years | 257 | 10.4% |
| 35 to 44 Years | 236 | 9.6% |
| 45 to 54 Years | 352 | 14.3% |
| 55 to 64 Years | 629 | 25.6% |
| 65 to 74 Years | 570 | 23.2% |
| 75 to 84 Years | 319 | 13.0% |
| 85 Years and Over | 99 | 4.0% |
| Total | 2,462 | 100.0% |
Housing Finances in Sullivan County
Median Income by Occupancy in Sullivan County
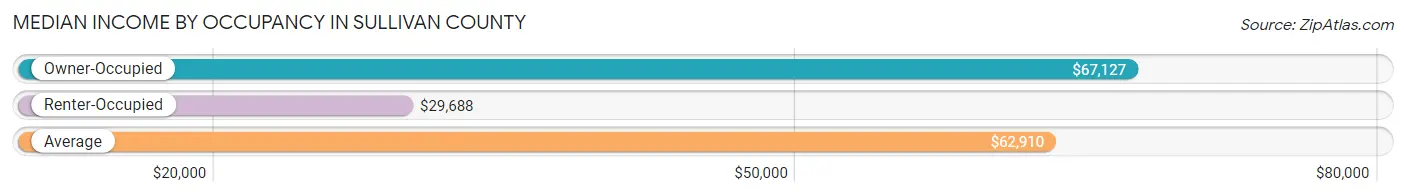
| Occupancy Type | # Households | Median Income |
| Owner-Occupied | 2,081 (84.5%) | $67,127 |
| Renter-Occupied | 381 (15.5%) | $29,688 |
| Average | 2,462 (100.0%) | $62,910 |
Occupancy by Householder Income Bracket in Sullivan County
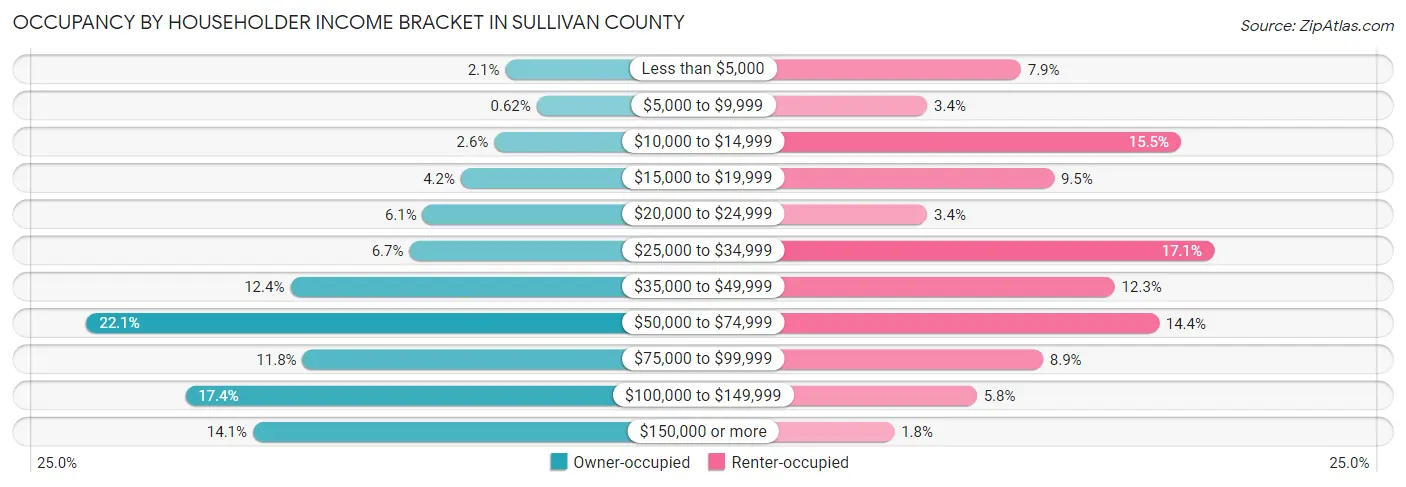
| Income Bracket | Owner-occupied | Renter-occupied |
| Less than $5,000 | 44 (2.1%) | 30 (7.9%) |
| $5,000 to $9,999 | 13 (0.6%) | 13 (3.4%) |
| $10,000 to $14,999 | 55 (2.6%) | 59 (15.5%) |
| $15,000 to $19,999 | 88 (4.2%) | 36 (9.5%) |
| $20,000 to $24,999 | 126 (6.0%) | 13 (3.4%) |
| $25,000 to $34,999 | 139 (6.7%) | 65 (17.1%) |
| $35,000 to $49,999 | 257 (12.3%) | 47 (12.3%) |
| $50,000 to $74,999 | 459 (22.1%) | 55 (14.4%) |
| $75,000 to $99,999 | 245 (11.8%) | 34 (8.9%) |
| $100,000 to $149,999 | 361 (17.3%) | 22 (5.8%) |
| $150,000 or more | 294 (14.1%) | 7 (1.8%) |
| Total | 2,081 (100.0%) | 381 (100.0%) |
Monthly Housing Cost Tiers in Sullivan County
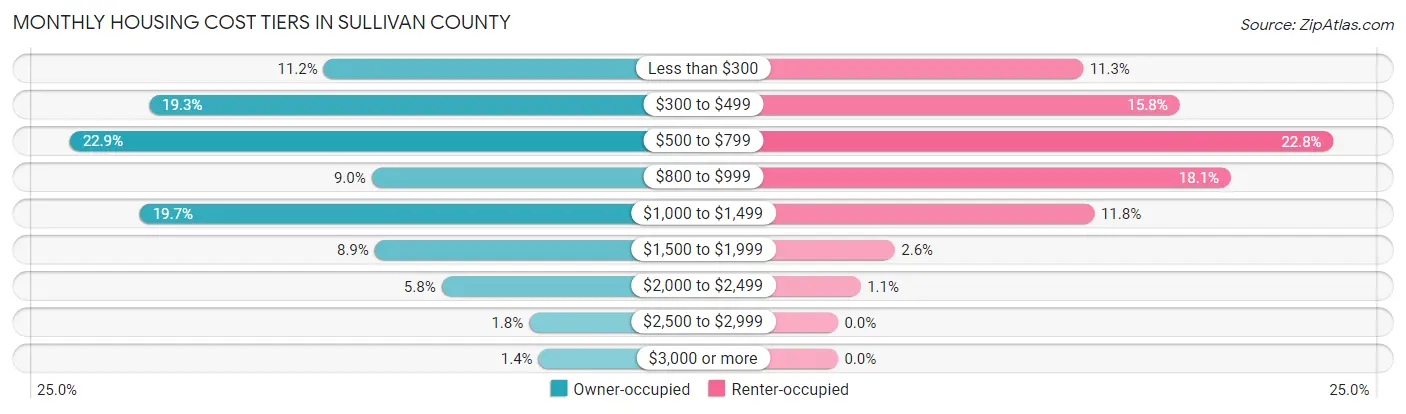
| Monthly Cost | Owner-occupied | Renter-occupied |
| Less than $300 | 234 (11.2%) | 43 (11.3%) |
| $300 to $499 | 401 (19.3%) | 60 (15.8%) |
| $500 to $799 | 477 (22.9%) | 87 (22.8%) |
| $800 to $999 | 188 (9.0%) | 69 (18.1%) |
| $1,000 to $1,499 | 410 (19.7%) | 45 (11.8%) |
| $1,500 to $1,999 | 185 (8.9%) | 10 (2.6%) |
| $2,000 to $2,499 | 121 (5.8%) | 4 (1.1%) |
| $2,500 to $2,999 | 37 (1.8%) | 0 (0.0%) |
| $3,000 or more | 28 (1.3%) | 0 (0.0%) |
| Total | 2,081 (100.0%) | 381 (100.0%) |
Physical Housing Characteristics in Sullivan County
Housing Structures in Sullivan County
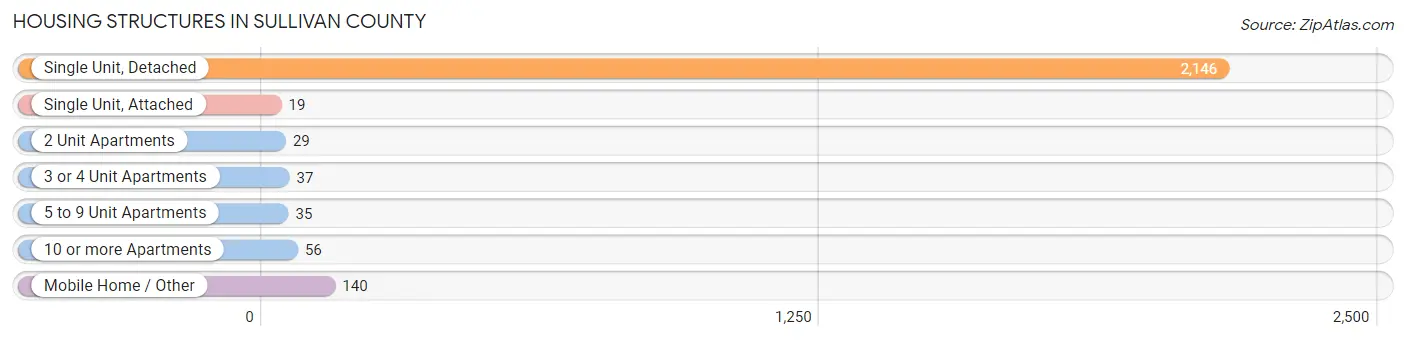
| Structure Type | # Housing Units | % Housing Units |
| Single Unit, Detached | 2,146 | 87.2% |
| Single Unit, Attached | 19 | 0.8% |
| 2 Unit Apartments | 29 | 1.2% |
| 3 or 4 Unit Apartments | 37 | 1.5% |
| 5 to 9 Unit Apartments | 35 | 1.4% |
| 10 or more Apartments | 56 | 2.3% |
| Mobile Home / Other | 140 | 5.7% |
| Total | 2,462 | 100.0% |
Housing Structures by Occupancy in Sullivan County
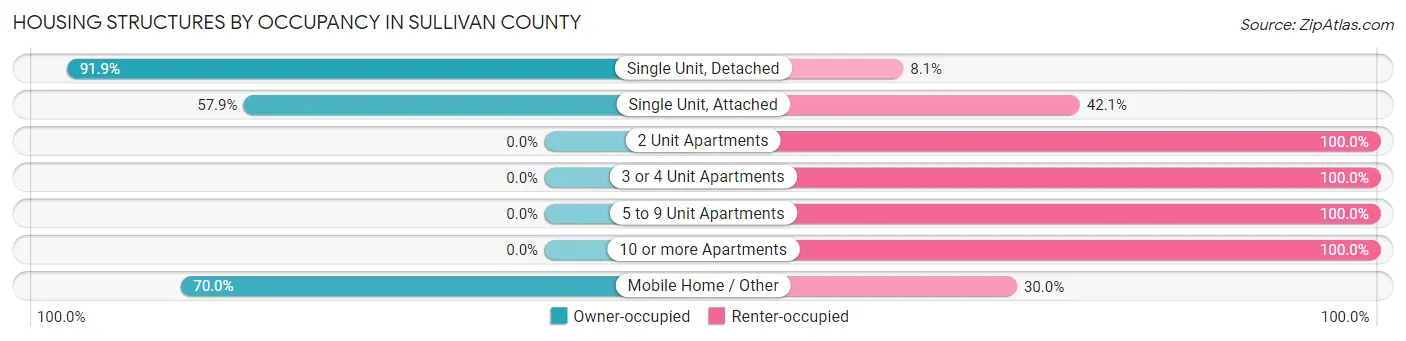
| Structure Type | Owner-occupied | Renter-occupied |
| Single Unit, Detached | 1,972 (91.9%) | 174 (8.1%) |
| Single Unit, Attached | 11 (57.9%) | 8 (42.1%) |
| 2 Unit Apartments | 0 (0.0%) | 29 (100.0%) |
| 3 or 4 Unit Apartments | 0 (0.0%) | 37 (100.0%) |
| 5 to 9 Unit Apartments | 0 (0.0%) | 35 (100.0%) |
| 10 or more Apartments | 0 (0.0%) | 56 (100.0%) |
| Mobile Home / Other | 98 (70.0%) | 42 (30.0%) |
| Total | 2,081 (84.5%) | 381 (15.5%) |
Housing Structures by Number of Rooms in Sullivan County
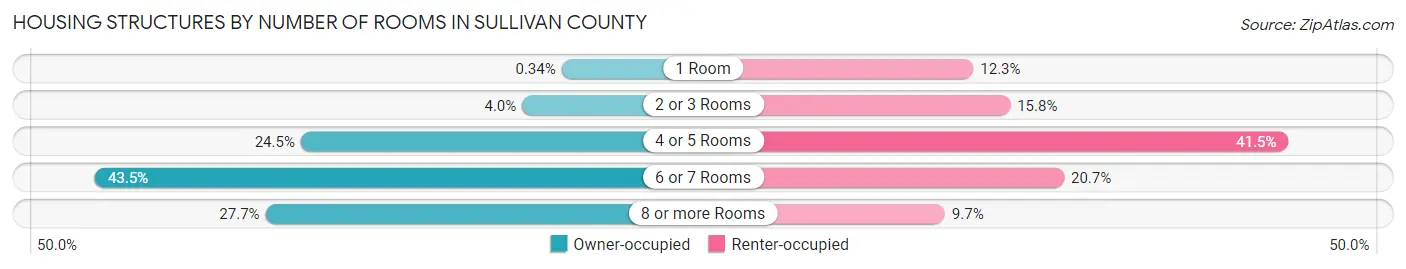
| Number of Rooms | Owner-occupied | Renter-occupied |
| 1 Room | 7 (0.3%) | 47 (12.3%) |
| 2 or 3 Rooms | 83 (4.0%) | 60 (15.8%) |
| 4 or 5 Rooms | 509 (24.5%) | 158 (41.5%) |
| 6 or 7 Rooms | 905 (43.5%) | 79 (20.7%) |
| 8 or more Rooms | 577 (27.7%) | 37 (9.7%) |
| Total | 2,081 (100.0%) | 381 (100.0%) |
Housing Structure by Heating Type in Sullivan County
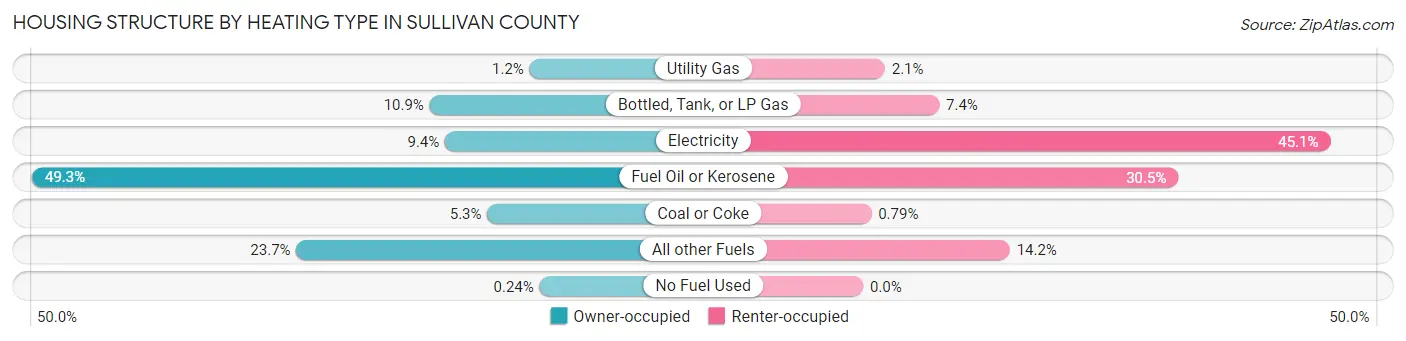
| Heating Type | Owner-occupied | Renter-occupied |
| Utility Gas | 25 (1.2%) | 8 (2.1%) |
| Bottled, Tank, or LP Gas | 226 (10.9%) | 28 (7.3%) |
| Electricity | 195 (9.4%) | 172 (45.1%) |
| Fuel Oil or Kerosene | 1,026 (49.3%) | 116 (30.4%) |
| Coal or Coke | 110 (5.3%) | 3 (0.8%) |
| All other Fuels | 494 (23.7%) | 54 (14.2%) |
| No Fuel Used | 5 (0.2%) | 0 (0.0%) |
| Total | 2,081 (100.0%) | 381 (100.0%) |
Household Vehicle Usage in Sullivan County
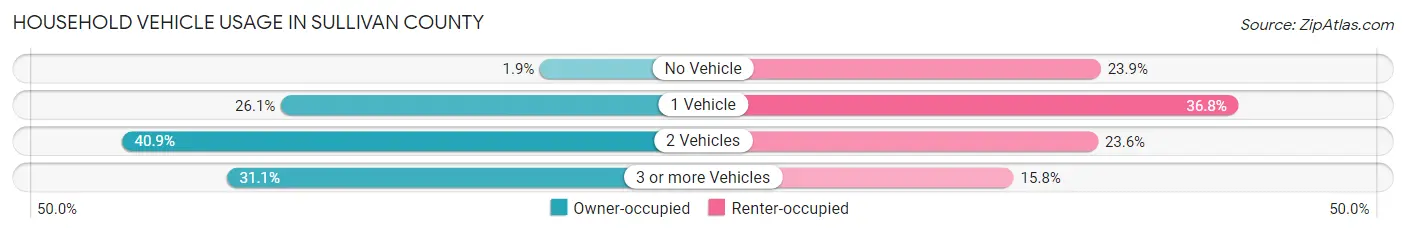
| Vehicles per Household | Owner-occupied | Renter-occupied |
| No Vehicle | 39 (1.9%) | 91 (23.9%) |
| 1 Vehicle | 542 (26.1%) | 140 (36.7%) |
| 2 Vehicles | 852 (40.9%) | 90 (23.6%) |
| 3 or more Vehicles | 648 (31.1%) | 60 (15.8%) |
| Total | 2,081 (100.0%) | 381 (100.0%) |
Real Estate & Mortgages in Sullivan County
Real Estate and Mortgage Overview in Sullivan County
| Characteristic | Without Mortgage | With Mortgage |
| Housing Units | 1,126 | 955 |
| Median Property Value | $170,400 | $184,400 |
| Median Household Income | $52,682 | $175 |
| Monthly Housing Costs | $470 | $26 |
| Real Estate Taxes | $1,691 | $6 |
Property Value by Mortgage Status in Sullivan County
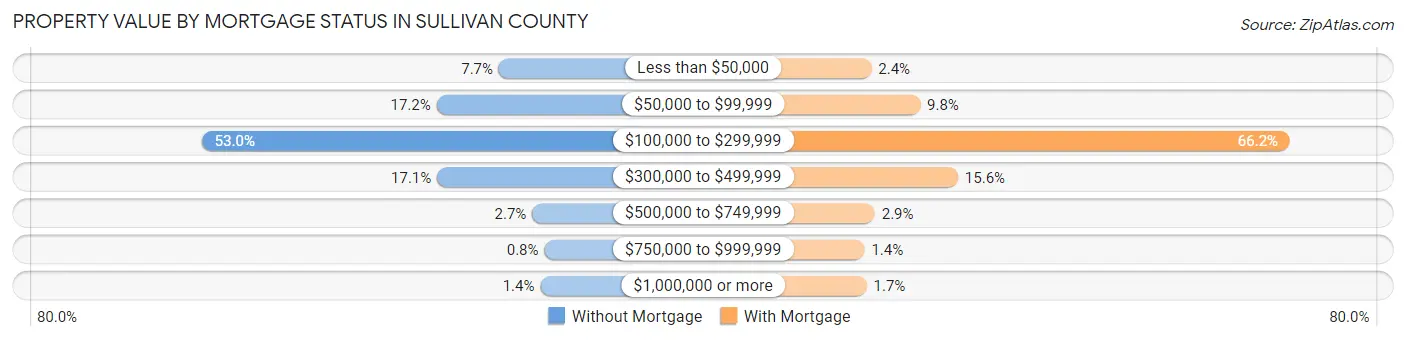
| Property Value | Without Mortgage | With Mortgage |
| Less than $50,000 | 87 (7.7%) | 23 (2.4%) |
| $50,000 to $99,999 | 194 (17.2%) | 94 (9.8%) |
| $100,000 to $299,999 | 597 (53.0%) | 632 (66.2%) |
| $300,000 to $499,999 | 193 (17.1%) | 149 (15.6%) |
| $500,000 to $749,999 | 30 (2.7%) | 28 (2.9%) |
| $750,000 to $999,999 | 9 (0.8%) | 13 (1.4%) |
| $1,000,000 or more | 16 (1.4%) | 16 (1.7%) |
| Total | 1,126 (100.0%) | 955 (100.0%) |
Household Income by Mortgage Status in Sullivan County
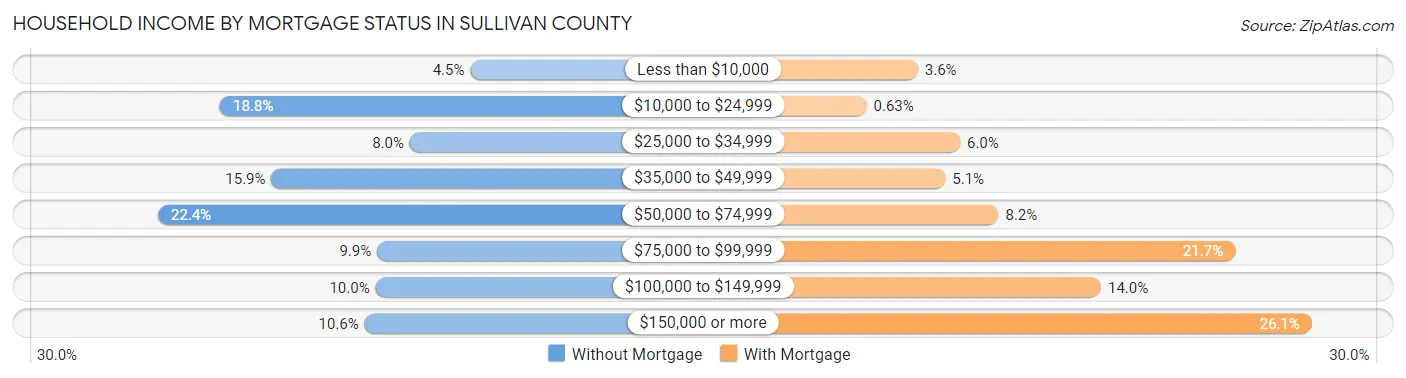
| Household Income | Without Mortgage | With Mortgage |
| Less than $10,000 | 51 (4.5%) | 34 (3.6%) |
| $10,000 to $24,999 | 212 (18.8%) | 6 (0.6%) |
| $25,000 to $34,999 | 90 (8.0%) | 57 (6.0%) |
| $35,000 to $49,999 | 179 (15.9%) | 49 (5.1%) |
| $50,000 to $74,999 | 252 (22.4%) | 78 (8.2%) |
| $75,000 to $99,999 | 111 (9.9%) | 207 (21.7%) |
| $100,000 to $149,999 | 112 (10.0%) | 134 (14.0%) |
| $150,000 or more | 119 (10.6%) | 249 (26.1%) |
| Total | 1,126 (100.0%) | 955 (100.0%) |
Property Value to Household Income Ratio in Sullivan County
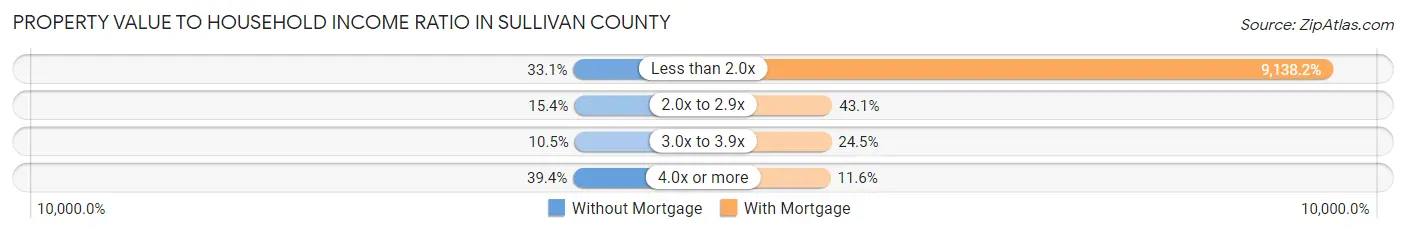
| Value-to-Income Ratio | Without Mortgage | With Mortgage |
| Less than 2.0x | 373 (33.1%) | 87,270 (9,138.2%) |
| 2.0x to 2.9x | 173 (15.4%) | 412 (43.1%) |
| 3.0x to 3.9x | 118 (10.5%) | 234 (24.5%) |
| 4.0x or more | 444 (39.4%) | 111 (11.6%) |
| Total | 1,126 (100.0%) | 955 (100.0%) |
Real Estate Taxes by Mortgage Status in Sullivan County
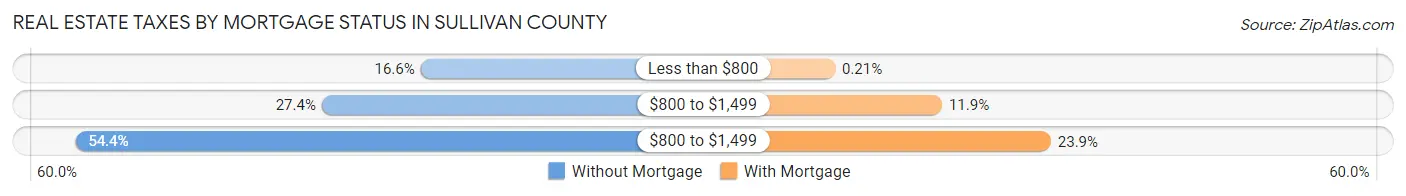
| Property Taxes | Without Mortgage | With Mortgage |
| Less than $800 | 187 (16.6%) | 2 (0.2%) |
| $800 to $1,499 | 309 (27.4%) | 114 (11.9%) |
| $800 to $1,499 | 613 (54.4%) | 228 (23.9%) |
| Total | 1,126 (100.0%) | 955 (100.0%) |
Health & Disability in Sullivan County
Health Insurance Coverage by Age in Sullivan County
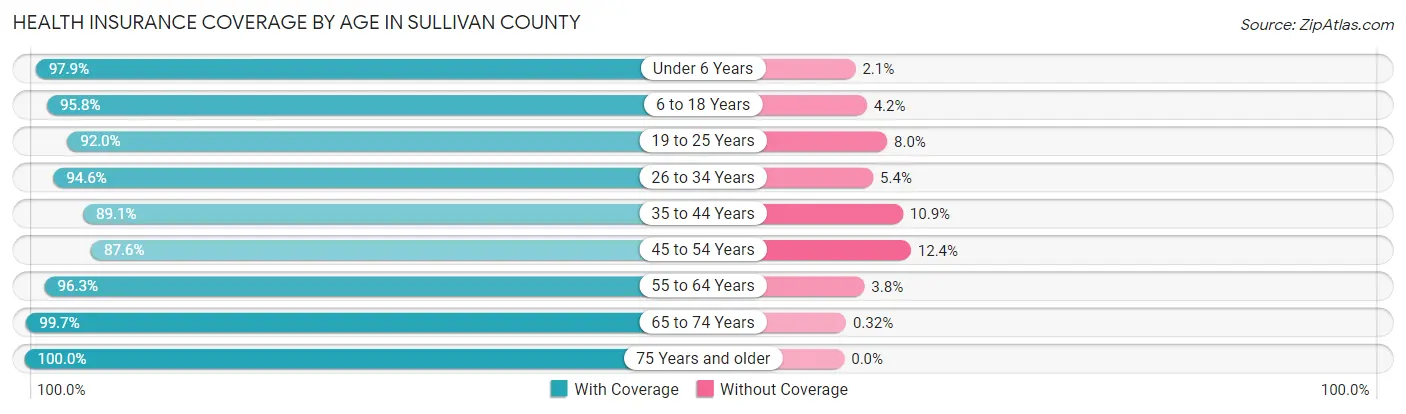
| Age Bracket | With Coverage | Without Coverage |
| Under 6 Years | 188 (97.9%) | 4 (2.1%) |
| 6 to 18 Years | 504 (95.8%) | 22 (4.2%) |
| 19 to 25 Years | 323 (92.0%) | 28 (8.0%) |
| 26 to 34 Years | 510 (94.6%) | 29 (5.4%) |
| 35 to 44 Years | 538 (89.1%) | 66 (10.9%) |
| 45 to 54 Years | 635 (87.6%) | 90 (12.4%) |
| 55 to 64 Years | 1,129 (96.3%) | 44 (3.7%) |
| 65 to 74 Years | 934 (99.7%) | 3 (0.3%) |
| 75 Years and older | 654 (100.0%) | 0 (0.0%) |
| Total | 5,415 (95.0%) | 286 (5.0%) |
Health Insurance Coverage by Citizenship Status in Sullivan County
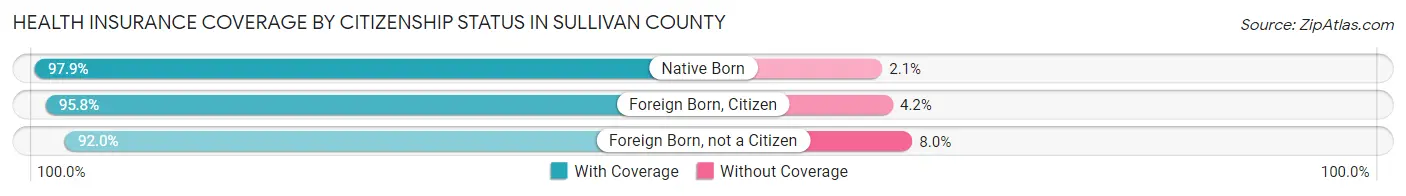
| Citizenship Status | With Coverage | Without Coverage |
| Native Born | 188 (97.9%) | 4 (2.1%) |
| Foreign Born, Citizen | 504 (95.8%) | 22 (4.2%) |
| Foreign Born, not a Citizen | 323 (92.0%) | 28 (8.0%) |
Health Insurance Coverage by Household Income in Sullivan County
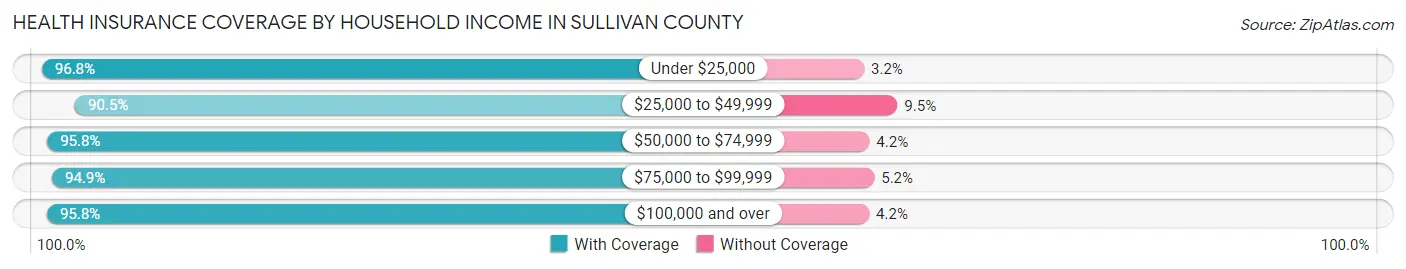
| Household Income | With Coverage | Without Coverage |
| Under $25,000 | 776 (96.8%) | 26 (3.2%) |
| $25,000 to $49,999 | 840 (90.5%) | 88 (9.5%) |
| $50,000 to $74,999 | 1,039 (95.8%) | 46 (4.2%) |
| $75,000 to $99,999 | 719 (94.9%) | 39 (5.1%) |
| $100,000 and over | 1,852 (95.8%) | 81 (4.2%) |
Public vs Private Health Insurance Coverage by Age in Sullivan County
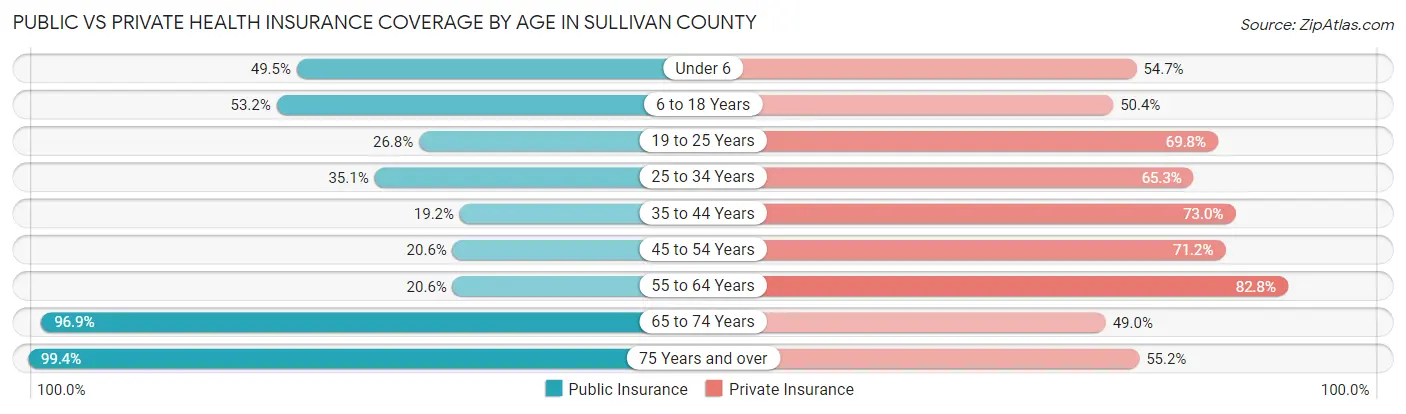
| Age Bracket | Public Insurance | Private Insurance |
| Under 6 | 95 (49.5%) | 105 (54.7%) |
| 6 to 18 Years | 280 (53.2%) | 265 (50.4%) |
| 19 to 25 Years | 94 (26.8%) | 245 (69.8%) |
| 25 to 34 Years | 189 (35.1%) | 352 (65.3%) |
| 35 to 44 Years | 116 (19.2%) | 441 (73.0%) |
| 45 to 54 Years | 149 (20.5%) | 516 (71.2%) |
| 55 to 64 Years | 241 (20.5%) | 971 (82.8%) |
| 65 to 74 Years | 908 (96.9%) | 459 (49.0%) |
| 75 Years and over | 650 (99.4%) | 361 (55.2%) |
| Total | 2,722 (47.7%) | 3,715 (65.2%) |
Disability Status by Sex by Age in Sullivan County
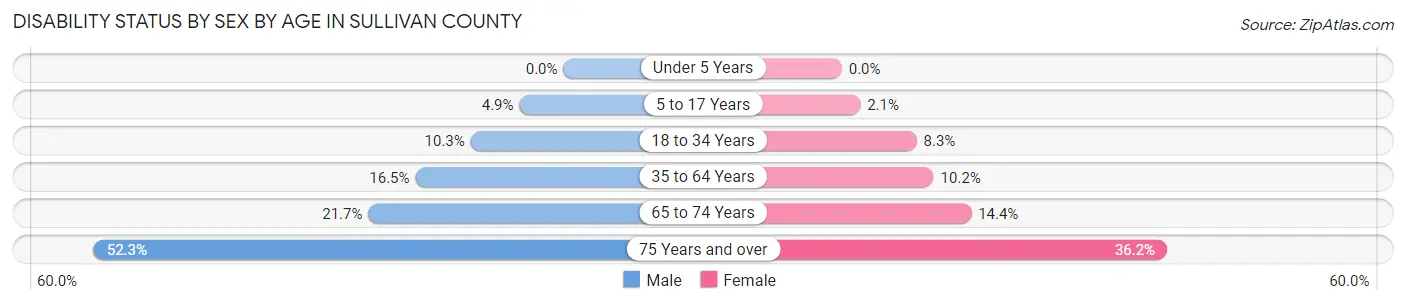
| Age Bracket | Male | Female |
| Under 5 Years | 0 (0.0%) | 0 (0.0%) |
| 5 to 17 Years | 15 (4.9%) | 4 (2.1%) |
| 18 to 34 Years | 56 (10.3%) | 33 (8.3%) |
| 35 to 64 Years | 211 (16.5%) | 125 (10.2%) |
| 65 to 74 Years | 101 (21.7%) | 68 (14.4%) |
| 75 Years and over | 160 (52.3%) | 126 (36.2%) |
Disability Class by Sex by Age in Sullivan County
Disability Class: Hearing Difficulty
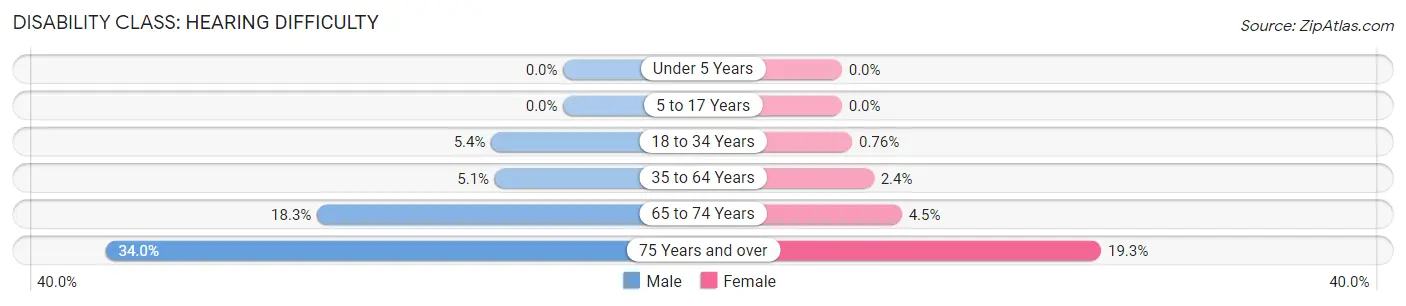
| Age Bracket | Male | Female |
| Under 5 Years | 0 (0.0%) | 0 (0.0%) |
| 5 to 17 Years | 0 (0.0%) | 0 (0.0%) |
| 18 to 34 Years | 29 (5.3%) | 3 (0.8%) |
| 35 to 64 Years | 65 (5.1%) | 29 (2.4%) |
| 65 to 74 Years | 85 (18.3%) | 21 (4.4%) |
| 75 Years and over | 104 (34.0%) | 67 (19.3%) |
Disability Class: Vision Difficulty
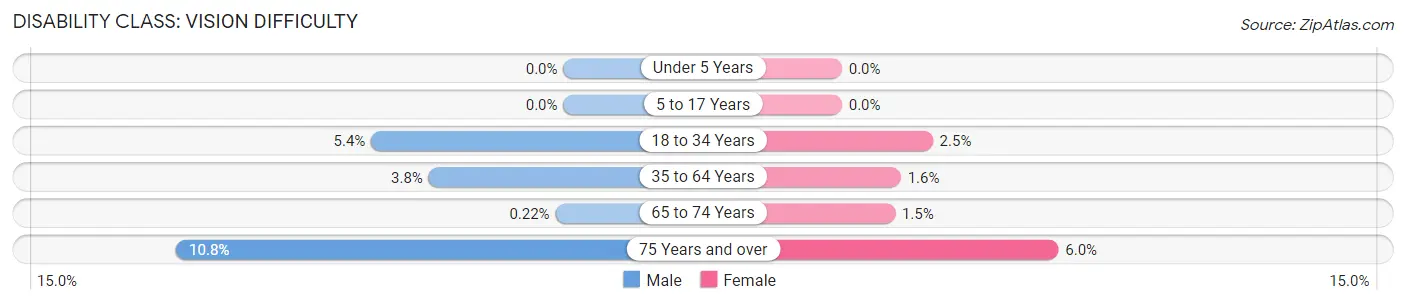
| Age Bracket | Male | Female |
| Under 5 Years | 0 (0.0%) | 0 (0.0%) |
| 5 to 17 Years | 0 (0.0%) | 0 (0.0%) |
| 18 to 34 Years | 29 (5.3%) | 10 (2.5%) |
| 35 to 64 Years | 48 (3.7%) | 20 (1.6%) |
| 65 to 74 Years | 1 (0.2%) | 7 (1.5%) |
| 75 Years and over | 33 (10.8%) | 21 (6.0%) |
Disability Class: Cognitive Difficulty
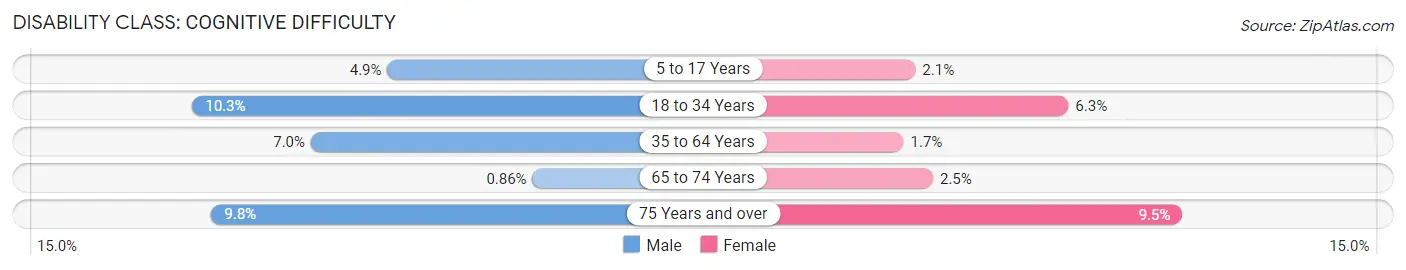
| Age Bracket | Male | Female |
| 5 to 17 Years | 15 (4.9%) | 4 (2.1%) |
| 18 to 34 Years | 56 (10.3%) | 25 (6.3%) |
| 35 to 64 Years | 90 (7.0%) | 21 (1.7%) |
| 65 to 74 Years | 4 (0.9%) | 12 (2.5%) |
| 75 Years and over | 30 (9.8%) | 33 (9.5%) |
Disability Class: Ambulatory Difficulty
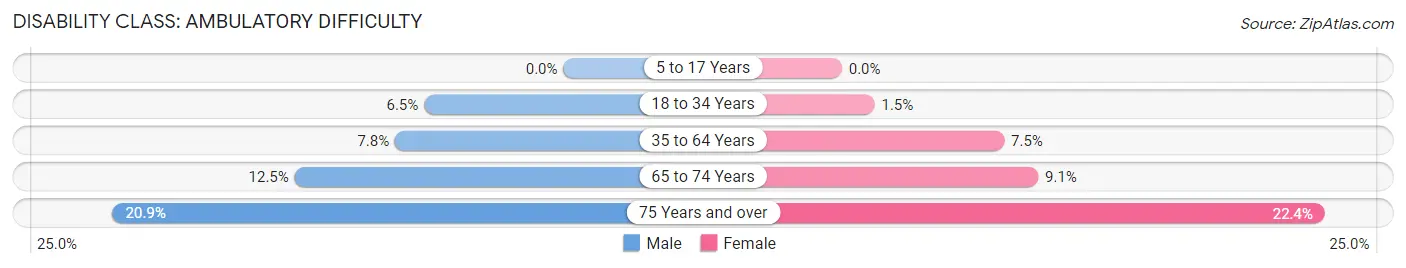
| Age Bracket | Male | Female |
| 5 to 17 Years | 0 (0.0%) | 0 (0.0%) |
| 18 to 34 Years | 35 (6.5%) | 6 (1.5%) |
| 35 to 64 Years | 100 (7.8%) | 92 (7.5%) |
| 65 to 74 Years | 58 (12.5%) | 43 (9.1%) |
| 75 Years and over | 64 (20.9%) | 78 (22.4%) |
Disability Class: Self-Care Difficulty
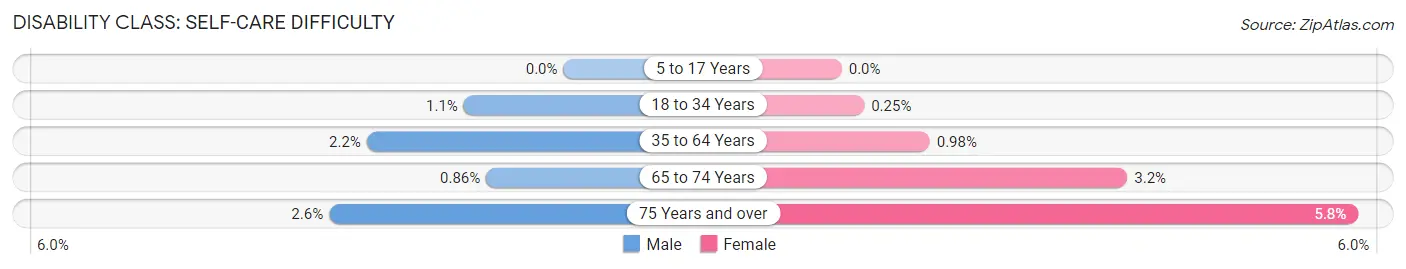
| Age Bracket | Male | Female |
| 5 to 17 Years | 0 (0.0%) | 0 (0.0%) |
| 18 to 34 Years | 6 (1.1%) | 1 (0.3%) |
| 35 to 64 Years | 28 (2.2%) | 12 (1.0%) |
| 65 to 74 Years | 4 (0.9%) | 15 (3.2%) |
| 75 Years and over | 8 (2.6%) | 20 (5.8%) |
Technology Access in Sullivan County
Computing Device Access in Sullivan County
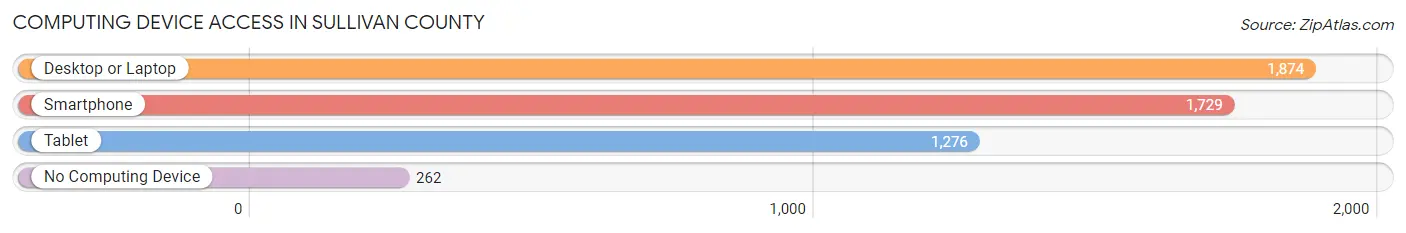
| Device Type | # Households | % Households |
| Desktop or Laptop | 1,874 | 76.1% |
| Smartphone | 1,729 | 70.2% |
| Tablet | 1,276 | 51.8% |
| No Computing Device | 262 | 10.6% |
| Total | 2,462 | 100.0% |
Internet Access in Sullivan County
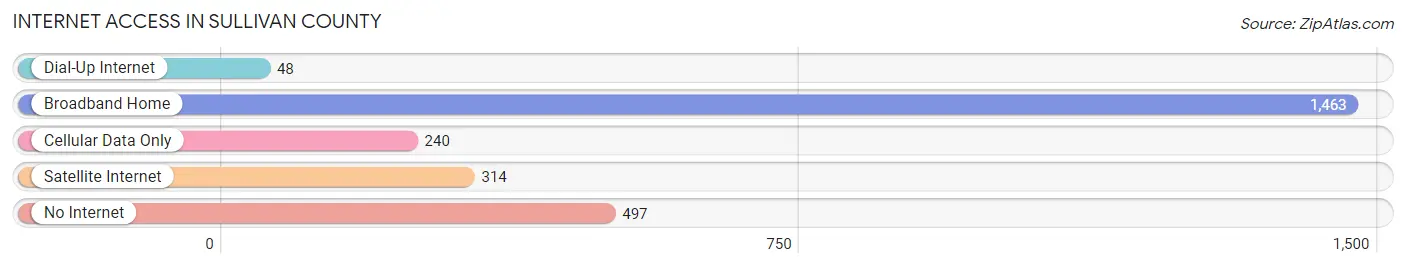
| Internet Type | # Households | % Households |
| Dial-Up Internet | 48 | 1.9% |
| Broadband Home | 1,463 | 59.4% |
| Cellular Data Only | 240 | 9.8% |
| Satellite Internet | 314 | 12.8% |
| No Internet | 497 | 20.2% |
| Total | 2,462 | 100.0% |
Sullivan County Summary
Sullivan County is a county located in the U.S. state of Pennsylvania. As of the 2010 census, the population was 6,428, making it the least populous county in Pennsylvania. The county seat is Laporte. The county was created on March 15, 1847, from part of Lycoming County and named for Charles C. Sullivan, a member of the Pennsylvania State Senate.
Geography
Sullivan County is located in the Endless Mountains region of the Appalachian Mountains. The county is bordered by Bradford County to the north, Lycoming County to the east, Columbia County to the south, and Wyoming County to the west. The county has a total area of 437 square miles, of which 434 square miles is land and 3.2 square miles (0.7%) is water.
The highest point in Sullivan County is North Knob, at 2,890 feet above sea level. The county is drained by the North Branch of the Susquehanna River and its tributaries, including Loyalsock Creek, Muncy Creek, and Fishing Creek.
Demographics
As of the 2010 census, there were 6,428 people, 2,717 households, and 1,788 families residing in the county. The population density was 14.8 people per square mile. There were 3,717 housing units at an average density of 8.6 per square mile. The racial makeup of the county was 97.7% White, 0.3% Black or African American, 0.2% Native American, 0.2% Asian, 0.1% Pacific Islander, 0.3% from other races, and 1.2% from two or more races. 1.3% of the population were Hispanic or Latino of any race.
There were 2,717 households, out of which 24.7% had children under the age of 18 living with them, 54.2% were married couples living together, 8.3% had a female householder with no husband present, and 33.2% were non-families. 28.7% of all households were made up of individuals, and 13.2% had someone living alone who was 65 years of age or older. The average household size was 2.33 and the average family size was 2.83.
The median age in the county was 45.3 years. 20.2% of residents were under the age of 18; 6.7% were between the ages of 18 and 24; 22.7% were from 25 to 44; 30.3% were from 45 to 64; and 20.1% were 65 years of age or older. The gender makeup of the county was 48.7% male and 51.3% female.
Economy
The economy of Sullivan County is largely based on agriculture and tourism. The county is home to several dairy farms, as well as a number of apple orchards. The county is also home to several wineries, which attract tourists from all over the region.
The county is also home to a number of small businesses, including restaurants, retail stores, and service providers. The county is also home to a number of small manufacturing companies, which produce a variety of products, including furniture, clothing, and food products.
The county is served by the Sullivan County Airport, which provides general aviation services. The county is also served by a number of state highways, including Route 87, Route 154, and Route 220.
Conclusion
Sullivan County is a rural county located in the Endless Mountains region of the Appalachian Mountains. The county has a population of 6,428, making it the least populous county in Pennsylvania. The economy of the county is largely based on agriculture and tourism, with a number of dairy farms, apple orchards, wineries, and small businesses located in the county. The county is served by the Sullivan County Airport and a number of state highways.
Common Questions
What is Per Capita Income in Sullivan County?
Per Capita income in Sullivan County is $35,618.
What is the Median Family Income in Sullivan County?
Median Family Income in Sullivan County is $80,104.
What is the Median Household income in Sullivan County?
Median Household Income in Sullivan County is $62,910.
What is Income or Wage Gap in Sullivan County?
Income or Wage Gap in Sullivan County is 32.6%.
Women in Sullivan County earn 67.4 cents for every dollar earned by a man.
What is Inequality or Gini Index in Sullivan County?
Inequality or Gini Index in Sullivan County is 0.43.
What is the Total Population of Sullivan County?
Total Population of Sullivan County is 5,880.
What is the Total Male Population of Sullivan County?
Total Male Population of Sullivan County is 3,096.
What is the Total Female Population of Sullivan County?
Total Female Population of Sullivan County is 2,784.
What is the Ratio of Males per 100 Females in Sullivan County?
There are 111.21 Males per 100 Females in Sullivan County.
What is the Ratio of Females per 100 Males in Sullivan County?
There are 89.92 Females per 100 Males in Sullivan County.
What is the Median Population Age in Sullivan County?
Median Population Age in Sullivan County is 55.0 Years.
What is the Average Family Size in Sullivan County
Average Family Size in Sullivan County is 2.8 People.
What is the Average Household Size in Sullivan County
Average Household Size in Sullivan County is 2.2 People.
How Large is the Labor Force in Sullivan County?
There are 2,700 People in the Labor Forcein in Sullivan County.
What is the Percentage of People in the Labor Force in Sullivan County?
50.8% of People are in the Labor Force in Sullivan County.
What is the Unemployment Rate in Sullivan County?
Unemployment Rate in Sullivan County is 5.5%.