Snyder County, PA Map & Demographics
Snyder County Map
Snyder County Overview
$31,776
PER CAPITA INCOME
$76,881
AVG FAMILY INCOME
$65,914
AVG HOUSEHOLD INCOME
30.8%
WAGE / INCOME GAP [ % ]
69.2¢/ $1
WAGE / INCOME GAP [ $ ]
$8,592
FAMILY INCOME DEFICIT
0.42
INEQUALITY / GINI INDEX
39,797
TOTAL POPULATION
19,772
MALE POPULATION
20,025
FEMALE POPULATION
98.74
MALES / 100 FEMALES
101.28
FEMALES / 100 MALES
40.0
MEDIAN AGE
3.1
AVG FAMILY SIZE
2.6
AVG HOUSEHOLD SIZE
19,884
LABOR FORCE [ PEOPLE ]
60.9%
PERCENT IN LABOR FORCE
2.2%
UNEMPLOYMENT RATE
Income in Snyder County
Income Overview in Snyder County
Per Capita Income in Snyder County is $31,776, while median incomes of families and households are $76,881 and $65,914 respectively.
| Characteristic | Number | Measure |
| Per Capita Income | 39,797 | $31,776 |
| Median Family Income | 9,969 | $76,881 |
| Mean Family Income | 9,969 | $95,893 |
| Median Household Income | 14,430 | $65,914 |
| Mean Household Income | 14,430 | $84,417 |
| Income Deficit | 9,969 | $8,592 |
| Wage / Income Gap (%) | 39,797 | 30.77% |
| Wage / Income Gap ($) | 39,797 | 69.23¢ per $1 |
| Gini / Inequality Index | 39,797 | 0.42 |
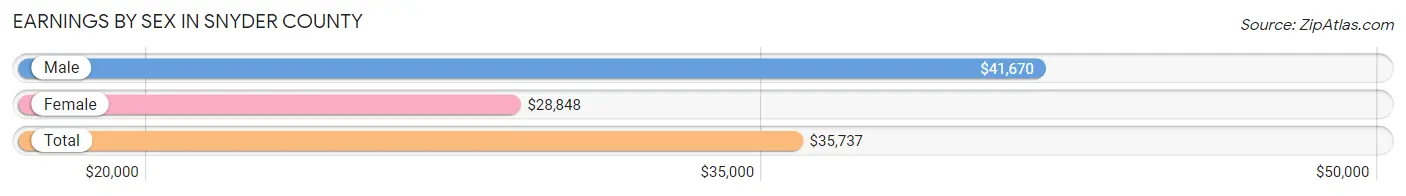
Earnings by Sex in Snyder County
Average Earnings in Snyder County are $35,737, $41,670 for men and $28,848 for women, a difference of 30.8%.
| Sex | Number | Average Earnings |
| Male | 11,497 (53.5%) | $41,670 |
| Female | 9,991 (46.5%) | $28,848 |
| Total | 21,488 (100.0%) | $35,737 |
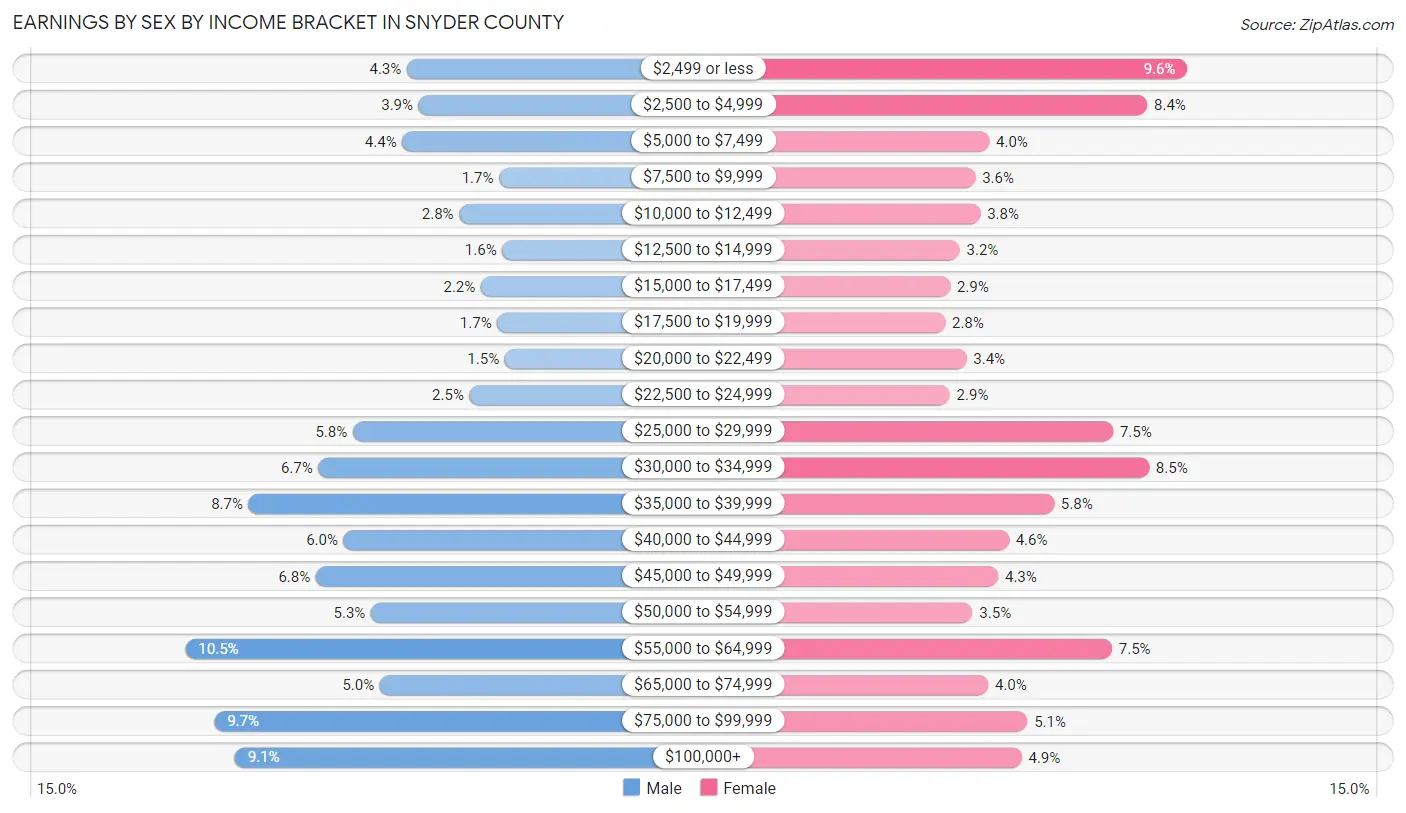
Earnings by Sex by Income Bracket in Snyder County
The most common earnings brackets in Snyder County are $55,000 to $64,999 for men (1,205 | 10.5%) and $2,499 or less for women (956 | 9.6%).
| Income | Male | Female |
| $2,499 or less | 489 (4.3%) | 956 (9.6%) |
| $2,500 to $4,999 | 451 (3.9%) | 843 (8.4%) |
| $5,000 to $7,499 | 503 (4.4%) | 400 (4.0%) |
| $7,500 to $9,999 | 191 (1.7%) | 361 (3.6%) |
| $10,000 to $12,499 | 320 (2.8%) | 375 (3.7%) |
| $12,500 to $14,999 | 180 (1.6%) | 317 (3.2%) |
| $15,000 to $17,499 | 250 (2.2%) | 290 (2.9%) |
| $17,500 to $19,999 | 197 (1.7%) | 276 (2.8%) |
| $20,000 to $22,499 | 173 (1.5%) | 336 (3.4%) |
| $22,500 to $24,999 | 286 (2.5%) | 289 (2.9%) |
| $25,000 to $29,999 | 663 (5.8%) | 747 (7.5%) |
| $30,000 to $34,999 | 775 (6.7%) | 848 (8.5%) |
| $35,000 to $39,999 | 1,000 (8.7%) | 581 (5.8%) |
| $40,000 to $44,999 | 693 (6.0%) | 455 (4.5%) |
| $45,000 to $49,999 | 783 (6.8%) | 425 (4.3%) |
| $50,000 to $54,999 | 605 (5.3%) | 353 (3.5%) |
| $55,000 to $64,999 | 1,205 (10.5%) | 744 (7.4%) |
| $65,000 to $74,999 | 576 (5.0%) | 397 (4.0%) |
| $75,000 to $99,999 | 1,112 (9.7%) | 507 (5.1%) |
| $100,000+ | 1,045 (9.1%) | 491 (4.9%) |
| Total | 11,497 (100.0%) | 9,991 (100.0%) |
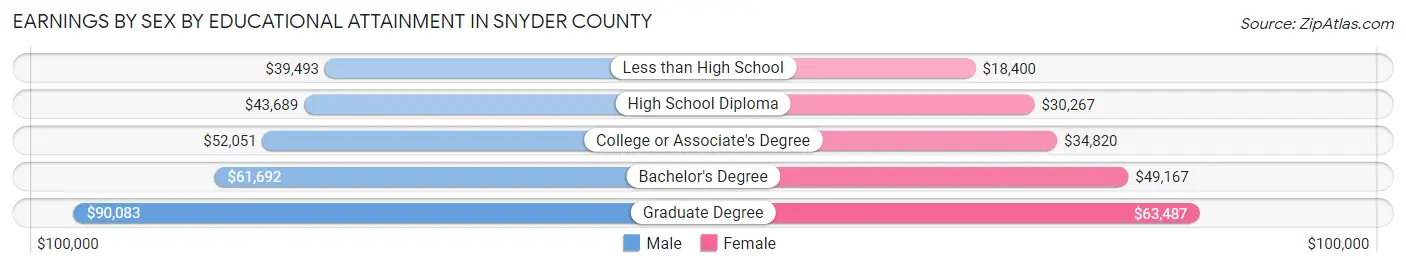
Earnings by Sex by Educational Attainment in Snyder County
Average earnings in Snyder County are $47,900 for men and $35,230 for women, a difference of 26.5%. Men with an educational attainment of graduate degree enjoy the highest average annual earnings of $90,083, while those with less than high school education earn the least with $39,493. Women with an educational attainment of graduate degree earn the most with the average annual earnings of $63,487, while those with less than high school education have the smallest earnings of $18,400.
| Educational Attainment | Male Income | Female Income |
| Less than High School | $39,493 | $18,400 |
| High School Diploma | $43,689 | $30,267 |
| College or Associate's Degree | $52,051 | $34,820 |
| Bachelor's Degree | $61,692 | $49,167 |
| Graduate Degree | $90,083 | $63,487 |
| Total | $47,900 | $35,230 |
Family Income in Snyder County
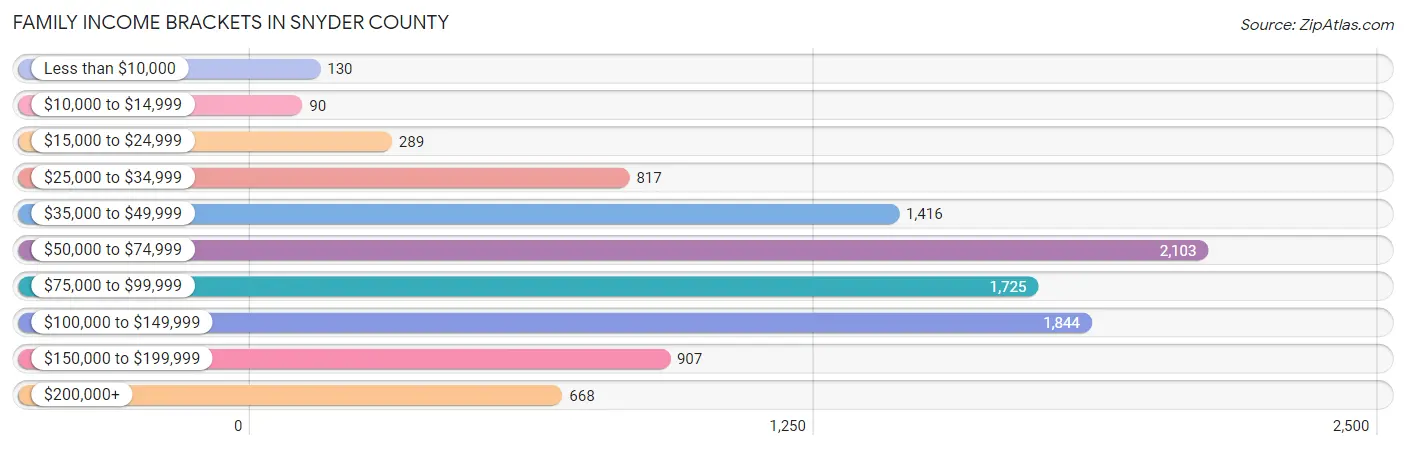
Family Income Brackets in Snyder County
According to the Snyder County family income data, there are 2,103 families falling into the $50,000 to $74,999 income range, which is the most common income bracket and makes up 21.1% of all families. Conversely, the $10,000 to $14,999 income bracket is the least frequent group with only 90 families (0.9%) belonging to this category.
| Income Bracket | # Families | % Families |
| Less than $10,000 | 130 | 1.3% |
| $10,000 to $14,999 | 90 | 0.9% |
| $15,000 to $24,999 | 289 | 2.9% |
| $25,000 to $34,999 | 817 | 8.2% |
| $35,000 to $49,999 | 1,416 | 14.2% |
| $50,000 to $74,999 | 2,103 | 21.1% |
| $75,000 to $99,999 | 1,725 | 17.3% |
| $100,000 to $149,999 | 1,844 | 18.5% |
| $150,000 to $199,999 | 907 | 9.1% |
| $200,000+ | 668 | 6.7% |
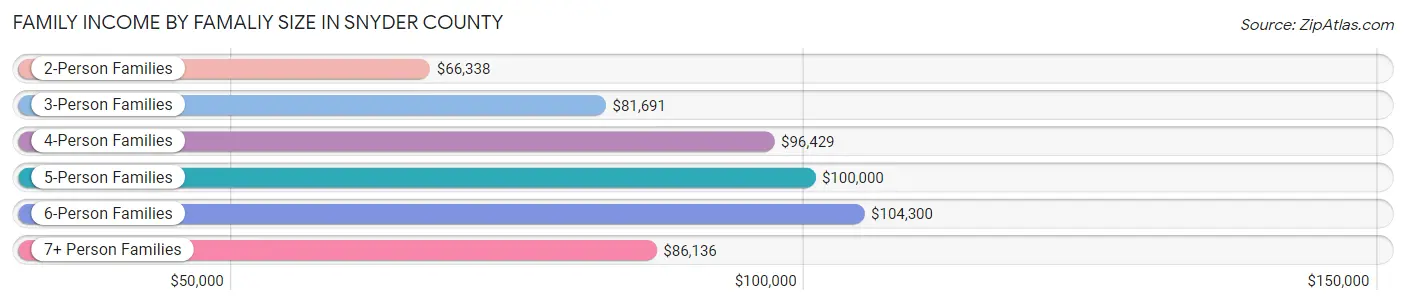
Family Income by Famaliy Size in Snyder County
6-person families (308 | 3.1%) account for the highest median family income in Snyder County with $104,300 per family, while 2-person families (5,181 | 52.0%) have the highest median income of $33,169 per family member.
| Income Bracket | # Families | Median Income |
| 2-Person Families | 5,181 (52.0%) | $66,338 |
| 3-Person Families | 2,082 (20.9%) | $81,691 |
| 4-Person Families | 1,546 (15.5%) | $96,429 |
| 5-Person Families | 616 (6.2%) | $100,000 |
| 6-Person Families | 308 (3.1%) | $104,300 |
| 7+ Person Families | 236 (2.4%) | $86,136 |
| Total | 9,969 (100.0%) | $76,881 |
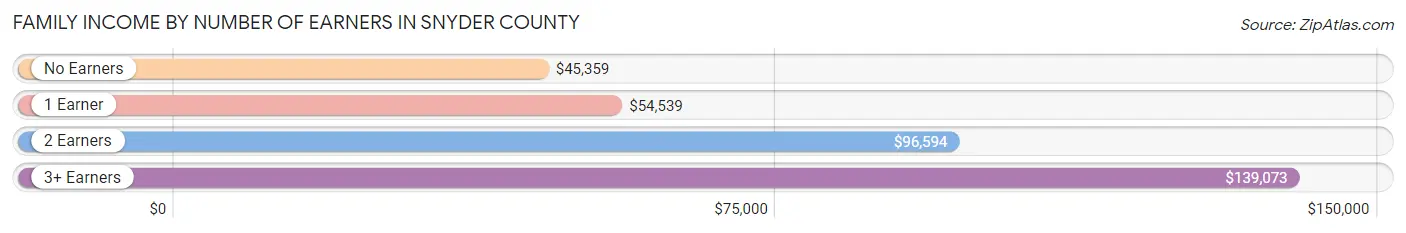
Family Income by Number of Earners in Snyder County
The median family income in Snyder County is $76,881, with families comprising 3+ earners (1,393) having the highest median family income of $139,073, while families with no earners (1,651) have the lowest median family income of $45,359, accounting for 14.0% and 16.6% of families, respectively.
| Number of Earners | # Families | Median Income |
| No Earners | 1,651 (16.6%) | $45,359 |
| 1 Earner | 3,078 (30.9%) | $54,539 |
| 2 Earners | 3,847 (38.6%) | $96,594 |
| 3+ Earners | 1,393 (14.0%) | $139,073 |
| Total | 9,969 (100.0%) | $76,881 |
Household Income in Snyder County
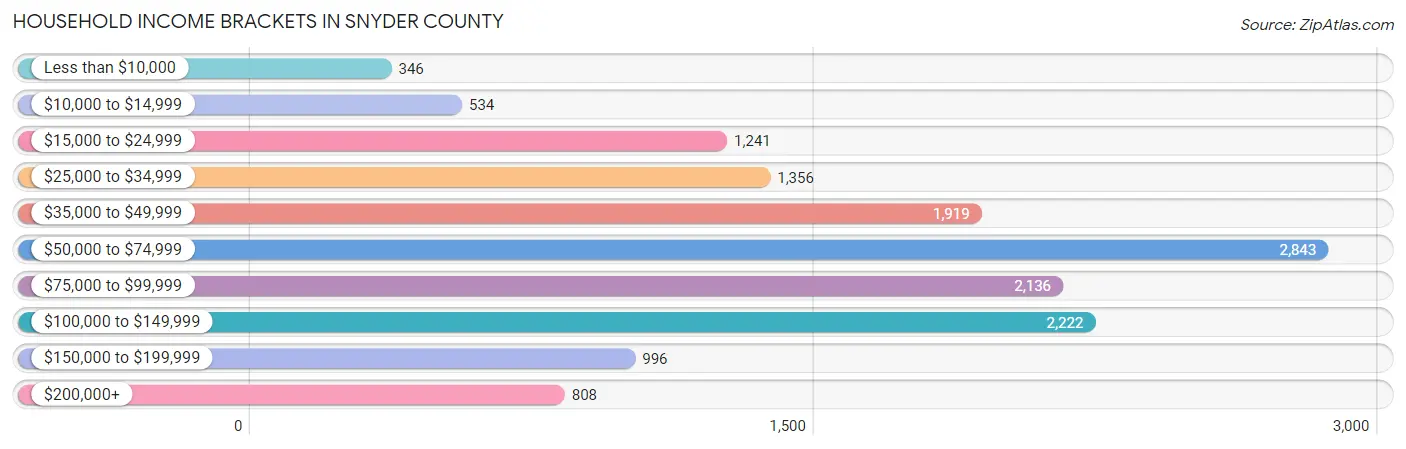
Household Income Brackets in Snyder County
With 2,843 households falling in the category, the $50,000 to $74,999 income range is the most frequent in Snyder County, accounting for 19.7% of all households. In contrast, only 346 households (2.4%) fall into the less than $10,000 income bracket, making it the least populous group.
| Income Bracket | # Households | % Households |
| Less than $10,000 | 346 | 2.4% |
| $10,000 to $14,999 | 534 | 3.7% |
| $15,000 to $24,999 | 1,241 | 8.6% |
| $25,000 to $34,999 | 1,356 | 9.4% |
| $35,000 to $49,999 | 1,919 | 13.3% |
| $50,000 to $74,999 | 2,843 | 19.7% |
| $75,000 to $99,999 | 2,136 | 14.8% |
| $100,000 to $149,999 | 2,222 | 15.4% |
| $150,000 to $199,999 | 996 | 6.9% |
| $200,000+ | 808 | 5.6% |
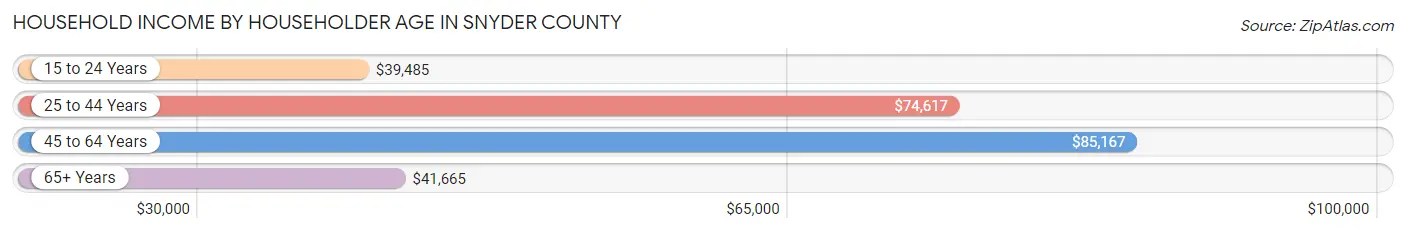
Household Income by Householder Age in Snyder County
The median household income in Snyder County is $65,914, with the highest median household income of $85,167 found in the 45 to 64 years age bracket for the primary householder. A total of 5,326 households (36.9%) fall into this category. Meanwhile, the 15 to 24 years age bracket for the primary householder has the lowest median household income of $39,485, with 273 households (1.9%) in this group.
| Income Bracket | # Households | Median Income |
| 15 to 24 Years | 273 (1.9%) | $39,485 |
| 25 to 44 Years | 3,842 (26.6%) | $74,617 |
| 45 to 64 Years | 5,326 (36.9%) | $85,167 |
| 65+ Years | 4,989 (34.6%) | $41,665 |
| Total | 14,430 (100.0%) | $65,914 |
Poverty in Snyder County
Income Below Poverty by Sex and Age in Snyder County
With 7.8% poverty level for males and 8.9% for females among the residents of Snyder County, 15 year old males and 5 year old females are the most vulnerable to poverty, with 116 males (33.1%) and 64 females (27.4%) in their respective age groups living below the poverty level.
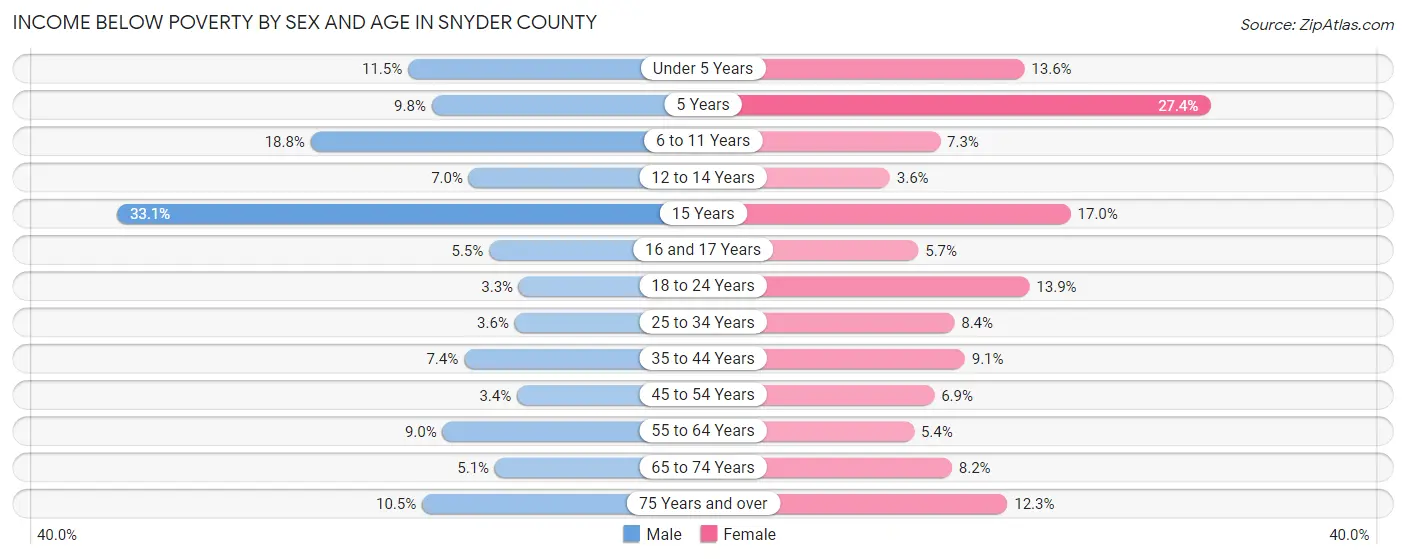
| Age Bracket | Male | Female |
| Under 5 Years | 126 (11.5%) | 133 (13.6%) |
| 5 Years | 25 (9.8%) | 64 (27.4%) |
| 6 to 11 Years | 260 (18.8%) | 88 (7.3%) |
| 12 to 14 Years | 53 (7.0%) | 24 (3.6%) |
| 15 Years | 116 (33.1%) | 26 (17.0%) |
| 16 and 17 Years | 25 (5.5%) | 32 (5.7%) |
| 18 to 24 Years | 49 (3.3%) | 171 (13.9%) |
| 25 to 34 Years | 79 (3.6%) | 175 (8.4%) |
| 35 to 44 Years | 155 (7.4%) | 193 (9.1%) |
| 45 to 54 Years | 84 (3.4%) | 160 (6.9%) |
| 55 to 64 Years | 239 (9.0%) | 139 (5.4%) |
| 65 to 74 Years | 105 (5.1%) | 176 (8.2%) |
| 75 Years and over | 138 (10.5%) | 266 (12.3%) |
| Total | 1,454 (7.8%) | 1,647 (8.9%) |
Income Above Poverty by Sex and Age in Snyder County
According to the poverty statistics in Snyder County, males aged 18 to 24 years and females aged 12 to 14 years are the age groups that are most secure financially, with 96.7% of males and 96.4% of females in these age groups living above the poverty line.
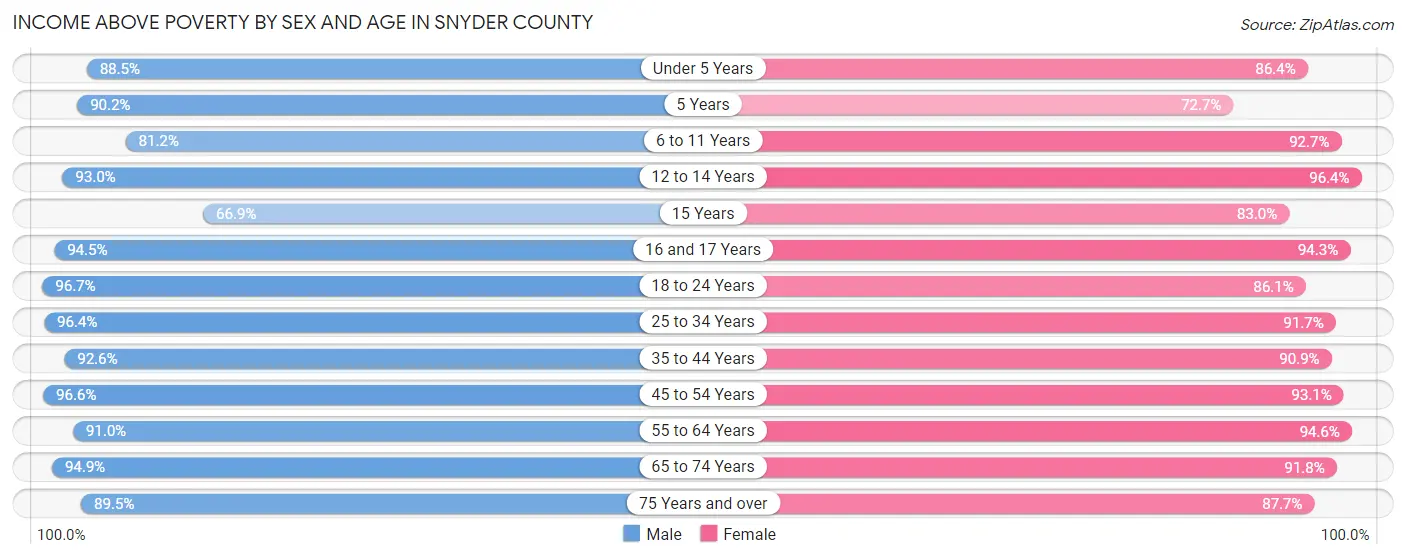
| Age Bracket | Male | Female |
| Under 5 Years | 967 (88.5%) | 848 (86.4%) |
| 5 Years | 231 (90.2%) | 170 (72.7%) |
| 6 to 11 Years | 1,126 (81.2%) | 1,117 (92.7%) |
| 12 to 14 Years | 702 (93.0%) | 649 (96.4%) |
| 15 Years | 234 (66.9%) | 127 (83.0%) |
| 16 and 17 Years | 429 (94.5%) | 531 (94.3%) |
| 18 to 24 Years | 1,436 (96.7%) | 1,057 (86.1%) |
| 25 to 34 Years | 2,109 (96.4%) | 1,922 (91.6%) |
| 35 to 44 Years | 1,949 (92.6%) | 1,921 (90.9%) |
| 45 to 54 Years | 2,358 (96.6%) | 2,173 (93.1%) |
| 55 to 64 Years | 2,424 (91.0%) | 2,453 (94.6%) |
| 65 to 74 Years | 1,962 (94.9%) | 1,977 (91.8%) |
| 75 Years and over | 1,177 (89.5%) | 1,898 (87.7%) |
| Total | 17,104 (92.2%) | 16,843 (91.1%) |
Income Below Poverty Among Married-Couple Families in Snyder County
The poverty statistics for married-couple families in Snyder County show that 3.6% or 286 of the total 8,039 families live below the poverty line. Families with 5 or more children have the highest poverty rate of 22.3%, comprising of 29 families. On the other hand, families with 1 or 2 children have the lowest poverty rate of 2.0%, which includes 42 families.
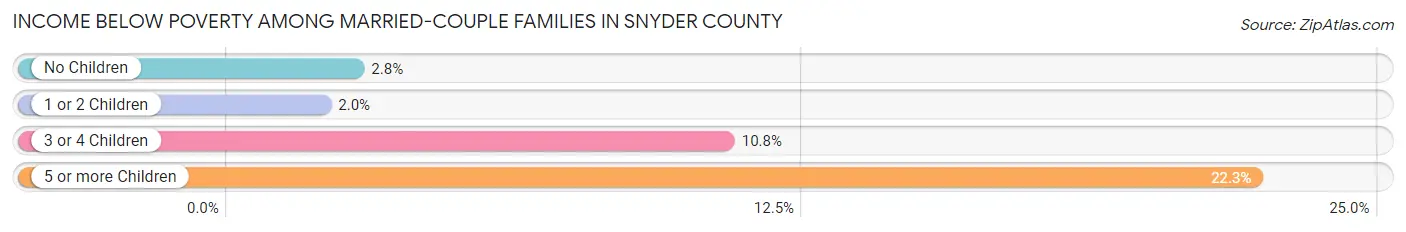
| Children | Above Poverty | Below Poverty |
| No Children | 5,026 (97.3%) | 142 (2.8%) |
| 1 or 2 Children | 2,024 (98.0%) | 42 (2.0%) |
| 3 or 4 Children | 602 (89.2%) | 73 (10.8%) |
| 5 or more Children | 101 (77.7%) | 29 (22.3%) |
| Total | 7,753 (96.4%) | 286 (3.6%) |
Income Below Poverty Among Single-Parent Households in Snyder County
According to the poverty data in Snyder County, 8.1% or 50 single-father households and 12.4% or 163 single-mother households are living below the poverty line. Among single-father households, those with 3 or 4 children have the highest poverty rate, with 4 households (15.4%) experiencing poverty. Likewise, among single-mother households, those with 5 or more children have the highest poverty rate, with 10 households (50.0%) falling below the poverty line.
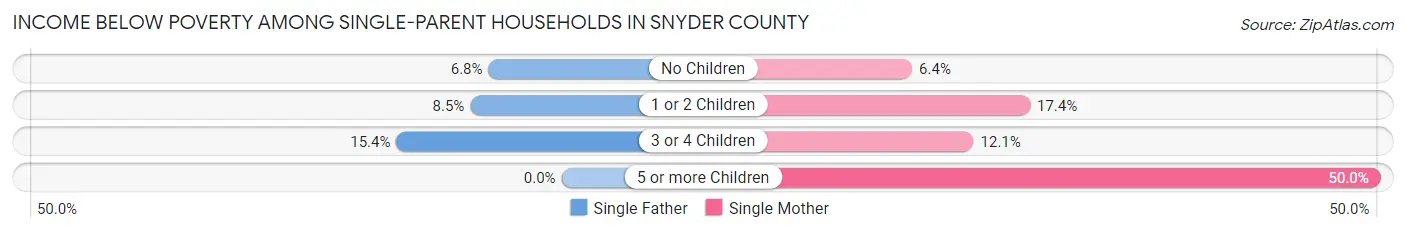
| Children | Single Father | Single Mother |
| No Children | 16 (6.8%) | 38 (6.4%) |
| 1 or 2 Children | 30 (8.5%) | 100 (17.4%) |
| 3 or 4 Children | 4 (15.4%) | 15 (12.1%) |
| 5 or more Children | 0 (0.0%) | 10 (50.0%) |
| Total | 50 (8.1%) | 163 (12.4%) |
Income Below Poverty Among Married-Couple vs Single-Parent Households in Snyder County
The poverty data for Snyder County shows that 286 of the married-couple family households (3.6%) and 213 of the single-parent households (11.0%) are living below the poverty level. Within the married-couple family households, those with 5 or more children have the highest poverty rate, with 29 households (22.3%) falling below the poverty line. Among the single-parent households, those with 5 or more children have the highest poverty rate, with 10 household (50.0%) living below poverty.
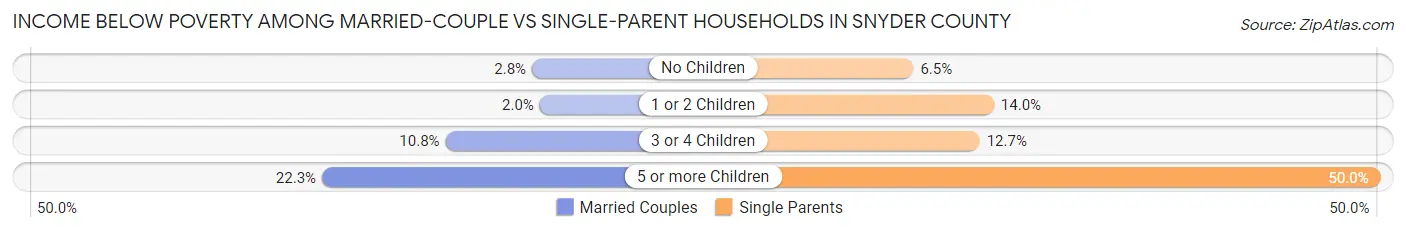
| Children | Married-Couple Families | Single-Parent Households |
| No Children | 142 (2.8%) | 54 (6.5%) |
| 1 or 2 Children | 42 (2.0%) | 130 (14.0%) |
| 3 or 4 Children | 73 (10.8%) | 19 (12.7%) |
| 5 or more Children | 29 (22.3%) | 10 (50.0%) |
| Total | 286 (3.6%) | 213 (11.0%) |
Race in Snyder County
The most populous races in Snyder County are White / Caucasian (37,992 | 95.5%), Two or more Races (947 | 2.4%), and Hispanic or Latino (931 | 2.3%).
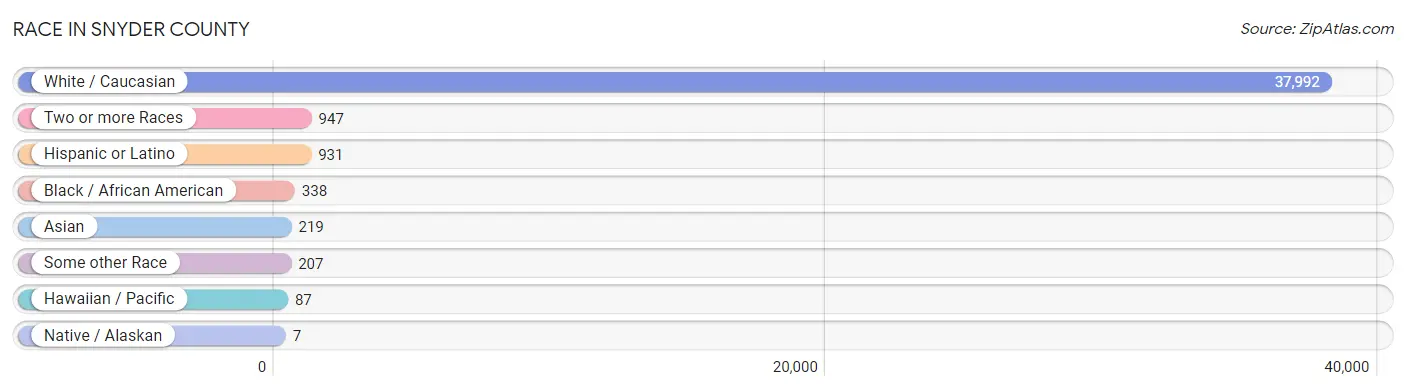
| Race | # Population | % Population |
| Asian | 219 | 0.5% |
| Black / African American | 338 | 0.9% |
| Hawaiian / Pacific | 87 | 0.2% |
| Hispanic or Latino | 931 | 2.3% |
| Native / Alaskan | 7 | 0.0% |
| White / Caucasian | 37,992 | 95.5% |
| Two or more Races | 947 | 2.4% |
| Some other Race | 207 | 0.5% |
| Total | 39,797 | 100.0% |
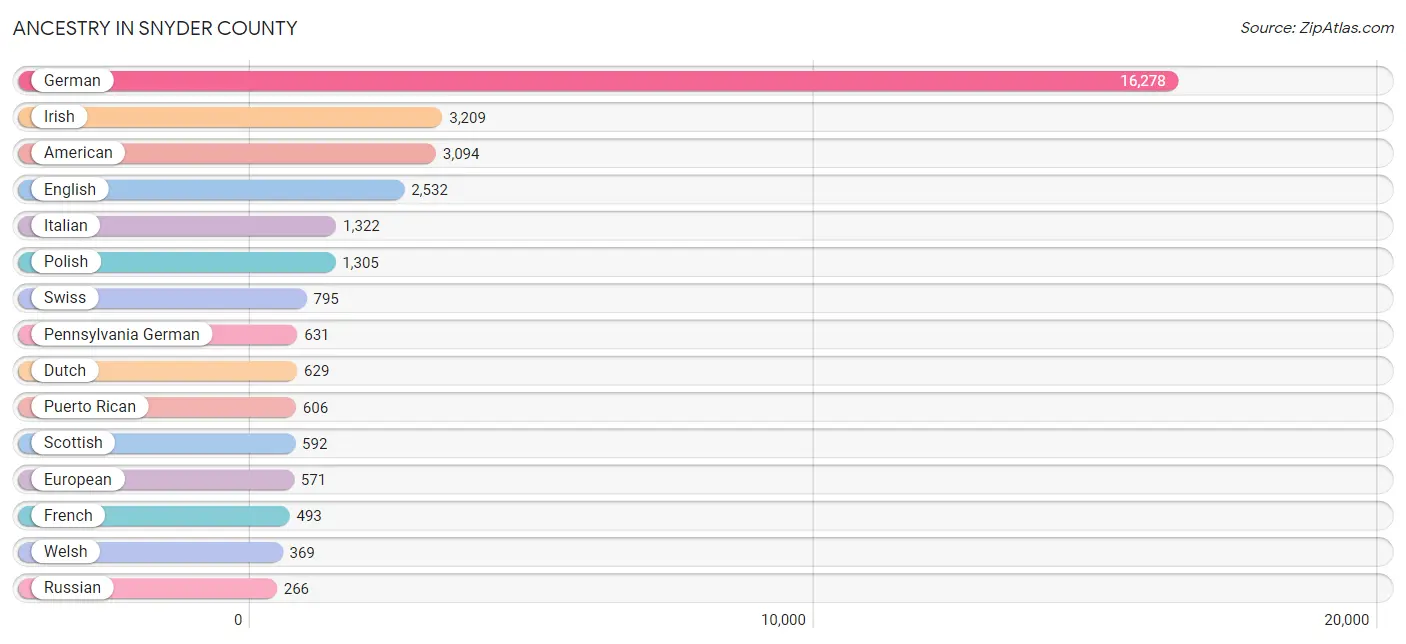
Ancestry in Snyder County
The most populous ancestries reported in Snyder County are German (16,278 | 40.9%), Irish (3,209 | 8.1%), American (3,094 | 7.8%), English (2,532 | 6.4%), and Italian (1,322 | 3.3%), together accounting for 66.4% of all Snyder County residents.
| Ancestry | # Population | % Population |
| African | 24 | 0.1% |
| Albanian | 3 | 0.0% |
| Aleut | 1 | 0.0% |
| American | 3,094 | 7.8% |
| Arab | 14 | 0.0% |
| Armenian | 4 | 0.0% |
| Australian | 6 | 0.0% |
| Austrian | 20 | 0.1% |
| Belgian | 15 | 0.0% |
| Bhutanese | 2 | 0.0% |
| Brazilian | 29 | 0.1% |
| British | 148 | 0.4% |
| Burmese | 40 | 0.1% |
| Canadian | 41 | 0.1% |
| Carpatho Rusyn | 3 | 0.0% |
| Central American | 26 | 0.1% |
| Cherokee | 28 | 0.1% |
| Choctaw | 1 | 0.0% |
| Croatian | 17 | 0.0% |
| Cuban | 31 | 0.1% |
| Cypriot | 4 | 0.0% |
| Czech | 95 | 0.2% |
| Czechoslovakian | 32 | 0.1% |
| Danish | 23 | 0.1% |
| Delaware | 3 | 0.0% |
| Dominican | 67 | 0.2% |
| Dutch | 629 | 1.6% |
| Eastern European | 142 | 0.4% |
| Ecuadorian | 19 | 0.1% |
| English | 2,532 | 6.4% |
| European | 571 | 1.4% |
| French | 493 | 1.2% |
| French Canadian | 60 | 0.2% |
| German | 16,278 | 40.9% |
| Greek | 136 | 0.3% |
| Guatemalan | 9 | 0.0% |
| Haitian | 1 | 0.0% |
| Honduran | 3 | 0.0% |
| Hungarian | 124 | 0.3% |
| Indian (Asian) | 99 | 0.3% |
| Irish | 3,209 | 8.1% |
| Iroquois | 3 | 0.0% |
| Italian | 1,322 | 3.3% |
| Jamaican | 27 | 0.1% |
| Korean | 101 | 0.3% |
| Laotian | 6 | 0.0% |
| Lebanese | 5 | 0.0% |
| Lithuanian | 59 | 0.2% |
| Luxembourger | 14 | 0.0% |
| Mexican | 82 | 0.2% |
| Native Hawaiian | 1 | 0.0% |
| Navajo | 5 | 0.0% |
| Nigerian | 6 | 0.0% |
| Northern European | 19 | 0.1% |
| Norwegian | 50 | 0.1% |
| Panamanian | 2 | 0.0% |
| Pennsylvania German | 631 | 1.6% |
| Peruvian | 11 | 0.0% |
| Polish | 1,305 | 3.3% |
| Portuguese | 19 | 0.1% |
| Puerto Rican | 606 | 1.5% |
| Romanian | 6 | 0.0% |
| Russian | 266 | 0.7% |
| Salvadoran | 12 | 0.0% |
| Scandinavian | 74 | 0.2% |
| Scotch-Irish | 169 | 0.4% |
| Scottish | 592 | 1.5% |
| Slavic | 27 | 0.1% |
| Slovak | 82 | 0.2% |
| Slovene | 15 | 0.0% |
| South American | 35 | 0.1% |
| Spaniard | 56 | 0.1% |
| Sri Lankan | 38 | 0.1% |
| Subsaharan African | 30 | 0.1% |
| Swedish | 120 | 0.3% |
| Swiss | 795 | 2.0% |
| Syrian | 9 | 0.0% |
| Thai | 26 | 0.1% |
| Tongan | 1 | 0.0% |
| Turkish | 9 | 0.0% |
| Ukrainian | 121 | 0.3% |
| Uruguayan | 5 | 0.0% |
| Welsh | 369 | 0.9% |
| Yugoslavian | 56 | 0.1% | View All 84 Rows |
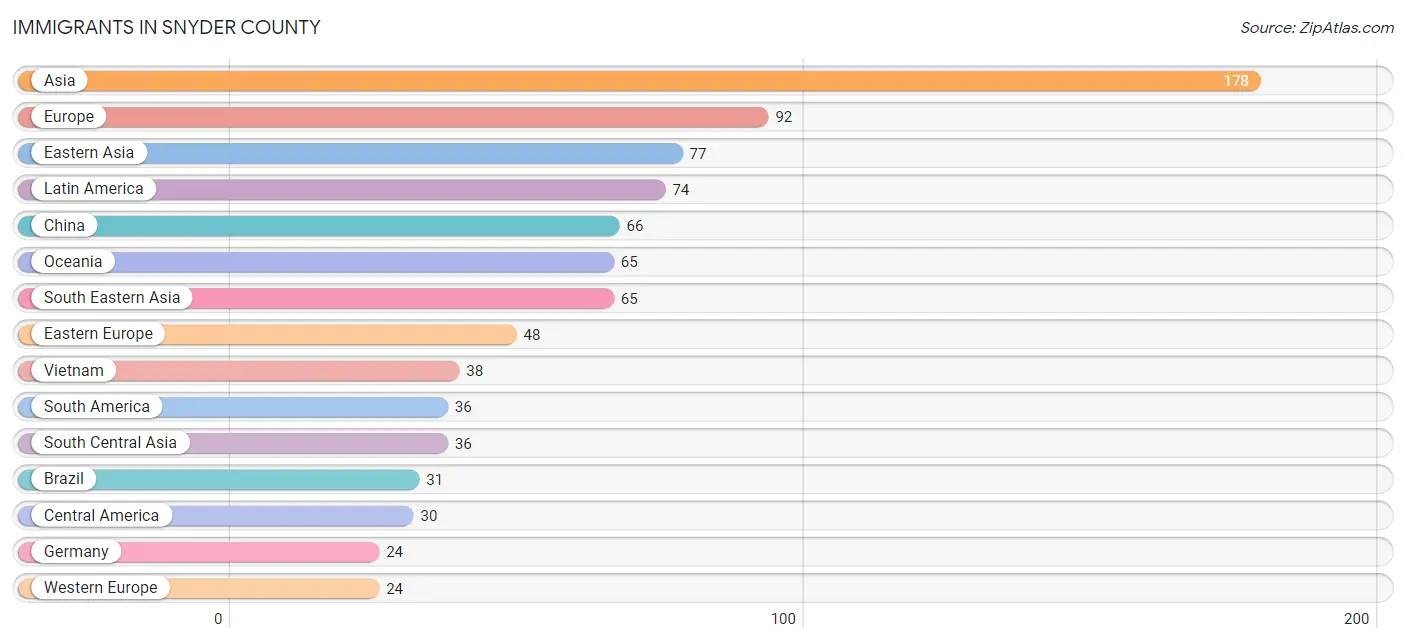
Immigrants in Snyder County
The most numerous immigrant groups reported in Snyder County came from Asia (178 | 0.4%), Europe (92 | 0.2%), Eastern Asia (77 | 0.2%), Latin America (74 | 0.2%), and China (66 | 0.2%), together accounting for 1.2% of all Snyder County residents.
| Immigration Origin | # Population | % Population |
| Africa | 15 | 0.0% |
| Asia | 178 | 0.4% |
| Australia | 2 | 0.0% |
| Brazil | 31 | 0.1% |
| Canada | 22 | 0.1% |
| Caribbean | 8 | 0.0% |
| Central America | 30 | 0.1% |
| China | 66 | 0.2% |
| Eastern Asia | 77 | 0.2% |
| Eastern Europe | 48 | 0.1% |
| Egypt | 14 | 0.0% |
| El Salvador | 7 | 0.0% |
| England | 7 | 0.0% |
| Europe | 92 | 0.2% |
| Germany | 24 | 0.1% |
| Guatemala | 9 | 0.0% |
| Haiti | 1 | 0.0% |
| Honduras | 1 | 0.0% |
| Hungary | 18 | 0.1% |
| India | 2 | 0.0% |
| Indonesia | 6 | 0.0% |
| Jamaica | 7 | 0.0% |
| Kazakhstan | 22 | 0.1% |
| Korea | 11 | 0.0% |
| Latin America | 74 | 0.2% |
| Mexico | 11 | 0.0% |
| Northern Africa | 14 | 0.0% |
| Northern Europe | 20 | 0.1% |
| Oceania | 65 | 0.2% |
| Pakistan | 12 | 0.0% |
| Panama | 2 | 0.0% |
| Philippines | 21 | 0.1% |
| Poland | 2 | 0.0% |
| Russia | 23 | 0.1% |
| Scotland | 2 | 0.0% |
| South Africa | 1 | 0.0% |
| South America | 36 | 0.1% |
| South Central Asia | 36 | 0.1% |
| South Eastern Asia | 65 | 0.2% |
| Ukraine | 5 | 0.0% |
| Uruguay | 5 | 0.0% |
| Vietnam | 38 | 0.1% |
| Western Europe | 24 | 0.1% | View All 43 Rows |
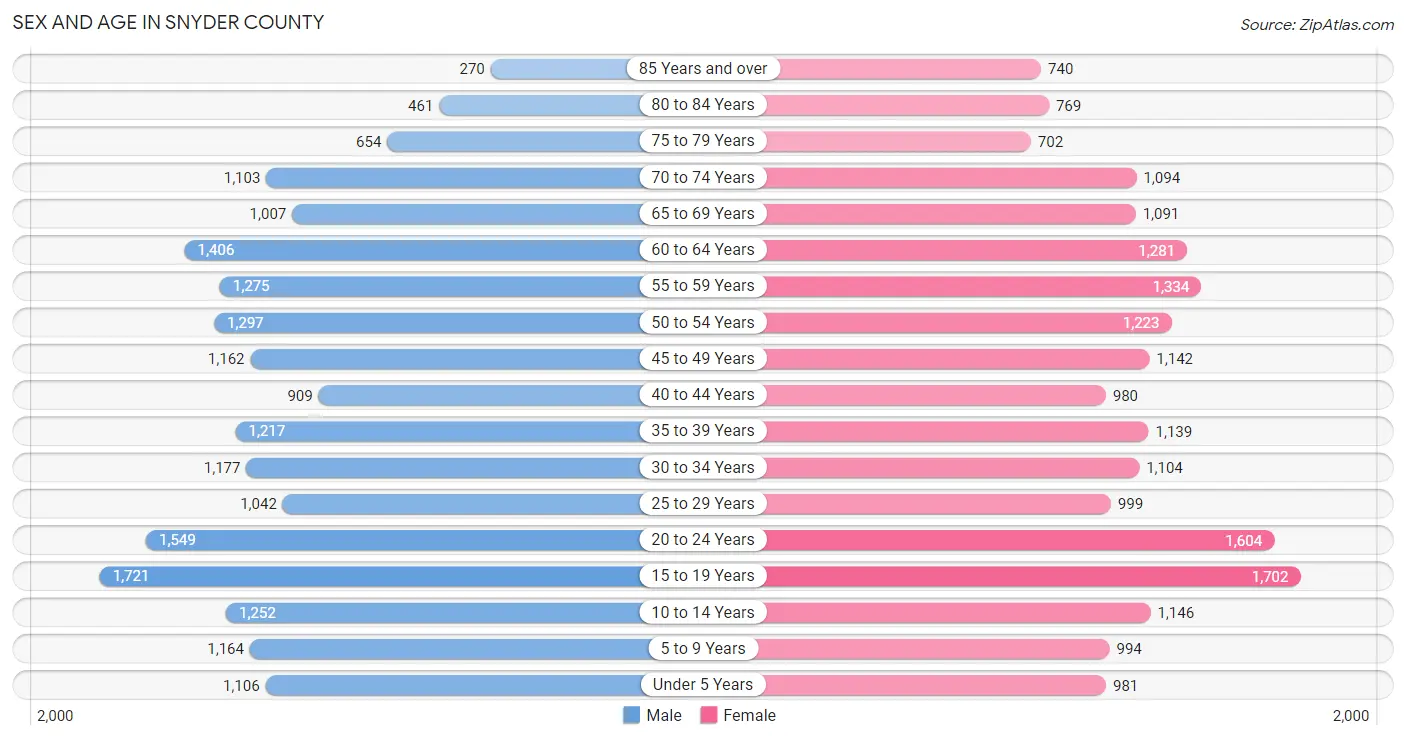
Sex and Age in Snyder County
Sex and Age in Snyder County
The most populous age groups in Snyder County are 15 to 19 Years (1,721 | 8.7%) for men and 15 to 19 Years (1,702 | 8.5%) for women.
| Age Bracket | Male | Female |
| Under 5 Years | 1,106 (5.6%) | 981 (4.9%) |
| 5 to 9 Years | 1,164 (5.9%) | 994 (5.0%) |
| 10 to 14 Years | 1,252 (6.3%) | 1,146 (5.7%) |
| 15 to 19 Years | 1,721 (8.7%) | 1,702 (8.5%) |
| 20 to 24 Years | 1,549 (7.8%) | 1,604 (8.0%) |
| 25 to 29 Years | 1,042 (5.3%) | 999 (5.0%) |
| 30 to 34 Years | 1,177 (5.9%) | 1,104 (5.5%) |
| 35 to 39 Years | 1,217 (6.2%) | 1,139 (5.7%) |
| 40 to 44 Years | 909 (4.6%) | 980 (4.9%) |
| 45 to 49 Years | 1,162 (5.9%) | 1,142 (5.7%) |
| 50 to 54 Years | 1,297 (6.6%) | 1,223 (6.1%) |
| 55 to 59 Years | 1,275 (6.5%) | 1,334 (6.7%) |
| 60 to 64 Years | 1,406 (7.1%) | 1,281 (6.4%) |
| 65 to 69 Years | 1,007 (5.1%) | 1,091 (5.4%) |
| 70 to 74 Years | 1,103 (5.6%) | 1,094 (5.5%) |
| 75 to 79 Years | 654 (3.3%) | 702 (3.5%) |
| 80 to 84 Years | 461 (2.3%) | 769 (3.8%) |
| 85 Years and over | 270 (1.4%) | 740 (3.7%) |
| Total | 19,772 (100.0%) | 20,025 (100.0%) |
Families and Households in Snyder County
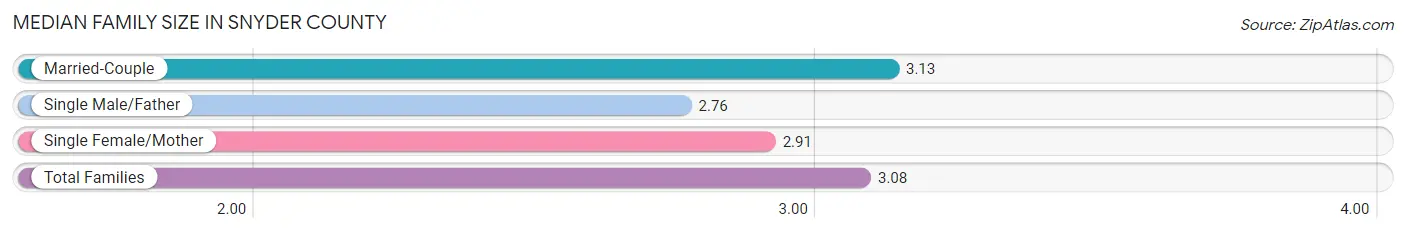
Median Family Size in Snyder County
The median family size in Snyder County is 3.08 persons per family, with married-couple families (8,039 | 80.6%) accounting for the largest median family size of 3.13 persons per family. On the other hand, single male/father families (614 | 6.2%) represent the smallest median family size with 2.76 persons per family.
| Family Type | # Families | Family Size |
| Married-Couple | 8,039 (80.6%) | 3.13 |
| Single Male/Father | 614 (6.2%) | 2.76 |
| Single Female/Mother | 1,316 (13.2%) | 2.91 |
| Total Families | 9,969 (100.0%) | 3.08 |
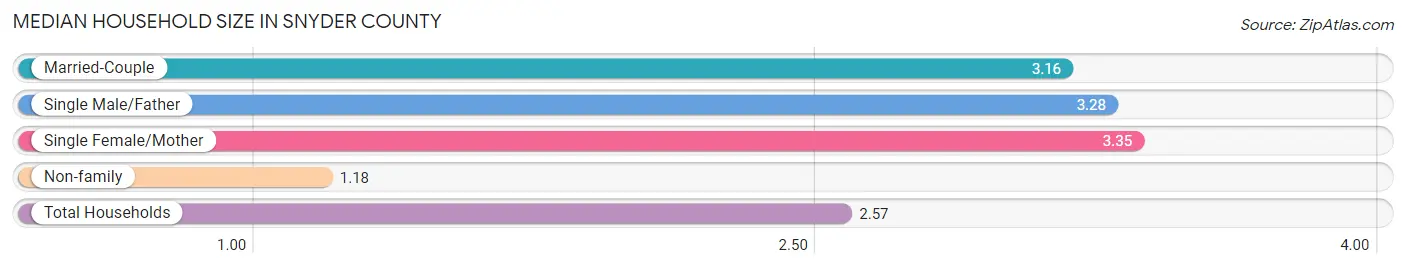
Median Household Size in Snyder County
The median household size in Snyder County is 2.57 persons per household, with single female/mother households (1,316 | 9.1%) accounting for the largest median household size of 3.35 persons per household. non-family households (4,461 | 30.9%) represent the smallest median household size with 1.18 persons per household.
| Household Type | # Households | Household Size |
| Married-Couple | 8,039 (55.7%) | 3.16 |
| Single Male/Father | 614 (4.3%) | 3.28 |
| Single Female/Mother | 1,316 (9.1%) | 3.35 |
| Non-family | 4,461 (30.9%) | 1.18 |
| Total Households | 14,430 (100.0%) | 2.57 |
Household Size by Marriage Status in Snyder County
Out of a total of 14,430 households in Snyder County, 9,969 (69.1%) are family households, while 4,461 (30.9%) are nonfamily households. The most numerous type of family households are 2-person households, comprising 4,768, and the most common type of nonfamily households are 1-person households, comprising 3,682.
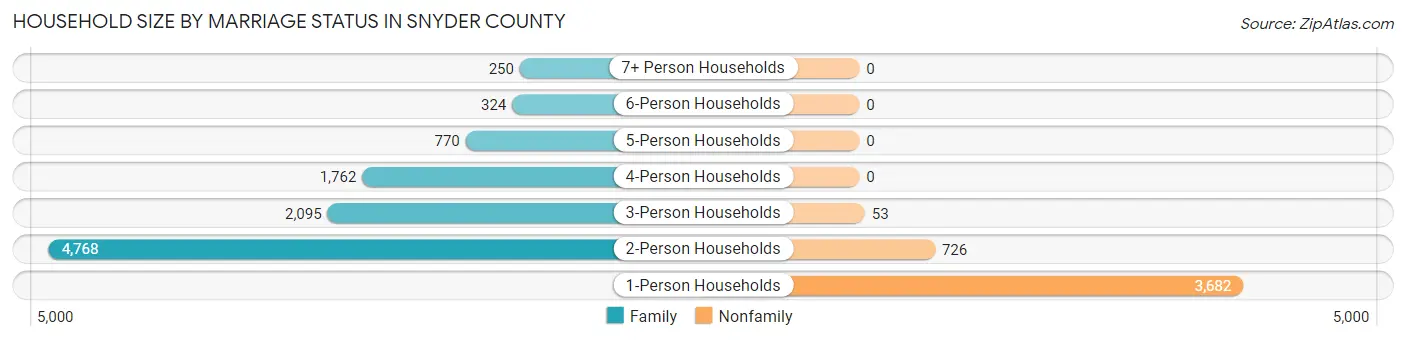
| Household Size | Family Households | Nonfamily Households |
| 1-Person Households | - | 3,682 (25.5%) |
| 2-Person Households | 4,768 (33.0%) | 726 (5.0%) |
| 3-Person Households | 2,095 (14.5%) | 53 (0.4%) |
| 4-Person Households | 1,762 (12.2%) | 0 (0.0%) |
| 5-Person Households | 770 (5.3%) | 0 (0.0%) |
| 6-Person Households | 324 (2.2%) | 0 (0.0%) |
| 7+ Person Households | 250 (1.7%) | 0 (0.0%) |
| Total | 9,969 (69.1%) | 4,461 (30.9%) |
Female Fertility in Snyder County
Fertility by Age in Snyder County
Average fertility rate in Snyder County is 45.0 births per 1,000 women. Women in the age bracket of 20 to 34 years have the highest fertility rate with 91.0 births per 1,000 women. Women in the age bracket of 20 to 34 years acount for 82.7% of all women with births.
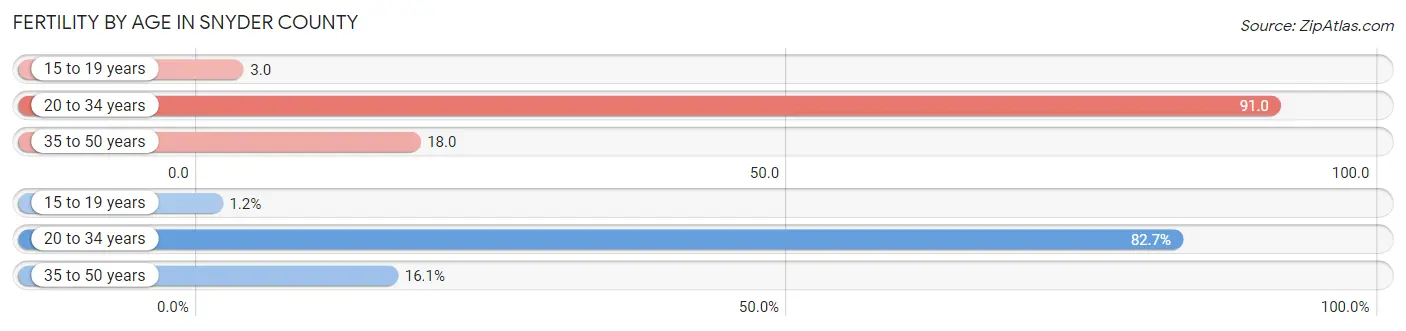
| Age Bracket | Women with Births | Births / 1,000 Women |
| 15 to 19 years | 5 (1.2%) | 3.0 |
| 20 to 34 years | 339 (82.7%) | 91.0 |
| 35 to 50 years | 66 (16.1%) | 18.0 |
| Total | 410 (100.0%) | 45.0 |
Fertility by Age by Marriage Status in Snyder County
64.9% of women with births (410) in Snyder County are married. The highest percentage of unmarried women with births falls into 15 to 19 years age bracket with 100.0% of them unmarried at the time of birth, while the lowest percentage of unmarried women with births belong to 35 to 50 years age bracket with 13.6% of them unmarried.
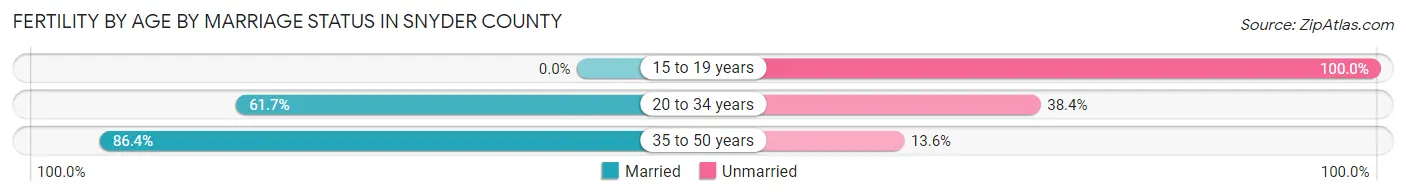
| Age Bracket | Married | Unmarried |
| 15 to 19 years | 0 (0.0%) | 5 (100.0%) |
| 20 to 34 years | 209 (61.7%) | 130 (38.4%) |
| 35 to 50 years | 57 (86.4%) | 9 (13.6%) |
| Total | 266 (64.9%) | 144 (35.1%) |
Fertility by Education in Snyder County
Average fertility rate in Snyder County is 45.0 births per 1,000 women. Women with the education attainment of less than high school have the highest fertility rate of 76.0 births per 1,000 women, while women with the education attainment of college or associate's degree have the lowest fertility at 24.0 births per 1,000 women. Women with the education attainment of less than high school represent 27.6% of all women with births.
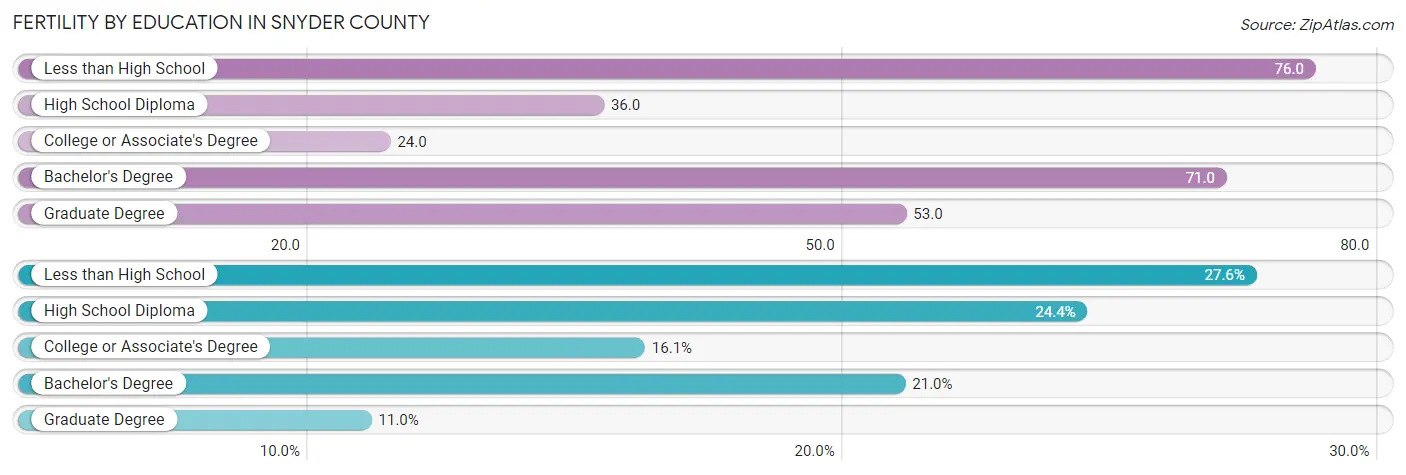
| Educational Attainment | Women with Births | Births / 1,000 Women |
| Less than High School | 113 (27.6%) | 76.0 |
| High School Diploma | 100 (24.4%) | 36.0 |
| College or Associate's Degree | 66 (16.1%) | 24.0 |
| Bachelor's Degree | 86 (21.0%) | 71.0 |
| Graduate Degree | 45 (11.0%) | 53.0 |
| Total | 410 (100.0%) | 45.0 |
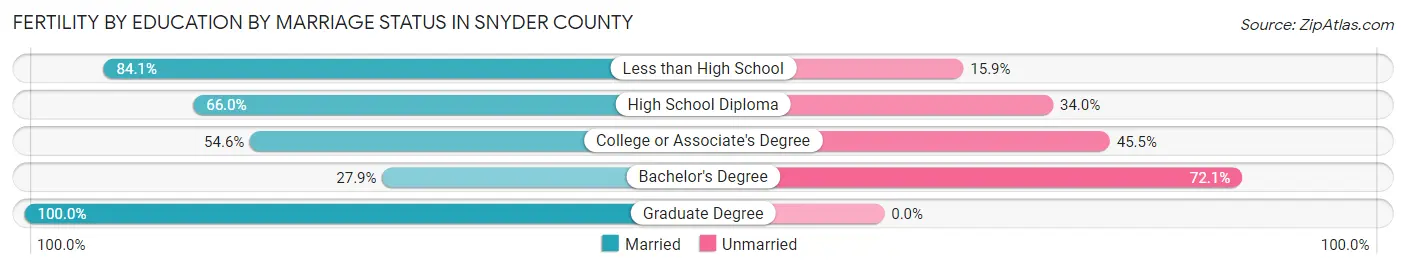
Fertility by Education by Marriage Status in Snyder County
35.1% of women with births in Snyder County are unmarried. Women with the educational attainment of graduate degree are most likely to be married with 100.0% of them married at childbirth, while women with the educational attainment of bachelor's degree are least likely to be married with 72.1% of them unmarried at childbirth.
| Educational Attainment | Married | Unmarried |
| Less than High School | 95 (84.1%) | 18 (15.9%) |
| High School Diploma | 66 (66.0%) | 34 (34.0%) |
| College or Associate's Degree | 36 (54.5%) | 30 (45.5%) |
| Bachelor's Degree | 24 (27.9%) | 62 (72.1%) |
| Graduate Degree | 45 (100.0%) | 0 (0.0%) |
| Total | 266 (64.9%) | 144 (35.1%) |
Employment Characteristics in Snyder County
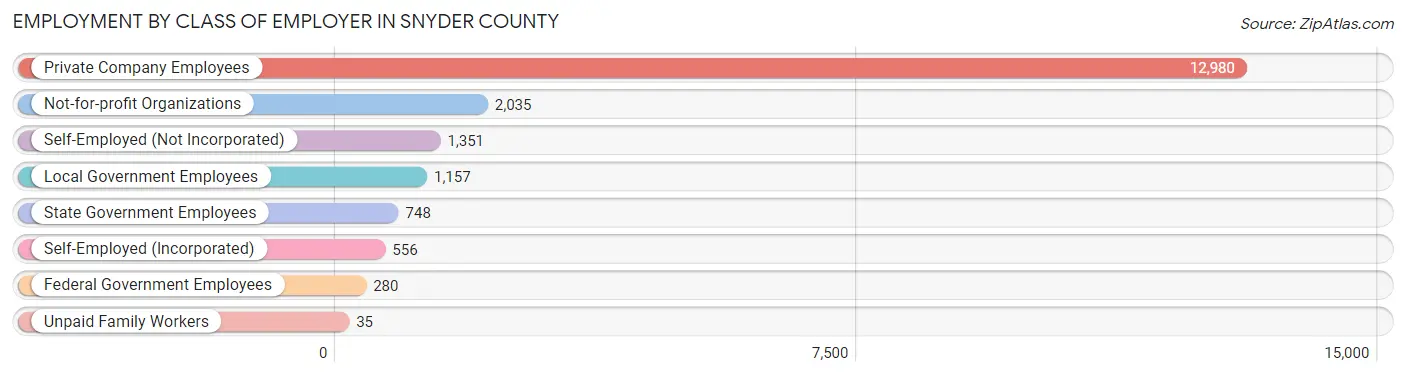
Employment by Class of Employer in Snyder County
Among the 19,142 employed individuals in Snyder County, private company employees (12,980 | 67.8%), not-for-profit organizations (2,035 | 10.6%), and self-employed (not incorporated) (1,351 | 7.1%) make up the most common classes of employment.
| Employer Class | # Employees | % Employees |
| Private Company Employees | 12,980 | 67.8% |
| Self-Employed (Incorporated) | 556 | 2.9% |
| Self-Employed (Not Incorporated) | 1,351 | 7.1% |
| Not-for-profit Organizations | 2,035 | 10.6% |
| Local Government Employees | 1,157 | 6.0% |
| State Government Employees | 748 | 3.9% |
| Federal Government Employees | 280 | 1.5% |
| Unpaid Family Workers | 35 | 0.2% |
| Total | 19,142 | 100.0% |
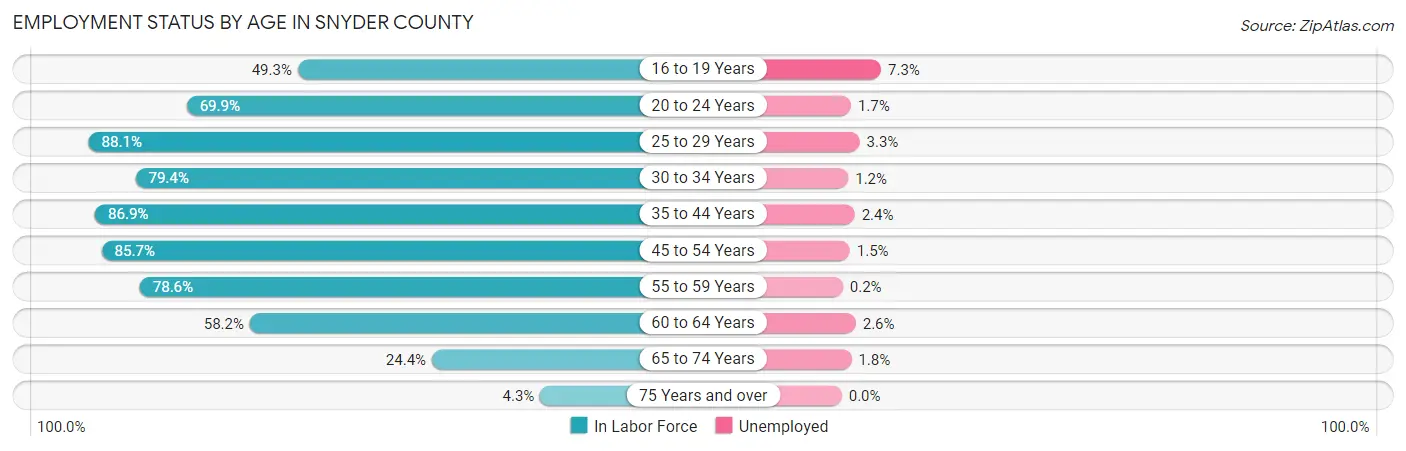
Employment Status by Age in Snyder County
According to the labor force statistics for Snyder County, out of the total population over 16 years of age (32,650), 60.9% or 19,884 individuals are in the labor force, with 2.2% or 437 of them unemployed. The age group with the highest labor force participation rate is 25 to 29 years, with 88.1% or 1,798 individuals in the labor force. Within the labor force, the 16 to 19 years age range has the highest percentage of unemployed individuals, with 7.3% or 105 of them being unemployed.
| Age Bracket | In Labor Force | Unemployed |
| 16 to 19 Years | 1,439 (49.3%) | 105 (7.3%) |
| 20 to 24 Years | 2,204 (69.9%) | 37 (1.7%) |
| 25 to 29 Years | 1,798 (88.1%) | 59 (3.3%) |
| 30 to 34 Years | 1,811 (79.4%) | 22 (1.2%) |
| 35 to 44 Years | 3,689 (86.9%) | 89 (2.4%) |
| 45 to 54 Years | 4,134 (85.7%) | 62 (1.5%) |
| 55 to 59 Years | 2,051 (78.6%) | 4 (0.2%) |
| 60 to 64 Years | 1,564 (58.2%) | 41 (2.6%) |
| 65 to 74 Years | 1,048 (24.4%) | 19 (1.8%) |
| 75 Years and over | 155 (4.3%) | 0 (0.0%) |
| Total | 19,884 (60.9%) | 437 (2.2%) |
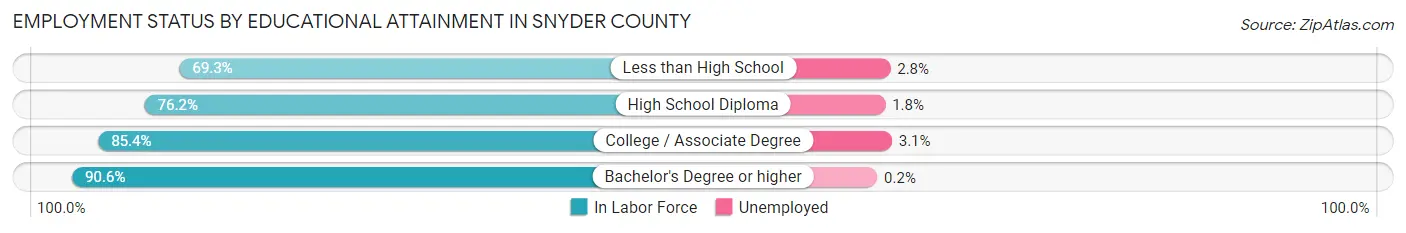
Employment Status by Educational Attainment in Snyder County
According to labor force statistics for Snyder County, 80.5% of individuals (15,043) out of the total population between 25 and 64 years of age (18,687) are in the labor force, with 1.8% or 271 of them being unemployed. The group with the highest labor force participation rate are those with the educational attainment of bachelor's degree or higher, with 90.6% or 3,733 individuals in the labor force. Within the labor force, individuals with college / associate degree education have the highest percentage of unemployment, with 3.1% or 108 of them being unemployed.
| Educational Attainment | In Labor Force | Unemployed |
| Less than High School | 1,661 (69.3%) | 67 (2.8%) |
| High School Diploma | 6,161 (76.2%) | 146 (1.8%) |
| College / Associate Degree | 3,489 (85.4%) | 127 (3.1%) |
| Bachelor's Degree or higher | 3,733 (90.6%) | 8 (0.2%) |
| Total | 15,043 (80.5%) | 336 (1.8%) |
Employment Occupations by Sex in Snyder County
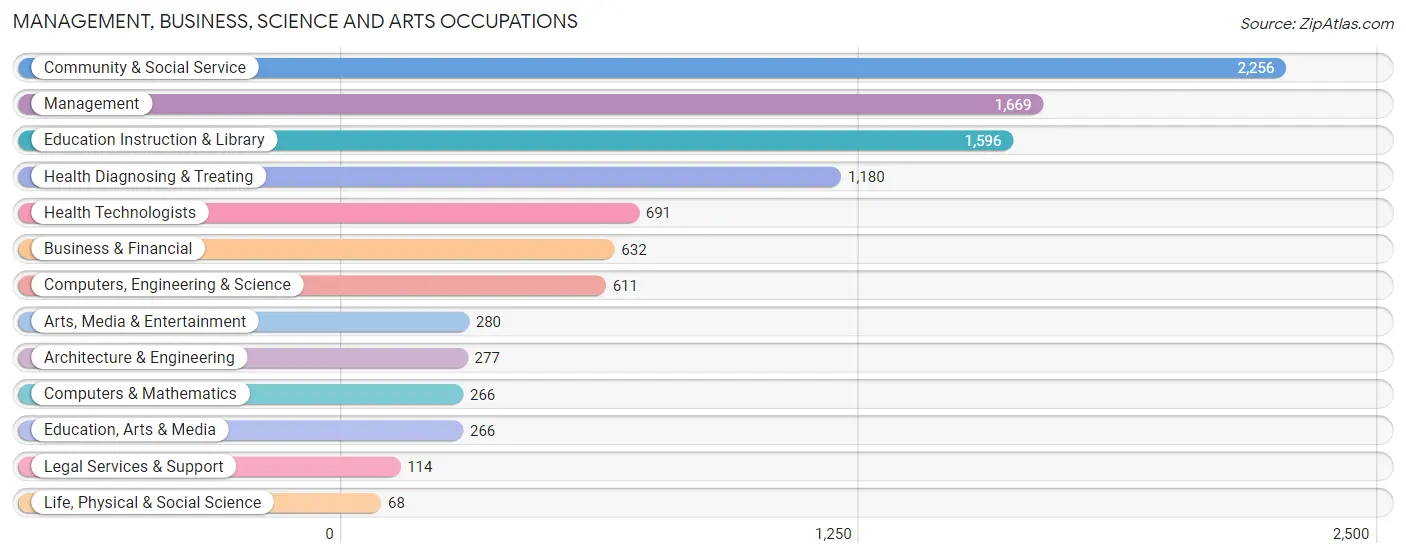
Management, Business, Science and Arts Occupations
The most common Management, Business, Science and Arts occupations in Snyder County are Community & Social Service (2,256 | 11.6%), Management (1,669 | 8.6%), Education Instruction & Library (1,596 | 8.2%), Health Diagnosing & Treating (1,180 | 6.1%), and Health Technologists (691 | 3.6%).
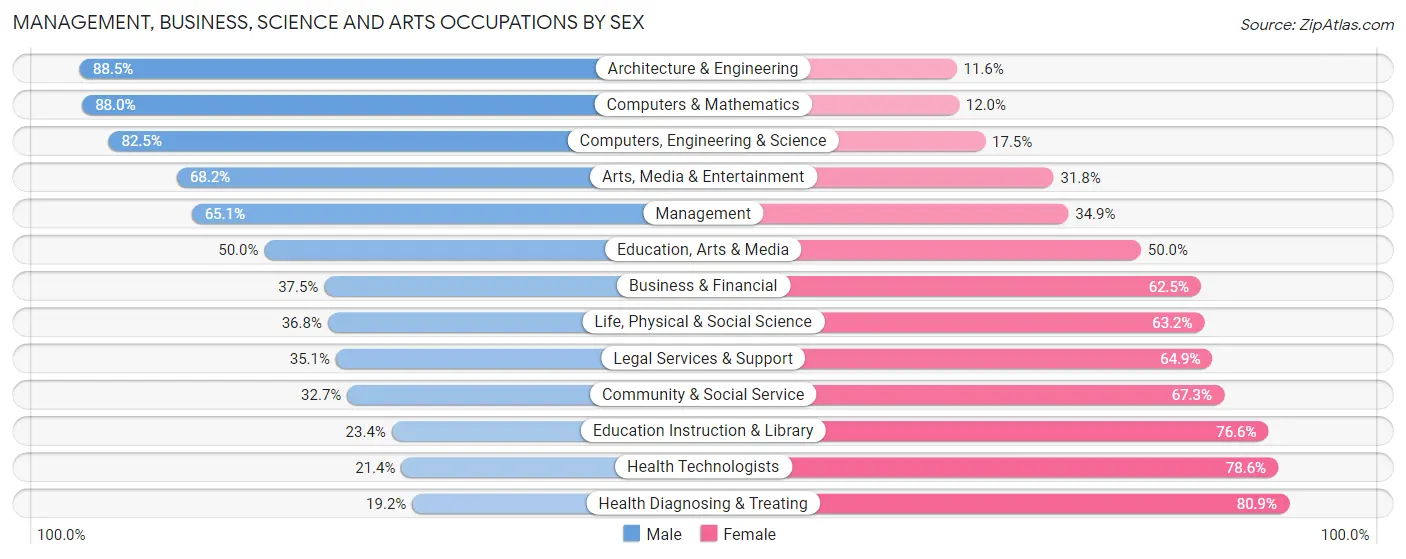
Management, Business, Science and Arts Occupations by Sex
Within the Management, Business, Science and Arts occupations in Snyder County, the most male-oriented occupations are Architecture & Engineering (88.4%), Computers & Mathematics (88.0%), and Computers, Engineering & Science (82.5%), while the most female-oriented occupations are Health Diagnosing & Treating (80.8%), Health Technologists (78.6%), and Education Instruction & Library (76.6%).
| Occupation | Male | Female |
| Management | 1,087 (65.1%) | 582 (34.9%) |
| Business & Financial | 237 (37.5%) | 395 (62.5%) |
| Computers, Engineering & Science | 504 (82.5%) | 107 (17.5%) |
| Computers & Mathematics | 234 (88.0%) | 32 (12.0%) |
| Architecture & Engineering | 245 (88.4%) | 32 (11.6%) |
| Life, Physical & Social Science | 25 (36.8%) | 43 (63.2%) |
| Community & Social Service | 738 (32.7%) | 1,518 (67.3%) |
| Education, Arts & Media | 133 (50.0%) | 133 (50.0%) |
| Legal Services & Support | 40 (35.1%) | 74 (64.9%) |
| Education Instruction & Library | 374 (23.4%) | 1,222 (76.6%) |
| Arts, Media & Entertainment | 191 (68.2%) | 89 (31.8%) |
| Health Diagnosing & Treating | 226 (19.2%) | 954 (80.8%) |
| Health Technologists | 148 (21.4%) | 543 (78.6%) |
| Total (Category) | 2,792 (44.0%) | 3,556 (56.0%) |
| Total (Overall) | 10,568 (54.4%) | 8,862 (45.6%) |
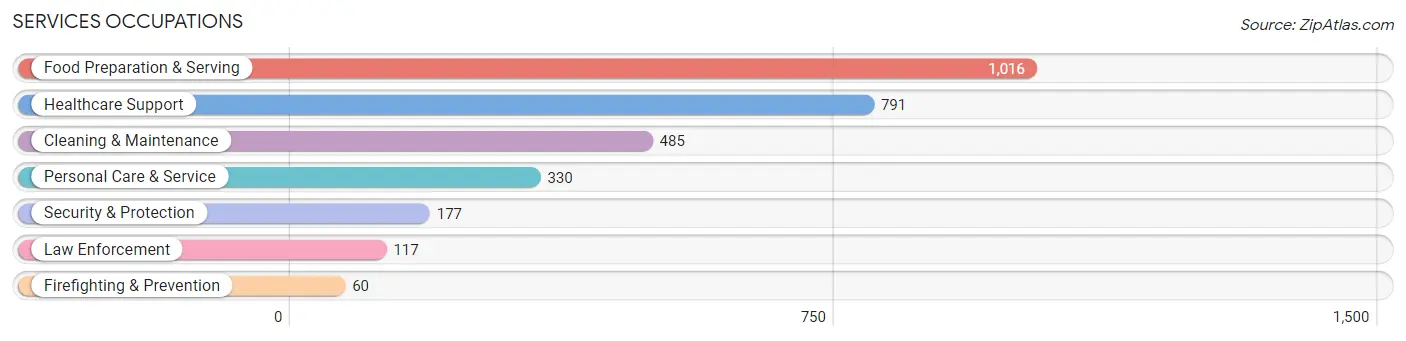
Services Occupations
The most common Services occupations in Snyder County are Food Preparation & Serving (1,016 | 5.2%), Healthcare Support (791 | 4.1%), Cleaning & Maintenance (485 | 2.5%), Personal Care & Service (330 | 1.7%), and Security & Protection (177 | 0.9%).
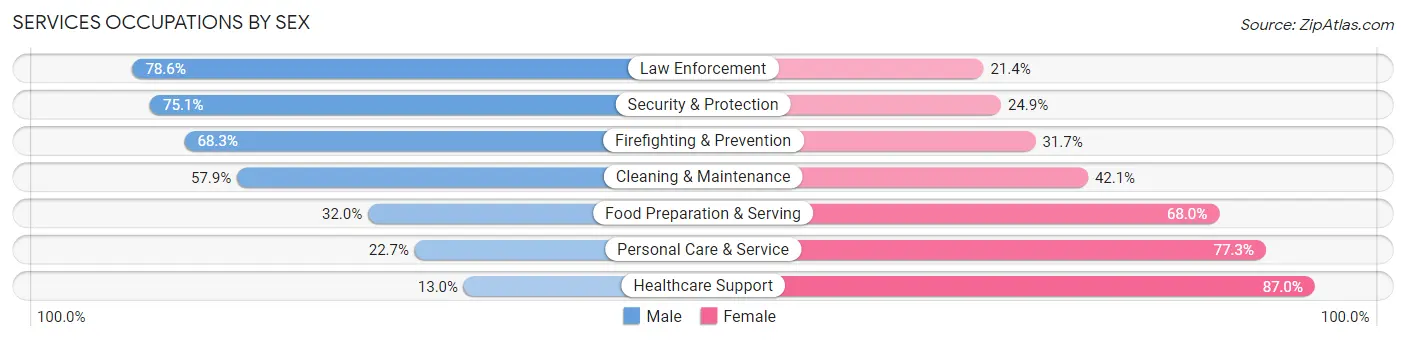
Services Occupations by Sex
Within the Services occupations in Snyder County, the most male-oriented occupations are Law Enforcement (78.6%), Security & Protection (75.1%), and Firefighting & Prevention (68.3%), while the most female-oriented occupations are Healthcare Support (87.0%), Personal Care & Service (77.3%), and Food Preparation & Serving (68.0%).
| Occupation | Male | Female |
| Healthcare Support | 103 (13.0%) | 688 (87.0%) |
| Security & Protection | 133 (75.1%) | 44 (24.9%) |
| Firefighting & Prevention | 41 (68.3%) | 19 (31.7%) |
| Law Enforcement | 92 (78.6%) | 25 (21.4%) |
| Food Preparation & Serving | 325 (32.0%) | 691 (68.0%) |
| Cleaning & Maintenance | 281 (57.9%) | 204 (42.1%) |
| Personal Care & Service | 75 (22.7%) | 255 (77.3%) |
| Total (Category) | 917 (32.8%) | 1,882 (67.2%) |
| Total (Overall) | 10,568 (54.4%) | 8,862 (45.6%) |
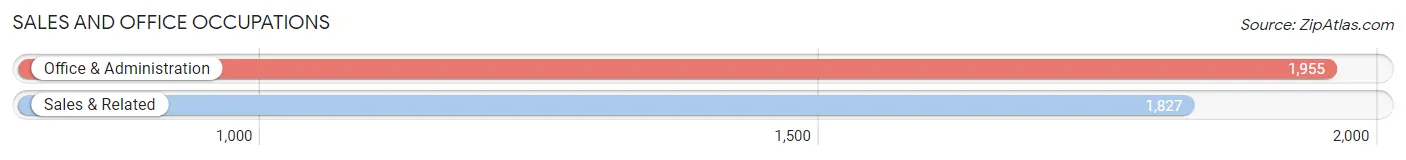
Sales and Office Occupations
The most common Sales and Office occupations in Snyder County are Office & Administration (1,955 | 10.1%), and Sales & Related (1,827 | 9.4%).
Sales and Office Occupations by Sex
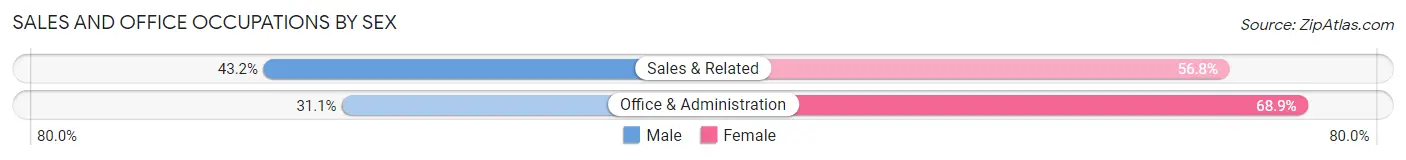
| Occupation | Male | Female |
| Sales & Related | 789 (43.2%) | 1,038 (56.8%) |
| Office & Administration | 608 (31.1%) | 1,347 (68.9%) |
| Total (Category) | 1,397 (36.9%) | 2,385 (63.1%) |
| Total (Overall) | 10,568 (54.4%) | 8,862 (45.6%) |
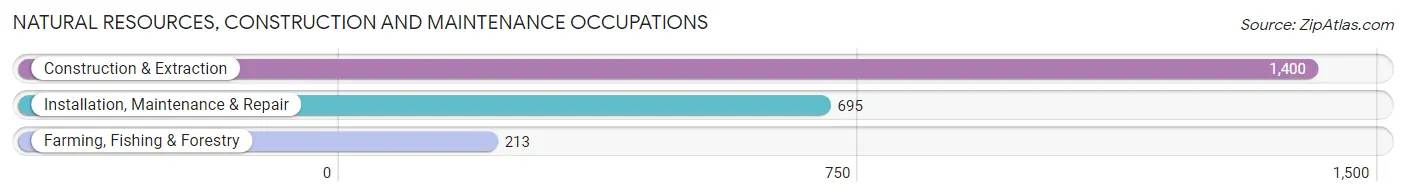
Natural Resources, Construction and Maintenance Occupations
The most common Natural Resources, Construction and Maintenance occupations in Snyder County are Construction & Extraction (1,400 | 7.2%), Installation, Maintenance & Repair (695 | 3.6%), and Farming, Fishing & Forestry (213 | 1.1%).
Natural Resources, Construction and Maintenance Occupations by Sex
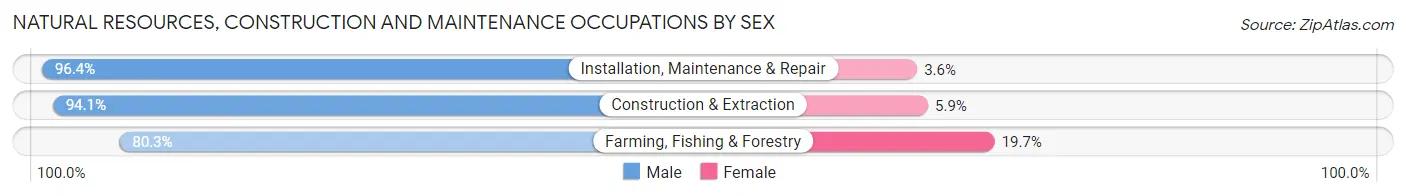
| Occupation | Male | Female |
| Farming, Fishing & Forestry | 171 (80.3%) | 42 (19.7%) |
| Construction & Extraction | 1,318 (94.1%) | 82 (5.9%) |
| Installation, Maintenance & Repair | 670 (96.4%) | 25 (3.6%) |
| Total (Category) | 2,159 (93.5%) | 149 (6.5%) |
| Total (Overall) | 10,568 (54.4%) | 8,862 (45.6%) |
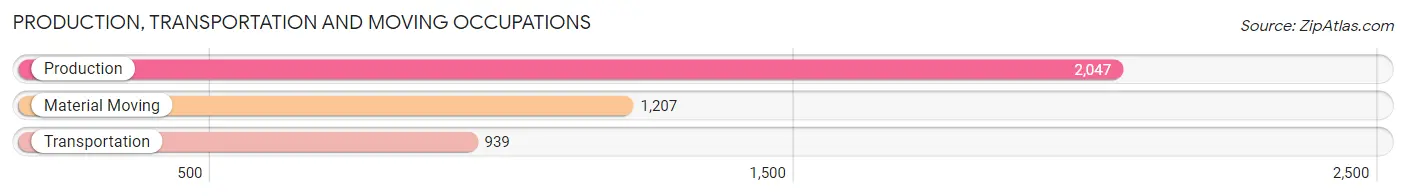
Production, Transportation and Moving Occupations
The most common Production, Transportation and Moving occupations in Snyder County are Production (2,047 | 10.5%), Material Moving (1,207 | 6.2%), and Transportation (939 | 4.8%).
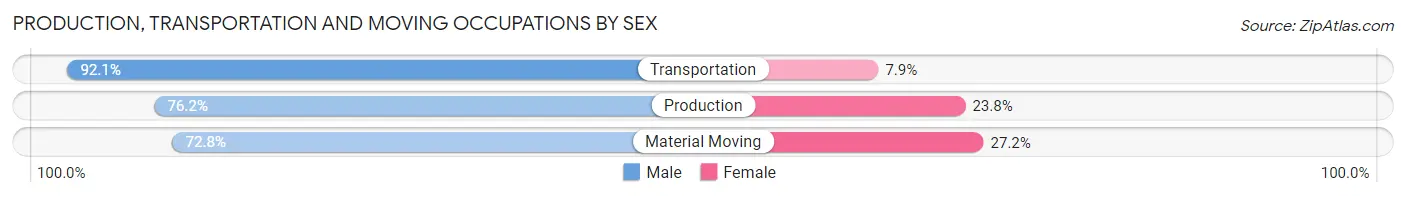
Production, Transportation and Moving Occupations by Sex
| Occupation | Male | Female |
| Production | 1,559 (76.2%) | 488 (23.8%) |
| Transportation | 865 (92.1%) | 74 (7.9%) |
| Material Moving | 879 (72.8%) | 328 (27.2%) |
| Total (Category) | 3,303 (78.8%) | 890 (21.2%) |
| Total (Overall) | 10,568 (54.4%) | 8,862 (45.6%) |
Employment Industries by Sex in Snyder County
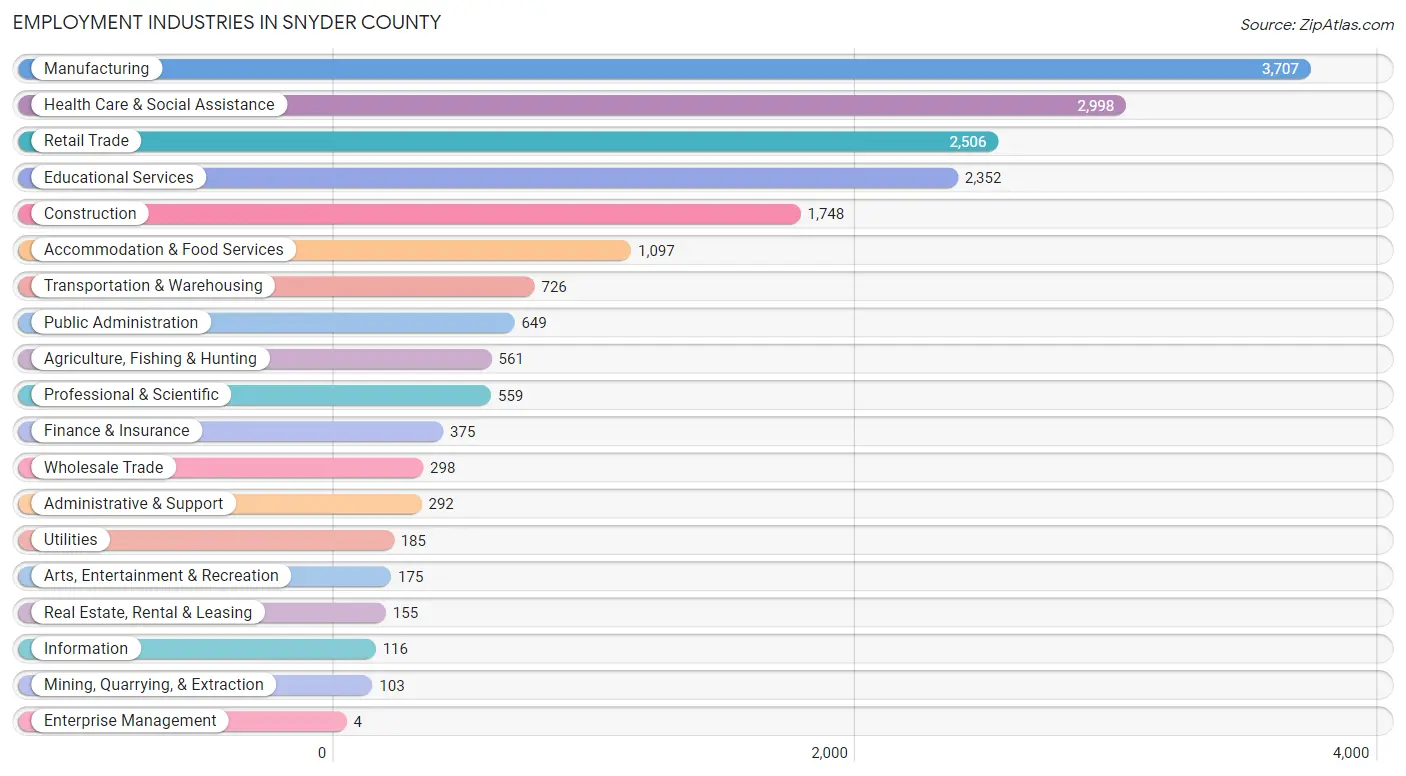
Employment Industries in Snyder County
The major employment industries in Snyder County include Manufacturing (3,707 | 19.1%), Health Care & Social Assistance (2,998 | 15.4%), Retail Trade (2,506 | 12.9%), Educational Services (2,352 | 12.1%), and Construction (1,748 | 9.0%).
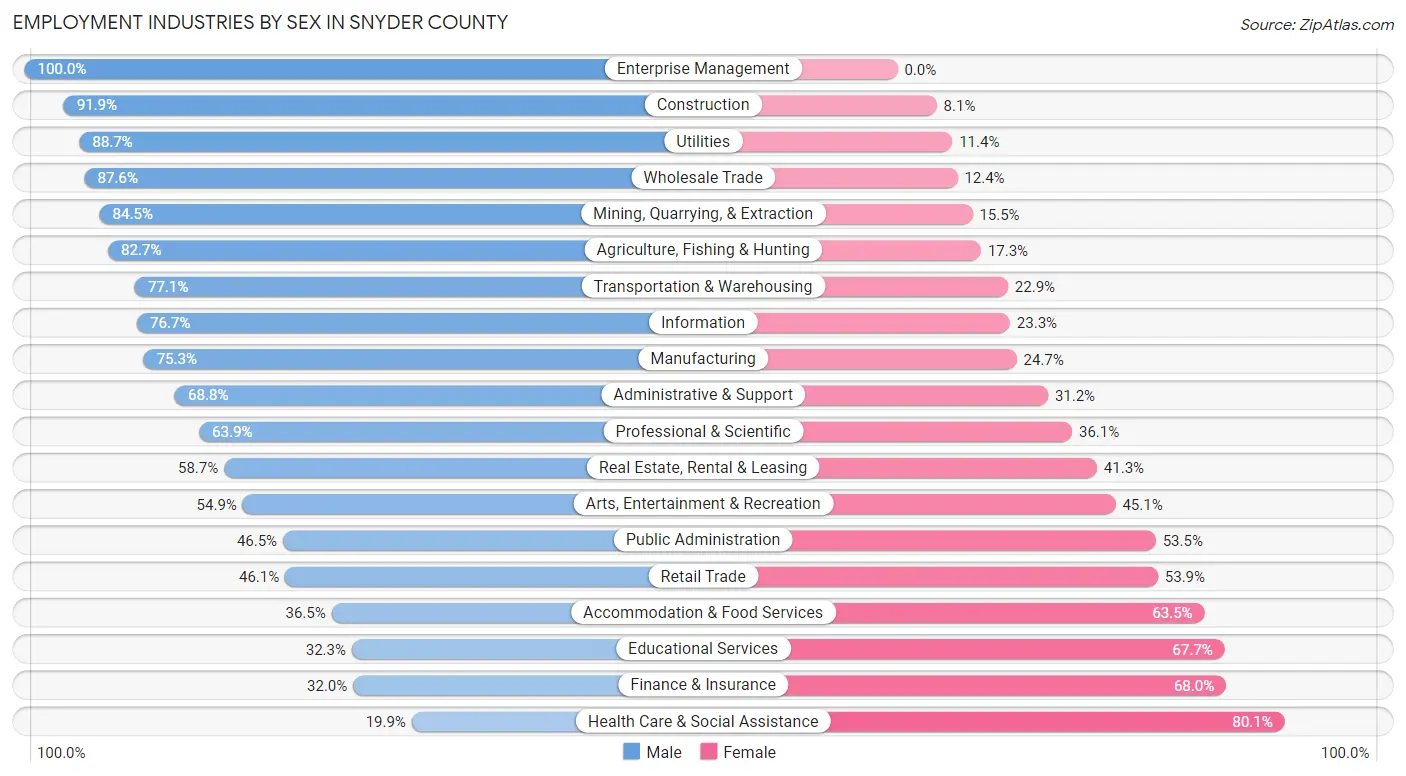
Employment Industries by Sex in Snyder County
The Snyder County industries that see more men than women are Enterprise Management (100.0%), Construction (91.9%), and Utilities (88.6%), whereas the industries that tend to have a higher number of women are Health Care & Social Assistance (80.1%), Finance & Insurance (68.0%), and Educational Services (67.7%).
| Industry | Male | Female |
| Agriculture, Fishing & Hunting | 464 (82.7%) | 97 (17.3%) |
| Mining, Quarrying, & Extraction | 87 (84.5%) | 16 (15.5%) |
| Construction | 1,606 (91.9%) | 142 (8.1%) |
| Manufacturing | 2,793 (75.3%) | 914 (24.7%) |
| Wholesale Trade | 261 (87.6%) | 37 (12.4%) |
| Retail Trade | 1,155 (46.1%) | 1,351 (53.9%) |
| Transportation & Warehousing | 560 (77.1%) | 166 (22.9%) |
| Utilities | 164 (88.6%) | 21 (11.4%) |
| Information | 89 (76.7%) | 27 (23.3%) |
| Finance & Insurance | 120 (32.0%) | 255 (68.0%) |
| Real Estate, Rental & Leasing | 91 (58.7%) | 64 (41.3%) |
| Professional & Scientific | 357 (63.9%) | 202 (36.1%) |
| Enterprise Management | 4 (100.0%) | 0 (0.0%) |
| Administrative & Support | 201 (68.8%) | 91 (31.2%) |
| Educational Services | 759 (32.3%) | 1,593 (67.7%) |
| Health Care & Social Assistance | 596 (19.9%) | 2,402 (80.1%) |
| Arts, Entertainment & Recreation | 96 (54.9%) | 79 (45.1%) |
| Accommodation & Food Services | 400 (36.5%) | 697 (63.5%) |
| Public Administration | 302 (46.5%) | 347 (53.5%) |
| Total | 10,568 (54.4%) | 8,862 (45.6%) |
Education in Snyder County
School Enrollment in Snyder County
The most common levels of schooling among the 9,597 students in Snyder County are college / undergraduate (2,992 | 31.2%), high school (1,950 | 20.3%), and middle school (1,838 | 19.2%).
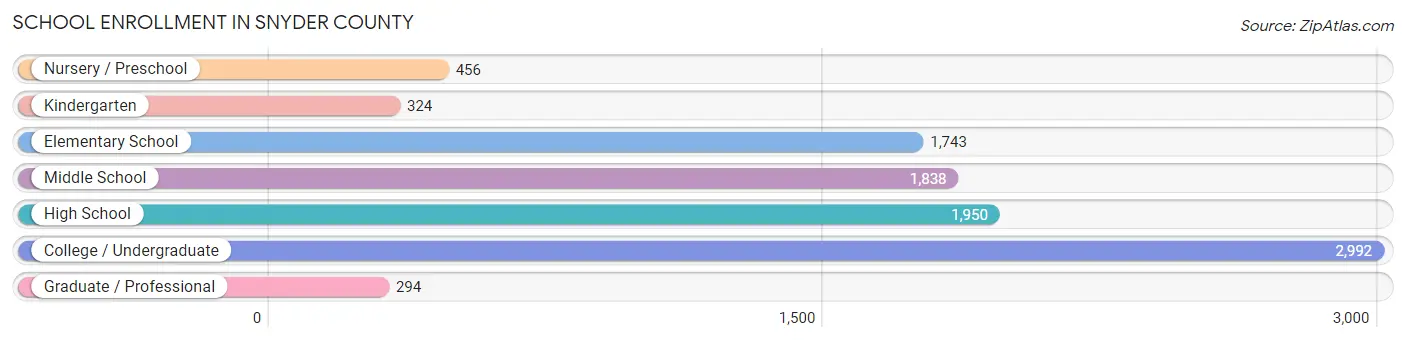
| School Level | # Students | % Students |
| Nursery / Preschool | 456 | 4.8% |
| Kindergarten | 324 | 3.4% |
| Elementary School | 1,743 | 18.2% |
| Middle School | 1,838 | 19.2% |
| High School | 1,950 | 20.3% |
| College / Undergraduate | 2,992 | 31.2% |
| Graduate / Professional | 294 | 3.1% |
| Total | 9,597 | 100.0% |
School Enrollment by Age by Funding Source in Snyder County
Out of a total of 9,597 students who are enrolled in schools in Snyder County, 4,136 (43.1%) attend a private institution, while the remaining 5,461 (56.9%) are enrolled in public schools. The age group of 20 to 24 year olds has the highest likelihood of being enrolled in private schools, with 1,417 (84.4% in the age bracket) enrolled. Conversely, the age group of 15 to 17 year olds has the lowest likelihood of being enrolled in a private school, with 1,126 (83.1% in the age bracket) attending a public institution.
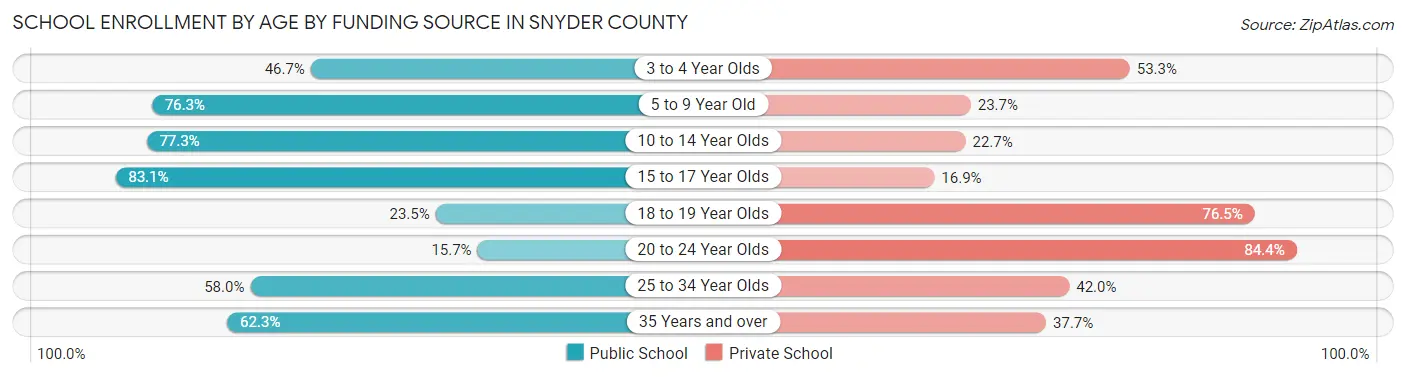
| Age Bracket | Public School | Private School |
| 3 to 4 Year Olds | 149 (46.7%) | 170 (53.3%) |
| 5 to 9 Year Old | 1,428 (76.3%) | 443 (23.7%) |
| 10 to 14 Year Olds | 1,829 (77.3%) | 537 (22.7%) |
| 15 to 17 Year Olds | 1,126 (83.1%) | 229 (16.9%) |
| 18 to 19 Year Olds | 346 (23.5%) | 1,129 (76.5%) |
| 20 to 24 Year Olds | 263 (15.7%) | 1,417 (84.4%) |
| 25 to 34 Year Olds | 171 (58.0%) | 124 (42.0%) |
| 35 Years and over | 147 (62.3%) | 89 (37.7%) |
| Total | 5,461 (56.9%) | 4,136 (43.1%) |
Educational Attainment by Field of Study in Snyder County
Education (1,477 | 24.3%), science & technology (827 | 13.6%), business (735 | 12.1%), bio, nature & agricultural (466 | 7.7%), and arts & humanities (398 | 6.6%) are the most common fields of study among 6,066 individuals in Snyder County who have obtained a bachelor's degree or higher.
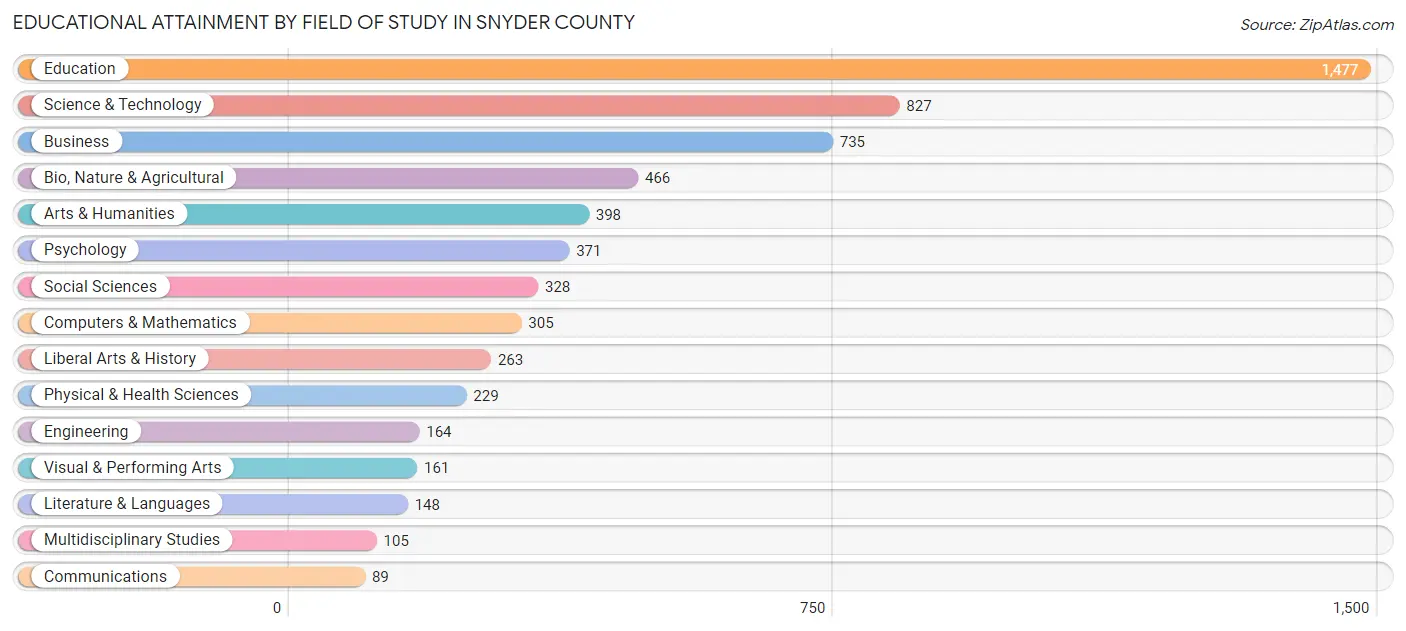
| Field of Study | # Graduates | % Graduates |
| Computers & Mathematics | 305 | 5.0% |
| Bio, Nature & Agricultural | 466 | 7.7% |
| Physical & Health Sciences | 229 | 3.8% |
| Psychology | 371 | 6.1% |
| Social Sciences | 328 | 5.4% |
| Engineering | 164 | 2.7% |
| Multidisciplinary Studies | 105 | 1.7% |
| Science & Technology | 827 | 13.6% |
| Business | 735 | 12.1% |
| Education | 1,477 | 24.3% |
| Literature & Languages | 148 | 2.4% |
| Liberal Arts & History | 263 | 4.3% |
| Visual & Performing Arts | 161 | 2.6% |
| Communications | 89 | 1.5% |
| Arts & Humanities | 398 | 6.6% |
| Total | 6,066 | 100.0% |
Transportation & Commute in Snyder County
Vehicle Availability by Sex in Snyder County
The most prevalent vehicle ownership categories in Snyder County are males with 2 vehicles (3,673, accounting for 36.9%) and females with 2 vehicles (3,046, making up 45.5%).
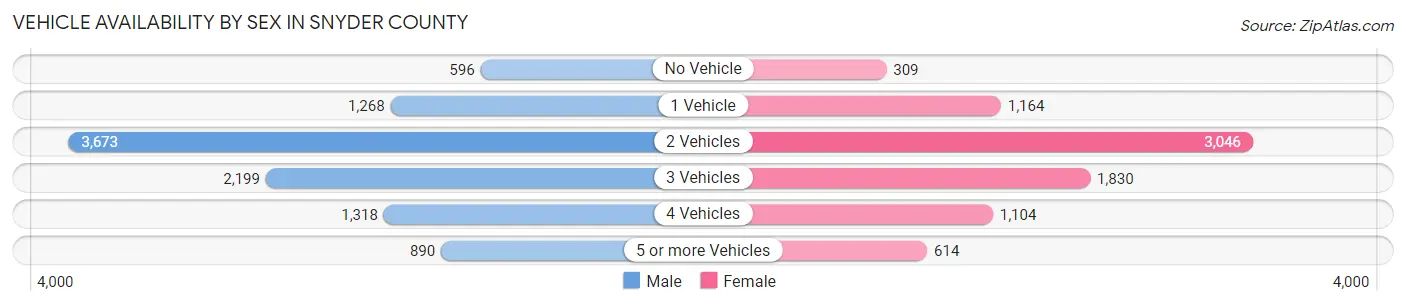
| Vehicles Available | Male | Female |
| No Vehicle | 596 (6.0%) | 309 (3.8%) |
| 1 Vehicle | 1,268 (12.8%) | 1,164 (14.4%) |
| 2 Vehicles | 3,673 (36.9%) | 3,046 (37.8%) |
| 3 Vehicles | 2,199 (22.1%) | 1,830 (22.7%) |
| 4 Vehicles | 1,318 (13.3%) | 1,104 (13.7%) |
| 5 or more Vehicles | 890 (8.9%) | 614 (7.6%) |
| Total | 9,944 (100.0%) | 8,067 (100.0%) |
Commute Time in Snyder County
The most frequently occuring commute durations in Snyder County are 5 to 9 minutes (3,123 commuters, 17.5%), 15 to 19 minutes (2,739 commuters, 15.4%), and 10 to 14 minutes (2,499 commuters, 14.0%).
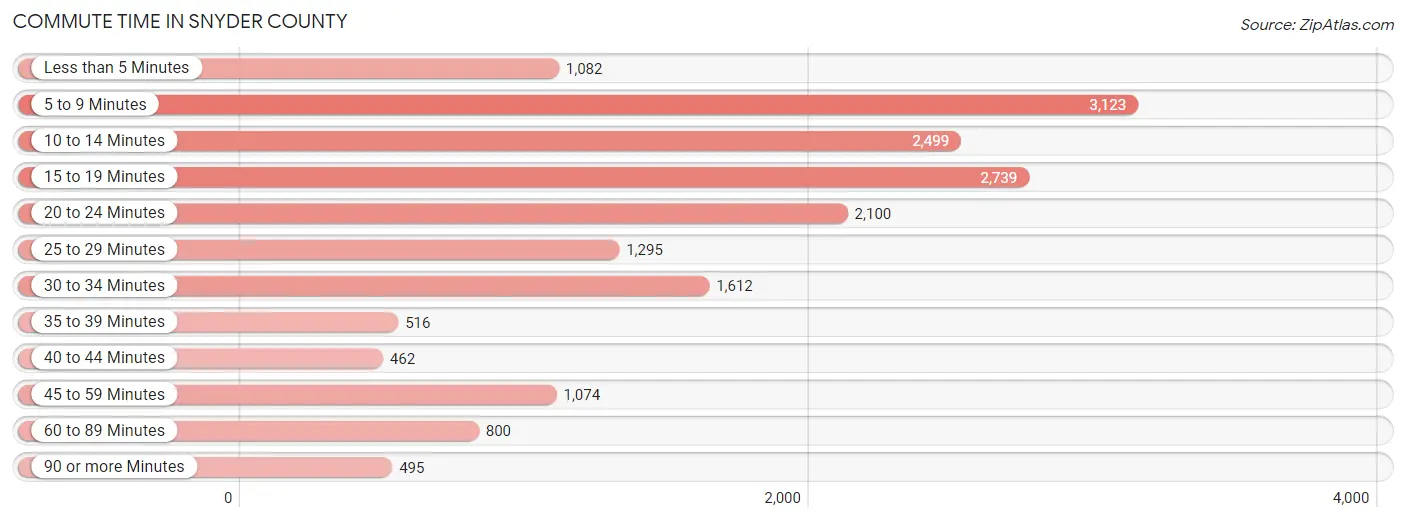
| Commute Time | # Commuters | % Commuters |
| Less than 5 Minutes | 1,082 | 6.1% |
| 5 to 9 Minutes | 3,123 | 17.5% |
| 10 to 14 Minutes | 2,499 | 14.0% |
| 15 to 19 Minutes | 2,739 | 15.4% |
| 20 to 24 Minutes | 2,100 | 11.8% |
| 25 to 29 Minutes | 1,295 | 7.3% |
| 30 to 34 Minutes | 1,612 | 9.1% |
| 35 to 39 Minutes | 516 | 2.9% |
| 40 to 44 Minutes | 462 | 2.6% |
| 45 to 59 Minutes | 1,074 | 6.0% |
| 60 to 89 Minutes | 800 | 4.5% |
| 90 or more Minutes | 495 | 2.8% |
Commute Time by Sex in Snyder County
The most common commute times in Snyder County are 5 to 9 minutes (1,865 commuters, 19.2%) for males and 15 to 19 minutes (1,472 commuters, 18.2%) for females.
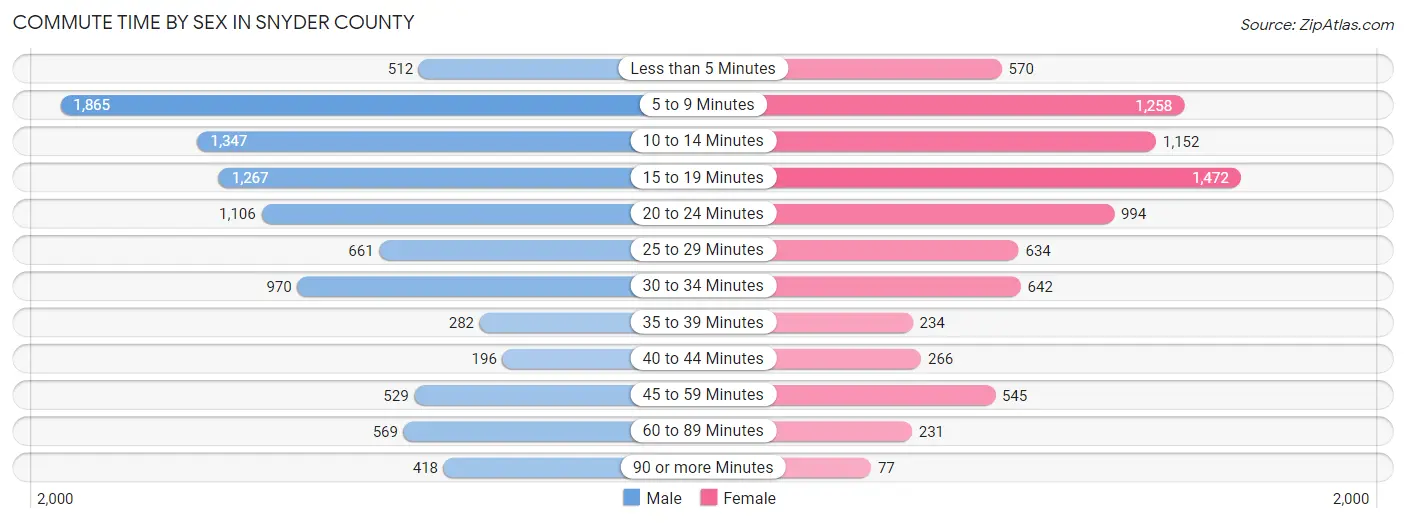
| Commute Time | Male | Female |
| Less than 5 Minutes | 512 (5.3%) | 570 (7.1%) |
| 5 to 9 Minutes | 1,865 (19.2%) | 1,258 (15.6%) |
| 10 to 14 Minutes | 1,347 (13.9%) | 1,152 (14.3%) |
| 15 to 19 Minutes | 1,267 (13.0%) | 1,472 (18.2%) |
| 20 to 24 Minutes | 1,106 (11.4%) | 994 (12.3%) |
| 25 to 29 Minutes | 661 (6.8%) | 634 (7.9%) |
| 30 to 34 Minutes | 970 (10.0%) | 642 (8.0%) |
| 35 to 39 Minutes | 282 (2.9%) | 234 (2.9%) |
| 40 to 44 Minutes | 196 (2.0%) | 266 (3.3%) |
| 45 to 59 Minutes | 529 (5.4%) | 545 (6.8%) |
| 60 to 89 Minutes | 569 (5.9%) | 231 (2.9%) |
| 90 or more Minutes | 418 (4.3%) | 77 (0.9%) |
Time of Departure to Work by Sex in Snyder County
The most frequent times of departure to work in Snyder County are 5:30 AM to 5:59 AM (1,182, 12.2%) for males and 7:00 AM to 7:29 AM (1,251, 15.5%) for females.
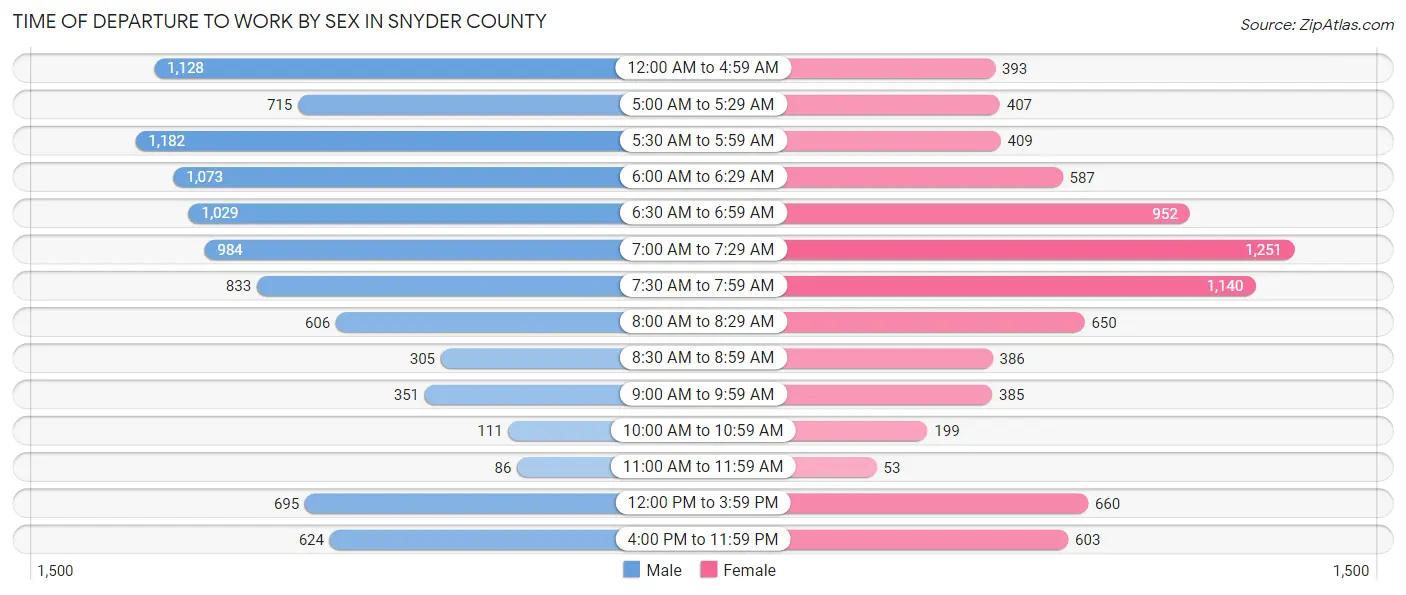
| Time of Departure | Male | Female |
| 12:00 AM to 4:59 AM | 1,128 (11.6%) | 393 (4.9%) |
| 5:00 AM to 5:29 AM | 715 (7.3%) | 407 (5.0%) |
| 5:30 AM to 5:59 AM | 1,182 (12.2%) | 409 (5.1%) |
| 6:00 AM to 6:29 AM | 1,073 (11.0%) | 587 (7.3%) |
| 6:30 AM to 6:59 AM | 1,029 (10.6%) | 952 (11.8%) |
| 7:00 AM to 7:29 AM | 984 (10.1%) | 1,251 (15.5%) |
| 7:30 AM to 7:59 AM | 833 (8.6%) | 1,140 (14.1%) |
| 8:00 AM to 8:29 AM | 606 (6.2%) | 650 (8.1%) |
| 8:30 AM to 8:59 AM | 305 (3.1%) | 386 (4.8%) |
| 9:00 AM to 9:59 AM | 351 (3.6%) | 385 (4.8%) |
| 10:00 AM to 10:59 AM | 111 (1.1%) | 199 (2.5%) |
| 11:00 AM to 11:59 AM | 86 (0.9%) | 53 (0.7%) |
| 12:00 PM to 3:59 PM | 695 (7.1%) | 660 (8.2%) |
| 4:00 PM to 11:59 PM | 624 (6.4%) | 603 (7.5%) |
| Total | 9,722 (100.0%) | 8,075 (100.0%) |
Housing Occupancy in Snyder County
Occupancy by Ownership in Snyder County
Of the total 14,430 dwellings in Snyder County, owner-occupied units account for 10,887 (75.4%), while renter-occupied units make up 3,543 (24.5%).
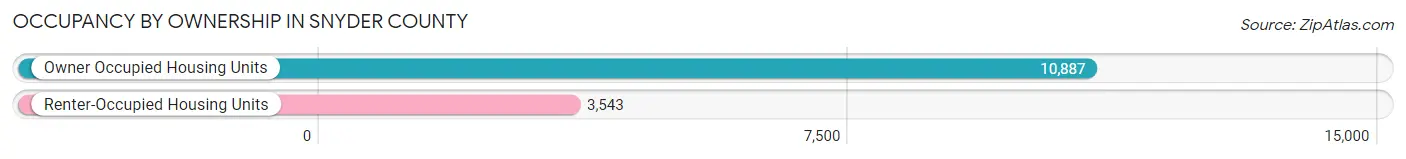
| Occupancy | # Housing Units | % Housing Units |
| Owner Occupied Housing Units | 10,887 | 75.4% |
| Renter-Occupied Housing Units | 3,543 | 24.5% |
| Total Occupied Housing Units | 14,430 | 100.0% |
Occupancy by Household Size in Snyder County
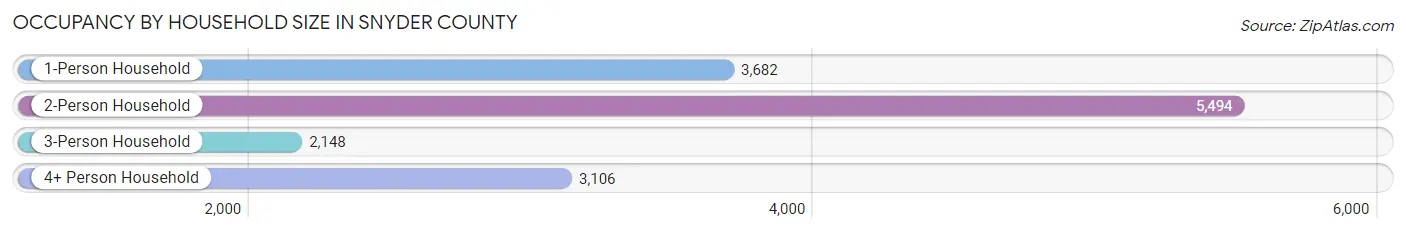
| Household Size | # Housing Units | % Housing Units |
| 1-Person Household | 3,682 | 25.5% |
| 2-Person Household | 5,494 | 38.1% |
| 3-Person Household | 2,148 | 14.9% |
| 4+ Person Household | 3,106 | 21.5% |
| Total Housing Units | 14,430 | 100.0% |
Occupancy by Ownership by Household Size in Snyder County
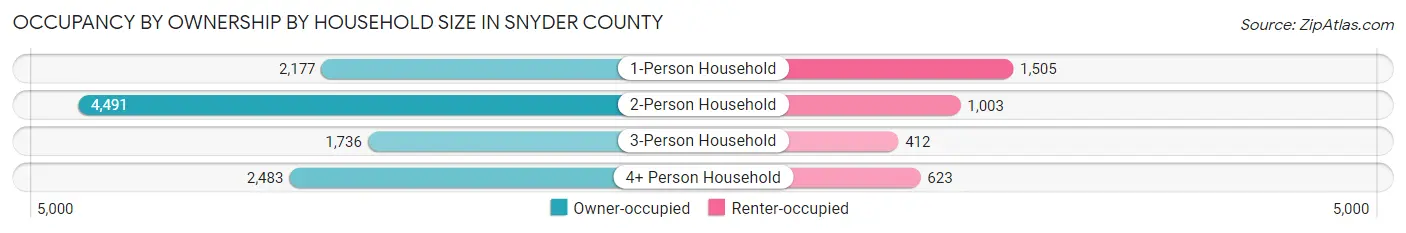
| Household Size | Owner-occupied | Renter-occupied |
| 1-Person Household | 2,177 (59.1%) | 1,505 (40.9%) |
| 2-Person Household | 4,491 (81.7%) | 1,003 (18.3%) |
| 3-Person Household | 1,736 (80.8%) | 412 (19.2%) |
| 4+ Person Household | 2,483 (79.9%) | 623 (20.1%) |
| Total Housing Units | 10,887 (75.4%) | 3,543 (24.5%) |
Occupancy by Educational Attainment in Snyder County
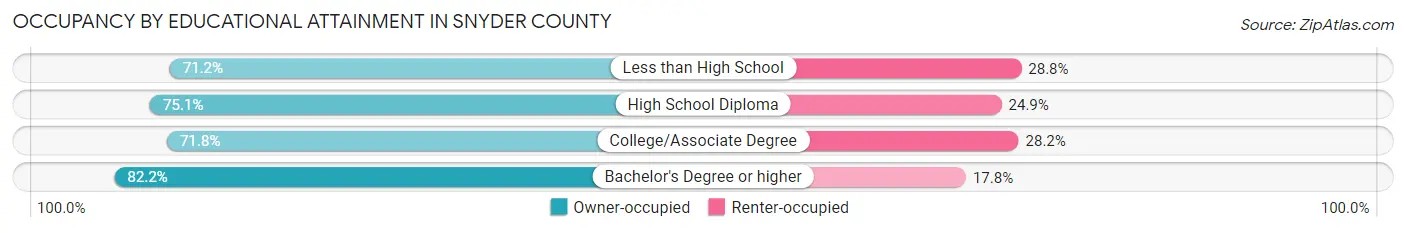
| Household Size | Owner-occupied | Renter-occupied |
| Less than High School | 1,464 (71.2%) | 592 (28.8%) |
| High School Diploma | 4,480 (75.1%) | 1,483 (24.9%) |
| College/Associate Degree | 2,244 (71.8%) | 883 (28.2%) |
| Bachelor's Degree or higher | 2,699 (82.2%) | 585 (17.8%) |
Occupancy by Age of Householder in Snyder County
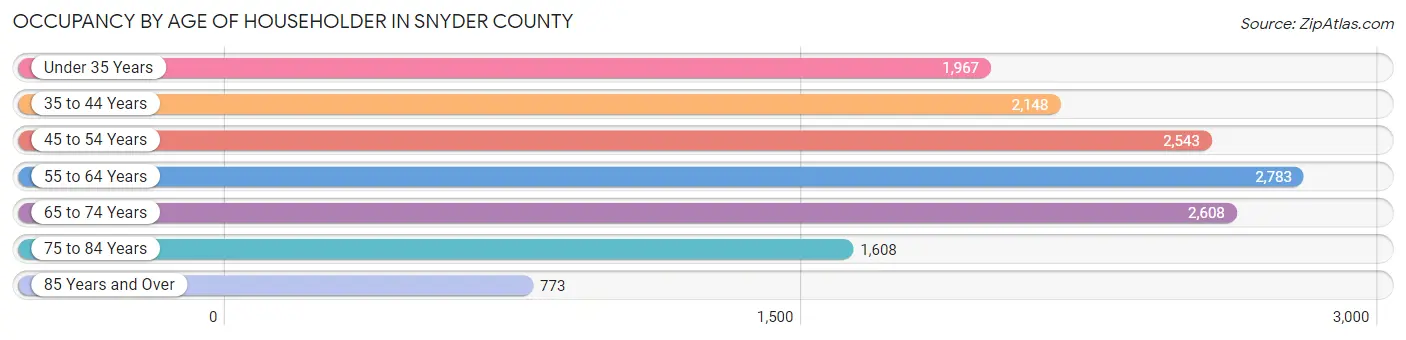
| Age Bracket | # Households | % Households |
| Under 35 Years | 1,967 | 13.6% |
| 35 to 44 Years | 2,148 | 14.9% |
| 45 to 54 Years | 2,543 | 17.6% |
| 55 to 64 Years | 2,783 | 19.3% |
| 65 to 74 Years | 2,608 | 18.1% |
| 75 to 84 Years | 1,608 | 11.1% |
| 85 Years and Over | 773 | 5.4% |
| Total | 14,430 | 100.0% |
Housing Finances in Snyder County
Median Income by Occupancy in Snyder County
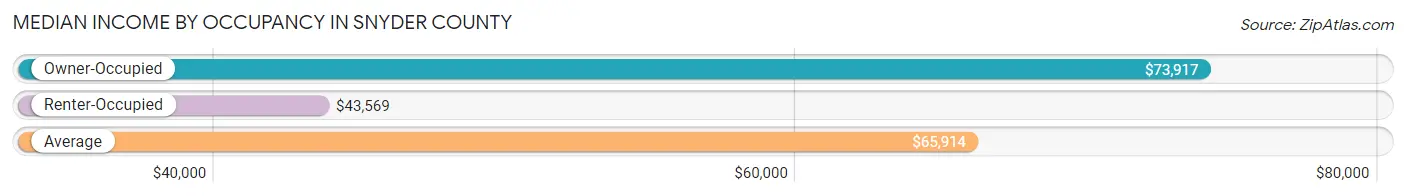
| Occupancy Type | # Households | Median Income |
| Owner-Occupied | 10,887 (75.4%) | $73,917 |
| Renter-Occupied | 3,543 (24.5%) | $43,569 |
| Average | 14,430 (100.0%) | $65,914 |
Occupancy by Householder Income Bracket in Snyder County
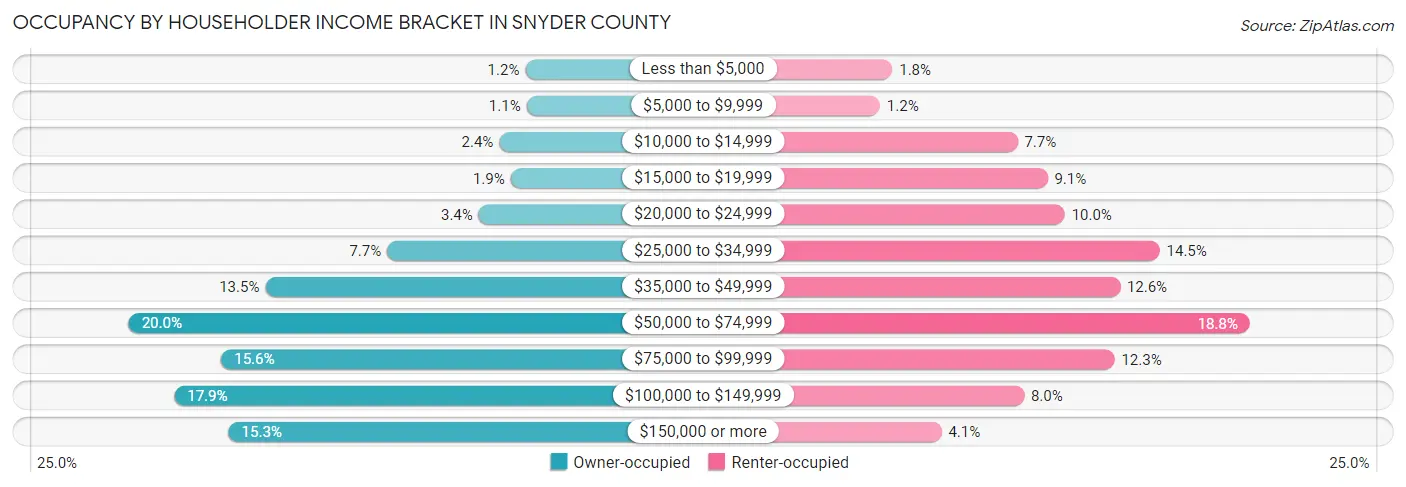
| Income Bracket | Owner-occupied | Renter-occupied |
| Less than $5,000 | 126 (1.2%) | 62 (1.8%) |
| $5,000 to $9,999 | 120 (1.1%) | 41 (1.2%) |
| $10,000 to $14,999 | 261 (2.4%) | 273 (7.7%) |
| $15,000 to $19,999 | 202 (1.9%) | 324 (9.1%) |
| $20,000 to $24,999 | 368 (3.4%) | 353 (10.0%) |
| $25,000 to $34,999 | 843 (7.7%) | 513 (14.5%) |
| $35,000 to $49,999 | 1,474 (13.5%) | 446 (12.6%) |
| $50,000 to $74,999 | 2,182 (20.0%) | 665 (18.8%) |
| $75,000 to $99,999 | 1,702 (15.6%) | 437 (12.3%) |
| $100,000 to $149,999 | 1,945 (17.9%) | 284 (8.0%) |
| $150,000 or more | 1,664 (15.3%) | 145 (4.1%) |
| Total | 10,887 (100.0%) | 3,543 (100.0%) |
Monthly Housing Cost Tiers in Snyder County
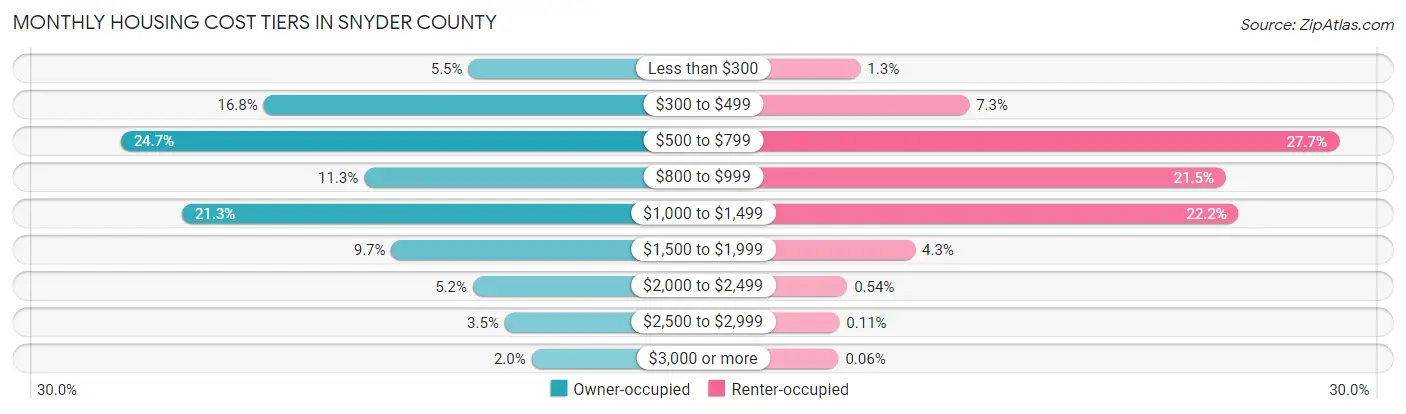
| Monthly Cost | Owner-occupied | Renter-occupied |
| Less than $300 | 598 (5.5%) | 45 (1.3%) |
| $300 to $499 | 1,829 (16.8%) | 258 (7.3%) |
| $500 to $799 | 2,688 (24.7%) | 981 (27.7%) |
| $800 to $999 | 1,225 (11.3%) | 760 (21.4%) |
| $1,000 to $1,499 | 2,320 (21.3%) | 785 (22.2%) |
| $1,500 to $1,999 | 1,060 (9.7%) | 152 (4.3%) |
| $2,000 to $2,499 | 570 (5.2%) | 19 (0.5%) |
| $2,500 to $2,999 | 379 (3.5%) | 4 (0.1%) |
| $3,000 or more | 218 (2.0%) | 2 (0.1%) |
| Total | 10,887 (100.0%) | 3,543 (100.0%) |
Physical Housing Characteristics in Snyder County
Housing Structures in Snyder County
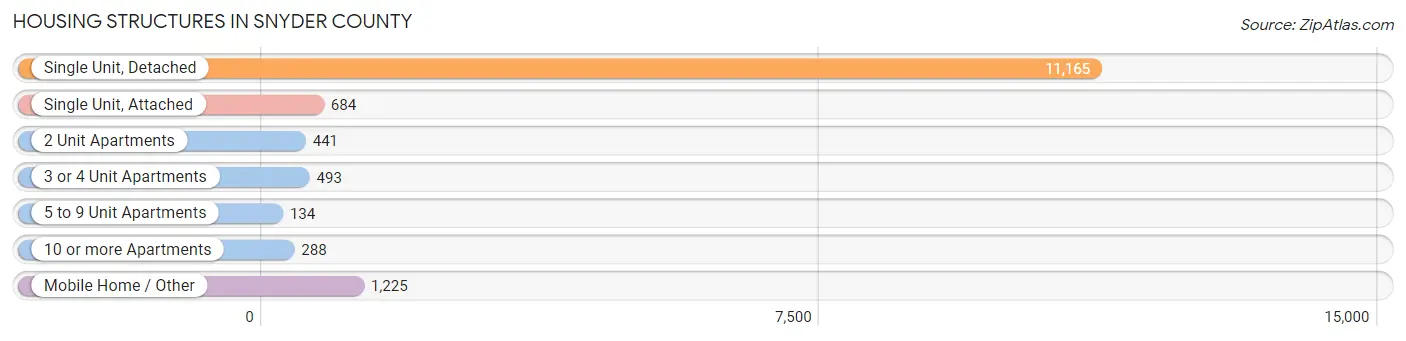
| Structure Type | # Housing Units | % Housing Units |
| Single Unit, Detached | 11,165 | 77.4% |
| Single Unit, Attached | 684 | 4.7% |
| 2 Unit Apartments | 441 | 3.1% |
| 3 or 4 Unit Apartments | 493 | 3.4% |
| 5 to 9 Unit Apartments | 134 | 0.9% |
| 10 or more Apartments | 288 | 2.0% |
| Mobile Home / Other | 1,225 | 8.5% |
| Total | 14,430 | 100.0% |
Housing Structures by Occupancy in Snyder County
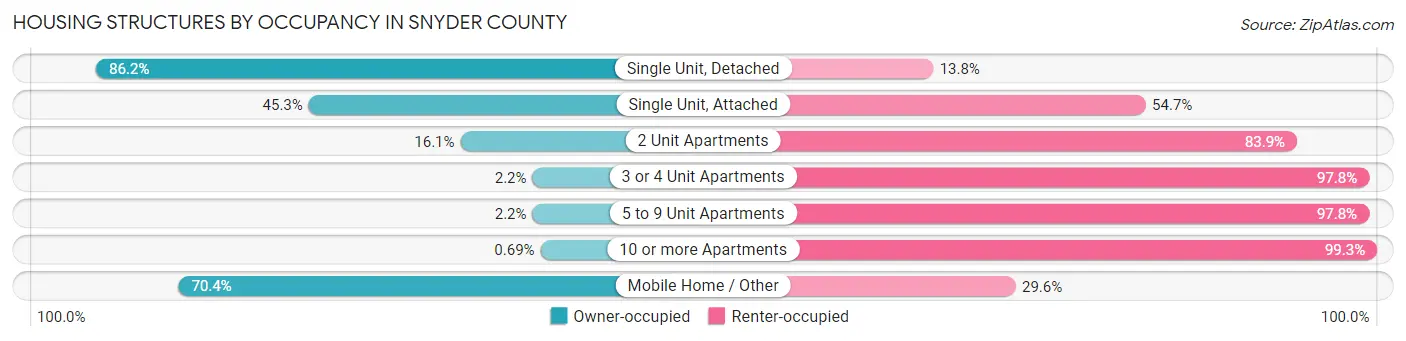
| Structure Type | Owner-occupied | Renter-occupied |
| Single Unit, Detached | 9,628 (86.2%) | 1,537 (13.8%) |
| Single Unit, Attached | 310 (45.3%) | 374 (54.7%) |
| 2 Unit Apartments | 71 (16.1%) | 370 (83.9%) |
| 3 or 4 Unit Apartments | 11 (2.2%) | 482 (97.8%) |
| 5 to 9 Unit Apartments | 3 (2.2%) | 131 (97.8%) |
| 10 or more Apartments | 2 (0.7%) | 286 (99.3%) |
| Mobile Home / Other | 862 (70.4%) | 363 (29.6%) |
| Total | 10,887 (75.4%) | 3,543 (24.5%) |
Housing Structures by Number of Rooms in Snyder County
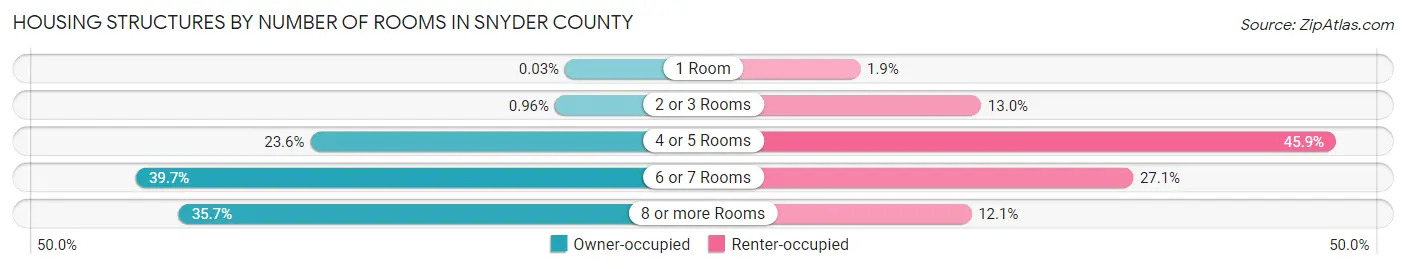
| Number of Rooms | Owner-occupied | Renter-occupied |
| 1 Room | 3 (0.0%) | 66 (1.9%) |
| 2 or 3 Rooms | 104 (1.0%) | 462 (13.0%) |
| 4 or 5 Rooms | 2,567 (23.6%) | 1,625 (45.9%) |
| 6 or 7 Rooms | 4,322 (39.7%) | 960 (27.1%) |
| 8 or more Rooms | 3,891 (35.7%) | 430 (12.1%) |
| Total | 10,887 (100.0%) | 3,543 (100.0%) |
Housing Structure by Heating Type in Snyder County
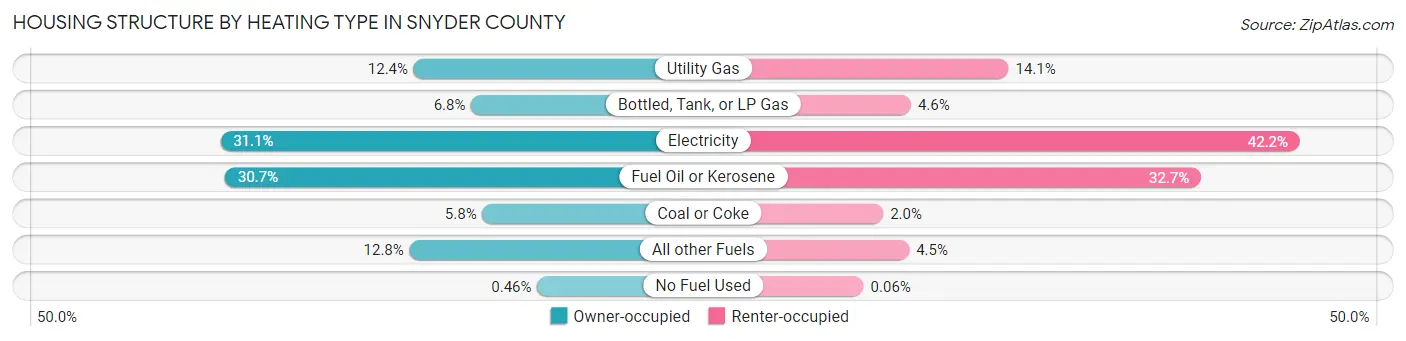
| Heating Type | Owner-occupied | Renter-occupied |
| Utility Gas | 1,349 (12.4%) | 498 (14.1%) |
| Bottled, Tank, or LP Gas | 745 (6.8%) | 164 (4.6%) |
| Electricity | 3,386 (31.1%) | 1,495 (42.2%) |
| Fuel Oil or Kerosene | 3,337 (30.6%) | 1,157 (32.7%) |
| Coal or Coke | 627 (5.8%) | 69 (1.9%) |
| All other Fuels | 1,393 (12.8%) | 158 (4.5%) |
| No Fuel Used | 50 (0.5%) | 2 (0.1%) |
| Total | 10,887 (100.0%) | 3,543 (100.0%) |
Household Vehicle Usage in Snyder County
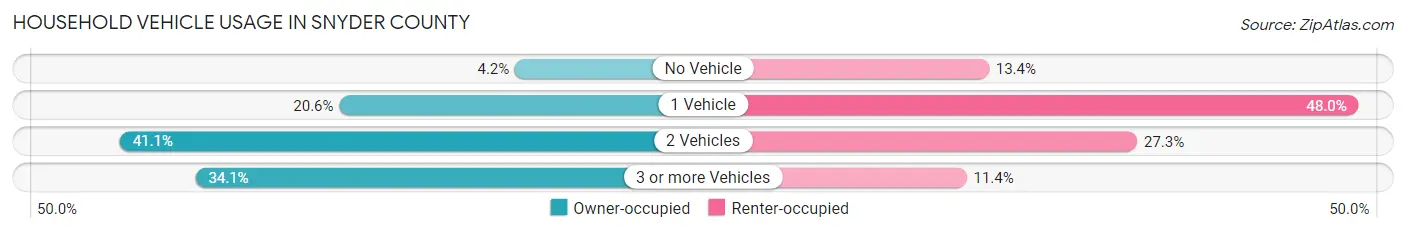
| Vehicles per Household | Owner-occupied | Renter-occupied |
| No Vehicle | 458 (4.2%) | 476 (13.4%) |
| 1 Vehicle | 2,245 (20.6%) | 1,699 (47.9%) |
| 2 Vehicles | 4,477 (41.1%) | 966 (27.3%) |
| 3 or more Vehicles | 3,707 (34.1%) | 402 (11.4%) |
| Total | 10,887 (100.0%) | 3,543 (100.0%) |
Real Estate & Mortgages in Snyder County
Real Estate and Mortgage Overview in Snyder County
| Characteristic | Without Mortgage | With Mortgage |
| Housing Units | 5,319 | 5,568 |
| Median Property Value | $191,400 | $204,500 |
| Median Household Income | $56,782 | $1,171 |
| Monthly Housing Costs | $529 | $214 |
| Real Estate Taxes | $2,204 | $35 |
Property Value by Mortgage Status in Snyder County
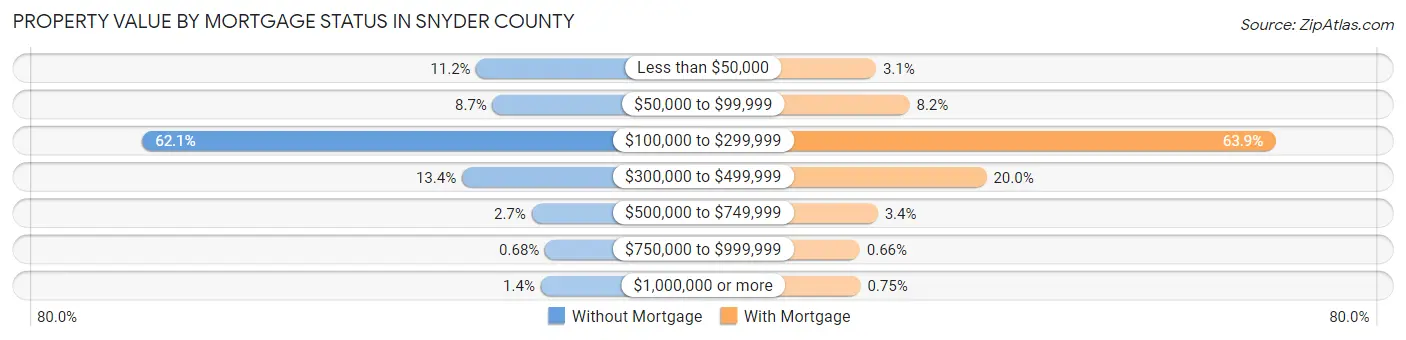
| Property Value | Without Mortgage | With Mortgage |
| Less than $50,000 | 593 (11.2%) | 173 (3.1%) |
| $50,000 to $99,999 | 461 (8.7%) | 458 (8.2%) |
| $100,000 to $299,999 | 3,301 (62.1%) | 3,559 (63.9%) |
| $300,000 to $499,999 | 710 (13.4%) | 1,111 (20.0%) |
| $500,000 to $749,999 | 146 (2.7%) | 188 (3.4%) |
| $750,000 to $999,999 | 36 (0.7%) | 37 (0.7%) |
| $1,000,000 or more | 72 (1.3%) | 42 (0.7%) |
| Total | 5,319 (100.0%) | 5,568 (100.0%) |
Household Income by Mortgage Status in Snyder County
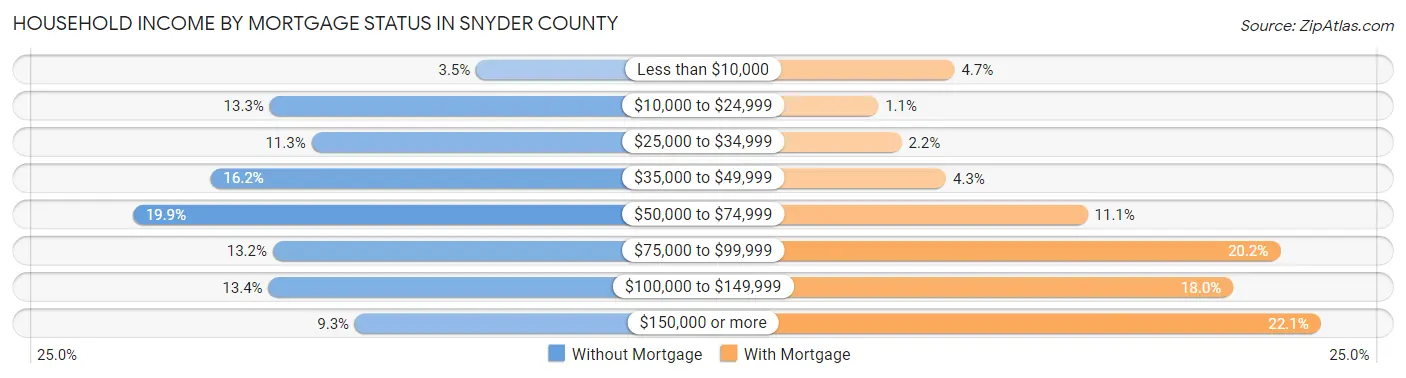
| Household Income | Without Mortgage | With Mortgage |
| Less than $10,000 | 186 (3.5%) | 262 (4.7%) |
| $10,000 to $24,999 | 709 (13.3%) | 60 (1.1%) |
| $25,000 to $34,999 | 603 (11.3%) | 122 (2.2%) |
| $35,000 to $49,999 | 859 (16.2%) | 240 (4.3%) |
| $50,000 to $74,999 | 1,056 (19.9%) | 615 (11.1%) |
| $75,000 to $99,999 | 701 (13.2%) | 1,126 (20.2%) |
| $100,000 to $149,999 | 712 (13.4%) | 1,001 (18.0%) |
| $150,000 or more | 493 (9.3%) | 1,233 (22.1%) |
| Total | 5,319 (100.0%) | 5,568 (100.0%) |
Property Value to Household Income Ratio in Snyder County
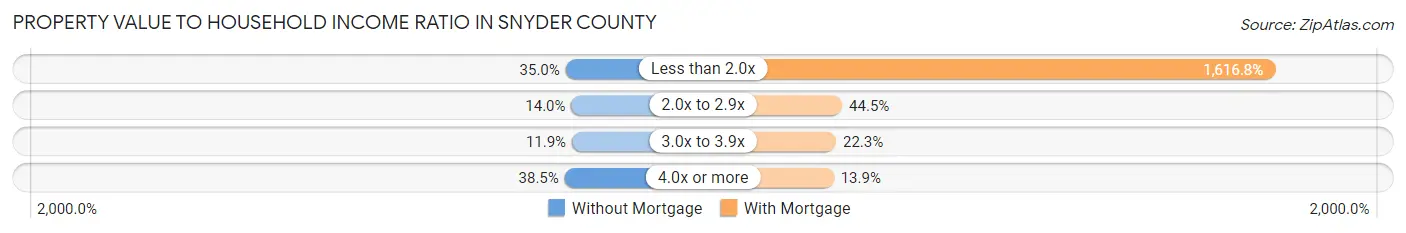
| Value-to-Income Ratio | Without Mortgage | With Mortgage |
| Less than 2.0x | 1,860 (35.0%) | 90,023 (1,616.8%) |
| 2.0x to 2.9x | 746 (14.0%) | 2,480 (44.5%) |
| 3.0x to 3.9x | 633 (11.9%) | 1,242 (22.3%) |
| 4.0x or more | 2,047 (38.5%) | 771 (13.9%) |
| Total | 5,319 (100.0%) | 5,568 (100.0%) |
Real Estate Taxes by Mortgage Status in Snyder County
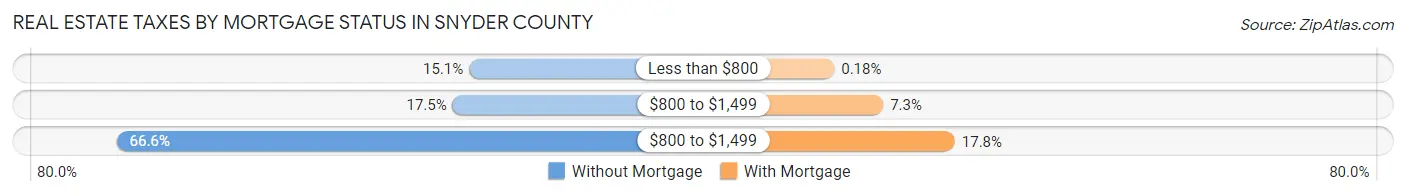
| Property Taxes | Without Mortgage | With Mortgage |
| Less than $800 | 801 (15.1%) | 10 (0.2%) |
| $800 to $1,499 | 929 (17.5%) | 408 (7.3%) |
| $800 to $1,499 | 3,540 (66.5%) | 991 (17.8%) |
| Total | 5,319 (100.0%) | 5,568 (100.0%) |
Health & Disability in Snyder County
Health Insurance Coverage by Age in Snyder County
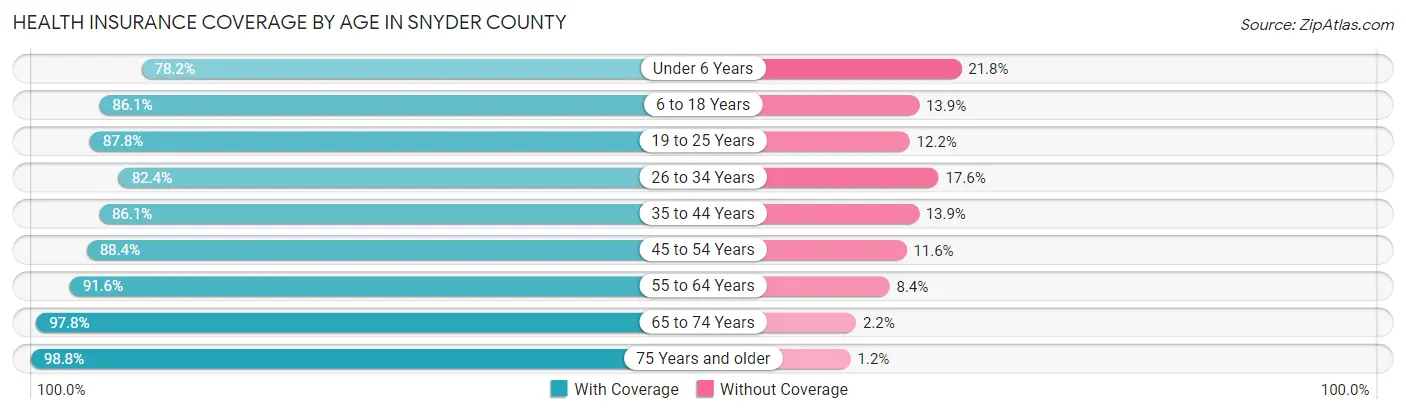
| Age Bracket | With Coverage | Without Coverage |
| Under 6 Years | 2,015 (78.2%) | 562 (21.8%) |
| 6 to 18 Years | 5,574 (86.1%) | 902 (13.9%) |
| 19 to 25 Years | 3,927 (87.8%) | 545 (12.2%) |
| 26 to 34 Years | 3,244 (82.4%) | 691 (17.6%) |
| 35 to 44 Years | 3,633 (86.1%) | 585 (13.9%) |
| 45 to 54 Years | 4,211 (88.4%) | 552 (11.6%) |
| 55 to 64 Years | 4,808 (91.6%) | 443 (8.4%) |
| 65 to 74 Years | 4,128 (97.8%) | 92 (2.2%) |
| 75 Years and older | 3,438 (98.8%) | 41 (1.2%) |
| Total | 34,978 (88.8%) | 4,413 (11.2%) |
Health Insurance Coverage by Citizenship Status in Snyder County
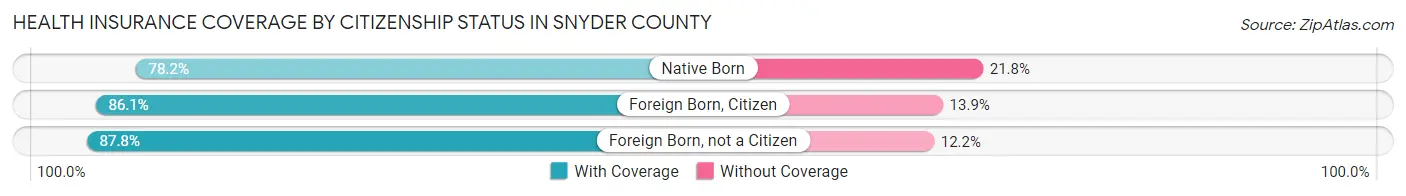
| Citizenship Status | With Coverage | Without Coverage |
| Native Born | 2,015 (78.2%) | 562 (21.8%) |
| Foreign Born, Citizen | 5,574 (86.1%) | 902 (13.9%) |
| Foreign Born, not a Citizen | 3,927 (87.8%) | 545 (12.2%) |
Health Insurance Coverage by Household Income in Snyder County
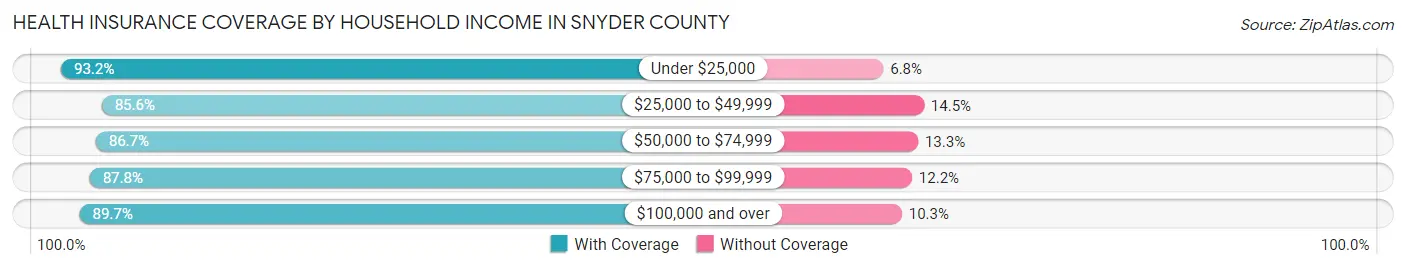
| Household Income | With Coverage | Without Coverage |
| Under $25,000 | 2,695 (93.2%) | 198 (6.8%) |
| $25,000 to $49,999 | 5,798 (85.6%) | 979 (14.4%) |
| $50,000 to $74,999 | 6,622 (86.7%) | 1,019 (13.3%) |
| $75,000 to $99,999 | 5,485 (87.8%) | 762 (12.2%) |
| $100,000 and over | 12,103 (89.7%) | 1,390 (10.3%) |
Public vs Private Health Insurance Coverage by Age in Snyder County
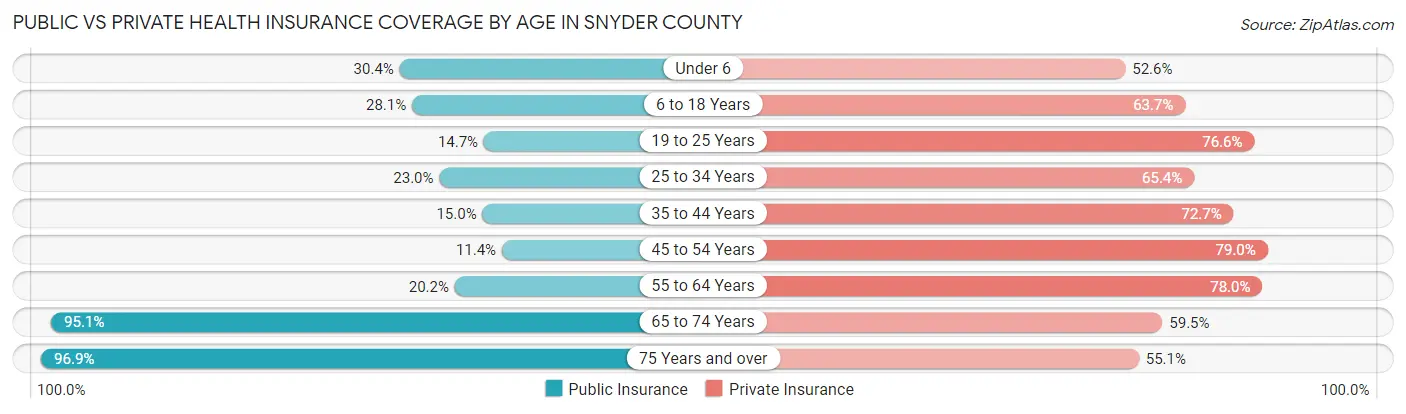
| Age Bracket | Public Insurance | Private Insurance |
| Under 6 | 783 (30.4%) | 1,356 (52.6%) |
| 6 to 18 Years | 1,819 (28.1%) | 4,128 (63.7%) |
| 19 to 25 Years | 659 (14.7%) | 3,424 (76.6%) |
| 25 to 34 Years | 906 (23.0%) | 2,573 (65.4%) |
| 35 to 44 Years | 633 (15.0%) | 3,067 (72.7%) |
| 45 to 54 Years | 543 (11.4%) | 3,764 (79.0%) |
| 55 to 64 Years | 1,058 (20.2%) | 4,098 (78.0%) |
| 65 to 74 Years | 4,012 (95.1%) | 2,511 (59.5%) |
| 75 Years and over | 3,372 (96.9%) | 1,918 (55.1%) |
| Total | 13,785 (35.0%) | 26,839 (68.1%) |
Disability Status by Sex by Age in Snyder County
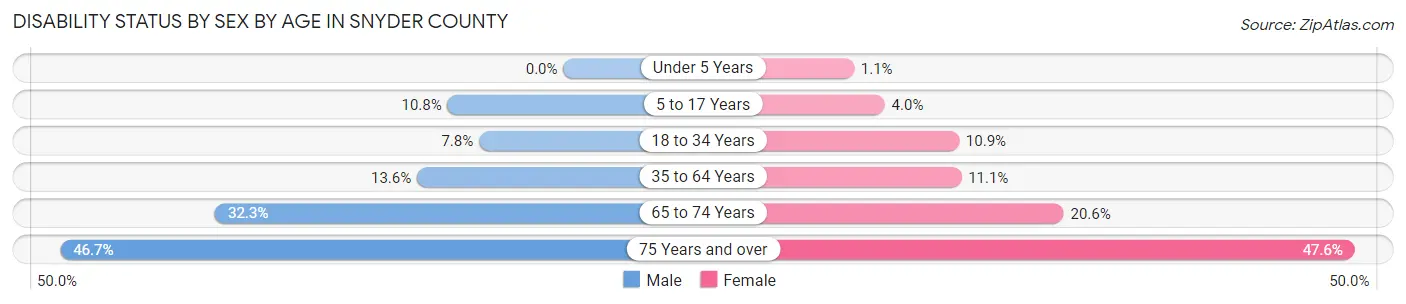
| Age Bracket | Male | Female |
| Under 5 Years | 0 (0.0%) | 11 (1.1%) |
| 5 to 17 Years | 346 (10.7%) | 114 (4.0%) |
| 18 to 34 Years | 361 (7.8%) | 508 (10.9%) |
| 35 to 64 Years | 977 (13.6%) | 780 (11.1%) |
| 65 to 74 Years | 668 (32.3%) | 443 (20.6%) |
| 75 Years and over | 614 (46.7%) | 1,030 (47.6%) |
Disability Class by Sex by Age in Snyder County
Disability Class: Hearing Difficulty
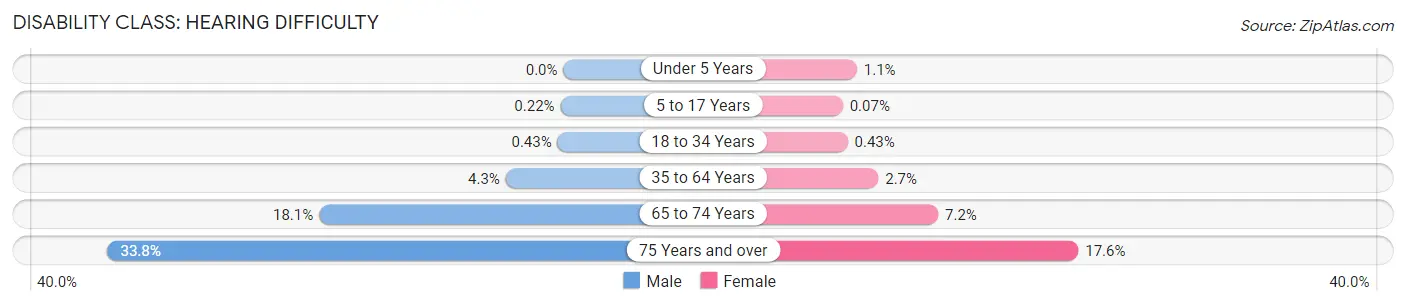
| Age Bracket | Male | Female |
| Under 5 Years | 0 (0.0%) | 11 (1.1%) |
| 5 to 17 Years | 7 (0.2%) | 2 (0.1%) |
| 18 to 34 Years | 20 (0.4%) | 20 (0.4%) |
| 35 to 64 Years | 308 (4.3%) | 191 (2.7%) |
| 65 to 74 Years | 375 (18.1%) | 154 (7.1%) |
| 75 Years and over | 445 (33.8%) | 380 (17.6%) |
Disability Class: Vision Difficulty
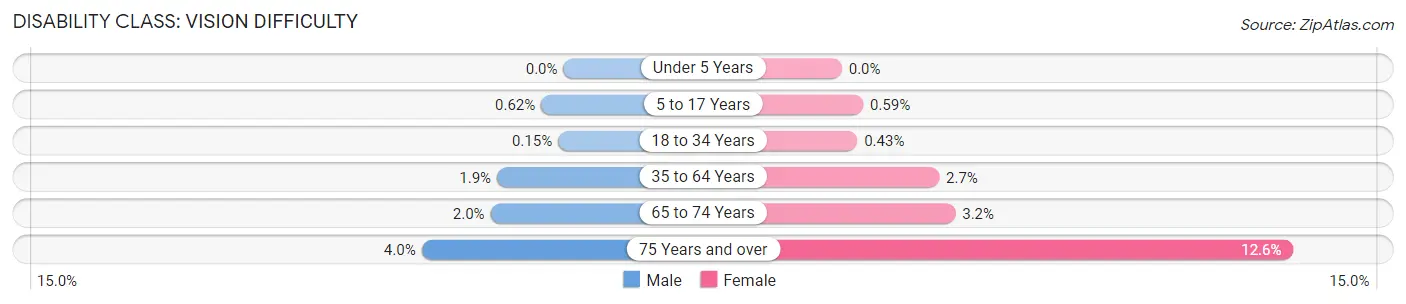
| Age Bracket | Male | Female |
| Under 5 Years | 0 (0.0%) | 0 (0.0%) |
| 5 to 17 Years | 20 (0.6%) | 17 (0.6%) |
| 18 to 34 Years | 7 (0.2%) | 20 (0.4%) |
| 35 to 64 Years | 133 (1.8%) | 191 (2.7%) |
| 65 to 74 Years | 42 (2.0%) | 68 (3.2%) |
| 75 Years and over | 52 (4.0%) | 272 (12.6%) |
Disability Class: Cognitive Difficulty
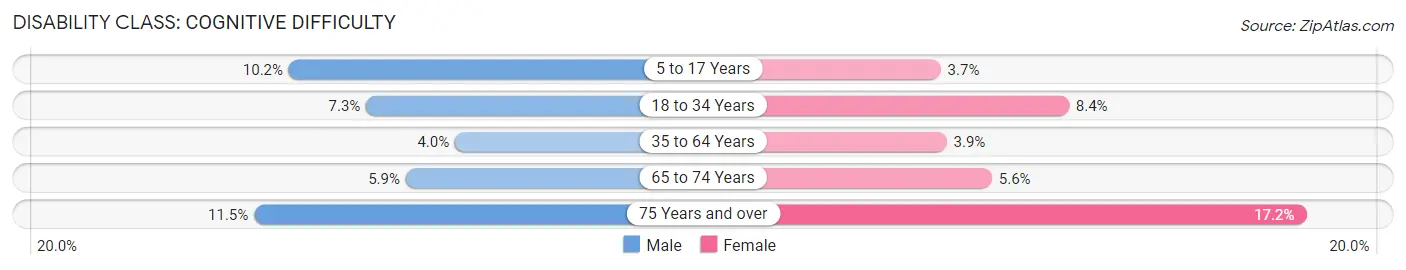
| Age Bracket | Male | Female |
| 5 to 17 Years | 328 (10.2%) | 105 (3.7%) |
| 18 to 34 Years | 338 (7.3%) | 394 (8.4%) |
| 35 to 64 Years | 289 (4.0%) | 274 (3.9%) |
| 65 to 74 Years | 121 (5.9%) | 120 (5.6%) |
| 75 Years and over | 151 (11.5%) | 373 (17.2%) |
Disability Class: Ambulatory Difficulty
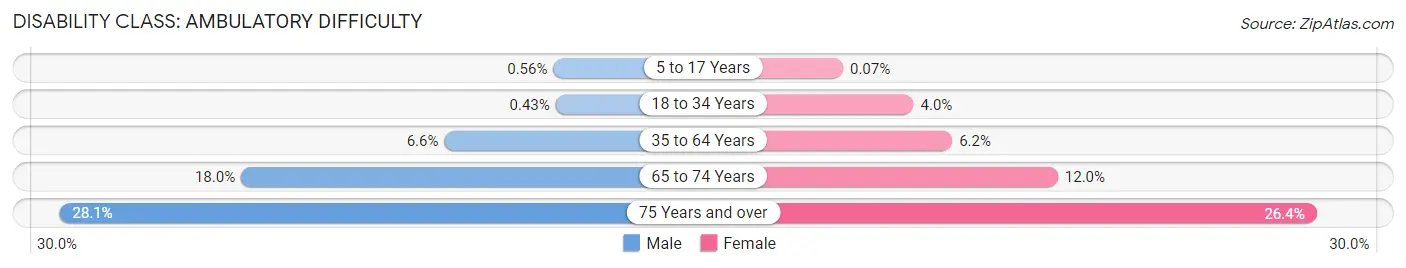
| Age Bracket | Male | Female |
| 5 to 17 Years | 18 (0.6%) | 2 (0.1%) |
| 18 to 34 Years | 20 (0.4%) | 187 (4.0%) |
| 35 to 64 Years | 477 (6.6%) | 433 (6.1%) |
| 65 to 74 Years | 371 (17.9%) | 259 (12.0%) |
| 75 Years and over | 369 (28.1%) | 572 (26.4%) |
Disability Class: Self-Care Difficulty
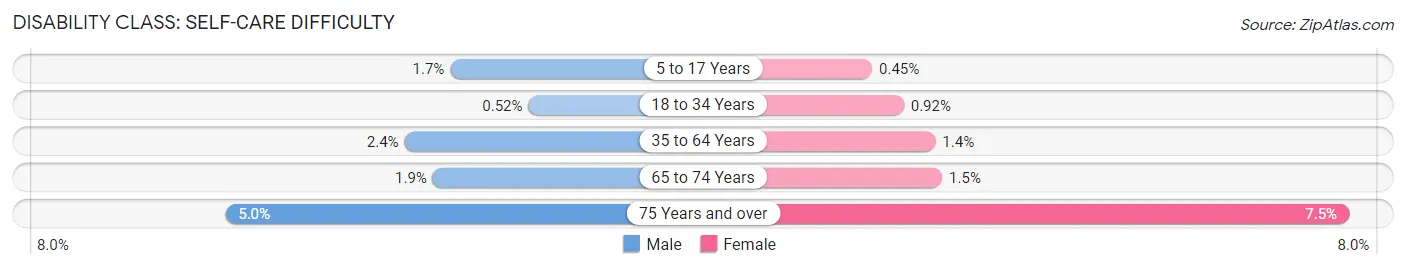
| Age Bracket | Male | Female |
| 5 to 17 Years | 54 (1.7%) | 13 (0.4%) |
| 18 to 34 Years | 24 (0.5%) | 43 (0.9%) |
| 35 to 64 Years | 170 (2.4%) | 98 (1.4%) |
| 65 to 74 Years | 40 (1.9%) | 32 (1.5%) |
| 75 Years and over | 66 (5.0%) | 163 (7.5%) |
Technology Access in Snyder County
Computing Device Access in Snyder County
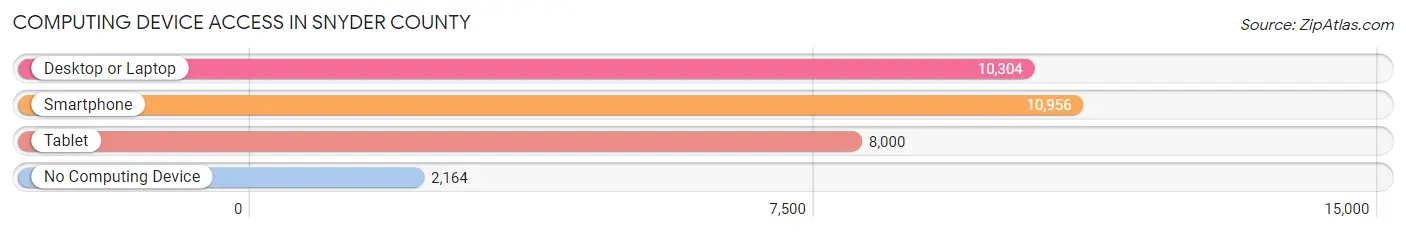
| Device Type | # Households | % Households |
| Desktop or Laptop | 10,304 | 71.4% |
| Smartphone | 10,956 | 75.9% |
| Tablet | 8,000 | 55.4% |
| No Computing Device | 2,164 | 15.0% |
| Total | 14,430 | 100.0% |
Internet Access in Snyder County
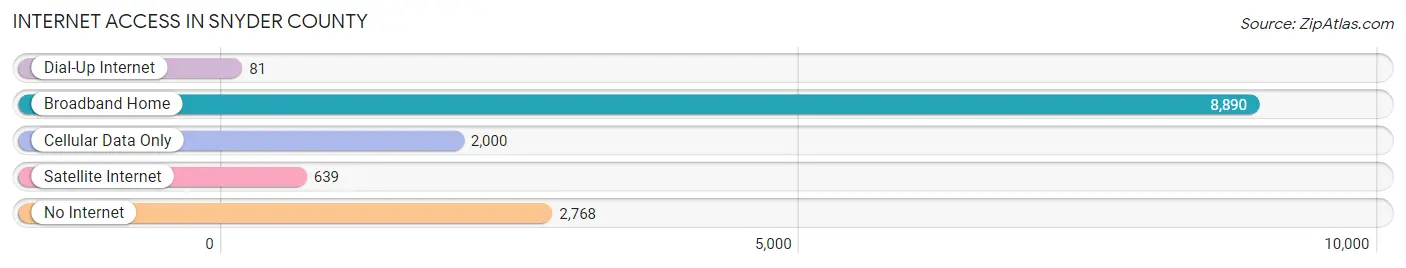
| Internet Type | # Households | % Households |
| Dial-Up Internet | 81 | 0.6% |
| Broadband Home | 8,890 | 61.6% |
| Cellular Data Only | 2,000 | 13.9% |
| Satellite Internet | 639 | 4.4% |
| No Internet | 2,768 | 19.2% |
| Total | 14,430 | 100.0% |
Snyder County Summary
Snyder County is a county located in the U.S. state of Pennsylvania. As of the 2010 census, the population was 39,702. The county seat is Middleburg. Snyder County was created on March 2, 1855, from parts of Union and Northumberland counties. It was named for the former Pennsylvania Governor Simon Snyder.
History
Snyder County was formed in 1855 from parts of Union and Northumberland counties. The county was named after Simon Snyder, the third Governor of Pennsylvania from 1808 to 1817. The county was originally part of the Iroquois Confederacy, and was later settled by German and Swiss immigrants in the late 1700s.
Geography
Snyder County is located in central Pennsylvania, and is bordered by Union County to the north, Northumberland County to the east, Juniata County to the south, and Mifflin County to the west. The county has a total area of 437 square miles, of which 434 square miles is land and 3 square miles is water. The county is located in the Ridge and Valley region of the Appalachian Mountains. The highest point in the county is Shade Mountain, which has an elevation of 2,039 feet.
Economy
Snyder County has a diverse economy, with a mix of agriculture, manufacturing, and services. The county is home to several large employers, including Weis Markets, Inc., a regional grocery store chain, and PennDOT, the Pennsylvania Department of Transportation. Agriculture is a major industry in the county, with dairy farming and livestock production being the primary agricultural activities. Manufacturing is also an important part of the economy, with several companies producing furniture, plastics, and other products.
Demographics
As of the 2010 census, there were 39,702 people, 15,845 households, and 11,072 families residing in the county. The population density was 91.3 people per square mile. The racial makeup of the county was 97.7% White, 0.7% African American, 0.2% Native American, 0.3% Asian, 0.1% Pacific Islander, 0.3% from other races, and 0.8% from two or more races. Hispanic or Latino of any race were 1.2% of the population.
The median income for a household in the county was $45,945, and the median income for a family was $54,945. The per capita income for the county was $21,945. About 8.2% of families and 10.7% of the population were below the poverty line, including 14.2% of those under age 18 and 8.2% of those age 65 or over.
Conclusion
Snyder County is a rural county located in central Pennsylvania. It has a diverse economy, with a mix of agriculture, manufacturing, and services. The county has a population of 39,702, with a median household income of $45,945. The county is home to several large employers, and is a popular destination for outdoor recreation.
Common Questions
What is Per Capita Income in Snyder County?
Per Capita income in Snyder County is $31,776.
What is the Median Family Income in Snyder County?
Median Family Income in Snyder County is $76,881.
What is the Median Household income in Snyder County?
Median Household Income in Snyder County is $65,914.
What is Income or Wage Gap in Snyder County?
Income or Wage Gap in Snyder County is 30.8%.
Women in Snyder County earn 69.2 cents for every dollar earned by a man.
What is Family Income Deficit in Snyder County?
Family Income Deficit in Snyder County is $8,592.
Families that are below poverty line in Snyder County earn $8,592 less on average than the poverty threshold level.
What is Inequality or Gini Index in Snyder County?
Inequality or Gini Index in Snyder County is 0.42.
What is the Total Population of Snyder County?
Total Population of Snyder County is 39,797.
What is the Total Male Population of Snyder County?
Total Male Population of Snyder County is 19,772.
What is the Total Female Population of Snyder County?
Total Female Population of Snyder County is 20,025.
What is the Ratio of Males per 100 Females in Snyder County?
There are 98.74 Males per 100 Females in Snyder County.
What is the Ratio of Females per 100 Males in Snyder County?
There are 101.28 Females per 100 Males in Snyder County.
What is the Median Population Age in Snyder County?
Median Population Age in Snyder County is 40.0 Years.
What is the Average Family Size in Snyder County
Average Family Size in Snyder County is 3.1 People.
What is the Average Household Size in Snyder County
Average Household Size in Snyder County is 2.6 People.
How Large is the Labor Force in Snyder County?
There are 19,884 People in the Labor Forcein in Snyder County.
What is the Percentage of People in the Labor Force in Snyder County?
60.9% of People are in the Labor Force in Snyder County.
What is the Unemployment Rate in Snyder County?
Unemployment Rate in Snyder County is 2.2%.