Potter County, PA Map & Demographics
Potter County Map
Potter County Overview
$29,629
PER CAPITA INCOME
$70,218
AVG FAMILY INCOME
$56,491
AVG HOUSEHOLD INCOME
30.2%
WAGE / INCOME GAP [ % ]
69.8¢/ $1
WAGE / INCOME GAP [ $ ]
$9,373
FAMILY INCOME DEFICIT
0.41
INEQUALITY / GINI INDEX
16,390
TOTAL POPULATION
8,220
MALE POPULATION
8,170
FEMALE POPULATION
100.61
MALES / 100 FEMALES
99.39
FEMALES / 100 MALES
48.1
MEDIAN AGE
3.0
AVG FAMILY SIZE
2.5
AVG HOUSEHOLD SIZE
7,169
LABOR FORCE [ PEOPLE ]
53.2%
PERCENT IN LABOR FORCE
4.8%
UNEMPLOYMENT RATE
Potter County Area Codes
Income in Potter County
Income Overview in Potter County
Per Capita Income in Potter County is $29,629, while median incomes of families and households are $70,218 and $56,491 respectively.
| Characteristic | Number | Measure |
| Per Capita Income | 16,390 | $29,629 |
| Median Family Income | 4,356 | $70,218 |
| Mean Family Income | 4,356 | $84,795 |
| Median Household Income | 6,595 | $56,491 |
| Mean Household Income | 6,595 | $70,333 |
| Income Deficit | 4,356 | $9,373 |
| Wage / Income Gap (%) | 16,390 | 30.17% |
| Wage / Income Gap ($) | 16,390 | 69.83¢ per $1 |
| Gini / Inequality Index | 16,390 | 0.41 |
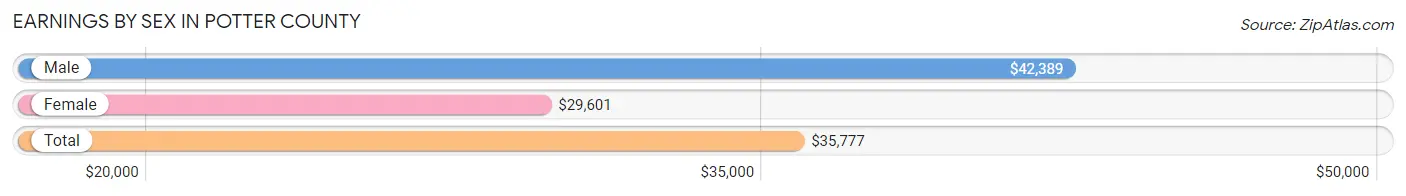
Earnings by Sex in Potter County
Average Earnings in Potter County are $35,777, $42,389 for men and $29,601 for women, a difference of 30.2%.
| Sex | Number | Average Earnings |
| Male | 4,123 (54.0%) | $42,389 |
| Female | 3,516 (46.0%) | $29,601 |
| Total | 7,639 (100.0%) | $35,777 |
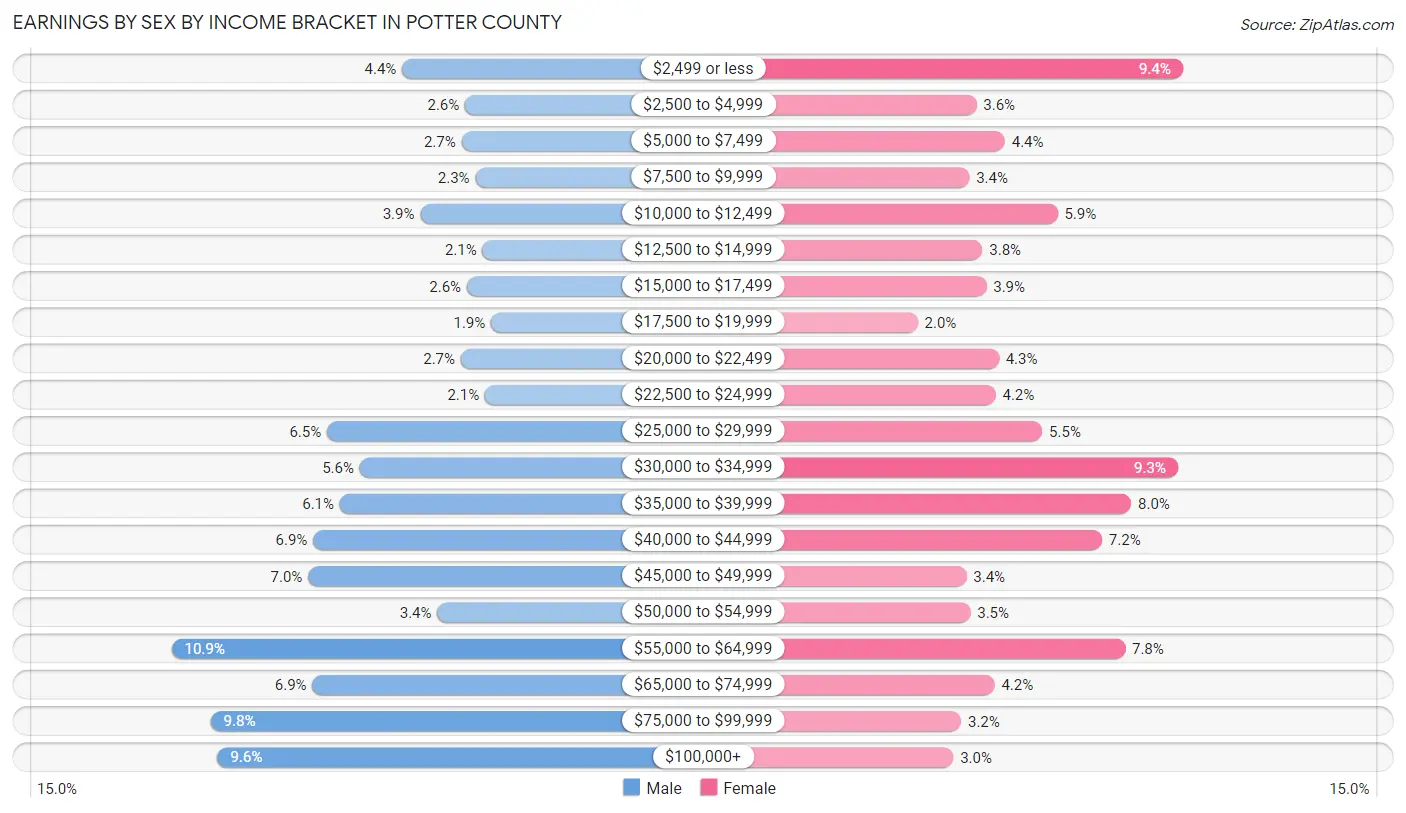
Earnings by Sex by Income Bracket in Potter County
The most common earnings brackets in Potter County are $55,000 to $64,999 for men (448 | 10.9%) and $2,499 or less for women (332 | 9.4%).
| Income | Male | Female |
| $2,499 or less | 181 (4.4%) | 332 (9.4%) |
| $2,500 to $4,999 | 108 (2.6%) | 128 (3.6%) |
| $5,000 to $7,499 | 112 (2.7%) | 156 (4.4%) |
| $7,500 to $9,999 | 96 (2.3%) | 121 (3.4%) |
| $10,000 to $12,499 | 160 (3.9%) | 208 (5.9%) |
| $12,500 to $14,999 | 88 (2.1%) | 134 (3.8%) |
| $15,000 to $17,499 | 106 (2.6%) | 138 (3.9%) |
| $17,500 to $19,999 | 78 (1.9%) | 70 (2.0%) |
| $20,000 to $22,499 | 113 (2.7%) | 150 (4.3%) |
| $22,500 to $24,999 | 85 (2.1%) | 147 (4.2%) |
| $25,000 to $29,999 | 268 (6.5%) | 193 (5.5%) |
| $30,000 to $34,999 | 230 (5.6%) | 327 (9.3%) |
| $35,000 to $39,999 | 253 (6.1%) | 281 (8.0%) |
| $40,000 to $44,999 | 284 (6.9%) | 252 (7.2%) |
| $45,000 to $49,999 | 290 (7.0%) | 118 (3.4%) |
| $50,000 to $54,999 | 140 (3.4%) | 122 (3.5%) |
| $55,000 to $64,999 | 448 (10.9%) | 275 (7.8%) |
| $65,000 to $74,999 | 285 (6.9%) | 146 (4.2%) |
| $75,000 to $99,999 | 403 (9.8%) | 113 (3.2%) |
| $100,000+ | 395 (9.6%) | 105 (3.0%) |
| Total | 4,123 (100.0%) | 3,516 (100.0%) |
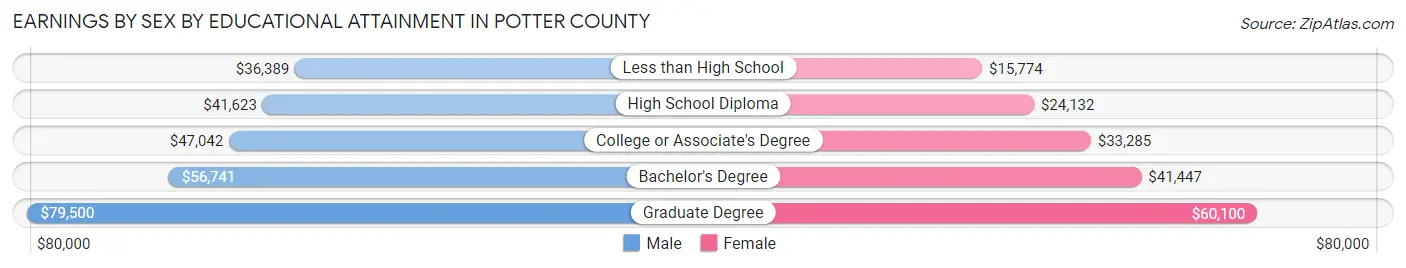
Earnings by Sex by Educational Attainment in Potter County
Average earnings in Potter County are $45,674 for men and $32,453 for women, a difference of 28.9%. Men with an educational attainment of graduate degree enjoy the highest average annual earnings of $79,500, while those with less than high school education earn the least with $36,389. Women with an educational attainment of graduate degree earn the most with the average annual earnings of $60,100, while those with less than high school education have the smallest earnings of $15,774.
| Educational Attainment | Male Income | Female Income |
| Less than High School | $36,389 | $15,774 |
| High School Diploma | $41,623 | $24,132 |
| College or Associate's Degree | $47,042 | $33,285 |
| Bachelor's Degree | $56,741 | $41,447 |
| Graduate Degree | $79,500 | $60,100 |
| Total | $45,674 | $32,453 |
Family Income in Potter County
Family Income Brackets in Potter County
According to the Potter County family income data, there are 971 families falling into the $50,000 to $74,999 income range, which is the most common income bracket and makes up 22.3% of all families. Conversely, the less than $10,000 income bracket is the least frequent group with only 70 families (1.6%) belonging to this category.
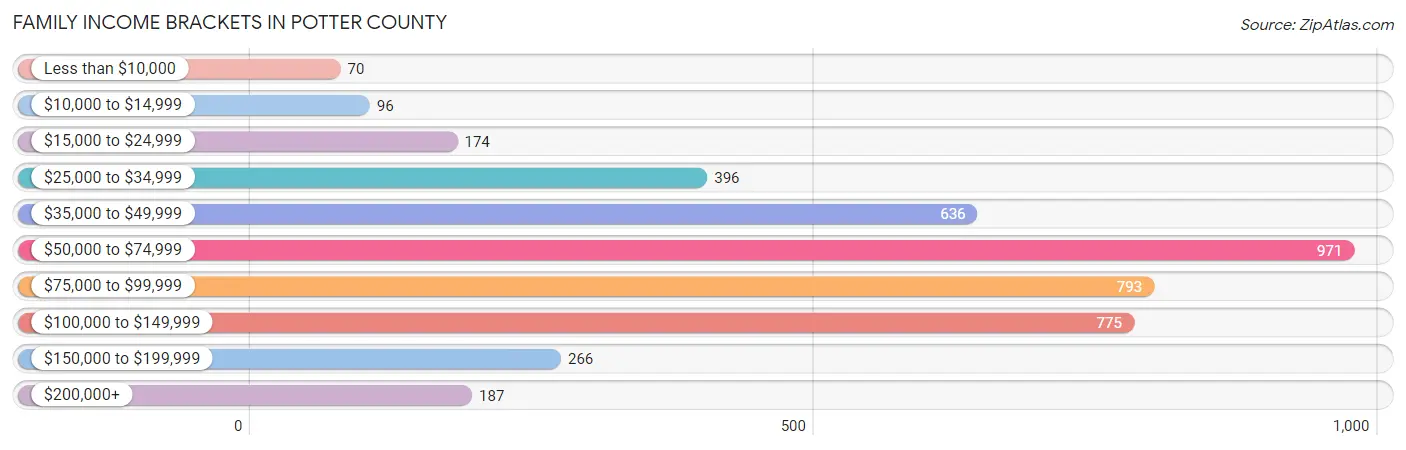
| Income Bracket | # Families | % Families |
| Less than $10,000 | 70 | 1.6% |
| $10,000 to $14,999 | 96 | 2.2% |
| $15,000 to $24,999 | 174 | 4.0% |
| $25,000 to $34,999 | 396 | 9.1% |
| $35,000 to $49,999 | 636 | 14.6% |
| $50,000 to $74,999 | 971 | 22.3% |
| $75,000 to $99,999 | 793 | 18.2% |
| $100,000 to $149,999 | 775 | 17.8% |
| $150,000 to $199,999 | 266 | 6.1% |
| $200,000+ | 187 | 4.3% |
Family Income by Famaliy Size in Potter County
4-person families (463 | 10.6%) account for the highest median family income in Potter County with $84,886 per family, while 2-person families (2,548 | 58.5%) have the highest median income of $32,792 per family member.
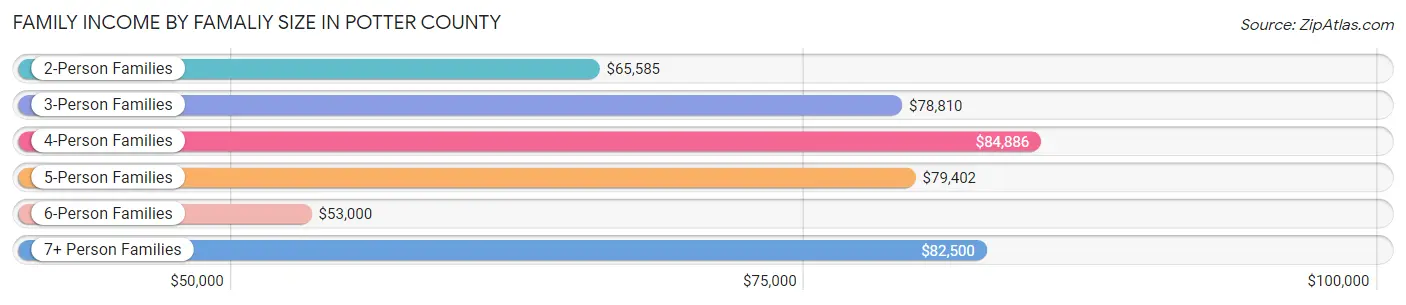
| Income Bracket | # Families | Median Income |
| 2-Person Families | 2,548 (58.5%) | $65,585 |
| 3-Person Families | 880 (20.2%) | $78,810 |
| 4-Person Families | 463 (10.6%) | $84,886 |
| 5-Person Families | 289 (6.6%) | $79,402 |
| 6-Person Families | 94 (2.2%) | $53,000 |
| 7+ Person Families | 82 (1.9%) | $82,500 |
| Total | 4,356 (100.0%) | $70,218 |
Family Income by Number of Earners in Potter County
The median family income in Potter County is $70,218, with families comprising 3+ earners (362) having the highest median family income of $118,750, while families with no earners (923) have the lowest median family income of $45,216, accounting for 8.3% and 21.2% of families, respectively.
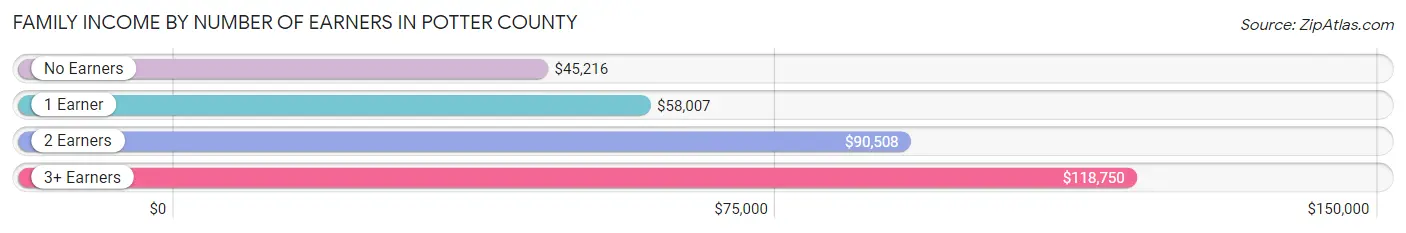
| Number of Earners | # Families | Median Income |
| No Earners | 923 (21.2%) | $45,216 |
| 1 Earner | 1,459 (33.5%) | $58,007 |
| 2 Earners | 1,612 (37.0%) | $90,508 |
| 3+ Earners | 362 (8.3%) | $118,750 |
| Total | 4,356 (100.0%) | $70,218 |
Household Income in Potter County
Household Income Brackets in Potter County
With 1,339 households falling in the category, the $50,000 to $74,999 income range is the most frequent in Potter County, accounting for 20.3% of all households. In contrast, only 191 households (2.9%) fall into the $200,000+ income bracket, making it the least populous group.
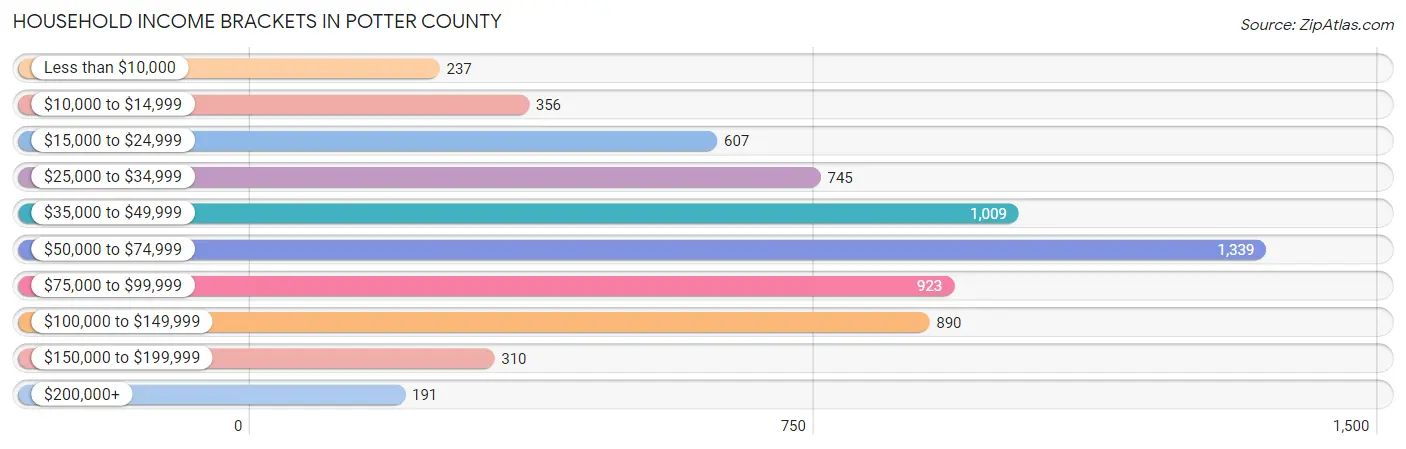
| Income Bracket | # Households | % Households |
| Less than $10,000 | 237 | 3.6% |
| $10,000 to $14,999 | 356 | 5.4% |
| $15,000 to $24,999 | 607 | 9.2% |
| $25,000 to $34,999 | 745 | 11.3% |
| $35,000 to $49,999 | 1,009 | 15.3% |
| $50,000 to $74,999 | 1,339 | 20.3% |
| $75,000 to $99,999 | 923 | 14.0% |
| $100,000 to $149,999 | 890 | 13.5% |
| $150,000 to $199,999 | 310 | 4.7% |
| $200,000+ | 191 | 2.9% |
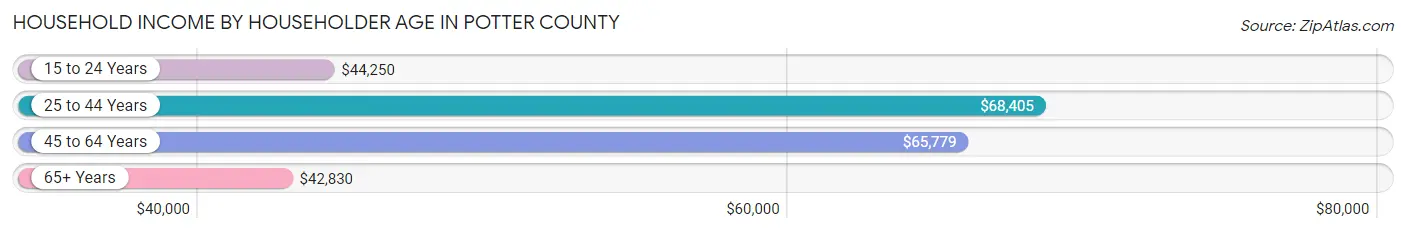
Household Income by Householder Age in Potter County
The median household income in Potter County is $56,491, with the highest median household income of $68,405 found in the 25 to 44 years age bracket for the primary householder. A total of 1,455 households (22.1%) fall into this category. Meanwhile, the 65+ years age bracket for the primary householder has the lowest median household income of $42,830, with 2,457 households (37.3%) in this group.
| Income Bracket | # Households | Median Income |
| 15 to 24 Years | 163 (2.5%) | $44,250 |
| 25 to 44 Years | 1,455 (22.1%) | $68,405 |
| 45 to 64 Years | 2,520 (38.2%) | $65,779 |
| 65+ Years | 2,457 (37.3%) | $42,830 |
| Total | 6,595 (100.0%) | $56,491 |
Poverty in Potter County
Income Below Poverty by Sex and Age in Potter County
With 10.9% poverty level for males and 13.6% for females among the residents of Potter County, 6 to 11 year old males and under 5 year old females are the most vulnerable to poverty, with 145 males (25.5%) and 108 females (26.6%) in their respective age groups living below the poverty level.
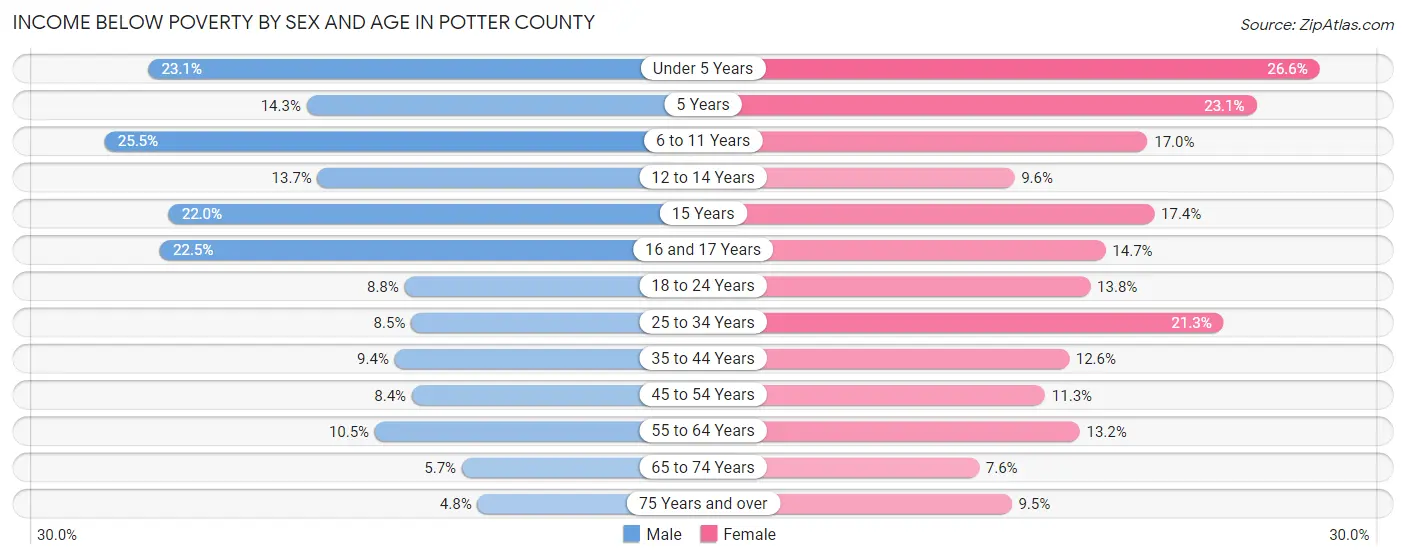
| Age Bracket | Male | Female |
| Under 5 Years | 91 (23.1%) | 108 (26.6%) |
| 5 Years | 10 (14.3%) | 21 (23.1%) |
| 6 to 11 Years | 145 (25.5%) | 99 (17.0%) |
| 12 to 14 Years | 42 (13.7%) | 24 (9.6%) |
| 15 Years | 29 (22.0%) | 16 (17.4%) |
| 16 and 17 Years | 42 (22.5%) | 32 (14.7%) |
| 18 to 24 Years | 52 (8.8%) | 73 (13.8%) |
| 25 to 34 Years | 69 (8.5%) | 165 (21.3%) |
| 35 to 44 Years | 78 (9.4%) | 102 (12.6%) |
| 45 to 54 Years | 84 (8.4%) | 107 (11.3%) |
| 55 to 64 Years | 140 (10.5%) | 172 (13.2%) |
| 65 to 74 Years | 66 (5.7%) | 88 (7.6%) |
| 75 Years and over | 33 (4.8%) | 87 (9.5%) |
| Total | 881 (10.9%) | 1,094 (13.6%) |
Income Above Poverty by Sex and Age in Potter County
According to the poverty statistics in Potter County, males aged 75 years and over and females aged 65 to 74 years are the age groups that are most secure financially, with 95.2% of males and 92.4% of females in these age groups living above the poverty line.
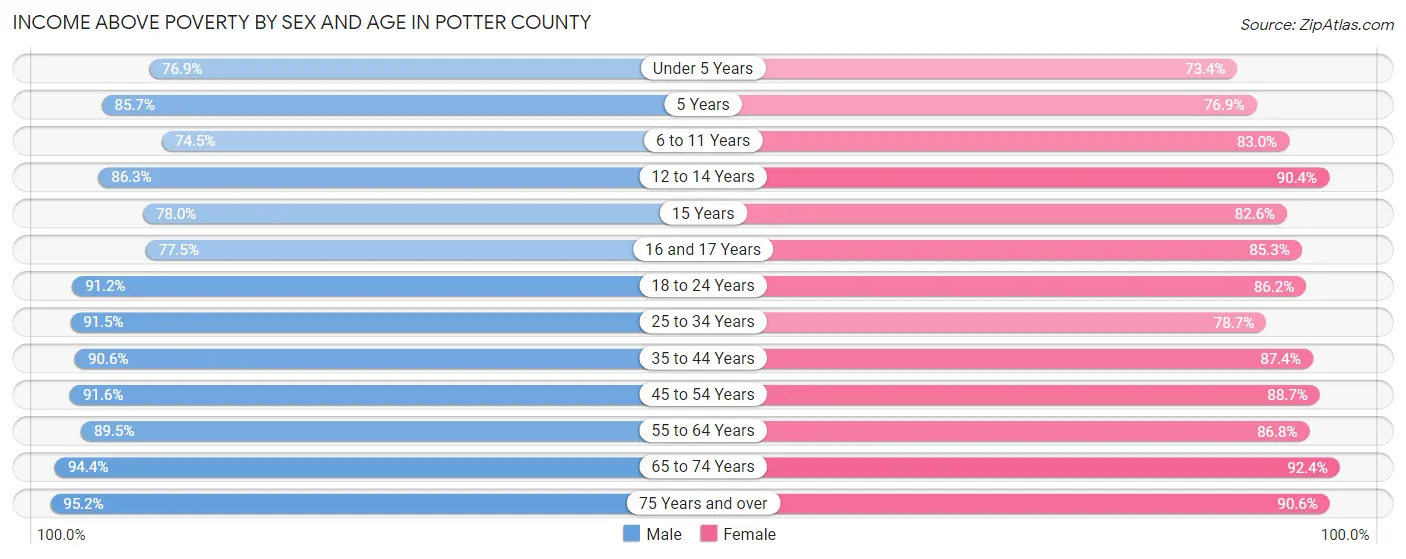
| Age Bracket | Male | Female |
| Under 5 Years | 303 (76.9%) | 298 (73.4%) |
| 5 Years | 60 (85.7%) | 70 (76.9%) |
| 6 to 11 Years | 423 (74.5%) | 483 (83.0%) |
| 12 to 14 Years | 265 (86.3%) | 226 (90.4%) |
| 15 Years | 103 (78.0%) | 76 (82.6%) |
| 16 and 17 Years | 145 (77.5%) | 186 (85.3%) |
| 18 to 24 Years | 536 (91.2%) | 455 (86.2%) |
| 25 to 34 Years | 746 (91.5%) | 611 (78.7%) |
| 35 to 44 Years | 753 (90.6%) | 705 (87.4%) |
| 45 to 54 Years | 912 (91.6%) | 839 (88.7%) |
| 55 to 64 Years | 1,194 (89.5%) | 1,127 (86.8%) |
| 65 to 74 Years | 1,102 (94.4%) | 1,066 (92.4%) |
| 75 Years and over | 657 (95.2%) | 834 (90.5%) |
| Total | 7,199 (89.1%) | 6,976 (86.4%) |
Income Below Poverty Among Married-Couple Families in Potter County
The poverty statistics for married-couple families in Potter County show that 4.1% or 148 of the total 3,584 families live below the poverty line. Families with 5 or more children have the highest poverty rate of 30.8%, comprising of 20 families. On the other hand, families with no children have the lowest poverty rate of 2.4%, which includes 60 families.
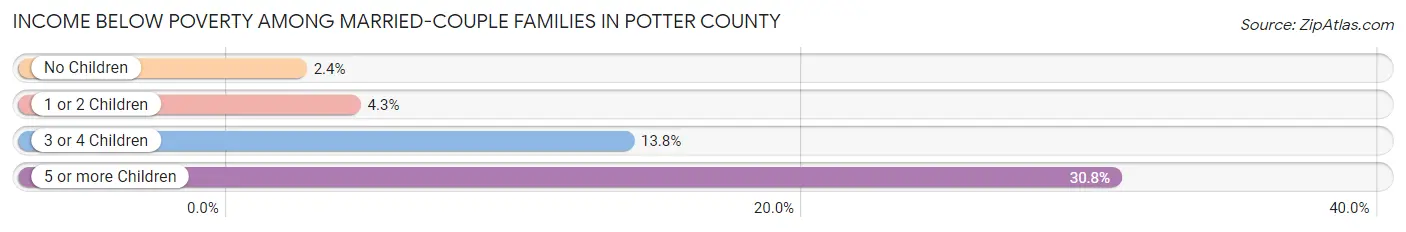
| Children | Above Poverty | Below Poverty |
| No Children | 2,449 (97.6%) | 60 (2.4%) |
| 1 or 2 Children | 717 (95.7%) | 32 (4.3%) |
| 3 or 4 Children | 225 (86.2%) | 36 (13.8%) |
| 5 or more Children | 45 (69.2%) | 20 (30.8%) |
| Total | 3,436 (95.9%) | 148 (4.1%) |
Income Below Poverty Among Single-Parent Households in Potter County
According to the poverty data in Potter County, 8.8% or 24 single-father households and 30.5% or 152 single-mother households are living below the poverty line. Among single-father households, those with 3 or 4 children have the highest poverty rate, with 8 households (44.4%) experiencing poverty. Likewise, among single-mother households, those with 5 or more children have the highest poverty rate, with 1 households (100.0%) falling below the poverty line.
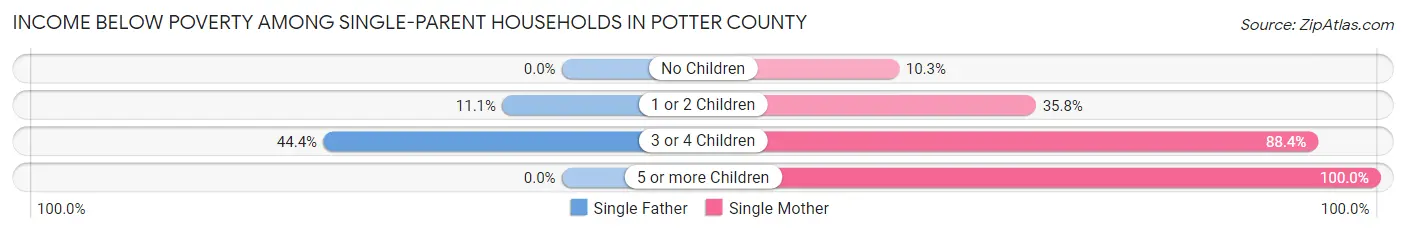
| Children | Single Father | Single Mother |
| No Children | 0 (0.0%) | 20 (10.3%) |
| 1 or 2 Children | 16 (11.1%) | 93 (35.8%) |
| 3 or 4 Children | 8 (44.4%) | 38 (88.4%) |
| 5 or more Children | 0 (0.0%) | 1 (100.0%) |
| Total | 24 (8.8%) | 152 (30.5%) |
Income Below Poverty Among Married-Couple vs Single-Parent Households in Potter County
The poverty data for Potter County shows that 148 of the married-couple family households (4.1%) and 176 of the single-parent households (22.8%) are living below the poverty level. Within the married-couple family households, those with 5 or more children have the highest poverty rate, with 20 households (30.8%) falling below the poverty line. Among the single-parent households, those with 5 or more children have the highest poverty rate, with 1 household (100.0%) living below poverty.
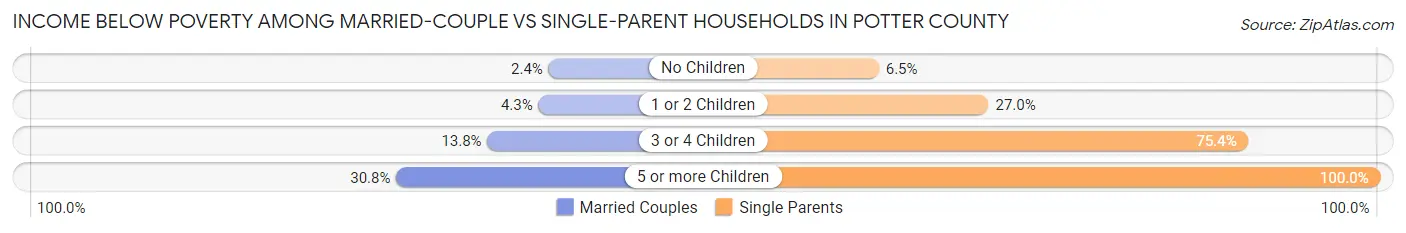
| Children | Married-Couple Families | Single-Parent Households |
| No Children | 60 (2.4%) | 20 (6.5%) |
| 1 or 2 Children | 32 (4.3%) | 109 (27.0%) |
| 3 or 4 Children | 36 (13.8%) | 46 (75.4%) |
| 5 or more Children | 20 (30.8%) | 1 (100.0%) |
| Total | 148 (4.1%) | 176 (22.8%) |
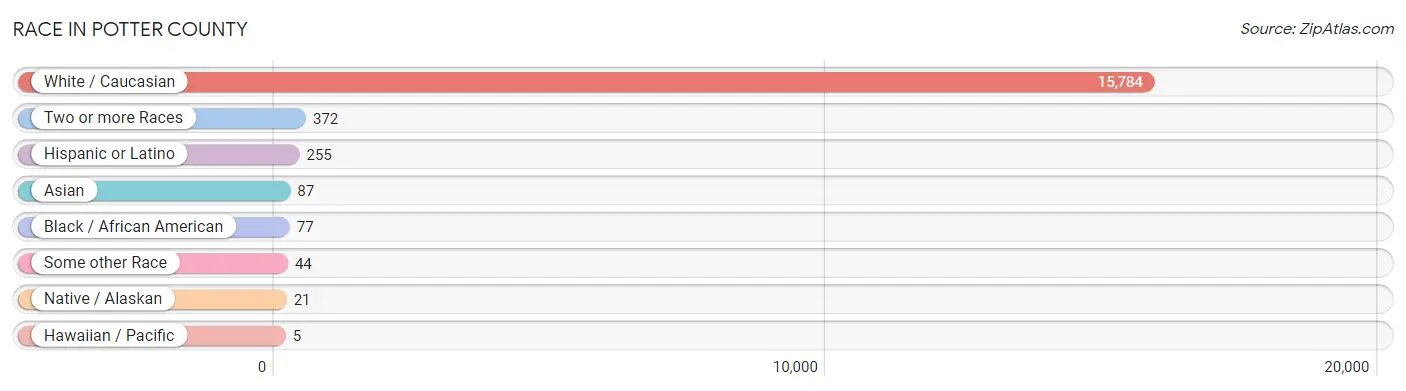
Race in Potter County
The most populous races in Potter County are White / Caucasian (15,784 | 96.3%), Two or more Races (372 | 2.3%), and Hispanic or Latino (255 | 1.6%).
| Race | # Population | % Population |
| Asian | 87 | 0.5% |
| Black / African American | 77 | 0.5% |
| Hawaiian / Pacific | 5 | 0.0% |
| Hispanic or Latino | 255 | 1.6% |
| Native / Alaskan | 21 | 0.1% |
| White / Caucasian | 15,784 | 96.3% |
| Two or more Races | 372 | 2.3% |
| Some other Race | 44 | 0.3% |
| Total | 16,390 | 100.0% |
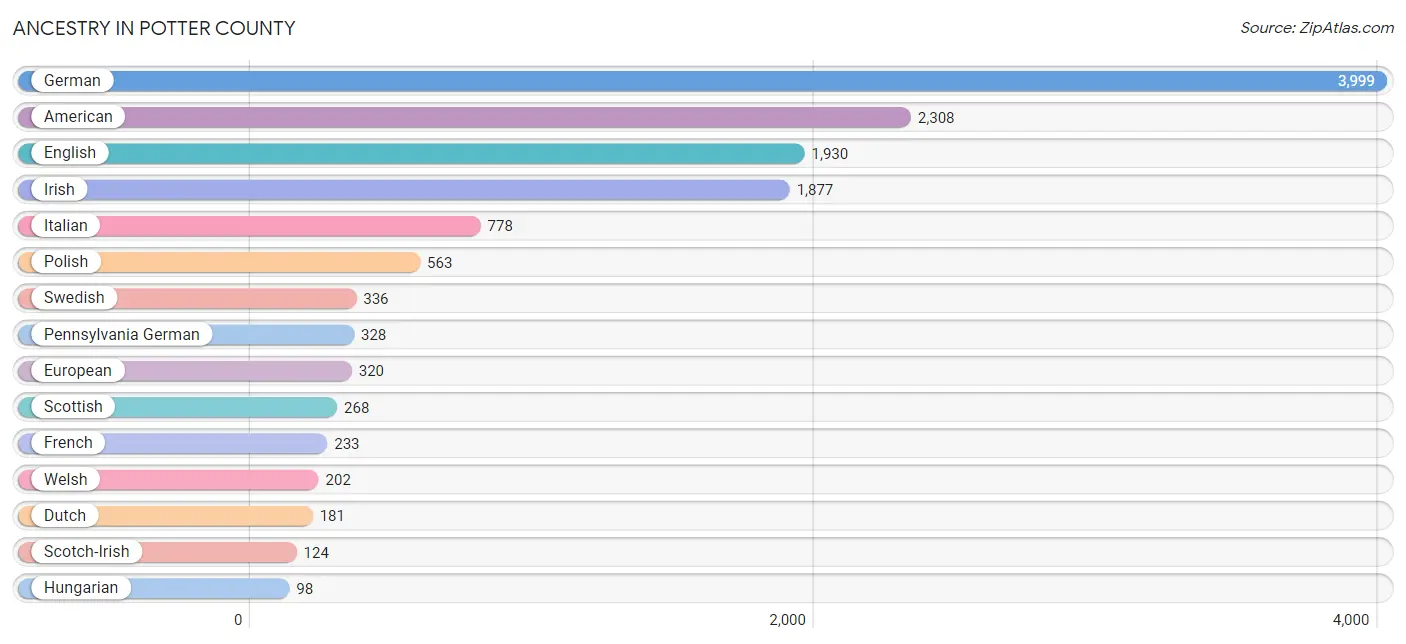
Ancestry in Potter County
The most populous ancestries reported in Potter County are German (3,999 | 24.4%), American (2,308 | 14.1%), English (1,930 | 11.8%), Irish (1,877 | 11.5%), and Italian (778 | 4.8%), together accounting for 66.5% of all Potter County residents.
| Ancestry | # Population | % Population |
| African | 1 | 0.0% |
| American | 2,308 | 14.1% |
| Arab | 20 | 0.1% |
| Armenian | 7 | 0.0% |
| Austrian | 46 | 0.3% |
| Belgian | 1 | 0.0% |
| Blackfeet | 3 | 0.0% |
| British | 75 | 0.5% |
| Bulgarian | 20 | 0.1% |
| Burmese | 3 | 0.0% |
| Cajun | 2 | 0.0% |
| Canadian | 11 | 0.1% |
| Central American | 18 | 0.1% |
| Cherokee | 71 | 0.4% |
| Chippewa | 1 | 0.0% |
| Colombian | 41 | 0.3% |
| Costa Rican | 3 | 0.0% |
| Croatian | 10 | 0.1% |
| Cuban | 37 | 0.2% |
| Czech | 52 | 0.3% |
| Czechoslovakian | 15 | 0.1% |
| Danish | 19 | 0.1% |
| Delaware | 1 | 0.0% |
| Dutch | 181 | 1.1% |
| Eastern European | 38 | 0.2% |
| English | 1,930 | 11.8% |
| Estonian | 2 | 0.0% |
| European | 320 | 1.9% |
| Finnish | 34 | 0.2% |
| French | 233 | 1.4% |
| French Canadian | 55 | 0.3% |
| German | 3,999 | 24.4% |
| Greek | 8 | 0.1% |
| Guatemalan | 3 | 0.0% |
| Hungarian | 98 | 0.6% |
| Indian (Asian) | 21 | 0.1% |
| Iranian | 2 | 0.0% |
| Irish | 1,877 | 11.5% |
| Iroquois | 12 | 0.1% |
| Italian | 778 | 4.8% |
| Jamaican | 3 | 0.0% |
| Korean | 11 | 0.1% |
| Lebanese | 20 | 0.1% |
| Lithuanian | 10 | 0.1% |
| Mexican | 67 | 0.4% |
| Native Hawaiian | 5 | 0.0% |
| Navajo | 11 | 0.1% |
| Nigerian | 1 | 0.0% |
| Northern European | 21 | 0.1% |
| Norwegian | 62 | 0.4% |
| Pennsylvania German | 328 | 2.0% |
| Peruvian | 9 | 0.1% |
| Polish | 563 | 3.4% |
| Portuguese | 12 | 0.1% |
| Puerto Rican | 66 | 0.4% |
| Romanian | 4 | 0.0% |
| Russian | 78 | 0.5% |
| Salvadoran | 12 | 0.1% |
| Scandinavian | 28 | 0.2% |
| Scotch-Irish | 124 | 0.8% |
| Scottish | 268 | 1.6% |
| Serbian | 2 | 0.0% |
| Slavic | 1 | 0.0% |
| Slovak | 51 | 0.3% |
| Slovene | 7 | 0.0% |
| South American | 50 | 0.3% |
| Sri Lankan | 11 | 0.1% |
| Subsaharan African | 2 | 0.0% |
| Swedish | 336 | 2.1% |
| Swiss | 77 | 0.5% |
| Thai | 8 | 0.1% |
| Ukrainian | 81 | 0.5% |
| Vietnamese | 42 | 0.3% |
| Welsh | 202 | 1.2% |
| Yugoslavian | 9 | 0.1% | View All 75 Rows |
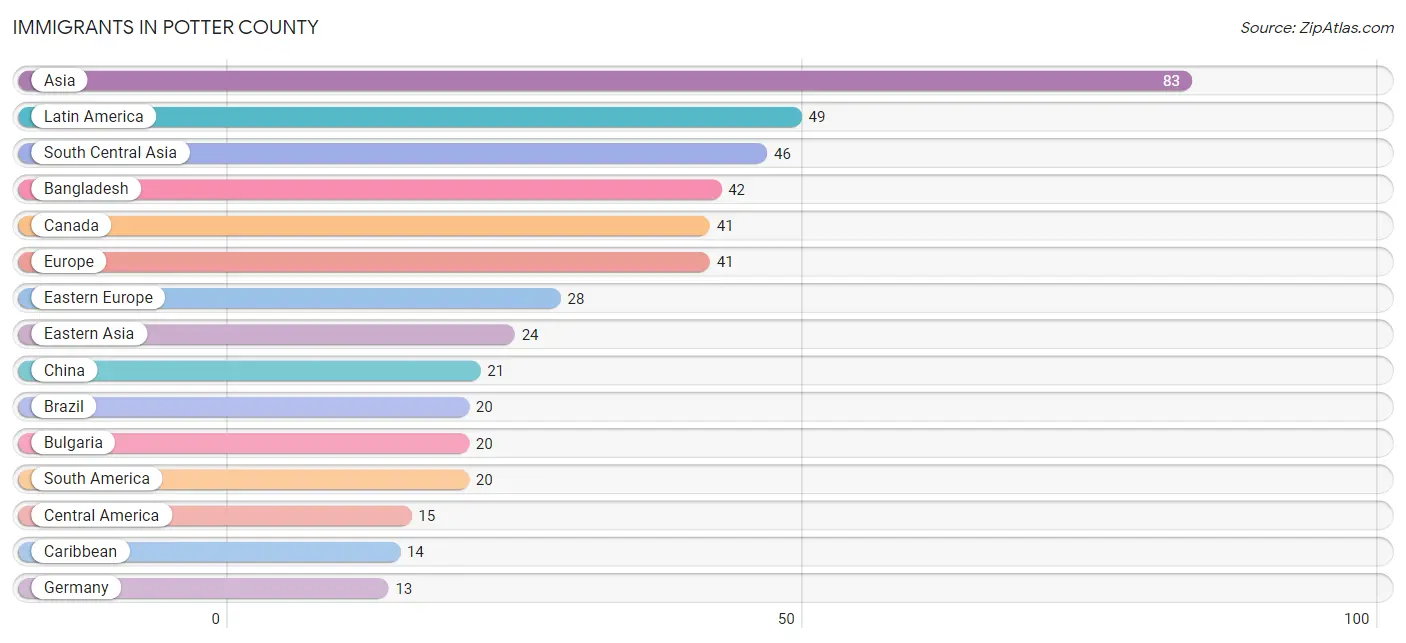
Immigrants in Potter County
The most numerous immigrant groups reported in Potter County came from Asia (83 | 0.5%), Latin America (49 | 0.3%), South Central Asia (46 | 0.3%), Bangladesh (42 | 0.3%), and Canada (41 | 0.3%), together accounting for 1.6% of all Potter County residents.
| Immigration Origin | # Population | % Population |
| Africa | 1 | 0.0% |
| Asia | 83 | 0.5% |
| Bangladesh | 42 | 0.3% |
| Brazil | 20 | 0.1% |
| Bulgaria | 20 | 0.1% |
| Canada | 41 | 0.3% |
| Caribbean | 14 | 0.1% |
| Central America | 15 | 0.1% |
| China | 21 | 0.1% |
| Cuba | 5 | 0.0% |
| Dominican Republic | 3 | 0.0% |
| Eastern Asia | 24 | 0.2% |
| Eastern Europe | 28 | 0.2% |
| El Salvador | 12 | 0.1% |
| Europe | 41 | 0.3% |
| Germany | 13 | 0.1% |
| Guatemala | 3 | 0.0% |
| India | 4 | 0.0% |
| Jamaica | 6 | 0.0% |
| Korea | 3 | 0.0% |
| Laos | 6 | 0.0% |
| Latin America | 49 | 0.3% |
| Latvia | 2 | 0.0% |
| Nigeria | 1 | 0.0% |
| Philippines | 5 | 0.0% |
| Russia | 3 | 0.0% |
| South America | 20 | 0.1% |
| South Central Asia | 46 | 0.3% |
| South Eastern Asia | 13 | 0.1% |
| Ukraine | 3 | 0.0% |
| Vietnam | 2 | 0.0% |
| Western Africa | 1 | 0.0% |
| Western Europe | 13 | 0.1% | View All 33 Rows |
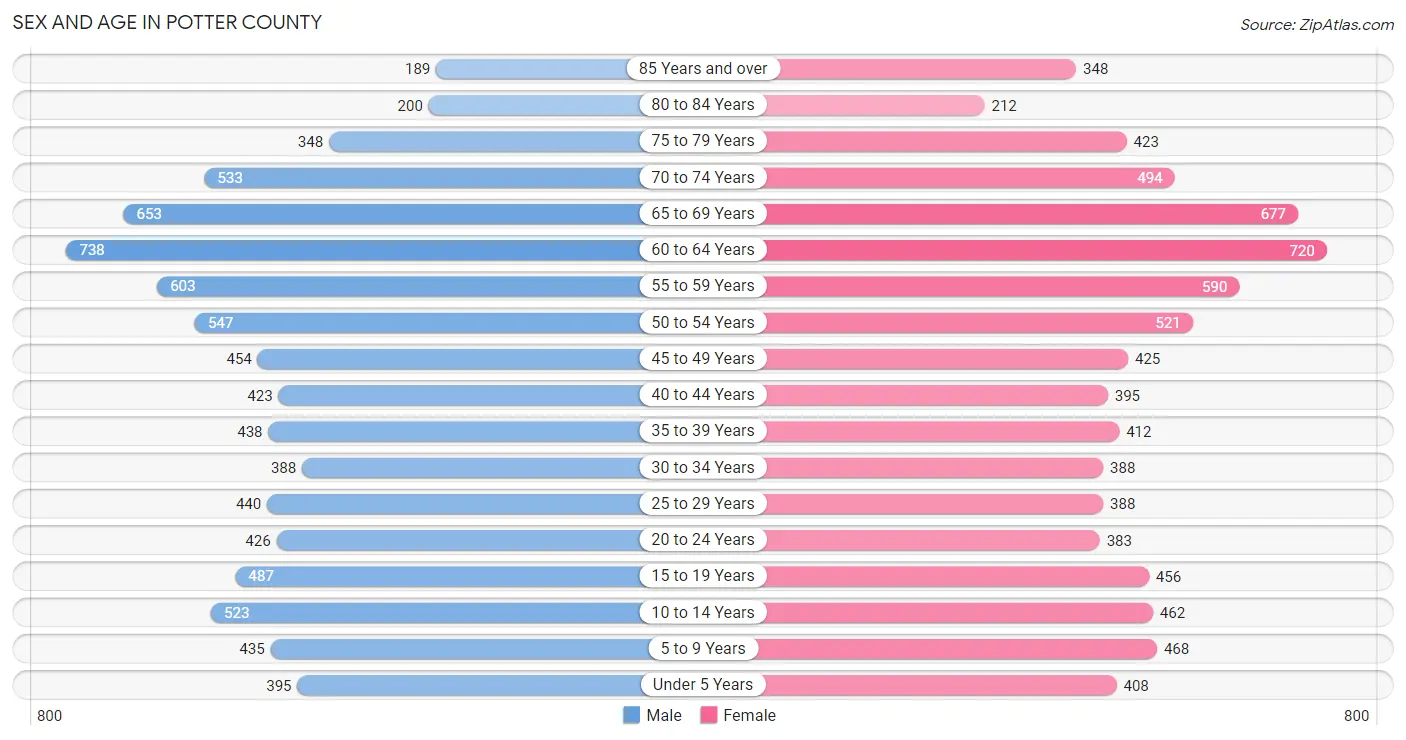
Sex and Age in Potter County
Sex and Age in Potter County
The most populous age groups in Potter County are 60 to 64 Years (738 | 9.0%) for men and 60 to 64 Years (720 | 8.8%) for women.
| Age Bracket | Male | Female |
| Under 5 Years | 395 (4.8%) | 408 (5.0%) |
| 5 to 9 Years | 435 (5.3%) | 468 (5.7%) |
| 10 to 14 Years | 523 (6.4%) | 462 (5.7%) |
| 15 to 19 Years | 487 (5.9%) | 456 (5.6%) |
| 20 to 24 Years | 426 (5.2%) | 383 (4.7%) |
| 25 to 29 Years | 440 (5.3%) | 388 (4.8%) |
| 30 to 34 Years | 388 (4.7%) | 388 (4.8%) |
| 35 to 39 Years | 438 (5.3%) | 412 (5.0%) |
| 40 to 44 Years | 423 (5.1%) | 395 (4.8%) |
| 45 to 49 Years | 454 (5.5%) | 425 (5.2%) |
| 50 to 54 Years | 547 (6.7%) | 521 (6.4%) |
| 55 to 59 Years | 603 (7.3%) | 590 (7.2%) |
| 60 to 64 Years | 738 (9.0%) | 720 (8.8%) |
| 65 to 69 Years | 653 (7.9%) | 677 (8.3%) |
| 70 to 74 Years | 533 (6.5%) | 494 (6.0%) |
| 75 to 79 Years | 348 (4.2%) | 423 (5.2%) |
| 80 to 84 Years | 200 (2.4%) | 212 (2.6%) |
| 85 Years and over | 189 (2.3%) | 348 (4.3%) |
| Total | 8,220 (100.0%) | 8,170 (100.0%) |
Families and Households in Potter County
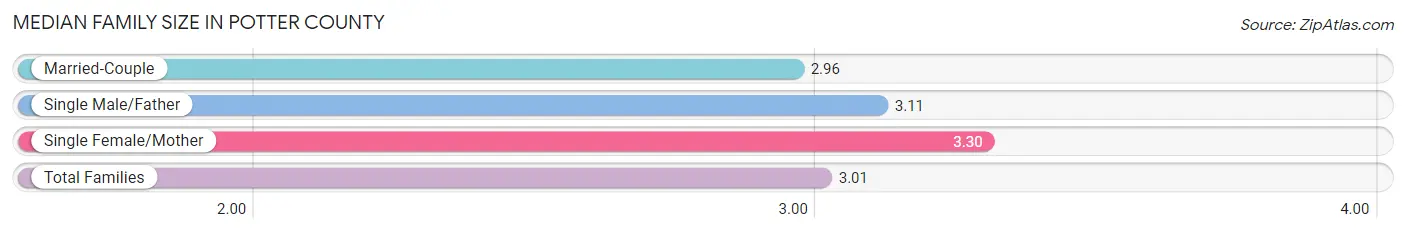
Median Family Size in Potter County
The median family size in Potter County is 3.01 persons per family, with single female/mother families (499 | 11.5%) accounting for the largest median family size of 3.3 persons per family. On the other hand, married-couple families (3,584 | 82.3%) represent the smallest median family size with 2.96 persons per family.
| Family Type | # Families | Family Size |
| Married-Couple | 3,584 (82.3%) | 2.96 |
| Single Male/Father | 273 (6.3%) | 3.11 |
| Single Female/Mother | 499 (11.5%) | 3.30 |
| Total Families | 4,356 (100.0%) | 3.01 |
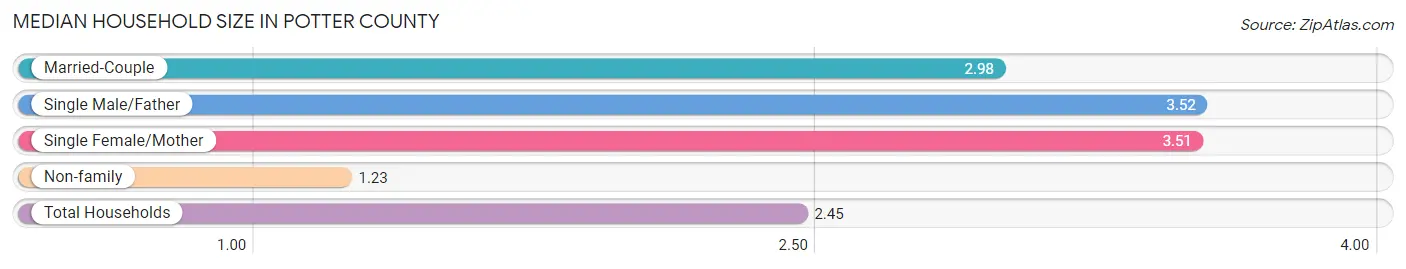
Median Household Size in Potter County
The median household size in Potter County is 2.45 persons per household, with single male/father households (273 | 4.1%) accounting for the largest median household size of 3.52 persons per household. non-family households (2,239 | 34.0%) represent the smallest median household size with 1.23 persons per household.
| Household Type | # Households | Household Size |
| Married-Couple | 3,584 (54.3%) | 2.98 |
| Single Male/Father | 273 (4.1%) | 3.52 |
| Single Female/Mother | 499 (7.6%) | 3.51 |
| Non-family | 2,239 (34.0%) | 1.23 |
| Total Households | 6,595 (100.0%) | 2.45 |
Household Size by Marriage Status in Potter County
Out of a total of 6,595 households in Potter County, 4,356 (66.0%) are family households, while 2,239 (34.0%) are nonfamily households. The most numerous type of family households are 2-person households, comprising 2,454, and the most common type of nonfamily households are 1-person households, comprising 1,855.
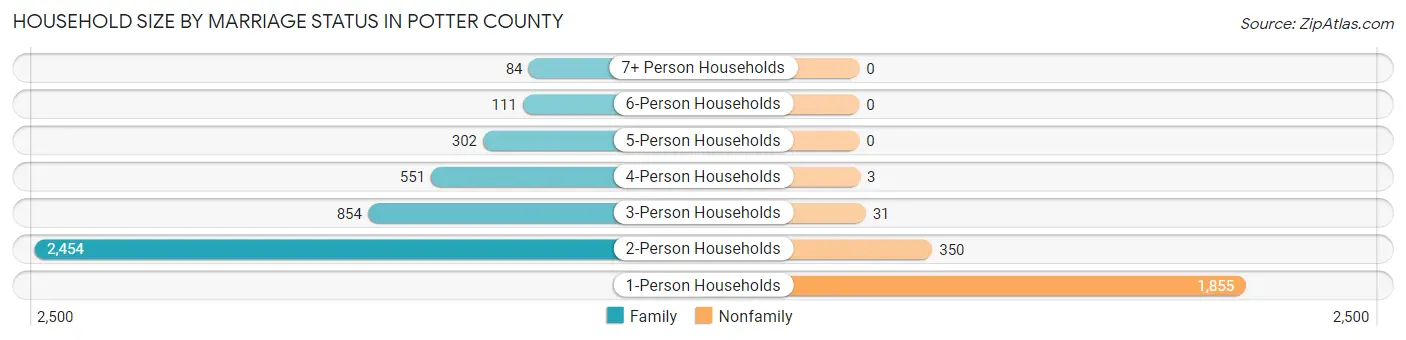
| Household Size | Family Households | Nonfamily Households |
| 1-Person Households | - | 1,855 (28.1%) |
| 2-Person Households | 2,454 (37.2%) | 350 (5.3%) |
| 3-Person Households | 854 (13.0%) | 31 (0.5%) |
| 4-Person Households | 551 (8.4%) | 3 (0.1%) |
| 5-Person Households | 302 (4.6%) | 0 (0.0%) |
| 6-Person Households | 111 (1.7%) | 0 (0.0%) |
| 7+ Person Households | 84 (1.3%) | 0 (0.0%) |
| Total | 4,356 (66.0%) | 2,239 (34.0%) |
Female Fertility in Potter County
Fertility by Age in Potter County
Average fertility rate in Potter County is 47.0 births per 1,000 women. Women in the age bracket of 20 to 34 years have the highest fertility rate with 109.0 births per 1,000 women. Women in the age bracket of 20 to 34 years acount for 90.6% of all women with births.
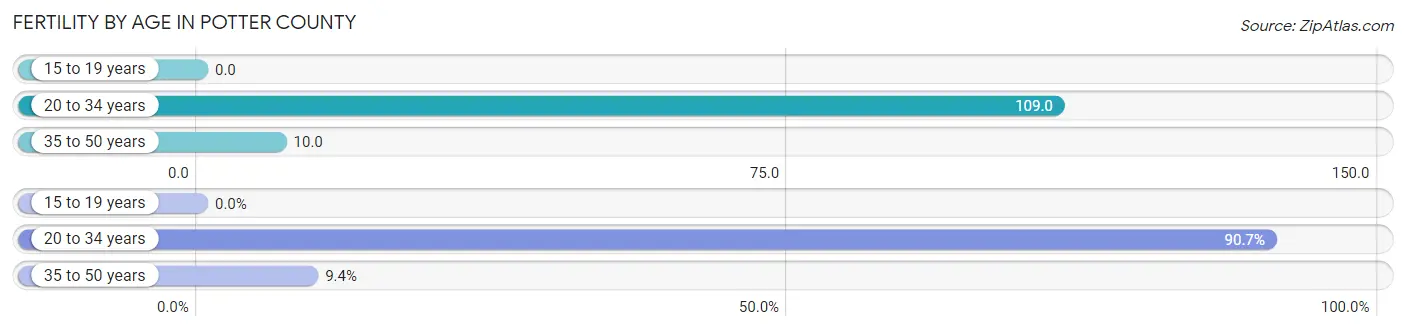
| Age Bracket | Women with Births | Births / 1,000 Women |
| 15 to 19 years | 0 (0.0%) | 0.0 |
| 20 to 34 years | 126 (90.6%) | 109.0 |
| 35 to 50 years | 13 (9.3%) | 10.0 |
| Total | 139 (100.0%) | 47.0 |
Fertility by Age by Marriage Status in Potter County
64.0% of women with births (139) in Potter County are married. The highest percentage of unmarried women with births falls into 20 to 34 years age bracket with 36.5% of them unmarried at the time of birth, while the lowest percentage of unmarried women with births belong to 35 to 50 years age bracket with 30.8% of them unmarried.
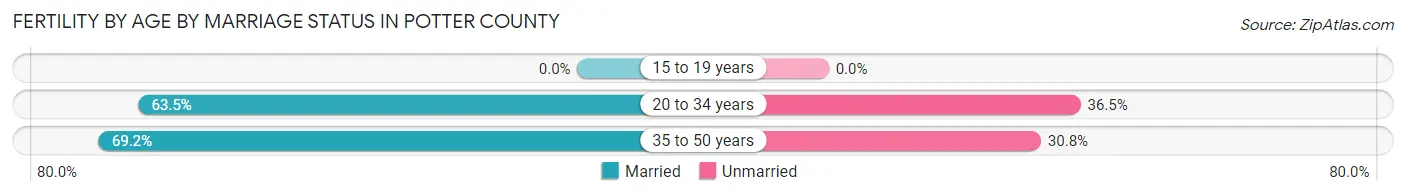
| Age Bracket | Married | Unmarried |
| 15 to 19 years | 0 (0.0%) | 0 (0.0%) |
| 20 to 34 years | 80 (63.5%) | 46 (36.5%) |
| 35 to 50 years | 9 (69.2%) | 4 (30.8%) |
| Total | 89 (64.0%) | 50 (36.0%) |
Fertility by Education in Potter County
Average fertility rate in Potter County is 47.0 births per 1,000 women. Women with the education attainment of graduate degree have the highest fertility rate of 73.0 births per 1,000 women, while women with the education attainment of less than high school have the lowest fertility at 6.0 births per 1,000 women. Women with the education attainment of high school diploma represent 42.4% of all women with births.
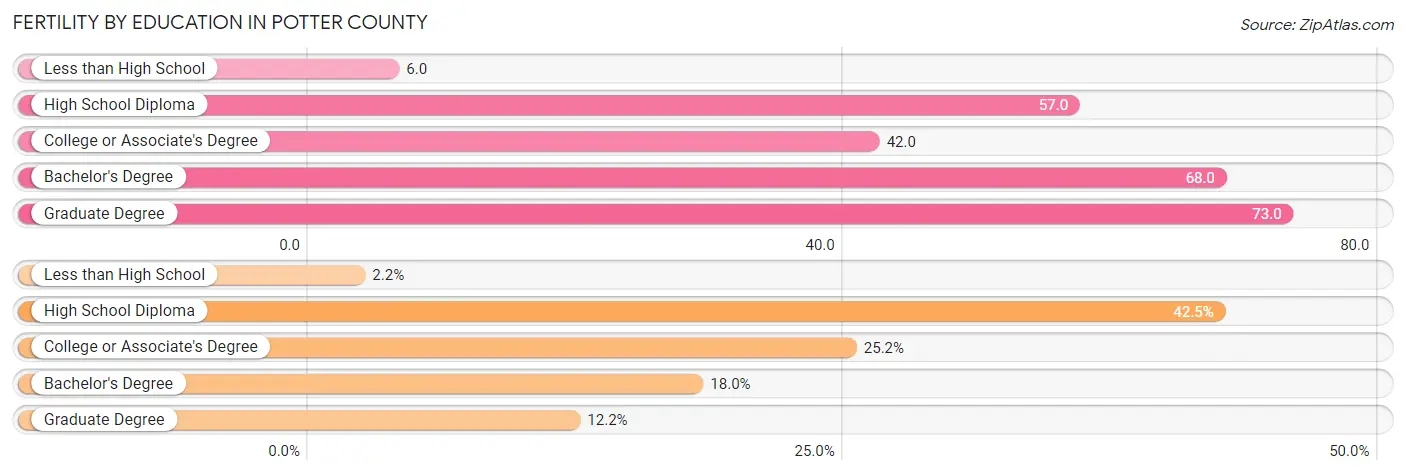
| Educational Attainment | Women with Births | Births / 1,000 Women |
| Less than High School | 3 (2.2%) | 6.0 |
| High School Diploma | 59 (42.4%) | 57.0 |
| College or Associate's Degree | 35 (25.2%) | 42.0 |
| Bachelor's Degree | 25 (18.0%) | 68.0 |
| Graduate Degree | 17 (12.2%) | 73.0 |
| Total | 139 (100.0%) | 47.0 |
Fertility by Education by Marriage Status in Potter County
36.0% of women with births in Potter County are unmarried. Women with the educational attainment of less than high school are most likely to be married with 100.0% of them married at childbirth, while women with the educational attainment of high school diploma are least likely to be married with 57.6% of them unmarried at childbirth.
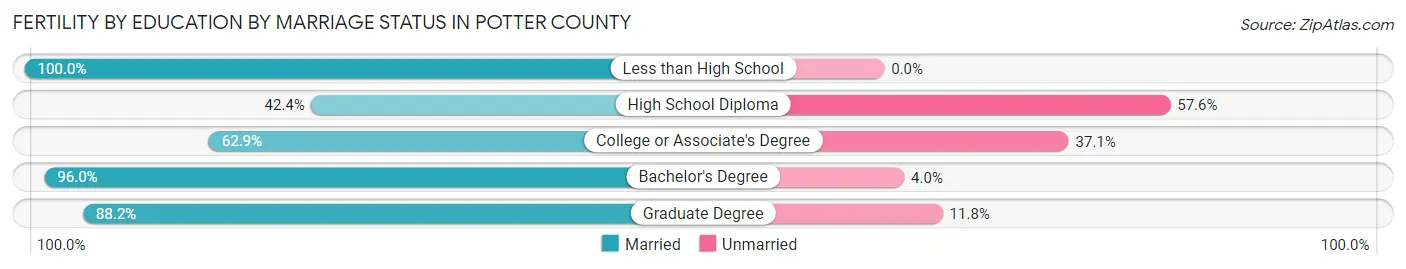
| Educational Attainment | Married | Unmarried |
| Less than High School | 3 (100.0%) | 0 (0.0%) |
| High School Diploma | 25 (42.4%) | 34 (57.6%) |
| College or Associate's Degree | 22 (62.9%) | 13 (37.1%) |
| Bachelor's Degree | 24 (96.0%) | 1 (4.0%) |
| Graduate Degree | 15 (88.2%) | 2 (11.8%) |
| Total | 89 (64.0%) | 50 (36.0%) |
Employment Characteristics in Potter County
Employment by Class of Employer in Potter County
Among the 6,670 employed individuals in Potter County, private company employees (4,148 | 62.2%), local government employees (616 | 9.2%), and self-employed (not incorporated) (598 | 9.0%) make up the most common classes of employment.
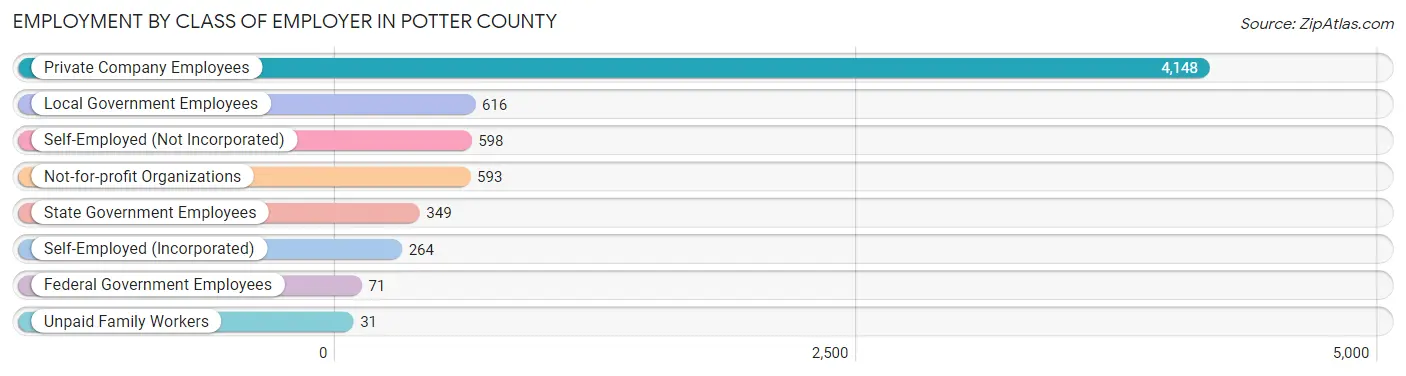
| Employer Class | # Employees | % Employees |
| Private Company Employees | 4,148 | 62.2% |
| Self-Employed (Incorporated) | 264 | 4.0% |
| Self-Employed (Not Incorporated) | 598 | 9.0% |
| Not-for-profit Organizations | 593 | 8.9% |
| Local Government Employees | 616 | 9.2% |
| State Government Employees | 349 | 5.2% |
| Federal Government Employees | 71 | 1.1% |
| Unpaid Family Workers | 31 | 0.5% |
| Total | 6,670 | 100.0% |
Employment Status by Age in Potter County
According to the labor force statistics for Potter County, out of the total population over 16 years of age (13,475), 53.2% or 7,169 individuals are in the labor force, with 4.8% or 344 of them unemployed. The age group with the highest labor force participation rate is 35 to 44 years, with 81.4% or 1,358 individuals in the labor force. Within the labor force, the 20 to 24 years age range has the highest percentage of unemployed individuals, with 12.2% or 79 of them being unemployed.
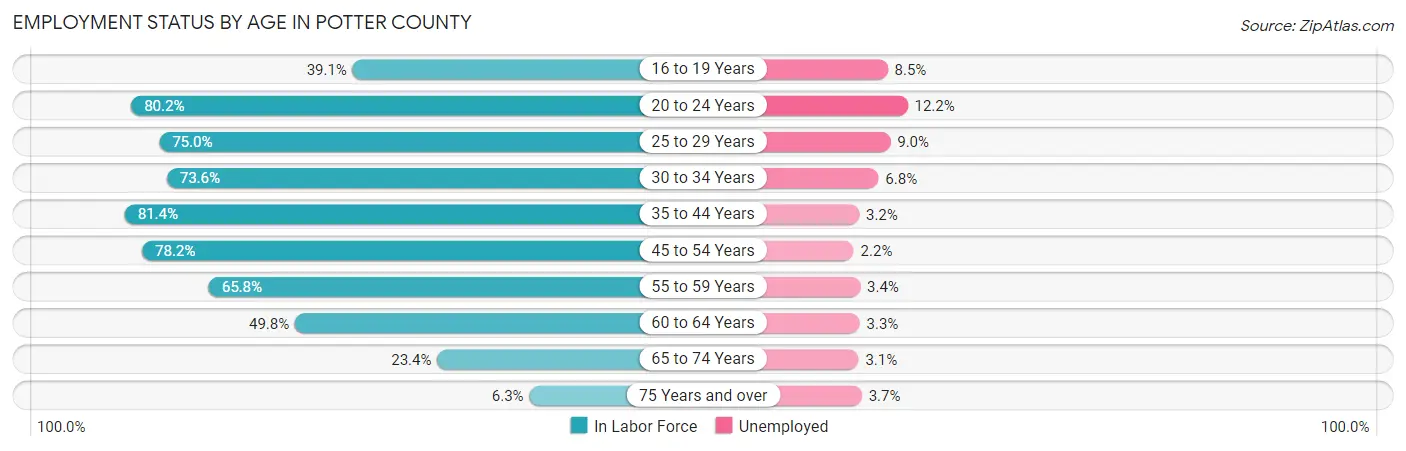
| Age Bracket | In Labor Force | Unemployed |
| 16 to 19 Years | 281 (39.1%) | 24 (8.5%) |
| 20 to 24 Years | 649 (80.2%) | 79 (12.2%) |
| 25 to 29 Years | 621 (75.0%) | 56 (9.0%) |
| 30 to 34 Years | 571 (73.6%) | 39 (6.8%) |
| 35 to 44 Years | 1,358 (81.4%) | 43 (3.2%) |
| 45 to 54 Years | 1,523 (78.2%) | 34 (2.2%) |
| 55 to 59 Years | 785 (65.8%) | 27 (3.4%) |
| 60 to 64 Years | 726 (49.8%) | 24 (3.3%) |
| 65 to 74 Years | 552 (23.4%) | 17 (3.1%) |
| 75 Years and over | 108 (6.3%) | 4 (3.7%) |
| Total | 7,169 (53.2%) | 344 (4.8%) |
Employment Status by Educational Attainment in Potter County
According to labor force statistics for Potter County, 70.9% of individuals (5,580) out of the total population between 25 and 64 years of age (7,870) are in the labor force, with 4.0% or 223 of them being unemployed. The group with the highest labor force participation rate are those with the educational attainment of bachelor's degree or higher, with 81.7% or 1,167 individuals in the labor force. Within the labor force, individuals with less than high school education have the highest percentage of unemployment, with 6.5% or 18 of them being unemployed.
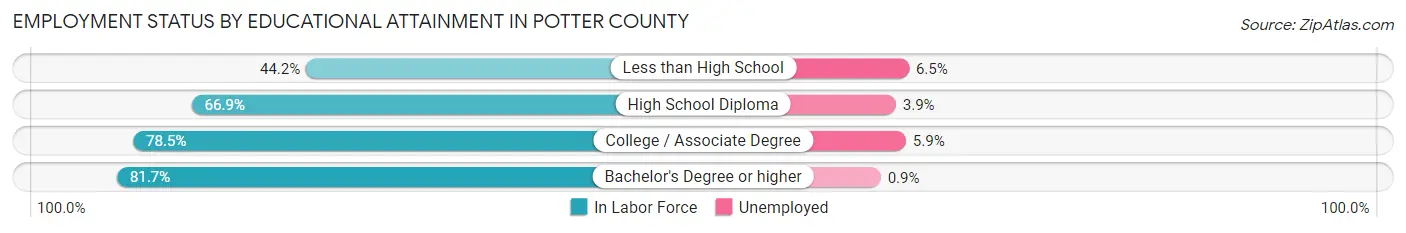
| Educational Attainment | In Labor Force | Unemployed |
| Less than High School | 275 (44.2%) | 40 (6.5%) |
| High School Diploma | 2,466 (66.9%) | 144 (3.9%) |
| College / Associate Degree | 1,674 (78.5%) | 126 (5.9%) |
| Bachelor's Degree or higher | 1,167 (81.7%) | 13 (0.9%) |
| Total | 5,580 (70.9%) | 315 (4.0%) |
Employment Occupations by Sex in Potter County
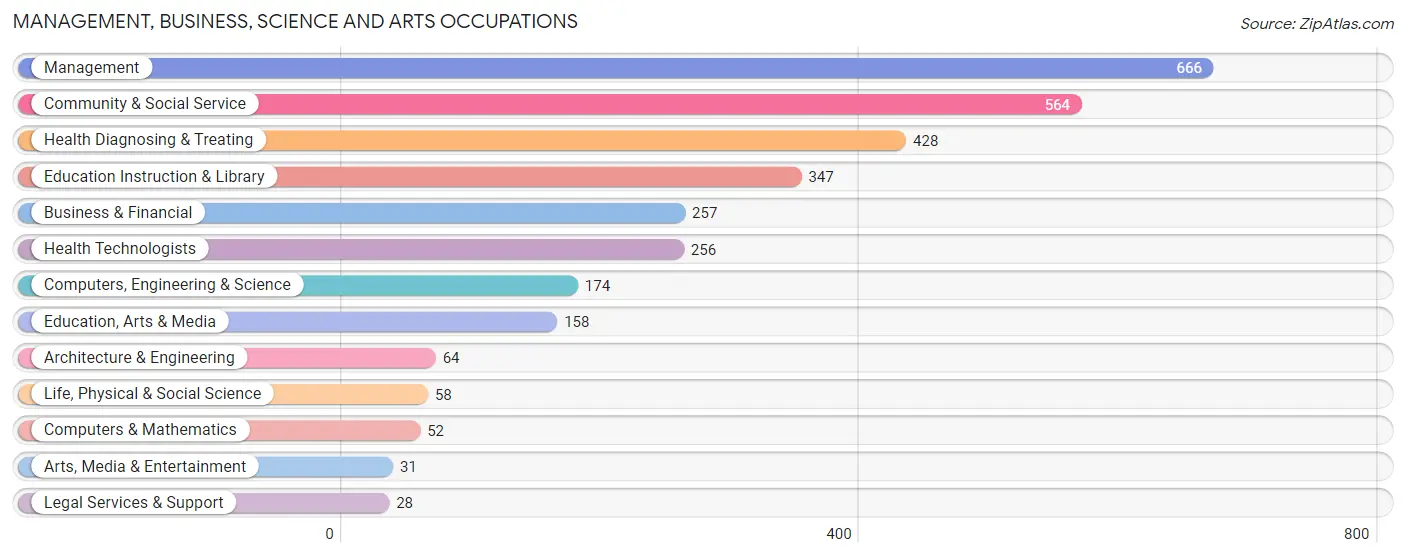
Management, Business, Science and Arts Occupations
The most common Management, Business, Science and Arts occupations in Potter County are Management (666 | 9.8%), Community & Social Service (564 | 8.3%), Health Diagnosing & Treating (428 | 6.3%), Education Instruction & Library (347 | 5.1%), and Business & Financial (257 | 3.8%).
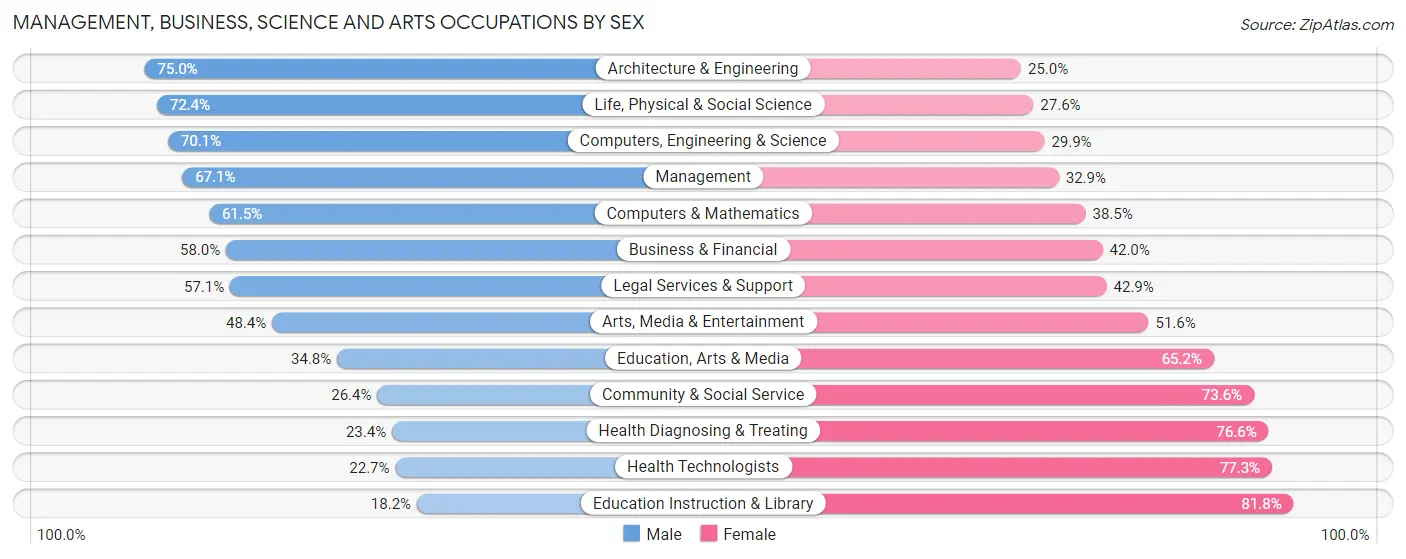
Management, Business, Science and Arts Occupations by Sex
Within the Management, Business, Science and Arts occupations in Potter County, the most male-oriented occupations are Architecture & Engineering (75.0%), Life, Physical & Social Science (72.4%), and Computers, Engineering & Science (70.1%), while the most female-oriented occupations are Education Instruction & Library (81.8%), Health Technologists (77.3%), and Health Diagnosing & Treating (76.6%).
| Occupation | Male | Female |
| Management | 447 (67.1%) | 219 (32.9%) |
| Business & Financial | 149 (58.0%) | 108 (42.0%) |
| Computers, Engineering & Science | 122 (70.1%) | 52 (29.9%) |
| Computers & Mathematics | 32 (61.5%) | 20 (38.5%) |
| Architecture & Engineering | 48 (75.0%) | 16 (25.0%) |
| Life, Physical & Social Science | 42 (72.4%) | 16 (27.6%) |
| Community & Social Service | 149 (26.4%) | 415 (73.6%) |
| Education, Arts & Media | 55 (34.8%) | 103 (65.2%) |
| Legal Services & Support | 16 (57.1%) | 12 (42.9%) |
| Education Instruction & Library | 63 (18.2%) | 284 (81.8%) |
| Arts, Media & Entertainment | 15 (48.4%) | 16 (51.6%) |
| Health Diagnosing & Treating | 100 (23.4%) | 328 (76.6%) |
| Health Technologists | 58 (22.7%) | 198 (77.3%) |
| Total (Category) | 967 (46.3%) | 1,122 (53.7%) |
| Total (Overall) | 3,674 (53.8%) | 3,153 (46.2%) |
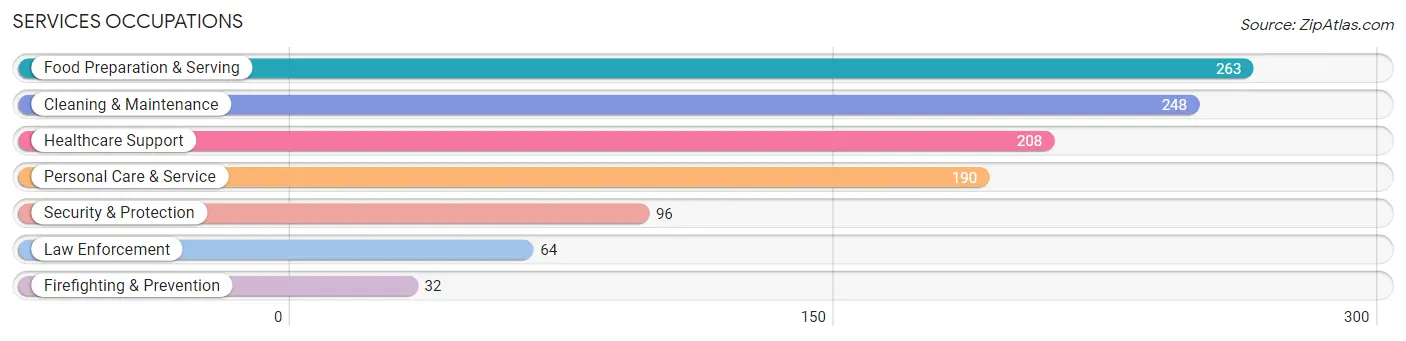
Services Occupations
The most common Services occupations in Potter County are Food Preparation & Serving (263 | 3.8%), Cleaning & Maintenance (248 | 3.6%), Healthcare Support (208 | 3.0%), Personal Care & Service (190 | 2.8%), and Security & Protection (96 | 1.4%).
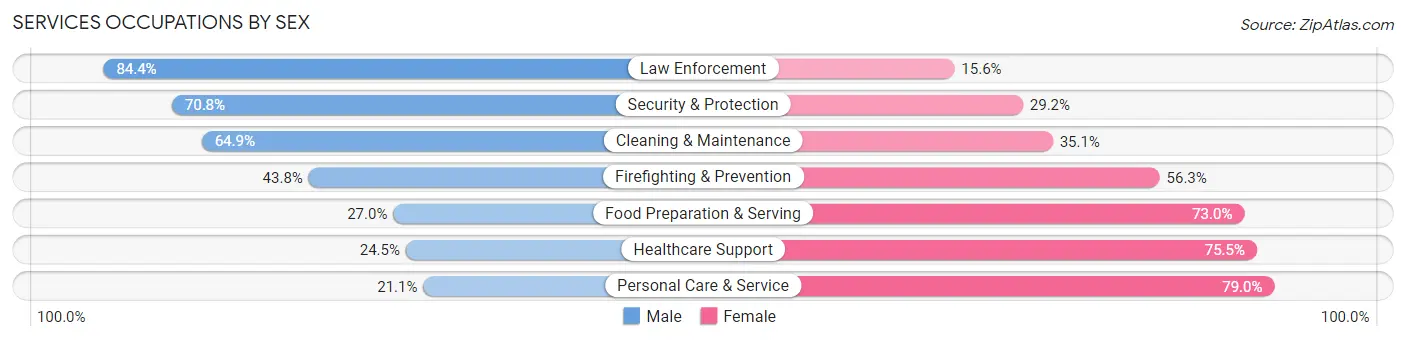
Services Occupations by Sex
Within the Services occupations in Potter County, the most male-oriented occupations are Law Enforcement (84.4%), Security & Protection (70.8%), and Cleaning & Maintenance (64.9%), while the most female-oriented occupations are Personal Care & Service (78.9%), Healthcare Support (75.5%), and Food Preparation & Serving (73.0%).
| Occupation | Male | Female |
| Healthcare Support | 51 (24.5%) | 157 (75.5%) |
| Security & Protection | 68 (70.8%) | 28 (29.2%) |
| Firefighting & Prevention | 14 (43.8%) | 18 (56.2%) |
| Law Enforcement | 54 (84.4%) | 10 (15.6%) |
| Food Preparation & Serving | 71 (27.0%) | 192 (73.0%) |
| Cleaning & Maintenance | 161 (64.9%) | 87 (35.1%) |
| Personal Care & Service | 40 (21.0%) | 150 (78.9%) |
| Total (Category) | 391 (38.9%) | 614 (61.1%) |
| Total (Overall) | 3,674 (53.8%) | 3,153 (46.2%) |
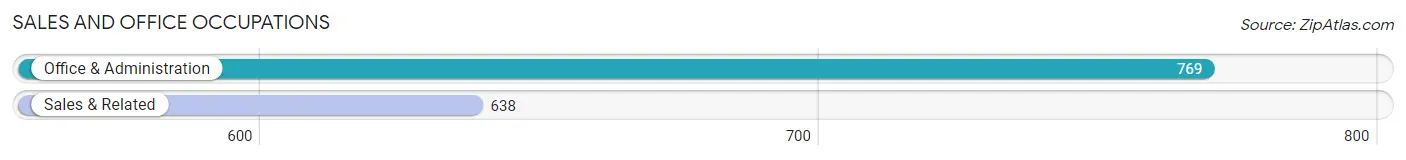
Sales and Office Occupations
The most common Sales and Office occupations in Potter County are Office & Administration (769 | 11.3%), and Sales & Related (638 | 9.3%).
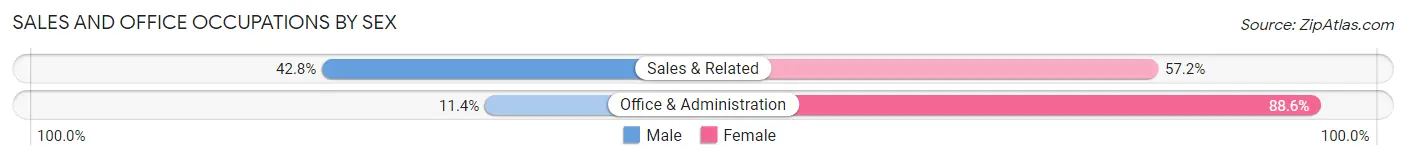
Sales and Office Occupations by Sex
| Occupation | Male | Female |
| Sales & Related | 273 (42.8%) | 365 (57.2%) |
| Office & Administration | 88 (11.4%) | 681 (88.6%) |
| Total (Category) | 361 (25.7%) | 1,046 (74.3%) |
| Total (Overall) | 3,674 (53.8%) | 3,153 (46.2%) |
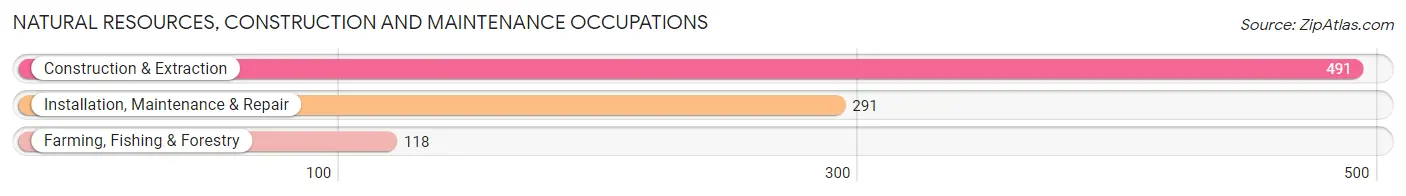
Natural Resources, Construction and Maintenance Occupations
The most common Natural Resources, Construction and Maintenance occupations in Potter County are Construction & Extraction (491 | 7.2%), Installation, Maintenance & Repair (291 | 4.3%), and Farming, Fishing & Forestry (118 | 1.7%).
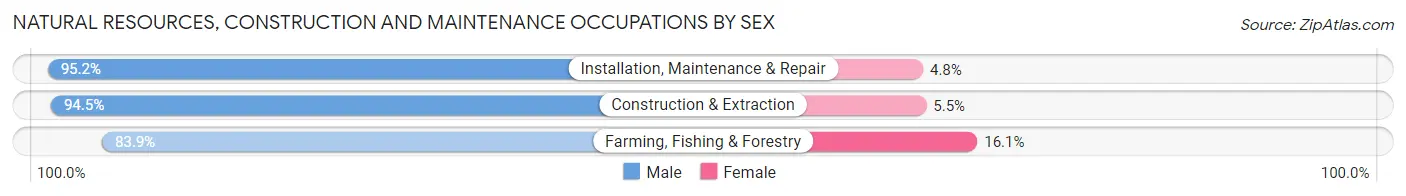
Natural Resources, Construction and Maintenance Occupations by Sex
| Occupation | Male | Female |
| Farming, Fishing & Forestry | 99 (83.9%) | 19 (16.1%) |
| Construction & Extraction | 464 (94.5%) | 27 (5.5%) |
| Installation, Maintenance & Repair | 277 (95.2%) | 14 (4.8%) |
| Total (Category) | 840 (93.3%) | 60 (6.7%) |
| Total (Overall) | 3,674 (53.8%) | 3,153 (46.2%) |
Production, Transportation and Moving Occupations
The most common Production, Transportation and Moving occupations in Potter County are Production (785 | 11.5%), Transportation (355 | 5.2%), and Material Moving (286 | 4.2%).
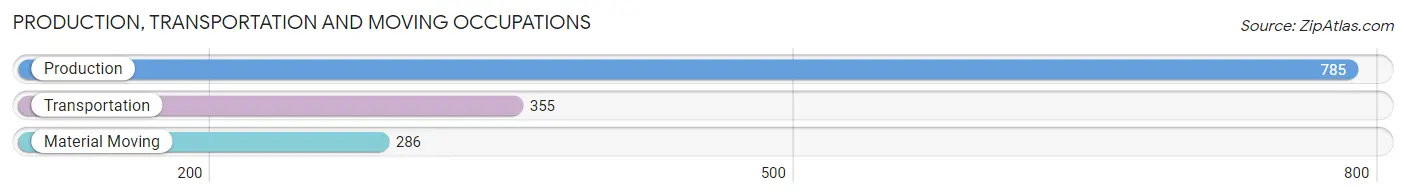
Production, Transportation and Moving Occupations by Sex
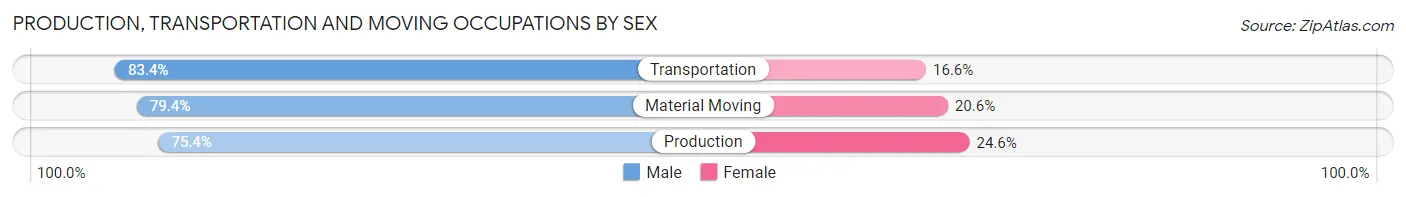
| Occupation | Male | Female |
| Production | 592 (75.4%) | 193 (24.6%) |
| Transportation | 296 (83.4%) | 59 (16.6%) |
| Material Moving | 227 (79.4%) | 59 (20.6%) |
| Total (Category) | 1,115 (78.2%) | 311 (21.8%) |
| Total (Overall) | 3,674 (53.8%) | 3,153 (46.2%) |
Employment Industries by Sex in Potter County
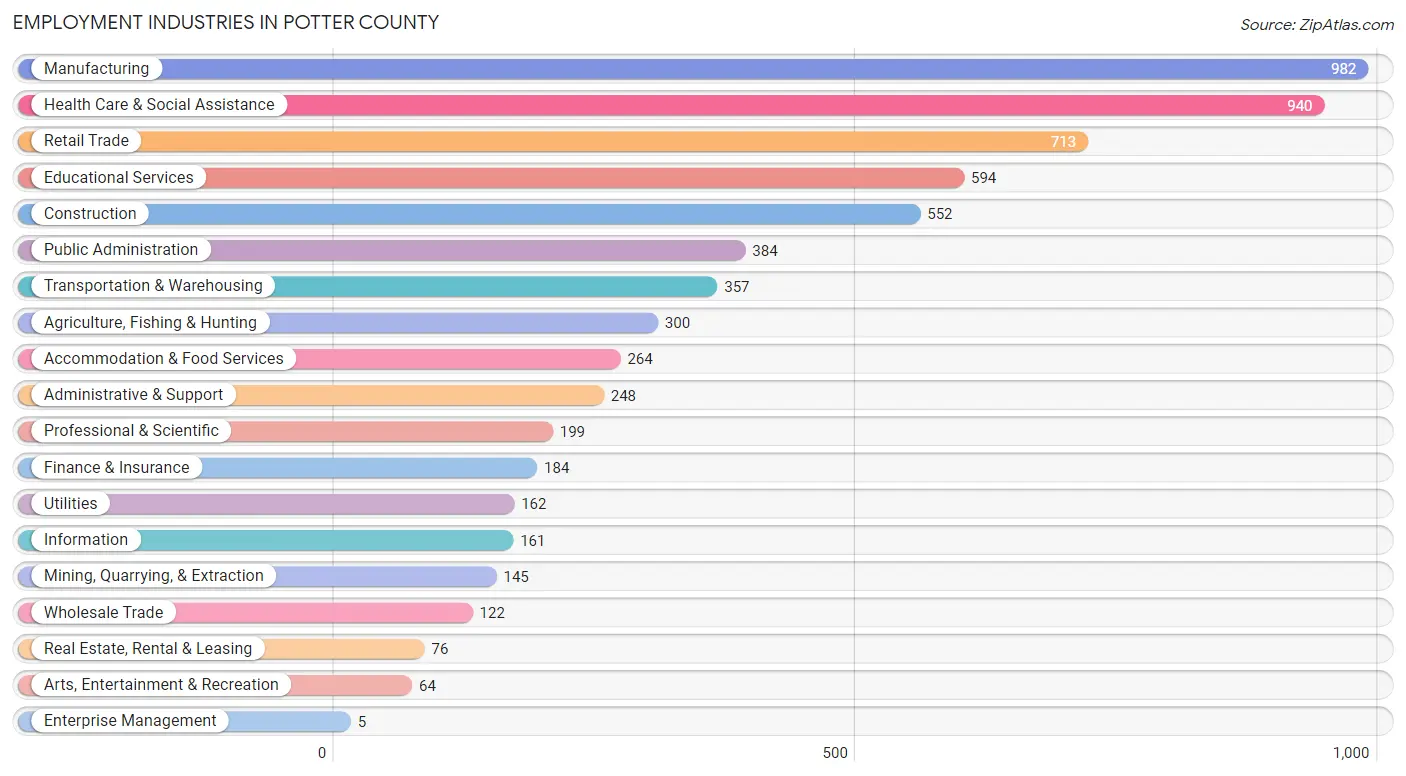
Employment Industries in Potter County
The major employment industries in Potter County include Manufacturing (982 | 14.4%), Health Care & Social Assistance (940 | 13.8%), Retail Trade (713 | 10.4%), Educational Services (594 | 8.7%), and Construction (552 | 8.1%).
Employment Industries by Sex in Potter County
The Potter County industries that see more men than women are Enterprise Management (100.0%), Construction (90.9%), and Real Estate, Rental & Leasing (90.8%), whereas the industries that tend to have a higher number of women are Health Care & Social Assistance (79.1%), Educational Services (76.4%), and Finance & Insurance (71.7%).
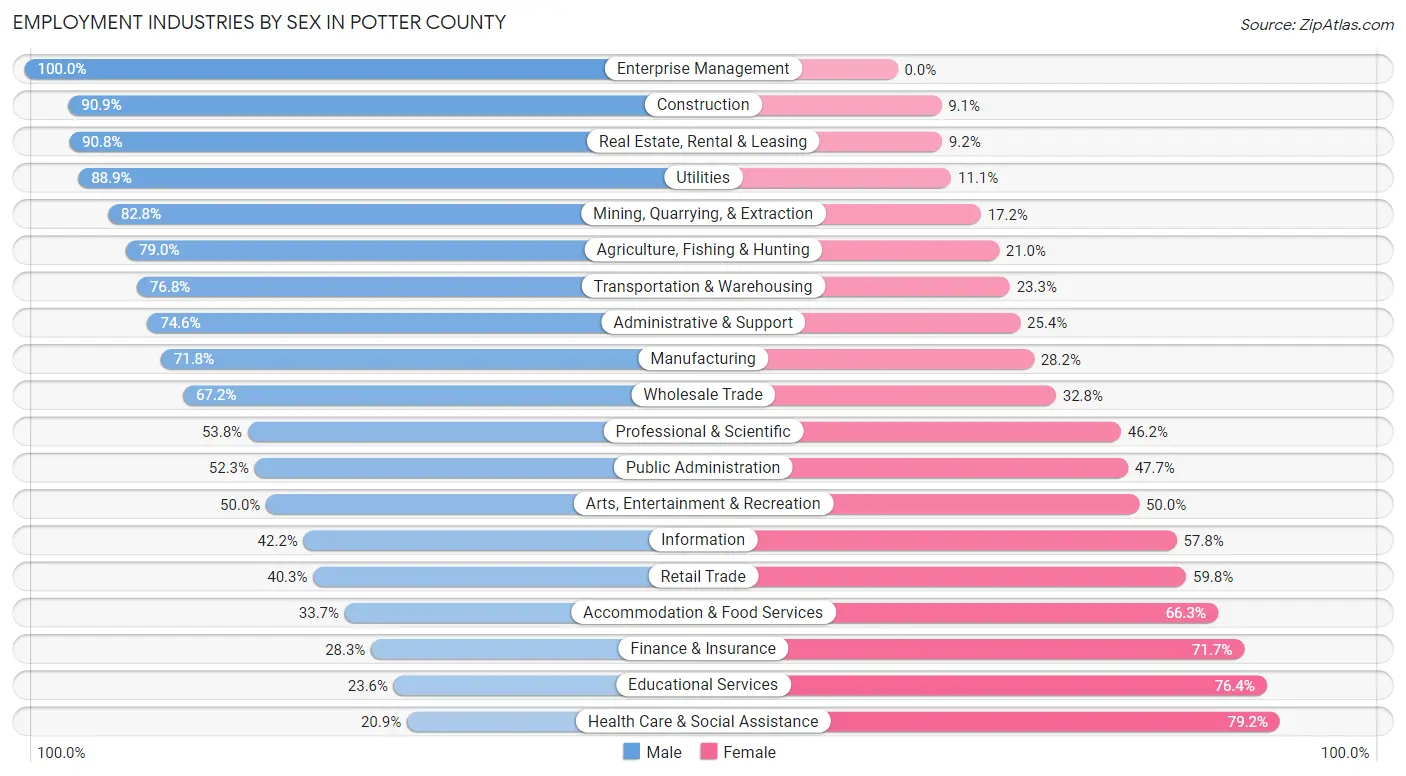
| Industry | Male | Female |
| Agriculture, Fishing & Hunting | 237 (79.0%) | 63 (21.0%) |
| Mining, Quarrying, & Extraction | 120 (82.8%) | 25 (17.2%) |
| Construction | 502 (90.9%) | 50 (9.1%) |
| Manufacturing | 705 (71.8%) | 277 (28.2%) |
| Wholesale Trade | 82 (67.2%) | 40 (32.8%) |
| Retail Trade | 287 (40.3%) | 426 (59.8%) |
| Transportation & Warehousing | 274 (76.7%) | 83 (23.3%) |
| Utilities | 144 (88.9%) | 18 (11.1%) |
| Information | 68 (42.2%) | 93 (57.8%) |
| Finance & Insurance | 52 (28.3%) | 132 (71.7%) |
| Real Estate, Rental & Leasing | 69 (90.8%) | 7 (9.2%) |
| Professional & Scientific | 107 (53.8%) | 92 (46.2%) |
| Enterprise Management | 5 (100.0%) | 0 (0.0%) |
| Administrative & Support | 185 (74.6%) | 63 (25.4%) |
| Educational Services | 140 (23.6%) | 454 (76.4%) |
| Health Care & Social Assistance | 196 (20.8%) | 744 (79.1%) |
| Arts, Entertainment & Recreation | 32 (50.0%) | 32 (50.0%) |
| Accommodation & Food Services | 89 (33.7%) | 175 (66.3%) |
| Public Administration | 201 (52.3%) | 183 (47.7%) |
| Total | 3,674 (53.8%) | 3,153 (46.2%) |
Education in Potter County
School Enrollment in Potter County
The most common levels of schooling among the 2,969 students in Potter County are middle school (811 | 27.3%), elementary school (769 | 25.9%), and high school (740 | 24.9%).
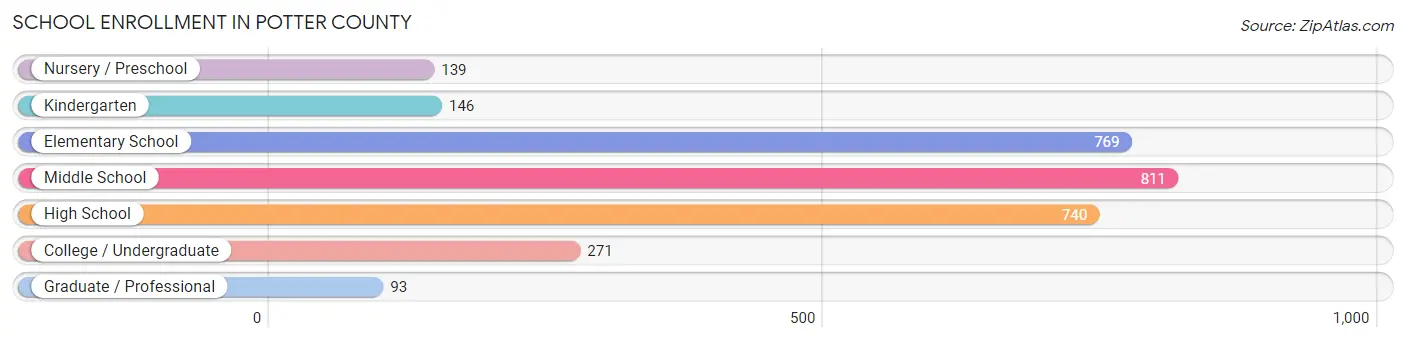
| School Level | # Students | % Students |
| Nursery / Preschool | 139 | 4.7% |
| Kindergarten | 146 | 4.9% |
| Elementary School | 769 | 25.9% |
| Middle School | 811 | 27.3% |
| High School | 740 | 24.9% |
| College / Undergraduate | 271 | 9.1% |
| Graduate / Professional | 93 | 3.1% |
| Total | 2,969 | 100.0% |
School Enrollment by Age by Funding Source in Potter County
Out of a total of 2,969 students who are enrolled in schools in Potter County, 448 (15.1%) attend a private institution, while the remaining 2,521 (84.9%) are enrolled in public schools. The age group of 20 to 24 year olds has the highest likelihood of being enrolled in private schools, with 83 (47.7% in the age bracket) enrolled. Conversely, the age group of 3 to 4 year olds has the lowest likelihood of being enrolled in a private school, with 91 (94.8% in the age bracket) attending a public institution.
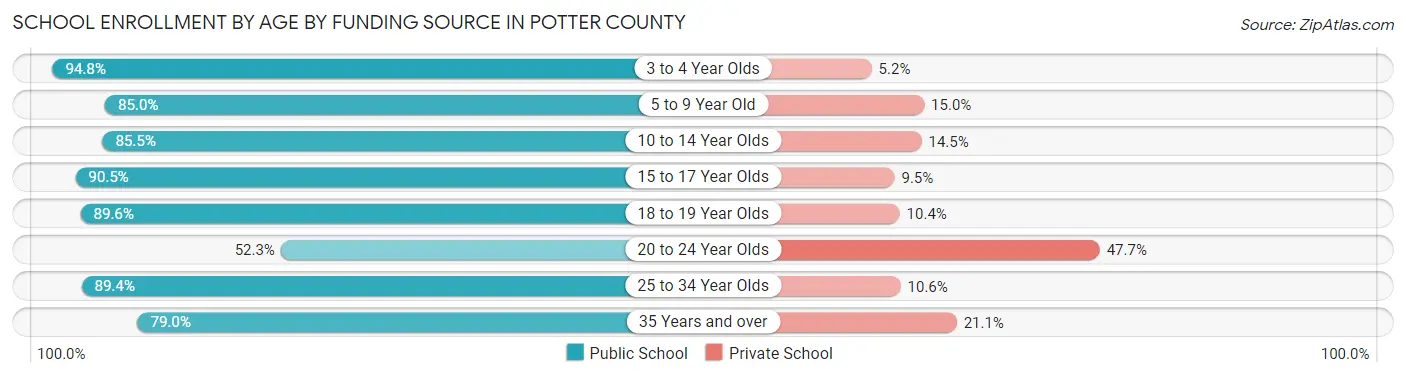
| Age Bracket | Public School | Private School |
| 3 to 4 Year Olds | 91 (94.8%) | 5 (5.2%) |
| 5 to 9 Year Old | 743 (85.0%) | 131 (15.0%) |
| 10 to 14 Year Olds | 801 (85.5%) | 136 (14.5%) |
| 15 to 17 Year Olds | 545 (90.5%) | 57 (9.5%) |
| 18 to 19 Year Olds | 146 (89.6%) | 17 (10.4%) |
| 20 to 24 Year Olds | 91 (52.3%) | 83 (47.7%) |
| 25 to 34 Year Olds | 59 (89.4%) | 7 (10.6%) |
| 35 Years and over | 45 (78.9%) | 12 (21.0%) |
| Total | 2,521 (84.9%) | 448 (15.1%) |
Educational Attainment by Field of Study in Potter County
Education (516 | 24.4%), science & technology (308 | 14.6%), business (280 | 13.2%), bio, nature & agricultural (186 | 8.8%), and psychology (176 | 8.3%) are the most common fields of study among 2,116 individuals in Potter County who have obtained a bachelor's degree or higher.
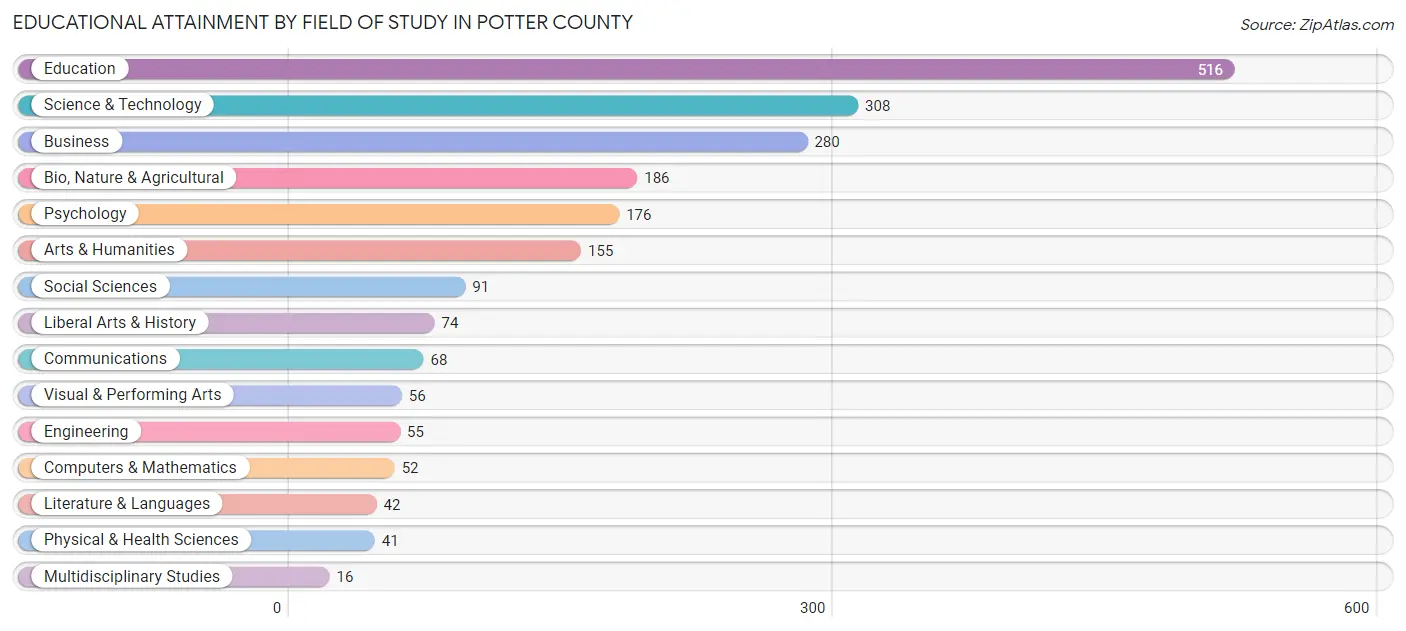
| Field of Study | # Graduates | % Graduates |
| Computers & Mathematics | 52 | 2.5% |
| Bio, Nature & Agricultural | 186 | 8.8% |
| Physical & Health Sciences | 41 | 1.9% |
| Psychology | 176 | 8.3% |
| Social Sciences | 91 | 4.3% |
| Engineering | 55 | 2.6% |
| Multidisciplinary Studies | 16 | 0.8% |
| Science & Technology | 308 | 14.6% |
| Business | 280 | 13.2% |
| Education | 516 | 24.4% |
| Literature & Languages | 42 | 2.0% |
| Liberal Arts & History | 74 | 3.5% |
| Visual & Performing Arts | 56 | 2.6% |
| Communications | 68 | 3.2% |
| Arts & Humanities | 155 | 7.3% |
| Total | 2,116 | 100.0% |
Transportation & Commute in Potter County
Vehicle Availability by Sex in Potter County
The most prevalent vehicle ownership categories in Potter County are males with 2 vehicles (1,537, accounting for 42.7%) and females with 2 vehicles (1,400, making up 50.1%).
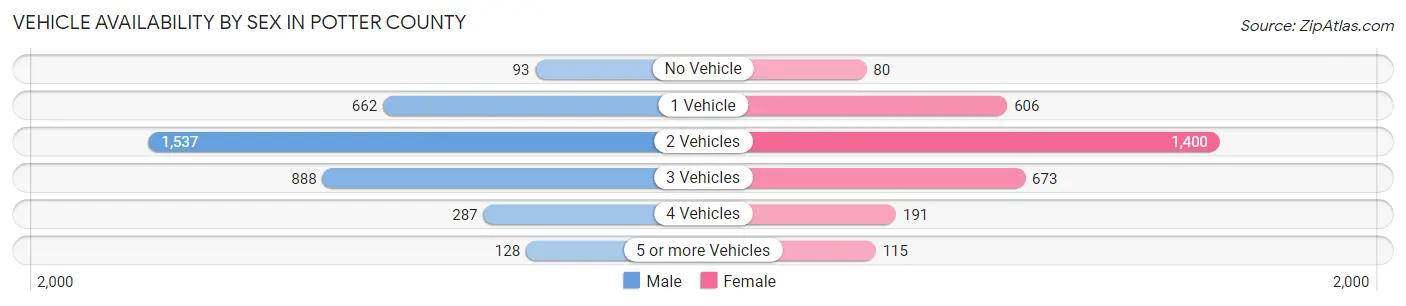
| Vehicles Available | Male | Female |
| No Vehicle | 93 (2.6%) | 80 (2.6%) |
| 1 Vehicle | 662 (18.4%) | 606 (19.8%) |
| 2 Vehicles | 1,537 (42.7%) | 1,400 (45.7%) |
| 3 Vehicles | 888 (24.7%) | 673 (22.0%) |
| 4 Vehicles | 287 (8.0%) | 191 (6.2%) |
| 5 or more Vehicles | 128 (3.6%) | 115 (3.7%) |
| Total | 3,595 (100.0%) | 3,065 (100.0%) |
Commute Time in Potter County
The most frequently occuring commute durations in Potter County are 5 to 9 minutes (1,097 commuters, 17.9%), 10 to 14 minutes (845 commuters, 13.8%), and 15 to 19 minutes (726 commuters, 11.8%).
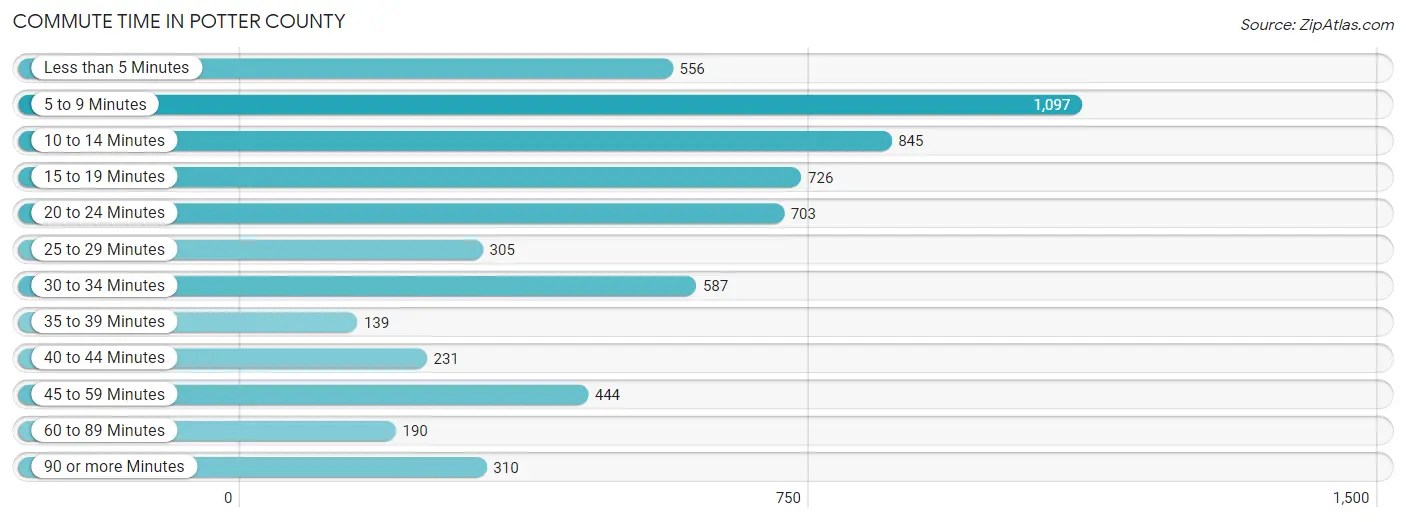
| Commute Time | # Commuters | % Commuters |
| Less than 5 Minutes | 556 | 9.1% |
| 5 to 9 Minutes | 1,097 | 17.9% |
| 10 to 14 Minutes | 845 | 13.8% |
| 15 to 19 Minutes | 726 | 11.8% |
| 20 to 24 Minutes | 703 | 11.5% |
| 25 to 29 Minutes | 305 | 5.0% |
| 30 to 34 Minutes | 587 | 9.6% |
| 35 to 39 Minutes | 139 | 2.3% |
| 40 to 44 Minutes | 231 | 3.8% |
| 45 to 59 Minutes | 444 | 7.2% |
| 60 to 89 Minutes | 190 | 3.1% |
| 90 or more Minutes | 310 | 5.1% |
Commute Time by Sex in Potter County
The most common commute times in Potter County are 5 to 9 minutes (583 commuters, 17.3%) for males and 5 to 9 minutes (514 commuters, 18.6%) for females.
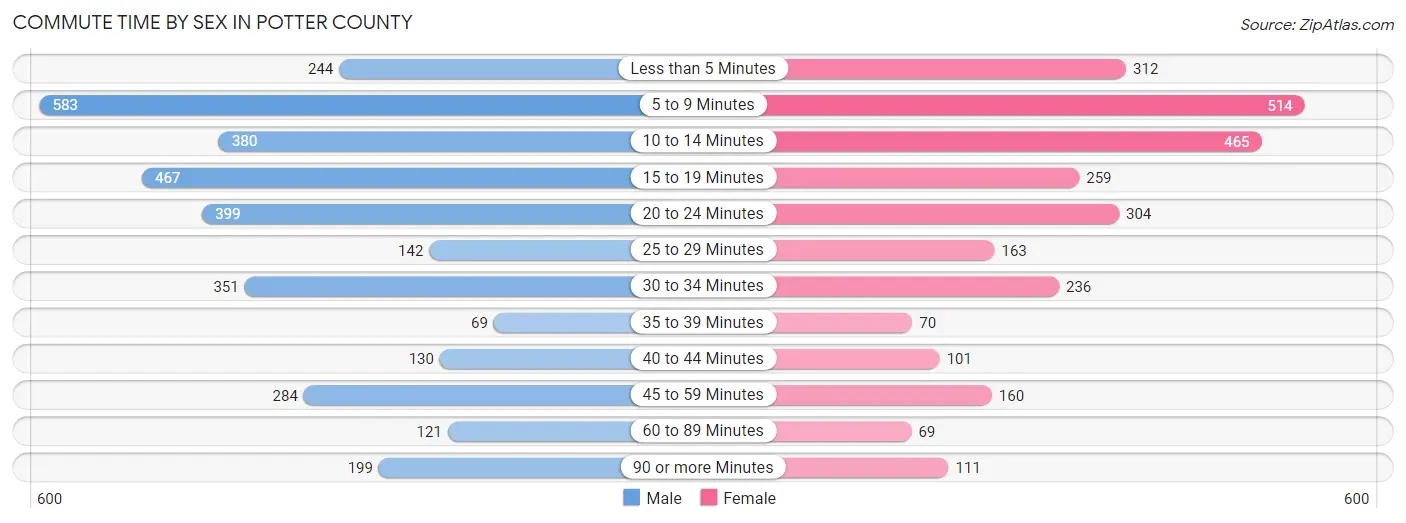
| Commute Time | Male | Female |
| Less than 5 Minutes | 244 (7.2%) | 312 (11.3%) |
| 5 to 9 Minutes | 583 (17.3%) | 514 (18.6%) |
| 10 to 14 Minutes | 380 (11.3%) | 465 (16.8%) |
| 15 to 19 Minutes | 467 (13.9%) | 259 (9.4%) |
| 20 to 24 Minutes | 399 (11.8%) | 304 (11.0%) |
| 25 to 29 Minutes | 142 (4.2%) | 163 (5.9%) |
| 30 to 34 Minutes | 351 (10.4%) | 236 (8.5%) |
| 35 to 39 Minutes | 69 (2.1%) | 70 (2.5%) |
| 40 to 44 Minutes | 130 (3.9%) | 101 (3.6%) |
| 45 to 59 Minutes | 284 (8.4%) | 160 (5.8%) |
| 60 to 89 Minutes | 121 (3.6%) | 69 (2.5%) |
| 90 or more Minutes | 199 (5.9%) | 111 (4.0%) |
Time of Departure to Work by Sex in Potter County
The most frequent times of departure to work in Potter County are 6:00 AM to 6:29 AM (519, 15.4%) for males and 7:30 AM to 7:59 AM (613, 22.2%) for females.
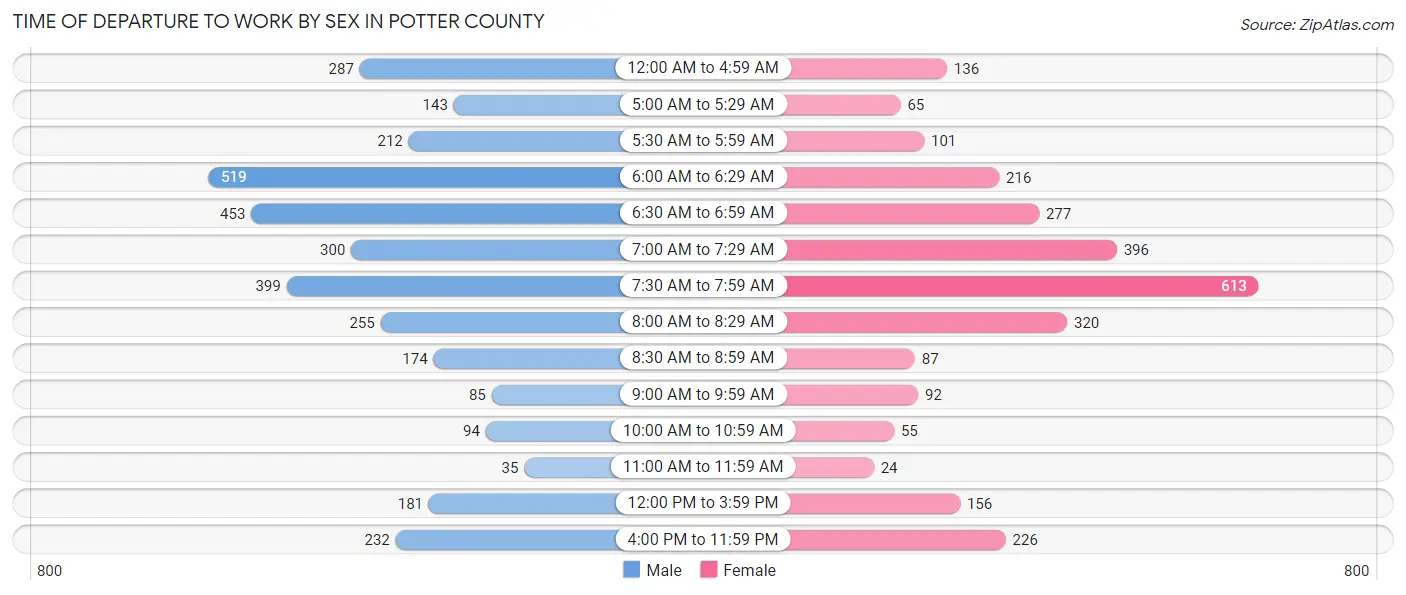
| Time of Departure | Male | Female |
| 12:00 AM to 4:59 AM | 287 (8.5%) | 136 (4.9%) |
| 5:00 AM to 5:29 AM | 143 (4.2%) | 65 (2.4%) |
| 5:30 AM to 5:59 AM | 212 (6.3%) | 101 (3.6%) |
| 6:00 AM to 6:29 AM | 519 (15.4%) | 216 (7.8%) |
| 6:30 AM to 6:59 AM | 453 (13.5%) | 277 (10.0%) |
| 7:00 AM to 7:29 AM | 300 (8.9%) | 396 (14.3%) |
| 7:30 AM to 7:59 AM | 399 (11.8%) | 613 (22.2%) |
| 8:00 AM to 8:29 AM | 255 (7.6%) | 320 (11.6%) |
| 8:30 AM to 8:59 AM | 174 (5.2%) | 87 (3.2%) |
| 9:00 AM to 9:59 AM | 85 (2.5%) | 92 (3.3%) |
| 10:00 AM to 10:59 AM | 94 (2.8%) | 55 (2.0%) |
| 11:00 AM to 11:59 AM | 35 (1.0%) | 24 (0.9%) |
| 12:00 PM to 3:59 PM | 181 (5.4%) | 156 (5.6%) |
| 4:00 PM to 11:59 PM | 232 (6.9%) | 226 (8.2%) |
| Total | 3,369 (100.0%) | 2,764 (100.0%) |
Housing Occupancy in Potter County
Occupancy by Ownership in Potter County
Of the total 6,595 dwellings in Potter County, owner-occupied units account for 5,279 (80.0%), while renter-occupied units make up 1,316 (20.0%).
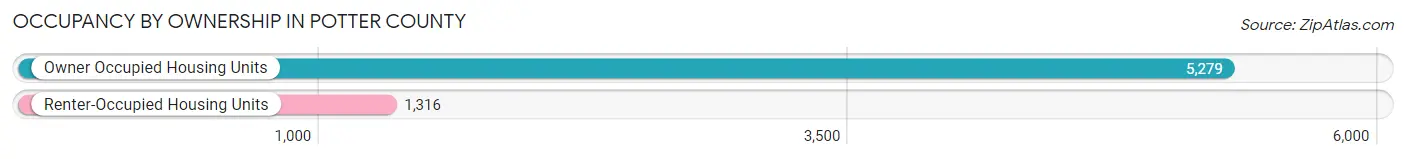
| Occupancy | # Housing Units | % Housing Units |
| Owner Occupied Housing Units | 5,279 | 80.0% |
| Renter-Occupied Housing Units | 1,316 | 20.0% |
| Total Occupied Housing Units | 6,595 | 100.0% |
Occupancy by Household Size in Potter County
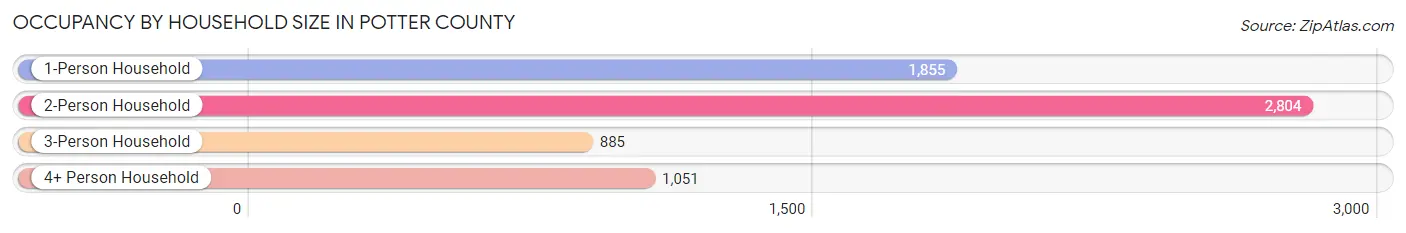
| Household Size | # Housing Units | % Housing Units |
| 1-Person Household | 1,855 | 28.1% |
| 2-Person Household | 2,804 | 42.5% |
| 3-Person Household | 885 | 13.4% |
| 4+ Person Household | 1,051 | 15.9% |
| Total Housing Units | 6,595 | 100.0% |
Occupancy by Ownership by Household Size in Potter County
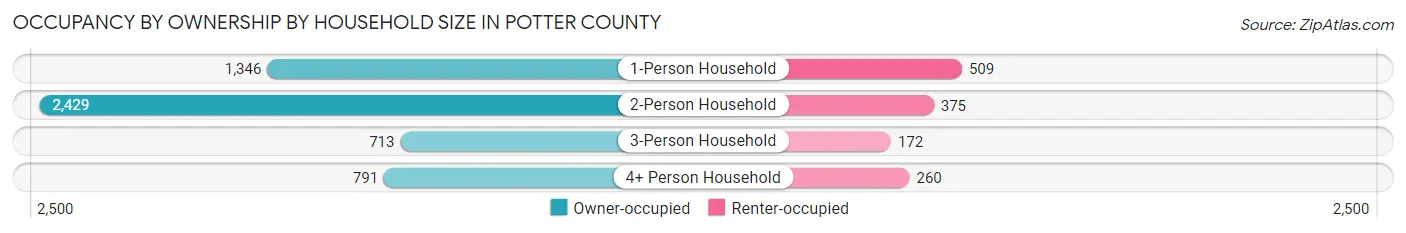
| Household Size | Owner-occupied | Renter-occupied |
| 1-Person Household | 1,346 (72.6%) | 509 (27.4%) |
| 2-Person Household | 2,429 (86.6%) | 375 (13.4%) |
| 3-Person Household | 713 (80.6%) | 172 (19.4%) |
| 4+ Person Household | 791 (75.3%) | 260 (24.7%) |
| Total Housing Units | 5,279 (80.0%) | 1,316 (20.0%) |
Occupancy by Educational Attainment in Potter County
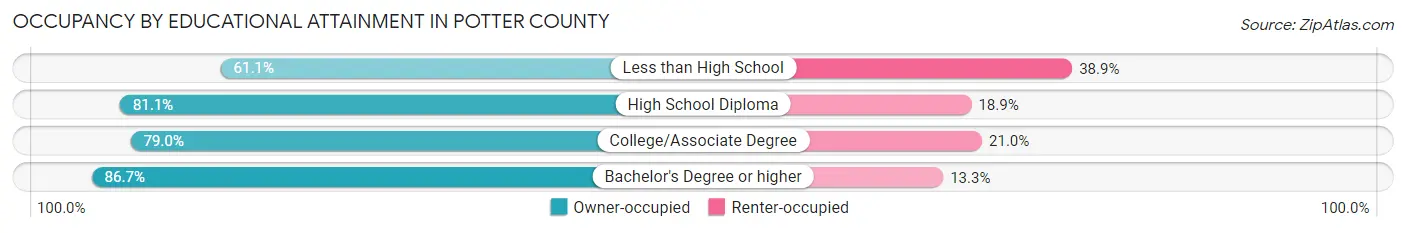
| Household Size | Owner-occupied | Renter-occupied |
| Less than High School | 324 (61.1%) | 206 (38.9%) |
| High School Diploma | 2,356 (81.1%) | 549 (18.9%) |
| College/Associate Degree | 1,445 (79.0%) | 384 (21.0%) |
| Bachelor's Degree or higher | 1,154 (86.7%) | 177 (13.3%) |
Occupancy by Age of Householder in Potter County
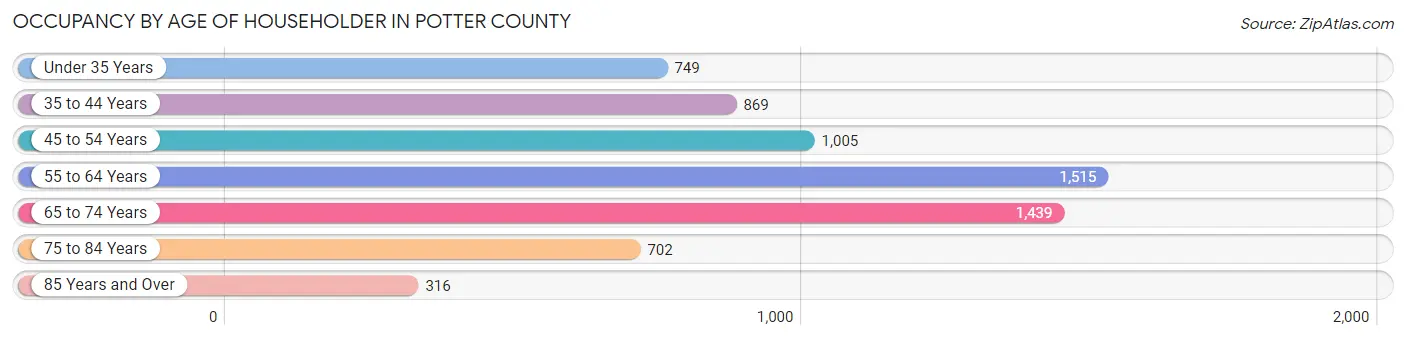
| Age Bracket | # Households | % Households |
| Under 35 Years | 749 | 11.4% |
| 35 to 44 Years | 869 | 13.2% |
| 45 to 54 Years | 1,005 | 15.2% |
| 55 to 64 Years | 1,515 | 23.0% |
| 65 to 74 Years | 1,439 | 21.8% |
| 75 to 84 Years | 702 | 10.6% |
| 85 Years and Over | 316 | 4.8% |
| Total | 6,595 | 100.0% |
Housing Finances in Potter County
Median Income by Occupancy in Potter County
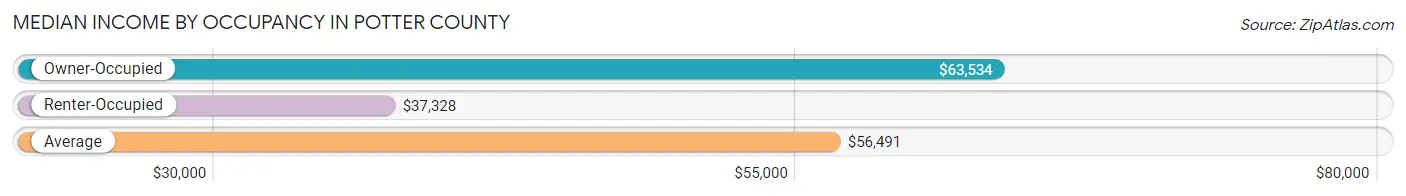
| Occupancy Type | # Households | Median Income |
| Owner-Occupied | 5,279 (80.0%) | $63,534 |
| Renter-Occupied | 1,316 (20.0%) | $37,328 |
| Average | 6,595 (100.0%) | $56,491 |
Occupancy by Householder Income Bracket in Potter County
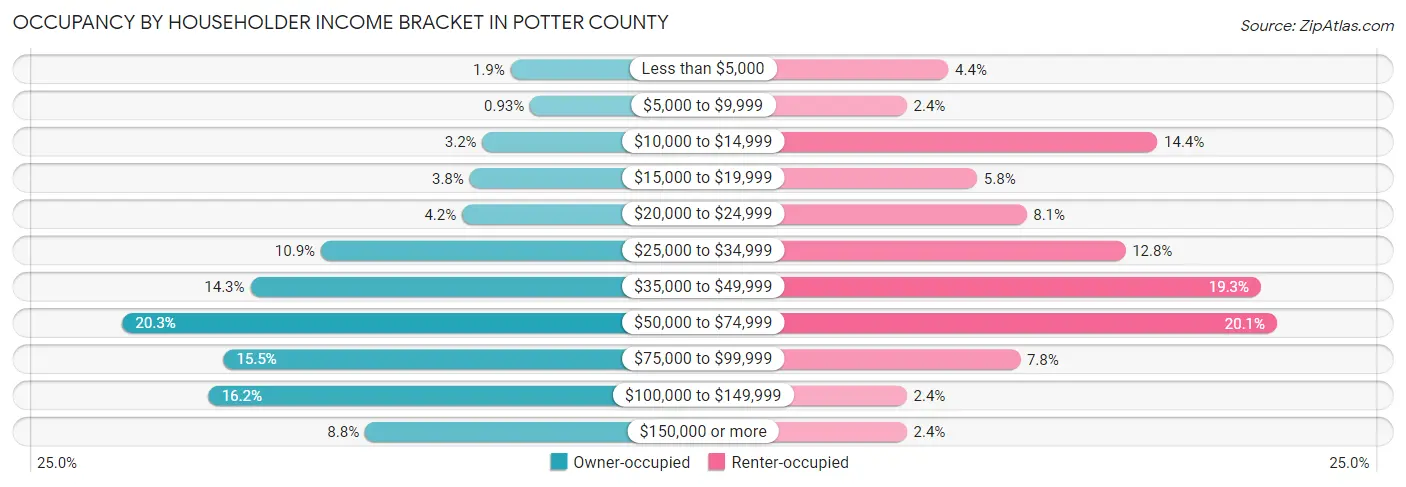
| Income Bracket | Owner-occupied | Renter-occupied |
| Less than $5,000 | 98 (1.9%) | 58 (4.4%) |
| $5,000 to $9,999 | 49 (0.9%) | 32 (2.4%) |
| $10,000 to $14,999 | 169 (3.2%) | 189 (14.4%) |
| $15,000 to $19,999 | 201 (3.8%) | 76 (5.8%) |
| $20,000 to $24,999 | 220 (4.2%) | 107 (8.1%) |
| $25,000 to $34,999 | 575 (10.9%) | 169 (12.8%) |
| $35,000 to $49,999 | 752 (14.2%) | 254 (19.3%) |
| $50,000 to $74,999 | 1,074 (20.3%) | 264 (20.1%) |
| $75,000 to $99,999 | 820 (15.5%) | 103 (7.8%) |
| $100,000 to $149,999 | 857 (16.2%) | 32 (2.4%) |
| $150,000 or more | 464 (8.8%) | 32 (2.4%) |
| Total | 5,279 (100.0%) | 1,316 (100.0%) |
Monthly Housing Cost Tiers in Potter County
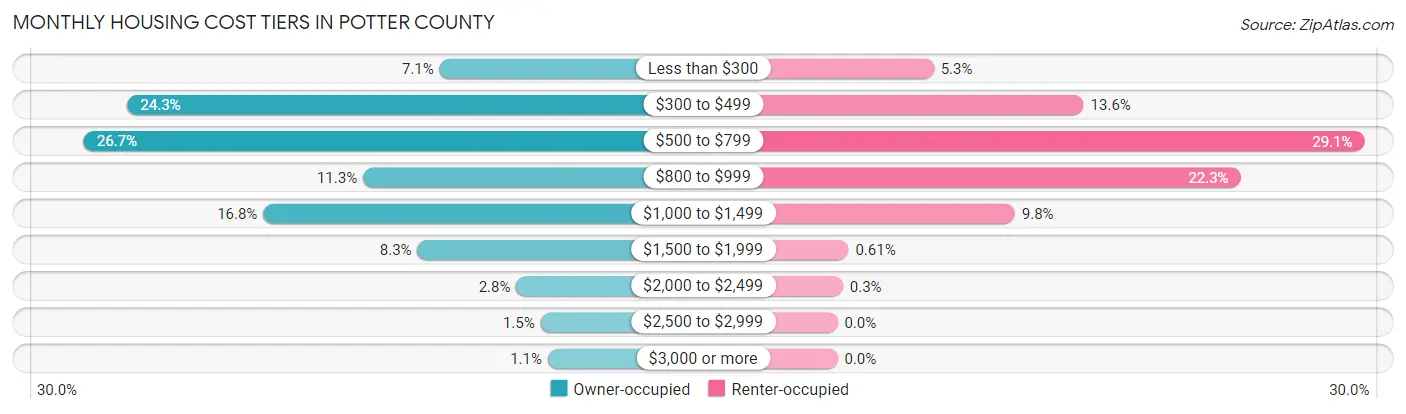
| Monthly Cost | Owner-occupied | Renter-occupied |
| Less than $300 | 374 (7.1%) | 70 (5.3%) |
| $300 to $499 | 1,284 (24.3%) | 179 (13.6%) |
| $500 to $799 | 1,411 (26.7%) | 383 (29.1%) |
| $800 to $999 | 597 (11.3%) | 293 (22.3%) |
| $1,000 to $1,499 | 888 (16.8%) | 129 (9.8%) |
| $1,500 to $1,999 | 438 (8.3%) | 8 (0.6%) |
| $2,000 to $2,499 | 150 (2.8%) | 4 (0.3%) |
| $2,500 to $2,999 | 79 (1.5%) | 0 (0.0%) |
| $3,000 or more | 58 (1.1%) | 0 (0.0%) |
| Total | 5,279 (100.0%) | 1,316 (100.0%) |
Physical Housing Characteristics in Potter County
Housing Structures in Potter County
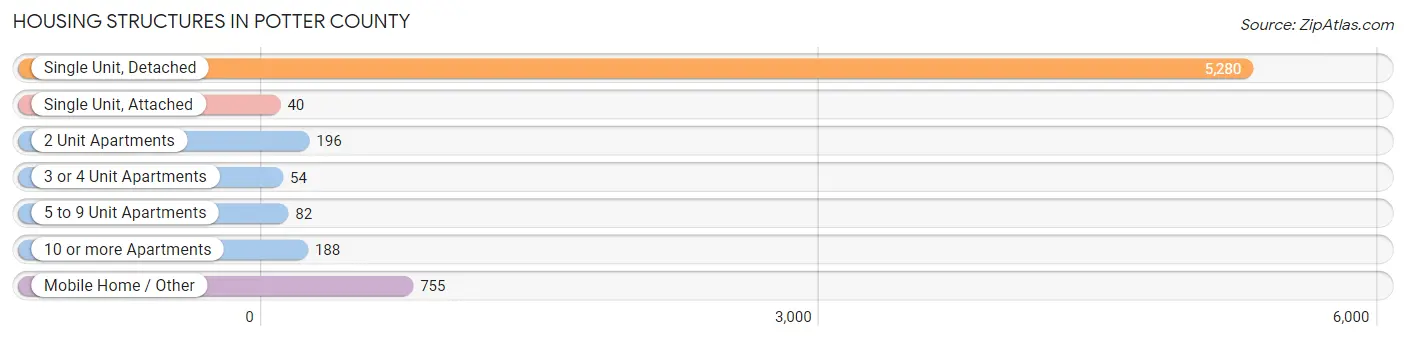
| Structure Type | # Housing Units | % Housing Units |
| Single Unit, Detached | 5,280 | 80.1% |
| Single Unit, Attached | 40 | 0.6% |
| 2 Unit Apartments | 196 | 3.0% |
| 3 or 4 Unit Apartments | 54 | 0.8% |
| 5 to 9 Unit Apartments | 82 | 1.2% |
| 10 or more Apartments | 188 | 2.9% |
| Mobile Home / Other | 755 | 11.5% |
| Total | 6,595 | 100.0% |
Housing Structures by Occupancy in Potter County
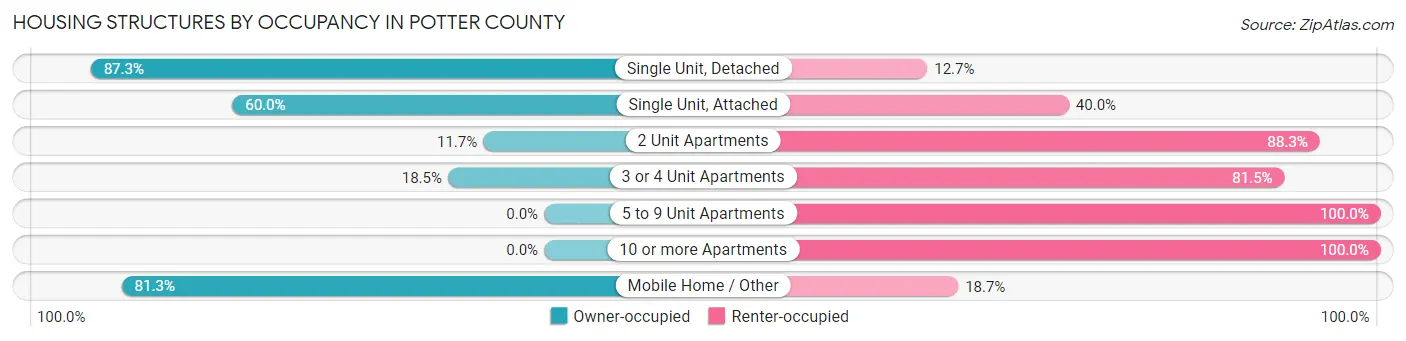
| Structure Type | Owner-occupied | Renter-occupied |
| Single Unit, Detached | 4,608 (87.3%) | 672 (12.7%) |
| Single Unit, Attached | 24 (60.0%) | 16 (40.0%) |
| 2 Unit Apartments | 23 (11.7%) | 173 (88.3%) |
| 3 or 4 Unit Apartments | 10 (18.5%) | 44 (81.5%) |
| 5 to 9 Unit Apartments | 0 (0.0%) | 82 (100.0%) |
| 10 or more Apartments | 0 (0.0%) | 188 (100.0%) |
| Mobile Home / Other | 614 (81.3%) | 141 (18.7%) |
| Total | 5,279 (80.0%) | 1,316 (20.0%) |
Housing Structures by Number of Rooms in Potter County
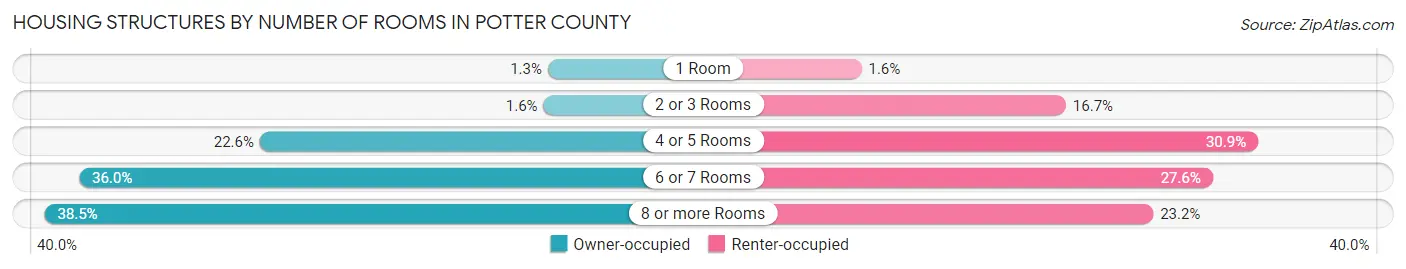
| Number of Rooms | Owner-occupied | Renter-occupied |
| 1 Room | 68 (1.3%) | 21 (1.6%) |
| 2 or 3 Rooms | 85 (1.6%) | 220 (16.7%) |
| 4 or 5 Rooms | 1,193 (22.6%) | 407 (30.9%) |
| 6 or 7 Rooms | 1,899 (36.0%) | 363 (27.6%) |
| 8 or more Rooms | 2,034 (38.5%) | 305 (23.2%) |
| Total | 5,279 (100.0%) | 1,316 (100.0%) |
Housing Structure by Heating Type in Potter County
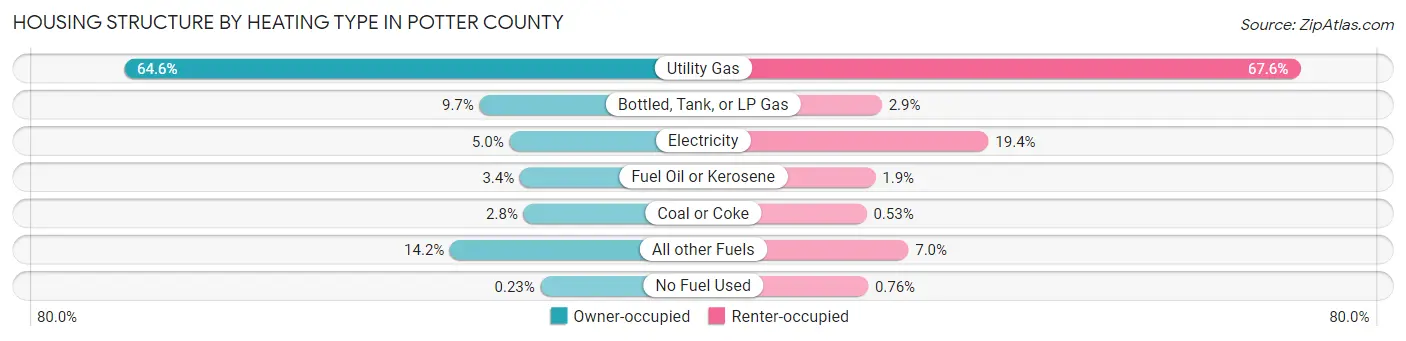
| Heating Type | Owner-occupied | Renter-occupied |
| Utility Gas | 3,411 (64.6%) | 889 (67.5%) |
| Bottled, Tank, or LP Gas | 510 (9.7%) | 38 (2.9%) |
| Electricity | 266 (5.0%) | 255 (19.4%) |
| Fuel Oil or Kerosene | 180 (3.4%) | 25 (1.9%) |
| Coal or Coke | 150 (2.8%) | 7 (0.5%) |
| All other Fuels | 750 (14.2%) | 92 (7.0%) |
| No Fuel Used | 12 (0.2%) | 10 (0.8%) |
| Total | 5,279 (100.0%) | 1,316 (100.0%) |
Household Vehicle Usage in Potter County
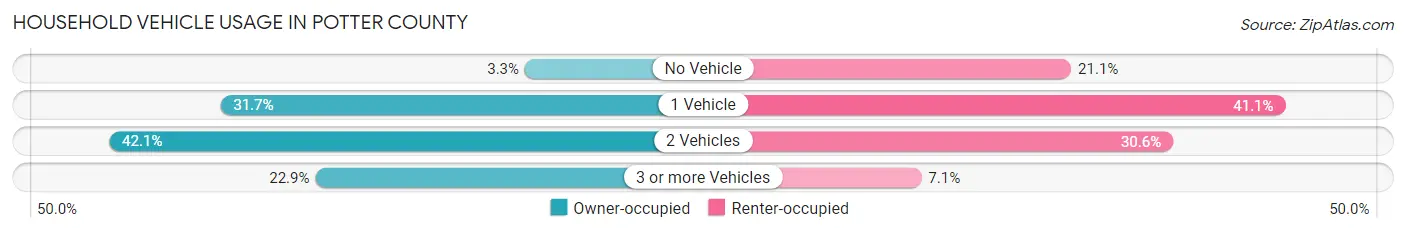
| Vehicles per Household | Owner-occupied | Renter-occupied |
| No Vehicle | 174 (3.3%) | 278 (21.1%) |
| 1 Vehicle | 1,675 (31.7%) | 541 (41.1%) |
| 2 Vehicles | 2,223 (42.1%) | 403 (30.6%) |
| 3 or more Vehicles | 1,207 (22.9%) | 94 (7.1%) |
| Total | 5,279 (100.0%) | 1,316 (100.0%) |
Real Estate & Mortgages in Potter County
Real Estate and Mortgage Overview in Potter County
| Characteristic | Without Mortgage | With Mortgage |
| Housing Units | 2,969 | 2,310 |
| Median Property Value | $127,100 | $142,200 |
| Median Household Income | $52,145 | $270 |
| Monthly Housing Costs | $477 | $49 |
| Real Estate Taxes | $1,702 | $29 |
Property Value by Mortgage Status in Potter County
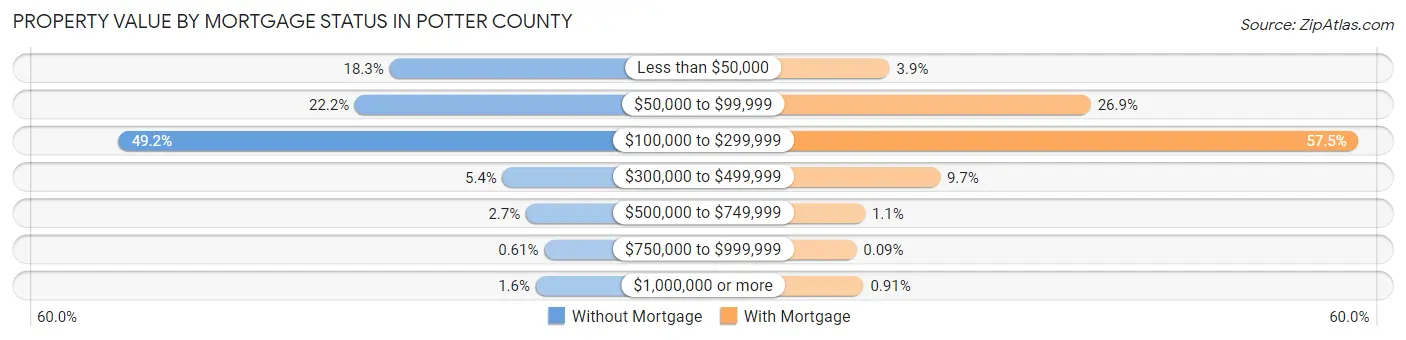
| Property Value | Without Mortgage | With Mortgage |
| Less than $50,000 | 543 (18.3%) | 90 (3.9%) |
| $50,000 to $99,999 | 660 (22.2%) | 621 (26.9%) |
| $100,000 to $299,999 | 1,462 (49.2%) | 1,328 (57.5%) |
| $300,000 to $499,999 | 159 (5.4%) | 223 (9.7%) |
| $500,000 to $749,999 | 80 (2.7%) | 25 (1.1%) |
| $750,000 to $999,999 | 18 (0.6%) | 2 (0.1%) |
| $1,000,000 or more | 47 (1.6%) | 21 (0.9%) |
| Total | 2,969 (100.0%) | 2,310 (100.0%) |
Household Income by Mortgage Status in Potter County
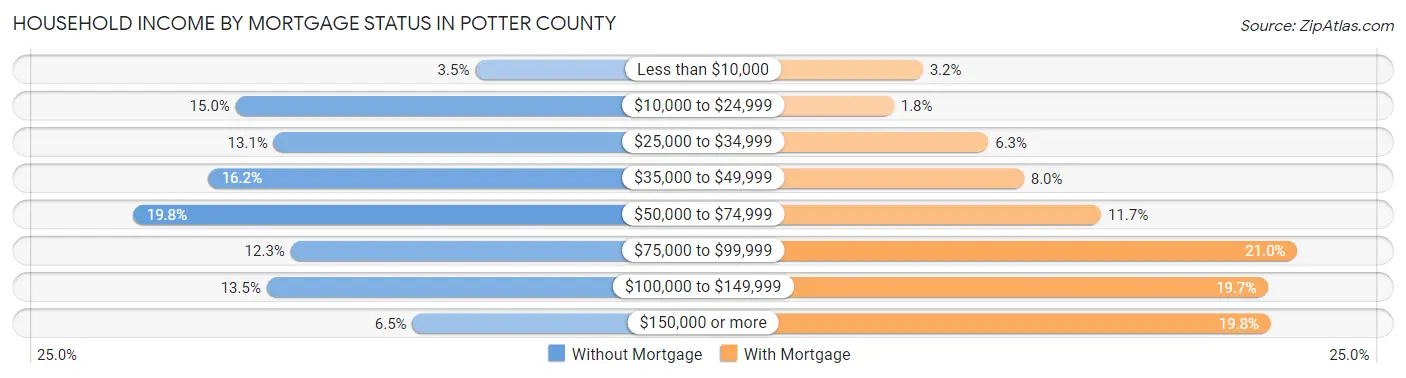
| Household Income | Without Mortgage | With Mortgage |
| Less than $10,000 | 105 (3.5%) | 74 (3.2%) |
| $10,000 to $24,999 | 444 (14.9%) | 42 (1.8%) |
| $25,000 to $34,999 | 390 (13.1%) | 146 (6.3%) |
| $35,000 to $49,999 | 482 (16.2%) | 185 (8.0%) |
| $50,000 to $74,999 | 588 (19.8%) | 270 (11.7%) |
| $75,000 to $99,999 | 366 (12.3%) | 486 (21.0%) |
| $100,000 to $149,999 | 400 (13.5%) | 454 (19.7%) |
| $150,000 or more | 194 (6.5%) | 457 (19.8%) |
| Total | 2,969 (100.0%) | 2,310 (100.0%) |
Property Value to Household Income Ratio in Potter County
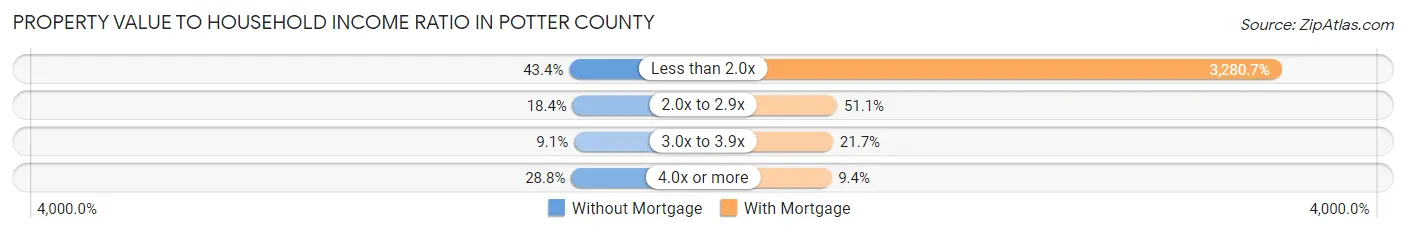
| Value-to-Income Ratio | Without Mortgage | With Mortgage |
| Less than 2.0x | 1,289 (43.4%) | 75,783 (3,280.6%) |
| 2.0x to 2.9x | 546 (18.4%) | 1,180 (51.1%) |
| 3.0x to 3.9x | 269 (9.1%) | 500 (21.6%) |
| 4.0x or more | 856 (28.8%) | 218 (9.4%) |
| Total | 2,969 (100.0%) | 2,310 (100.0%) |
Real Estate Taxes by Mortgage Status in Potter County
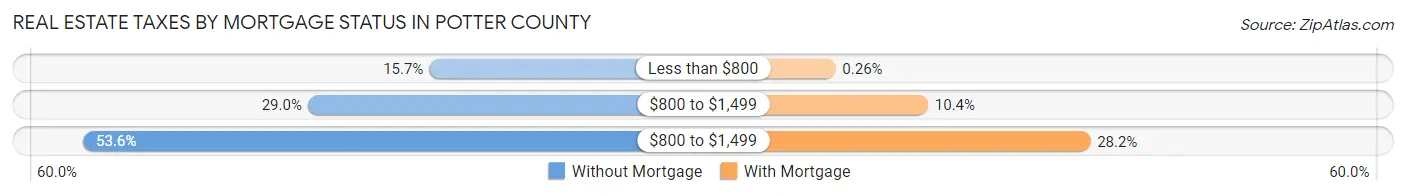
| Property Taxes | Without Mortgage | With Mortgage |
| Less than $800 | 465 (15.7%) | 6 (0.3%) |
| $800 to $1,499 | 860 (29.0%) | 240 (10.4%) |
| $800 to $1,499 | 1,591 (53.6%) | 651 (28.2%) |
| Total | 2,969 (100.0%) | 2,310 (100.0%) |
Health & Disability in Potter County
Health Insurance Coverage by Age in Potter County
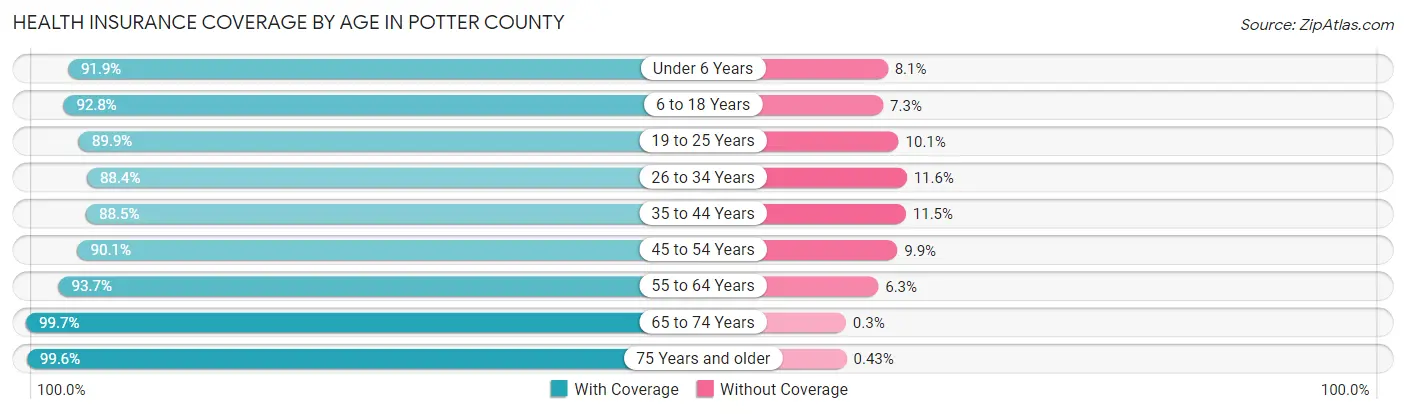
| Age Bracket | With Coverage | Without Coverage |
| Under 6 Years | 886 (91.9%) | 78 (8.1%) |
| 6 to 18 Years | 2,355 (92.7%) | 184 (7.2%) |
| 19 to 25 Years | 914 (89.9%) | 103 (10.1%) |
| 26 to 34 Years | 1,328 (88.4%) | 175 (11.6%) |
| 35 to 44 Years | 1,450 (88.5%) | 188 (11.5%) |
| 45 to 54 Years | 1,750 (90.1%) | 192 (9.9%) |
| 55 to 64 Years | 2,466 (93.7%) | 167 (6.3%) |
| 65 to 74 Years | 2,315 (99.7%) | 7 (0.3%) |
| 75 Years and older | 1,604 (99.6%) | 7 (0.4%) |
| Total | 15,068 (93.2%) | 1,101 (6.8%) |
Health Insurance Coverage by Citizenship Status in Potter County
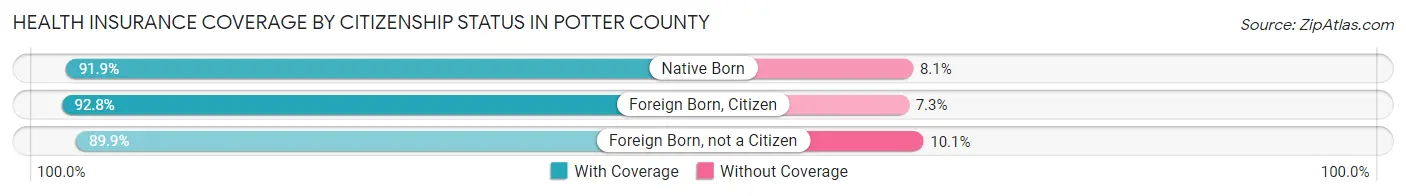
| Citizenship Status | With Coverage | Without Coverage |
| Native Born | 886 (91.9%) | 78 (8.1%) |
| Foreign Born, Citizen | 2,355 (92.7%) | 184 (7.2%) |
| Foreign Born, not a Citizen | 914 (89.9%) | 103 (10.1%) |
Health Insurance Coverage by Household Income in Potter County
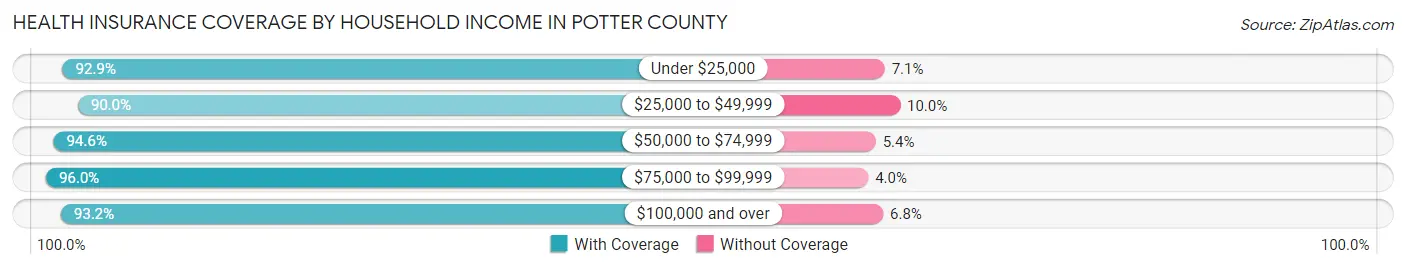
| Household Income | With Coverage | Without Coverage |
| Under $25,000 | 1,687 (92.9%) | 129 (7.1%) |
| $25,000 to $49,999 | 3,431 (90.0%) | 380 (10.0%) |
| $50,000 to $74,999 | 3,156 (94.6%) | 181 (5.4%) |
| $75,000 to $99,999 | 2,636 (96.0%) | 110 (4.0%) |
| $100,000 and over | 4,126 (93.2%) | 301 (6.8%) |
Public vs Private Health Insurance Coverage by Age in Potter County
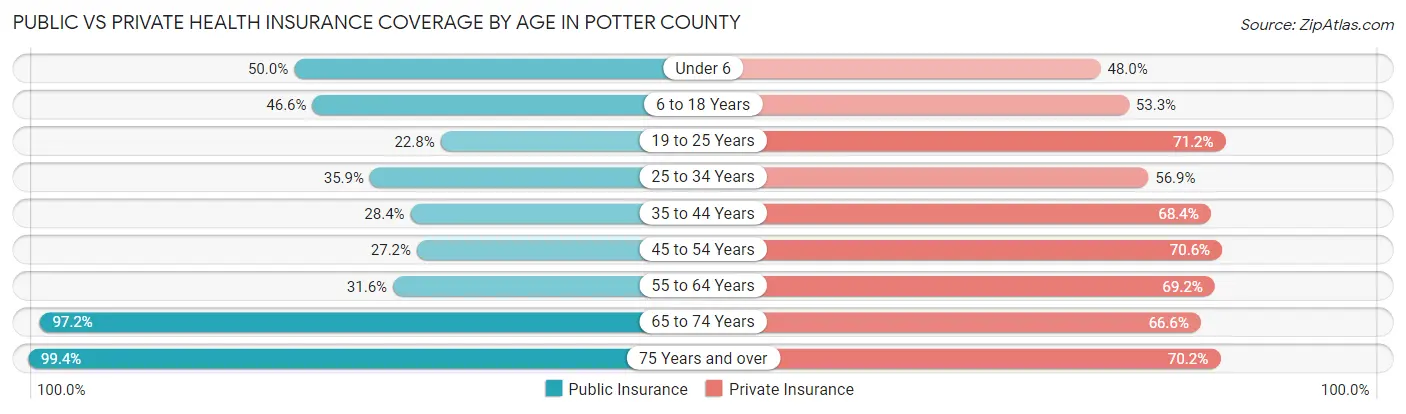
| Age Bracket | Public Insurance | Private Insurance |
| Under 6 | 482 (50.0%) | 463 (48.0%) |
| 6 to 18 Years | 1,183 (46.6%) | 1,353 (53.3%) |
| 19 to 25 Years | 232 (22.8%) | 724 (71.2%) |
| 25 to 34 Years | 540 (35.9%) | 855 (56.9%) |
| 35 to 44 Years | 465 (28.4%) | 1,121 (68.4%) |
| 45 to 54 Years | 528 (27.2%) | 1,370 (70.6%) |
| 55 to 64 Years | 833 (31.6%) | 1,822 (69.2%) |
| 65 to 74 Years | 2,258 (97.2%) | 1,547 (66.6%) |
| 75 Years and over | 1,601 (99.4%) | 1,131 (70.2%) |
| Total | 8,122 (50.2%) | 10,386 (64.2%) |
Disability Status by Sex by Age in Potter County
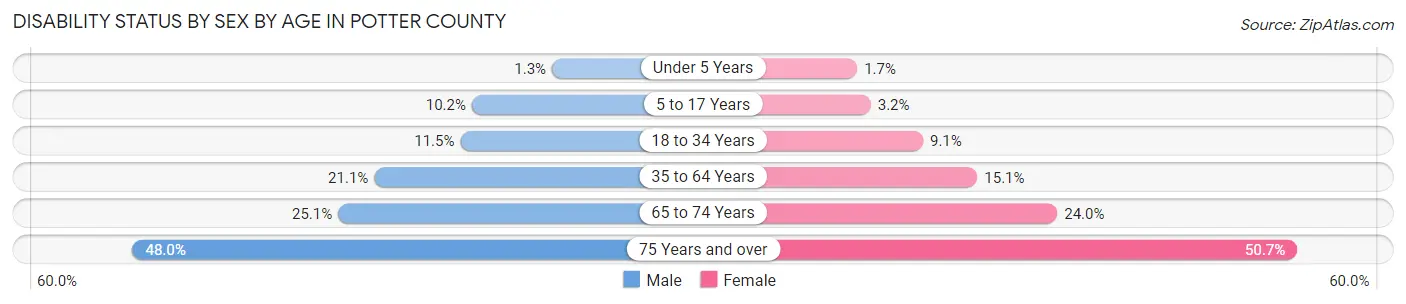
| Age Bracket | Male | Female |
| Under 5 Years | 5 (1.3%) | 7 (1.7%) |
| 5 to 17 Years | 130 (10.2%) | 40 (3.2%) |
| 18 to 34 Years | 161 (11.5%) | 118 (9.0%) |
| 35 to 64 Years | 666 (21.1%) | 461 (15.1%) |
| 65 to 74 Years | 293 (25.1%) | 277 (24.0%) |
| 75 Years and over | 331 (48.0%) | 467 (50.7%) |
Disability Class by Sex by Age in Potter County
Disability Class: Hearing Difficulty
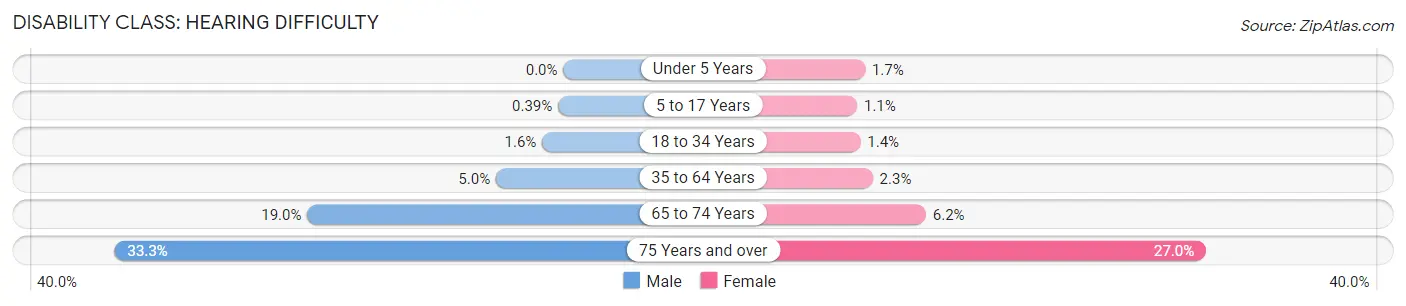
| Age Bracket | Male | Female |
| Under 5 Years | 0 (0.0%) | 7 (1.7%) |
| 5 to 17 Years | 5 (0.4%) | 14 (1.1%) |
| 18 to 34 Years | 22 (1.6%) | 18 (1.4%) |
| 35 to 64 Years | 158 (5.0%) | 70 (2.3%) |
| 65 to 74 Years | 222 (19.0%) | 72 (6.2%) |
| 75 Years and over | 230 (33.3%) | 249 (27.0%) |
Disability Class: Vision Difficulty
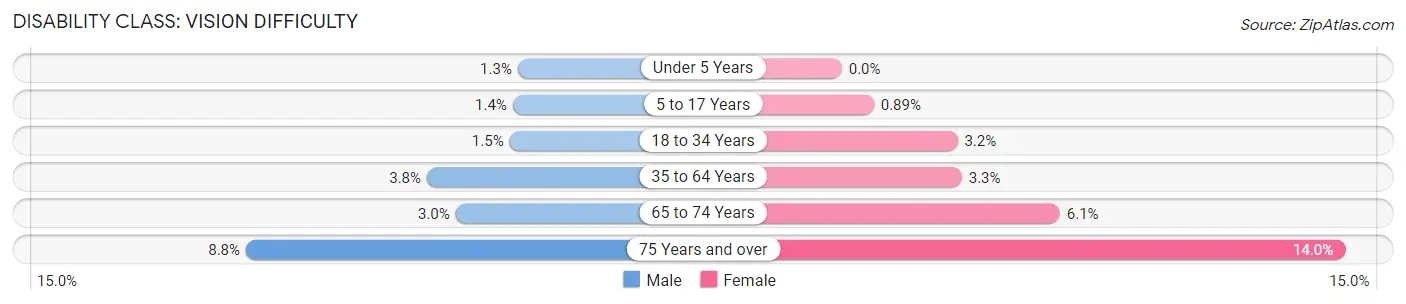
| Age Bracket | Male | Female |
| Under 5 Years | 5 (1.3%) | 0 (0.0%) |
| 5 to 17 Years | 18 (1.4%) | 11 (0.9%) |
| 18 to 34 Years | 21 (1.5%) | 42 (3.2%) |
| 35 to 64 Years | 120 (3.8%) | 102 (3.3%) |
| 65 to 74 Years | 35 (3.0%) | 70 (6.1%) |
| 75 Years and over | 61 (8.8%) | 129 (14.0%) |
Disability Class: Cognitive Difficulty
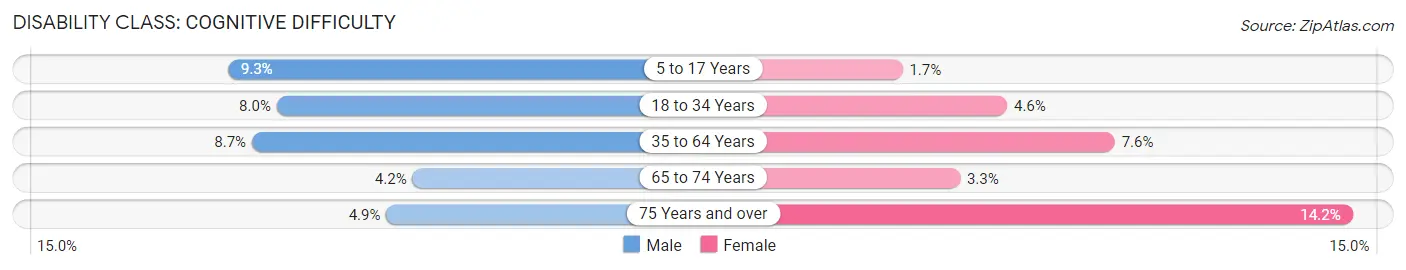
| Age Bracket | Male | Female |
| 5 to 17 Years | 119 (9.3%) | 21 (1.7%) |
| 18 to 34 Years | 112 (8.0%) | 60 (4.6%) |
| 35 to 64 Years | 274 (8.7%) | 232 (7.6%) |
| 65 to 74 Years | 49 (4.2%) | 38 (3.3%) |
| 75 Years and over | 34 (4.9%) | 131 (14.2%) |
Disability Class: Ambulatory Difficulty
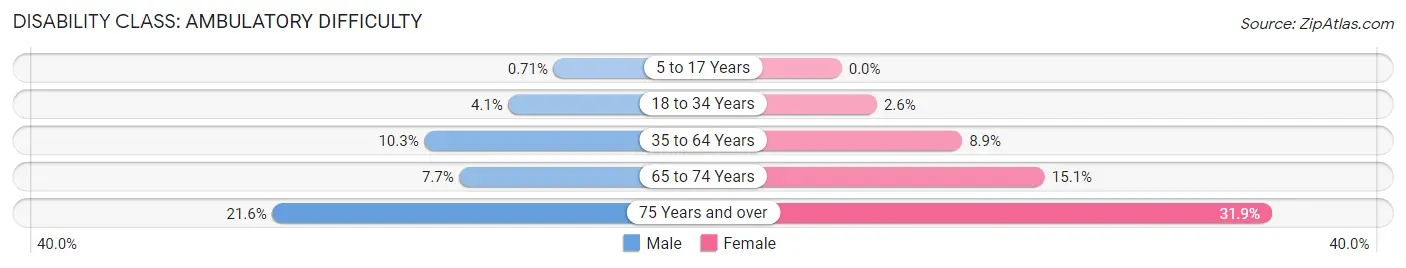
| Age Bracket | Male | Female |
| 5 to 17 Years | 9 (0.7%) | 0 (0.0%) |
| 18 to 34 Years | 57 (4.1%) | 34 (2.6%) |
| 35 to 64 Years | 326 (10.3%) | 273 (8.9%) |
| 65 to 74 Years | 90 (7.7%) | 174 (15.1%) |
| 75 Years and over | 149 (21.6%) | 294 (31.9%) |
Disability Class: Self-Care Difficulty
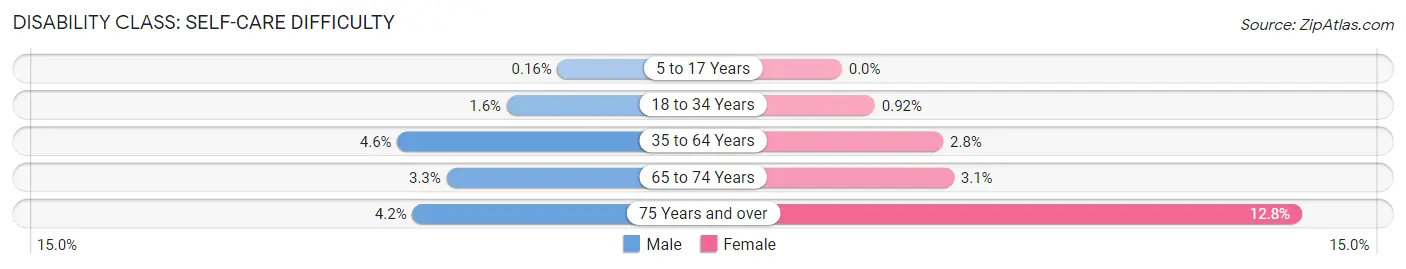
| Age Bracket | Male | Female |
| 5 to 17 Years | 2 (0.2%) | 0 (0.0%) |
| 18 to 34 Years | 22 (1.6%) | 12 (0.9%) |
| 35 to 64 Years | 146 (4.6%) | 86 (2.8%) |
| 65 to 74 Years | 38 (3.3%) | 36 (3.1%) |
| 75 Years and over | 29 (4.2%) | 118 (12.8%) |
Technology Access in Potter County
Computing Device Access in Potter County
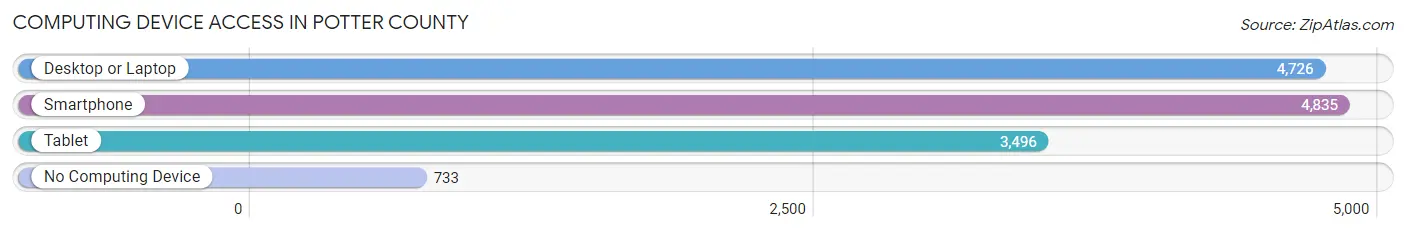
| Device Type | # Households | % Households |
| Desktop or Laptop | 4,726 | 71.7% |
| Smartphone | 4,835 | 73.3% |
| Tablet | 3,496 | 53.0% |
| No Computing Device | 733 | 11.1% |
| Total | 6,595 | 100.0% |
Internet Access in Potter County
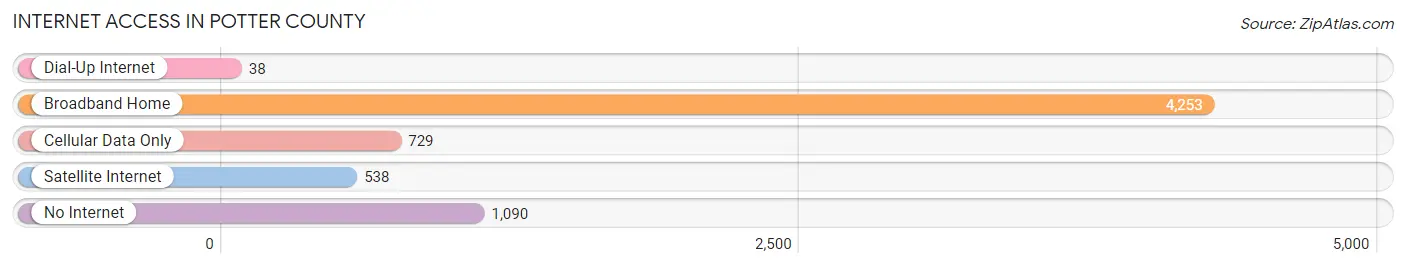
| Internet Type | # Households | % Households |
| Dial-Up Internet | 38 | 0.6% |
| Broadband Home | 4,253 | 64.5% |
| Cellular Data Only | 729 | 11.1% |
| Satellite Internet | 538 | 8.2% |
| No Internet | 1,090 | 16.5% |
| Total | 6,595 | 100.0% |
Potter County Summary
Potter County is located in the north-central region of Pennsylvania, and is part of the Allegheny Plateau. It is bordered by McKean County to the north, Tioga County to the east, Clinton County to the south, and Cameron and Elk Counties to the west. Potter County is home to a population of 17,457 people, according to the 2010 census.
Geography
Potter County is located in the Allegheny Plateau region of Pennsylvania, and is characterized by rolling hills and valleys. The county is home to several state parks, including Susquehannock State Park, Cherry Springs State Park, and Lyman Run State Park. The Allegheny River runs through the county, and is a popular destination for fishing, boating, and other recreational activities. The county is also home to several small lakes, including Chappel Dam Lake, Lyman Run Lake, and Potter Lake.
The highest point in Potter County is located at the summit of Mount Tom, which has an elevation of 2,890 feet. The lowest point is located at the confluence of the Allegheny and Genesee Rivers, which has an elevation of 1,400 feet.
Economy
Potter County is largely rural, and the economy is largely based on agriculture and tourism. The county is home to several dairy farms, as well as a number of small businesses. The county is also home to several wineries, including the Allegheny Wine Cellars and the Potter County Winery.
Tourism is a major industry in Potter County, and the county is home to several popular attractions, including the Allegheny National Forest, the Allegheny River, and the Cherry Springs State Park. The county is also home to several historic sites, including the Potter County Courthouse and the Potter County Historical Society.
Demographics
According to the 2010 census, Potter County had a population of 17,457 people. The population was spread out, with 48.3% male and 51.7% female. The median age was 43.2 years. The racial makeup of the county was 97.2% White, 0.7% African American, 0.3% Native American, 0.2% Asian, 0.1% Pacific Islander, 0.4% from other races, and 1.1% from two or more races. Hispanic or Latino of any race were 1.2% of the population.
The median household income in Potter County was $37,945, and the median family income was $45,938. The per capita income was $20,845. About 11.2% of the population was below the poverty line.
Conclusion
Potter County is a rural county located in the north-central region of Pennsylvania. The county is home to a population of 17,457 people, and the economy is largely based on agriculture and tourism. The county is home to several state parks, as well as several wineries and historic sites. The population is largely white, and the median household income is $37,945.
Common Questions
What is Per Capita Income in Potter County?
Per Capita income in Potter County is $29,629.
What is the Median Family Income in Potter County?
Median Family Income in Potter County is $70,218.
What is the Median Household income in Potter County?
Median Household Income in Potter County is $56,491.
What is Income or Wage Gap in Potter County?
Income or Wage Gap in Potter County is 30.2%.
Women in Potter County earn 69.8 cents for every dollar earned by a man.
What is Family Income Deficit in Potter County?
Family Income Deficit in Potter County is $9,373.
Families that are below poverty line in Potter County earn $9,373 less on average than the poverty threshold level.
What is Inequality or Gini Index in Potter County?
Inequality or Gini Index in Potter County is 0.41.
What is the Total Population of Potter County?
Total Population of Potter County is 16,390.
What is the Total Male Population of Potter County?
Total Male Population of Potter County is 8,220.
What is the Total Female Population of Potter County?
Total Female Population of Potter County is 8,170.
What is the Ratio of Males per 100 Females in Potter County?
There are 100.61 Males per 100 Females in Potter County.
What is the Ratio of Females per 100 Males in Potter County?
There are 99.39 Females per 100 Males in Potter County.
What is the Median Population Age in Potter County?
Median Population Age in Potter County is 48.1 Years.
What is the Average Family Size in Potter County
Average Family Size in Potter County is 3.0 People.
What is the Average Household Size in Potter County
Average Household Size in Potter County is 2.5 People.
How Large is the Labor Force in Potter County?
There are 7,169 People in the Labor Forcein in Potter County.
What is the Percentage of People in the Labor Force in Potter County?
53.2% of People are in the Labor Force in Potter County.
What is the Unemployment Rate in Potter County?
Unemployment Rate in Potter County is 4.8%.