Perry County, PA Map & Demographics
Perry County Map
Perry County Overview
$37,018
PER CAPITA INCOME
$90,946
AVG FAMILY INCOME
$76,103
AVG HOUSEHOLD INCOME
33.2%
WAGE / INCOME GAP [ % ]
66.8¢/ $1
WAGE / INCOME GAP [ $ ]
$11,389
FAMILY INCOME DEFICIT
0.40
INEQUALITY / GINI INDEX
45,941
TOTAL POPULATION
23,368
MALE POPULATION
22,573
FEMALE POPULATION
103.52
MALES / 100 FEMALES
96.60
FEMALES / 100 MALES
43.7
MEDIAN AGE
3.0
AVG FAMILY SIZE
2.5
AVG HOUSEHOLD SIZE
23,176
LABOR FORCE [ PEOPLE ]
62.0%
PERCENT IN LABOR FORCE
3.4%
UNEMPLOYMENT RATE
Perry County Area Codes
Income in Perry County
Income Overview in Perry County
Per Capita Income in Perry County is $37,018, while median incomes of families and households are $90,946 and $76,103 respectively.
| Characteristic | Number | Measure |
| Per Capita Income | 45,941 | $37,018 |
| Median Family Income | 12,601 | $90,946 |
| Mean Family Income | 12,601 | $102,798 |
| Median Household Income | 18,066 | $76,103 |
| Mean Household Income | 18,066 | $91,535 |
| Income Deficit | 12,601 | $11,389 |
| Wage / Income Gap (%) | 45,941 | 33.16% |
| Wage / Income Gap ($) | 45,941 | 66.84¢ per $1 |
| Gini / Inequality Index | 45,941 | 0.40 |
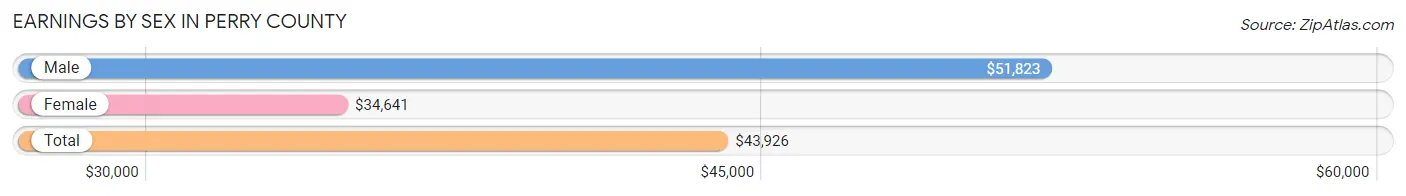
Earnings by Sex in Perry County
Average Earnings in Perry County are $43,926, $51,823 for men and $34,641 for women, a difference of 33.2%.
| Sex | Number | Average Earnings |
| Male | 13,337 (54.6%) | $51,823 |
| Female | 11,072 (45.4%) | $34,641 |
| Total | 24,409 (100.0%) | $43,926 |
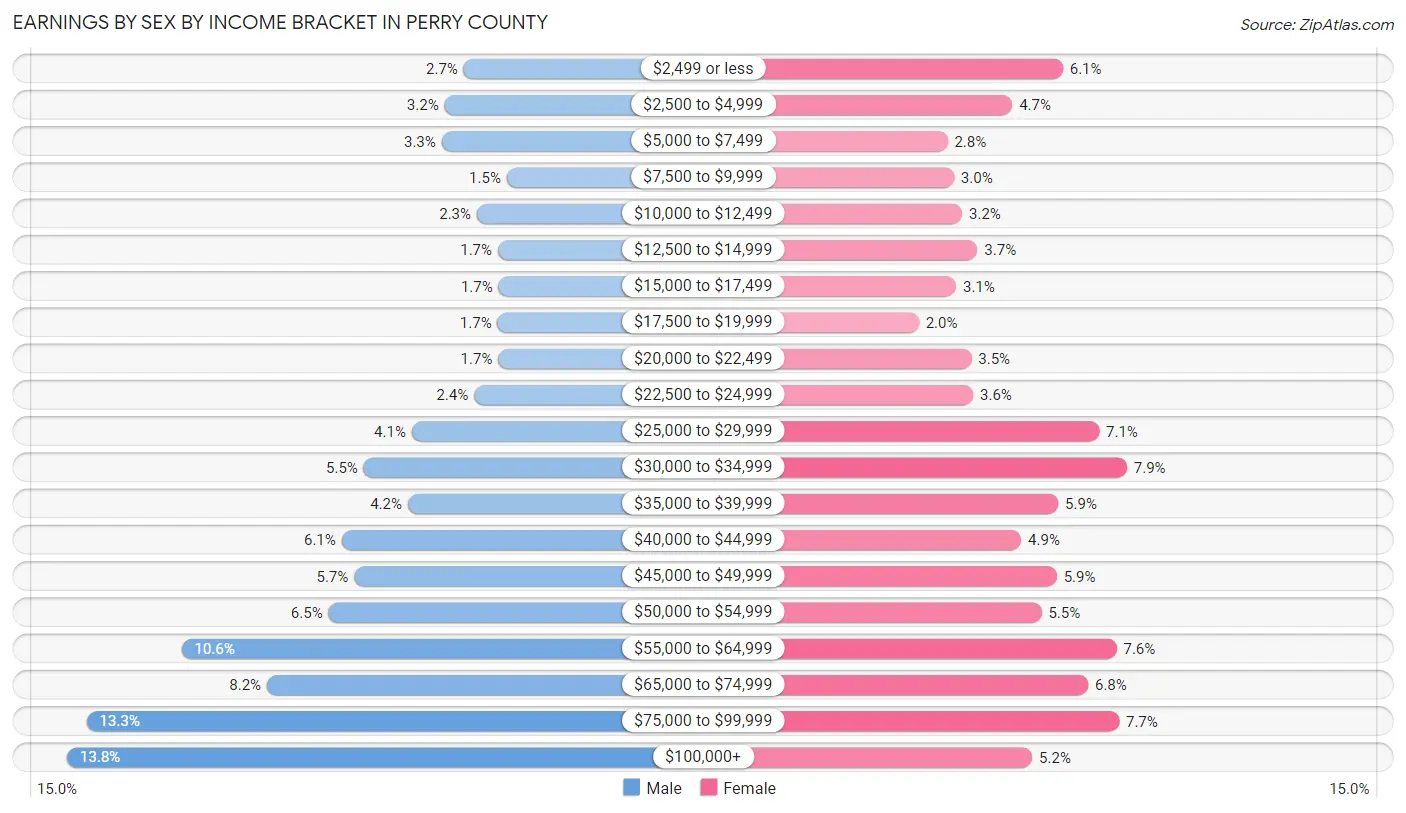
Earnings by Sex by Income Bracket in Perry County
The most common earnings brackets in Perry County are $100,000+ for men (1,842 | 13.8%) and $30,000 to $34,999 for women (871 | 7.9%).
| Income | Male | Female |
| $2,499 or less | 355 (2.7%) | 672 (6.1%) |
| $2,500 to $4,999 | 427 (3.2%) | 515 (4.6%) |
| $5,000 to $7,499 | 438 (3.3%) | 313 (2.8%) |
| $7,500 to $9,999 | 194 (1.5%) | 333 (3.0%) |
| $10,000 to $12,499 | 306 (2.3%) | 359 (3.2%) |
| $12,500 to $14,999 | 227 (1.7%) | 406 (3.7%) |
| $15,000 to $17,499 | 224 (1.7%) | 340 (3.1%) |
| $17,500 to $19,999 | 228 (1.7%) | 224 (2.0%) |
| $20,000 to $22,499 | 226 (1.7%) | 387 (3.5%) |
| $22,500 to $24,999 | 316 (2.4%) | 393 (3.5%) |
| $25,000 to $29,999 | 549 (4.1%) | 785 (7.1%) |
| $30,000 to $34,999 | 729 (5.5%) | 871 (7.9%) |
| $35,000 to $39,999 | 564 (4.2%) | 658 (5.9%) |
| $40,000 to $44,999 | 812 (6.1%) | 543 (4.9%) |
| $45,000 to $49,999 | 765 (5.7%) | 653 (5.9%) |
| $50,000 to $54,999 | 861 (6.5%) | 606 (5.5%) |
| $55,000 to $64,999 | 1,413 (10.6%) | 839 (7.6%) |
| $65,000 to $74,999 | 1,092 (8.2%) | 751 (6.8%) |
| $75,000 to $99,999 | 1,769 (13.3%) | 847 (7.6%) |
| $100,000+ | 1,842 (13.8%) | 577 (5.2%) |
| Total | 13,337 (100.0%) | 11,072 (100.0%) |
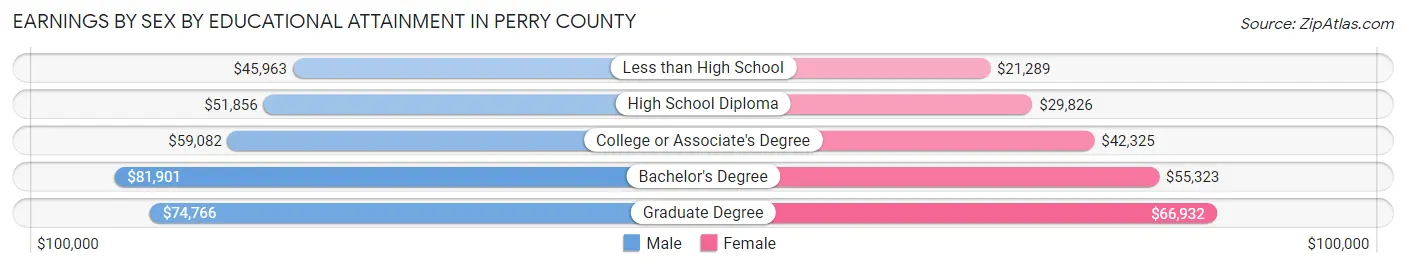
Earnings by Sex by Educational Attainment in Perry County
Average earnings in Perry County are $55,929 for men and $38,767 for women, a difference of 30.7%. Men with an educational attainment of bachelor's degree enjoy the highest average annual earnings of $81,901, while those with less than high school education earn the least with $45,963. Women with an educational attainment of graduate degree earn the most with the average annual earnings of $66,932, while those with less than high school education have the smallest earnings of $21,289.
| Educational Attainment | Male Income | Female Income |
| Less than High School | $45,963 | $21,289 |
| High School Diploma | $51,856 | $29,826 |
| College or Associate's Degree | $59,082 | $42,325 |
| Bachelor's Degree | $81,901 | $55,323 |
| Graduate Degree | $74,766 | $66,932 |
| Total | $55,929 | $38,767 |
Family Income in Perry County
Family Income Brackets in Perry County
According to the Perry County family income data, there are 3,201 families falling into the $100,000 to $149,999 income range, which is the most common income bracket and makes up 25.4% of all families. Conversely, the less than $10,000 income bracket is the least frequent group with only 265 families (2.1%) belonging to this category.
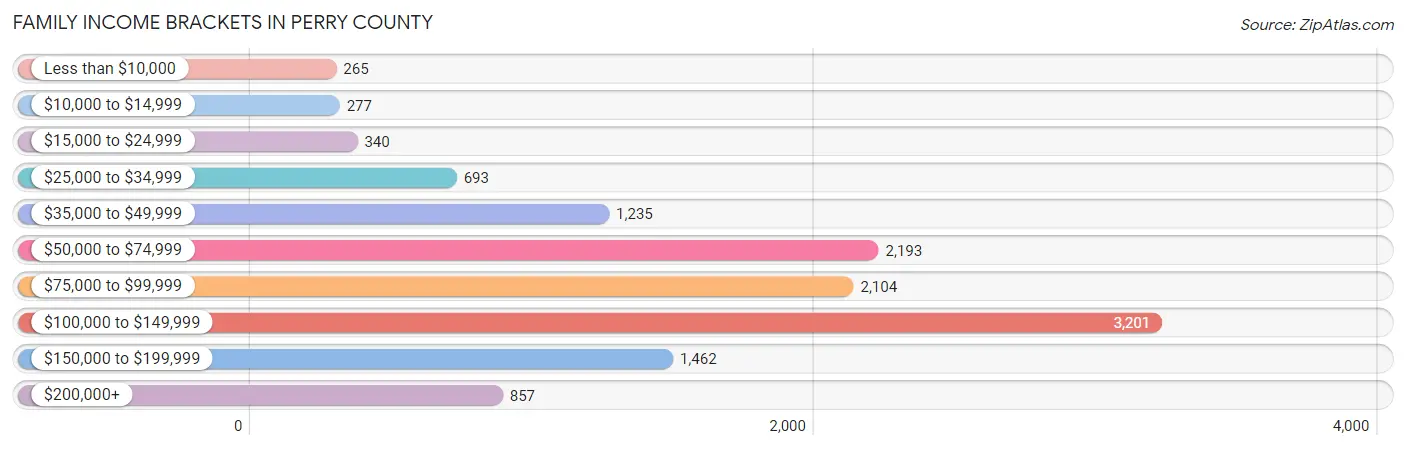
| Income Bracket | # Families | % Families |
| Less than $10,000 | 265 | 2.1% |
| $10,000 to $14,999 | 277 | 2.2% |
| $15,000 to $24,999 | 340 | 2.7% |
| $25,000 to $34,999 | 693 | 5.5% |
| $35,000 to $49,999 | 1,235 | 9.8% |
| $50,000 to $74,999 | 2,193 | 17.4% |
| $75,000 to $99,999 | 2,104 | 16.7% |
| $100,000 to $149,999 | 3,201 | 25.4% |
| $150,000 to $199,999 | 1,462 | 11.6% |
| $200,000+ | 857 | 6.8% |
Family Income by Famaliy Size in Perry County
7+ person families (316 | 2.5%) account for the highest median family income in Perry County with $115,000 per family, while 2-person families (6,486 | 51.5%) have the highest median income of $40,000 per family member.
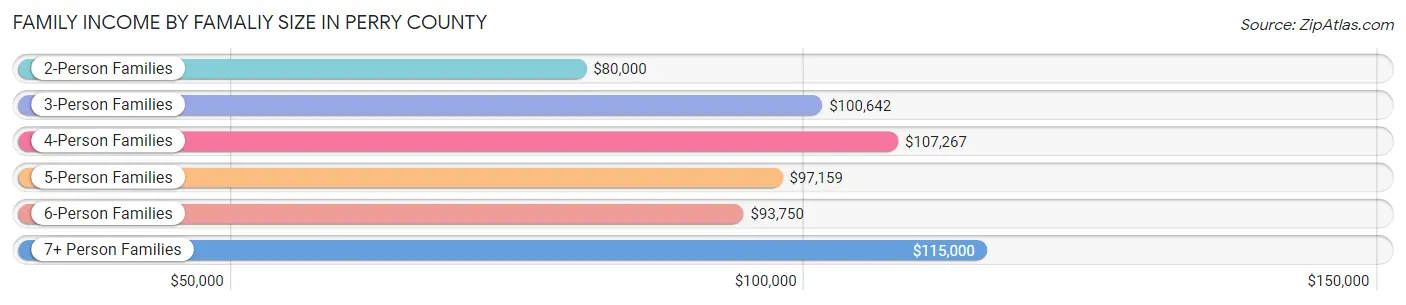
| Income Bracket | # Families | Median Income |
| 2-Person Families | 6,486 (51.5%) | $80,000 |
| 3-Person Families | 2,616 (20.8%) | $100,642 |
| 4-Person Families | 1,962 (15.6%) | $107,267 |
| 5-Person Families | 912 (7.2%) | $97,159 |
| 6-Person Families | 309 (2.5%) | $93,750 |
| 7+ Person Families | 316 (2.5%) | $115,000 |
| Total | 12,601 (100.0%) | $90,946 |
Family Income by Number of Earners in Perry County
The median family income in Perry County is $90,946, with families comprising 3+ earners (1,595) having the highest median family income of $140,966, while families with no earners (1,925) have the lowest median family income of $45,322, accounting for 12.7% and 15.3% of families, respectively.
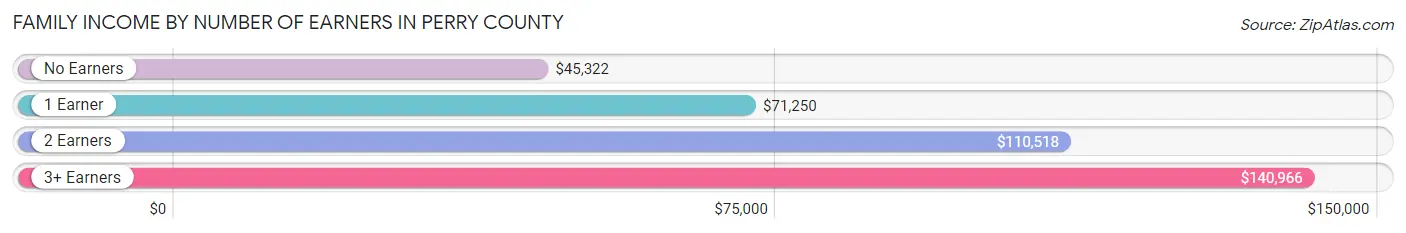
| Number of Earners | # Families | Median Income |
| No Earners | 1,925 (15.3%) | $45,322 |
| 1 Earner | 4,227 (33.5%) | $71,250 |
| 2 Earners | 4,854 (38.5%) | $110,518 |
| 3+ Earners | 1,595 (12.7%) | $140,966 |
| Total | 12,601 (100.0%) | $90,946 |
Household Income in Perry County
Household Income Brackets in Perry County
With 3,740 households falling in the category, the $100,000 to $149,999 income range is the most frequent in Perry County, accounting for 20.7% of all households. In contrast, only 542 households (3.0%) fall into the less than $10,000 income bracket, making it the least populous group.
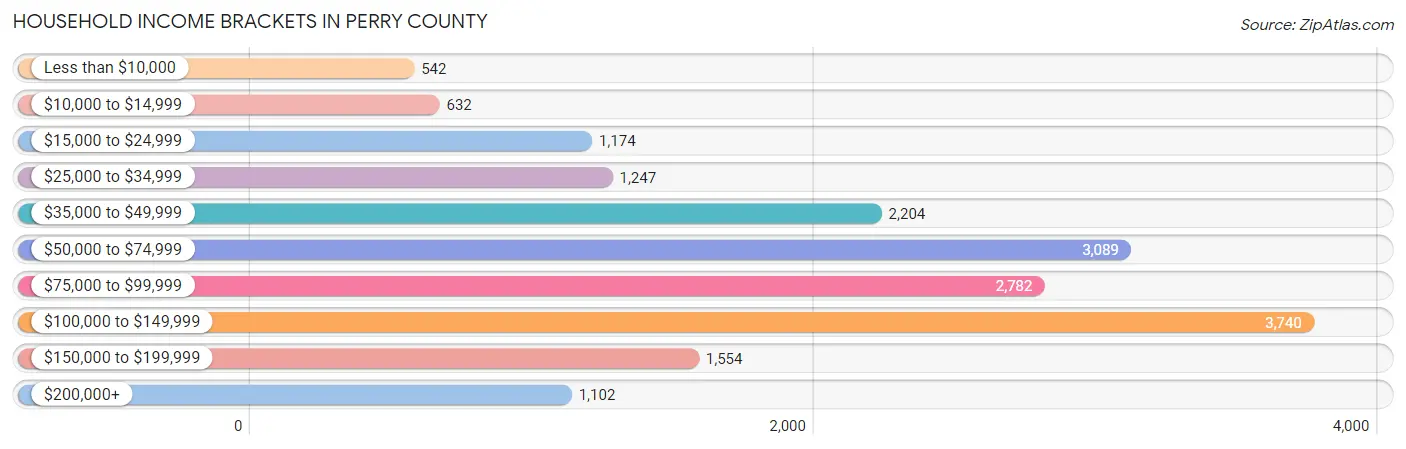
| Income Bracket | # Households | % Households |
| Less than $10,000 | 542 | 3.0% |
| $10,000 to $14,999 | 632 | 3.5% |
| $15,000 to $24,999 | 1,174 | 6.5% |
| $25,000 to $34,999 | 1,247 | 6.9% |
| $35,000 to $49,999 | 2,204 | 12.2% |
| $50,000 to $74,999 | 3,089 | 17.1% |
| $75,000 to $99,999 | 2,782 | 15.4% |
| $100,000 to $149,999 | 3,740 | 20.7% |
| $150,000 to $199,999 | 1,554 | 8.6% |
| $200,000+ | 1,102 | 6.1% |
Household Income by Householder Age in Perry County
The median household income in Perry County is $76,103, with the highest median household income of $95,663 found in the 45 to 64 years age bracket for the primary householder. A total of 7,149 households (39.6%) fall into this category. Meanwhile, the 65+ years age bracket for the primary householder has the lowest median household income of $46,218, with 5,483 households (30.3%) in this group.
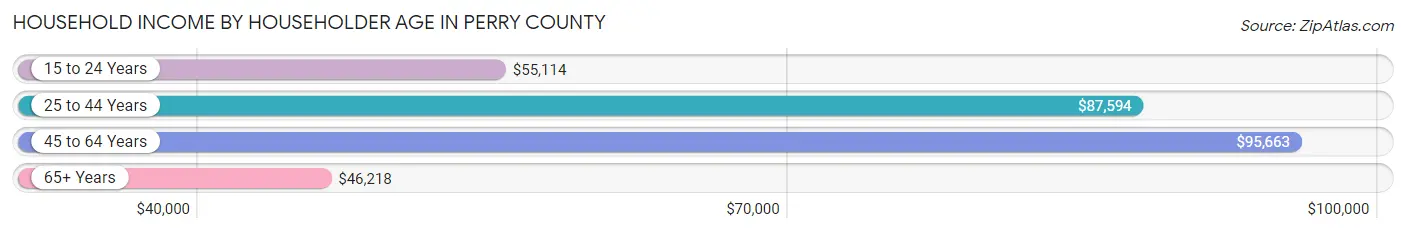
| Income Bracket | # Households | Median Income |
| 15 to 24 Years | 389 (2.1%) | $55,114 |
| 25 to 44 Years | 5,045 (27.9%) | $87,594 |
| 45 to 64 Years | 7,149 (39.6%) | $95,663 |
| 65+ Years | 5,483 (30.3%) | $46,218 |
| Total | 18,066 (100.0%) | $76,103 |
Poverty in Perry County
Income Below Poverty by Sex and Age in Perry County
With 7.6% poverty level for males and 8.7% for females among the residents of Perry County, 5 year old males and 25 to 34 year old females are the most vulnerable to poverty, with 36 males (14.1%) and 422 females (16.4%) in their respective age groups living below the poverty level.
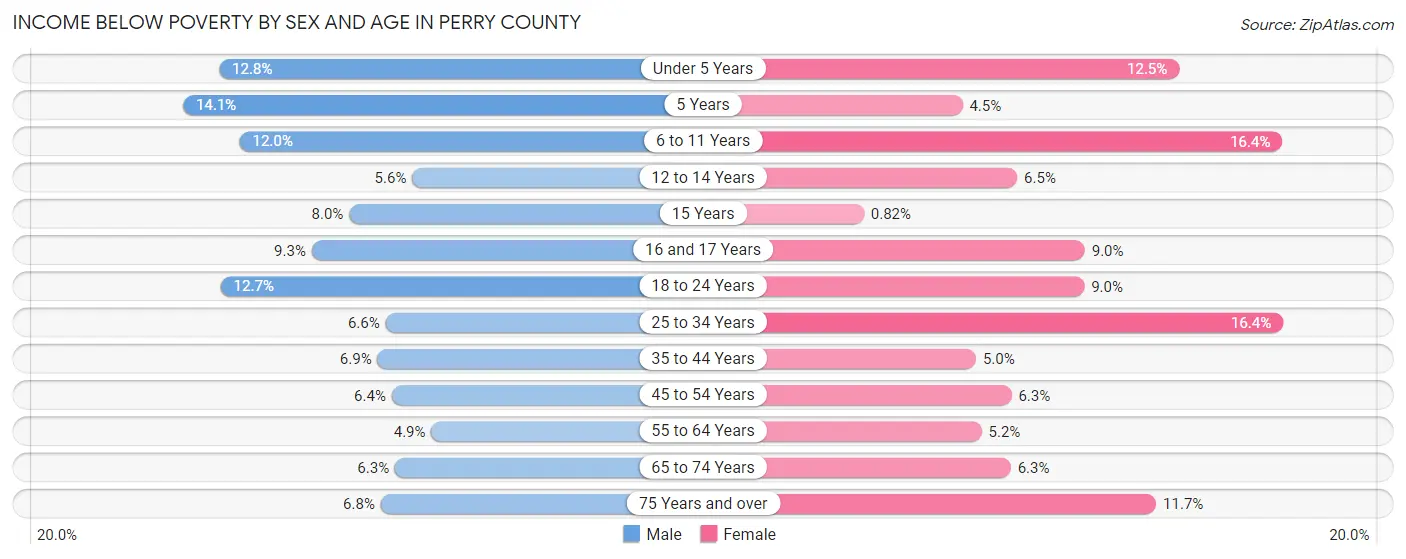
| Age Bracket | Male | Female |
| Under 5 Years | 166 (12.8%) | 147 (12.5%) |
| 5 Years | 36 (14.1%) | 12 (4.5%) |
| 6 to 11 Years | 213 (12.0%) | 238 (16.4%) |
| 12 to 14 Years | 45 (5.6%) | 55 (6.5%) |
| 15 Years | 24 (8.0%) | 2 (0.8%) |
| 16 and 17 Years | 48 (9.3%) | 48 (9.0%) |
| 18 to 24 Years | 213 (12.7%) | 137 (9.0%) |
| 25 to 34 Years | 181 (6.6%) | 422 (16.4%) |
| 35 to 44 Years | 189 (6.9%) | 131 (5.0%) |
| 45 to 54 Years | 206 (6.4%) | 194 (6.3%) |
| 55 to 64 Years | 175 (4.9%) | 182 (5.2%) |
| 65 to 74 Years | 175 (6.2%) | 165 (6.3%) |
| 75 Years and over | 94 (6.8%) | 214 (11.7%) |
| Total | 1,765 (7.6%) | 1,947 (8.7%) |
Income Above Poverty by Sex and Age in Perry County
According to the poverty statistics in Perry County, males aged 55 to 64 years and females aged 15 years are the age groups that are most secure financially, with 95.1% of males and 99.2% of females in these age groups living above the poverty line.
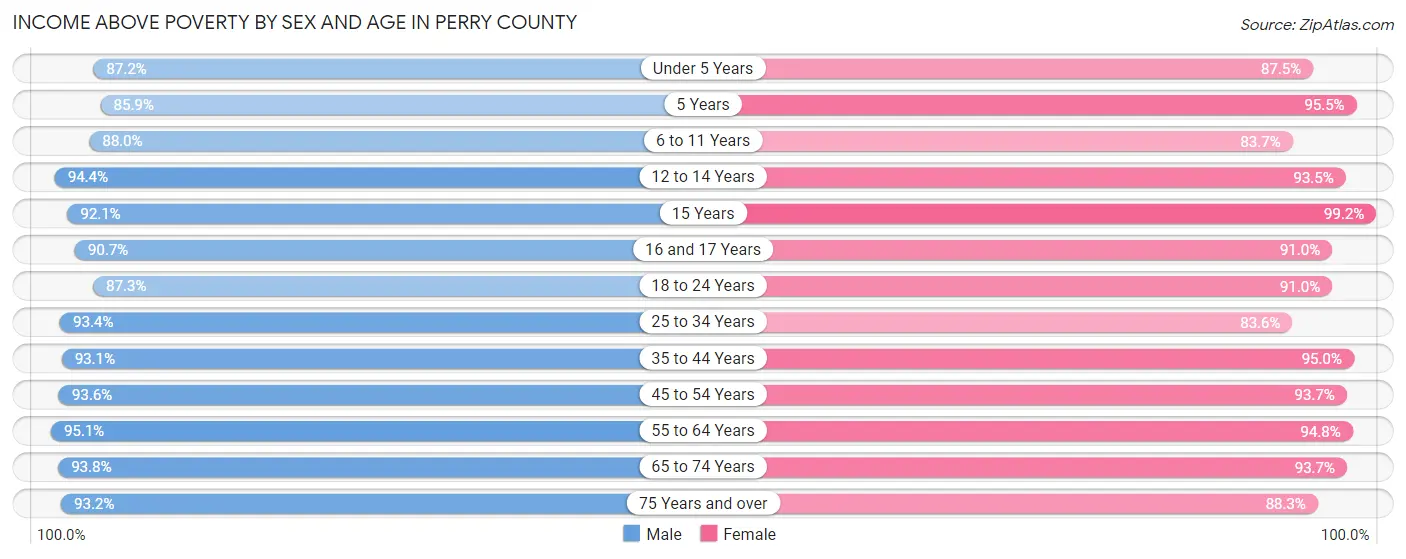
| Age Bracket | Male | Female |
| Under 5 Years | 1,133 (87.2%) | 1,027 (87.5%) |
| 5 Years | 219 (85.9%) | 256 (95.5%) |
| 6 to 11 Years | 1,559 (88.0%) | 1,218 (83.7%) |
| 12 to 14 Years | 757 (94.4%) | 790 (93.5%) |
| 15 Years | 278 (92.0%) | 241 (99.2%) |
| 16 and 17 Years | 466 (90.7%) | 484 (91.0%) |
| 18 to 24 Years | 1,462 (87.3%) | 1,385 (91.0%) |
| 25 to 34 Years | 2,563 (93.4%) | 2,154 (83.6%) |
| 35 to 44 Years | 2,551 (93.1%) | 2,502 (95.0%) |
| 45 to 54 Years | 3,030 (93.6%) | 2,887 (93.7%) |
| 55 to 64 Years | 3,397 (95.1%) | 3,324 (94.8%) |
| 65 to 74 Years | 2,627 (93.8%) | 2,465 (93.7%) |
| 75 Years and over | 1,292 (93.2%) | 1,619 (88.3%) |
| Total | 21,334 (92.4%) | 20,352 (91.3%) |
Income Below Poverty Among Married-Couple Families in Perry County
The poverty statistics for married-couple families in Perry County show that 3.2% or 324 of the total 10,152 families live below the poverty line. Families with 3 or 4 children have the highest poverty rate of 10.2%, comprising of 74 families. On the other hand, families with 1 or 2 children have the lowest poverty rate of 2.4%, which includes 61 families.
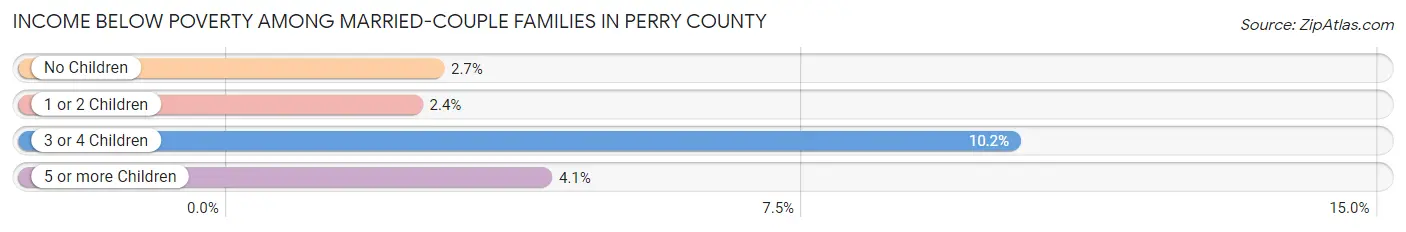
| Children | Above Poverty | Below Poverty |
| No Children | 6,478 (97.3%) | 179 (2.7%) |
| 1 or 2 Children | 2,466 (97.6%) | 61 (2.4%) |
| 3 or 4 Children | 650 (89.8%) | 74 (10.2%) |
| 5 or more Children | 234 (95.9%) | 10 (4.1%) |
| Total | 9,828 (96.8%) | 324 (3.2%) |
Income Below Poverty Among Single-Parent Households in Perry County
According to the poverty data in Perry County, 14.8% or 132 single-father households and 22.5% or 350 single-mother households are living below the poverty line. Among single-father households, those with 5 or more children have the highest poverty rate, with 3 households (100.0%) experiencing poverty. Likewise, among single-mother households, those with 5 or more children have the highest poverty rate, with 3 households (100.0%) falling below the poverty line.
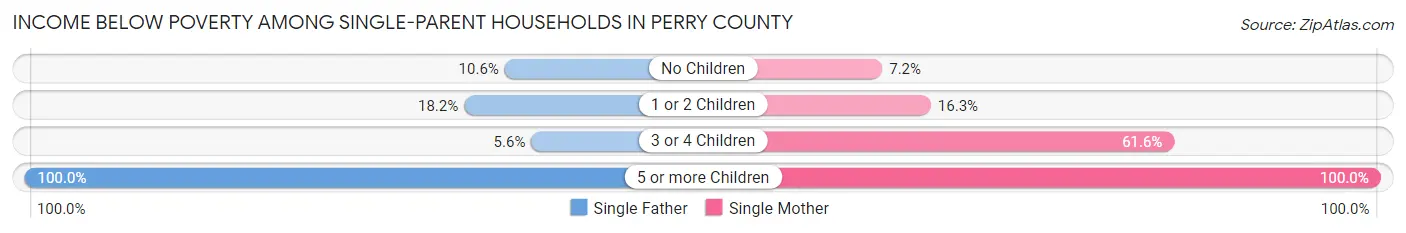
| Children | Single Father | Single Mother |
| No Children | 33 (10.6%) | 40 (7.2%) |
| 1 or 2 Children | 92 (18.1%) | 110 (16.3%) |
| 3 or 4 Children | 4 (5.6%) | 197 (61.6%) |
| 5 or more Children | 3 (100.0%) | 3 (100.0%) |
| Total | 132 (14.8%) | 350 (22.5%) |
Income Below Poverty Among Married-Couple vs Single-Parent Households in Perry County
The poverty data for Perry County shows that 324 of the married-couple family households (3.2%) and 482 of the single-parent households (19.7%) are living below the poverty level. Within the married-couple family households, those with 3 or 4 children have the highest poverty rate, with 74 households (10.2%) falling below the poverty line. Among the single-parent households, those with 5 or more children have the highest poverty rate, with 6 household (100.0%) living below poverty.
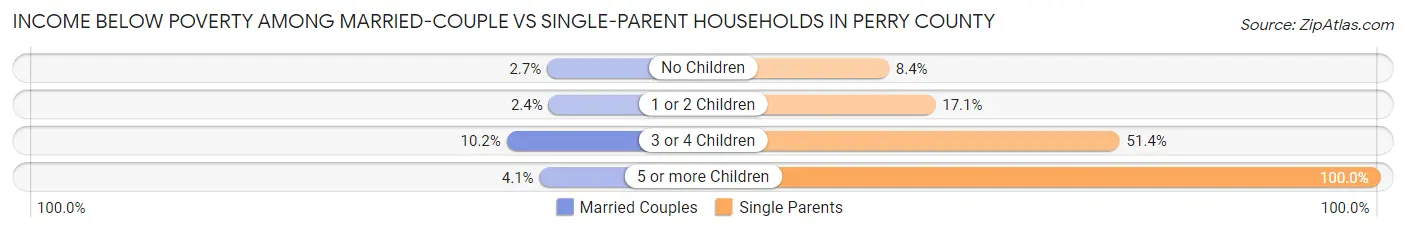
| Children | Married-Couple Families | Single-Parent Households |
| No Children | 179 (2.7%) | 73 (8.4%) |
| 1 or 2 Children | 61 (2.4%) | 202 (17.1%) |
| 3 or 4 Children | 74 (10.2%) | 201 (51.4%) |
| 5 or more Children | 10 (4.1%) | 6 (100.0%) |
| Total | 324 (3.2%) | 482 (19.7%) |
Race in Perry County
The most populous races in Perry County are White / Caucasian (43,702 | 95.1%), Two or more Races (1,409 | 3.1%), and Hispanic or Latino (1,085 | 2.4%).
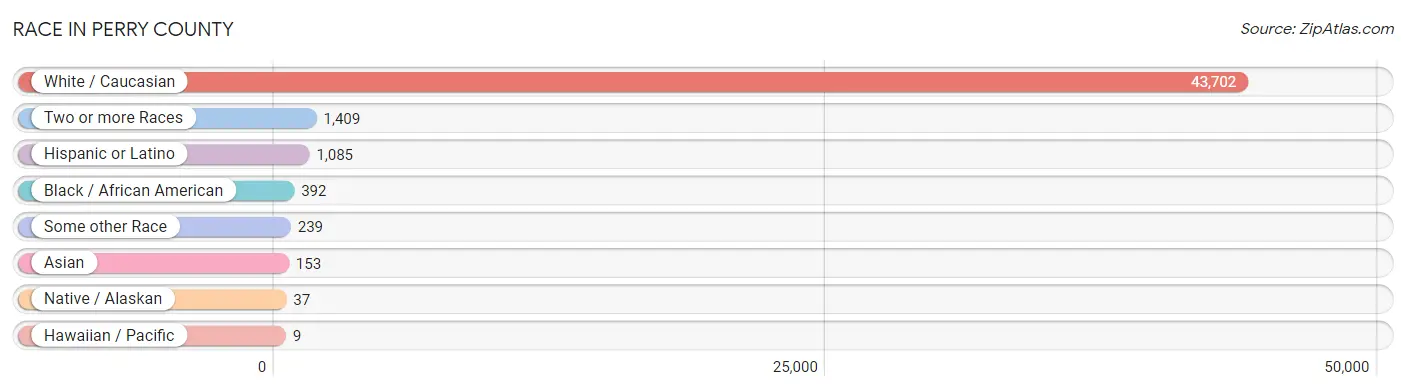
| Race | # Population | % Population |
| Asian | 153 | 0.3% |
| Black / African American | 392 | 0.9% |
| Hawaiian / Pacific | 9 | 0.0% |
| Hispanic or Latino | 1,085 | 2.4% |
| Native / Alaskan | 37 | 0.1% |
| White / Caucasian | 43,702 | 95.1% |
| Two or more Races | 1,409 | 3.1% |
| Some other Race | 239 | 0.5% |
| Total | 45,941 | 100.0% |
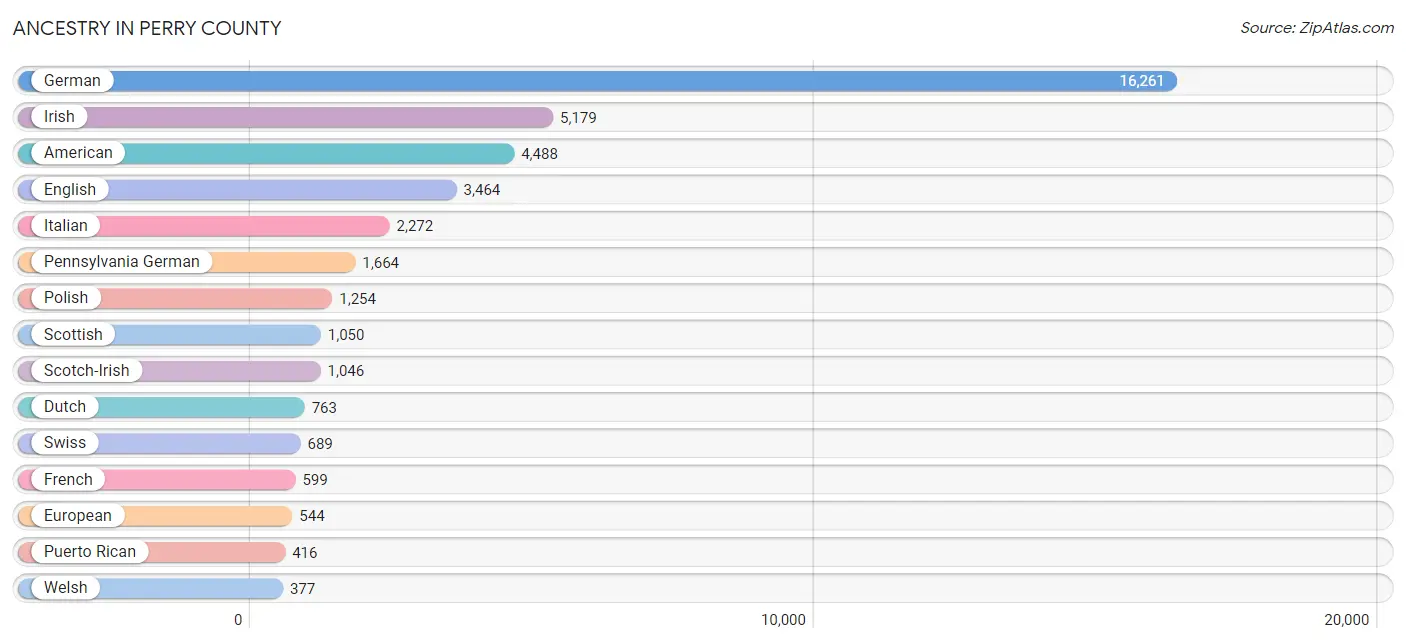
Ancestry in Perry County
The most populous ancestries reported in Perry County are German (16,261 | 35.4%), Irish (5,179 | 11.3%), American (4,488 | 9.8%), English (3,464 | 7.5%), and Italian (2,272 | 5.0%), together accounting for 68.9% of all Perry County residents.
| Ancestry | # Population | % Population |
| African | 29 | 0.1% |
| Albanian | 3 | 0.0% |
| American | 4,488 | 9.8% |
| Apache | 10 | 0.0% |
| Arab | 9 | 0.0% |
| Argentinean | 4 | 0.0% |
| Armenian | 11 | 0.0% |
| Austrian | 95 | 0.2% |
| Bangladeshi | 3 | 0.0% |
| Belgian | 3 | 0.0% |
| Bhutanese | 18 | 0.0% |
| Blackfeet | 2 | 0.0% |
| British | 242 | 0.5% |
| Burmese | 73 | 0.2% |
| Cajun | 136 | 0.3% |
| Canadian | 29 | 0.1% |
| Central American | 116 | 0.3% |
| Central American Indian | 4 | 0.0% |
| Cherokee | 66 | 0.1% |
| Colombian | 16 | 0.0% |
| Costa Rican | 7 | 0.0% |
| Croatian | 25 | 0.1% |
| Cuban | 52 | 0.1% |
| Czech | 71 | 0.2% |
| Czechoslovakian | 16 | 0.0% |
| Danish | 26 | 0.1% |
| Dominican | 56 | 0.1% |
| Dutch | 763 | 1.7% |
| Eastern European | 97 | 0.2% |
| Ecuadorian | 2 | 0.0% |
| Egyptian | 8 | 0.0% |
| English | 3,464 | 7.5% |
| European | 544 | 1.2% |
| Finnish | 21 | 0.1% |
| French | 599 | 1.3% |
| French American Indian | 1 | 0.0% |
| French Canadian | 57 | 0.1% |
| German | 16,261 | 35.4% |
| Greek | 182 | 0.4% |
| Guamanian / Chamorro | 9 | 0.0% |
| Guatemalan | 70 | 0.2% |
| Haitian | 82 | 0.2% |
| Honduran | 10 | 0.0% |
| Hungarian | 289 | 0.6% |
| Indian (Asian) | 50 | 0.1% |
| Irish | 5,179 | 11.3% |
| Iroquois | 2 | 0.0% |
| Italian | 2,272 | 5.0% |
| Jamaican | 26 | 0.1% |
| Japanese | 7 | 0.0% |
| Korean | 60 | 0.1% |
| Lithuanian | 106 | 0.2% |
| Lumbee | 28 | 0.1% |
| Macedonian | 18 | 0.0% |
| Malaysian | 7 | 0.0% |
| Mexican | 190 | 0.4% |
| Mexican American Indian | 19 | 0.0% |
| Mongolian | 17 | 0.0% |
| Native Hawaiian | 17 | 0.0% |
| Northern European | 24 | 0.1% |
| Norwegian | 104 | 0.2% |
| Panamanian | 25 | 0.1% |
| Pennsylvania German | 1,664 | 3.6% |
| Peruvian | 4 | 0.0% |
| Polish | 1,254 | 2.7% |
| Portuguese | 131 | 0.3% |
| Puerto Rican | 416 | 0.9% |
| Romanian | 11 | 0.0% |
| Russian | 125 | 0.3% |
| Salvadoran | 4 | 0.0% |
| Samoan | 3 | 0.0% |
| Scandinavian | 227 | 0.5% |
| Scotch-Irish | 1,046 | 2.3% |
| Scottish | 1,050 | 2.3% |
| Serbian | 15 | 0.0% |
| Slavic | 20 | 0.0% |
| Slovak | 142 | 0.3% |
| Slovene | 82 | 0.2% |
| South American | 127 | 0.3% |
| Spaniard | 10 | 0.0% |
| Spanish | 60 | 0.1% |
| Sri Lankan | 27 | 0.1% |
| Subsaharan African | 39 | 0.1% |
| Swedish | 151 | 0.3% |
| Swiss | 689 | 1.5% |
| Thai | 74 | 0.2% |
| Trinidadian and Tobagonian | 11 | 0.0% |
| Turkish | 3 | 0.0% |
| Ukrainian | 201 | 0.4% |
| Uruguayan | 85 | 0.2% |
| Venezuelan | 16 | 0.0% |
| Welsh | 377 | 0.8% |
| West Indian | 35 | 0.1% |
| Yugoslavian | 15 | 0.0% | View All 94 Rows |
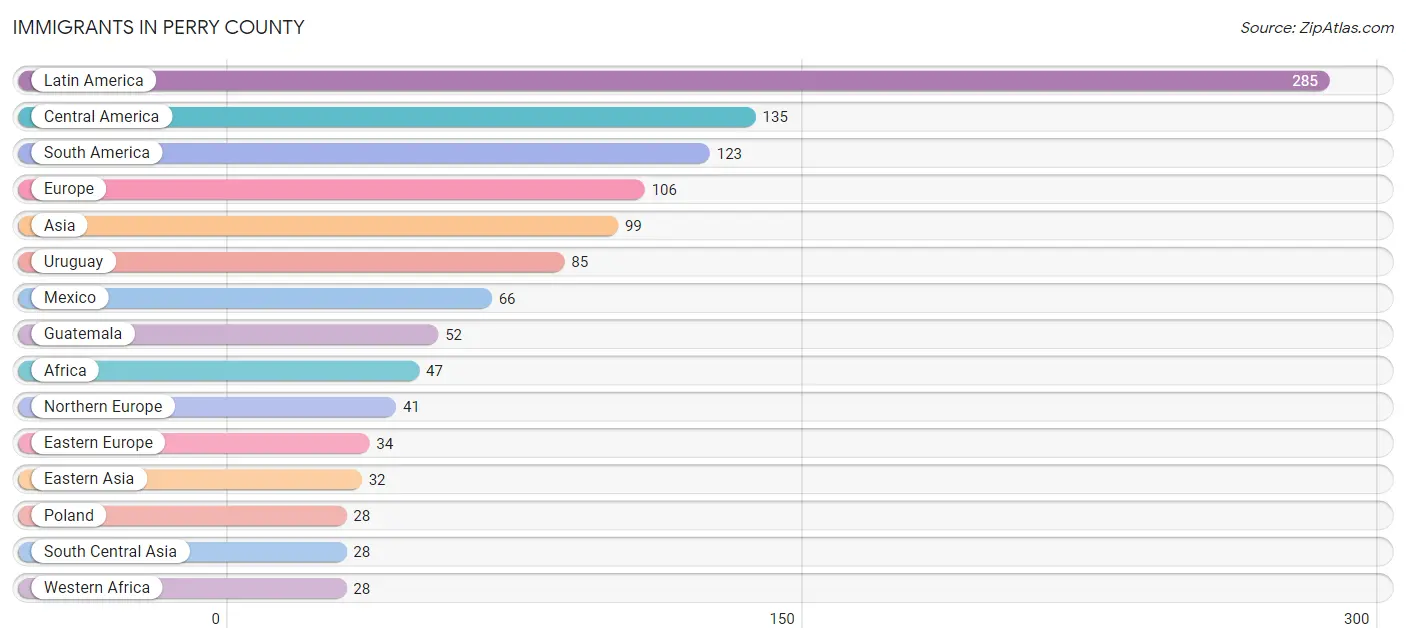
Immigrants in Perry County
The most numerous immigrant groups reported in Perry County came from Latin America (285 | 0.6%), Central America (135 | 0.3%), South America (123 | 0.3%), Europe (106 | 0.2%), and Asia (99 | 0.2%), together accounting for 1.6% of all Perry County residents.
| Immigration Origin | # Population | % Population |
| Africa | 47 | 0.1% |
| Argentina | 24 | 0.1% |
| Asia | 99 | 0.2% |
| Australia | 7 | 0.0% |
| Canada | 10 | 0.0% |
| Caribbean | 27 | 0.1% |
| Central America | 135 | 0.3% |
| China | 14 | 0.0% |
| Costa Rica | 7 | 0.0% |
| Czechoslovakia | 2 | 0.0% |
| Dominican Republic | 6 | 0.0% |
| Eastern Africa | 2 | 0.0% |
| Eastern Asia | 32 | 0.1% |
| Eastern Europe | 34 | 0.1% |
| Egypt | 8 | 0.0% |
| El Salvador | 4 | 0.0% |
| England | 8 | 0.0% |
| Europe | 106 | 0.2% |
| Germany | 21 | 0.1% |
| Guatemala | 52 | 0.1% |
| Haiti | 3 | 0.0% |
| Honduras | 6 | 0.0% |
| India | 23 | 0.1% |
| Ireland | 20 | 0.0% |
| Jamaica | 11 | 0.0% |
| Japan | 18 | 0.0% |
| Kenya | 2 | 0.0% |
| Laos | 7 | 0.0% |
| Latin America | 285 | 0.6% |
| Malaysia | 6 | 0.0% |
| Mexico | 66 | 0.1% |
| Netherlands | 2 | 0.0% |
| Northern Africa | 8 | 0.0% |
| Northern Europe | 41 | 0.1% |
| Oceania | 7 | 0.0% |
| Pakistan | 5 | 0.0% |
| Peru | 4 | 0.0% |
| Philippines | 1 | 0.0% |
| Poland | 28 | 0.1% |
| Russia | 4 | 0.0% |
| South Africa | 9 | 0.0% |
| South America | 123 | 0.3% |
| South Central Asia | 28 | 0.1% |
| South Eastern Asia | 26 | 0.1% |
| Southern Europe | 8 | 0.0% |
| Spain | 8 | 0.0% |
| Trinidad and Tobago | 7 | 0.0% |
| Uruguay | 85 | 0.2% |
| Venezuela | 5 | 0.0% |
| Vietnam | 12 | 0.0% |
| Western Africa | 28 | 0.1% |
| Western Europe | 23 | 0.1% | View All 52 Rows |
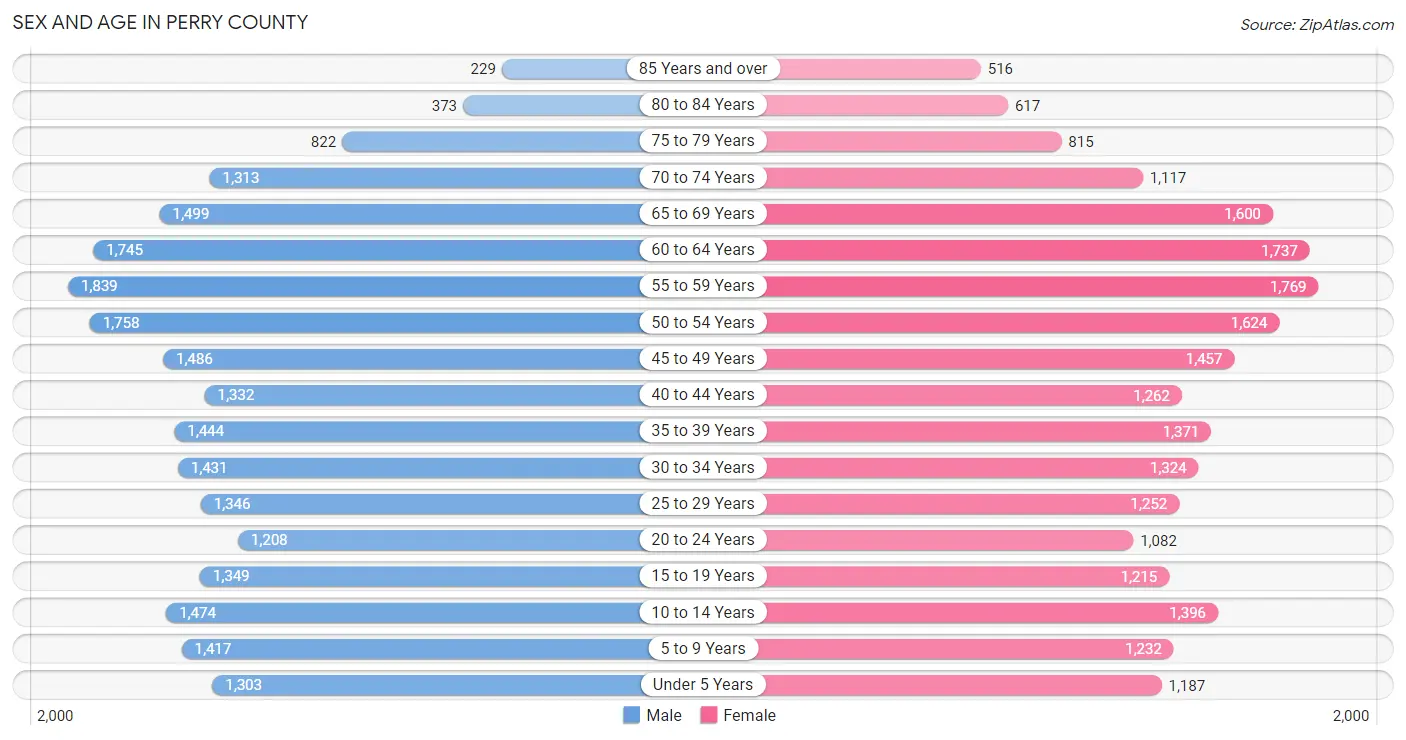
Sex and Age in Perry County
Sex and Age in Perry County
The most populous age groups in Perry County are 55 to 59 Years (1,839 | 7.9%) for men and 55 to 59 Years (1,769 | 7.8%) for women.
| Age Bracket | Male | Female |
| Under 5 Years | 1,303 (5.6%) | 1,187 (5.3%) |
| 5 to 9 Years | 1,417 (6.1%) | 1,232 (5.5%) |
| 10 to 14 Years | 1,474 (6.3%) | 1,396 (6.2%) |
| 15 to 19 Years | 1,349 (5.8%) | 1,215 (5.4%) |
| 20 to 24 Years | 1,208 (5.2%) | 1,082 (4.8%) |
| 25 to 29 Years | 1,346 (5.8%) | 1,252 (5.6%) |
| 30 to 34 Years | 1,431 (6.1%) | 1,324 (5.9%) |
| 35 to 39 Years | 1,444 (6.2%) | 1,371 (6.1%) |
| 40 to 44 Years | 1,332 (5.7%) | 1,262 (5.6%) |
| 45 to 49 Years | 1,486 (6.4%) | 1,457 (6.5%) |
| 50 to 54 Years | 1,758 (7.5%) | 1,624 (7.2%) |
| 55 to 59 Years | 1,839 (7.9%) | 1,769 (7.8%) |
| 60 to 64 Years | 1,745 (7.5%) | 1,737 (7.7%) |
| 65 to 69 Years | 1,499 (6.4%) | 1,600 (7.1%) |
| 70 to 74 Years | 1,313 (5.6%) | 1,117 (5.0%) |
| 75 to 79 Years | 822 (3.5%) | 815 (3.6%) |
| 80 to 84 Years | 373 (1.6%) | 617 (2.7%) |
| 85 Years and over | 229 (1.0%) | 516 (2.3%) |
| Total | 23,368 (100.0%) | 22,573 (100.0%) |
Families and Households in Perry County
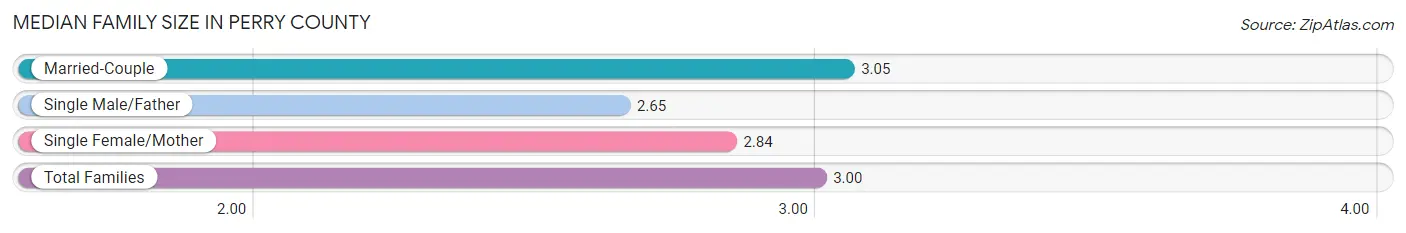
Median Family Size in Perry County
The median family size in Perry County is 3.00 persons per family, with married-couple families (10,152 | 80.6%) accounting for the largest median family size of 3.05 persons per family. On the other hand, single male/father families (893 | 7.1%) represent the smallest median family size with 2.65 persons per family.
| Family Type | # Families | Family Size |
| Married-Couple | 10,152 (80.6%) | 3.05 |
| Single Male/Father | 893 (7.1%) | 2.65 |
| Single Female/Mother | 1,556 (12.3%) | 2.84 |
| Total Families | 12,601 (100.0%) | 3.00 |
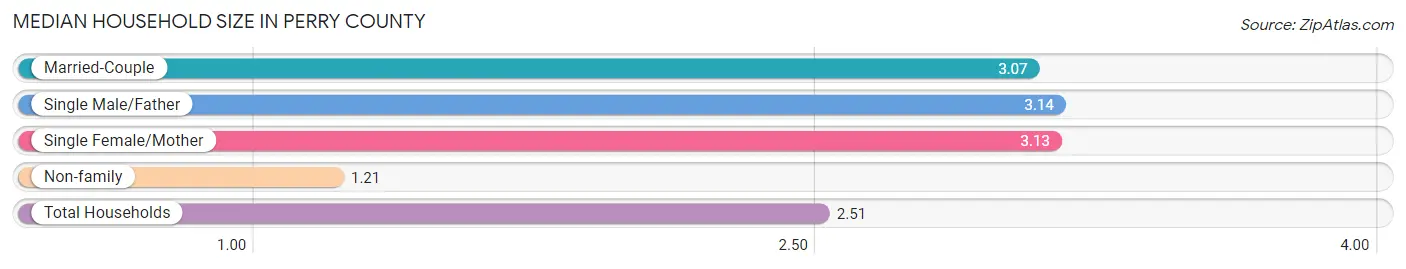
Median Household Size in Perry County
The median household size in Perry County is 2.51 persons per household, with single male/father households (893 | 4.9%) accounting for the largest median household size of 3.14 persons per household. non-family households (5,465 | 30.2%) represent the smallest median household size with 1.21 persons per household.
| Household Type | # Households | Household Size |
| Married-Couple | 10,152 (56.2%) | 3.07 |
| Single Male/Father | 893 (4.9%) | 3.14 |
| Single Female/Mother | 1,556 (8.6%) | 3.13 |
| Non-family | 5,465 (30.2%) | 1.21 |
| Total Households | 18,066 (100.0%) | 2.51 |
Household Size by Marriage Status in Perry County
Out of a total of 18,066 households in Perry County, 12,601 (69.8%) are family households, while 5,465 (30.2%) are nonfamily households. The most numerous type of family households are 2-person households, comprising 6,139, and the most common type of nonfamily households are 1-person households, comprising 4,596.
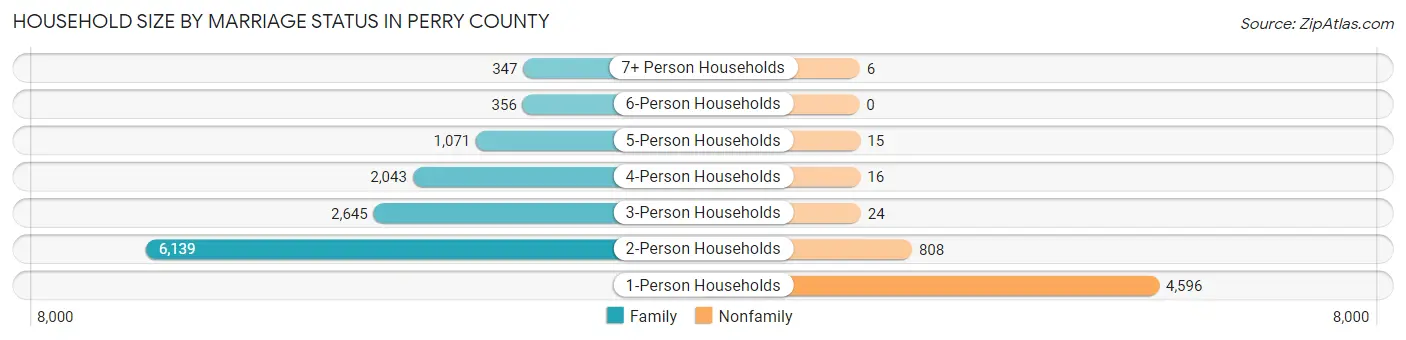
| Household Size | Family Households | Nonfamily Households |
| 1-Person Households | - | 4,596 (25.4%) |
| 2-Person Households | 6,139 (34.0%) | 808 (4.5%) |
| 3-Person Households | 2,645 (14.6%) | 24 (0.1%) |
| 4-Person Households | 2,043 (11.3%) | 16 (0.1%) |
| 5-Person Households | 1,071 (5.9%) | 15 (0.1%) |
| 6-Person Households | 356 (2.0%) | 0 (0.0%) |
| 7+ Person Households | 347 (1.9%) | 6 (0.0%) |
| Total | 12,601 (69.8%) | 5,465 (30.2%) |
Female Fertility in Perry County
Fertility by Age in Perry County
Average fertility rate in Perry County is 60.0 births per 1,000 women. Women in the age bracket of 20 to 34 years have the highest fertility rate with 122.0 births per 1,000 women. Women in the age bracket of 20 to 34 years acount for 80.1% of all women with births.
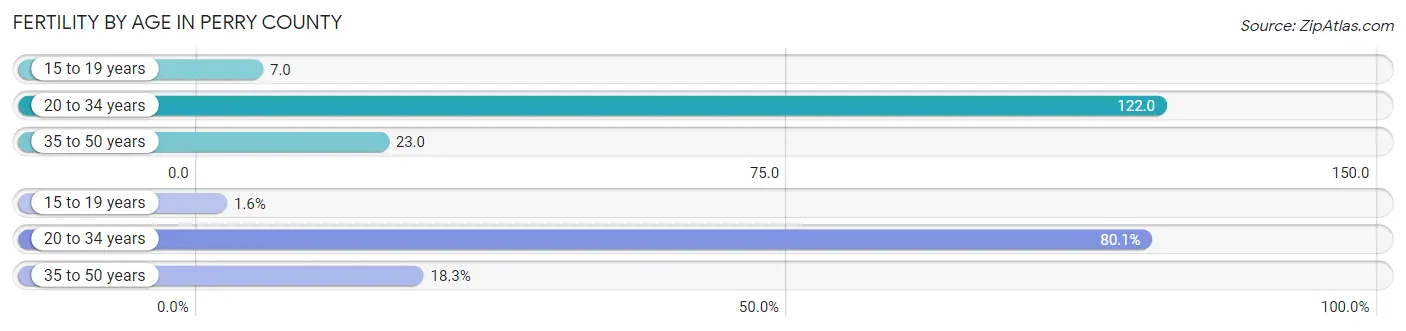
| Age Bracket | Women with Births | Births / 1,000 Women |
| 15 to 19 years | 9 (1.6%) | 7.0 |
| 20 to 34 years | 447 (80.1%) | 122.0 |
| 35 to 50 years | 102 (18.3%) | 23.0 |
| Total | 558 (100.0%) | 60.0 |
Fertility by Age by Marriage Status in Perry County
83.7% of women with births (558) in Perry County are married. The highest percentage of unmarried women with births falls into 15 to 19 years age bracket with 100.0% of them unmarried at the time of birth, while the lowest percentage of unmarried women with births belong to 20 to 34 years age bracket with 13.0% of them unmarried.
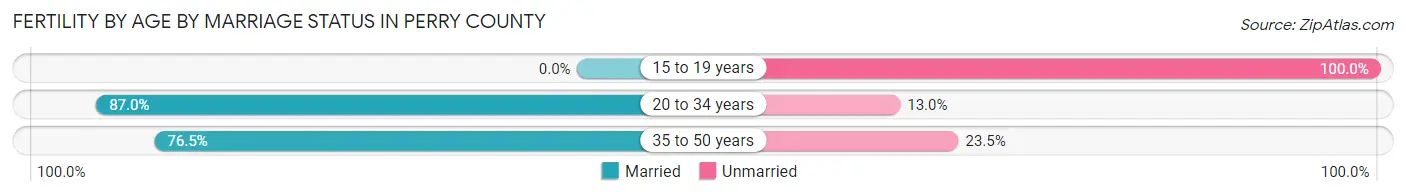
| Age Bracket | Married | Unmarried |
| 15 to 19 years | 0 (0.0%) | 9 (100.0%) |
| 20 to 34 years | 389 (87.0%) | 58 (13.0%) |
| 35 to 50 years | 78 (76.5%) | 24 (23.5%) |
| Total | 467 (83.7%) | 91 (16.3%) |
Fertility by Education in Perry County
Average fertility rate in Perry County is 60.0 births per 1,000 women. Women with the education attainment of less than high school have the highest fertility rate of 89.0 births per 1,000 women, while women with the education attainment of bachelor's degree have the lowest fertility at 29.0 births per 1,000 women. Women with the education attainment of college or associate's degree represent 32.4% of all women with births.
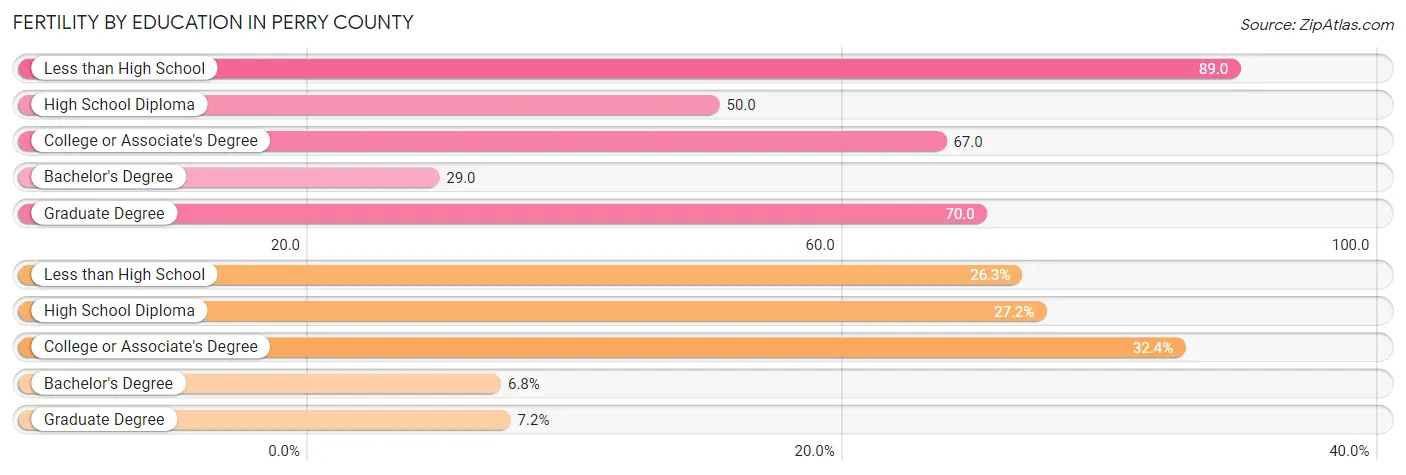
| Educational Attainment | Women with Births | Births / 1,000 Women |
| Less than High School | 147 (26.3%) | 89.0 |
| High School Diploma | 152 (27.2%) | 50.0 |
| College or Associate's Degree | 181 (32.4%) | 67.0 |
| Bachelor's Degree | 38 (6.8%) | 29.0 |
| Graduate Degree | 40 (7.2%) | 70.0 |
| Total | 558 (100.0%) | 60.0 |
Fertility by Education by Marriage Status in Perry County
16.3% of women with births in Perry County are unmarried. Women with the educational attainment of bachelor's degree are most likely to be married with 100.0% of them married at childbirth, while women with the educational attainment of high school diploma are least likely to be married with 27.0% of them unmarried at childbirth.
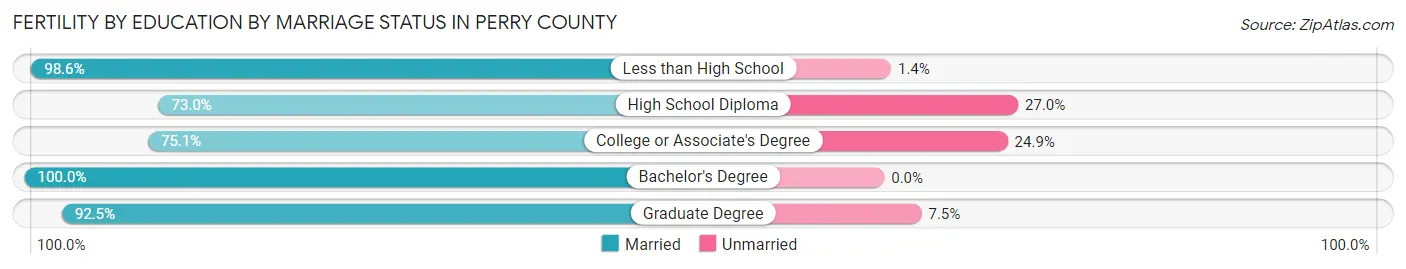
| Educational Attainment | Married | Unmarried |
| Less than High School | 145 (98.6%) | 2 (1.4%) |
| High School Diploma | 111 (73.0%) | 41 (27.0%) |
| College or Associate's Degree | 136 (75.1%) | 45 (24.9%) |
| Bachelor's Degree | 38 (100.0%) | 0 (0.0%) |
| Graduate Degree | 37 (92.5%) | 3 (7.5%) |
| Total | 467 (83.7%) | 91 (16.3%) |
Employment Characteristics in Perry County
Employment by Class of Employer in Perry County
Among the 22,091 employed individuals in Perry County, private company employees (14,936 | 67.6%), not-for-profit organizations (2,032 | 9.2%), and self-employed (not incorporated) (1,476 | 6.7%) make up the most common classes of employment.
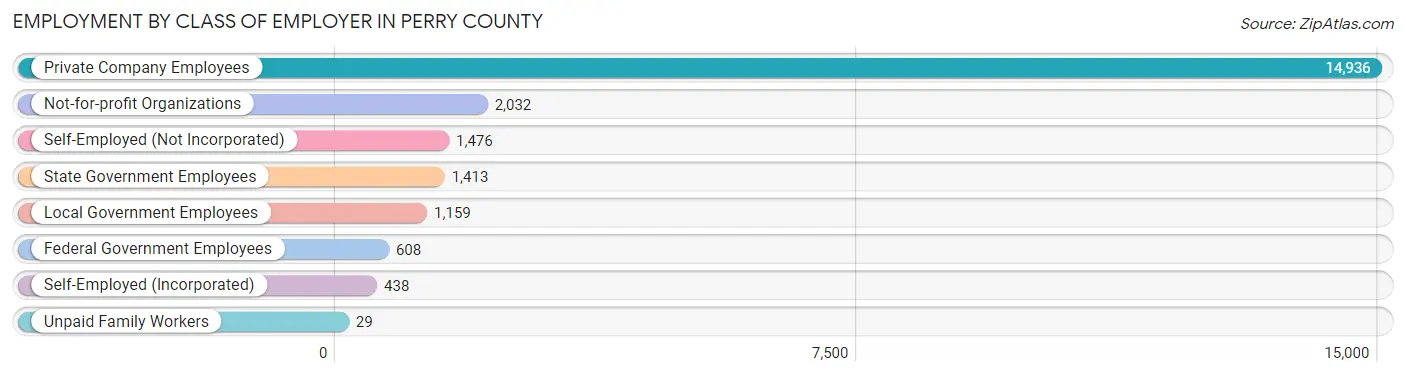
| Employer Class | # Employees | % Employees |
| Private Company Employees | 14,936 | 67.6% |
| Self-Employed (Incorporated) | 438 | 2.0% |
| Self-Employed (Not Incorporated) | 1,476 | 6.7% |
| Not-for-profit Organizations | 2,032 | 9.2% |
| Local Government Employees | 1,159 | 5.2% |
| State Government Employees | 1,413 | 6.4% |
| Federal Government Employees | 608 | 2.8% |
| Unpaid Family Workers | 29 | 0.1% |
| Total | 22,091 | 100.0% |
Employment Status by Age in Perry County
According to the labor force statistics for Perry County, out of the total population over 16 years of age (37,380), 62.0% or 23,176 individuals are in the labor force, with 3.4% or 788 of them unemployed. The age group with the highest labor force participation rate is 20 to 24 years, with 85.5% or 1,958 individuals in the labor force. Within the labor force, the 75 years and over age range has the highest percentage of unemployed individuals, with 6.5% or 10 of them being unemployed.
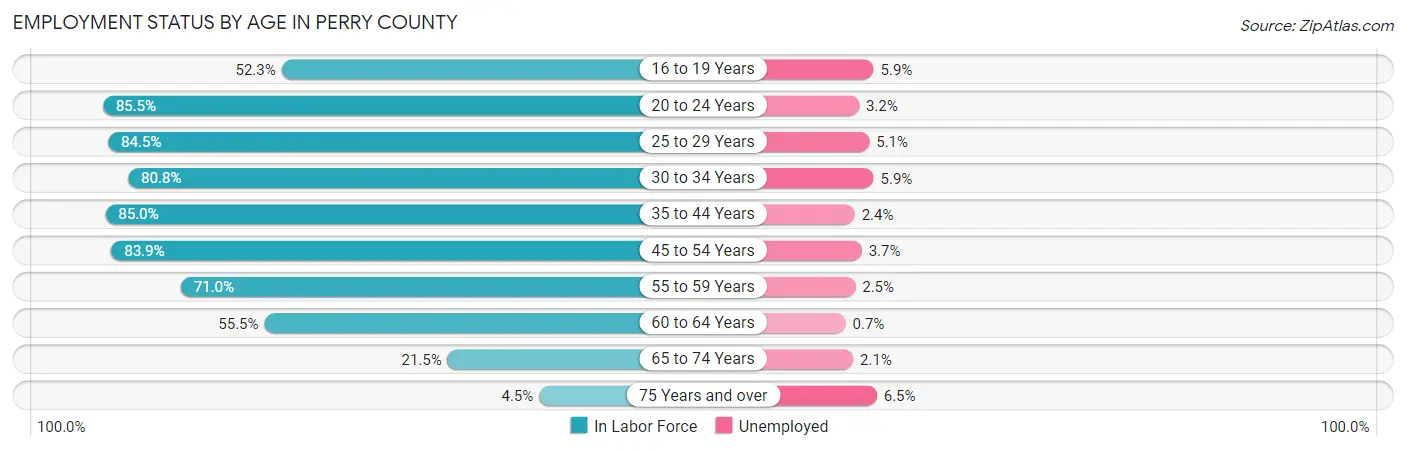
| Age Bracket | In Labor Force | Unemployed |
| 16 to 19 Years | 1,052 (52.3%) | 62 (5.9%) |
| 20 to 24 Years | 1,958 (85.5%) | 63 (3.2%) |
| 25 to 29 Years | 2,195 (84.5%) | 112 (5.1%) |
| 30 to 34 Years | 2,226 (80.8%) | 131 (5.9%) |
| 35 to 44 Years | 4,598 (85.0%) | 110 (2.4%) |
| 45 to 54 Years | 5,307 (83.9%) | 196 (3.7%) |
| 55 to 59 Years | 2,562 (71.0%) | 64 (2.5%) |
| 60 to 64 Years | 1,933 (55.5%) | 14 (0.7%) |
| 65 to 74 Years | 1,189 (21.5%) | 25 (2.1%) |
| 75 Years and over | 152 (4.5%) | 10 (6.5%) |
| Total | 23,176 (62.0%) | 788 (3.4%) |
Employment Status by Educational Attainment in Perry County
According to labor force statistics for Perry County, 77.9% of individuals (18,834) out of the total population between 25 and 64 years of age (24,177) are in the labor force, with 3.3% or 622 of them being unemployed. The group with the highest labor force participation rate are those with the educational attainment of bachelor's degree or higher, with 89.1% or 4,116 individuals in the labor force. Within the labor force, individuals with high school diploma education have the highest percentage of unemployment, with 4.5% or 358 of them being unemployed.
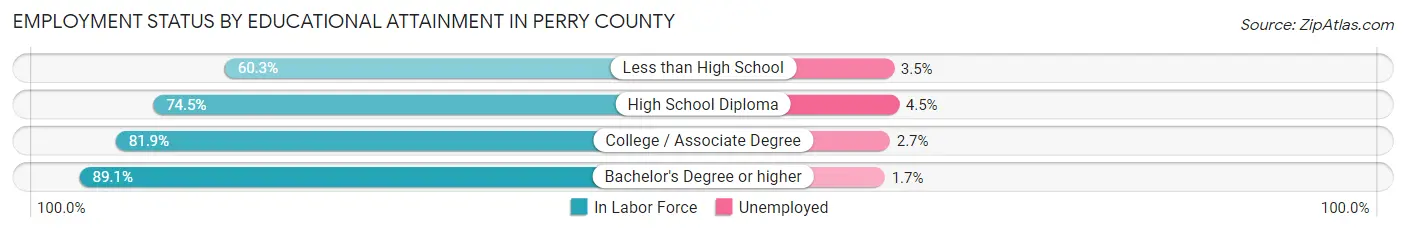
| Educational Attainment | In Labor Force | Unemployed |
| Less than High School | 1,439 (60.3%) | 84 (3.5%) |
| High School Diploma | 7,958 (74.5%) | 481 (4.5%) |
| College / Associate Degree | 5,314 (81.9%) | 175 (2.7%) |
| Bachelor's Degree or higher | 4,116 (89.1%) | 79 (1.7%) |
| Total | 18,834 (77.9%) | 798 (3.3%) |
Employment Occupations by Sex in Perry County
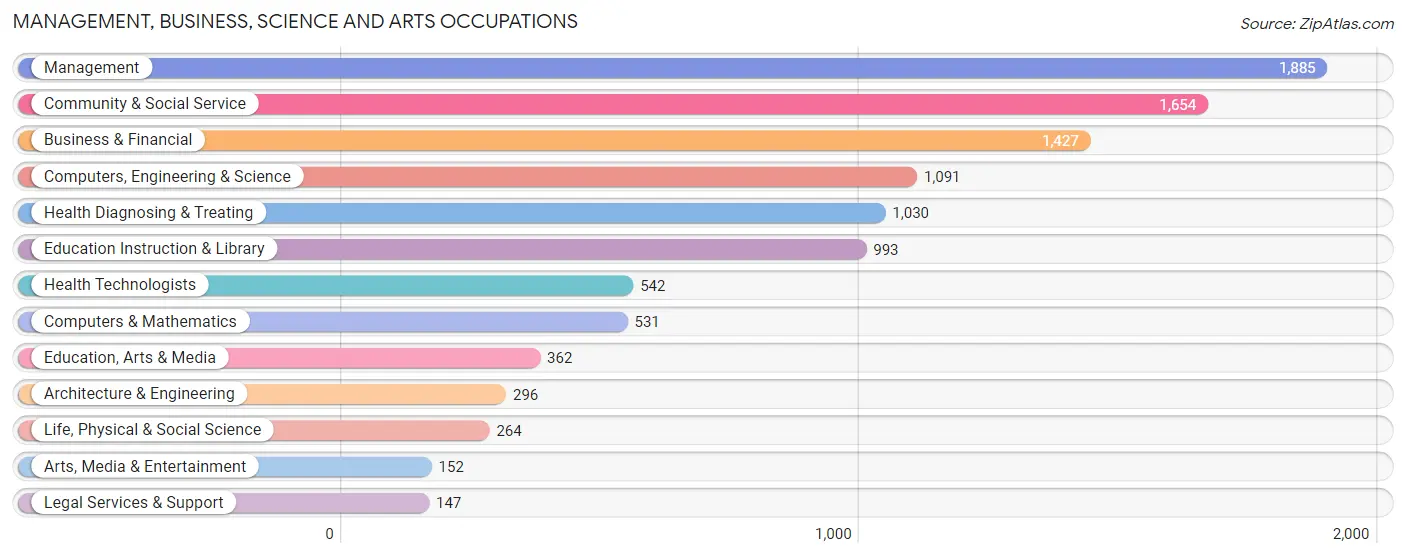
Management, Business, Science and Arts Occupations
The most common Management, Business, Science and Arts occupations in Perry County are Management (1,885 | 8.4%), Community & Social Service (1,654 | 7.4%), Business & Financial (1,427 | 6.4%), Computers, Engineering & Science (1,091 | 4.9%), and Health Diagnosing & Treating (1,030 | 4.6%).
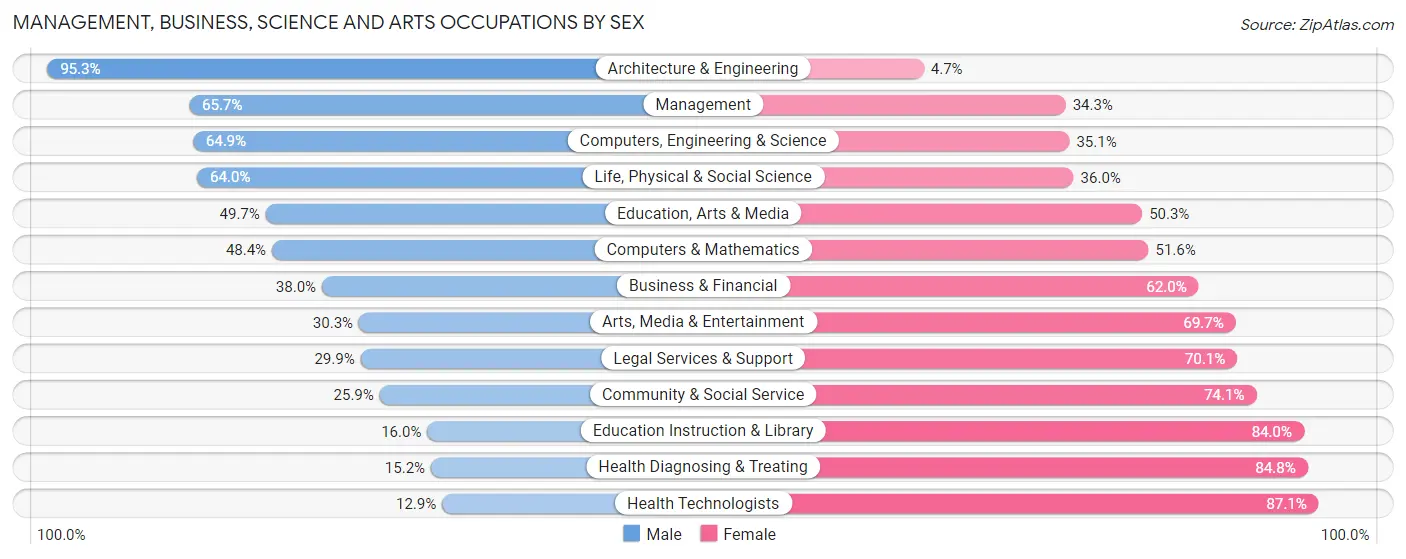
Management, Business, Science and Arts Occupations by Sex
Within the Management, Business, Science and Arts occupations in Perry County, the most male-oriented occupations are Architecture & Engineering (95.3%), Management (65.7%), and Computers, Engineering & Science (64.9%), while the most female-oriented occupations are Health Technologists (87.1%), Health Diagnosing & Treating (84.8%), and Education Instruction & Library (84.0%).
| Occupation | Male | Female |
| Management | 1,238 (65.7%) | 647 (34.3%) |
| Business & Financial | 542 (38.0%) | 885 (62.0%) |
| Computers, Engineering & Science | 708 (64.9%) | 383 (35.1%) |
| Computers & Mathematics | 257 (48.4%) | 274 (51.6%) |
| Architecture & Engineering | 282 (95.3%) | 14 (4.7%) |
| Life, Physical & Social Science | 169 (64.0%) | 95 (36.0%) |
| Community & Social Service | 429 (25.9%) | 1,225 (74.1%) |
| Education, Arts & Media | 180 (49.7%) | 182 (50.3%) |
| Legal Services & Support | 44 (29.9%) | 103 (70.1%) |
| Education Instruction & Library | 159 (16.0%) | 834 (84.0%) |
| Arts, Media & Entertainment | 46 (30.3%) | 106 (69.7%) |
| Health Diagnosing & Treating | 157 (15.2%) | 873 (84.8%) |
| Health Technologists | 70 (12.9%) | 472 (87.1%) |
| Total (Category) | 3,074 (43.4%) | 4,013 (56.6%) |
| Total (Overall) | 12,224 (54.7%) | 10,122 (45.3%) |
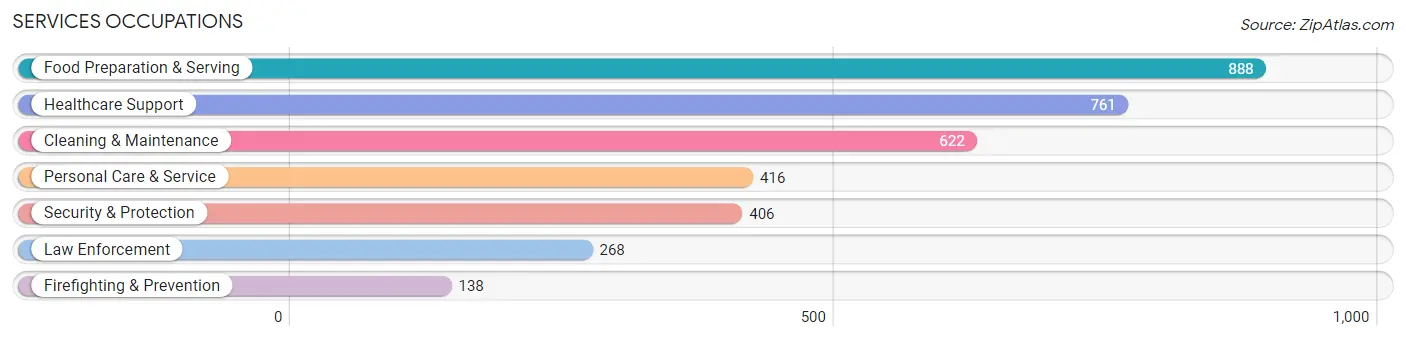
Services Occupations
The most common Services occupations in Perry County are Food Preparation & Serving (888 | 4.0%), Healthcare Support (761 | 3.4%), Cleaning & Maintenance (622 | 2.8%), Personal Care & Service (416 | 1.9%), and Security & Protection (406 | 1.8%).
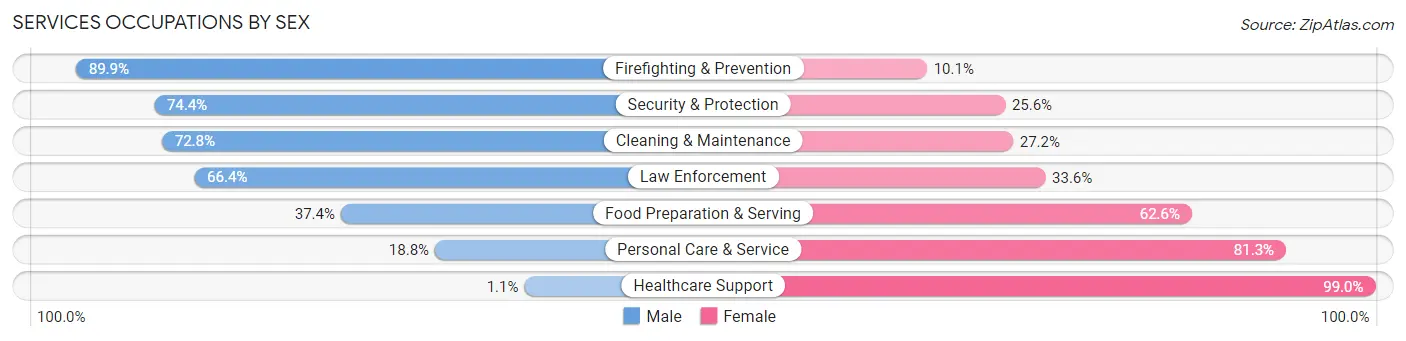
Services Occupations by Sex
Within the Services occupations in Perry County, the most male-oriented occupations are Firefighting & Prevention (89.9%), Security & Protection (74.4%), and Cleaning & Maintenance (72.8%), while the most female-oriented occupations are Healthcare Support (99.0%), Personal Care & Service (81.2%), and Food Preparation & Serving (62.6%).
| Occupation | Male | Female |
| Healthcare Support | 8 (1.1%) | 753 (99.0%) |
| Security & Protection | 302 (74.4%) | 104 (25.6%) |
| Firefighting & Prevention | 124 (89.9%) | 14 (10.1%) |
| Law Enforcement | 178 (66.4%) | 90 (33.6%) |
| Food Preparation & Serving | 332 (37.4%) | 556 (62.6%) |
| Cleaning & Maintenance | 453 (72.8%) | 169 (27.2%) |
| Personal Care & Service | 78 (18.8%) | 338 (81.2%) |
| Total (Category) | 1,173 (37.9%) | 1,920 (62.1%) |
| Total (Overall) | 12,224 (54.7%) | 10,122 (45.3%) |
Sales and Office Occupations
The most common Sales and Office occupations in Perry County are Office & Administration (2,933 | 13.1%), and Sales & Related (1,431 | 6.4%).
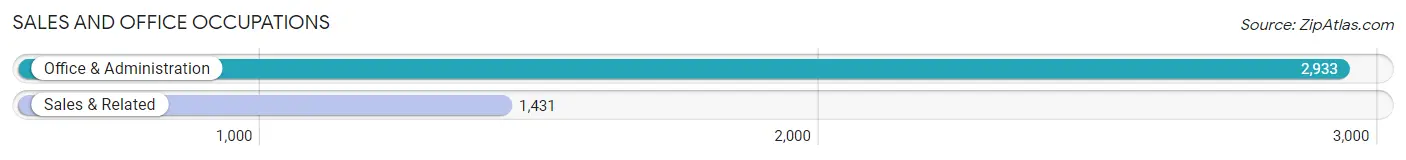
Sales and Office Occupations by Sex

| Occupation | Male | Female |
| Sales & Related | 588 (41.1%) | 843 (58.9%) |
| Office & Administration | 511 (17.4%) | 2,422 (82.6%) |
| Total (Category) | 1,099 (25.2%) | 3,265 (74.8%) |
| Total (Overall) | 12,224 (54.7%) | 10,122 (45.3%) |
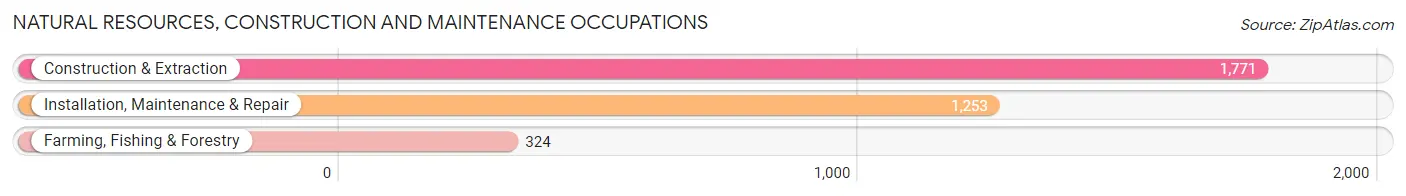
Natural Resources, Construction and Maintenance Occupations
The most common Natural Resources, Construction and Maintenance occupations in Perry County are Construction & Extraction (1,771 | 7.9%), Installation, Maintenance & Repair (1,253 | 5.6%), and Farming, Fishing & Forestry (324 | 1.5%).
Natural Resources, Construction and Maintenance Occupations by Sex
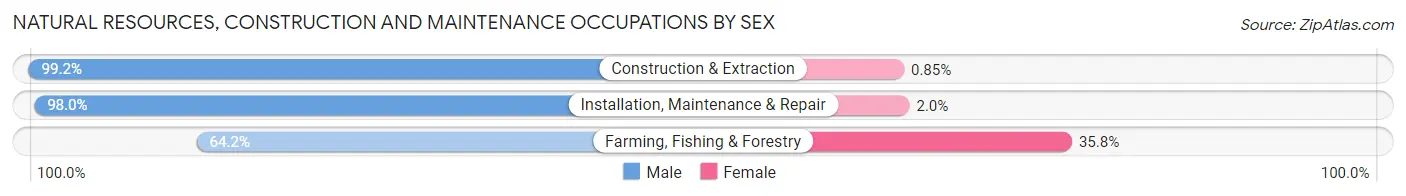
| Occupation | Male | Female |
| Farming, Fishing & Forestry | 208 (64.2%) | 116 (35.8%) |
| Construction & Extraction | 1,756 (99.2%) | 15 (0.9%) |
| Installation, Maintenance & Repair | 1,228 (98.0%) | 25 (2.0%) |
| Total (Category) | 3,192 (95.3%) | 156 (4.7%) |
| Total (Overall) | 12,224 (54.7%) | 10,122 (45.3%) |
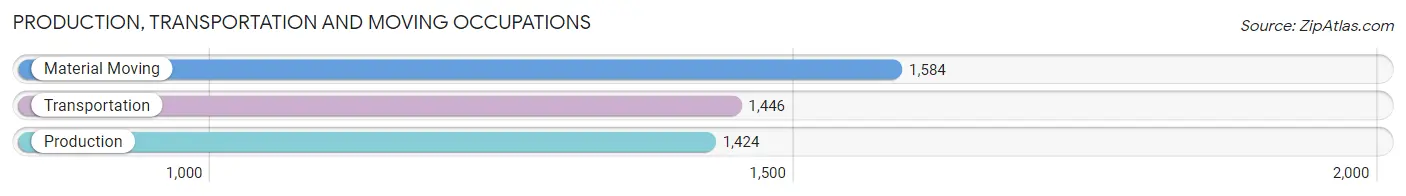
Production, Transportation and Moving Occupations
The most common Production, Transportation and Moving occupations in Perry County are Material Moving (1,584 | 7.1%), Transportation (1,446 | 6.5%), and Production (1,424 | 6.4%).
Production, Transportation and Moving Occupations by Sex
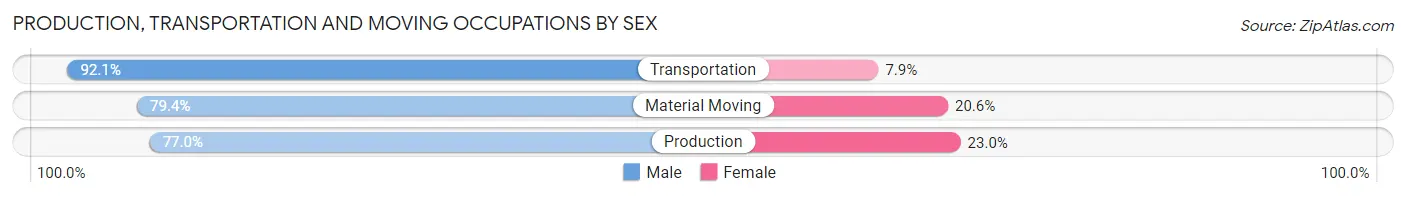
| Occupation | Male | Female |
| Production | 1,097 (77.0%) | 327 (23.0%) |
| Transportation | 1,332 (92.1%) | 114 (7.9%) |
| Material Moving | 1,257 (79.4%) | 327 (20.6%) |
| Total (Category) | 3,686 (82.8%) | 768 (17.2%) |
| Total (Overall) | 12,224 (54.7%) | 10,122 (45.3%) |
Employment Industries by Sex in Perry County
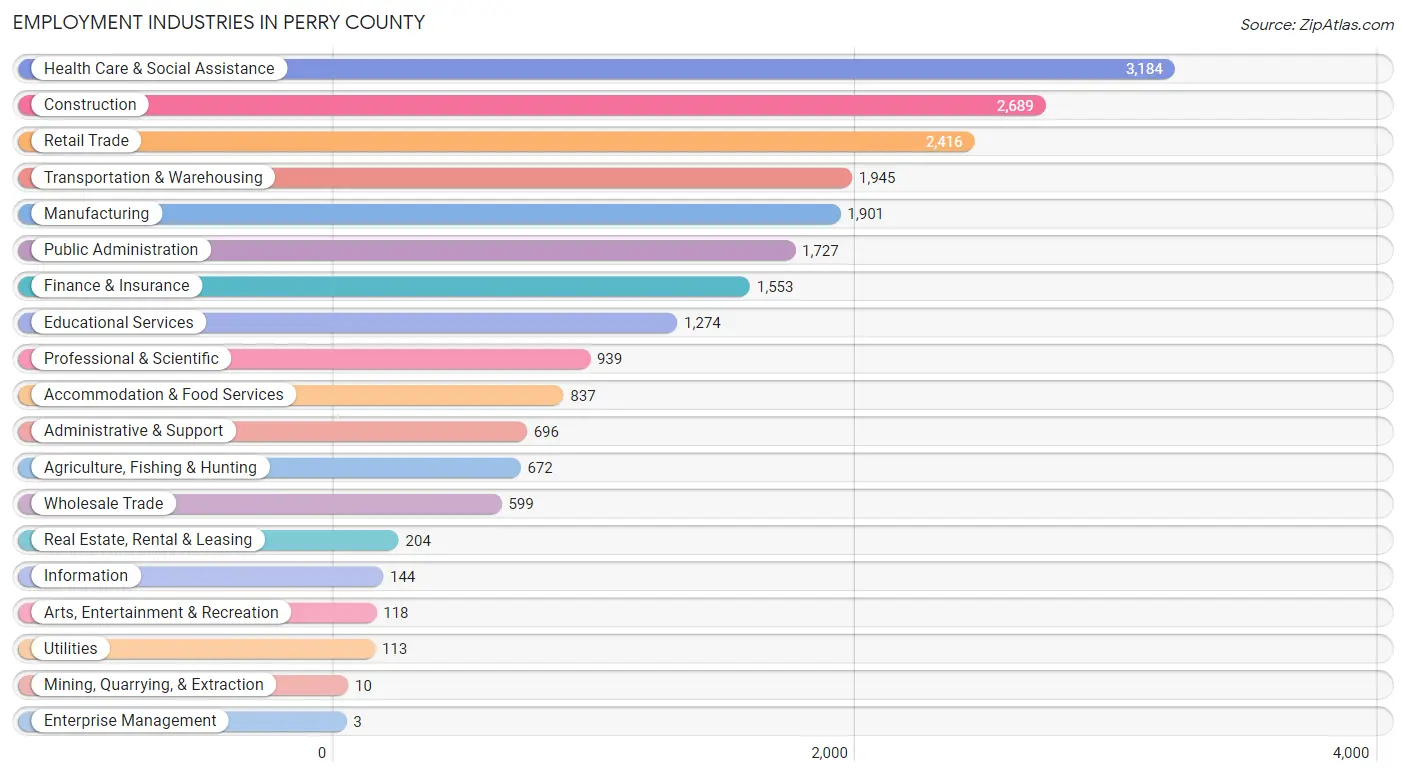
Employment Industries in Perry County
The major employment industries in Perry County include Health Care & Social Assistance (3,184 | 14.2%), Construction (2,689 | 12.0%), Retail Trade (2,416 | 10.8%), Transportation & Warehousing (1,945 | 8.7%), and Manufacturing (1,901 | 8.5%).
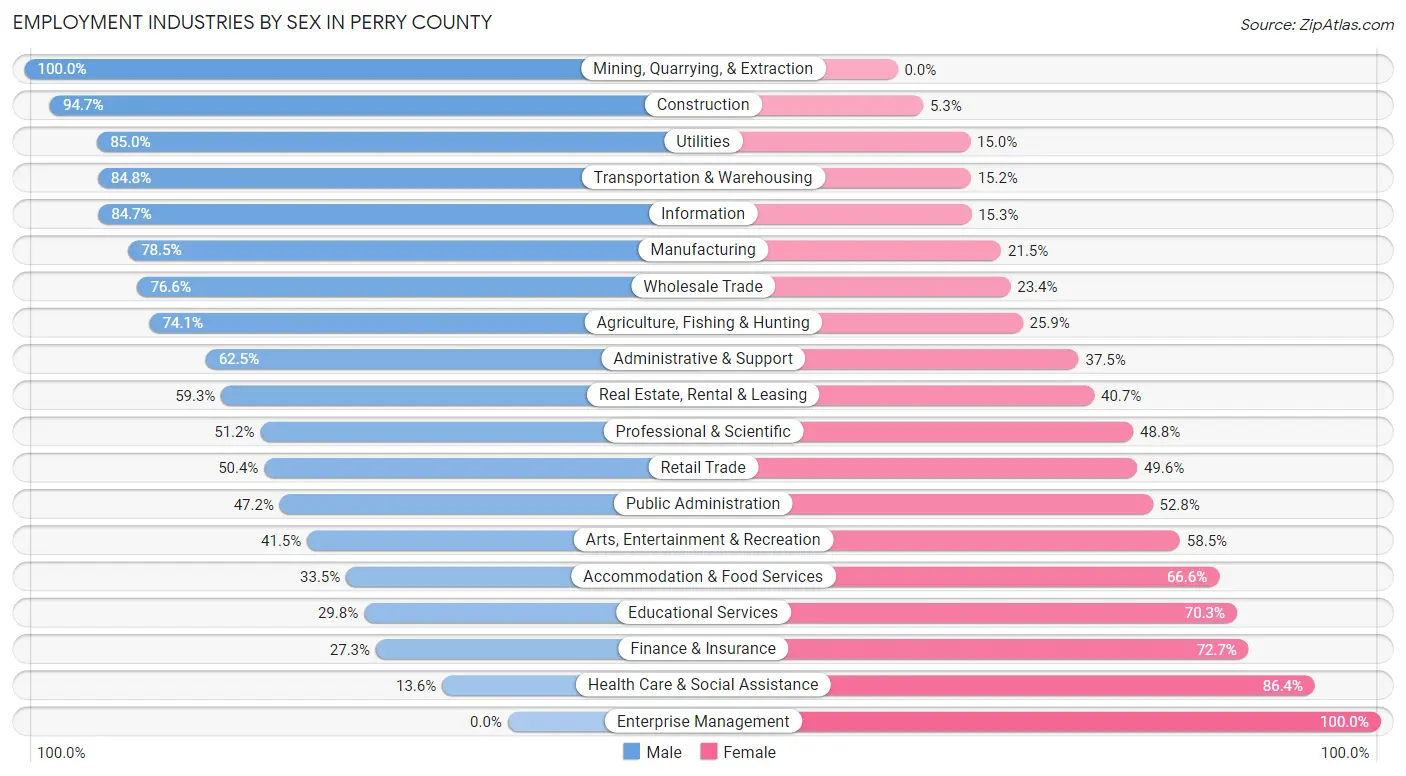
Employment Industries by Sex in Perry County
The Perry County industries that see more men than women are Mining, Quarrying, & Extraction (100.0%), Construction (94.7%), and Utilities (85.0%), whereas the industries that tend to have a higher number of women are Enterprise Management (100.0%), Health Care & Social Assistance (86.4%), and Finance & Insurance (72.7%).
| Industry | Male | Female |
| Agriculture, Fishing & Hunting | 498 (74.1%) | 174 (25.9%) |
| Mining, Quarrying, & Extraction | 10 (100.0%) | 0 (0.0%) |
| Construction | 2,547 (94.7%) | 142 (5.3%) |
| Manufacturing | 1,493 (78.5%) | 408 (21.5%) |
| Wholesale Trade | 459 (76.6%) | 140 (23.4%) |
| Retail Trade | 1,218 (50.4%) | 1,198 (49.6%) |
| Transportation & Warehousing | 1,650 (84.8%) | 295 (15.2%) |
| Utilities | 96 (85.0%) | 17 (15.0%) |
| Information | 122 (84.7%) | 22 (15.3%) |
| Finance & Insurance | 424 (27.3%) | 1,129 (72.7%) |
| Real Estate, Rental & Leasing | 121 (59.3%) | 83 (40.7%) |
| Professional & Scientific | 481 (51.2%) | 458 (48.8%) |
| Enterprise Management | 0 (0.0%) | 3 (100.0%) |
| Administrative & Support | 435 (62.5%) | 261 (37.5%) |
| Educational Services | 379 (29.7%) | 895 (70.3%) |
| Health Care & Social Assistance | 433 (13.6%) | 2,751 (86.4%) |
| Arts, Entertainment & Recreation | 49 (41.5%) | 69 (58.5%) |
| Accommodation & Food Services | 280 (33.5%) | 557 (66.5%) |
| Public Administration | 815 (47.2%) | 912 (52.8%) |
| Total | 12,224 (54.7%) | 10,122 (45.3%) |
Education in Perry County
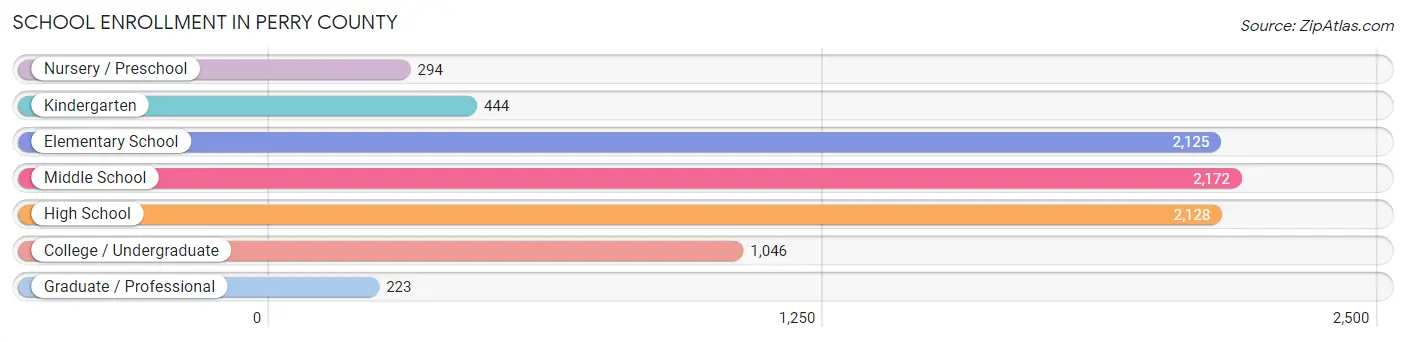
School Enrollment in Perry County
The most common levels of schooling among the 8,432 students in Perry County are middle school (2,172 | 25.8%), high school (2,128 | 25.2%), and elementary school (2,125 | 25.2%).
| School Level | # Students | % Students |
| Nursery / Preschool | 294 | 3.5% |
| Kindergarten | 444 | 5.3% |
| Elementary School | 2,125 | 25.2% |
| Middle School | 2,172 | 25.8% |
| High School | 2,128 | 25.2% |
| College / Undergraduate | 1,046 | 12.4% |
| Graduate / Professional | 223 | 2.6% |
| Total | 8,432 | 100.0% |
School Enrollment by Age by Funding Source in Perry County
Out of a total of 8,432 students who are enrolled in schools in Perry County, 1,779 (21.1%) attend a private institution, while the remaining 6,653 (78.9%) are enrolled in public schools. The age group of 35 years and over has the highest likelihood of being enrolled in private schools, with 146 (36.7% in the age bracket) enrolled. Conversely, the age group of 15 to 17 year olds has the lowest likelihood of being enrolled in a private school, with 1,283 (88.6% in the age bracket) attending a public institution.
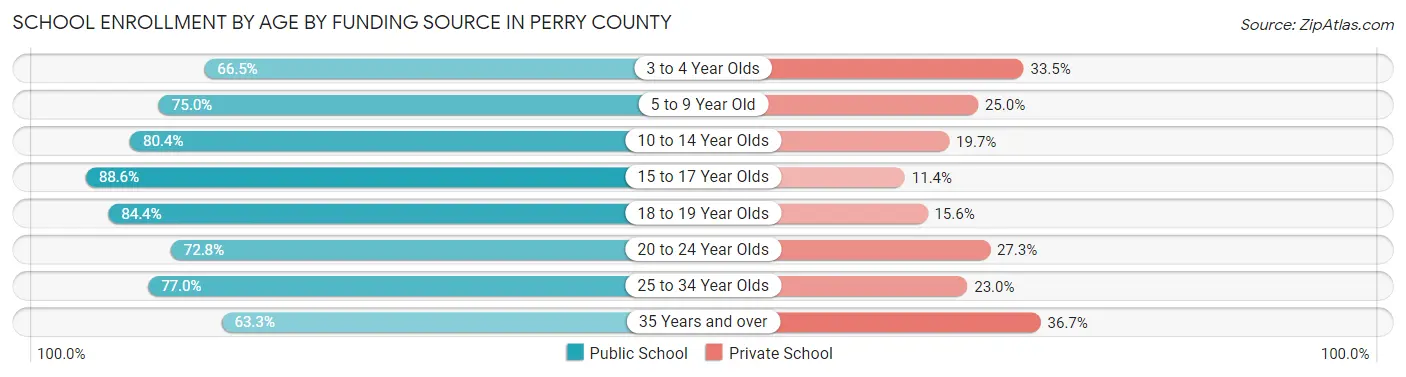
| Age Bracket | Public School | Private School |
| 3 to 4 Year Olds | 131 (66.5%) | 66 (33.5%) |
| 5 to 9 Year Old | 1,750 (75.0%) | 584 (25.0%) |
| 10 to 14 Year Olds | 2,253 (80.3%) | 551 (19.7%) |
| 15 to 17 Year Olds | 1,283 (88.6%) | 165 (11.4%) |
| 18 to 19 Year Olds | 438 (84.4%) | 81 (15.6%) |
| 20 to 24 Year Olds | 283 (72.8%) | 106 (27.3%) |
| 25 to 34 Year Olds | 264 (77.0%) | 79 (23.0%) |
| 35 Years and over | 252 (63.3%) | 146 (36.7%) |
| Total | 6,653 (78.9%) | 1,779 (21.1%) |
Educational Attainment by Field of Study in Perry County
Business (1,202 | 18.7%), education (1,110 | 17.3%), science & technology (752 | 11.7%), arts & humanities (537 | 8.4%), and bio, nature & agricultural (524 | 8.2%) are the most common fields of study among 6,417 individuals in Perry County who have obtained a bachelor's degree or higher.
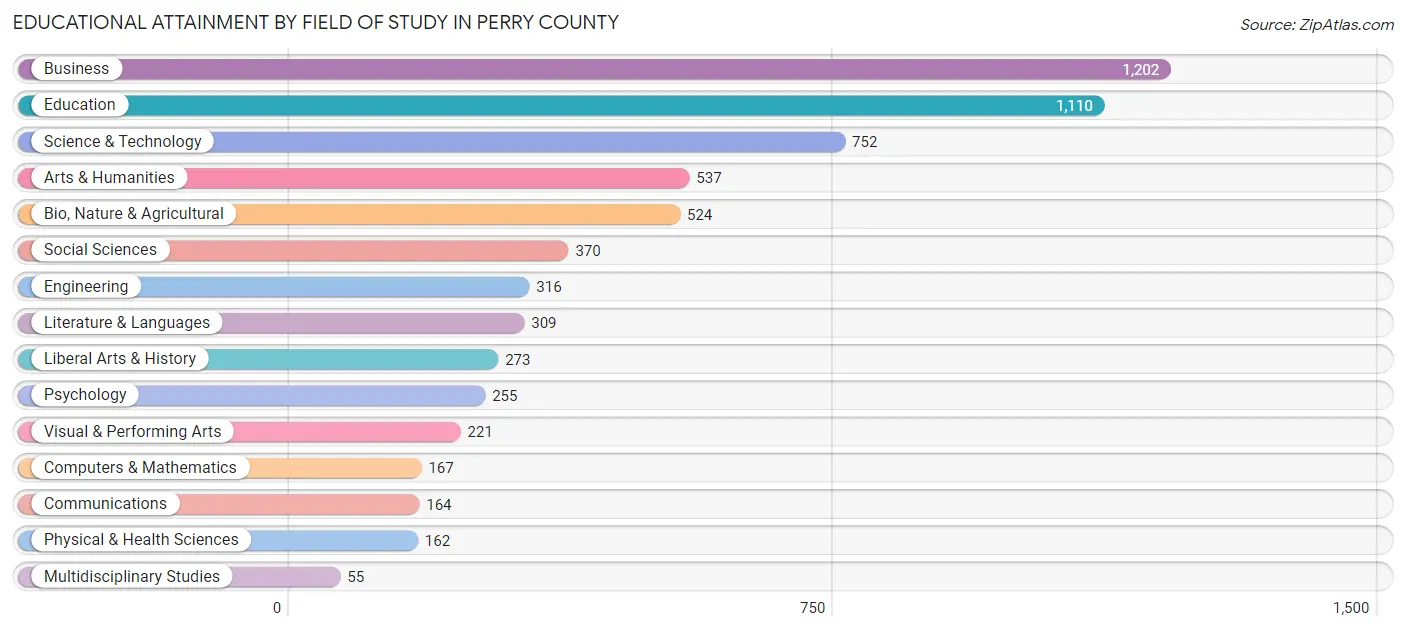
| Field of Study | # Graduates | % Graduates |
| Computers & Mathematics | 167 | 2.6% |
| Bio, Nature & Agricultural | 524 | 8.2% |
| Physical & Health Sciences | 162 | 2.5% |
| Psychology | 255 | 4.0% |
| Social Sciences | 370 | 5.8% |
| Engineering | 316 | 4.9% |
| Multidisciplinary Studies | 55 | 0.9% |
| Science & Technology | 752 | 11.7% |
| Business | 1,202 | 18.7% |
| Education | 1,110 | 17.3% |
| Literature & Languages | 309 | 4.8% |
| Liberal Arts & History | 273 | 4.3% |
| Visual & Performing Arts | 221 | 3.4% |
| Communications | 164 | 2.6% |
| Arts & Humanities | 537 | 8.4% |
| Total | 6,417 | 100.0% |
Transportation & Commute in Perry County
Vehicle Availability by Sex in Perry County
The most prevalent vehicle ownership categories in Perry County are males with 2 vehicles (4,065, accounting for 33.8%) and females with 2 vehicles (3,472, making up 40.7%).
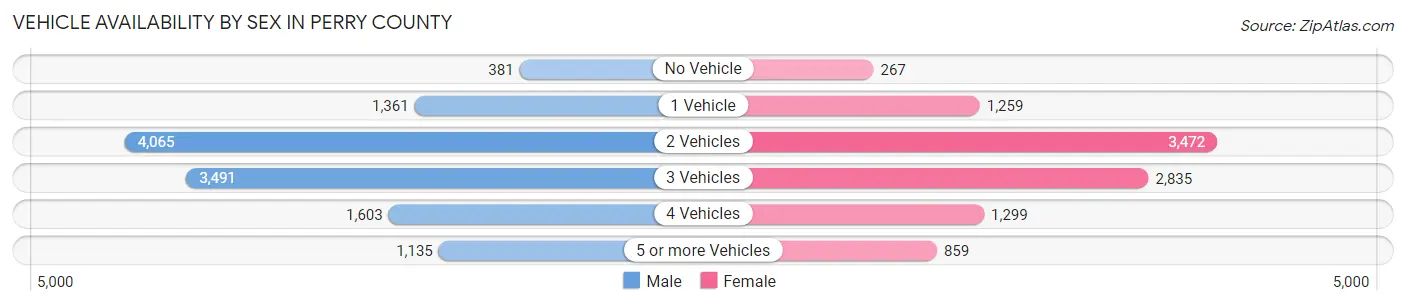
| Vehicles Available | Male | Female |
| No Vehicle | 381 (3.2%) | 267 (2.7%) |
| 1 Vehicle | 1,361 (11.3%) | 1,259 (12.6%) |
| 2 Vehicles | 4,065 (33.8%) | 3,472 (34.7%) |
| 3 Vehicles | 3,491 (29.0%) | 2,835 (28.4%) |
| 4 Vehicles | 1,603 (13.3%) | 1,299 (13.0%) |
| 5 or more Vehicles | 1,135 (9.4%) | 859 (8.6%) |
| Total | 12,036 (100.0%) | 9,991 (100.0%) |
Commute Time in Perry County
The most frequently occuring commute durations in Perry County are 45 to 59 minutes (3,443 commuters, 17.4%), 30 to 34 minutes (3,174 commuters, 16.0%), and 20 to 24 minutes (1,895 commuters, 9.6%).
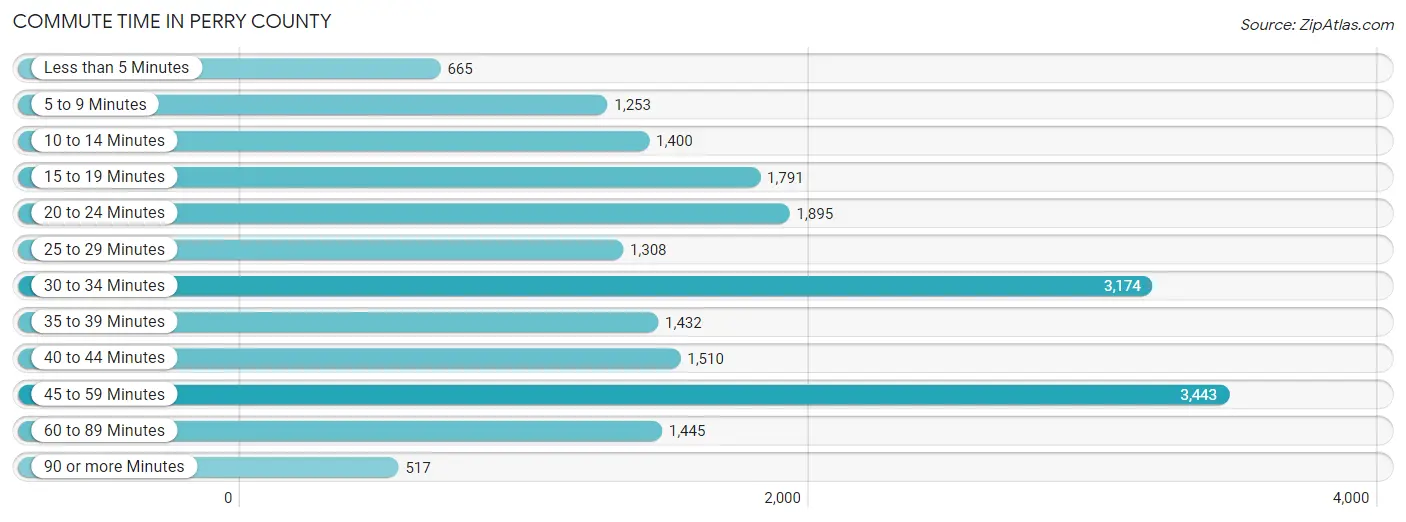
| Commute Time | # Commuters | % Commuters |
| Less than 5 Minutes | 665 | 3.4% |
| 5 to 9 Minutes | 1,253 | 6.3% |
| 10 to 14 Minutes | 1,400 | 7.1% |
| 15 to 19 Minutes | 1,791 | 9.0% |
| 20 to 24 Minutes | 1,895 | 9.6% |
| 25 to 29 Minutes | 1,308 | 6.6% |
| 30 to 34 Minutes | 3,174 | 16.0% |
| 35 to 39 Minutes | 1,432 | 7.2% |
| 40 to 44 Minutes | 1,510 | 7.6% |
| 45 to 59 Minutes | 3,443 | 17.4% |
| 60 to 89 Minutes | 1,445 | 7.3% |
| 90 or more Minutes | 517 | 2.6% |
Commute Time by Sex in Perry County
The most common commute times in Perry County are 45 to 59 minutes (2,089 commuters, 18.9%) for males and 45 to 59 minutes (1,354 commuters, 15.4%) for females.
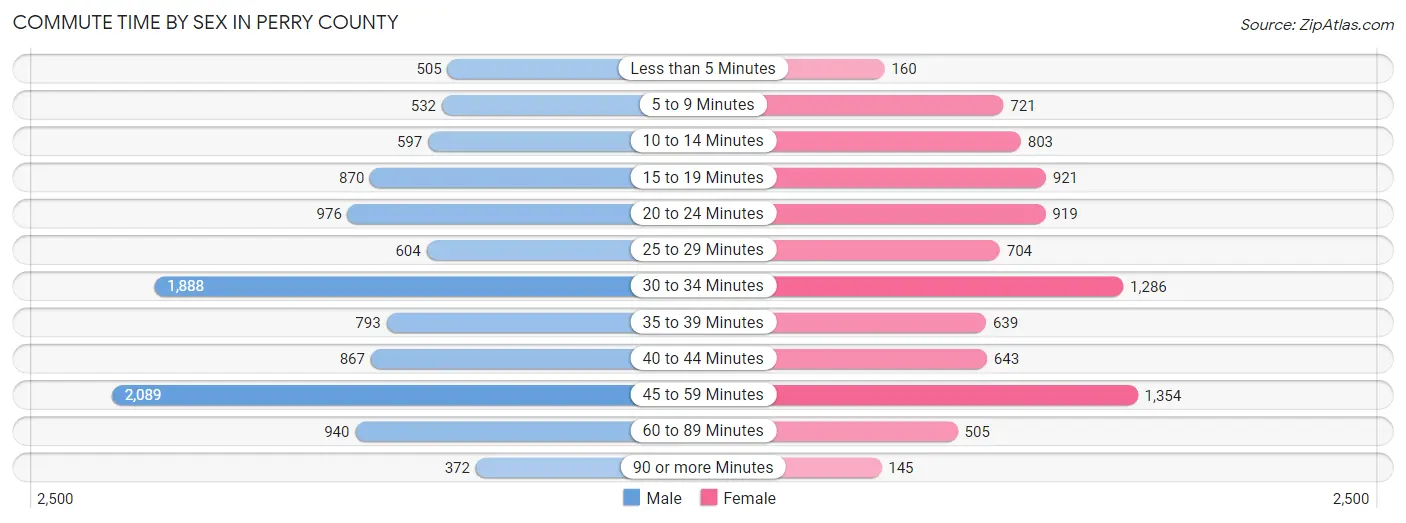
| Commute Time | Male | Female |
| Less than 5 Minutes | 505 (4.6%) | 160 (1.8%) |
| 5 to 9 Minutes | 532 (4.8%) | 721 (8.2%) |
| 10 to 14 Minutes | 597 (5.4%) | 803 (9.1%) |
| 15 to 19 Minutes | 870 (7.9%) | 921 (10.5%) |
| 20 to 24 Minutes | 976 (8.8%) | 919 (10.4%) |
| 25 to 29 Minutes | 604 (5.5%) | 704 (8.0%) |
| 30 to 34 Minutes | 1,888 (17.1%) | 1,286 (14.6%) |
| 35 to 39 Minutes | 793 (7.2%) | 639 (7.3%) |
| 40 to 44 Minutes | 867 (7.9%) | 643 (7.3%) |
| 45 to 59 Minutes | 2,089 (18.9%) | 1,354 (15.4%) |
| 60 to 89 Minutes | 940 (8.5%) | 505 (5.7%) |
| 90 or more Minutes | 372 (3.4%) | 145 (1.7%) |
Time of Departure to Work by Sex in Perry County
The most frequent times of departure to work in Perry County are 6:00 AM to 6:29 AM (1,695, 15.4%) for males and 7:00 AM to 7:29 AM (1,460, 16.6%) for females.
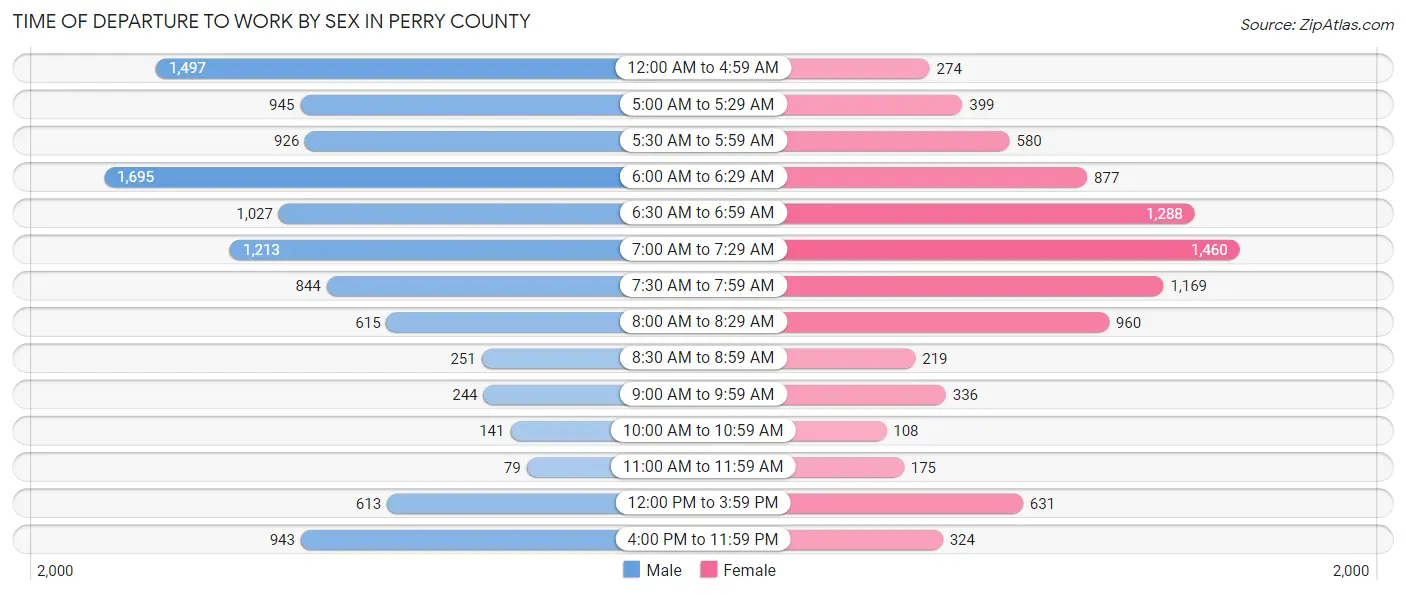
| Time of Departure | Male | Female |
| 12:00 AM to 4:59 AM | 1,497 (13.6%) | 274 (3.1%) |
| 5:00 AM to 5:29 AM | 945 (8.6%) | 399 (4.5%) |
| 5:30 AM to 5:59 AM | 926 (8.4%) | 580 (6.6%) |
| 6:00 AM to 6:29 AM | 1,695 (15.4%) | 877 (10.0%) |
| 6:30 AM to 6:59 AM | 1,027 (9.3%) | 1,288 (14.6%) |
| 7:00 AM to 7:29 AM | 1,213 (11.0%) | 1,460 (16.6%) |
| 7:30 AM to 7:59 AM | 844 (7.6%) | 1,169 (13.3%) |
| 8:00 AM to 8:29 AM | 615 (5.6%) | 960 (10.9%) |
| 8:30 AM to 8:59 AM | 251 (2.3%) | 219 (2.5%) |
| 9:00 AM to 9:59 AM | 244 (2.2%) | 336 (3.8%) |
| 10:00 AM to 10:59 AM | 141 (1.3%) | 108 (1.2%) |
| 11:00 AM to 11:59 AM | 79 (0.7%) | 175 (2.0%) |
| 12:00 PM to 3:59 PM | 613 (5.6%) | 631 (7.2%) |
| 4:00 PM to 11:59 PM | 943 (8.6%) | 324 (3.7%) |
| Total | 11,033 (100.0%) | 8,800 (100.0%) |
Housing Occupancy in Perry County
Occupancy by Ownership in Perry County
Of the total 18,066 dwellings in Perry County, owner-occupied units account for 14,574 (80.7%), while renter-occupied units make up 3,492 (19.3%).
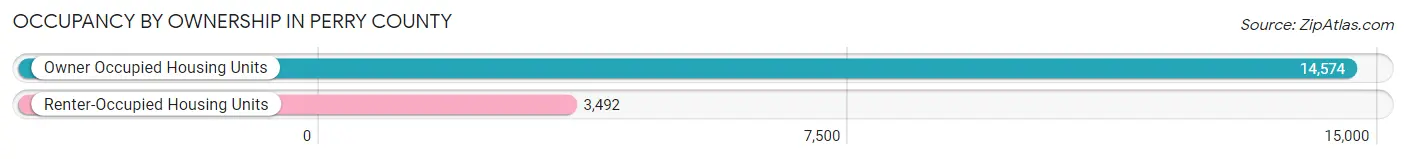
| Occupancy | # Housing Units | % Housing Units |
| Owner Occupied Housing Units | 14,574 | 80.7% |
| Renter-Occupied Housing Units | 3,492 | 19.3% |
| Total Occupied Housing Units | 18,066 | 100.0% |
Occupancy by Household Size in Perry County
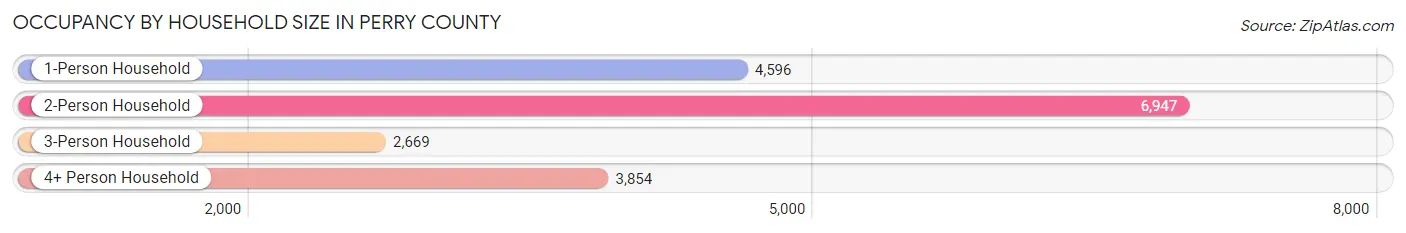
| Household Size | # Housing Units | % Housing Units |
| 1-Person Household | 4,596 | 25.4% |
| 2-Person Household | 6,947 | 38.5% |
| 3-Person Household | 2,669 | 14.8% |
| 4+ Person Household | 3,854 | 21.3% |
| Total Housing Units | 18,066 | 100.0% |
Occupancy by Ownership by Household Size in Perry County
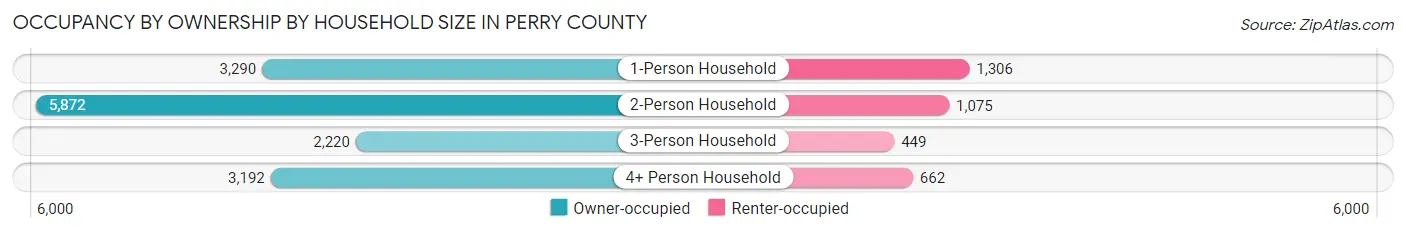
| Household Size | Owner-occupied | Renter-occupied |
| 1-Person Household | 3,290 (71.6%) | 1,306 (28.4%) |
| 2-Person Household | 5,872 (84.5%) | 1,075 (15.5%) |
| 3-Person Household | 2,220 (83.2%) | 449 (16.8%) |
| 4+ Person Household | 3,192 (82.8%) | 662 (17.2%) |
| Total Housing Units | 14,574 (80.7%) | 3,492 (19.3%) |
Occupancy by Educational Attainment in Perry County
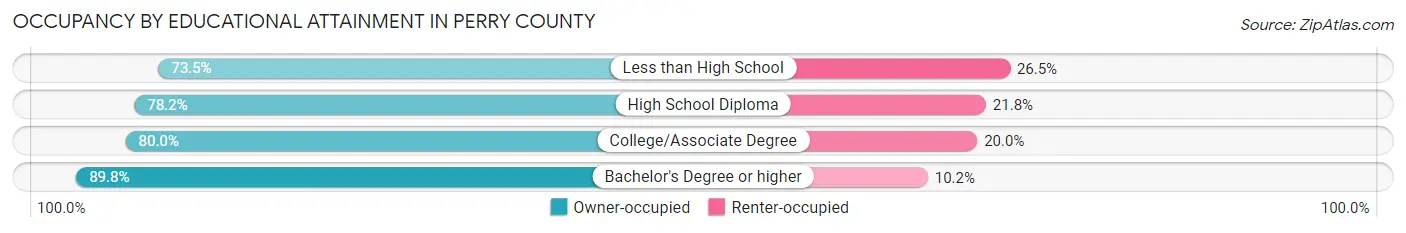
| Household Size | Owner-occupied | Renter-occupied |
| Less than High School | 1,313 (73.5%) | 474 (26.5%) |
| High School Diploma | 5,955 (78.2%) | 1,656 (21.8%) |
| College/Associate Degree | 3,877 (80.0%) | 971 (20.0%) |
| Bachelor's Degree or higher | 3,429 (89.8%) | 391 (10.2%) |
Occupancy by Age of Householder in Perry County
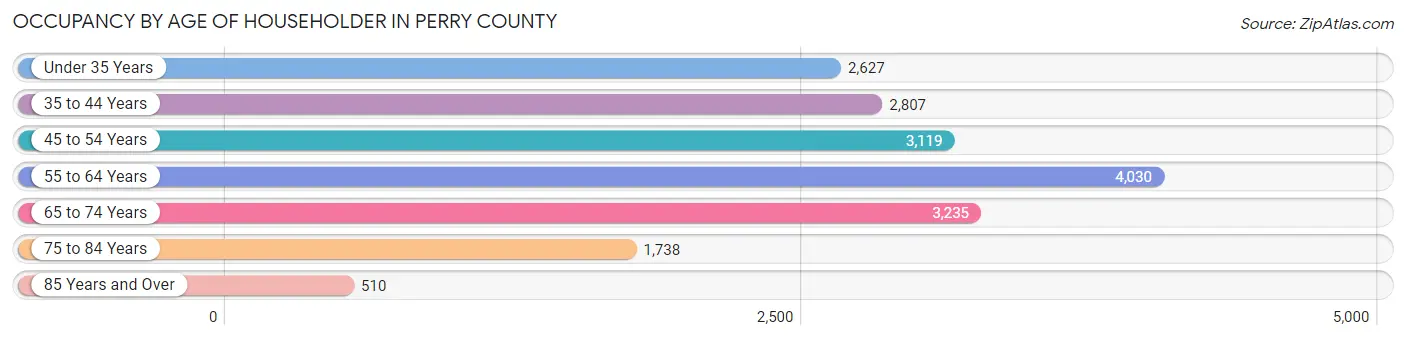
| Age Bracket | # Households | % Households |
| Under 35 Years | 2,627 | 14.5% |
| 35 to 44 Years | 2,807 | 15.5% |
| 45 to 54 Years | 3,119 | 17.3% |
| 55 to 64 Years | 4,030 | 22.3% |
| 65 to 74 Years | 3,235 | 17.9% |
| 75 to 84 Years | 1,738 | 9.6% |
| 85 Years and Over | 510 | 2.8% |
| Total | 18,066 | 100.0% |
Housing Finances in Perry County
Median Income by Occupancy in Perry County
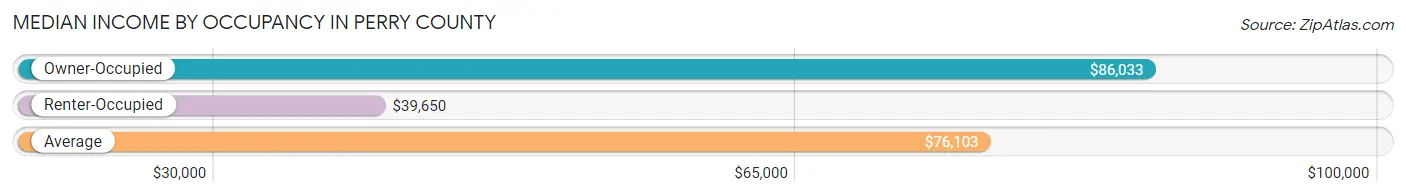
| Occupancy Type | # Households | Median Income |
| Owner-Occupied | 14,574 (80.7%) | $86,033 |
| Renter-Occupied | 3,492 (19.3%) | $39,650 |
| Average | 18,066 (100.0%) | $76,103 |
Occupancy by Householder Income Bracket in Perry County
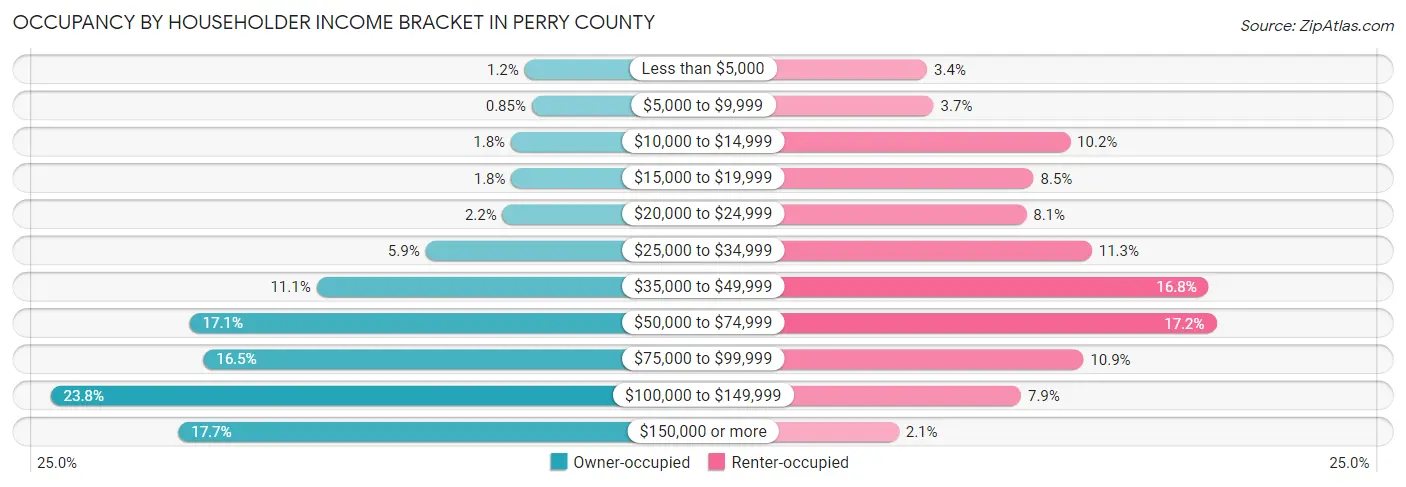
| Income Bracket | Owner-occupied | Renter-occupied |
| Less than $5,000 | 173 (1.2%) | 119 (3.4%) |
| $5,000 to $9,999 | 124 (0.9%) | 130 (3.7%) |
| $10,000 to $14,999 | 268 (1.8%) | 357 (10.2%) |
| $15,000 to $19,999 | 265 (1.8%) | 296 (8.5%) |
| $20,000 to $24,999 | 326 (2.2%) | 284 (8.1%) |
| $25,000 to $34,999 | 861 (5.9%) | 393 (11.3%) |
| $35,000 to $49,999 | 1,617 (11.1%) | 587 (16.8%) |
| $50,000 to $74,999 | 2,498 (17.1%) | 600 (17.2%) |
| $75,000 to $99,999 | 2,403 (16.5%) | 379 (10.8%) |
| $100,000 to $149,999 | 3,463 (23.8%) | 275 (7.9%) |
| $150,000 or more | 2,576 (17.7%) | 72 (2.1%) |
| Total | 14,574 (100.0%) | 3,492 (100.0%) |
Monthly Housing Cost Tiers in Perry County
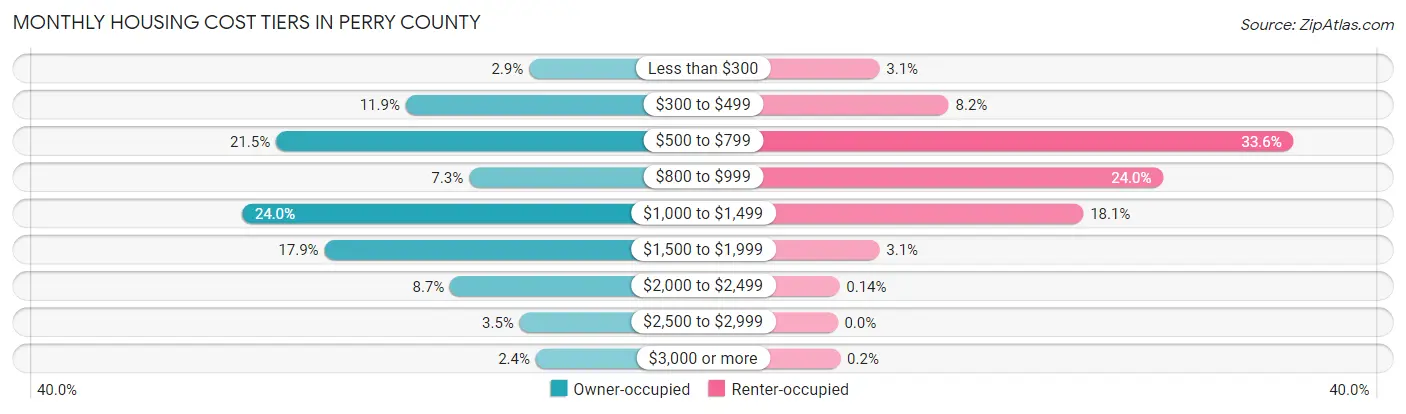
| Monthly Cost | Owner-occupied | Renter-occupied |
| Less than $300 | 416 (2.9%) | 108 (3.1%) |
| $300 to $499 | 1,739 (11.9%) | 286 (8.2%) |
| $500 to $799 | 3,130 (21.5%) | 1,173 (33.6%) |
| $800 to $999 | 1,060 (7.3%) | 838 (24.0%) |
| $1,000 to $1,499 | 3,498 (24.0%) | 632 (18.1%) |
| $1,500 to $1,999 | 2,611 (17.9%) | 108 (3.1%) |
| $2,000 to $2,499 | 1,262 (8.7%) | 5 (0.1%) |
| $2,500 to $2,999 | 516 (3.5%) | 0 (0.0%) |
| $3,000 or more | 342 (2.4%) | 7 (0.2%) |
| Total | 14,574 (100.0%) | 3,492 (100.0%) |
Physical Housing Characteristics in Perry County
Housing Structures in Perry County
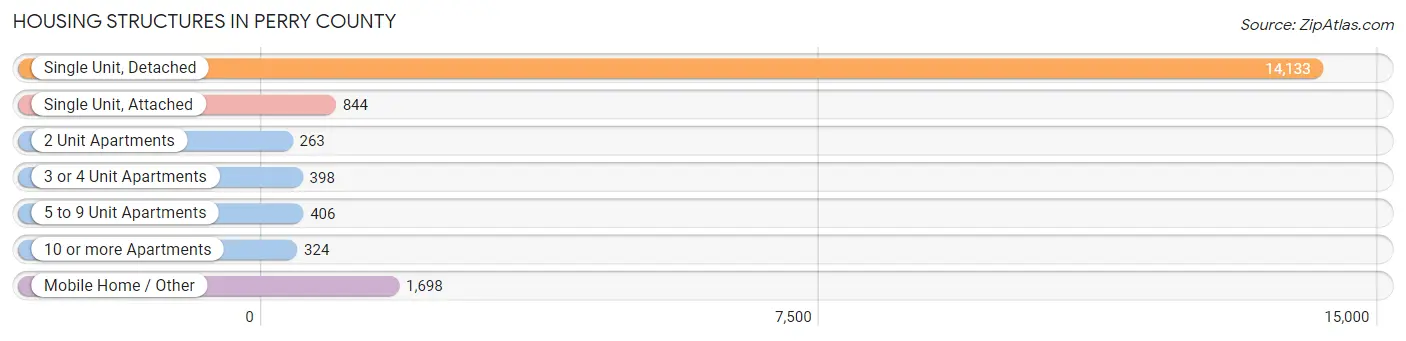
| Structure Type | # Housing Units | % Housing Units |
| Single Unit, Detached | 14,133 | 78.2% |
| Single Unit, Attached | 844 | 4.7% |
| 2 Unit Apartments | 263 | 1.5% |
| 3 or 4 Unit Apartments | 398 | 2.2% |
| 5 to 9 Unit Apartments | 406 | 2.2% |
| 10 or more Apartments | 324 | 1.8% |
| Mobile Home / Other | 1,698 | 9.4% |
| Total | 18,066 | 100.0% |
Housing Structures by Occupancy in Perry County
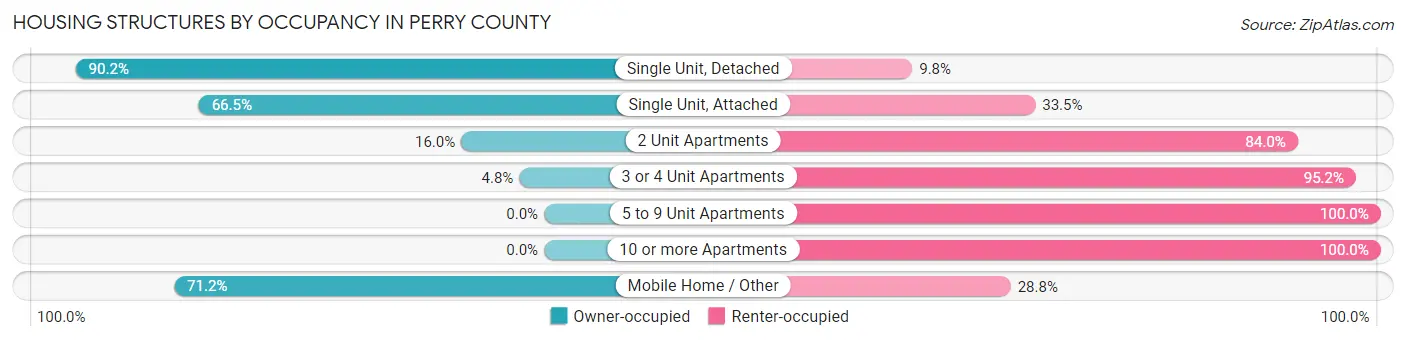
| Structure Type | Owner-occupied | Renter-occupied |
| Single Unit, Detached | 12,743 (90.2%) | 1,390 (9.8%) |
| Single Unit, Attached | 561 (66.5%) | 283 (33.5%) |
| 2 Unit Apartments | 42 (16.0%) | 221 (84.0%) |
| 3 or 4 Unit Apartments | 19 (4.8%) | 379 (95.2%) |
| 5 to 9 Unit Apartments | 0 (0.0%) | 406 (100.0%) |
| 10 or more Apartments | 0 (0.0%) | 324 (100.0%) |
| Mobile Home / Other | 1,209 (71.2%) | 489 (28.8%) |
| Total | 14,574 (80.7%) | 3,492 (19.3%) |
Housing Structures by Number of Rooms in Perry County
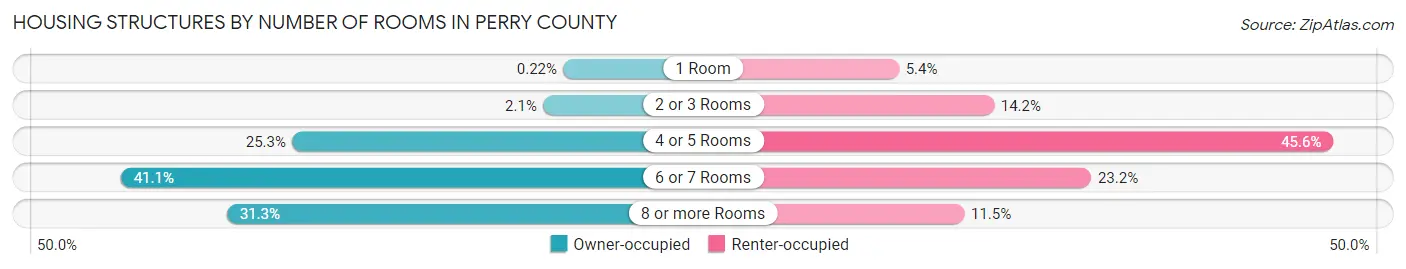
| Number of Rooms | Owner-occupied | Renter-occupied |
| 1 Room | 32 (0.2%) | 190 (5.4%) |
| 2 or 3 Rooms | 303 (2.1%) | 497 (14.2%) |
| 4 or 5 Rooms | 3,686 (25.3%) | 1,593 (45.6%) |
| 6 or 7 Rooms | 5,992 (41.1%) | 811 (23.2%) |
| 8 or more Rooms | 4,561 (31.3%) | 401 (11.5%) |
| Total | 14,574 (100.0%) | 3,492 (100.0%) |
Housing Structure by Heating Type in Perry County
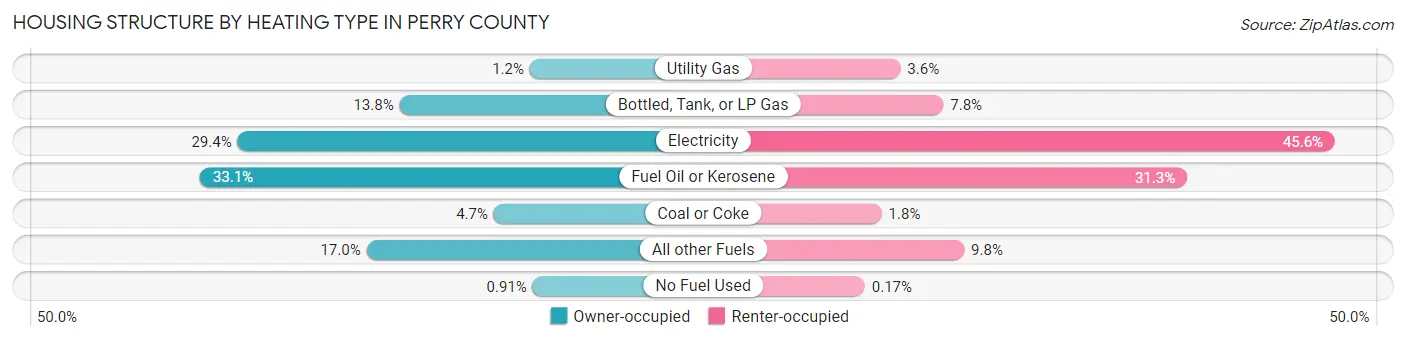
| Heating Type | Owner-occupied | Renter-occupied |
| Utility Gas | 174 (1.2%) | 126 (3.6%) |
| Bottled, Tank, or LP Gas | 2,008 (13.8%) | 271 (7.8%) |
| Electricity | 4,289 (29.4%) | 1,592 (45.6%) |
| Fuel Oil or Kerosene | 4,818 (33.1%) | 1,093 (31.3%) |
| Coal or Coke | 680 (4.7%) | 63 (1.8%) |
| All other Fuels | 2,473 (17.0%) | 341 (9.8%) |
| No Fuel Used | 132 (0.9%) | 6 (0.2%) |
| Total | 14,574 (100.0%) | 3,492 (100.0%) |
Household Vehicle Usage in Perry County
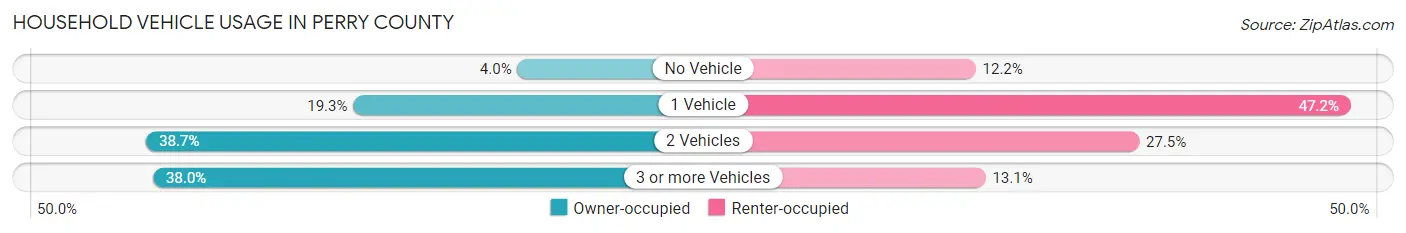
| Vehicles per Household | Owner-occupied | Renter-occupied |
| No Vehicle | 582 (4.0%) | 426 (12.2%) |
| 1 Vehicle | 2,816 (19.3%) | 1,649 (47.2%) |
| 2 Vehicles | 5,635 (38.7%) | 959 (27.5%) |
| 3 or more Vehicles | 5,541 (38.0%) | 458 (13.1%) |
| Total | 14,574 (100.0%) | 3,492 (100.0%) |
Real Estate & Mortgages in Perry County
Real Estate and Mortgage Overview in Perry County
| Characteristic | Without Mortgage | With Mortgage |
| Housing Units | 5,601 | 8,973 |
| Median Property Value | $190,500 | $222,000 |
| Median Household Income | $63,260 | $1,920 |
| Monthly Housing Costs | $570 | $337 |
| Real Estate Taxes | $2,463 | $137 |
Property Value by Mortgage Status in Perry County
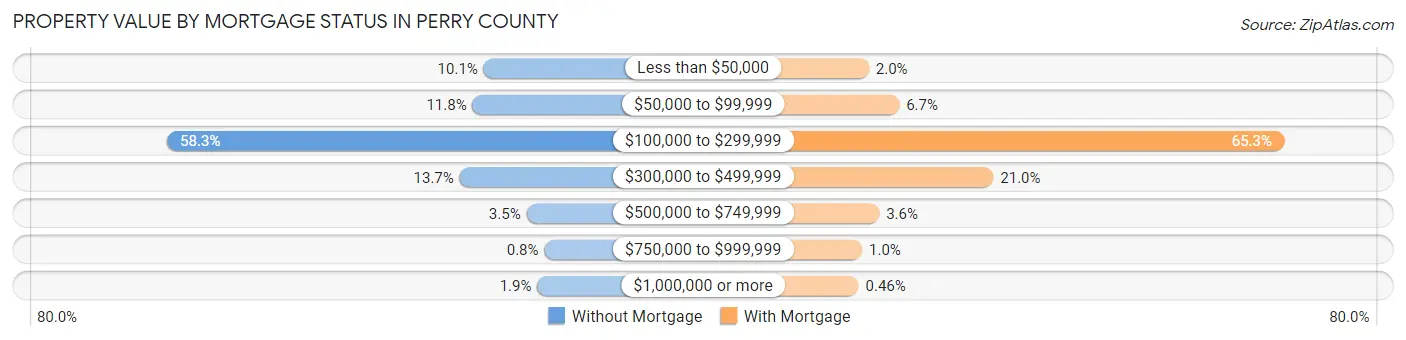
| Property Value | Without Mortgage | With Mortgage |
| Less than $50,000 | 563 (10.1%) | 182 (2.0%) |
| $50,000 to $99,999 | 658 (11.7%) | 597 (6.7%) |
| $100,000 to $299,999 | 3,265 (58.3%) | 5,855 (65.2%) |
| $300,000 to $499,999 | 768 (13.7%) | 1,884 (21.0%) |
| $500,000 to $749,999 | 197 (3.5%) | 324 (3.6%) |
| $750,000 to $999,999 | 45 (0.8%) | 90 (1.0%) |
| $1,000,000 or more | 105 (1.9%) | 41 (0.5%) |
| Total | 5,601 (100.0%) | 8,973 (100.0%) |
Household Income by Mortgage Status in Perry County
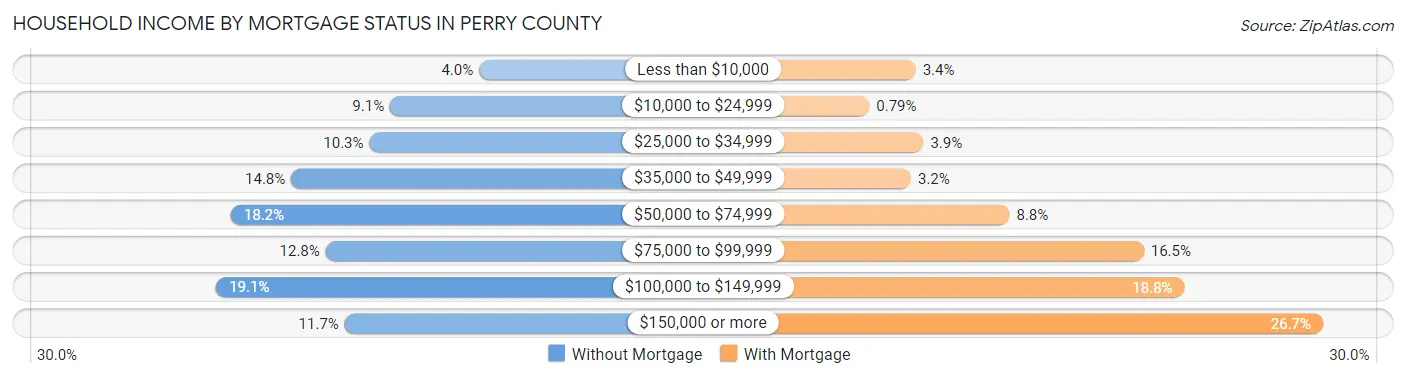
| Household Income | Without Mortgage | With Mortgage |
| Less than $10,000 | 226 (4.0%) | 309 (3.4%) |
| $10,000 to $24,999 | 511 (9.1%) | 71 (0.8%) |
| $25,000 to $34,999 | 577 (10.3%) | 348 (3.9%) |
| $35,000 to $49,999 | 827 (14.8%) | 284 (3.2%) |
| $50,000 to $74,999 | 1,020 (18.2%) | 790 (8.8%) |
| $75,000 to $99,999 | 717 (12.8%) | 1,478 (16.5%) |
| $100,000 to $149,999 | 1,067 (19.1%) | 1,686 (18.8%) |
| $150,000 or more | 656 (11.7%) | 2,396 (26.7%) |
| Total | 5,601 (100.0%) | 8,973 (100.0%) |
Property Value to Household Income Ratio in Perry County
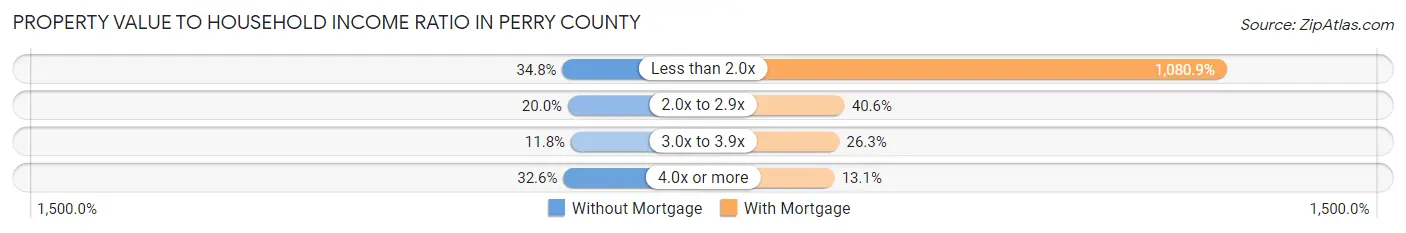
| Value-to-Income Ratio | Without Mortgage | With Mortgage |
| Less than 2.0x | 1,951 (34.8%) | 96,990 (1,080.9%) |
| 2.0x to 2.9x | 1,120 (20.0%) | 3,640 (40.6%) |
| 3.0x to 3.9x | 661 (11.8%) | 2,360 (26.3%) |
| 4.0x or more | 1,823 (32.6%) | 1,172 (13.1%) |
| Total | 5,601 (100.0%) | 8,973 (100.0%) |
Real Estate Taxes by Mortgage Status in Perry County
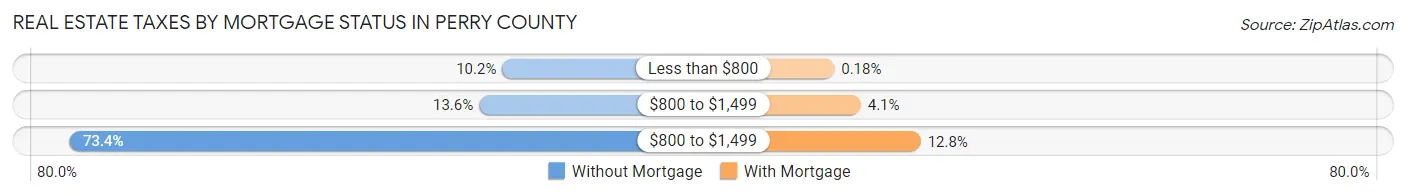
| Property Taxes | Without Mortgage | With Mortgage |
| Less than $800 | 572 (10.2%) | 16 (0.2%) |
| $800 to $1,499 | 762 (13.6%) | 363 (4.1%) |
| $800 to $1,499 | 4,109 (73.4%) | 1,149 (12.8%) |
| Total | 5,601 (100.0%) | 8,973 (100.0%) |
Health & Disability in Perry County
Health Insurance Coverage by Age in Perry County
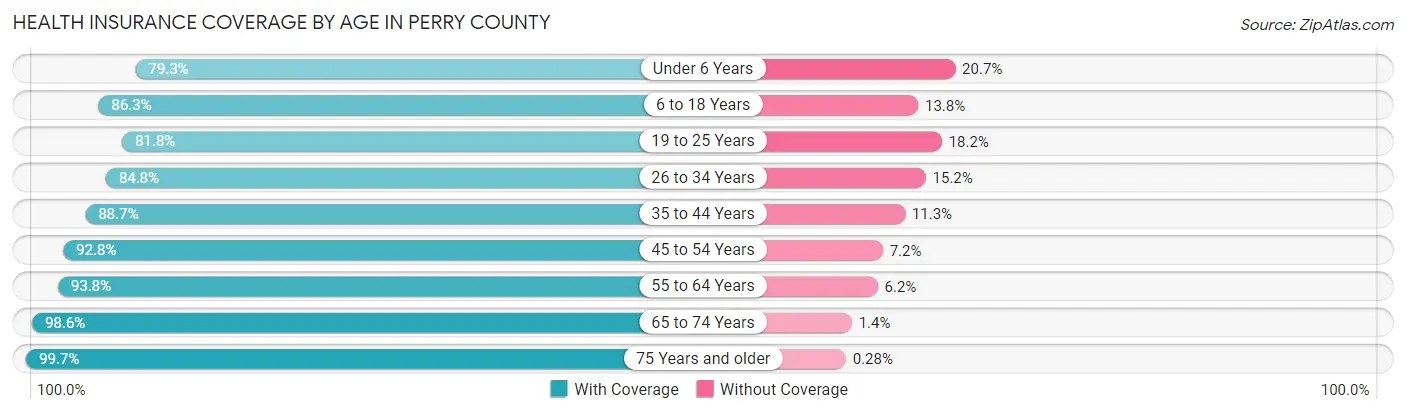
| Age Bracket | With Coverage | Without Coverage |
| Under 6 Years | 2,402 (79.3%) | 626 (20.7%) |
| 6 to 18 Years | 6,112 (86.3%) | 974 (13.8%) |
| 19 to 25 Years | 2,577 (81.8%) | 572 (18.2%) |
| 26 to 34 Years | 4,101 (84.8%) | 733 (15.2%) |
| 35 to 44 Years | 4,758 (88.7%) | 607 (11.3%) |
| 45 to 54 Years | 5,861 (92.8%) | 453 (7.2%) |
| 55 to 64 Years | 6,627 (93.8%) | 439 (6.2%) |
| 65 to 74 Years | 5,357 (98.6%) | 75 (1.4%) |
| 75 Years and older | 3,210 (99.7%) | 9 (0.3%) |
| Total | 41,005 (90.1%) | 4,488 (9.9%) |
Health Insurance Coverage by Citizenship Status in Perry County
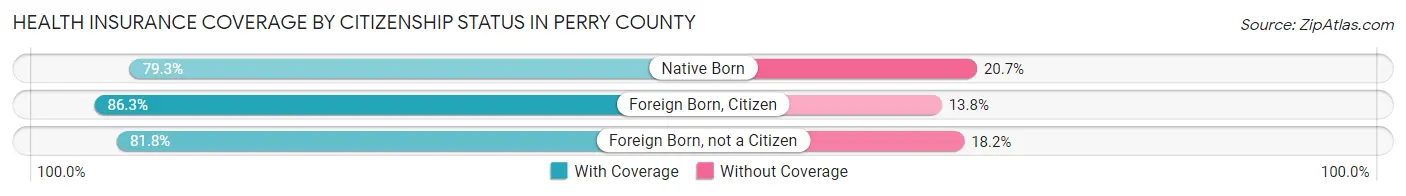
| Citizenship Status | With Coverage | Without Coverage |
| Native Born | 2,402 (79.3%) | 626 (20.7%) |
| Foreign Born, Citizen | 6,112 (86.3%) | 974 (13.8%) |
| Foreign Born, not a Citizen | 2,577 (81.8%) | 572 (18.2%) |
Health Insurance Coverage by Household Income in Perry County
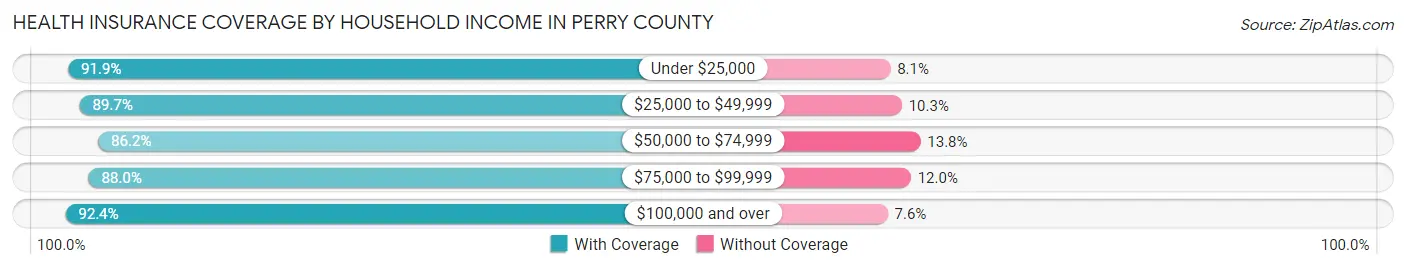
| Household Income | With Coverage | Without Coverage |
| Under $25,000 | 3,386 (91.9%) | 300 (8.1%) |
| $25,000 to $49,999 | 5,761 (89.7%) | 661 (10.3%) |
| $50,000 to $74,999 | 6,636 (86.2%) | 1,061 (13.8%) |
| $75,000 to $99,999 | 6,575 (88.0%) | 895 (12.0%) |
| $100,000 and over | 18,567 (92.4%) | 1,536 (7.6%) |
Public vs Private Health Insurance Coverage by Age in Perry County
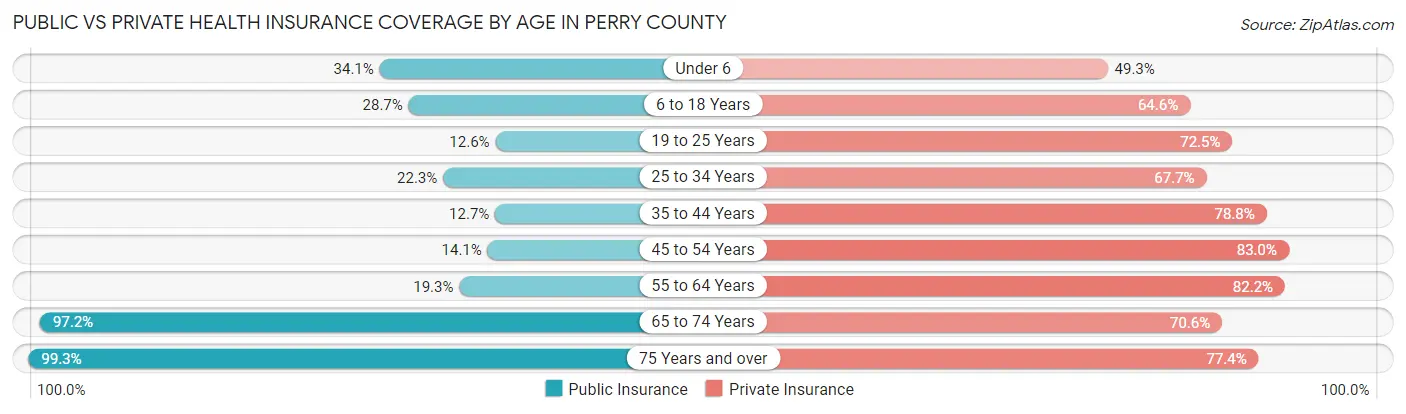
| Age Bracket | Public Insurance | Private Insurance |
| Under 6 | 1,033 (34.1%) | 1,494 (49.3%) |
| 6 to 18 Years | 2,035 (28.7%) | 4,579 (64.6%) |
| 19 to 25 Years | 397 (12.6%) | 2,282 (72.5%) |
| 25 to 34 Years | 1,079 (22.3%) | 3,271 (67.7%) |
| 35 to 44 Years | 679 (12.7%) | 4,230 (78.8%) |
| 45 to 54 Years | 888 (14.1%) | 5,239 (83.0%) |
| 55 to 64 Years | 1,365 (19.3%) | 5,811 (82.2%) |
| 65 to 74 Years | 5,277 (97.2%) | 3,834 (70.6%) |
| 75 Years and over | 3,196 (99.3%) | 2,490 (77.3%) |
| Total | 15,949 (35.1%) | 33,230 (73.0%) |
Disability Status by Sex by Age in Perry County
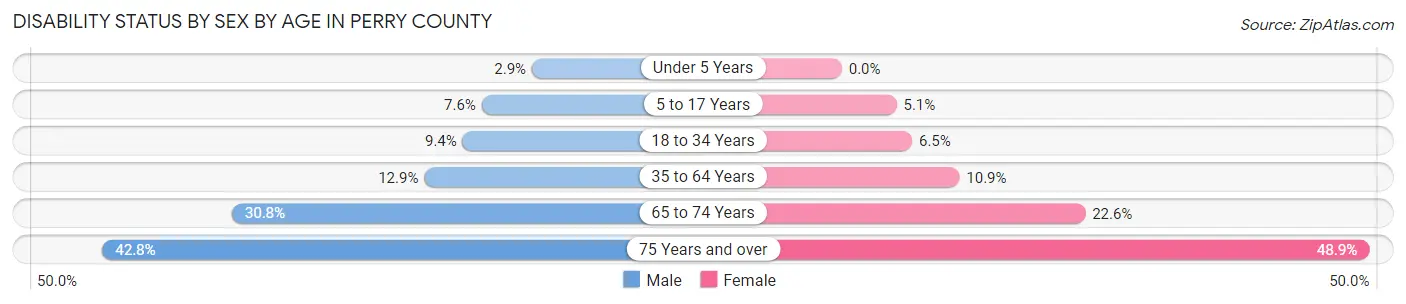
| Age Bracket | Male | Female |
| Under 5 Years | 38 (2.9%) | 0 (0.0%) |
| 5 to 17 Years | 281 (7.6%) | 173 (5.1%) |
| 18 to 34 Years | 413 (9.3%) | 266 (6.5%) |
| 35 to 64 Years | 1,230 (12.9%) | 1,006 (10.9%) |
| 65 to 74 Years | 862 (30.8%) | 594 (22.6%) |
| 75 Years and over | 593 (42.8%) | 897 (48.9%) |
Disability Class by Sex by Age in Perry County
Disability Class: Hearing Difficulty
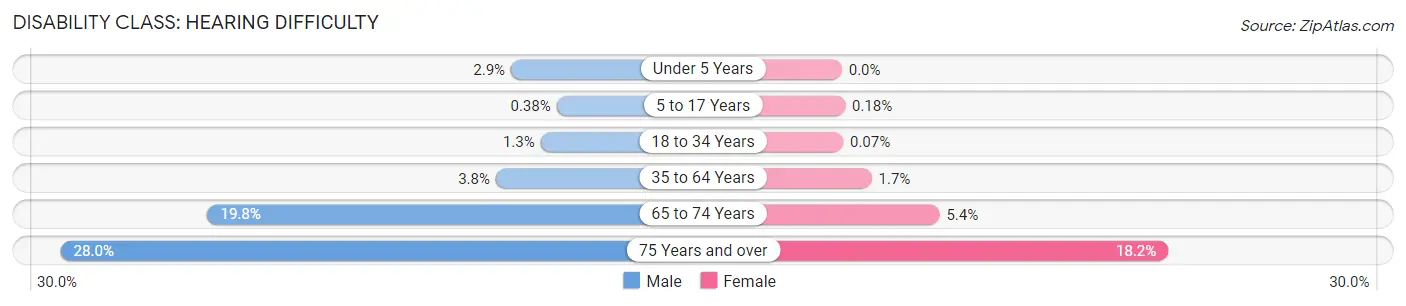
| Age Bracket | Male | Female |
| Under 5 Years | 38 (2.9%) | 0 (0.0%) |
| 5 to 17 Years | 14 (0.4%) | 6 (0.2%) |
| 18 to 34 Years | 56 (1.3%) | 3 (0.1%) |
| 35 to 64 Years | 358 (3.8%) | 153 (1.7%) |
| 65 to 74 Years | 555 (19.8%) | 143 (5.4%) |
| 75 Years and over | 388 (28.0%) | 333 (18.2%) |
Disability Class: Vision Difficulty
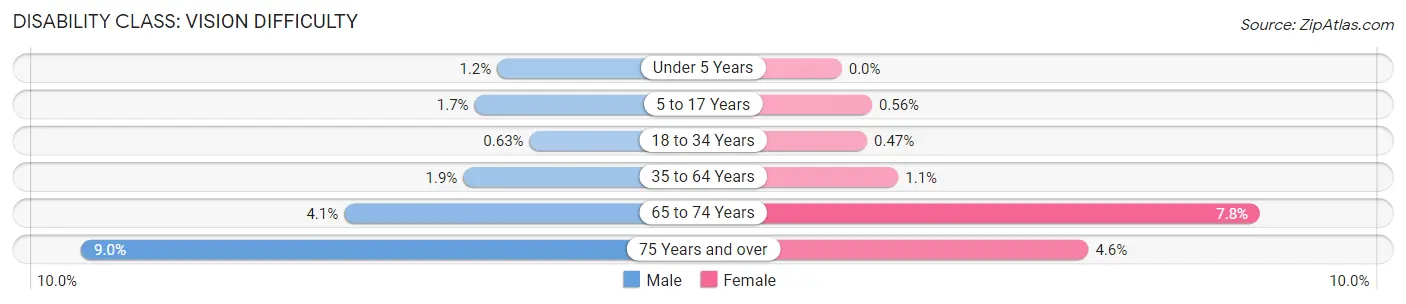
| Age Bracket | Male | Female |
| Under 5 Years | 16 (1.2%) | 0 (0.0%) |
| 5 to 17 Years | 61 (1.7%) | 19 (0.6%) |
| 18 to 34 Years | 28 (0.6%) | 19 (0.5%) |
| 35 to 64 Years | 177 (1.9%) | 97 (1.1%) |
| 65 to 74 Years | 114 (4.1%) | 204 (7.8%) |
| 75 Years and over | 124 (8.9%) | 84 (4.6%) |
Disability Class: Cognitive Difficulty
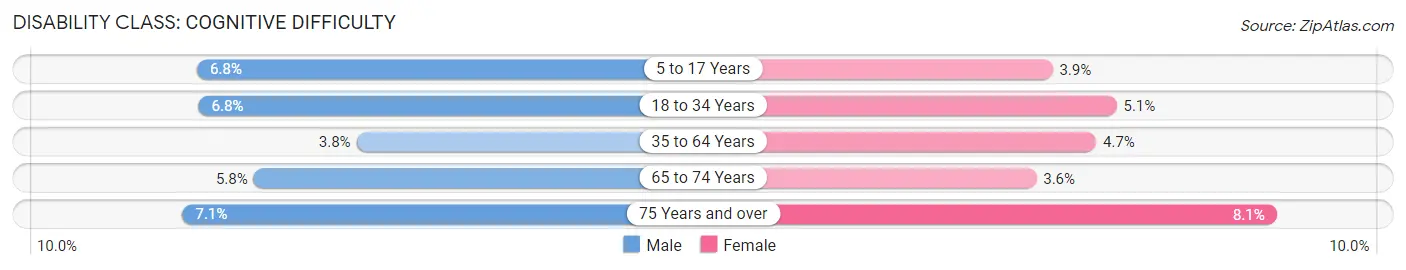
| Age Bracket | Male | Female |
| 5 to 17 Years | 252 (6.8%) | 133 (3.9%) |
| 18 to 34 Years | 299 (6.8%) | 208 (5.1%) |
| 35 to 64 Years | 366 (3.8%) | 435 (4.7%) |
| 65 to 74 Years | 161 (5.8%) | 95 (3.6%) |
| 75 Years and over | 98 (7.1%) | 148 (8.1%) |
Disability Class: Ambulatory Difficulty
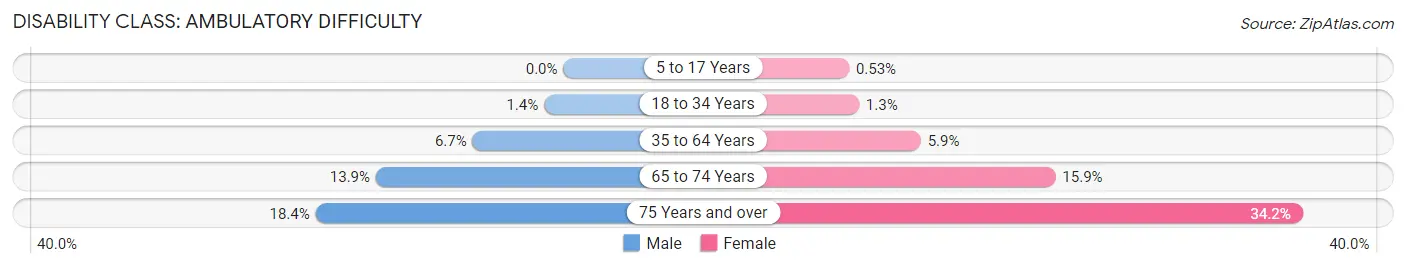
| Age Bracket | Male | Female |
| 5 to 17 Years | 0 (0.0%) | 18 (0.5%) |
| 18 to 34 Years | 63 (1.4%) | 52 (1.3%) |
| 35 to 64 Years | 642 (6.7%) | 540 (5.9%) |
| 65 to 74 Years | 390 (13.9%) | 417 (15.9%) |
| 75 Years and over | 255 (18.4%) | 627 (34.2%) |
Disability Class: Self-Care Difficulty
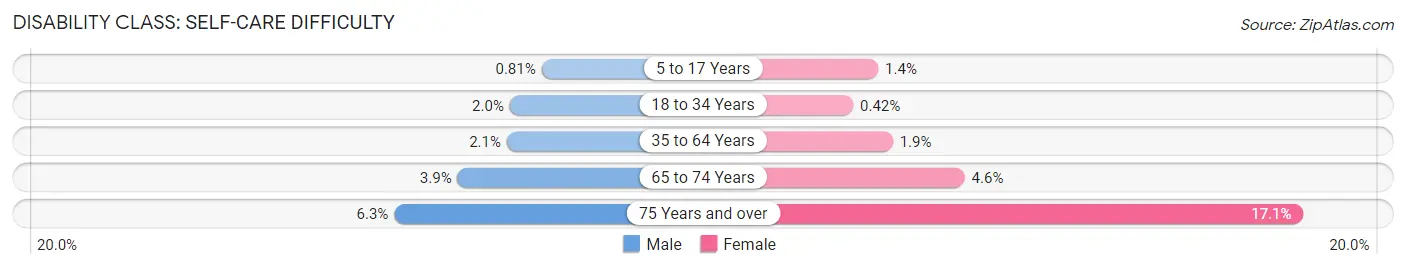
| Age Bracket | Male | Female |
| 5 to 17 Years | 30 (0.8%) | 46 (1.3%) |
| 18 to 34 Years | 88 (2.0%) | 17 (0.4%) |
| 35 to 64 Years | 200 (2.1%) | 174 (1.9%) |
| 65 to 74 Years | 110 (3.9%) | 120 (4.6%) |
| 75 Years and over | 87 (6.3%) | 314 (17.1%) |
Technology Access in Perry County
Computing Device Access in Perry County
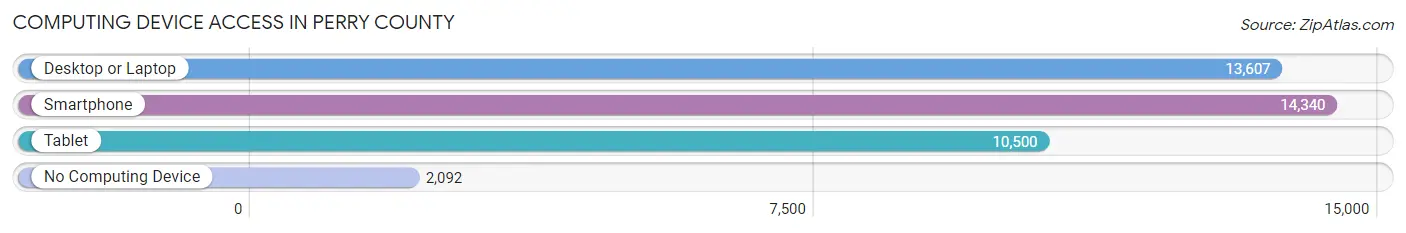
| Device Type | # Households | % Households |
| Desktop or Laptop | 13,607 | 75.3% |
| Smartphone | 14,340 | 79.4% |
| Tablet | 10,500 | 58.1% |
| No Computing Device | 2,092 | 11.6% |
| Total | 18,066 | 100.0% |
Internet Access in Perry County
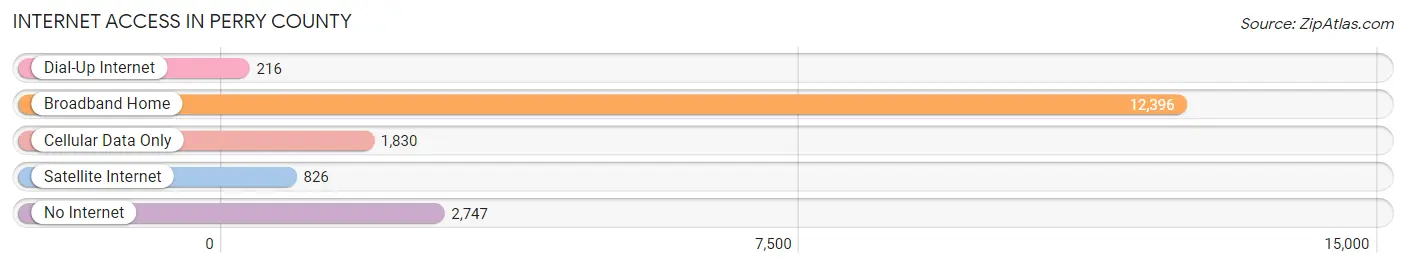
| Internet Type | # Households | % Households |
| Dial-Up Internet | 216 | 1.2% |
| Broadband Home | 12,396 | 68.6% |
| Cellular Data Only | 1,830 | 10.1% |
| Satellite Internet | 826 | 4.6% |
| No Internet | 2,747 | 15.2% |
| Total | 18,066 | 100.0% |
Perry County Summary
Perry County, Pennsylvania is located in the south-central part of the state and is part of the Susquehanna Valley region. It is bordered by Cumberland, Juniata, Dauphin, and York counties. The county seat is New Bloomfield. The county was created in 1820 from part of Cumberland County and was named after Oliver Hazard Perry, a naval hero of the War of 1812.
Geography
Perry County is located in the Appalachian Mountains and is part of the Ridge and Valley physiographic province. The county is characterized by rolling hills and valleys, with the highest point being Blue Mountain at 2,065 feet. The Susquehanna River forms the northern border of the county, and the Juniata River forms the eastern border. The county is home to several state parks, including Little Buffalo State Park, Tuscarora State Park, and Greenwood Furnace State Park.
Economy
Perry County’s economy is largely based on agriculture and tourism. The county is home to several large farms, including dairy, beef, and poultry operations. The county is also home to several wineries and breweries, as well as a number of small businesses. Tourism is a major industry in the county, with visitors coming to enjoy the area’s natural beauty, outdoor recreation, and historical sites.
Demographics
As of the 2010 census, Perry County had a population of 45,969. The population is largely white (95.3%), with small percentages of African American (2.2%), Hispanic (1.2%), and Asian (0.5%) residents. The median household income is $45,945, and the median age is 42.7 years.
History
Perry County was created in 1820 from part of Cumberland County. The county was named after Oliver Hazard Perry, a naval hero of the War of 1812. The county was largely rural until the mid-19th century, when the Pennsylvania Canal and the Pennsylvania Railroad were built through the county. This led to an influx of settlers and the development of several small towns. The county was also home to several iron furnaces, which were important to the local economy.
In the late 19th and early 20th centuries, the county was home to several large farms, which were important to the local economy. The county was also home to several wineries and breweries, as well as a number of small businesses.
Today, Perry County is a largely rural county, with a strong agricultural and tourism economy. The county is home to several state parks, as well as a number of historical sites. The county is also home to several wineries and breweries, as well as a number of small businesses.
Common Questions
What is Per Capita Income in Perry County?
Per Capita income in Perry County is $37,018.
What is the Median Family Income in Perry County?
Median Family Income in Perry County is $90,946.
What is the Median Household income in Perry County?
Median Household Income in Perry County is $76,103.
What is Income or Wage Gap in Perry County?
Income or Wage Gap in Perry County is 33.2%.
Women in Perry County earn 66.8 cents for every dollar earned by a man.
What is Family Income Deficit in Perry County?
Family Income Deficit in Perry County is $11,389.
Families that are below poverty line in Perry County earn $11,389 less on average than the poverty threshold level.
What is Inequality or Gini Index in Perry County?
Inequality or Gini Index in Perry County is 0.40.
What is the Total Population of Perry County?
Total Population of Perry County is 45,941.
What is the Total Male Population of Perry County?
Total Male Population of Perry County is 23,368.
What is the Total Female Population of Perry County?
Total Female Population of Perry County is 22,573.
What is the Ratio of Males per 100 Females in Perry County?
There are 103.52 Males per 100 Females in Perry County.
What is the Ratio of Females per 100 Males in Perry County?
There are 96.60 Females per 100 Males in Perry County.
What is the Median Population Age in Perry County?
Median Population Age in Perry County is 43.7 Years.
What is the Average Family Size in Perry County
Average Family Size in Perry County is 3.0 People.
What is the Average Household Size in Perry County
Average Household Size in Perry County is 2.5 People.
How Large is the Labor Force in Perry County?
There are 23,176 People in the Labor Forcein in Perry County.
What is the Percentage of People in the Labor Force in Perry County?
62.0% of People are in the Labor Force in Perry County.
What is the Unemployment Rate in Perry County?
Unemployment Rate in Perry County is 3.4%.