Northumberland County, PA Map & Demographics
Northumberland County Map
Northumberland County Overview
$31,240
PER CAPITA INCOME
$74,473
AVG FAMILY INCOME
$55,952
AVG HOUSEHOLD INCOME
31.1%
WAGE / INCOME GAP [ % ]
68.9¢/ $1
WAGE / INCOME GAP [ $ ]
$10,420
FAMILY INCOME DEFICIT
0.43
INEQUALITY / GINI INDEX
91,340
TOTAL POPULATION
46,403
MALE POPULATION
44,937
FEMALE POPULATION
103.26
MALES / 100 FEMALES
96.84
FEMALES / 100 MALES
44.5
MEDIAN AGE
2.9
AVG FAMILY SIZE
2.3
AVG HOUSEHOLD SIZE
43,493
LABOR FORCE [ PEOPLE ]
57.5%
PERCENT IN LABOR FORCE
4.7%
UNEMPLOYMENT RATE
Income in Northumberland County
Income Overview in Northumberland County
Per Capita Income in Northumberland County is $31,240, while median incomes of families and households are $74,473 and $55,952 respectively.
| Characteristic | Number | Measure |
| Per Capita Income | 91,340 | $31,240 |
| Median Family Income | 23,926 | $74,473 |
| Mean Family Income | 23,926 | $89,102 |
| Median Household Income | 37,775 | $55,952 |
| Mean Household Income | 37,775 | $74,086 |
| Income Deficit | 23,926 | $10,420 |
| Wage / Income Gap (%) | 91,340 | 31.12% |
| Wage / Income Gap ($) | 91,340 | 68.88¢ per $1 |
| Gini / Inequality Index | 91,340 | 0.43 |
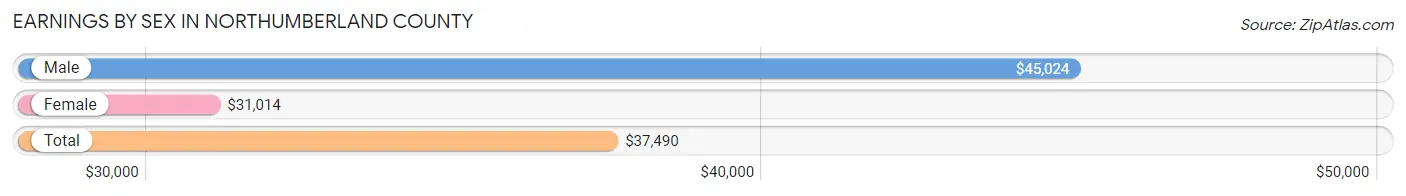
Earnings by Sex in Northumberland County
Average Earnings in Northumberland County are $37,490, $45,024 for men and $31,014 for women, a difference of 31.1%.
| Sex | Number | Average Earnings |
| Male | 24,089 (52.9%) | $45,024 |
| Female | 21,477 (47.1%) | $31,014 |
| Total | 45,566 (100.0%) | $37,490 |
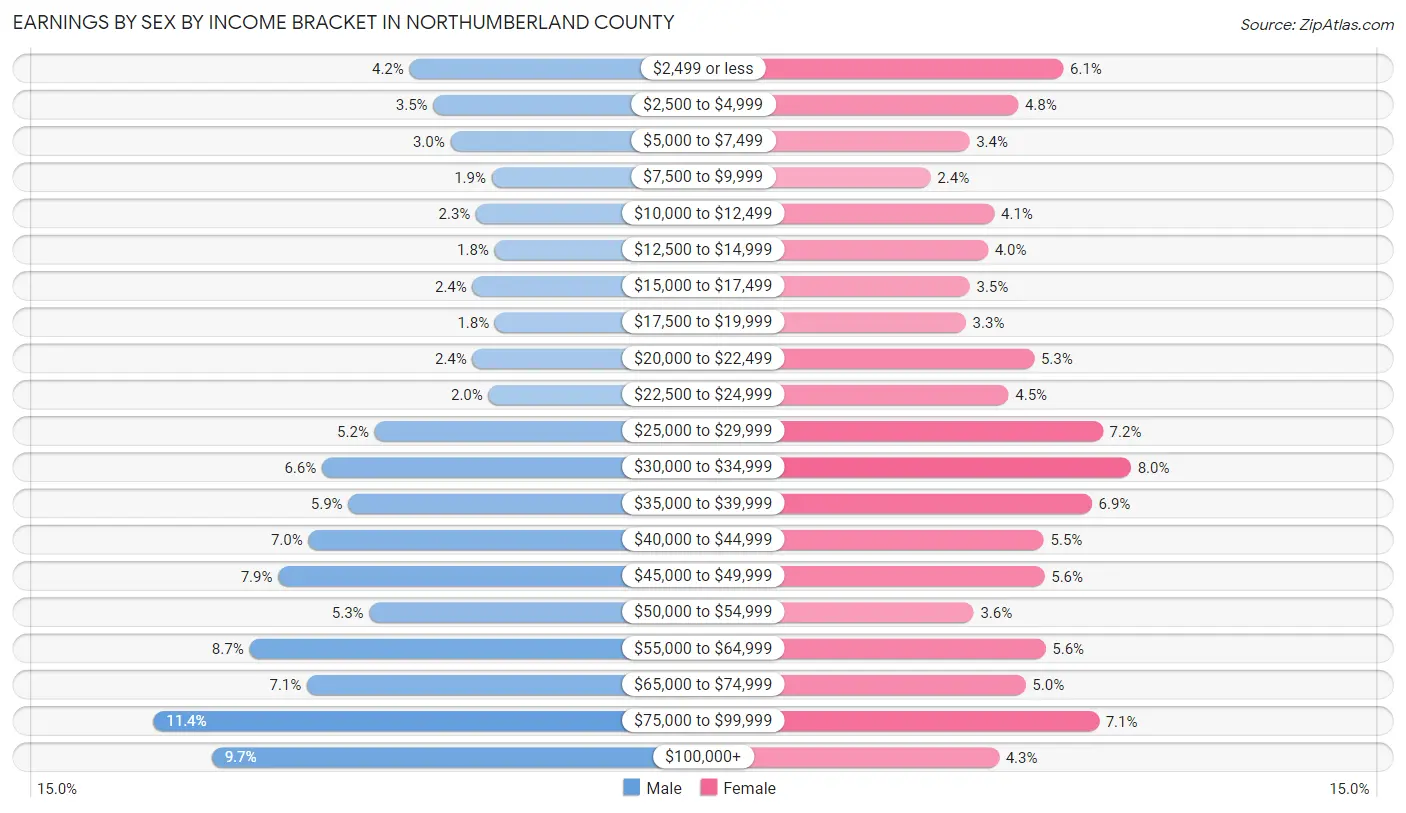
Earnings by Sex by Income Bracket in Northumberland County
The most common earnings brackets in Northumberland County are $75,000 to $99,999 for men (2,741 | 11.4%) and $30,000 to $34,999 for women (1,714 | 8.0%).
| Income | Male | Female |
| $2,499 or less | 1,008 (4.2%) | 1,306 (6.1%) |
| $2,500 to $4,999 | 846 (3.5%) | 1,033 (4.8%) |
| $5,000 to $7,499 | 729 (3.0%) | 739 (3.4%) |
| $7,500 to $9,999 | 450 (1.9%) | 504 (2.4%) |
| $10,000 to $12,499 | 556 (2.3%) | 889 (4.1%) |
| $12,500 to $14,999 | 431 (1.8%) | 851 (4.0%) |
| $15,000 to $17,499 | 581 (2.4%) | 740 (3.5%) |
| $17,500 to $19,999 | 429 (1.8%) | 718 (3.3%) |
| $20,000 to $22,499 | 580 (2.4%) | 1,129 (5.3%) |
| $22,500 to $24,999 | 472 (2.0%) | 974 (4.5%) |
| $25,000 to $29,999 | 1,243 (5.2%) | 1,544 (7.2%) |
| $30,000 to $34,999 | 1,599 (6.6%) | 1,714 (8.0%) |
| $35,000 to $39,999 | 1,421 (5.9%) | 1,478 (6.9%) |
| $40,000 to $44,999 | 1,690 (7.0%) | 1,187 (5.5%) |
| $45,000 to $49,999 | 1,895 (7.9%) | 1,191 (5.6%) |
| $50,000 to $54,999 | 1,280 (5.3%) | 765 (3.6%) |
| $55,000 to $64,999 | 2,091 (8.7%) | 1,199 (5.6%) |
| $65,000 to $74,999 | 1,701 (7.1%) | 1,079 (5.0%) |
| $75,000 to $99,999 | 2,741 (11.4%) | 1,520 (7.1%) |
| $100,000+ | 2,346 (9.7%) | 917 (4.3%) |
| Total | 24,089 (100.0%) | 21,477 (100.0%) |
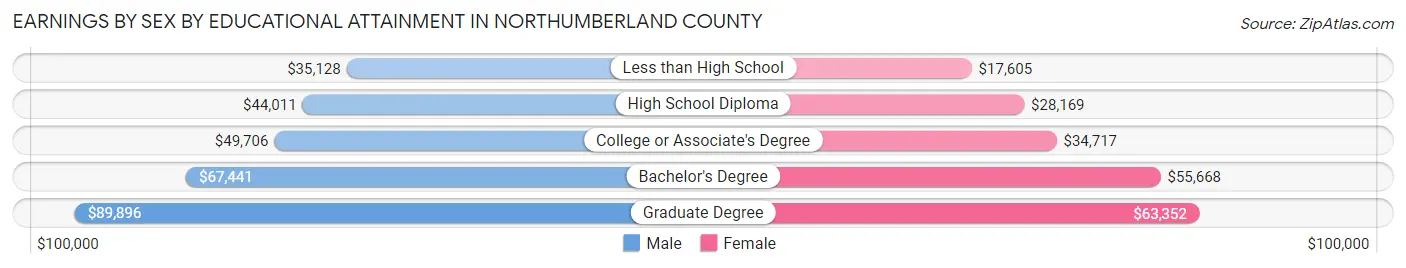
Earnings by Sex by Educational Attainment in Northumberland County
Average earnings in Northumberland County are $48,383 for men and $34,289 for women, a difference of 29.1%. Men with an educational attainment of graduate degree enjoy the highest average annual earnings of $89,896, while those with less than high school education earn the least with $35,128. Women with an educational attainment of graduate degree earn the most with the average annual earnings of $63,352, while those with less than high school education have the smallest earnings of $17,605.
| Educational Attainment | Male Income | Female Income |
| Less than High School | $35,128 | $17,605 |
| High School Diploma | $44,011 | $28,169 |
| College or Associate's Degree | $49,706 | $34,717 |
| Bachelor's Degree | $67,441 | $55,668 |
| Graduate Degree | $89,896 | $63,352 |
| Total | $48,383 | $34,289 |
Family Income in Northumberland County
Family Income Brackets in Northumberland County
According to the Northumberland County family income data, there are 4,929 families falling into the $100,000 to $149,999 income range, which is the most common income bracket and makes up 20.6% of all families. Conversely, the $10,000 to $14,999 income bracket is the least frequent group with only 479 families (2.0%) belonging to this category.
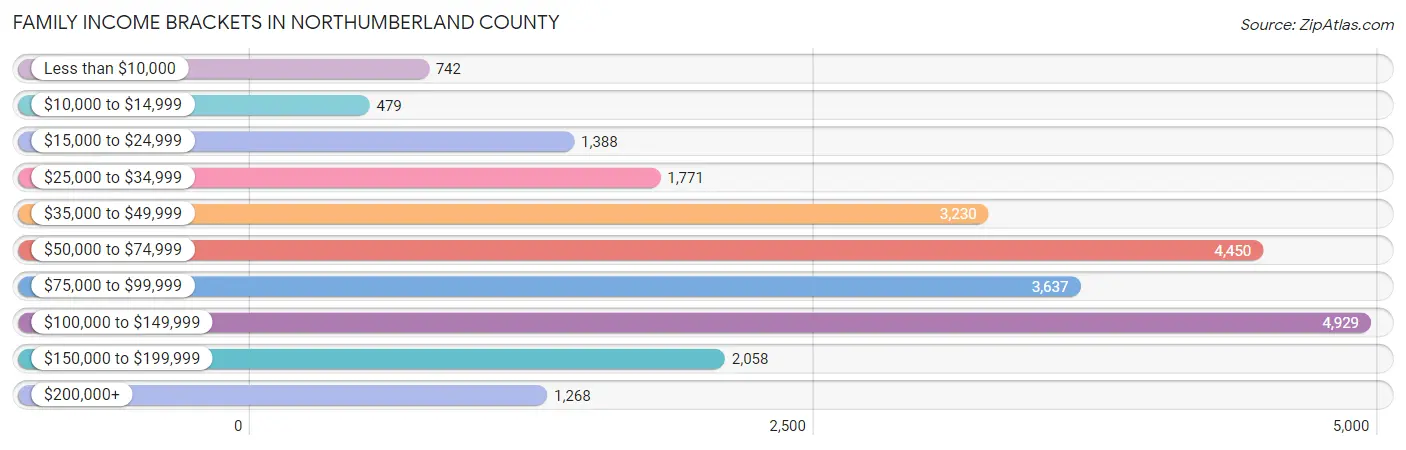
| Income Bracket | # Families | % Families |
| Less than $10,000 | 742 | 3.1% |
| $10,000 to $14,999 | 479 | 2.0% |
| $15,000 to $24,999 | 1,388 | 5.8% |
| $25,000 to $34,999 | 1,771 | 7.4% |
| $35,000 to $49,999 | 3,230 | 13.5% |
| $50,000 to $74,999 | 4,450 | 18.6% |
| $75,000 to $99,999 | 3,637 | 15.2% |
| $100,000 to $149,999 | 4,929 | 20.6% |
| $150,000 to $199,999 | 2,058 | 8.6% |
| $200,000+ | 1,268 | 5.3% |
Family Income by Famaliy Size in Northumberland County
4-person families (3,483 | 14.6%) account for the highest median family income in Northumberland County with $103,168 per family, while 2-person families (12,662 | 52.9%) have the highest median income of $30,463 per family member.
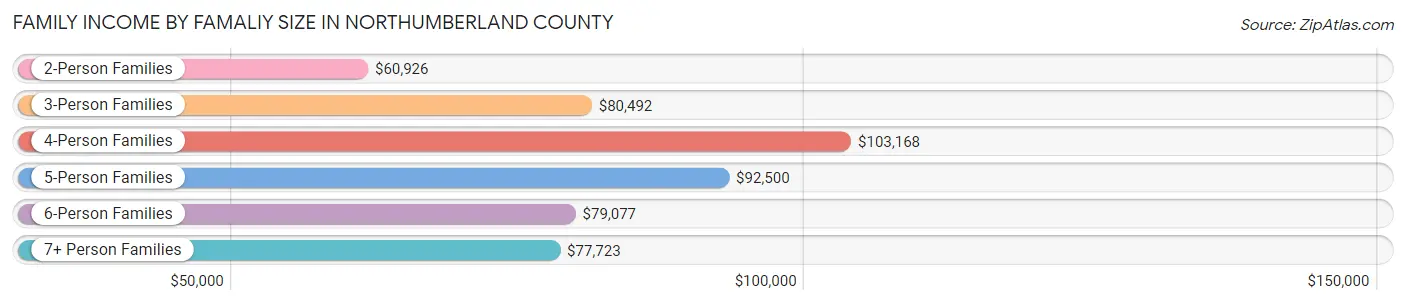
| Income Bracket | # Families | Median Income |
| 2-Person Families | 12,662 (52.9%) | $60,926 |
| 3-Person Families | 5,332 (22.3%) | $80,492 |
| 4-Person Families | 3,483 (14.6%) | $103,168 |
| 5-Person Families | 1,492 (6.2%) | $92,500 |
| 6-Person Families | 594 (2.5%) | $79,077 |
| 7+ Person Families | 363 (1.5%) | $77,723 |
| Total | 23,926 (100.0%) | $74,473 |
Family Income by Number of Earners in Northumberland County
The median family income in Northumberland County is $74,473, with families comprising 3+ earners (2,775) having the highest median family income of $127,642, while families with no earners (4,471) have the lowest median family income of $38,341, accounting for 11.6% and 18.7% of families, respectively.
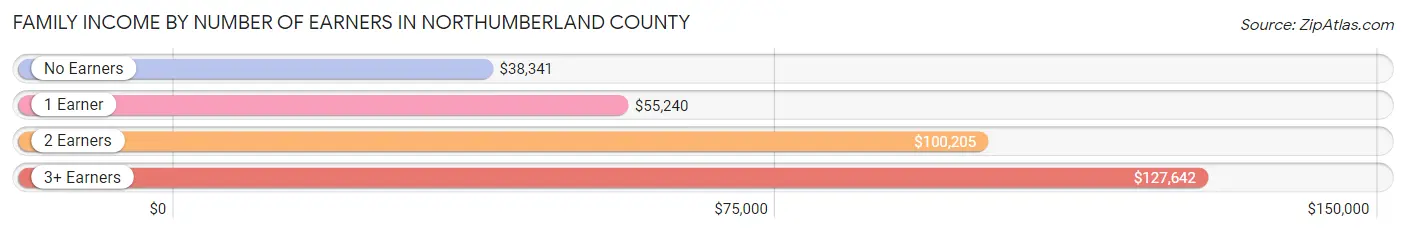
| Number of Earners | # Families | Median Income |
| No Earners | 4,471 (18.7%) | $38,341 |
| 1 Earner | 7,622 (31.9%) | $55,240 |
| 2 Earners | 9,058 (37.9%) | $100,205 |
| 3+ Earners | 2,775 (11.6%) | $127,642 |
| Total | 23,926 (100.0%) | $74,473 |
Household Income in Northumberland County
Household Income Brackets in Northumberland County
With 6,460 households falling in the category, the $50,000 to $74,999 income range is the most frequent in Northumberland County, accounting for 17.1% of all households. In contrast, only 1,435 households (3.8%) fall into the $200,000+ income bracket, making it the least populous group.
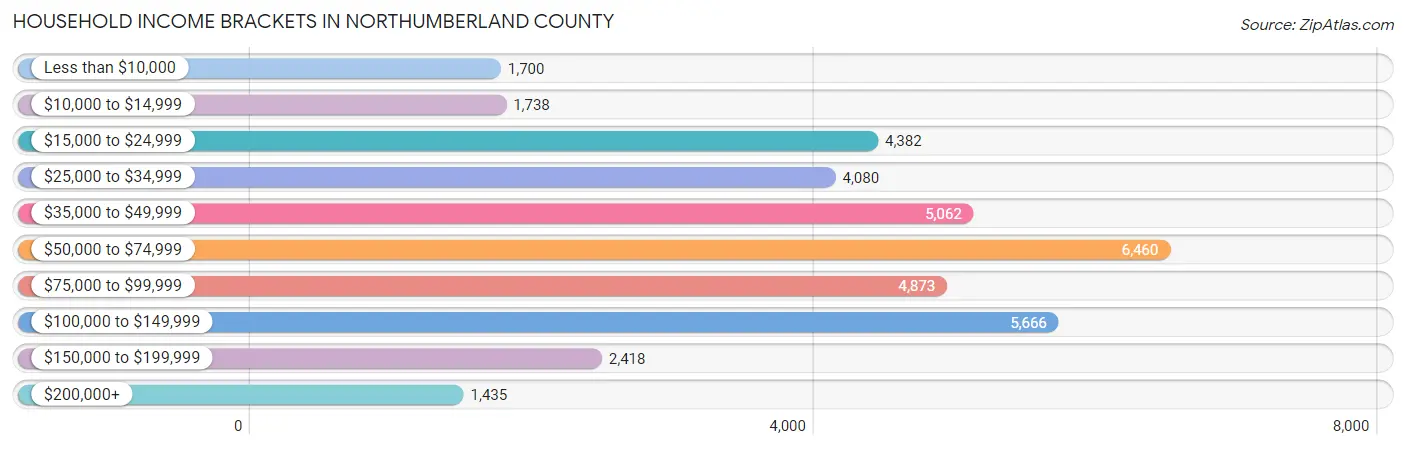
| Income Bracket | # Households | % Households |
| Less than $10,000 | 1,700 | 4.5% |
| $10,000 to $14,999 | 1,738 | 4.6% |
| $15,000 to $24,999 | 4,382 | 11.6% |
| $25,000 to $34,999 | 4,080 | 10.8% |
| $35,000 to $49,999 | 5,062 | 13.4% |
| $50,000 to $74,999 | 6,460 | 17.1% |
| $75,000 to $99,999 | 4,873 | 12.9% |
| $100,000 to $149,999 | 5,666 | 15.0% |
| $150,000 to $199,999 | 2,418 | 6.4% |
| $200,000+ | 1,435 | 3.8% |
Household Income by Householder Age in Northumberland County
The median household income in Northumberland County is $55,952, with the highest median household income of $73,399 found in the 45 to 64 years age bracket for the primary householder. A total of 14,383 households (38.1%) fall into this category. Meanwhile, the 65+ years age bracket for the primary householder has the lowest median household income of $37,075, with 12,725 households (33.7%) in this group.
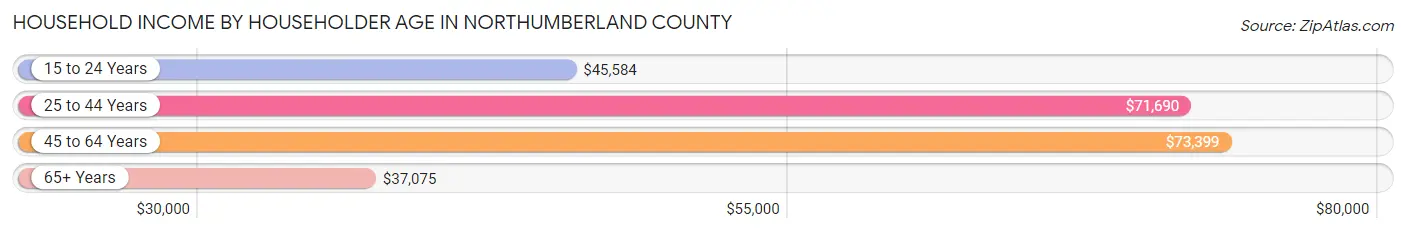
| Income Bracket | # Households | Median Income |
| 15 to 24 Years | 1,032 (2.7%) | $45,584 |
| 25 to 44 Years | 9,635 (25.5%) | $71,690 |
| 45 to 64 Years | 14,383 (38.1%) | $73,399 |
| 65+ Years | 12,725 (33.7%) | $37,075 |
| Total | 37,775 (100.0%) | $55,952 |
Poverty in Northumberland County
Income Below Poverty by Sex and Age in Northumberland County
With 10.8% poverty level for males and 14.0% for females among the residents of Northumberland County, 5 year old males and under 5 year old females are the most vulnerable to poverty, with 157 males (30.8%) and 520 females (24.7%) in their respective age groups living below the poverty level.
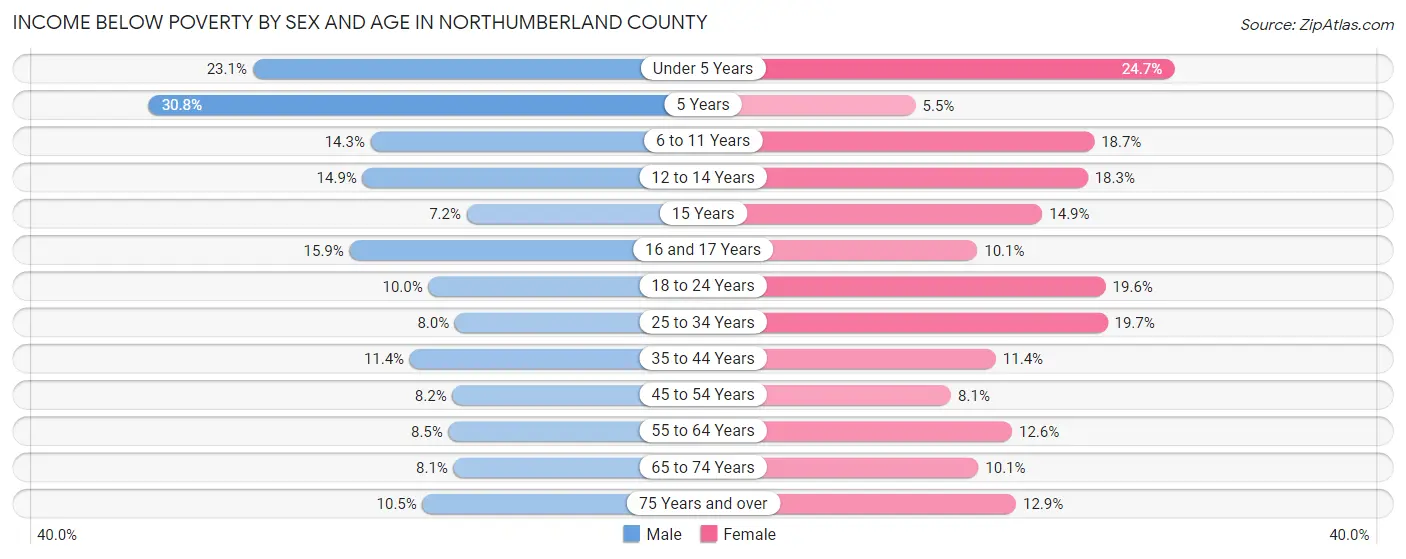
| Age Bracket | Male | Female |
| Under 5 Years | 544 (23.1%) | 520 (24.7%) |
| 5 Years | 157 (30.8%) | 28 (5.5%) |
| 6 to 11 Years | 430 (14.3%) | 549 (18.7%) |
| 12 to 14 Years | 233 (14.9%) | 250 (18.3%) |
| 15 Years | 38 (7.2%) | 74 (14.9%) |
| 16 and 17 Years | 163 (15.9%) | 106 (10.1%) |
| 18 to 24 Years | 326 (10.0%) | 608 (19.6%) |
| 25 to 34 Years | 412 (8.0%) | 1,004 (19.7%) |
| 35 to 44 Years | 563 (11.4%) | 565 (11.4%) |
| 45 to 54 Years | 488 (8.2%) | 451 (8.1%) |
| 55 to 64 Years | 560 (8.5%) | 852 (12.6%) |
| 65 to 74 Years | 443 (8.1%) | 577 (10.1%) |
| 75 Years and over | 344 (10.4%) | 587 (12.9%) |
| Total | 4,701 (10.8%) | 6,171 (14.0%) |
Income Above Poverty by Sex and Age in Northumberland County
According to the poverty statistics in Northumberland County, males aged 15 years and females aged 5 years are the age groups that are most secure financially, with 92.8% of males and 94.5% of females in these age groups living above the poverty line.
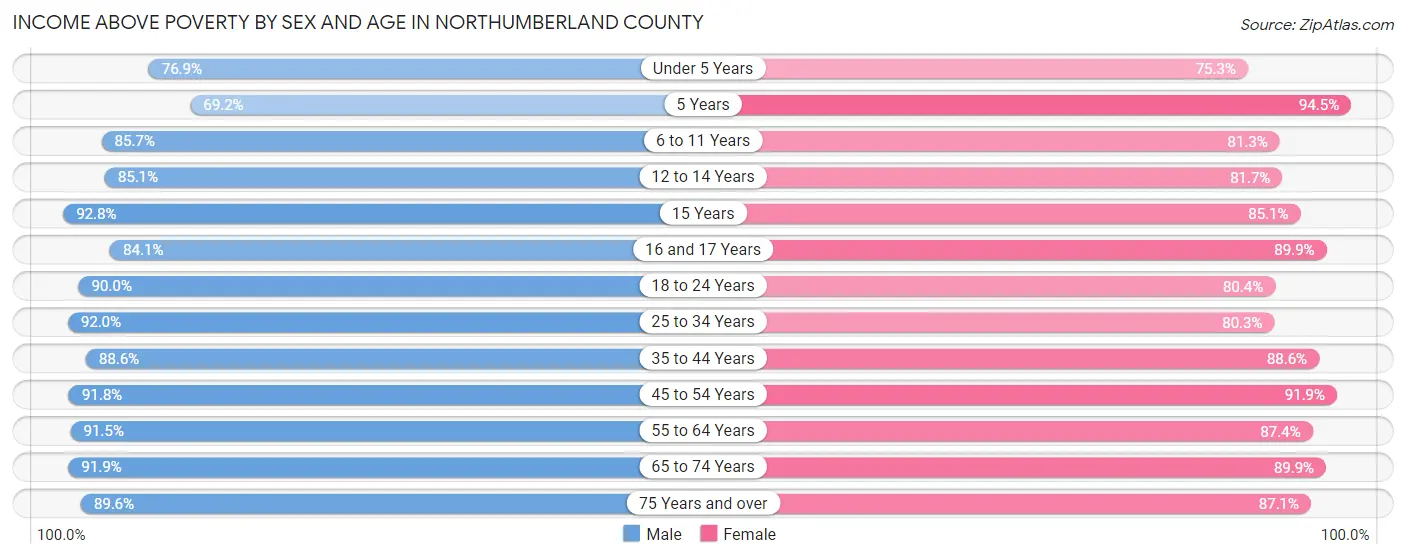
| Age Bracket | Male | Female |
| Under 5 Years | 1,815 (76.9%) | 1,589 (75.3%) |
| 5 Years | 353 (69.2%) | 483 (94.5%) |
| 6 to 11 Years | 2,578 (85.7%) | 2,381 (81.3%) |
| 12 to 14 Years | 1,331 (85.1%) | 1,119 (81.7%) |
| 15 Years | 492 (92.8%) | 423 (85.1%) |
| 16 and 17 Years | 864 (84.1%) | 948 (89.9%) |
| 18 to 24 Years | 2,930 (90.0%) | 2,496 (80.4%) |
| 25 to 34 Years | 4,713 (92.0%) | 4,084 (80.3%) |
| 35 to 44 Years | 4,382 (88.6%) | 4,374 (88.6%) |
| 45 to 54 Years | 5,442 (91.8%) | 5,105 (91.9%) |
| 55 to 64 Years | 6,009 (91.5%) | 5,887 (87.4%) |
| 65 to 74 Years | 5,000 (91.9%) | 5,113 (89.9%) |
| 75 Years and over | 2,948 (89.5%) | 3,950 (87.1%) |
| Total | 38,857 (89.2%) | 37,952 (86.0%) |
Income Below Poverty Among Married-Couple Families in Northumberland County
The poverty statistics for married-couple families in Northumberland County show that 3.3% or 582 of the total 17,836 families live below the poverty line. Families with 5 or more children have the highest poverty rate of 9.8%, comprising of 18 families. On the other hand, families with no children have the lowest poverty rate of 2.8%, which includes 335 families.
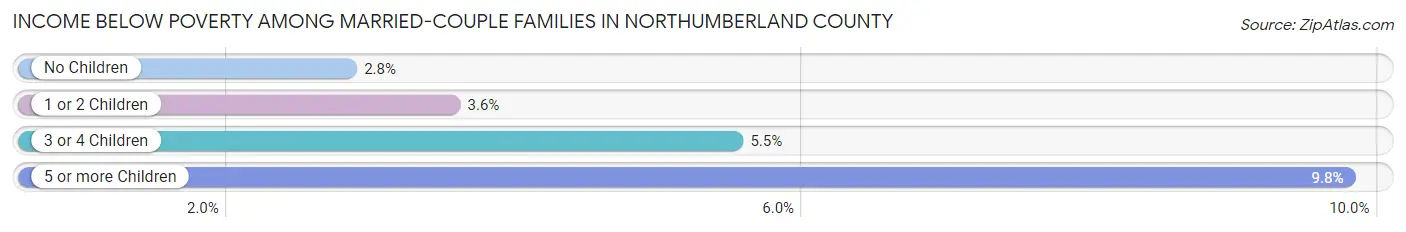
| Children | Above Poverty | Below Poverty |
| No Children | 11,512 (97.2%) | 335 (2.8%) |
| 1 or 2 Children | 4,480 (96.5%) | 165 (3.5%) |
| 3 or 4 Children | 1,096 (94.5%) | 64 (5.5%) |
| 5 or more Children | 166 (90.2%) | 18 (9.8%) |
| Total | 17,254 (96.7%) | 582 (3.3%) |
Income Below Poverty Among Single-Parent Households in Northumberland County
According to the poverty data in Northumberland County, 16.7% or 358 single-father households and 30.0% or 1,182 single-mother households are living below the poverty line. Among single-father households, those with 5 or more children have the highest poverty rate, with 38 households (100.0%) experiencing poverty. Likewise, among single-mother households, those with 3 or 4 children have the highest poverty rate, with 314 households (80.7%) falling below the poverty line.
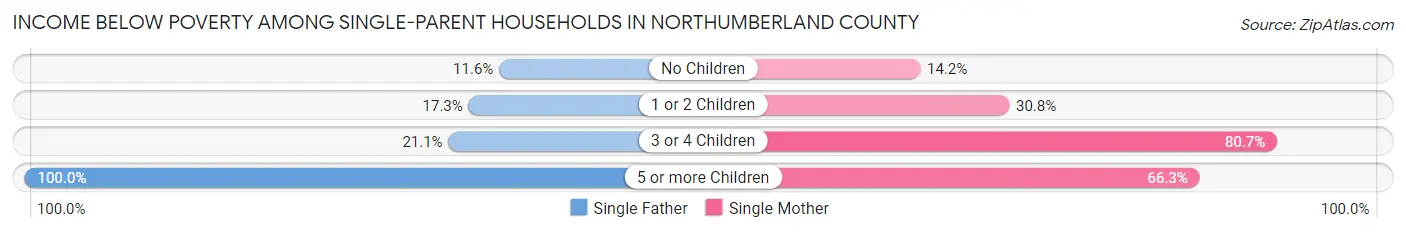
| Children | Single Father | Single Mother |
| No Children | 100 (11.6%) | 222 (14.2%) |
| 1 or 2 Children | 196 (17.3%) | 587 (30.8%) |
| 3 or 4 Children | 24 (21.0%) | 314 (80.7%) |
| 5 or more Children | 38 (100.0%) | 59 (66.3%) |
| Total | 358 (16.7%) | 1,182 (30.0%) |
Income Below Poverty Among Married-Couple vs Single-Parent Households in Northumberland County
The poverty data for Northumberland County shows that 582 of the married-couple family households (3.3%) and 1,540 of the single-parent households (25.3%) are living below the poverty level. Within the married-couple family households, those with 5 or more children have the highest poverty rate, with 18 households (9.8%) falling below the poverty line. Among the single-parent households, those with 5 or more children have the highest poverty rate, with 97 household (76.4%) living below poverty.
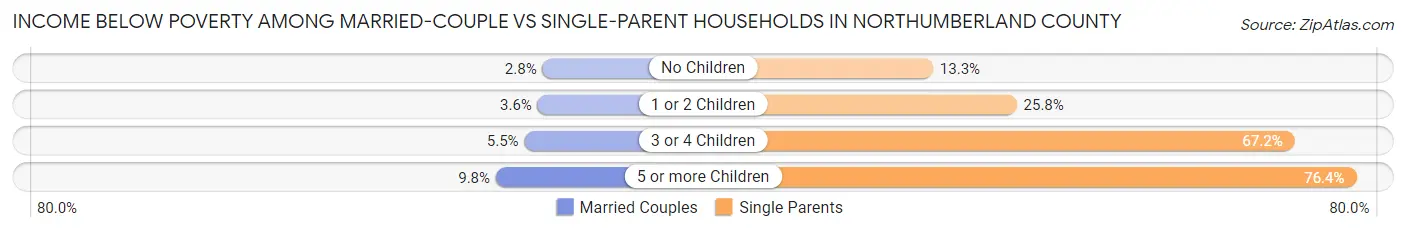
| Children | Married-Couple Families | Single-Parent Households |
| No Children | 335 (2.8%) | 322 (13.3%) |
| 1 or 2 Children | 165 (3.5%) | 783 (25.8%) |
| 3 or 4 Children | 64 (5.5%) | 338 (67.2%) |
| 5 or more Children | 18 (9.8%) | 97 (76.4%) |
| Total | 582 (3.3%) | 1,540 (25.3%) |
Race in Northumberland County
The most populous races in Northumberland County are White / Caucasian (84,070 | 92.0%), Hispanic or Latino (3,879 | 4.3%), and Two or more Races (3,063 | 3.4%).
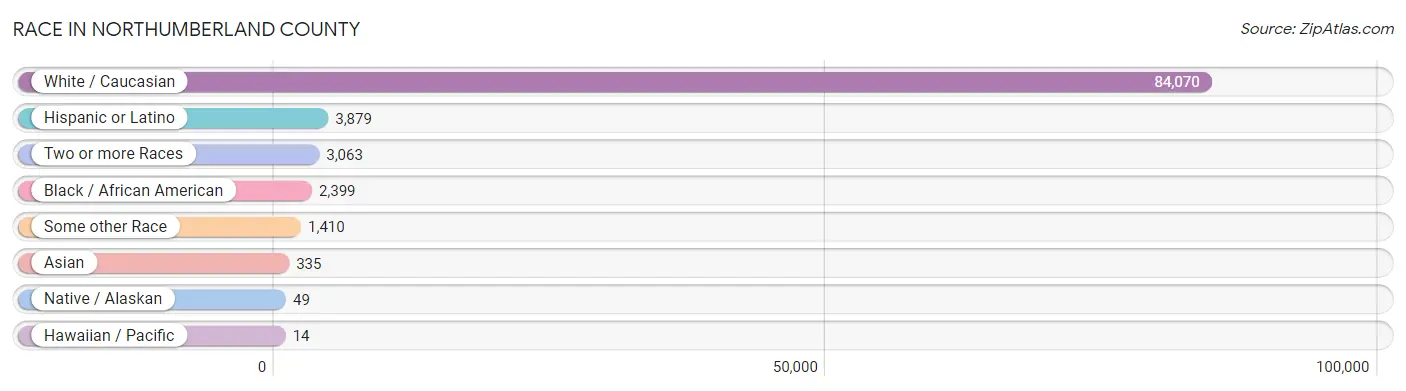
| Race | # Population | % Population |
| Asian | 335 | 0.4% |
| Black / African American | 2,399 | 2.6% |
| Hawaiian / Pacific | 14 | 0.0% |
| Hispanic or Latino | 3,879 | 4.3% |
| Native / Alaskan | 49 | 0.1% |
| White / Caucasian | 84,070 | 92.0% |
| Two or more Races | 3,063 | 3.4% |
| Some other Race | 1,410 | 1.5% |
| Total | 91,340 | 100.0% |
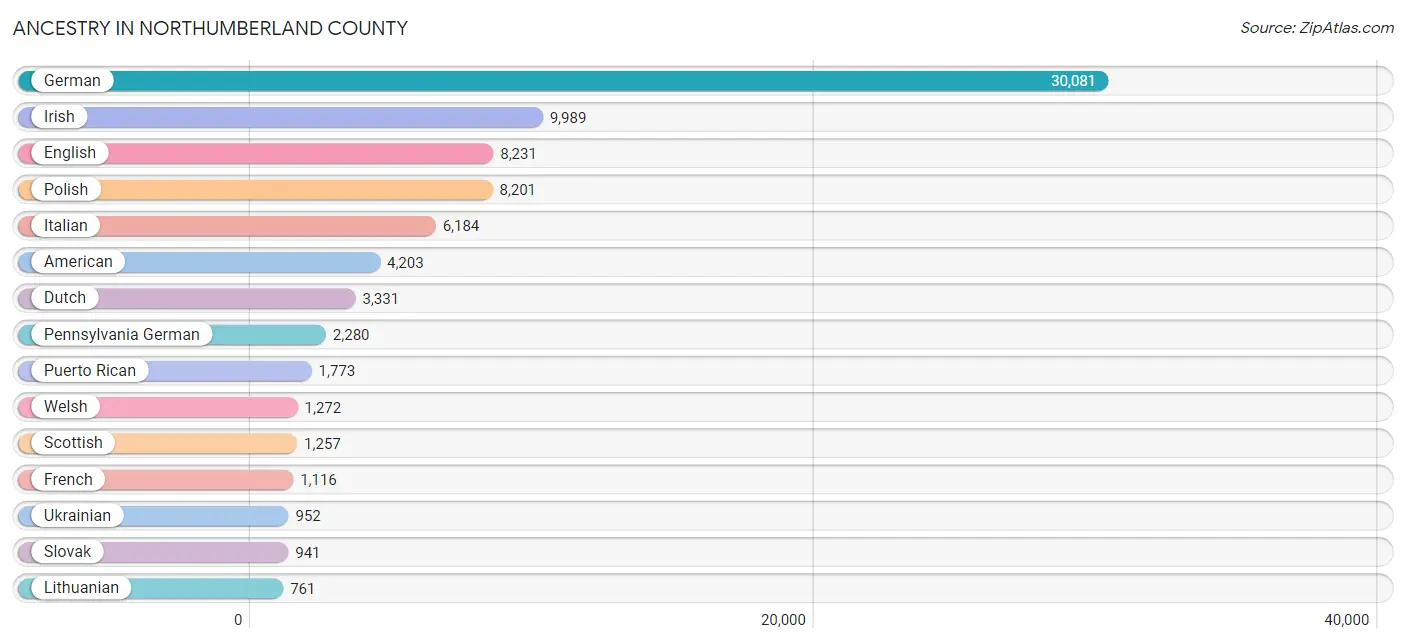
Ancestry in Northumberland County
The most populous ancestries reported in Northumberland County are German (30,081 | 32.9%), Irish (9,989 | 10.9%), English (8,231 | 9.0%), Polish (8,201 | 9.0%), and Italian (6,184 | 6.8%), together accounting for 68.6% of all Northumberland County residents.
| Ancestry | # Population | % Population |
| African | 140 | 0.2% |
| American | 4,203 | 4.6% |
| Arab | 120 | 0.1% |
| Australian | 9 | 0.0% |
| Austrian | 440 | 0.5% |
| Belgian | 93 | 0.1% |
| Bhutanese | 79 | 0.1% |
| Blackfeet | 62 | 0.1% |
| British | 369 | 0.4% |
| Bulgarian | 9 | 0.0% |
| Burmese | 39 | 0.0% |
| Celtic | 10 | 0.0% |
| Central American | 234 | 0.3% |
| Central American Indian | 53 | 0.1% |
| Cherokee | 84 | 0.1% |
| Chilean | 16 | 0.0% |
| Choctaw | 1 | 0.0% |
| Colombian | 299 | 0.3% |
| Comanche | 8 | 0.0% |
| Costa Rican | 2 | 0.0% |
| Croatian | 7 | 0.0% |
| Cuban | 111 | 0.1% |
| Cypriot | 8 | 0.0% |
| Czech | 169 | 0.2% |
| Czechoslovakian | 46 | 0.1% |
| Danish | 78 | 0.1% |
| Dominican | 340 | 0.4% |
| Dutch | 3,331 | 3.6% |
| Eastern European | 285 | 0.3% |
| Ecuadorian | 2 | 0.0% |
| Egyptian | 10 | 0.0% |
| English | 8,231 | 9.0% |
| Ethiopian | 52 | 0.1% |
| European | 542 | 0.6% |
| French | 1,116 | 1.2% |
| French Canadian | 20 | 0.0% |
| German | 30,081 | 32.9% |
| Ghanaian | 1 | 0.0% |
| Greek | 90 | 0.1% |
| Guatemalan | 148 | 0.2% |
| Guyanese | 24 | 0.0% |
| Haitian | 35 | 0.0% |
| Honduran | 49 | 0.1% |
| Hungarian | 447 | 0.5% |
| Icelander | 7 | 0.0% |
| Indian (Asian) | 236 | 0.3% |
| Inupiat | 5 | 0.0% |
| Irish | 9,989 | 10.9% |
| Iroquois | 4 | 0.0% |
| Italian | 6,184 | 6.8% |
| Jamaican | 27 | 0.0% |
| Kenyan | 1 | 0.0% |
| Korean | 98 | 0.1% |
| Lebanese | 100 | 0.1% |
| Lithuanian | 761 | 0.8% |
| Lumbee | 7 | 0.0% |
| Macedonian | 19 | 0.0% |
| Mexican | 733 | 0.8% |
| Moroccan | 5 | 0.0% |
| Nigerian | 13 | 0.0% |
| Northern European | 61 | 0.1% |
| Norwegian | 142 | 0.2% |
| Pakistani | 2 | 0.0% |
| Pennsylvania German | 2,280 | 2.5% |
| Peruvian | 7 | 0.0% |
| Polish | 8,201 | 9.0% |
| Portuguese | 95 | 0.1% |
| Puerto Rican | 1,773 | 1.9% |
| Romanian | 90 | 0.1% |
| Russian | 707 | 0.8% |
| Salvadoran | 35 | 0.0% |
| Samoan | 3 | 0.0% |
| Scandinavian | 88 | 0.1% |
| Scotch-Irish | 417 | 0.5% |
| Scottish | 1,257 | 1.4% |
| Serbian | 15 | 0.0% |
| Sioux | 69 | 0.1% |
| Slavic | 124 | 0.1% |
| Slovak | 941 | 1.0% |
| Slovene | 17 | 0.0% |
| South American | 324 | 0.4% |
| Spaniard | 58 | 0.1% |
| Spanish | 23 | 0.0% |
| Sri Lankan | 100 | 0.1% |
| Subsaharan African | 248 | 0.3% |
| Swedish | 391 | 0.4% |
| Swiss | 276 | 0.3% |
| Thai | 138 | 0.2% |
| Trinidadian and Tobagonian | 3 | 0.0% |
| Ukrainian | 952 | 1.0% |
| Welsh | 1,272 | 1.4% |
| Yugoslavian | 6 | 0.0% | View All 92 Rows |
Immigrants in Northumberland County
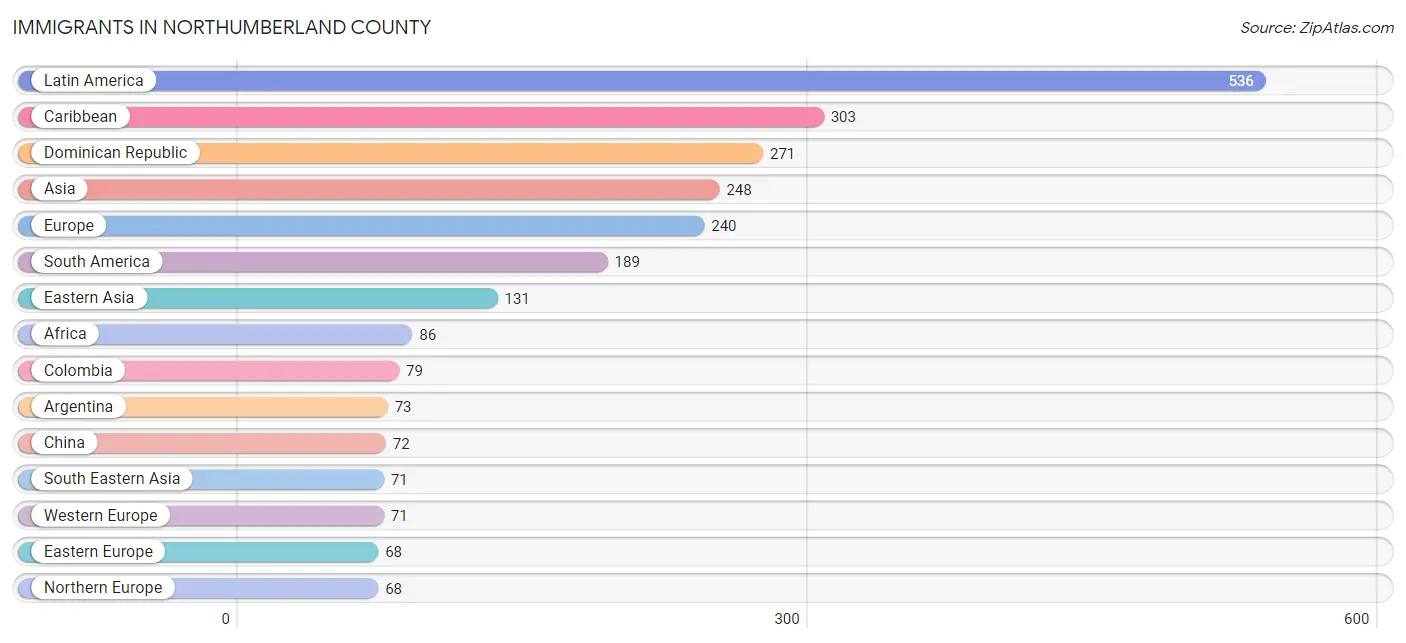
The most numerous immigrant groups reported in Northumberland County came from Latin America (536 | 0.6%), Caribbean (303 | 0.3%), Dominican Republic (271 | 0.3%), Asia (248 | 0.3%), and Europe (240 | 0.3%), together accounting for 1.8% of all Northumberland County residents.
| Immigration Origin | # Population | % Population |
| Africa | 86 | 0.1% |
| Argentina | 73 | 0.1% |
| Asia | 248 | 0.3% |
| Australia | 9 | 0.0% |
| Belarus | 4 | 0.0% |
| Canada | 3 | 0.0% |
| Caribbean | 303 | 0.3% |
| Central America | 44 | 0.1% |
| China | 72 | 0.1% |
| Colombia | 79 | 0.1% |
| Costa Rica | 2 | 0.0% |
| Cuba | 6 | 0.0% |
| Dominican Republic | 271 | 0.3% |
| Eastern Africa | 53 | 0.1% |
| Eastern Asia | 131 | 0.1% |
| Eastern Europe | 68 | 0.1% |
| Ecuador | 2 | 0.0% |
| Egypt | 10 | 0.0% |
| England | 11 | 0.0% |
| Ethiopia | 52 | 0.1% |
| Europe | 240 | 0.3% |
| France | 4 | 0.0% |
| Germany | 59 | 0.1% |
| Guatemala | 41 | 0.0% |
| Guyana | 24 | 0.0% |
| Honduras | 1 | 0.0% |
| Hungary | 1 | 0.0% |
| India | 33 | 0.0% |
| Ireland | 25 | 0.0% |
| Italy | 33 | 0.0% |
| Jamaica | 20 | 0.0% |
| Japan | 20 | 0.0% |
| Kazakhstan | 13 | 0.0% |
| Kenya | 1 | 0.0% |
| Korea | 39 | 0.0% |
| Latin America | 536 | 0.6% |
| Lithuania | 2 | 0.0% |
| Netherlands | 8 | 0.0% |
| Nigeria | 13 | 0.0% |
| Northern Africa | 15 | 0.0% |
| Northern Europe | 68 | 0.1% |
| Oceania | 9 | 0.0% |
| Peru | 7 | 0.0% |
| Philippines | 42 | 0.1% |
| Poland | 19 | 0.0% |
| Russia | 6 | 0.0% |
| South Africa | 4 | 0.0% |
| South America | 189 | 0.2% |
| South Central Asia | 46 | 0.1% |
| South Eastern Asia | 71 | 0.1% |
| Southern Europe | 33 | 0.0% |
| Taiwan | 1 | 0.0% |
| Thailand | 2 | 0.0% |
| Trinidad and Tobago | 6 | 0.0% |
| Ukraine | 36 | 0.0% |
| Vietnam | 27 | 0.0% |
| Western Africa | 14 | 0.0% |
| Western Europe | 71 | 0.1% | View All 58 Rows |
Sex and Age in Northumberland County
Sex and Age in Northumberland County
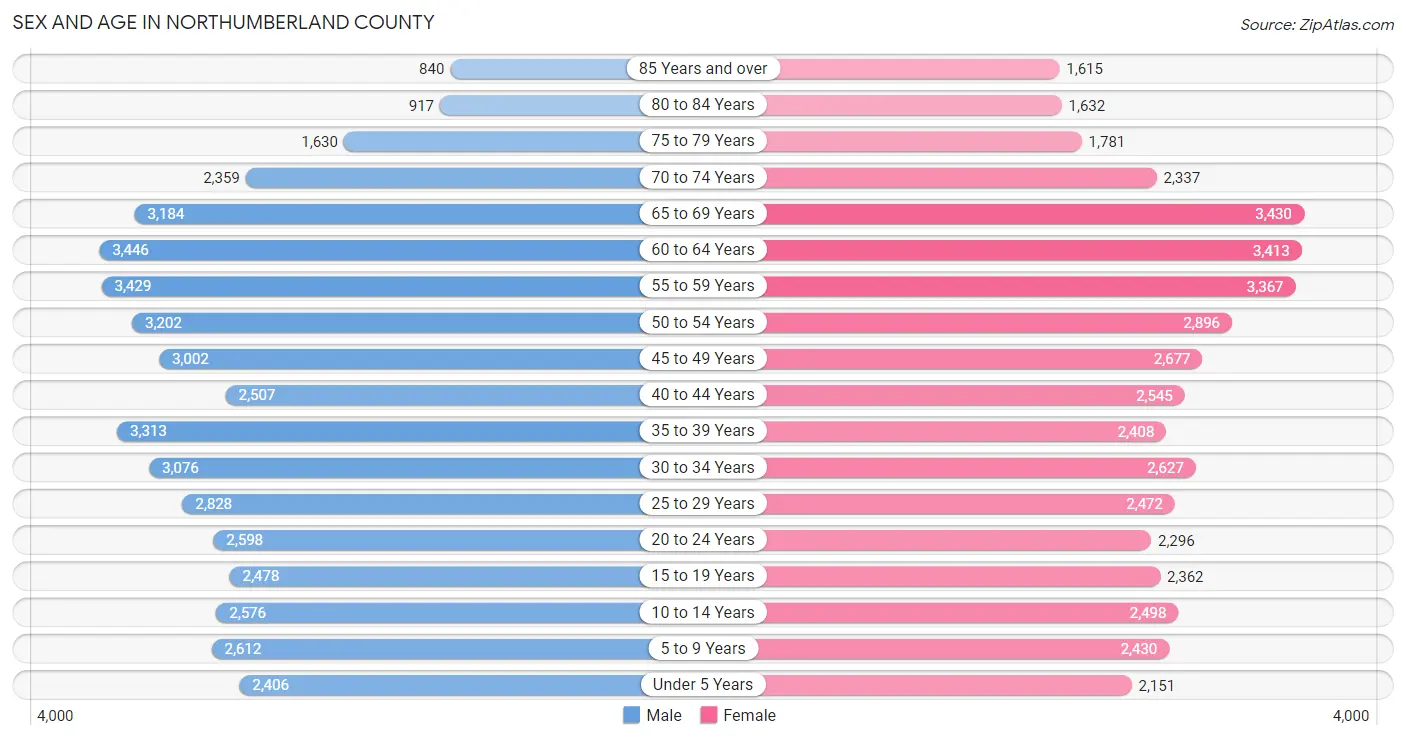
The most populous age groups in Northumberland County are 60 to 64 Years (3,446 | 7.4%) for men and 65 to 69 Years (3,430 | 7.6%) for women.
| Age Bracket | Male | Female |
| Under 5 Years | 2,406 (5.2%) | 2,151 (4.8%) |
| 5 to 9 Years | 2,612 (5.6%) | 2,430 (5.4%) |
| 10 to 14 Years | 2,576 (5.6%) | 2,498 (5.6%) |
| 15 to 19 Years | 2,478 (5.3%) | 2,362 (5.3%) |
| 20 to 24 Years | 2,598 (5.6%) | 2,296 (5.1%) |
| 25 to 29 Years | 2,828 (6.1%) | 2,472 (5.5%) |
| 30 to 34 Years | 3,076 (6.6%) | 2,627 (5.9%) |
| 35 to 39 Years | 3,313 (7.1%) | 2,408 (5.4%) |
| 40 to 44 Years | 2,507 (5.4%) | 2,545 (5.7%) |
| 45 to 49 Years | 3,002 (6.5%) | 2,677 (6.0%) |
| 50 to 54 Years | 3,202 (6.9%) | 2,896 (6.4%) |
| 55 to 59 Years | 3,429 (7.4%) | 3,367 (7.5%) |
| 60 to 64 Years | 3,446 (7.4%) | 3,413 (7.6%) |
| 65 to 69 Years | 3,184 (6.9%) | 3,430 (7.6%) |
| 70 to 74 Years | 2,359 (5.1%) | 2,337 (5.2%) |
| 75 to 79 Years | 1,630 (3.5%) | 1,781 (4.0%) |
| 80 to 84 Years | 917 (2.0%) | 1,632 (3.6%) |
| 85 Years and over | 840 (1.8%) | 1,615 (3.6%) |
| Total | 46,403 (100.0%) | 44,937 (100.0%) |
Families and Households in Northumberland County
Median Family Size in Northumberland County
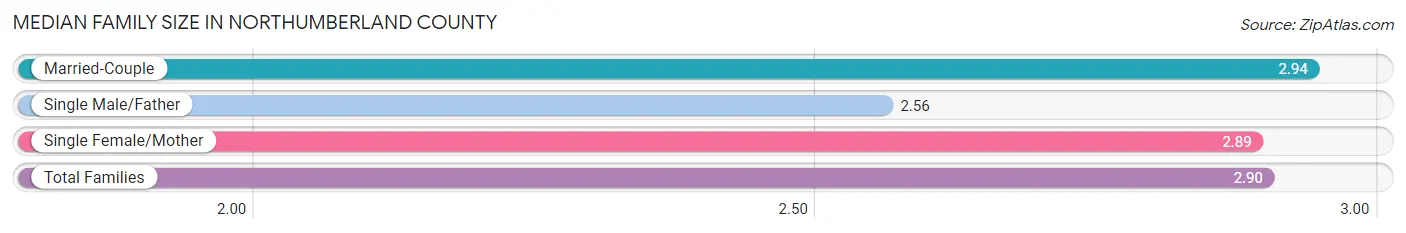
The median family size in Northumberland County is 2.90 persons per family, with married-couple families (17,836 | 74.6%) accounting for the largest median family size of 2.94 persons per family. On the other hand, single male/father families (2,146 | 9.0%) represent the smallest median family size with 2.56 persons per family.
| Family Type | # Families | Family Size |
| Married-Couple | 17,836 (74.6%) | 2.94 |
| Single Male/Father | 2,146 (9.0%) | 2.56 |
| Single Female/Mother | 3,944 (16.5%) | 2.89 |
| Total Families | 23,926 (100.0%) | 2.90 |
Median Household Size in Northumberland County
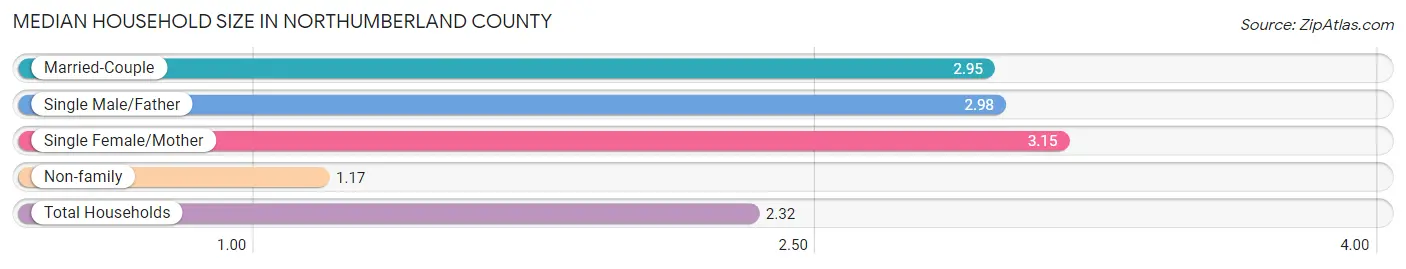
The median household size in Northumberland County is 2.32 persons per household, with single female/mother households (3,944 | 10.4%) accounting for the largest median household size of 3.15 persons per household. non-family households (13,849 | 36.7%) represent the smallest median household size with 1.17 persons per household.
| Household Type | # Households | Household Size |
| Married-Couple | 17,836 (47.2%) | 2.95 |
| Single Male/Father | 2,146 (5.7%) | 2.98 |
| Single Female/Mother | 3,944 (10.4%) | 3.15 |
| Non-family | 13,849 (36.7%) | 1.17 |
| Total Households | 37,775 (100.0%) | 2.32 |
Household Size by Marriage Status in Northumberland County
Out of a total of 37,775 households in Northumberland County, 23,926 (63.3%) are family households, while 13,849 (36.7%) are nonfamily households. The most numerous type of family households are 2-person households, comprising 11,815, and the most common type of nonfamily households are 1-person households, comprising 11,895.
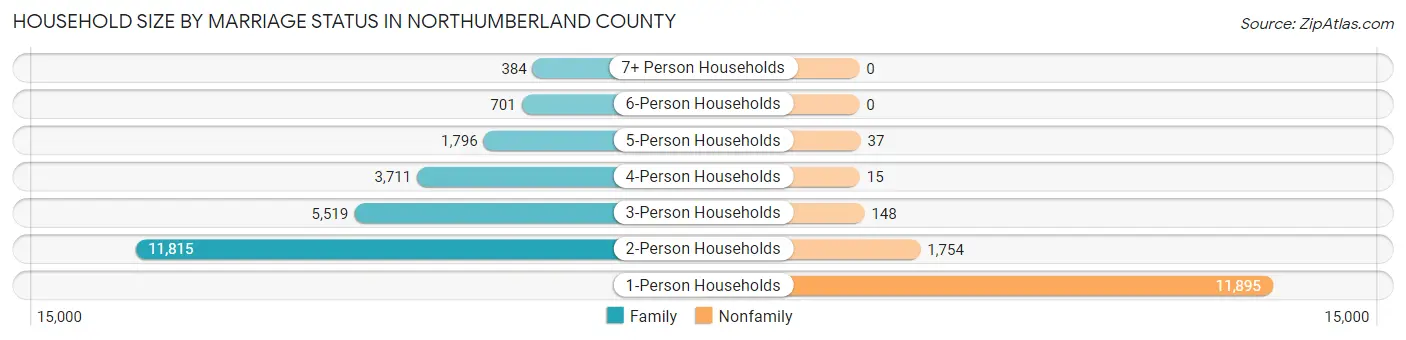
| Household Size | Family Households | Nonfamily Households |
| 1-Person Households | - | 11,895 (31.5%) |
| 2-Person Households | 11,815 (31.3%) | 1,754 (4.6%) |
| 3-Person Households | 5,519 (14.6%) | 148 (0.4%) |
| 4-Person Households | 3,711 (9.8%) | 15 (0.0%) |
| 5-Person Households | 1,796 (4.8%) | 37 (0.1%) |
| 6-Person Households | 701 (1.9%) | 0 (0.0%) |
| 7+ Person Households | 384 (1.0%) | 0 (0.0%) |
| Total | 23,926 (63.3%) | 13,849 (36.7%) |
Female Fertility in Northumberland County
Fertility by Age in Northumberland County
Average fertility rate in Northumberland County is 69.0 births per 1,000 women. Women in the age bracket of 20 to 34 years have the highest fertility rate with 135.0 births per 1,000 women. Women in the age bracket of 20 to 34 years acount for 80.4% of all women with births.
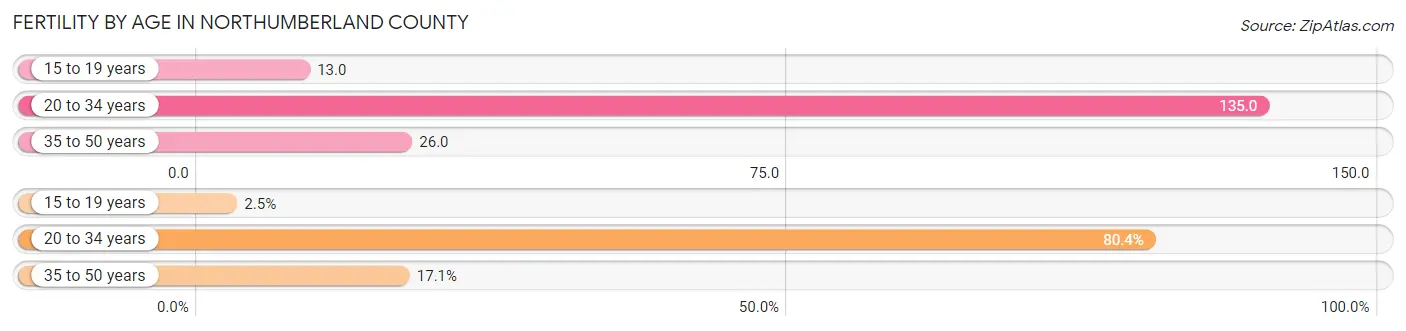
| Age Bracket | Women with Births | Births / 1,000 Women |
| 15 to 19 years | 31 (2.5%) | 13.0 |
| 20 to 34 years | 1,000 (80.4%) | 135.0 |
| 35 to 50 years | 213 (17.1%) | 26.0 |
| Total | 1,244 (100.0%) | 69.0 |
Fertility by Age by Marriage Status in Northumberland County
60.4% of women with births (1,244) in Northumberland County are married. The highest percentage of unmarried women with births falls into 15 to 19 years age bracket with 100.0% of them unmarried at the time of birth, while the lowest percentage of unmarried women with births belong to 35 to 50 years age bracket with 9.9% of them unmarried.
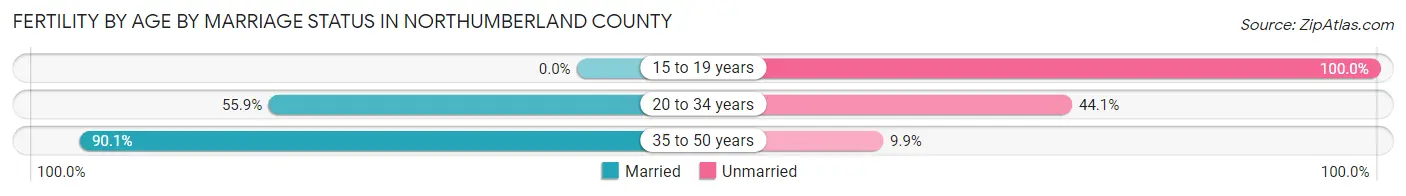
| Age Bracket | Married | Unmarried |
| 15 to 19 years | 0 (0.0%) | 31 (100.0%) |
| 20 to 34 years | 559 (55.9%) | 441 (44.1%) |
| 35 to 50 years | 192 (90.1%) | 21 (9.9%) |
| Total | 751 (60.4%) | 493 (39.6%) |
Fertility by Education in Northumberland County
Average fertility rate in Northumberland County is 69.0 births per 1,000 women. Women with the education attainment of high school diploma have the highest fertility rate of 89.0 births per 1,000 women, while women with the education attainment of less than high school have the lowest fertility at 49.0 births per 1,000 women. Women with the education attainment of high school diploma represent 37.6% of all women with births.
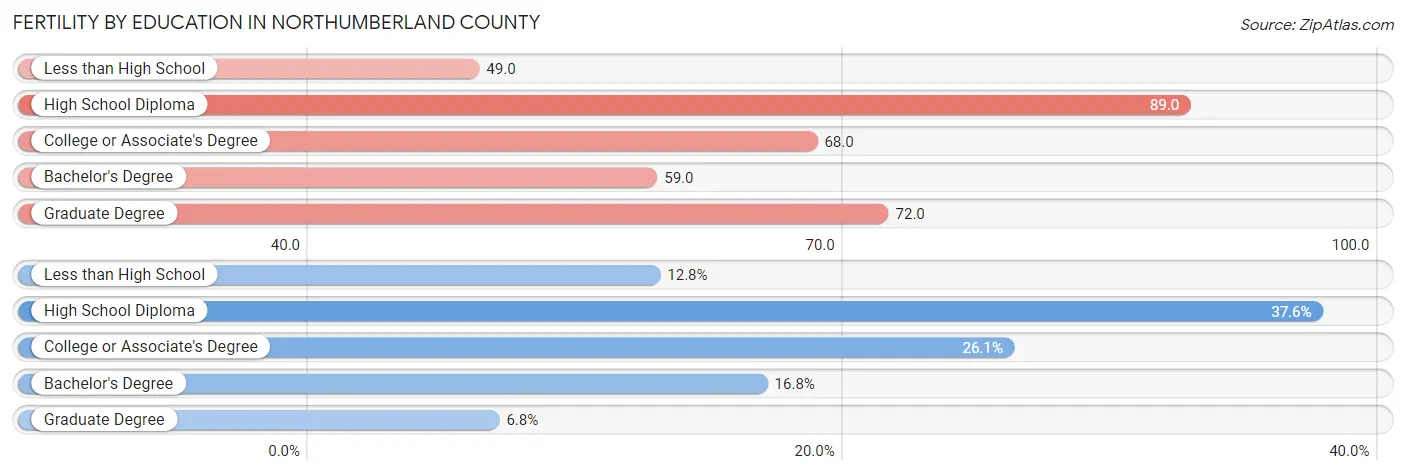
| Educational Attainment | Women with Births | Births / 1,000 Women |
| Less than High School | 159 (12.8%) | 49.0 |
| High School Diploma | 468 (37.6%) | 89.0 |
| College or Associate's Degree | 324 (26.1%) | 68.0 |
| Bachelor's Degree | 209 (16.8%) | 59.0 |
| Graduate Degree | 84 (6.8%) | 72.0 |
| Total | 1,244 (100.0%) | 69.0 |
Fertility by Education by Marriage Status in Northumberland County
39.6% of women with births in Northumberland County are unmarried. Women with the educational attainment of graduate degree are most likely to be married with 100.0% of them married at childbirth, while women with the educational attainment of high school diploma are least likely to be married with 52.6% of them unmarried at childbirth.
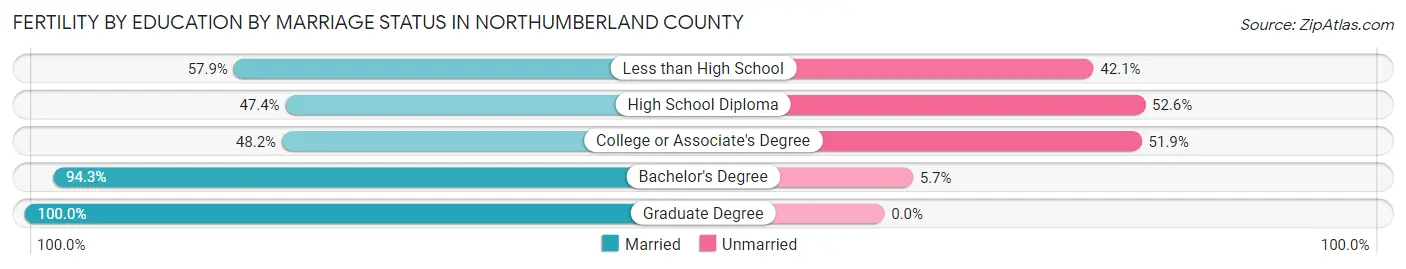
| Educational Attainment | Married | Unmarried |
| Less than High School | 92 (57.9%) | 67 (42.1%) |
| High School Diploma | 222 (47.4%) | 246 (52.6%) |
| College or Associate's Degree | 156 (48.1%) | 168 (51.8%) |
| Bachelor's Degree | 197 (94.3%) | 12 (5.7%) |
| Graduate Degree | 84 (100.0%) | 0 (0.0%) |
| Total | 751 (60.4%) | 493 (39.6%) |
Employment Characteristics in Northumberland County
Employment by Class of Employer in Northumberland County
Among the 40,657 employed individuals in Northumberland County, private company employees (26,947 | 66.3%), not-for-profit organizations (5,183 | 12.8%), and local government employees (2,451 | 6.0%) make up the most common classes of employment.
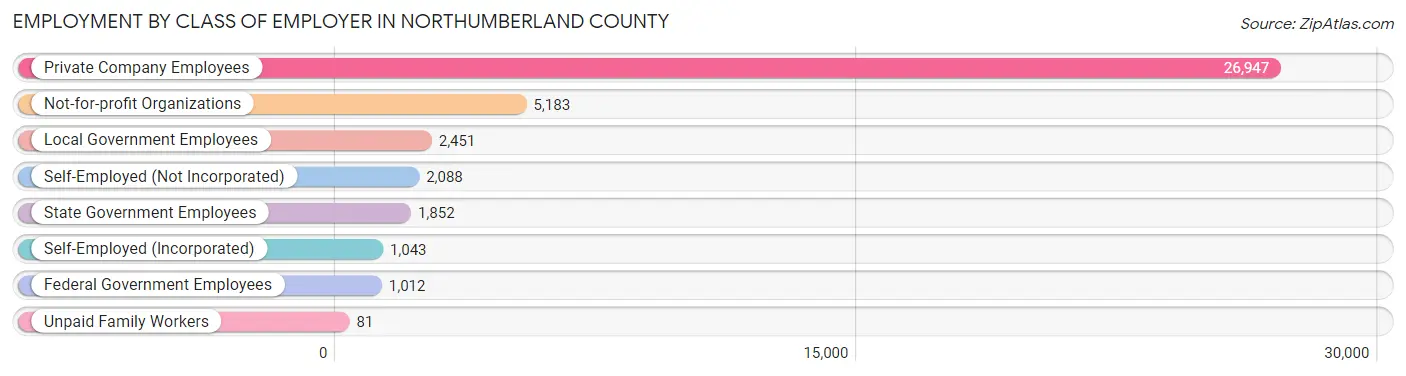
| Employer Class | # Employees | % Employees |
| Private Company Employees | 26,947 | 66.3% |
| Self-Employed (Incorporated) | 1,043 | 2.6% |
| Self-Employed (Not Incorporated) | 2,088 | 5.1% |
| Not-for-profit Organizations | 5,183 | 12.8% |
| Local Government Employees | 2,451 | 6.0% |
| State Government Employees | 1,852 | 4.6% |
| Federal Government Employees | 1,012 | 2.5% |
| Unpaid Family Workers | 81 | 0.2% |
| Total | 40,657 | 100.0% |
Employment Status by Age in Northumberland County
According to the labor force statistics for Northumberland County, out of the total population over 16 years of age (75,640), 57.5% or 43,493 individuals are in the labor force, with 4.7% or 2,044 of them unemployed. The age group with the highest labor force participation rate is 45 to 54 years, with 81.9% or 9,645 individuals in the labor force. Within the labor force, the 16 to 19 years age range has the highest percentage of unemployed individuals, with 11.7% or 194 of them being unemployed.
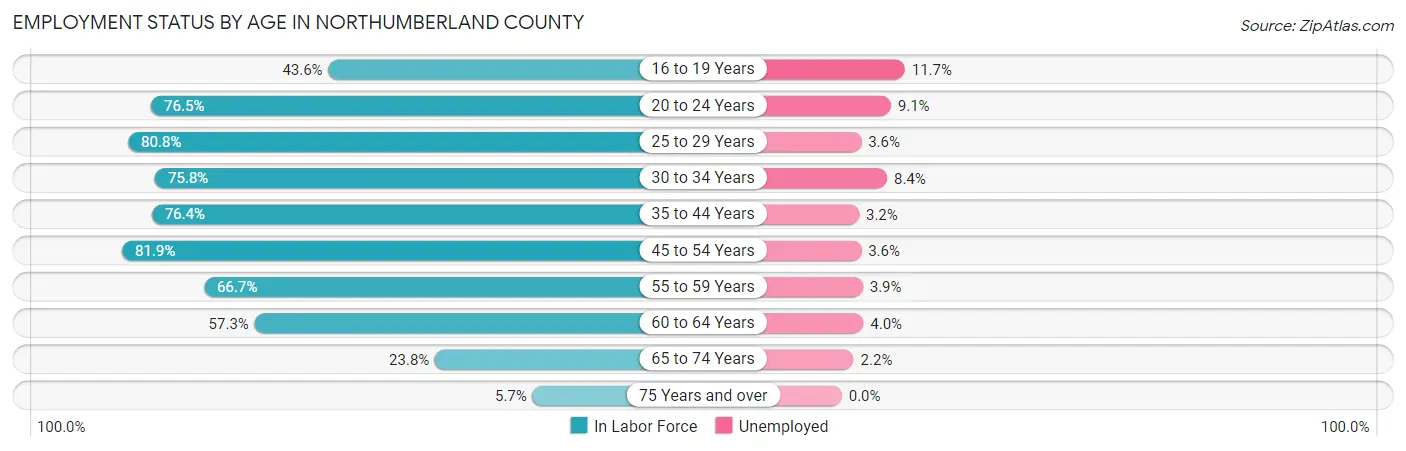
| Age Bracket | In Labor Force | Unemployed |
| 16 to 19 Years | 1,662 (43.6%) | 194 (11.7%) |
| 20 to 24 Years | 3,744 (76.5%) | 341 (9.1%) |
| 25 to 29 Years | 4,282 (80.8%) | 154 (3.6%) |
| 30 to 34 Years | 4,323 (75.8%) | 363 (8.4%) |
| 35 to 44 Years | 8,231 (76.4%) | 263 (3.2%) |
| 45 to 54 Years | 9,645 (81.9%) | 347 (3.6%) |
| 55 to 59 Years | 4,533 (66.7%) | 177 (3.9%) |
| 60 to 64 Years | 3,930 (57.3%) | 157 (4.0%) |
| 65 to 74 Years | 2,692 (23.8%) | 59 (2.2%) |
| 75 Years and over | 480 (5.7%) | 0 (0.0%) |
| Total | 43,493 (57.5%) | 2,044 (4.7%) |
Employment Status by Educational Attainment in Northumberland County
According to labor force statistics for Northumberland County, 74.0% of individuals (34,934) out of the total population between 25 and 64 years of age (47,208) are in the labor force, with 4.2% or 1,467 of them being unemployed. The group with the highest labor force participation rate are those with the educational attainment of bachelor's degree or higher, with 89.9% or 8,706 individuals in the labor force. Within the labor force, individuals with college / associate degree education have the highest percentage of unemployment, with 7.4% or 702 of them being unemployed.
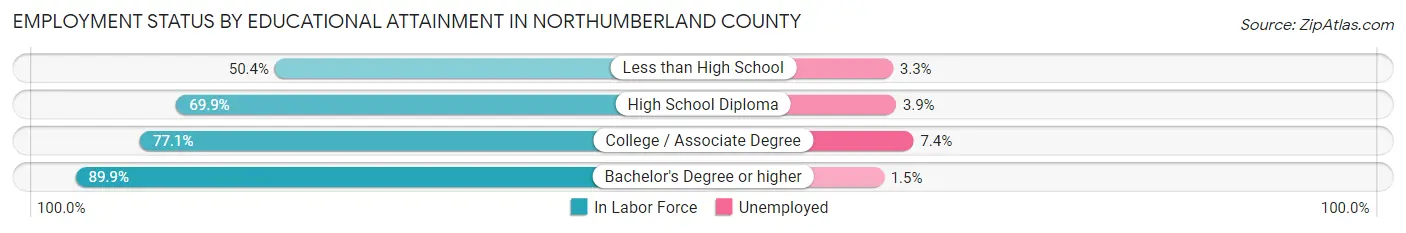
| Educational Attainment | In Labor Force | Unemployed |
| Less than High School | 2,266 (50.4%) | 148 (3.3%) |
| High School Diploma | 14,483 (69.9%) | 808 (3.9%) |
| College / Associate Degree | 9,489 (77.1%) | 911 (7.4%) |
| Bachelor's Degree or higher | 8,706 (89.9%) | 145 (1.5%) |
| Total | 34,934 (74.0%) | 1,983 (4.2%) |
Employment Occupations by Sex in Northumberland County
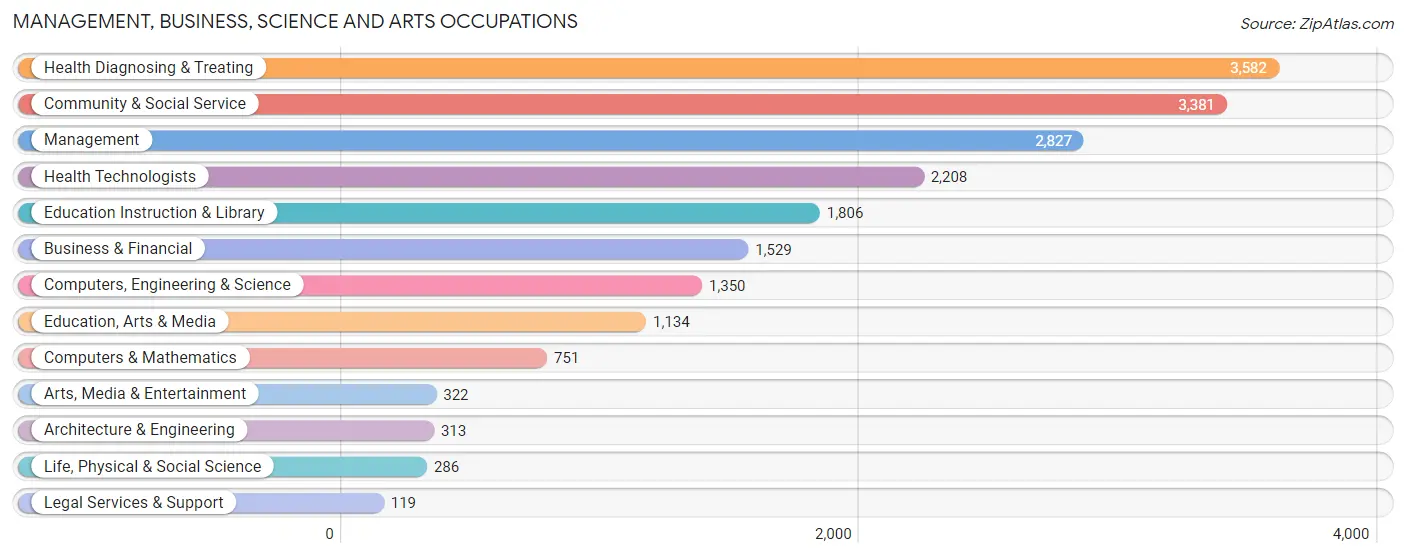
Management, Business, Science and Arts Occupations
The most common Management, Business, Science and Arts occupations in Northumberland County are Health Diagnosing & Treating (3,582 | 8.6%), Community & Social Service (3,381 | 8.2%), Management (2,827 | 6.8%), Health Technologists (2,208 | 5.3%), and Education Instruction & Library (1,806 | 4.4%).
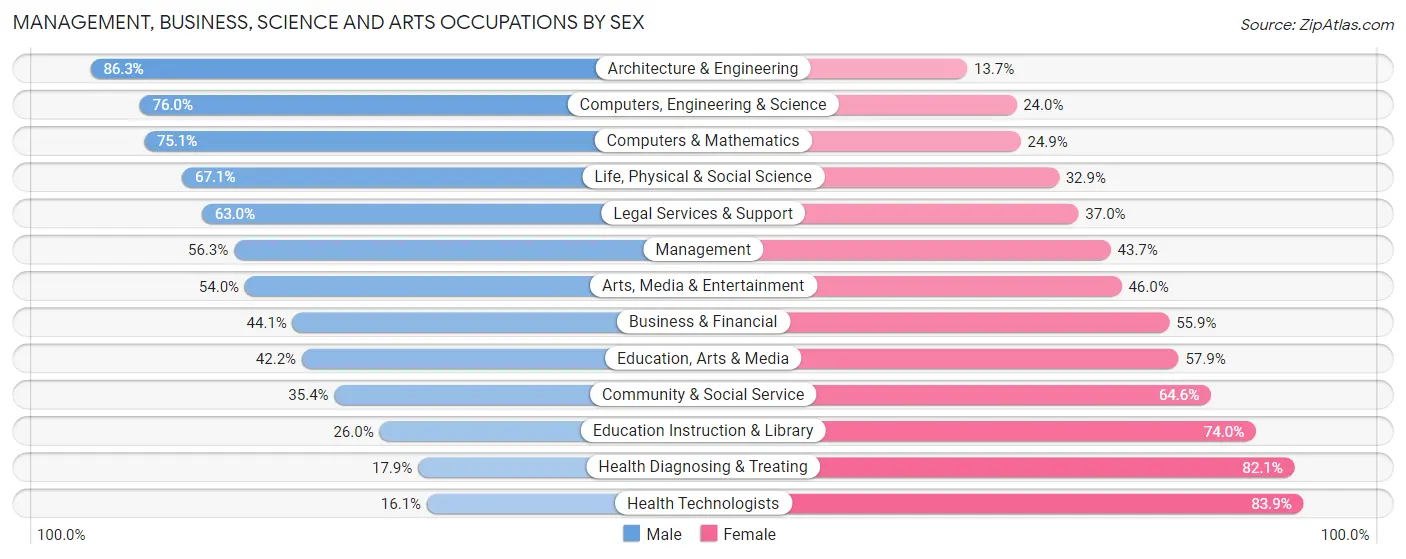
Management, Business, Science and Arts Occupations by Sex
Within the Management, Business, Science and Arts occupations in Northumberland County, the most male-oriented occupations are Architecture & Engineering (86.3%), Computers, Engineering & Science (76.0%), and Computers & Mathematics (75.1%), while the most female-oriented occupations are Health Technologists (83.9%), Health Diagnosing & Treating (82.1%), and Education Instruction & Library (74.0%).
| Occupation | Male | Female |
| Management | 1,592 (56.3%) | 1,235 (43.7%) |
| Business & Financial | 674 (44.1%) | 855 (55.9%) |
| Computers, Engineering & Science | 1,026 (76.0%) | 324 (24.0%) |
| Computers & Mathematics | 564 (75.1%) | 187 (24.9%) |
| Architecture & Engineering | 270 (86.3%) | 43 (13.7%) |
| Life, Physical & Social Science | 192 (67.1%) | 94 (32.9%) |
| Community & Social Service | 1,196 (35.4%) | 2,185 (64.6%) |
| Education, Arts & Media | 478 (42.1%) | 656 (57.9%) |
| Legal Services & Support | 75 (63.0%) | 44 (37.0%) |
| Education Instruction & Library | 469 (26.0%) | 1,337 (74.0%) |
| Arts, Media & Entertainment | 174 (54.0%) | 148 (46.0%) |
| Health Diagnosing & Treating | 642 (17.9%) | 2,940 (82.1%) |
| Health Technologists | 355 (16.1%) | 1,853 (83.9%) |
| Total (Category) | 5,130 (40.5%) | 7,539 (59.5%) |
| Total (Overall) | 21,809 (52.6%) | 19,652 (47.4%) |
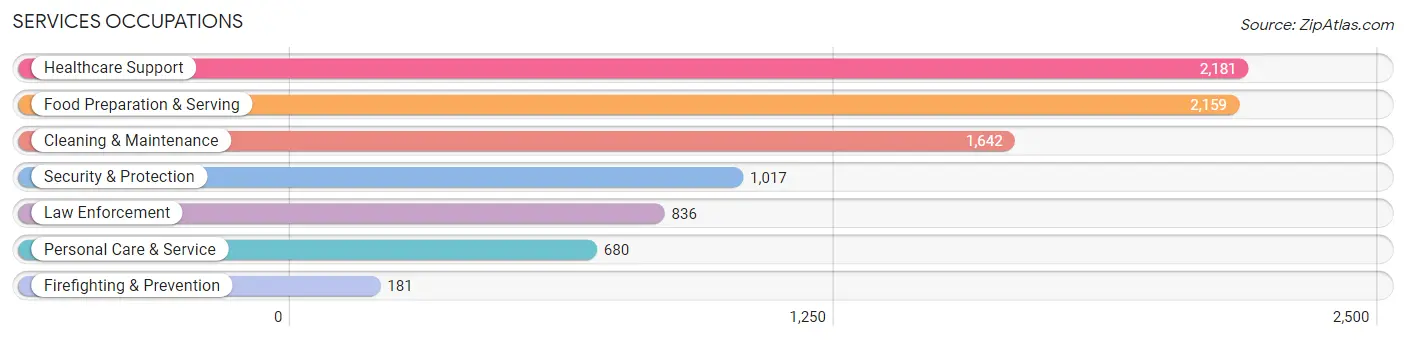
Services Occupations
The most common Services occupations in Northumberland County are Healthcare Support (2,181 | 5.3%), Food Preparation & Serving (2,159 | 5.2%), Cleaning & Maintenance (1,642 | 4.0%), Security & Protection (1,017 | 2.5%), and Law Enforcement (836 | 2.0%).
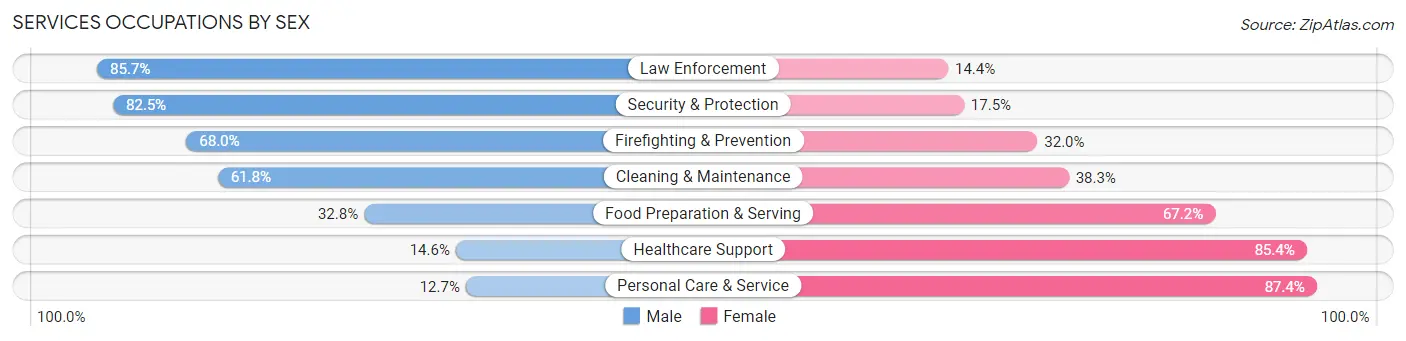
Services Occupations by Sex
Within the Services occupations in Northumberland County, the most male-oriented occupations are Law Enforcement (85.7%), Security & Protection (82.5%), and Firefighting & Prevention (68.0%), while the most female-oriented occupations are Personal Care & Service (87.4%), Healthcare Support (85.4%), and Food Preparation & Serving (67.2%).
| Occupation | Male | Female |
| Healthcare Support | 319 (14.6%) | 1,862 (85.4%) |
| Security & Protection | 839 (82.5%) | 178 (17.5%) |
| Firefighting & Prevention | 123 (68.0%) | 58 (32.0%) |
| Law Enforcement | 716 (85.7%) | 120 (14.3%) |
| Food Preparation & Serving | 708 (32.8%) | 1,451 (67.2%) |
| Cleaning & Maintenance | 1,014 (61.8%) | 628 (38.3%) |
| Personal Care & Service | 86 (12.7%) | 594 (87.4%) |
| Total (Category) | 2,966 (38.6%) | 4,713 (61.4%) |
| Total (Overall) | 21,809 (52.6%) | 19,652 (47.4%) |
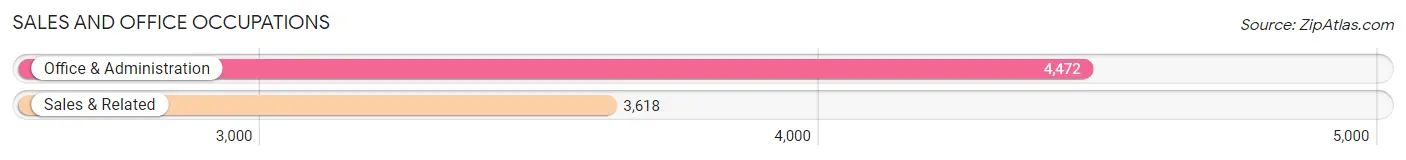
Sales and Office Occupations
The most common Sales and Office occupations in Northumberland County are Office & Administration (4,472 | 10.8%), and Sales & Related (3,618 | 8.7%).
Sales and Office Occupations by Sex
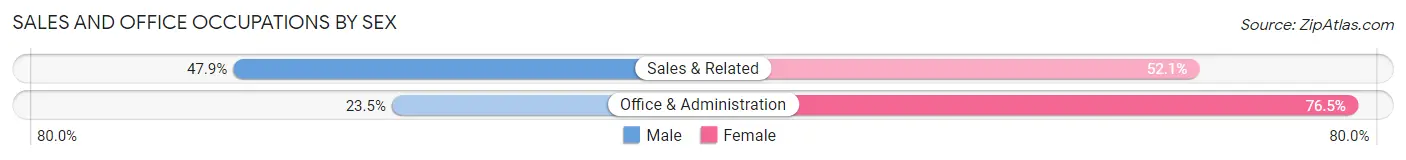
| Occupation | Male | Female |
| Sales & Related | 1,734 (47.9%) | 1,884 (52.1%) |
| Office & Administration | 1,052 (23.5%) | 3,420 (76.5%) |
| Total (Category) | 2,786 (34.4%) | 5,304 (65.6%) |
| Total (Overall) | 21,809 (52.6%) | 19,652 (47.4%) |
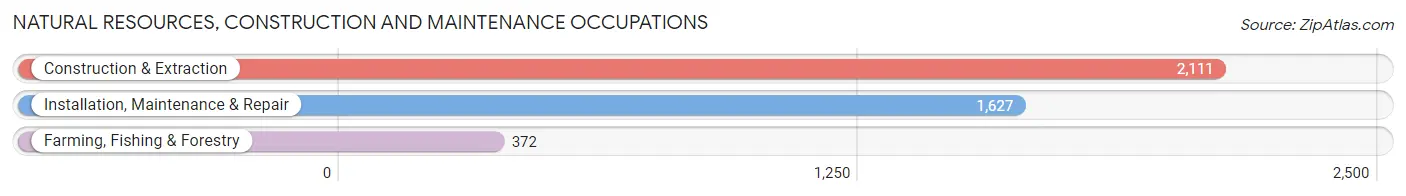
Natural Resources, Construction and Maintenance Occupations
The most common Natural Resources, Construction and Maintenance occupations in Northumberland County are Construction & Extraction (2,111 | 5.1%), Installation, Maintenance & Repair (1,627 | 3.9%), and Farming, Fishing & Forestry (372 | 0.9%).
Natural Resources, Construction and Maintenance Occupations by Sex
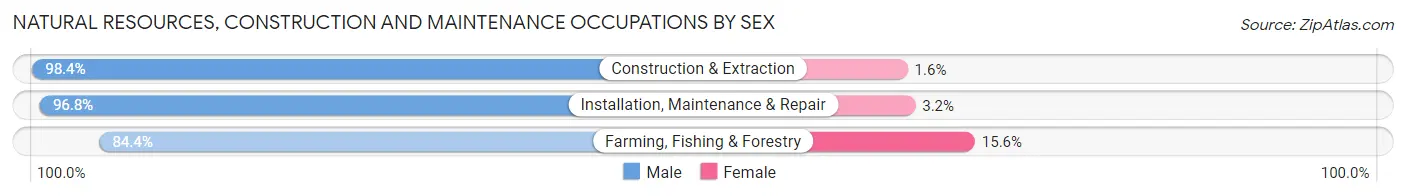
| Occupation | Male | Female |
| Farming, Fishing & Forestry | 314 (84.4%) | 58 (15.6%) |
| Construction & Extraction | 2,077 (98.4%) | 34 (1.6%) |
| Installation, Maintenance & Repair | 1,575 (96.8%) | 52 (3.2%) |
| Total (Category) | 3,966 (96.5%) | 144 (3.5%) |
| Total (Overall) | 21,809 (52.6%) | 19,652 (47.4%) |
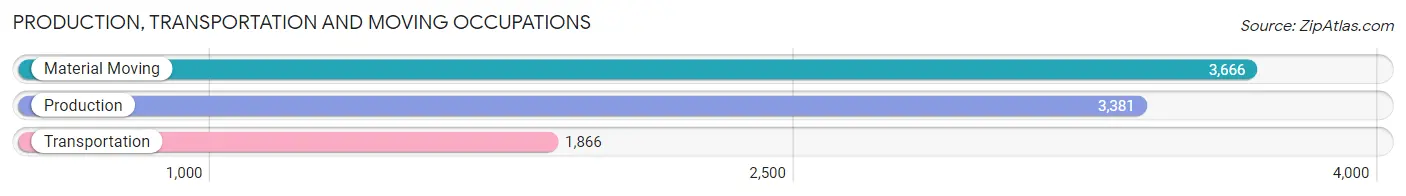
Production, Transportation and Moving Occupations
The most common Production, Transportation and Moving occupations in Northumberland County are Material Moving (3,666 | 8.8%), Production (3,381 | 8.2%), and Transportation (1,866 | 4.5%).
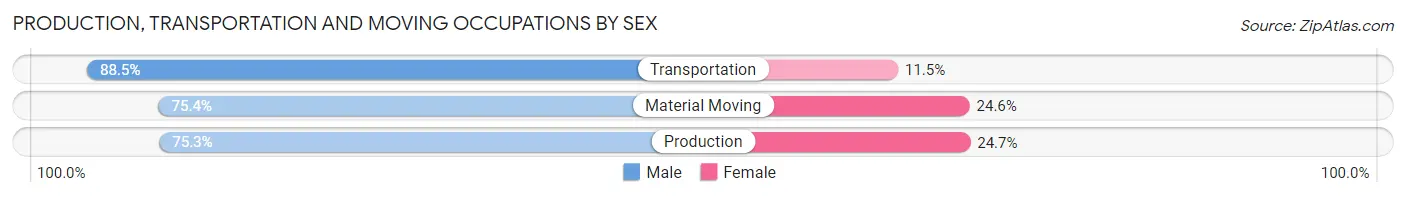
Production, Transportation and Moving Occupations by Sex
| Occupation | Male | Female |
| Production | 2,545 (75.3%) | 836 (24.7%) |
| Transportation | 1,652 (88.5%) | 214 (11.5%) |
| Material Moving | 2,764 (75.4%) | 902 (24.6%) |
| Total (Category) | 6,961 (78.1%) | 1,952 (21.9%) |
| Total (Overall) | 21,809 (52.6%) | 19,652 (47.4%) |
Employment Industries by Sex in Northumberland County
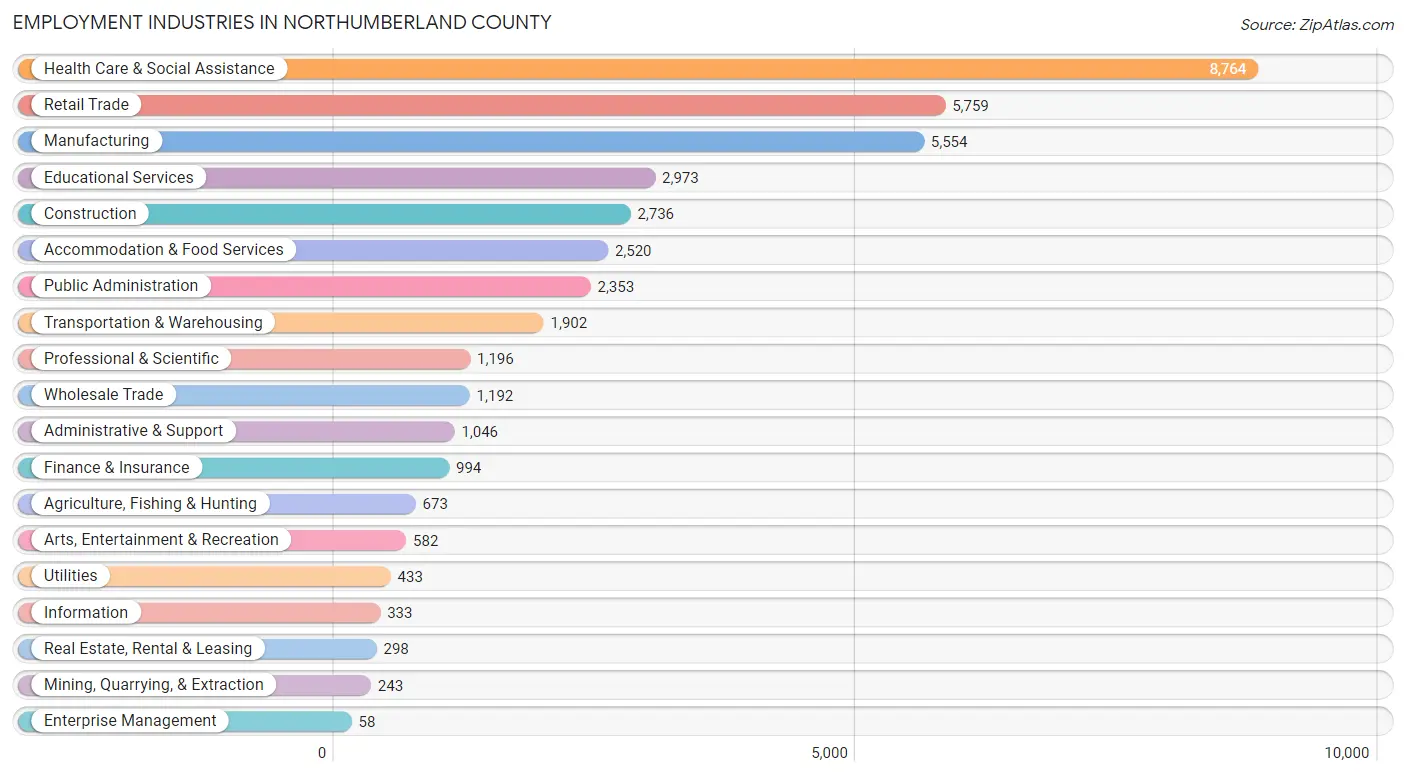
Employment Industries in Northumberland County
The major employment industries in Northumberland County include Health Care & Social Assistance (8,764 | 21.1%), Retail Trade (5,759 | 13.9%), Manufacturing (5,554 | 13.4%), Educational Services (2,973 | 7.2%), and Construction (2,736 | 6.6%).
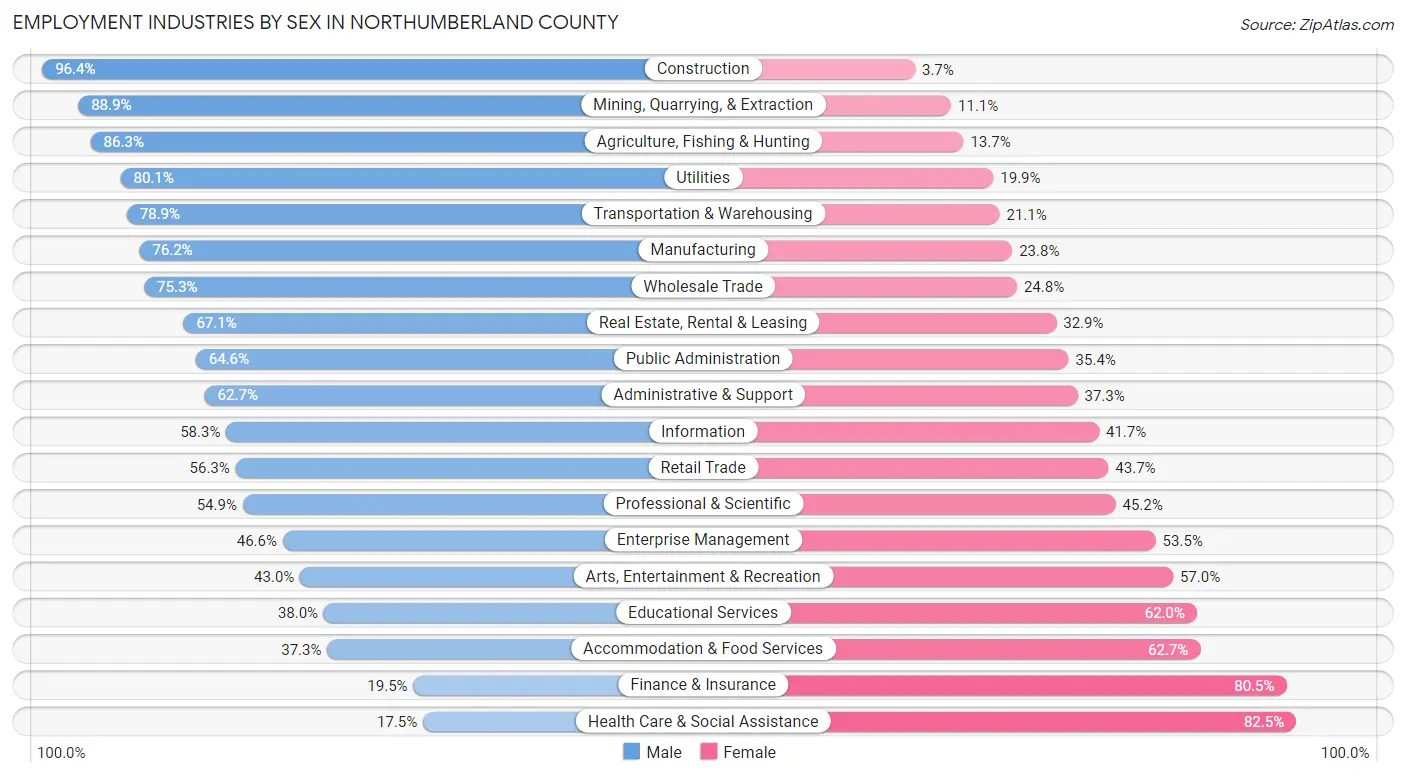
Employment Industries by Sex in Northumberland County
The Northumberland County industries that see more men than women are Construction (96.4%), Mining, Quarrying, & Extraction (88.9%), and Agriculture, Fishing & Hunting (86.3%), whereas the industries that tend to have a higher number of women are Health Care & Social Assistance (82.5%), Finance & Insurance (80.5%), and Accommodation & Food Services (62.7%).
| Industry | Male | Female |
| Agriculture, Fishing & Hunting | 581 (86.3%) | 92 (13.7%) |
| Mining, Quarrying, & Extraction | 216 (88.9%) | 27 (11.1%) |
| Construction | 2,636 (96.4%) | 100 (3.6%) |
| Manufacturing | 4,234 (76.2%) | 1,320 (23.8%) |
| Wholesale Trade | 897 (75.2%) | 295 (24.7%) |
| Retail Trade | 3,244 (56.3%) | 2,515 (43.7%) |
| Transportation & Warehousing | 1,500 (78.9%) | 402 (21.1%) |
| Utilities | 347 (80.1%) | 86 (19.9%) |
| Information | 194 (58.3%) | 139 (41.7%) |
| Finance & Insurance | 194 (19.5%) | 800 (80.5%) |
| Real Estate, Rental & Leasing | 200 (67.1%) | 98 (32.9%) |
| Professional & Scientific | 656 (54.8%) | 540 (45.2%) |
| Enterprise Management | 27 (46.6%) | 31 (53.4%) |
| Administrative & Support | 656 (62.7%) | 390 (37.3%) |
| Educational Services | 1,131 (38.0%) | 1,842 (62.0%) |
| Health Care & Social Assistance | 1,535 (17.5%) | 7,229 (82.5%) |
| Arts, Entertainment & Recreation | 250 (43.0%) | 332 (57.0%) |
| Accommodation & Food Services | 941 (37.3%) | 1,579 (62.7%) |
| Public Administration | 1,519 (64.6%) | 834 (35.4%) |
| Total | 21,809 (52.6%) | 19,652 (47.4%) |
Education in Northumberland County
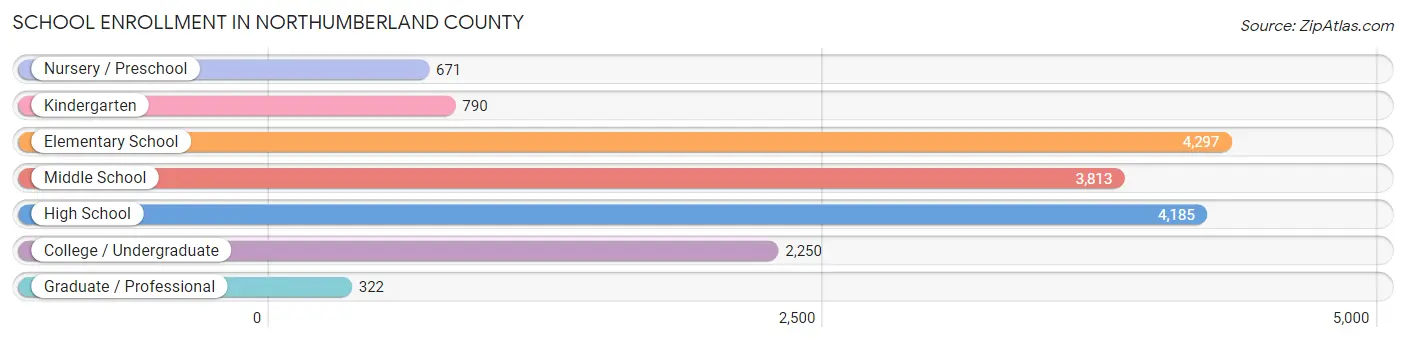
School Enrollment in Northumberland County
The most common levels of schooling among the 16,328 students in Northumberland County are elementary school (4,297 | 26.3%), high school (4,185 | 25.6%), and middle school (3,813 | 23.4%).
| School Level | # Students | % Students |
| Nursery / Preschool | 671 | 4.1% |
| Kindergarten | 790 | 4.8% |
| Elementary School | 4,297 | 26.3% |
| Middle School | 3,813 | 23.4% |
| High School | 4,185 | 25.6% |
| College / Undergraduate | 2,250 | 13.8% |
| Graduate / Professional | 322 | 2.0% |
| Total | 16,328 | 100.0% |
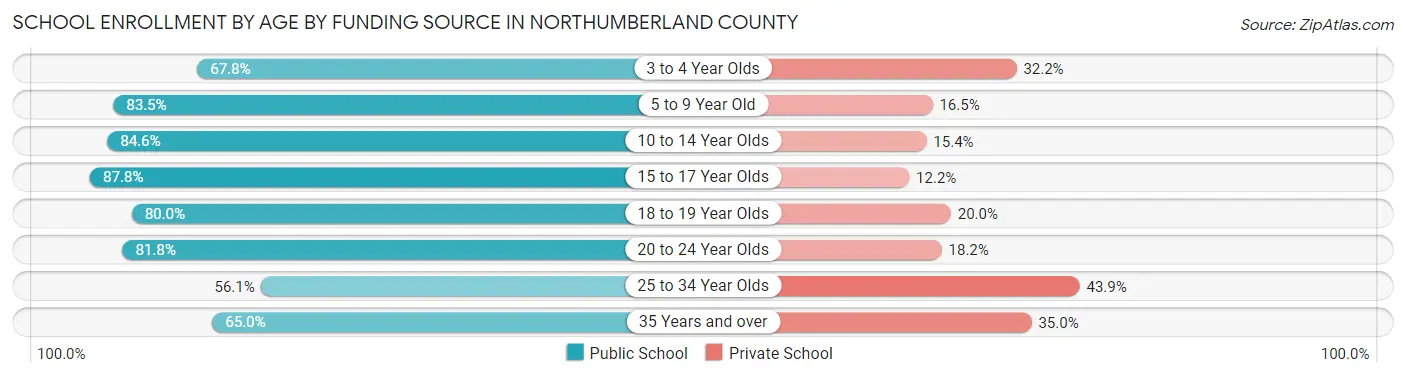
School Enrollment by Age by Funding Source in Northumberland County
Out of a total of 16,328 students who are enrolled in schools in Northumberland County, 2,906 (17.8%) attend a private institution, while the remaining 13,422 (82.2%) are enrolled in public schools. The age group of 25 to 34 year olds has the highest likelihood of being enrolled in private schools, with 221 (43.9% in the age bracket) enrolled. Conversely, the age group of 15 to 17 year olds has the lowest likelihood of being enrolled in a private school, with 2,556 (87.8% in the age bracket) attending a public institution.
| Age Bracket | Public School | Private School |
| 3 to 4 Year Olds | 274 (67.8%) | 130 (32.2%) |
| 5 to 9 Year Old | 3,864 (83.5%) | 766 (16.5%) |
| 10 to 14 Year Olds | 4,239 (84.6%) | 772 (15.4%) |
| 15 to 17 Year Olds | 2,556 (87.8%) | 355 (12.2%) |
| 18 to 19 Year Olds | 806 (80.0%) | 201 (20.0%) |
| 20 to 24 Year Olds | 959 (81.8%) | 214 (18.2%) |
| 25 to 34 Year Olds | 282 (56.1%) | 221 (43.9%) |
| 35 Years and over | 448 (65.0%) | 241 (35.0%) |
| Total | 13,422 (82.2%) | 2,906 (17.8%) |
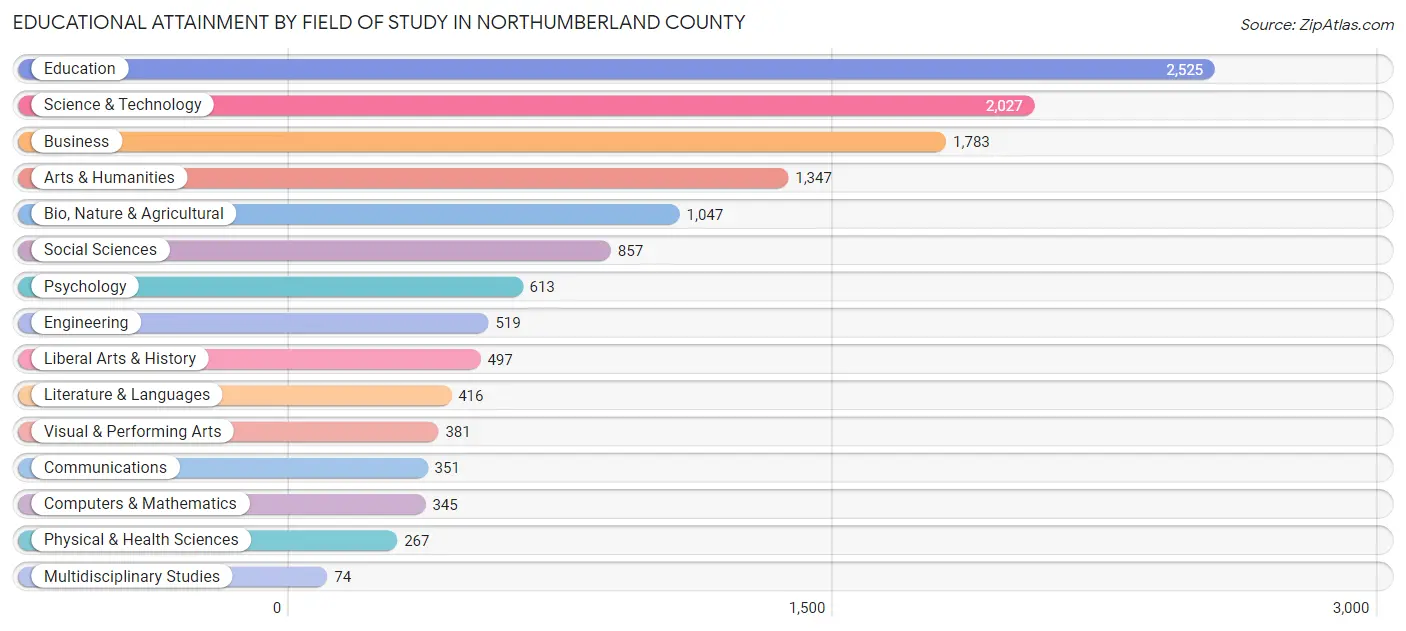
Educational Attainment by Field of Study in Northumberland County
Education (2,525 | 19.4%), science & technology (2,027 | 15.5%), business (1,783 | 13.7%), arts & humanities (1,347 | 10.3%), and bio, nature & agricultural (1,047 | 8.0%) are the most common fields of study among 13,049 individuals in Northumberland County who have obtained a bachelor's degree or higher.
| Field of Study | # Graduates | % Graduates |
| Computers & Mathematics | 345 | 2.6% |
| Bio, Nature & Agricultural | 1,047 | 8.0% |
| Physical & Health Sciences | 267 | 2.1% |
| Psychology | 613 | 4.7% |
| Social Sciences | 857 | 6.6% |
| Engineering | 519 | 4.0% |
| Multidisciplinary Studies | 74 | 0.6% |
| Science & Technology | 2,027 | 15.5% |
| Business | 1,783 | 13.7% |
| Education | 2,525 | 19.4% |
| Literature & Languages | 416 | 3.2% |
| Liberal Arts & History | 497 | 3.8% |
| Visual & Performing Arts | 381 | 2.9% |
| Communications | 351 | 2.7% |
| Arts & Humanities | 1,347 | 10.3% |
| Total | 13,049 | 100.0% |
Transportation & Commute in Northumberland County
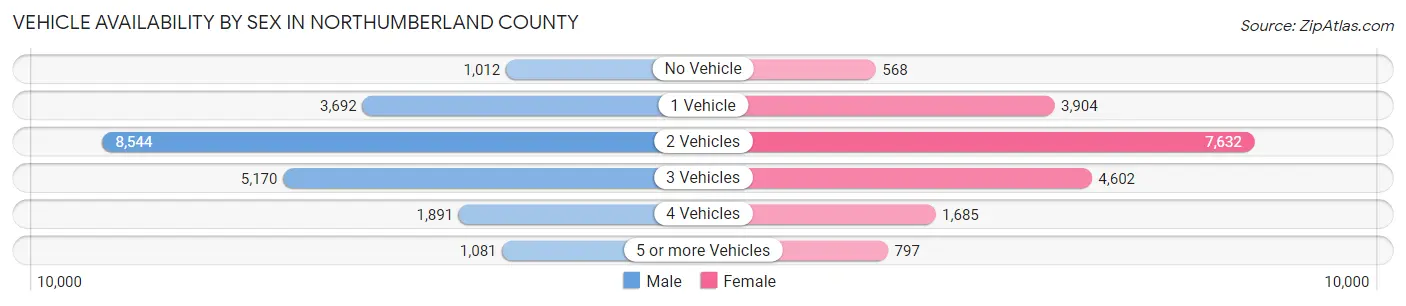
Vehicle Availability by Sex in Northumberland County
The most prevalent vehicle ownership categories in Northumberland County are males with 2 vehicles (8,544, accounting for 39.9%) and females with 2 vehicles (7,632, making up 44.5%).
| Vehicles Available | Male | Female |
| No Vehicle | 1,012 (4.7%) | 568 (3.0%) |
| 1 Vehicle | 3,692 (17.3%) | 3,904 (20.3%) |
| 2 Vehicles | 8,544 (39.9%) | 7,632 (39.8%) |
| 3 Vehicles | 5,170 (24.2%) | 4,602 (24.0%) |
| 4 Vehicles | 1,891 (8.8%) | 1,685 (8.8%) |
| 5 or more Vehicles | 1,081 (5.1%) | 797 (4.2%) |
| Total | 21,390 (100.0%) | 19,188 (100.0%) |
Commute Time in Northumberland County
The most frequently occuring commute durations in Northumberland County are 20 to 24 minutes (5,982 commuters, 15.9%), 10 to 14 minutes (5,822 commuters, 15.5%), and 15 to 19 minutes (5,512 commuters, 14.6%).
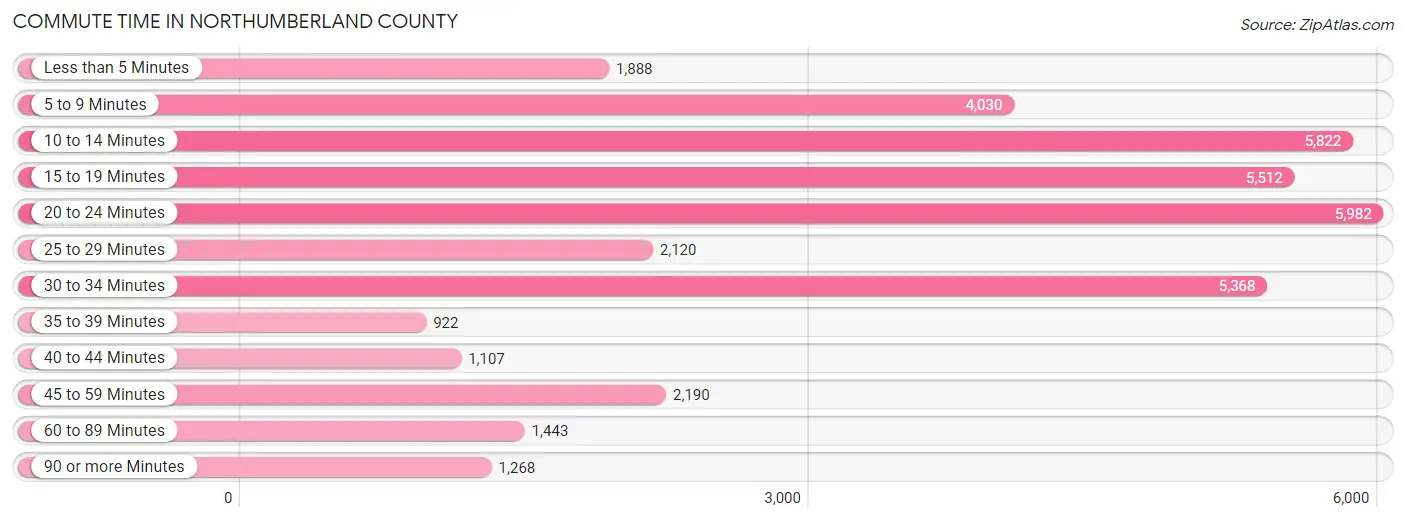
| Commute Time | # Commuters | % Commuters |
| Less than 5 Minutes | 1,888 | 5.0% |
| 5 to 9 Minutes | 4,030 | 10.7% |
| 10 to 14 Minutes | 5,822 | 15.5% |
| 15 to 19 Minutes | 5,512 | 14.6% |
| 20 to 24 Minutes | 5,982 | 15.9% |
| 25 to 29 Minutes | 2,120 | 5.6% |
| 30 to 34 Minutes | 5,368 | 14.3% |
| 35 to 39 Minutes | 922 | 2.5% |
| 40 to 44 Minutes | 1,107 | 2.9% |
| 45 to 59 Minutes | 2,190 | 5.8% |
| 60 to 89 Minutes | 1,443 | 3.8% |
| 90 or more Minutes | 1,268 | 3.4% |
Commute Time by Sex in Northumberland County
The most common commute times in Northumberland County are 20 to 24 minutes (2,898 commuters, 14.4%) for males and 20 to 24 minutes (3,084 commuters, 17.5%) for females.
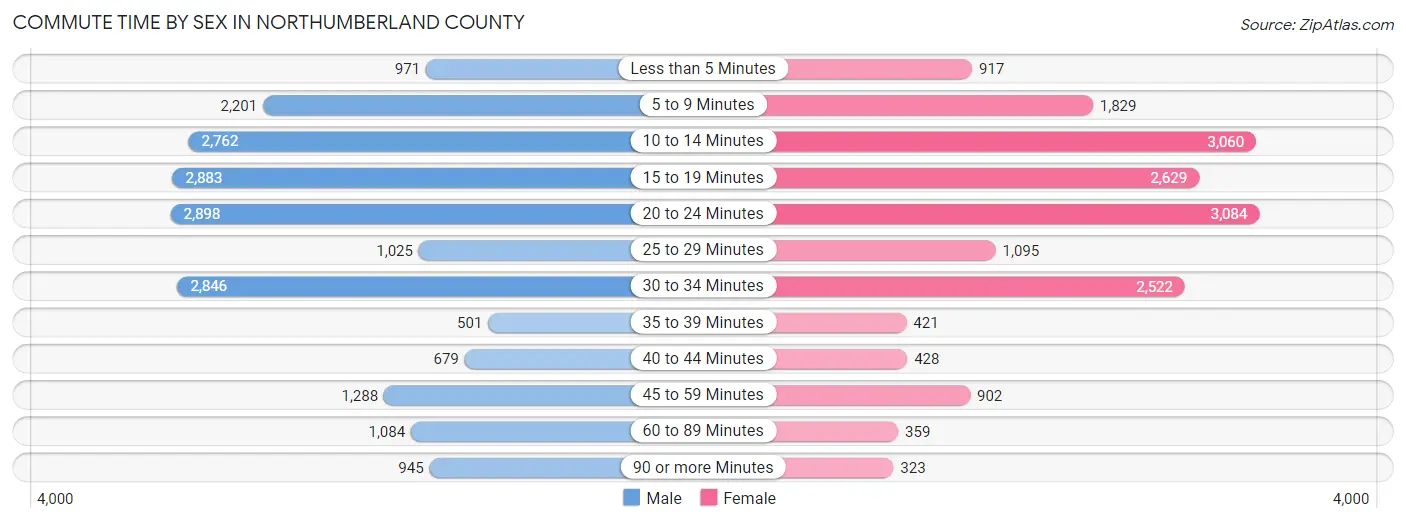
| Commute Time | Male | Female |
| Less than 5 Minutes | 971 (4.8%) | 917 (5.2%) |
| 5 to 9 Minutes | 2,201 (11.0%) | 1,829 (10.4%) |
| 10 to 14 Minutes | 2,762 (13.8%) | 3,060 (17.4%) |
| 15 to 19 Minutes | 2,883 (14.4%) | 2,629 (15.0%) |
| 20 to 24 Minutes | 2,898 (14.4%) | 3,084 (17.5%) |
| 25 to 29 Minutes | 1,025 (5.1%) | 1,095 (6.2%) |
| 30 to 34 Minutes | 2,846 (14.2%) | 2,522 (14.3%) |
| 35 to 39 Minutes | 501 (2.5%) | 421 (2.4%) |
| 40 to 44 Minutes | 679 (3.4%) | 428 (2.4%) |
| 45 to 59 Minutes | 1,288 (6.4%) | 902 (5.1%) |
| 60 to 89 Minutes | 1,084 (5.4%) | 359 (2.0%) |
| 90 or more Minutes | 945 (4.7%) | 323 (1.8%) |
Time of Departure to Work by Sex in Northumberland County
The most frequent times of departure to work in Northumberland County are 7:00 AM to 7:29 AM (3,255, 16.2%) for males and 7:00 AM to 7:29 AM (3,735, 21.3%) for females.
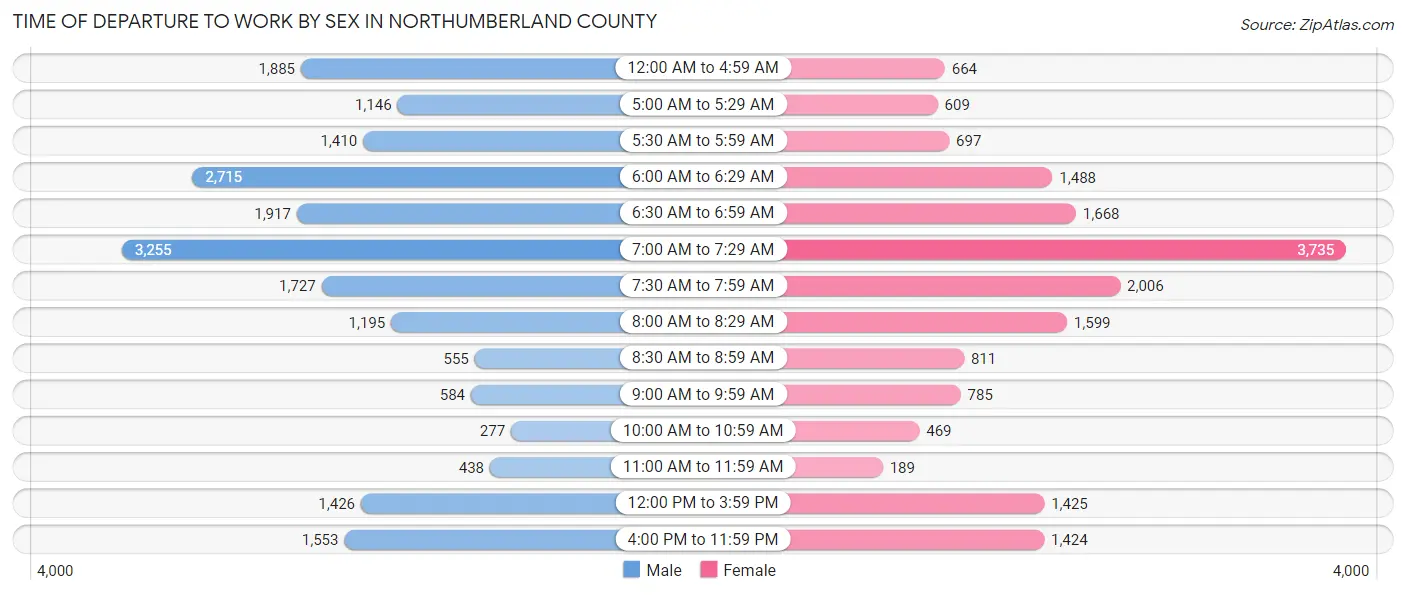
| Time of Departure | Male | Female |
| 12:00 AM to 4:59 AM | 1,885 (9.4%) | 664 (3.8%) |
| 5:00 AM to 5:29 AM | 1,146 (5.7%) | 609 (3.5%) |
| 5:30 AM to 5:59 AM | 1,410 (7.0%) | 697 (4.0%) |
| 6:00 AM to 6:29 AM | 2,715 (13.5%) | 1,488 (8.5%) |
| 6:30 AM to 6:59 AM | 1,917 (9.6%) | 1,668 (9.5%) |
| 7:00 AM to 7:29 AM | 3,255 (16.2%) | 3,735 (21.3%) |
| 7:30 AM to 7:59 AM | 1,727 (8.6%) | 2,006 (11.4%) |
| 8:00 AM to 8:29 AM | 1,195 (5.9%) | 1,599 (9.1%) |
| 8:30 AM to 8:59 AM | 555 (2.8%) | 811 (4.6%) |
| 9:00 AM to 9:59 AM | 584 (2.9%) | 785 (4.5%) |
| 10:00 AM to 10:59 AM | 277 (1.4%) | 469 (2.7%) |
| 11:00 AM to 11:59 AM | 438 (2.2%) | 189 (1.1%) |
| 12:00 PM to 3:59 PM | 1,426 (7.1%) | 1,425 (8.1%) |
| 4:00 PM to 11:59 PM | 1,553 (7.7%) | 1,424 (8.1%) |
| Total | 20,083 (100.0%) | 17,569 (100.0%) |
Housing Occupancy in Northumberland County
Occupancy by Ownership in Northumberland County
Of the total 37,775 dwellings in Northumberland County, owner-occupied units account for 27,875 (73.8%), while renter-occupied units make up 9,900 (26.2%).
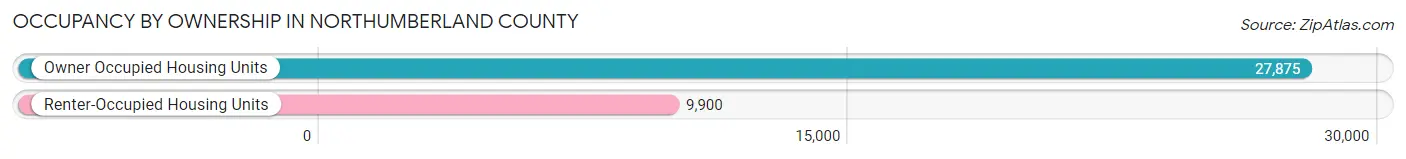
| Occupancy | # Housing Units | % Housing Units |
| Owner Occupied Housing Units | 27,875 | 73.8% |
| Renter-Occupied Housing Units | 9,900 | 26.2% |
| Total Occupied Housing Units | 37,775 | 100.0% |
Occupancy by Household Size in Northumberland County
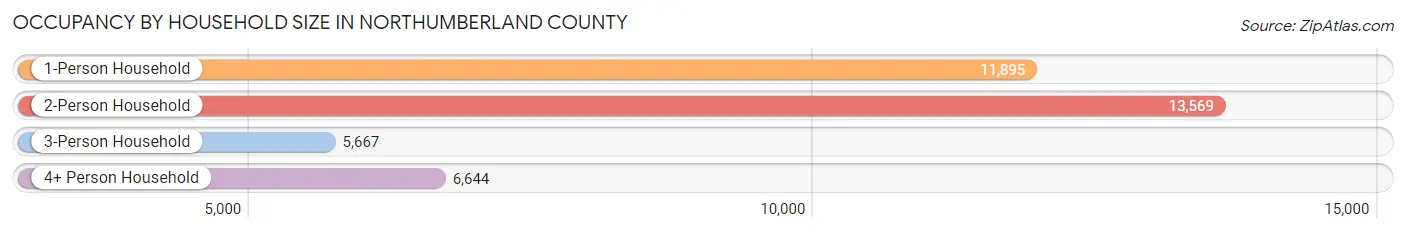
| Household Size | # Housing Units | % Housing Units |
| 1-Person Household | 11,895 | 31.5% |
| 2-Person Household | 13,569 | 35.9% |
| 3-Person Household | 5,667 | 15.0% |
| 4+ Person Household | 6,644 | 17.6% |
| Total Housing Units | 37,775 | 100.0% |
Occupancy by Ownership by Household Size in Northumberland County
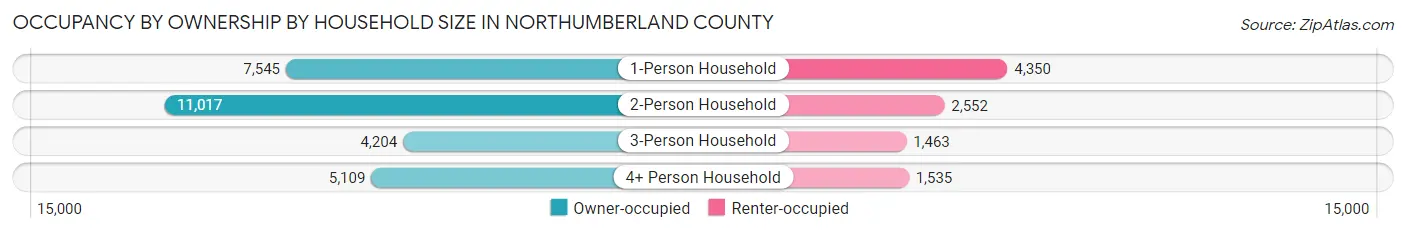
| Household Size | Owner-occupied | Renter-occupied |
| 1-Person Household | 7,545 (63.4%) | 4,350 (36.6%) |
| 2-Person Household | 11,017 (81.2%) | 2,552 (18.8%) |
| 3-Person Household | 4,204 (74.2%) | 1,463 (25.8%) |
| 4+ Person Household | 5,109 (76.9%) | 1,535 (23.1%) |
| Total Housing Units | 27,875 (73.8%) | 9,900 (26.2%) |
Occupancy by Educational Attainment in Northumberland County
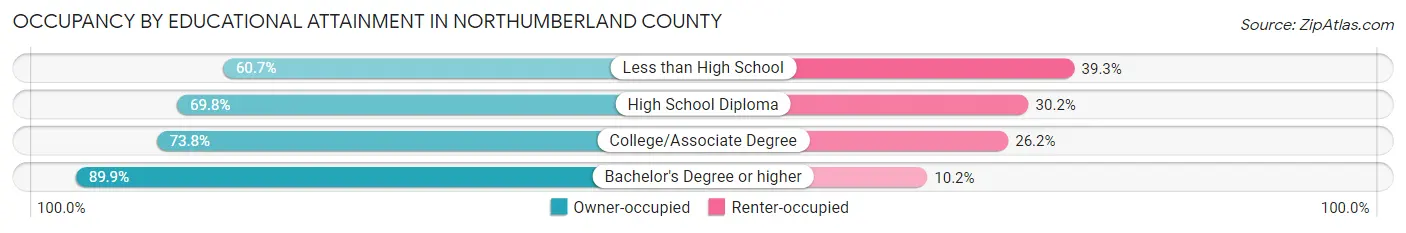
| Household Size | Owner-occupied | Renter-occupied |
| Less than High School | 1,958 (60.7%) | 1,270 (39.3%) |
| High School Diploma | 12,629 (69.8%) | 5,473 (30.2%) |
| College/Associate Degree | 6,850 (73.8%) | 2,430 (26.2%) |
| Bachelor's Degree or higher | 6,438 (89.8%) | 727 (10.2%) |
Occupancy by Age of Householder in Northumberland County
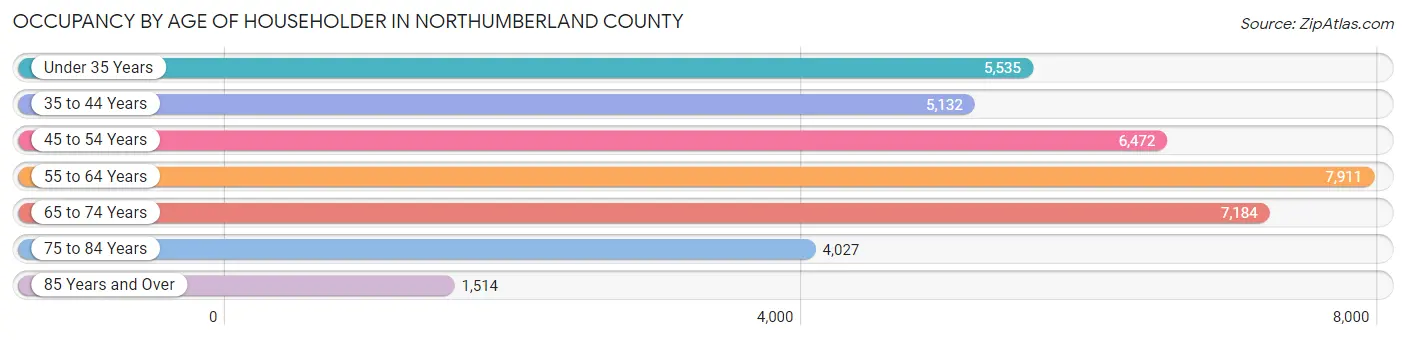
| Age Bracket | # Households | % Households |
| Under 35 Years | 5,535 | 14.6% |
| 35 to 44 Years | 5,132 | 13.6% |
| 45 to 54 Years | 6,472 | 17.1% |
| 55 to 64 Years | 7,911 | 20.9% |
| 65 to 74 Years | 7,184 | 19.0% |
| 75 to 84 Years | 4,027 | 10.7% |
| 85 Years and Over | 1,514 | 4.0% |
| Total | 37,775 | 100.0% |
Housing Finances in Northumberland County
Median Income by Occupancy in Northumberland County
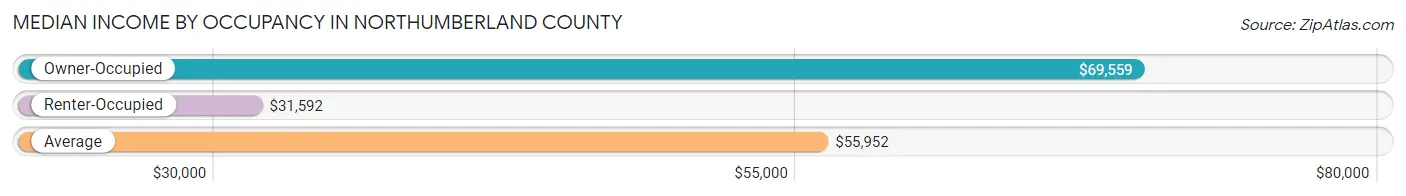
| Occupancy Type | # Households | Median Income |
| Owner-Occupied | 27,875 (73.8%) | $69,559 |
| Renter-Occupied | 9,900 (26.2%) | $31,592 |
| Average | 37,775 (100.0%) | $55,952 |
Occupancy by Householder Income Bracket in Northumberland County
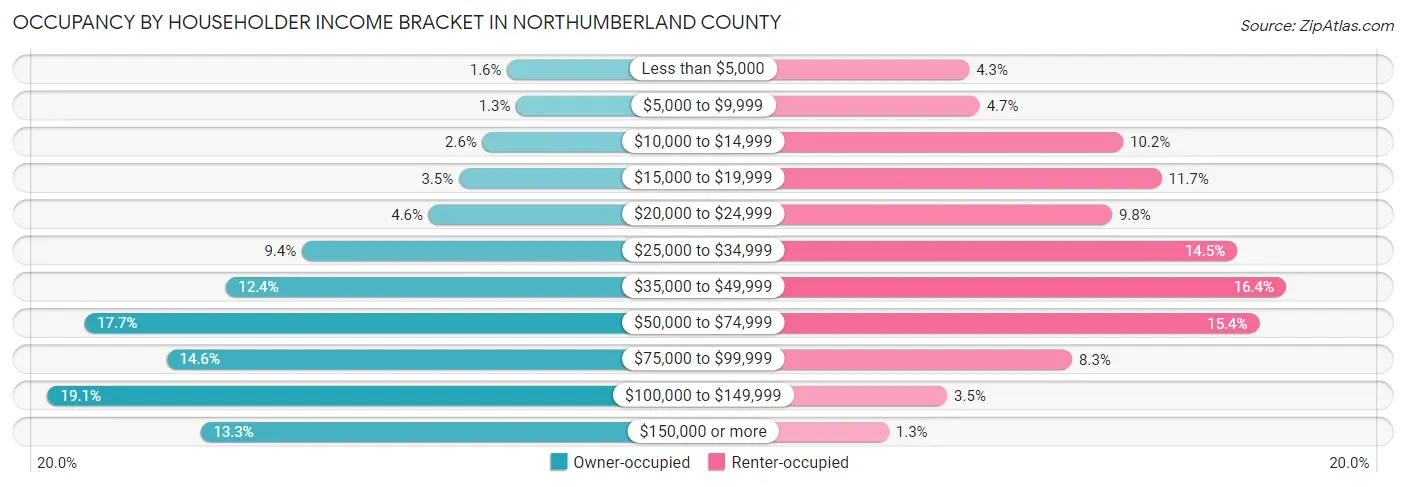
| Income Bracket | Owner-occupied | Renter-occupied |
| Less than $5,000 | 448 (1.6%) | 429 (4.3%) |
| $5,000 to $9,999 | 355 (1.3%) | 468 (4.7%) |
| $10,000 to $14,999 | 712 (2.5%) | 1,009 (10.2%) |
| $15,000 to $19,999 | 961 (3.5%) | 1,154 (11.7%) |
| $20,000 to $24,999 | 1,282 (4.6%) | 967 (9.8%) |
| $25,000 to $34,999 | 2,630 (9.4%) | 1,438 (14.5%) |
| $35,000 to $49,999 | 3,442 (12.3%) | 1,623 (16.4%) |
| $50,000 to $74,999 | 4,941 (17.7%) | 1,523 (15.4%) |
| $75,000 to $99,999 | 4,067 (14.6%) | 817 (8.3%) |
| $100,000 to $149,999 | 5,331 (19.1%) | 346 (3.5%) |
| $150,000 or more | 3,706 (13.3%) | 126 (1.3%) |
| Total | 27,875 (100.0%) | 9,900 (100.0%) |
Monthly Housing Cost Tiers in Northumberland County
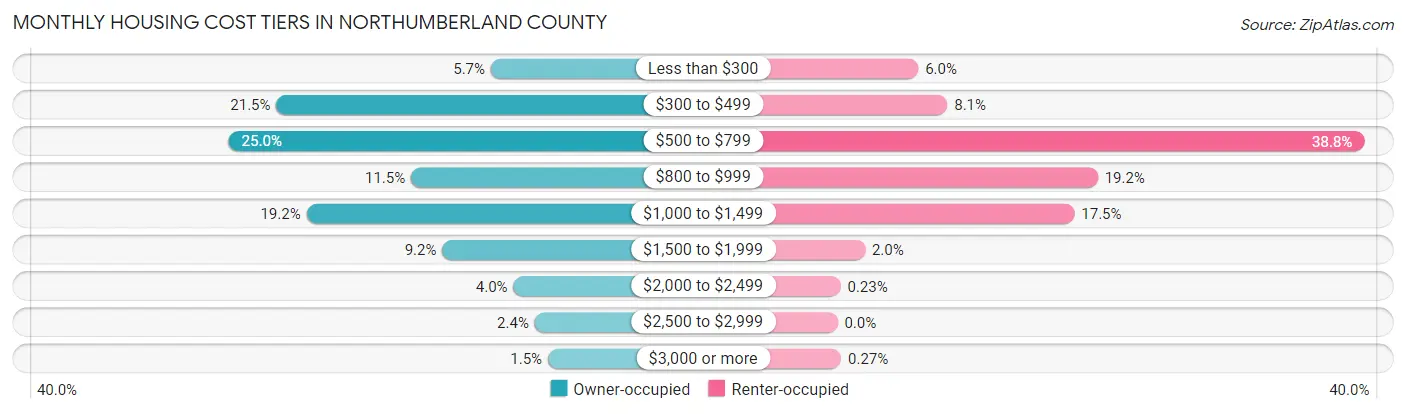
| Monthly Cost | Owner-occupied | Renter-occupied |
| Less than $300 | 1,578 (5.7%) | 589 (5.9%) |
| $300 to $499 | 5,982 (21.5%) | 801 (8.1%) |
| $500 to $799 | 6,961 (25.0%) | 3,840 (38.8%) |
| $800 to $999 | 3,216 (11.5%) | 1,898 (19.2%) |
| $1,000 to $1,499 | 5,364 (19.2%) | 1,728 (17.4%) |
| $1,500 to $1,999 | 2,577 (9.2%) | 201 (2.0%) |
| $2,000 to $2,499 | 1,114 (4.0%) | 23 (0.2%) |
| $2,500 to $2,999 | 676 (2.4%) | 0 (0.0%) |
| $3,000 or more | 407 (1.5%) | 27 (0.3%) |
| Total | 27,875 (100.0%) | 9,900 (100.0%) |
Physical Housing Characteristics in Northumberland County
Housing Structures in Northumberland County
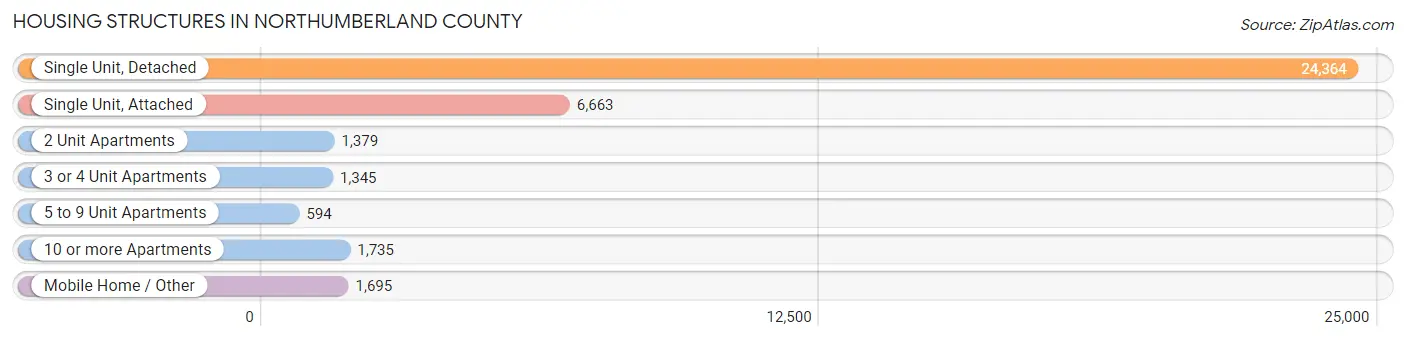
| Structure Type | # Housing Units | % Housing Units |
| Single Unit, Detached | 24,364 | 64.5% |
| Single Unit, Attached | 6,663 | 17.6% |
| 2 Unit Apartments | 1,379 | 3.6% |
| 3 or 4 Unit Apartments | 1,345 | 3.6% |
| 5 to 9 Unit Apartments | 594 | 1.6% |
| 10 or more Apartments | 1,735 | 4.6% |
| Mobile Home / Other | 1,695 | 4.5% |
| Total | 37,775 | 100.0% |
Housing Structures by Occupancy in Northumberland County
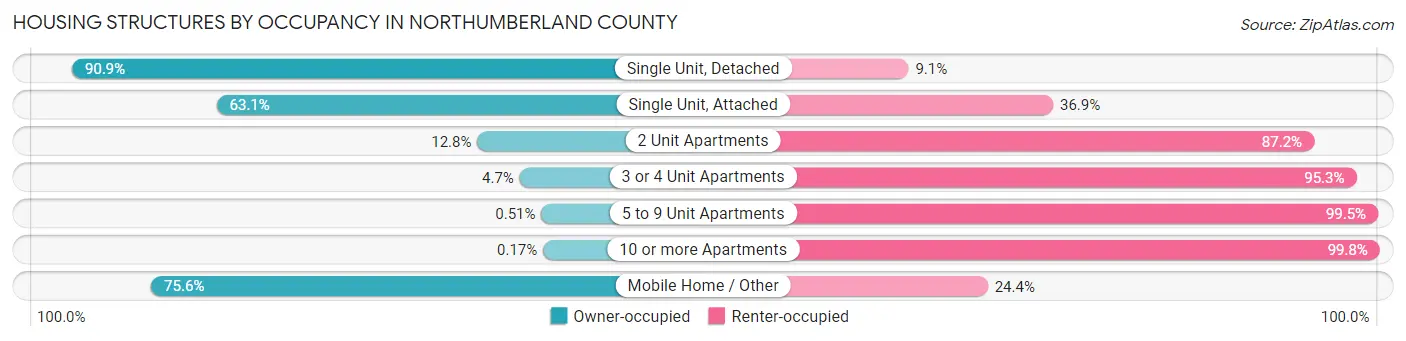
| Structure Type | Owner-occupied | Renter-occupied |
| Single Unit, Detached | 22,145 (90.9%) | 2,219 (9.1%) |
| Single Unit, Attached | 4,202 (63.1%) | 2,461 (36.9%) |
| 2 Unit Apartments | 177 (12.8%) | 1,202 (87.2%) |
| 3 or 4 Unit Apartments | 63 (4.7%) | 1,282 (95.3%) |
| 5 to 9 Unit Apartments | 3 (0.5%) | 591 (99.5%) |
| 10 or more Apartments | 3 (0.2%) | 1,732 (99.8%) |
| Mobile Home / Other | 1,282 (75.6%) | 413 (24.4%) |
| Total | 27,875 (73.8%) | 9,900 (26.2%) |
Housing Structures by Number of Rooms in Northumberland County
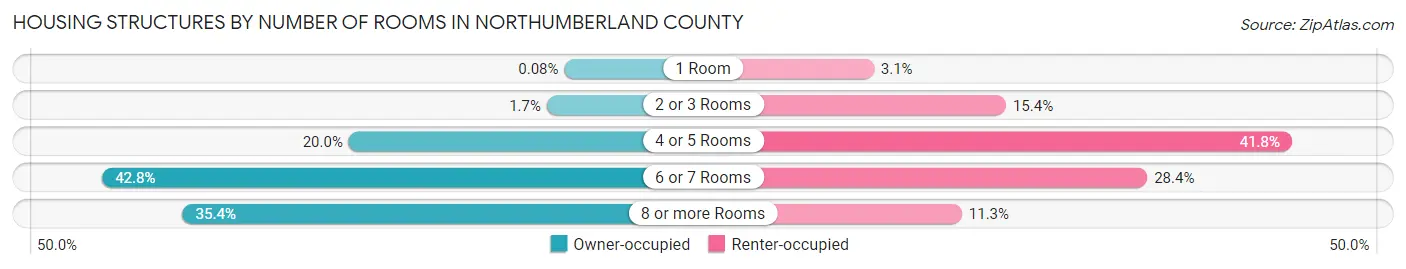
| Number of Rooms | Owner-occupied | Renter-occupied |
| 1 Room | 23 (0.1%) | 311 (3.1%) |
| 2 or 3 Rooms | 475 (1.7%) | 1,521 (15.4%) |
| 4 or 5 Rooms | 5,580 (20.0%) | 4,137 (41.8%) |
| 6 or 7 Rooms | 11,936 (42.8%) | 2,814 (28.4%) |
| 8 or more Rooms | 9,861 (35.4%) | 1,117 (11.3%) |
| Total | 27,875 (100.0%) | 9,900 (100.0%) |
Housing Structure by Heating Type in Northumberland County
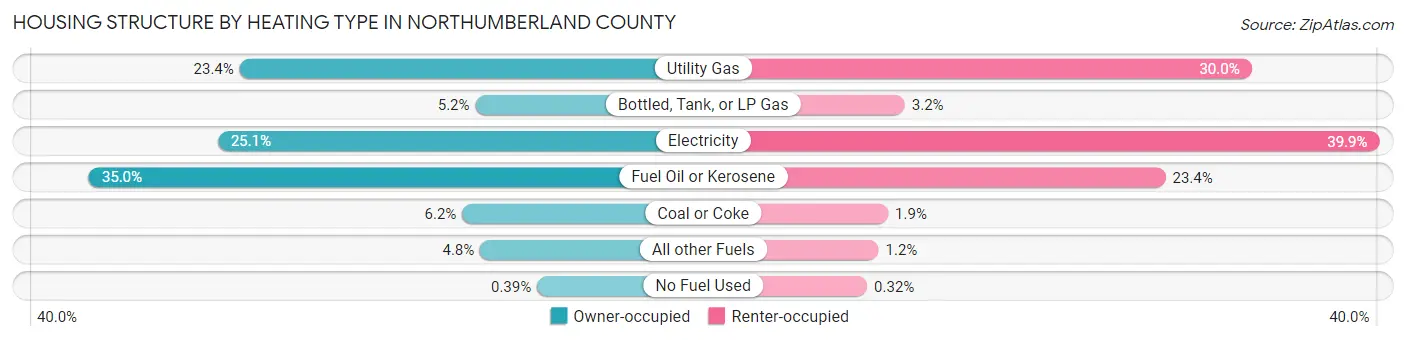
| Heating Type | Owner-occupied | Renter-occupied |
| Utility Gas | 6,517 (23.4%) | 2,972 (30.0%) |
| Bottled, Tank, or LP Gas | 1,437 (5.2%) | 320 (3.2%) |
| Electricity | 6,987 (25.1%) | 3,950 (39.9%) |
| Fuel Oil or Kerosene | 9,766 (35.0%) | 2,315 (23.4%) |
| Coal or Coke | 1,723 (6.2%) | 192 (1.9%) |
| All other Fuels | 1,336 (4.8%) | 119 (1.2%) |
| No Fuel Used | 109 (0.4%) | 32 (0.3%) |
| Total | 27,875 (100.0%) | 9,900 (100.0%) |
Household Vehicle Usage in Northumberland County
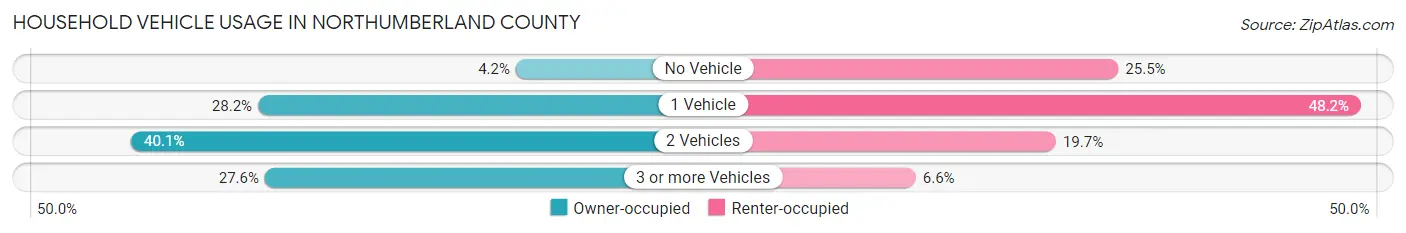
| Vehicles per Household | Owner-occupied | Renter-occupied |
| No Vehicle | 1,158 (4.2%) | 2,527 (25.5%) |
| 1 Vehicle | 7,866 (28.2%) | 4,768 (48.2%) |
| 2 Vehicles | 11,164 (40.1%) | 1,950 (19.7%) |
| 3 or more Vehicles | 7,687 (27.6%) | 655 (6.6%) |
| Total | 27,875 (100.0%) | 9,900 (100.0%) |
Real Estate & Mortgages in Northumberland County
Real Estate and Mortgage Overview in Northumberland County
| Characteristic | Without Mortgage | With Mortgage |
| Housing Units | 13,564 | 14,311 |
| Median Property Value | $118,100 | $161,000 |
| Median Household Income | $52,618 | $2,507 |
| Monthly Housing Costs | $487 | $375 |
| Real Estate Taxes | $1,588 | $138 |
Property Value by Mortgage Status in Northumberland County
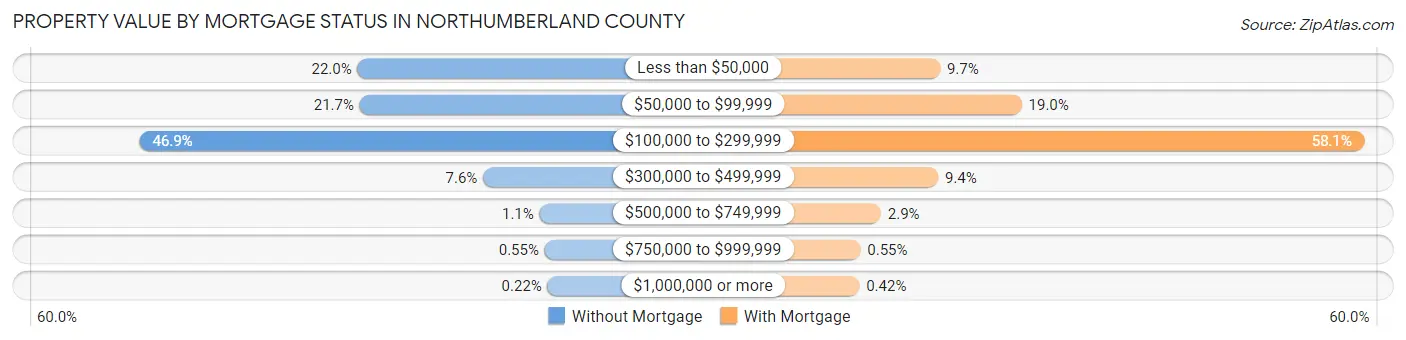
| Property Value | Without Mortgage | With Mortgage |
| Less than $50,000 | 2,977 (22.0%) | 1,381 (9.7%) |
| $50,000 to $99,999 | 2,942 (21.7%) | 2,716 (19.0%) |
| $100,000 to $299,999 | 6,357 (46.9%) | 8,312 (58.1%) |
| $300,000 to $499,999 | 1,029 (7.6%) | 1,349 (9.4%) |
| $500,000 to $749,999 | 155 (1.1%) | 414 (2.9%) |
| $750,000 to $999,999 | 74 (0.5%) | 79 (0.5%) |
| $1,000,000 or more | 30 (0.2%) | 60 (0.4%) |
| Total | 13,564 (100.0%) | 14,311 (100.0%) |
Household Income by Mortgage Status in Northumberland County
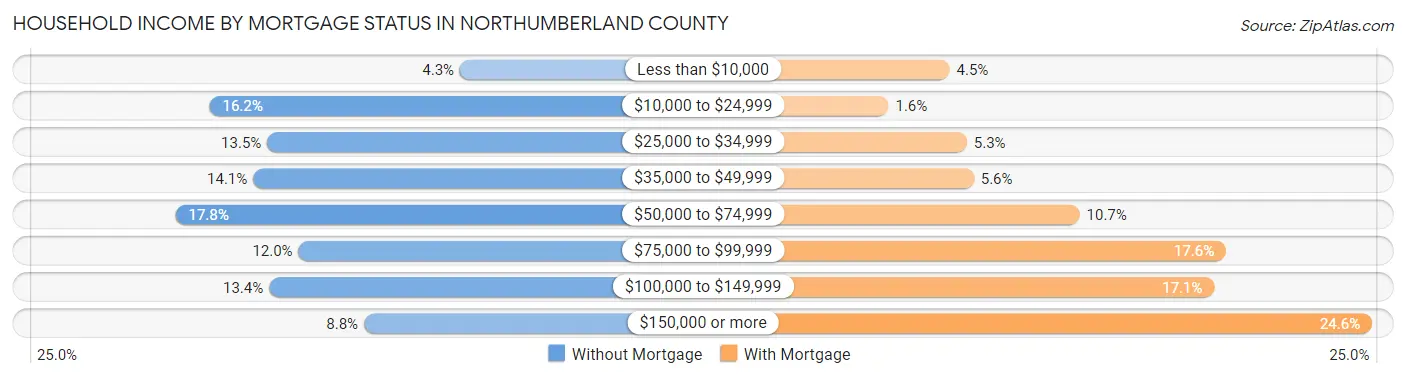
| Household Income | Without Mortgage | With Mortgage |
| Less than $10,000 | 579 (4.3%) | 641 (4.5%) |
| $10,000 to $24,999 | 2,196 (16.2%) | 224 (1.6%) |
| $25,000 to $34,999 | 1,825 (13.5%) | 759 (5.3%) |
| $35,000 to $49,999 | 1,915 (14.1%) | 805 (5.6%) |
| $50,000 to $74,999 | 2,416 (17.8%) | 1,527 (10.7%) |
| $75,000 to $99,999 | 1,622 (12.0%) | 2,525 (17.6%) |
| $100,000 to $149,999 | 1,812 (13.4%) | 2,445 (17.1%) |
| $150,000 or more | 1,199 (8.8%) | 3,519 (24.6%) |
| Total | 13,564 (100.0%) | 14,311 (100.0%) |
Property Value to Household Income Ratio in Northumberland County
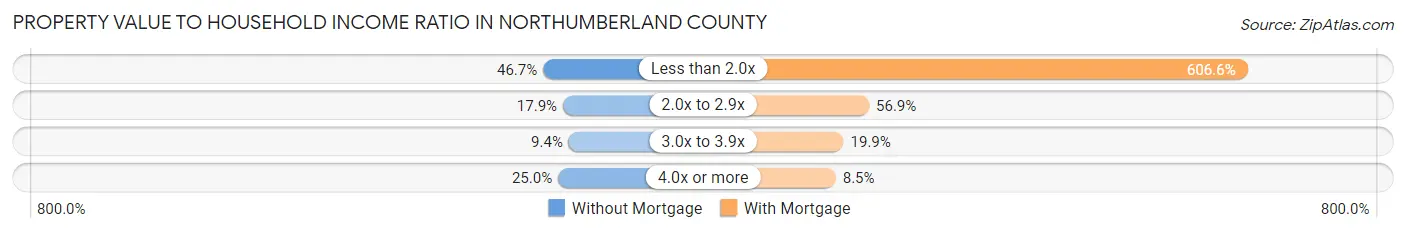
| Value-to-Income Ratio | Without Mortgage | With Mortgage |
| Less than 2.0x | 6,340 (46.7%) | 86,814 (606.6%) |
| 2.0x to 2.9x | 2,432 (17.9%) | 8,145 (56.9%) |
| 3.0x to 3.9x | 1,276 (9.4%) | 2,848 (19.9%) |
| 4.0x or more | 3,396 (25.0%) | 1,218 (8.5%) |
| Total | 13,564 (100.0%) | 14,311 (100.0%) |
Real Estate Taxes by Mortgage Status in Northumberland County
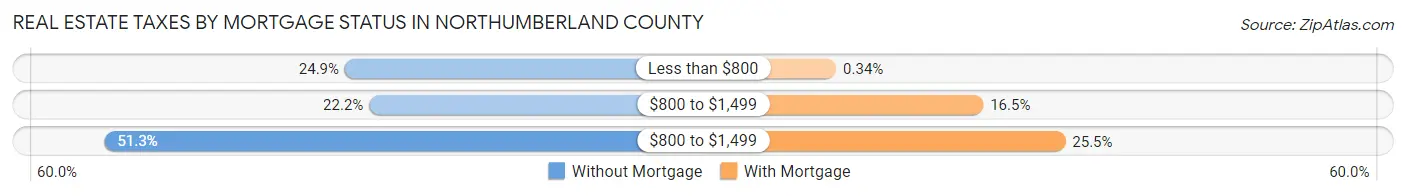
| Property Taxes | Without Mortgage | With Mortgage |
| Less than $800 | 3,377 (24.9%) | 48 (0.3%) |
| $800 to $1,499 | 3,017 (22.2%) | 2,355 (16.5%) |
| $800 to $1,499 | 6,951 (51.2%) | 3,643 (25.5%) |
| Total | 13,564 (100.0%) | 14,311 (100.0%) |
Health & Disability in Northumberland County
Health Insurance Coverage by Age in Northumberland County
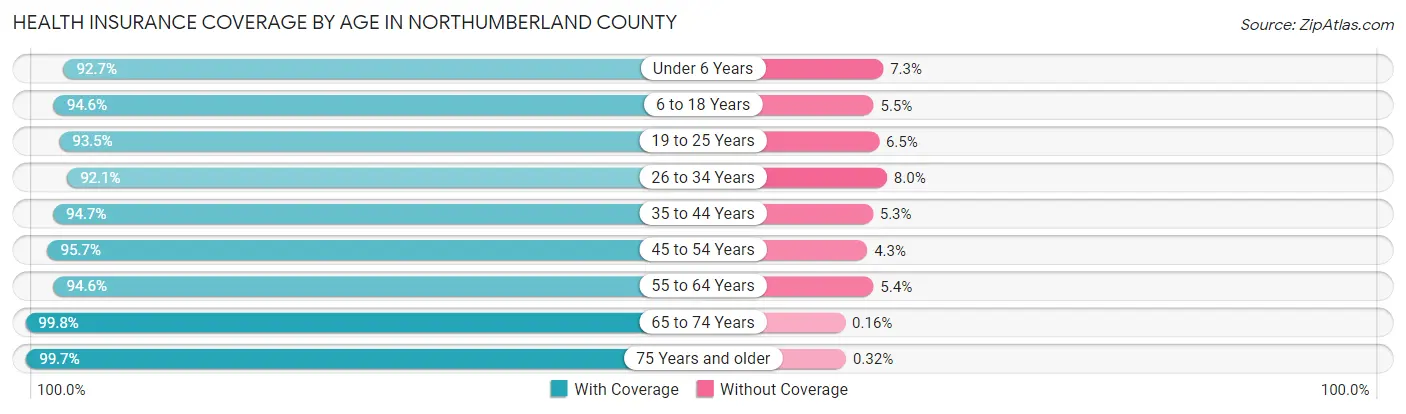
| Age Bracket | With Coverage | Without Coverage |
| Under 6 Years | 5,189 (92.7%) | 406 (7.3%) |
| 6 to 18 Years | 12,355 (94.6%) | 712 (5.4%) |
| 19 to 25 Years | 6,190 (93.5%) | 428 (6.5%) |
| 26 to 34 Years | 8,356 (92.0%) | 722 (8.0%) |
| 35 to 44 Years | 9,359 (94.7%) | 525 (5.3%) |
| 45 to 54 Years | 10,994 (95.7%) | 492 (4.3%) |
| 55 to 64 Years | 12,586 (94.6%) | 722 (5.4%) |
| 65 to 74 Years | 11,115 (99.8%) | 18 (0.2%) |
| 75 Years and older | 7,804 (99.7%) | 25 (0.3%) |
| Total | 83,948 (95.4%) | 4,050 (4.6%) |
Health Insurance Coverage by Citizenship Status in Northumberland County
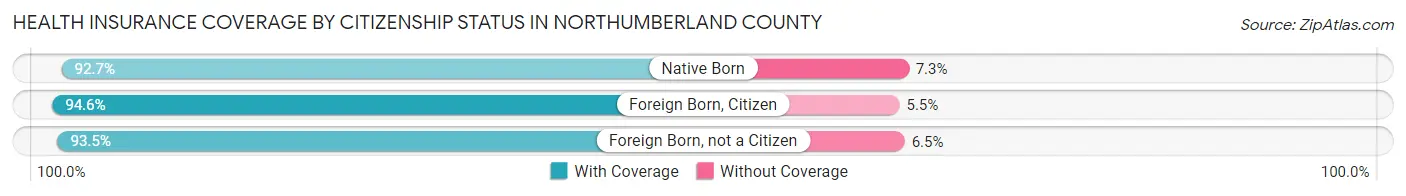
| Citizenship Status | With Coverage | Without Coverage |
| Native Born | 5,189 (92.7%) | 406 (7.3%) |
| Foreign Born, Citizen | 12,355 (94.6%) | 712 (5.4%) |
| Foreign Born, not a Citizen | 6,190 (93.5%) | 428 (6.5%) |
Health Insurance Coverage by Household Income in Northumberland County
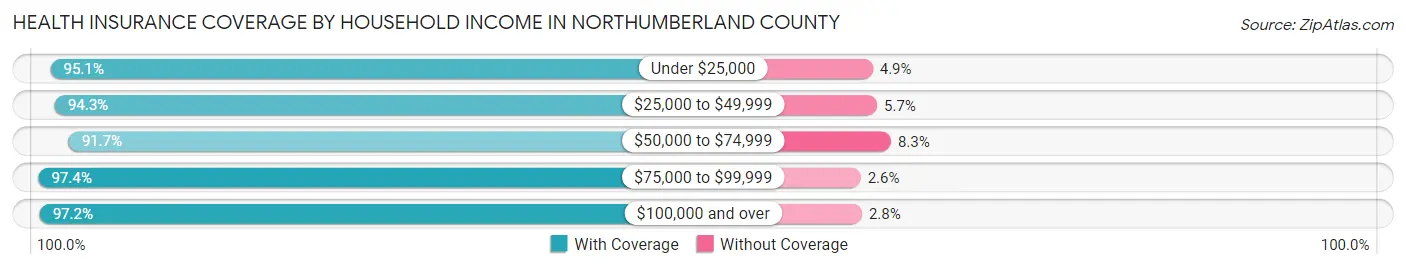
| Household Income | With Coverage | Without Coverage |
| Under $25,000 | 11,771 (95.1%) | 602 (4.9%) |
| $25,000 to $49,999 | 16,346 (94.3%) | 985 (5.7%) |
| $50,000 to $74,999 | 13,836 (91.7%) | 1,248 (8.3%) |
| $75,000 to $99,999 | 13,158 (97.4%) | 353 (2.6%) |
| $100,000 and over | 28,563 (97.2%) | 836 (2.8%) |
Public vs Private Health Insurance Coverage by Age in Northumberland County
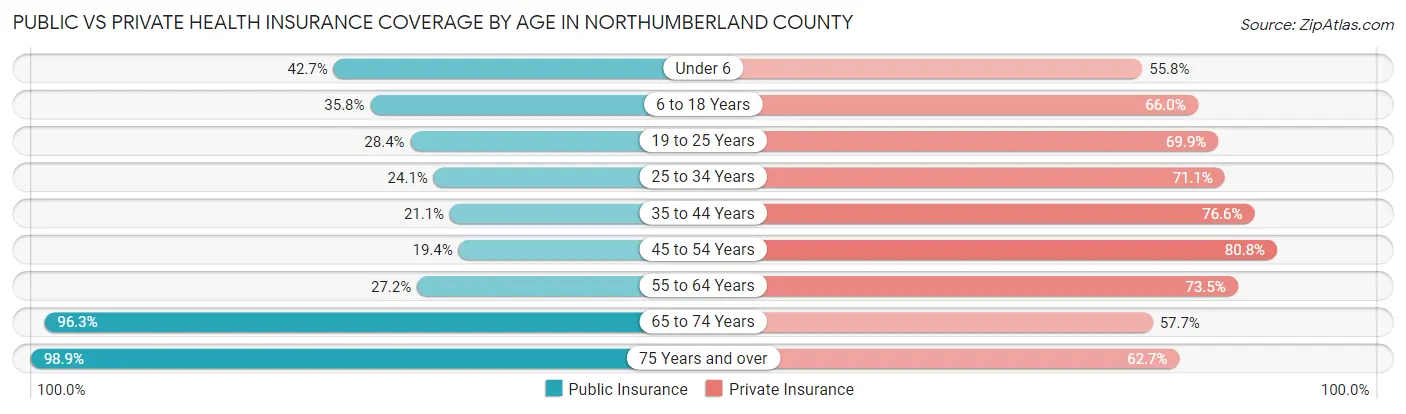
| Age Bracket | Public Insurance | Private Insurance |
| Under 6 | 2,387 (42.7%) | 3,121 (55.8%) |
| 6 to 18 Years | 4,680 (35.8%) | 8,627 (66.0%) |
| 19 to 25 Years | 1,879 (28.4%) | 4,623 (69.9%) |
| 25 to 34 Years | 2,185 (24.1%) | 6,452 (71.1%) |
| 35 to 44 Years | 2,081 (21.0%) | 7,568 (76.6%) |
| 45 to 54 Years | 2,233 (19.4%) | 9,276 (80.8%) |
| 55 to 64 Years | 3,615 (27.2%) | 9,777 (73.5%) |
| 65 to 74 Years | 10,726 (96.3%) | 6,425 (57.7%) |
| 75 Years and over | 7,740 (98.9%) | 4,905 (62.6%) |
| Total | 37,526 (42.6%) | 60,774 (69.1%) |
Disability Status by Sex by Age in Northumberland County
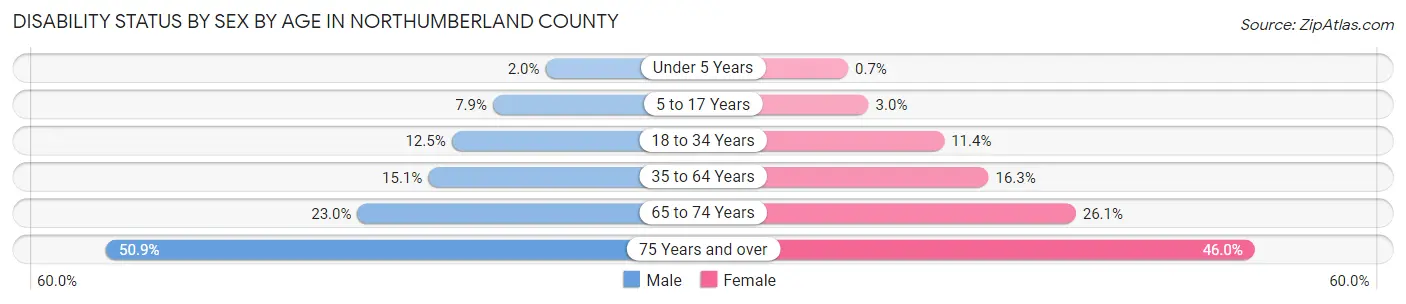
| Age Bracket | Male | Female |
| Under 5 Years | 48 (2.0%) | 15 (0.7%) |
| 5 to 17 Years | 530 (7.9%) | 194 (3.0%) |
| 18 to 34 Years | 1,045 (12.5%) | 935 (11.4%) |
| 35 to 64 Years | 2,627 (15.1%) | 2,816 (16.3%) |
| 65 to 74 Years | 1,249 (23.0%) | 1,483 (26.1%) |
| 75 Years and over | 1,676 (50.9%) | 2,086 (46.0%) |
Disability Class by Sex by Age in Northumberland County
Disability Class: Hearing Difficulty
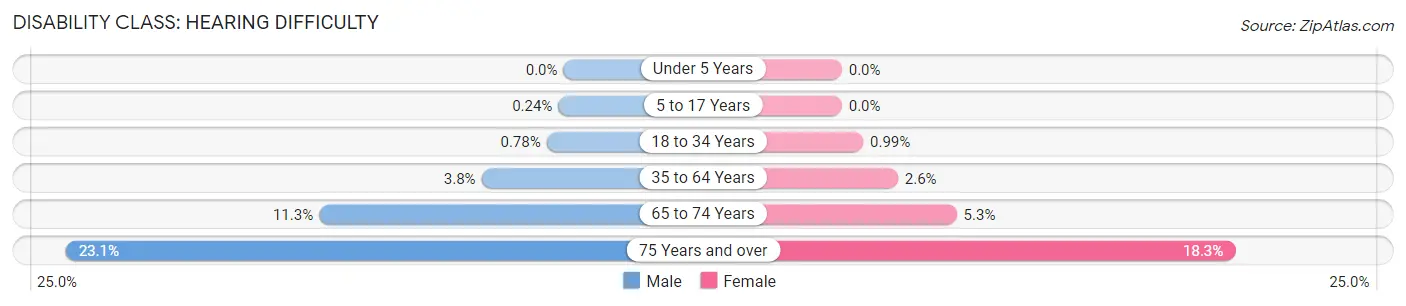
| Age Bracket | Male | Female |
| Under 5 Years | 0 (0.0%) | 0 (0.0%) |
| 5 to 17 Years | 16 (0.2%) | 0 (0.0%) |
| 18 to 34 Years | 65 (0.8%) | 81 (1.0%) |
| 35 to 64 Years | 663 (3.8%) | 448 (2.6%) |
| 65 to 74 Years | 617 (11.3%) | 303 (5.3%) |
| 75 Years and over | 760 (23.1%) | 828 (18.2%) |
Disability Class: Vision Difficulty
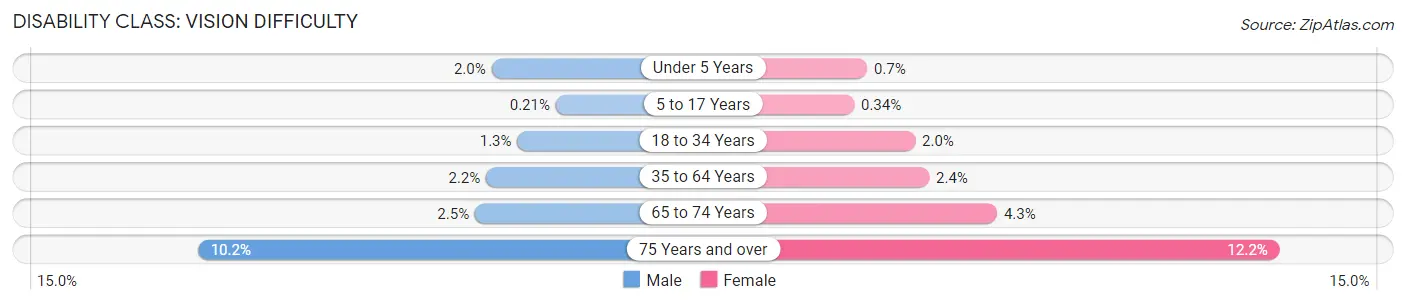
| Age Bracket | Male | Female |
| Under 5 Years | 48 (2.0%) | 15 (0.7%) |
| 5 to 17 Years | 14 (0.2%) | 22 (0.3%) |
| 18 to 34 Years | 107 (1.3%) | 167 (2.0%) |
| 35 to 64 Years | 375 (2.1%) | 418 (2.4%) |
| 65 to 74 Years | 134 (2.5%) | 246 (4.3%) |
| 75 Years and over | 335 (10.2%) | 553 (12.2%) |
Disability Class: Cognitive Difficulty
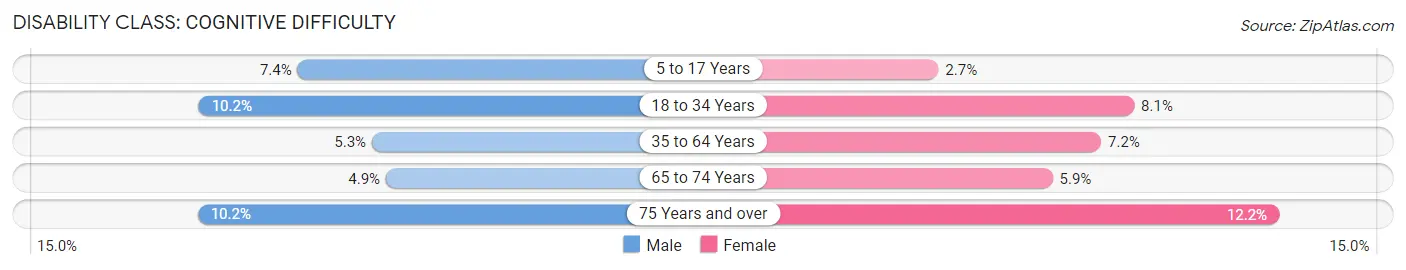
| Age Bracket | Male | Female |
| 5 to 17 Years | 499 (7.4%) | 174 (2.7%) |
| 18 to 34 Years | 851 (10.2%) | 667 (8.1%) |
| 35 to 64 Years | 930 (5.3%) | 1,244 (7.2%) |
| 65 to 74 Years | 269 (4.9%) | 334 (5.9%) |
| 75 Years and over | 335 (10.2%) | 552 (12.2%) |
Disability Class: Ambulatory Difficulty
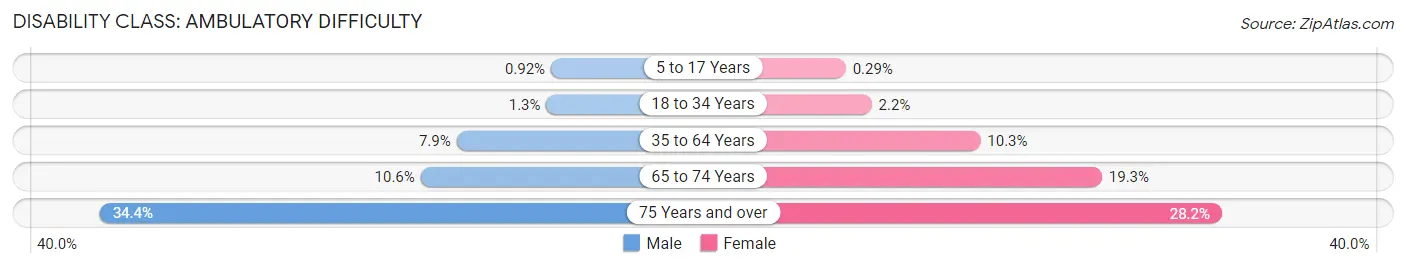
| Age Bracket | Male | Female |
| 5 to 17 Years | 62 (0.9%) | 19 (0.3%) |
| 18 to 34 Years | 106 (1.3%) | 181 (2.2%) |
| 35 to 64 Years | 1,384 (7.9%) | 1,774 (10.3%) |
| 65 to 74 Years | 577 (10.6%) | 1,099 (19.3%) |
| 75 Years and over | 1,133 (34.4%) | 1,280 (28.2%) |
Disability Class: Self-Care Difficulty
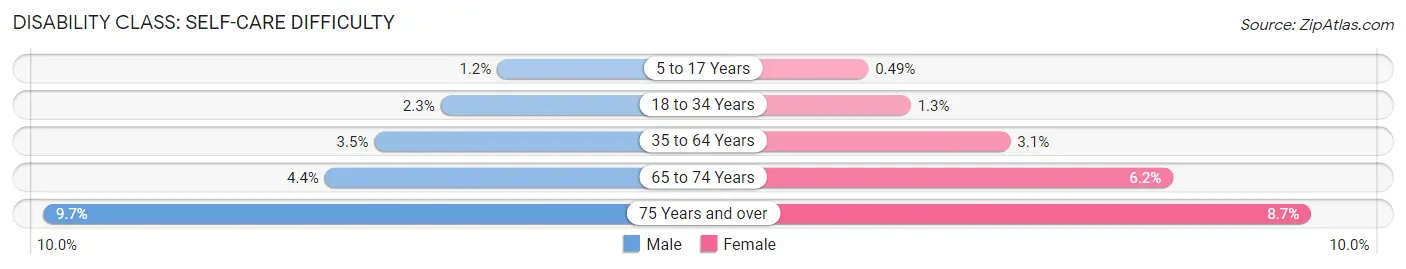
| Age Bracket | Male | Female |
| 5 to 17 Years | 83 (1.2%) | 32 (0.5%) |
| 18 to 34 Years | 191 (2.3%) | 105 (1.3%) |
| 35 to 64 Years | 612 (3.5%) | 539 (3.1%) |
| 65 to 74 Years | 241 (4.4%) | 350 (6.1%) |
| 75 Years and over | 318 (9.7%) | 395 (8.7%) |
Technology Access in Northumberland County
Computing Device Access in Northumberland County
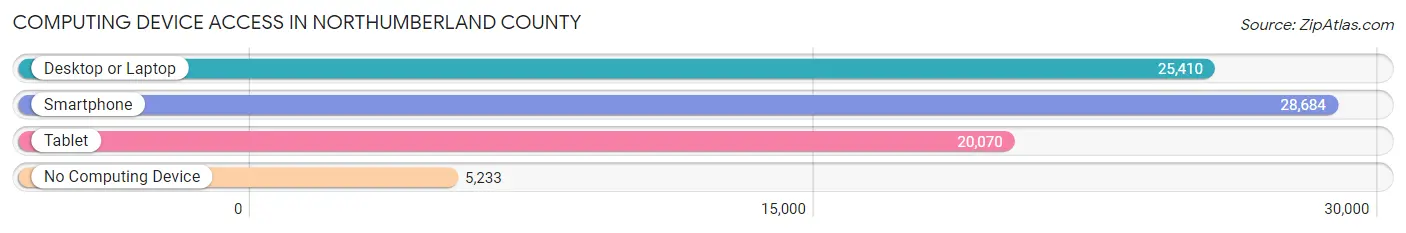
| Device Type | # Households | % Households |
| Desktop or Laptop | 25,410 | 67.3% |
| Smartphone | 28,684 | 75.9% |
| Tablet | 20,070 | 53.1% |
| No Computing Device | 5,233 | 13.9% |
| Total | 37,775 | 100.0% |
Internet Access in Northumberland County
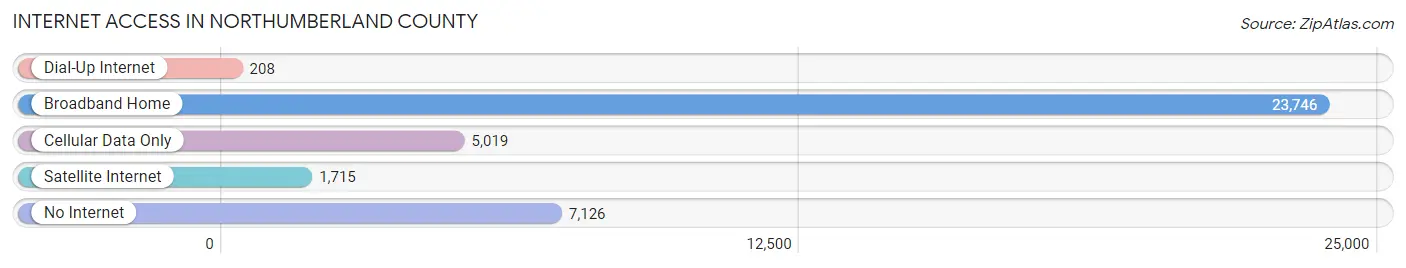
| Internet Type | # Households | % Households |
| Dial-Up Internet | 208 | 0.5% |
| Broadband Home | 23,746 | 62.9% |
| Cellular Data Only | 5,019 | 13.3% |
| Satellite Internet | 1,715 | 4.5% |
| No Internet | 7,126 | 18.9% |
| Total | 37,775 | 100.0% |
Northumberland County Summary
Northumberland County, Pennsylvania is located in the northeastern part of the state and is part of the Susquehanna Valley region. It is bordered by Lycoming County to the north, Union County to the east, Snyder County to the south, and Montour and Columbia Counties to the west. The county seat is Sunbury, and the county is home to a population of approximately 94,528 people.
History
Northumberland County was formed in 1772 from parts of Lancaster, Berks, and Northampton Counties. It was named after the county of Northumberland in England. The county was originally divided into three townships: Sunbury, Shamokin, and Turbot. The county was home to several Native American tribes, including the Susquehannock, Iroquois, and Lenape.
The county was an important part of the Revolutionary War, as it was the site of the Battle of Wyoming in 1778. The battle was a major victory for the American forces, and it helped to secure the independence of the United States.
In the 19th century, the county was an important center of the iron and coal industries. The county was also home to several important figures in American history, including James Buchanan, the 15th President of the United States, and John Brown, the abolitionist.
Geography
Northumberland County is located in the northeastern part of Pennsylvania and is part of the Susquehanna Valley region. The county is bordered by Lycoming County to the north, Union County to the east, Snyder County to the south, and Montour and Columbia Counties to the west. The county is home to several rivers, including the Susquehanna, West Branch Susquehanna, and Shamokin Creek.
The county is mostly rural, with the majority of the land being used for agricultural purposes. The county is home to several state parks, including Little Buffalo State Park, R.B. Winter State Park, and Shikellamy State Park.
Economy
Northumberland County is home to a diverse economy. The county is home to several large employers, including Weis Markets, Geisinger Health System, and Wegmans. The county is also home to several manufacturing companies, including Cargill, Inc., and Tyson Foods.
The county is home to several tourist attractions, including the Pennsylvania Grand Canyon, the Susquehanna River, and the Little Buffalo State Park. The county is also home to several wineries and breweries, including the Susquehanna Brewing Company and the Northumberland County Winery.
Demographics
As of the 2010 census, Northumberland County had a population of 94,528 people. The population is mostly white (90.2%), with a small percentage of African Americans (4.2%), Hispanics (2.3%), and Asians (1.2%). The median household income is $45,945, and the median age is 42.
The county is home to several religious denominations, including Roman Catholic (25.3%), Lutheran (14.2%), and Methodist (10.2%). The county is also home to several colleges and universities, including Bloomsburg University, Bucknell University, and Susquehanna University.
Conclusion
Northumberland County, Pennsylvania is a rural county located in the northeastern part of the state. The county is home to a diverse population and economy, and it is home to several important historical sites and tourist attractions. The county is home to several large employers, and it is home to several religious denominations and colleges and universities. Northumberland County is an important part of the Susquehanna Valley region and is an important part of Pennsylvania’s history and culture.
Common Questions
What is Per Capita Income in Northumberland County?
Per Capita income in Northumberland County is $31,240.
What is the Median Family Income in Northumberland County?
Median Family Income in Northumberland County is $74,473.
What is the Median Household income in Northumberland County?
Median Household Income in Northumberland County is $55,952.
What is Income or Wage Gap in Northumberland County?
Income or Wage Gap in Northumberland County is 31.1%.
Women in Northumberland County earn 68.9 cents for every dollar earned by a man.
What is Family Income Deficit in Northumberland County?
Family Income Deficit in Northumberland County is $10,420.
Families that are below poverty line in Northumberland County earn $10,420 less on average than the poverty threshold level.
What is Inequality or Gini Index in Northumberland County?
Inequality or Gini Index in Northumberland County is 0.43.
What is the Total Population of Northumberland County?
Total Population of Northumberland County is 91,340.
What is the Total Male Population of Northumberland County?
Total Male Population of Northumberland County is 46,403.
What is the Total Female Population of Northumberland County?
Total Female Population of Northumberland County is 44,937.
What is the Ratio of Males per 100 Females in Northumberland County?
There are 103.26 Males per 100 Females in Northumberland County.
What is the Ratio of Females per 100 Males in Northumberland County?
There are 96.84 Females per 100 Males in Northumberland County.
What is the Median Population Age in Northumberland County?
Median Population Age in Northumberland County is 44.5 Years.
What is the Average Family Size in Northumberland County
Average Family Size in Northumberland County is 2.9 People.
What is the Average Household Size in Northumberland County
Average Household Size in Northumberland County is 2.3 People.
How Large is the Labor Force in Northumberland County?
There are 43,493 People in the Labor Forcein in Northumberland County.
What is the Percentage of People in the Labor Force in Northumberland County?
57.5% of People are in the Labor Force in Northumberland County.
What is the Unemployment Rate in Northumberland County?
Unemployment Rate in Northumberland County is 4.7%.