Montour County, PA Map & Demographics
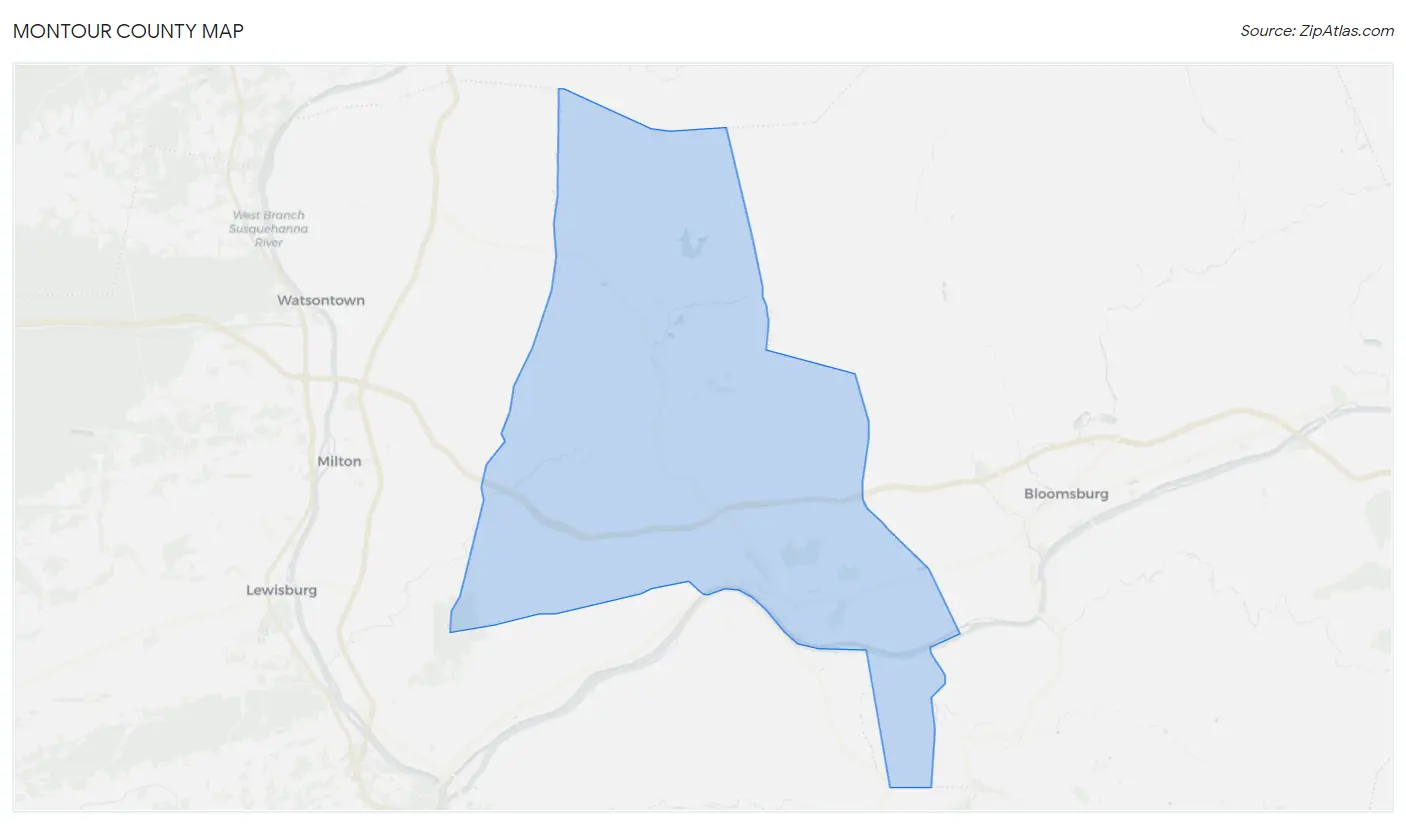
Montour County Map
Montour County Overview
$43,700
PER CAPITA INCOME
$87,020
AVG FAMILY INCOME
$72,626
AVG HOUSEHOLD INCOME
33.6%
WAGE / INCOME GAP [ % ]
66.4¢/ $1
WAGE / INCOME GAP [ $ ]
0.50
INEQUALITY / GINI INDEX
18,165
TOTAL POPULATION
8,912
MALE POPULATION
9,253
FEMALE POPULATION
96.31
MALES / 100 FEMALES
103.83
FEMALES / 100 MALES
43.2
MEDIAN AGE
2.8
AVG FAMILY SIZE
2.3
AVG HOUSEHOLD SIZE
8,977
LABOR FORCE [ PEOPLE ]
60.1%
PERCENT IN LABOR FORCE
2.4%
UNEMPLOYMENT RATE
Montour County Area Codes
Income in Montour County
Income Overview in Montour County
Per Capita Income in Montour County is $43,700, while median incomes of families and households are $87,020 and $72,626 respectively.
| Characteristic | Number | Measure |
| Per Capita Income | 18,165 | $43,700 |
| Median Family Income | 5,099 | $87,020 |
| Mean Family Income | 5,099 | $122,804 |
| Median Household Income | 7,633 | $72,626 |
| Mean Household Income | 7,633 | $103,130 |
| Income Deficit | 5,099 | $0 |
| Wage / Income Gap (%) | 18,165 | 33.63% |
| Wage / Income Gap ($) | 18,165 | 66.37¢ per $1 |
| Gini / Inequality Index | 18,165 | 0.50 |
Earnings by Sex in Montour County
Average Earnings in Montour County are $46,771, $54,989 for men and $36,498 for women, a difference of 33.6%.
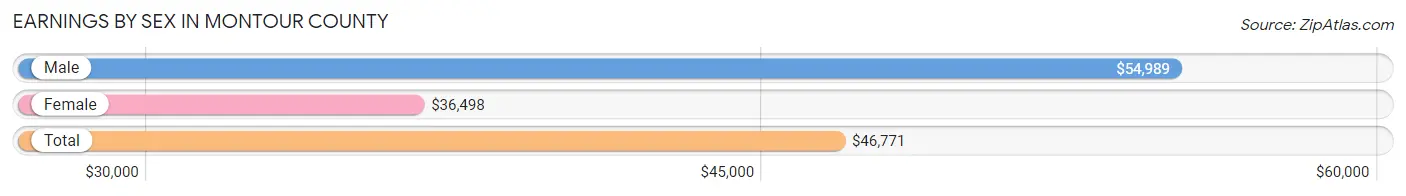
| Sex | Number | Average Earnings |
| Male | 5,123 (54.3%) | $54,989 |
| Female | 4,315 (45.7%) | $36,498 |
| Total | 9,438 (100.0%) | $46,771 |
Earnings by Sex by Income Bracket in Montour County
The most common earnings brackets in Montour County are $75,000 to $99,999 for men (812 | 15.9%) and $100,000+ for women (549 | 12.7%).
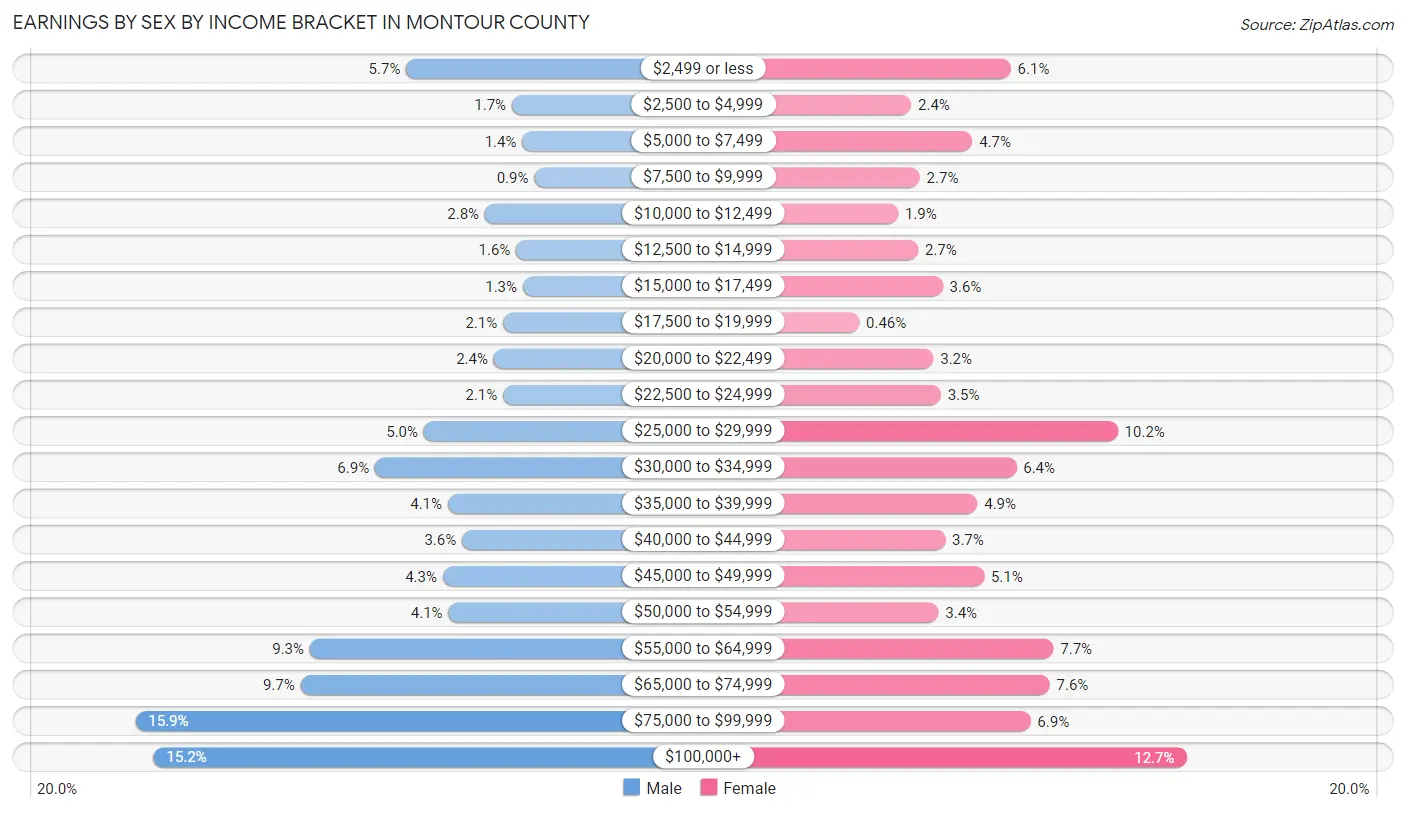
| Income | Male | Female |
| $2,499 or less | 292 (5.7%) | 265 (6.1%) |
| $2,500 to $4,999 | 89 (1.7%) | 104 (2.4%) |
| $5,000 to $7,499 | 69 (1.3%) | 203 (4.7%) |
| $7,500 to $9,999 | 46 (0.9%) | 118 (2.7%) |
| $10,000 to $12,499 | 141 (2.8%) | 83 (1.9%) |
| $12,500 to $14,999 | 81 (1.6%) | 115 (2.7%) |
| $15,000 to $17,499 | 68 (1.3%) | 155 (3.6%) |
| $17,500 to $19,999 | 106 (2.1%) | 20 (0.5%) |
| $20,000 to $22,499 | 124 (2.4%) | 140 (3.2%) |
| $22,500 to $24,999 | 106 (2.1%) | 152 (3.5%) |
| $25,000 to $29,999 | 258 (5.0%) | 438 (10.2%) |
| $30,000 to $34,999 | 352 (6.9%) | 274 (6.4%) |
| $35,000 to $39,999 | 212 (4.1%) | 211 (4.9%) |
| $40,000 to $44,999 | 185 (3.6%) | 159 (3.7%) |
| $45,000 to $49,999 | 222 (4.3%) | 222 (5.1%) |
| $50,000 to $54,999 | 211 (4.1%) | 148 (3.4%) |
| $55,000 to $64,999 | 477 (9.3%) | 334 (7.7%) |
| $65,000 to $74,999 | 495 (9.7%) | 328 (7.6%) |
| $75,000 to $99,999 | 812 (15.9%) | 297 (6.9%) |
| $100,000+ | 777 (15.2%) | 549 (12.7%) |
| Total | 5,123 (100.0%) | 4,315 (100.0%) |
Earnings by Sex by Educational Attainment in Montour County
Average earnings in Montour County are $60,041 for men and $44,350 for women, a difference of 26.1%. Men with an educational attainment of graduate degree enjoy the highest average annual earnings of $93,164, while those with less than high school education earn the least with $35,769. Women with an educational attainment of graduate degree earn the most with the average annual earnings of $73,946, while those with less than high school education have the smallest earnings of $22,188.
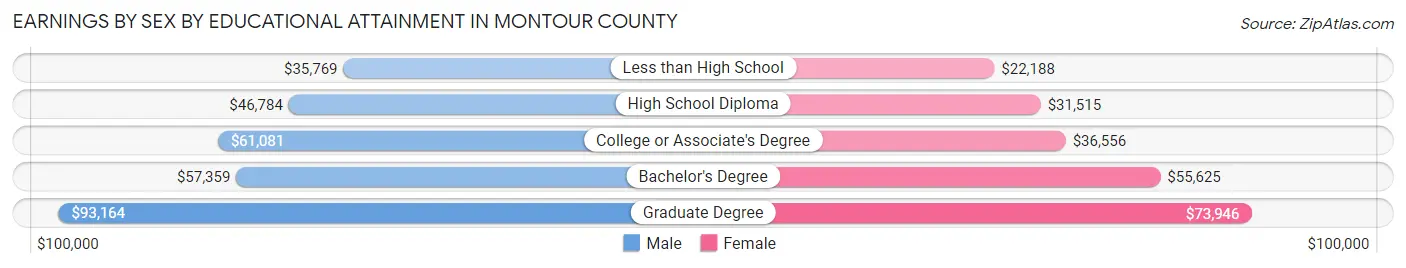
| Educational Attainment | Male Income | Female Income |
| Less than High School | $35,769 | $22,188 |
| High School Diploma | $46,784 | $31,515 |
| College or Associate's Degree | $61,081 | $36,556 |
| Bachelor's Degree | $57,359 | $55,625 |
| Graduate Degree | $93,164 | $73,946 |
| Total | $60,041 | $44,350 |
Family Income in Montour County
Family Income Brackets in Montour County
According to the Montour County family income data, there are 1,091 families falling into the $100,000 to $149,999 income range, which is the most common income bracket and makes up 21.4% of all families. Conversely, the $10,000 to $14,999 income bracket is the least frequent group with only 82 families (1.6%) belonging to this category.
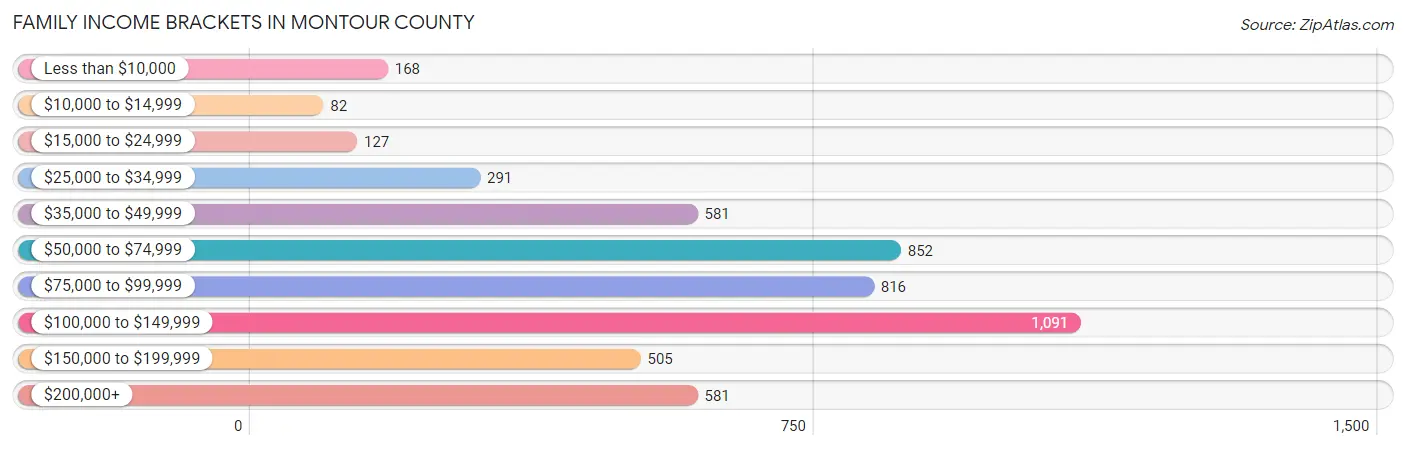
| Income Bracket | # Families | % Families |
| Less than $10,000 | 168 | 3.3% |
| $10,000 to $14,999 | 82 | 1.6% |
| $15,000 to $24,999 | 127 | 2.5% |
| $25,000 to $34,999 | 291 | 5.7% |
| $35,000 to $49,999 | 581 | 11.4% |
| $50,000 to $74,999 | 852 | 16.7% |
| $75,000 to $99,999 | 816 | 16.0% |
| $100,000 to $149,999 | 1,091 | 21.4% |
| $150,000 to $199,999 | 505 | 9.9% |
| $200,000+ | 581 | 11.4% |
Family Income by Famaliy Size in Montour County
4-person families (596 | 11.7%) account for the highest median family income in Montour County with $130,625 per family, while 2-person families (2,726 | 53.5%) have the highest median income of $35,769 per family member.
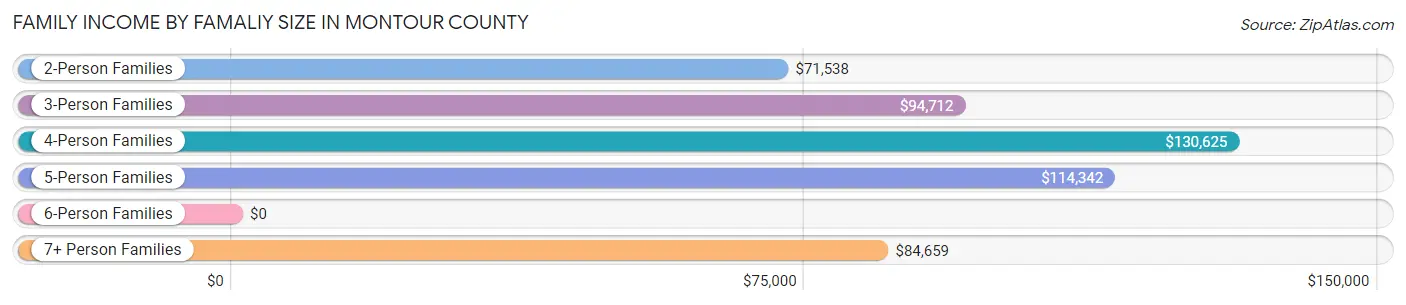
| Income Bracket | # Families | Median Income |
| 2-Person Families | 2,726 (53.5%) | $71,538 |
| 3-Person Families | 1,271 (24.9%) | $94,712 |
| 4-Person Families | 596 (11.7%) | $130,625 |
| 5-Person Families | 326 (6.4%) | $114,342 |
| 6-Person Families | 123 (2.4%) | $0 |
| 7+ Person Families | 57 (1.1%) | $84,659 |
| Total | 5,099 (100.0%) | $87,020 |
Family Income by Number of Earners in Montour County
The median family income in Montour County is $87,020, with families comprising 3+ earners (523) having the highest median family income of $135,893, while families with no earners (884) have the lowest median family income of $47,500, accounting for 10.3% and 17.3% of families, respectively.
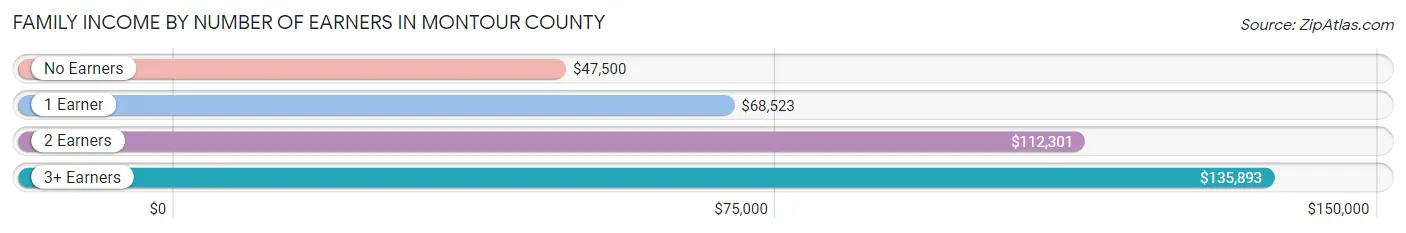
| Number of Earners | # Families | Median Income |
| No Earners | 884 (17.3%) | $47,500 |
| 1 Earner | 1,787 (35.0%) | $68,523 |
| 2 Earners | 1,905 (37.4%) | $112,301 |
| 3+ Earners | 523 (10.3%) | $135,893 |
| Total | 5,099 (100.0%) | $87,020 |
Household Income in Montour County
Household Income Brackets in Montour County
With 1,343 households falling in the category, the $100,000 to $149,999 income range is the most frequent in Montour County, accounting for 17.6% of all households. In contrast, only 198 households (2.6%) fall into the $10,000 to $14,999 income bracket, making it the least populous group.
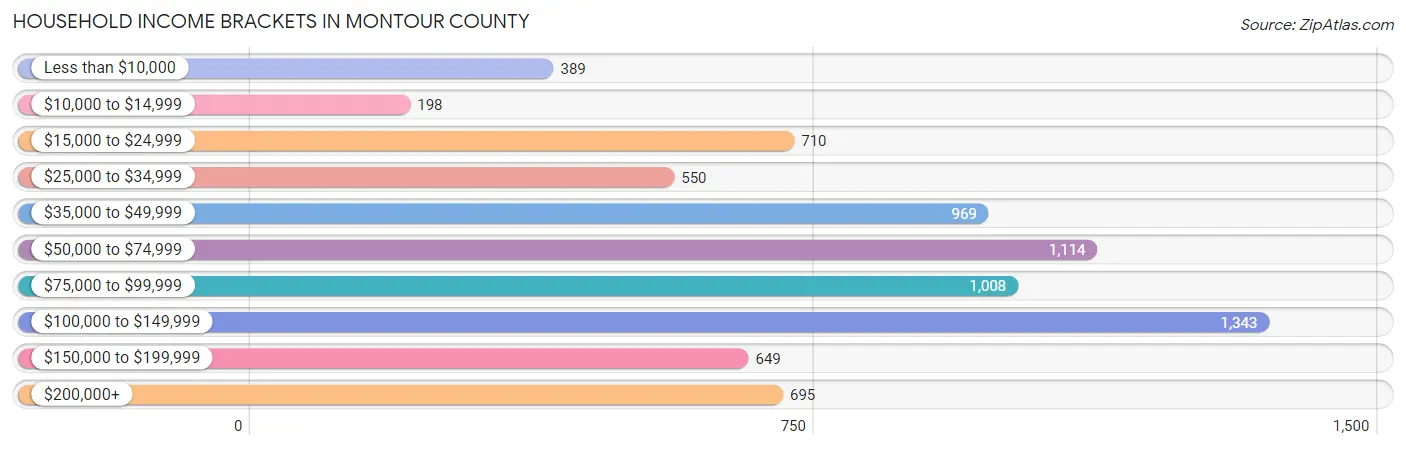
| Income Bracket | # Households | % Households |
| Less than $10,000 | 389 | 5.1% |
| $10,000 to $14,999 | 198 | 2.6% |
| $15,000 to $24,999 | 710 | 9.3% |
| $25,000 to $34,999 | 550 | 7.2% |
| $35,000 to $49,999 | 969 | 12.7% |
| $50,000 to $74,999 | 1,114 | 14.6% |
| $75,000 to $99,999 | 1,008 | 13.2% |
| $100,000 to $149,999 | 1,343 | 17.6% |
| $150,000 to $199,999 | 649 | 8.5% |
| $200,000+ | 695 | 9.1% |
Household Income by Householder Age in Montour County
The median household income in Montour County is $72,626, with the highest median household income of $98,161 found in the 45 to 64 years age bracket for the primary householder. A total of 2,668 households (34.9%) fall into this category. Meanwhile, the 15 to 24 years age bracket for the primary householder has the lowest median household income of $0, with 252 households (3.3%) in this group.
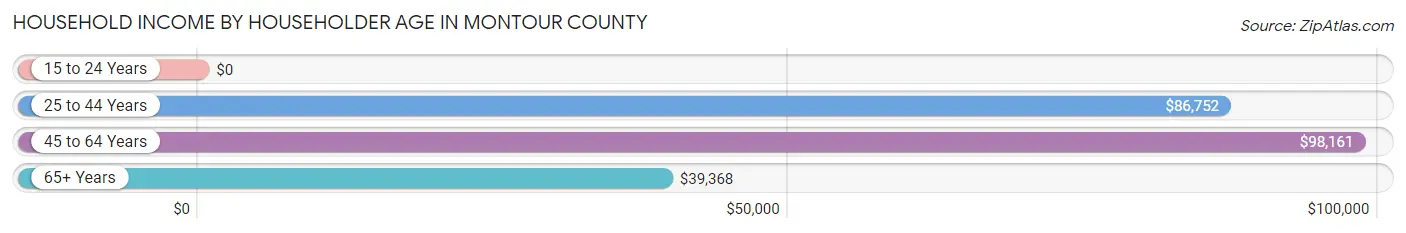
| Income Bracket | # Households | Median Income |
| 15 to 24 Years | 252 (3.3%) | $0 |
| 25 to 44 Years | 2,405 (31.5%) | $86,752 |
| 45 to 64 Years | 2,668 (34.9%) | $98,161 |
| 65+ Years | 2,308 (30.2%) | $39,368 |
| Total | 7,633 (100.0%) | $72,626 |
Poverty in Montour County
Income Below Poverty by Sex and Age in Montour County
With 6.9% poverty level for males and 10.4% for females among the residents of Montour County, 6 to 11 year old males and under 5 year old females are the most vulnerable to poverty, with 128 males (21.0%) and 128 females (25.5%) in their respective age groups living below the poverty level.
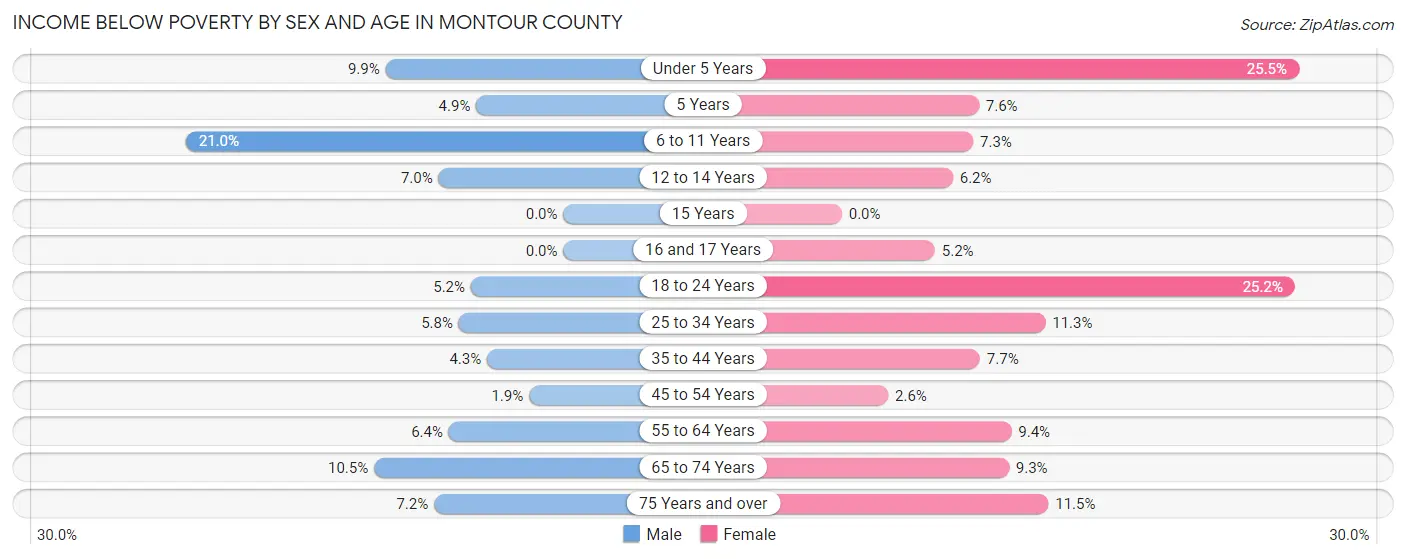
| Age Bracket | Male | Female |
| Under 5 Years | 51 (9.9%) | 128 (25.5%) |
| 5 Years | 5 (4.9%) | 9 (7.6%) |
| 6 to 11 Years | 128 (21.0%) | 37 (7.3%) |
| 12 to 14 Years | 18 (7.0%) | 16 (6.2%) |
| 15 Years | 0 (0.0%) | 0 (0.0%) |
| 16 and 17 Years | 0 (0.0%) | 10 (5.2%) |
| 18 to 24 Years | 30 (5.1%) | 142 (25.2%) |
| 25 to 34 Years | 75 (5.8%) | 127 (11.3%) |
| 35 to 44 Years | 43 (4.3%) | 85 (7.7%) |
| 45 to 54 Years | 19 (1.9%) | 27 (2.6%) |
| 55 to 64 Years | 82 (6.4%) | 131 (9.4%) |
| 65 to 74 Years | 94 (10.5%) | 95 (9.3%) |
| 75 Years and over | 44 (7.2%) | 114 (11.5%) |
| Total | 589 (6.9%) | 921 (10.4%) |
Income Above Poverty by Sex and Age in Montour County
According to the poverty statistics in Montour County, males aged 15 years and females aged 15 years are the age groups that are most secure financially, with 100.0% of males and 100.0% of females in these age groups living above the poverty line.
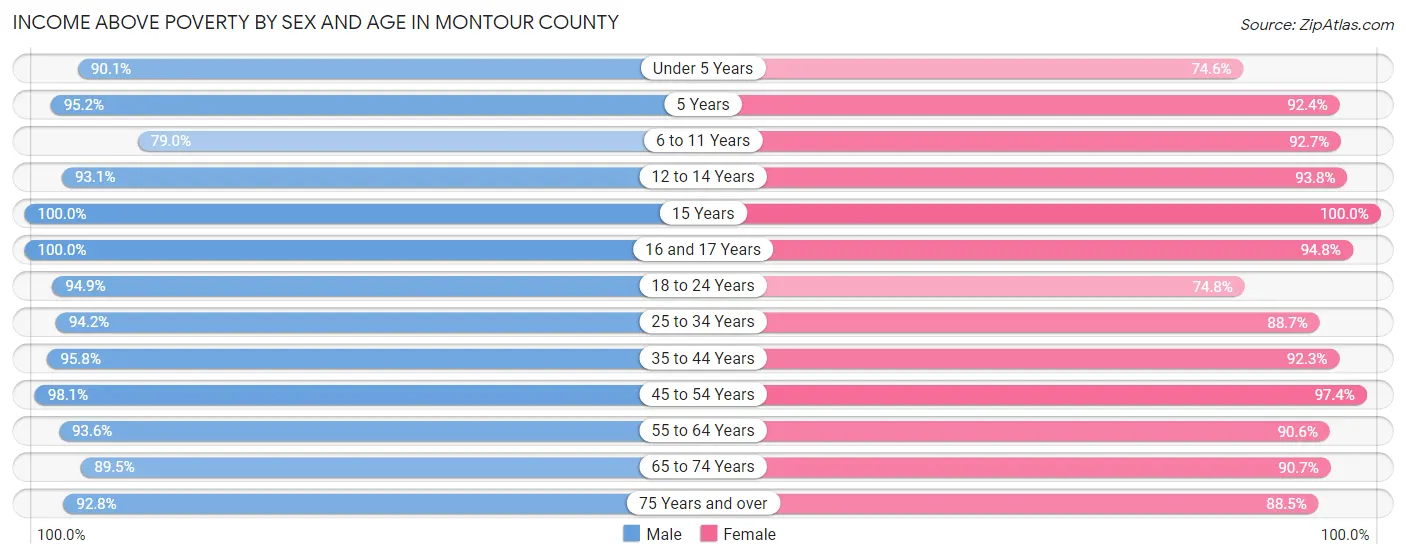
| Age Bracket | Male | Female |
| Under 5 Years | 464 (90.1%) | 375 (74.6%) |
| 5 Years | 98 (95.2%) | 109 (92.4%) |
| 6 to 11 Years | 481 (79.0%) | 469 (92.7%) |
| 12 to 14 Years | 241 (93.0%) | 243 (93.8%) |
| 15 Years | 133 (100.0%) | 64 (100.0%) |
| 16 and 17 Years | 211 (100.0%) | 183 (94.8%) |
| 18 to 24 Years | 552 (94.9%) | 421 (74.8%) |
| 25 to 34 Years | 1,213 (94.2%) | 994 (88.7%) |
| 35 to 44 Years | 968 (95.8%) | 1,020 (92.3%) |
| 45 to 54 Years | 977 (98.1%) | 1,021 (97.4%) |
| 55 to 64 Years | 1,203 (93.6%) | 1,257 (90.6%) |
| 65 to 74 Years | 798 (89.5%) | 927 (90.7%) |
| 75 Years and over | 567 (92.8%) | 877 (88.5%) |
| Total | 7,906 (93.1%) | 7,960 (89.6%) |
Income Below Poverty Among Married-Couple Families in Montour County
The poverty statistics for married-couple families in Montour County show that 3.1% or 123 of the total 4,017 families live below the poverty line. Families with 5 or more children have the highest poverty rate of 12.0%, comprising of 3 families. On the other hand, families with no children have the lowest poverty rate of 2.9%, which includes 73 families.
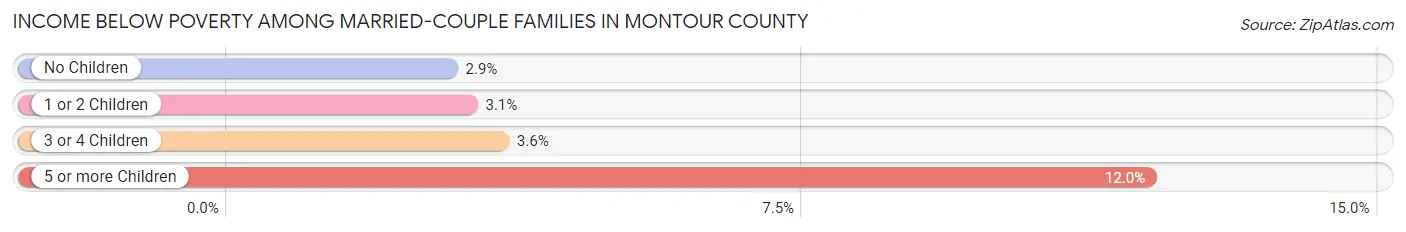
| Children | Above Poverty | Below Poverty |
| No Children | 2,463 (97.1%) | 73 (2.9%) |
| 1 or 2 Children | 1,110 (96.9%) | 36 (3.1%) |
| 3 or 4 Children | 299 (96.5%) | 11 (3.5%) |
| 5 or more Children | 22 (88.0%) | 3 (12.0%) |
| Total | 3,894 (96.9%) | 123 (3.1%) |
Income Below Poverty Among Single-Parent Households in Montour County
According to the poverty data in Montour County, 3.9% or 14 single-father households and 27.6% or 200 single-mother households are living below the poverty line. Among single-father households, those with no children have the highest poverty rate, with 14 households (10.9%) experiencing poverty. Likewise, among single-mother households, those with 3 or 4 children have the highest poverty rate, with 62 households (93.9%) falling below the poverty line.
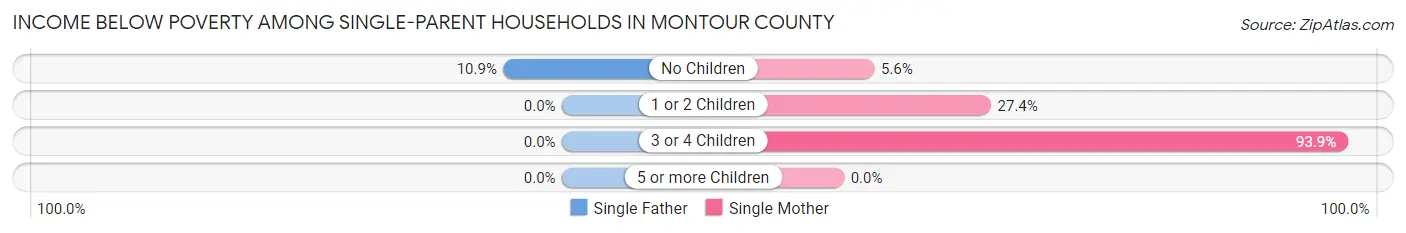
| Children | Single Father | Single Mother |
| No Children | 14 (10.9%) | 11 (5.6%) |
| 1 or 2 Children | 0 (0.0%) | 127 (27.4%) |
| 3 or 4 Children | 0 (0.0%) | 62 (93.9%) |
| 5 or more Children | 0 (0.0%) | 0 (0.0%) |
| Total | 14 (3.9%) | 200 (27.6%) |
Income Below Poverty Among Married-Couple vs Single-Parent Households in Montour County
The poverty data for Montour County shows that 123 of the married-couple family households (3.1%) and 214 of the single-parent households (19.8%) are living below the poverty level. Within the married-couple family households, those with 5 or more children have the highest poverty rate, with 3 households (12.0%) falling below the poverty line. Among the single-parent households, those with 3 or 4 children have the highest poverty rate, with 62 household (89.9%) living below poverty.
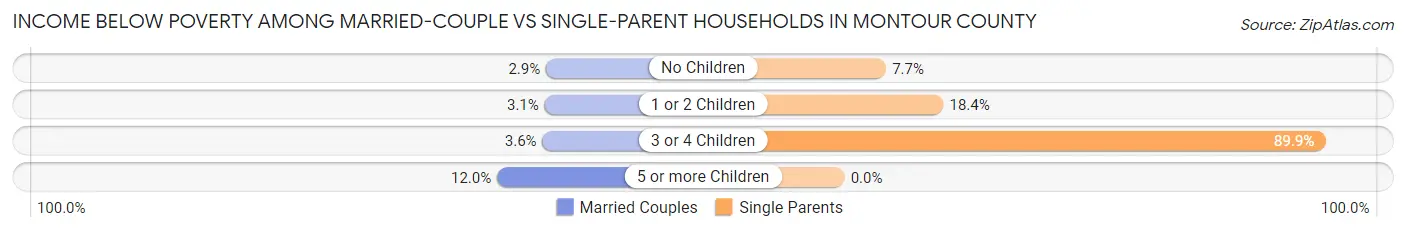
| Children | Married-Couple Families | Single-Parent Households |
| No Children | 73 (2.9%) | 25 (7.7%) |
| 1 or 2 Children | 36 (3.1%) | 127 (18.4%) |
| 3 or 4 Children | 11 (3.5%) | 62 (89.9%) |
| 5 or more Children | 3 (12.0%) | 0 (0.0%) |
| Total | 123 (3.1%) | 214 (19.8%) |
Race in Montour County
The most populous races in Montour County are White / Caucasian (16,602 | 91.4%), Asian (660 | 3.6%), and Hispanic or Latino (517 | 2.9%).
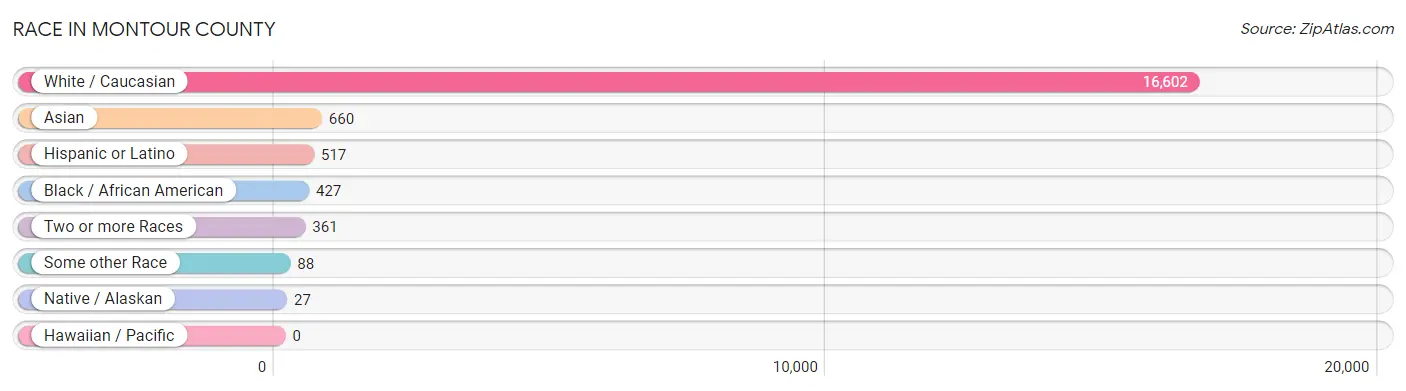
| Race | # Population | % Population |
| Asian | 660 | 3.6% |
| Black / African American | 427 | 2.4% |
| Hawaiian / Pacific | 0 | 0.0% |
| Hispanic or Latino | 517 | 2.9% |
| Native / Alaskan | 27 | 0.2% |
| White / Caucasian | 16,602 | 91.4% |
| Two or more Races | 361 | 2.0% |
| Some other Race | 88 | 0.5% |
| Total | 18,165 | 100.0% |
Ancestry in Montour County
The most populous ancestries reported in Montour County are German (5,722 | 31.5%), English (2,734 | 15.0%), Irish (1,749 | 9.6%), Italian (861 | 4.7%), and Polish (822 | 4.5%), together accounting for 65.5% of all Montour County residents.
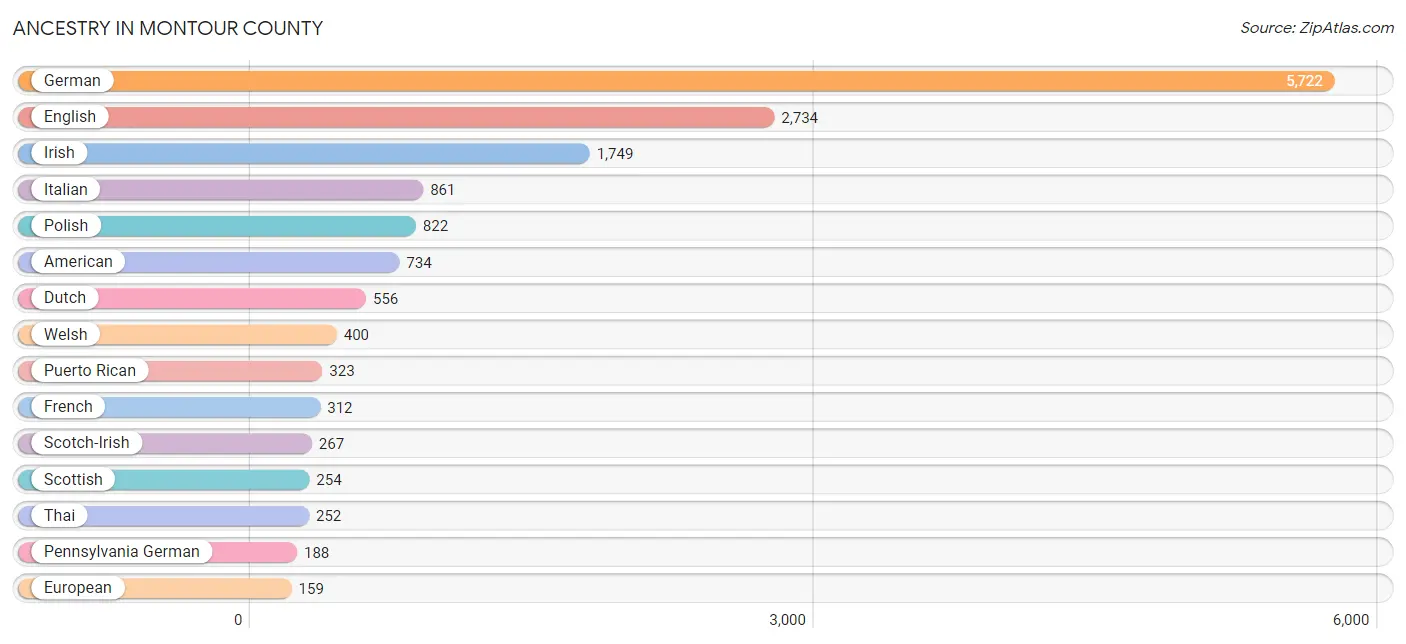
| Ancestry | # Population | % Population |
| African | 1 | 0.0% |
| Albanian | 5 | 0.0% |
| American | 734 | 4.0% |
| Arab | 80 | 0.4% |
| Armenian | 19 | 0.1% |
| Australian | 19 | 0.1% |
| Austrian | 40 | 0.2% |
| Belgian | 2 | 0.0% |
| Blackfeet | 5 | 0.0% |
| Brazilian | 118 | 0.6% |
| British | 70 | 0.4% |
| Bulgarian | 16 | 0.1% |
| Burmese | 5 | 0.0% |
| Canadian | 18 | 0.1% |
| Central American | 66 | 0.4% |
| Central American Indian | 20 | 0.1% |
| Cheyenne | 7 | 0.0% |
| Colombian | 11 | 0.1% |
| Czech | 47 | 0.3% |
| Czechoslovakian | 6 | 0.0% |
| Danish | 2 | 0.0% |
| Dominican | 4 | 0.0% |
| Dutch | 556 | 3.1% |
| Eastern European | 11 | 0.1% |
| Egyptian | 26 | 0.1% |
| English | 2,734 | 15.0% |
| European | 159 | 0.9% |
| French | 312 | 1.7% |
| French Canadian | 47 | 0.3% |
| German | 5,722 | 31.5% |
| Ghanaian | 44 | 0.2% |
| Greek | 75 | 0.4% |
| Guatemalan | 28 | 0.2% |
| Honduran | 36 | 0.2% |
| Hungarian | 157 | 0.9% |
| Indian (Asian) | 126 | 0.7% |
| Iraqi | 48 | 0.3% |
| Irish | 1,749 | 9.6% |
| Iroquois | 29 | 0.2% |
| Italian | 861 | 4.7% |
| Jamaican | 31 | 0.2% |
| Korean | 27 | 0.2% |
| Lebanese | 6 | 0.0% |
| Lithuanian | 40 | 0.2% |
| Mexican | 67 | 0.4% |
| Norwegian | 87 | 0.5% |
| Pennsylvania German | 188 | 1.0% |
| Polish | 822 | 4.5% |
| Portuguese | 2 | 0.0% |
| Puerto Rican | 323 | 1.8% |
| Romanian | 10 | 0.1% |
| Russian | 59 | 0.3% |
| Salvadoran | 2 | 0.0% |
| Scandinavian | 17 | 0.1% |
| Scotch-Irish | 267 | 1.5% |
| Scottish | 254 | 1.4% |
| Serbian | 1 | 0.0% |
| Sioux | 2 | 0.0% |
| Slavic | 68 | 0.4% |
| Slovak | 109 | 0.6% |
| South American | 23 | 0.1% |
| Spaniard | 21 | 0.1% |
| Sri Lankan | 1 | 0.0% |
| Subsaharan African | 45 | 0.3% |
| Swedish | 122 | 0.7% |
| Swiss | 80 | 0.4% |
| Thai | 252 | 1.4% |
| Trinidadian and Tobagonian | 5 | 0.0% |
| Ukrainian | 108 | 0.6% |
| Venezuelan | 12 | 0.1% |
| Vietnamese | 10 | 0.1% |
| Welsh | 400 | 2.2% |
| West Indian | 23 | 0.1% | View All 73 Rows |
Immigrants in Montour County
The most numerous immigrant groups reported in Montour County came from Asia (555 | 3.1%), South Central Asia (402 | 2.2%), Pakistan (250 | 1.4%), Latin America (190 | 1.1%), and India (152 | 0.8%), together accounting for 8.5% of all Montour County residents.
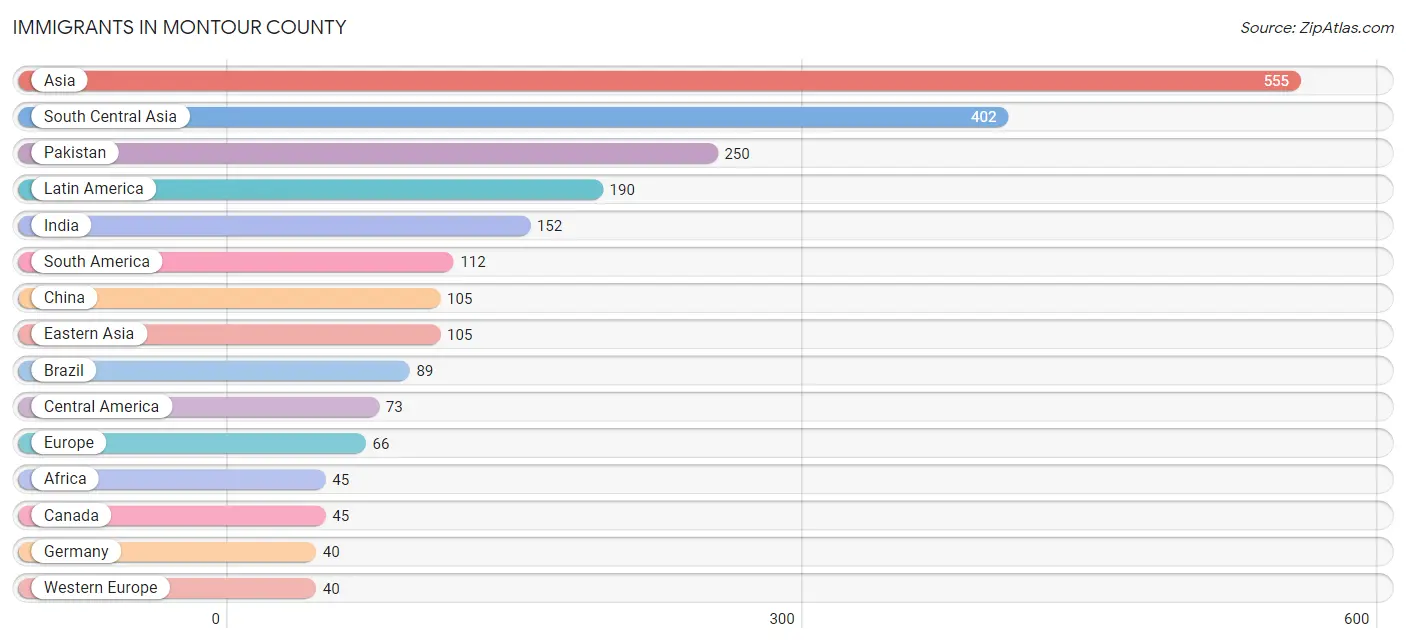
| Immigration Origin | # Population | % Population |
| Africa | 45 | 0.3% |
| Asia | 555 | 3.1% |
| Australia | 18 | 0.1% |
| Brazil | 89 | 0.5% |
| Bulgaria | 6 | 0.0% |
| Canada | 45 | 0.3% |
| Caribbean | 5 | 0.0% |
| Central America | 73 | 0.4% |
| China | 105 | 0.6% |
| Colombia | 11 | 0.1% |
| Eastern Asia | 105 | 0.6% |
| Eastern Europe | 16 | 0.1% |
| Egypt | 26 | 0.1% |
| England | 4 | 0.0% |
| Europe | 66 | 0.4% |
| Germany | 40 | 0.2% |
| Ghana | 19 | 0.1% |
| Guatemala | 12 | 0.1% |
| Honduras | 36 | 0.2% |
| India | 152 | 0.8% |
| Iraq | 39 | 0.2% |
| Italy | 6 | 0.0% |
| Latin America | 190 | 1.1% |
| Mexico | 25 | 0.1% |
| Northern Africa | 26 | 0.1% |
| Northern Europe | 4 | 0.0% |
| Oceania | 18 | 0.1% |
| Pakistan | 250 | 1.4% |
| Philippines | 8 | 0.0% |
| Romania | 10 | 0.1% |
| South America | 112 | 0.6% |
| South Central Asia | 402 | 2.2% |
| South Eastern Asia | 9 | 0.1% |
| Southern Europe | 6 | 0.0% |
| Trinidad and Tobago | 5 | 0.0% |
| Venezuela | 12 | 0.1% |
| Vietnam | 1 | 0.0% |
| Western Africa | 19 | 0.1% |
| Western Asia | 39 | 0.2% |
| Western Europe | 40 | 0.2% | View All 40 Rows |
Sex and Age in Montour County
Sex and Age in Montour County
The most populous age groups in Montour County are 30 to 34 Years (805 | 9.0%) for men and 60 to 64 Years (822 | 8.9%) for women.
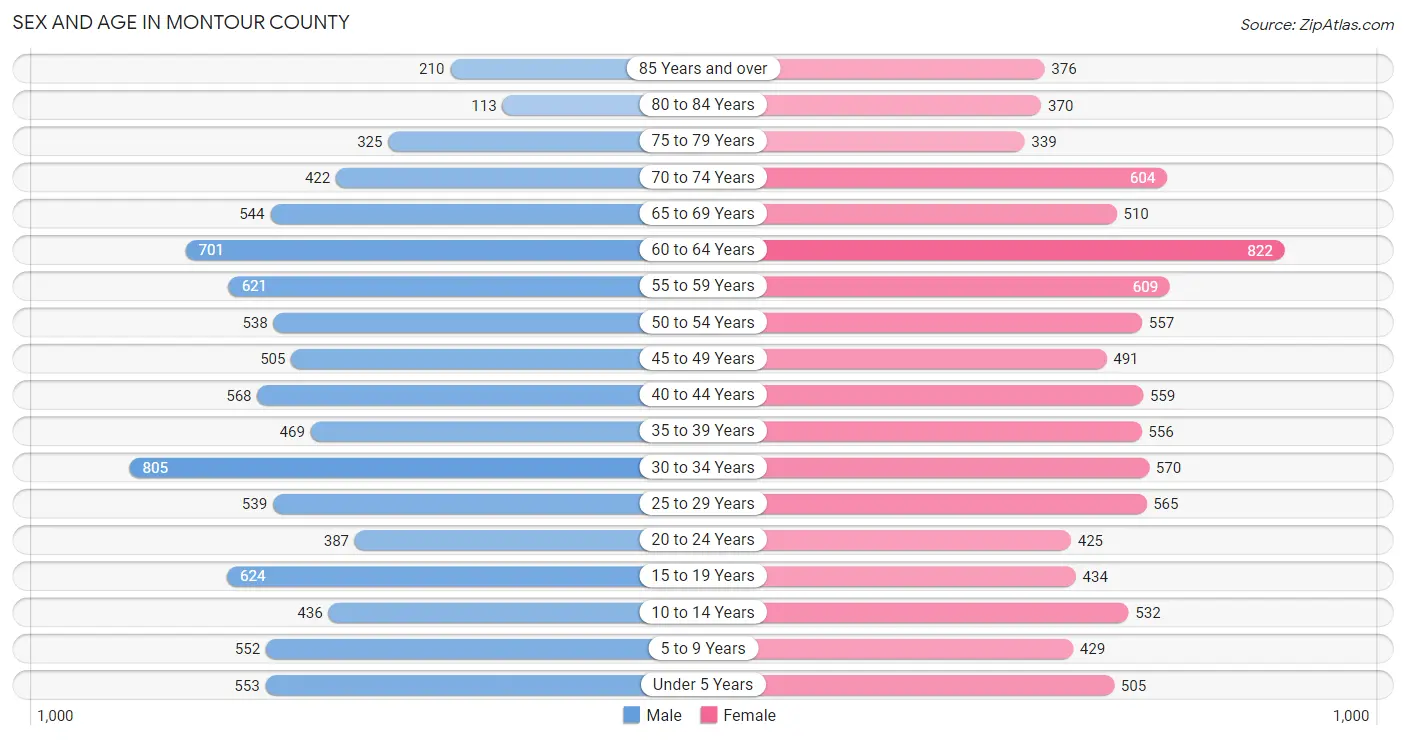
| Age Bracket | Male | Female |
| Under 5 Years | 553 (6.2%) | 505 (5.5%) |
| 5 to 9 Years | 552 (6.2%) | 429 (4.6%) |
| 10 to 14 Years | 436 (4.9%) | 532 (5.8%) |
| 15 to 19 Years | 624 (7.0%) | 434 (4.7%) |
| 20 to 24 Years | 387 (4.3%) | 425 (4.6%) |
| 25 to 29 Years | 539 (6.0%) | 565 (6.1%) |
| 30 to 34 Years | 805 (9.0%) | 570 (6.2%) |
| 35 to 39 Years | 469 (5.3%) | 556 (6.0%) |
| 40 to 44 Years | 568 (6.4%) | 559 (6.0%) |
| 45 to 49 Years | 505 (5.7%) | 491 (5.3%) |
| 50 to 54 Years | 538 (6.0%) | 557 (6.0%) |
| 55 to 59 Years | 621 (7.0%) | 609 (6.6%) |
| 60 to 64 Years | 701 (7.9%) | 822 (8.9%) |
| 65 to 69 Years | 544 (6.1%) | 510 (5.5%) |
| 70 to 74 Years | 422 (4.7%) | 604 (6.5%) |
| 75 to 79 Years | 325 (3.6%) | 339 (3.7%) |
| 80 to 84 Years | 113 (1.3%) | 370 (4.0%) |
| 85 Years and over | 210 (2.4%) | 376 (4.1%) |
| Total | 8,912 (100.0%) | 9,253 (100.0%) |
Families and Households in Montour County
Median Family Size in Montour County
The median family size in Montour County is 2.75 persons per family, with married-couple families (4,017 | 78.8%) accounting for the largest median family size of 2.87 persons per family. On the other hand, single male/father families (357 | 7.0%) represent the smallest median family size with 2.27 persons per family.
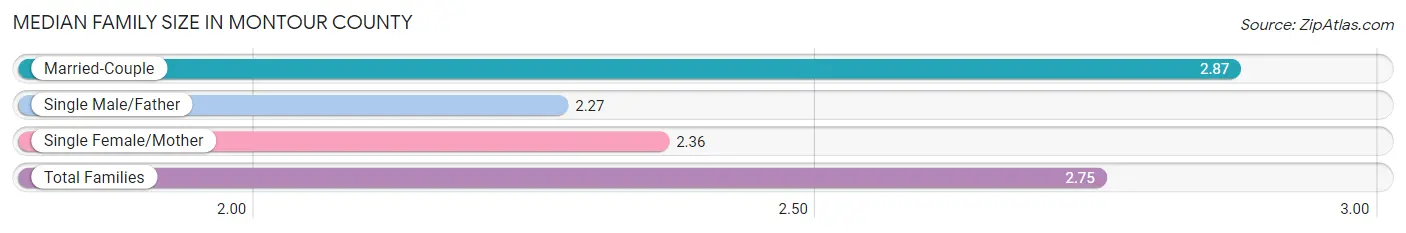
| Family Type | # Families | Family Size |
| Married-Couple | 4,017 (78.8%) | 2.87 |
| Single Male/Father | 357 (7.0%) | 2.27 |
| Single Female/Mother | 725 (14.2%) | 2.36 |
| Total Families | 5,099 (100.0%) | 2.75 |
Median Household Size in Montour County
The median household size in Montour County is 2.28 persons per household, with single male/father households (357 | 4.7%) accounting for the largest median household size of 2.94 persons per household. non-family households (2,534 | 33.2%) represent the smallest median household size with 1.14 persons per household.
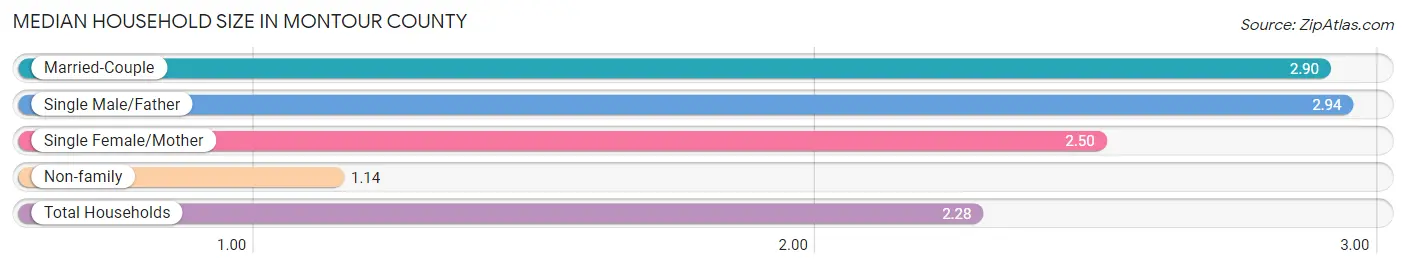
| Household Type | # Households | Household Size |
| Married-Couple | 4,017 (52.6%) | 2.90 |
| Single Male/Father | 357 (4.7%) | 2.94 |
| Single Female/Mother | 725 (9.5%) | 2.50 |
| Non-family | 2,534 (33.2%) | 1.14 |
| Total Households | 7,633 (100.0%) | 2.28 |
Household Size by Marriage Status in Montour County
Out of a total of 7,633 households in Montour County, 5,099 (66.8%) are family households, while 2,534 (33.2%) are nonfamily households. The most numerous type of family households are 2-person households, comprising 2,593, and the most common type of nonfamily households are 1-person households, comprising 2,211.
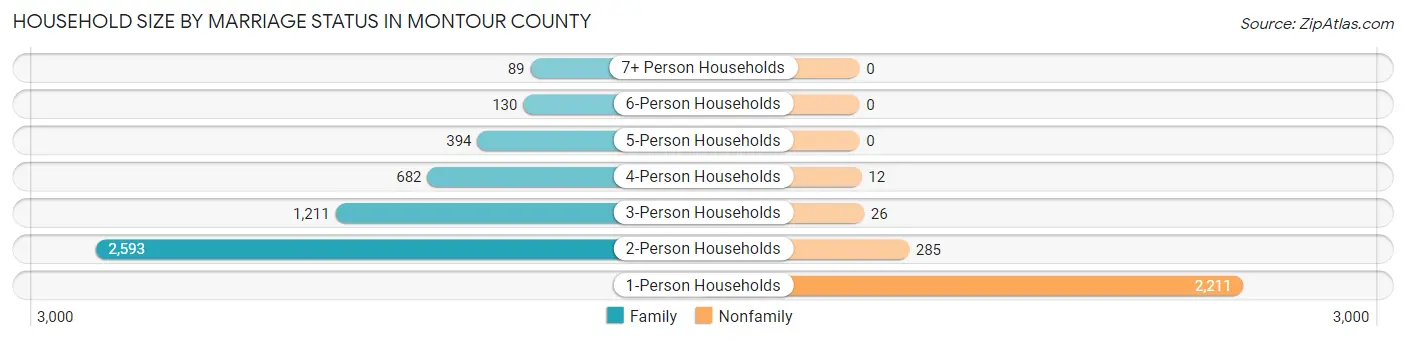
| Household Size | Family Households | Nonfamily Households |
| 1-Person Households | - | 2,211 (29.0%) |
| 2-Person Households | 2,593 (34.0%) | 285 (3.7%) |
| 3-Person Households | 1,211 (15.9%) | 26 (0.3%) |
| 4-Person Households | 682 (8.9%) | 12 (0.2%) |
| 5-Person Households | 394 (5.2%) | 0 (0.0%) |
| 6-Person Households | 130 (1.7%) | 0 (0.0%) |
| 7+ Person Households | 89 (1.2%) | 0 (0.0%) |
| Total | 5,099 (66.8%) | 2,534 (33.2%) |
Female Fertility in Montour County
Fertility by Age in Montour County
Average fertility rate in Montour County is 43.0 births per 1,000 women. Women in the age bracket of 35 to 50 years have the highest fertility rate with 58.0 births per 1,000 women. Women in the age bracket of 35 to 50 years acount for 63.5% of all women with births.
| Age Bracket | Women with Births | Births / 1,000 Women |
| 15 to 19 years | 0 (0.0%) | 0.0 |
| 20 to 34 years | 58 (36.5%) | 37.0 |
| 35 to 50 years | 101 (63.5%) | 58.0 |
| Total | 159 (100.0%) | 43.0 |
Fertility by Age by Marriage Status in Montour County
95.6% of women with births (159) in Montour County are married. The highest percentage of unmarried women with births falls into 20 to 34 years age bracket with 12.1% of them unmarried at the time of birth, while the lowest percentage of unmarried women with births belong to 35 to 50 years age bracket with 0.0% of them unmarried.
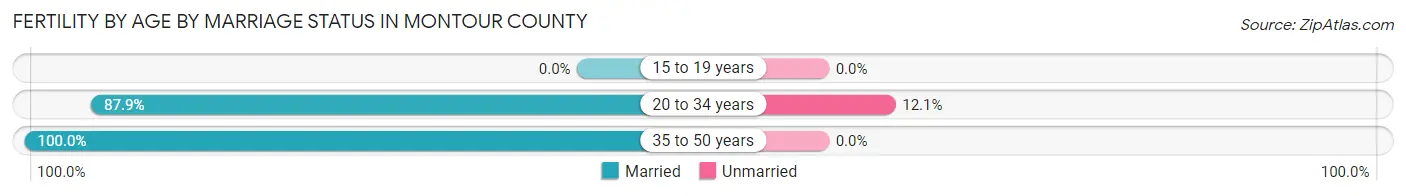
| Age Bracket | Married | Unmarried |
| 15 to 19 years | 0 (0.0%) | 0 (0.0%) |
| 20 to 34 years | 51 (87.9%) | 7 (12.1%) |
| 35 to 50 years | 101 (100.0%) | 0 (0.0%) |
| Total | 152 (95.6%) | 7 (4.4%) |
Fertility by Education in Montour County
Average fertility rate in Montour County is 43.0 births per 1,000 women. Women with the education attainment of graduate degree have the highest fertility rate of 81.0 births per 1,000 women, while women with the education attainment of less than high school have the lowest fertility at 5.0 births per 1,000 women. Women with the education attainment of graduate degree represent 44.0% of all women with births.
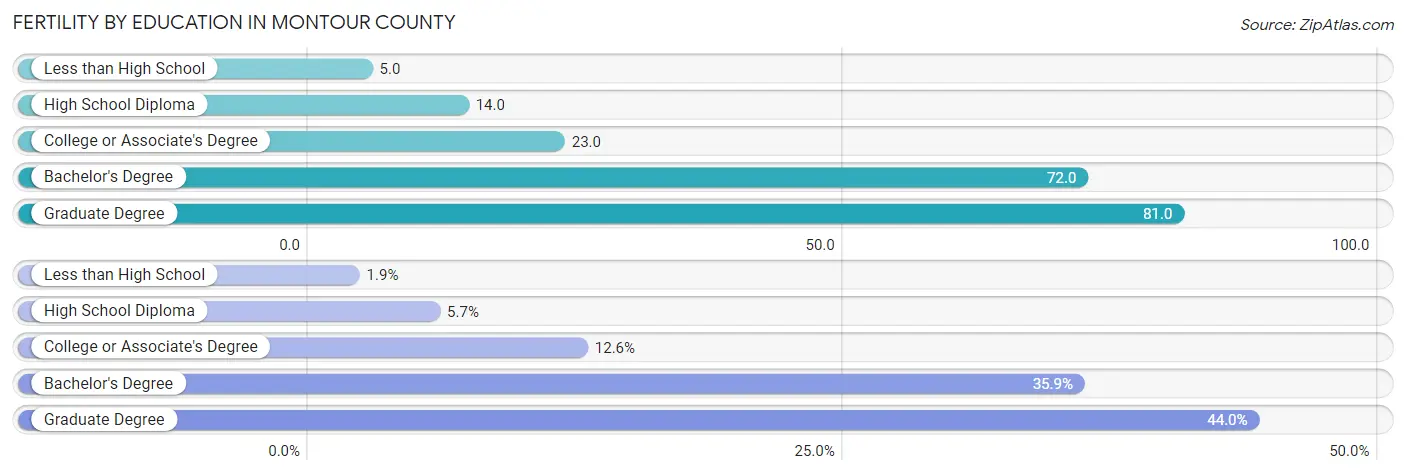
| Educational Attainment | Women with Births | Births / 1,000 Women |
| Less than High School | 3 (1.9%) | 5.0 |
| High School Diploma | 9 (5.7%) | 14.0 |
| College or Associate's Degree | 20 (12.6%) | 23.0 |
| Bachelor's Degree | 57 (35.8%) | 72.0 |
| Graduate Degree | 70 (44.0%) | 81.0 |
| Total | 159 (100.0%) | 43.0 |
Fertility by Education by Marriage Status in Montour County
4.4% of women with births in Montour County are unmarried. Women with the educational attainment of high school diploma are most likely to be married with 100.0% of them married at childbirth, while women with the educational attainment of less than high school are least likely to be married with 100.0% of them unmarried at childbirth.
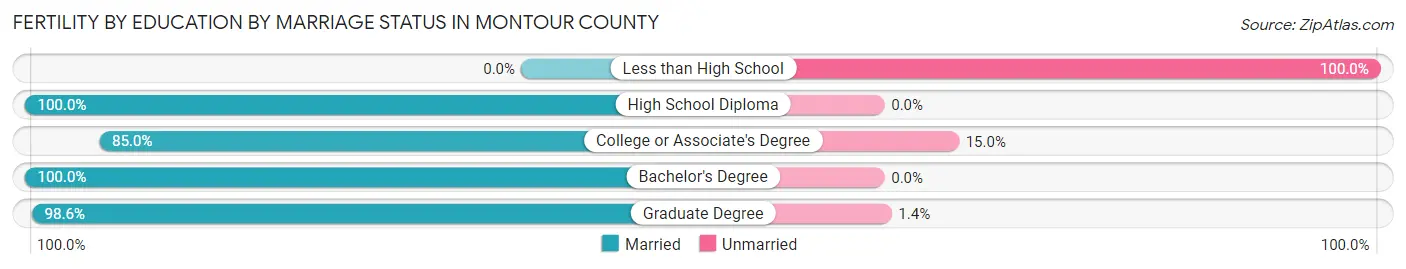
| Educational Attainment | Married | Unmarried |
| Less than High School | 0 (0.0%) | 3 (100.0%) |
| High School Diploma | 9 (100.0%) | 0 (0.0%) |
| College or Associate's Degree | 17 (85.0%) | 3 (15.0%) |
| Bachelor's Degree | 57 (100.0%) | 0 (0.0%) |
| Graduate Degree | 69 (98.6%) | 1 (1.4%) |
| Total | 152 (95.6%) | 7 (4.4%) |
Employment Characteristics in Montour County
Employment by Class of Employer in Montour County
Among the 8,683 employed individuals in Montour County, private company employees (4,695 | 54.1%), not-for-profit organizations (1,959 | 22.6%), and local government employees (565 | 6.5%) make up the most common classes of employment.
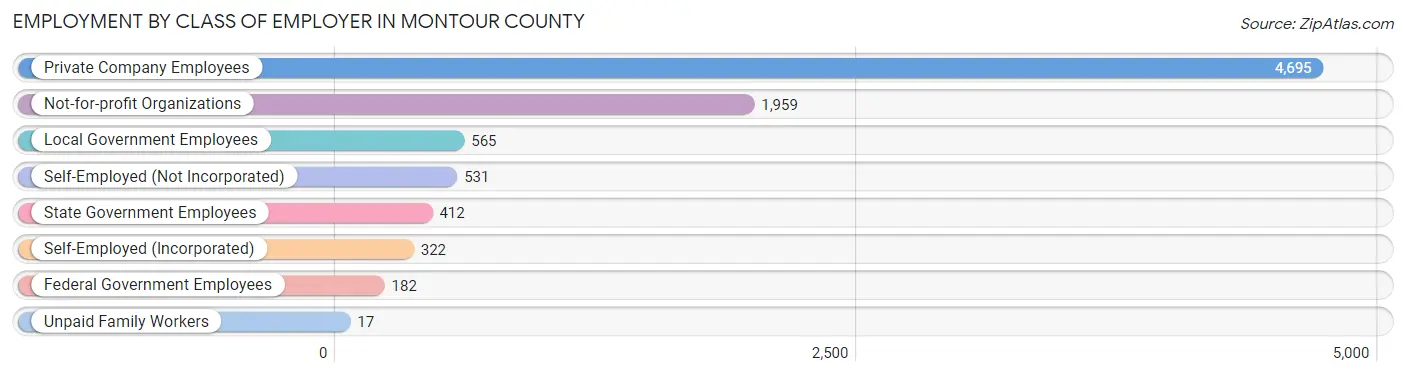
| Employer Class | # Employees | % Employees |
| Private Company Employees | 4,695 | 54.1% |
| Self-Employed (Incorporated) | 322 | 3.7% |
| Self-Employed (Not Incorporated) | 531 | 6.1% |
| Not-for-profit Organizations | 1,959 | 22.6% |
| Local Government Employees | 565 | 6.5% |
| State Government Employees | 412 | 4.7% |
| Federal Government Employees | 182 | 2.1% |
| Unpaid Family Workers | 17 | 0.2% |
| Total | 8,683 | 100.0% |
Employment Status by Age in Montour County
According to the labor force statistics for Montour County, out of the total population over 16 years of age (14,937), 60.1% or 8,977 individuals are in the labor force, with 2.4% or 215 of them unemployed. The age group with the highest labor force participation rate is 35 to 44 years, with 84.7% or 1,823 individuals in the labor force. Within the labor force, the 16 to 19 years age range has the highest percentage of unemployed individuals, with 15.2% or 68 of them being unemployed.
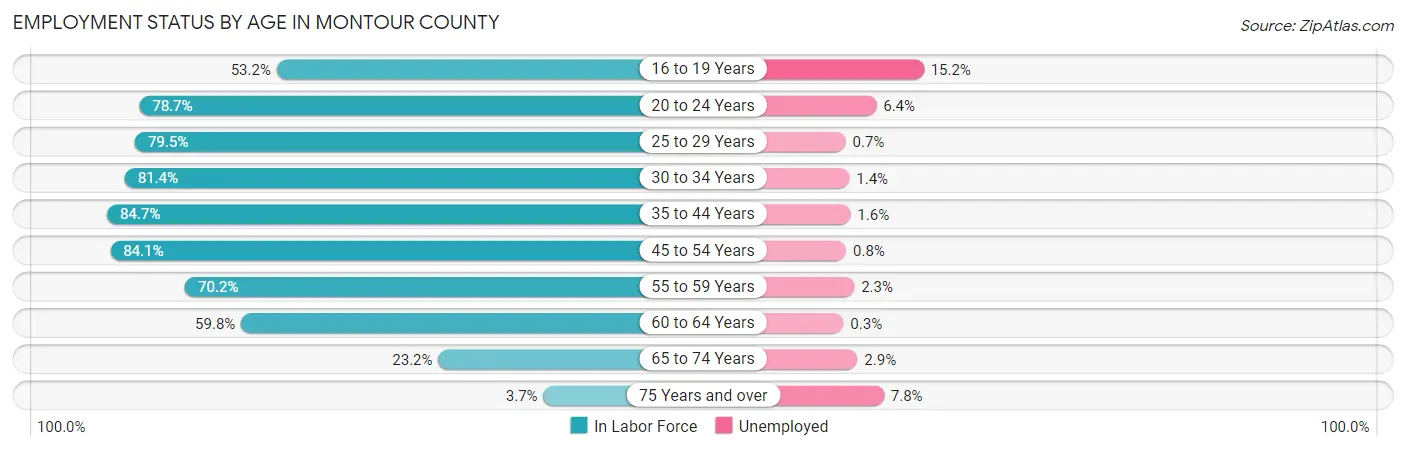
| Age Bracket | In Labor Force | Unemployed |
| 16 to 19 Years | 445 (53.2%) | 68 (15.2%) |
| 20 to 24 Years | 639 (78.7%) | 41 (6.4%) |
| 25 to 29 Years | 878 (79.5%) | 6 (0.7%) |
| 30 to 34 Years | 1,119 (81.4%) | 16 (1.4%) |
| 35 to 44 Years | 1,823 (84.7%) | 29 (1.6%) |
| 45 to 54 Years | 1,759 (84.1%) | 14 (0.8%) |
| 55 to 59 Years | 863 (70.2%) | 20 (2.3%) |
| 60 to 64 Years | 911 (59.8%) | 3 (0.3%) |
| 65 to 74 Years | 483 (23.2%) | 14 (2.9%) |
| 75 Years and over | 64 (3.7%) | 5 (7.8%) |
| Total | 8,977 (60.1%) | 215 (2.4%) |
Employment Status by Educational Attainment in Montour County
According to labor force statistics for Montour County, 77.6% of individuals (7,353) out of the total population between 25 and 64 years of age (9,475) are in the labor force, with 1.2% or 88 of them being unemployed. The group with the highest labor force participation rate are those with the educational attainment of bachelor's degree or higher, with 89.4% or 3,511 individuals in the labor force. Within the labor force, individuals with less than high school education have the highest percentage of unemployment, with 6.5% or 20 of them being unemployed.
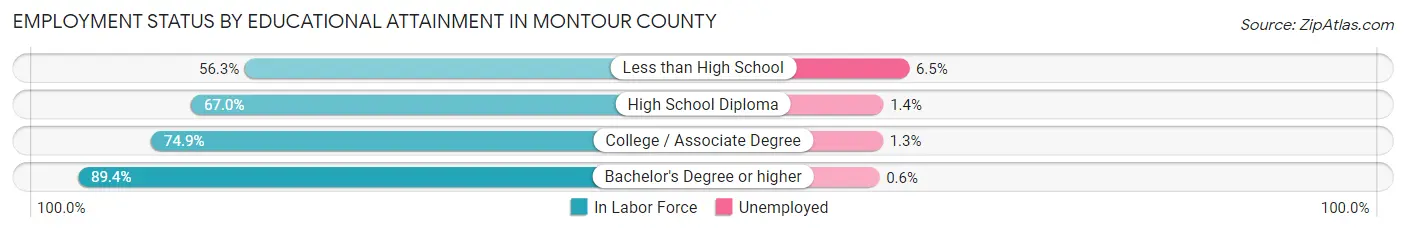
| Educational Attainment | In Labor Force | Unemployed |
| Less than High School | 308 (56.3%) | 36 (6.5%) |
| High School Diploma | 1,820 (67.0%) | 38 (1.4%) |
| College / Associate Degree | 1,711 (74.9%) | 30 (1.3%) |
| Bachelor's Degree or higher | 3,511 (89.4%) | 24 (0.6%) |
| Total | 7,353 (77.6%) | 114 (1.2%) |
Employment Occupations by Sex in Montour County
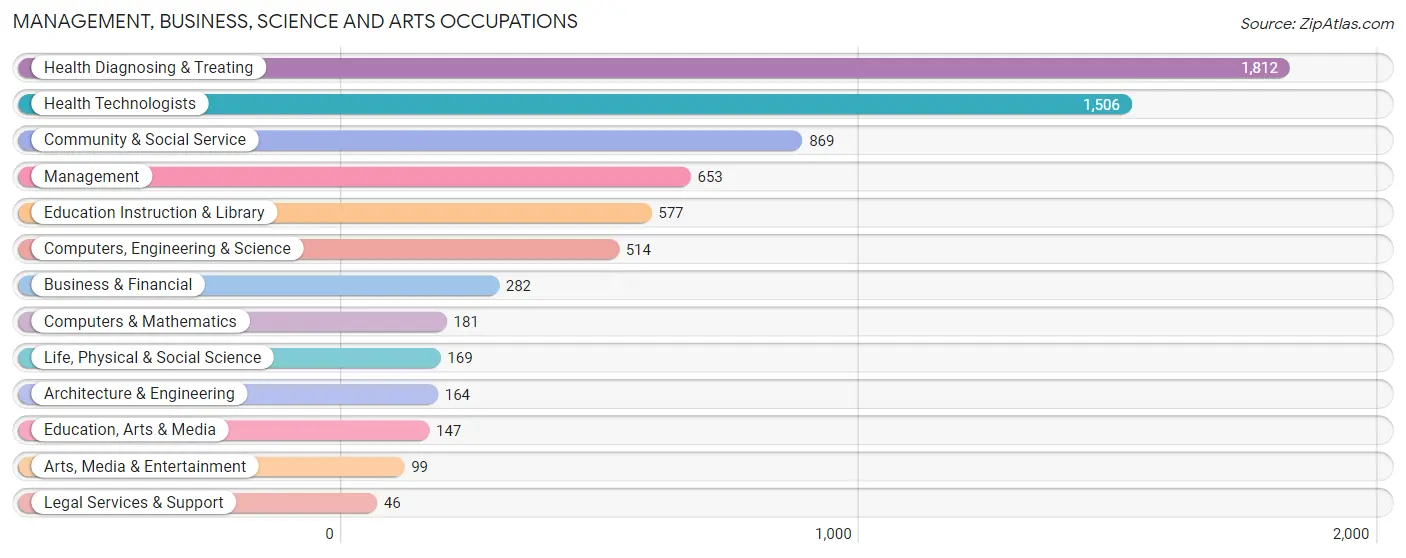
Management, Business, Science and Arts Occupations
The most common Management, Business, Science and Arts occupations in Montour County are Health Diagnosing & Treating (1,812 | 20.8%), Health Technologists (1,506 | 17.3%), Community & Social Service (869 | 10.0%), Management (653 | 7.5%), and Education Instruction & Library (577 | 6.6%).
Management, Business, Science and Arts Occupations by Sex
Within the Management, Business, Science and Arts occupations in Montour County, the most male-oriented occupations are Architecture & Engineering (86.0%), Computers & Mathematics (73.5%), and Management (70.4%), while the most female-oriented occupations are Life, Physical & Social Science (71.0%), Legal Services & Support (69.6%), and Business & Financial (66.7%).
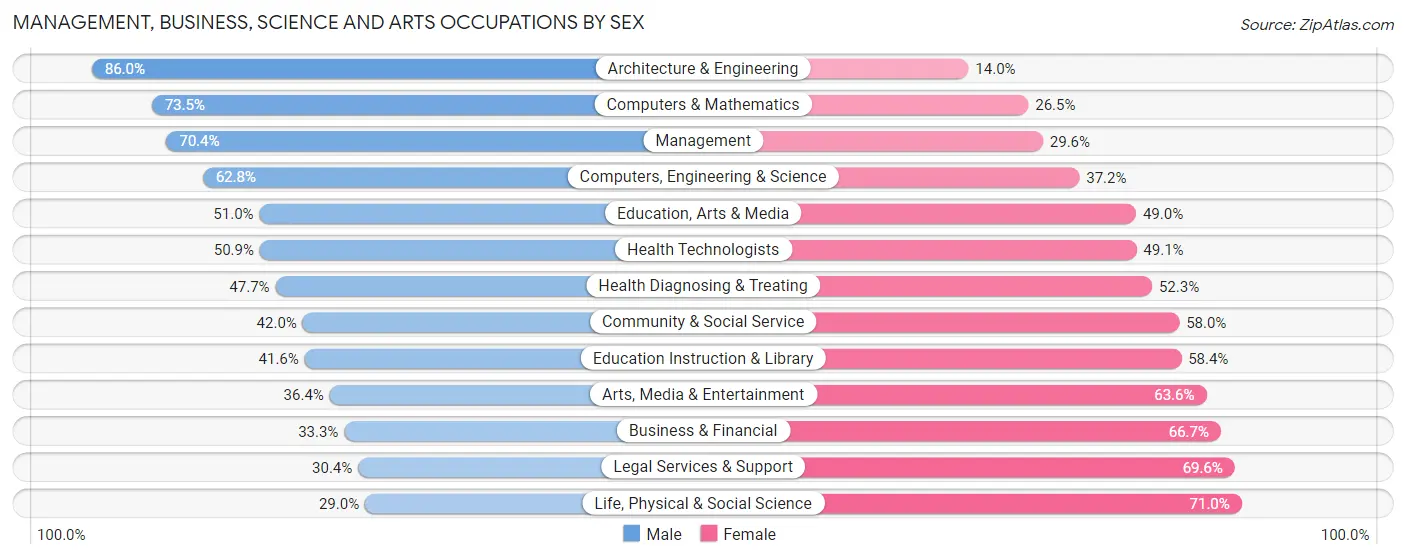
| Occupation | Male | Female |
| Management | 460 (70.4%) | 193 (29.6%) |
| Business & Financial | 94 (33.3%) | 188 (66.7%) |
| Computers, Engineering & Science | 323 (62.8%) | 191 (37.2%) |
| Computers & Mathematics | 133 (73.5%) | 48 (26.5%) |
| Architecture & Engineering | 141 (86.0%) | 23 (14.0%) |
| Life, Physical & Social Science | 49 (29.0%) | 120 (71.0%) |
| Community & Social Service | 365 (42.0%) | 504 (58.0%) |
| Education, Arts & Media | 75 (51.0%) | 72 (49.0%) |
| Legal Services & Support | 14 (30.4%) | 32 (69.6%) |
| Education Instruction & Library | 240 (41.6%) | 337 (58.4%) |
| Arts, Media & Entertainment | 36 (36.4%) | 63 (63.6%) |
| Health Diagnosing & Treating | 864 (47.7%) | 948 (52.3%) |
| Health Technologists | 767 (50.9%) | 739 (49.1%) |
| Total (Category) | 2,106 (51.0%) | 2,024 (49.0%) |
| Total (Overall) | 4,680 (53.7%) | 4,031 (46.3%) |
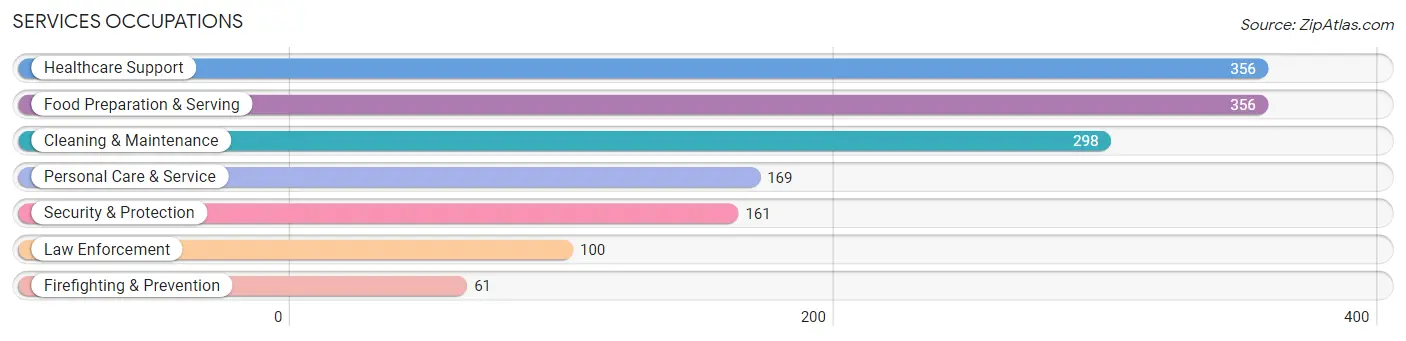
Services Occupations
The most common Services occupations in Montour County are Healthcare Support (356 | 4.1%), Food Preparation & Serving (356 | 4.1%), Cleaning & Maintenance (298 | 3.4%), Personal Care & Service (169 | 1.9%), and Security & Protection (161 | 1.8%).
Services Occupations by Sex
Within the Services occupations in Montour County, the most male-oriented occupations are Firefighting & Prevention (88.5%), Security & Protection (87.0%), and Law Enforcement (86.0%), while the most female-oriented occupations are Healthcare Support (96.6%), Personal Care & Service (87.6%), and Food Preparation & Serving (77.0%).
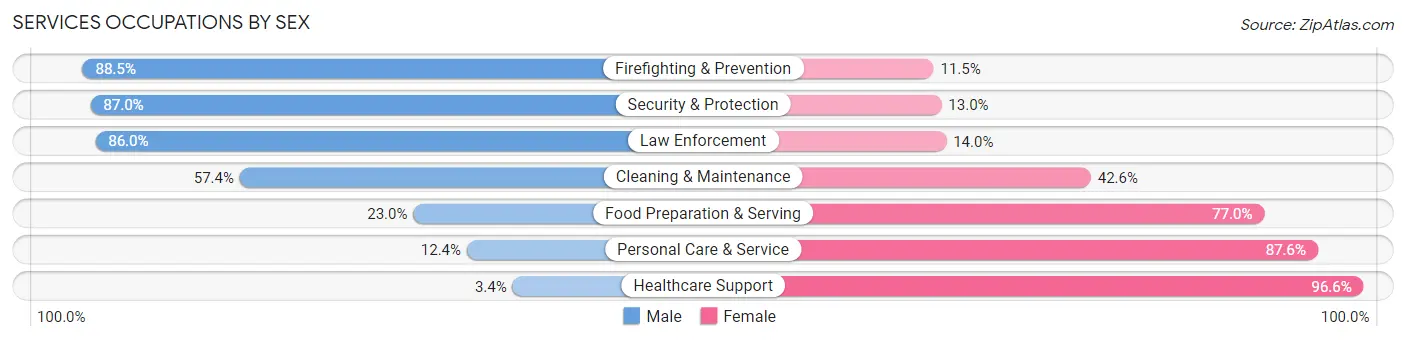
| Occupation | Male | Female |
| Healthcare Support | 12 (3.4%) | 344 (96.6%) |
| Security & Protection | 140 (87.0%) | 21 (13.0%) |
| Firefighting & Prevention | 54 (88.5%) | 7 (11.5%) |
| Law Enforcement | 86 (86.0%) | 14 (14.0%) |
| Food Preparation & Serving | 82 (23.0%) | 274 (77.0%) |
| Cleaning & Maintenance | 171 (57.4%) | 127 (42.6%) |
| Personal Care & Service | 21 (12.4%) | 148 (87.6%) |
| Total (Category) | 426 (31.8%) | 914 (68.2%) |
| Total (Overall) | 4,680 (53.7%) | 4,031 (46.3%) |
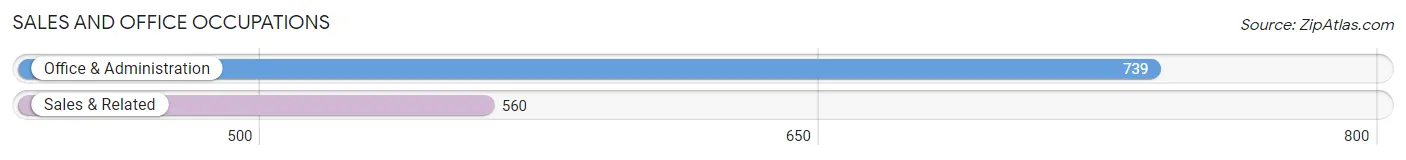
Sales and Office Occupations
The most common Sales and Office occupations in Montour County are Office & Administration (739 | 8.5%), and Sales & Related (560 | 6.4%).
Sales and Office Occupations by Sex
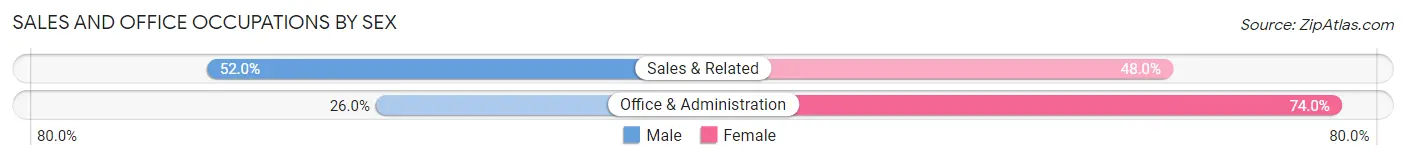
| Occupation | Male | Female |
| Sales & Related | 291 (52.0%) | 269 (48.0%) |
| Office & Administration | 192 (26.0%) | 547 (74.0%) |
| Total (Category) | 483 (37.2%) | 816 (62.8%) |
| Total (Overall) | 4,680 (53.7%) | 4,031 (46.3%) |
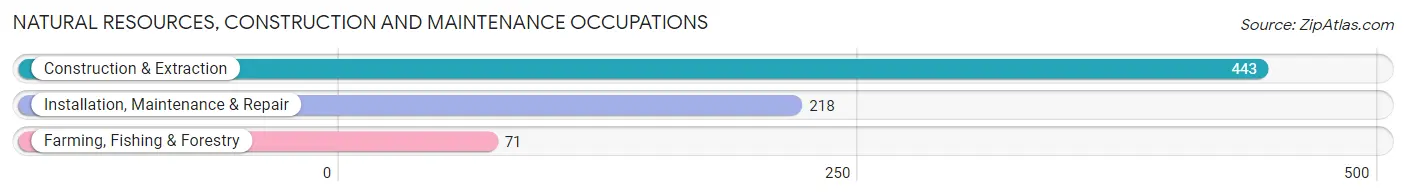
Natural Resources, Construction and Maintenance Occupations
The most common Natural Resources, Construction and Maintenance occupations in Montour County are Construction & Extraction (443 | 5.1%), Installation, Maintenance & Repair (218 | 2.5%), and Farming, Fishing & Forestry (71 | 0.8%).
Natural Resources, Construction and Maintenance Occupations by Sex
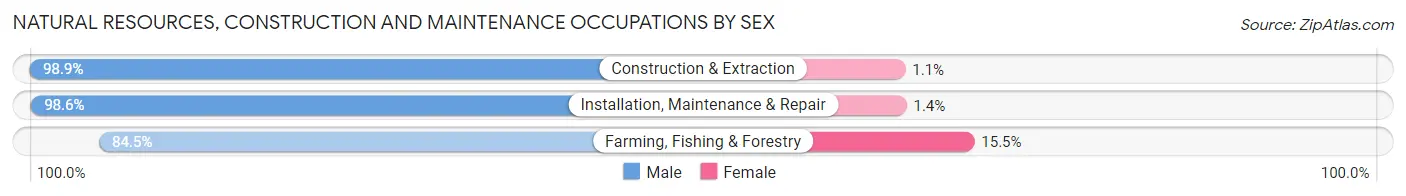
| Occupation | Male | Female |
| Farming, Fishing & Forestry | 60 (84.5%) | 11 (15.5%) |
| Construction & Extraction | 438 (98.9%) | 5 (1.1%) |
| Installation, Maintenance & Repair | 215 (98.6%) | 3 (1.4%) |
| Total (Category) | 713 (97.4%) | 19 (2.6%) |
| Total (Overall) | 4,680 (53.7%) | 4,031 (46.3%) |
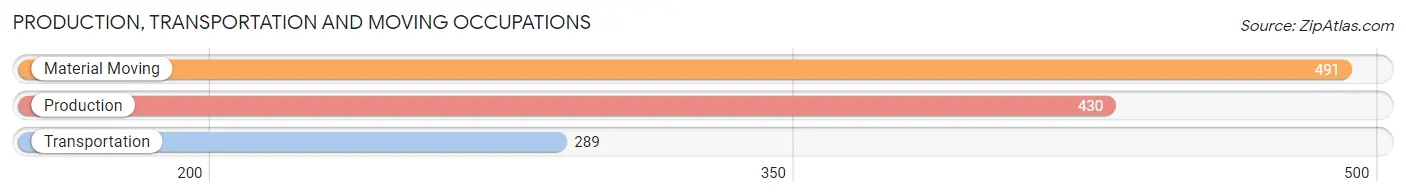
Production, Transportation and Moving Occupations
The most common Production, Transportation and Moving occupations in Montour County are Material Moving (491 | 5.6%), Production (430 | 4.9%), and Transportation (289 | 3.3%).
Production, Transportation and Moving Occupations by Sex
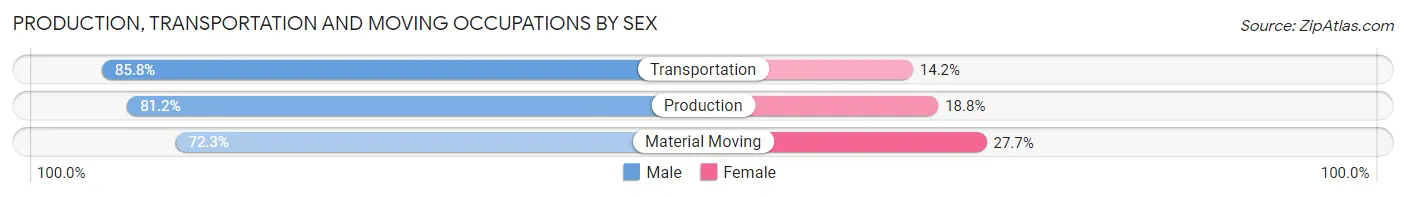
| Occupation | Male | Female |
| Production | 349 (81.2%) | 81 (18.8%) |
| Transportation | 248 (85.8%) | 41 (14.2%) |
| Material Moving | 355 (72.3%) | 136 (27.7%) |
| Total (Category) | 952 (78.7%) | 258 (21.3%) |
| Total (Overall) | 4,680 (53.7%) | 4,031 (46.3%) |
Employment Industries by Sex in Montour County
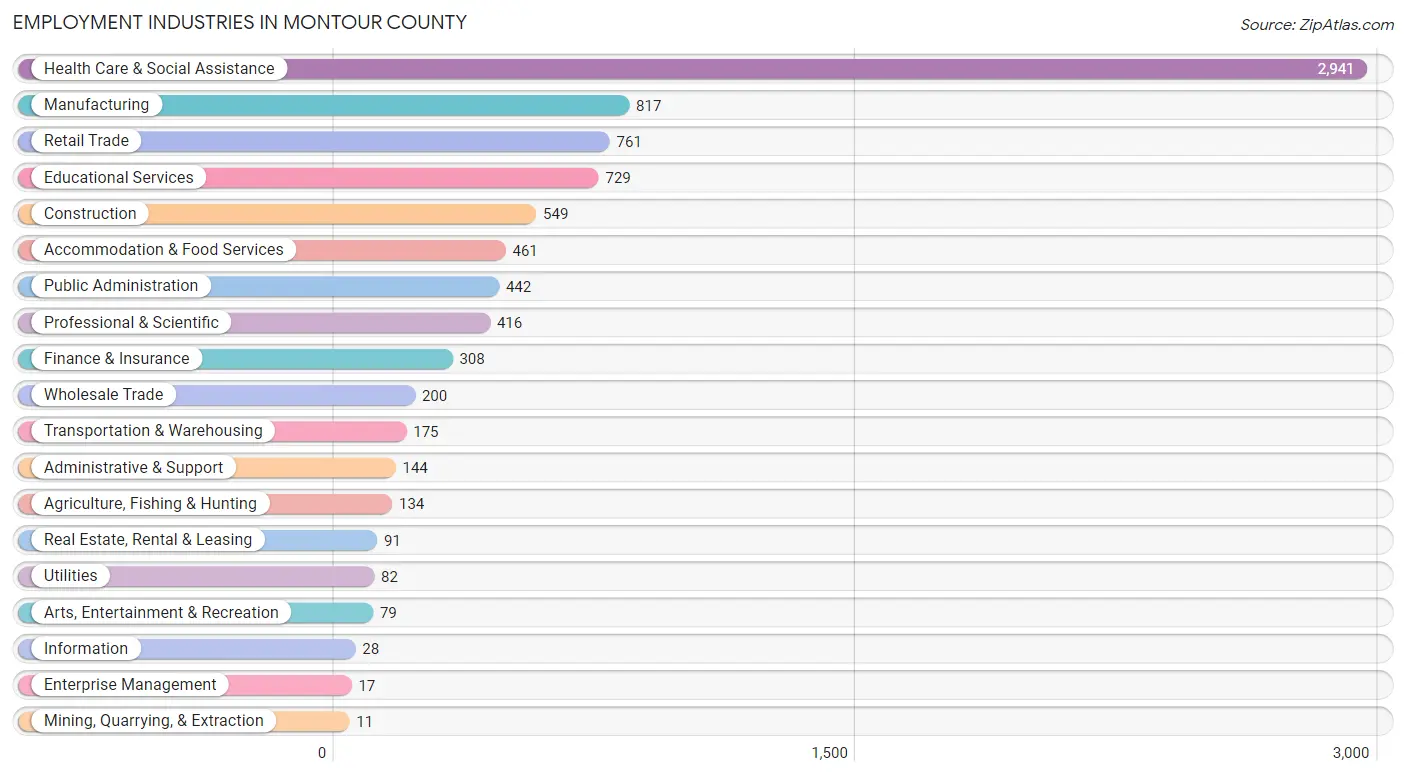
Employment Industries in Montour County
The major employment industries in Montour County include Health Care & Social Assistance (2,941 | 33.8%), Manufacturing (817 | 9.4%), Retail Trade (761 | 8.7%), Educational Services (729 | 8.4%), and Construction (549 | 6.3%).
Employment Industries by Sex in Montour County
The Montour County industries that see more men than women are Mining, Quarrying, & Extraction (100.0%), Utilities (100.0%), and Construction (89.8%), whereas the industries that tend to have a higher number of women are Real Estate, Rental & Leasing (89.0%), Finance & Insurance (72.7%), and Health Care & Social Assistance (63.2%).
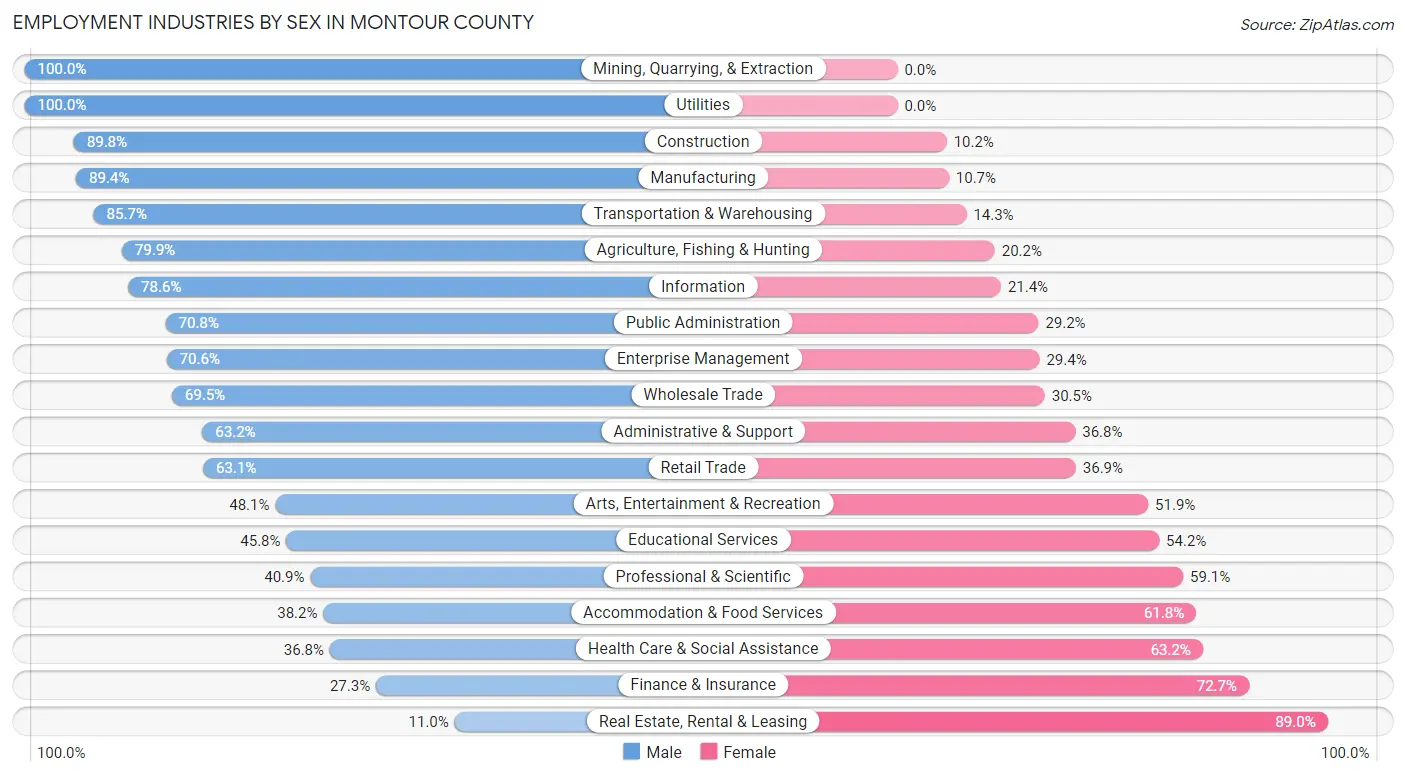
| Industry | Male | Female |
| Agriculture, Fishing & Hunting | 107 (79.8%) | 27 (20.2%) |
| Mining, Quarrying, & Extraction | 11 (100.0%) | 0 (0.0%) |
| Construction | 493 (89.8%) | 56 (10.2%) |
| Manufacturing | 730 (89.3%) | 87 (10.6%) |
| Wholesale Trade | 139 (69.5%) | 61 (30.5%) |
| Retail Trade | 480 (63.1%) | 281 (36.9%) |
| Transportation & Warehousing | 150 (85.7%) | 25 (14.3%) |
| Utilities | 82 (100.0%) | 0 (0.0%) |
| Information | 22 (78.6%) | 6 (21.4%) |
| Finance & Insurance | 84 (27.3%) | 224 (72.7%) |
| Real Estate, Rental & Leasing | 10 (11.0%) | 81 (89.0%) |
| Professional & Scientific | 170 (40.9%) | 246 (59.1%) |
| Enterprise Management | 12 (70.6%) | 5 (29.4%) |
| Administrative & Support | 91 (63.2%) | 53 (36.8%) |
| Educational Services | 334 (45.8%) | 395 (54.2%) |
| Health Care & Social Assistance | 1,083 (36.8%) | 1,858 (63.2%) |
| Arts, Entertainment & Recreation | 38 (48.1%) | 41 (51.9%) |
| Accommodation & Food Services | 176 (38.2%) | 285 (61.8%) |
| Public Administration | 313 (70.8%) | 129 (29.2%) |
| Total | 4,680 (53.7%) | 4,031 (46.3%) |
Education in Montour County
School Enrollment in Montour County
The most common levels of schooling among the 3,392 students in Montour County are high school (876 | 25.8%), middle school (734 | 21.6%), and elementary school (713 | 21.0%).
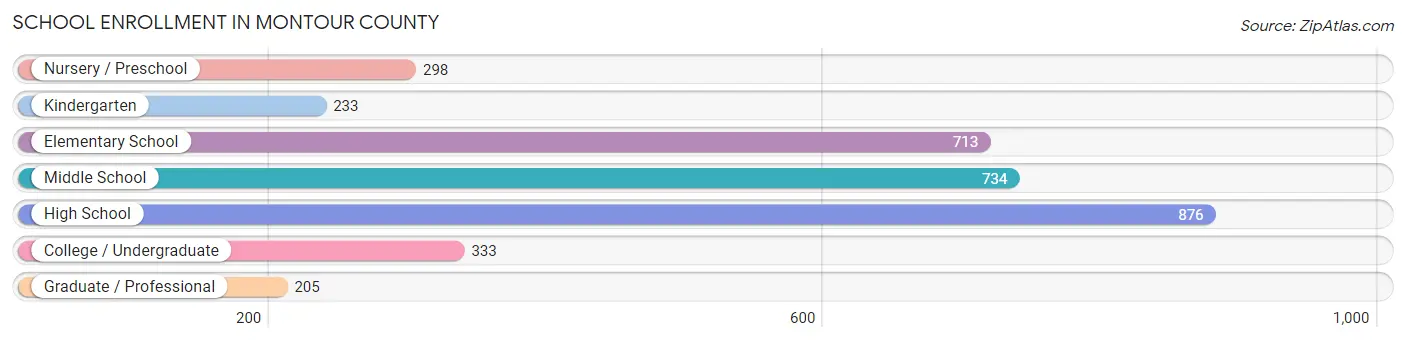
| School Level | # Students | % Students |
| Nursery / Preschool | 298 | 8.8% |
| Kindergarten | 233 | 6.9% |
| Elementary School | 713 | 21.0% |
| Middle School | 734 | 21.6% |
| High School | 876 | 25.8% |
| College / Undergraduate | 333 | 9.8% |
| Graduate / Professional | 205 | 6.0% |
| Total | 3,392 | 100.0% |
School Enrollment by Age by Funding Source in Montour County
Out of a total of 3,392 students who are enrolled in schools in Montour County, 777 (22.9%) attend a private institution, while the remaining 2,615 (77.1%) are enrolled in public schools. The age group of 3 to 4 year olds has the highest likelihood of being enrolled in private schools, with 84 (34.0% in the age bracket) enrolled. Conversely, the age group of 10 to 14 year olds has the lowest likelihood of being enrolled in a private school, with 766 (83.6% in the age bracket) attending a public institution.
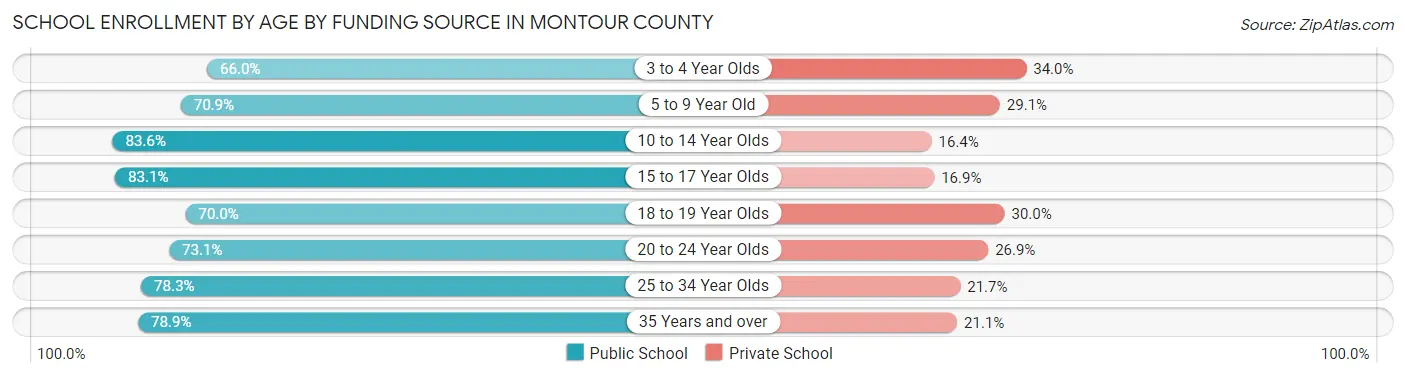
| Age Bracket | Public School | Private School |
| 3 to 4 Year Olds | 163 (66.0%) | 84 (34.0%) |
| 5 to 9 Year Old | 614 (70.9%) | 252 (29.1%) |
| 10 to 14 Year Olds | 766 (83.6%) | 150 (16.4%) |
| 15 to 17 Year Olds | 542 (83.1%) | 110 (16.9%) |
| 18 to 19 Year Olds | 166 (70.0%) | 71 (30.0%) |
| 20 to 24 Year Olds | 95 (73.1%) | 35 (26.9%) |
| 25 to 34 Year Olds | 173 (78.3%) | 48 (21.7%) |
| 35 Years and over | 97 (78.9%) | 26 (21.1%) |
| Total | 2,615 (77.1%) | 777 (22.9%) |
Educational Attainment by Field of Study in Montour County
Science & technology (1,102 | 20.5%), education (808 | 15.0%), bio, nature & agricultural (739 | 13.8%), business (444 | 8.3%), and psychology (306 | 5.7%) are the most common fields of study among 5,372 individuals in Montour County who have obtained a bachelor's degree or higher.
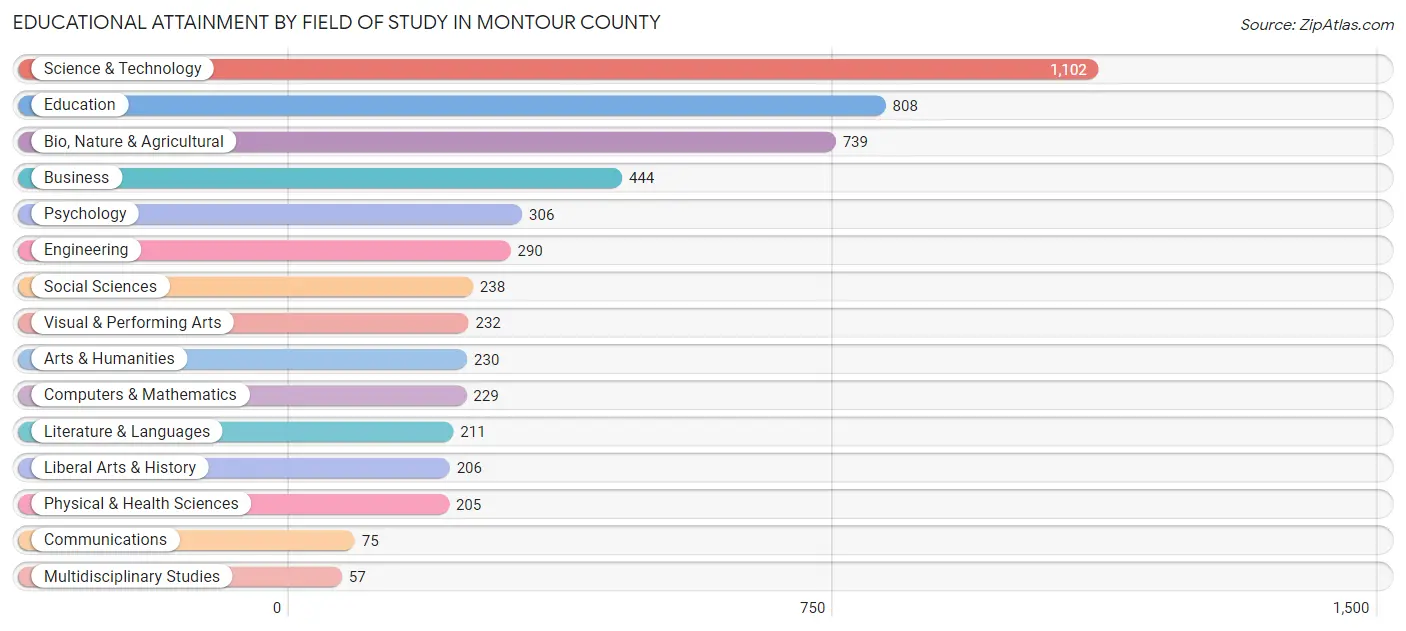
| Field of Study | # Graduates | % Graduates |
| Computers & Mathematics | 229 | 4.3% |
| Bio, Nature & Agricultural | 739 | 13.8% |
| Physical & Health Sciences | 205 | 3.8% |
| Psychology | 306 | 5.7% |
| Social Sciences | 238 | 4.4% |
| Engineering | 290 | 5.4% |
| Multidisciplinary Studies | 57 | 1.1% |
| Science & Technology | 1,102 | 20.5% |
| Business | 444 | 8.3% |
| Education | 808 | 15.0% |
| Literature & Languages | 211 | 3.9% |
| Liberal Arts & History | 206 | 3.8% |
| Visual & Performing Arts | 232 | 4.3% |
| Communications | 75 | 1.4% |
| Arts & Humanities | 230 | 4.3% |
| Total | 5,372 | 100.0% |
Transportation & Commute in Montour County
Vehicle Availability by Sex in Montour County
The most prevalent vehicle ownership categories in Montour County are males with 2 vehicles (1,790, accounting for 38.2%) and females with 2 vehicles (1,486, making up 45.2%).
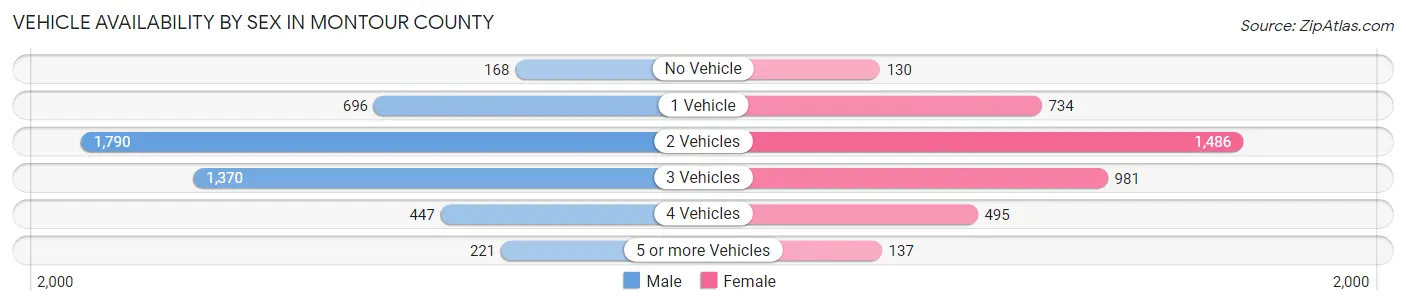
| Vehicles Available | Male | Female |
| No Vehicle | 168 (3.6%) | 130 (3.3%) |
| 1 Vehicle | 696 (14.8%) | 734 (18.5%) |
| 2 Vehicles | 1,790 (38.2%) | 1,486 (37.5%) |
| 3 Vehicles | 1,370 (29.2%) | 981 (24.7%) |
| 4 Vehicles | 447 (9.5%) | 495 (12.5%) |
| 5 or more Vehicles | 221 (4.7%) | 137 (3.5%) |
| Total | 4,692 (100.0%) | 3,963 (100.0%) |
Commute Time in Montour County
The most frequently occuring commute durations in Montour County are 5 to 9 minutes (1,482 commuters, 19.0%), 15 to 19 minutes (1,424 commuters, 18.2%), and 10 to 14 minutes (1,354 commuters, 17.3%).
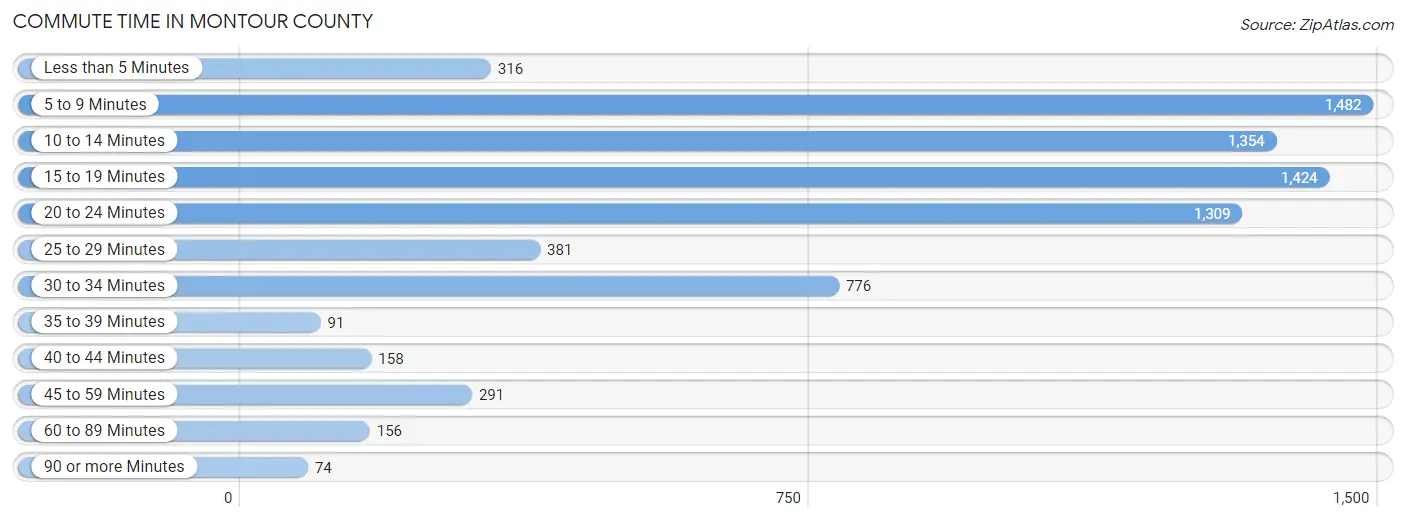
| Commute Time | # Commuters | % Commuters |
| Less than 5 Minutes | 316 | 4.1% |
| 5 to 9 Minutes | 1,482 | 19.0% |
| 10 to 14 Minutes | 1,354 | 17.3% |
| 15 to 19 Minutes | 1,424 | 18.2% |
| 20 to 24 Minutes | 1,309 | 16.8% |
| 25 to 29 Minutes | 381 | 4.9% |
| 30 to 34 Minutes | 776 | 9.9% |
| 35 to 39 Minutes | 91 | 1.2% |
| 40 to 44 Minutes | 158 | 2.0% |
| 45 to 59 Minutes | 291 | 3.7% |
| 60 to 89 Minutes | 156 | 2.0% |
| 90 or more Minutes | 74 | 0.9% |
Commute Time by Sex in Montour County
The most common commute times in Montour County are 5 to 9 minutes (849 commuters, 19.8%) for males and 15 to 19 minutes (752 commuters, 21.3%) for females.
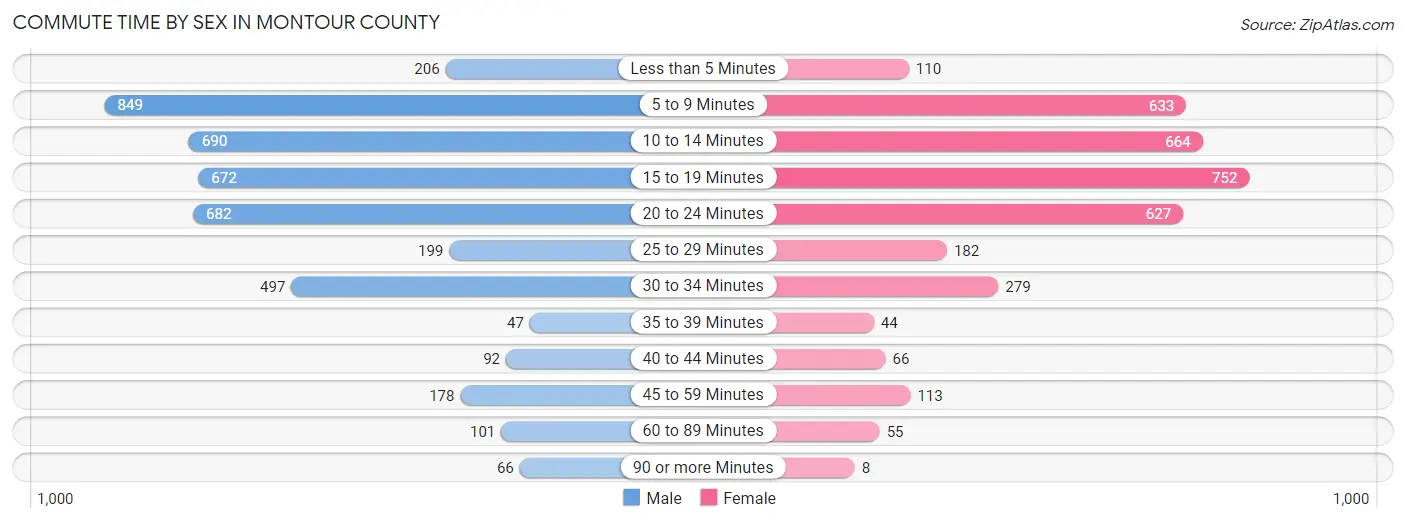
| Commute Time | Male | Female |
| Less than 5 Minutes | 206 (4.8%) | 110 (3.1%) |
| 5 to 9 Minutes | 849 (19.8%) | 633 (17.9%) |
| 10 to 14 Minutes | 690 (16.1%) | 664 (18.8%) |
| 15 to 19 Minutes | 672 (15.7%) | 752 (21.3%) |
| 20 to 24 Minutes | 682 (15.9%) | 627 (17.7%) |
| 25 to 29 Minutes | 199 (4.6%) | 182 (5.1%) |
| 30 to 34 Minutes | 497 (11.6%) | 279 (7.9%) |
| 35 to 39 Minutes | 47 (1.1%) | 44 (1.3%) |
| 40 to 44 Minutes | 92 (2.1%) | 66 (1.9%) |
| 45 to 59 Minutes | 178 (4.2%) | 113 (3.2%) |
| 60 to 89 Minutes | 101 (2.4%) | 55 (1.6%) |
| 90 or more Minutes | 66 (1.5%) | 8 (0.2%) |
Time of Departure to Work by Sex in Montour County
The most frequent times of departure to work in Montour County are 7:00 AM to 7:29 AM (1,060, 24.8%) for males and 7:00 AM to 7:29 AM (1,048, 29.7%) for females.
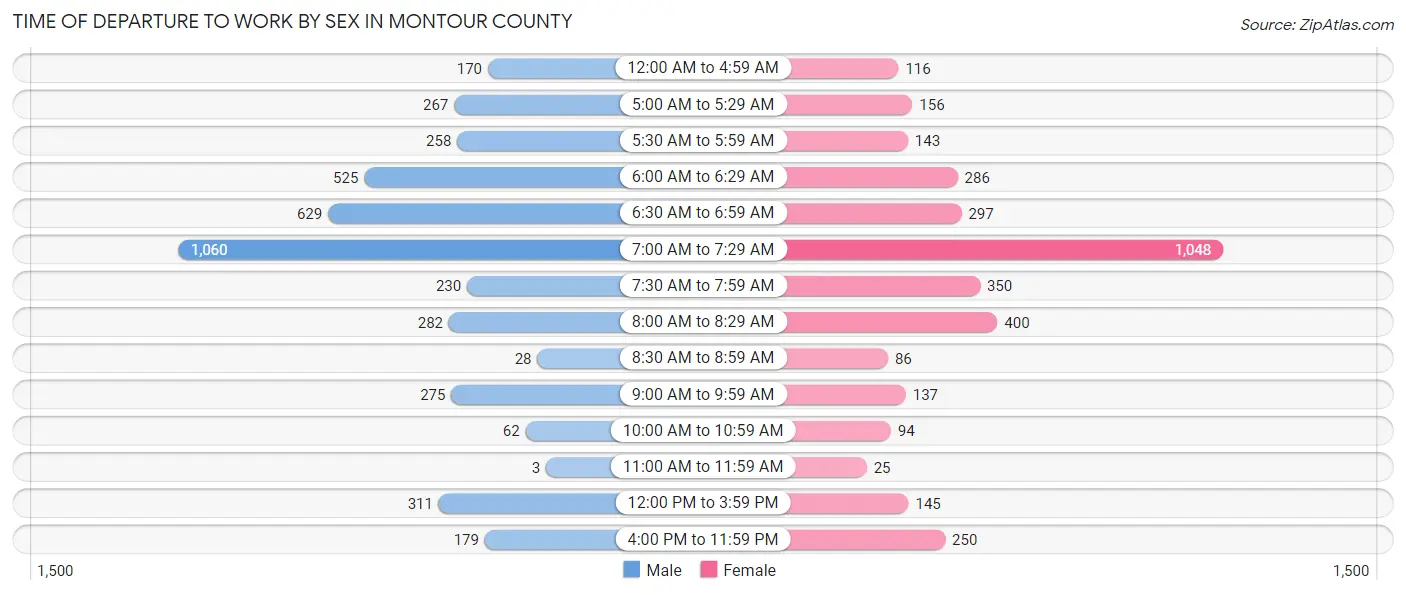
| Time of Departure | Male | Female |
| 12:00 AM to 4:59 AM | 170 (4.0%) | 116 (3.3%) |
| 5:00 AM to 5:29 AM | 267 (6.2%) | 156 (4.4%) |
| 5:30 AM to 5:59 AM | 258 (6.0%) | 143 (4.1%) |
| 6:00 AM to 6:29 AM | 525 (12.3%) | 286 (8.1%) |
| 6:30 AM to 6:59 AM | 629 (14.7%) | 297 (8.4%) |
| 7:00 AM to 7:29 AM | 1,060 (24.8%) | 1,048 (29.7%) |
| 7:30 AM to 7:59 AM | 230 (5.4%) | 350 (9.9%) |
| 8:00 AM to 8:29 AM | 282 (6.6%) | 400 (11.3%) |
| 8:30 AM to 8:59 AM | 28 (0.6%) | 86 (2.4%) |
| 9:00 AM to 9:59 AM | 275 (6.4%) | 137 (3.9%) |
| 10:00 AM to 10:59 AM | 62 (1.5%) | 94 (2.7%) |
| 11:00 AM to 11:59 AM | 3 (0.1%) | 25 (0.7%) |
| 12:00 PM to 3:59 PM | 311 (7.3%) | 145 (4.1%) |
| 4:00 PM to 11:59 PM | 179 (4.2%) | 250 (7.1%) |
| Total | 4,279 (100.0%) | 3,533 (100.0%) |
Housing Occupancy in Montour County
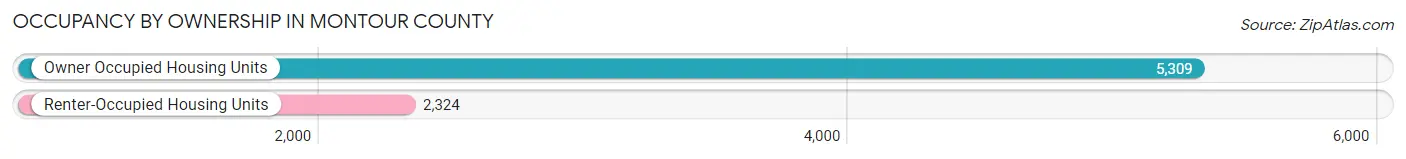
Occupancy by Ownership in Montour County
Of the total 7,633 dwellings in Montour County, owner-occupied units account for 5,309 (69.6%), while renter-occupied units make up 2,324 (30.4%).
| Occupancy | # Housing Units | % Housing Units |
| Owner Occupied Housing Units | 5,309 | 69.6% |
| Renter-Occupied Housing Units | 2,324 | 30.4% |
| Total Occupied Housing Units | 7,633 | 100.0% |
Occupancy by Household Size in Montour County
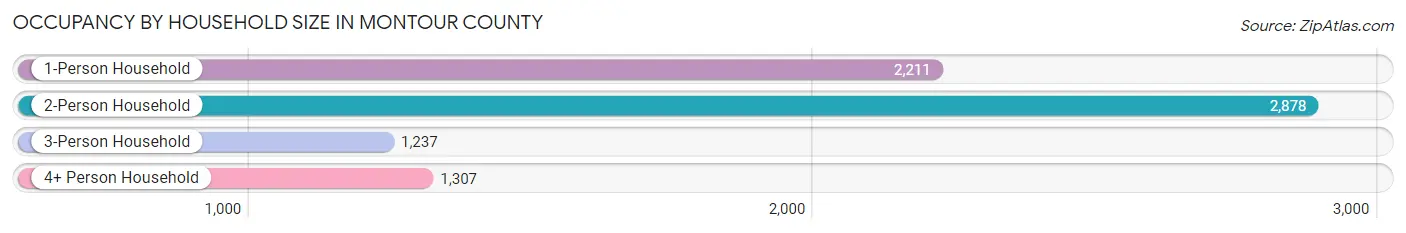
| Household Size | # Housing Units | % Housing Units |
| 1-Person Household | 2,211 | 29.0% |
| 2-Person Household | 2,878 | 37.7% |
| 3-Person Household | 1,237 | 16.2% |
| 4+ Person Household | 1,307 | 17.1% |
| Total Housing Units | 7,633 | 100.0% |
Occupancy by Ownership by Household Size in Montour County
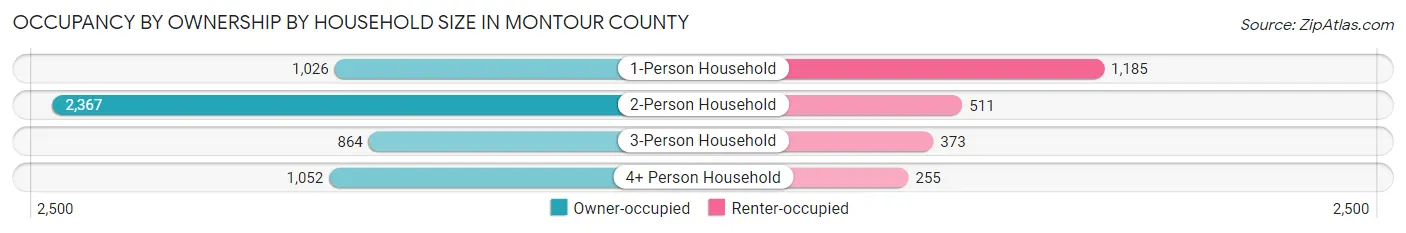
| Household Size | Owner-occupied | Renter-occupied |
| 1-Person Household | 1,026 (46.4%) | 1,185 (53.6%) |
| 2-Person Household | 2,367 (82.2%) | 511 (17.8%) |
| 3-Person Household | 864 (69.9%) | 373 (30.1%) |
| 4+ Person Household | 1,052 (80.5%) | 255 (19.5%) |
| Total Housing Units | 5,309 (69.6%) | 2,324 (30.4%) |
Occupancy by Educational Attainment in Montour County
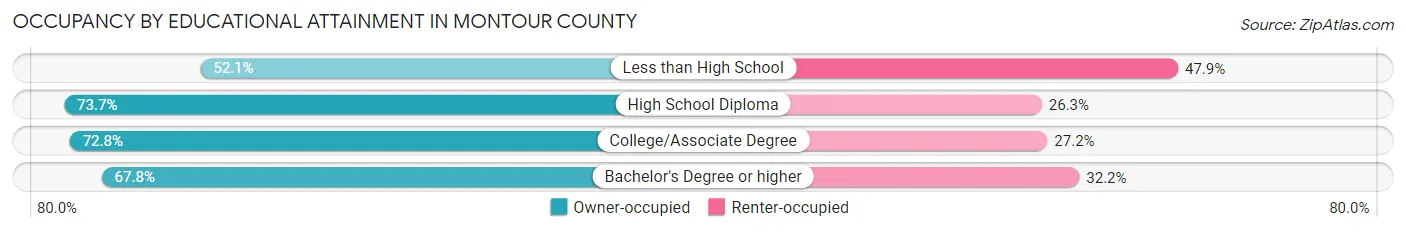
| Household Size | Owner-occupied | Renter-occupied |
| Less than High School | 295 (52.1%) | 271 (47.9%) |
| High School Diploma | 1,686 (73.7%) | 601 (26.3%) |
| College/Associate Degree | 1,274 (72.8%) | 475 (27.2%) |
| Bachelor's Degree or higher | 2,054 (67.8%) | 977 (32.2%) |
Occupancy by Age of Householder in Montour County
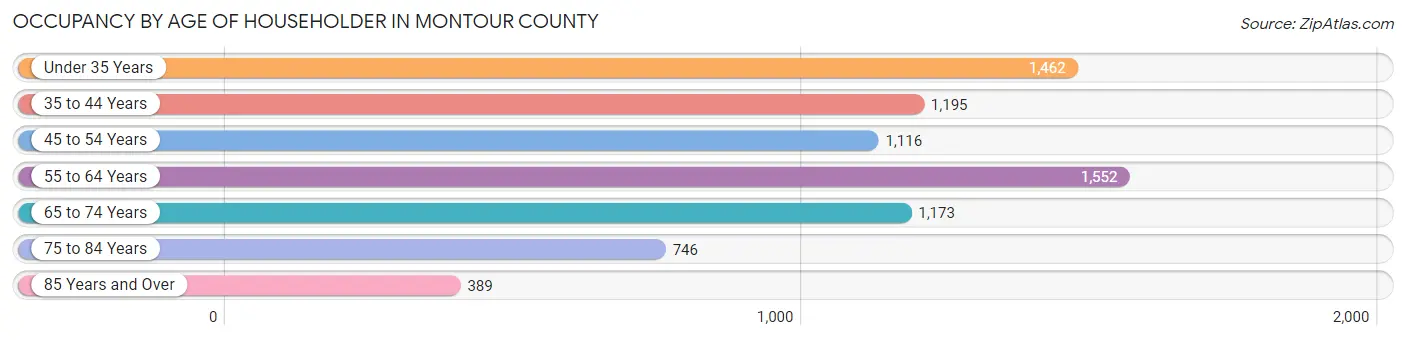
| Age Bracket | # Households | % Households |
| Under 35 Years | 1,462 | 19.2% |
| 35 to 44 Years | 1,195 | 15.7% |
| 45 to 54 Years | 1,116 | 14.6% |
| 55 to 64 Years | 1,552 | 20.3% |
| 65 to 74 Years | 1,173 | 15.4% |
| 75 to 84 Years | 746 | 9.8% |
| 85 Years and Over | 389 | 5.1% |
| Total | 7,633 | 100.0% |
Housing Finances in Montour County
Median Income by Occupancy in Montour County
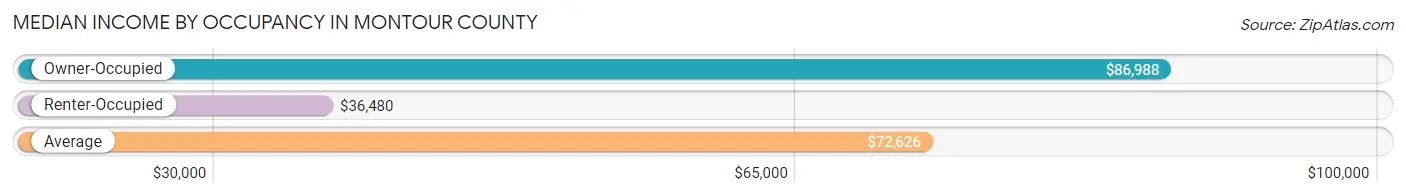
| Occupancy Type | # Households | Median Income |
| Owner-Occupied | 5,309 (69.6%) | $86,988 |
| Renter-Occupied | 2,324 (30.4%) | $36,480 |
| Average | 7,633 (100.0%) | $72,626 |
Occupancy by Householder Income Bracket in Montour County
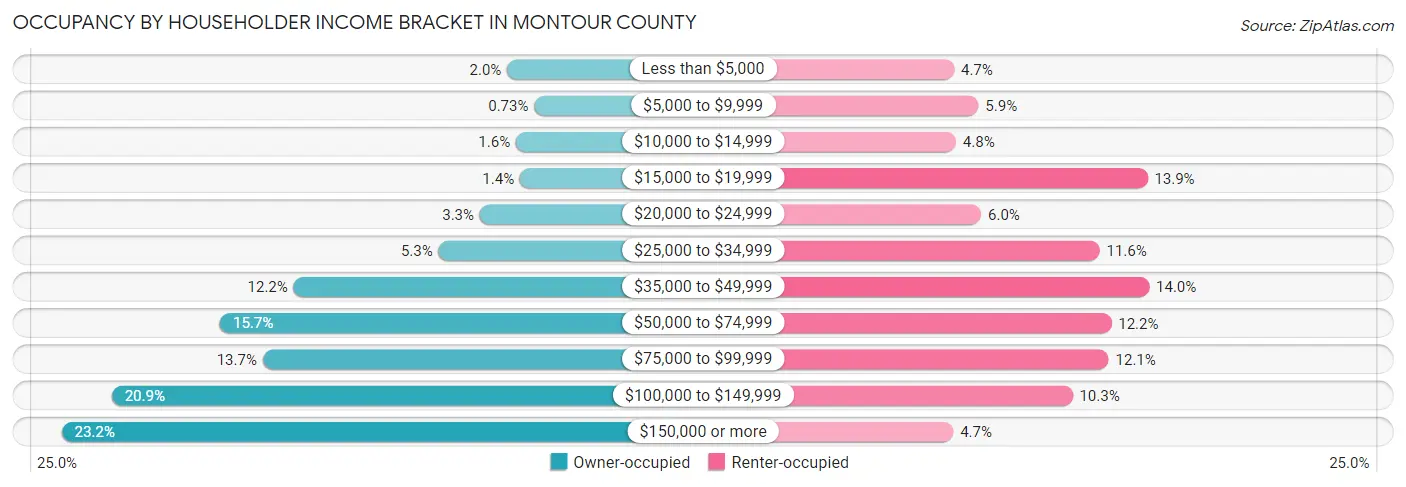
| Income Bracket | Owner-occupied | Renter-occupied |
| Less than $5,000 | 107 (2.0%) | 109 (4.7%) |
| $5,000 to $9,999 | 39 (0.7%) | 136 (5.9%) |
| $10,000 to $14,999 | 85 (1.6%) | 111 (4.8%) |
| $15,000 to $19,999 | 75 (1.4%) | 323 (13.9%) |
| $20,000 to $24,999 | 176 (3.3%) | 139 (6.0%) |
| $25,000 to $34,999 | 281 (5.3%) | 270 (11.6%) |
| $35,000 to $49,999 | 647 (12.2%) | 325 (14.0%) |
| $50,000 to $74,999 | 833 (15.7%) | 283 (12.2%) |
| $75,000 to $99,999 | 725 (13.7%) | 280 (12.0%) |
| $100,000 to $149,999 | 1,107 (20.8%) | 240 (10.3%) |
| $150,000 or more | 1,234 (23.2%) | 108 (4.6%) |
| Total | 5,309 (100.0%) | 2,324 (100.0%) |
Monthly Housing Cost Tiers in Montour County
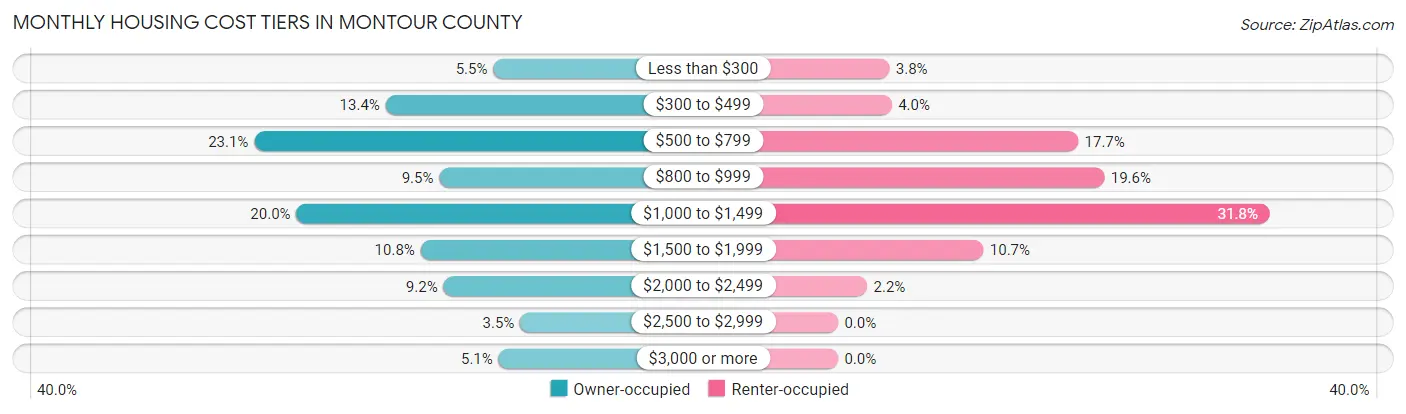
| Monthly Cost | Owner-occupied | Renter-occupied |
| Less than $300 | 291 (5.5%) | 88 (3.8%) |
| $300 to $499 | 712 (13.4%) | 92 (4.0%) |
| $500 to $799 | 1,226 (23.1%) | 411 (17.7%) |
| $800 to $999 | 502 (9.5%) | 456 (19.6%) |
| $1,000 to $1,499 | 1,061 (20.0%) | 740 (31.8%) |
| $1,500 to $1,999 | 575 (10.8%) | 249 (10.7%) |
| $2,000 to $2,499 | 486 (9.1%) | 50 (2.1%) |
| $2,500 to $2,999 | 186 (3.5%) | 0 (0.0%) |
| $3,000 or more | 270 (5.1%) | 0 (0.0%) |
| Total | 5,309 (100.0%) | 2,324 (100.0%) |
Physical Housing Characteristics in Montour County
Housing Structures in Montour County
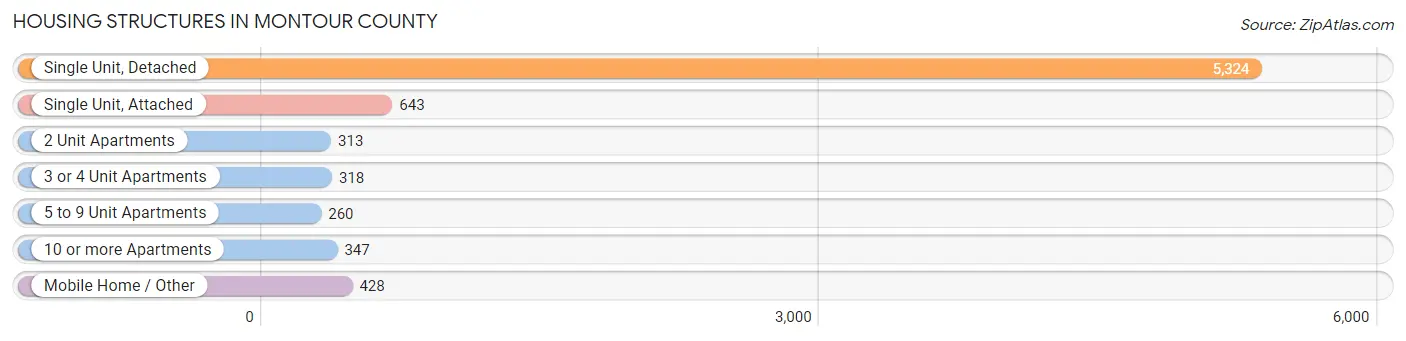
| Structure Type | # Housing Units | % Housing Units |
| Single Unit, Detached | 5,324 | 69.8% |
| Single Unit, Attached | 643 | 8.4% |
| 2 Unit Apartments | 313 | 4.1% |
| 3 or 4 Unit Apartments | 318 | 4.2% |
| 5 to 9 Unit Apartments | 260 | 3.4% |
| 10 or more Apartments | 347 | 4.5% |
| Mobile Home / Other | 428 | 5.6% |
| Total | 7,633 | 100.0% |
Housing Structures by Occupancy in Montour County
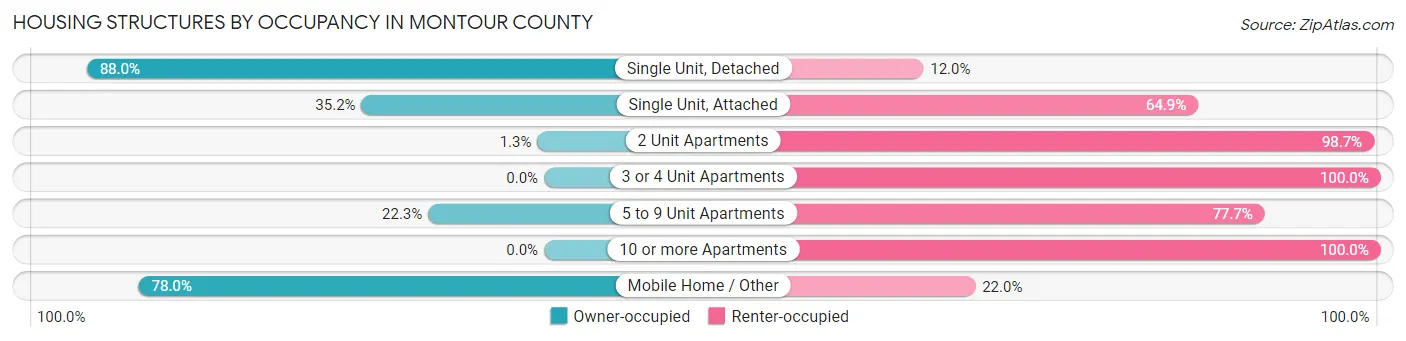
| Structure Type | Owner-occupied | Renter-occupied |
| Single Unit, Detached | 4,687 (88.0%) | 637 (12.0%) |
| Single Unit, Attached | 226 (35.1%) | 417 (64.8%) |
| 2 Unit Apartments | 4 (1.3%) | 309 (98.7%) |
| 3 or 4 Unit Apartments | 0 (0.0%) | 318 (100.0%) |
| 5 to 9 Unit Apartments | 58 (22.3%) | 202 (77.7%) |
| 10 or more Apartments | 0 (0.0%) | 347 (100.0%) |
| Mobile Home / Other | 334 (78.0%) | 94 (22.0%) |
| Total | 5,309 (69.6%) | 2,324 (30.4%) |
Housing Structures by Number of Rooms in Montour County
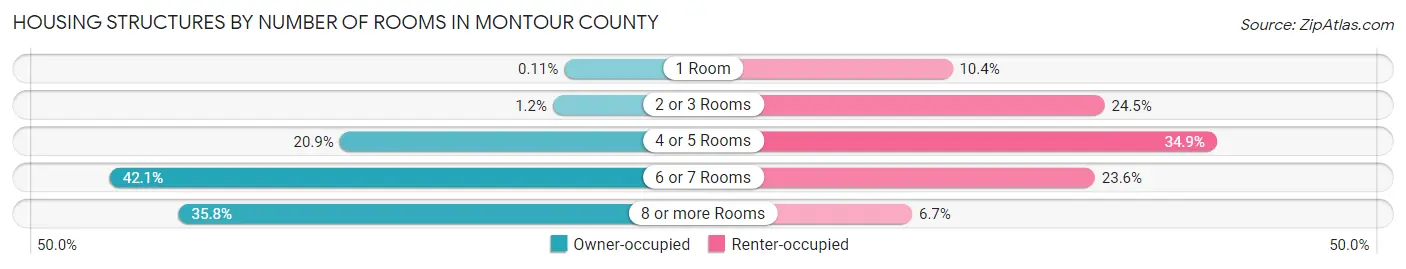
| Number of Rooms | Owner-occupied | Renter-occupied |
| 1 Room | 6 (0.1%) | 242 (10.4%) |
| 2 or 3 Rooms | 61 (1.1%) | 569 (24.5%) |
| 4 or 5 Rooms | 1,108 (20.9%) | 810 (34.8%) |
| 6 or 7 Rooms | 2,236 (42.1%) | 548 (23.6%) |
| 8 or more Rooms | 1,898 (35.7%) | 155 (6.7%) |
| Total | 5,309 (100.0%) | 2,324 (100.0%) |
Housing Structure by Heating Type in Montour County
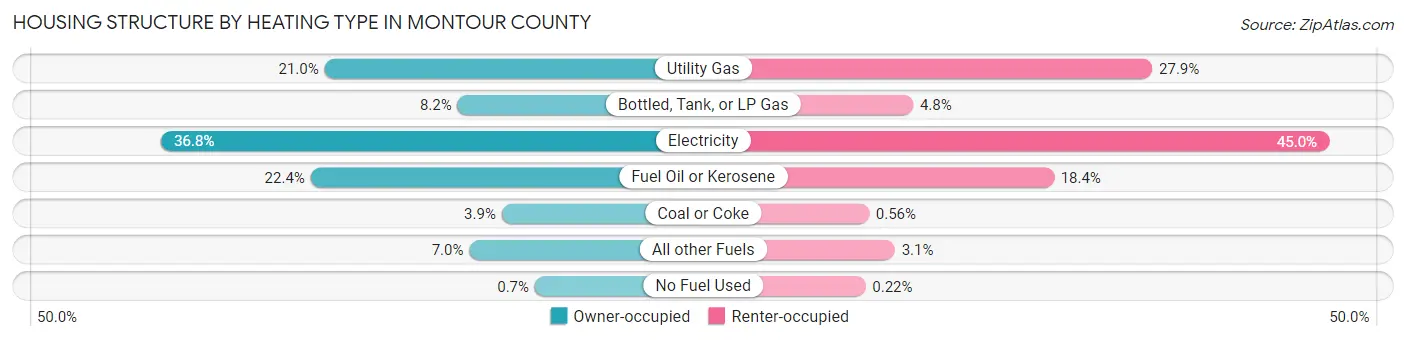
| Heating Type | Owner-occupied | Renter-occupied |
| Utility Gas | 1,116 (21.0%) | 649 (27.9%) |
| Bottled, Tank, or LP Gas | 434 (8.2%) | 112 (4.8%) |
| Electricity | 1,955 (36.8%) | 1,046 (45.0%) |
| Fuel Oil or Kerosene | 1,187 (22.4%) | 428 (18.4%) |
| Coal or Coke | 207 (3.9%) | 13 (0.6%) |
| All other Fuels | 373 (7.0%) | 71 (3.1%) |
| No Fuel Used | 37 (0.7%) | 5 (0.2%) |
| Total | 5,309 (100.0%) | 2,324 (100.0%) |
Household Vehicle Usage in Montour County
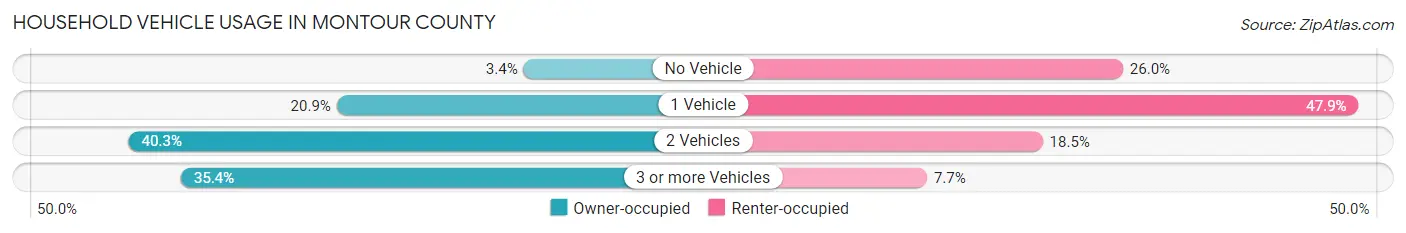
| Vehicles per Household | Owner-occupied | Renter-occupied |
| No Vehicle | 182 (3.4%) | 603 (26.0%) |
| 1 Vehicle | 1,108 (20.9%) | 1,114 (47.9%) |
| 2 Vehicles | 2,139 (40.3%) | 429 (18.5%) |
| 3 or more Vehicles | 1,880 (35.4%) | 178 (7.7%) |
| Total | 5,309 (100.0%) | 2,324 (100.0%) |
Real Estate & Mortgages in Montour County
Real Estate and Mortgage Overview in Montour County
| Characteristic | Without Mortgage | With Mortgage |
| Housing Units | 2,486 | 2,823 |
| Median Property Value | $216,400 | $237,900 |
| Median Household Income | $65,750 | $792 |
| Monthly Housing Costs | $560 | $245 |
| Real Estate Taxes | $2,245 | $8 |
Property Value by Mortgage Status in Montour County
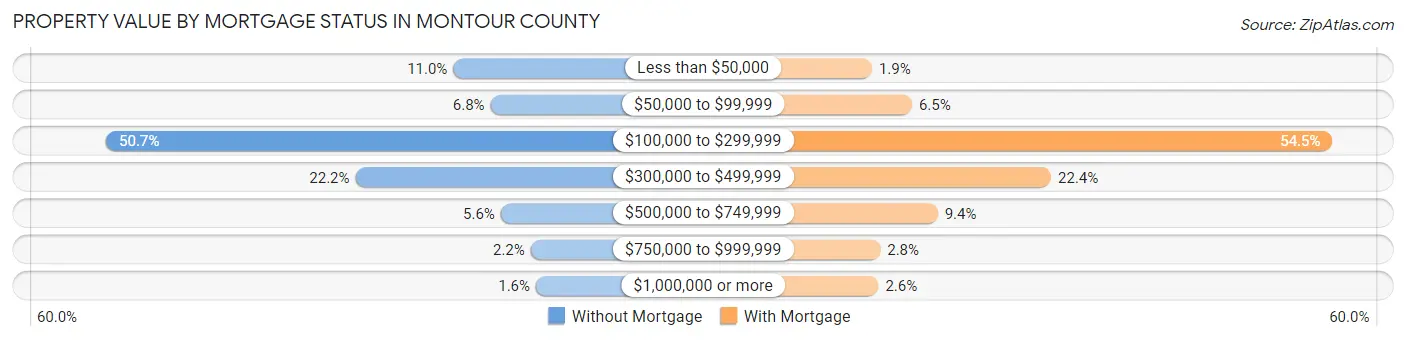
| Property Value | Without Mortgage | With Mortgage |
| Less than $50,000 | 274 (11.0%) | 53 (1.9%) |
| $50,000 to $99,999 | 168 (6.8%) | 182 (6.5%) |
| $100,000 to $299,999 | 1,260 (50.7%) | 1,538 (54.5%) |
| $300,000 to $499,999 | 552 (22.2%) | 631 (22.4%) |
| $500,000 to $749,999 | 139 (5.6%) | 265 (9.4%) |
| $750,000 to $999,999 | 54 (2.2%) | 80 (2.8%) |
| $1,000,000 or more | 39 (1.6%) | 74 (2.6%) |
| Total | 2,486 (100.0%) | 2,823 (100.0%) |
Household Income by Mortgage Status in Montour County
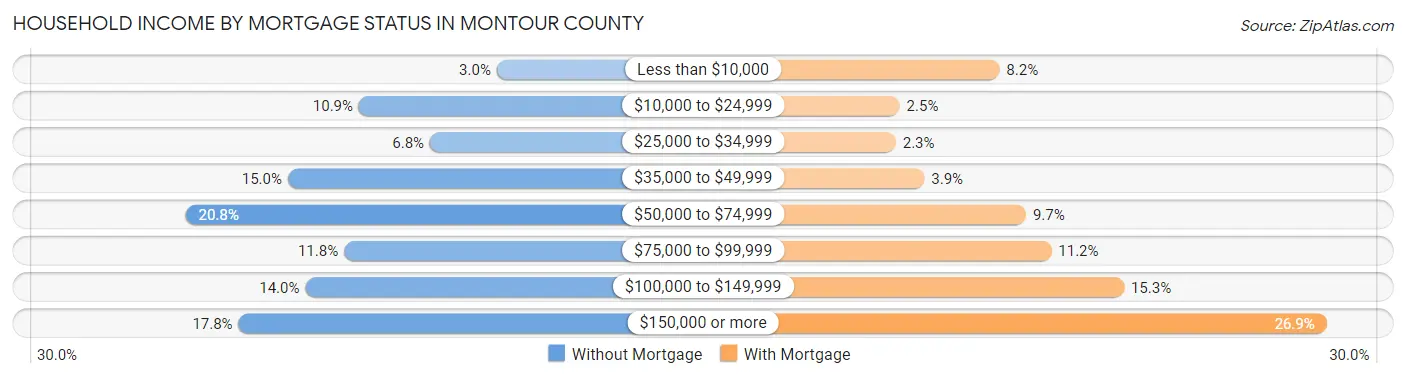
| Household Income | Without Mortgage | With Mortgage |
| Less than $10,000 | 75 (3.0%) | 232 (8.2%) |
| $10,000 to $24,999 | 271 (10.9%) | 71 (2.5%) |
| $25,000 to $34,999 | 170 (6.8%) | 65 (2.3%) |
| $35,000 to $49,999 | 372 (15.0%) | 111 (3.9%) |
| $50,000 to $74,999 | 517 (20.8%) | 275 (9.7%) |
| $75,000 to $99,999 | 292 (11.7%) | 316 (11.2%) |
| $100,000 to $149,999 | 347 (14.0%) | 433 (15.3%) |
| $150,000 or more | 442 (17.8%) | 760 (26.9%) |
| Total | 2,486 (100.0%) | 2,823 (100.0%) |
Property Value to Household Income Ratio in Montour County
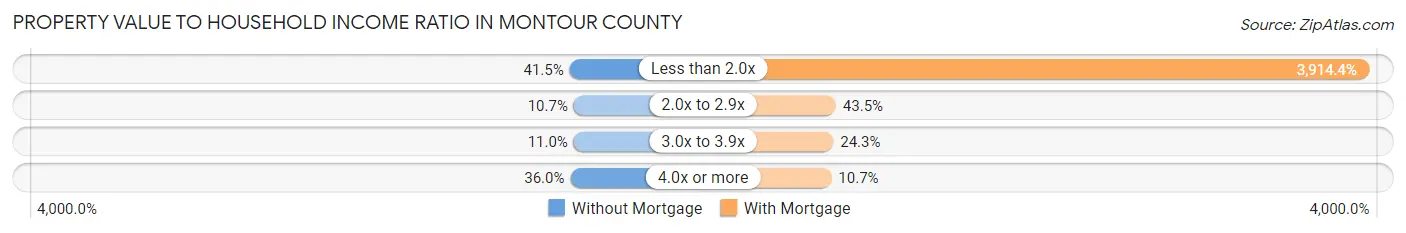
| Value-to-Income Ratio | Without Mortgage | With Mortgage |
| Less than 2.0x | 1,032 (41.5%) | 110,503 (3,914.4%) |
| 2.0x to 2.9x | 266 (10.7%) | 1,228 (43.5%) |
| 3.0x to 3.9x | 273 (11.0%) | 687 (24.3%) |
| 4.0x or more | 895 (36.0%) | 302 (10.7%) |
| Total | 2,486 (100.0%) | 2,823 (100.0%) |
Real Estate Taxes by Mortgage Status in Montour County
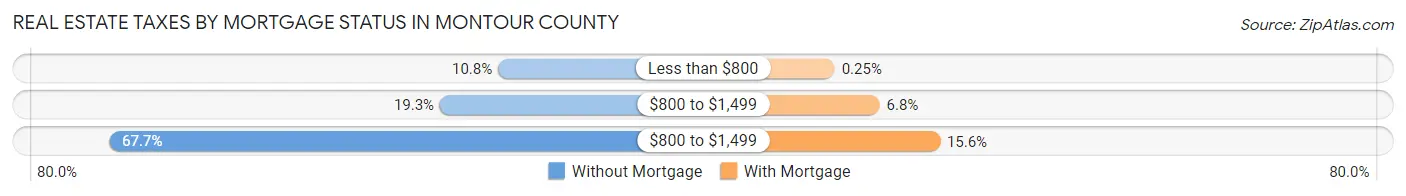
| Property Taxes | Without Mortgage | With Mortgage |
| Less than $800 | 269 (10.8%) | 7 (0.3%) |
| $800 to $1,499 | 480 (19.3%) | 192 (6.8%) |
| $800 to $1,499 | 1,682 (67.7%) | 441 (15.6%) |
| Total | 2,486 (100.0%) | 2,823 (100.0%) |
Health & Disability in Montour County
Health Insurance Coverage by Age in Montour County
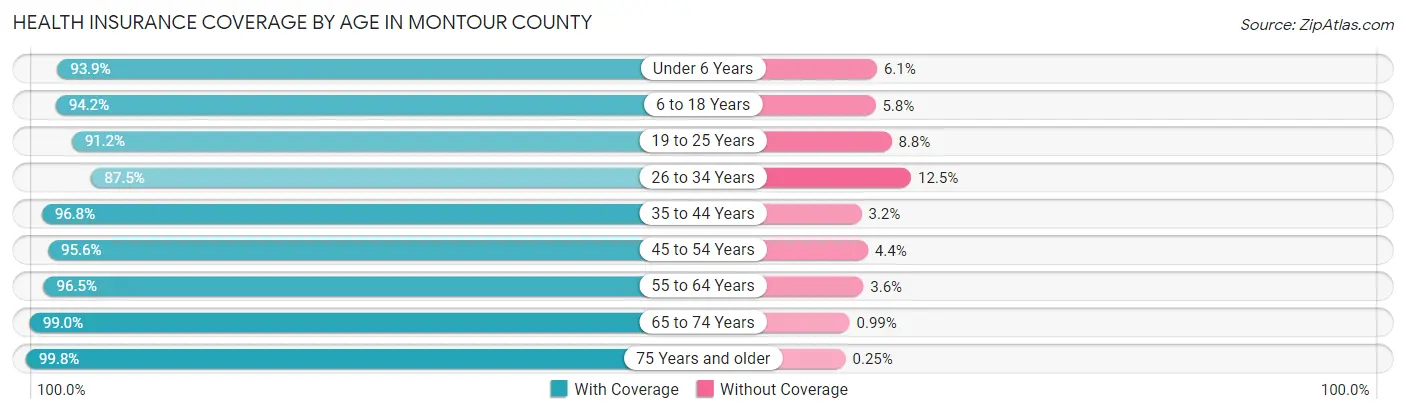
| Age Bracket | With Coverage | Without Coverage |
| Under 6 Years | 1,201 (93.9%) | 78 (6.1%) |
| 6 to 18 Years | 2,396 (94.2%) | 148 (5.8%) |
| 19 to 25 Years | 965 (91.2%) | 93 (8.8%) |
| 26 to 34 Years | 1,974 (87.5%) | 281 (12.5%) |
| 35 to 44 Years | 2,048 (96.8%) | 68 (3.2%) |
| 45 to 54 Years | 1,911 (95.6%) | 88 (4.4%) |
| 55 to 64 Years | 2,578 (96.5%) | 95 (3.5%) |
| 65 to 74 Years | 1,895 (99.0%) | 19 (1.0%) |
| 75 Years and older | 1,598 (99.8%) | 4 (0.3%) |
| Total | 16,566 (95.0%) | 874 (5.0%) |
Health Insurance Coverage by Citizenship Status in Montour County
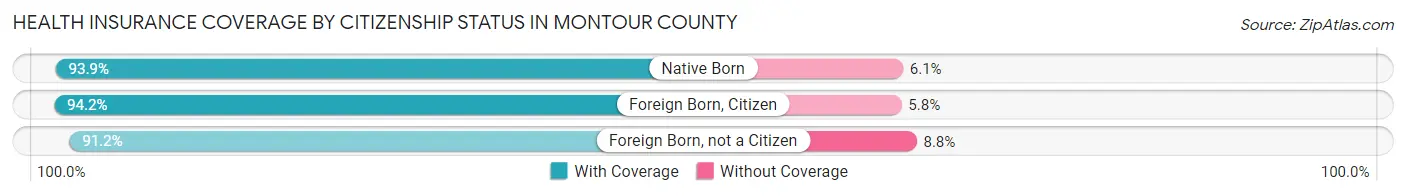
| Citizenship Status | With Coverage | Without Coverage |
| Native Born | 1,201 (93.9%) | 78 (6.1%) |
| Foreign Born, Citizen | 2,396 (94.2%) | 148 (5.8%) |
| Foreign Born, not a Citizen | 965 (91.2%) | 93 (8.8%) |
Health Insurance Coverage by Household Income in Montour County
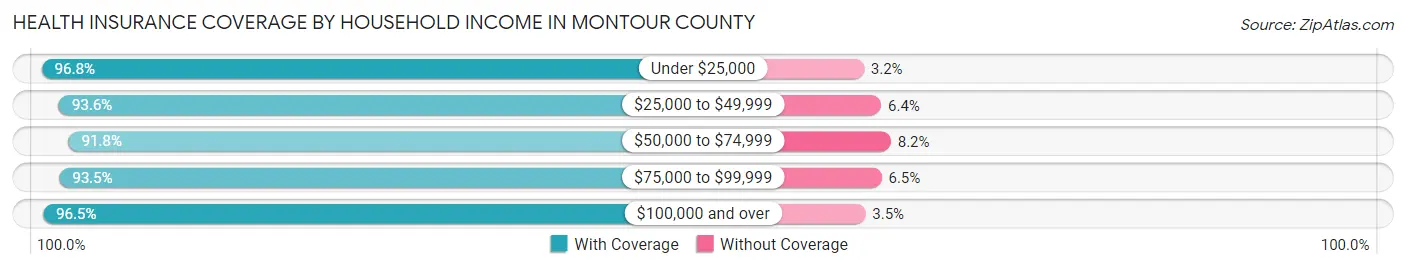
| Household Income | With Coverage | Without Coverage |
| Under $25,000 | 1,815 (96.8%) | 60 (3.2%) |
| $25,000 to $49,999 | 2,401 (93.6%) | 165 (6.4%) |
| $50,000 to $74,999 | 2,315 (91.8%) | 208 (8.2%) |
| $75,000 to $99,999 | 2,514 (93.5%) | 175 (6.5%) |
| $100,000 and over | 7,410 (96.5%) | 266 (3.5%) |
Public vs Private Health Insurance Coverage by Age in Montour County
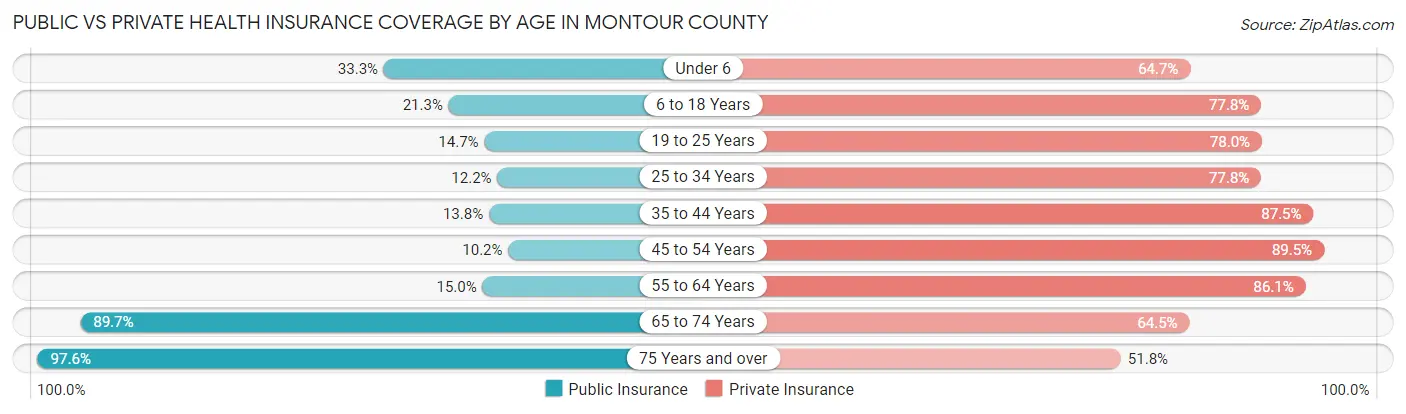
| Age Bracket | Public Insurance | Private Insurance |
| Under 6 | 426 (33.3%) | 827 (64.7%) |
| 6 to 18 Years | 541 (21.3%) | 1,980 (77.8%) |
| 19 to 25 Years | 155 (14.6%) | 825 (78.0%) |
| 25 to 34 Years | 276 (12.2%) | 1,755 (77.8%) |
| 35 to 44 Years | 292 (13.8%) | 1,852 (87.5%) |
| 45 to 54 Years | 204 (10.2%) | 1,789 (89.5%) |
| 55 to 64 Years | 401 (15.0%) | 2,301 (86.1%) |
| 65 to 74 Years | 1,716 (89.7%) | 1,235 (64.5%) |
| 75 Years and over | 1,563 (97.6%) | 830 (51.8%) |
| Total | 5,574 (32.0%) | 13,394 (76.8%) |
Disability Status by Sex by Age in Montour County
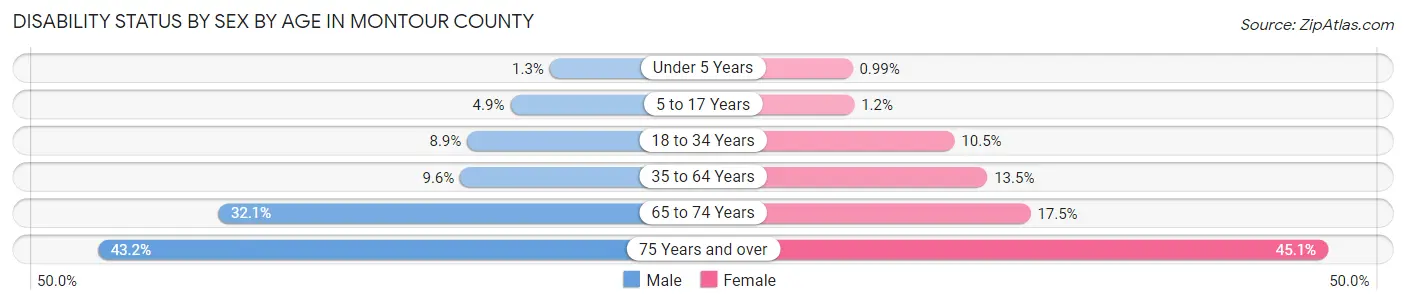
| Age Bracket | Male | Female |
| Under 5 Years | 7 (1.3%) | 5 (1.0%) |
| 5 to 17 Years | 65 (4.9%) | 14 (1.1%) |
| 18 to 34 Years | 166 (8.9%) | 176 (10.4%) |
| 35 to 64 Years | 311 (9.6%) | 478 (13.5%) |
| 65 to 74 Years | 286 (32.1%) | 179 (17.5%) |
| 75 Years and over | 264 (43.2%) | 447 (45.1%) |
Disability Class by Sex by Age in Montour County
Disability Class: Hearing Difficulty
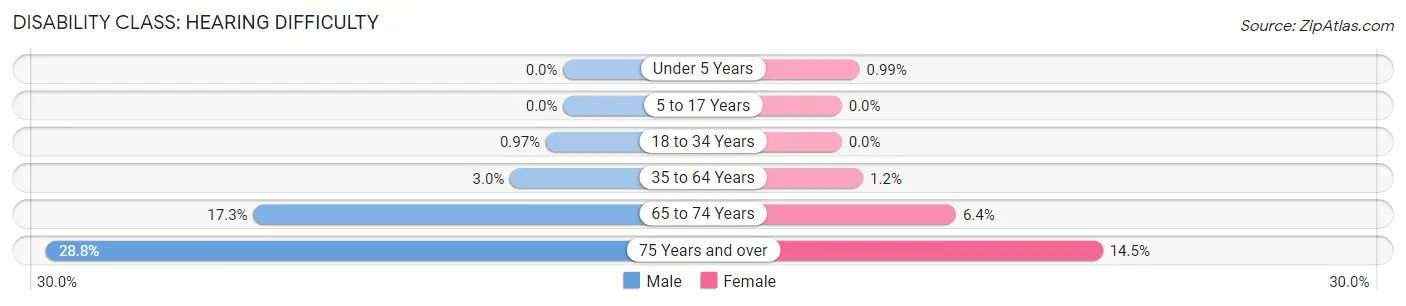
| Age Bracket | Male | Female |
| Under 5 Years | 0 (0.0%) | 5 (1.0%) |
| 5 to 17 Years | 0 (0.0%) | 0 (0.0%) |
| 18 to 34 Years | 18 (1.0%) | 0 (0.0%) |
| 35 to 64 Years | 96 (3.0%) | 42 (1.2%) |
| 65 to 74 Years | 154 (17.3%) | 65 (6.4%) |
| 75 Years and over | 176 (28.8%) | 144 (14.5%) |
Disability Class: Vision Difficulty
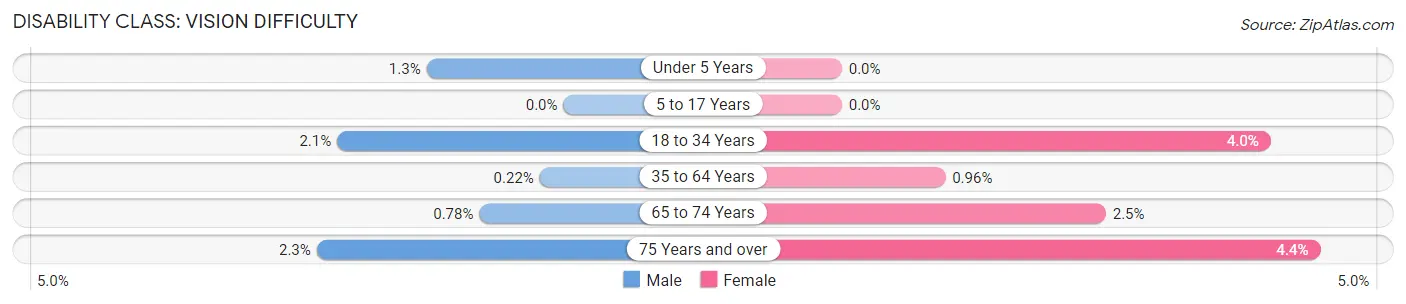
| Age Bracket | Male | Female |
| Under 5 Years | 7 (1.3%) | 0 (0.0%) |
| 5 to 17 Years | 0 (0.0%) | 0 (0.0%) |
| 18 to 34 Years | 39 (2.1%) | 67 (4.0%) |
| 35 to 64 Years | 7 (0.2%) | 34 (1.0%) |
| 65 to 74 Years | 7 (0.8%) | 25 (2.5%) |
| 75 Years and over | 14 (2.3%) | 44 (4.4%) |
Disability Class: Cognitive Difficulty
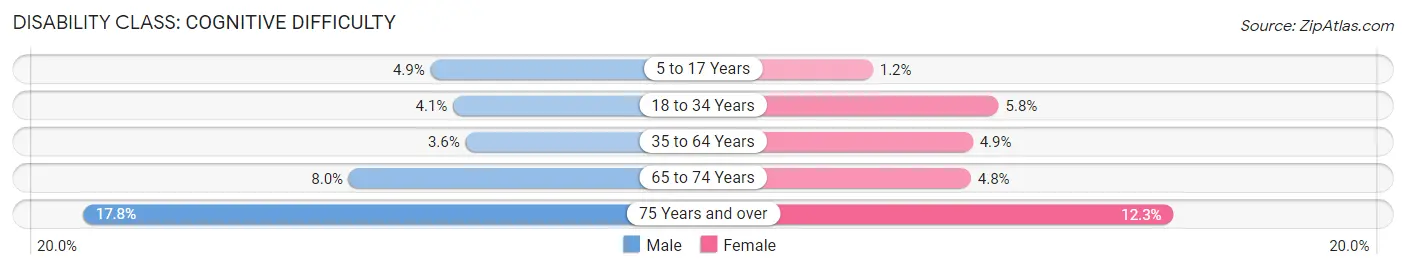
| Age Bracket | Male | Female |
| 5 to 17 Years | 65 (4.9%) | 14 (1.1%) |
| 18 to 34 Years | 76 (4.1%) | 98 (5.8%) |
| 35 to 64 Years | 118 (3.6%) | 172 (4.9%) |
| 65 to 74 Years | 71 (8.0%) | 49 (4.8%) |
| 75 Years and over | 109 (17.8%) | 122 (12.3%) |
Disability Class: Ambulatory Difficulty
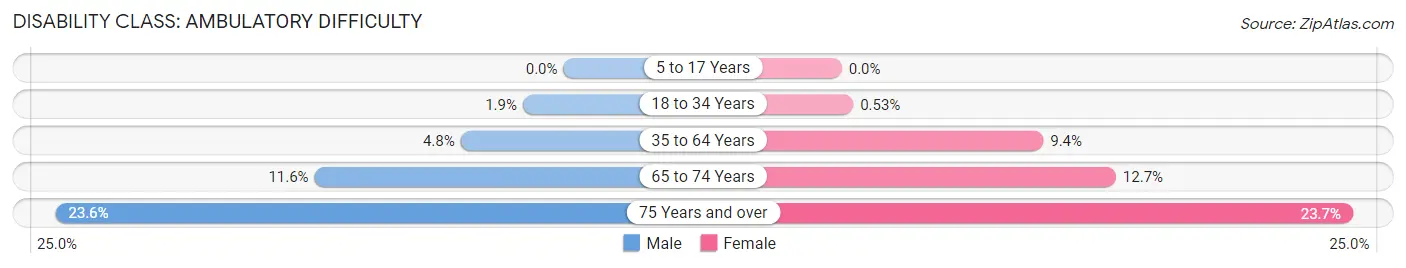
| Age Bracket | Male | Female |
| 5 to 17 Years | 0 (0.0%) | 0 (0.0%) |
| 18 to 34 Years | 35 (1.9%) | 9 (0.5%) |
| 35 to 64 Years | 155 (4.8%) | 331 (9.3%) |
| 65 to 74 Years | 103 (11.6%) | 130 (12.7%) |
| 75 Years and over | 144 (23.6%) | 235 (23.7%) |
Disability Class: Self-Care Difficulty
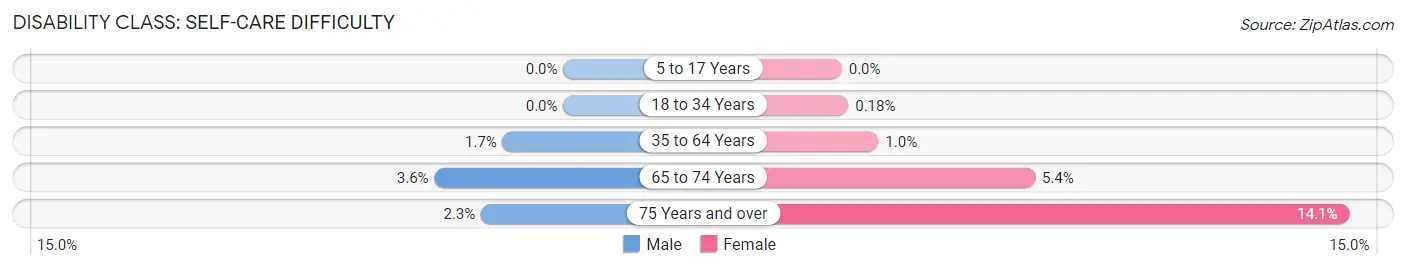
| Age Bracket | Male | Female |
| 5 to 17 Years | 0 (0.0%) | 0 (0.0%) |
| 18 to 34 Years | 0 (0.0%) | 3 (0.2%) |
| 35 to 64 Years | 55 (1.7%) | 36 (1.0%) |
| 65 to 74 Years | 32 (3.6%) | 55 (5.4%) |
| 75 Years and over | 14 (2.3%) | 140 (14.1%) |
Technology Access in Montour County
Computing Device Access in Montour County
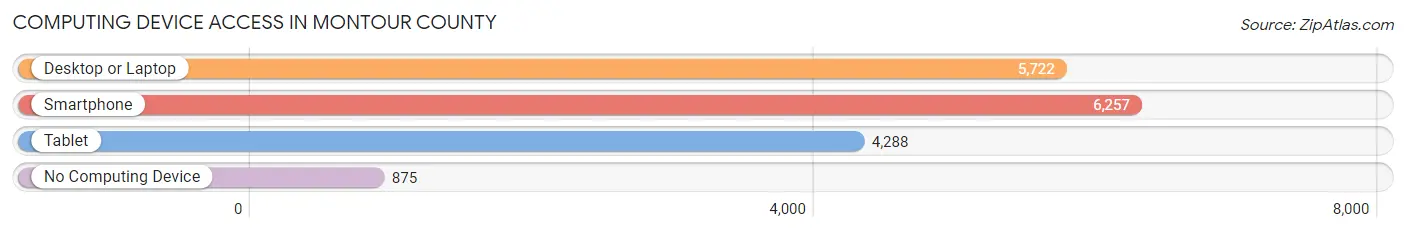
| Device Type | # Households | % Households |
| Desktop or Laptop | 5,722 | 75.0% |
| Smartphone | 6,257 | 82.0% |
| Tablet | 4,288 | 56.2% |
| No Computing Device | 875 | 11.5% |
| Total | 7,633 | 100.0% |
Internet Access in Montour County
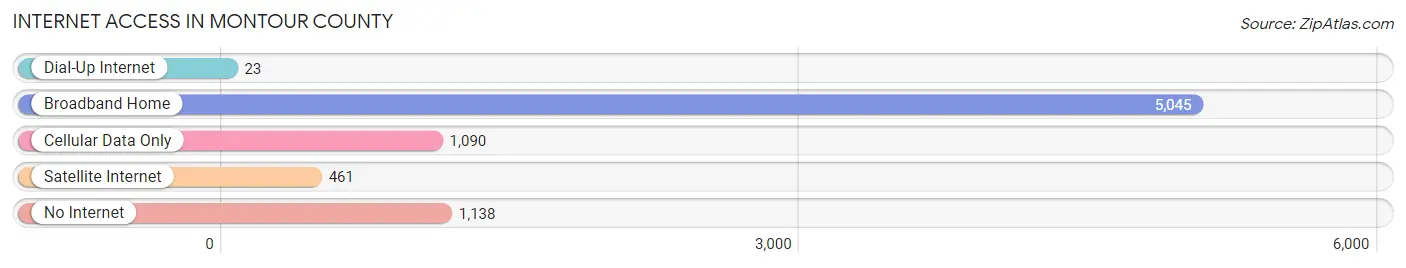
| Internet Type | # Households | % Households |
| Dial-Up Internet | 23 | 0.3% |
| Broadband Home | 5,045 | 66.1% |
| Cellular Data Only | 1,090 | 14.3% |
| Satellite Internet | 461 | 6.0% |
| No Internet | 1,138 | 14.9% |
| Total | 7,633 | 100.0% |
Montour County Summary
Introduction
Montour County is a county located in the U.S. state of Pennsylvania. It is part of the Bloomsburg-Berwick Metropolitan Statistical Area. The county seat is Danville. As of the 2010 census, the population was 18,267. The county was created on March 2, 1850, from part of Northumberland County and named for Andrew Montour, a prominent Native American of the area.
History
Montour County was formed in 1850 from part of Northumberland County. The county was named for Andrew Montour, a prominent Native American of the area. Montour was a half-blood Native American who served as an interpreter and guide for the British during the French and Indian War. He was also a negotiator for the Iroquois during the Revolutionary War.
The first settlers in the area were German and Swiss immigrants who arrived in the early 1700s. The first county seat was located in Danville, which was established in 1792. The county was officially organized in 1850.
Geography
Montour County is located in the central part of Pennsylvania. It is bordered by Northumberland County to the north, Columbia County to the east, Lycoming County to the south, and Union County to the west. The county has a total area of 246 square miles, of which 241 square miles is land and 5 square miles is water.
The terrain of Montour County is mostly rolling hills and valleys. The highest point in the county is located in the northern part of the county, at an elevation of 1,890 feet. The county is drained by the Susquehanna River and its tributaries, including the Mahoning Creek, Fishing Creek, and Chillisquaque Creek.
Economy
The economy of Montour County is largely based on agriculture and manufacturing. The county is home to several large farms, as well as several small family farms. The county is also home to several manufacturing companies, including a paper mill, a steel mill, and a plastics plant.
The county also has a growing tourism industry, with several attractions, including the Montour County Historical Society Museum, the Montour County Park, and the Montour Preserve.
Demographics
As of the 2010 census, the population of Montour County was 18,267. The racial makeup of the county was 95.3% White, 1.7% African American, 0.3% Native American, 0.5% Asian, 0.1% Pacific Islander, 0.7% from other races, and 1.4% from two or more races. Hispanic or Latino of any race were 2.2% of the population.
The median income for a household in the county was $45,945, and the median income for a family was $54,945. The per capita income for the county was $22,845. About 8.7% of families and 11.2% of the population were below the poverty line, including 15.2% of those under age 18 and 8.2% of those age 65 or over.
Conclusion
Montour County is a county located in the U.S. state of Pennsylvania. It is part of the Bloomsburg-Berwick Metropolitan Statistical Area. The county was created in 1850 from part of Northumberland County and named for Andrew Montour, a prominent Native American of the area. The county has a total area of 246 square miles, of which 241 square miles is land and 5 square miles is water. The economy of Montour County is largely based on agriculture and manufacturing. As of the 2010 census, the population of Montour County was 18,267. The median income for a household in the county was $45,945, and the median income for a family was $54,945. The county has a growing tourism industry, with several attractions, including the Montour County Historical Society Museum, the Montour County Park, and the Montour Preserve.
Common Questions
What is Per Capita Income in Montour County?
Per Capita income in Montour County is $43,700.
What is the Median Family Income in Montour County?
Median Family Income in Montour County is $87,020.
What is the Median Household income in Montour County?
Median Household Income in Montour County is $72,626.
What is Income or Wage Gap in Montour County?
Income or Wage Gap in Montour County is 33.6%.
Women in Montour County earn 66.4 cents for every dollar earned by a man.
What is Inequality or Gini Index in Montour County?
Inequality or Gini Index in Montour County is 0.50.
What is the Total Population of Montour County?
Total Population of Montour County is 18,165.
What is the Total Male Population of Montour County?
Total Male Population of Montour County is 8,912.
What is the Total Female Population of Montour County?
Total Female Population of Montour County is 9,253.
What is the Ratio of Males per 100 Females in Montour County?
There are 96.31 Males per 100 Females in Montour County.
What is the Ratio of Females per 100 Males in Montour County?
There are 103.83 Females per 100 Males in Montour County.
What is the Median Population Age in Montour County?
Median Population Age in Montour County is 43.2 Years.
What is the Average Family Size in Montour County
Average Family Size in Montour County is 2.8 People.
What is the Average Household Size in Montour County
Average Household Size in Montour County is 2.3 People.
How Large is the Labor Force in Montour County?
There are 8,977 People in the Labor Forcein in Montour County.
What is the Percentage of People in the Labor Force in Montour County?
60.1% of People are in the Labor Force in Montour County.
What is the Unemployment Rate in Montour County?
Unemployment Rate in Montour County is 2.4%.