Monroe County, PA Map & Demographics
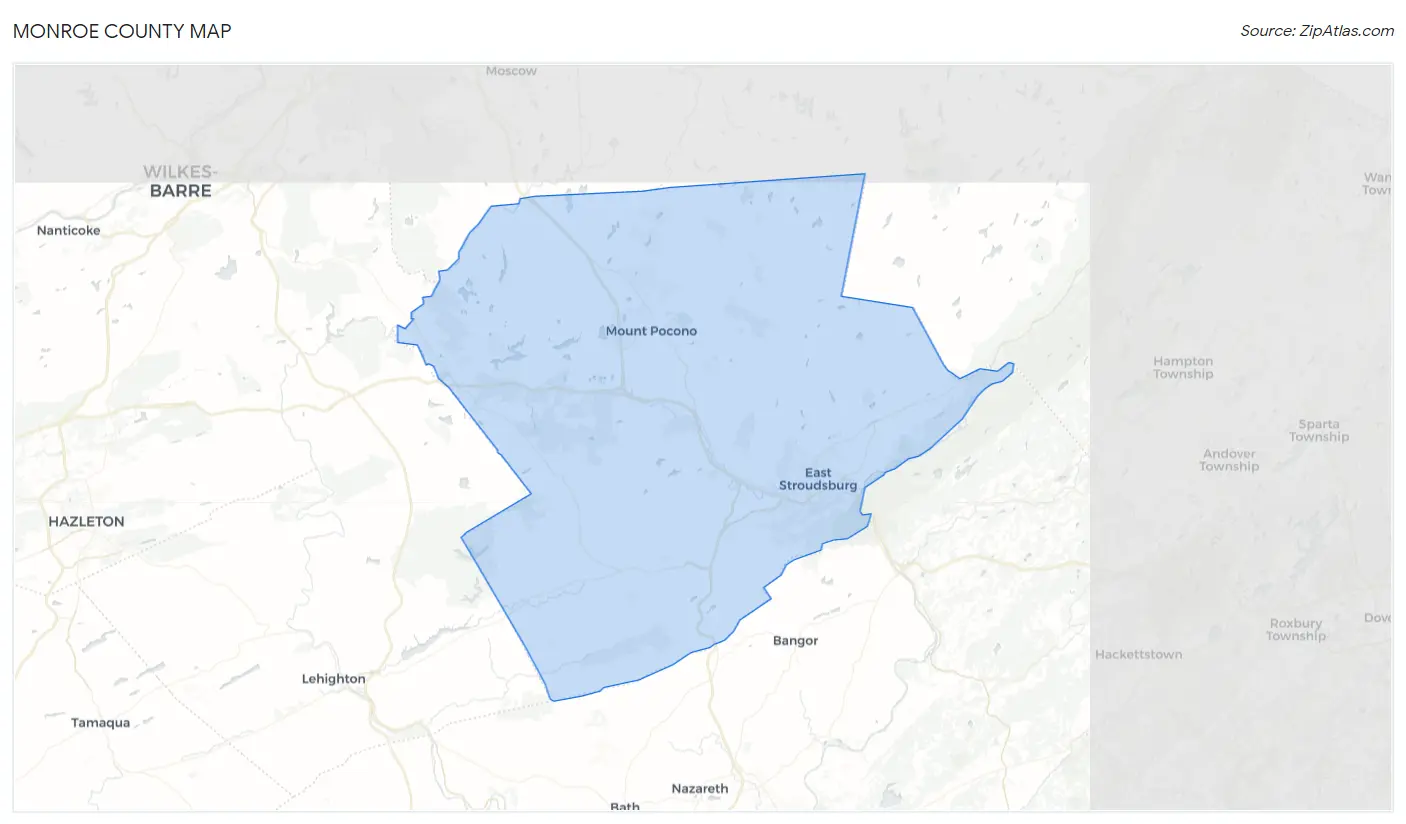
Monroe County Map
Monroe County Overview
$36,277
PER CAPITA INCOME
$95,253
AVG FAMILY INCOME
$80,656
AVG HOUSEHOLD INCOME
33.5%
WAGE / INCOME GAP [ % ]
66.5¢/ $1
WAGE / INCOME GAP [ $ ]
$11,814
FAMILY INCOME DEFICIT
0.42
INEQUALITY / GINI INDEX
168,128
TOTAL POPULATION
84,131
MALE POPULATION
83,997
FEMALE POPULATION
100.16
MALES / 100 FEMALES
99.84
FEMALES / 100 MALES
43.5
MEDIAN AGE
3.3
AVG FAMILY SIZE
2.8
AVG HOUSEHOLD SIZE
84,585
LABOR FORCE [ PEOPLE ]
60.6%
PERCENT IN LABOR FORCE
6.3%
UNEMPLOYMENT RATE
Income in Monroe County
Income Overview in Monroe County
Per Capita Income in Monroe County is $36,277, while median incomes of families and households are $95,253 and $80,656 respectively.
| Characteristic | Number | Measure |
| Per Capita Income | 168,128 | $36,277 |
| Median Family Income | 42,191 | $95,253 |
| Mean Family Income | 42,191 | $110,842 |
| Median Household Income | 59,113 | $80,656 |
| Mean Household Income | 59,113 | $98,338 |
| Income Deficit | 42,191 | $11,814 |
| Wage / Income Gap (%) | 168,128 | 33.51% |
| Wage / Income Gap ($) | 168,128 | 66.49¢ per $1 |
| Gini / Inequality Index | 168,128 | 0.42 |
Earnings by Sex in Monroe County
Average Earnings in Monroe County are $38,423, $46,542 for men and $30,948 for women, a difference of 33.5%.
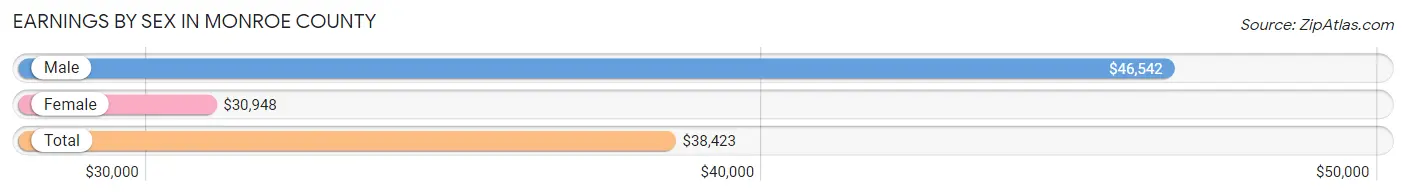
| Sex | Number | Average Earnings |
| Male | 46,823 (53.4%) | $46,542 |
| Female | 40,887 (46.6%) | $30,948 |
| Total | 87,710 (100.0%) | $38,423 |
Earnings by Sex by Income Bracket in Monroe County
The most common earnings brackets in Monroe County are $100,000+ for men (7,794 | 16.7%) and $75,000 to $99,999 for women (3,754 | 9.2%).
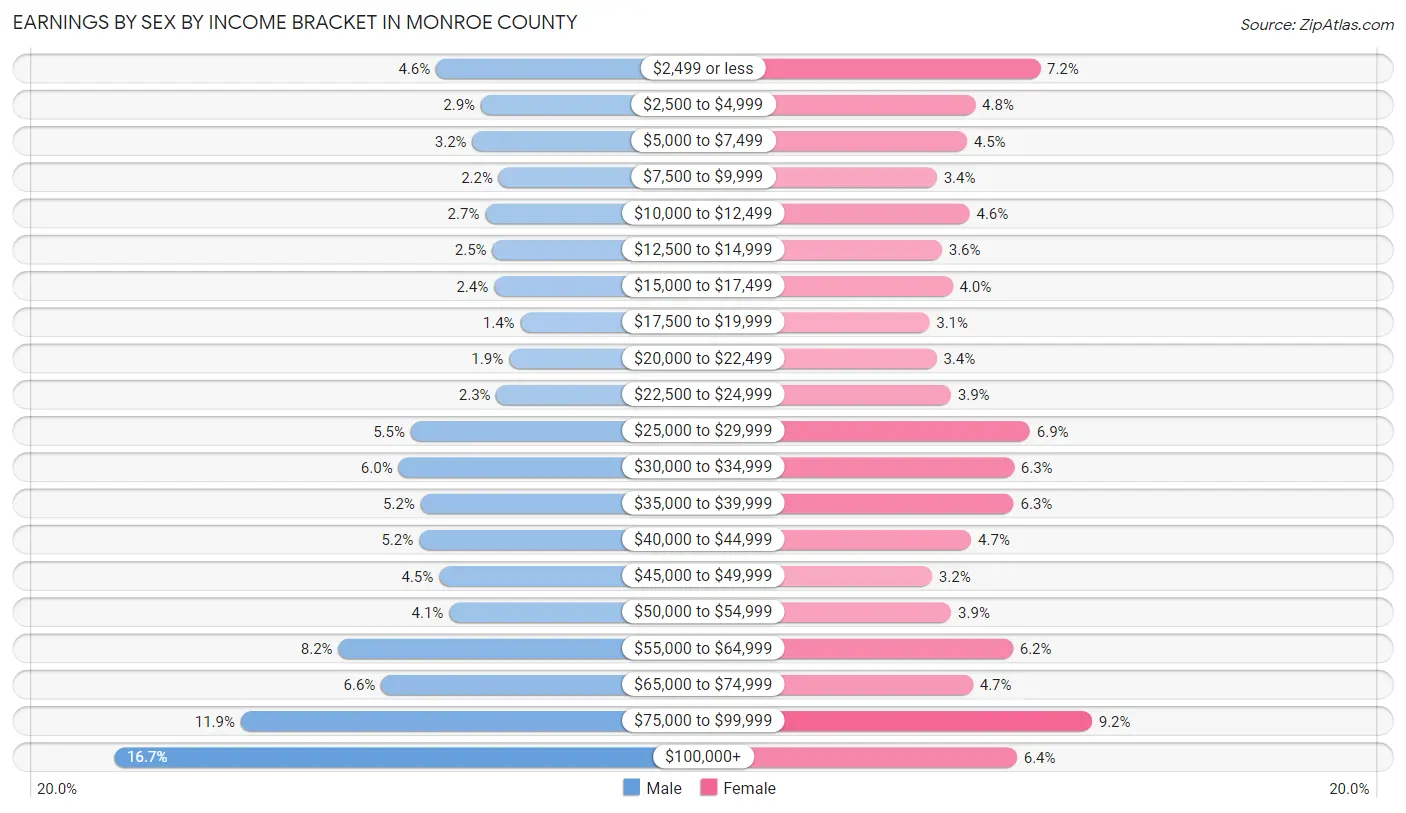
| Income | Male | Female |
| $2,499 or less | 2,144 (4.6%) | 2,959 (7.2%) |
| $2,500 to $4,999 | 1,357 (2.9%) | 1,966 (4.8%) |
| $5,000 to $7,499 | 1,508 (3.2%) | 1,838 (4.5%) |
| $7,500 to $9,999 | 1,043 (2.2%) | 1,376 (3.4%) |
| $10,000 to $12,499 | 1,284 (2.7%) | 1,881 (4.6%) |
| $12,500 to $14,999 | 1,156 (2.5%) | 1,455 (3.6%) |
| $15,000 to $17,499 | 1,129 (2.4%) | 1,620 (4.0%) |
| $17,500 to $19,999 | 663 (1.4%) | 1,264 (3.1%) |
| $20,000 to $22,499 | 864 (1.8%) | 1,375 (3.4%) |
| $22,500 to $24,999 | 1,086 (2.3%) | 1,594 (3.9%) |
| $25,000 to $29,999 | 2,587 (5.5%) | 2,806 (6.9%) |
| $30,000 to $34,999 | 2,804 (6.0%) | 2,558 (6.3%) |
| $35,000 to $39,999 | 2,416 (5.2%) | 2,555 (6.2%) |
| $40,000 to $44,999 | 2,443 (5.2%) | 1,904 (4.7%) |
| $45,000 to $49,999 | 2,093 (4.5%) | 1,303 (3.2%) |
| $50,000 to $54,999 | 1,915 (4.1%) | 1,599 (3.9%) |
| $55,000 to $64,999 | 3,856 (8.2%) | 2,545 (6.2%) |
| $65,000 to $74,999 | 3,107 (6.6%) | 1,929 (4.7%) |
| $75,000 to $99,999 | 5,574 (11.9%) | 3,754 (9.2%) |
| $100,000+ | 7,794 (16.7%) | 2,606 (6.4%) |
| Total | 46,823 (100.0%) | 40,887 (100.0%) |
Earnings by Sex by Educational Attainment in Monroe County
Average earnings in Monroe County are $55,174 for men and $36,125 for women, a difference of 34.5%. Men with an educational attainment of graduate degree enjoy the highest average annual earnings of $104,758, while those with less than high school education earn the least with $38,724. Women with an educational attainment of graduate degree earn the most with the average annual earnings of $76,464, while those with less than high school education have the smallest earnings of $18,000.
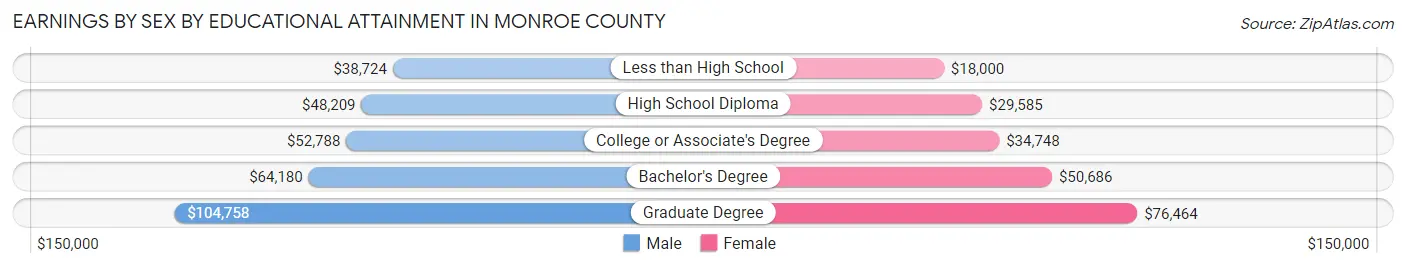
| Educational Attainment | Male Income | Female Income |
| Less than High School | $38,724 | $18,000 |
| High School Diploma | $48,209 | $29,585 |
| College or Associate's Degree | $52,788 | $34,748 |
| Bachelor's Degree | $64,180 | $50,686 |
| Graduate Degree | $104,758 | $76,464 |
| Total | $55,174 | $36,125 |
Family Income in Monroe County
Family Income Brackets in Monroe County
According to the Monroe County family income data, there are 10,295 families falling into the $100,000 to $149,999 income range, which is the most common income bracket and makes up 24.4% of all families. Conversely, the $10,000 to $14,999 income bracket is the least frequent group with only 633 families (1.5%) belonging to this category.
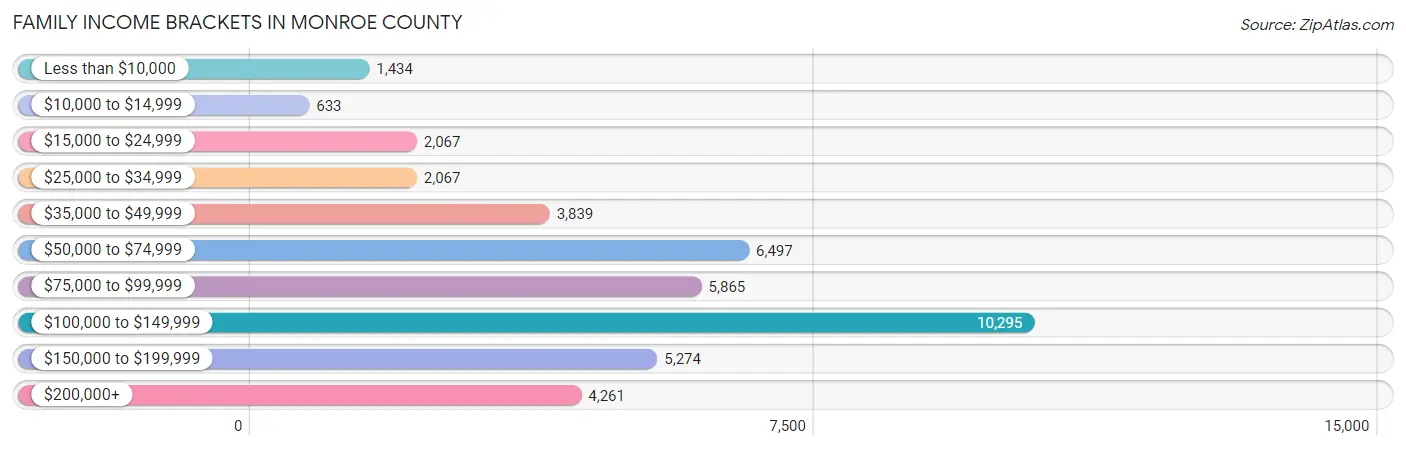
| Income Bracket | # Families | % Families |
| Less than $10,000 | 1,434 | 3.4% |
| $10,000 to $14,999 | 633 | 1.5% |
| $15,000 to $24,999 | 2,067 | 4.9% |
| $25,000 to $34,999 | 2,067 | 4.9% |
| $35,000 to $49,999 | 3,839 | 9.1% |
| $50,000 to $74,999 | 6,497 | 15.4% |
| $75,000 to $99,999 | 5,865 | 13.9% |
| $100,000 to $149,999 | 10,295 | 24.4% |
| $150,000 to $199,999 | 5,274 | 12.5% |
| $200,000+ | 4,261 | 10.1% |
Family Income by Famaliy Size in Monroe County
7+ person families (806 | 1.9%) account for the highest median family income in Monroe County with $146,033 per family, while 2-person families (18,681 | 44.3%) have the highest median income of $41,196 per family member.
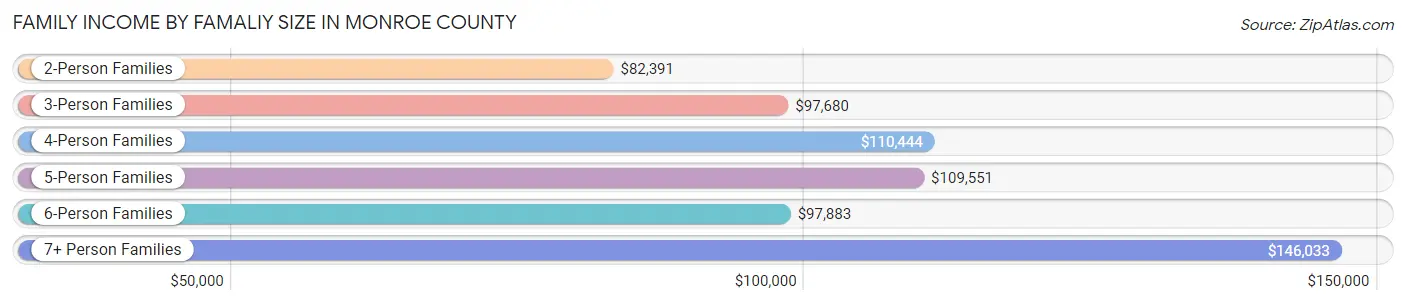
| Income Bracket | # Families | Median Income |
| 2-Person Families | 18,681 (44.3%) | $82,391 |
| 3-Person Families | 9,663 (22.9%) | $97,680 |
| 4-Person Families | 7,311 (17.3%) | $110,444 |
| 5-Person Families | 4,115 (9.8%) | $109,551 |
| 6-Person Families | 1,615 (3.8%) | $97,883 |
| 7+ Person Families | 806 (1.9%) | $146,033 |
| Total | 42,191 (100.0%) | $95,253 |
Family Income by Number of Earners in Monroe County
The median family income in Monroe County is $95,253, with families comprising 3+ earners (5,862) having the highest median family income of $144,278, while families with no earners (7,034) have the lowest median family income of $48,131, accounting for 13.9% and 16.7% of families, respectively.
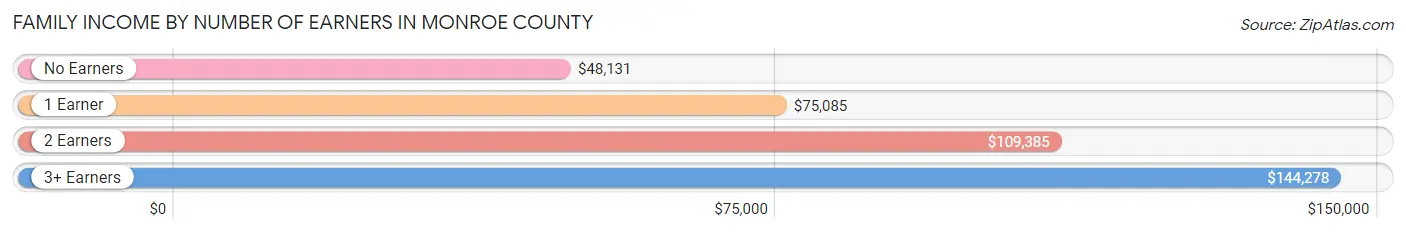
| Number of Earners | # Families | Median Income |
| No Earners | 7,034 (16.7%) | $48,131 |
| 1 Earner | 13,067 (31.0%) | $75,085 |
| 2 Earners | 16,228 (38.5%) | $109,385 |
| 3+ Earners | 5,862 (13.9%) | $144,278 |
| Total | 42,191 (100.0%) | $95,253 |
Household Income in Monroe County
Household Income Brackets in Monroe County
With 12,473 households falling in the category, the $100,000 to $149,999 income range is the most frequent in Monroe County, accounting for 21.1% of all households. In contrast, only 1,773 households (3.0%) fall into the $10,000 to $14,999 income bracket, making it the least populous group.
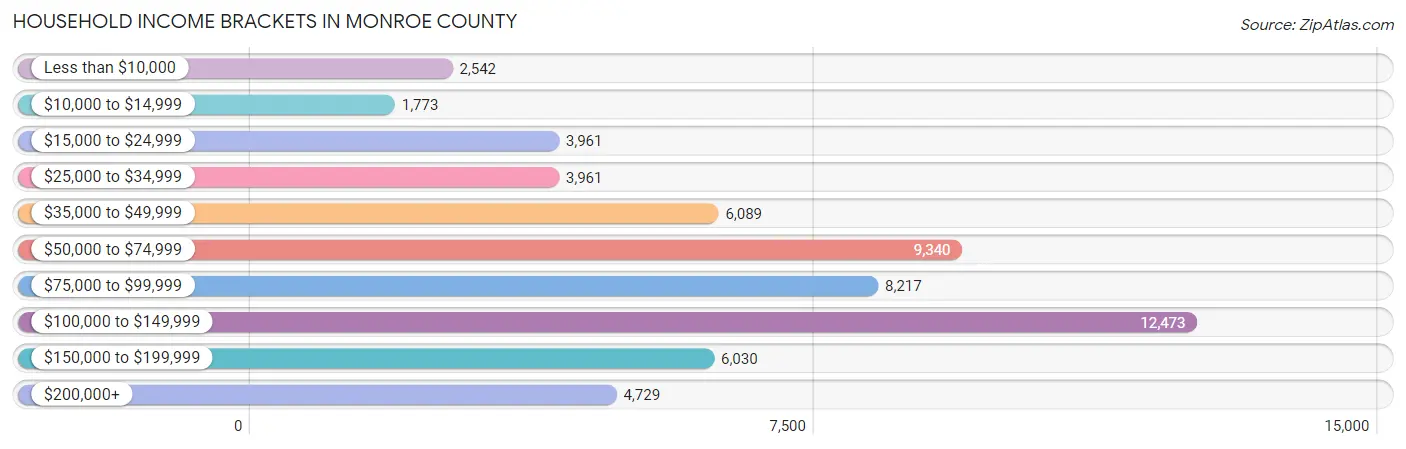
| Income Bracket | # Households | % Households |
| Less than $10,000 | 2,542 | 4.3% |
| $10,000 to $14,999 | 1,773 | 3.0% |
| $15,000 to $24,999 | 3,961 | 6.7% |
| $25,000 to $34,999 | 3,961 | 6.7% |
| $35,000 to $49,999 | 6,089 | 10.3% |
| $50,000 to $74,999 | 9,340 | 15.8% |
| $75,000 to $99,999 | 8,217 | 13.9% |
| $100,000 to $149,999 | 12,473 | 21.1% |
| $150,000 to $199,999 | 6,030 | 10.2% |
| $200,000+ | 4,729 | 8.0% |
Household Income by Householder Age in Monroe County
The median household income in Monroe County is $80,656, with the highest median household income of $98,898 found in the 45 to 64 years age bracket for the primary householder. A total of 26,957 households (45.6%) fall into this category. Meanwhile, the 15 to 24 years age bracket for the primary householder has the lowest median household income of $53,701, with 523 households (0.9%) in this group.
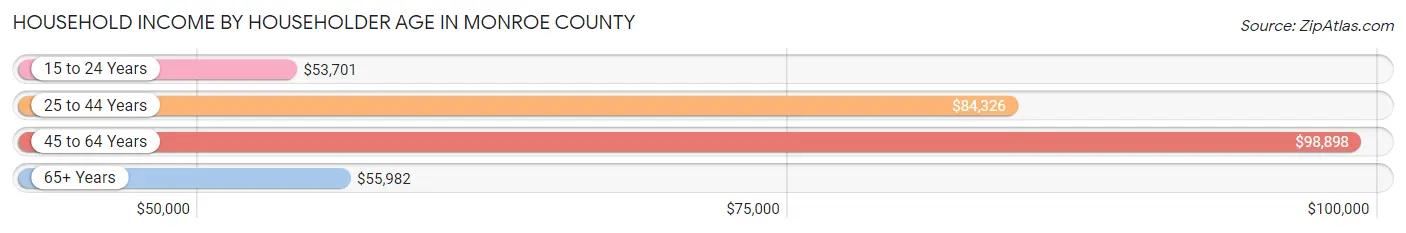
| Income Bracket | # Households | Median Income |
| 15 to 24 Years | 523 (0.9%) | $53,701 |
| 25 to 44 Years | 14,070 (23.8%) | $84,326 |
| 45 to 64 Years | 26,957 (45.6%) | $98,898 |
| 65+ Years | 17,563 (29.7%) | $55,982 |
| Total | 59,113 (100.0%) | $80,656 |
Poverty in Monroe County
Income Below Poverty by Sex and Age in Monroe County
With 9.9% poverty level for males and 12.7% for females among the residents of Monroe County, 6 to 11 year old males and 18 to 24 year old females are the most vulnerable to poverty, with 874 males (17.9%) and 1,453 females (19.6%) in their respective age groups living below the poverty level.
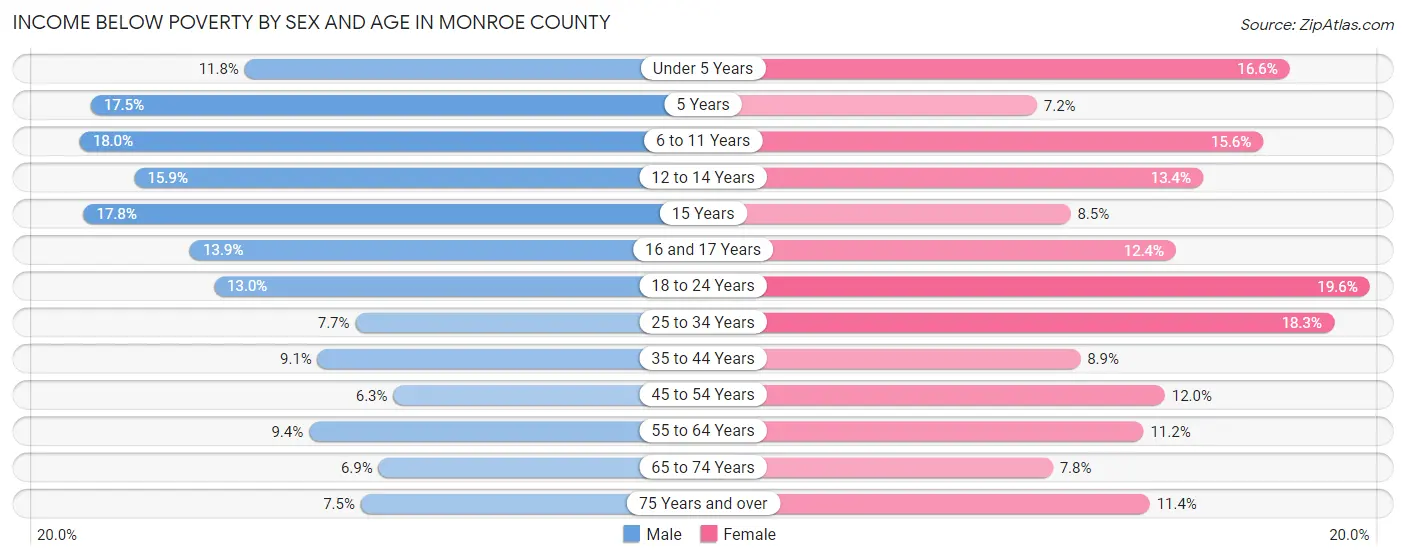
| Age Bracket | Male | Female |
| Under 5 Years | 456 (11.8%) | 637 (16.6%) |
| 5 Years | 205 (17.5%) | 72 (7.2%) |
| 6 to 11 Years | 874 (17.9%) | 810 (15.6%) |
| 12 to 14 Years | 507 (15.9%) | 351 (13.4%) |
| 15 Years | 205 (17.8%) | 107 (8.5%) |
| 16 and 17 Years | 304 (13.9%) | 240 (12.4%) |
| 18 to 24 Years | 1,021 (13.0%) | 1,453 (19.6%) |
| 25 to 34 Years | 784 (7.7%) | 1,628 (18.3%) |
| 35 to 44 Years | 819 (9.1%) | 839 (8.8%) |
| 45 to 54 Years | 713 (6.3%) | 1,404 (12.0%) |
| 55 to 64 Years | 1,297 (9.4%) | 1,503 (11.2%) |
| 65 to 74 Years | 654 (6.9%) | 750 (7.8%) |
| 75 Years and over | 372 (7.5%) | 708 (11.4%) |
| Total | 8,211 (9.9%) | 10,502 (12.7%) |
Income Above Poverty by Sex and Age in Monroe County
According to the poverty statistics in Monroe County, males aged 45 to 54 years and females aged 5 years are the age groups that are most secure financially, with 93.7% of males and 92.8% of females in these age groups living above the poverty line.
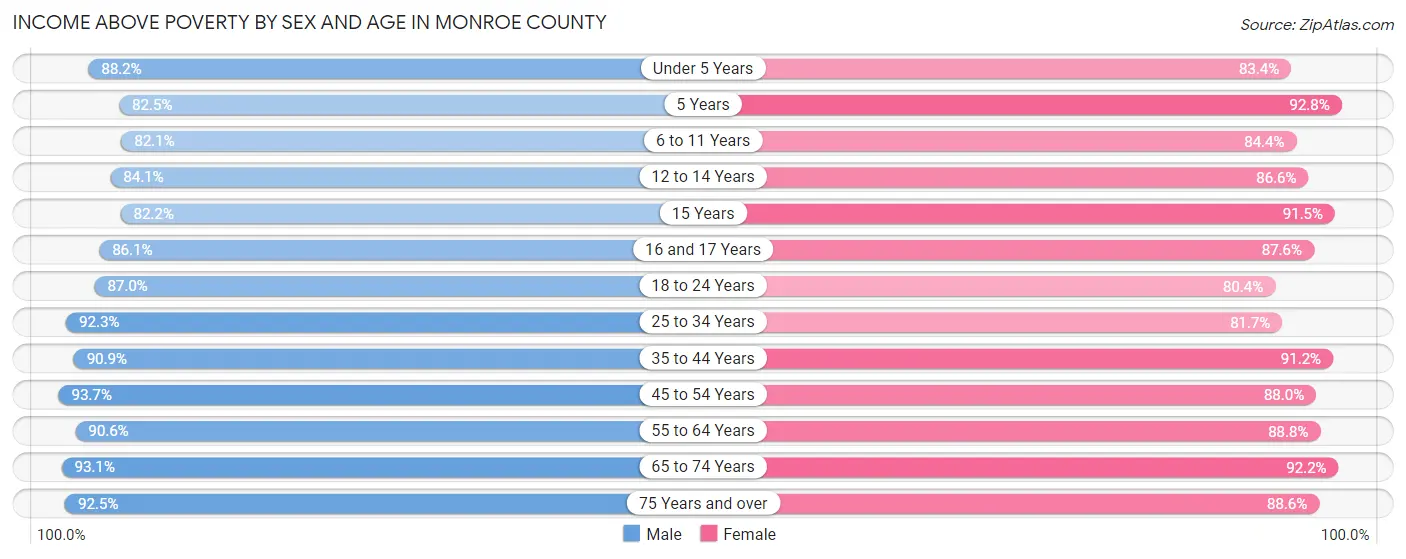
| Age Bracket | Male | Female |
| Under 5 Years | 3,400 (88.2%) | 3,195 (83.4%) |
| 5 Years | 964 (82.5%) | 923 (92.8%) |
| 6 to 11 Years | 3,994 (82.1%) | 4,370 (84.4%) |
| 12 to 14 Years | 2,677 (84.1%) | 2,268 (86.6%) |
| 15 Years | 946 (82.2%) | 1,154 (91.5%) |
| 16 and 17 Years | 1,890 (86.1%) | 1,696 (87.6%) |
| 18 to 24 Years | 6,853 (87.0%) | 5,964 (80.4%) |
| 25 to 34 Years | 9,367 (92.3%) | 7,290 (81.7%) |
| 35 to 44 Years | 8,163 (90.9%) | 8,641 (91.1%) |
| 45 to 54 Years | 10,590 (93.7%) | 10,301 (88.0%) |
| 55 to 64 Years | 12,437 (90.6%) | 11,914 (88.8%) |
| 65 to 74 Years | 8,878 (93.1%) | 8,830 (92.2%) |
| 75 Years and over | 4,578 (92.5%) | 5,486 (88.6%) |
| Total | 74,737 (90.1%) | 72,032 (87.3%) |
Income Below Poverty Among Married-Couple Families in Monroe County
The poverty statistics for married-couple families in Monroe County show that 5.2% or 1,663 of the total 31,975 families live below the poverty line. Families with 5 or more children have the highest poverty rate of 23.4%, comprising of 18 families. On the other hand, families with no children have the lowest poverty rate of 4.3%, which includes 836 families.
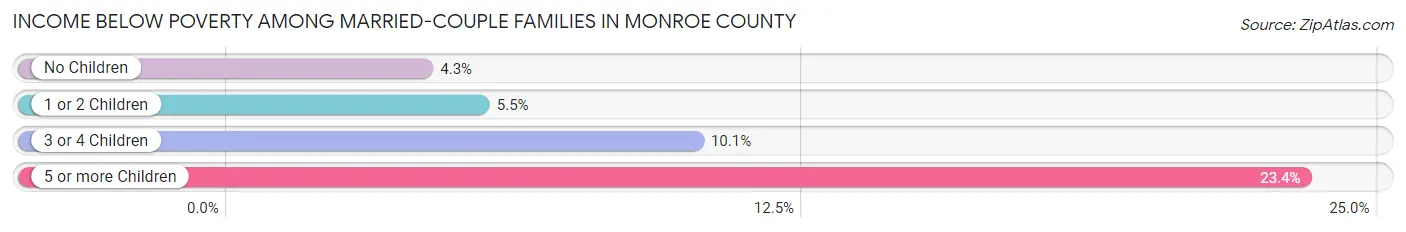
| Children | Above Poverty | Below Poverty |
| No Children | 18,835 (95.8%) | 836 (4.3%) |
| 1 or 2 Children | 8,732 (94.5%) | 506 (5.5%) |
| 3 or 4 Children | 2,686 (89.9%) | 303 (10.1%) |
| 5 or more Children | 59 (76.6%) | 18 (23.4%) |
| Total | 30,312 (94.8%) | 1,663 (5.2%) |
Income Below Poverty Among Single-Parent Households in Monroe County
According to the poverty data in Monroe County, 15.5% or 477 single-father households and 23.7% or 1,694 single-mother households are living below the poverty line. Among single-father households, those with 3 or 4 children have the highest poverty rate, with 90 households (36.7%) experiencing poverty. Likewise, among single-mother households, those with 5 or more children have the highest poverty rate, with 111 households (81.0%) falling below the poverty line.
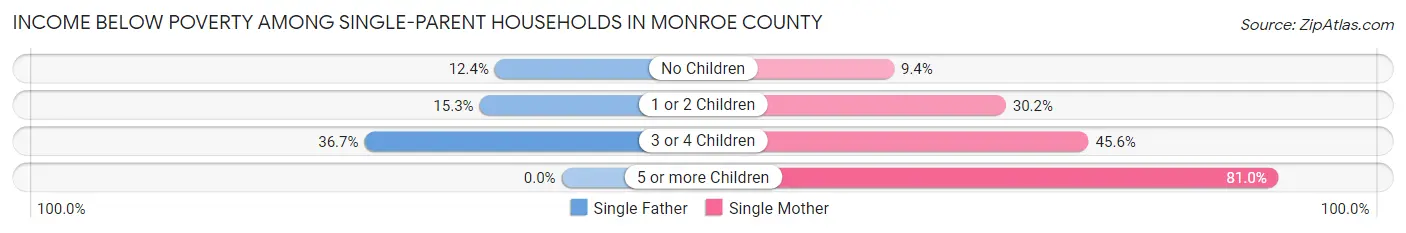
| Children | Single Father | Single Mother |
| No Children | 194 (12.4%) | 291 (9.4%) |
| 1 or 2 Children | 193 (15.3%) | 963 (30.2%) |
| 3 or 4 Children | 90 (36.7%) | 329 (45.6%) |
| 5 or more Children | 0 (0.0%) | 111 (81.0%) |
| Total | 477 (15.5%) | 1,694 (23.7%) |
Income Below Poverty Among Married-Couple vs Single-Parent Households in Monroe County
The poverty data for Monroe County shows that 1,663 of the married-couple family households (5.2%) and 2,171 of the single-parent households (21.2%) are living below the poverty level. Within the married-couple family households, those with 5 or more children have the highest poverty rate, with 18 households (23.4%) falling below the poverty line. Among the single-parent households, those with 5 or more children have the highest poverty rate, with 111 household (81.0%) living below poverty.
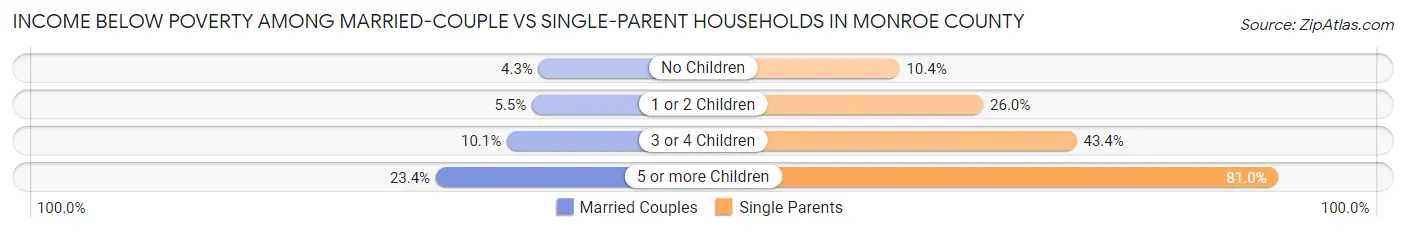
| Children | Married-Couple Families | Single-Parent Households |
| No Children | 836 (4.3%) | 485 (10.4%) |
| 1 or 2 Children | 506 (5.5%) | 1,156 (26.0%) |
| 3 or 4 Children | 303 (10.1%) | 419 (43.4%) |
| 5 or more Children | 18 (23.4%) | 111 (81.0%) |
| Total | 1,663 (5.2%) | 2,171 (21.2%) |
Race in Monroe County
The most populous races in Monroe County are White / Caucasian (116,728 | 69.4%), Hispanic or Latino (29,982 | 17.8%), and Black / African American (24,720 | 14.7%).
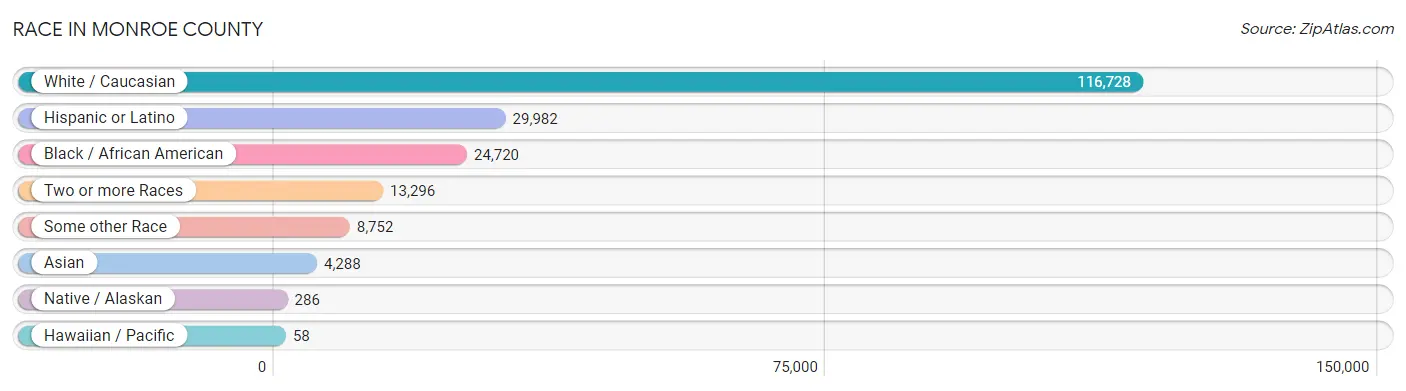
| Race | # Population | % Population |
| Asian | 4,288 | 2.5% |
| Black / African American | 24,720 | 14.7% |
| Hawaiian / Pacific | 58 | 0.0% |
| Hispanic or Latino | 29,982 | 17.8% |
| Native / Alaskan | 286 | 0.2% |
| White / Caucasian | 116,728 | 69.4% |
| Two or more Races | 13,296 | 7.9% |
| Some other Race | 8,752 | 5.2% |
| Total | 168,128 | 100.0% |
Ancestry in Monroe County
The most populous ancestries reported in Monroe County are German (26,268 | 15.6%), Irish (23,091 | 13.7%), Italian (20,482 | 12.2%), Puerto Rican (14,685 | 8.7%), and Polish (10,711 | 6.4%), together accounting for 56.6% of all Monroe County residents.
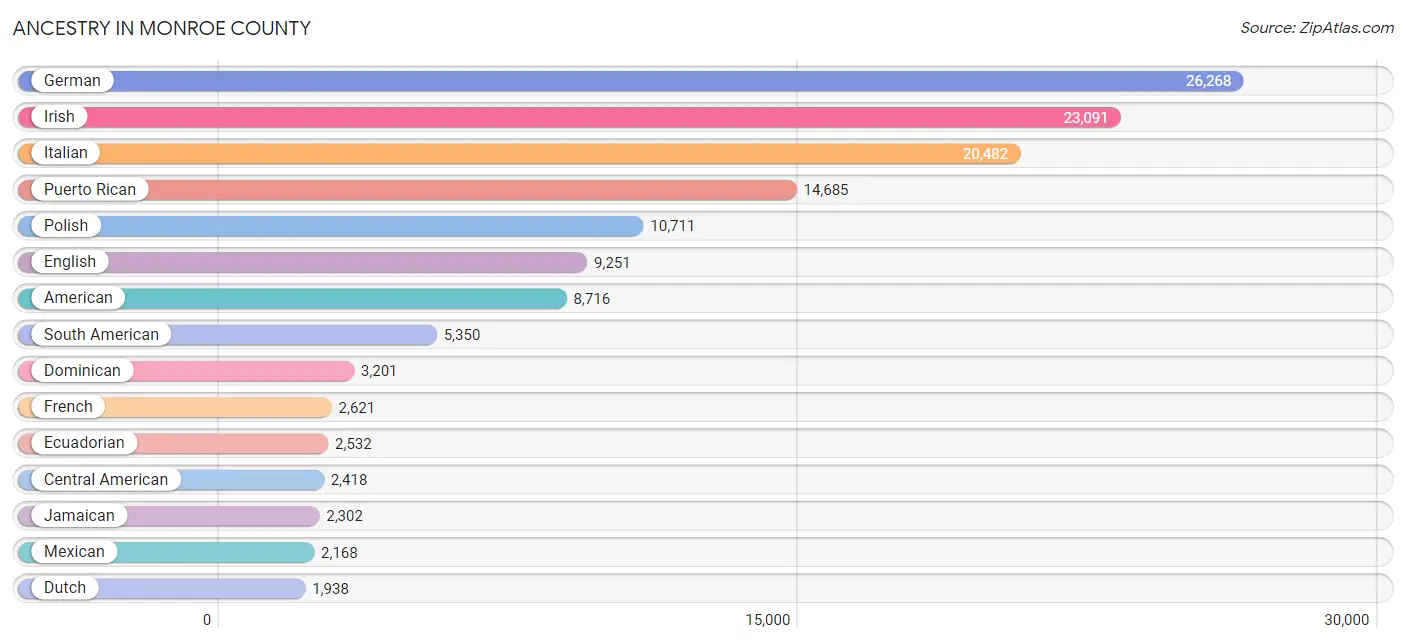
| Ancestry | # Population | % Population |
| Afghan | 32 | 0.0% |
| African | 1,016 | 0.6% |
| Albanian | 90 | 0.1% |
| Alsatian | 18 | 0.0% |
| American | 8,716 | 5.2% |
| Apache | 1 | 0.0% |
| Arab | 764 | 0.4% |
| Armenian | 145 | 0.1% |
| Austrian | 612 | 0.4% |
| Barbadian | 93 | 0.1% |
| Belgian | 372 | 0.2% |
| Belizean | 71 | 0.0% |
| Bermudan | 69 | 0.0% |
| Bhutanese | 219 | 0.1% |
| Blackfeet | 101 | 0.1% |
| Bolivian | 56 | 0.0% |
| Brazilian | 209 | 0.1% |
| British | 479 | 0.3% |
| British West Indian | 221 | 0.1% |
| Bulgarian | 174 | 0.1% |
| Burmese | 737 | 0.4% |
| Cajun | 36 | 0.0% |
| Cambodian | 41 | 0.0% |
| Canadian | 248 | 0.2% |
| Cape Verdean | 18 | 0.0% |
| Carpatho Rusyn | 51 | 0.0% |
| Central American | 2,418 | 1.4% |
| Central American Indian | 439 | 0.3% |
| Cherokee | 219 | 0.1% |
| Cheyenne | 7 | 0.0% |
| Chilean | 236 | 0.1% |
| Choctaw | 36 | 0.0% |
| Colombian | 1,195 | 0.7% |
| Comanche | 19 | 0.0% |
| Costa Rican | 49 | 0.0% |
| Creek | 3 | 0.0% |
| Croatian | 78 | 0.1% |
| Cuban | 429 | 0.3% |
| Cypriot | 86 | 0.1% |
| Czech | 537 | 0.3% |
| Czechoslovakian | 282 | 0.2% |
| Danish | 427 | 0.3% |
| Delaware | 136 | 0.1% |
| Dominican | 3,201 | 1.9% |
| Dutch | 1,938 | 1.1% |
| Eastern European | 591 | 0.4% |
| Ecuadorian | 2,532 | 1.5% |
| Egyptian | 85 | 0.1% |
| English | 9,251 | 5.5% |
| European | 1,527 | 0.9% |
| Finnish | 114 | 0.1% |
| French | 2,621 | 1.6% |
| French American Indian | 3 | 0.0% |
| French Canadian | 321 | 0.2% |
| German | 26,268 | 15.6% |
| Ghanaian | 29 | 0.0% |
| Greek | 1,530 | 0.9% |
| Guatemalan | 574 | 0.3% |
| Guyanese | 589 | 0.4% |
| Haitian | 900 | 0.5% |
| Honduran | 886 | 0.5% |
| Hungarian | 1,106 | 0.7% |
| Icelander | 13 | 0.0% |
| Indian (Asian) | 645 | 0.4% |
| Iranian | 14 | 0.0% |
| Irish | 23,091 | 13.7% |
| Iroquois | 59 | 0.0% |
| Israeli | 23 | 0.0% |
| Italian | 20,482 | 12.2% |
| Jamaican | 2,302 | 1.4% |
| Jordanian | 118 | 0.1% |
| Korean | 915 | 0.5% |
| Laotian | 2 | 0.0% |
| Lebanese | 161 | 0.1% |
| Liberian | 104 | 0.1% |
| Lithuanian | 428 | 0.3% |
| Macedonian | 8 | 0.0% |
| Malaysian | 56 | 0.0% |
| Maltese | 62 | 0.0% |
| Mexican | 2,168 | 1.3% |
| Mexican American Indian | 28 | 0.0% |
| Moroccan | 145 | 0.1% |
| Native Hawaiian | 57 | 0.0% |
| New Zealander | 21 | 0.0% |
| Nicaraguan | 23 | 0.0% |
| Nigerian | 66 | 0.0% |
| Northern European | 52 | 0.0% |
| Norwegian | 1,100 | 0.6% |
| Pakistani | 26 | 0.0% |
| Palestinian | 16 | 0.0% |
| Panamanian | 250 | 0.2% |
| Pennsylvania German | 1,927 | 1.1% |
| Peruvian | 1,116 | 0.7% |
| Pima | 5 | 0.0% |
| Polish | 10,711 | 6.4% |
| Portuguese | 1,395 | 0.8% |
| Puerto Rican | 14,685 | 8.7% |
| Romanian | 211 | 0.1% |
| Russian | 1,532 | 0.9% |
| Salvadoran | 613 | 0.4% |
| Scandinavian | 141 | 0.1% |
| Scotch-Irish | 525 | 0.3% |
| Scottish | 1,863 | 1.1% |
| Seminole | 13 | 0.0% |
| Serbian | 8 | 0.0% |
| Sioux | 195 | 0.1% |
| Slavic | 51 | 0.0% |
| Slovak | 1,232 | 0.7% |
| Slovene | 56 | 0.0% |
| South African | 7 | 0.0% |
| South American | 5,350 | 3.2% |
| South American Indian | 194 | 0.1% |
| Soviet Union | 22 | 0.0% |
| Spaniard | 439 | 0.3% |
| Spanish | 341 | 0.2% |
| Sri Lankan | 287 | 0.2% |
| Subsaharan African | 1,326 | 0.8% |
| Swedish | 999 | 0.6% |
| Swiss | 222 | 0.1% |
| Syrian | 64 | 0.0% |
| Thai | 1,894 | 1.1% |
| Trinidadian and Tobagonian | 557 | 0.3% |
| Turkish | 170 | 0.1% |
| Ukrainian | 560 | 0.3% |
| Venezuelan | 215 | 0.1% |
| Vietnamese | 407 | 0.2% |
| Welsh | 1,448 | 0.9% |
| West Indian | 885 | 0.5% |
| Yugoslavian | 60 | 0.0% | View All 129 Rows |
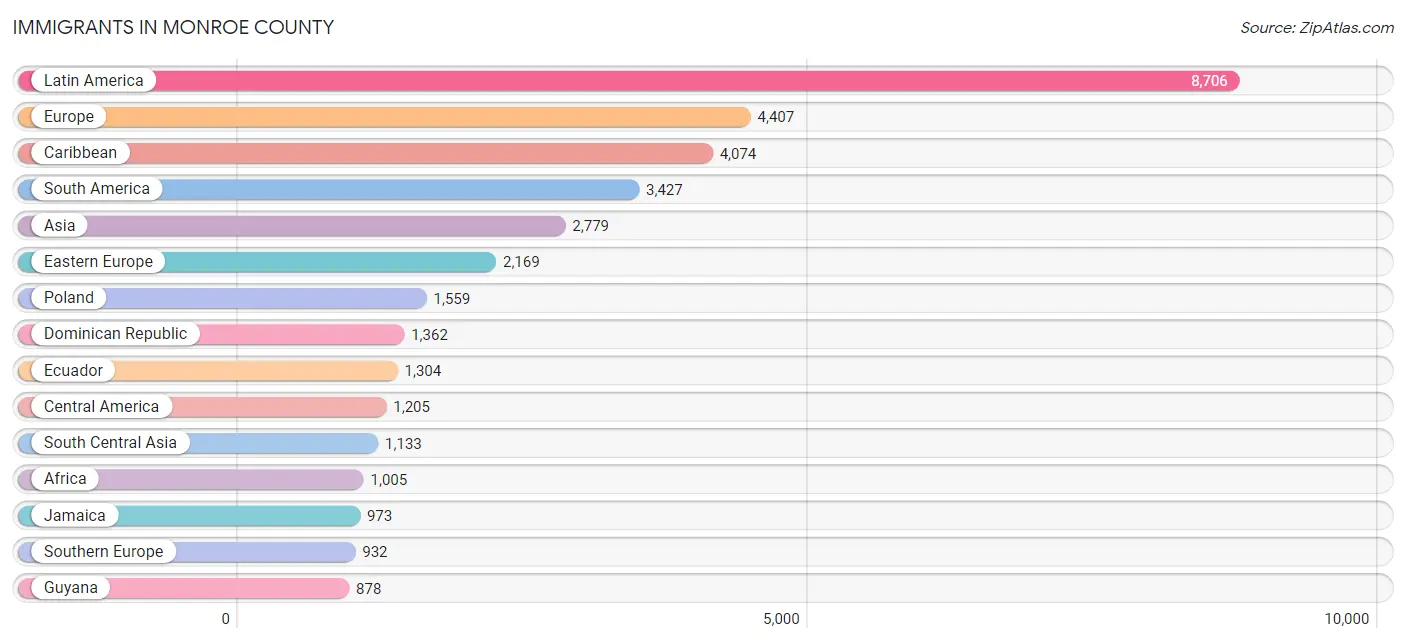
Immigrants in Monroe County
The most numerous immigrant groups reported in Monroe County came from Latin America (8,706 | 5.2%), Europe (4,407 | 2.6%), Caribbean (4,074 | 2.4%), South America (3,427 | 2.0%), and Asia (2,779 | 1.7%), together accounting for 13.9% of all Monroe County residents.
| Immigration Origin | # Population | % Population |
| Afghanistan | 32 | 0.0% |
| Africa | 1,005 | 0.6% |
| Asia | 2,779 | 1.7% |
| Australia | 83 | 0.1% |
| Austria | 12 | 0.0% |
| Bahamas | 30 | 0.0% |
| Bangladesh | 193 | 0.1% |
| Barbados | 60 | 0.0% |
| Belarus | 4 | 0.0% |
| Belgium | 8 | 0.0% |
| Belize | 56 | 0.0% |
| Bolivia | 56 | 0.0% |
| Brazil | 193 | 0.1% |
| Bulgaria | 165 | 0.1% |
| Canada | 157 | 0.1% |
| Caribbean | 4,074 | 2.4% |
| Central America | 1,205 | 0.7% |
| Chile | 134 | 0.1% |
| China | 282 | 0.2% |
| Colombia | 430 | 0.3% |
| Costa Rica | 35 | 0.0% |
| Cuba | 153 | 0.1% |
| Czechoslovakia | 75 | 0.0% |
| Denmark | 30 | 0.0% |
| Dominica | 14 | 0.0% |
| Dominican Republic | 1,362 | 0.8% |
| Eastern Africa | 103 | 0.1% |
| Eastern Asia | 696 | 0.4% |
| Eastern Europe | 2,169 | 1.3% |
| Ecuador | 1,304 | 0.8% |
| Egypt | 69 | 0.0% |
| El Salvador | 154 | 0.1% |
| England | 320 | 0.2% |
| Europe | 4,407 | 2.6% |
| France | 10 | 0.0% |
| Germany | 540 | 0.3% |
| Ghana | 157 | 0.1% |
| Greece | 311 | 0.2% |
| Grenada | 226 | 0.1% |
| Guatemala | 281 | 0.2% |
| Guyana | 878 | 0.5% |
| Haiti | 355 | 0.2% |
| Honduras | 167 | 0.1% |
| Hong Kong | 65 | 0.0% |
| Hungary | 19 | 0.0% |
| India | 548 | 0.3% |
| Indonesia | 2 | 0.0% |
| Iran | 14 | 0.0% |
| Ireland | 106 | 0.1% |
| Israel | 23 | 0.0% |
| Italy | 247 | 0.2% |
| Jamaica | 973 | 0.6% |
| Japan | 8 | 0.0% |
| Jordan | 60 | 0.0% |
| Korea | 406 | 0.2% |
| Latin America | 8,706 | 5.2% |
| Latvia | 32 | 0.0% |
| Liberia | 104 | 0.1% |
| Mexico | 366 | 0.2% |
| Middle Africa | 21 | 0.0% |
| Morocco | 145 | 0.1% |
| Netherlands | 10 | 0.0% |
| Nicaragua | 23 | 0.0% |
| Nigeria | 224 | 0.1% |
| North Macedonia | 8 | 0.0% |
| Northern Africa | 266 | 0.2% |
| Northern Europe | 715 | 0.4% |
| Norway | 13 | 0.0% |
| Oceania | 93 | 0.1% |
| Pakistan | 272 | 0.2% |
| Panama | 123 | 0.1% |
| Peru | 196 | 0.1% |
| Philippines | 475 | 0.3% |
| Poland | 1,559 | 0.9% |
| Portugal | 289 | 0.2% |
| Romania | 40 | 0.0% |
| Russia | 124 | 0.1% |
| Saudi Arabia | 16 | 0.0% |
| Scotland | 116 | 0.1% |
| Serbia | 67 | 0.0% |
| South America | 3,427 | 2.0% |
| South Central Asia | 1,133 | 0.7% |
| South Eastern Asia | 597 | 0.4% |
| Southern Europe | 932 | 0.5% |
| Spain | 85 | 0.1% |
| Sri Lanka | 11 | 0.0% |
| St. Vincent and the Grenadines | 174 | 0.1% |
| Switzerland | 11 | 0.0% |
| Syria | 34 | 0.0% |
| Taiwan | 27 | 0.0% |
| Thailand | 18 | 0.0% |
| Trinidad and Tobago | 365 | 0.2% |
| Turkey | 119 | 0.1% |
| Uganda | 50 | 0.0% |
| Ukraine | 36 | 0.0% |
| Venezuela | 217 | 0.1% |
| Vietnam | 102 | 0.1% |
| West Indies | 124 | 0.1% |
| Western Africa | 608 | 0.4% |
| Western Asia | 353 | 0.2% |
| Western Europe | 591 | 0.4% | View All 101 Rows |
Sex and Age in Monroe County
Sex and Age in Monroe County
The most populous age groups in Monroe County are 60 to 64 Years (6,986 | 8.3%) for men and 55 to 59 Years (7,311 | 8.7%) for women.
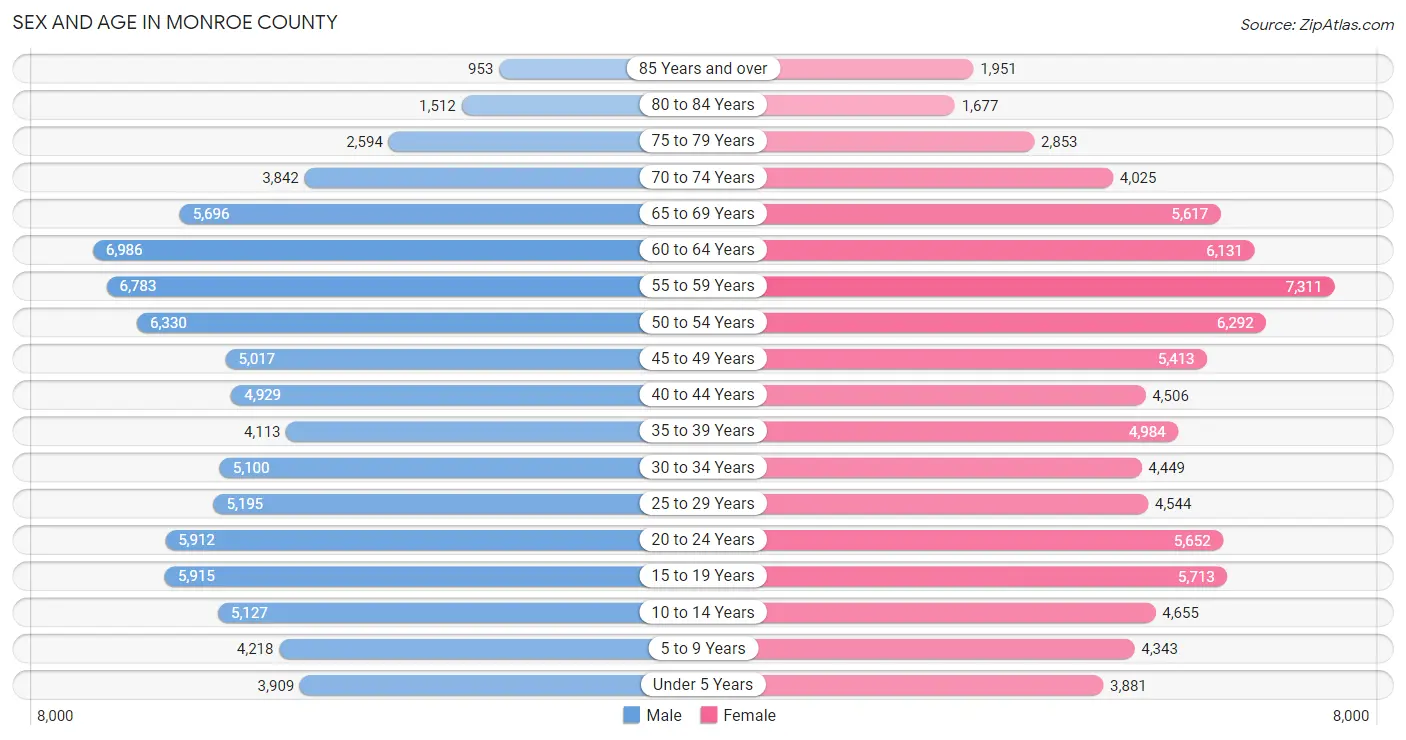
| Age Bracket | Male | Female |
| Under 5 Years | 3,909 (4.6%) | 3,881 (4.6%) |
| 5 to 9 Years | 4,218 (5.0%) | 4,343 (5.2%) |
| 10 to 14 Years | 5,127 (6.1%) | 4,655 (5.5%) |
| 15 to 19 Years | 5,915 (7.0%) | 5,713 (6.8%) |
| 20 to 24 Years | 5,912 (7.0%) | 5,652 (6.7%) |
| 25 to 29 Years | 5,195 (6.2%) | 4,544 (5.4%) |
| 30 to 34 Years | 5,100 (6.1%) | 4,449 (5.3%) |
| 35 to 39 Years | 4,113 (4.9%) | 4,984 (5.9%) |
| 40 to 44 Years | 4,929 (5.9%) | 4,506 (5.4%) |
| 45 to 49 Years | 5,017 (6.0%) | 5,413 (6.4%) |
| 50 to 54 Years | 6,330 (7.5%) | 6,292 (7.5%) |
| 55 to 59 Years | 6,783 (8.1%) | 7,311 (8.7%) |
| 60 to 64 Years | 6,986 (8.3%) | 6,131 (7.3%) |
| 65 to 69 Years | 5,696 (6.8%) | 5,617 (6.7%) |
| 70 to 74 Years | 3,842 (4.6%) | 4,025 (4.8%) |
| 75 to 79 Years | 2,594 (3.1%) | 2,853 (3.4%) |
| 80 to 84 Years | 1,512 (1.8%) | 1,677 (2.0%) |
| 85 Years and over | 953 (1.1%) | 1,951 (2.3%) |
| Total | 84,131 (100.0%) | 83,997 (100.0%) |
Families and Households in Monroe County
Median Family Size in Monroe County
The median family size in Monroe County is 3.30 persons per family, with single female/mother families (7,148 | 16.9%) accounting for the largest median family size of 3.39 persons per family. On the other hand, single male/father families (3,068 | 7.3%) represent the smallest median family size with 3.15 persons per family.
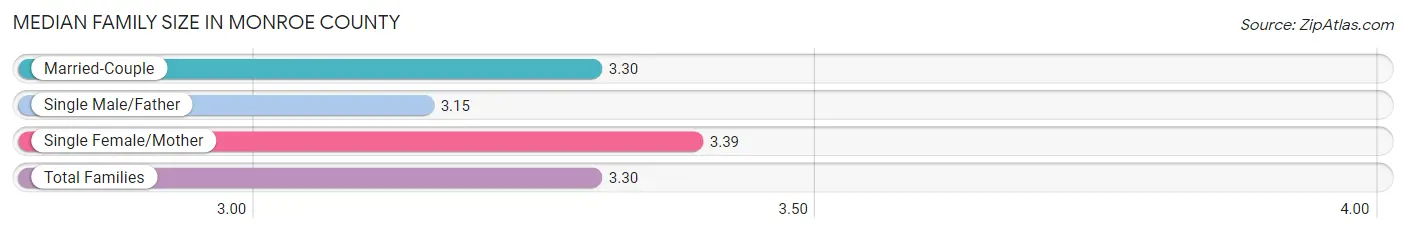
| Family Type | # Families | Family Size |
| Married-Couple | 31,975 (75.8%) | 3.30 |
| Single Male/Father | 3,068 (7.3%) | 3.15 |
| Single Female/Mother | 7,148 (16.9%) | 3.39 |
| Total Families | 42,191 (100.0%) | 3.30 |
Median Household Size in Monroe County
The median household size in Monroe County is 2.80 persons per household, with single female/mother households (7,148 | 12.1%) accounting for the largest median household size of 3.75 persons per household. non-family households (16,922 | 28.6%) represent the smallest median household size with 1.28 persons per household.
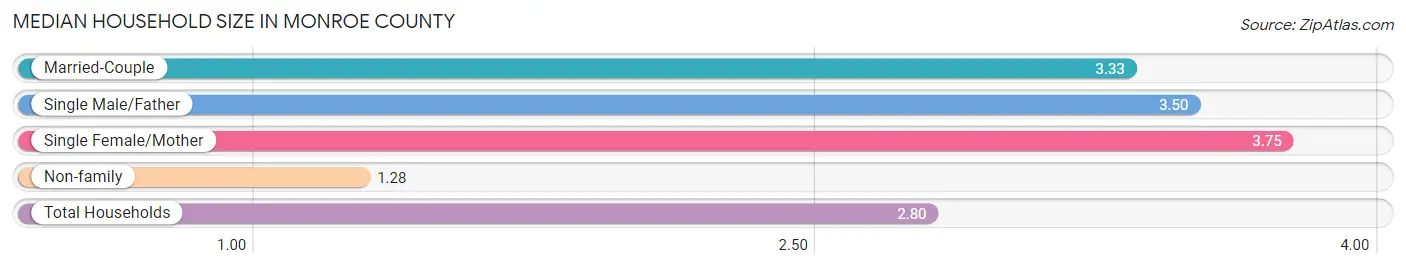
| Household Type | # Households | Household Size |
| Married-Couple | 31,975 (54.1%) | 3.33 |
| Single Male/Father | 3,068 (5.2%) | 3.50 |
| Single Female/Mother | 7,148 (12.1%) | 3.75 |
| Non-family | 16,922 (28.6%) | 1.28 |
| Total Households | 59,113 (100.0%) | 2.80 |
Household Size by Marriage Status in Monroe County
Out of a total of 59,113 households in Monroe County, 42,191 (71.4%) are family households, while 16,922 (28.6%) are nonfamily households. The most numerous type of family households are 2-person households, comprising 17,266, and the most common type of nonfamily households are 1-person households, comprising 13,223.
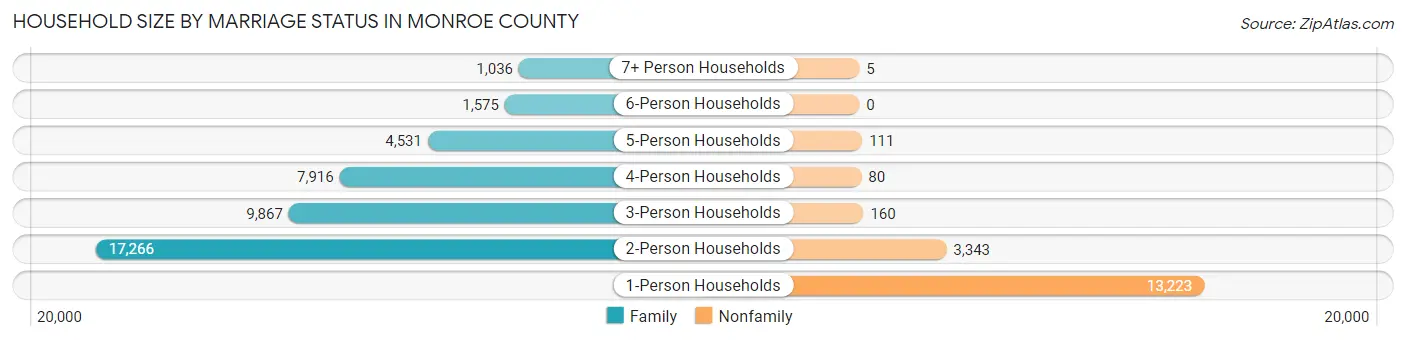
| Household Size | Family Households | Nonfamily Households |
| 1-Person Households | - | 13,223 (22.4%) |
| 2-Person Households | 17,266 (29.2%) | 3,343 (5.7%) |
| 3-Person Households | 9,867 (16.7%) | 160 (0.3%) |
| 4-Person Households | 7,916 (13.4%) | 80 (0.1%) |
| 5-Person Households | 4,531 (7.7%) | 111 (0.2%) |
| 6-Person Households | 1,575 (2.7%) | 0 (0.0%) |
| 7+ Person Households | 1,036 (1.8%) | 5 (0.0%) |
| Total | 42,191 (71.4%) | 16,922 (28.6%) |
Female Fertility in Monroe County
Fertility by Age in Monroe County
Average fertility rate in Monroe County is 59.0 births per 1,000 women. Women in the age bracket of 20 to 34 years have the highest fertility rate with 83.0 births per 1,000 women. Women in the age bracket of 20 to 34 years acount for 56.9% of all women with births.
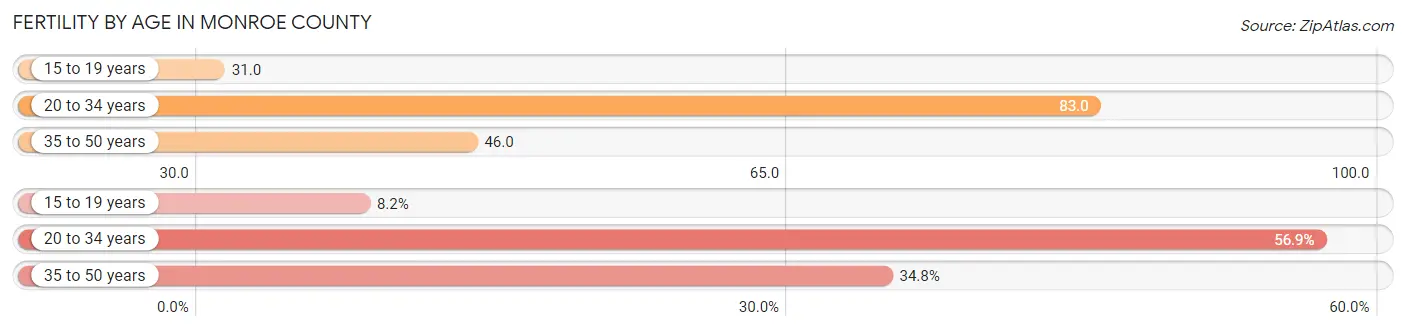
| Age Bracket | Women with Births | Births / 1,000 Women |
| 15 to 19 years | 177 (8.2%) | 31.0 |
| 20 to 34 years | 1,222 (56.9%) | 83.0 |
| 35 to 50 years | 748 (34.8%) | 46.0 |
| Total | 2,147 (100.0%) | 59.0 |
Fertility by Age by Marriage Status in Monroe County
56.2% of women with births (2,147) in Monroe County are married. The highest percentage of unmarried women with births falls into 15 to 19 years age bracket with 80.8% of them unmarried at the time of birth, while the lowest percentage of unmarried women with births belong to 35 to 50 years age bracket with 32.1% of them unmarried.
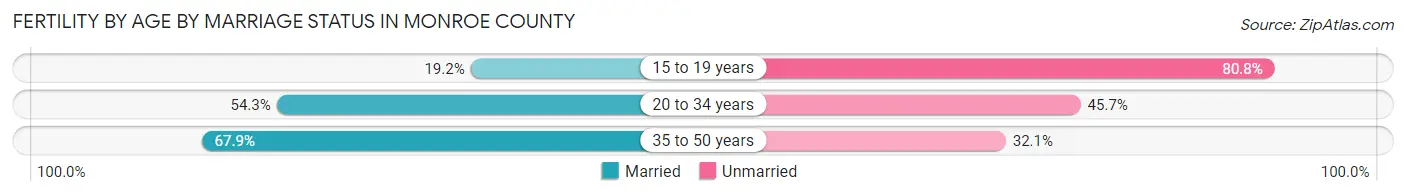
| Age Bracket | Married | Unmarried |
| 15 to 19 years | 34 (19.2%) | 143 (80.8%) |
| 20 to 34 years | 664 (54.3%) | 558 (45.7%) |
| 35 to 50 years | 508 (67.9%) | 240 (32.1%) |
| Total | 1,207 (56.2%) | 940 (43.8%) |
Fertility by Education in Monroe County
Average fertility rate in Monroe County is 59.0 births per 1,000 women. Women with the education attainment of high school diploma have the highest fertility rate of 76.0 births per 1,000 women, while women with the education attainment of less than high school have the lowest fertility at 24.0 births per 1,000 women. Women with the education attainment of college or associate's degree represent 37.0% of all women with births.
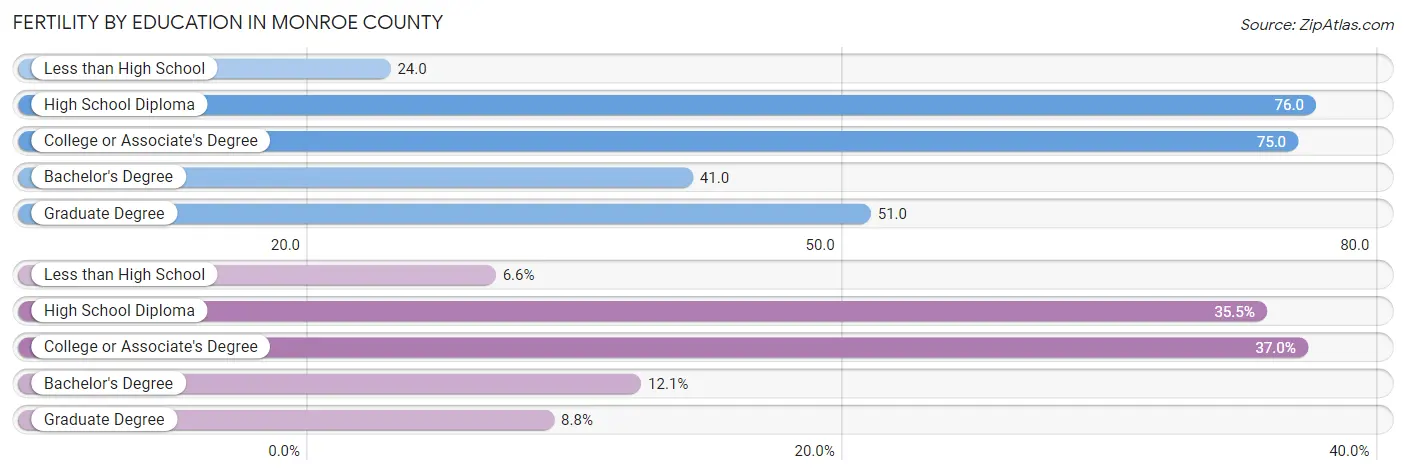
| Educational Attainment | Women with Births | Births / 1,000 Women |
| Less than High School | 142 (6.6%) | 24.0 |
| High School Diploma | 762 (35.5%) | 76.0 |
| College or Associate's Degree | 795 (37.0%) | 75.0 |
| Bachelor's Degree | 259 (12.1%) | 41.0 |
| Graduate Degree | 189 (8.8%) | 51.0 |
| Total | 2,147 (100.0%) | 59.0 |
Fertility by Education by Marriage Status in Monroe County
43.8% of women with births in Monroe County are unmarried. Women with the educational attainment of bachelor's degree are most likely to be married with 100.0% of them married at childbirth, while women with the educational attainment of less than high school are least likely to be married with 76.8% of them unmarried at childbirth.
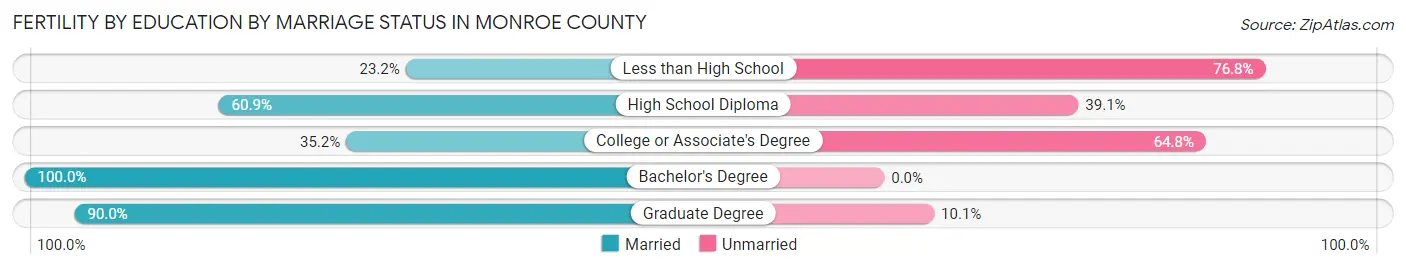
| Educational Attainment | Married | Unmarried |
| Less than High School | 33 (23.2%) | 109 (76.8%) |
| High School Diploma | 464 (60.9%) | 298 (39.1%) |
| College or Associate's Degree | 280 (35.2%) | 515 (64.8%) |
| Bachelor's Degree | 259 (100.0%) | 0 (0.0%) |
| Graduate Degree | 170 (89.9%) | 19 (10.1%) |
| Total | 1,207 (56.2%) | 940 (43.8%) |
Employment Characteristics in Monroe County
Employment by Class of Employer in Monroe County
Among the 77,614 employed individuals in Monroe County, private company employees (54,741 | 70.5%), not-for-profit organizations (6,327 | 8.2%), and local government employees (5,896 | 7.6%) make up the most common classes of employment.
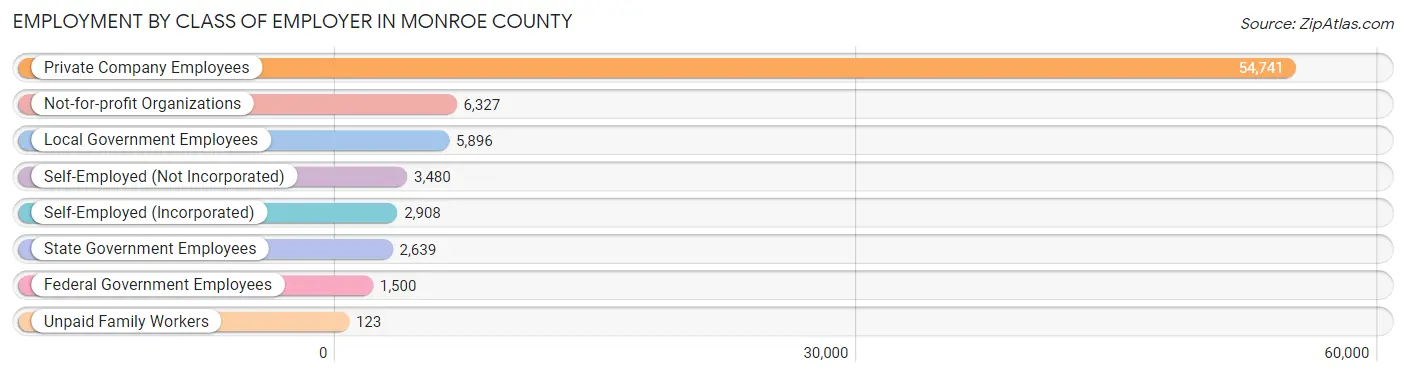
| Employer Class | # Employees | % Employees |
| Private Company Employees | 54,741 | 70.5% |
| Self-Employed (Incorporated) | 2,908 | 3.7% |
| Self-Employed (Not Incorporated) | 3,480 | 4.5% |
| Not-for-profit Organizations | 6,327 | 8.2% |
| Local Government Employees | 5,896 | 7.6% |
| State Government Employees | 2,639 | 3.4% |
| Federal Government Employees | 1,500 | 1.9% |
| Unpaid Family Workers | 123 | 0.2% |
| Total | 77,614 | 100.0% |
Employment Status by Age in Monroe County
According to the labor force statistics for Monroe County, out of the total population over 16 years of age (139,579), 60.6% or 84,585 individuals are in the labor force, with 6.3% or 5,329 of them unemployed. The age group with the highest labor force participation rate is 25 to 29 years, with 85.2% or 8,298 individuals in the labor force. Within the labor force, the 16 to 19 years age range has the highest percentage of unemployed individuals, with 17.3% or 685 of them being unemployed.
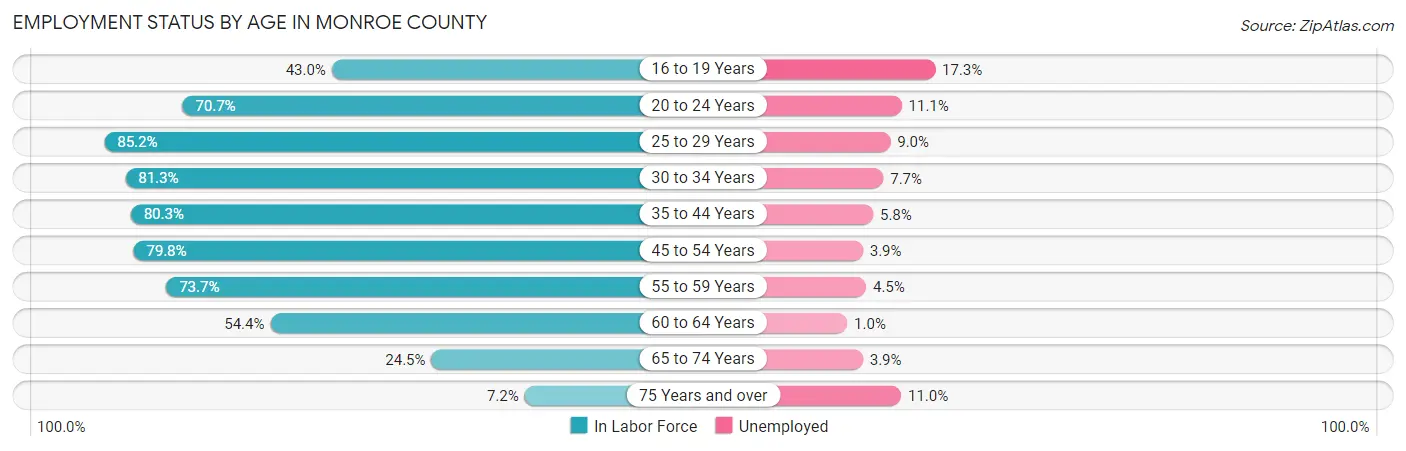
| Age Bracket | In Labor Force | Unemployed |
| 16 to 19 Years | 3,961 (43.0%) | 685 (17.3%) |
| 20 to 24 Years | 8,176 (70.7%) | 908 (11.1%) |
| 25 to 29 Years | 8,298 (85.2%) | 747 (9.0%) |
| 30 to 34 Years | 7,763 (81.3%) | 598 (7.7%) |
| 35 to 44 Years | 14,881 (80.3%) | 863 (5.8%) |
| 45 to 54 Years | 18,395 (79.8%) | 717 (3.9%) |
| 55 to 59 Years | 10,387 (73.7%) | 467 (4.5%) |
| 60 to 64 Years | 7,136 (54.4%) | 71 (1.0%) |
| 65 to 74 Years | 4,699 (24.5%) | 183 (3.9%) |
| 75 Years and over | 831 (7.2%) | 91 (11.0%) |
| Total | 84,585 (60.6%) | 5,329 (6.3%) |
Employment Status by Educational Attainment in Monroe County
According to labor force statistics for Monroe County, 75.9% of individuals (66,855) out of the total population between 25 and 64 years of age (88,083) are in the labor force, with 5.2% or 3,476 of them being unemployed. The group with the highest labor force participation rate are those with the educational attainment of bachelor's degree or higher, with 83.1% or 19,695 individuals in the labor force. Within the labor force, individuals with high school diploma education have the highest percentage of unemployment, with 8.0% or 1,855 of them being unemployed.
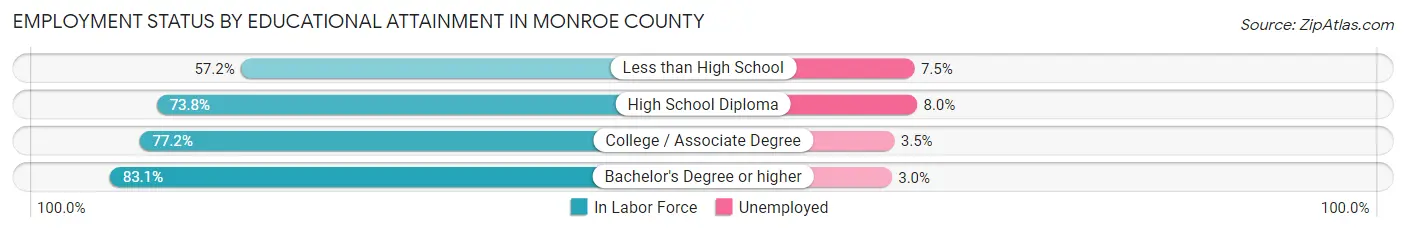
| Educational Attainment | In Labor Force | Unemployed |
| Less than High School | 4,184 (57.2%) | 549 (7.5%) |
| High School Diploma | 23,186 (73.8%) | 2,513 (8.0%) |
| College / Associate Degree | 19,802 (77.2%) | 898 (3.5%) |
| Bachelor's Degree or higher | 19,695 (83.1%) | 711 (3.0%) |
| Total | 66,855 (75.9%) | 4,580 (5.2%) |
Employment Occupations by Sex in Monroe County
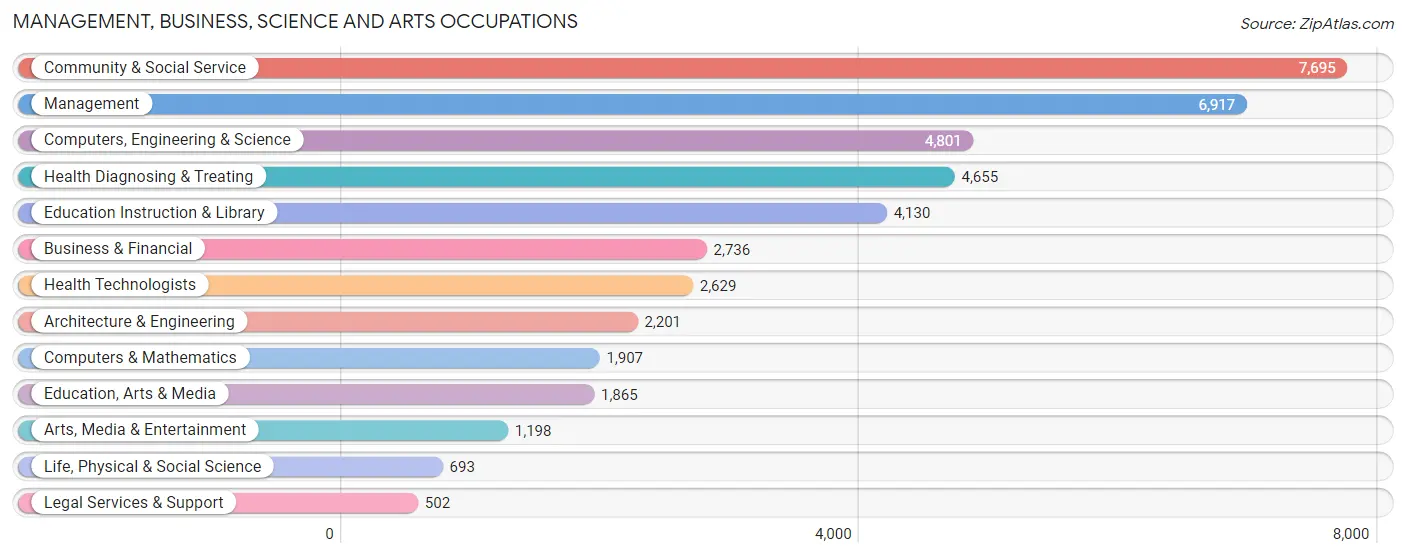
Management, Business, Science and Arts Occupations
The most common Management, Business, Science and Arts occupations in Monroe County are Community & Social Service (7,695 | 9.7%), Management (6,917 | 8.7%), Computers, Engineering & Science (4,801 | 6.1%), Health Diagnosing & Treating (4,655 | 5.9%), and Education Instruction & Library (4,130 | 5.2%).
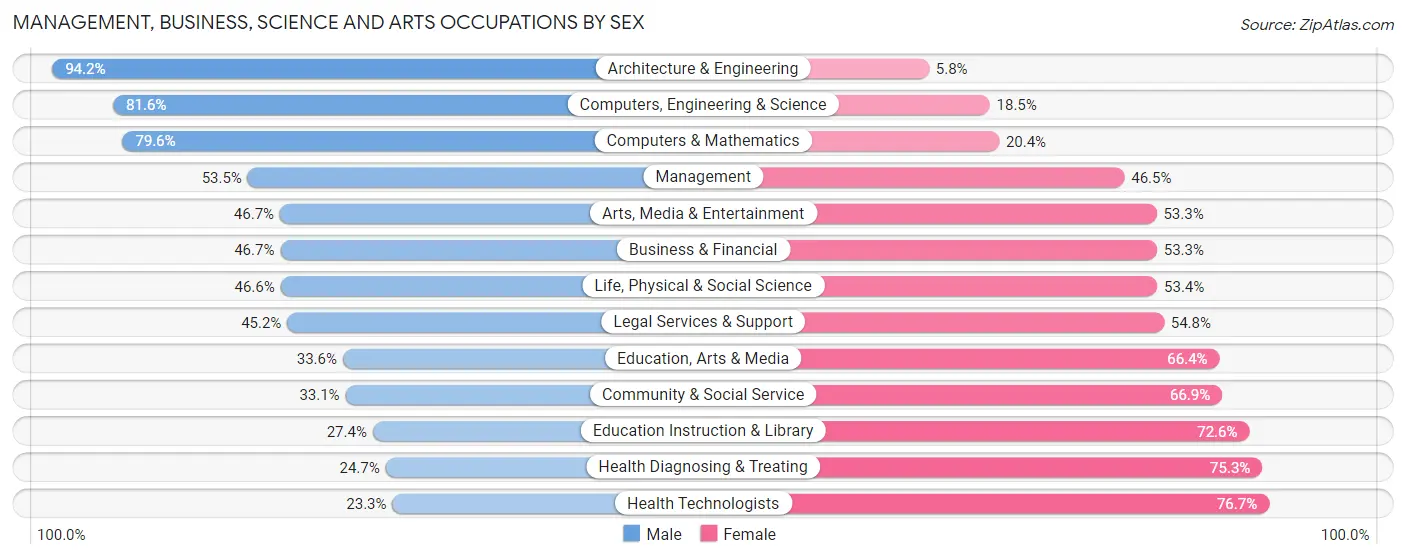
Management, Business, Science and Arts Occupations by Sex
Within the Management, Business, Science and Arts occupations in Monroe County, the most male-oriented occupations are Architecture & Engineering (94.2%), Computers, Engineering & Science (81.6%), and Computers & Mathematics (79.6%), while the most female-oriented occupations are Health Technologists (76.7%), Health Diagnosing & Treating (75.3%), and Education Instruction & Library (72.6%).
| Occupation | Male | Female |
| Management | 3,698 (53.5%) | 3,219 (46.5%) |
| Business & Financial | 1,277 (46.7%) | 1,459 (53.3%) |
| Computers, Engineering & Science | 3,915 (81.6%) | 886 (18.4%) |
| Computers & Mathematics | 1,518 (79.6%) | 389 (20.4%) |
| Architecture & Engineering | 2,074 (94.2%) | 127 (5.8%) |
| Life, Physical & Social Science | 323 (46.6%) | 370 (53.4%) |
| Community & Social Service | 2,545 (33.1%) | 5,150 (66.9%) |
| Education, Arts & Media | 627 (33.6%) | 1,238 (66.4%) |
| Legal Services & Support | 227 (45.2%) | 275 (54.8%) |
| Education Instruction & Library | 1,131 (27.4%) | 2,999 (72.6%) |
| Arts, Media & Entertainment | 560 (46.7%) | 638 (53.3%) |
| Health Diagnosing & Treating | 1,150 (24.7%) | 3,505 (75.3%) |
| Health Technologists | 612 (23.3%) | 2,017 (76.7%) |
| Total (Category) | 12,585 (46.9%) | 14,219 (53.0%) |
| Total (Overall) | 42,949 (54.2%) | 36,219 (45.8%) |
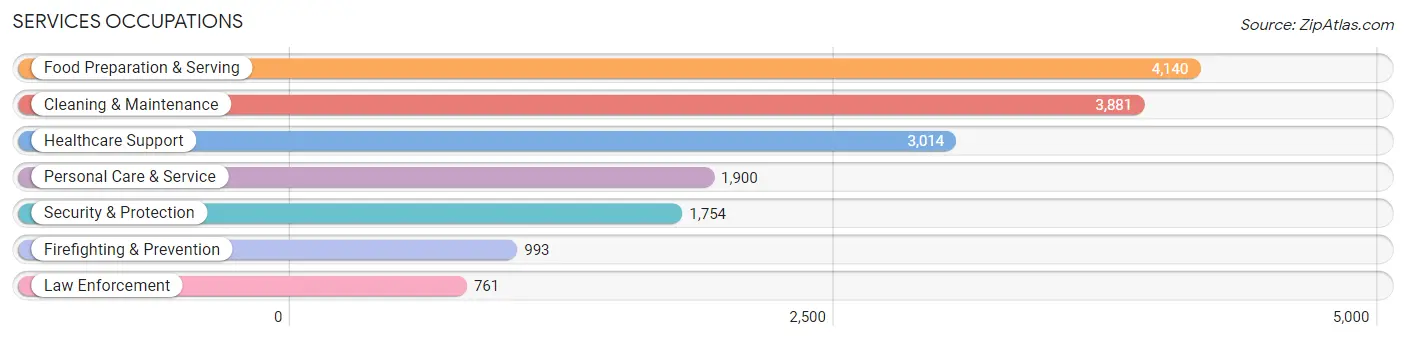
Services Occupations
The most common Services occupations in Monroe County are Food Preparation & Serving (4,140 | 5.2%), Cleaning & Maintenance (3,881 | 4.9%), Healthcare Support (3,014 | 3.8%), Personal Care & Service (1,900 | 2.4%), and Security & Protection (1,754 | 2.2%).
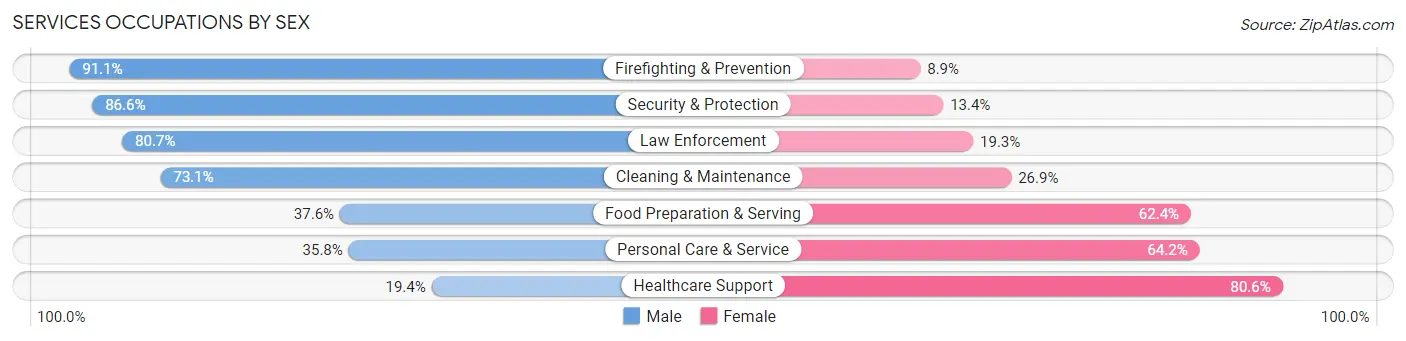
Services Occupations by Sex
Within the Services occupations in Monroe County, the most male-oriented occupations are Firefighting & Prevention (91.1%), Security & Protection (86.6%), and Law Enforcement (80.7%), while the most female-oriented occupations are Healthcare Support (80.6%), Personal Care & Service (64.2%), and Food Preparation & Serving (62.4%).
| Occupation | Male | Female |
| Healthcare Support | 585 (19.4%) | 2,429 (80.6%) |
| Security & Protection | 1,519 (86.6%) | 235 (13.4%) |
| Firefighting & Prevention | 905 (91.1%) | 88 (8.9%) |
| Law Enforcement | 614 (80.7%) | 147 (19.3%) |
| Food Preparation & Serving | 1,555 (37.6%) | 2,585 (62.4%) |
| Cleaning & Maintenance | 2,838 (73.1%) | 1,043 (26.9%) |
| Personal Care & Service | 681 (35.8%) | 1,219 (64.2%) |
| Total (Category) | 7,178 (48.9%) | 7,511 (51.1%) |
| Total (Overall) | 42,949 (54.2%) | 36,219 (45.8%) |
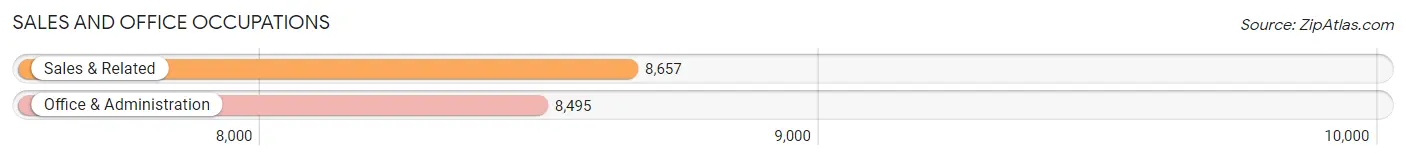
Sales and Office Occupations
The most common Sales and Office occupations in Monroe County are Sales & Related (8,657 | 10.9%), and Office & Administration (8,495 | 10.7%).
Sales and Office Occupations by Sex
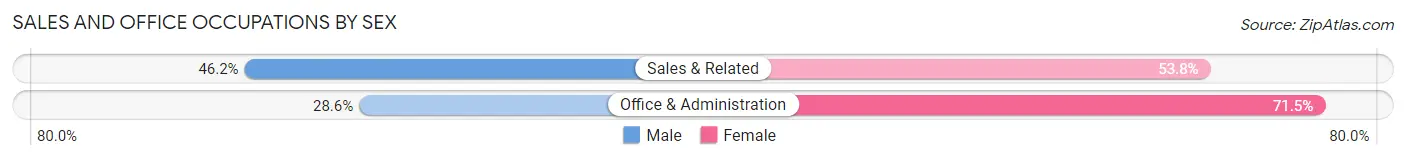
| Occupation | Male | Female |
| Sales & Related | 3,998 (46.2%) | 4,659 (53.8%) |
| Office & Administration | 2,425 (28.5%) | 6,070 (71.5%) |
| Total (Category) | 6,423 (37.4%) | 10,729 (62.5%) |
| Total (Overall) | 42,949 (54.2%) | 36,219 (45.8%) |
Natural Resources, Construction and Maintenance Occupations
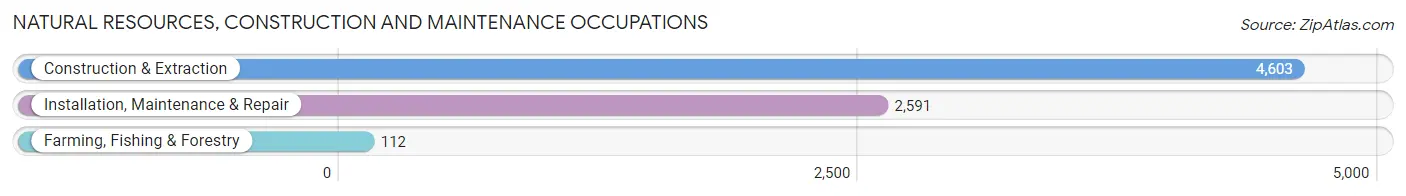
The most common Natural Resources, Construction and Maintenance occupations in Monroe County are Construction & Extraction (4,603 | 5.8%), Installation, Maintenance & Repair (2,591 | 3.3%), and Farming, Fishing & Forestry (112 | 0.1%).
Natural Resources, Construction and Maintenance Occupations by Sex
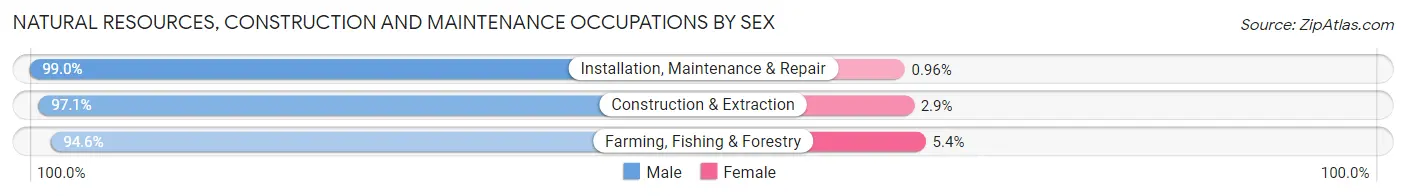
| Occupation | Male | Female |
| Farming, Fishing & Forestry | 106 (94.6%) | 6 (5.4%) |
| Construction & Extraction | 4,471 (97.1%) | 132 (2.9%) |
| Installation, Maintenance & Repair | 2,566 (99.0%) | 25 (1.0%) |
| Total (Category) | 7,143 (97.8%) | 163 (2.2%) |
| Total (Overall) | 42,949 (54.2%) | 36,219 (45.8%) |
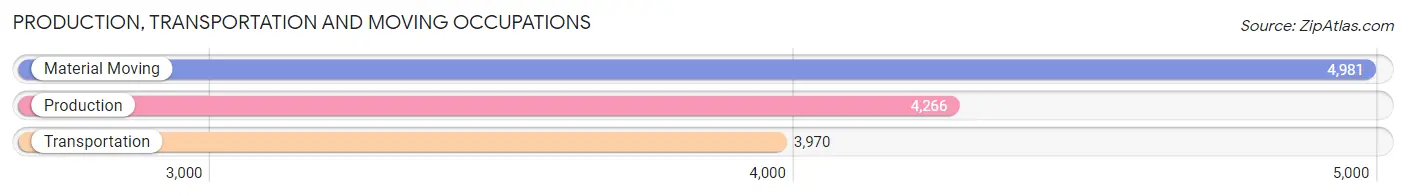
Production, Transportation and Moving Occupations
The most common Production, Transportation and Moving occupations in Monroe County are Material Moving (4,981 | 6.3%), Production (4,266 | 5.4%), and Transportation (3,970 | 5.0%).
Production, Transportation and Moving Occupations by Sex
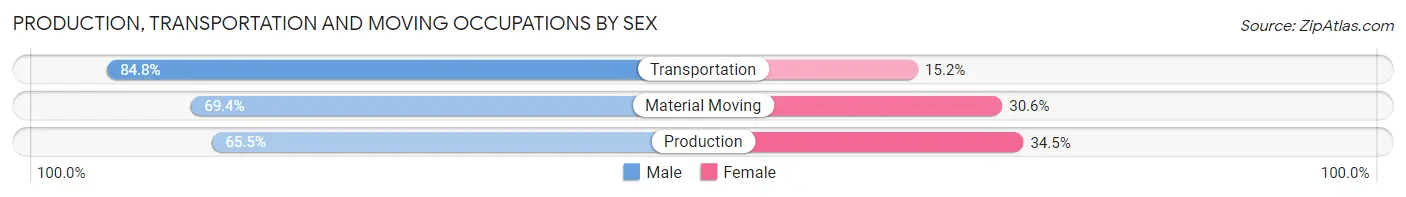
| Occupation | Male | Female |
| Production | 2,795 (65.5%) | 1,471 (34.5%) |
| Transportation | 3,368 (84.8%) | 602 (15.2%) |
| Material Moving | 3,457 (69.4%) | 1,524 (30.6%) |
| Total (Category) | 9,620 (72.8%) | 3,597 (27.2%) |
| Total (Overall) | 42,949 (54.2%) | 36,219 (45.8%) |
Employment Industries by Sex in Monroe County
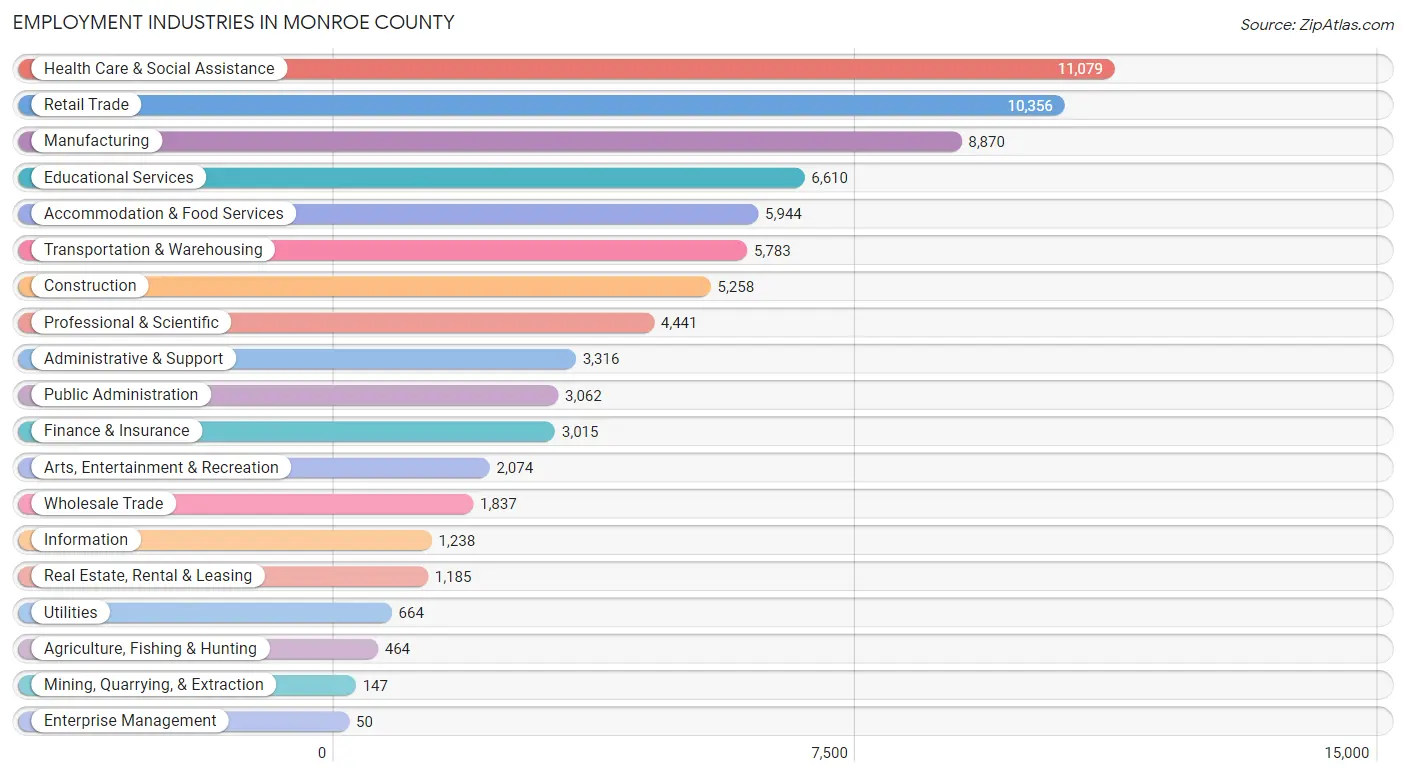
Employment Industries in Monroe County
The major employment industries in Monroe County include Health Care & Social Assistance (11,079 | 14.0%), Retail Trade (10,356 | 13.1%), Manufacturing (8,870 | 11.2%), Educational Services (6,610 | 8.4%), and Accommodation & Food Services (5,944 | 7.5%).
Employment Industries by Sex in Monroe County
The Monroe County industries that see more men than women are Construction (91.3%), Agriculture, Fishing & Hunting (80.6%), and Transportation & Warehousing (76.3%), whereas the industries that tend to have a higher number of women are Enterprise Management (100.0%), Health Care & Social Assistance (74.4%), and Educational Services (59.3%).
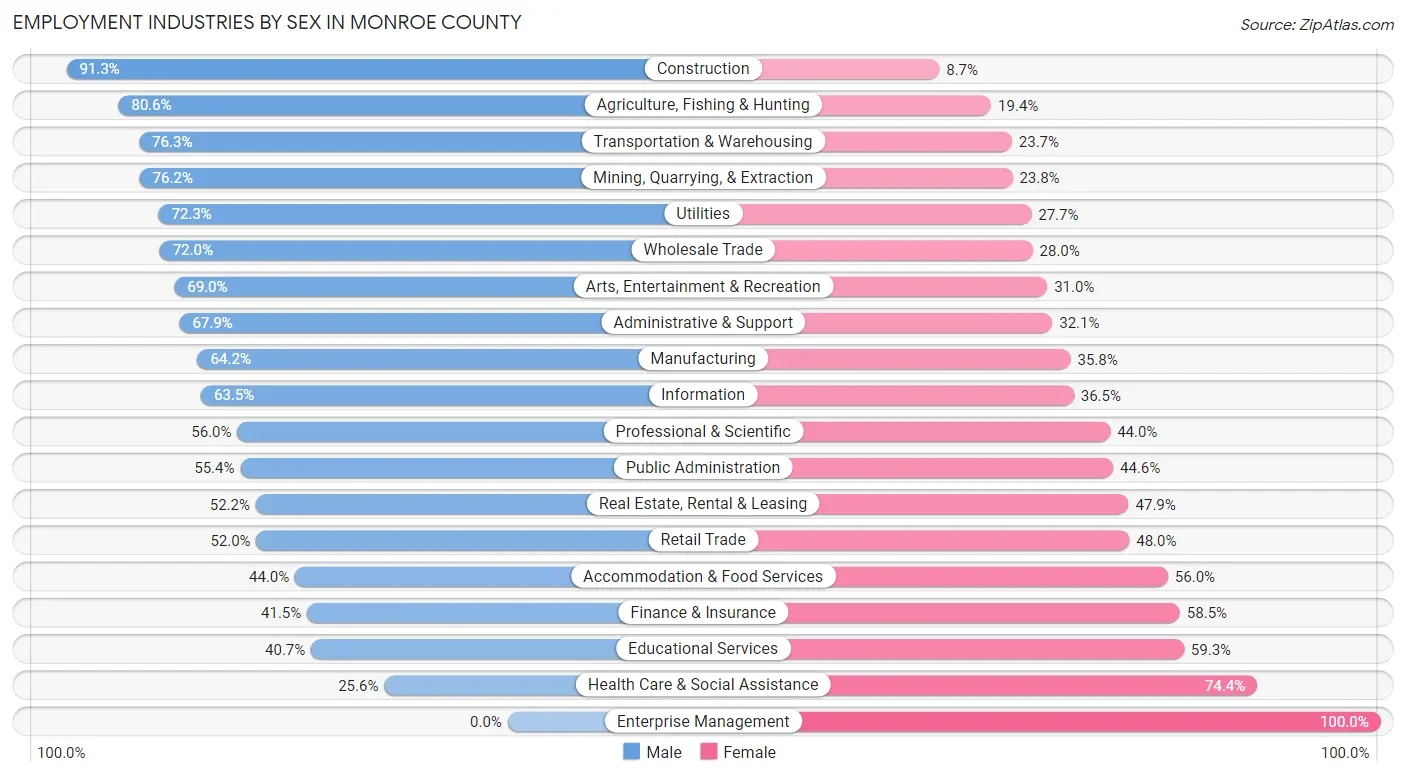
| Industry | Male | Female |
| Agriculture, Fishing & Hunting | 374 (80.6%) | 90 (19.4%) |
| Mining, Quarrying, & Extraction | 112 (76.2%) | 35 (23.8%) |
| Construction | 4,802 (91.3%) | 456 (8.7%) |
| Manufacturing | 5,692 (64.2%) | 3,178 (35.8%) |
| Wholesale Trade | 1,323 (72.0%) | 514 (28.0%) |
| Retail Trade | 5,386 (52.0%) | 4,970 (48.0%) |
| Transportation & Warehousing | 4,413 (76.3%) | 1,370 (23.7%) |
| Utilities | 480 (72.3%) | 184 (27.7%) |
| Information | 786 (63.5%) | 452 (36.5%) |
| Finance & Insurance | 1,252 (41.5%) | 1,763 (58.5%) |
| Real Estate, Rental & Leasing | 618 (52.1%) | 567 (47.8%) |
| Professional & Scientific | 2,485 (56.0%) | 1,956 (44.0%) |
| Enterprise Management | 0 (0.0%) | 50 (100.0%) |
| Administrative & Support | 2,253 (67.9%) | 1,063 (32.1%) |
| Educational Services | 2,690 (40.7%) | 3,920 (59.3%) |
| Health Care & Social Assistance | 2,832 (25.6%) | 8,247 (74.4%) |
| Arts, Entertainment & Recreation | 1,431 (69.0%) | 643 (31.0%) |
| Accommodation & Food Services | 2,616 (44.0%) | 3,328 (56.0%) |
| Public Administration | 1,695 (55.4%) | 1,367 (44.6%) |
| Total | 42,949 (54.2%) | 36,219 (45.8%) |
Education in Monroe County
School Enrollment in Monroe County
The most common levels of schooling among the 36,598 students in Monroe County are high school (9,607 | 26.3%), college / undergraduate (8,074 | 22.1%), and middle school (7,614 | 20.8%).
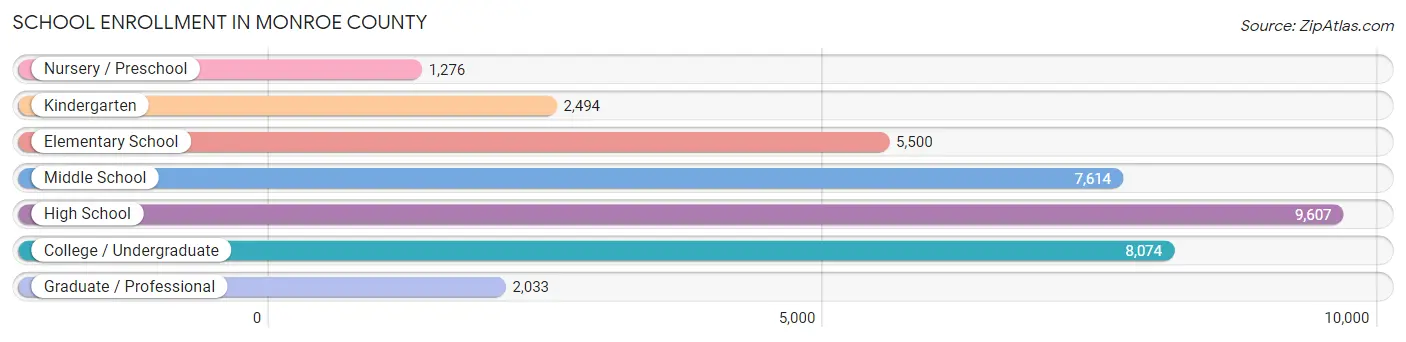
| School Level | # Students | % Students |
| Nursery / Preschool | 1,276 | 3.5% |
| Kindergarten | 2,494 | 6.8% |
| Elementary School | 5,500 | 15.0% |
| Middle School | 7,614 | 20.8% |
| High School | 9,607 | 26.3% |
| College / Undergraduate | 8,074 | 22.1% |
| Graduate / Professional | 2,033 | 5.6% |
| Total | 36,598 | 100.0% |
School Enrollment by Age by Funding Source in Monroe County
Out of a total of 36,598 students who are enrolled in schools in Monroe County, 5,453 (14.9%) attend a private institution, while the remaining 31,145 (85.1%) are enrolled in public schools. The age group of 35 years and over has the highest likelihood of being enrolled in private schools, with 914 (43.1% in the age bracket) enrolled. Conversely, the age group of 15 to 17 year olds has the lowest likelihood of being enrolled in a private school, with 5,991 (94.2% in the age bracket) attending a public institution.
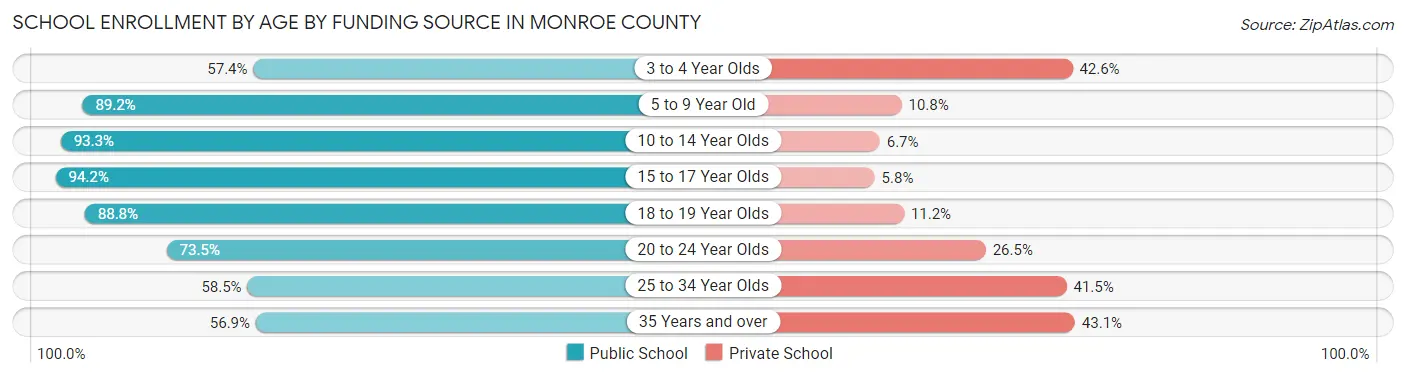
| Age Bracket | Public School | Private School |
| 3 to 4 Year Olds | 555 (57.4%) | 412 (42.6%) |
| 5 to 9 Year Old | 6,768 (89.2%) | 818 (10.8%) |
| 10 to 14 Year Olds | 8,950 (93.3%) | 646 (6.7%) |
| 15 to 17 Year Olds | 5,991 (94.2%) | 367 (5.8%) |
| 18 to 19 Year Olds | 3,611 (88.8%) | 457 (11.2%) |
| 20 to 24 Year Olds | 3,071 (73.5%) | 1,105 (26.5%) |
| 25 to 34 Year Olds | 1,009 (58.5%) | 716 (41.5%) |
| 35 Years and over | 1,208 (56.9%) | 914 (43.1%) |
| Total | 31,145 (85.1%) | 5,453 (14.9%) |
Educational Attainment by Field of Study in Monroe County
Education (5,991 | 17.5%), business (5,220 | 15.2%), science & technology (3,458 | 10.1%), arts & humanities (2,346 | 6.9%), and social sciences (2,213 | 6.5%) are the most common fields of study among 34,244 individuals in Monroe County who have obtained a bachelor's degree or higher.
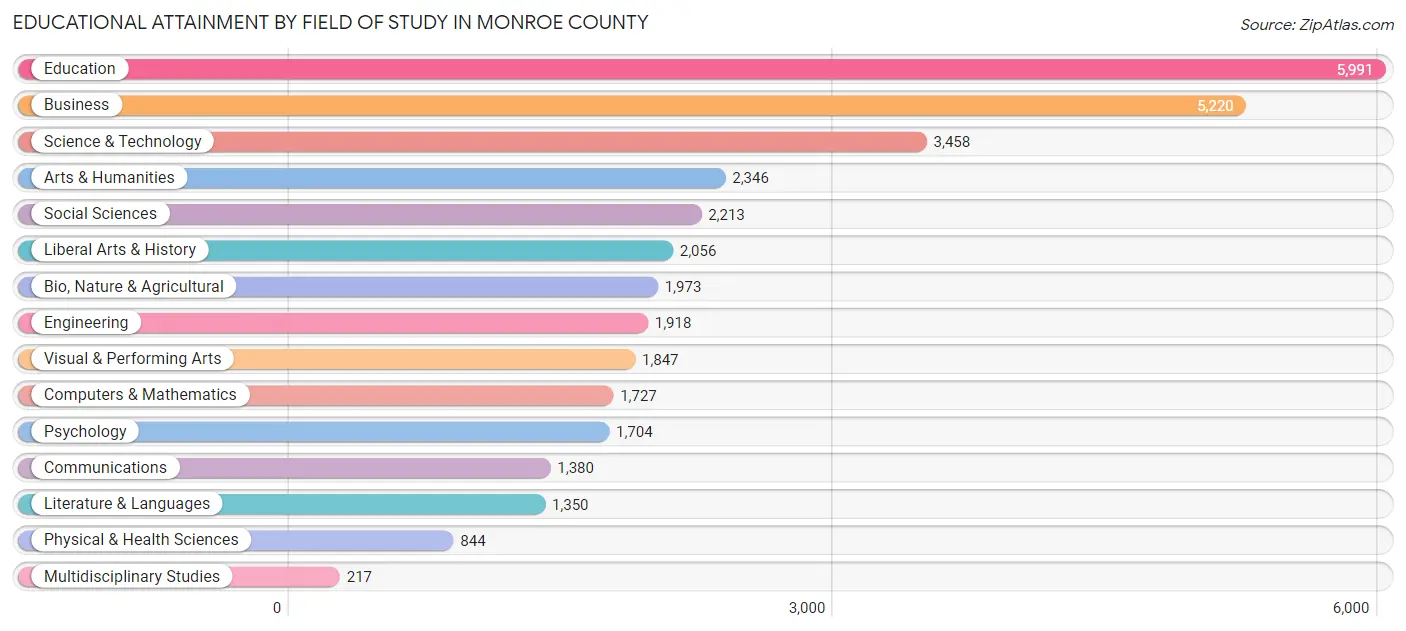
| Field of Study | # Graduates | % Graduates |
| Computers & Mathematics | 1,727 | 5.0% |
| Bio, Nature & Agricultural | 1,973 | 5.8% |
| Physical & Health Sciences | 844 | 2.5% |
| Psychology | 1,704 | 5.0% |
| Social Sciences | 2,213 | 6.5% |
| Engineering | 1,918 | 5.6% |
| Multidisciplinary Studies | 217 | 0.6% |
| Science & Technology | 3,458 | 10.1% |
| Business | 5,220 | 15.2% |
| Education | 5,991 | 17.5% |
| Literature & Languages | 1,350 | 3.9% |
| Liberal Arts & History | 2,056 | 6.0% |
| Visual & Performing Arts | 1,847 | 5.4% |
| Communications | 1,380 | 4.0% |
| Arts & Humanities | 2,346 | 6.9% |
| Total | 34,244 | 100.0% |
Transportation & Commute in Monroe County
Vehicle Availability by Sex in Monroe County
The most prevalent vehicle ownership categories in Monroe County are males with 2 vehicles (16,541, accounting for 39.4%) and females with 2 vehicles (13,337, making up 47.1%).
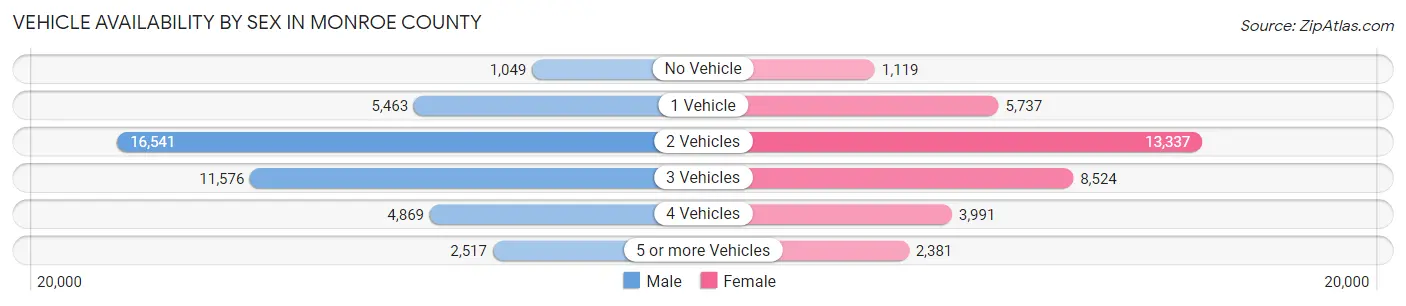
| Vehicles Available | Male | Female |
| No Vehicle | 1,049 (2.5%) | 1,119 (3.2%) |
| 1 Vehicle | 5,463 (13.0%) | 5,737 (16.4%) |
| 2 Vehicles | 16,541 (39.4%) | 13,337 (38.0%) |
| 3 Vehicles | 11,576 (27.6%) | 8,524 (24.3%) |
| 4 Vehicles | 4,869 (11.6%) | 3,991 (11.4%) |
| 5 or more Vehicles | 2,517 (6.0%) | 2,381 (6.8%) |
| Total | 42,015 (100.0%) | 35,089 (100.0%) |
Commute Time in Monroe County
The most frequently occuring commute durations in Monroe County are 90 or more minutes (10,508 commuters, 14.9%), 15 to 19 minutes (8,939 commuters, 12.7%), and 20 to 24 minutes (8,481 commuters, 12.0%).
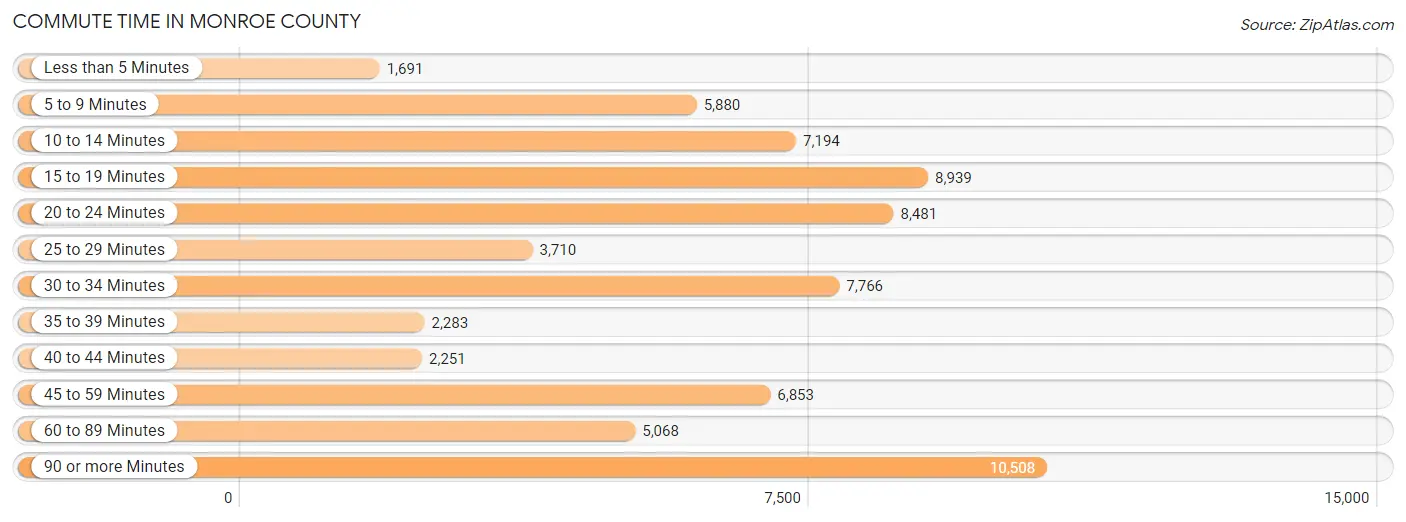
| Commute Time | # Commuters | % Commuters |
| Less than 5 Minutes | 1,691 | 2.4% |
| 5 to 9 Minutes | 5,880 | 8.3% |
| 10 to 14 Minutes | 7,194 | 10.2% |
| 15 to 19 Minutes | 8,939 | 12.7% |
| 20 to 24 Minutes | 8,481 | 12.0% |
| 25 to 29 Minutes | 3,710 | 5.2% |
| 30 to 34 Minutes | 7,766 | 11.0% |
| 35 to 39 Minutes | 2,283 | 3.2% |
| 40 to 44 Minutes | 2,251 | 3.2% |
| 45 to 59 Minutes | 6,853 | 9.7% |
| 60 to 89 Minutes | 5,068 | 7.2% |
| 90 or more Minutes | 10,508 | 14.9% |
Commute Time by Sex in Monroe County
The most common commute times in Monroe County are 90 or more minutes (7,687 commuters, 19.8%) for males and 15 to 19 minutes (4,887 commuters, 15.4%) for females.
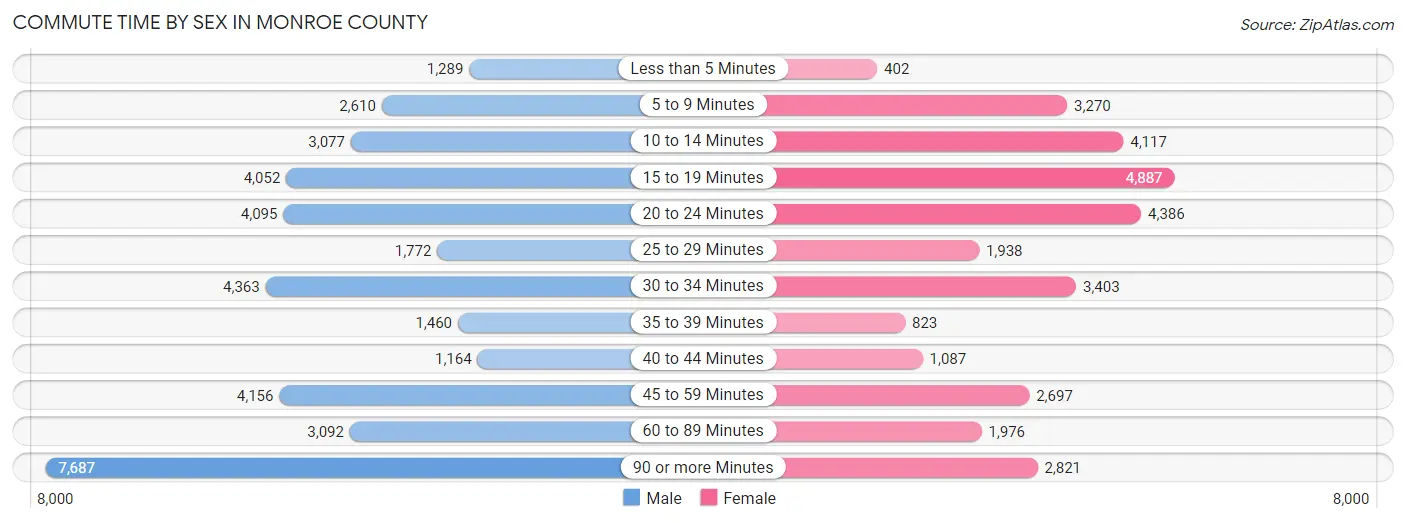
| Commute Time | Male | Female |
| Less than 5 Minutes | 1,289 (3.3%) | 402 (1.3%) |
| 5 to 9 Minutes | 2,610 (6.7%) | 3,270 (10.3%) |
| 10 to 14 Minutes | 3,077 (7.9%) | 4,117 (12.9%) |
| 15 to 19 Minutes | 4,052 (10.4%) | 4,887 (15.4%) |
| 20 to 24 Minutes | 4,095 (10.5%) | 4,386 (13.8%) |
| 25 to 29 Minutes | 1,772 (4.6%) | 1,938 (6.1%) |
| 30 to 34 Minutes | 4,363 (11.2%) | 3,403 (10.7%) |
| 35 to 39 Minutes | 1,460 (3.8%) | 823 (2.6%) |
| 40 to 44 Minutes | 1,164 (3.0%) | 1,087 (3.4%) |
| 45 to 59 Minutes | 4,156 (10.7%) | 2,697 (8.5%) |
| 60 to 89 Minutes | 3,092 (8.0%) | 1,976 (6.2%) |
| 90 or more Minutes | 7,687 (19.8%) | 2,821 (8.9%) |
Time of Departure to Work by Sex in Monroe County
The most frequent times of departure to work in Monroe County are 12:00 AM to 4:59 AM (5,431, 14.0%) for males and 7:00 AM to 7:29 AM (4,194, 13.2%) for females.
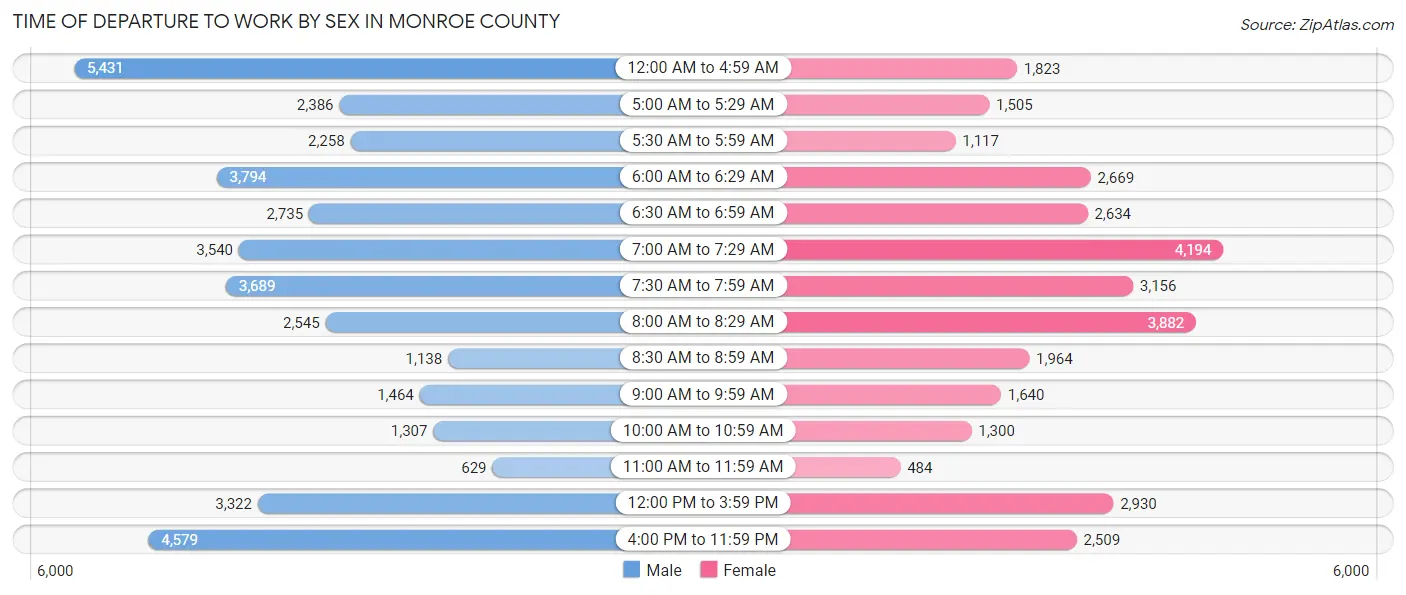
| Time of Departure | Male | Female |
| 12:00 AM to 4:59 AM | 5,431 (14.0%) | 1,823 (5.7%) |
| 5:00 AM to 5:29 AM | 2,386 (6.1%) | 1,505 (4.7%) |
| 5:30 AM to 5:59 AM | 2,258 (5.8%) | 1,117 (3.5%) |
| 6:00 AM to 6:29 AM | 3,794 (9.8%) | 2,669 (8.4%) |
| 6:30 AM to 6:59 AM | 2,735 (7.0%) | 2,634 (8.3%) |
| 7:00 AM to 7:29 AM | 3,540 (9.1%) | 4,194 (13.2%) |
| 7:30 AM to 7:59 AM | 3,689 (9.5%) | 3,156 (9.9%) |
| 8:00 AM to 8:29 AM | 2,545 (6.6%) | 3,882 (12.2%) |
| 8:30 AM to 8:59 AM | 1,138 (2.9%) | 1,964 (6.2%) |
| 9:00 AM to 9:59 AM | 1,464 (3.8%) | 1,640 (5.2%) |
| 10:00 AM to 10:59 AM | 1,307 (3.4%) | 1,300 (4.1%) |
| 11:00 AM to 11:59 AM | 629 (1.6%) | 484 (1.5%) |
| 12:00 PM to 3:59 PM | 3,322 (8.6%) | 2,930 (9.2%) |
| 4:00 PM to 11:59 PM | 4,579 (11.8%) | 2,509 (7.9%) |
| Total | 38,817 (100.0%) | 31,807 (100.0%) |
Housing Occupancy in Monroe County
Occupancy by Ownership in Monroe County
Of the total 59,113 dwellings in Monroe County, owner-occupied units account for 46,524 (78.7%), while renter-occupied units make up 12,589 (21.3%).
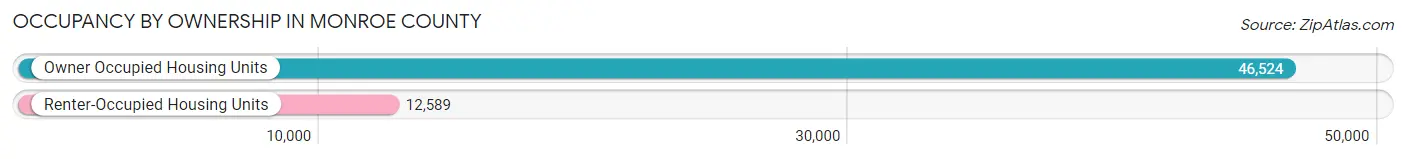
| Occupancy | # Housing Units | % Housing Units |
| Owner Occupied Housing Units | 46,524 | 78.7% |
| Renter-Occupied Housing Units | 12,589 | 21.3% |
| Total Occupied Housing Units | 59,113 | 100.0% |
Occupancy by Household Size in Monroe County
| Household Size | # Housing Units | % Housing Units |
| 1-Person Household | 13,223 | 22.4% |
| 2-Person Household | 20,609 | 34.9% |
| 3-Person Household | 10,027 | 17.0% |
| 4+ Person Household | 15,254 | 25.8% |
| Total Housing Units | 59,113 | 100.0% |
Occupancy by Ownership by Household Size in Monroe County
| Household Size | Owner-occupied | Renter-occupied |
| 1-Person Household | 9,193 (69.5%) | 4,030 (30.5%) |
| 2-Person Household | 16,741 (81.2%) | 3,868 (18.8%) |
| 3-Person Household | 8,316 (82.9%) | 1,711 (17.1%) |
| 4+ Person Household | 12,274 (80.5%) | 2,980 (19.5%) |
| Total Housing Units | 46,524 (78.7%) | 12,589 (21.3%) |
Occupancy by Educational Attainment in Monroe County
| Household Size | Owner-occupied | Renter-occupied |
| Less than High School | 3,148 (68.7%) | 1,434 (31.3%) |
| High School Diploma | 13,803 (76.5%) | 4,230 (23.5%) |
| College/Associate Degree | 14,048 (75.5%) | 4,562 (24.5%) |
| Bachelor's Degree or higher | 15,525 (86.8%) | 2,363 (13.2%) |
Occupancy by Age of Householder in Monroe County
| Age Bracket | # Households | % Households |
| Under 35 Years | 6,406 | 10.8% |
| 35 to 44 Years | 8,187 | 13.9% |
| 45 to 54 Years | 12,083 | 20.4% |
| 55 to 64 Years | 14,874 | 25.2% |
| 65 to 74 Years | 10,921 | 18.5% |
| 75 to 84 Years | 5,153 | 8.7% |
| 85 Years and Over | 1,489 | 2.5% |
| Total | 59,113 | 100.0% |
Housing Finances in Monroe County
Median Income by Occupancy in Monroe County
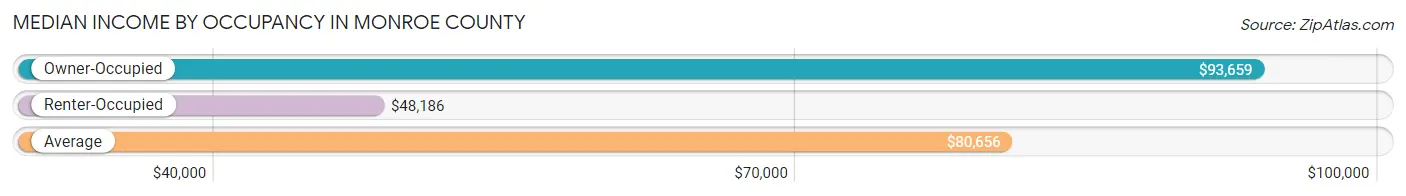
| Occupancy Type | # Households | Median Income |
| Owner-Occupied | 46,524 (78.7%) | $93,659 |
| Renter-Occupied | 12,589 (21.3%) | $48,186 |
| Average | 59,113 (100.0%) | $80,656 |
Occupancy by Householder Income Bracket in Monroe County
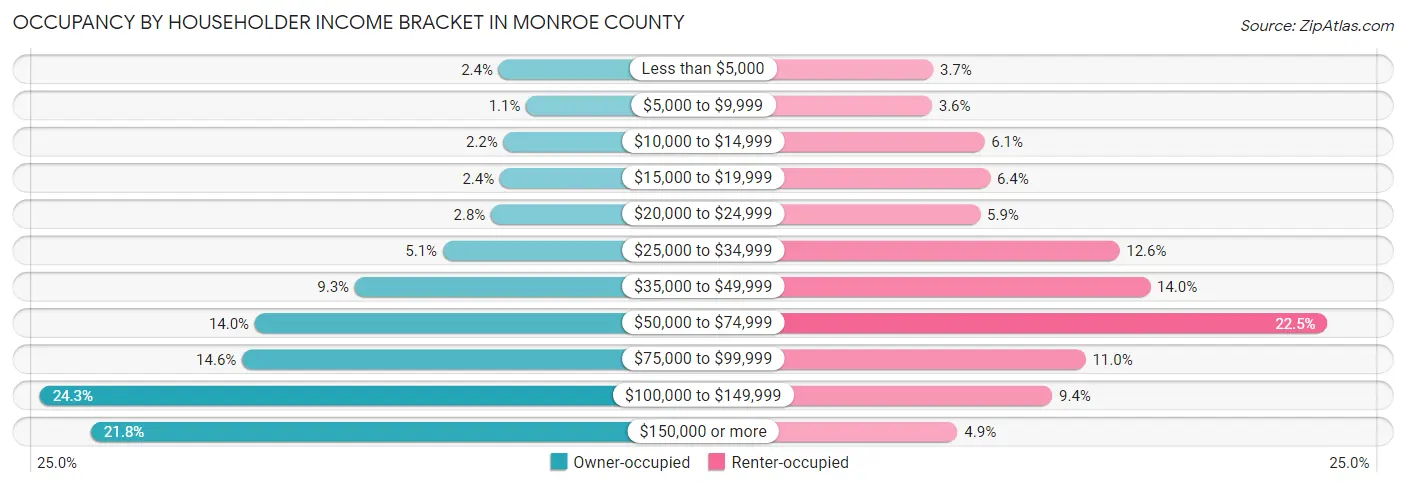
| Income Bracket | Owner-occupied | Renter-occupied |
| Less than $5,000 | 1,127 (2.4%) | 464 (3.7%) |
| $5,000 to $9,999 | 517 (1.1%) | 457 (3.6%) |
| $10,000 to $14,999 | 1,019 (2.2%) | 772 (6.1%) |
| $15,000 to $19,999 | 1,100 (2.4%) | 806 (6.4%) |
| $20,000 to $24,999 | 1,294 (2.8%) | 747 (5.9%) |
| $25,000 to $34,999 | 2,365 (5.1%) | 1,581 (12.6%) |
| $35,000 to $49,999 | 4,311 (9.3%) | 1,765 (14.0%) |
| $50,000 to $74,999 | 6,525 (14.0%) | 2,829 (22.5%) |
| $75,000 to $99,999 | 6,813 (14.6%) | 1,379 (11.0%) |
| $100,000 to $149,999 | 11,294 (24.3%) | 1,178 (9.4%) |
| $150,000 or more | 10,159 (21.8%) | 611 (4.9%) |
| Total | 46,524 (100.0%) | 12,589 (100.0%) |
Monthly Housing Cost Tiers in Monroe County
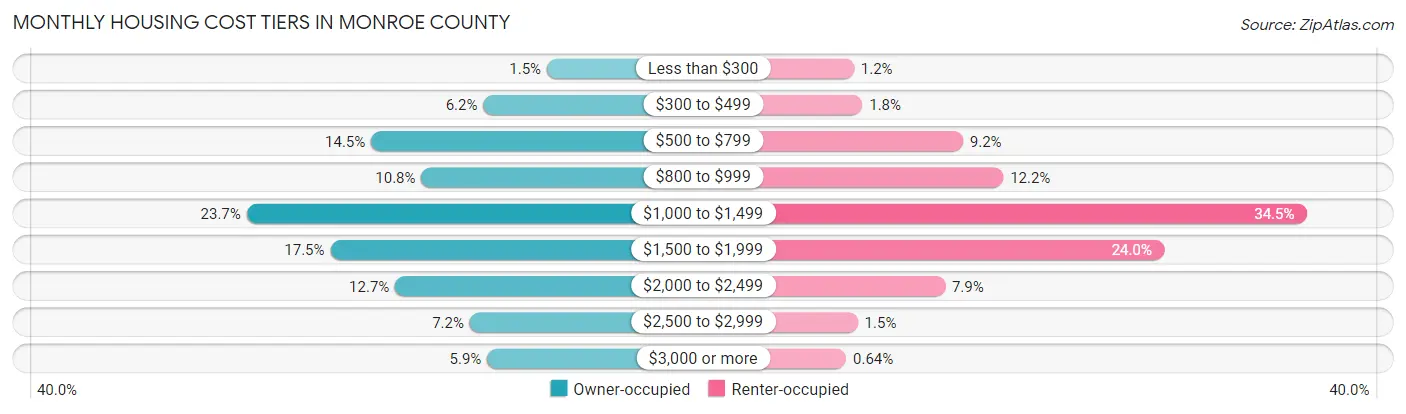
| Monthly Cost | Owner-occupied | Renter-occupied |
| Less than $300 | 714 (1.5%) | 152 (1.2%) |
| $300 to $499 | 2,892 (6.2%) | 231 (1.8%) |
| $500 to $799 | 6,738 (14.5%) | 1,163 (9.2%) |
| $800 to $999 | 5,017 (10.8%) | 1,537 (12.2%) |
| $1,000 to $1,499 | 11,004 (23.6%) | 4,347 (34.5%) |
| $1,500 to $1,999 | 8,131 (17.5%) | 3,025 (24.0%) |
| $2,000 to $2,499 | 5,913 (12.7%) | 997 (7.9%) |
| $2,500 to $2,999 | 3,355 (7.2%) | 188 (1.5%) |
| $3,000 or more | 2,760 (5.9%) | 80 (0.6%) |
| Total | 46,524 (100.0%) | 12,589 (100.0%) |
Physical Housing Characteristics in Monroe County
Housing Structures in Monroe County
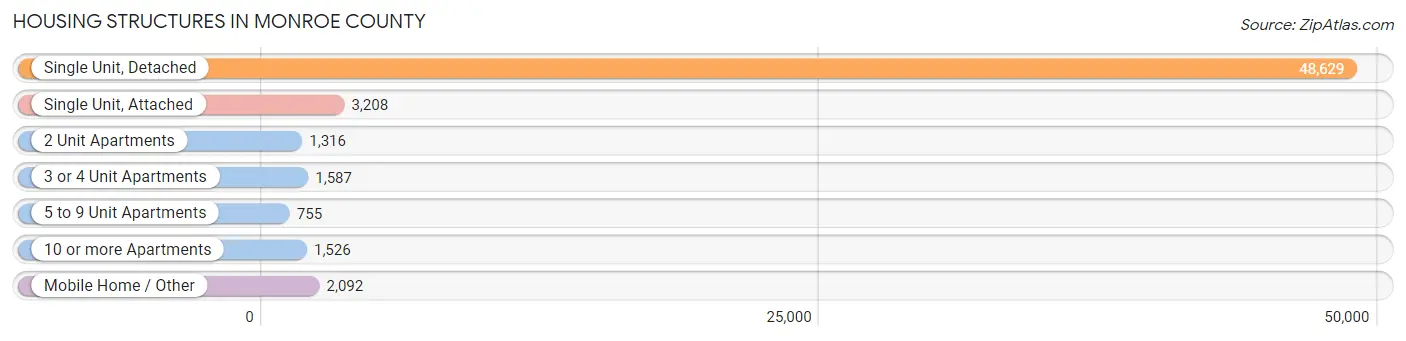
| Structure Type | # Housing Units | % Housing Units |
| Single Unit, Detached | 48,629 | 82.3% |
| Single Unit, Attached | 3,208 | 5.4% |
| 2 Unit Apartments | 1,316 | 2.2% |
| 3 or 4 Unit Apartments | 1,587 | 2.7% |
| 5 to 9 Unit Apartments | 755 | 1.3% |
| 10 or more Apartments | 1,526 | 2.6% |
| Mobile Home / Other | 2,092 | 3.5% |
| Total | 59,113 | 100.0% |
Housing Structures by Occupancy in Monroe County
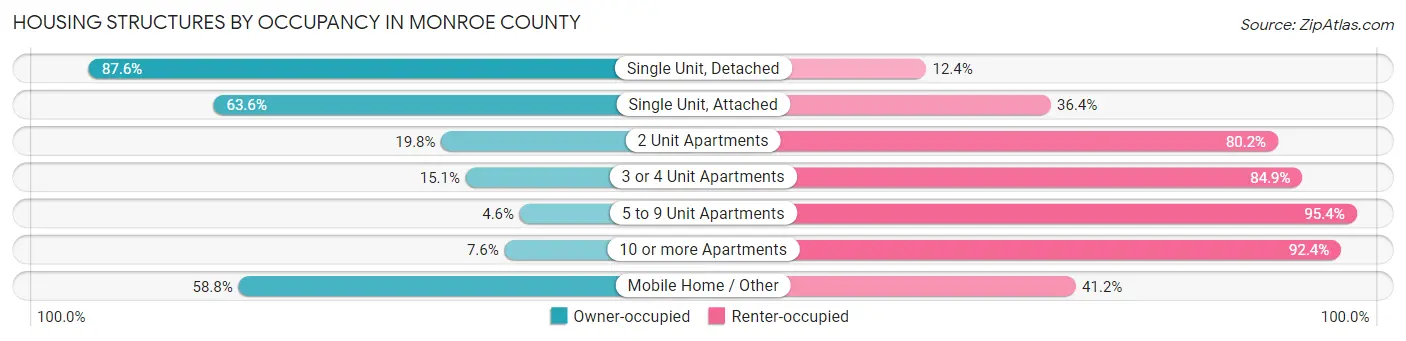
| Structure Type | Owner-occupied | Renter-occupied |
| Single Unit, Detached | 42,603 (87.6%) | 6,026 (12.4%) |
| Single Unit, Attached | 2,041 (63.6%) | 1,167 (36.4%) |
| 2 Unit Apartments | 260 (19.8%) | 1,056 (80.2%) |
| 3 or 4 Unit Apartments | 239 (15.1%) | 1,348 (84.9%) |
| 5 to 9 Unit Apartments | 35 (4.6%) | 720 (95.4%) |
| 10 or more Apartments | 116 (7.6%) | 1,410 (92.4%) |
| Mobile Home / Other | 1,230 (58.8%) | 862 (41.2%) |
| Total | 46,524 (78.7%) | 12,589 (21.3%) |
Housing Structures by Number of Rooms in Monroe County
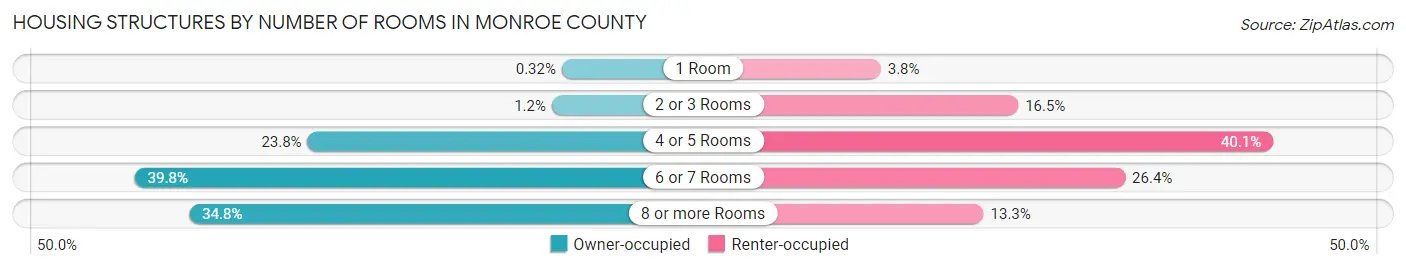
| Number of Rooms | Owner-occupied | Renter-occupied |
| 1 Room | 148 (0.3%) | 476 (3.8%) |
| 2 or 3 Rooms | 578 (1.2%) | 2,076 (16.5%) |
| 4 or 5 Rooms | 11,089 (23.8%) | 5,043 (40.1%) |
| 6 or 7 Rooms | 18,526 (39.8%) | 3,321 (26.4%) |
| 8 or more Rooms | 16,183 (34.8%) | 1,673 (13.3%) |
| Total | 46,524 (100.0%) | 12,589 (100.0%) |
Housing Structure by Heating Type in Monroe County
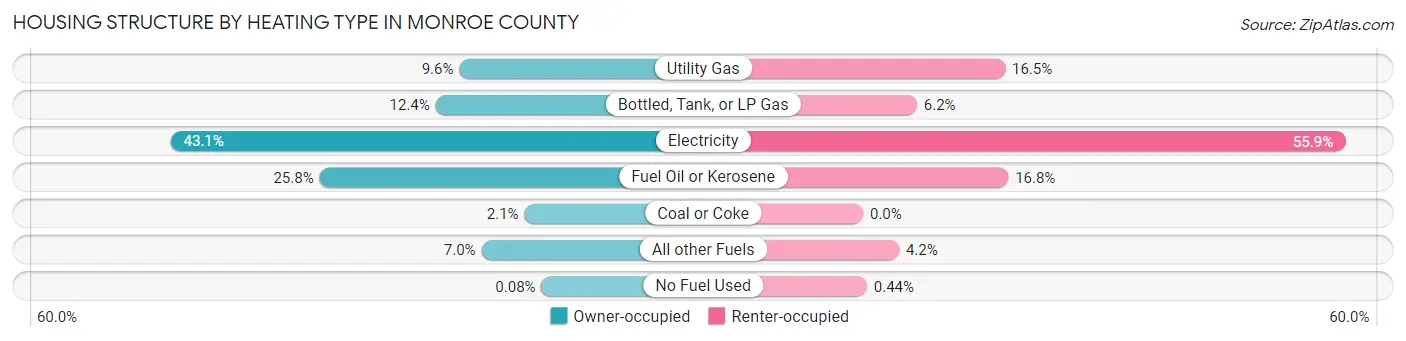
| Heating Type | Owner-occupied | Renter-occupied |
| Utility Gas | 4,464 (9.6%) | 2,072 (16.5%) |
| Bottled, Tank, or LP Gas | 5,748 (12.3%) | 785 (6.2%) |
| Electricity | 20,039 (43.1%) | 7,033 (55.9%) |
| Fuel Oil or Kerosene | 12,008 (25.8%) | 2,119 (16.8%) |
| Coal or Coke | 954 (2.1%) | 0 (0.0%) |
| All other Fuels | 3,272 (7.0%) | 524 (4.2%) |
| No Fuel Used | 39 (0.1%) | 56 (0.4%) |
| Total | 46,524 (100.0%) | 12,589 (100.0%) |
Household Vehicle Usage in Monroe County
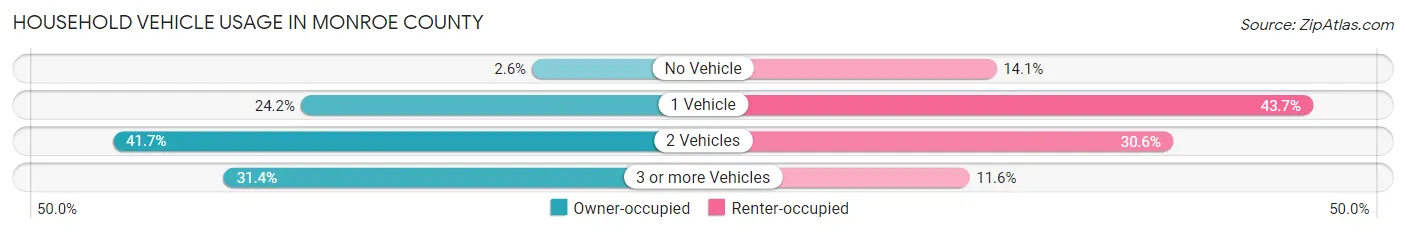
| Vehicles per Household | Owner-occupied | Renter-occupied |
| No Vehicle | 1,226 (2.6%) | 1,778 (14.1%) |
| 1 Vehicle | 11,269 (24.2%) | 5,498 (43.7%) |
| 2 Vehicles | 19,417 (41.7%) | 3,852 (30.6%) |
| 3 or more Vehicles | 14,612 (31.4%) | 1,461 (11.6%) |
| Total | 46,524 (100.0%) | 12,589 (100.0%) |
Real Estate & Mortgages in Monroe County
Real Estate and Mortgage Overview in Monroe County
| Characteristic | Without Mortgage | With Mortgage |
| Housing Units | 16,750 | 29,774 |
| Median Property Value | $211,200 | $226,500 |
| Median Household Income | $66,929 | $7,803 |
| Monthly Housing Costs | $750 | $2,729 |
| Real Estate Taxes | $4,250 | $504 |
Property Value by Mortgage Status in Monroe County
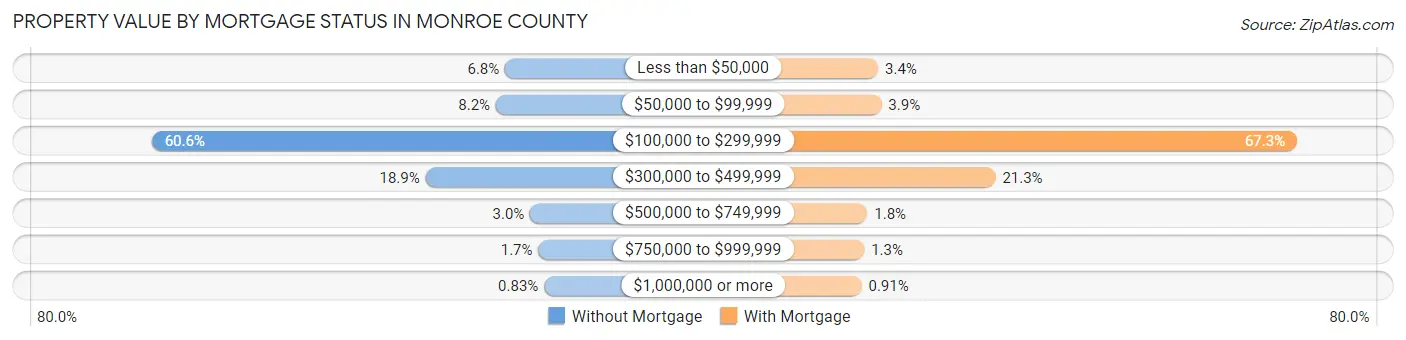
| Property Value | Without Mortgage | With Mortgage |
| Less than $50,000 | 1,136 (6.8%) | 1,023 (3.4%) |
| $50,000 to $99,999 | 1,370 (8.2%) | 1,174 (3.9%) |
| $100,000 to $299,999 | 10,156 (60.6%) | 20,027 (67.3%) |
| $300,000 to $499,999 | 3,167 (18.9%) | 6,349 (21.3%) |
| $500,000 to $749,999 | 495 (3.0%) | 537 (1.8%) |
| $750,000 to $999,999 | 287 (1.7%) | 393 (1.3%) |
| $1,000,000 or more | 139 (0.8%) | 271 (0.9%) |
| Total | 16,750 (100.0%) | 29,774 (100.0%) |
Household Income by Mortgage Status in Monroe County
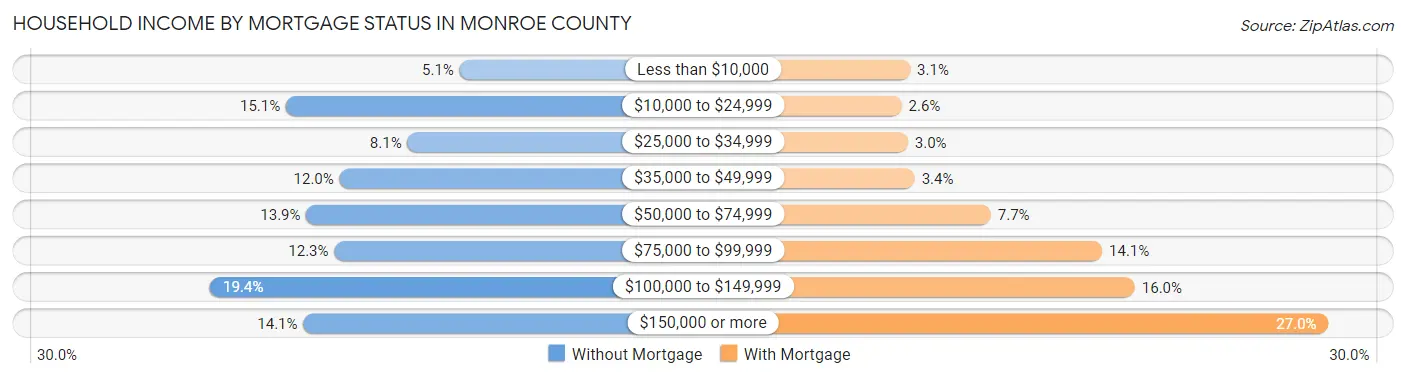
| Household Income | Without Mortgage | With Mortgage |
| Less than $10,000 | 861 (5.1%) | 928 (3.1%) |
| $10,000 to $24,999 | 2,523 (15.1%) | 783 (2.6%) |
| $25,000 to $34,999 | 1,360 (8.1%) | 890 (3.0%) |
| $35,000 to $49,999 | 2,010 (12.0%) | 1,005 (3.4%) |
| $50,000 to $74,999 | 2,329 (13.9%) | 2,301 (7.7%) |
| $75,000 to $99,999 | 2,061 (12.3%) | 4,196 (14.1%) |
| $100,000 to $149,999 | 3,250 (19.4%) | 4,752 (16.0%) |
| $150,000 or more | 2,356 (14.1%) | 8,044 (27.0%) |
| Total | 16,750 (100.0%) | 29,774 (100.0%) |
Property Value to Household Income Ratio in Monroe County
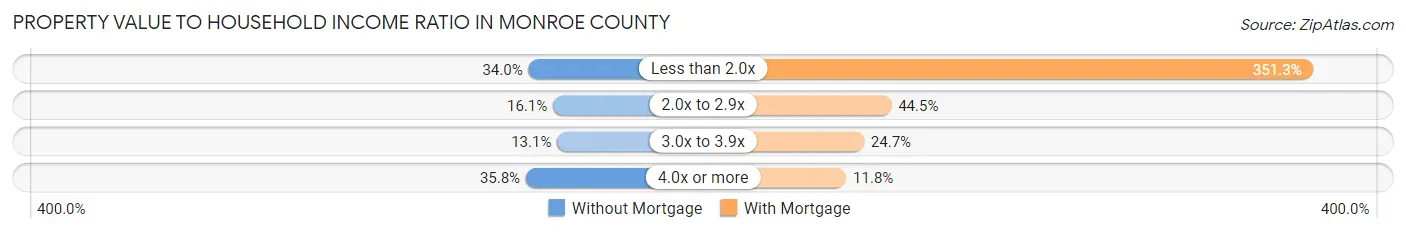
| Value-to-Income Ratio | Without Mortgage | With Mortgage |
| Less than 2.0x | 5,689 (34.0%) | 104,588 (351.3%) |
| 2.0x to 2.9x | 2,697 (16.1%) | 13,259 (44.5%) |
| 3.0x to 3.9x | 2,187 (13.1%) | 7,350 (24.7%) |
| 4.0x or more | 5,999 (35.8%) | 3,514 (11.8%) |
| Total | 16,750 (100.0%) | 29,774 (100.0%) |
Real Estate Taxes by Mortgage Status in Monroe County
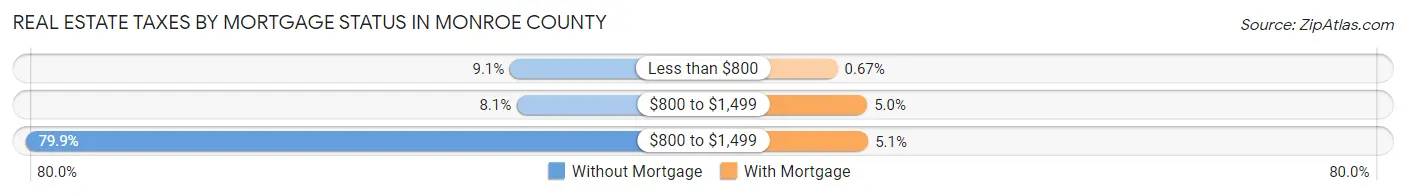
| Property Taxes | Without Mortgage | With Mortgage |
| Less than $800 | 1,518 (9.1%) | 200 (0.7%) |
| $800 to $1,499 | 1,349 (8.1%) | 1,487 (5.0%) |
| $800 to $1,499 | 13,378 (79.9%) | 1,530 (5.1%) |
| Total | 16,750 (100.0%) | 29,774 (100.0%) |
Health & Disability in Monroe County
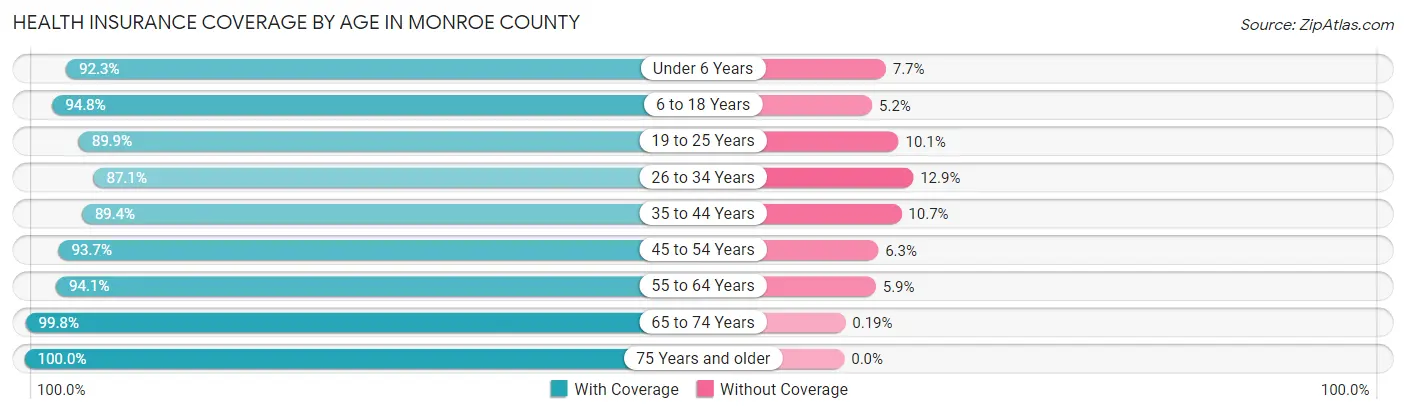
Health Insurance Coverage by Age in Monroe County
| Age Bracket | With Coverage | Without Coverage |
| Under 6 Years | 9,184 (92.3%) | 770 (7.7%) |
| 6 to 18 Years | 24,102 (94.8%) | 1,318 (5.2%) |
| 19 to 25 Years | 14,571 (89.9%) | 1,641 (10.1%) |
| 26 to 34 Years | 14,570 (87.1%) | 2,150 (12.9%) |
| 35 to 44 Years | 16,472 (89.3%) | 1,964 (10.6%) |
| 45 to 54 Years | 21,545 (93.7%) | 1,456 (6.3%) |
| 55 to 64 Years | 25,558 (94.1%) | 1,593 (5.9%) |
| 65 to 74 Years | 19,076 (99.8%) | 36 (0.2%) |
| 75 Years and older | 11,144 (100.0%) | 0 (0.0%) |
| Total | 156,222 (93.5%) | 10,928 (6.5%) |
Health Insurance Coverage by Citizenship Status in Monroe County
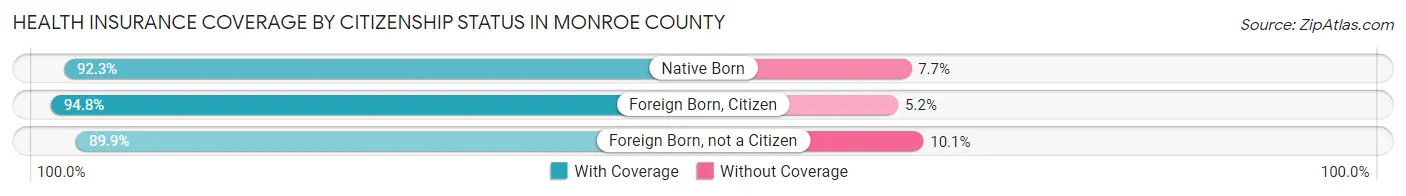
| Citizenship Status | With Coverage | Without Coverage |
| Native Born | 9,184 (92.3%) | 770 (7.7%) |
| Foreign Born, Citizen | 24,102 (94.8%) | 1,318 (5.2%) |
| Foreign Born, not a Citizen | 14,571 (89.9%) | 1,641 (10.1%) |
Health Insurance Coverage by Household Income in Monroe County
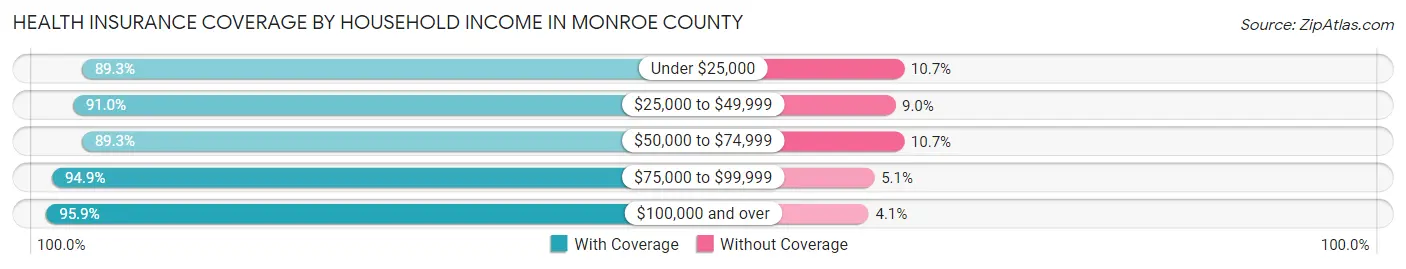
| Household Income | With Coverage | Without Coverage |
| Under $25,000 | 14,005 (89.3%) | 1,678 (10.7%) |
| $25,000 to $49,999 | 20,586 (91.0%) | 2,045 (9.0%) |
| $50,000 to $74,999 | 23,154 (89.3%) | 2,775 (10.7%) |
| $75,000 to $99,999 | 21,059 (94.9%) | 1,140 (5.1%) |
| $100,000 and over | 75,915 (95.9%) | 3,218 (4.1%) |
Public vs Private Health Insurance Coverage by Age in Monroe County
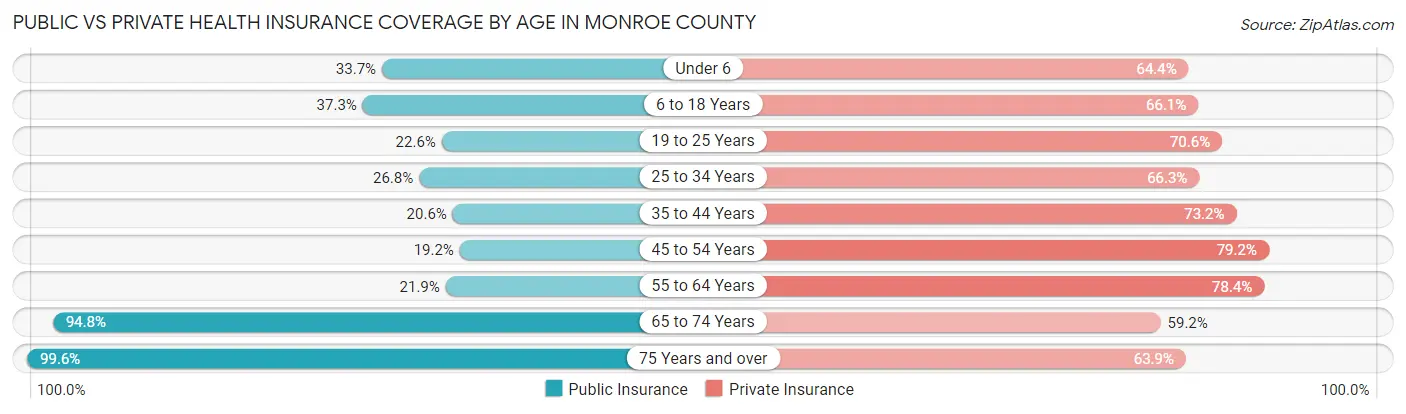
| Age Bracket | Public Insurance | Private Insurance |
| Under 6 | 3,353 (33.7%) | 6,405 (64.3%) |
| 6 to 18 Years | 9,468 (37.2%) | 16,807 (66.1%) |
| 19 to 25 Years | 3,663 (22.6%) | 11,439 (70.6%) |
| 25 to 34 Years | 4,478 (26.8%) | 11,091 (66.3%) |
| 35 to 44 Years | 3,789 (20.5%) | 13,498 (73.2%) |
| 45 to 54 Years | 4,426 (19.2%) | 18,226 (79.2%) |
| 55 to 64 Years | 5,934 (21.9%) | 21,285 (78.4%) |
| 65 to 74 Years | 18,115 (94.8%) | 11,310 (59.2%) |
| 75 Years and over | 11,095 (99.6%) | 7,116 (63.8%) |
| Total | 64,321 (38.5%) | 117,177 (70.1%) |
Disability Status by Sex by Age in Monroe County
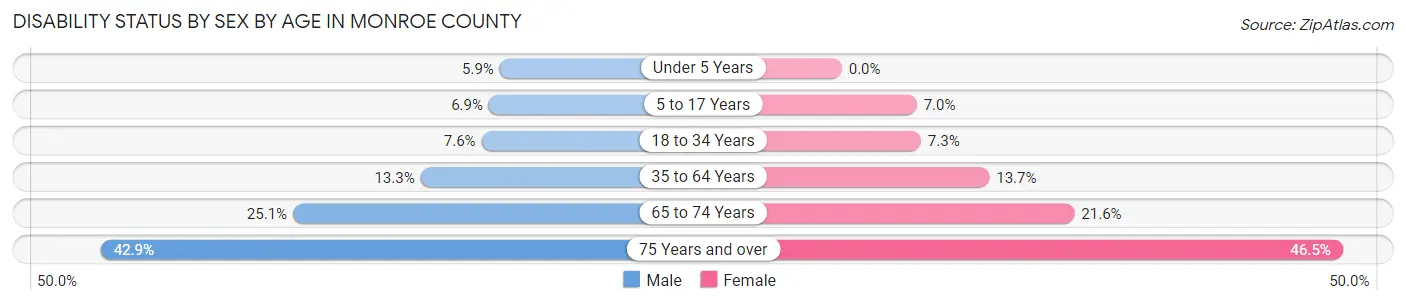
| Age Bracket | Male | Female |
| Under 5 Years | 231 (5.9%) | 0 (0.0%) |
| 5 to 17 Years | 878 (6.9%) | 848 (7.0%) |
| 18 to 34 Years | 1,411 (7.6%) | 1,254 (7.3%) |
| 35 to 64 Years | 4,507 (13.3%) | 4,736 (13.7%) |
| 65 to 74 Years | 2,393 (25.1%) | 2,068 (21.6%) |
| 75 Years and over | 2,125 (42.9%) | 2,879 (46.5%) |
Disability Class by Sex by Age in Monroe County
Disability Class: Hearing Difficulty
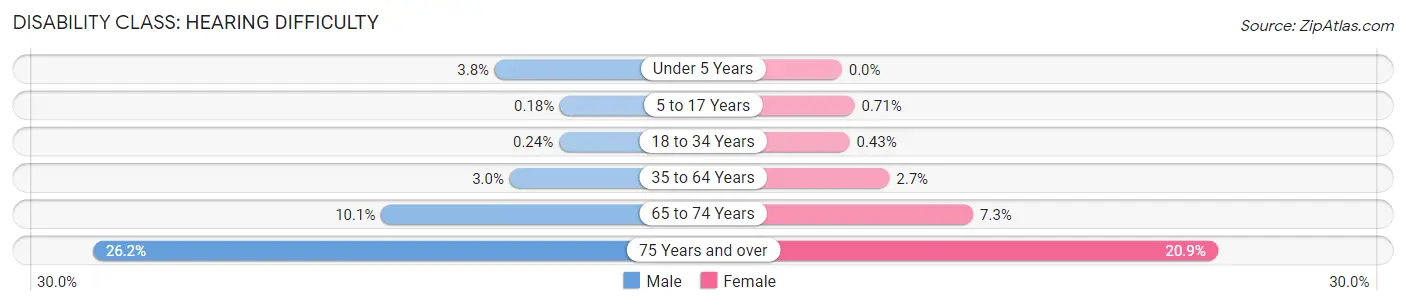
| Age Bracket | Male | Female |
| Under 5 Years | 149 (3.8%) | 0 (0.0%) |
| 5 to 17 Years | 23 (0.2%) | 87 (0.7%) |
| 18 to 34 Years | 45 (0.2%) | 74 (0.4%) |
| 35 to 64 Years | 1,013 (3.0%) | 916 (2.6%) |
| 65 to 74 Years | 967 (10.1%) | 700 (7.3%) |
| 75 Years and over | 1,297 (26.2%) | 1,296 (20.9%) |
Disability Class: Vision Difficulty
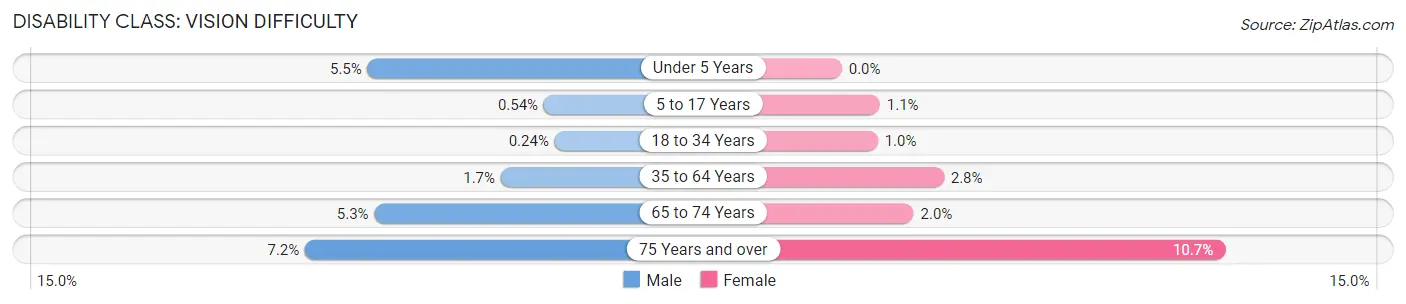
| Age Bracket | Male | Female |
| Under 5 Years | 213 (5.4%) | 0 (0.0%) |
| 5 to 17 Years | 69 (0.5%) | 129 (1.1%) |
| 18 to 34 Years | 45 (0.2%) | 170 (1.0%) |
| 35 to 64 Years | 592 (1.7%) | 983 (2.8%) |
| 65 to 74 Years | 501 (5.3%) | 192 (2.0%) |
| 75 Years and over | 356 (7.2%) | 661 (10.7%) |
Disability Class: Cognitive Difficulty
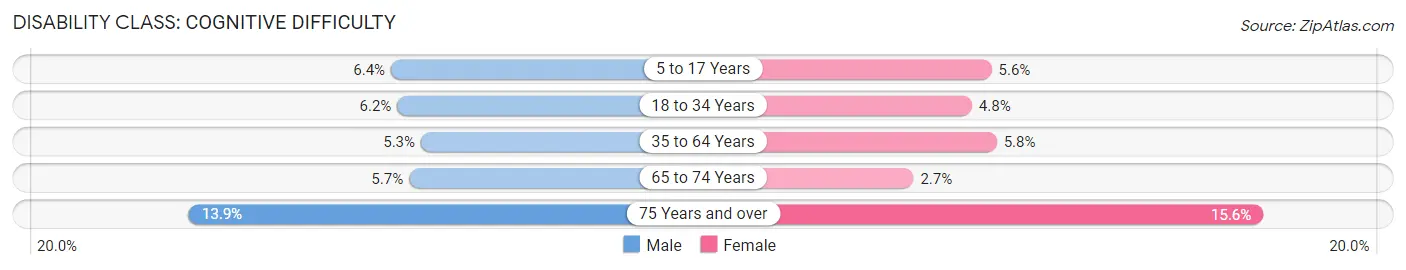
| Age Bracket | Male | Female |
| 5 to 17 Years | 812 (6.4%) | 678 (5.6%) |
| 18 to 34 Years | 1,145 (6.2%) | 824 (4.8%) |
| 35 to 64 Years | 1,798 (5.3%) | 1,989 (5.8%) |
| 65 to 74 Years | 546 (5.7%) | 255 (2.7%) |
| 75 Years and over | 688 (13.9%) | 969 (15.6%) |
Disability Class: Ambulatory Difficulty
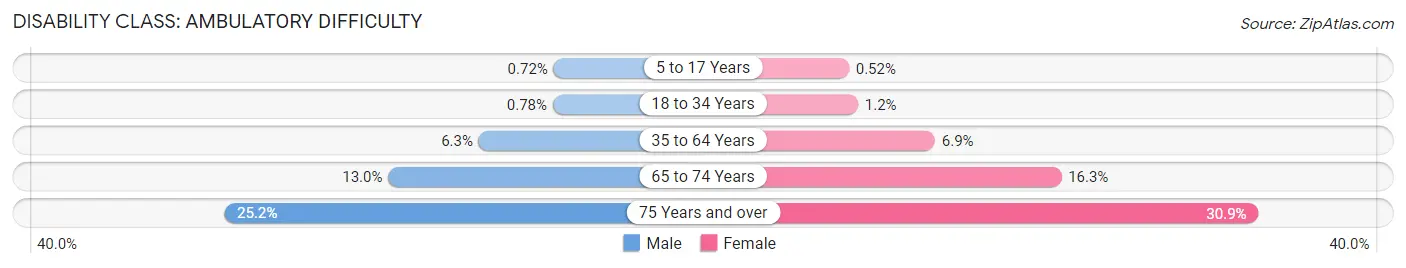
| Age Bracket | Male | Female |
| 5 to 17 Years | 91 (0.7%) | 64 (0.5%) |
| 18 to 34 Years | 145 (0.8%) | 203 (1.2%) |
| 35 to 64 Years | 2,136 (6.3%) | 2,392 (6.9%) |
| 65 to 74 Years | 1,239 (13.0%) | 1,561 (16.3%) |
| 75 Years and over | 1,247 (25.2%) | 1,916 (30.9%) |
Disability Class: Self-Care Difficulty
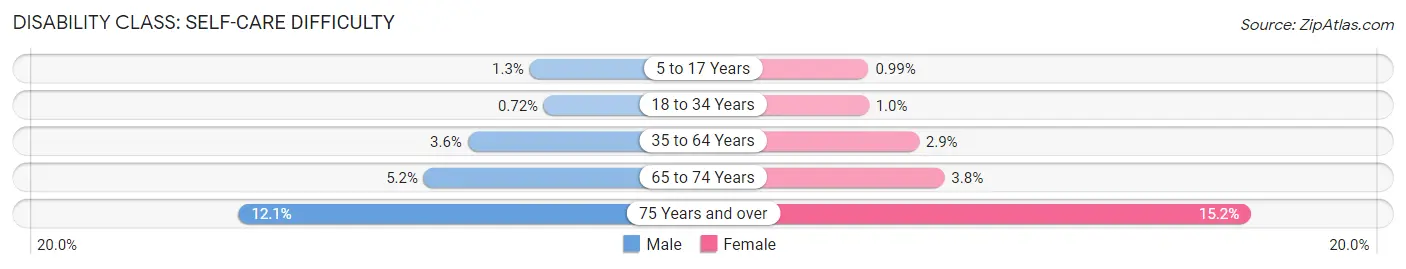
| Age Bracket | Male | Female |
| 5 to 17 Years | 159 (1.3%) | 121 (1.0%) |
| 18 to 34 Years | 133 (0.7%) | 171 (1.0%) |
| 35 to 64 Years | 1,205 (3.5%) | 991 (2.9%) |
| 65 to 74 Years | 494 (5.2%) | 365 (3.8%) |
| 75 Years and over | 597 (12.1%) | 941 (15.2%) |
Technology Access in Monroe County
Computing Device Access in Monroe County
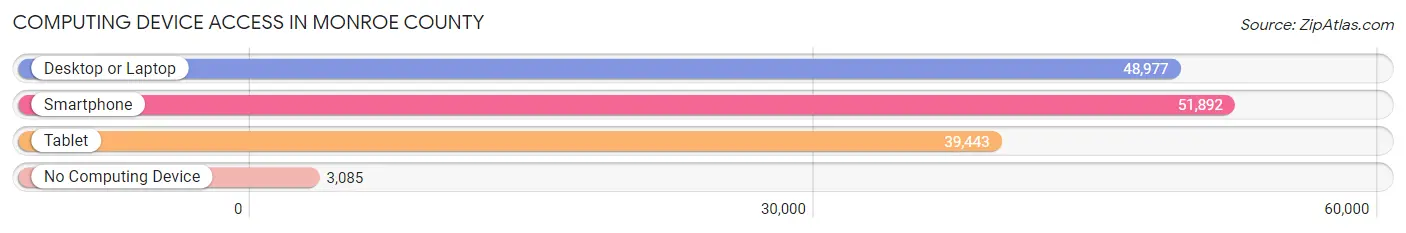
| Device Type | # Households | % Households |
| Desktop or Laptop | 48,977 | 82.9% |
| Smartphone | 51,892 | 87.8% |
| Tablet | 39,443 | 66.7% |
| No Computing Device | 3,085 | 5.2% |
| Total | 59,113 | 100.0% |
Internet Access in Monroe County
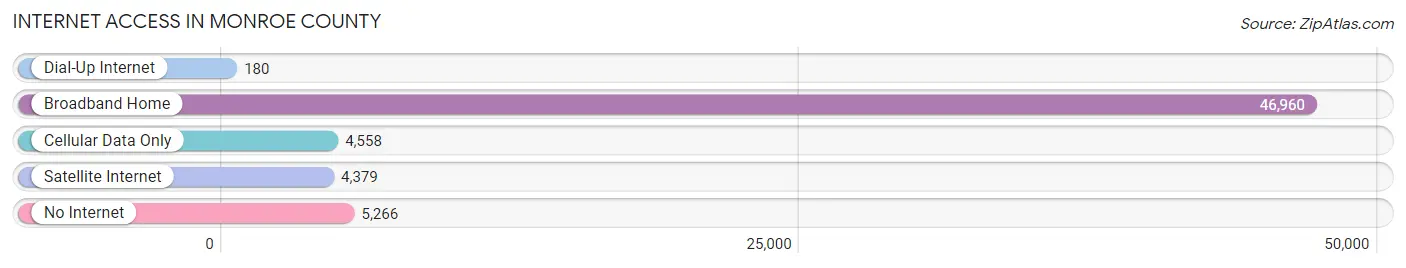
| Internet Type | # Households | % Households |
| Dial-Up Internet | 180 | 0.3% |
| Broadband Home | 46,960 | 79.4% |
| Cellular Data Only | 4,558 | 7.7% |
| Satellite Internet | 4,379 | 7.4% |
| No Internet | 5,266 | 8.9% |
| Total | 59,113 | 100.0% |
Monroe County Summary
Monroe County, Pennsylvania is located in the northeastern part of the state and is part of the Pocono Mountains region. It is bordered by Carbon County to the north, Northampton County to the east, Pike County to the south, and Wayne County to the west. The county seat is Stroudsburg, and the county is home to a population of 169,842 people as of the 2010 census.
History
Monroe County was formed in 1836 from parts of Northampton and Pike Counties. It was named after James Monroe, the fifth President of the United States. The county was originally home to the Lenape Native Americans, who were later displaced by European settlers. The first settlers in the area were German and Dutch immigrants, who arrived in the early 1700s. The county was primarily agricultural until the mid-1800s, when the discovery of coal and iron ore in the area led to the development of mining and manufacturing industries.
Geography
Monroe County is located in the Pocono Mountains region of Pennsylvania. The county is mostly mountainous, with the highest point being Camelback Mountain at 1,553 feet. The county is home to several rivers, including the Delaware, Lehigh, and Brodhead. The county is also home to several state parks, including Big Pocono State Park, Promised Land State Park, and Tobyhanna State Park.
Economy
Monroe County’s economy is largely based on tourism, manufacturing, and agriculture. The county is home to several ski resorts, including Camelback Mountain Resort and Shawnee Mountain Ski Area. The county is also home to several manufacturing companies, including Sanofi Pasteur, a pharmaceutical company, and Pocono Raceway, a motorsports facility. Agriculture is also an important part of the county’s economy, with dairy farming being the most common type of farming.
Demographics
As of the 2010 census, Monroe County had a population of 169,842 people. The racial makeup of the county was 87.3% White, 6.2% African American, 0.5% Native American, 2.2% Asian, 0.1% Pacific Islander, 1.7% from other races, and 2.1% from two or more races. The median household income was $50,867, and the median family income was $60,945. The per capita income was $25,945.
Monroe County is home to a diverse population, with a variety of religious backgrounds. The largest religious group in the county is Catholic, followed by Protestant, Jewish, and other faiths. The county is also home to a large number of immigrants, with the largest groups being from Mexico, India, and the Dominican Republic.
Monroe County is a diverse and vibrant county with a rich history and a strong economy. The county is home to a variety of industries, from tourism to manufacturing, and is a great place to live and work.
Common Questions
What is Per Capita Income in Monroe County?
Per Capita income in Monroe County is $36,277.
What is the Median Family Income in Monroe County?
Median Family Income in Monroe County is $95,253.
What is the Median Household income in Monroe County?
Median Household Income in Monroe County is $80,656.
What is Income or Wage Gap in Monroe County?
Income or Wage Gap in Monroe County is 33.5%.
Women in Monroe County earn 66.5 cents for every dollar earned by a man.
What is Family Income Deficit in Monroe County?
Family Income Deficit in Monroe County is $11,814.
Families that are below poverty line in Monroe County earn $11,814 less on average than the poverty threshold level.
What is Inequality or Gini Index in Monroe County?
Inequality or Gini Index in Monroe County is 0.42.
What is the Total Population of Monroe County?
Total Population of Monroe County is 168,128.
What is the Total Male Population of Monroe County?
Total Male Population of Monroe County is 84,131.
What is the Total Female Population of Monroe County?
Total Female Population of Monroe County is 83,997.
What is the Ratio of Males per 100 Females in Monroe County?
There are 100.16 Males per 100 Females in Monroe County.
What is the Ratio of Females per 100 Males in Monroe County?
There are 99.84 Females per 100 Males in Monroe County.
What is the Median Population Age in Monroe County?
Median Population Age in Monroe County is 43.5 Years.
What is the Average Family Size in Monroe County
Average Family Size in Monroe County is 3.3 People.
What is the Average Household Size in Monroe County
Average Household Size in Monroe County is 2.8 People.
How Large is the Labor Force in Monroe County?
There are 84,585 People in the Labor Forcein in Monroe County.
What is the Percentage of People in the Labor Force in Monroe County?
60.6% of People are in the Labor Force in Monroe County.
What is the Unemployment Rate in Monroe County?
Unemployment Rate in Monroe County is 6.3%.