Mifflin County, PA Map & Demographics
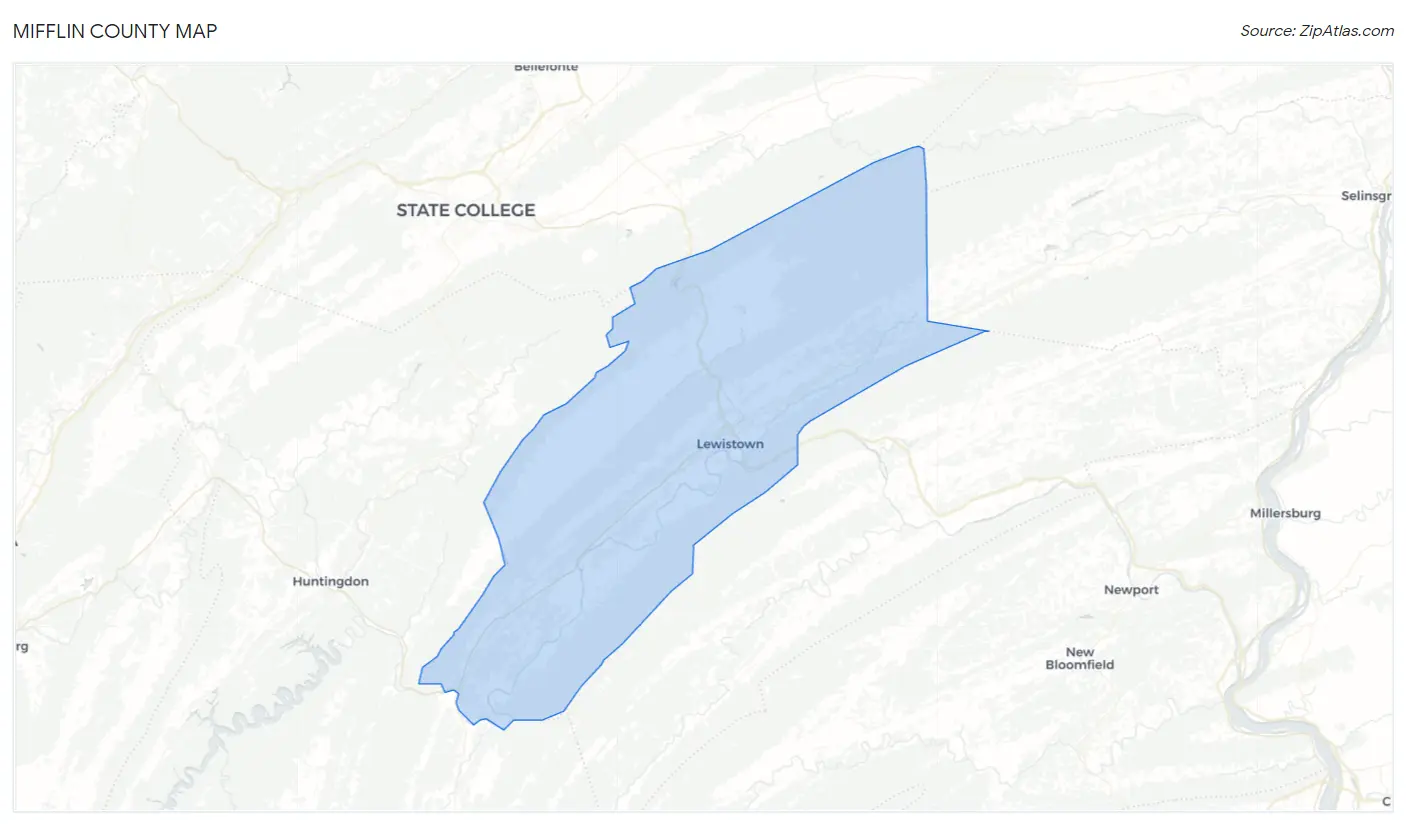
Mifflin County Map
Mifflin County Overview
$28,979
PER CAPITA INCOME
$67,657
AVG FAMILY INCOME
$58,012
AVG HOUSEHOLD INCOME
32.6%
WAGE / INCOME GAP [ % ]
67.4¢/ $1
WAGE / INCOME GAP [ $ ]
$9,101
FAMILY INCOME DEFICIT
0.40
INEQUALITY / GINI INDEX
46,146
TOTAL POPULATION
22,740
MALE POPULATION
23,406
FEMALE POPULATION
97.15
MALES / 100 FEMALES
102.93
FEMALES / 100 MALES
43.3
MEDIAN AGE
2.9
AVG FAMILY SIZE
2.4
AVG HOUSEHOLD SIZE
22,125
LABOR FORCE [ PEOPLE ]
59.9%
PERCENT IN LABOR FORCE
3.9%
UNEMPLOYMENT RATE
Income in Mifflin County
Income Overview in Mifflin County
Per Capita Income in Mifflin County is $28,979, while median incomes of families and households are $67,657 and $58,012 respectively.
| Characteristic | Number | Measure |
| Per Capita Income | 46,146 | $28,979 |
| Median Family Income | 12,671 | $67,657 |
| Mean Family Income | 12,671 | $80,345 |
| Median Household Income | 18,612 | $58,012 |
| Mean Household Income | 18,612 | $70,553 |
| Income Deficit | 12,671 | $9,101 |
| Wage / Income Gap (%) | 46,146 | 32.60% |
| Wage / Income Gap ($) | 46,146 | 67.40¢ per $1 |
| Gini / Inequality Index | 46,146 | 0.40 |
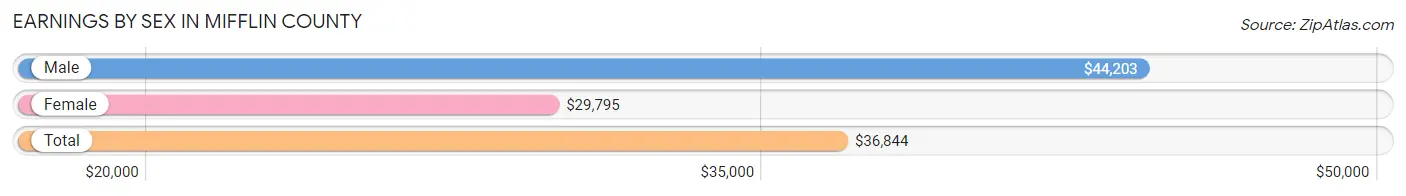
Earnings by Sex in Mifflin County
Average Earnings in Mifflin County are $36,844, $44,203 for men and $29,795 for women, a difference of 32.6%.
| Sex | Number | Average Earnings |
| Male | 12,582 (55.6%) | $44,203 |
| Female | 10,057 (44.4%) | $29,795 |
| Total | 22,639 (100.0%) | $36,844 |
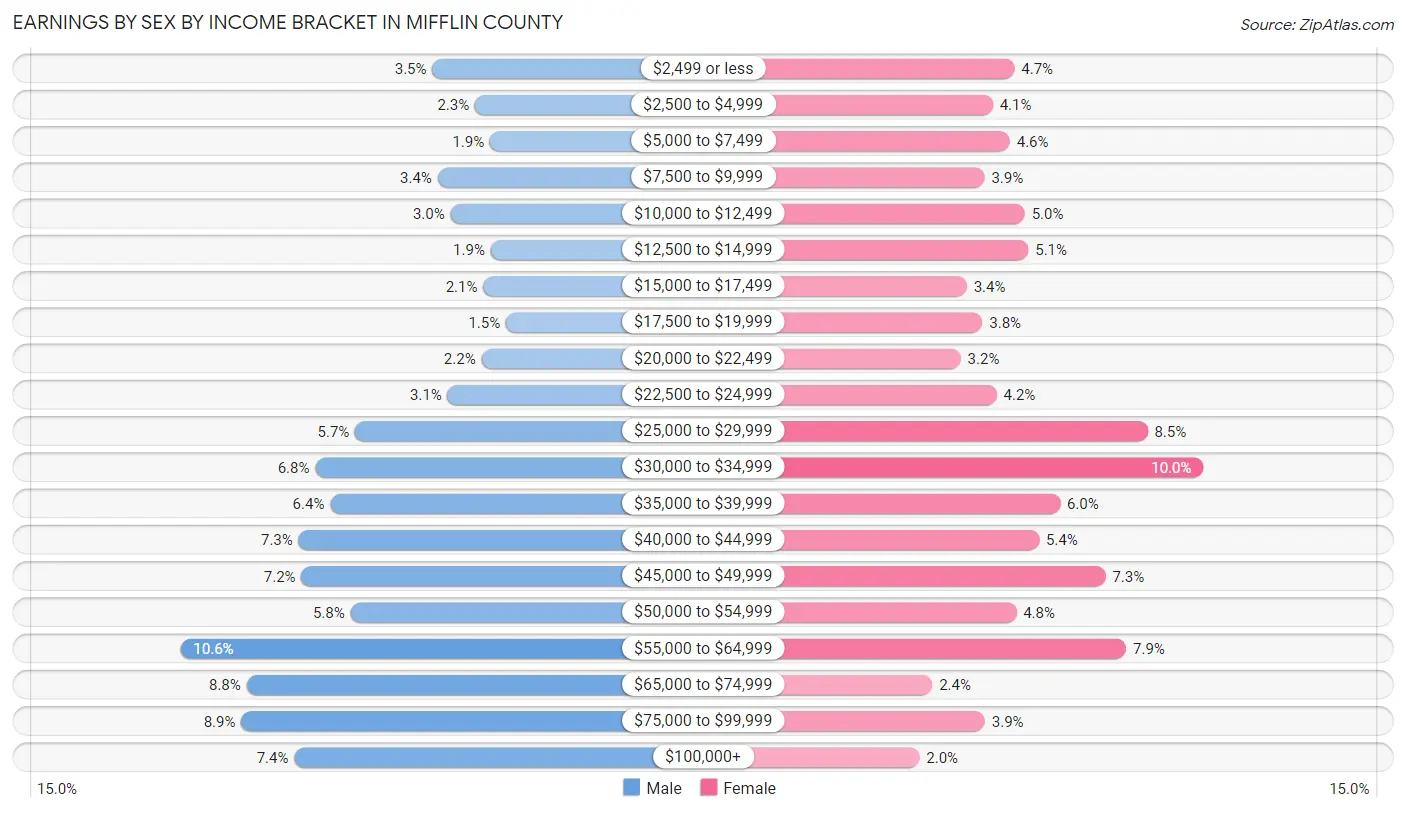
Earnings by Sex by Income Bracket in Mifflin County
The most common earnings brackets in Mifflin County are $55,000 to $64,999 for men (1,336 | 10.6%) and $30,000 to $34,999 for women (1,008 | 10.0%).
| Income | Male | Female |
| $2,499 or less | 446 (3.5%) | 474 (4.7%) |
| $2,500 to $4,999 | 295 (2.3%) | 412 (4.1%) |
| $5,000 to $7,499 | 242 (1.9%) | 461 (4.6%) |
| $7,500 to $9,999 | 427 (3.4%) | 389 (3.9%) |
| $10,000 to $12,499 | 381 (3.0%) | 503 (5.0%) |
| $12,500 to $14,999 | 239 (1.9%) | 513 (5.1%) |
| $15,000 to $17,499 | 266 (2.1%) | 339 (3.4%) |
| $17,500 to $19,999 | 185 (1.5%) | 383 (3.8%) |
| $20,000 to $22,499 | 272 (2.2%) | 322 (3.2%) |
| $22,500 to $24,999 | 391 (3.1%) | 423 (4.2%) |
| $25,000 to $29,999 | 718 (5.7%) | 850 (8.5%) |
| $30,000 to $34,999 | 859 (6.8%) | 1,008 (10.0%) |
| $35,000 to $39,999 | 807 (6.4%) | 602 (6.0%) |
| $40,000 to $44,999 | 918 (7.3%) | 543 (5.4%) |
| $45,000 to $49,999 | 909 (7.2%) | 731 (7.3%) |
| $50,000 to $54,999 | 735 (5.8%) | 479 (4.8%) |
| $55,000 to $64,999 | 1,336 (10.6%) | 789 (7.9%) |
| $65,000 to $74,999 | 1,102 (8.8%) | 241 (2.4%) |
| $75,000 to $99,999 | 1,121 (8.9%) | 390 (3.9%) |
| $100,000+ | 933 (7.4%) | 205 (2.0%) |
| Total | 12,582 (100.0%) | 10,057 (100.0%) |
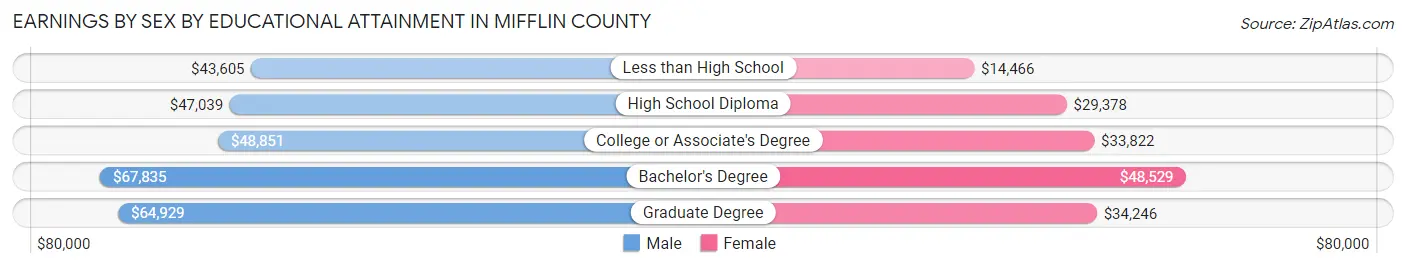
Earnings by Sex by Educational Attainment in Mifflin County
Average earnings in Mifflin County are $47,459 for men and $31,929 for women, a difference of 32.7%. Men with an educational attainment of bachelor's degree enjoy the highest average annual earnings of $67,835, while those with less than high school education earn the least with $43,605. Women with an educational attainment of bachelor's degree earn the most with the average annual earnings of $48,529, while those with less than high school education have the smallest earnings of $14,466.
| Educational Attainment | Male Income | Female Income |
| Less than High School | $43,605 | $14,466 |
| High School Diploma | $47,039 | $29,378 |
| College or Associate's Degree | $48,851 | $33,822 |
| Bachelor's Degree | $67,835 | $48,529 |
| Graduate Degree | $64,929 | $34,246 |
| Total | $47,459 | $31,929 |
Family Income in Mifflin County
Family Income Brackets in Mifflin County
According to the Mifflin County family income data, there are 3,028 families falling into the $50,000 to $74,999 income range, which is the most common income bracket and makes up 23.9% of all families. Conversely, the $10,000 to $14,999 income bracket is the least frequent group with only 139 families (1.1%) belonging to this category.
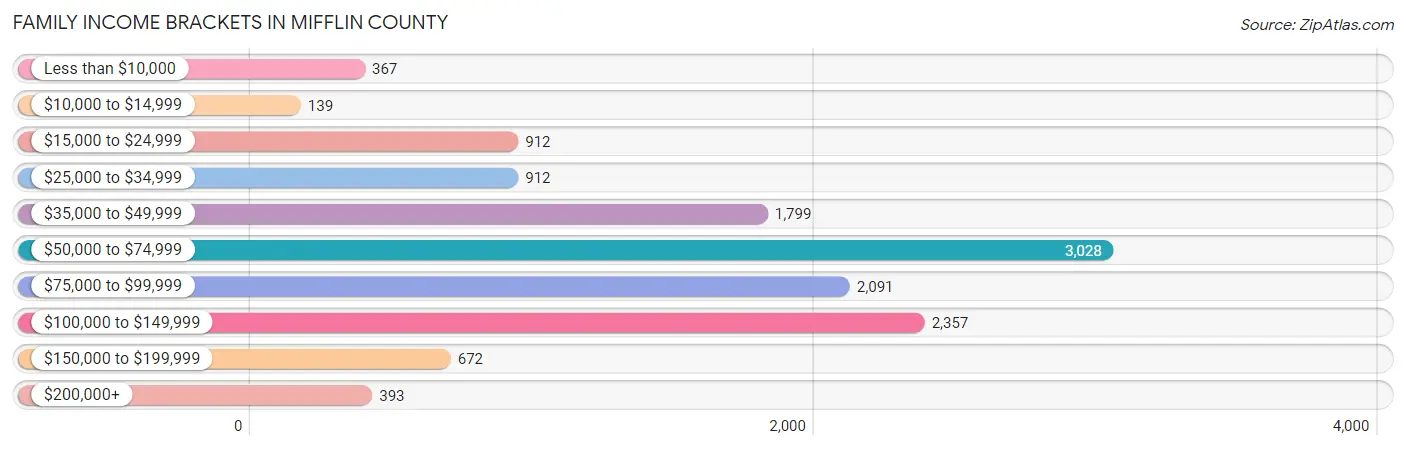
| Income Bracket | # Families | % Families |
| Less than $10,000 | 367 | 2.9% |
| $10,000 to $14,999 | 139 | 1.1% |
| $15,000 to $24,999 | 912 | 7.2% |
| $25,000 to $34,999 | 912 | 7.2% |
| $35,000 to $49,999 | 1,799 | 14.2% |
| $50,000 to $74,999 | 3,028 | 23.9% |
| $75,000 to $99,999 | 2,091 | 16.5% |
| $100,000 to $149,999 | 2,357 | 18.6% |
| $150,000 to $199,999 | 672 | 5.3% |
| $200,000+ | 393 | 3.1% |
Family Income by Famaliy Size in Mifflin County
4-person families (1,695 | 13.4%) account for the highest median family income in Mifflin County with $81,593 per family, while 2-person families (7,151 | 56.4%) have the highest median income of $31,462 per family member.
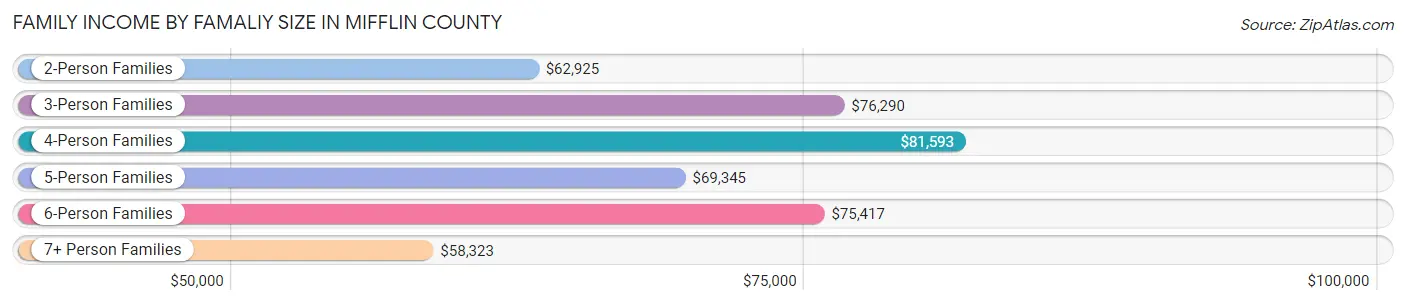
| Income Bracket | # Families | Median Income |
| 2-Person Families | 7,151 (56.4%) | $62,925 |
| 3-Person Families | 2,546 (20.1%) | $76,290 |
| 4-Person Families | 1,695 (13.4%) | $81,593 |
| 5-Person Families | 600 (4.7%) | $69,345 |
| 6-Person Families | 241 (1.9%) | $75,417 |
| 7+ Person Families | 438 (3.5%) | $58,323 |
| Total | 12,671 (100.0%) | $67,657 |
Family Income by Number of Earners in Mifflin County
The median family income in Mifflin County is $67,657, with families comprising 3+ earners (1,311) having the highest median family income of $115,208, while families with no earners (2,546) have the lowest median family income of $38,799, accounting for 10.3% and 20.1% of families, respectively.
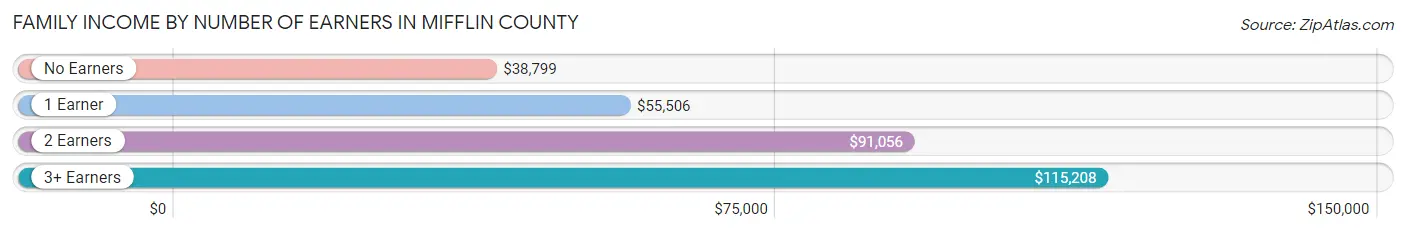
| Number of Earners | # Families | Median Income |
| No Earners | 2,546 (20.1%) | $38,799 |
| 1 Earner | 4,354 (34.4%) | $55,506 |
| 2 Earners | 4,460 (35.2%) | $91,056 |
| 3+ Earners | 1,311 (10.3%) | $115,208 |
| Total | 12,671 (100.0%) | $67,657 |
Household Income in Mifflin County
Household Income Brackets in Mifflin County
With 4,057 households falling in the category, the $50,000 to $74,999 income range is the most frequent in Mifflin County, accounting for 21.8% of all households. In contrast, only 465 households (2.5%) fall into the $200,000+ income bracket, making it the least populous group.
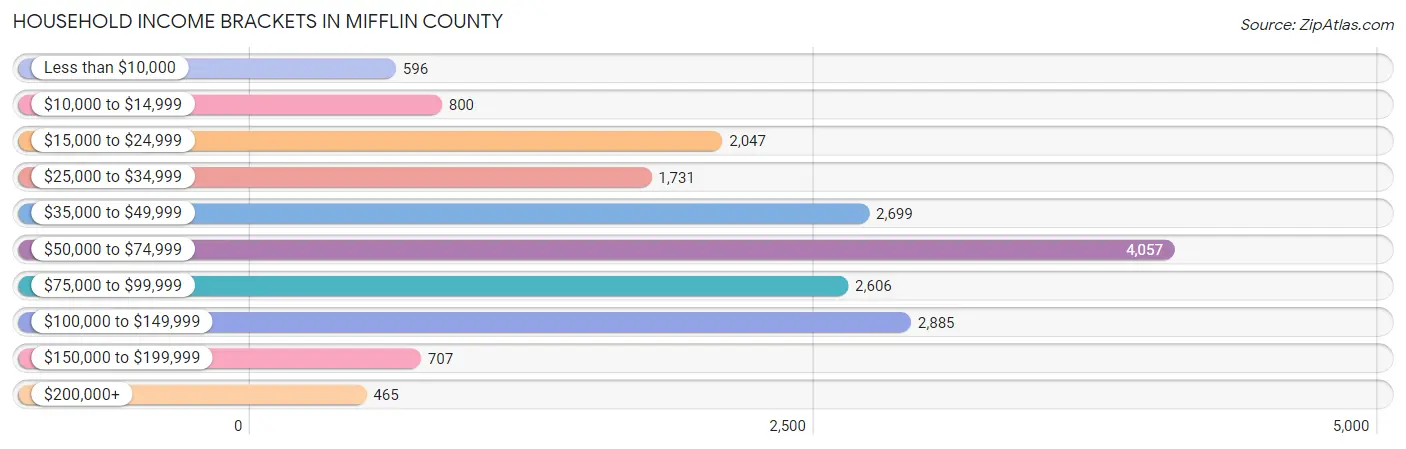
| Income Bracket | # Households | % Households |
| Less than $10,000 | 596 | 3.2% |
| $10,000 to $14,999 | 800 | 4.3% |
| $15,000 to $24,999 | 2,047 | 11.0% |
| $25,000 to $34,999 | 1,731 | 9.3% |
| $35,000 to $49,999 | 2,699 | 14.5% |
| $50,000 to $74,999 | 4,057 | 21.8% |
| $75,000 to $99,999 | 2,606 | 14.0% |
| $100,000 to $149,999 | 2,885 | 15.5% |
| $150,000 to $199,999 | 707 | 3.8% |
| $200,000+ | 465 | 2.5% |
Household Income by Householder Age in Mifflin County
The median household income in Mifflin County is $58,012, with the highest median household income of $69,779 found in the 45 to 64 years age bracket for the primary householder. A total of 7,080 households (38.0%) fall into this category. Meanwhile, the 65+ years age bracket for the primary householder has the lowest median household income of $41,227, with 6,024 households (32.4%) in this group.
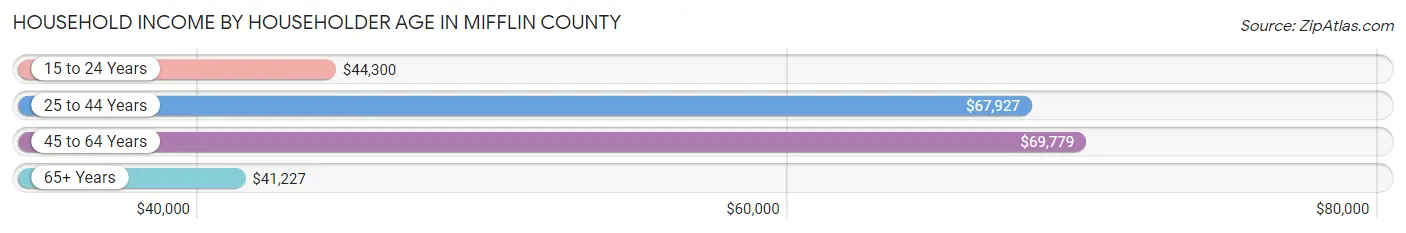
| Income Bracket | # Households | Median Income |
| 15 to 24 Years | 630 (3.4%) | $44,300 |
| 25 to 44 Years | 4,878 (26.2%) | $67,927 |
| 45 to 64 Years | 7,080 (38.0%) | $69,779 |
| 65+ Years | 6,024 (32.4%) | $41,227 |
| Total | 18,612 (100.0%) | $58,012 |
Poverty in Mifflin County
Income Below Poverty by Sex and Age in Mifflin County
With 14.8% poverty level for males and 18.5% for females among the residents of Mifflin County, 15 year old males and under 5 year old females are the most vulnerable to poverty, with 126 males (48.1%) and 513 females (34.8%) in their respective age groups living below the poverty level.
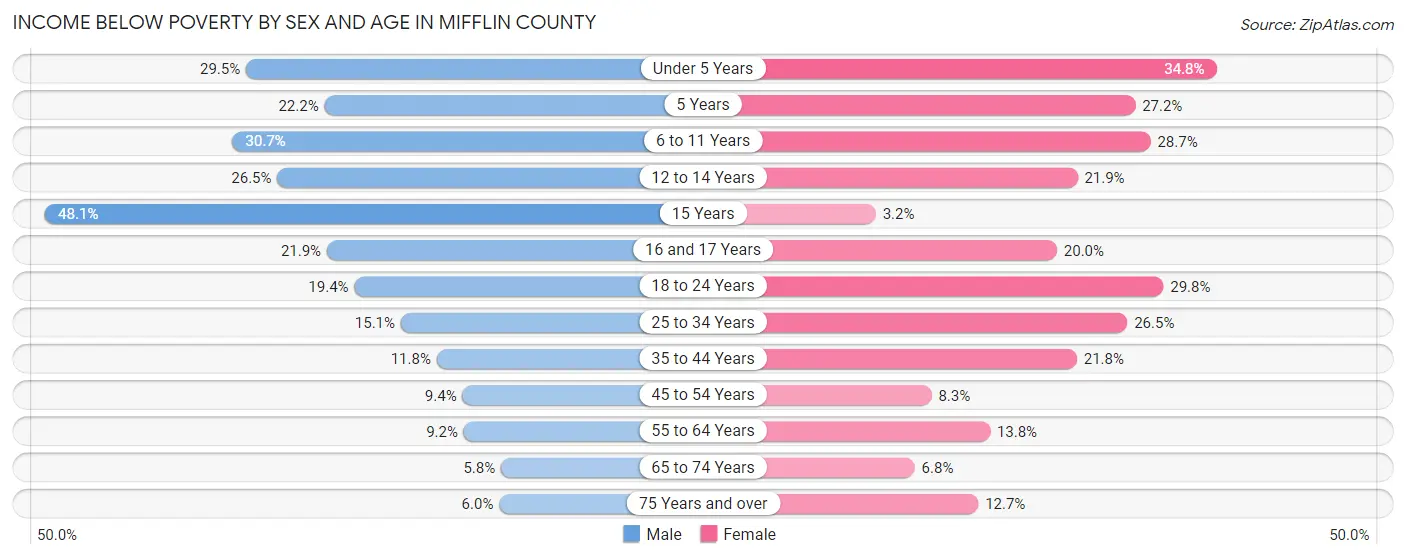
| Age Bracket | Male | Female |
| Under 5 Years | 430 (29.4%) | 513 (34.8%) |
| 5 Years | 47 (22.2%) | 64 (27.2%) |
| 6 to 11 Years | 465 (30.7%) | 550 (28.6%) |
| 12 to 14 Years | 267 (26.5%) | 152 (21.9%) |
| 15 Years | 126 (48.1%) | 9 (3.2%) |
| 16 and 17 Years | 138 (21.9%) | 106 (20.0%) |
| 18 to 24 Years | 336 (19.4%) | 493 (29.8%) |
| 25 to 34 Years | 395 (15.1%) | 665 (26.5%) |
| 35 to 44 Years | 280 (11.7%) | 530 (21.8%) |
| 45 to 54 Years | 279 (9.4%) | 235 (8.3%) |
| 55 to 64 Years | 301 (9.2%) | 444 (13.8%) |
| 65 to 74 Years | 147 (5.8%) | 193 (6.8%) |
| 75 Years and over | 106 (5.9%) | 300 (12.7%) |
| Total | 3,317 (14.8%) | 4,254 (18.5%) |
Income Above Poverty by Sex and Age in Mifflin County
According to the poverty statistics in Mifflin County, males aged 65 to 74 years and females aged 15 years are the age groups that are most secure financially, with 94.2% of males and 96.9% of females in these age groups living above the poverty line.
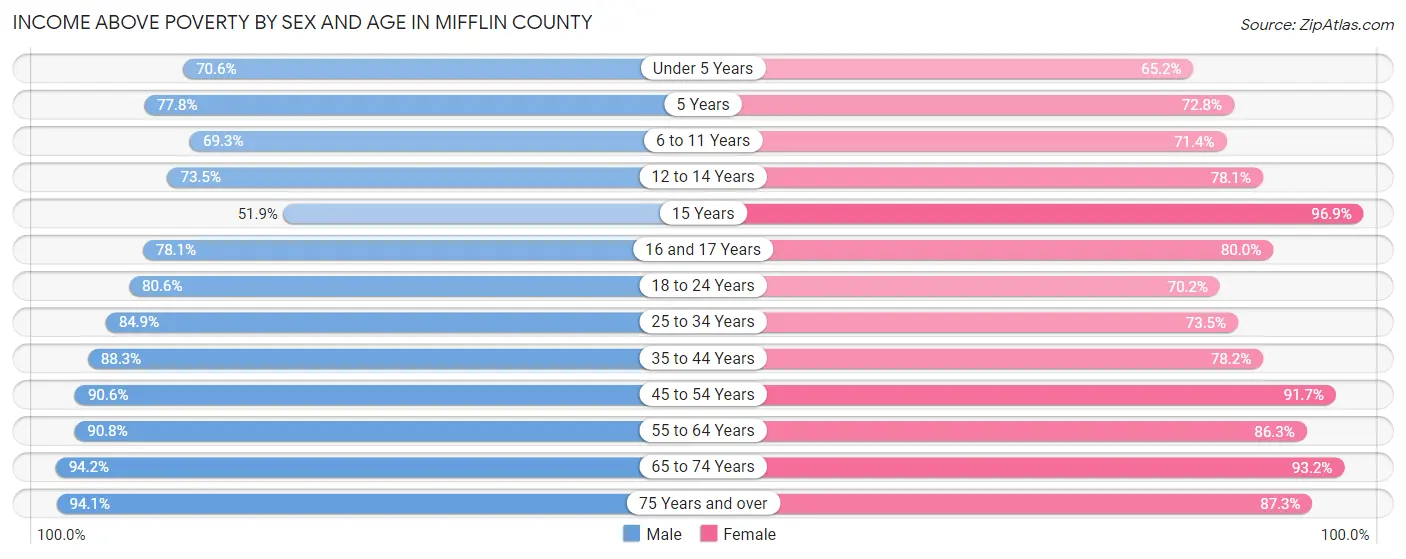
| Age Bracket | Male | Female |
| Under 5 Years | 1,030 (70.6%) | 963 (65.2%) |
| 5 Years | 165 (77.8%) | 171 (72.8%) |
| 6 to 11 Years | 1,049 (69.3%) | 1,370 (71.4%) |
| 12 to 14 Years | 739 (73.5%) | 543 (78.1%) |
| 15 Years | 136 (51.9%) | 277 (96.9%) |
| 16 and 17 Years | 491 (78.1%) | 425 (80.0%) |
| 18 to 24 Years | 1,397 (80.6%) | 1,159 (70.2%) |
| 25 to 34 Years | 2,224 (84.9%) | 1,845 (73.5%) |
| 35 to 44 Years | 2,102 (88.2%) | 1,900 (78.2%) |
| 45 to 54 Years | 2,703 (90.6%) | 2,590 (91.7%) |
| 55 to 64 Years | 2,957 (90.8%) | 2,785 (86.3%) |
| 65 to 74 Years | 2,396 (94.2%) | 2,662 (93.2%) |
| 75 Years and over | 1,676 (94.1%) | 2,070 (87.3%) |
| Total | 19,065 (85.2%) | 18,760 (81.5%) |
Income Below Poverty Among Married-Couple Families in Mifflin County
The poverty statistics for married-couple families in Mifflin County show that 7.0% or 691 of the total 9,833 families live below the poverty line. Families with 5 or more children have the highest poverty rate of 48.3%, comprising of 131 families. On the other hand, families with no children have the lowest poverty rate of 2.4%, which includes 161 families.
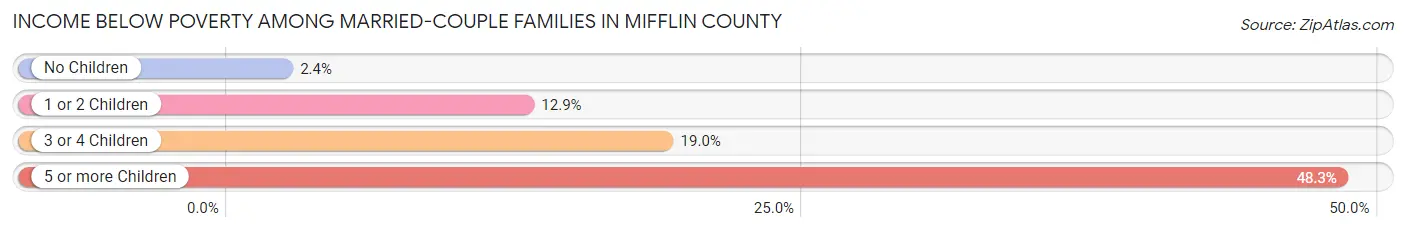
| Children | Above Poverty | Below Poverty |
| No Children | 6,543 (97.6%) | 161 (2.4%) |
| 1 or 2 Children | 2,053 (87.1%) | 304 (12.9%) |
| 3 or 4 Children | 406 (81.0%) | 95 (19.0%) |
| 5 or more Children | 140 (51.7%) | 131 (48.3%) |
| Total | 9,142 (93.0%) | 691 (7.0%) |
Income Below Poverty Among Single-Parent Households in Mifflin County
According to the poverty data in Mifflin County, 17.7% or 184 single-father households and 30.2% or 543 single-mother households are living below the poverty line. Among single-father households, those with 3 or 4 children have the highest poverty rate, with 31 households (20.8%) experiencing poverty. Likewise, among single-mother households, those with 3 or 4 children have the highest poverty rate, with 161 households (80.1%) falling below the poverty line.
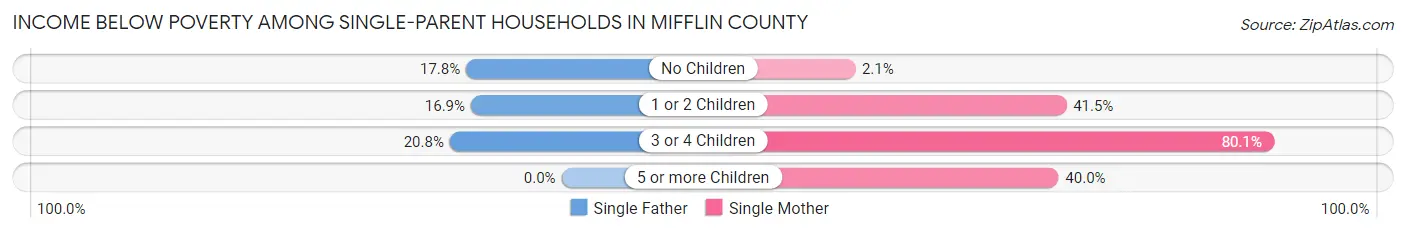
| Children | Single Father | Single Mother |
| No Children | 59 (17.8%) | 15 (2.1%) |
| 1 or 2 Children | 94 (16.9%) | 361 (41.4%) |
| 3 or 4 Children | 31 (20.8%) | 161 (80.1%) |
| 5 or more Children | 0 (0.0%) | 6 (40.0%) |
| Total | 184 (17.7%) | 543 (30.2%) |
Income Below Poverty Among Married-Couple vs Single-Parent Households in Mifflin County
The poverty data for Mifflin County shows that 691 of the married-couple family households (7.0%) and 727 of the single-parent households (25.6%) are living below the poverty level. Within the married-couple family households, those with 5 or more children have the highest poverty rate, with 131 households (48.3%) falling below the poverty line. Among the single-parent households, those with 3 or 4 children have the highest poverty rate, with 192 household (54.9%) living below poverty.
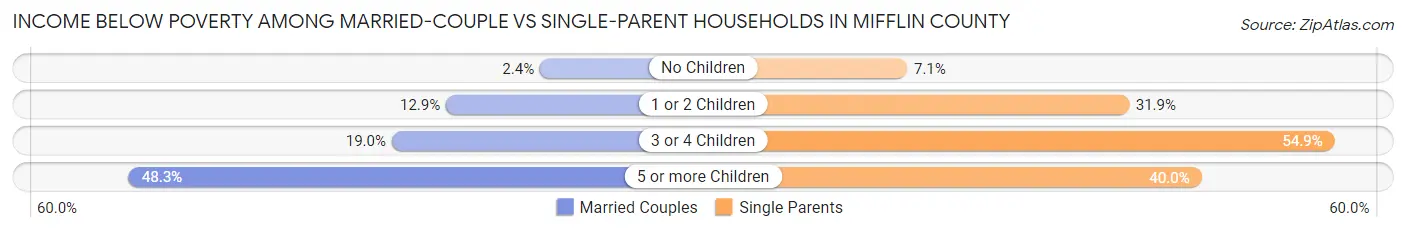
| Children | Married-Couple Families | Single-Parent Households |
| No Children | 161 (2.4%) | 74 (7.1%) |
| 1 or 2 Children | 304 (12.9%) | 455 (31.9%) |
| 3 or 4 Children | 95 (19.0%) | 192 (54.9%) |
| 5 or more Children | 131 (48.3%) | 6 (40.0%) |
| Total | 691 (7.0%) | 727 (25.6%) |
Race in Mifflin County
The most populous races in Mifflin County are White / Caucasian (43,747 | 94.8%), Two or more Races (1,603 | 3.5%), and Hispanic or Latino (825 | 1.8%).
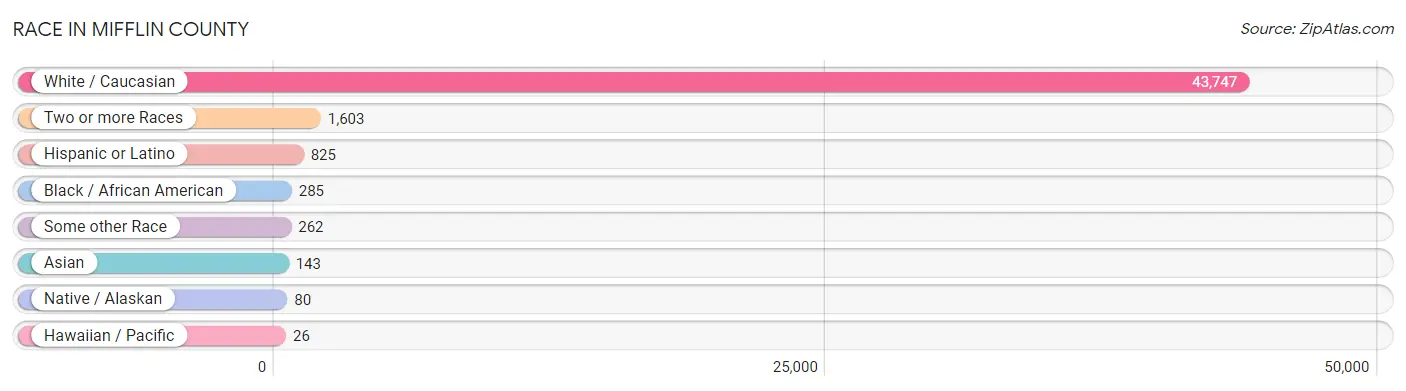
| Race | # Population | % Population |
| Asian | 143 | 0.3% |
| Black / African American | 285 | 0.6% |
| Hawaiian / Pacific | 26 | 0.1% |
| Hispanic or Latino | 825 | 1.8% |
| Native / Alaskan | 80 | 0.2% |
| White / Caucasian | 43,747 | 94.8% |
| Two or more Races | 1,603 | 3.5% |
| Some other Race | 262 | 0.6% |
| Total | 46,146 | 100.0% |
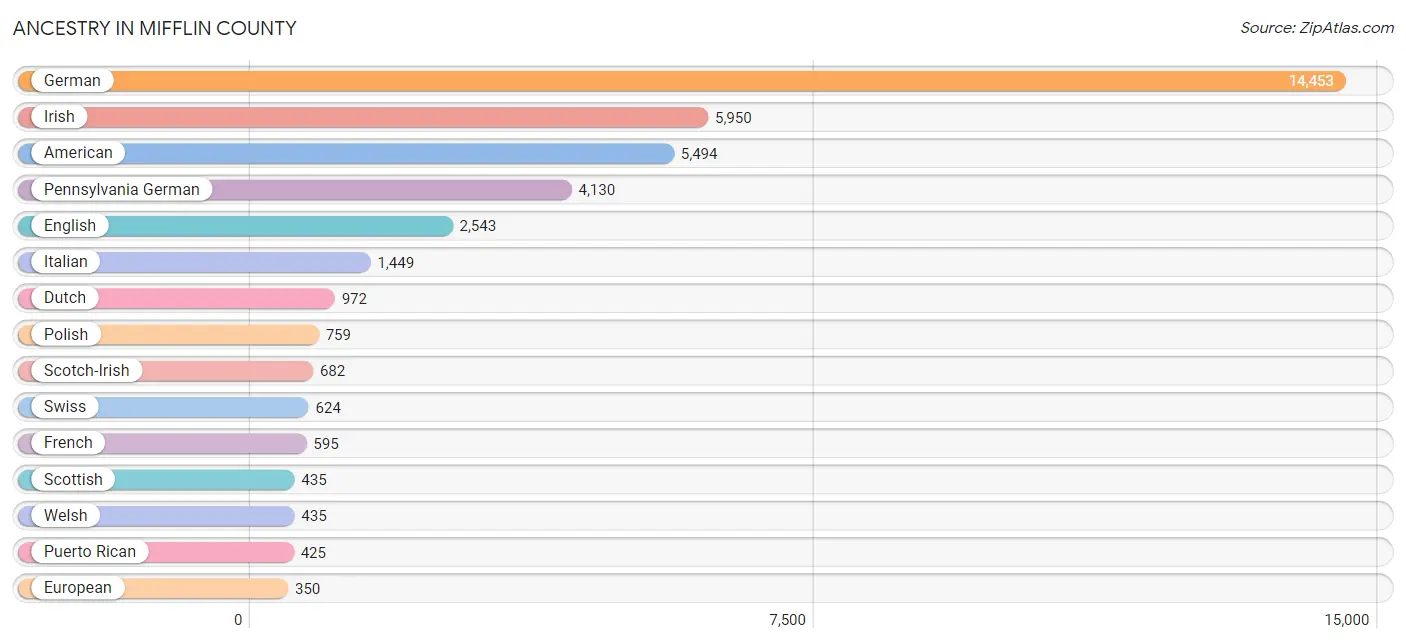
Ancestry in Mifflin County
The most populous ancestries reported in Mifflin County are German (14,453 | 31.3%), Irish (5,950 | 12.9%), American (5,494 | 11.9%), Pennsylvania German (4,130 | 8.9%), and English (2,543 | 5.5%), together accounting for 70.6% of all Mifflin County residents.
| Ancestry | # Population | % Population |
| African | 4 | 0.0% |
| American | 5,494 | 11.9% |
| Arab | 33 | 0.1% |
| Austrian | 34 | 0.1% |
| Belgian | 92 | 0.2% |
| Bhutanese | 29 | 0.1% |
| Brazilian | 21 | 0.1% |
| British | 65 | 0.1% |
| Burmese | 107 | 0.2% |
| Canadian | 23 | 0.1% |
| Central American | 43 | 0.1% |
| Cherokee | 14 | 0.0% |
| Chilean | 30 | 0.1% |
| Chippewa | 2 | 0.0% |
| Croatian | 29 | 0.1% |
| Cuban | 14 | 0.0% |
| Czech | 3 | 0.0% |
| Czechoslovakian | 14 | 0.0% |
| Danish | 58 | 0.1% |
| Dutch | 972 | 2.1% |
| Eastern European | 62 | 0.1% |
| English | 2,543 | 5.5% |
| European | 350 | 0.8% |
| French | 595 | 1.3% |
| French American Indian | 15 | 0.0% |
| German | 14,453 | 31.3% |
| Greek | 31 | 0.1% |
| Hungarian | 118 | 0.3% |
| Indian (Asian) | 100 | 0.2% |
| Iranian | 6 | 0.0% |
| Irish | 5,950 | 12.9% |
| Israeli | 9 | 0.0% |
| Italian | 1,449 | 3.1% |
| Korean | 50 | 0.1% |
| Lithuanian | 38 | 0.1% |
| Mexican | 279 | 0.6% |
| Moroccan | 30 | 0.1% |
| Native Hawaiian | 43 | 0.1% |
| Northern European | 12 | 0.0% |
| Norwegian | 131 | 0.3% |
| Pakistani | 12 | 0.0% |
| Panamanian | 25 | 0.1% |
| Paraguayan | 10 | 0.0% |
| Pennsylvania German | 4,130 | 8.9% |
| Polish | 759 | 1.6% |
| Portuguese | 10 | 0.0% |
| Puerto Rican | 425 | 0.9% |
| Romanian | 2 | 0.0% |
| Russian | 113 | 0.2% |
| Salvadoran | 18 | 0.0% |
| Scandinavian | 82 | 0.2% |
| Scotch-Irish | 682 | 1.5% |
| Scottish | 435 | 0.9% |
| Seminole | 2 | 0.0% |
| Shoshone | 39 | 0.1% |
| Sioux | 11 | 0.0% |
| Slavic | 27 | 0.1% |
| Slovak | 30 | 0.1% |
| South American | 40 | 0.1% |
| Spanish | 24 | 0.1% |
| Sri Lankan | 27 | 0.1% |
| Subsaharan African | 4 | 0.0% |
| Swedish | 193 | 0.4% |
| Swiss | 624 | 1.3% |
| Syrian | 3 | 0.0% |
| Thai | 37 | 0.1% |
| Ukrainian | 41 | 0.1% |
| Welsh | 435 | 0.9% |
| Yugoslavian | 5 | 0.0% | View All 69 Rows |
Immigrants in Mifflin County
The most numerous immigrant groups reported in Mifflin County came from Asia (169 | 0.4%), Latin America (117 | 0.3%), South Central Asia (84 | 0.2%), Central America (77 | 0.2%), and Mexico (77 | 0.2%), together accounting for 1.1% of all Mifflin County residents.
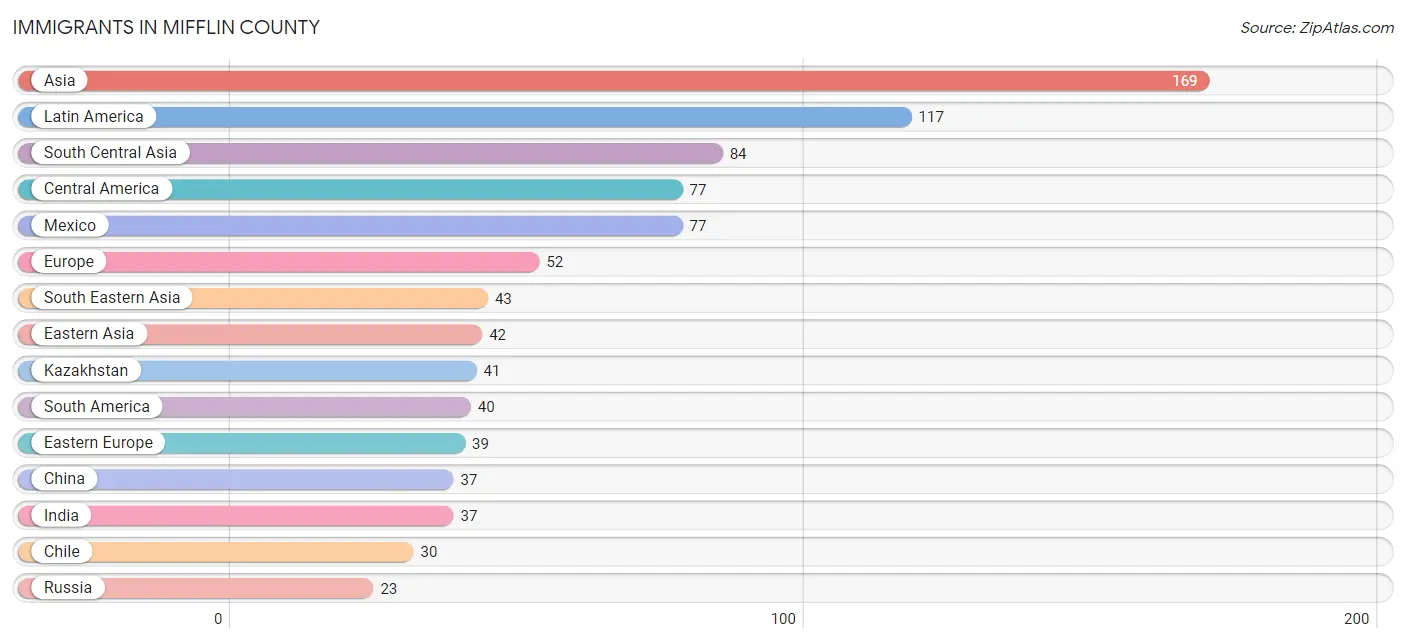
| Immigration Origin | # Population | % Population |
| Asia | 169 | 0.4% |
| Australia | 12 | 0.0% |
| Canada | 10 | 0.0% |
| Central America | 77 | 0.2% |
| Chile | 30 | 0.1% |
| China | 37 | 0.1% |
| Eastern Asia | 42 | 0.1% |
| Eastern Europe | 39 | 0.1% |
| Europe | 52 | 0.1% |
| Germany | 3 | 0.0% |
| India | 37 | 0.1% |
| Iran | 6 | 0.0% |
| Ireland | 1 | 0.0% |
| Italy | 7 | 0.0% |
| Kazakhstan | 41 | 0.1% |
| Korea | 5 | 0.0% |
| Latin America | 117 | 0.3% |
| Mexico | 77 | 0.2% |
| Northern Europe | 1 | 0.0% |
| Oceania | 12 | 0.0% |
| Philippines | 13 | 0.0% |
| Russia | 23 | 0.1% |
| South America | 40 | 0.1% |
| South Central Asia | 84 | 0.2% |
| South Eastern Asia | 43 | 0.1% |
| Southern Europe | 7 | 0.0% |
| Thailand | 15 | 0.0% |
| Vietnam | 15 | 0.0% |
| Western Europe | 5 | 0.0% | View All 29 Rows |
Sex and Age in Mifflin County
Sex and Age in Mifflin County
The most populous age groups in Mifflin County are 10 to 14 Years (1,653 | 7.3%) for men and 55 to 59 Years (1,638 | 7.0%) for women.
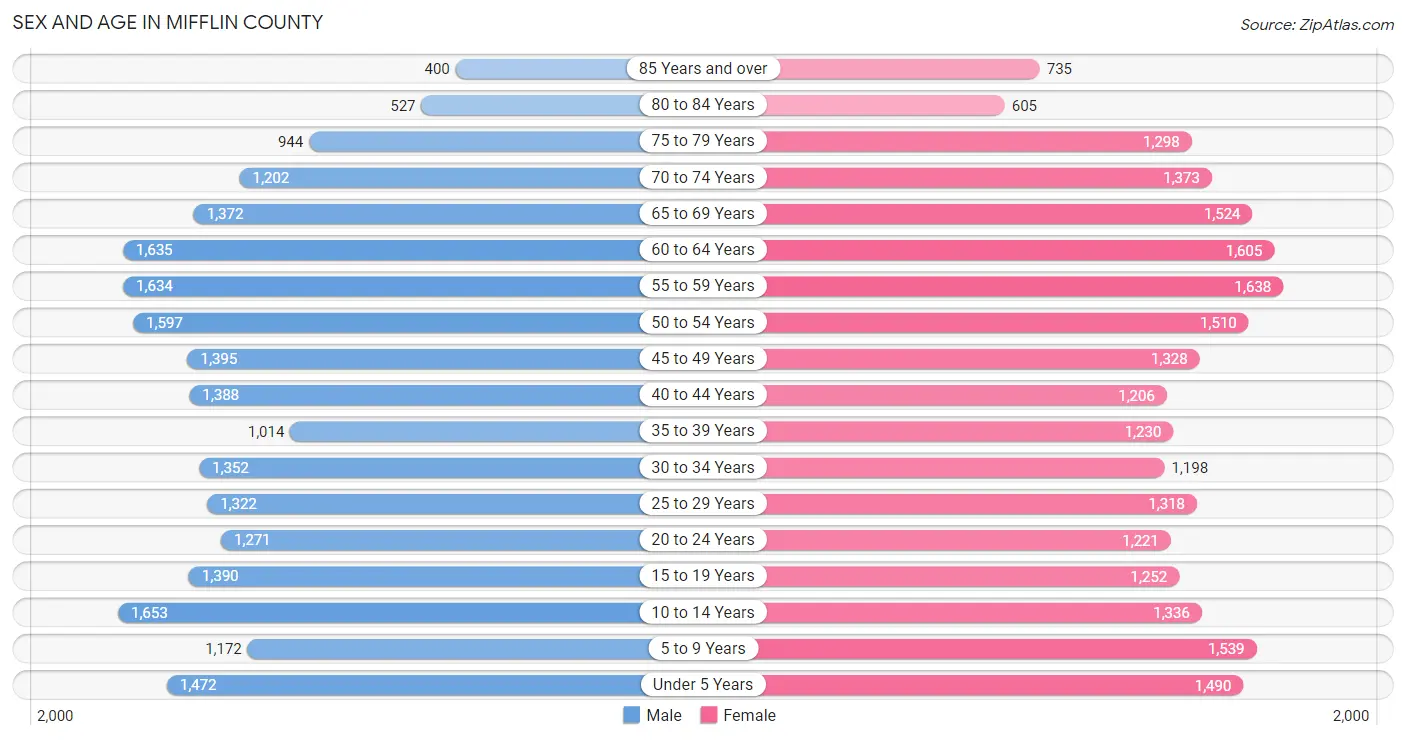
| Age Bracket | Male | Female |
| Under 5 Years | 1,472 (6.5%) | 1,490 (6.4%) |
| 5 to 9 Years | 1,172 (5.1%) | 1,539 (6.6%) |
| 10 to 14 Years | 1,653 (7.3%) | 1,336 (5.7%) |
| 15 to 19 Years | 1,390 (6.1%) | 1,252 (5.3%) |
| 20 to 24 Years | 1,271 (5.6%) | 1,221 (5.2%) |
| 25 to 29 Years | 1,322 (5.8%) | 1,318 (5.6%) |
| 30 to 34 Years | 1,352 (5.9%) | 1,198 (5.1%) |
| 35 to 39 Years | 1,014 (4.5%) | 1,230 (5.3%) |
| 40 to 44 Years | 1,388 (6.1%) | 1,206 (5.1%) |
| 45 to 49 Years | 1,395 (6.1%) | 1,328 (5.7%) |
| 50 to 54 Years | 1,597 (7.0%) | 1,510 (6.5%) |
| 55 to 59 Years | 1,634 (7.2%) | 1,638 (7.0%) |
| 60 to 64 Years | 1,635 (7.2%) | 1,605 (6.9%) |
| 65 to 69 Years | 1,372 (6.0%) | 1,524 (6.5%) |
| 70 to 74 Years | 1,202 (5.3%) | 1,373 (5.9%) |
| 75 to 79 Years | 944 (4.2%) | 1,298 (5.6%) |
| 80 to 84 Years | 527 (2.3%) | 605 (2.6%) |
| 85 Years and over | 400 (1.8%) | 735 (3.1%) |
| Total | 22,740 (100.0%) | 23,406 (100.0%) |
Families and Households in Mifflin County
Median Family Size in Mifflin County
The median family size in Mifflin County is 2.93 persons per family, with married-couple families (9,833 | 77.6%) accounting for the largest median family size of 3.01 persons per family. On the other hand, single female/mother families (1,800 | 14.2%) represent the smallest median family size with 2.60 persons per family.
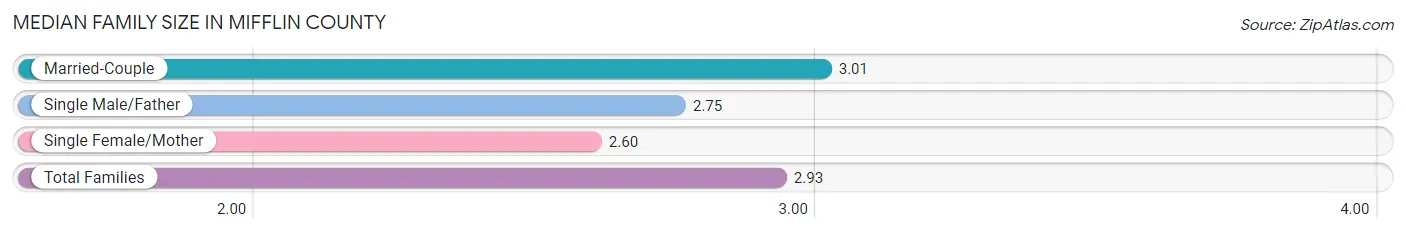
| Family Type | # Families | Family Size |
| Married-Couple | 9,833 (77.6%) | 3.01 |
| Single Male/Father | 1,038 (8.2%) | 2.75 |
| Single Female/Mother | 1,800 (14.2%) | 2.60 |
| Total Families | 12,671 (100.0%) | 2.93 |
Median Household Size in Mifflin County
The median household size in Mifflin County is 2.44 persons per household, with single male/father households (1,038 | 5.6%) accounting for the largest median household size of 3.46 persons per household. non-family households (5,941 | 31.9%) represent the smallest median household size with 1.19 persons per household.
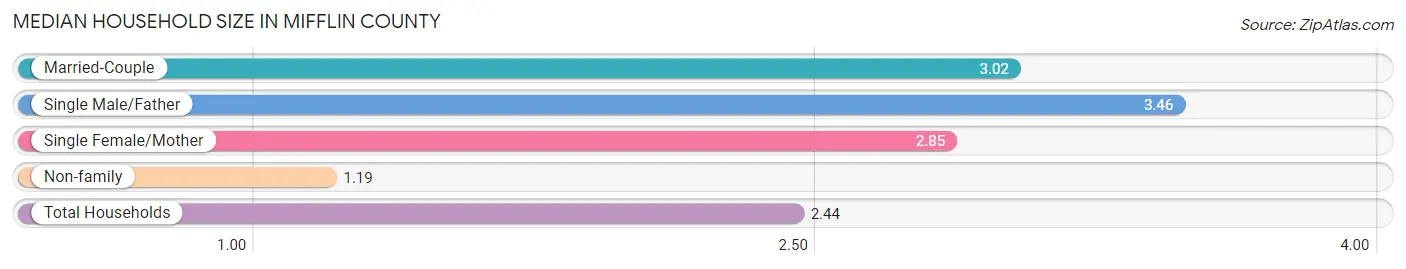
| Household Type | # Households | Household Size |
| Married-Couple | 9,833 (52.8%) | 3.02 |
| Single Male/Father | 1,038 (5.6%) | 3.46 |
| Single Female/Mother | 1,800 (9.7%) | 2.85 |
| Non-family | 5,941 (31.9%) | 1.19 |
| Total Households | 18,612 (100.0%) | 2.44 |
Household Size by Marriage Status in Mifflin County
Out of a total of 18,612 households in Mifflin County, 12,671 (68.1%) are family households, while 5,941 (31.9%) are nonfamily households. The most numerous type of family households are 2-person households, comprising 6,625, and the most common type of nonfamily households are 1-person households, comprising 4,988.
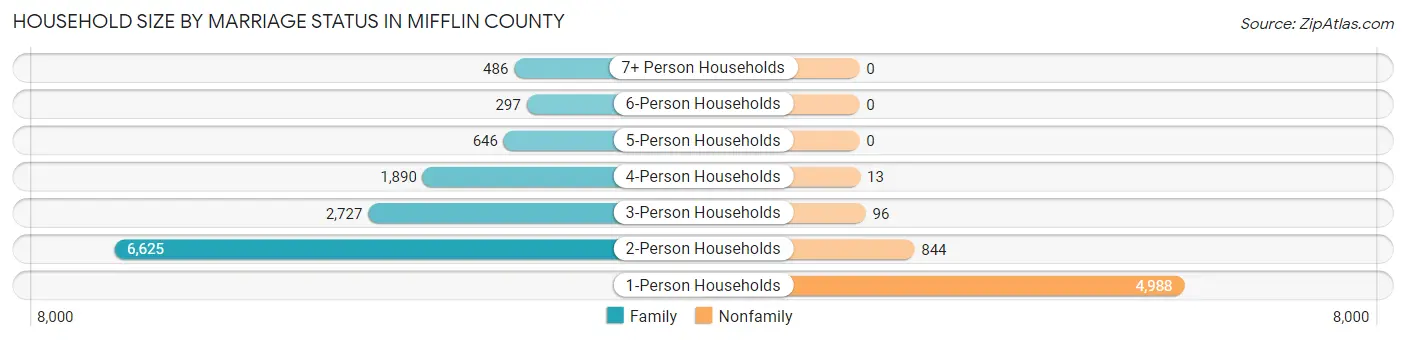
| Household Size | Family Households | Nonfamily Households |
| 1-Person Households | - | 4,988 (26.8%) |
| 2-Person Households | 6,625 (35.6%) | 844 (4.5%) |
| 3-Person Households | 2,727 (14.6%) | 96 (0.5%) |
| 4-Person Households | 1,890 (10.2%) | 13 (0.1%) |
| 5-Person Households | 646 (3.5%) | 0 (0.0%) |
| 6-Person Households | 297 (1.6%) | 0 (0.0%) |
| 7+ Person Households | 486 (2.6%) | 0 (0.0%) |
| Total | 12,671 (68.1%) | 5,941 (31.9%) |
Female Fertility in Mifflin County
Fertility by Age in Mifflin County
Average fertility rate in Mifflin County is 73.0 births per 1,000 women. Women in the age bracket of 20 to 34 years have the highest fertility rate with 159.0 births per 1,000 women. Women in the age bracket of 20 to 34 years acount for 90.6% of all women with births.
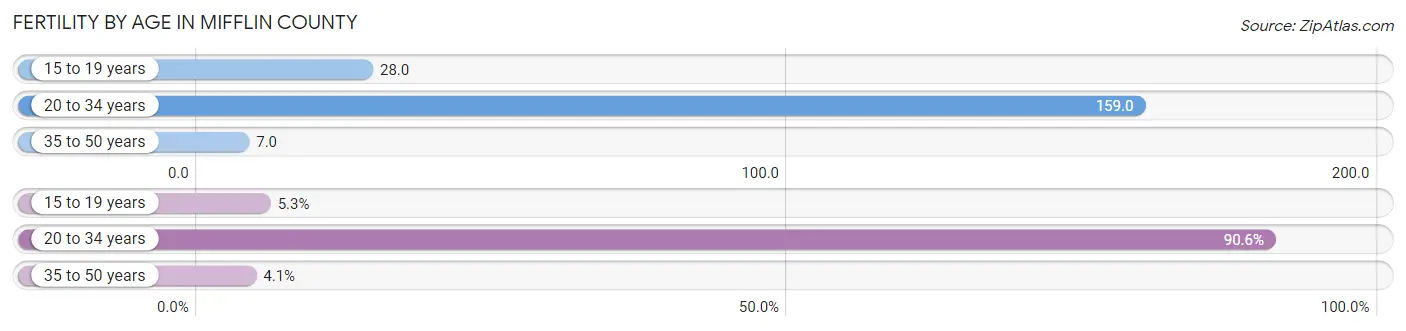
| Age Bracket | Women with Births | Births / 1,000 Women |
| 15 to 19 years | 35 (5.3%) | 28.0 |
| 20 to 34 years | 596 (90.6%) | 159.0 |
| 35 to 50 years | 27 (4.1%) | 7.0 |
| Total | 658 (100.0%) | 73.0 |
Fertility by Age by Marriage Status in Mifflin County
65.7% of women with births (658) in Mifflin County are married. The highest percentage of unmarried women with births falls into 15 to 19 years age bracket with 100.0% of them unmarried at the time of birth, while the lowest percentage of unmarried women with births belong to 35 to 50 years age bracket with 3.7% of them unmarried.
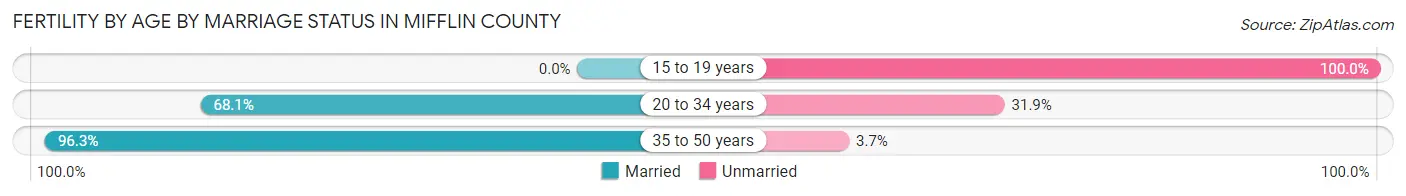
| Age Bracket | Married | Unmarried |
| 15 to 19 years | 0 (0.0%) | 35 (100.0%) |
| 20 to 34 years | 406 (68.1%) | 190 (31.9%) |
| 35 to 50 years | 26 (96.3%) | 1 (3.7%) |
| Total | 432 (65.6%) | 226 (34.4%) |
Fertility by Education in Mifflin County
Average fertility rate in Mifflin County is 73.0 births per 1,000 women. Women with the education attainment of less than high school have the highest fertility rate of 85.0 births per 1,000 women, while women with the education attainment of graduate degree have the lowest fertility at 36.0 births per 1,000 women. Women with the education attainment of high school diploma represent 40.6% of all women with births.
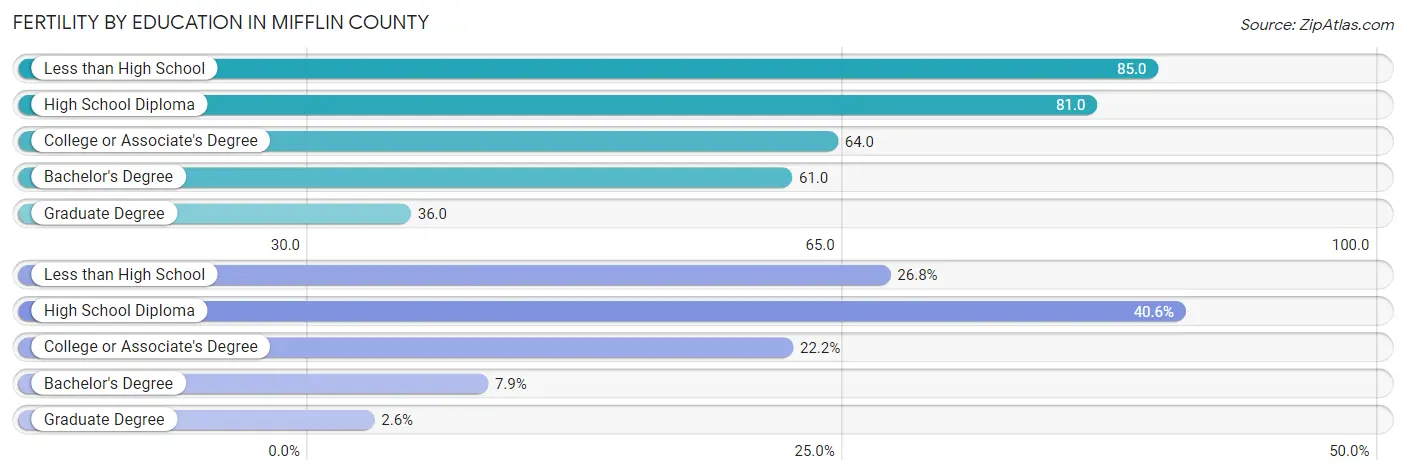
| Educational Attainment | Women with Births | Births / 1,000 Women |
| Less than High School | 176 (26.8%) | 85.0 |
| High School Diploma | 267 (40.6%) | 81.0 |
| College or Associate's Degree | 146 (22.2%) | 64.0 |
| Bachelor's Degree | 52 (7.9%) | 61.0 |
| Graduate Degree | 17 (2.6%) | 36.0 |
| Total | 658 (100.0%) | 73.0 |
Fertility by Education by Marriage Status in Mifflin County
34.4% of women with births in Mifflin County are unmarried. Women with the educational attainment of bachelor's degree are most likely to be married with 100.0% of them married at childbirth, while women with the educational attainment of high school diploma are least likely to be married with 62.5% of them unmarried at childbirth.
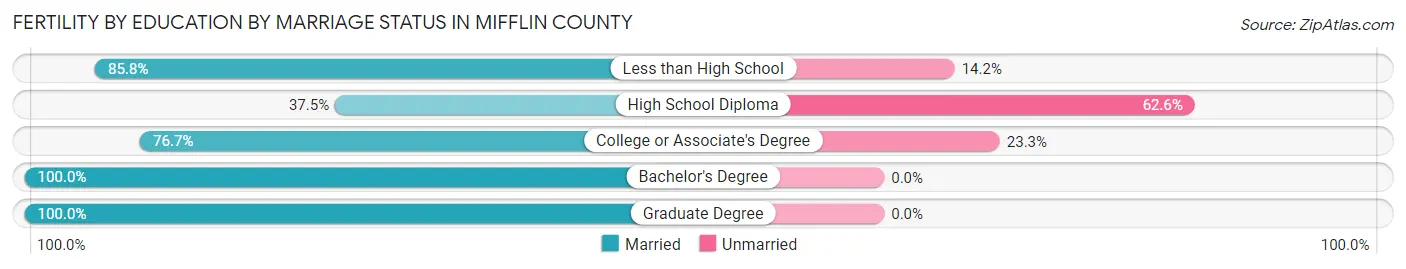
| Educational Attainment | Married | Unmarried |
| Less than High School | 151 (85.8%) | 25 (14.2%) |
| High School Diploma | 100 (37.4%) | 167 (62.5%) |
| College or Associate's Degree | 112 (76.7%) | 34 (23.3%) |
| Bachelor's Degree | 52 (100.0%) | 0 (0.0%) |
| Graduate Degree | 17 (100.0%) | 0 (0.0%) |
| Total | 432 (65.6%) | 226 (34.4%) |
Employment Characteristics in Mifflin County
Employment by Class of Employer in Mifflin County
Among the 21,056 employed individuals in Mifflin County, private company employees (15,045 | 71.5%), not-for-profit organizations (1,787 | 8.5%), and self-employed (not incorporated) (1,572 | 7.5%) make up the most common classes of employment.
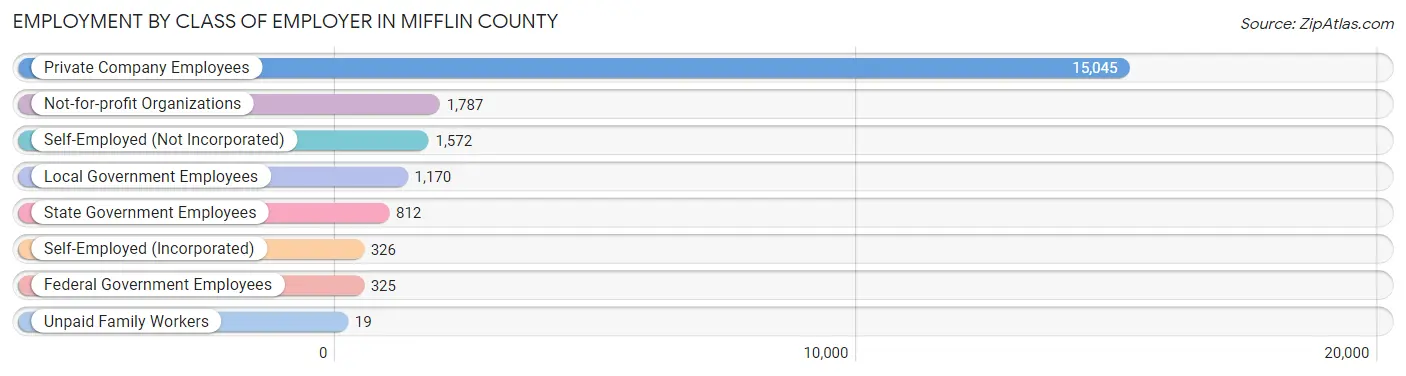
| Employer Class | # Employees | % Employees |
| Private Company Employees | 15,045 | 71.5% |
| Self-Employed (Incorporated) | 326 | 1.5% |
| Self-Employed (Not Incorporated) | 1,572 | 7.5% |
| Not-for-profit Organizations | 1,787 | 8.5% |
| Local Government Employees | 1,170 | 5.6% |
| State Government Employees | 812 | 3.9% |
| Federal Government Employees | 325 | 1.5% |
| Unpaid Family Workers | 19 | 0.1% |
| Total | 21,056 | 100.0% |
Employment Status by Age in Mifflin County
According to the labor force statistics for Mifflin County, out of the total population over 16 years of age (36,936), 59.9% or 22,125 individuals are in the labor force, with 3.9% or 863 of them unemployed. The age group with the highest labor force participation rate is 45 to 54 years, with 82.2% or 4,792 individuals in the labor force. Within the labor force, the 16 to 19 years age range has the highest percentage of unemployed individuals, with 15.3% or 175 of them being unemployed.
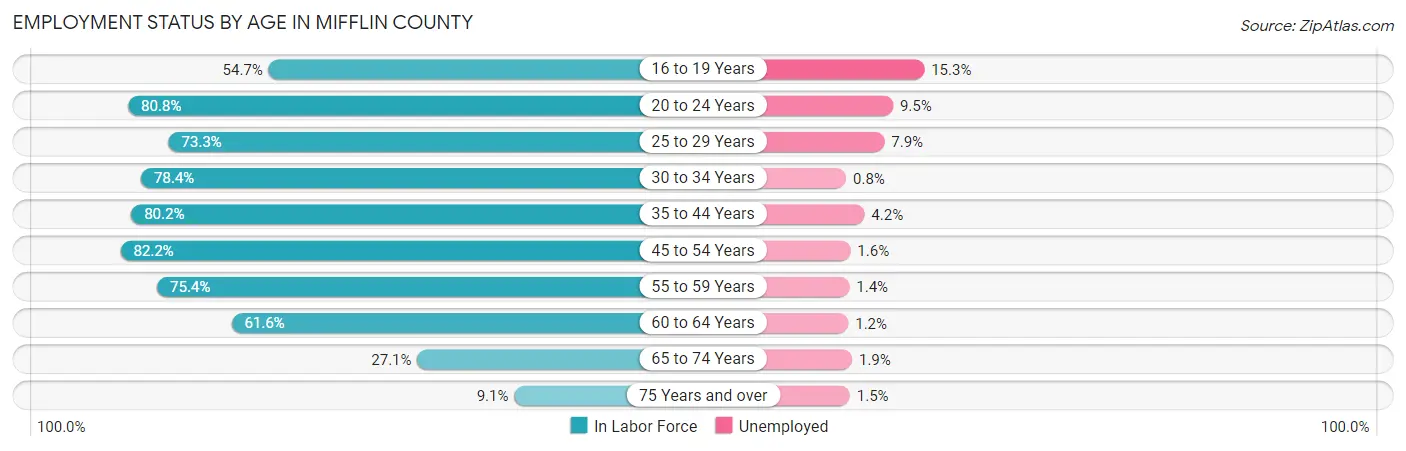
| Age Bracket | In Labor Force | Unemployed |
| 16 to 19 Years | 1,145 (54.7%) | 175 (15.3%) |
| 20 to 24 Years | 2,014 (80.8%) | 191 (9.5%) |
| 25 to 29 Years | 1,935 (73.3%) | 153 (7.9%) |
| 30 to 34 Years | 1,999 (78.4%) | 16 (0.8%) |
| 35 to 44 Years | 3,880 (80.2%) | 163 (4.2%) |
| 45 to 54 Years | 4,792 (82.2%) | 77 (1.6%) |
| 55 to 59 Years | 2,467 (75.4%) | 35 (1.4%) |
| 60 to 64 Years | 1,996 (61.6%) | 24 (1.2%) |
| 65 to 74 Years | 1,483 (27.1%) | 28 (1.9%) |
| 75 Years and over | 410 (9.1%) | 6 (1.5%) |
| Total | 22,125 (59.9%) | 863 (3.9%) |
Employment Status by Educational Attainment in Mifflin County
According to labor force statistics for Mifflin County, 76.3% of individuals (17,068) out of the total population between 25 and 64 years of age (22,370) are in the labor force, with 2.7% or 461 of them being unemployed. The group with the highest labor force participation rate are those with the educational attainment of bachelor's degree or higher, with 88.9% or 2,786 individuals in the labor force. Within the labor force, individuals with less than high school education have the highest percentage of unemployment, with 3.9% or 66 of them being unemployed.
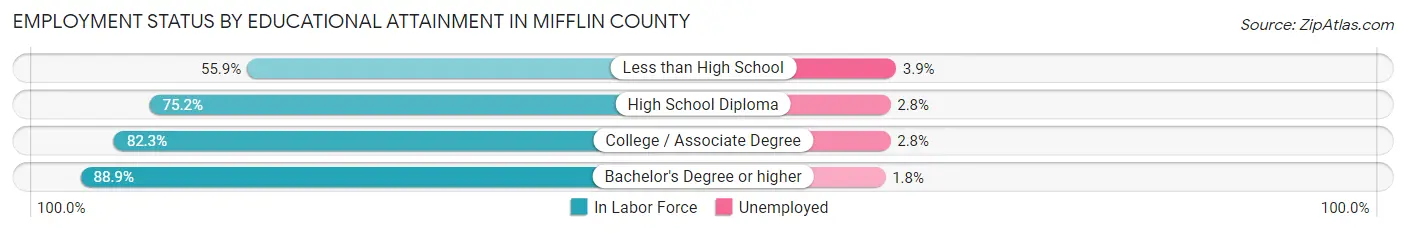
| Educational Attainment | In Labor Force | Unemployed |
| Less than High School | 1,688 (55.9%) | 118 (3.9%) |
| High School Diploma | 7,926 (75.2%) | 295 (2.8%) |
| College / Associate Degree | 4,671 (82.3%) | 159 (2.8%) |
| Bachelor's Degree or higher | 2,786 (88.9%) | 56 (1.8%) |
| Total | 17,068 (76.3%) | 604 (2.7%) |
Employment Occupations by Sex in Mifflin County
Management, Business, Science and Arts Occupations
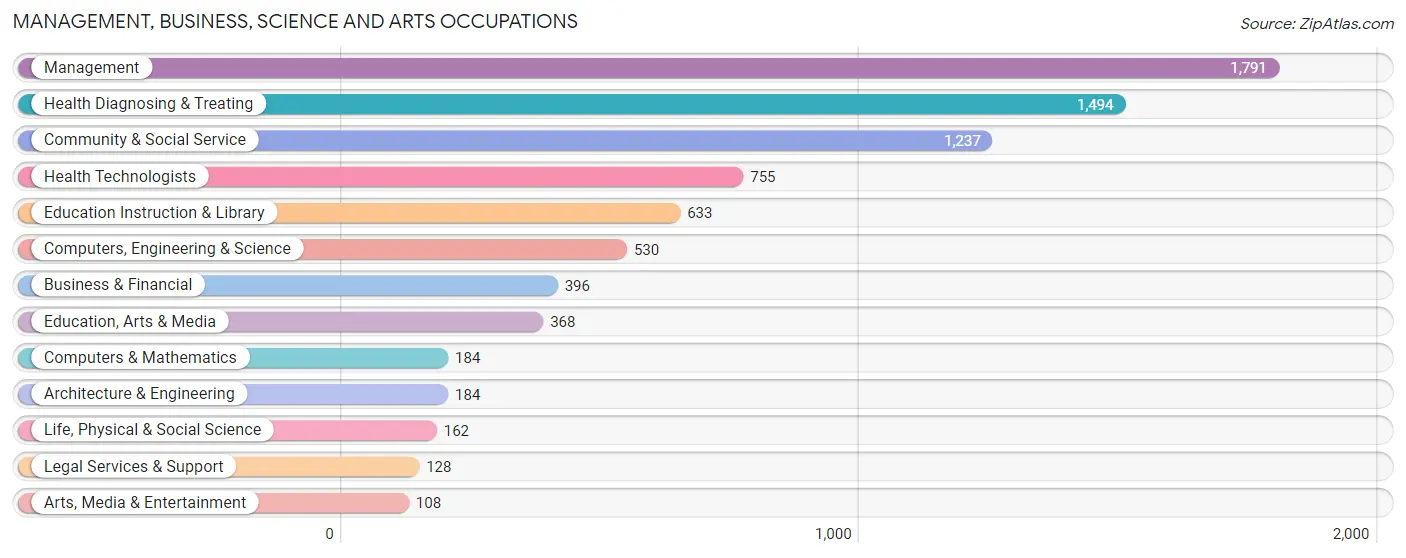
The most common Management, Business, Science and Arts occupations in Mifflin County are Management (1,791 | 8.4%), Health Diagnosing & Treating (1,494 | 7.0%), Community & Social Service (1,237 | 5.8%), Health Technologists (755 | 3.6%), and Education Instruction & Library (633 | 3.0%).
Management, Business, Science and Arts Occupations by Sex
Within the Management, Business, Science and Arts occupations in Mifflin County, the most male-oriented occupations are Architecture & Engineering (77.7%), Computers & Mathematics (75.5%), and Computers, Engineering & Science (74.3%), while the most female-oriented occupations are Health Technologists (89.8%), Health Diagnosing & Treating (87.8%), and Education Instruction & Library (72.2%).

| Occupation | Male | Female |
| Management | 1,151 (64.3%) | 640 (35.7%) |
| Business & Financial | 141 (35.6%) | 255 (64.4%) |
| Computers, Engineering & Science | 394 (74.3%) | 136 (25.7%) |
| Computers & Mathematics | 139 (75.5%) | 45 (24.5%) |
| Architecture & Engineering | 143 (77.7%) | 41 (22.3%) |
| Life, Physical & Social Science | 112 (69.1%) | 50 (30.9%) |
| Community & Social Service | 433 (35.0%) | 804 (65.0%) |
| Education, Arts & Media | 169 (45.9%) | 199 (54.1%) |
| Legal Services & Support | 49 (38.3%) | 79 (61.7%) |
| Education Instruction & Library | 176 (27.8%) | 457 (72.2%) |
| Arts, Media & Entertainment | 39 (36.1%) | 69 (63.9%) |
| Health Diagnosing & Treating | 182 (12.2%) | 1,312 (87.8%) |
| Health Technologists | 77 (10.2%) | 678 (89.8%) |
| Total (Category) | 2,301 (42.2%) | 3,147 (57.8%) |
| Total (Overall) | 11,750 (55.3%) | 9,479 (44.7%) |
Services Occupations
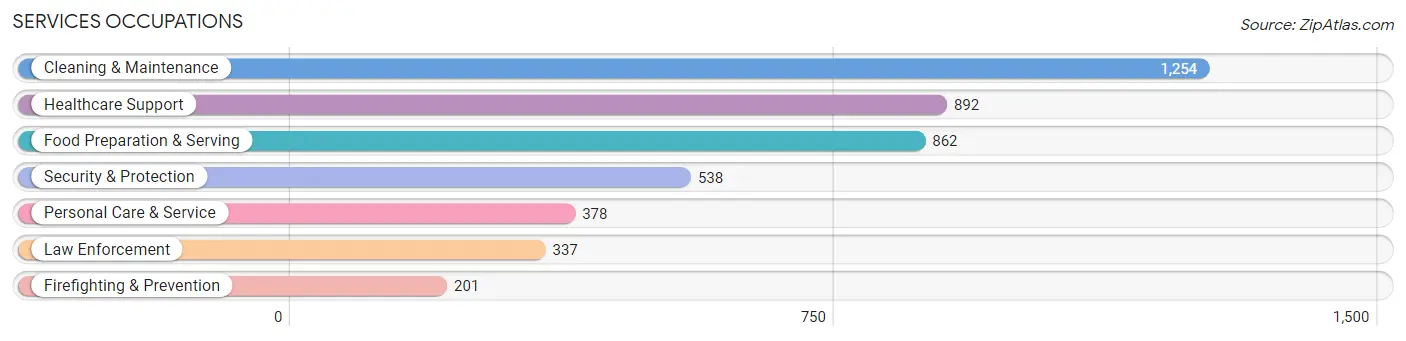
The most common Services occupations in Mifflin County are Cleaning & Maintenance (1,254 | 5.9%), Healthcare Support (892 | 4.2%), Food Preparation & Serving (862 | 4.1%), Security & Protection (538 | 2.5%), and Personal Care & Service (378 | 1.8%).
Services Occupations by Sex
Within the Services occupations in Mifflin County, the most male-oriented occupations are Firefighting & Prevention (92.0%), Security & Protection (83.8%), and Law Enforcement (78.9%), while the most female-oriented occupations are Healthcare Support (86.2%), Personal Care & Service (84.7%), and Food Preparation & Serving (71.1%).
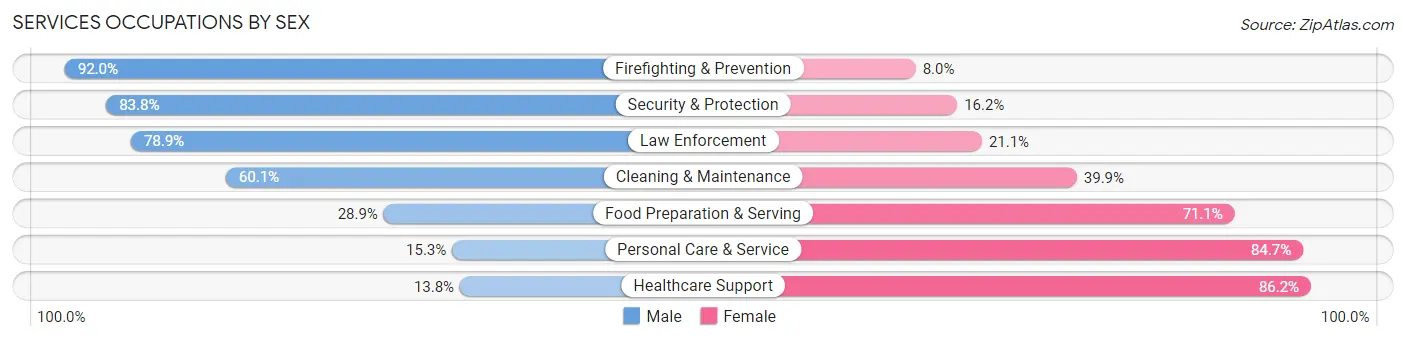
| Occupation | Male | Female |
| Healthcare Support | 123 (13.8%) | 769 (86.2%) |
| Security & Protection | 451 (83.8%) | 87 (16.2%) |
| Firefighting & Prevention | 185 (92.0%) | 16 (8.0%) |
| Law Enforcement | 266 (78.9%) | 71 (21.1%) |
| Food Preparation & Serving | 249 (28.9%) | 613 (71.1%) |
| Cleaning & Maintenance | 754 (60.1%) | 500 (39.9%) |
| Personal Care & Service | 58 (15.3%) | 320 (84.7%) |
| Total (Category) | 1,635 (41.7%) | 2,289 (58.3%) |
| Total (Overall) | 11,750 (55.3%) | 9,479 (44.7%) |
Sales and Office Occupations
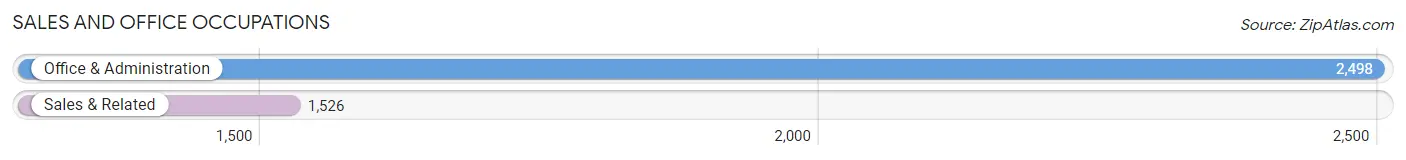
The most common Sales and Office occupations in Mifflin County are Office & Administration (2,498 | 11.8%), and Sales & Related (1,526 | 7.2%).
Sales and Office Occupations by Sex

| Occupation | Male | Female |
| Sales & Related | 704 (46.1%) | 822 (53.9%) |
| Office & Administration | 491 (19.7%) | 2,007 (80.3%) |
| Total (Category) | 1,195 (29.7%) | 2,829 (70.3%) |
| Total (Overall) | 11,750 (55.3%) | 9,479 (44.7%) |
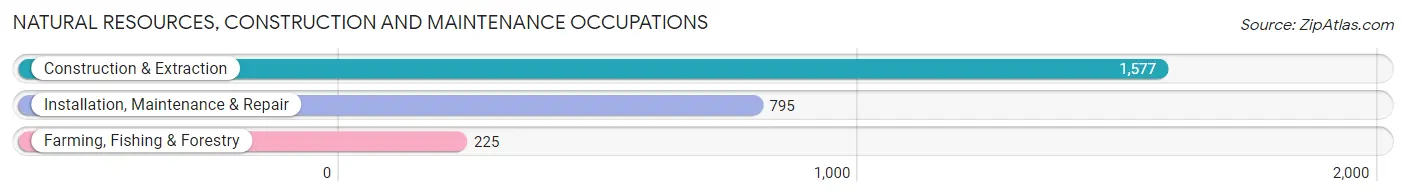
Natural Resources, Construction and Maintenance Occupations
The most common Natural Resources, Construction and Maintenance occupations in Mifflin County are Construction & Extraction (1,577 | 7.4%), Installation, Maintenance & Repair (795 | 3.7%), and Farming, Fishing & Forestry (225 | 1.1%).
Natural Resources, Construction and Maintenance Occupations by Sex
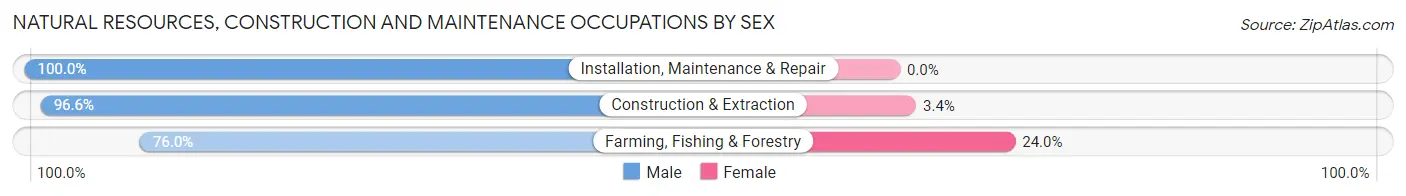
| Occupation | Male | Female |
| Farming, Fishing & Forestry | 171 (76.0%) | 54 (24.0%) |
| Construction & Extraction | 1,524 (96.6%) | 53 (3.4%) |
| Installation, Maintenance & Repair | 795 (100.0%) | 0 (0.0%) |
| Total (Category) | 2,490 (95.9%) | 107 (4.1%) |
| Total (Overall) | 11,750 (55.3%) | 9,479 (44.7%) |
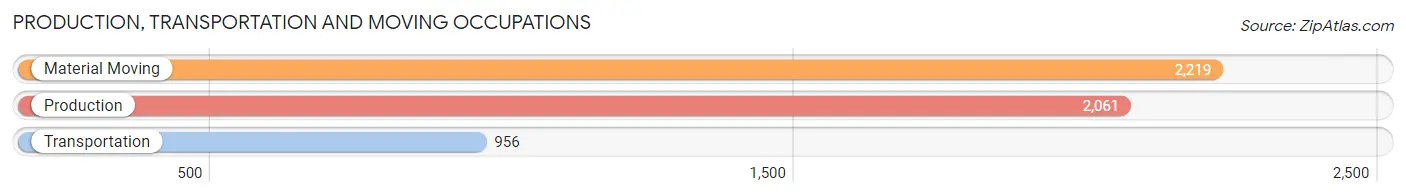
Production, Transportation and Moving Occupations
The most common Production, Transportation and Moving occupations in Mifflin County are Material Moving (2,219 | 10.4%), Production (2,061 | 9.7%), and Transportation (956 | 4.5%).
Production, Transportation and Moving Occupations by Sex
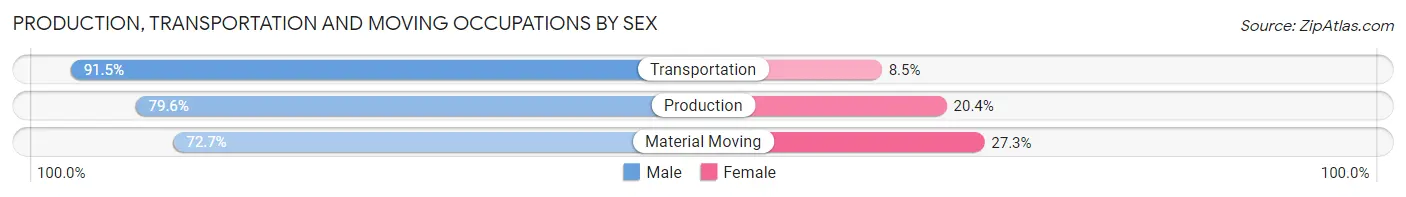
| Occupation | Male | Female |
| Production | 1,641 (79.6%) | 420 (20.4%) |
| Transportation | 875 (91.5%) | 81 (8.5%) |
| Material Moving | 1,613 (72.7%) | 606 (27.3%) |
| Total (Category) | 4,129 (78.9%) | 1,107 (21.1%) |
| Total (Overall) | 11,750 (55.3%) | 9,479 (44.7%) |
Employment Industries by Sex in Mifflin County
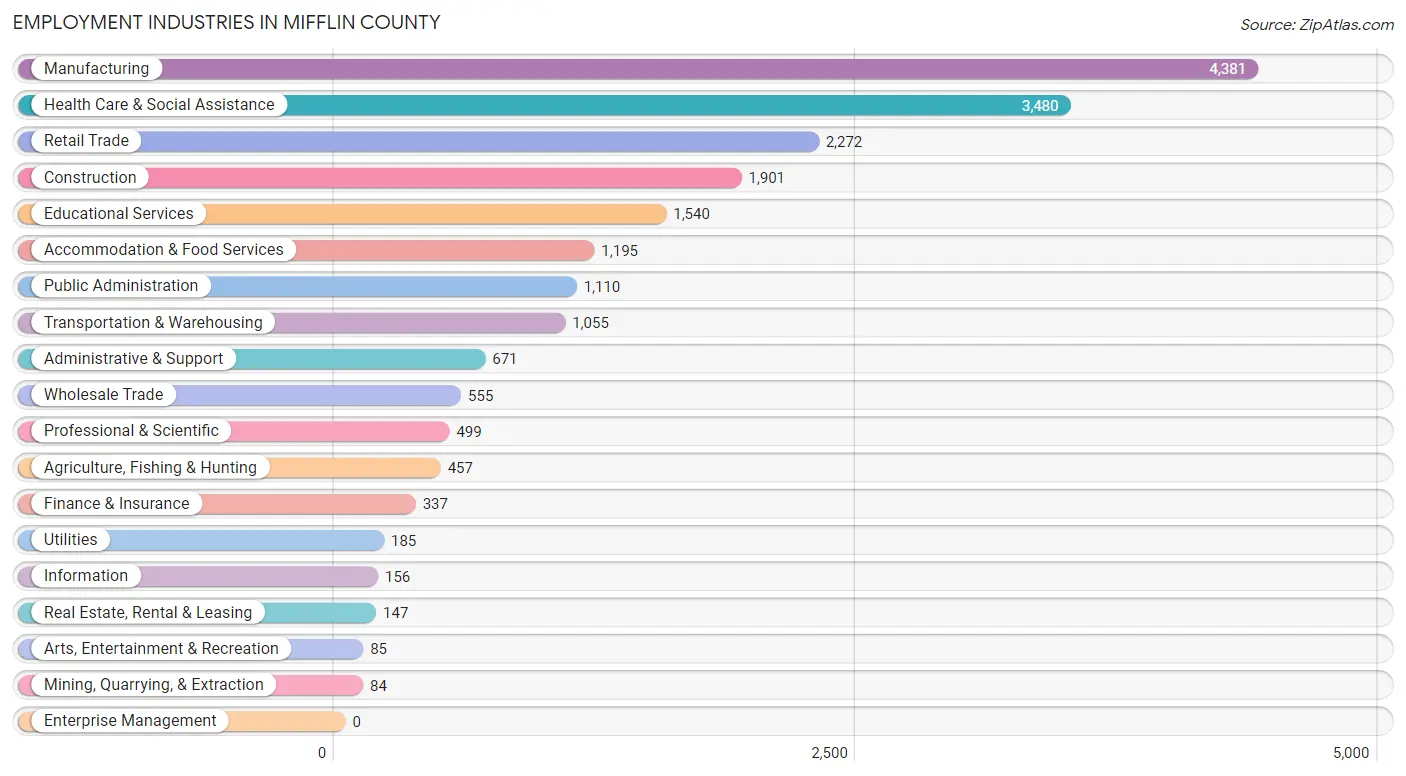
Employment Industries in Mifflin County
The major employment industries in Mifflin County include Manufacturing (4,381 | 20.6%), Health Care & Social Assistance (3,480 | 16.4%), Retail Trade (2,272 | 10.7%), Construction (1,901 | 8.9%), and Educational Services (1,540 | 7.2%).
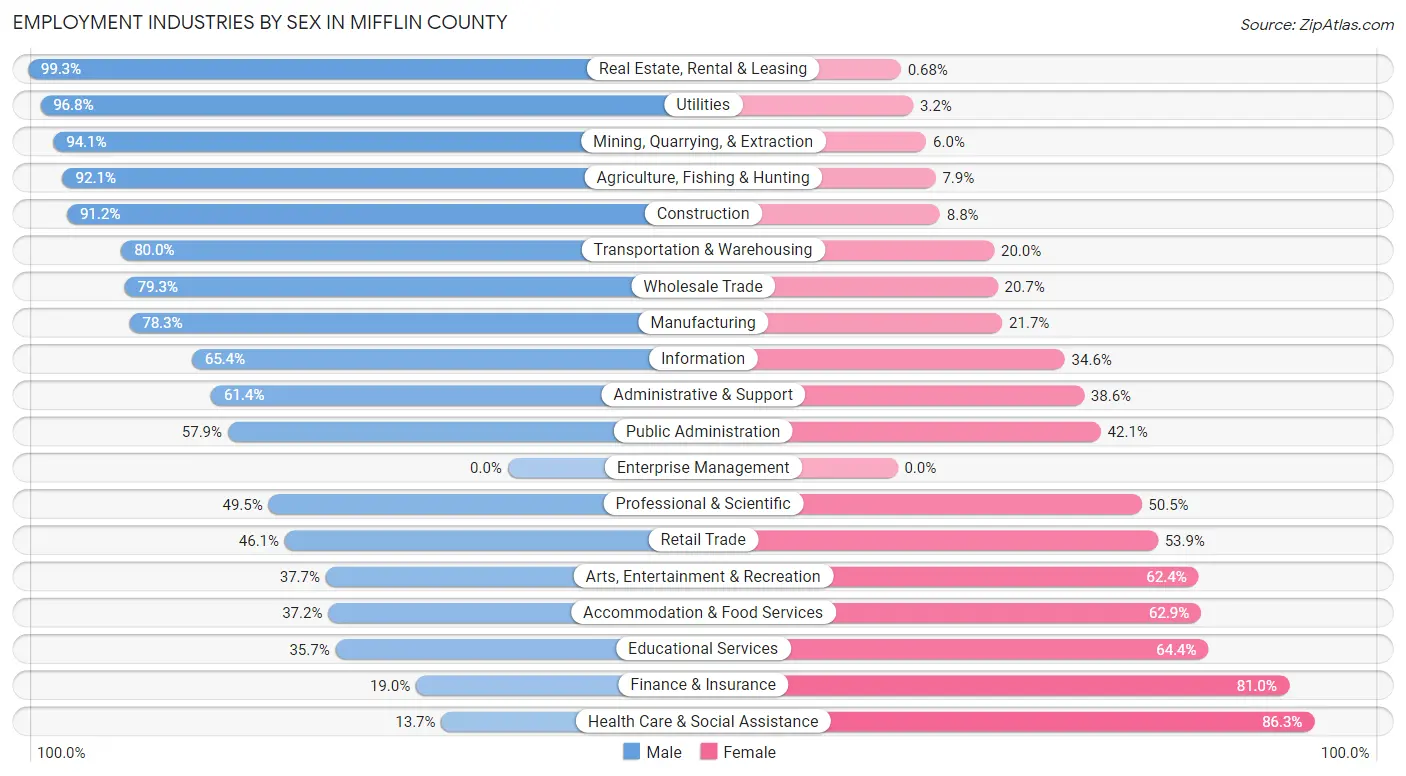
Employment Industries by Sex in Mifflin County
The Mifflin County industries that see more men than women are Real Estate, Rental & Leasing (99.3%), Utilities (96.8%), and Mining, Quarrying, & Extraction (94.1%), whereas the industries that tend to have a higher number of women are Health Care & Social Assistance (86.3%), Finance & Insurance (81.0%), and Educational Services (64.3%).
| Industry | Male | Female |
| Agriculture, Fishing & Hunting | 421 (92.1%) | 36 (7.9%) |
| Mining, Quarrying, & Extraction | 79 (94.1%) | 5 (5.9%) |
| Construction | 1,734 (91.2%) | 167 (8.8%) |
| Manufacturing | 3,431 (78.3%) | 950 (21.7%) |
| Wholesale Trade | 440 (79.3%) | 115 (20.7%) |
| Retail Trade | 1,048 (46.1%) | 1,224 (53.9%) |
| Transportation & Warehousing | 844 (80.0%) | 211 (20.0%) |
| Utilities | 179 (96.8%) | 6 (3.2%) |
| Information | 102 (65.4%) | 54 (34.6%) |
| Finance & Insurance | 64 (19.0%) | 273 (81.0%) |
| Real Estate, Rental & Leasing | 146 (99.3%) | 1 (0.7%) |
| Professional & Scientific | 247 (49.5%) | 252 (50.5%) |
| Enterprise Management | 0 (0.0%) | 0 (0.0%) |
| Administrative & Support | 412 (61.4%) | 259 (38.6%) |
| Educational Services | 549 (35.6%) | 991 (64.3%) |
| Health Care & Social Assistance | 478 (13.7%) | 3,002 (86.3%) |
| Arts, Entertainment & Recreation | 32 (37.7%) | 53 (62.4%) |
| Accommodation & Food Services | 444 (37.1%) | 751 (62.8%) |
| Public Administration | 643 (57.9%) | 467 (42.1%) |
| Total | 11,750 (55.3%) | 9,479 (44.7%) |
Education in Mifflin County
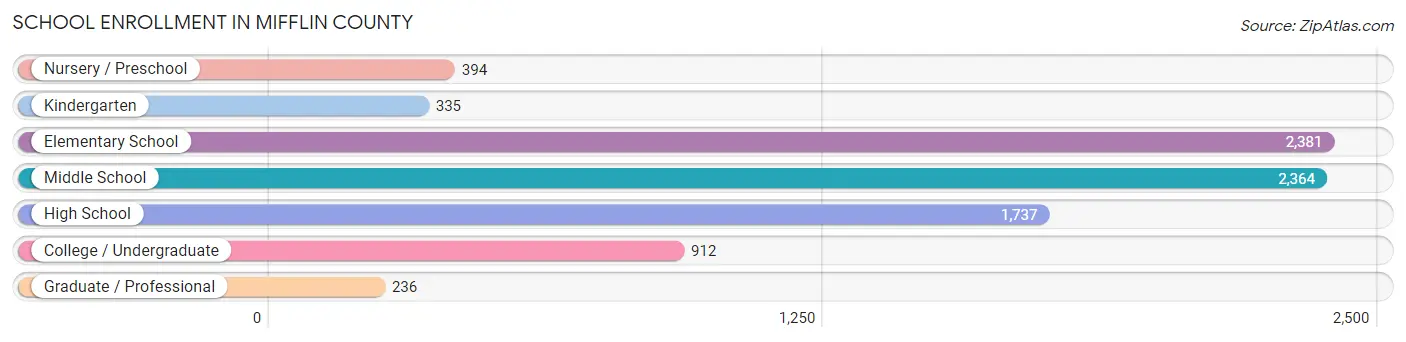
School Enrollment in Mifflin County
The most common levels of schooling among the 8,359 students in Mifflin County are elementary school (2,381 | 28.5%), middle school (2,364 | 28.3%), and high school (1,737 | 20.8%).
| School Level | # Students | % Students |
| Nursery / Preschool | 394 | 4.7% |
| Kindergarten | 335 | 4.0% |
| Elementary School | 2,381 | 28.5% |
| Middle School | 2,364 | 28.3% |
| High School | 1,737 | 20.8% |
| College / Undergraduate | 912 | 10.9% |
| Graduate / Professional | 236 | 2.8% |
| Total | 8,359 | 100.0% |
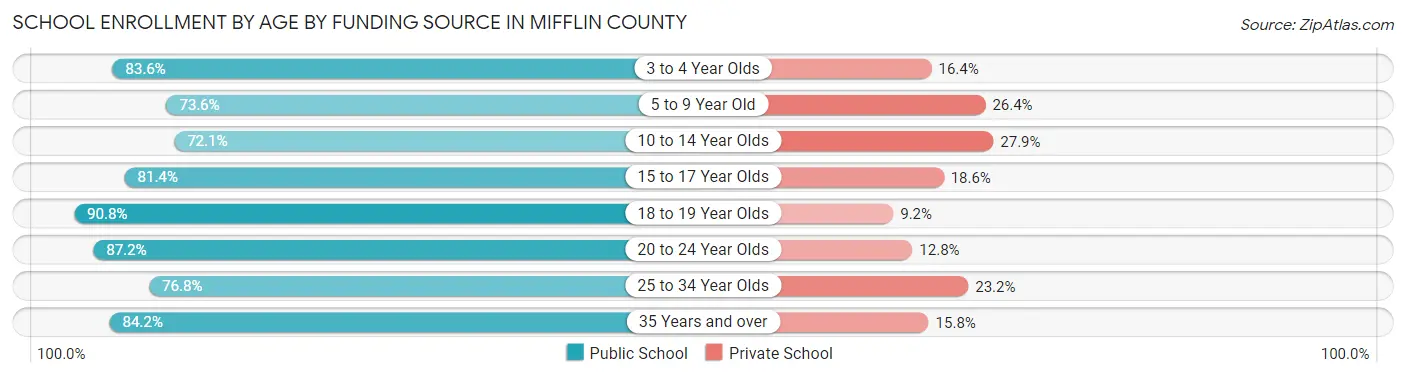
School Enrollment by Age by Funding Source in Mifflin County
Out of a total of 8,359 students who are enrolled in schools in Mifflin County, 1,939 (23.2%) attend a private institution, while the remaining 6,420 (76.8%) are enrolled in public schools. The age group of 10 to 14 year olds has the highest likelihood of being enrolled in private schools, with 797 (27.9% in the age bracket) enrolled. Conversely, the age group of 18 to 19 year olds has the lowest likelihood of being enrolled in a private school, with 442 (90.8% in the age bracket) attending a public institution.
| Age Bracket | Public School | Private School |
| 3 to 4 Year Olds | 230 (83.6%) | 45 (16.4%) |
| 5 to 9 Year Old | 1,806 (73.6%) | 648 (26.4%) |
| 10 to 14 Year Olds | 2,062 (72.1%) | 797 (27.9%) |
| 15 to 17 Year Olds | 1,118 (81.4%) | 256 (18.6%) |
| 18 to 19 Year Olds | 442 (90.8%) | 45 (9.2%) |
| 20 to 24 Year Olds | 361 (87.2%) | 53 (12.8%) |
| 25 to 34 Year Olds | 182 (76.8%) | 55 (23.2%) |
| 35 Years and over | 218 (84.2%) | 41 (15.8%) |
| Total | 6,420 (76.8%) | 1,939 (23.2%) |
Educational Attainment by Field of Study in Mifflin County
Business (980 | 20.9%), education (971 | 20.7%), science & technology (669 | 14.2%), bio, nature & agricultural (444 | 9.5%), and arts & humanities (326 | 7.0%) are the most common fields of study among 4,694 individuals in Mifflin County who have obtained a bachelor's degree or higher.
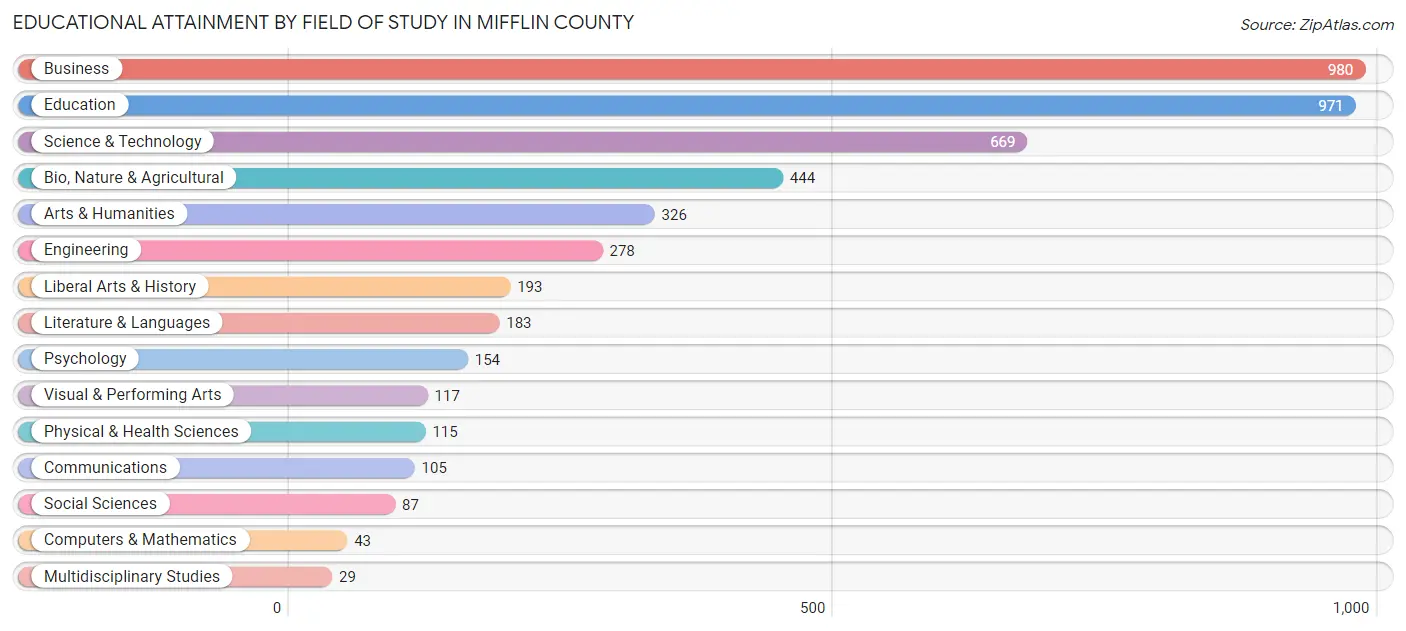
| Field of Study | # Graduates | % Graduates |
| Computers & Mathematics | 43 | 0.9% |
| Bio, Nature & Agricultural | 444 | 9.5% |
| Physical & Health Sciences | 115 | 2.5% |
| Psychology | 154 | 3.3% |
| Social Sciences | 87 | 1.8% |
| Engineering | 278 | 5.9% |
| Multidisciplinary Studies | 29 | 0.6% |
| Science & Technology | 669 | 14.2% |
| Business | 980 | 20.9% |
| Education | 971 | 20.7% |
| Literature & Languages | 183 | 3.9% |
| Liberal Arts & History | 193 | 4.1% |
| Visual & Performing Arts | 117 | 2.5% |
| Communications | 105 | 2.2% |
| Arts & Humanities | 326 | 7.0% |
| Total | 4,694 | 100.0% |
Transportation & Commute in Mifflin County
Vehicle Availability by Sex in Mifflin County
The most prevalent vehicle ownership categories in Mifflin County are males with 2 vehicles (4,661, accounting for 39.9%) and females with 2 vehicles (3,948, making up 49.7%).
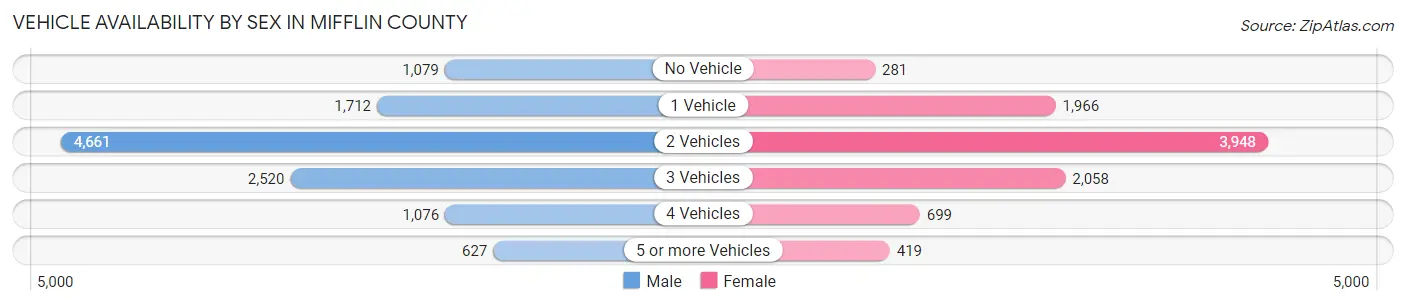
| Vehicles Available | Male | Female |
| No Vehicle | 1,079 (9.2%) | 281 (3.0%) |
| 1 Vehicle | 1,712 (14.7%) | 1,966 (21.0%) |
| 2 Vehicles | 4,661 (39.9%) | 3,948 (42.1%) |
| 3 Vehicles | 2,520 (21.6%) | 2,058 (22.0%) |
| 4 Vehicles | 1,076 (9.2%) | 699 (7.5%) |
| 5 or more Vehicles | 627 (5.4%) | 419 (4.5%) |
| Total | 11,675 (100.0%) | 9,371 (100.0%) |
Commute Time in Mifflin County
The most frequently occuring commute durations in Mifflin County are 10 to 14 minutes (3,641 commuters, 18.3%), 5 to 9 minutes (3,291 commuters, 16.5%), and 15 to 19 minutes (2,566 commuters, 12.9%).
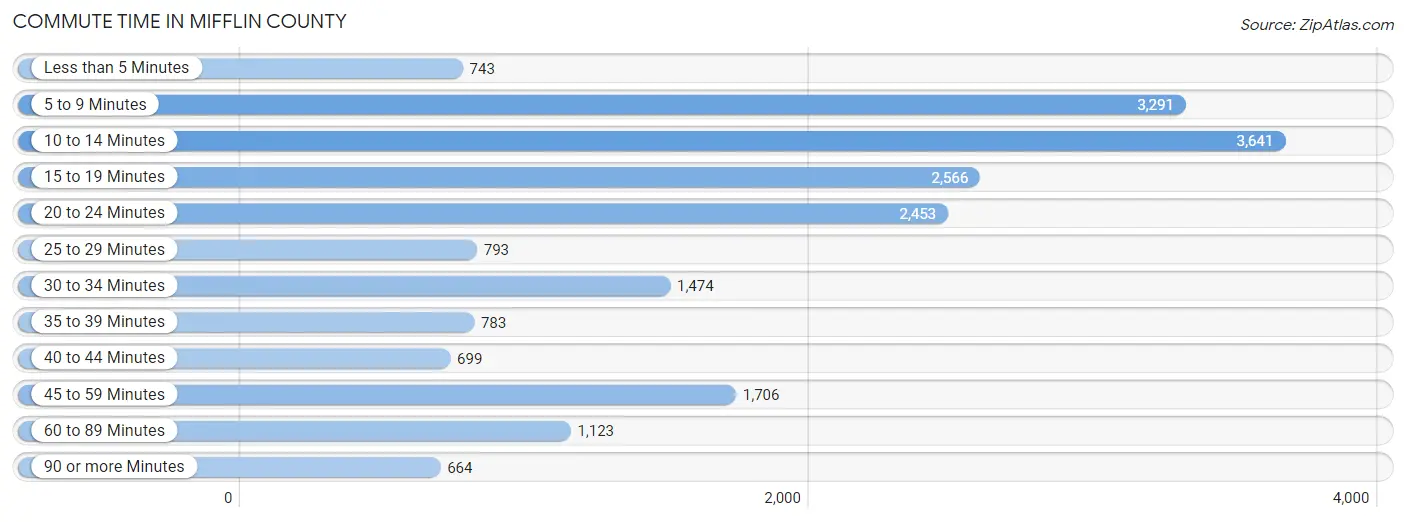
| Commute Time | # Commuters | % Commuters |
| Less than 5 Minutes | 743 | 3.7% |
| 5 to 9 Minutes | 3,291 | 16.5% |
| 10 to 14 Minutes | 3,641 | 18.3% |
| 15 to 19 Minutes | 2,566 | 12.9% |
| 20 to 24 Minutes | 2,453 | 12.3% |
| 25 to 29 Minutes | 793 | 4.0% |
| 30 to 34 Minutes | 1,474 | 7.4% |
| 35 to 39 Minutes | 783 | 3.9% |
| 40 to 44 Minutes | 699 | 3.5% |
| 45 to 59 Minutes | 1,706 | 8.6% |
| 60 to 89 Minutes | 1,123 | 5.6% |
| 90 or more Minutes | 664 | 3.3% |
Commute Time by Sex in Mifflin County
The most common commute times in Mifflin County are 10 to 14 minutes (1,523 commuters, 13.9%) for males and 10 to 14 minutes (2,118 commuters, 23.6%) for females.
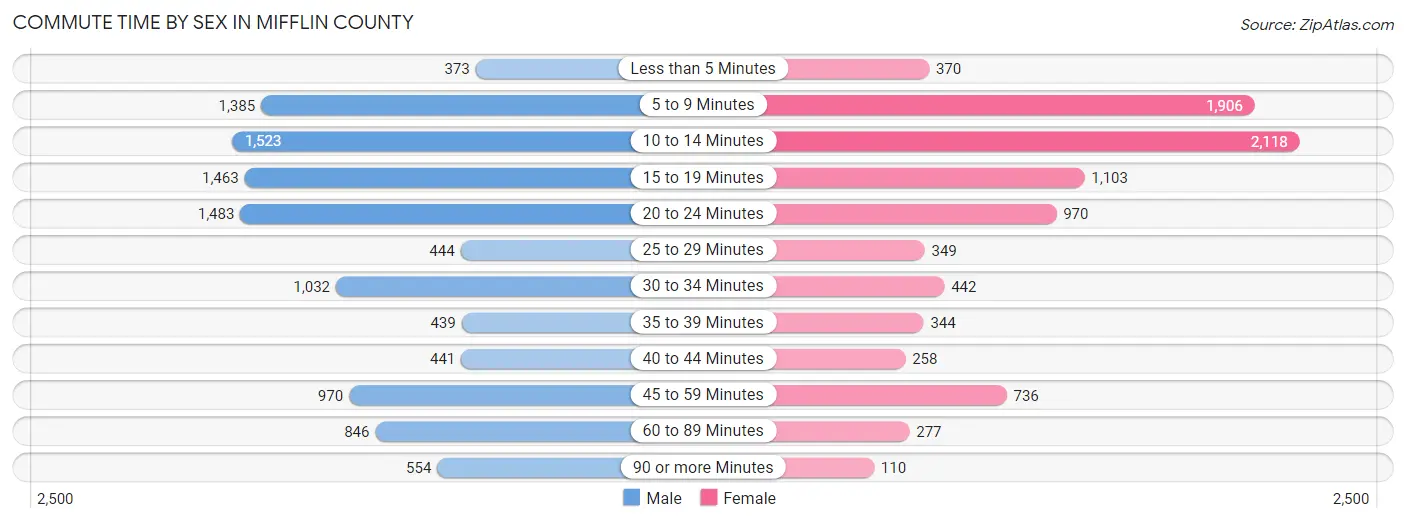
| Commute Time | Male | Female |
| Less than 5 Minutes | 373 (3.4%) | 370 (4.1%) |
| 5 to 9 Minutes | 1,385 (12.6%) | 1,906 (21.2%) |
| 10 to 14 Minutes | 1,523 (13.9%) | 2,118 (23.6%) |
| 15 to 19 Minutes | 1,463 (13.4%) | 1,103 (12.3%) |
| 20 to 24 Minutes | 1,483 (13.5%) | 970 (10.8%) |
| 25 to 29 Minutes | 444 (4.1%) | 349 (3.9%) |
| 30 to 34 Minutes | 1,032 (9.4%) | 442 (4.9%) |
| 35 to 39 Minutes | 439 (4.0%) | 344 (3.8%) |
| 40 to 44 Minutes | 441 (4.0%) | 258 (2.9%) |
| 45 to 59 Minutes | 970 (8.9%) | 736 (8.2%) |
| 60 to 89 Minutes | 846 (7.7%) | 277 (3.1%) |
| 90 or more Minutes | 554 (5.1%) | 110 (1.2%) |
Time of Departure to Work by Sex in Mifflin County
The most frequent times of departure to work in Mifflin County are 6:00 AM to 6:29 AM (1,571, 14.3%) for males and 7:00 AM to 7:29 AM (1,472, 16.4%) for females.
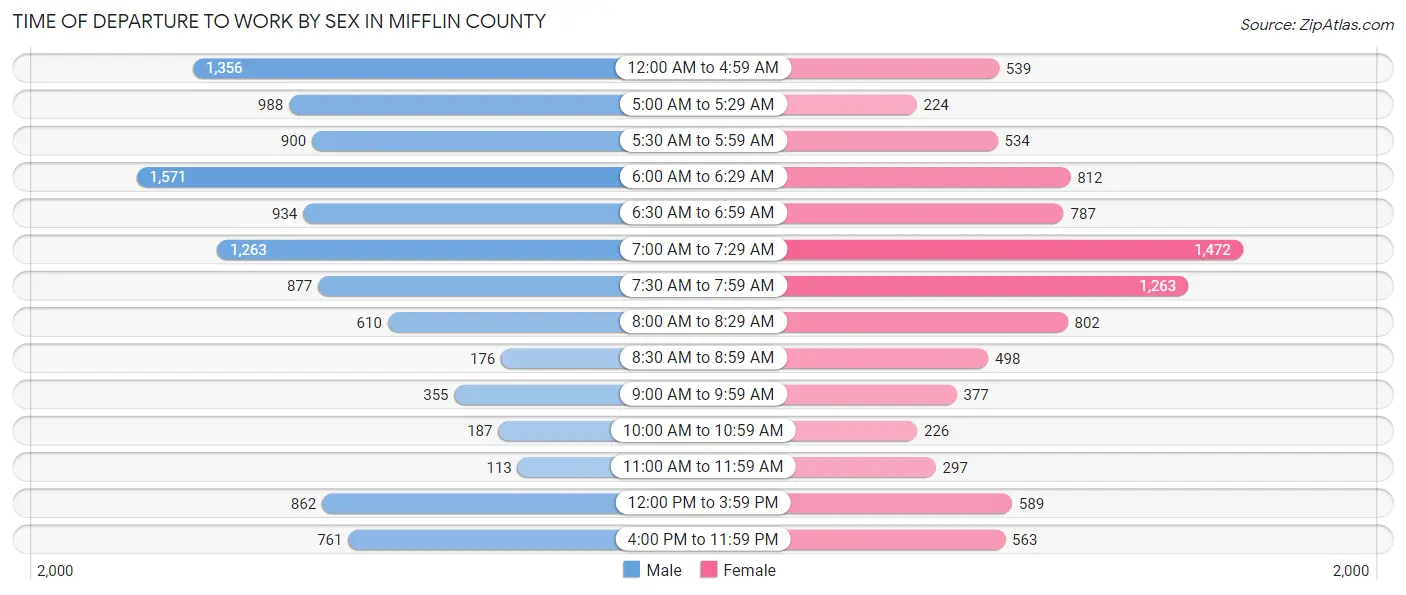
| Time of Departure | Male | Female |
| 12:00 AM to 4:59 AM | 1,356 (12.4%) | 539 (6.0%) |
| 5:00 AM to 5:29 AM | 988 (9.0%) | 224 (2.5%) |
| 5:30 AM to 5:59 AM | 900 (8.2%) | 534 (5.9%) |
| 6:00 AM to 6:29 AM | 1,571 (14.3%) | 812 (9.0%) |
| 6:30 AM to 6:59 AM | 934 (8.5%) | 787 (8.8%) |
| 7:00 AM to 7:29 AM | 1,263 (11.5%) | 1,472 (16.4%) |
| 7:30 AM to 7:59 AM | 877 (8.0%) | 1,263 (14.1%) |
| 8:00 AM to 8:29 AM | 610 (5.6%) | 802 (8.9%) |
| 8:30 AM to 8:59 AM | 176 (1.6%) | 498 (5.5%) |
| 9:00 AM to 9:59 AM | 355 (3.2%) | 377 (4.2%) |
| 10:00 AM to 10:59 AM | 187 (1.7%) | 226 (2.5%) |
| 11:00 AM to 11:59 AM | 113 (1.0%) | 297 (3.3%) |
| 12:00 PM to 3:59 PM | 862 (7.9%) | 589 (6.6%) |
| 4:00 PM to 11:59 PM | 761 (7.0%) | 563 (6.3%) |
| Total | 10,953 (100.0%) | 8,983 (100.0%) |
Housing Occupancy in Mifflin County
Occupancy by Ownership in Mifflin County
Of the total 18,612 dwellings in Mifflin County, owner-occupied units account for 13,308 (71.5%), while renter-occupied units make up 5,304 (28.5%).
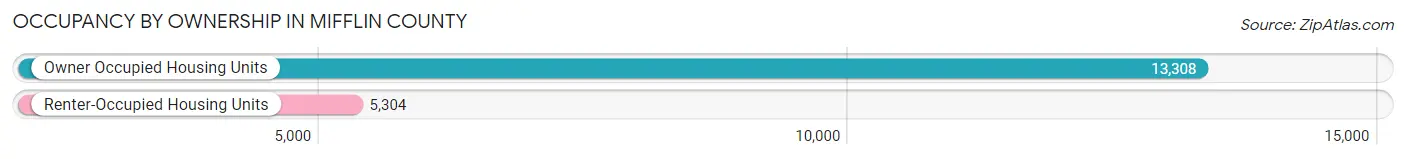
| Occupancy | # Housing Units | % Housing Units |
| Owner Occupied Housing Units | 13,308 | 71.5% |
| Renter-Occupied Housing Units | 5,304 | 28.5% |
| Total Occupied Housing Units | 18,612 | 100.0% |
Occupancy by Household Size in Mifflin County
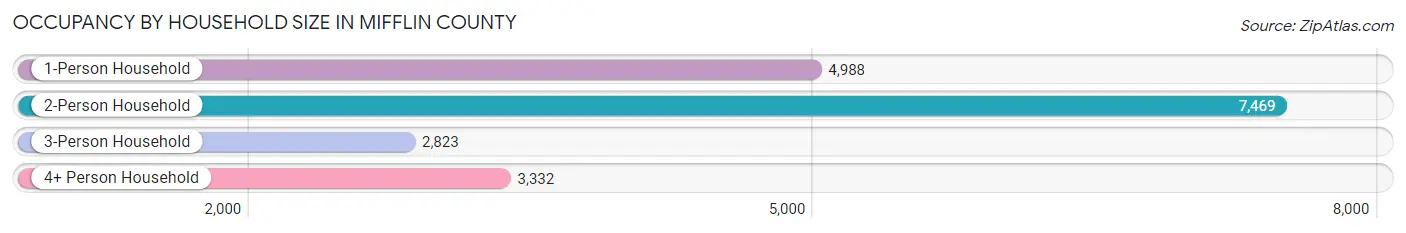
| Household Size | # Housing Units | % Housing Units |
| 1-Person Household | 4,988 | 26.8% |
| 2-Person Household | 7,469 | 40.1% |
| 3-Person Household | 2,823 | 15.2% |
| 4+ Person Household | 3,332 | 17.9% |
| Total Housing Units | 18,612 | 100.0% |
Occupancy by Ownership by Household Size in Mifflin County
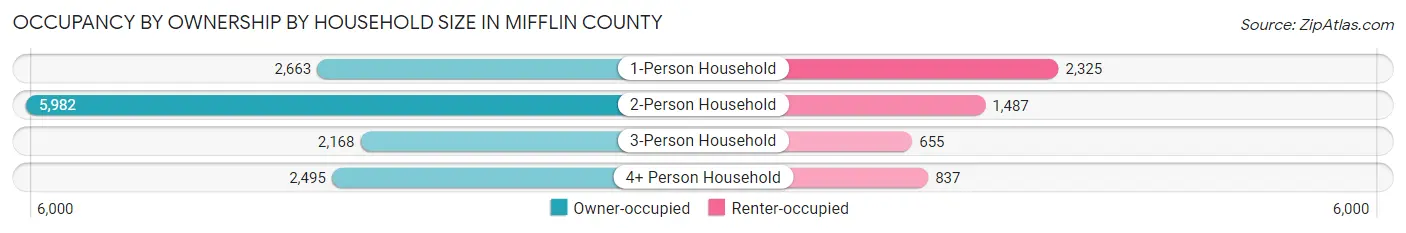
| Household Size | Owner-occupied | Renter-occupied |
| 1-Person Household | 2,663 (53.4%) | 2,325 (46.6%) |
| 2-Person Household | 5,982 (80.1%) | 1,487 (19.9%) |
| 3-Person Household | 2,168 (76.8%) | 655 (23.2%) |
| 4+ Person Household | 2,495 (74.9%) | 837 (25.1%) |
| Total Housing Units | 13,308 (71.5%) | 5,304 (28.5%) |
Occupancy by Educational Attainment in Mifflin County
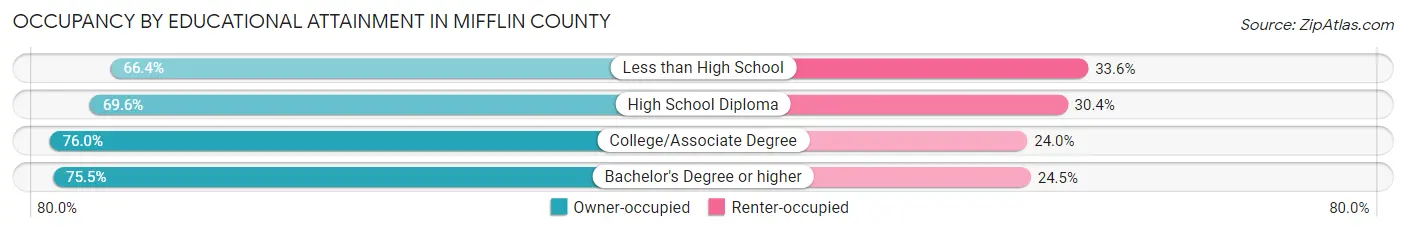
| Household Size | Owner-occupied | Renter-occupied |
| Less than High School | 1,708 (66.4%) | 866 (33.6%) |
| High School Diploma | 6,313 (69.6%) | 2,752 (30.4%) |
| College/Associate Degree | 3,283 (76.0%) | 1,035 (24.0%) |
| Bachelor's Degree or higher | 2,004 (75.5%) | 651 (24.5%) |
Occupancy by Age of Householder in Mifflin County
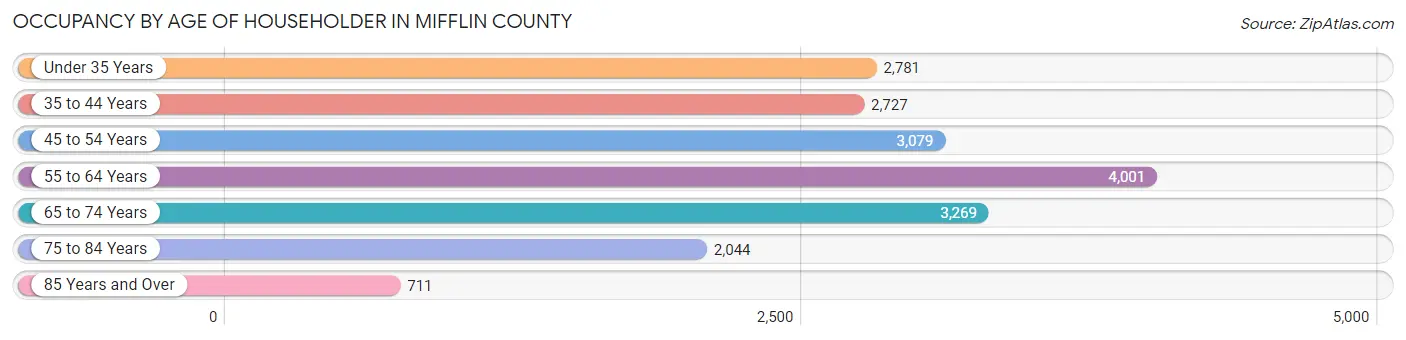
| Age Bracket | # Households | % Households |
| Under 35 Years | 2,781 | 14.9% |
| 35 to 44 Years | 2,727 | 14.6% |
| 45 to 54 Years | 3,079 | 16.5% |
| 55 to 64 Years | 4,001 | 21.5% |
| 65 to 74 Years | 3,269 | 17.6% |
| 75 to 84 Years | 2,044 | 11.0% |
| 85 Years and Over | 711 | 3.8% |
| Total | 18,612 | 100.0% |
Housing Finances in Mifflin County
Median Income by Occupancy in Mifflin County
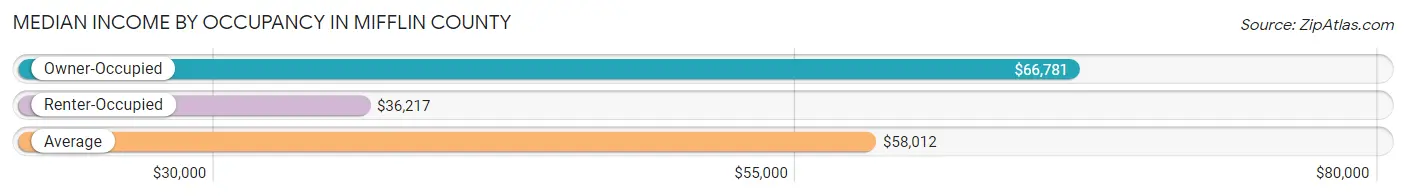
| Occupancy Type | # Households | Median Income |
| Owner-Occupied | 13,308 (71.5%) | $66,781 |
| Renter-Occupied | 5,304 (28.5%) | $36,217 |
| Average | 18,612 (100.0%) | $58,012 |
Occupancy by Householder Income Bracket in Mifflin County
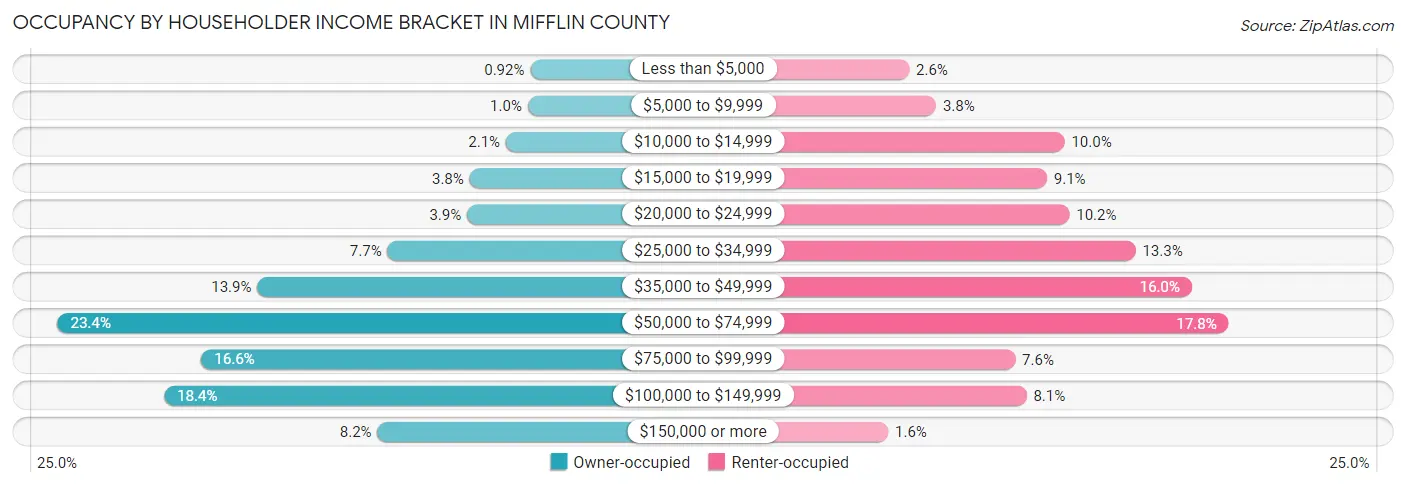
| Income Bracket | Owner-occupied | Renter-occupied |
| Less than $5,000 | 123 (0.9%) | 135 (2.5%) |
| $5,000 to $9,999 | 138 (1.0%) | 203 (3.8%) |
| $10,000 to $14,999 | 277 (2.1%) | 528 (10.0%) |
| $15,000 to $19,999 | 507 (3.8%) | 483 (9.1%) |
| $20,000 to $24,999 | 523 (3.9%) | 540 (10.2%) |
| $25,000 to $34,999 | 1,027 (7.7%) | 707 (13.3%) |
| $35,000 to $49,999 | 1,853 (13.9%) | 849 (16.0%) |
| $50,000 to $74,999 | 3,118 (23.4%) | 942 (17.8%) |
| $75,000 to $99,999 | 2,207 (16.6%) | 403 (7.6%) |
| $100,000 to $149,999 | 2,444 (18.4%) | 432 (8.1%) |
| $150,000 or more | 1,091 (8.2%) | 82 (1.5%) |
| Total | 13,308 (100.0%) | 5,304 (100.0%) |
Monthly Housing Cost Tiers in Mifflin County
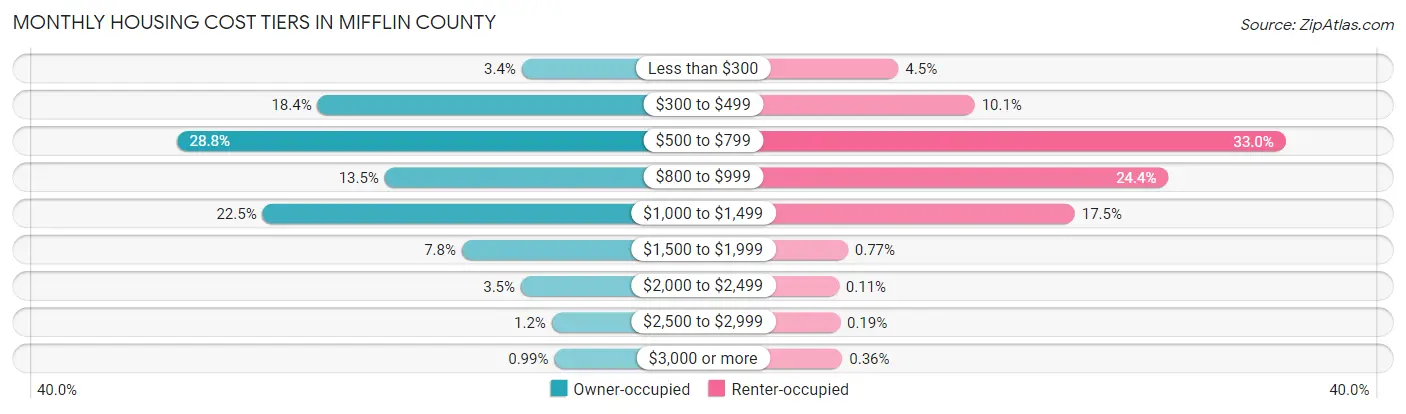
| Monthly Cost | Owner-occupied | Renter-occupied |
| Less than $300 | 451 (3.4%) | 238 (4.5%) |
| $300 to $499 | 2,453 (18.4%) | 536 (10.1%) |
| $500 to $799 | 3,833 (28.8%) | 1,751 (33.0%) |
| $800 to $999 | 1,794 (13.5%) | 1,292 (24.4%) |
| $1,000 to $1,499 | 2,991 (22.5%) | 927 (17.5%) |
| $1,500 to $1,999 | 1,038 (7.8%) | 41 (0.8%) |
| $2,000 to $2,499 | 459 (3.5%) | 6 (0.1%) |
| $2,500 to $2,999 | 157 (1.2%) | 10 (0.2%) |
| $3,000 or more | 132 (1.0%) | 19 (0.4%) |
| Total | 13,308 (100.0%) | 5,304 (100.0%) |
Physical Housing Characteristics in Mifflin County
Housing Structures in Mifflin County
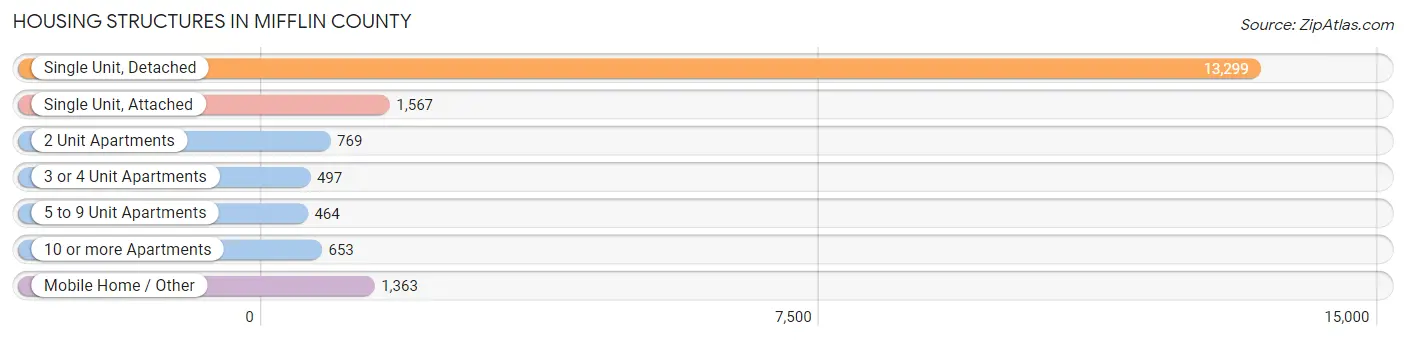
| Structure Type | # Housing Units | % Housing Units |
| Single Unit, Detached | 13,299 | 71.5% |
| Single Unit, Attached | 1,567 | 8.4% |
| 2 Unit Apartments | 769 | 4.1% |
| 3 or 4 Unit Apartments | 497 | 2.7% |
| 5 to 9 Unit Apartments | 464 | 2.5% |
| 10 or more Apartments | 653 | 3.5% |
| Mobile Home / Other | 1,363 | 7.3% |
| Total | 18,612 | 100.0% |
Housing Structures by Occupancy in Mifflin County
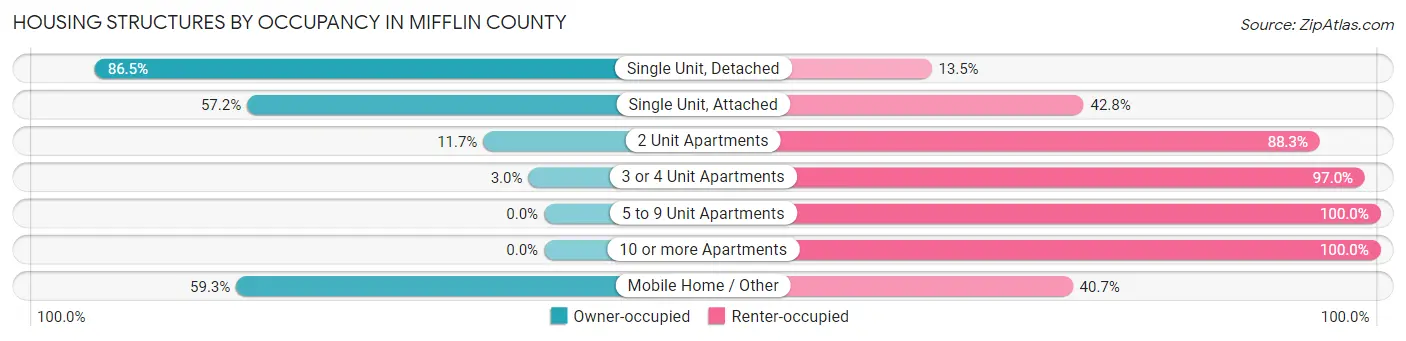
| Structure Type | Owner-occupied | Renter-occupied |
| Single Unit, Detached | 11,499 (86.5%) | 1,800 (13.5%) |
| Single Unit, Attached | 896 (57.2%) | 671 (42.8%) |
| 2 Unit Apartments | 90 (11.7%) | 679 (88.3%) |
| 3 or 4 Unit Apartments | 15 (3.0%) | 482 (97.0%) |
| 5 to 9 Unit Apartments | 0 (0.0%) | 464 (100.0%) |
| 10 or more Apartments | 0 (0.0%) | 653 (100.0%) |
| Mobile Home / Other | 808 (59.3%) | 555 (40.7%) |
| Total | 13,308 (71.5%) | 5,304 (28.5%) |
Housing Structures by Number of Rooms in Mifflin County
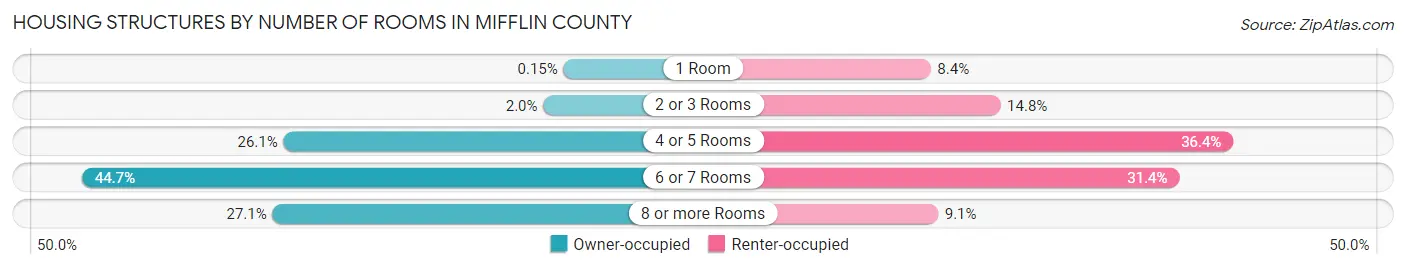
| Number of Rooms | Owner-occupied | Renter-occupied |
| 1 Room | 20 (0.2%) | 444 (8.4%) |
| 2 or 3 Rooms | 269 (2.0%) | 786 (14.8%) |
| 4 or 5 Rooms | 3,467 (26.1%) | 1,929 (36.4%) |
| 6 or 7 Rooms | 5,950 (44.7%) | 1,665 (31.4%) |
| 8 or more Rooms | 3,602 (27.1%) | 480 (9.0%) |
| Total | 13,308 (100.0%) | 5,304 (100.0%) |
Housing Structure by Heating Type in Mifflin County
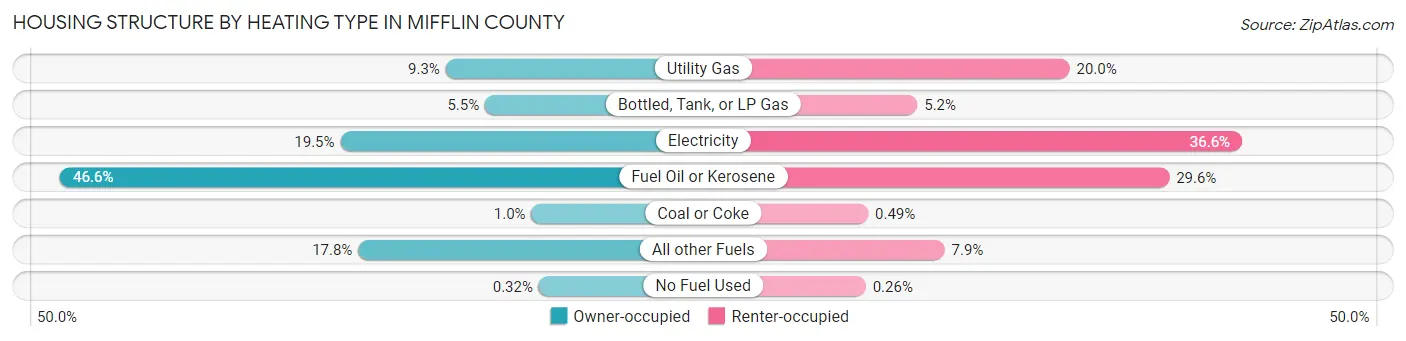
| Heating Type | Owner-occupied | Renter-occupied |
| Utility Gas | 1,240 (9.3%) | 1,058 (20.0%) |
| Bottled, Tank, or LP Gas | 733 (5.5%) | 278 (5.2%) |
| Electricity | 2,594 (19.5%) | 1,941 (36.6%) |
| Fuel Oil or Kerosene | 6,197 (46.6%) | 1,569 (29.6%) |
| Coal or Coke | 137 (1.0%) | 26 (0.5%) |
| All other Fuels | 2,365 (17.8%) | 418 (7.9%) |
| No Fuel Used | 42 (0.3%) | 14 (0.3%) |
| Total | 13,308 (100.0%) | 5,304 (100.0%) |
Household Vehicle Usage in Mifflin County
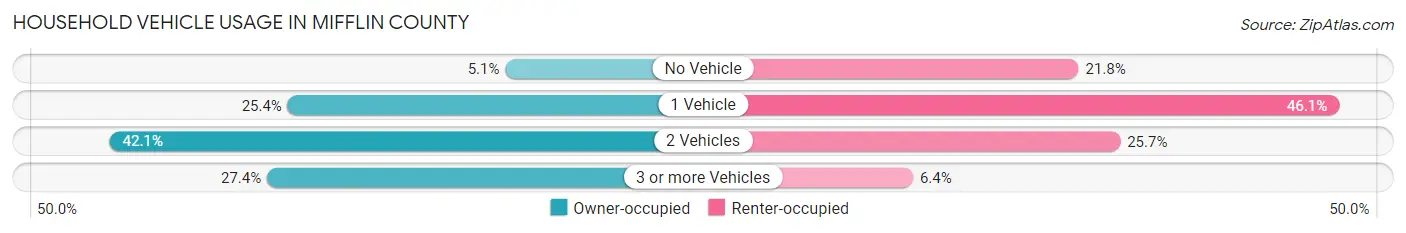
| Vehicles per Household | Owner-occupied | Renter-occupied |
| No Vehicle | 683 (5.1%) | 1,157 (21.8%) |
| 1 Vehicle | 3,385 (25.4%) | 2,447 (46.1%) |
| 2 Vehicles | 5,598 (42.1%) | 1,363 (25.7%) |
| 3 or more Vehicles | 3,642 (27.4%) | 337 (6.4%) |
| Total | 13,308 (100.0%) | 5,304 (100.0%) |
Real Estate & Mortgages in Mifflin County
Real Estate and Mortgage Overview in Mifflin County
| Characteristic | Without Mortgage | With Mortgage |
| Housing Units | 6,633 | 6,675 |
| Median Property Value | $138,700 | $126,400 |
| Median Household Income | $56,745 | $655 |
| Monthly Housing Costs | $532 | $126 |
| Real Estate Taxes | $2,222 | $30 |
Property Value by Mortgage Status in Mifflin County
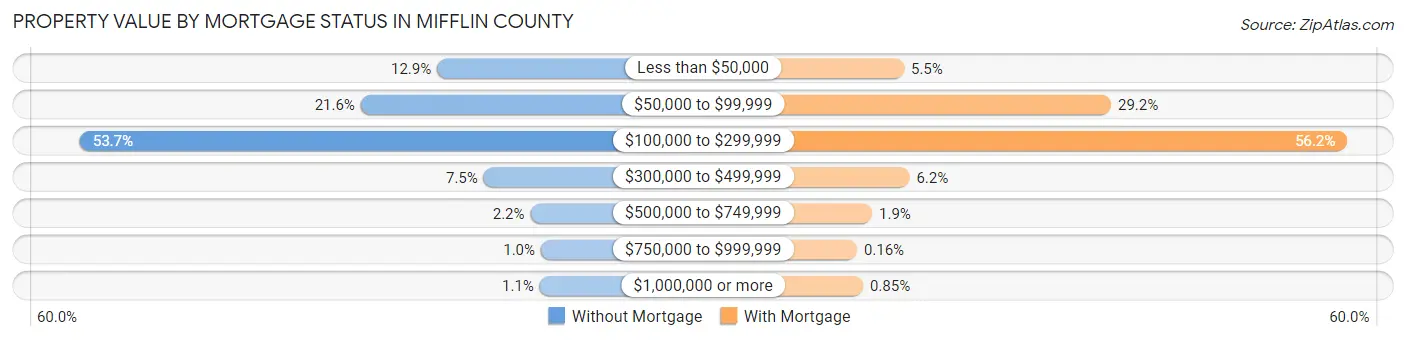
| Property Value | Without Mortgage | With Mortgage |
| Less than $50,000 | 853 (12.9%) | 370 (5.5%) |
| $50,000 to $99,999 | 1,432 (21.6%) | 1,949 (29.2%) |
| $100,000 to $299,999 | 3,561 (53.7%) | 3,751 (56.2%) |
| $300,000 to $499,999 | 500 (7.5%) | 411 (6.2%) |
| $500,000 to $749,999 | 146 (2.2%) | 126 (1.9%) |
| $750,000 to $999,999 | 66 (1.0%) | 11 (0.2%) |
| $1,000,000 or more | 75 (1.1%) | 57 (0.9%) |
| Total | 6,633 (100.0%) | 6,675 (100.0%) |
Household Income by Mortgage Status in Mifflin County
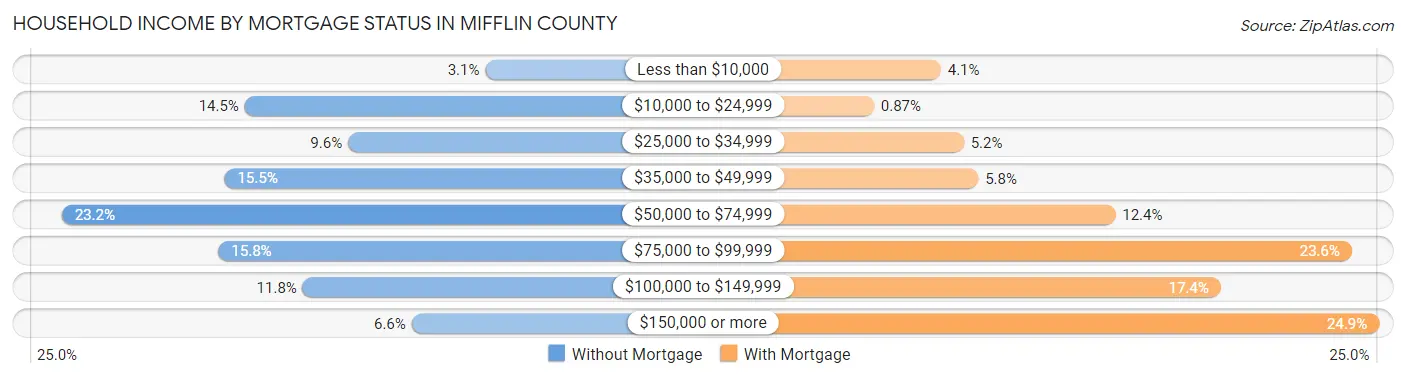
| Household Income | Without Mortgage | With Mortgage |
| Less than $10,000 | 203 (3.1%) | 271 (4.1%) |
| $10,000 to $24,999 | 963 (14.5%) | 58 (0.9%) |
| $25,000 to $34,999 | 637 (9.6%) | 344 (5.1%) |
| $35,000 to $49,999 | 1,027 (15.5%) | 390 (5.8%) |
| $50,000 to $74,999 | 1,541 (23.2%) | 826 (12.4%) |
| $75,000 to $99,999 | 1,046 (15.8%) | 1,577 (23.6%) |
| $100,000 to $149,999 | 780 (11.8%) | 1,161 (17.4%) |
| $150,000 or more | 436 (6.6%) | 1,664 (24.9%) |
| Total | 6,633 (100.0%) | 6,675 (100.0%) |
Property Value to Household Income Ratio in Mifflin County
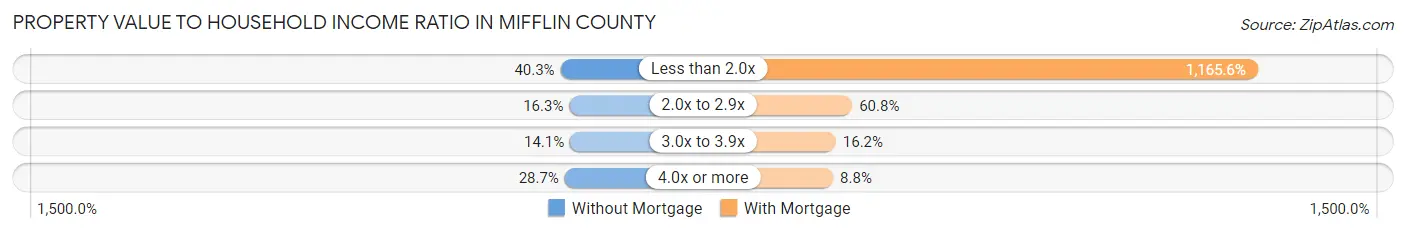
| Value-to-Income Ratio | Without Mortgage | With Mortgage |
| Less than 2.0x | 2,673 (40.3%) | 77,803 (1,165.6%) |
| 2.0x to 2.9x | 1,083 (16.3%) | 4,058 (60.8%) |
| 3.0x to 3.9x | 932 (14.1%) | 1,083 (16.2%) |
| 4.0x or more | 1,901 (28.7%) | 588 (8.8%) |
| Total | 6,633 (100.0%) | 6,675 (100.0%) |
Real Estate Taxes by Mortgage Status in Mifflin County
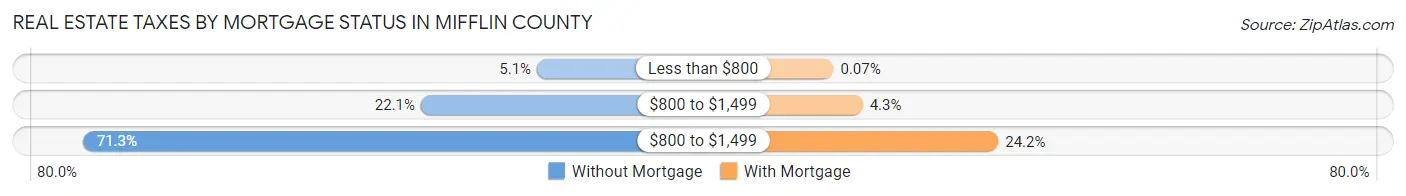
| Property Taxes | Without Mortgage | With Mortgage |
| Less than $800 | 341 (5.1%) | 5 (0.1%) |
| $800 to $1,499 | 1,466 (22.1%) | 289 (4.3%) |
| $800 to $1,499 | 4,732 (71.3%) | 1,612 (24.1%) |
| Total | 6,633 (100.0%) | 6,675 (100.0%) |
Health & Disability in Mifflin County
Health Insurance Coverage by Age in Mifflin County
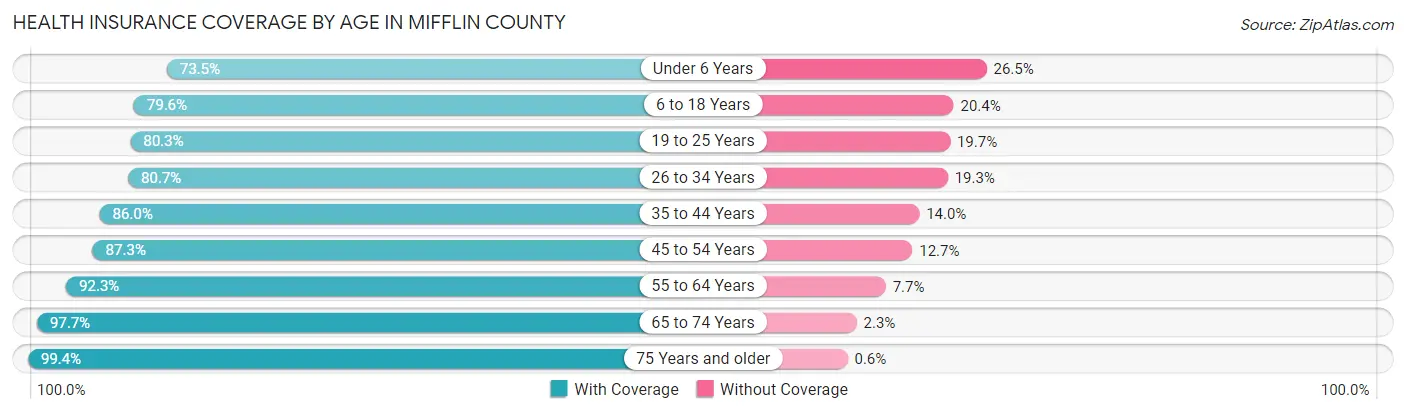
| Age Bracket | With Coverage | Without Coverage |
| Under 6 Years | 2,505 (73.5%) | 904 (26.5%) |
| 6 to 18 Years | 5,933 (79.6%) | 1,519 (20.4%) |
| 19 to 25 Years | 2,696 (80.3%) | 662 (19.7%) |
| 26 to 34 Years | 3,751 (80.7%) | 896 (19.3%) |
| 35 to 44 Years | 4,140 (86.0%) | 672 (14.0%) |
| 45 to 54 Years | 5,063 (87.3%) | 735 (12.7%) |
| 55 to 64 Years | 5,986 (92.3%) | 501 (7.7%) |
| 65 to 74 Years | 5,274 (97.7%) | 124 (2.3%) |
| 75 Years and older | 4,127 (99.4%) | 25 (0.6%) |
| Total | 39,475 (86.7%) | 6,038 (13.3%) |
Health Insurance Coverage by Citizenship Status in Mifflin County
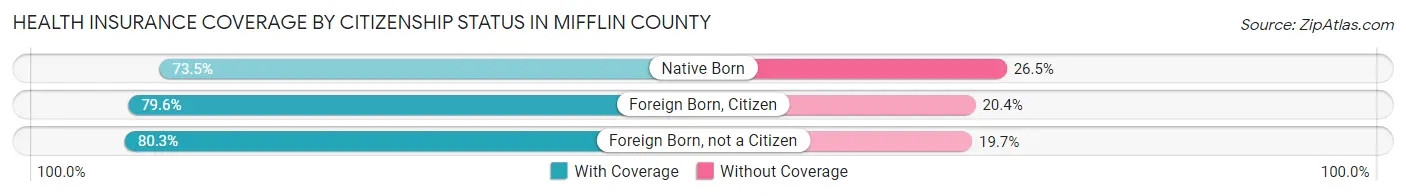
| Citizenship Status | With Coverage | Without Coverage |
| Native Born | 2,505 (73.5%) | 904 (26.5%) |
| Foreign Born, Citizen | 5,933 (79.6%) | 1,519 (20.4%) |
| Foreign Born, not a Citizen | 2,696 (80.3%) | 662 (19.7%) |
Health Insurance Coverage by Household Income in Mifflin County
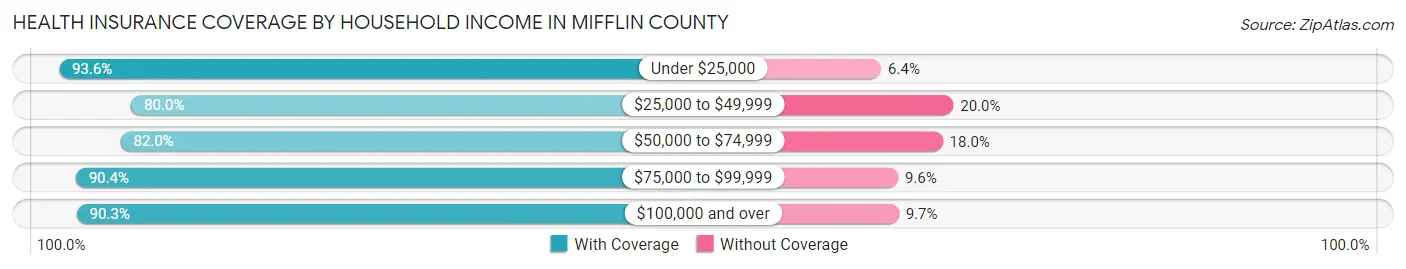
| Household Income | With Coverage | Without Coverage |
| Under $25,000 | 5,667 (93.6%) | 390 (6.4%) |
| $25,000 to $49,999 | 7,930 (80.0%) | 1,978 (20.0%) |
| $50,000 to $74,999 | 8,061 (82.0%) | 1,765 (18.0%) |
| $75,000 to $99,999 | 6,502 (90.4%) | 689 (9.6%) |
| $100,000 and over | 11,235 (90.3%) | 1,211 (9.7%) |
Public vs Private Health Insurance Coverage by Age in Mifflin County
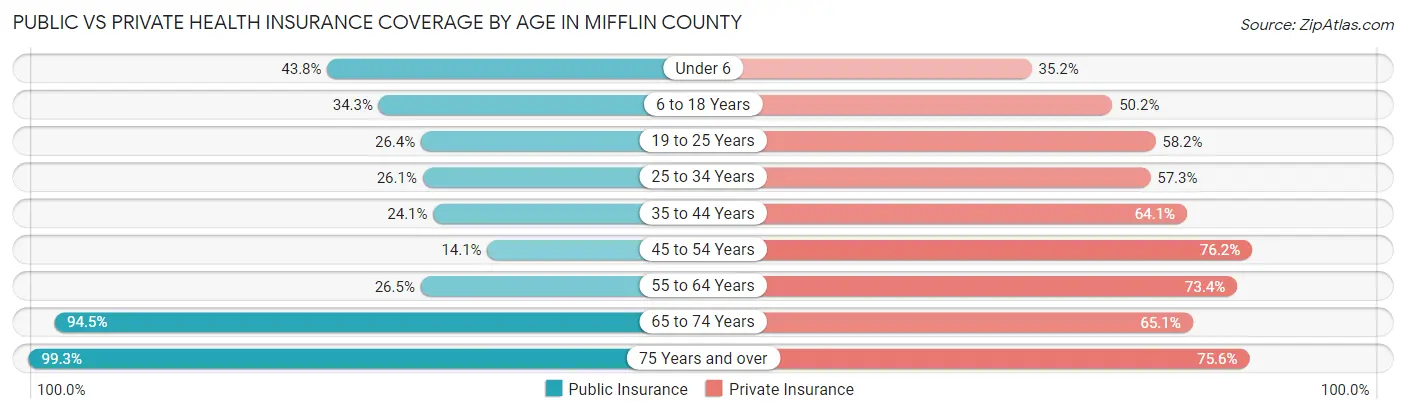
| Age Bracket | Public Insurance | Private Insurance |
| Under 6 | 1,493 (43.8%) | 1,201 (35.2%) |
| 6 to 18 Years | 2,552 (34.3%) | 3,741 (50.2%) |
| 19 to 25 Years | 887 (26.4%) | 1,954 (58.2%) |
| 25 to 34 Years | 1,213 (26.1%) | 2,661 (57.3%) |
| 35 to 44 Years | 1,161 (24.1%) | 3,082 (64.0%) |
| 45 to 54 Years | 817 (14.1%) | 4,415 (76.1%) |
| 55 to 64 Years | 1,717 (26.5%) | 4,760 (73.4%) |
| 65 to 74 Years | 5,102 (94.5%) | 3,515 (65.1%) |
| 75 Years and over | 4,121 (99.3%) | 3,140 (75.6%) |
| Total | 19,063 (41.9%) | 28,469 (62.5%) |
Disability Status by Sex by Age in Mifflin County
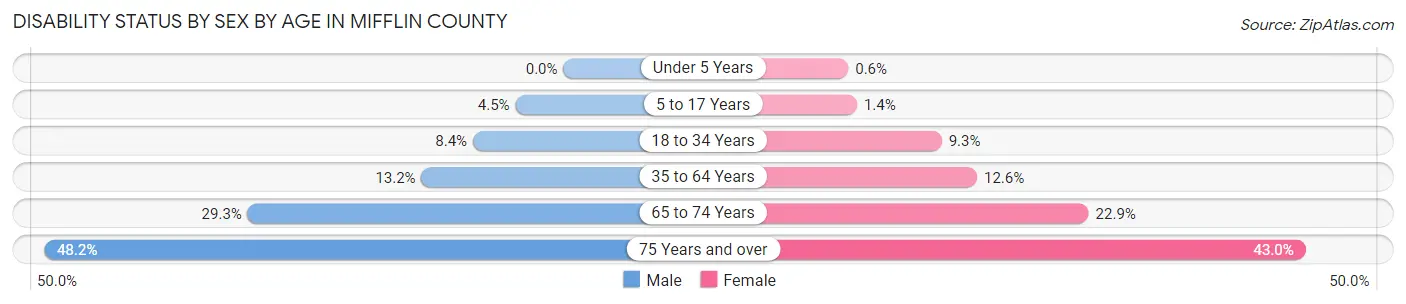
| Age Bracket | Male | Female |
| Under 5 Years | 0 (0.0%) | 9 (0.6%) |
| 5 to 17 Years | 165 (4.4%) | 52 (1.4%) |
| 18 to 34 Years | 364 (8.4%) | 386 (9.3%) |
| 35 to 64 Years | 1,134 (13.2%) | 1,065 (12.6%) |
| 65 to 74 Years | 745 (29.3%) | 654 (22.9%) |
| 75 Years and over | 859 (48.2%) | 1,020 (43.0%) |
Disability Class by Sex by Age in Mifflin County
Disability Class: Hearing Difficulty
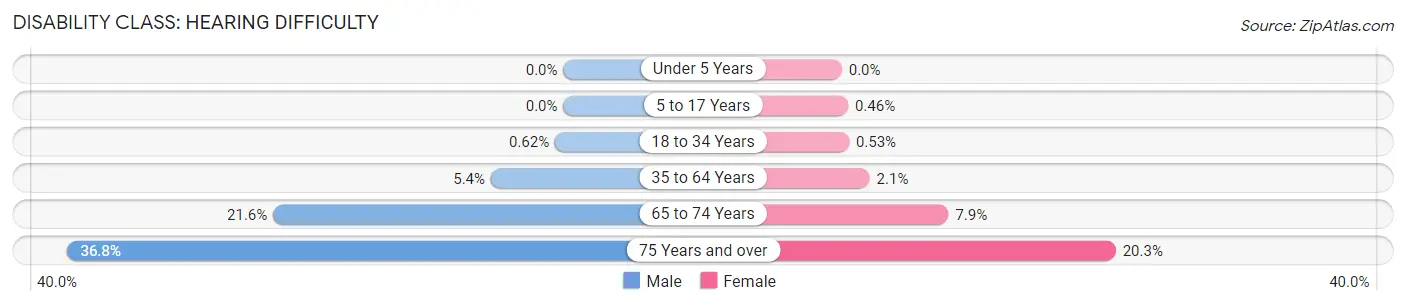
| Age Bracket | Male | Female |
| Under 5 Years | 0 (0.0%) | 0 (0.0%) |
| 5 to 17 Years | 0 (0.0%) | 17 (0.5%) |
| 18 to 34 Years | 27 (0.6%) | 22 (0.5%) |
| 35 to 64 Years | 463 (5.4%) | 176 (2.1%) |
| 65 to 74 Years | 548 (21.5%) | 226 (7.9%) |
| 75 Years and over | 656 (36.8%) | 482 (20.3%) |
Disability Class: Vision Difficulty
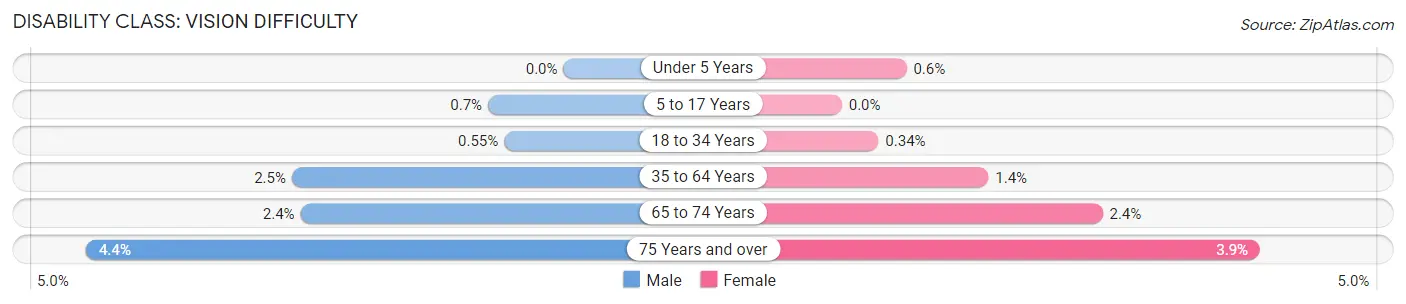
| Age Bracket | Male | Female |
| Under 5 Years | 0 (0.0%) | 9 (0.6%) |
| 5 to 17 Years | 26 (0.7%) | 0 (0.0%) |
| 18 to 34 Years | 24 (0.5%) | 14 (0.3%) |
| 35 to 64 Years | 217 (2.5%) | 115 (1.4%) |
| 65 to 74 Years | 62 (2.4%) | 69 (2.4%) |
| 75 Years and over | 79 (4.4%) | 92 (3.9%) |
Disability Class: Cognitive Difficulty
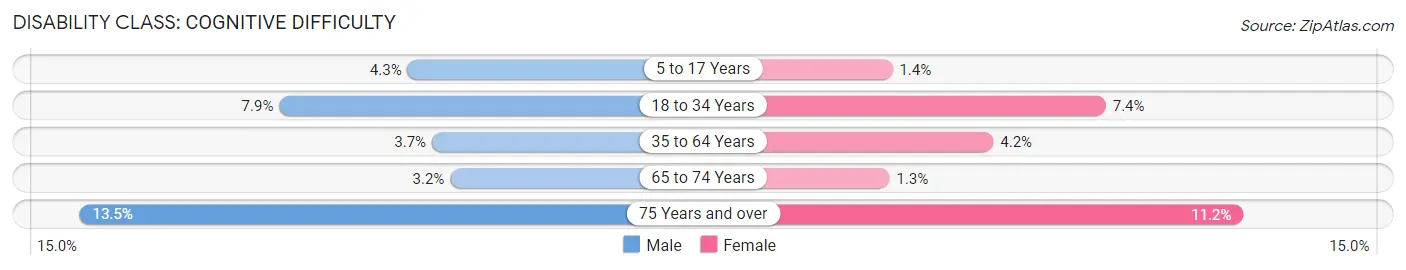
| Age Bracket | Male | Female |
| 5 to 17 Years | 161 (4.3%) | 52 (1.4%) |
| 18 to 34 Years | 343 (7.9%) | 306 (7.3%) |
| 35 to 64 Years | 315 (3.7%) | 358 (4.2%) |
| 65 to 74 Years | 80 (3.2%) | 38 (1.3%) |
| 75 Years and over | 240 (13.5%) | 265 (11.2%) |
Disability Class: Ambulatory Difficulty
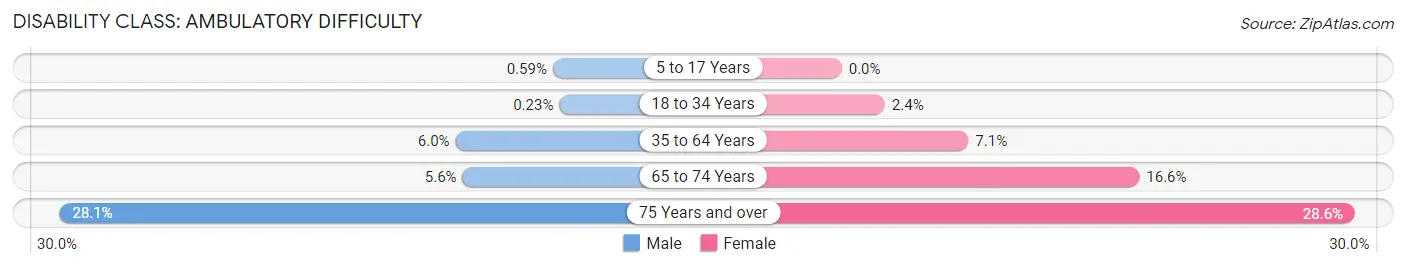
| Age Bracket | Male | Female |
| 5 to 17 Years | 22 (0.6%) | 0 (0.0%) |
| 18 to 34 Years | 10 (0.2%) | 100 (2.4%) |
| 35 to 64 Years | 518 (6.0%) | 598 (7.0%) |
| 65 to 74 Years | 143 (5.6%) | 473 (16.6%) |
| 75 Years and over | 500 (28.1%) | 677 (28.6%) |
Disability Class: Self-Care Difficulty
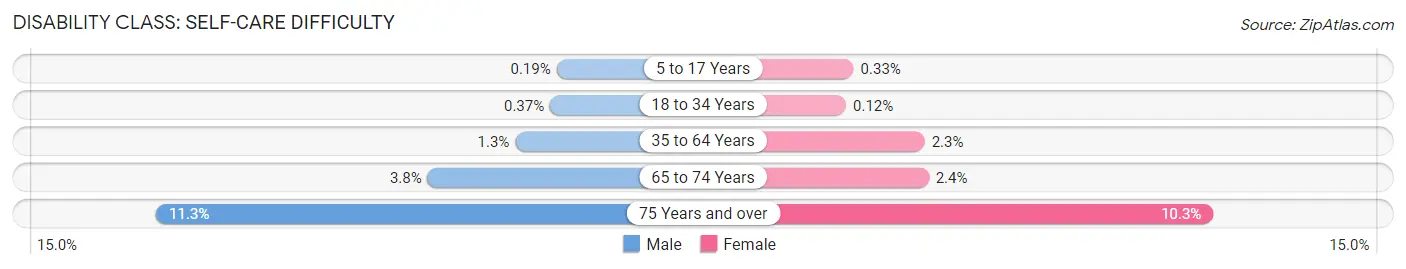
| Age Bracket | Male | Female |
| 5 to 17 Years | 7 (0.2%) | 12 (0.3%) |
| 18 to 34 Years | 16 (0.4%) | 5 (0.1%) |
| 35 to 64 Years | 115 (1.3%) | 196 (2.3%) |
| 65 to 74 Years | 96 (3.8%) | 69 (2.4%) |
| 75 Years and over | 202 (11.3%) | 245 (10.3%) |
Technology Access in Mifflin County
Computing Device Access in Mifflin County
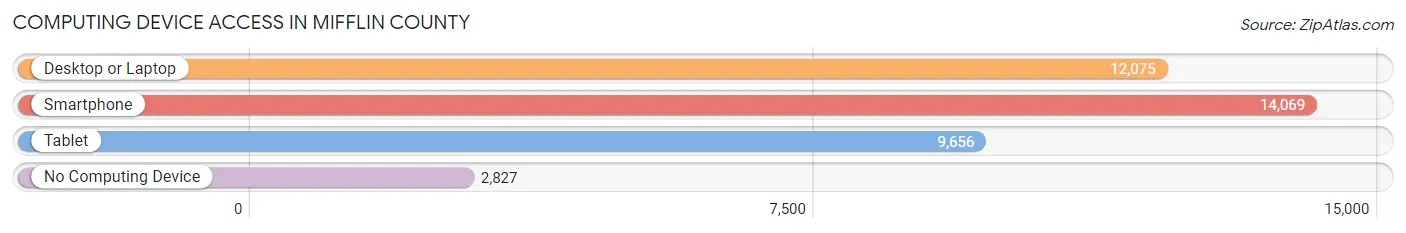
| Device Type | # Households | % Households |
| Desktop or Laptop | 12,075 | 64.9% |
| Smartphone | 14,069 | 75.6% |
| Tablet | 9,656 | 51.9% |
| No Computing Device | 2,827 | 15.2% |
| Total | 18,612 | 100.0% |
Internet Access in Mifflin County
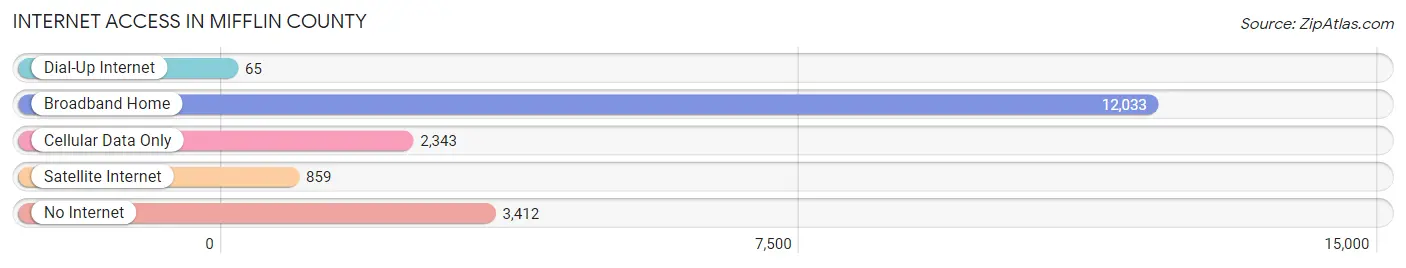
| Internet Type | # Households | % Households |
| Dial-Up Internet | 65 | 0.4% |
| Broadband Home | 12,033 | 64.6% |
| Cellular Data Only | 2,343 | 12.6% |
| Satellite Internet | 859 | 4.6% |
| No Internet | 3,412 | 18.3% |
| Total | 18,612 | 100.0% |
Mifflin County Summary
Mifflin County is a county located in the U.S. state of Pennsylvania. As of the 2010 census, the population was 46,682. The county seat is Lewistown. The county was created on September 19, 1789, from part of Northumberland County and named after Thomas Mifflin, the first Governor of Pennsylvania.
History
Mifflin County was formed in 1789 from part of Northumberland County. It was named after Thomas Mifflin, the first Governor of Pennsylvania. The county was originally part of the "Seven Counties" of the Susquehanna Company, which were created in 1768. The county was home to many Native American tribes, including the Susquehannock, Iroquois, and Shawnee.
The first European settlers arrived in the area in the late 1700s. The county was home to many early industries, including iron and steel production, lumbering, and coal mining. The county was also home to the first oil well in the United States, which was drilled in 1859.
Geography
Mifflin County is located in central Pennsylvania, about 90 miles northwest of Philadelphia. It is bordered by Juniata County to the north, Snyder County to the east, Centre County to the south, and Huntingdon County to the west. The county has a total area of 517 square miles, of which 514 square miles is land and 3 square miles is water.
The county is located in the Ridge and Valley region of the Appalachian Mountains. The main geographic features of the county are the Juniata River, which runs through the center of the county, and the Tuscarora Mountains, which run along the western edge of the county.
Economy
Mifflin County's economy is largely based on agriculture and manufacturing. The county is home to several large agricultural operations, including dairy farms, beef farms, and poultry farms. The county is also home to several large manufacturing companies, including a paper mill, a steel mill, and a plastics plant.
The county is also home to several tourist attractions, including the Pennsylvania State Forest, the Pennsylvania State Park, and the Pennsylvania State Game Lands.
Demographics
As of the 2010 census, there were 46,682 people, 18,845 households, and 12,845 families living in the county. The population density was 91.2 people per square mile. The racial makeup of the county was 97.3% White, 0.7% African American, 0.2% Native American, 0.3% Asian, 0.1% Pacific Islander, 0.4% from other races, and 0.9% from two or more races.
The median income for a household in the county was $41,945, and the median income for a family was $50,945. The per capita income for the county was $20,945. About 10.3% of families and 13.2% of the population were below the poverty line, including 17.2% of those under age 18 and 8.2% of those age 65 or over.
Common Questions
What is Per Capita Income in Mifflin County?
Per Capita income in Mifflin County is $28,979.
What is the Median Family Income in Mifflin County?
Median Family Income in Mifflin County is $67,657.
What is the Median Household income in Mifflin County?
Median Household Income in Mifflin County is $58,012.
What is Income or Wage Gap in Mifflin County?
Income or Wage Gap in Mifflin County is 32.6%.
Women in Mifflin County earn 67.4 cents for every dollar earned by a man.
What is Family Income Deficit in Mifflin County?
Family Income Deficit in Mifflin County is $9,101.
Families that are below poverty line in Mifflin County earn $9,101 less on average than the poverty threshold level.
What is Inequality or Gini Index in Mifflin County?
Inequality or Gini Index in Mifflin County is 0.40.
What is the Total Population of Mifflin County?
Total Population of Mifflin County is 46,146.
What is the Total Male Population of Mifflin County?
Total Male Population of Mifflin County is 22,740.
What is the Total Female Population of Mifflin County?
Total Female Population of Mifflin County is 23,406.
What is the Ratio of Males per 100 Females in Mifflin County?
There are 97.15 Males per 100 Females in Mifflin County.
What is the Ratio of Females per 100 Males in Mifflin County?
There are 102.93 Females per 100 Males in Mifflin County.
What is the Median Population Age in Mifflin County?
Median Population Age in Mifflin County is 43.3 Years.
What is the Average Family Size in Mifflin County
Average Family Size in Mifflin County is 2.9 People.
What is the Average Household Size in Mifflin County
Average Household Size in Mifflin County is 2.4 People.
How Large is the Labor Force in Mifflin County?
There are 22,125 People in the Labor Forcein in Mifflin County.
What is the Percentage of People in the Labor Force in Mifflin County?
59.9% of People are in the Labor Force in Mifflin County.
What is the Unemployment Rate in Mifflin County?
Unemployment Rate in Mifflin County is 3.9%.