McKean County, PA Map & Demographics
McKean County Map
McKean County Overview
$30,278
PER CAPITA INCOME
$72,857
AVG FAMILY INCOME
$57,861
AVG HOUSEHOLD INCOME
27.5%
WAGE / INCOME GAP [ % ]
72.5¢/ $1
WAGE / INCOME GAP [ $ ]
$11,181
FAMILY INCOME DEFICIT
0.45
INEQUALITY / GINI INDEX
40,459
TOTAL POPULATION
20,929
MALE POPULATION
19,530
FEMALE POPULATION
107.16
MALES / 100 FEMALES
93.32
FEMALES / 100 MALES
43.8
MEDIAN AGE
2.9
AVG FAMILY SIZE
2.4
AVG HOUSEHOLD SIZE
18,589
LABOR FORCE [ PEOPLE ]
55.4%
PERCENT IN LABOR FORCE
5.3%
UNEMPLOYMENT RATE
McKean County Area Codes
Income in McKean County
Income Overview in McKean County
Per Capita Income in McKean County is $30,278, while median incomes of families and households are $72,857 and $57,861 respectively.
| Characteristic | Number | Measure |
| Per Capita Income | 40,459 | $30,278 |
| Median Family Income | 10,088 | $72,857 |
| Mean Family Income | 10,088 | $86,878 |
| Median Household Income | 15,931 | $57,861 |
| Mean Household Income | 15,931 | $74,725 |
| Income Deficit | 10,088 | $11,181 |
| Wage / Income Gap (%) | 40,459 | 27.50% |
| Wage / Income Gap ($) | 40,459 | 72.50¢ per $1 |
| Gini / Inequality Index | 40,459 | 0.45 |
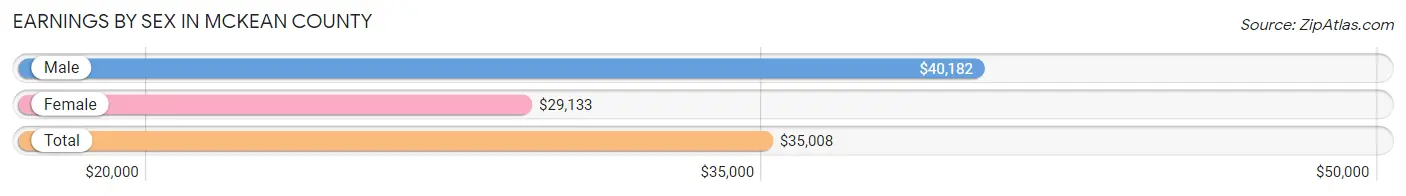
Earnings by Sex in McKean County
Average Earnings in McKean County are $35,008, $40,182 for men and $29,133 for women, a difference of 27.5%.
| Sex | Number | Average Earnings |
| Male | 10,918 (54.2%) | $40,182 |
| Female | 9,238 (45.8%) | $29,133 |
| Total | 20,156 (100.0%) | $35,008 |
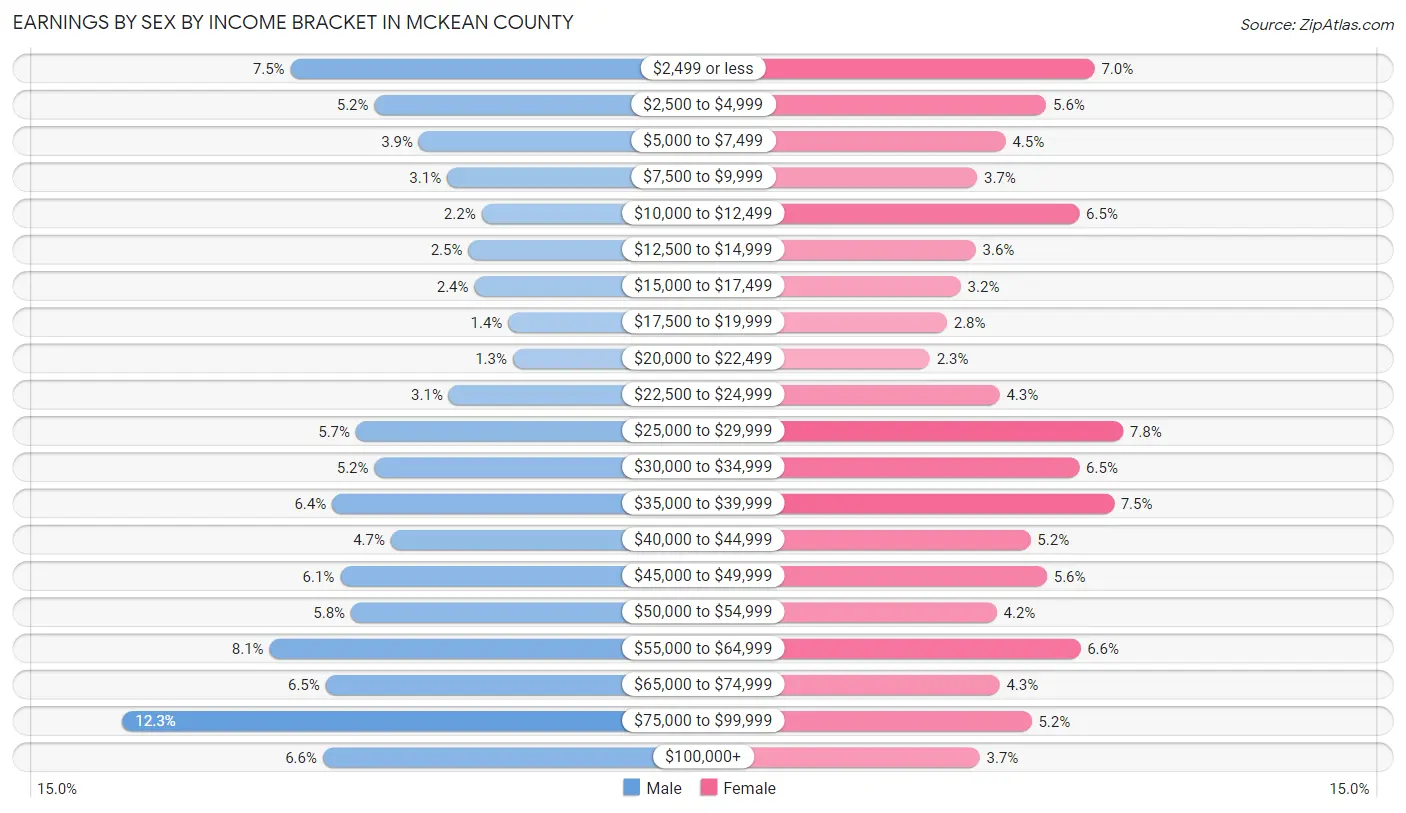
Earnings by Sex by Income Bracket in McKean County
The most common earnings brackets in McKean County are $75,000 to $99,999 for men (1,338 | 12.2%) and $25,000 to $29,999 for women (717 | 7.8%).
| Income | Male | Female |
| $2,499 or less | 822 (7.5%) | 643 (7.0%) |
| $2,500 to $4,999 | 565 (5.2%) | 517 (5.6%) |
| $5,000 to $7,499 | 428 (3.9%) | 412 (4.5%) |
| $7,500 to $9,999 | 342 (3.1%) | 338 (3.7%) |
| $10,000 to $12,499 | 236 (2.2%) | 603 (6.5%) |
| $12,500 to $14,999 | 276 (2.5%) | 334 (3.6%) |
| $15,000 to $17,499 | 258 (2.4%) | 296 (3.2%) |
| $17,500 to $19,999 | 154 (1.4%) | 260 (2.8%) |
| $20,000 to $22,499 | 140 (1.3%) | 215 (2.3%) |
| $22,500 to $24,999 | 336 (3.1%) | 396 (4.3%) |
| $25,000 to $29,999 | 621 (5.7%) | 717 (7.8%) |
| $30,000 to $34,999 | 564 (5.2%) | 603 (6.5%) |
| $35,000 to $39,999 | 694 (6.4%) | 693 (7.5%) |
| $40,000 to $44,999 | 514 (4.7%) | 477 (5.2%) |
| $45,000 to $49,999 | 669 (6.1%) | 519 (5.6%) |
| $50,000 to $54,999 | 637 (5.8%) | 389 (4.2%) |
| $55,000 to $64,999 | 887 (8.1%) | 606 (6.6%) |
| $65,000 to $74,999 | 714 (6.5%) | 396 (4.3%) |
| $75,000 to $99,999 | 1,338 (12.2%) | 479 (5.2%) |
| $100,000+ | 723 (6.6%) | 345 (3.7%) |
| Total | 10,918 (100.0%) | 9,238 (100.0%) |
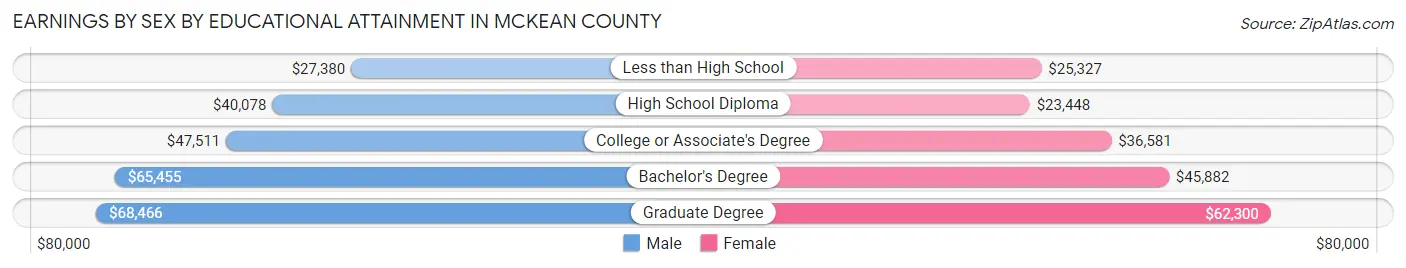
Earnings by Sex by Educational Attainment in McKean County
Average earnings in McKean County are $46,665 for men and $34,706 for women, a difference of 25.6%. Men with an educational attainment of graduate degree enjoy the highest average annual earnings of $68,466, while those with less than high school education earn the least with $27,380. Women with an educational attainment of graduate degree earn the most with the average annual earnings of $62,300, while those with high school diploma education have the smallest earnings of $23,448.
| Educational Attainment | Male Income | Female Income |
| Less than High School | $27,380 | $25,327 |
| High School Diploma | $40,078 | $23,448 |
| College or Associate's Degree | $47,511 | $36,581 |
| Bachelor's Degree | $65,455 | $45,882 |
| Graduate Degree | $68,466 | $62,300 |
| Total | $46,665 | $34,706 |
Family Income in McKean County
Family Income Brackets in McKean County
According to the McKean County family income data, there are 2,139 families falling into the $50,000 to $74,999 income range, which is the most common income bracket and makes up 21.2% of all families. Conversely, the $10,000 to $14,999 income bracket is the least frequent group with only 272 families (2.7%) belonging to this category.
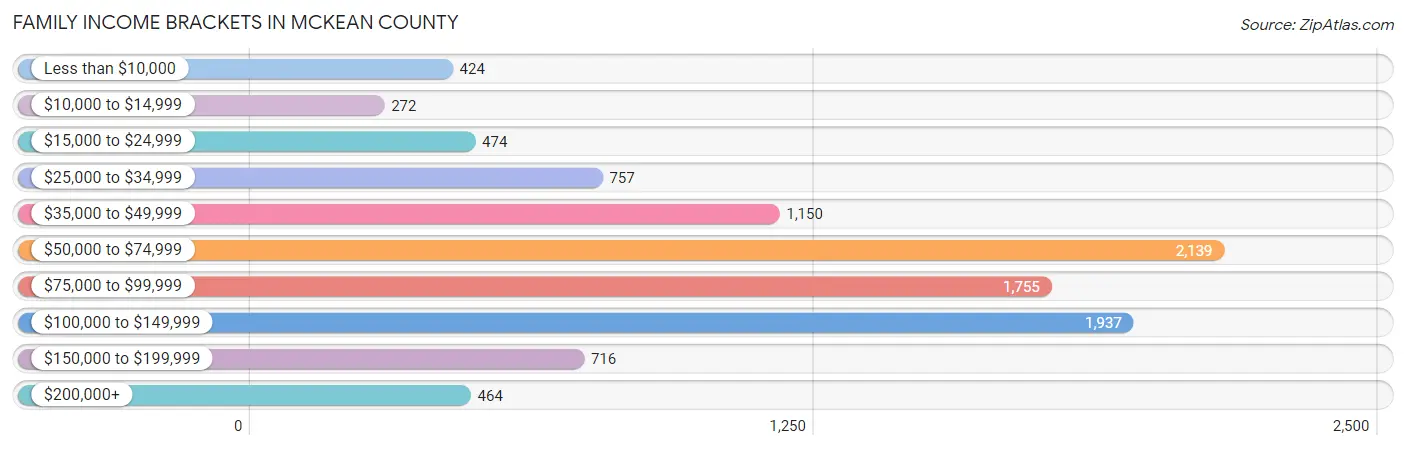
| Income Bracket | # Families | % Families |
| Less than $10,000 | 424 | 4.2% |
| $10,000 to $14,999 | 272 | 2.7% |
| $15,000 to $24,999 | 474 | 4.7% |
| $25,000 to $34,999 | 757 | 7.5% |
| $35,000 to $49,999 | 1,150 | 11.4% |
| $50,000 to $74,999 | 2,139 | 21.2% |
| $75,000 to $99,999 | 1,755 | 17.4% |
| $100,000 to $149,999 | 1,937 | 19.2% |
| $150,000 to $199,999 | 716 | 7.1% |
| $200,000+ | 464 | 4.6% |
Family Income by Famaliy Size in McKean County
7+ person families (84 | 0.8%) account for the highest median family income in McKean County with $100,500 per family, while 2-person families (5,443 | 54.0%) have the highest median income of $33,614 per family member.
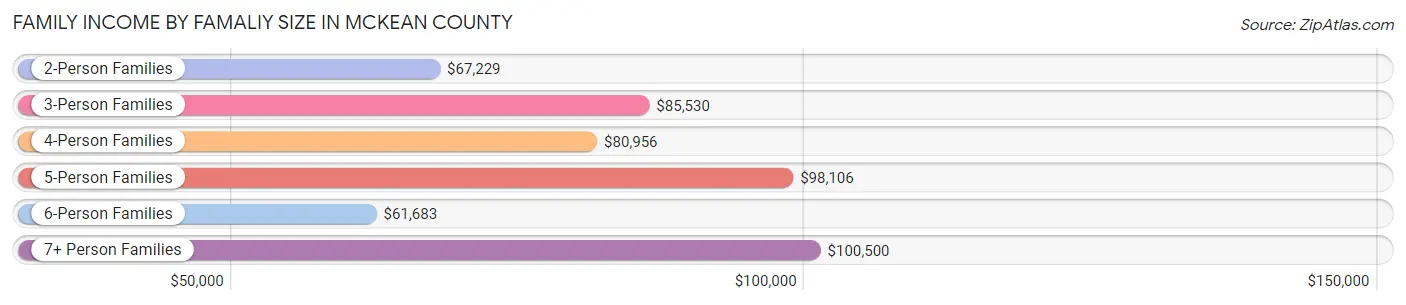
| Income Bracket | # Families | Median Income |
| 2-Person Families | 5,443 (54.0%) | $67,229 |
| 3-Person Families | 2,053 (20.3%) | $85,530 |
| 4-Person Families | 1,635 (16.2%) | $80,956 |
| 5-Person Families | 558 (5.5%) | $98,106 |
| 6-Person Families | 315 (3.1%) | $61,683 |
| 7+ Person Families | 84 (0.8%) | $100,500 |
| Total | 10,088 (100.0%) | $72,857 |
Family Income by Number of Earners in McKean County
The median family income in McKean County is $72,857, with families comprising 3+ earners (1,009) having the highest median family income of $119,922, while families with no earners (1,972) have the lowest median family income of $45,678, accounting for 10.0% and 19.6% of families, respectively.
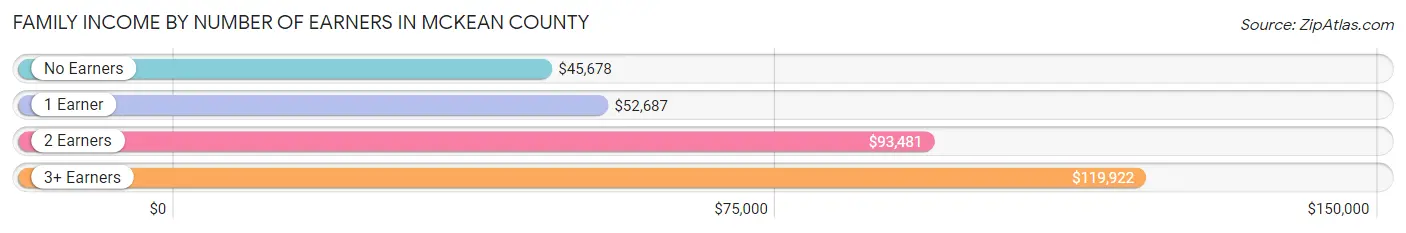
| Number of Earners | # Families | Median Income |
| No Earners | 1,972 (19.6%) | $45,678 |
| 1 Earner | 3,303 (32.7%) | $52,687 |
| 2 Earners | 3,804 (37.7%) | $93,481 |
| 3+ Earners | 1,009 (10.0%) | $119,922 |
| Total | 10,088 (100.0%) | $72,857 |
Household Income in McKean County
Household Income Brackets in McKean County
With 3,170 households falling in the category, the $50,000 to $74,999 income range is the most frequent in McKean County, accounting for 19.9% of all households. In contrast, only 621 households (3.9%) fall into the $200,000+ income bracket, making it the least populous group.
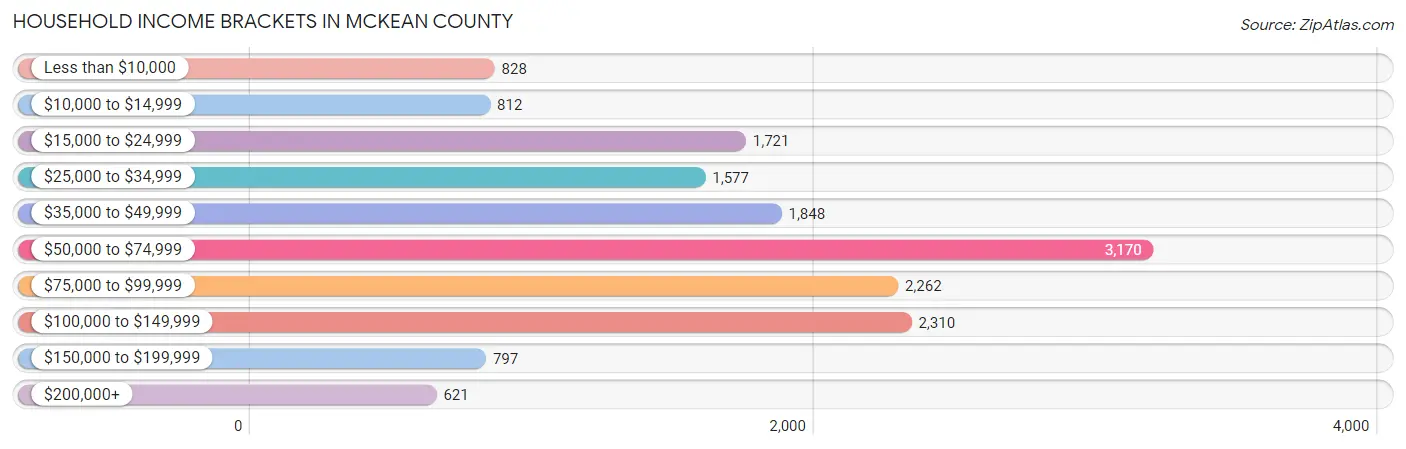
| Income Bracket | # Households | % Households |
| Less than $10,000 | 828 | 5.2% |
| $10,000 to $14,999 | 812 | 5.1% |
| $15,000 to $24,999 | 1,721 | 10.8% |
| $25,000 to $34,999 | 1,577 | 9.9% |
| $35,000 to $49,999 | 1,848 | 11.6% |
| $50,000 to $74,999 | 3,170 | 19.9% |
| $75,000 to $99,999 | 2,262 | 14.2% |
| $100,000 to $149,999 | 2,310 | 14.5% |
| $150,000 to $199,999 | 797 | 5.0% |
| $200,000+ | 621 | 3.9% |
Household Income by Householder Age in McKean County
The median household income in McKean County is $57,861, with the highest median household income of $71,454 found in the 45 to 64 years age bracket for the primary householder. A total of 6,535 households (41.0%) fall into this category. Meanwhile, the 65+ years age bracket for the primary householder has the lowest median household income of $42,633, with 4,983 households (31.3%) in this group.
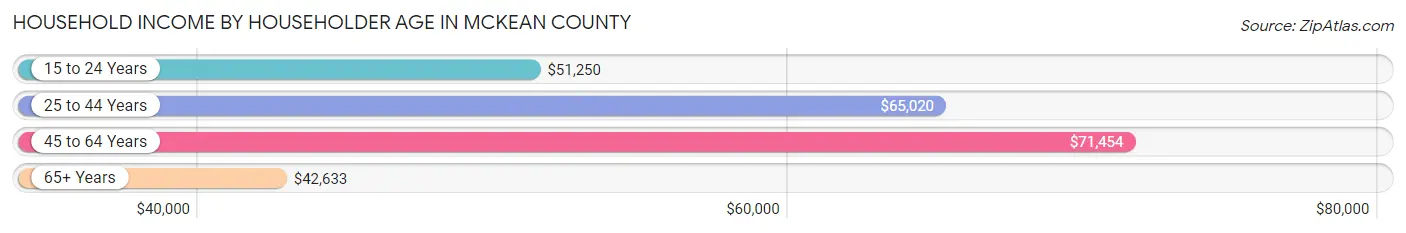
| Income Bracket | # Households | Median Income |
| 15 to 24 Years | 403 (2.5%) | $51,250 |
| 25 to 44 Years | 4,010 (25.2%) | $65,020 |
| 45 to 64 Years | 6,535 (41.0%) | $71,454 |
| 65+ Years | 4,983 (31.3%) | $42,633 |
| Total | 15,931 (100.0%) | $57,861 |
Poverty in McKean County
Income Below Poverty by Sex and Age in McKean County
With 12.7% poverty level for males and 15.6% for females among the residents of McKean County, 25 to 34 year old males and 5 year old females are the most vulnerable to poverty, with 481 males (21.5%) and 52 females (38.2%) in their respective age groups living below the poverty level.
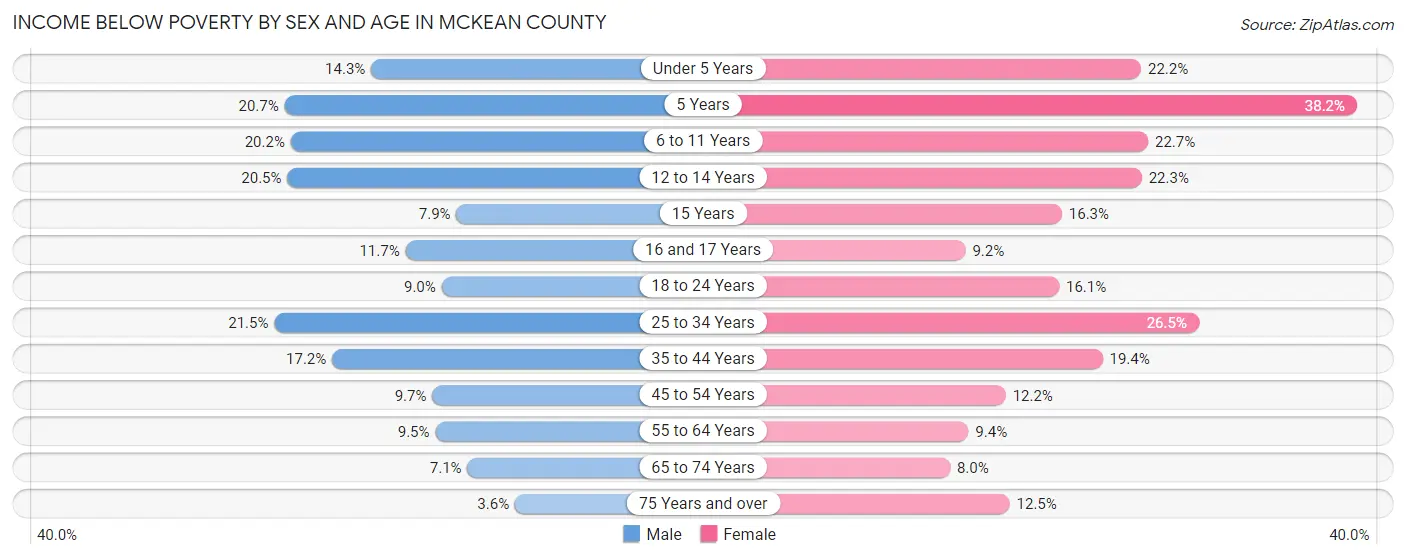
| Age Bracket | Male | Female |
| Under 5 Years | 134 (14.3%) | 210 (22.2%) |
| 5 Years | 65 (20.7%) | 52 (38.2%) |
| 6 to 11 Years | 274 (20.2%) | 277 (22.7%) |
| 12 to 14 Years | 143 (20.5%) | 157 (22.3%) |
| 15 Years | 25 (7.9%) | 25 (16.3%) |
| 16 and 17 Years | 60 (11.7%) | 49 (9.2%) |
| 18 to 24 Years | 120 (9.0%) | 229 (16.1%) |
| 25 to 34 Years | 481 (21.5%) | 542 (26.5%) |
| 35 to 44 Years | 359 (17.2%) | 404 (19.4%) |
| 45 to 54 Years | 261 (9.7%) | 305 (12.2%) |
| 55 to 64 Years | 288 (9.5%) | 280 (9.4%) |
| 65 to 74 Years | 163 (7.1%) | 181 (8.0%) |
| 75 Years and over | 47 (3.6%) | 212 (12.5%) |
| Total | 2,420 (12.7%) | 2,923 (15.6%) |
Income Above Poverty by Sex and Age in McKean County
According to the poverty statistics in McKean County, males aged 75 years and over and females aged 65 to 74 years are the age groups that are most secure financially, with 96.4% of males and 92.0% of females in these age groups living above the poverty line.
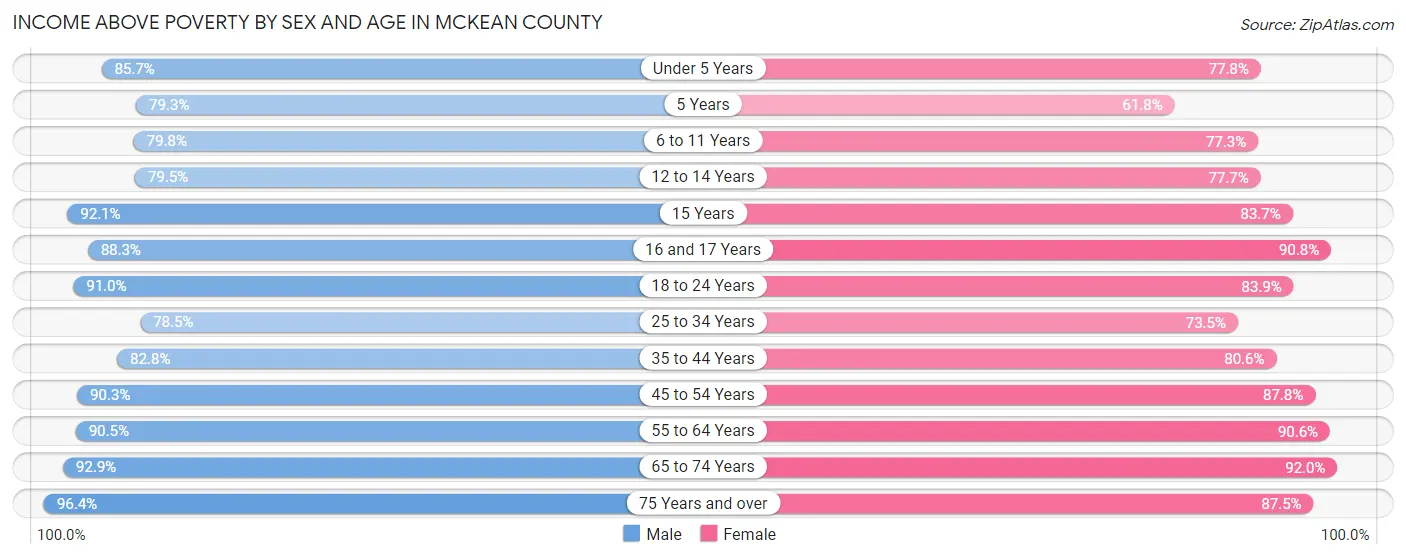
| Age Bracket | Male | Female |
| Under 5 Years | 805 (85.7%) | 735 (77.8%) |
| 5 Years | 249 (79.3%) | 84 (61.8%) |
| 6 to 11 Years | 1,080 (79.8%) | 941 (77.3%) |
| 12 to 14 Years | 555 (79.5%) | 548 (77.7%) |
| 15 Years | 290 (92.1%) | 128 (83.7%) |
| 16 and 17 Years | 452 (88.3%) | 485 (90.8%) |
| 18 to 24 Years | 1,207 (91.0%) | 1,191 (83.9%) |
| 25 to 34 Years | 1,760 (78.5%) | 1,503 (73.5%) |
| 35 to 44 Years | 1,732 (82.8%) | 1,683 (80.6%) |
| 45 to 54 Years | 2,422 (90.3%) | 2,202 (87.8%) |
| 55 to 64 Years | 2,743 (90.5%) | 2,700 (90.6%) |
| 65 to 74 Years | 2,126 (92.9%) | 2,074 (92.0%) |
| 75 Years and over | 1,262 (96.4%) | 1,489 (87.5%) |
| Total | 16,683 (87.3%) | 15,763 (84.4%) |
Income Below Poverty Among Married-Couple Families in McKean County
The poverty statistics for married-couple families in McKean County show that 5.5% or 427 of the total 7,827 families live below the poverty line. Families with 5 or more children have the highest poverty rate of 14.0%, comprising of 6 families. On the other hand, families with no children have the lowest poverty rate of 4.7%, which includes 243 families.
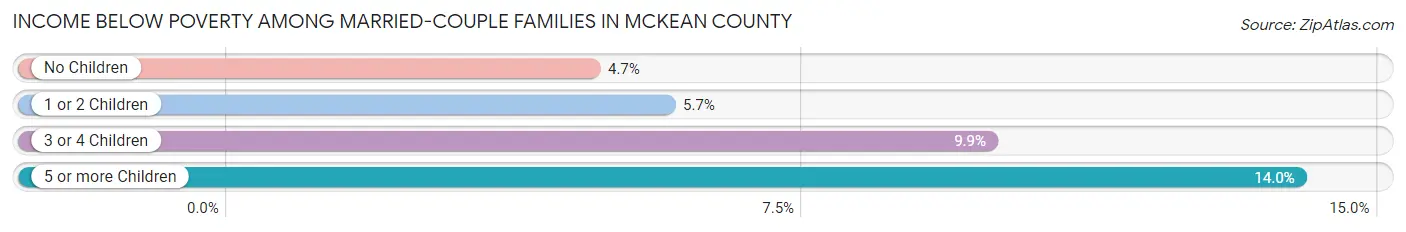
| Children | Above Poverty | Below Poverty |
| No Children | 4,880 (95.3%) | 243 (4.7%) |
| 1 or 2 Children | 1,929 (94.3%) | 117 (5.7%) |
| 3 or 4 Children | 554 (90.1%) | 61 (9.9%) |
| 5 or more Children | 37 (86.1%) | 6 (14.0%) |
| Total | 7,400 (94.5%) | 427 (5.5%) |
Income Below Poverty Among Single-Parent Households in McKean County
According to the poverty data in McKean County, 20.9% or 178 single-father households and 34.2% or 482 single-mother households are living below the poverty line. Among single-father households, those with 5 or more children have the highest poverty rate, with 17 households (100.0%) experiencing poverty. Likewise, among single-mother households, those with 5 or more children have the highest poverty rate, with 9 households (100.0%) falling below the poverty line.
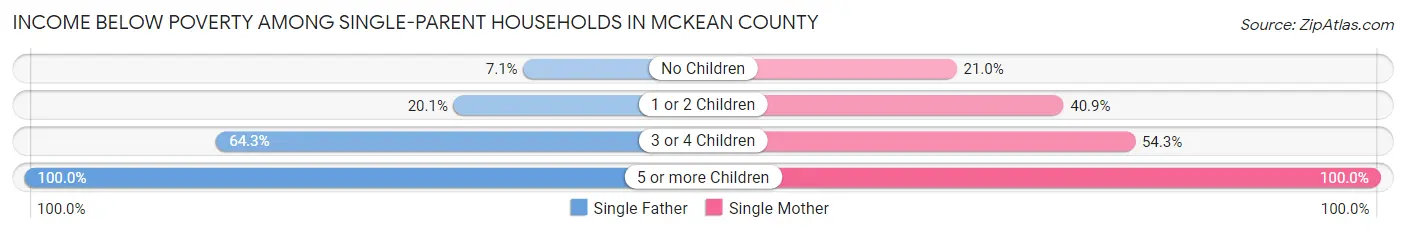
| Children | Single Father | Single Mother |
| No Children | 17 (7.1%) | 124 (21.0%) |
| 1 or 2 Children | 108 (20.1%) | 279 (40.9%) |
| 3 or 4 Children | 36 (64.3%) | 70 (54.3%) |
| 5 or more Children | 17 (100.0%) | 9 (100.0%) |
| Total | 178 (20.9%) | 482 (34.2%) |
Income Below Poverty Among Married-Couple vs Single-Parent Households in McKean County
The poverty data for McKean County shows that 427 of the married-couple family households (5.5%) and 660 of the single-parent households (29.2%) are living below the poverty level. Within the married-couple family households, those with 5 or more children have the highest poverty rate, with 6 households (14.0%) falling below the poverty line. Among the single-parent households, those with 5 or more children have the highest poverty rate, with 26 household (100.0%) living below poverty.
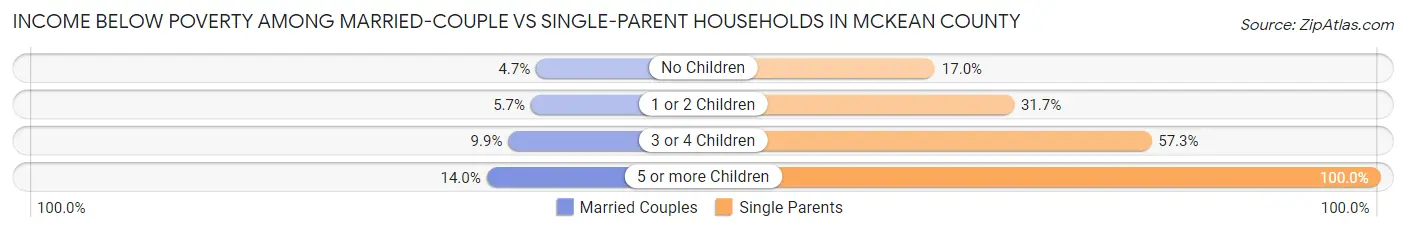
| Children | Married-Couple Families | Single-Parent Households |
| No Children | 243 (4.7%) | 141 (17.0%) |
| 1 or 2 Children | 117 (5.7%) | 387 (31.7%) |
| 3 or 4 Children | 61 (9.9%) | 106 (57.3%) |
| 5 or more Children | 6 (14.0%) | 26 (100.0%) |
| Total | 427 (5.5%) | 660 (29.2%) |
Race in McKean County
The most populous races in McKean County are White / Caucasian (38,007 | 93.9%), Two or more Races (1,127 | 2.8%), and Hispanic or Latino (872 | 2.2%).
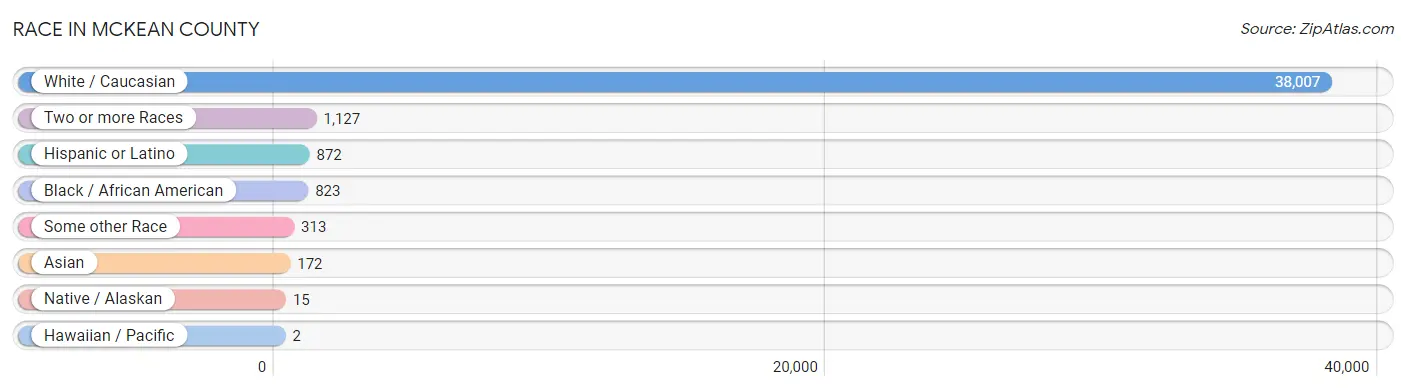
| Race | # Population | % Population |
| Asian | 172 | 0.4% |
| Black / African American | 823 | 2.0% |
| Hawaiian / Pacific | 2 | 0.0% |
| Hispanic or Latino | 872 | 2.2% |
| Native / Alaskan | 15 | 0.0% |
| White / Caucasian | 38,007 | 93.9% |
| Two or more Races | 1,127 | 2.8% |
| Some other Race | 313 | 0.8% |
| Total | 40,459 | 100.0% |
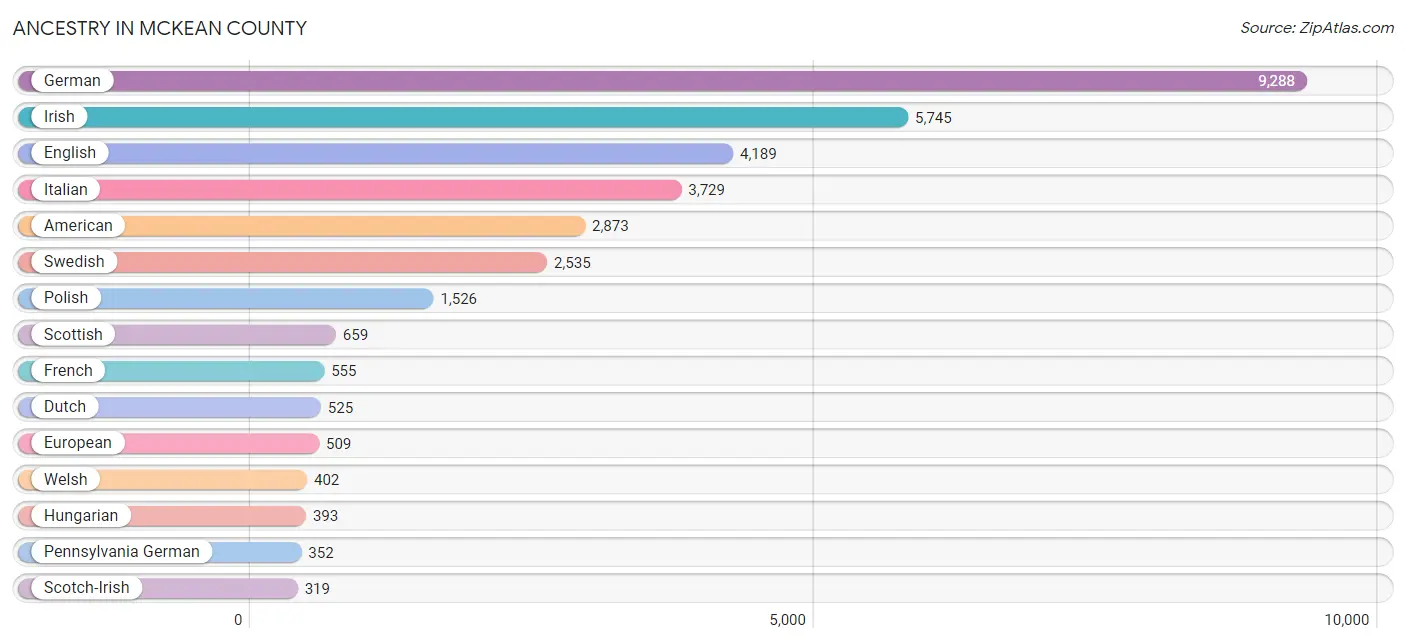
Ancestry in McKean County
The most populous ancestries reported in McKean County are German (9,288 | 23.0%), Irish (5,745 | 14.2%), English (4,189 | 10.3%), Italian (3,729 | 9.2%), and American (2,873 | 7.1%), together accounting for 63.8% of all McKean County residents.
| Ancestry | # Population | % Population |
| African | 26 | 0.1% |
| American | 2,873 | 7.1% |
| Arab | 108 | 0.3% |
| Armenian | 7 | 0.0% |
| Austrian | 103 | 0.3% |
| Basque | 10 | 0.0% |
| Belgian | 36 | 0.1% |
| Bhutanese | 42 | 0.1% |
| Blackfeet | 2 | 0.0% |
| Brazilian | 4 | 0.0% |
| British | 178 | 0.4% |
| Burmese | 18 | 0.0% |
| Canadian | 56 | 0.1% |
| Cape Verdean | 4 | 0.0% |
| Celtic | 2 | 0.0% |
| Central American | 88 | 0.2% |
| Cherokee | 45 | 0.1% |
| Chippewa | 6 | 0.0% |
| Colombian | 48 | 0.1% |
| Croatian | 176 | 0.4% |
| Cuban | 23 | 0.1% |
| Czech | 157 | 0.4% |
| Czechoslovakian | 66 | 0.2% |
| Danish | 65 | 0.2% |
| Dominican | 32 | 0.1% |
| Dutch | 525 | 1.3% |
| Eastern European | 93 | 0.2% |
| English | 4,189 | 10.3% |
| Estonian | 16 | 0.0% |
| European | 509 | 1.3% |
| Finnish | 5 | 0.0% |
| French | 555 | 1.4% |
| French Canadian | 153 | 0.4% |
| German | 9,288 | 23.0% |
| Greek | 35 | 0.1% |
| Guatemalan | 31 | 0.1% |
| Hungarian | 393 | 1.0% |
| Indian (Asian) | 71 | 0.2% |
| Iranian | 13 | 0.0% |
| Irish | 5,745 | 14.2% |
| Iroquois | 35 | 0.1% |
| Italian | 3,729 | 9.2% |
| Japanese | 8 | 0.0% |
| Jordanian | 7 | 0.0% |
| Korean | 79 | 0.2% |
| Lebanese | 97 | 0.2% |
| Lithuanian | 16 | 0.0% |
| Mexican | 158 | 0.4% |
| Nigerian | 8 | 0.0% |
| Northern European | 10 | 0.0% |
| Norwegian | 192 | 0.5% |
| Pakistani | 52 | 0.1% |
| Panamanian | 57 | 0.1% |
| Pennsylvania German | 352 | 0.9% |
| Peruvian | 90 | 0.2% |
| Polish | 1,526 | 3.8% |
| Portuguese | 6 | 0.0% |
| Puerto Rican | 228 | 0.6% |
| Romanian | 16 | 0.0% |
| Russian | 113 | 0.3% |
| Scandinavian | 77 | 0.2% |
| Scotch-Irish | 319 | 0.8% |
| Scottish | 659 | 1.6% |
| Slavic | 46 | 0.1% |
| Slovak | 230 | 0.6% |
| Slovene | 83 | 0.2% |
| South American | 138 | 0.3% |
| Spaniard | 2 | 0.0% |
| Sri Lankan | 45 | 0.1% |
| Subsaharan African | 48 | 0.1% |
| Swedish | 2,535 | 6.3% |
| Swiss | 136 | 0.3% |
| Thai | 32 | 0.1% |
| Trinidadian and Tobagonian | 15 | 0.0% |
| Ukrainian | 189 | 0.5% |
| Welsh | 402 | 1.0% |
| West Indian | 66 | 0.2% |
| Yugoslavian | 14 | 0.0% | View All 78 Rows |
Immigrants in McKean County
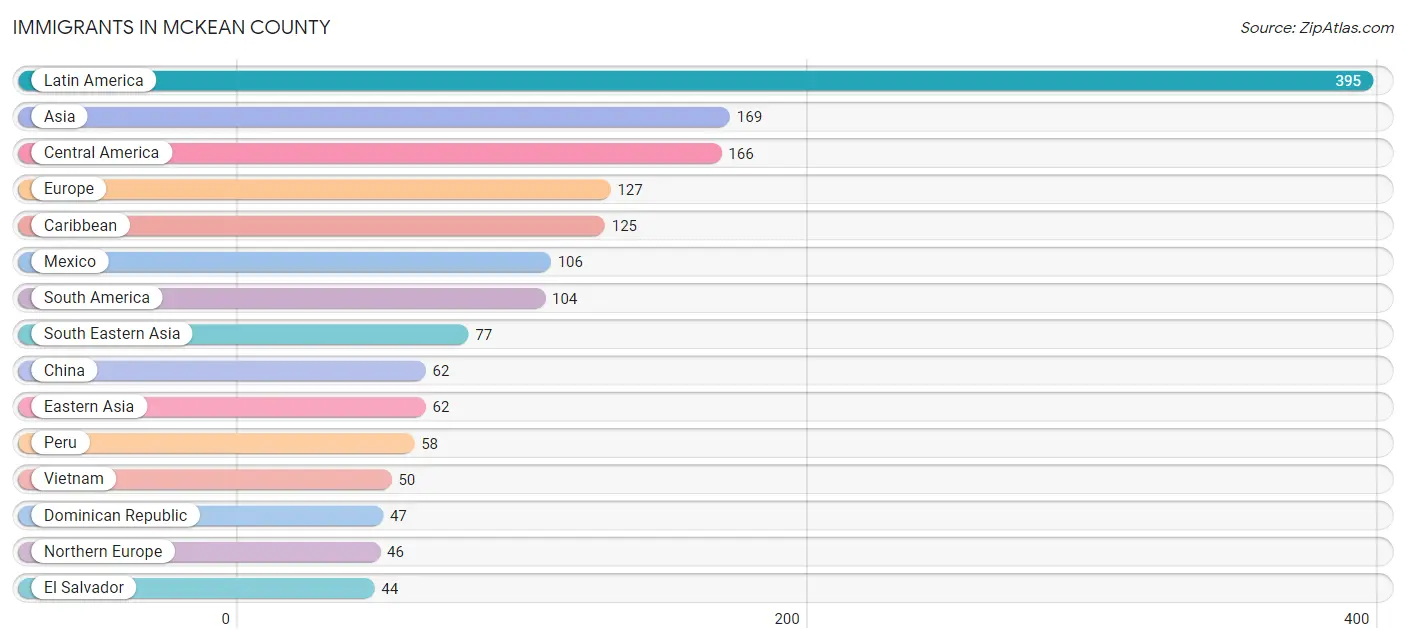
The most numerous immigrant groups reported in McKean County came from Latin America (395 | 1.0%), Asia (169 | 0.4%), Central America (166 | 0.4%), Europe (127 | 0.3%), and Caribbean (125 | 0.3%), together accounting for 2.4% of all McKean County residents.
| Immigration Origin | # Population | % Population |
| Africa | 15 | 0.0% |
| Albania | 10 | 0.0% |
| Asia | 169 | 0.4% |
| Cambodia | 8 | 0.0% |
| Canada | 25 | 0.1% |
| Caribbean | 125 | 0.3% |
| Central America | 166 | 0.4% |
| China | 62 | 0.2% |
| Colombia | 36 | 0.1% |
| Cuba | 16 | 0.0% |
| Dominican Republic | 47 | 0.1% |
| Eastern Africa | 8 | 0.0% |
| Eastern Asia | 62 | 0.2% |
| Eastern Europe | 30 | 0.1% |
| El Salvador | 44 | 0.1% |
| England | 32 | 0.1% |
| Ethiopia | 8 | 0.0% |
| Europe | 127 | 0.3% |
| France | 17 | 0.0% |
| Germany | 17 | 0.0% |
| Guatemala | 6 | 0.0% |
| Guyana | 10 | 0.0% |
| Honduras | 10 | 0.0% |
| India | 17 | 0.0% |
| Iran | 13 | 0.0% |
| Ireland | 10 | 0.0% |
| Italy | 12 | 0.0% |
| Jamaica | 11 | 0.0% |
| Latin America | 395 | 1.0% |
| Mexico | 106 | 0.3% |
| Nigeria | 4 | 0.0% |
| Northern Europe | 46 | 0.1% |
| Peru | 58 | 0.1% |
| Philippines | 19 | 0.1% |
| Portugal | 3 | 0.0% |
| Romania | 2 | 0.0% |
| Russia | 1 | 0.0% |
| Scotland | 2 | 0.0% |
| Sierra Leone | 3 | 0.0% |
| South America | 104 | 0.3% |
| South Central Asia | 30 | 0.1% |
| South Eastern Asia | 77 | 0.2% |
| Southern Europe | 17 | 0.0% |
| Spain | 2 | 0.0% |
| St. Vincent and the Grenadines | 11 | 0.0% |
| Taiwan | 4 | 0.0% |
| Trinidad and Tobago | 40 | 0.1% |
| Ukraine | 17 | 0.0% |
| Vietnam | 50 | 0.1% |
| Western Africa | 7 | 0.0% |
| Western Europe | 34 | 0.1% | View All 51 Rows |
Sex and Age in McKean County
Sex and Age in McKean County
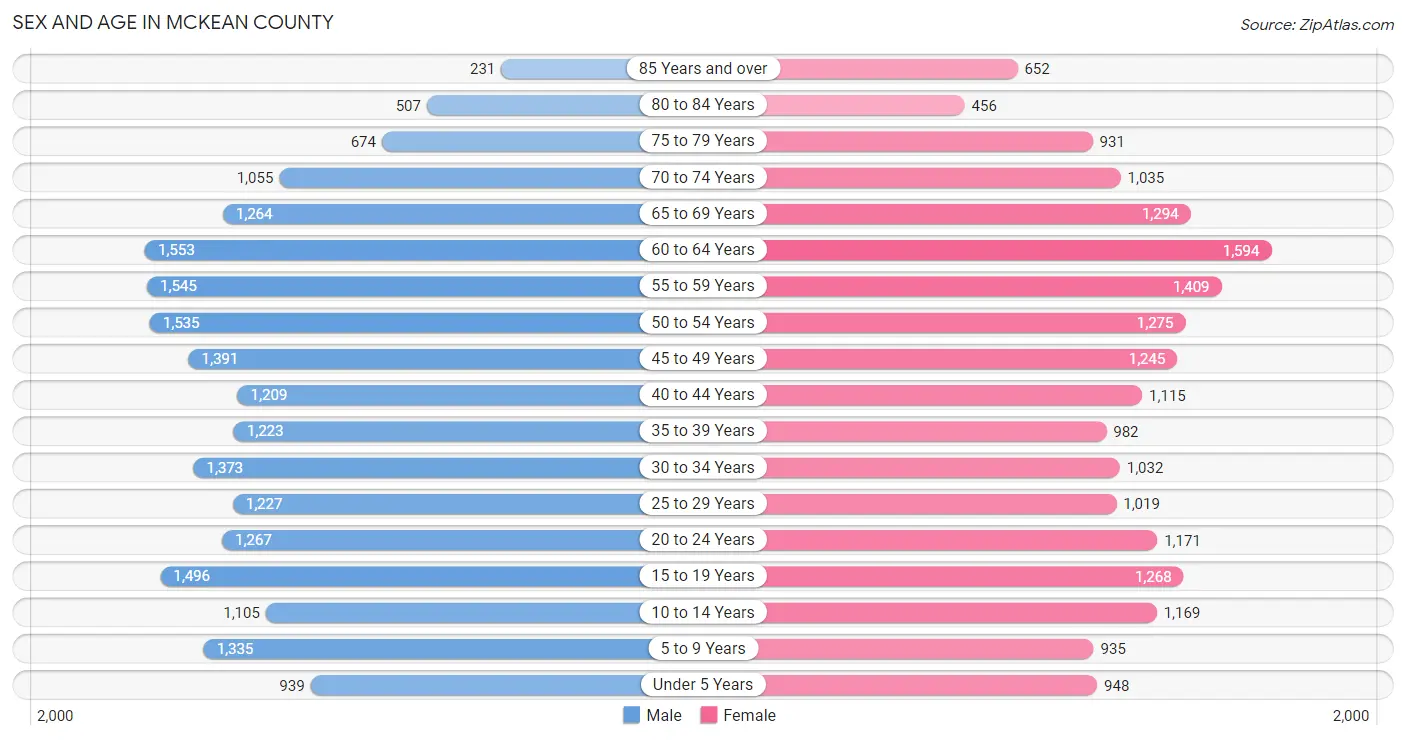
The most populous age groups in McKean County are 60 to 64 Years (1,553 | 7.4%) for men and 60 to 64 Years (1,594 | 8.2%) for women.
| Age Bracket | Male | Female |
| Under 5 Years | 939 (4.5%) | 948 (4.9%) |
| 5 to 9 Years | 1,335 (6.4%) | 935 (4.8%) |
| 10 to 14 Years | 1,105 (5.3%) | 1,169 (6.0%) |
| 15 to 19 Years | 1,496 (7.1%) | 1,268 (6.5%) |
| 20 to 24 Years | 1,267 (6.0%) | 1,171 (6.0%) |
| 25 to 29 Years | 1,227 (5.9%) | 1,019 (5.2%) |
| 30 to 34 Years | 1,373 (6.6%) | 1,032 (5.3%) |
| 35 to 39 Years | 1,223 (5.8%) | 982 (5.0%) |
| 40 to 44 Years | 1,209 (5.8%) | 1,115 (5.7%) |
| 45 to 49 Years | 1,391 (6.7%) | 1,245 (6.4%) |
| 50 to 54 Years | 1,535 (7.3%) | 1,275 (6.5%) |
| 55 to 59 Years | 1,545 (7.4%) | 1,409 (7.2%) |
| 60 to 64 Years | 1,553 (7.4%) | 1,594 (8.2%) |
| 65 to 69 Years | 1,264 (6.0%) | 1,294 (6.6%) |
| 70 to 74 Years | 1,055 (5.0%) | 1,035 (5.3%) |
| 75 to 79 Years | 674 (3.2%) | 931 (4.8%) |
| 80 to 84 Years | 507 (2.4%) | 456 (2.3%) |
| 85 Years and over | 231 (1.1%) | 652 (3.3%) |
| Total | 20,929 (100.0%) | 19,530 (100.0%) |
Families and Households in McKean County
Median Family Size in McKean County
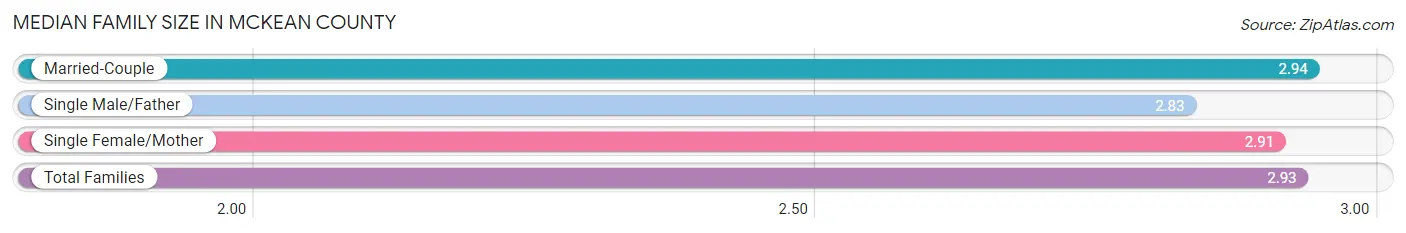
The median family size in McKean County is 2.93 persons per family, with married-couple families (7,827 | 77.6%) accounting for the largest median family size of 2.94 persons per family. On the other hand, single male/father families (851 | 8.4%) represent the smallest median family size with 2.83 persons per family.
| Family Type | # Families | Family Size |
| Married-Couple | 7,827 (77.6%) | 2.94 |
| Single Male/Father | 851 (8.4%) | 2.83 |
| Single Female/Mother | 1,410 (14.0%) | 2.91 |
| Total Families | 10,088 (100.0%) | 2.93 |
Median Household Size in McKean County
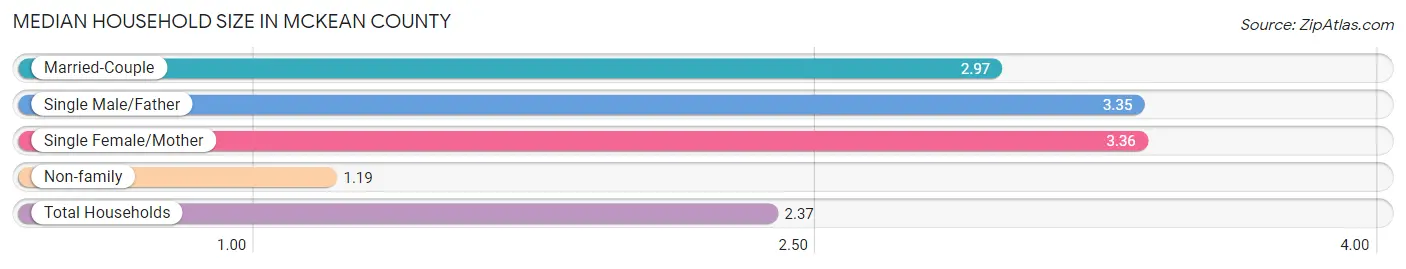
The median household size in McKean County is 2.37 persons per household, with single female/mother households (1,410 | 8.8%) accounting for the largest median household size of 3.36 persons per household. non-family households (5,843 | 36.7%) represent the smallest median household size with 1.19 persons per household.
| Household Type | # Households | Household Size |
| Married-Couple | 7,827 (49.1%) | 2.97 |
| Single Male/Father | 851 (5.3%) | 3.35 |
| Single Female/Mother | 1,410 (8.8%) | 3.36 |
| Non-family | 5,843 (36.7%) | 1.19 |
| Total Households | 15,931 (100.0%) | 2.37 |
Household Size by Marriage Status in McKean County
Out of a total of 15,931 households in McKean County, 10,088 (63.3%) are family households, while 5,843 (36.7%) are nonfamily households. The most numerous type of family households are 2-person households, comprising 5,034, and the most common type of nonfamily households are 1-person households, comprising 4,976.
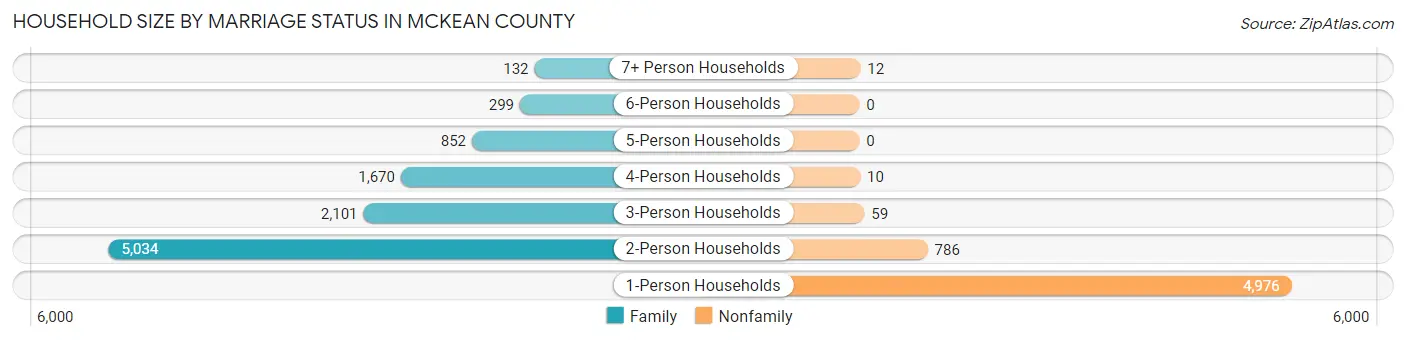
| Household Size | Family Households | Nonfamily Households |
| 1-Person Households | - | 4,976 (31.2%) |
| 2-Person Households | 5,034 (31.6%) | 786 (4.9%) |
| 3-Person Households | 2,101 (13.2%) | 59 (0.4%) |
| 4-Person Households | 1,670 (10.5%) | 10 (0.1%) |
| 5-Person Households | 852 (5.3%) | 0 (0.0%) |
| 6-Person Households | 299 (1.9%) | 0 (0.0%) |
| 7+ Person Households | 132 (0.8%) | 12 (0.1%) |
| Total | 10,088 (63.3%) | 5,843 (36.7%) |
Female Fertility in McKean County
Fertility by Age in McKean County
Average fertility rate in McKean County is 35.0 births per 1,000 women. Women in the age bracket of 20 to 34 years have the highest fertility rate with 65.0 births per 1,000 women. Women in the age bracket of 20 to 34 years acount for 76.2% of all women with births.
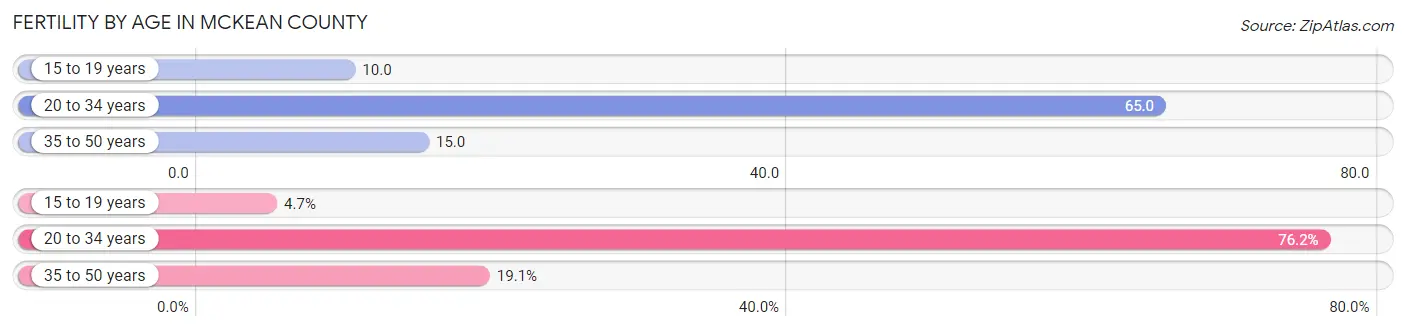
| Age Bracket | Women with Births | Births / 1,000 Women |
| 15 to 19 years | 13 (4.7%) | 10.0 |
| 20 to 34 years | 211 (76.2%) | 65.0 |
| 35 to 50 years | 53 (19.1%) | 15.0 |
| Total | 277 (100.0%) | 35.0 |
Fertility by Age by Marriage Status in McKean County
68.6% of women with births (277) in McKean County are married. The highest percentage of unmarried women with births falls into 15 to 19 years age bracket with 100.0% of them unmarried at the time of birth, while the lowest percentage of unmarried women with births belong to 20 to 34 years age bracket with 22.8% of them unmarried.
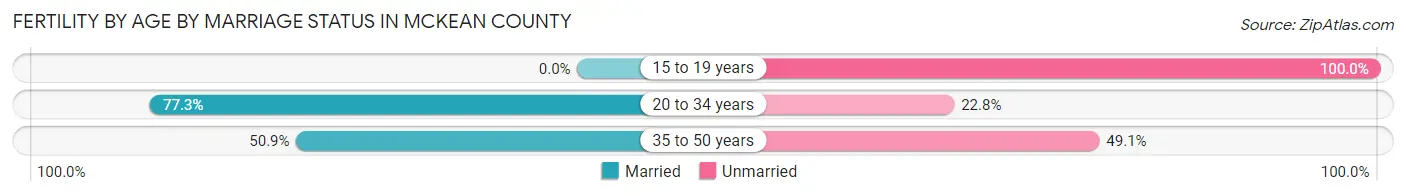
| Age Bracket | Married | Unmarried |
| 15 to 19 years | 0 (0.0%) | 13 (100.0%) |
| 20 to 34 years | 163 (77.2%) | 48 (22.8%) |
| 35 to 50 years | 27 (50.9%) | 26 (49.1%) |
| Total | 190 (68.6%) | 87 (31.4%) |
Fertility by Education in McKean County
Average fertility rate in McKean County is 35.0 births per 1,000 women. Women with the education attainment of graduate degree have the highest fertility rate of 75.0 births per 1,000 women, while women with the education attainment of less than high school have the lowest fertility at 29.0 births per 1,000 women. Women with the education attainment of high school diploma represent 32.5% of all women with births.
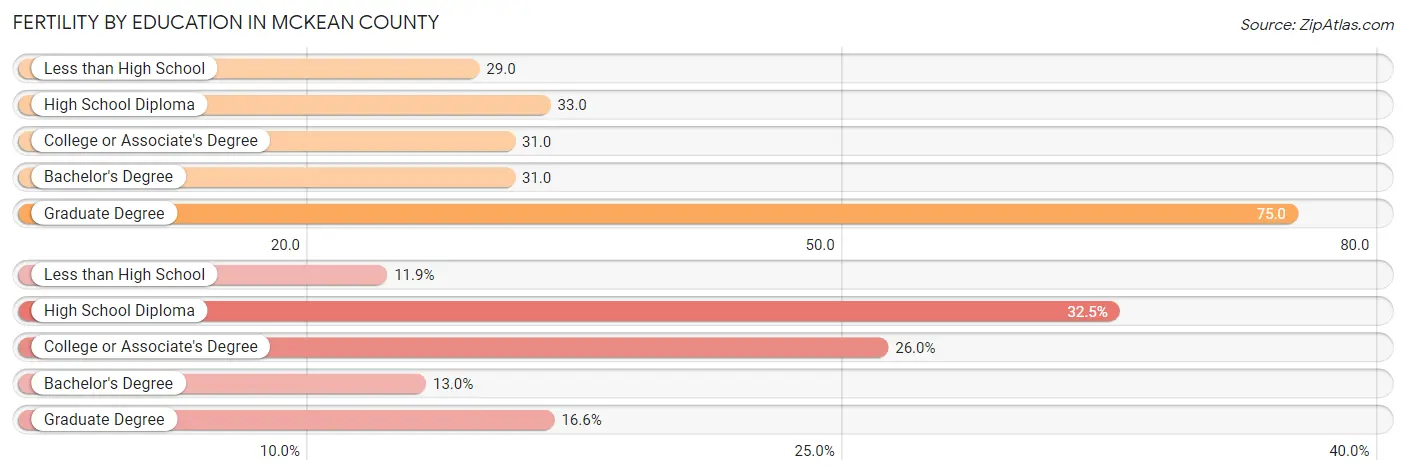
| Educational Attainment | Women with Births | Births / 1,000 Women |
| Less than High School | 33 (11.9%) | 29.0 |
| High School Diploma | 90 (32.5%) | 33.0 |
| College or Associate's Degree | 72 (26.0%) | 31.0 |
| Bachelor's Degree | 36 (13.0%) | 31.0 |
| Graduate Degree | 46 (16.6%) | 75.0 |
| Total | 277 (100.0%) | 35.0 |
Fertility by Education by Marriage Status in McKean County
31.4% of women with births in McKean County are unmarried. Women with the educational attainment of graduate degree are most likely to be married with 100.0% of them married at childbirth, while women with the educational attainment of less than high school are least likely to be married with 90.9% of them unmarried at childbirth.
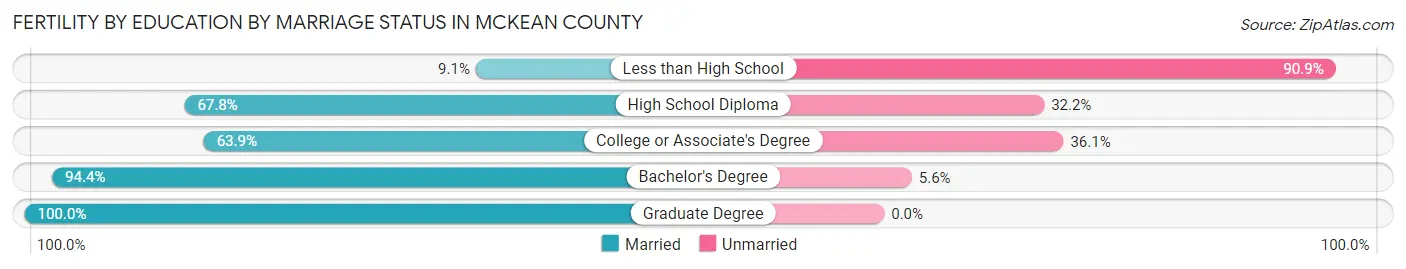
| Educational Attainment | Married | Unmarried |
| Less than High School | 3 (9.1%) | 30 (90.9%) |
| High School Diploma | 61 (67.8%) | 29 (32.2%) |
| College or Associate's Degree | 46 (63.9%) | 26 (36.1%) |
| Bachelor's Degree | 34 (94.4%) | 2 (5.6%) |
| Graduate Degree | 46 (100.0%) | 0 (0.0%) |
| Total | 190 (68.6%) | 87 (31.4%) |
Employment Characteristics in McKean County
Employment by Class of Employer in McKean County
Among the 17,283 employed individuals in McKean County, private company employees (11,146 | 64.5%), not-for-profit organizations (2,564 | 14.8%), and local government employees (1,467 | 8.5%) make up the most common classes of employment.
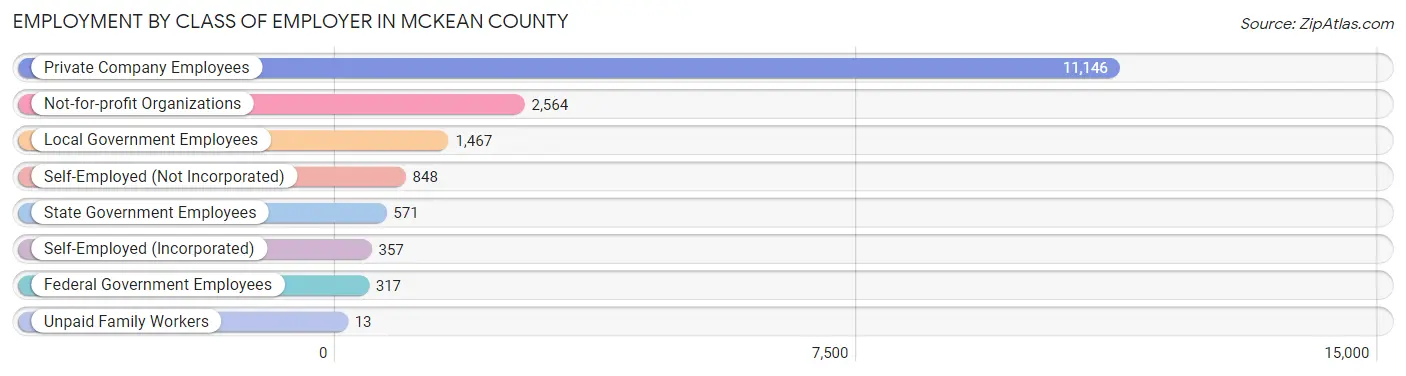
| Employer Class | # Employees | % Employees |
| Private Company Employees | 11,146 | 64.5% |
| Self-Employed (Incorporated) | 357 | 2.1% |
| Self-Employed (Not Incorporated) | 848 | 4.9% |
| Not-for-profit Organizations | 2,564 | 14.8% |
| Local Government Employees | 1,467 | 8.5% |
| State Government Employees | 571 | 3.3% |
| Federal Government Employees | 317 | 1.8% |
| Unpaid Family Workers | 13 | 0.1% |
| Total | 17,283 | 100.0% |
Employment Status by Age in McKean County
According to the labor force statistics for McKean County, out of the total population over 16 years of age (33,555), 55.4% or 18,589 individuals are in the labor force, with 5.3% or 985 of them unemployed. The age group with the highest labor force participation rate is 20 to 24 years, with 77.5% or 1,889 individuals in the labor force. Within the labor force, the 60 to 64 years age range has the highest percentage of unemployed individuals, with 11.0% or 197 of them being unemployed.
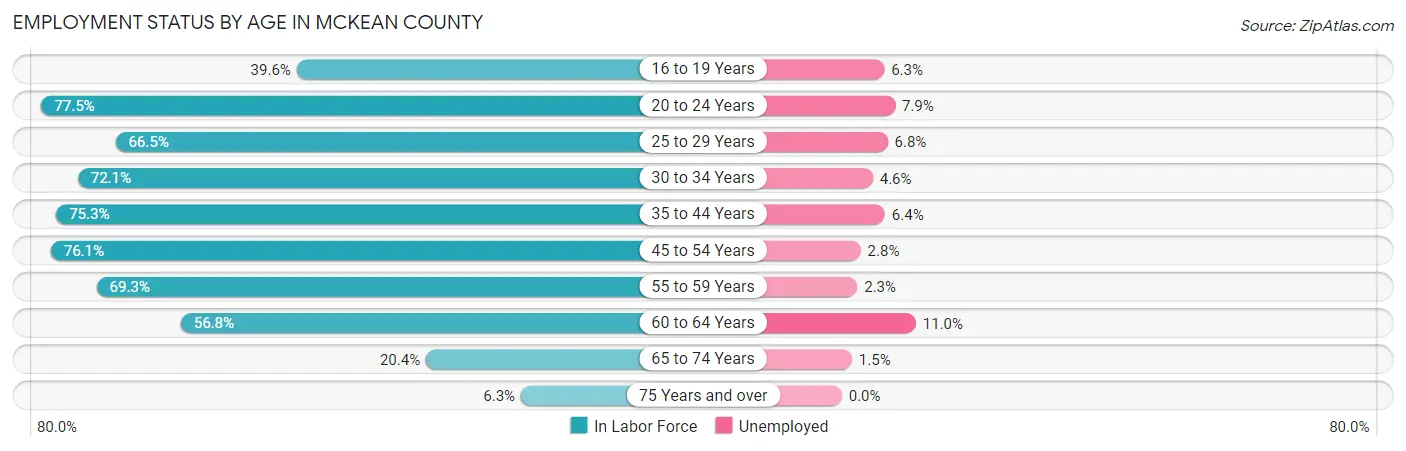
| Age Bracket | In Labor Force | Unemployed |
| 16 to 19 Years | 907 (39.6%) | 57 (6.3%) |
| 20 to 24 Years | 1,889 (77.5%) | 149 (7.9%) |
| 25 to 29 Years | 1,494 (66.5%) | 102 (6.8%) |
| 30 to 34 Years | 1,734 (72.1%) | 80 (4.6%) |
| 35 to 44 Years | 3,410 (75.3%) | 218 (6.4%) |
| 45 to 54 Years | 4,144 (76.1%) | 116 (2.8%) |
| 55 to 59 Years | 2,047 (69.3%) | 47 (2.3%) |
| 60 to 64 Years | 1,787 (56.8%) | 197 (11.0%) |
| 65 to 74 Years | 948 (20.4%) | 14 (1.5%) |
| 75 Years and over | 217 (6.3%) | 0 (0.0%) |
| Total | 18,589 (55.4%) | 985 (5.3%) |
Employment Status by Educational Attainment in McKean County
According to labor force statistics for McKean County, 70.5% of individuals (14,613) out of the total population between 25 and 64 years of age (20,727) are in the labor force, with 5.2% or 760 of them being unemployed. The group with the highest labor force participation rate are those with the educational attainment of bachelor's degree or higher, with 89.0% or 3,854 individuals in the labor force. Within the labor force, individuals with high school diploma education have the highest percentage of unemployment, with 8.0% or 494 of them being unemployed.
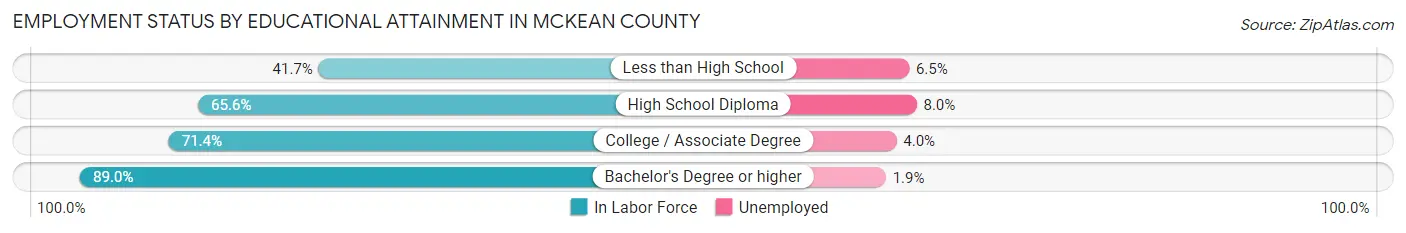
| Educational Attainment | In Labor Force | Unemployed |
| Less than High School | 555 (41.7%) | 87 (6.5%) |
| High School Diploma | 6,176 (65.6%) | 753 (8.0%) |
| College / Associate Degree | 4,036 (71.4%) | 226 (4.0%) |
| Bachelor's Degree or higher | 3,854 (89.0%) | 82 (1.9%) |
| Total | 14,613 (70.5%) | 1,078 (5.2%) |
Employment Occupations by Sex in McKean County
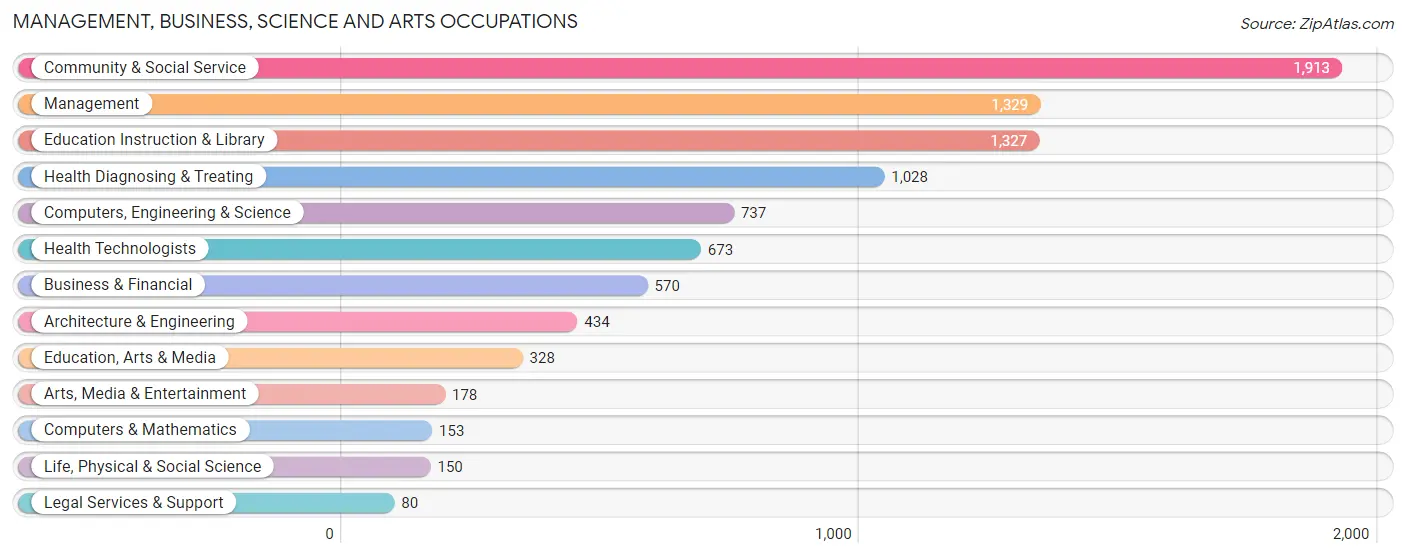
Management, Business, Science and Arts Occupations
The most common Management, Business, Science and Arts occupations in McKean County are Community & Social Service (1,913 | 10.9%), Management (1,329 | 7.6%), Education Instruction & Library (1,327 | 7.5%), Health Diagnosing & Treating (1,028 | 5.9%), and Computers, Engineering & Science (737 | 4.2%).
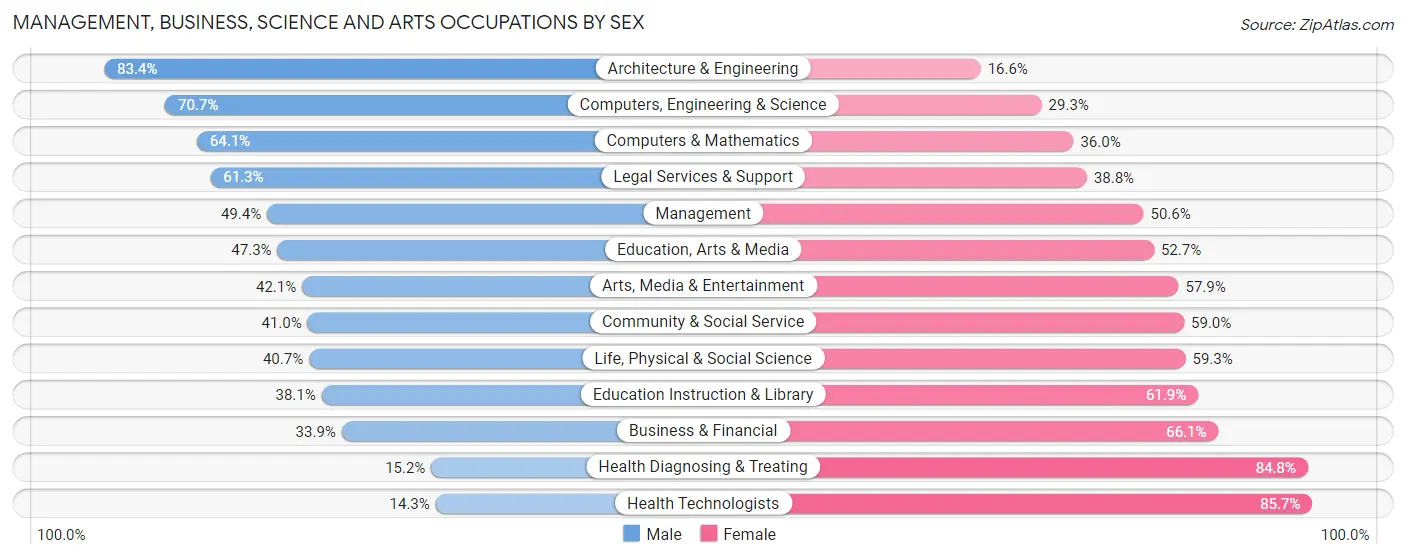
Management, Business, Science and Arts Occupations by Sex
Within the Management, Business, Science and Arts occupations in McKean County, the most male-oriented occupations are Architecture & Engineering (83.4%), Computers, Engineering & Science (70.7%), and Computers & Mathematics (64.0%), while the most female-oriented occupations are Health Technologists (85.7%), Health Diagnosing & Treating (84.8%), and Business & Financial (66.1%).
| Occupation | Male | Female |
| Management | 657 (49.4%) | 672 (50.6%) |
| Business & Financial | 193 (33.9%) | 377 (66.1%) |
| Computers, Engineering & Science | 521 (70.7%) | 216 (29.3%) |
| Computers & Mathematics | 98 (64.0%) | 55 (35.9%) |
| Architecture & Engineering | 362 (83.4%) | 72 (16.6%) |
| Life, Physical & Social Science | 61 (40.7%) | 89 (59.3%) |
| Community & Social Service | 784 (41.0%) | 1,129 (59.0%) |
| Education, Arts & Media | 155 (47.3%) | 173 (52.7%) |
| Legal Services & Support | 49 (61.3%) | 31 (38.8%) |
| Education Instruction & Library | 505 (38.1%) | 822 (61.9%) |
| Arts, Media & Entertainment | 75 (42.1%) | 103 (57.9%) |
| Health Diagnosing & Treating | 156 (15.2%) | 872 (84.8%) |
| Health Technologists | 96 (14.3%) | 577 (85.7%) |
| Total (Category) | 2,311 (41.4%) | 3,266 (58.6%) |
| Total (Overall) | 9,292 (52.9%) | 8,283 (47.1%) |
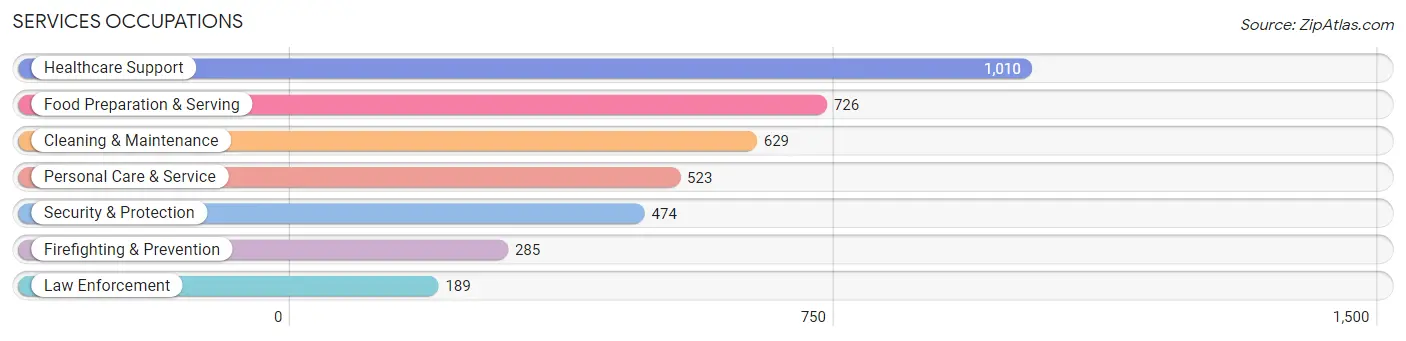
Services Occupations
The most common Services occupations in McKean County are Healthcare Support (1,010 | 5.8%), Food Preparation & Serving (726 | 4.1%), Cleaning & Maintenance (629 | 3.6%), Personal Care & Service (523 | 3.0%), and Security & Protection (474 | 2.7%).
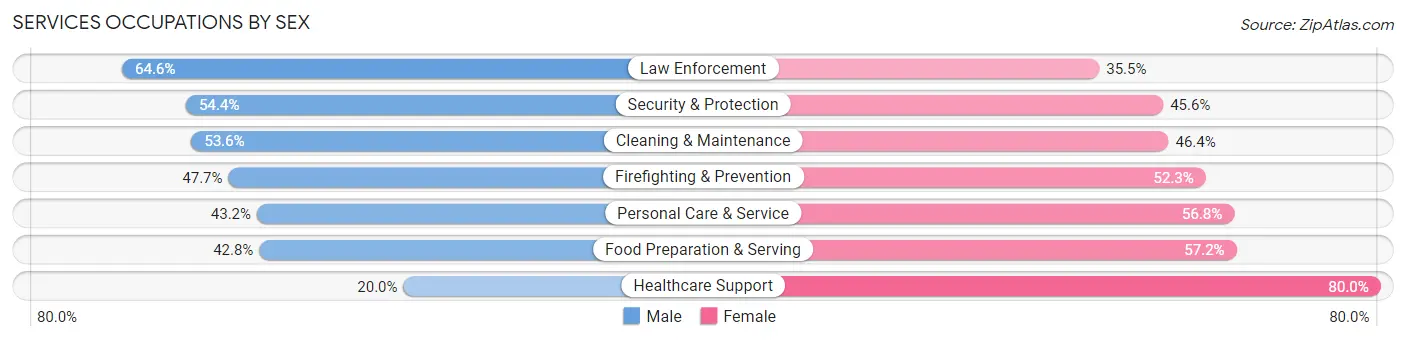
Services Occupations by Sex
Within the Services occupations in McKean County, the most male-oriented occupations are Law Enforcement (64.5%), Security & Protection (54.4%), and Cleaning & Maintenance (53.6%), while the most female-oriented occupations are Healthcare Support (80.0%), Food Preparation & Serving (57.2%), and Personal Care & Service (56.8%).
| Occupation | Male | Female |
| Healthcare Support | 202 (20.0%) | 808 (80.0%) |
| Security & Protection | 258 (54.4%) | 216 (45.6%) |
| Firefighting & Prevention | 136 (47.7%) | 149 (52.3%) |
| Law Enforcement | 122 (64.5%) | 67 (35.4%) |
| Food Preparation & Serving | 311 (42.8%) | 415 (57.2%) |
| Cleaning & Maintenance | 337 (53.6%) | 292 (46.4%) |
| Personal Care & Service | 226 (43.2%) | 297 (56.8%) |
| Total (Category) | 1,334 (39.7%) | 2,028 (60.3%) |
| Total (Overall) | 9,292 (52.9%) | 8,283 (47.1%) |
Sales and Office Occupations
The most common Sales and Office occupations in McKean County are Office & Administration (1,937 | 11.0%), and Sales & Related (1,308 | 7.4%).
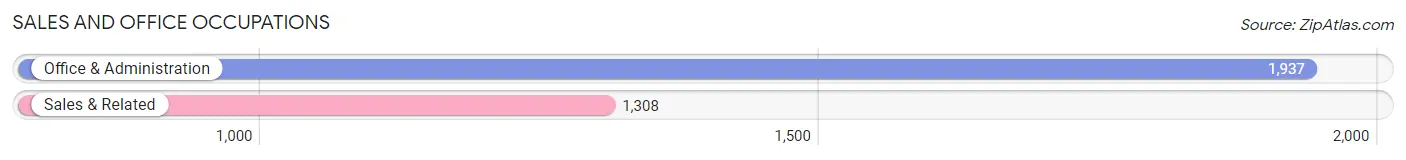
Sales and Office Occupations by Sex
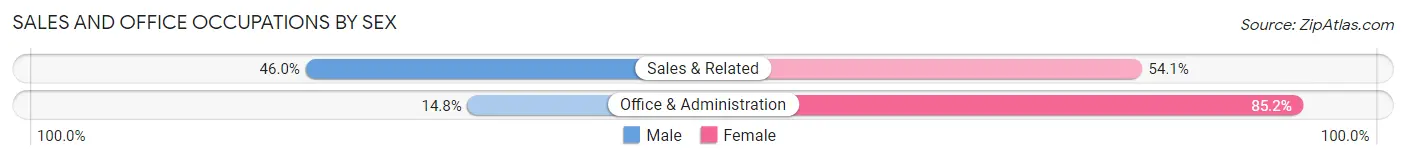
| Occupation | Male | Female |
| Sales & Related | 601 (46.0%) | 707 (54.0%) |
| Office & Administration | 287 (14.8%) | 1,650 (85.2%) |
| Total (Category) | 888 (27.4%) | 2,357 (72.6%) |
| Total (Overall) | 9,292 (52.9%) | 8,283 (47.1%) |
Natural Resources, Construction and Maintenance Occupations
The most common Natural Resources, Construction and Maintenance occupations in McKean County are Construction & Extraction (990 | 5.6%), Installation, Maintenance & Repair (721 | 4.1%), and Farming, Fishing & Forestry (137 | 0.8%).
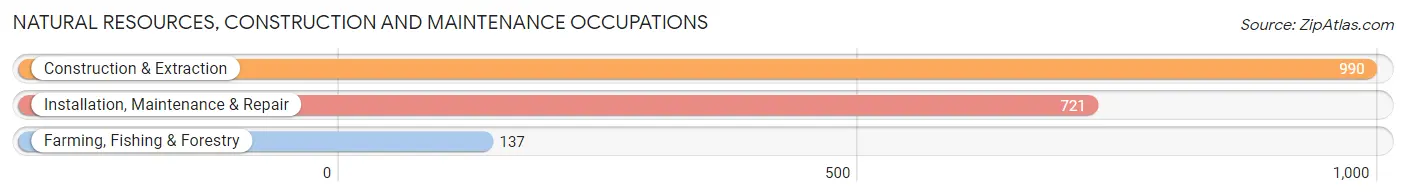
Natural Resources, Construction and Maintenance Occupations by Sex
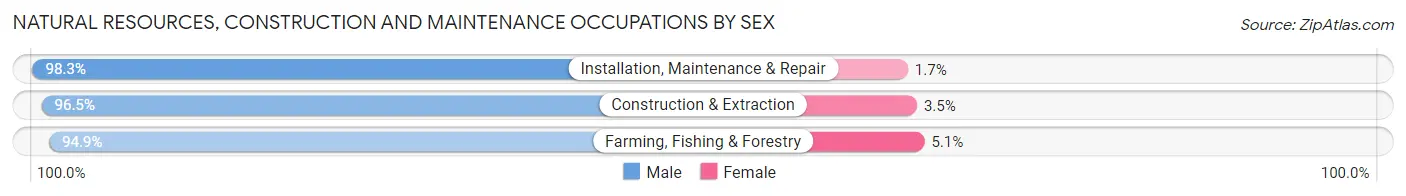
| Occupation | Male | Female |
| Farming, Fishing & Forestry | 130 (94.9%) | 7 (5.1%) |
| Construction & Extraction | 955 (96.5%) | 35 (3.5%) |
| Installation, Maintenance & Repair | 709 (98.3%) | 12 (1.7%) |
| Total (Category) | 1,794 (97.1%) | 54 (2.9%) |
| Total (Overall) | 9,292 (52.9%) | 8,283 (47.1%) |
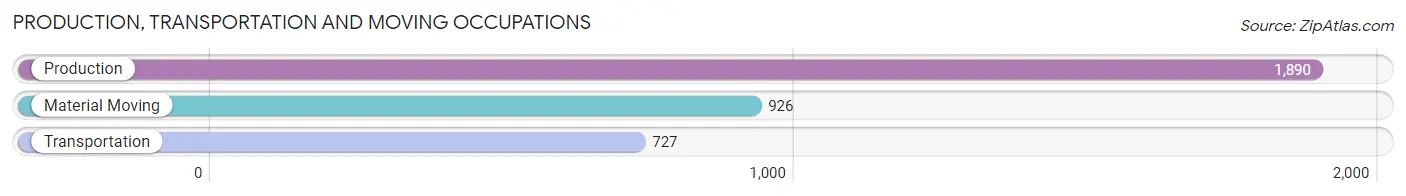
Production, Transportation and Moving Occupations
The most common Production, Transportation and Moving occupations in McKean County are Production (1,890 | 10.7%), Material Moving (926 | 5.3%), and Transportation (727 | 4.1%).
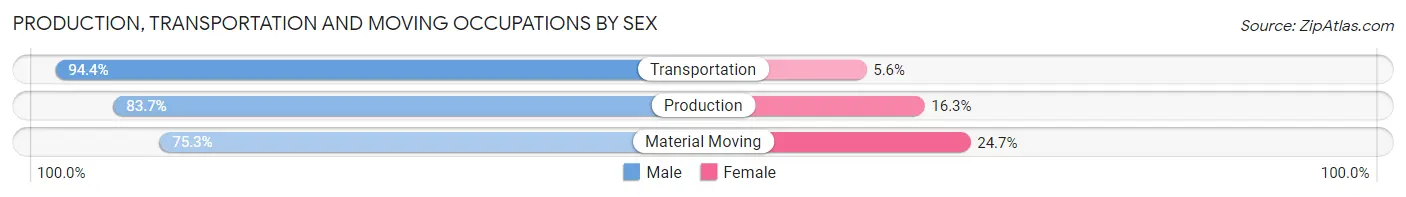
Production, Transportation and Moving Occupations by Sex
| Occupation | Male | Female |
| Production | 1,582 (83.7%) | 308 (16.3%) |
| Transportation | 686 (94.4%) | 41 (5.6%) |
| Material Moving | 697 (75.3%) | 229 (24.7%) |
| Total (Category) | 2,965 (83.7%) | 578 (16.3%) |
| Total (Overall) | 9,292 (52.9%) | 8,283 (47.1%) |
Employment Industries by Sex in McKean County
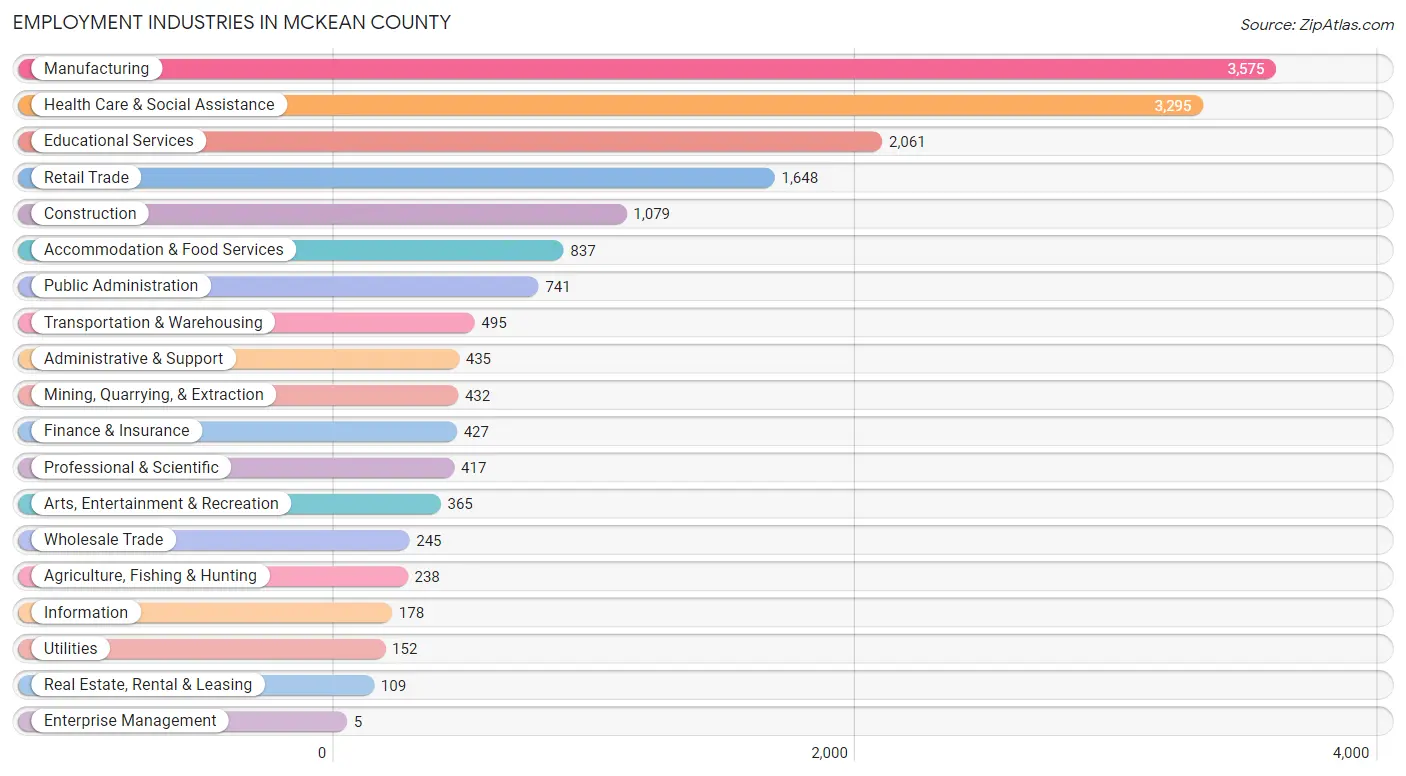
Employment Industries in McKean County
The major employment industries in McKean County include Manufacturing (3,575 | 20.3%), Health Care & Social Assistance (3,295 | 18.8%), Educational Services (2,061 | 11.7%), Retail Trade (1,648 | 9.4%), and Construction (1,079 | 6.1%).
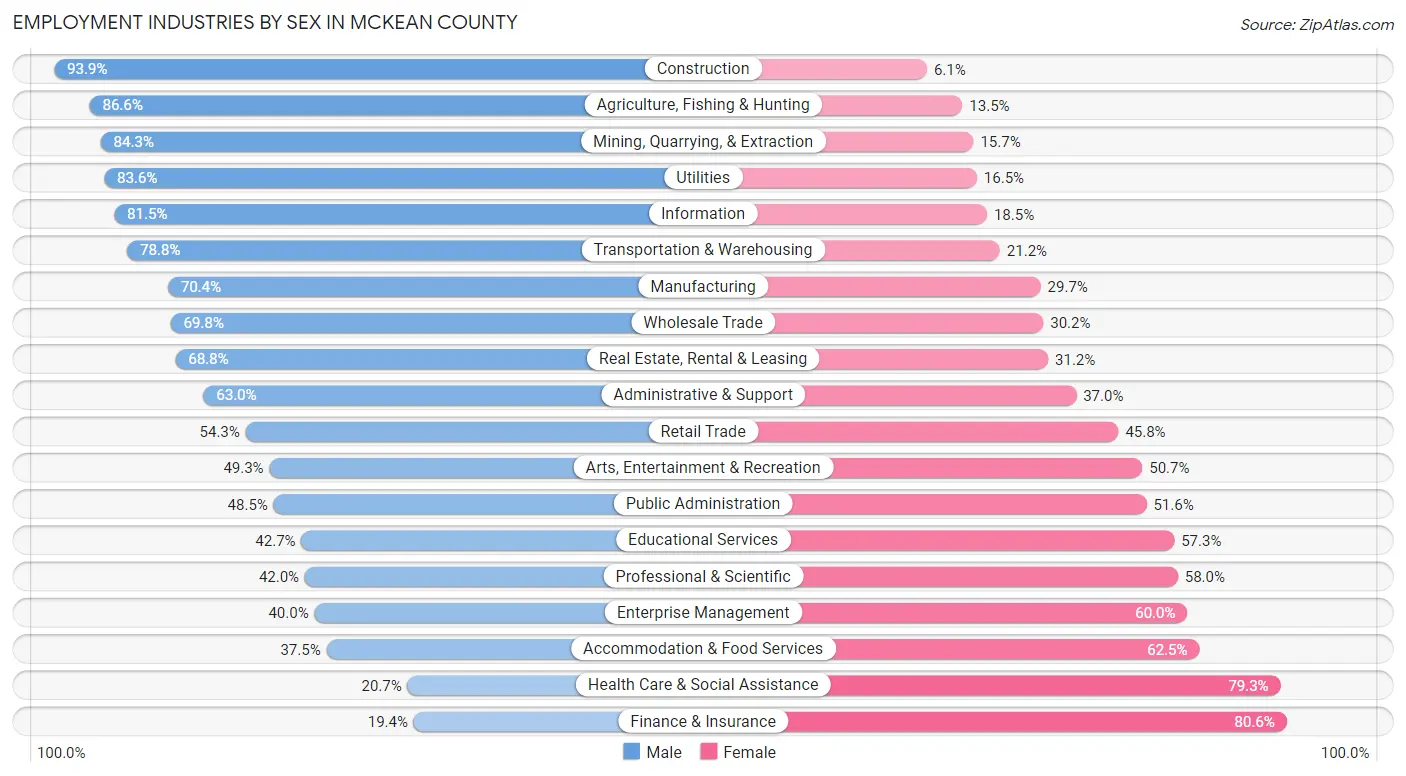
Employment Industries by Sex in McKean County
The McKean County industries that see more men than women are Construction (93.9%), Agriculture, Fishing & Hunting (86.6%), and Mining, Quarrying, & Extraction (84.3%), whereas the industries that tend to have a higher number of women are Finance & Insurance (80.6%), Health Care & Social Assistance (79.3%), and Accommodation & Food Services (62.5%).
| Industry | Male | Female |
| Agriculture, Fishing & Hunting | 206 (86.6%) | 32 (13.5%) |
| Mining, Quarrying, & Extraction | 364 (84.3%) | 68 (15.7%) |
| Construction | 1,013 (93.9%) | 66 (6.1%) |
| Manufacturing | 2,515 (70.4%) | 1,060 (29.6%) |
| Wholesale Trade | 171 (69.8%) | 74 (30.2%) |
| Retail Trade | 894 (54.2%) | 754 (45.8%) |
| Transportation & Warehousing | 390 (78.8%) | 105 (21.2%) |
| Utilities | 127 (83.6%) | 25 (16.5%) |
| Information | 145 (81.5%) | 33 (18.5%) |
| Finance & Insurance | 83 (19.4%) | 344 (80.6%) |
| Real Estate, Rental & Leasing | 75 (68.8%) | 34 (31.2%) |
| Professional & Scientific | 175 (42.0%) | 242 (58.0%) |
| Enterprise Management | 2 (40.0%) | 3 (60.0%) |
| Administrative & Support | 274 (63.0%) | 161 (37.0%) |
| Educational Services | 880 (42.7%) | 1,181 (57.3%) |
| Health Care & Social Assistance | 683 (20.7%) | 2,612 (79.3%) |
| Arts, Entertainment & Recreation | 180 (49.3%) | 185 (50.7%) |
| Accommodation & Food Services | 314 (37.5%) | 523 (62.5%) |
| Public Administration | 359 (48.4%) | 382 (51.5%) |
| Total | 9,292 (52.9%) | 8,283 (47.1%) |
Education in McKean County
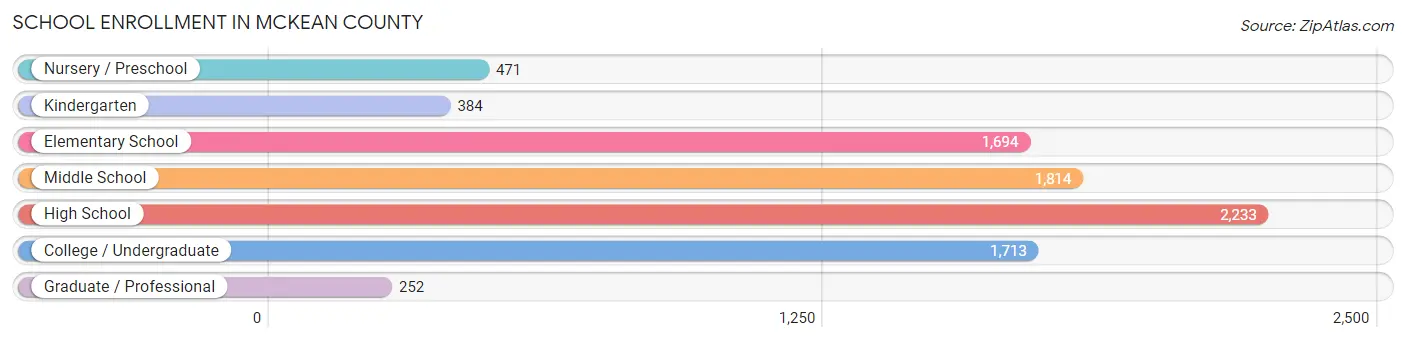
School Enrollment in McKean County
The most common levels of schooling among the 8,561 students in McKean County are high school (2,233 | 26.1%), middle school (1,814 | 21.2%), and college / undergraduate (1,713 | 20.0%).
| School Level | # Students | % Students |
| Nursery / Preschool | 471 | 5.5% |
| Kindergarten | 384 | 4.5% |
| Elementary School | 1,694 | 19.8% |
| Middle School | 1,814 | 21.2% |
| High School | 2,233 | 26.1% |
| College / Undergraduate | 1,713 | 20.0% |
| Graduate / Professional | 252 | 2.9% |
| Total | 8,561 | 100.0% |
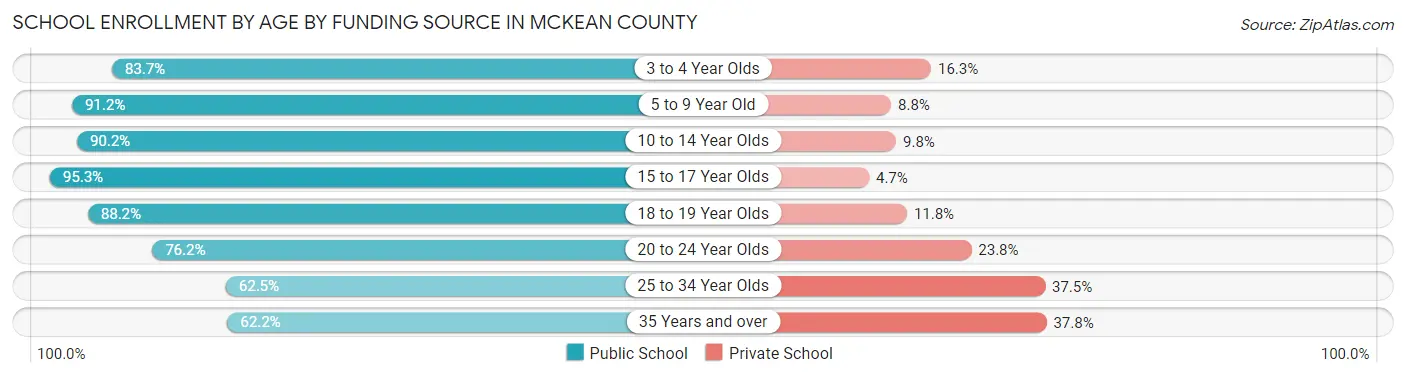
School Enrollment by Age by Funding Source in McKean County
Out of a total of 8,561 students who are enrolled in schools in McKean County, 1,062 (12.4%) attend a private institution, while the remaining 7,499 (87.6%) are enrolled in public schools. The age group of 35 years and over has the highest likelihood of being enrolled in private schools, with 133 (37.8% in the age bracket) enrolled. Conversely, the age group of 15 to 17 year olds has the lowest likelihood of being enrolled in a private school, with 1,412 (95.3% in the age bracket) attending a public institution.
| Age Bracket | Public School | Private School |
| 3 to 4 Year Olds | 247 (83.7%) | 48 (16.3%) |
| 5 to 9 Year Old | 1,869 (91.2%) | 181 (8.8%) |
| 10 to 14 Year Olds | 2,044 (90.2%) | 221 (9.8%) |
| 15 to 17 Year Olds | 1,412 (95.3%) | 70 (4.7%) |
| 18 to 19 Year Olds | 875 (88.2%) | 117 (11.8%) |
| 20 to 24 Year Olds | 705 (76.2%) | 220 (23.8%) |
| 25 to 34 Year Olds | 125 (62.5%) | 75 (37.5%) |
| 35 Years and over | 219 (62.2%) | 133 (37.8%) |
| Total | 7,499 (87.6%) | 1,062 (12.4%) |
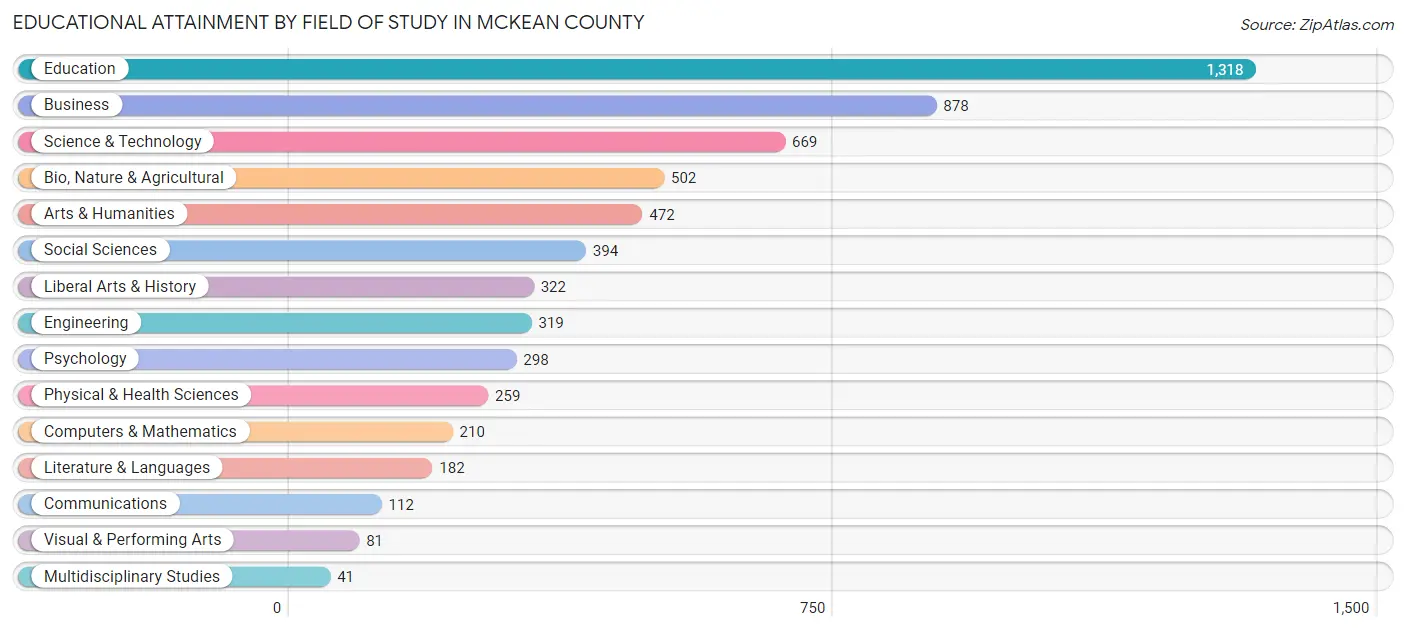
Educational Attainment by Field of Study in McKean County
Education (1,318 | 21.8%), business (878 | 14.5%), science & technology (669 | 11.1%), bio, nature & agricultural (502 | 8.3%), and arts & humanities (472 | 7.8%) are the most common fields of study among 6,057 individuals in McKean County who have obtained a bachelor's degree or higher.
| Field of Study | # Graduates | % Graduates |
| Computers & Mathematics | 210 | 3.5% |
| Bio, Nature & Agricultural | 502 | 8.3% |
| Physical & Health Sciences | 259 | 4.3% |
| Psychology | 298 | 4.9% |
| Social Sciences | 394 | 6.5% |
| Engineering | 319 | 5.3% |
| Multidisciplinary Studies | 41 | 0.7% |
| Science & Technology | 669 | 11.1% |
| Business | 878 | 14.5% |
| Education | 1,318 | 21.8% |
| Literature & Languages | 182 | 3.0% |
| Liberal Arts & History | 322 | 5.3% |
| Visual & Performing Arts | 81 | 1.3% |
| Communications | 112 | 1.8% |
| Arts & Humanities | 472 | 7.8% |
| Total | 6,057 | 100.0% |
Transportation & Commute in McKean County
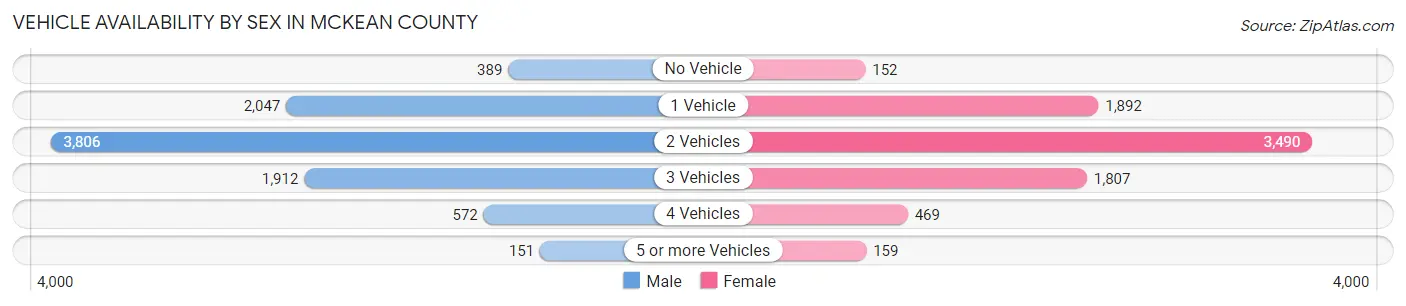
Vehicle Availability by Sex in McKean County
The most prevalent vehicle ownership categories in McKean County are males with 2 vehicles (3,806, accounting for 42.9%) and females with 2 vehicles (3,490, making up 47.8%).
| Vehicles Available | Male | Female |
| No Vehicle | 389 (4.4%) | 152 (1.9%) |
| 1 Vehicle | 2,047 (23.1%) | 1,892 (23.7%) |
| 2 Vehicles | 3,806 (42.9%) | 3,490 (43.8%) |
| 3 Vehicles | 1,912 (21.5%) | 1,807 (22.7%) |
| 4 Vehicles | 572 (6.4%) | 469 (5.9%) |
| 5 or more Vehicles | 151 (1.7%) | 159 (2.0%) |
| Total | 8,877 (100.0%) | 7,969 (100.0%) |
Commute Time in McKean County
The most frequently occuring commute durations in McKean County are 10 to 14 minutes (3,225 commuters, 19.5%), 5 to 9 minutes (3,182 commuters, 19.3%), and 15 to 19 minutes (2,065 commuters, 12.5%).
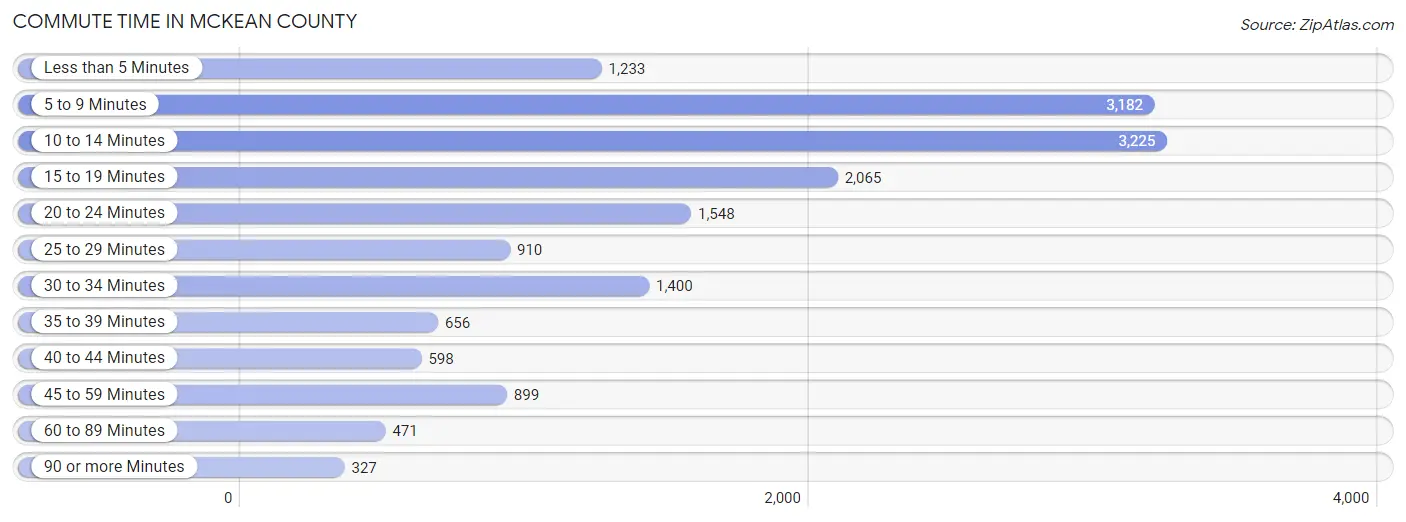
| Commute Time | # Commuters | % Commuters |
| Less than 5 Minutes | 1,233 | 7.5% |
| 5 to 9 Minutes | 3,182 | 19.3% |
| 10 to 14 Minutes | 3,225 | 19.5% |
| 15 to 19 Minutes | 2,065 | 12.5% |
| 20 to 24 Minutes | 1,548 | 9.4% |
| 25 to 29 Minutes | 910 | 5.5% |
| 30 to 34 Minutes | 1,400 | 8.5% |
| 35 to 39 Minutes | 656 | 4.0% |
| 40 to 44 Minutes | 598 | 3.6% |
| 45 to 59 Minutes | 899 | 5.4% |
| 60 to 89 Minutes | 471 | 2.9% |
| 90 or more Minutes | 327 | 2.0% |
Commute Time by Sex in McKean County
The most common commute times in McKean County are 10 to 14 minutes (1,767 commuters, 20.2%) for males and 5 to 9 minutes (1,533 commuters, 19.8%) for females.
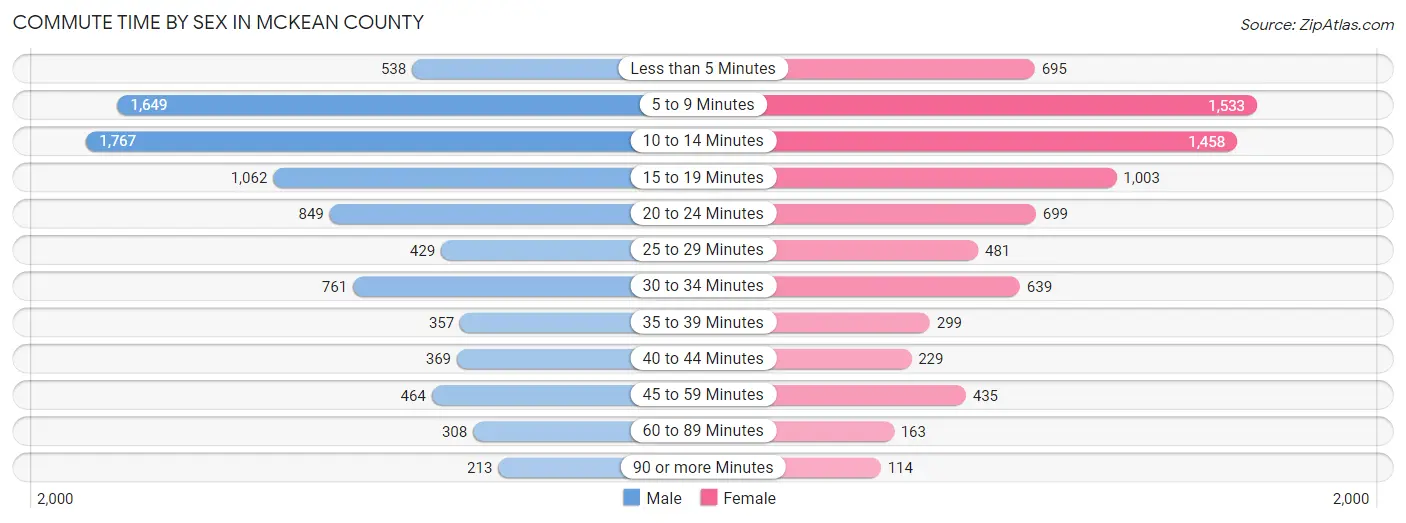
| Commute Time | Male | Female |
| Less than 5 Minutes | 538 (6.1%) | 695 (9.0%) |
| 5 to 9 Minutes | 1,649 (18.8%) | 1,533 (19.8%) |
| 10 to 14 Minutes | 1,767 (20.2%) | 1,458 (18.8%) |
| 15 to 19 Minutes | 1,062 (12.1%) | 1,003 (13.0%) |
| 20 to 24 Minutes | 849 (9.7%) | 699 (9.0%) |
| 25 to 29 Minutes | 429 (4.9%) | 481 (6.2%) |
| 30 to 34 Minutes | 761 (8.7%) | 639 (8.3%) |
| 35 to 39 Minutes | 357 (4.1%) | 299 (3.9%) |
| 40 to 44 Minutes | 369 (4.2%) | 229 (3.0%) |
| 45 to 59 Minutes | 464 (5.3%) | 435 (5.6%) |
| 60 to 89 Minutes | 308 (3.5%) | 163 (2.1%) |
| 90 or more Minutes | 213 (2.4%) | 114 (1.5%) |
Time of Departure to Work by Sex in McKean County
The most frequent times of departure to work in McKean County are 6:30 AM to 6:59 AM (1,066, 12.2%) for males and 7:30 AM to 7:59 AM (1,552, 20.0%) for females.
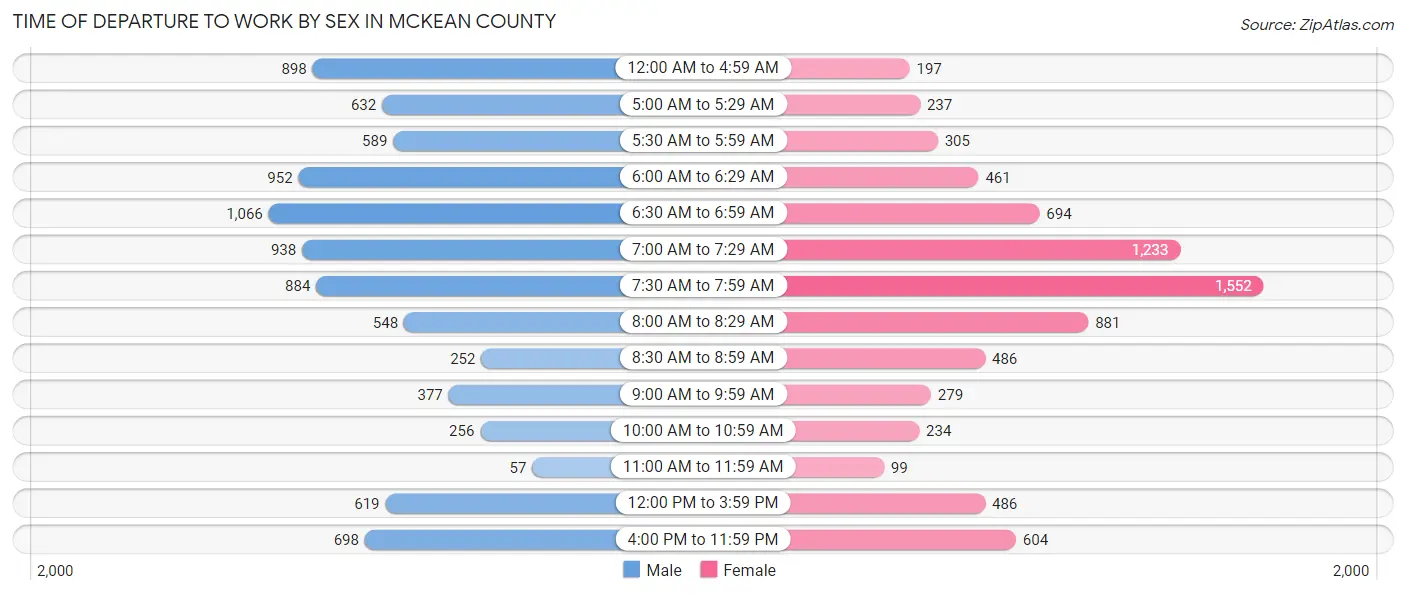
| Time of Departure | Male | Female |
| 12:00 AM to 4:59 AM | 898 (10.2%) | 197 (2.5%) |
| 5:00 AM to 5:29 AM | 632 (7.2%) | 237 (3.1%) |
| 5:30 AM to 5:59 AM | 589 (6.7%) | 305 (3.9%) |
| 6:00 AM to 6:29 AM | 952 (10.9%) | 461 (5.9%) |
| 6:30 AM to 6:59 AM | 1,066 (12.2%) | 694 (9.0%) |
| 7:00 AM to 7:29 AM | 938 (10.7%) | 1,233 (15.9%) |
| 7:30 AM to 7:59 AM | 884 (10.1%) | 1,552 (20.0%) |
| 8:00 AM to 8:29 AM | 548 (6.2%) | 881 (11.4%) |
| 8:30 AM to 8:59 AM | 252 (2.9%) | 486 (6.3%) |
| 9:00 AM to 9:59 AM | 377 (4.3%) | 279 (3.6%) |
| 10:00 AM to 10:59 AM | 256 (2.9%) | 234 (3.0%) |
| 11:00 AM to 11:59 AM | 57 (0.6%) | 99 (1.3%) |
| 12:00 PM to 3:59 PM | 619 (7.1%) | 486 (6.3%) |
| 4:00 PM to 11:59 PM | 698 (8.0%) | 604 (7.8%) |
| Total | 8,766 (100.0%) | 7,748 (100.0%) |
Housing Occupancy in McKean County
Occupancy by Ownership in McKean County
Of the total 15,931 dwellings in McKean County, owner-occupied units account for 12,336 (77.4%), while renter-occupied units make up 3,595 (22.6%).
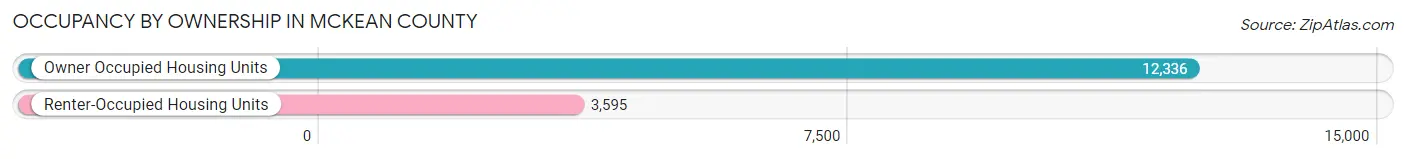
| Occupancy | # Housing Units | % Housing Units |
| Owner Occupied Housing Units | 12,336 | 77.4% |
| Renter-Occupied Housing Units | 3,595 | 22.6% |
| Total Occupied Housing Units | 15,931 | 100.0% |
Occupancy by Household Size in McKean County
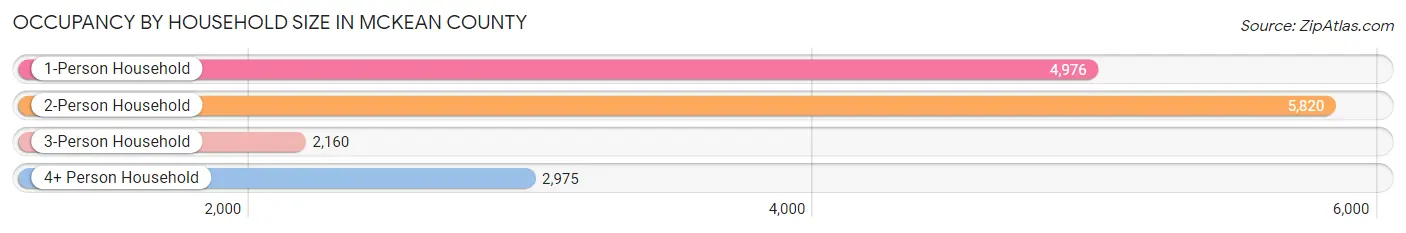
| Household Size | # Housing Units | % Housing Units |
| 1-Person Household | 4,976 | 31.2% |
| 2-Person Household | 5,820 | 36.5% |
| 3-Person Household | 2,160 | 13.6% |
| 4+ Person Household | 2,975 | 18.7% |
| Total Housing Units | 15,931 | 100.0% |
Occupancy by Ownership by Household Size in McKean County
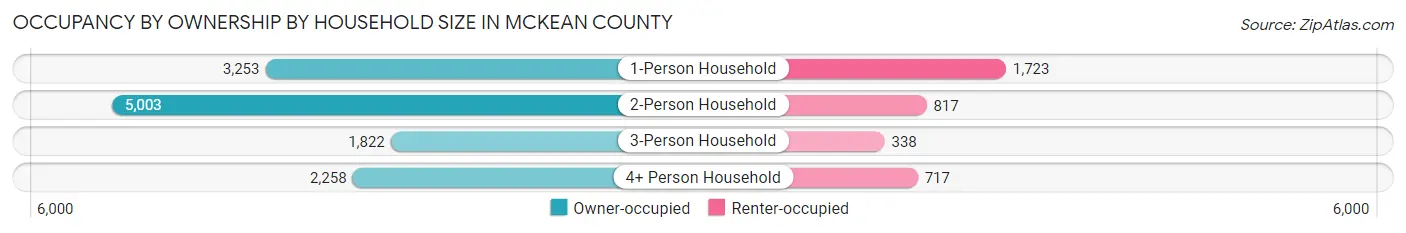
| Household Size | Owner-occupied | Renter-occupied |
| 1-Person Household | 3,253 (65.4%) | 1,723 (34.6%) |
| 2-Person Household | 5,003 (86.0%) | 817 (14.0%) |
| 3-Person Household | 1,822 (84.4%) | 338 (15.7%) |
| 4+ Person Household | 2,258 (75.9%) | 717 (24.1%) |
| Total Housing Units | 12,336 (77.4%) | 3,595 (22.6%) |
Occupancy by Educational Attainment in McKean County
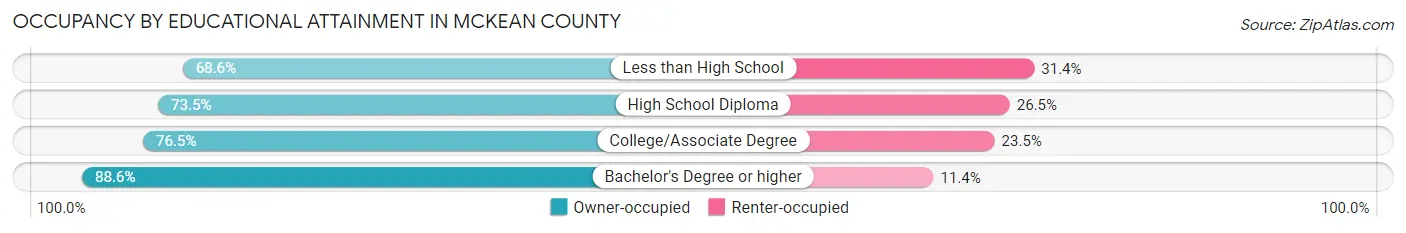
| Household Size | Owner-occupied | Renter-occupied |
| Less than High School | 639 (68.6%) | 292 (31.4%) |
| High School Diploma | 5,208 (73.5%) | 1,877 (26.5%) |
| College/Associate Degree | 3,315 (76.5%) | 1,018 (23.5%) |
| Bachelor's Degree or higher | 3,174 (88.6%) | 408 (11.4%) |
Occupancy by Age of Householder in McKean County
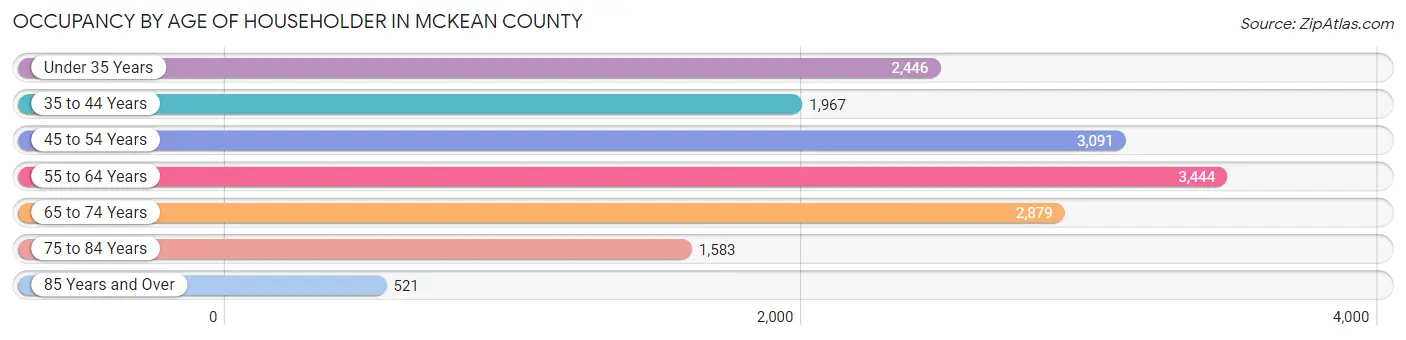
| Age Bracket | # Households | % Households |
| Under 35 Years | 2,446 | 15.3% |
| 35 to 44 Years | 1,967 | 12.3% |
| 45 to 54 Years | 3,091 | 19.4% |
| 55 to 64 Years | 3,444 | 21.6% |
| 65 to 74 Years | 2,879 | 18.1% |
| 75 to 84 Years | 1,583 | 9.9% |
| 85 Years and Over | 521 | 3.3% |
| Total | 15,931 | 100.0% |
Housing Finances in McKean County
Median Income by Occupancy in McKean County
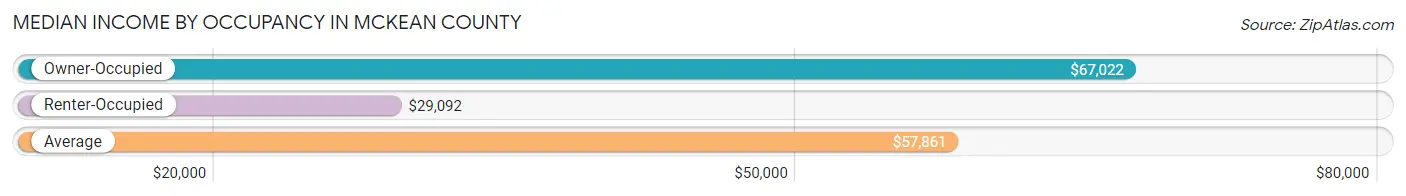
| Occupancy Type | # Households | Median Income |
| Owner-Occupied | 12,336 (77.4%) | $67,022 |
| Renter-Occupied | 3,595 (22.6%) | $29,092 |
| Average | 15,931 (100.0%) | $57,861 |
Occupancy by Householder Income Bracket in McKean County
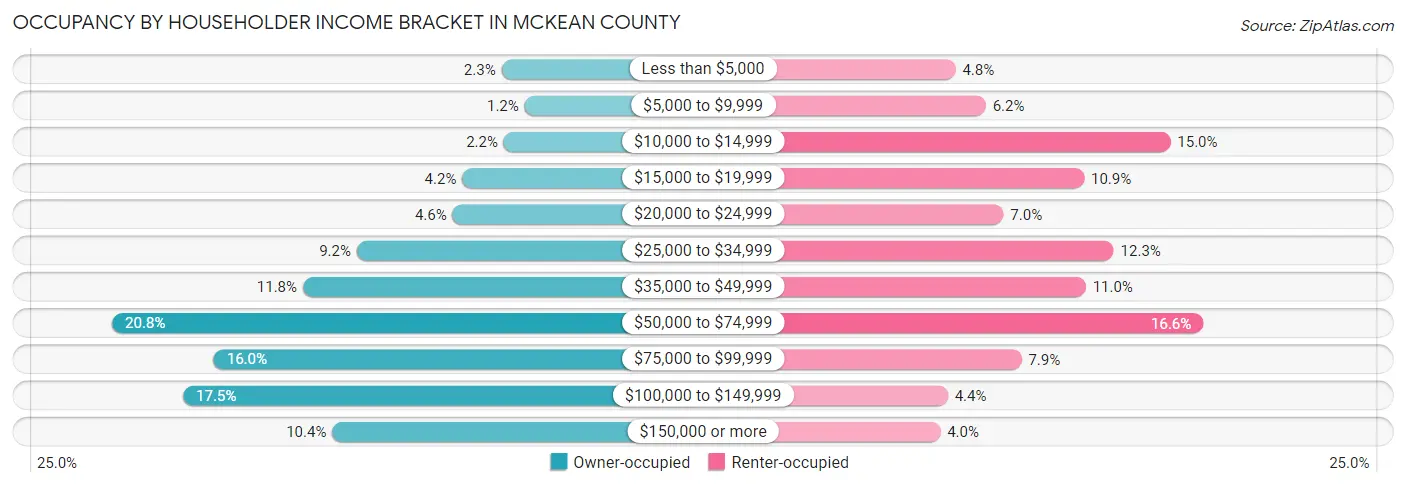
| Income Bracket | Owner-occupied | Renter-occupied |
| Less than $5,000 | 283 (2.3%) | 171 (4.8%) |
| $5,000 to $9,999 | 147 (1.2%) | 223 (6.2%) |
| $10,000 to $14,999 | 269 (2.2%) | 539 (15.0%) |
| $15,000 to $19,999 | 513 (4.2%) | 391 (10.9%) |
| $20,000 to $24,999 | 570 (4.6%) | 253 (7.0%) |
| $25,000 to $34,999 | 1,133 (9.2%) | 442 (12.3%) |
| $35,000 to $49,999 | 1,450 (11.7%) | 394 (11.0%) |
| $50,000 to $74,999 | 2,569 (20.8%) | 595 (16.6%) |
| $75,000 to $99,999 | 1,972 (16.0%) | 284 (7.9%) |
| $100,000 to $149,999 | 2,153 (17.4%) | 158 (4.4%) |
| $150,000 or more | 1,277 (10.3%) | 145 (4.0%) |
| Total | 12,336 (100.0%) | 3,595 (100.0%) |
Monthly Housing Cost Tiers in McKean County
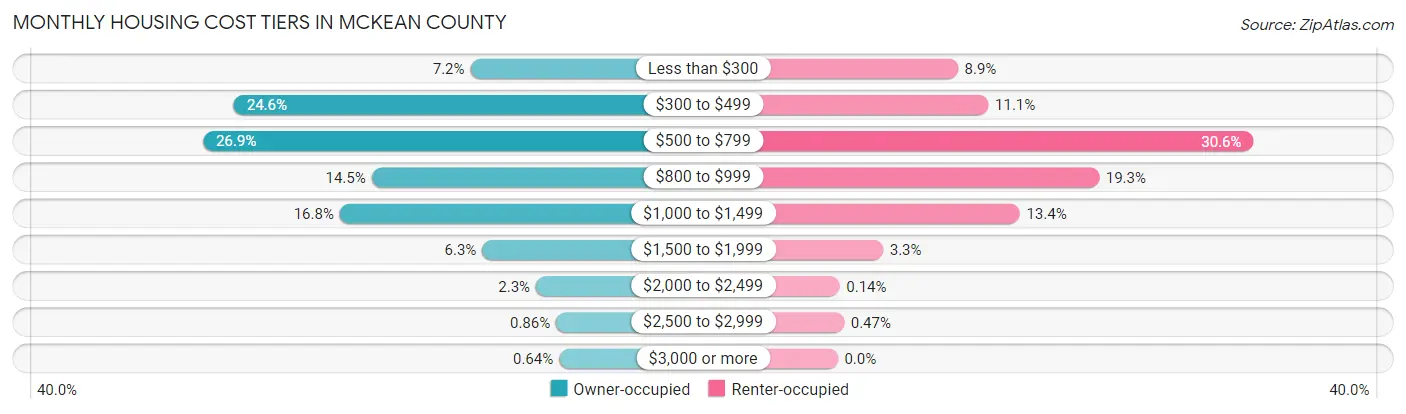
| Monthly Cost | Owner-occupied | Renter-occupied |
| Less than $300 | 885 (7.2%) | 318 (8.8%) |
| $300 to $499 | 3,034 (24.6%) | 399 (11.1%) |
| $500 to $799 | 3,313 (26.9%) | 1,101 (30.6%) |
| $800 to $999 | 1,782 (14.4%) | 692 (19.3%) |
| $1,000 to $1,499 | 2,071 (16.8%) | 482 (13.4%) |
| $1,500 to $1,999 | 777 (6.3%) | 120 (3.3%) |
| $2,000 to $2,499 | 289 (2.3%) | 5 (0.1%) |
| $2,500 to $2,999 | 106 (0.9%) | 17 (0.5%) |
| $3,000 or more | 79 (0.6%) | 0 (0.0%) |
| Total | 12,336 (100.0%) | 3,595 (100.0%) |
Physical Housing Characteristics in McKean County
Housing Structures in McKean County
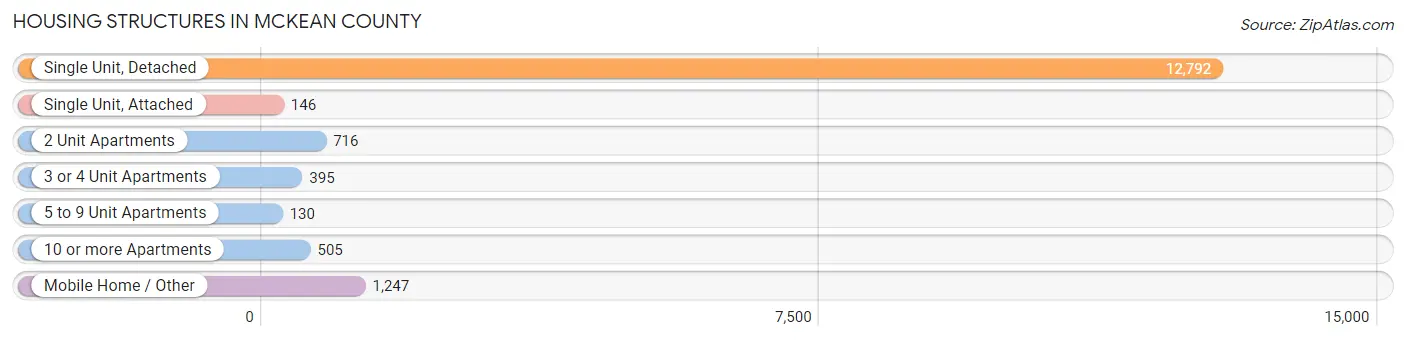
| Structure Type | # Housing Units | % Housing Units |
| Single Unit, Detached | 12,792 | 80.3% |
| Single Unit, Attached | 146 | 0.9% |
| 2 Unit Apartments | 716 | 4.5% |
| 3 or 4 Unit Apartments | 395 | 2.5% |
| 5 to 9 Unit Apartments | 130 | 0.8% |
| 10 or more Apartments | 505 | 3.2% |
| Mobile Home / Other | 1,247 | 7.8% |
| Total | 15,931 | 100.0% |
Housing Structures by Occupancy in McKean County
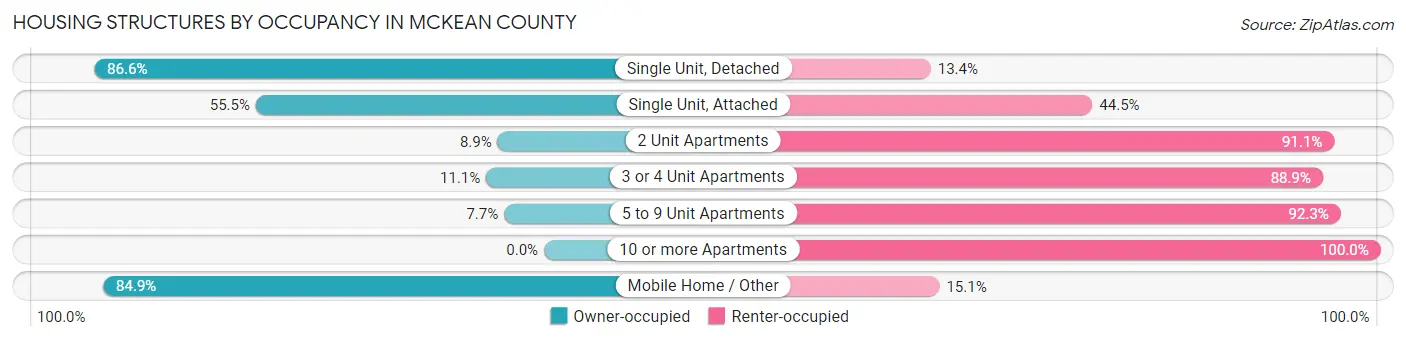
| Structure Type | Owner-occupied | Renter-occupied |
| Single Unit, Detached | 11,078 (86.6%) | 1,714 (13.4%) |
| Single Unit, Attached | 81 (55.5%) | 65 (44.5%) |
| 2 Unit Apartments | 64 (8.9%) | 652 (91.1%) |
| 3 or 4 Unit Apartments | 44 (11.1%) | 351 (88.9%) |
| 5 to 9 Unit Apartments | 10 (7.7%) | 120 (92.3%) |
| 10 or more Apartments | 0 (0.0%) | 505 (100.0%) |
| Mobile Home / Other | 1,059 (84.9%) | 188 (15.1%) |
| Total | 12,336 (77.4%) | 3,595 (22.6%) |
Housing Structures by Number of Rooms in McKean County
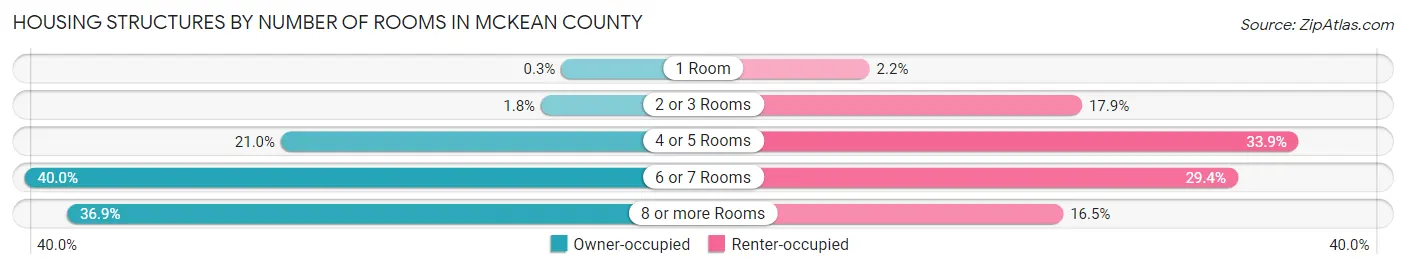
| Number of Rooms | Owner-occupied | Renter-occupied |
| 1 Room | 37 (0.3%) | 79 (2.2%) |
| 2 or 3 Rooms | 222 (1.8%) | 644 (17.9%) |
| 4 or 5 Rooms | 2,596 (21.0%) | 1,220 (33.9%) |
| 6 or 7 Rooms | 4,934 (40.0%) | 1,058 (29.4%) |
| 8 or more Rooms | 4,547 (36.9%) | 594 (16.5%) |
| Total | 12,336 (100.0%) | 3,595 (100.0%) |
Housing Structure by Heating Type in McKean County
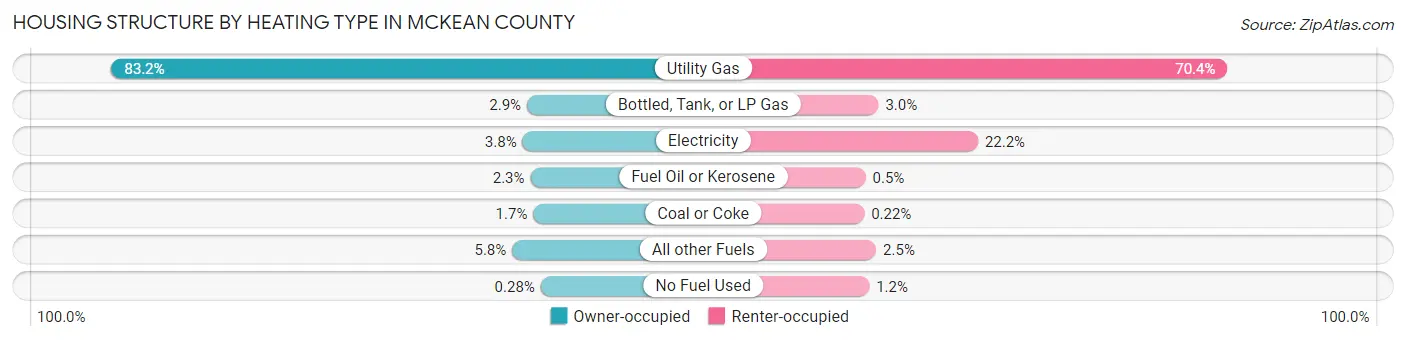
| Heating Type | Owner-occupied | Renter-occupied |
| Utility Gas | 10,267 (83.2%) | 2,530 (70.4%) |
| Bottled, Tank, or LP Gas | 362 (2.9%) | 107 (3.0%) |
| Electricity | 467 (3.8%) | 798 (22.2%) |
| Fuel Oil or Kerosene | 280 (2.3%) | 18 (0.5%) |
| Coal or Coke | 211 (1.7%) | 8 (0.2%) |
| All other Fuels | 714 (5.8%) | 91 (2.5%) |
| No Fuel Used | 35 (0.3%) | 43 (1.2%) |
| Total | 12,336 (100.0%) | 3,595 (100.0%) |
Household Vehicle Usage in McKean County
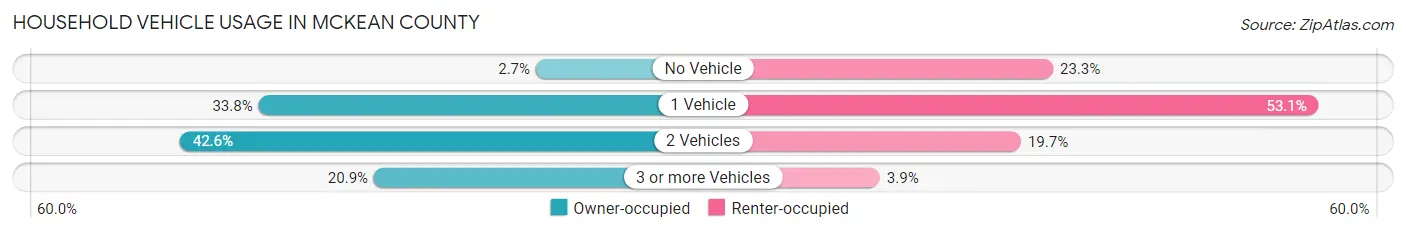
| Vehicles per Household | Owner-occupied | Renter-occupied |
| No Vehicle | 337 (2.7%) | 838 (23.3%) |
| 1 Vehicle | 4,169 (33.8%) | 1,907 (53.0%) |
| 2 Vehicles | 5,256 (42.6%) | 709 (19.7%) |
| 3 or more Vehicles | 2,574 (20.9%) | 141 (3.9%) |
| Total | 12,336 (100.0%) | 3,595 (100.0%) |
Real Estate & Mortgages in McKean County
Real Estate and Mortgage Overview in McKean County
| Characteristic | Without Mortgage | With Mortgage |
| Housing Units | 6,223 | 6,113 |
| Median Property Value | $89,300 | $105,900 |
| Median Household Income | $55,502 | $861 |
| Monthly Housing Costs | $458 | $77 |
| Real Estate Taxes | $1,439 | $210 |
Property Value by Mortgage Status in McKean County
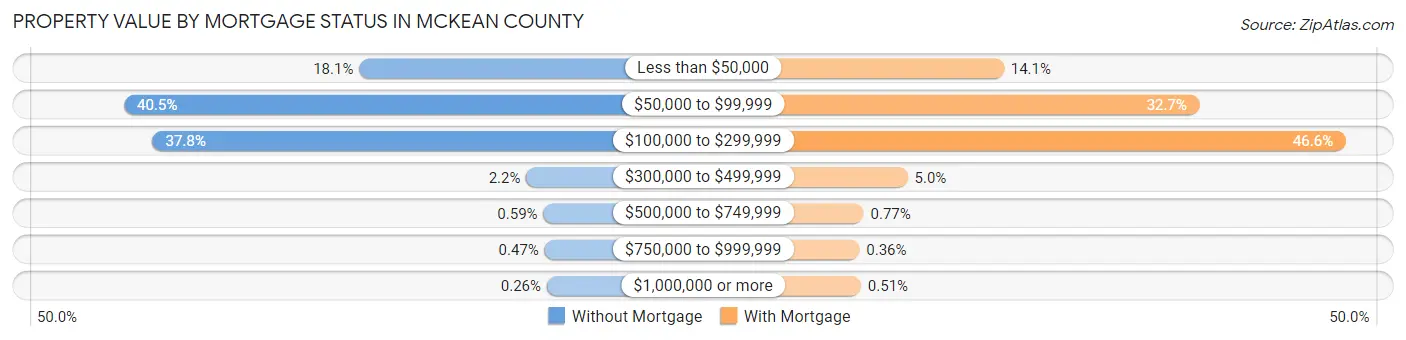
| Property Value | Without Mortgage | With Mortgage |
| Less than $50,000 | 1,128 (18.1%) | 863 (14.1%) |
| $50,000 to $99,999 | 2,522 (40.5%) | 1,998 (32.7%) |
| $100,000 to $299,999 | 2,353 (37.8%) | 2,849 (46.6%) |
| $300,000 to $499,999 | 138 (2.2%) | 303 (5.0%) |
| $500,000 to $749,999 | 37 (0.6%) | 47 (0.8%) |
| $750,000 to $999,999 | 29 (0.5%) | 22 (0.4%) |
| $1,000,000 or more | 16 (0.3%) | 31 (0.5%) |
| Total | 6,223 (100.0%) | 6,113 (100.0%) |
Household Income by Mortgage Status in McKean County
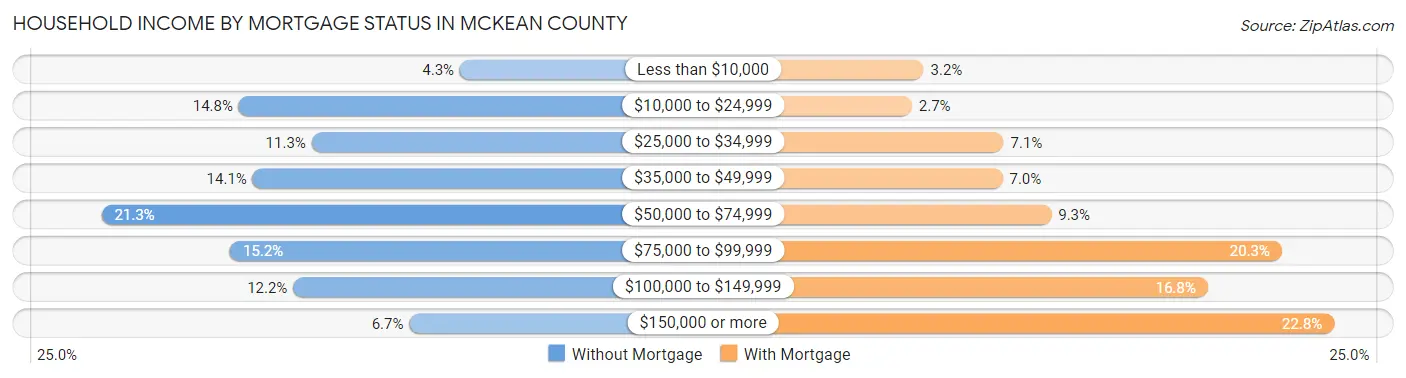
| Household Income | Without Mortgage | With Mortgage |
| Less than $10,000 | 266 (4.3%) | 198 (3.2%) |
| $10,000 to $24,999 | 921 (14.8%) | 164 (2.7%) |
| $25,000 to $34,999 | 705 (11.3%) | 431 (7.0%) |
| $35,000 to $49,999 | 880 (14.1%) | 428 (7.0%) |
| $50,000 to $74,999 | 1,328 (21.3%) | 570 (9.3%) |
| $75,000 to $99,999 | 947 (15.2%) | 1,241 (20.3%) |
| $100,000 to $149,999 | 760 (12.2%) | 1,025 (16.8%) |
| $150,000 or more | 416 (6.7%) | 1,393 (22.8%) |
| Total | 6,223 (100.0%) | 6,113 (100.0%) |
Property Value to Household Income Ratio in McKean County
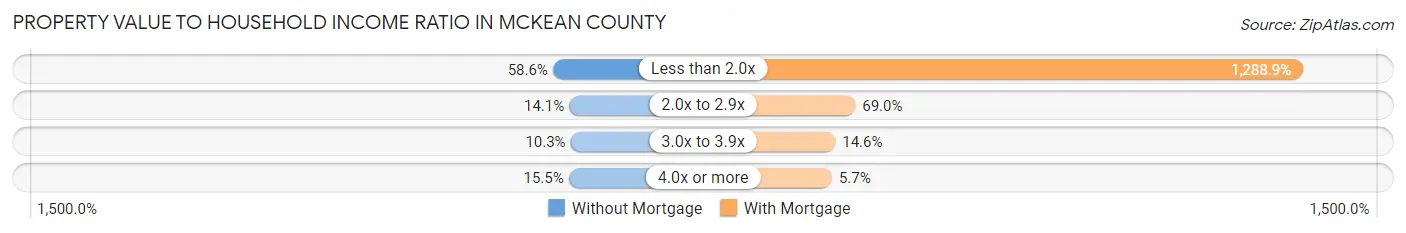
| Value-to-Income Ratio | Without Mortgage | With Mortgage |
| Less than 2.0x | 3,648 (58.6%) | 78,791 (1,288.9%) |
| 2.0x to 2.9x | 876 (14.1%) | 4,220 (69.0%) |
| 3.0x to 3.9x | 642 (10.3%) | 891 (14.6%) |
| 4.0x or more | 964 (15.5%) | 348 (5.7%) |
| Total | 6,223 (100.0%) | 6,113 (100.0%) |
Real Estate Taxes by Mortgage Status in McKean County
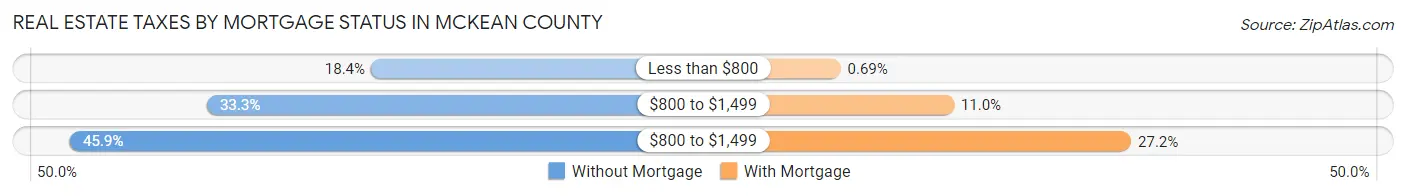
| Property Taxes | Without Mortgage | With Mortgage |
| Less than $800 | 1,144 (18.4%) | 42 (0.7%) |
| $800 to $1,499 | 2,075 (33.3%) | 675 (11.0%) |
| $800 to $1,499 | 2,853 (45.9%) | 1,664 (27.2%) |
| Total | 6,223 (100.0%) | 6,113 (100.0%) |
Health & Disability in McKean County
Health Insurance Coverage by Age in McKean County
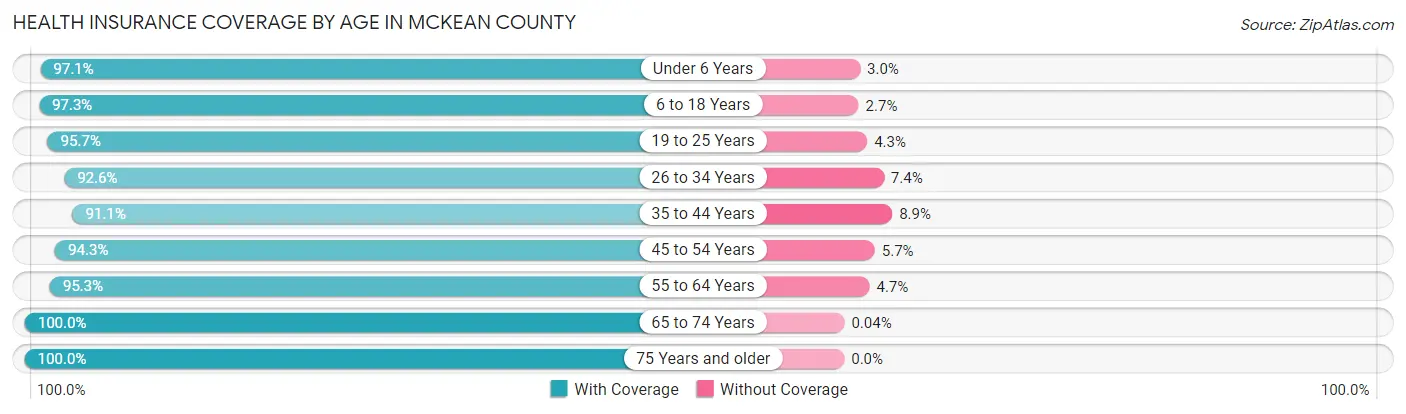
| Age Bracket | With Coverage | Without Coverage |
| Under 6 Years | 2,268 (97.1%) | 69 (2.9%) |
| 6 to 18 Years | 6,038 (97.3%) | 166 (2.7%) |
| 19 to 25 Years | 3,151 (95.7%) | 141 (4.3%) |
| 26 to 34 Years | 3,635 (92.6%) | 290 (7.4%) |
| 35 to 44 Years | 3,801 (91.1%) | 373 (8.9%) |
| 45 to 54 Years | 4,894 (94.3%) | 296 (5.7%) |
| 55 to 64 Years | 5,728 (95.3%) | 283 (4.7%) |
| 65 to 74 Years | 4,542 (100.0%) | 2 (0.0%) |
| 75 Years and older | 3,010 (100.0%) | 0 (0.0%) |
| Total | 37,067 (95.8%) | 1,620 (4.2%) |
Health Insurance Coverage by Citizenship Status in McKean County
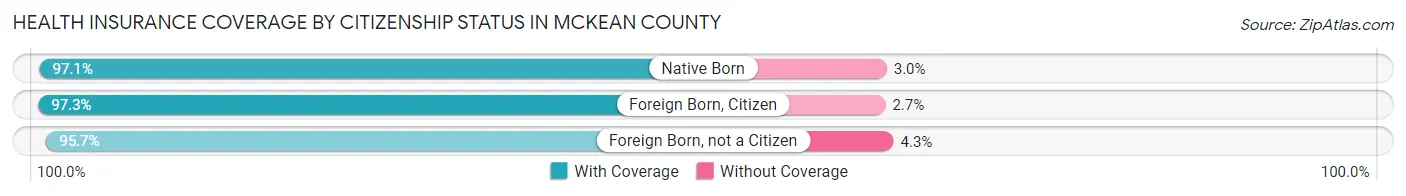
| Citizenship Status | With Coverage | Without Coverage |
| Native Born | 2,268 (97.1%) | 69 (2.9%) |
| Foreign Born, Citizen | 6,038 (97.3%) | 166 (2.7%) |
| Foreign Born, not a Citizen | 3,151 (95.7%) | 141 (4.3%) |
Health Insurance Coverage by Household Income in McKean County
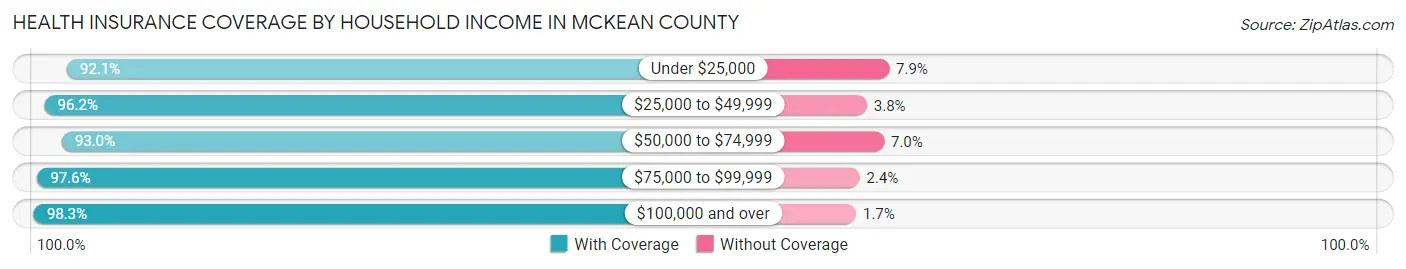
| Household Income | With Coverage | Without Coverage |
| Under $25,000 | 4,844 (92.1%) | 417 (7.9%) |
| $25,000 to $49,999 | 6,788 (96.2%) | 265 (3.8%) |
| $50,000 to $74,999 | 7,541 (93.0%) | 566 (7.0%) |
| $75,000 to $99,999 | 5,713 (97.6%) | 140 (2.4%) |
| $100,000 and over | 11,248 (98.3%) | 198 (1.7%) |
Public vs Private Health Insurance Coverage by Age in McKean County
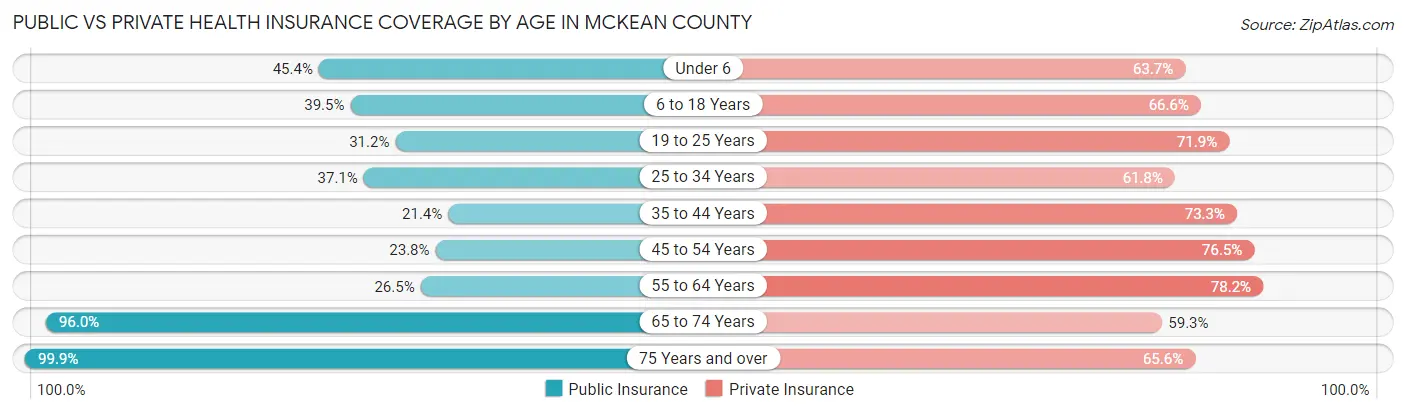
| Age Bracket | Public Insurance | Private Insurance |
| Under 6 | 1,061 (45.4%) | 1,489 (63.7%) |
| 6 to 18 Years | 2,453 (39.5%) | 4,133 (66.6%) |
| 19 to 25 Years | 1,027 (31.2%) | 2,366 (71.9%) |
| 25 to 34 Years | 1,455 (37.1%) | 2,426 (61.8%) |
| 35 to 44 Years | 893 (21.4%) | 3,060 (73.3%) |
| 45 to 54 Years | 1,233 (23.8%) | 3,972 (76.5%) |
| 55 to 64 Years | 1,594 (26.5%) | 4,698 (78.2%) |
| 65 to 74 Years | 4,364 (96.0%) | 2,695 (59.3%) |
| 75 Years and over | 3,007 (99.9%) | 1,973 (65.5%) |
| Total | 17,087 (44.2%) | 26,812 (69.3%) |
Disability Status by Sex by Age in McKean County
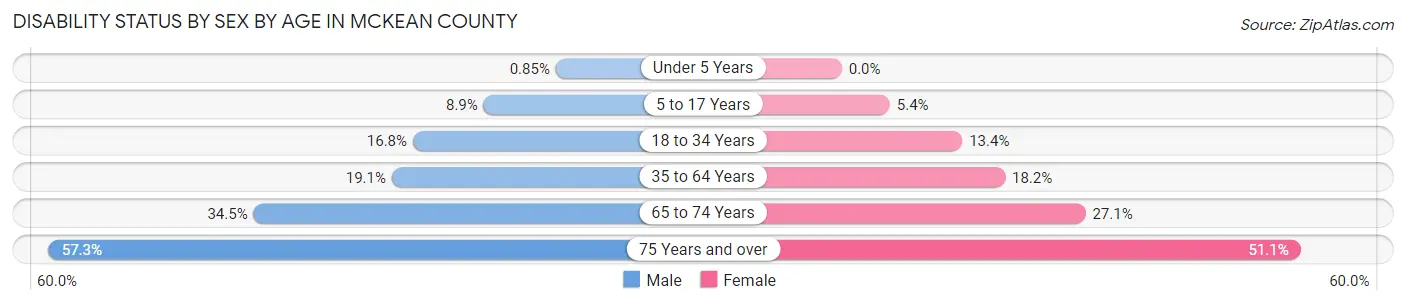
| Age Bracket | Male | Female |
| Under 5 Years | 8 (0.9%) | 0 (0.0%) |
| 5 to 17 Years | 289 (8.9%) | 149 (5.3%) |
| 18 to 34 Years | 680 (16.8%) | 506 (13.4%) |
| 35 to 64 Years | 1,491 (19.1%) | 1,377 (18.2%) |
| 65 to 74 Years | 790 (34.5%) | 612 (27.1%) |
| 75 Years and over | 750 (57.3%) | 869 (51.1%) |
Disability Class by Sex by Age in McKean County
Disability Class: Hearing Difficulty
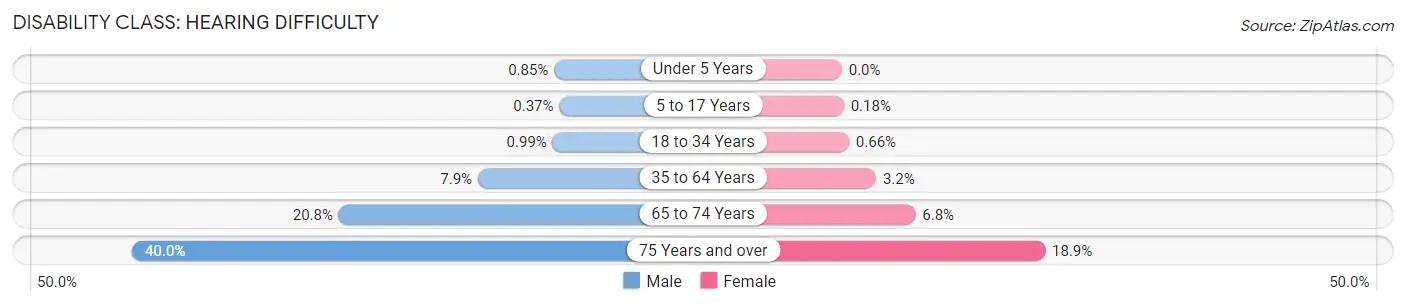
| Age Bracket | Male | Female |
| Under 5 Years | 8 (0.9%) | 0 (0.0%) |
| 5 to 17 Years | 12 (0.4%) | 5 (0.2%) |
| 18 to 34 Years | 40 (1.0%) | 25 (0.7%) |
| 35 to 64 Years | 619 (7.9%) | 240 (3.2%) |
| 65 to 74 Years | 477 (20.8%) | 154 (6.8%) |
| 75 Years and over | 524 (40.0%) | 321 (18.9%) |
Disability Class: Vision Difficulty
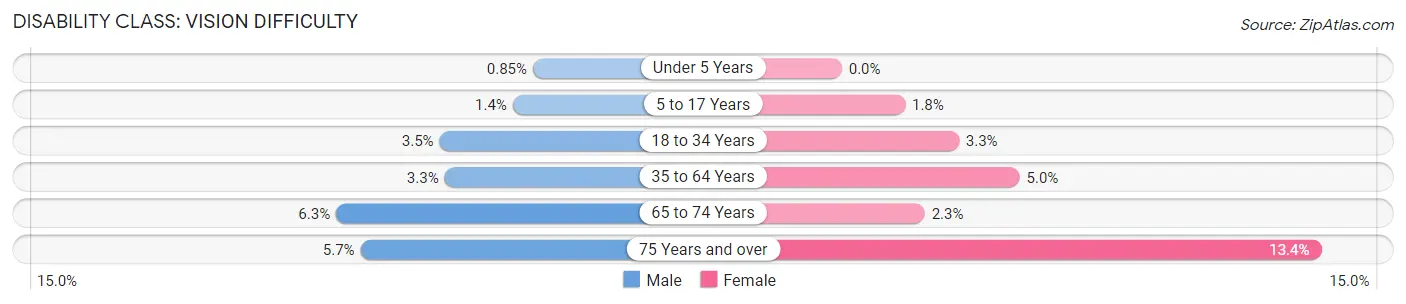
| Age Bracket | Male | Female |
| Under 5 Years | 8 (0.9%) | 0 (0.0%) |
| 5 to 17 Years | 46 (1.4%) | 49 (1.8%) |
| 18 to 34 Years | 140 (3.5%) | 123 (3.3%) |
| 35 to 64 Years | 258 (3.3%) | 375 (5.0%) |
| 65 to 74 Years | 145 (6.3%) | 52 (2.3%) |
| 75 Years and over | 74 (5.7%) | 227 (13.4%) |
Disability Class: Cognitive Difficulty
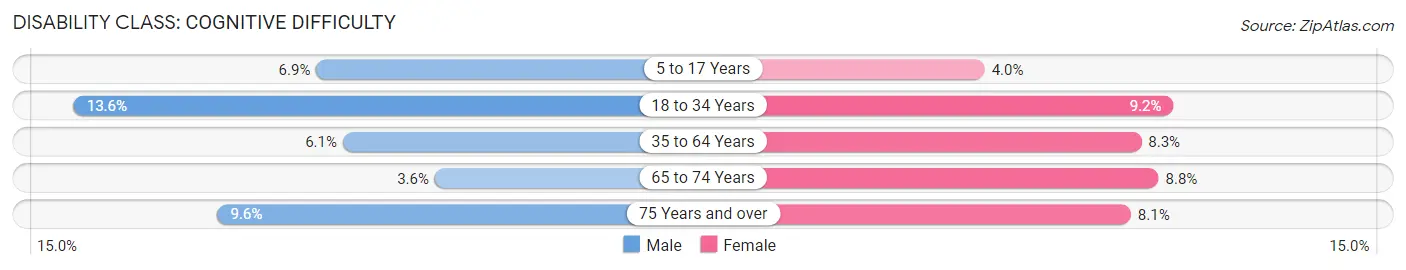
| Age Bracket | Male | Female |
| 5 to 17 Years | 224 (6.9%) | 111 (4.0%) |
| 18 to 34 Years | 553 (13.6%) | 348 (9.2%) |
| 35 to 64 Years | 479 (6.1%) | 632 (8.3%) |
| 65 to 74 Years | 82 (3.6%) | 199 (8.8%) |
| 75 Years and over | 126 (9.6%) | 137 (8.1%) |
Disability Class: Ambulatory Difficulty
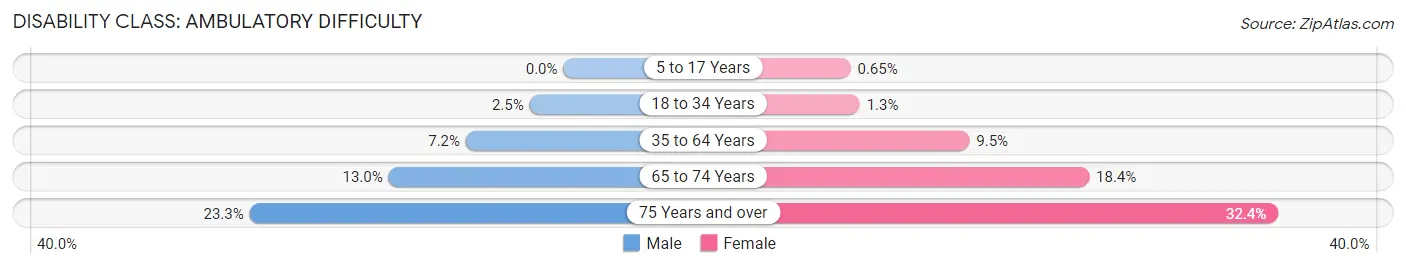
| Age Bracket | Male | Female |
| 5 to 17 Years | 0 (0.0%) | 18 (0.6%) |
| 18 to 34 Years | 102 (2.5%) | 50 (1.3%) |
| 35 to 64 Years | 565 (7.2%) | 717 (9.5%) |
| 65 to 74 Years | 297 (13.0%) | 414 (18.4%) |
| 75 Years and over | 305 (23.3%) | 551 (32.4%) |
Disability Class: Self-Care Difficulty
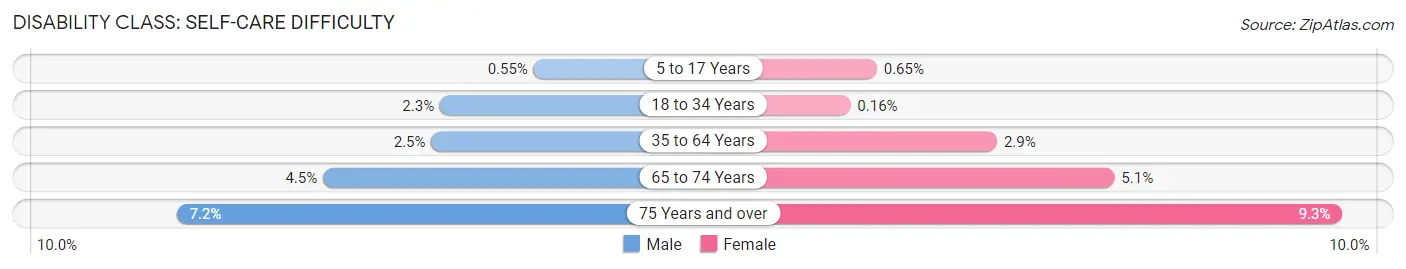
| Age Bracket | Male | Female |
| 5 to 17 Years | 18 (0.5%) | 18 (0.6%) |
| 18 to 34 Years | 93 (2.3%) | 6 (0.2%) |
| 35 to 64 Years | 191 (2.5%) | 218 (2.9%) |
| 65 to 74 Years | 102 (4.5%) | 114 (5.1%) |
| 75 Years and over | 94 (7.2%) | 158 (9.3%) |
Technology Access in McKean County
Computing Device Access in McKean County
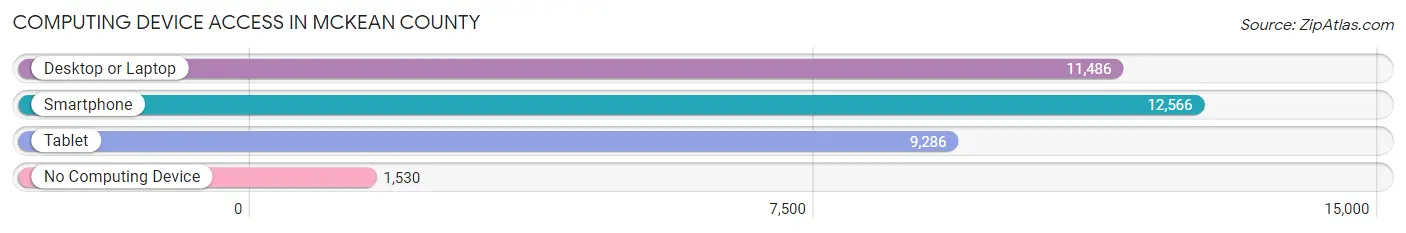
| Device Type | # Households | % Households |
| Desktop or Laptop | 11,486 | 72.1% |
| Smartphone | 12,566 | 78.9% |
| Tablet | 9,286 | 58.3% |
| No Computing Device | 1,530 | 9.6% |
| Total | 15,931 | 100.0% |
Internet Access in McKean County
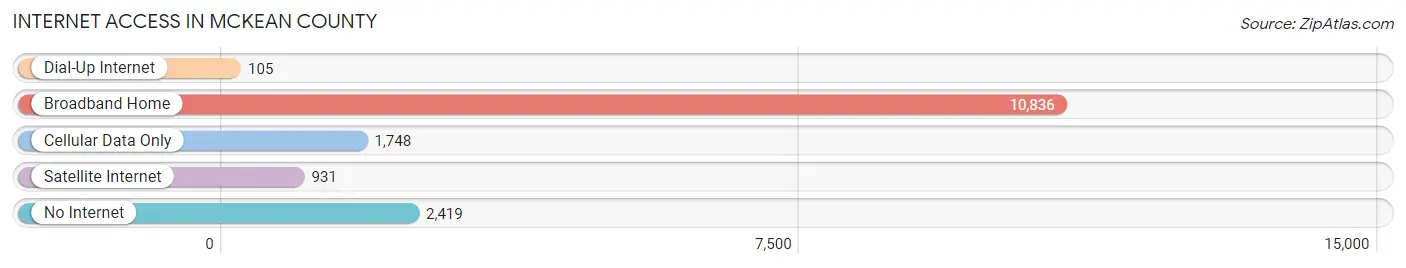
| Internet Type | # Households | % Households |
| Dial-Up Internet | 105 | 0.7% |
| Broadband Home | 10,836 | 68.0% |
| Cellular Data Only | 1,748 | 11.0% |
| Satellite Internet | 931 | 5.8% |
| No Internet | 2,419 | 15.2% |
| Total | 15,931 | 100.0% |
McKean County Summary
McKean County is a county located in the U.S. state of Pennsylvania. As of the 2010 census, the population was 43,450. The county seat is Smethport. The county was created in 1804 and organized in 1826. It is named after former Pennsylvania Governor and Declaration of Independence signer Thomas McKean.
History
McKean County was formed in 1804 from parts of Lycoming, Potter, and Warren counties. It was named after Thomas McKean, a signer of the Declaration of Independence and the second governor of Pennsylvania. The county was organized in 1826.
The first settlers in McKean County were Native Americans, who lived in the area for thousands of years before the arrival of Europeans. The first European settlers were mostly Scots-Irish and German immigrants who arrived in the late 1700s and early 1800s.
Geography
McKean County is located in the northwest corner of Pennsylvania. It is bordered by Potter County to the north, Warren County to the east, Elk County to the south, and Cattaraugus County, New York to the west. The Allegheny River forms the northern border of the county.
The county has a total area of 1,072 square miles, of which 1,067 square miles is land and 5.2 square miles is water. The highest point in the county is 2,890 feet above sea level on the summit of Mount Jewett.
Economy
McKean County’s economy is largely based on agriculture and natural resources. The county is home to several large dairy farms, as well as beef and poultry farms. The county also has a large timber industry, with several sawmills and paper mills located in the area.
The county is also home to several oil and gas wells, as well as several coal mines. Tourism is also an important part of the economy, with the Allegheny National Forest and the Kinzua Dam providing recreational opportunities for visitors.
Demographics
As of the 2010 census, there were 43,450 people, 17,845 households, and 11,945 families living in the county. The population density was 40.6 people per square mile. There were 20,845 housing units at an average density of 19.5 per square mile.
The racial makeup of the county was 97.2% White, 0.7% Black or African American, 0.3% Native American, 0.2% Asian, 0.1% Pacific Islander, 0.4% from other races, and 1.1% from two or more races. 1.7% of the population were Hispanic or Latino of any race.
The median income for a household in the county was $35,945, and the median income for a family was $44,945. The per capita income for the county was $19,845. About 11.2% of families and 15.2% of the population were below the poverty line, including 22.2% of those under age 18 and 8.2% of those age 65 or over.
Common Questions
What is Per Capita Income in McKean County?
Per Capita income in McKean County is $30,278.
What is the Median Family Income in McKean County?
Median Family Income in McKean County is $72,857.
What is the Median Household income in McKean County?
Median Household Income in McKean County is $57,861.
What is Income or Wage Gap in McKean County?
Income or Wage Gap in McKean County is 27.5%.
Women in McKean County earn 72.5 cents for every dollar earned by a man.
What is Family Income Deficit in McKean County?
Family Income Deficit in McKean County is $11,181.
Families that are below poverty line in McKean County earn $11,181 less on average than the poverty threshold level.
What is Inequality or Gini Index in McKean County?
Inequality or Gini Index in McKean County is 0.45.
What is the Total Population of McKean County?
Total Population of McKean County is 40,459.
What is the Total Male Population of McKean County?
Total Male Population of McKean County is 20,929.
What is the Total Female Population of McKean County?
Total Female Population of McKean County is 19,530.
What is the Ratio of Males per 100 Females in McKean County?
There are 107.16 Males per 100 Females in McKean County.
What is the Ratio of Females per 100 Males in McKean County?
There are 93.32 Females per 100 Males in McKean County.
What is the Median Population Age in McKean County?
Median Population Age in McKean County is 43.8 Years.
What is the Average Family Size in McKean County
Average Family Size in McKean County is 2.9 People.
What is the Average Household Size in McKean County
Average Household Size in McKean County is 2.4 People.
How Large is the Labor Force in McKean County?
There are 18,589 People in the Labor Forcein in McKean County.
What is the Percentage of People in the Labor Force in McKean County?
55.4% of People are in the Labor Force in McKean County.
What is the Unemployment Rate in McKean County?
Unemployment Rate in McKean County is 5.3%.