Lycoming County, PA Map & Demographics
Lycoming County Map
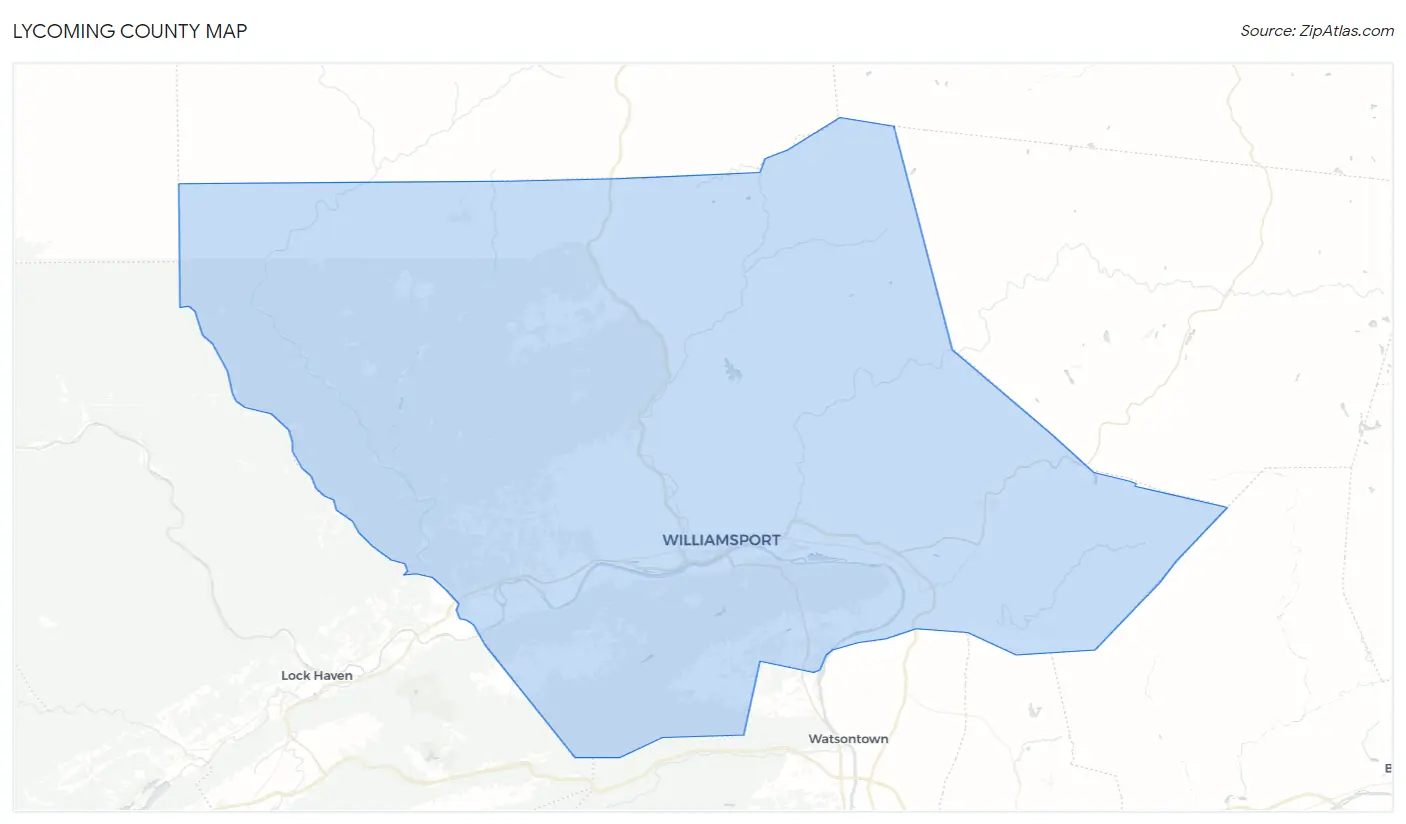
Lycoming County Overview
$32,968
PER CAPITA INCOME
$77,846
AVG FAMILY INCOME
$63,437
AVG HOUSEHOLD INCOME
30.3%
WAGE / INCOME GAP [ % ]
69.7¢/ $1
WAGE / INCOME GAP [ $ ]
$11,104
FAMILY INCOME DEFICIT
0.43
INEQUALITY / GINI INDEX
114,022
TOTAL POPULATION
56,229
MALE POPULATION
57,793
FEMALE POPULATION
97.29
MALES / 100 FEMALES
102.78
FEMALES / 100 MALES
41.4
MEDIAN AGE
2.9
AVG FAMILY SIZE
2.4
AVG HOUSEHOLD SIZE
55,474
LABOR FORCE [ PEOPLE ]
59.4%
PERCENT IN LABOR FORCE
5.3%
UNEMPLOYMENT RATE
Lycoming County Area Codes
Income in Lycoming County
Income Overview in Lycoming County
Per Capita Income in Lycoming County is $32,968, while median incomes of families and households are $77,846 and $63,437 respectively.
| Characteristic | Number | Measure |
| Per Capita Income | 114,022 | $32,968 |
| Median Family Income | 28,974 | $77,846 |
| Mean Family Income | 28,974 | $95,091 |
| Median Household Income | 45,705 | $63,437 |
| Mean Household Income | 45,705 | $80,309 |
| Income Deficit | 28,974 | $11,104 |
| Wage / Income Gap (%) | 114,022 | 30.32% |
| Wage / Income Gap ($) | 114,022 | 69.68¢ per $1 |
| Gini / Inequality Index | 114,022 | 0.43 |
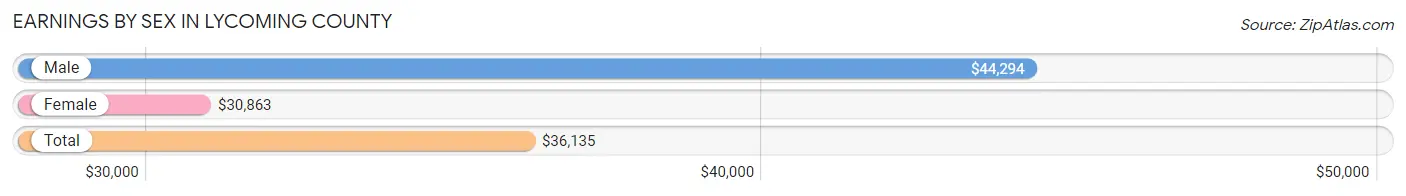
Earnings by Sex in Lycoming County
Average Earnings in Lycoming County are $36,135, $44,294 for men and $30,863 for women, a difference of 30.3%.
| Sex | Number | Average Earnings |
| Male | 31,541 (52.9%) | $44,294 |
| Female | 28,126 (47.1%) | $30,863 |
| Total | 59,667 (100.0%) | $36,135 |
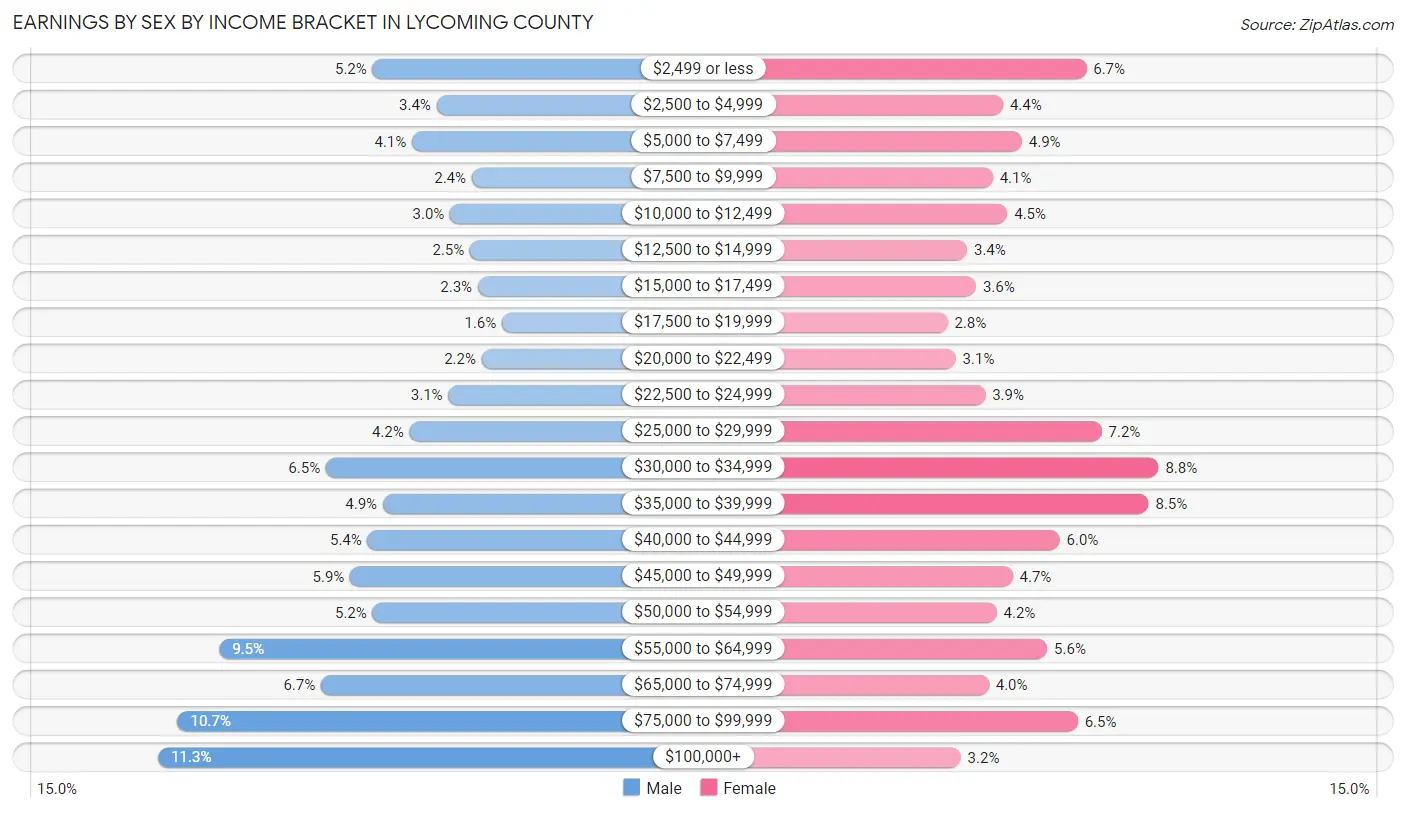
Earnings by Sex by Income Bracket in Lycoming County
The most common earnings brackets in Lycoming County are $100,000+ for men (3,547 | 11.3%) and $30,000 to $34,999 for women (2,465 | 8.8%).
| Income | Male | Female |
| $2,499 or less | 1,646 (5.2%) | 1,892 (6.7%) |
| $2,500 to $4,999 | 1,080 (3.4%) | 1,234 (4.4%) |
| $5,000 to $7,499 | 1,295 (4.1%) | 1,385 (4.9%) |
| $7,500 to $9,999 | 765 (2.4%) | 1,154 (4.1%) |
| $10,000 to $12,499 | 958 (3.0%) | 1,269 (4.5%) |
| $12,500 to $14,999 | 783 (2.5%) | 950 (3.4%) |
| $15,000 to $17,499 | 712 (2.3%) | 1,020 (3.6%) |
| $17,500 to $19,999 | 497 (1.6%) | 796 (2.8%) |
| $20,000 to $22,499 | 679 (2.1%) | 861 (3.1%) |
| $22,500 to $24,999 | 976 (3.1%) | 1,094 (3.9%) |
| $25,000 to $29,999 | 1,319 (4.2%) | 2,013 (7.2%) |
| $30,000 to $34,999 | 2,060 (6.5%) | 2,465 (8.8%) |
| $35,000 to $39,999 | 1,556 (4.9%) | 2,384 (8.5%) |
| $40,000 to $44,999 | 1,691 (5.4%) | 1,682 (6.0%) |
| $45,000 to $49,999 | 1,846 (5.9%) | 1,312 (4.7%) |
| $50,000 to $54,999 | 1,648 (5.2%) | 1,185 (4.2%) |
| $55,000 to $64,999 | 3,005 (9.5%) | 1,583 (5.6%) |
| $65,000 to $74,999 | 2,103 (6.7%) | 1,122 (4.0%) |
| $75,000 to $99,999 | 3,375 (10.7%) | 1,826 (6.5%) |
| $100,000+ | 3,547 (11.3%) | 899 (3.2%) |
| Total | 31,541 (100.0%) | 28,126 (100.0%) |
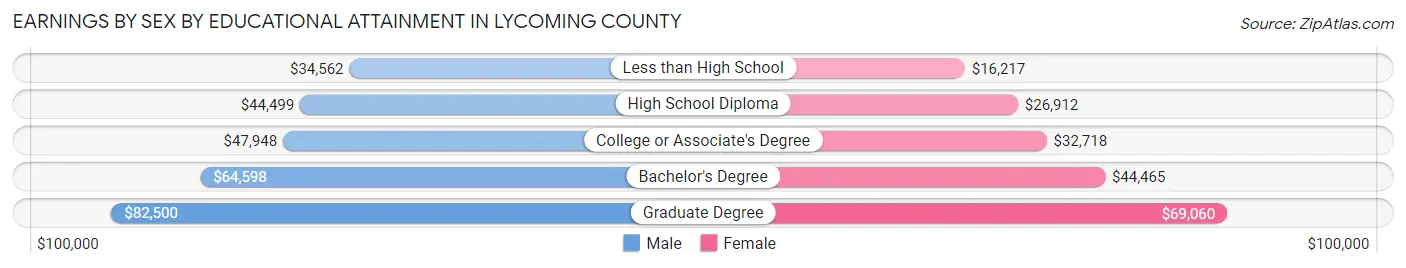
Earnings by Sex by Educational Attainment in Lycoming County
Average earnings in Lycoming County are $49,947 for men and $34,596 for women, a difference of 30.7%. Men with an educational attainment of graduate degree enjoy the highest average annual earnings of $82,500, while those with less than high school education earn the least with $34,562. Women with an educational attainment of graduate degree earn the most with the average annual earnings of $69,060, while those with less than high school education have the smallest earnings of $16,217.
| Educational Attainment | Male Income | Female Income |
| Less than High School | $34,562 | $16,217 |
| High School Diploma | $44,499 | $26,912 |
| College or Associate's Degree | $47,948 | $32,718 |
| Bachelor's Degree | $64,598 | $44,465 |
| Graduate Degree | $82,500 | $69,060 |
| Total | $49,947 | $34,596 |
Family Income in Lycoming County
Family Income Brackets in Lycoming County
According to the Lycoming County family income data, there are 6,142 families falling into the $100,000 to $149,999 income range, which is the most common income bracket and makes up 21.2% of all families. Conversely, the $10,000 to $14,999 income bracket is the least frequent group with only 464 families (1.6%) belonging to this category.
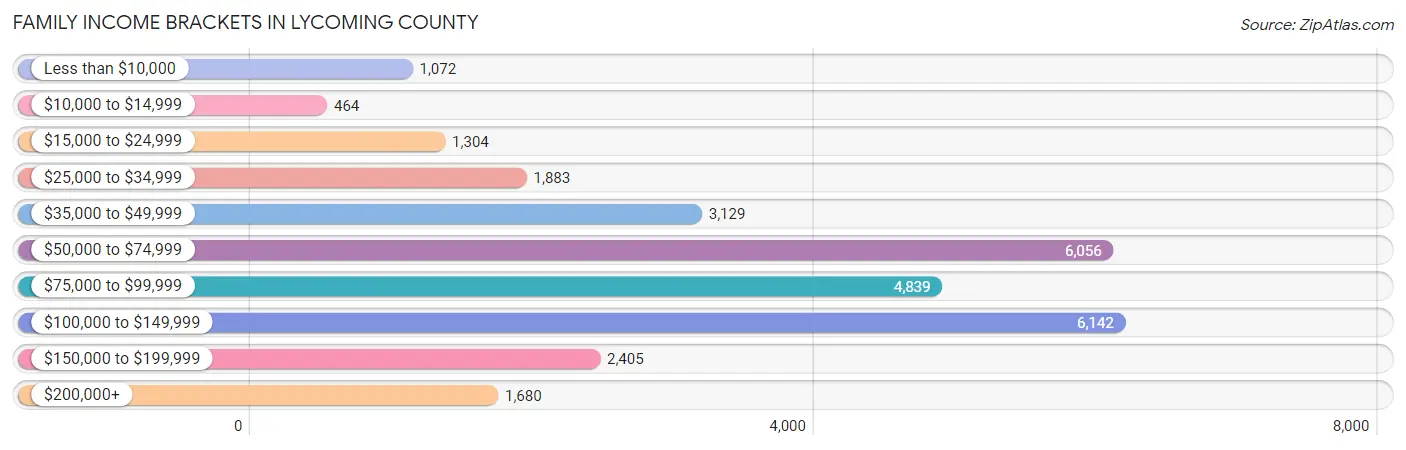
| Income Bracket | # Families | % Families |
| Less than $10,000 | 1,072 | 3.7% |
| $10,000 to $14,999 | 464 | 1.6% |
| $15,000 to $24,999 | 1,304 | 4.5% |
| $25,000 to $34,999 | 1,883 | 6.5% |
| $35,000 to $49,999 | 3,129 | 10.8% |
| $50,000 to $74,999 | 6,056 | 20.9% |
| $75,000 to $99,999 | 4,839 | 16.7% |
| $100,000 to $149,999 | 6,142 | 21.2% |
| $150,000 to $199,999 | 2,405 | 8.3% |
| $200,000+ | 1,680 | 5.8% |
Family Income by Famaliy Size in Lycoming County
5-person families (1,552 | 5.4%) account for the highest median family income in Lycoming County with $103,191 per family, while 2-person families (16,097 | 55.6%) have the highest median income of $33,466 per family member.
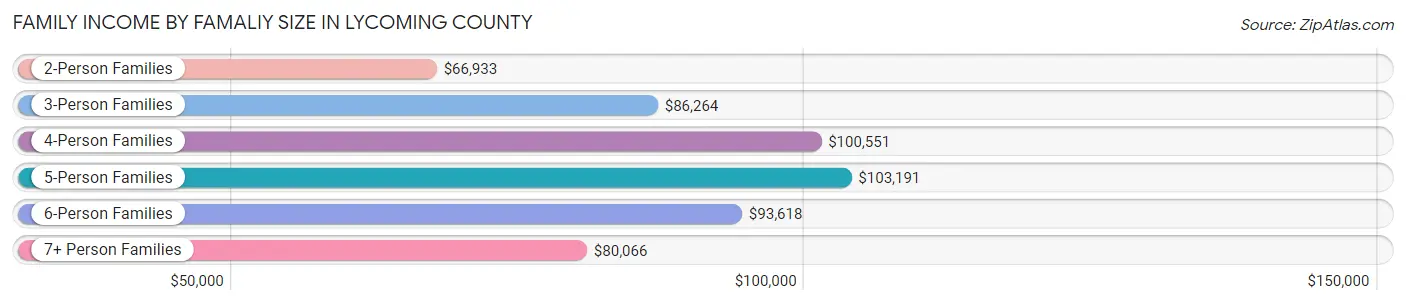
| Income Bracket | # Families | Median Income |
| 2-Person Families | 16,097 (55.6%) | $66,933 |
| 3-Person Families | 5,513 (19.0%) | $86,264 |
| 4-Person Families | 4,703 (16.2%) | $100,551 |
| 5-Person Families | 1,552 (5.4%) | $103,191 |
| 6-Person Families | 751 (2.6%) | $93,618 |
| 7+ Person Families | 358 (1.2%) | $80,066 |
| Total | 28,974 (100.0%) | $77,846 |
Family Income by Number of Earners in Lycoming County
The median family income in Lycoming County is $77,846, with families comprising 3+ earners (3,046) having the highest median family income of $132,600, while families with no earners (5,258) have the lowest median family income of $48,494, accounting for 10.5% and 18.1% of families, respectively.
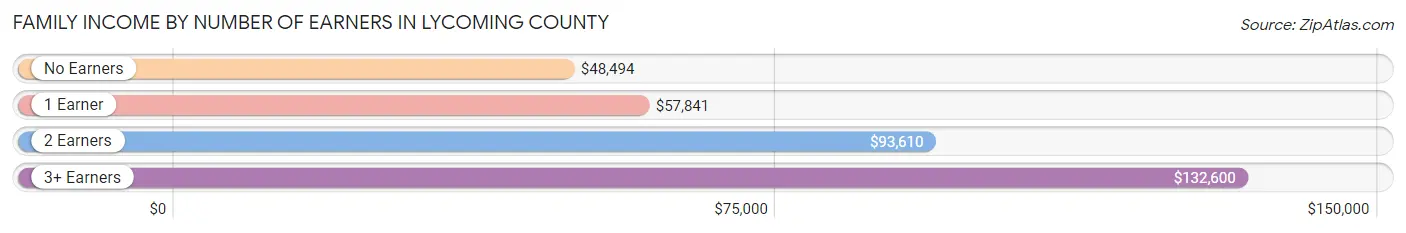
| Number of Earners | # Families | Median Income |
| No Earners | 5,258 (18.1%) | $48,494 |
| 1 Earner | 9,031 (31.2%) | $57,841 |
| 2 Earners | 11,639 (40.2%) | $93,610 |
| 3+ Earners | 3,046 (10.5%) | $132,600 |
| Total | 28,974 (100.0%) | $77,846 |
Household Income in Lycoming County
Household Income Brackets in Lycoming County
With 9,050 households falling in the category, the $50,000 to $74,999 income range is the most frequent in Lycoming County, accounting for 19.8% of all households. In contrast, only 1,874 households (4.1%) fall into the $10,000 to $14,999 income bracket, making it the least populous group.
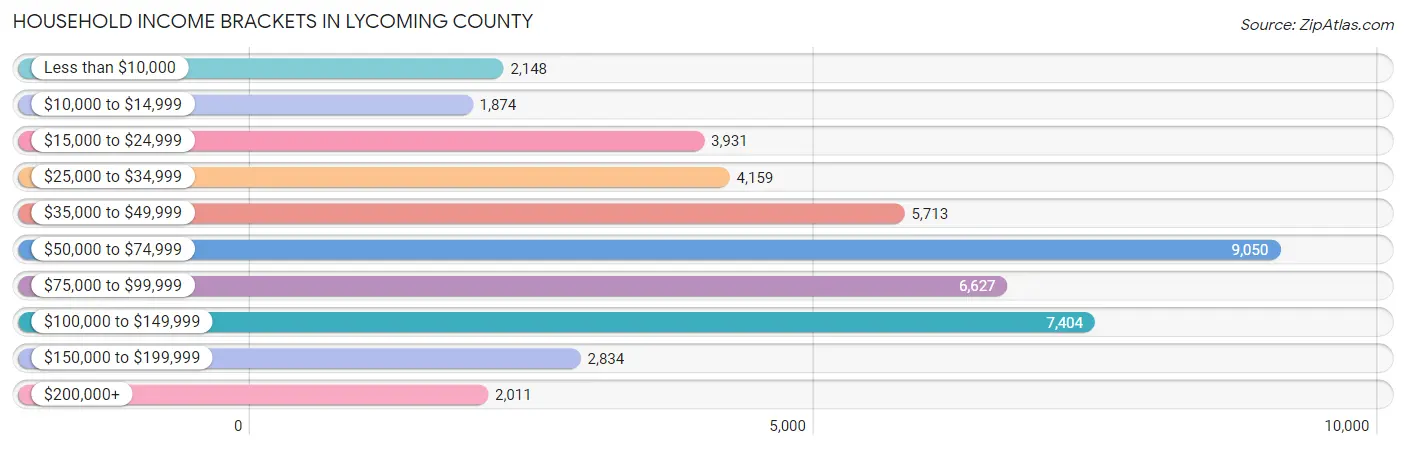
| Income Bracket | # Households | % Households |
| Less than $10,000 | 2,148 | 4.7% |
| $10,000 to $14,999 | 1,874 | 4.1% |
| $15,000 to $24,999 | 3,931 | 8.6% |
| $25,000 to $34,999 | 4,159 | 9.1% |
| $35,000 to $49,999 | 5,713 | 12.5% |
| $50,000 to $74,999 | 9,050 | 19.8% |
| $75,000 to $99,999 | 6,627 | 14.5% |
| $100,000 to $149,999 | 7,404 | 16.2% |
| $150,000 to $199,999 | 2,834 | 6.2% |
| $200,000+ | 2,011 | 4.4% |
Household Income by Householder Age in Lycoming County
The median household income in Lycoming County is $63,437, with the highest median household income of $77,586 found in the 25 to 44 years age bracket for the primary householder. A total of 12,766 households (27.9%) fall into this category. Meanwhile, the 15 to 24 years age bracket for the primary householder has the lowest median household income of $33,213, with 1,679 households (3.7%) in this group.
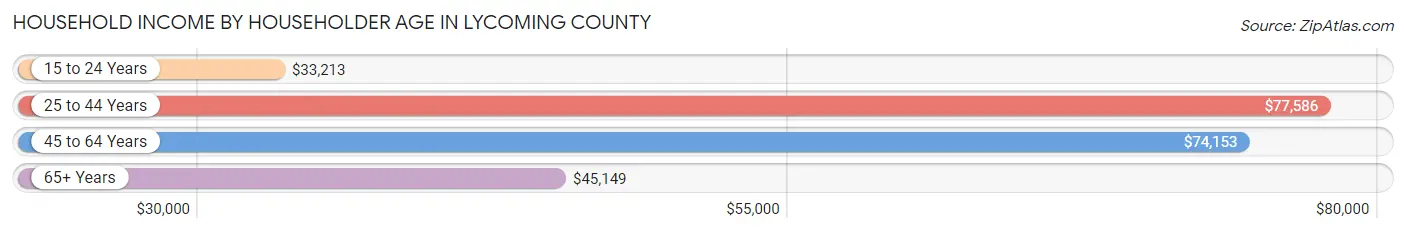
| Income Bracket | # Households | Median Income |
| 15 to 24 Years | 1,679 (3.7%) | $33,213 |
| 25 to 44 Years | 12,766 (27.9%) | $77,586 |
| 45 to 64 Years | 17,394 (38.1%) | $74,153 |
| 65+ Years | 13,866 (30.3%) | $45,149 |
| Total | 45,705 (100.0%) | $63,437 |
Poverty in Lycoming County
Income Below Poverty by Sex and Age in Lycoming County
With 10.8% poverty level for males and 14.1% for females among the residents of Lycoming County, 18 to 24 year old males and under 5 year old females are the most vulnerable to poverty, with 892 males (23.3%) and 767 females (26.9%) in their respective age groups living below the poverty level.
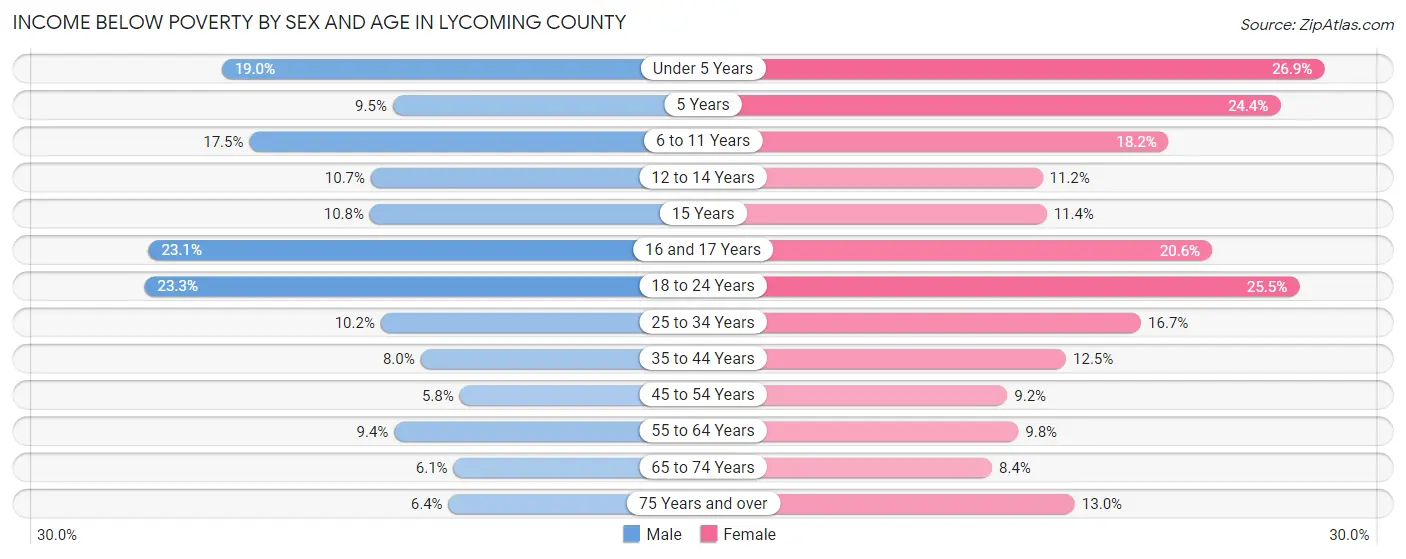
| Age Bracket | Male | Female |
| Under 5 Years | 581 (19.0%) | 767 (26.9%) |
| 5 Years | 70 (9.5%) | 195 (24.4%) |
| 6 to 11 Years | 661 (17.5%) | 701 (18.2%) |
| 12 to 14 Years | 211 (10.7%) | 190 (11.2%) |
| 15 Years | 65 (10.8%) | 76 (11.4%) |
| 16 and 17 Years | 328 (23.1%) | 278 (20.6%) |
| 18 to 24 Years | 892 (23.3%) | 932 (25.5%) |
| 25 to 34 Years | 736 (10.2%) | 1,097 (16.7%) |
| 35 to 44 Years | 505 (8.0%) | 767 (12.5%) |
| 45 to 54 Years | 389 (5.8%) | 622 (9.2%) |
| 55 to 64 Years | 748 (9.4%) | 786 (9.8%) |
| 65 to 74 Years | 383 (6.1%) | 559 (8.4%) |
| 75 Years and over | 230 (6.4%) | 648 (13.0%) |
| Total | 5,799 (10.8%) | 7,618 (14.1%) |
Income Above Poverty by Sex and Age in Lycoming County
According to the poverty statistics in Lycoming County, males aged 45 to 54 years and females aged 65 to 74 years are the age groups that are most secure financially, with 94.2% of males and 91.6% of females in these age groups living above the poverty line.
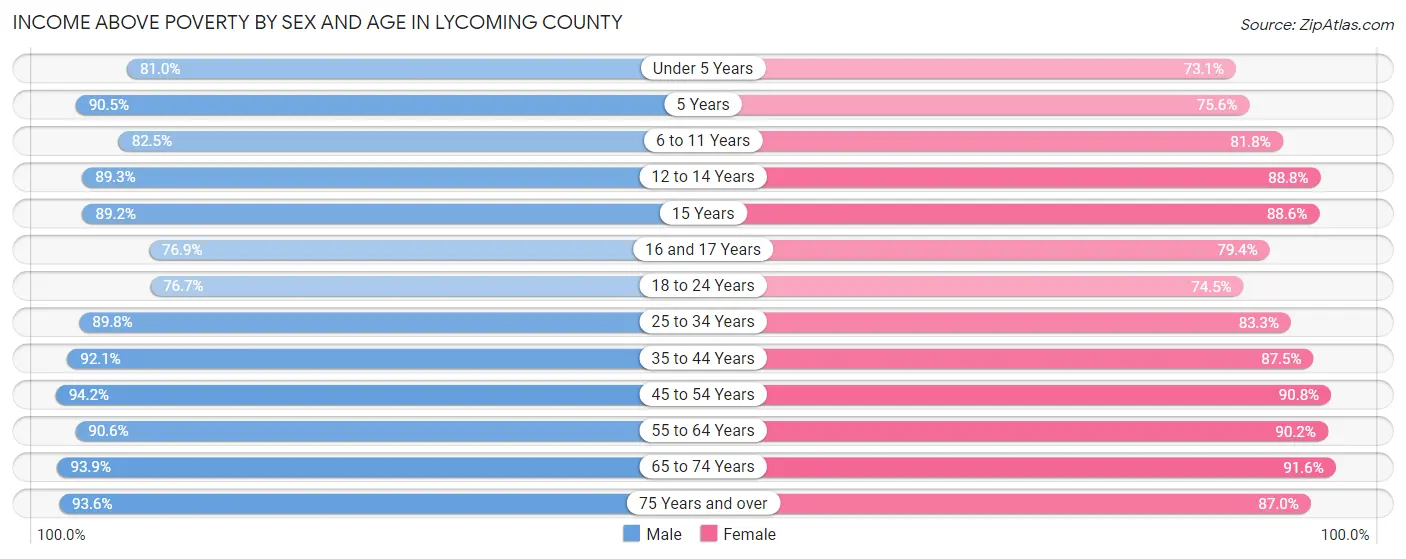
| Age Bracket | Male | Female |
| Under 5 Years | 2,473 (81.0%) | 2,089 (73.1%) |
| 5 Years | 667 (90.5%) | 604 (75.6%) |
| 6 to 11 Years | 3,119 (82.5%) | 3,151 (81.8%) |
| 12 to 14 Years | 1,757 (89.3%) | 1,510 (88.8%) |
| 15 Years | 538 (89.2%) | 590 (88.6%) |
| 16 and 17 Years | 1,092 (76.9%) | 1,071 (79.4%) |
| 18 to 24 Years | 2,933 (76.7%) | 2,728 (74.5%) |
| 25 to 34 Years | 6,498 (89.8%) | 5,485 (83.3%) |
| 35 to 44 Years | 5,850 (92.0%) | 5,374 (87.5%) |
| 45 to 54 Years | 6,343 (94.2%) | 6,122 (90.8%) |
| 55 to 64 Years | 7,195 (90.6%) | 7,213 (90.2%) |
| 65 to 74 Years | 5,879 (93.9%) | 6,121 (91.6%) |
| 75 Years and over | 3,361 (93.6%) | 4,343 (87.0%) |
| Total | 47,705 (89.2%) | 46,401 (85.9%) |
Income Below Poverty Among Married-Couple Families in Lycoming County
The poverty statistics for married-couple families in Lycoming County show that 3.3% or 709 of the total 21,696 families live below the poverty line. Families with 5 or more children have the highest poverty rate of 30.7%, comprising of 62 families. On the other hand, families with no children have the lowest poverty rate of 2.8%, which includes 413 families.
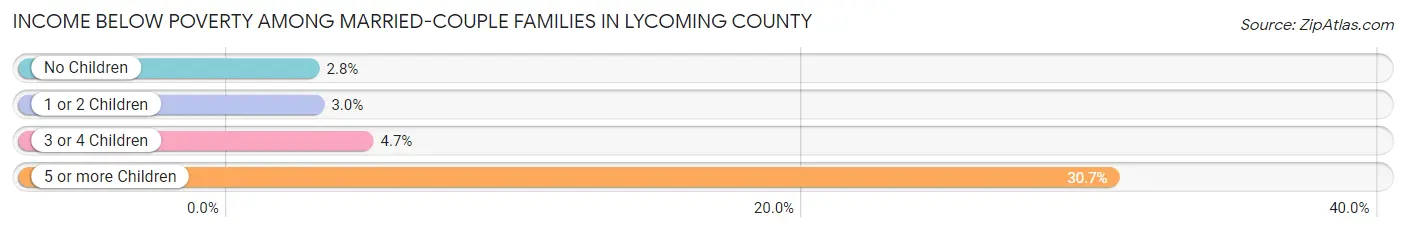
| Children | Above Poverty | Below Poverty |
| No Children | 14,120 (97.2%) | 413 (2.8%) |
| 1 or 2 Children | 5,353 (97.0%) | 166 (3.0%) |
| 3 or 4 Children | 1,374 (95.3%) | 68 (4.7%) |
| 5 or more Children | 140 (69.3%) | 62 (30.7%) |
| Total | 20,987 (96.7%) | 709 (3.3%) |
Income Below Poverty Among Single-Parent Households in Lycoming County
According to the poverty data in Lycoming County, 12.7% or 313 single-father households and 28.2% or 1,361 single-mother households are living below the poverty line. Among single-father households, those with 3 or 4 children have the highest poverty rate, with 54 households (23.4%) experiencing poverty. Likewise, among single-mother households, those with 5 or more children have the highest poverty rate, with 71 households (96.0%) falling below the poverty line.
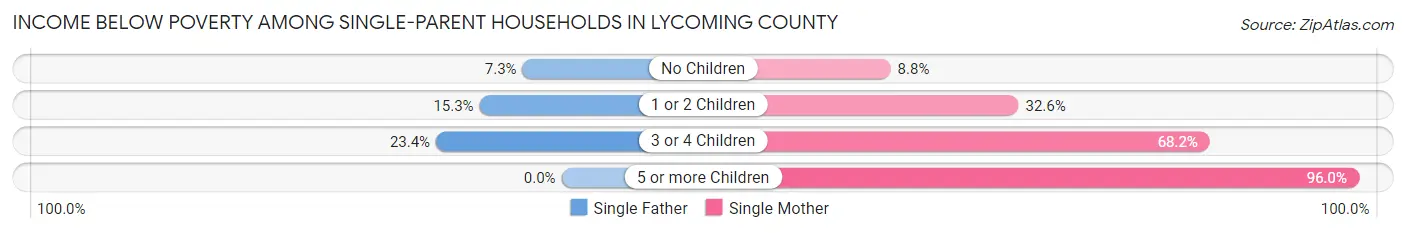
| Children | Single Father | Single Mother |
| No Children | 74 (7.3%) | 146 (8.7%) |
| 1 or 2 Children | 185 (15.3%) | 872 (32.6%) |
| 3 or 4 Children | 54 (23.4%) | 272 (68.2%) |
| 5 or more Children | 0 (0.0%) | 71 (96.0%) |
| Total | 313 (12.7%) | 1,361 (28.2%) |
Income Below Poverty Among Married-Couple vs Single-Parent Households in Lycoming County
The poverty data for Lycoming County shows that 709 of the married-couple family households (3.3%) and 1,674 of the single-parent households (23.0%) are living below the poverty level. Within the married-couple family households, those with 5 or more children have the highest poverty rate, with 62 households (30.7%) falling below the poverty line. Among the single-parent households, those with 5 or more children have the highest poverty rate, with 71 household (96.0%) living below poverty.
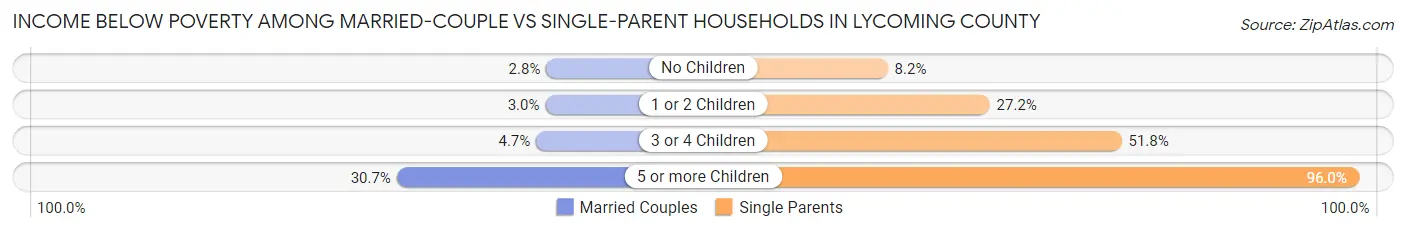
| Children | Married-Couple Families | Single-Parent Households |
| No Children | 413 (2.8%) | 220 (8.2%) |
| 1 or 2 Children | 166 (3.0%) | 1,057 (27.2%) |
| 3 or 4 Children | 68 (4.7%) | 326 (51.7%) |
| 5 or more Children | 62 (30.7%) | 71 (96.0%) |
| Total | 709 (3.3%) | 1,674 (23.0%) |
Race in Lycoming County
The most populous races in Lycoming County are White / Caucasian (102,334 | 89.7%), Black / African American (5,238 | 4.6%), and Two or more Races (4,337 | 3.8%).
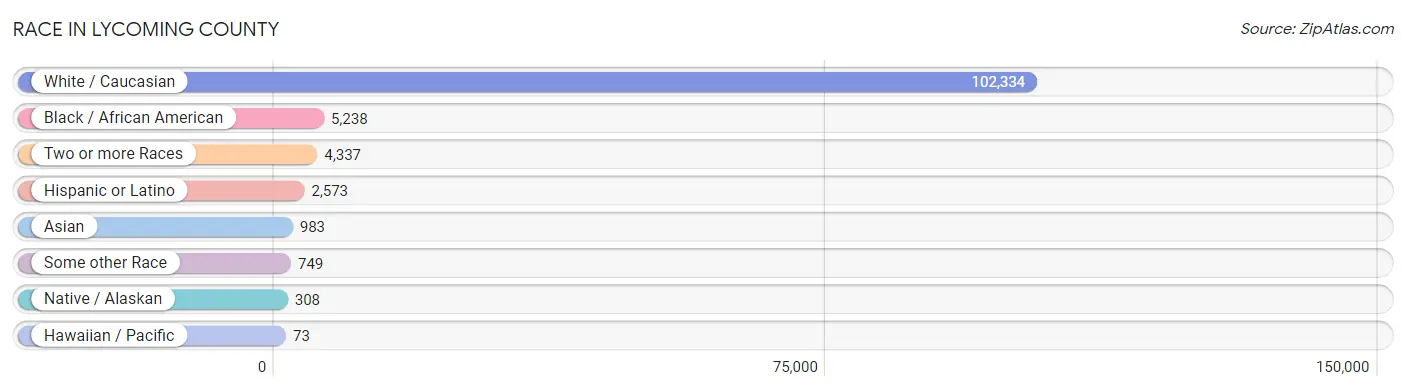
| Race | # Population | % Population |
| Asian | 983 | 0.9% |
| Black / African American | 5,238 | 4.6% |
| Hawaiian / Pacific | 73 | 0.1% |
| Hispanic or Latino | 2,573 | 2.3% |
| Native / Alaskan | 308 | 0.3% |
| White / Caucasian | 102,334 | 89.7% |
| Two or more Races | 4,337 | 3.8% |
| Some other Race | 749 | 0.7% |
| Total | 114,022 | 100.0% |
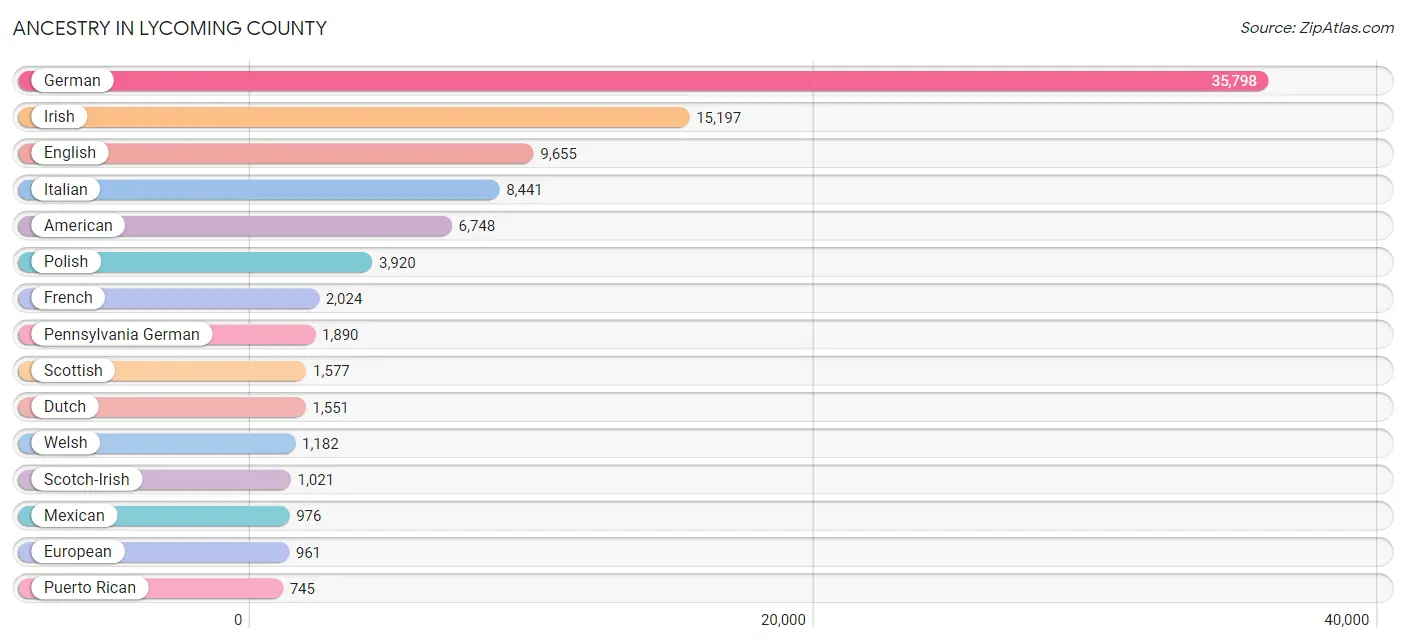
Ancestry in Lycoming County
The most populous ancestries reported in Lycoming County are German (35,798 | 31.4%), Irish (15,197 | 13.3%), English (9,655 | 8.5%), Italian (8,441 | 7.4%), and American (6,748 | 5.9%), together accounting for 66.5% of all Lycoming County residents.
| Ancestry | # Population | % Population |
| African | 82 | 0.1% |
| Alaskan Athabascan | 1 | 0.0% |
| Aleut | 4 | 0.0% |
| American | 6,748 | 5.9% |
| Arab | 146 | 0.1% |
| Argentinean | 56 | 0.1% |
| Armenian | 1 | 0.0% |
| Australian | 6 | 0.0% |
| Austrian | 163 | 0.1% |
| Bahamian | 15 | 0.0% |
| Belgian | 9 | 0.0% |
| Belizean | 67 | 0.1% |
| Bhutanese | 63 | 0.1% |
| Blackfeet | 78 | 0.1% |
| Bolivian | 13 | 0.0% |
| British | 347 | 0.3% |
| British West Indian | 9 | 0.0% |
| Bulgarian | 46 | 0.0% |
| Burmese | 91 | 0.1% |
| Canadian | 107 | 0.1% |
| Central American | 345 | 0.3% |
| Central American Indian | 29 | 0.0% |
| Cherokee | 259 | 0.2% |
| Chilean | 6 | 0.0% |
| Chinese | 1 | 0.0% |
| Chippewa | 30 | 0.0% |
| Colombian | 32 | 0.0% |
| Croatian | 41 | 0.0% |
| Crow | 6 | 0.0% |
| Cuban | 77 | 0.1% |
| Czech | 104 | 0.1% |
| Czechoslovakian | 56 | 0.1% |
| Danish | 101 | 0.1% |
| Delaware | 10 | 0.0% |
| Dominican | 55 | 0.1% |
| Dutch | 1,551 | 1.4% |
| Eastern European | 314 | 0.3% |
| Ecuadorian | 14 | 0.0% |
| Egyptian | 35 | 0.0% |
| English | 9,655 | 8.5% |
| European | 961 | 0.8% |
| Filipino | 1 | 0.0% |
| Finnish | 32 | 0.0% |
| French | 2,024 | 1.8% |
| French Canadian | 237 | 0.2% |
| German | 35,798 | 31.4% |
| Greek | 146 | 0.1% |
| Guamanian / Chamorro | 3 | 0.0% |
| Guatemalan | 32 | 0.0% |
| Haitian | 185 | 0.2% |
| Honduran | 10 | 0.0% |
| Hungarian | 226 | 0.2% |
| Indian (Asian) | 448 | 0.4% |
| Indonesian | 37 | 0.0% |
| Inupiat | 14 | 0.0% |
| Irish | 15,197 | 13.3% |
| Iroquois | 43 | 0.0% |
| Italian | 8,441 | 7.4% |
| Jamaican | 91 | 0.1% |
| Kenyan | 4 | 0.0% |
| Korean | 445 | 0.4% |
| Latvian | 32 | 0.0% |
| Lebanese | 78 | 0.1% |
| Liberian | 28 | 0.0% |
| Lithuanian | 243 | 0.2% |
| Lumbee | 4 | 0.0% |
| Maltese | 3 | 0.0% |
| Mexican | 976 | 0.9% |
| Mexican American Indian | 135 | 0.1% |
| Native Hawaiian | 28 | 0.0% |
| Nigerian | 63 | 0.1% |
| Northern European | 242 | 0.2% |
| Norwegian | 299 | 0.3% |
| Osage | 4 | 0.0% |
| Pakistani | 40 | 0.0% |
| Pennsylvania German | 1,890 | 1.7% |
| Polish | 3,920 | 3.4% |
| Portuguese | 61 | 0.1% |
| Potawatomi | 1 | 0.0% |
| Puerto Rican | 745 | 0.6% |
| Romanian | 104 | 0.1% |
| Russian | 377 | 0.3% |
| Salvadoran | 303 | 0.3% |
| Samoan | 50 | 0.0% |
| Scandinavian | 108 | 0.1% |
| Scotch-Irish | 1,021 | 0.9% |
| Scottish | 1,577 | 1.4% |
| Seminole | 2 | 0.0% |
| Serbian | 24 | 0.0% |
| Shoshone | 38 | 0.0% |
| Sioux | 5 | 0.0% |
| Slavic | 75 | 0.1% |
| Slovak | 340 | 0.3% |
| Slovene | 2 | 0.0% |
| South African | 3 | 0.0% |
| South American | 136 | 0.1% |
| Spaniard | 119 | 0.1% |
| Spanish | 36 | 0.0% |
| Sri Lankan | 170 | 0.2% |
| Subsaharan African | 180 | 0.2% |
| Swedish | 667 | 0.6% |
| Swiss | 685 | 0.6% |
| Syrian | 9 | 0.0% |
| Thai | 40 | 0.0% |
| Trinidadian and Tobagonian | 8 | 0.0% |
| Turkish | 43 | 0.0% |
| Ukrainian | 167 | 0.2% |
| Venezuelan | 15 | 0.0% |
| Welsh | 1,182 | 1.0% |
| West Indian | 94 | 0.1% |
| Yugoslavian | 51 | 0.0% | View All 111 Rows |
Immigrants in Lycoming County
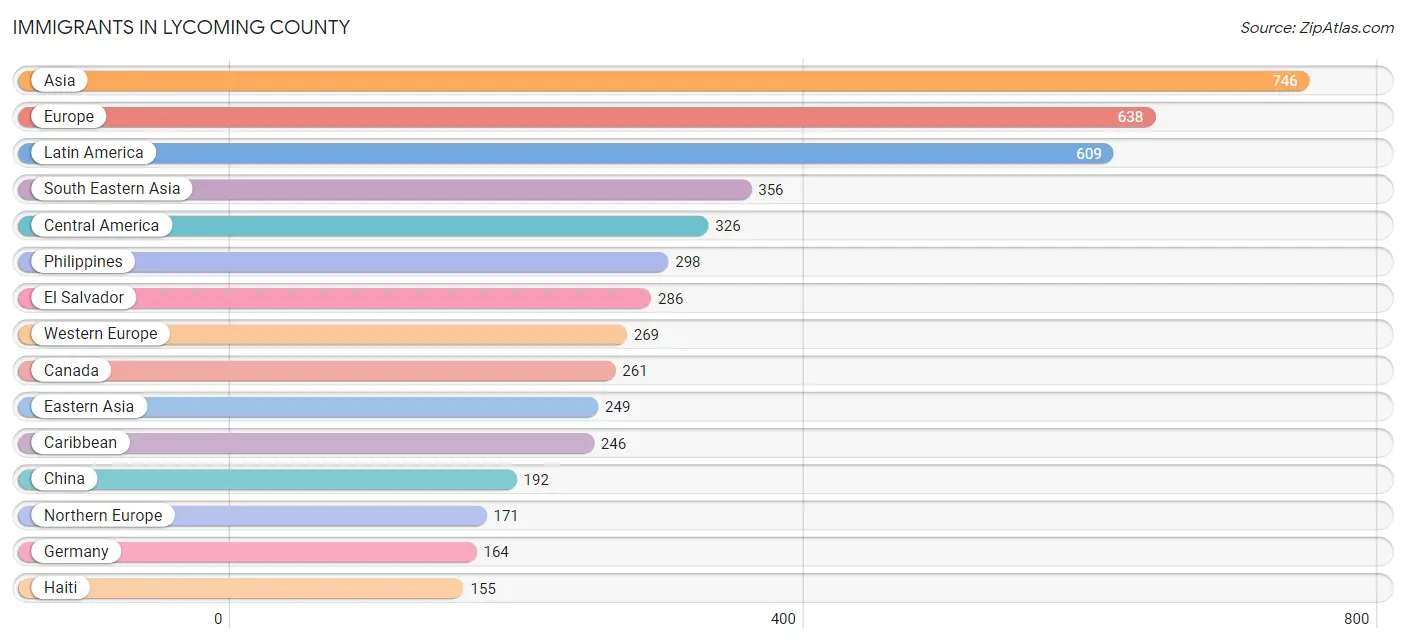
The most numerous immigrant groups reported in Lycoming County came from Asia (746 | 0.6%), Europe (638 | 0.6%), Latin America (609 | 0.5%), South Eastern Asia (356 | 0.3%), and Central America (326 | 0.3%), together accounting for 2.3% of all Lycoming County residents.
| Immigration Origin | # Population | % Population |
| Africa | 66 | 0.1% |
| Argentina | 26 | 0.0% |
| Asia | 746 | 0.6% |
| Bahamas | 15 | 0.0% |
| Belgium | 2 | 0.0% |
| Bolivia | 5 | 0.0% |
| Bosnia and Herzegovina | 9 | 0.0% |
| Bulgaria | 2 | 0.0% |
| Canada | 261 | 0.2% |
| Caribbean | 246 | 0.2% |
| Central America | 326 | 0.3% |
| Chile | 2 | 0.0% |
| China | 192 | 0.2% |
| Colombia | 4 | 0.0% |
| Dominican Republic | 40 | 0.0% |
| Eastern Africa | 10 | 0.0% |
| Eastern Asia | 249 | 0.2% |
| Eastern Europe | 91 | 0.1% |
| Egypt | 19 | 0.0% |
| El Salvador | 286 | 0.3% |
| England | 55 | 0.1% |
| Europe | 638 | 0.6% |
| France | 25 | 0.0% |
| Germany | 164 | 0.1% |
| Guatemala | 27 | 0.0% |
| Haiti | 155 | 0.1% |
| Honduras | 8 | 0.0% |
| Hungary | 7 | 0.0% |
| India | 15 | 0.0% |
| Italy | 104 | 0.1% |
| Jamaica | 12 | 0.0% |
| Japan | 26 | 0.0% |
| Kenya | 4 | 0.0% |
| Korea | 31 | 0.0% |
| Latin America | 609 | 0.5% |
| Liberia | 28 | 0.0% |
| Mexico | 5 | 0.0% |
| Moldova | 35 | 0.0% |
| Netherlands | 61 | 0.1% |
| Nigeria | 6 | 0.0% |
| Northern Africa | 19 | 0.0% |
| Northern Europe | 171 | 0.2% |
| Pakistan | 33 | 0.0% |
| Philippines | 298 | 0.3% |
| Poland | 12 | 0.0% |
| Romania | 3 | 0.0% |
| Russia | 2 | 0.0% |
| Singapore | 6 | 0.0% |
| South Africa | 3 | 0.0% |
| South America | 37 | 0.0% |
| South Central Asia | 51 | 0.0% |
| South Eastern Asia | 356 | 0.3% |
| Southern Europe | 107 | 0.1% |
| Sweden | 12 | 0.0% |
| Switzerland | 17 | 0.0% |
| Syria | 8 | 0.0% |
| Taiwan | 12 | 0.0% |
| Trinidad and Tobago | 24 | 0.0% |
| Turkey | 82 | 0.1% |
| Ukraine | 21 | 0.0% |
| Vietnam | 36 | 0.0% |
| Western Africa | 34 | 0.0% |
| Western Asia | 90 | 0.1% |
| Western Europe | 269 | 0.2% | View All 64 Rows |
Sex and Age in Lycoming County
Sex and Age in Lycoming County
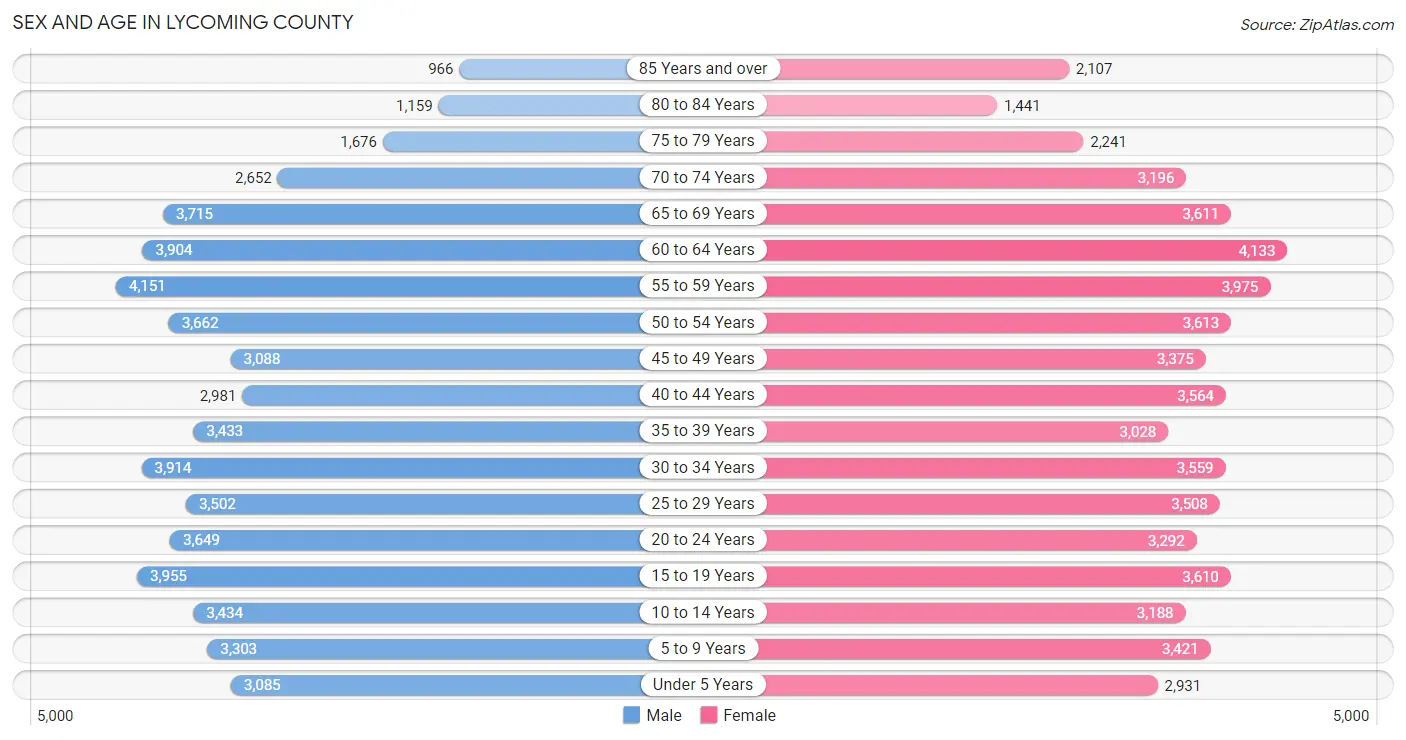
The most populous age groups in Lycoming County are 55 to 59 Years (4,151 | 7.4%) for men and 60 to 64 Years (4,133 | 7.1%) for women.
| Age Bracket | Male | Female |
| Under 5 Years | 3,085 (5.5%) | 2,931 (5.1%) |
| 5 to 9 Years | 3,303 (5.9%) | 3,421 (5.9%) |
| 10 to 14 Years | 3,434 (6.1%) | 3,188 (5.5%) |
| 15 to 19 Years | 3,955 (7.0%) | 3,610 (6.2%) |
| 20 to 24 Years | 3,649 (6.5%) | 3,292 (5.7%) |
| 25 to 29 Years | 3,502 (6.2%) | 3,508 (6.1%) |
| 30 to 34 Years | 3,914 (7.0%) | 3,559 (6.2%) |
| 35 to 39 Years | 3,433 (6.1%) | 3,028 (5.2%) |
| 40 to 44 Years | 2,981 (5.3%) | 3,564 (6.2%) |
| 45 to 49 Years | 3,088 (5.5%) | 3,375 (5.8%) |
| 50 to 54 Years | 3,662 (6.5%) | 3,613 (6.2%) |
| 55 to 59 Years | 4,151 (7.4%) | 3,975 (6.9%) |
| 60 to 64 Years | 3,904 (6.9%) | 4,133 (7.1%) |
| 65 to 69 Years | 3,715 (6.6%) | 3,611 (6.2%) |
| 70 to 74 Years | 2,652 (4.7%) | 3,196 (5.5%) |
| 75 to 79 Years | 1,676 (3.0%) | 2,241 (3.9%) |
| 80 to 84 Years | 1,159 (2.1%) | 1,441 (2.5%) |
| 85 Years and over | 966 (1.7%) | 2,107 (3.6%) |
| Total | 56,229 (100.0%) | 57,793 (100.0%) |
Families and Households in Lycoming County
Median Family Size in Lycoming County
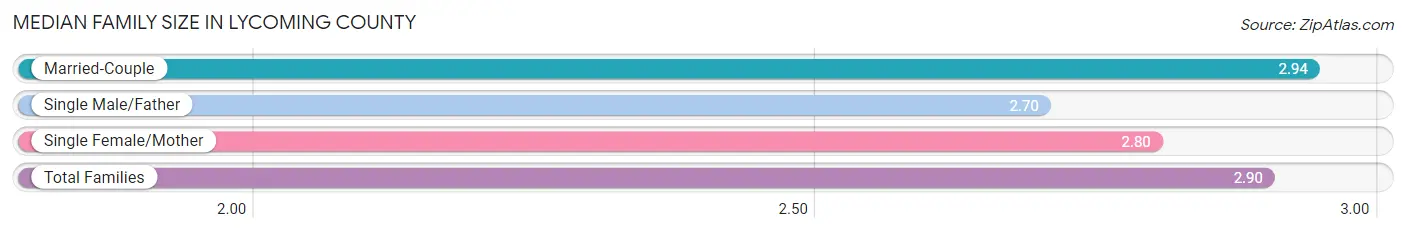
The median family size in Lycoming County is 2.90 persons per family, with married-couple families (21,696 | 74.9%) accounting for the largest median family size of 2.94 persons per family. On the other hand, single male/father families (2,460 | 8.5%) represent the smallest median family size with 2.70 persons per family.
| Family Type | # Families | Family Size |
| Married-Couple | 21,696 (74.9%) | 2.94 |
| Single Male/Father | 2,460 (8.5%) | 2.70 |
| Single Female/Mother | 4,818 (16.6%) | 2.80 |
| Total Families | 28,974 (100.0%) | 2.90 |
Median Household Size in Lycoming County
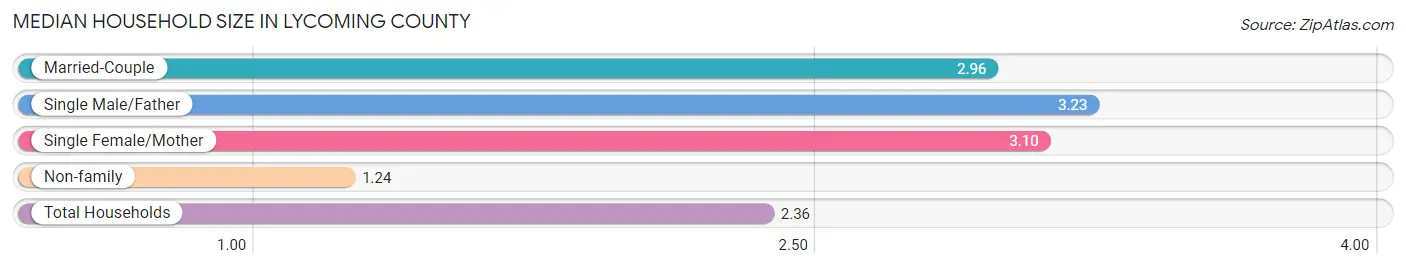
The median household size in Lycoming County is 2.36 persons per household, with single male/father households (2,460 | 5.4%) accounting for the largest median household size of 3.23 persons per household. non-family households (16,731 | 36.6%) represent the smallest median household size with 1.24 persons per household.
| Household Type | # Households | Household Size |
| Married-Couple | 21,696 (47.5%) | 2.96 |
| Single Male/Father | 2,460 (5.4%) | 3.23 |
| Single Female/Mother | 4,818 (10.5%) | 3.10 |
| Non-family | 16,731 (36.6%) | 1.24 |
| Total Households | 45,705 (100.0%) | 2.36 |
Household Size by Marriage Status in Lycoming County
Out of a total of 45,705 households in Lycoming County, 28,974 (63.4%) are family households, while 16,731 (36.6%) are nonfamily households. The most numerous type of family households are 2-person households, comprising 14,599, and the most common type of nonfamily households are 1-person households, comprising 13,681.
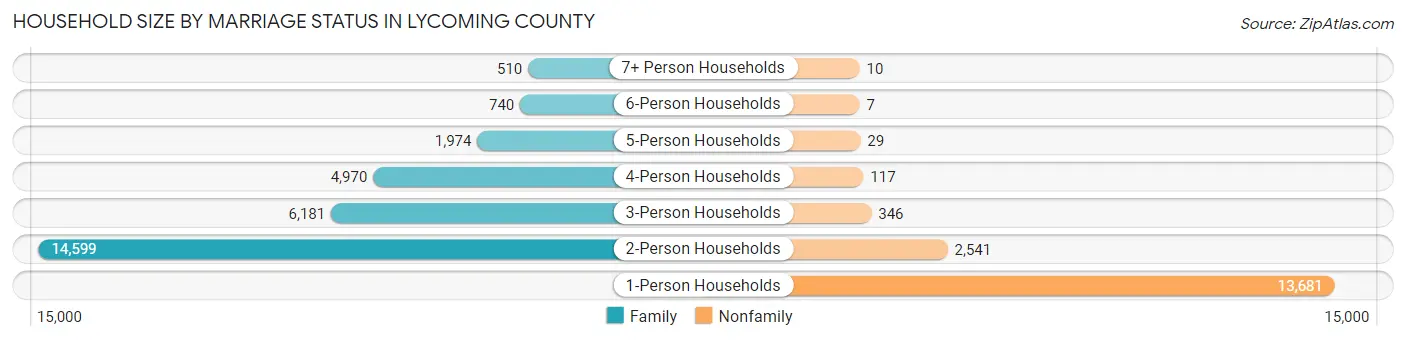
| Household Size | Family Households | Nonfamily Households |
| 1-Person Households | - | 13,681 (29.9%) |
| 2-Person Households | 14,599 (31.9%) | 2,541 (5.6%) |
| 3-Person Households | 6,181 (13.5%) | 346 (0.8%) |
| 4-Person Households | 4,970 (10.9%) | 117 (0.3%) |
| 5-Person Households | 1,974 (4.3%) | 29 (0.1%) |
| 6-Person Households | 740 (1.6%) | 7 (0.0%) |
| 7+ Person Households | 510 (1.1%) | 10 (0.0%) |
| Total | 28,974 (63.4%) | 16,731 (36.6%) |
Female Fertility in Lycoming County
Fertility by Age in Lycoming County
Average fertility rate in Lycoming County is 46.0 births per 1,000 women. Women in the age bracket of 20 to 34 years have the highest fertility rate with 80.0 births per 1,000 women. Women in the age bracket of 20 to 34 years acount for 72.7% of all women with births.
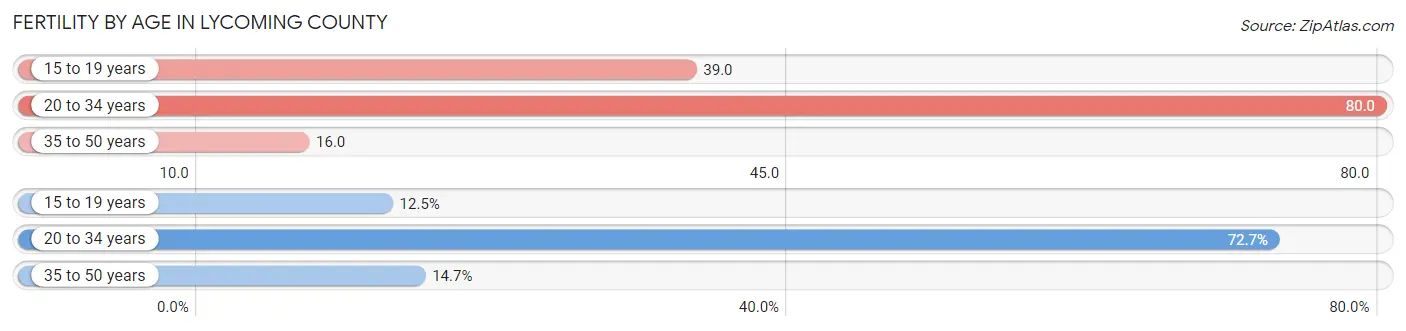
| Age Bracket | Women with Births | Births / 1,000 Women |
| 15 to 19 years | 142 (12.5%) | 39.0 |
| 20 to 34 years | 824 (72.7%) | 80.0 |
| 35 to 50 years | 167 (14.7%) | 16.0 |
| Total | 1,133 (100.0%) | 46.0 |
Fertility by Age by Marriage Status in Lycoming County
59.8% of women with births (1,133) in Lycoming County are married. The highest percentage of unmarried women with births falls into 15 to 19 years age bracket with 93.7% of them unmarried at the time of birth, while the lowest percentage of unmarried women with births belong to 35 to 50 years age bracket with 9.0% of them unmarried.
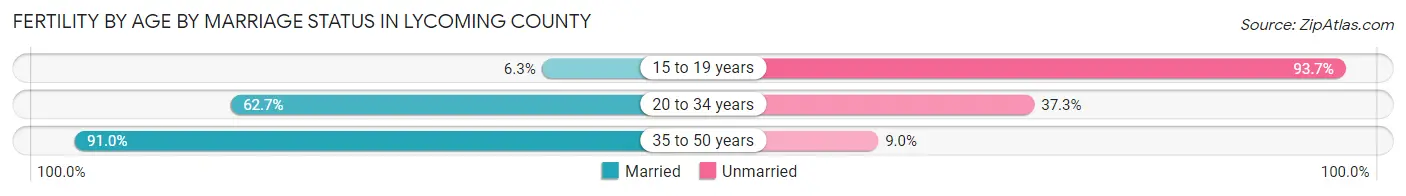
| Age Bracket | Married | Unmarried |
| 15 to 19 years | 9 (6.3%) | 133 (93.7%) |
| 20 to 34 years | 517 (62.7%) | 307 (37.3%) |
| 35 to 50 years | 152 (91.0%) | 15 (9.0%) |
| Total | 678 (59.8%) | 455 (40.2%) |
Fertility by Education in Lycoming County
Average fertility rate in Lycoming County is 46.0 births per 1,000 women. Women with the education attainment of high school diploma have the highest fertility rate of 56.0 births per 1,000 women, while women with the education attainment of graduate degree have the lowest fertility at 27.0 births per 1,000 women. Women with the education attainment of high school diploma represent 34.9% of all women with births.
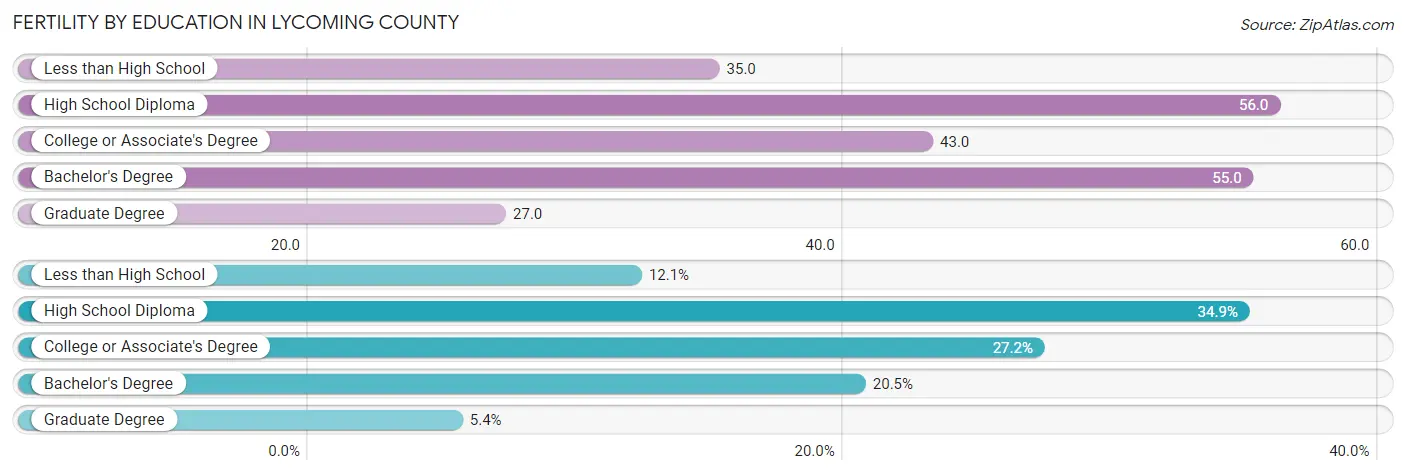
| Educational Attainment | Women with Births | Births / 1,000 Women |
| Less than High School | 137 (12.1%) | 35.0 |
| High School Diploma | 395 (34.9%) | 56.0 |
| College or Associate's Degree | 308 (27.2%) | 43.0 |
| Bachelor's Degree | 232 (20.5%) | 55.0 |
| Graduate Degree | 61 (5.4%) | 27.0 |
| Total | 1,133 (100.0%) | 46.0 |
Fertility by Education by Marriage Status in Lycoming County
40.2% of women with births in Lycoming County are unmarried. Women with the educational attainment of bachelor's degree are most likely to be married with 94.8% of them married at childbirth, while women with the educational attainment of high school diploma are least likely to be married with 75.7% of them unmarried at childbirth.
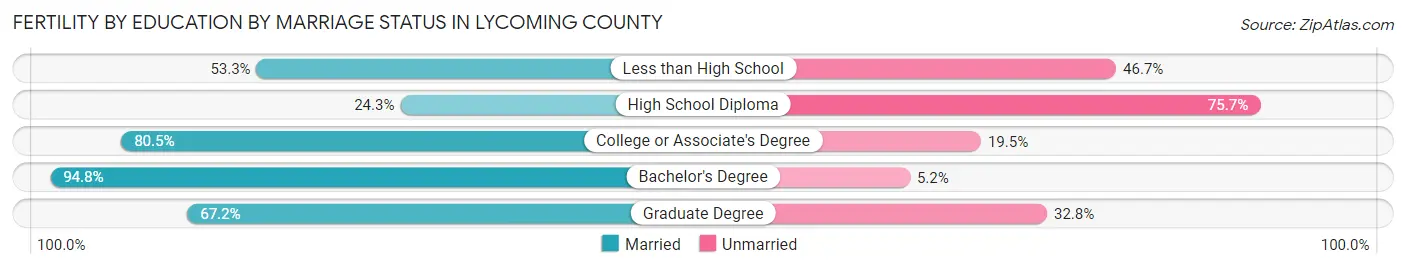
| Educational Attainment | Married | Unmarried |
| Less than High School | 73 (53.3%) | 64 (46.7%) |
| High School Diploma | 96 (24.3%) | 299 (75.7%) |
| College or Associate's Degree | 248 (80.5%) | 60 (19.5%) |
| Bachelor's Degree | 220 (94.8%) | 12 (5.2%) |
| Graduate Degree | 41 (67.2%) | 20 (32.8%) |
| Total | 678 (59.8%) | 455 (40.2%) |
Employment Characteristics in Lycoming County
Employment by Class of Employer in Lycoming County
Among the 51,688 employed individuals in Lycoming County, private company employees (35,037 | 67.8%), not-for-profit organizations (6,314 | 12.2%), and local government employees (2,849 | 5.5%) make up the most common classes of employment.
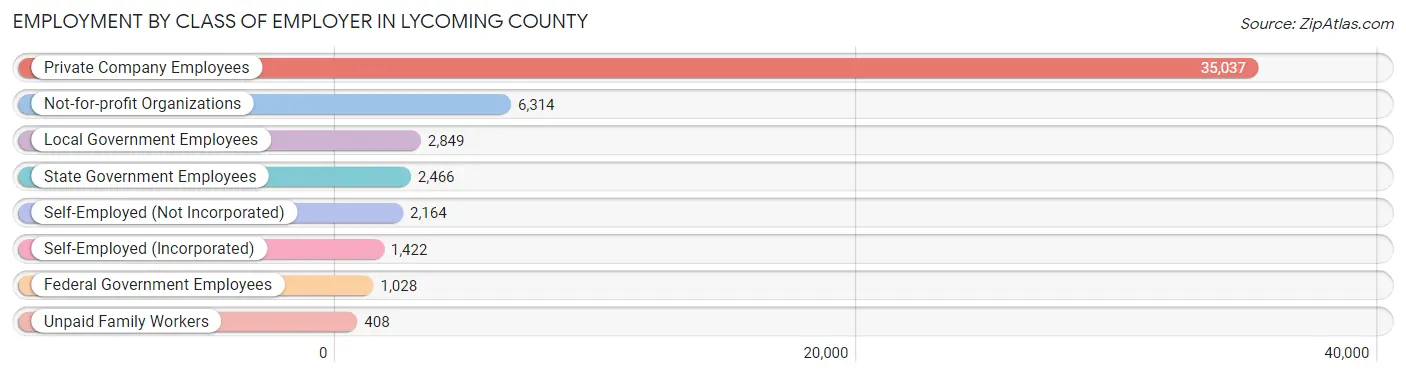
| Employer Class | # Employees | % Employees |
| Private Company Employees | 35,037 | 67.8% |
| Self-Employed (Incorporated) | 1,422 | 2.8% |
| Self-Employed (Not Incorporated) | 2,164 | 4.2% |
| Not-for-profit Organizations | 6,314 | 12.2% |
| Local Government Employees | 2,849 | 5.5% |
| State Government Employees | 2,466 | 4.8% |
| Federal Government Employees | 1,028 | 2.0% |
| Unpaid Family Workers | 408 | 0.8% |
| Total | 51,688 | 100.0% |
Employment Status by Age in Lycoming County
According to the labor force statistics for Lycoming County, out of the total population over 16 years of age (93,391), 59.4% or 55,474 individuals are in the labor force, with 5.3% or 2,940 of them unemployed. The age group with the highest labor force participation rate is 25 to 29 years, with 83.9% or 5,881 individuals in the labor force. Within the labor force, the 16 to 19 years age range has the highest percentage of unemployed individuals, with 18.2% or 394 of them being unemployed.
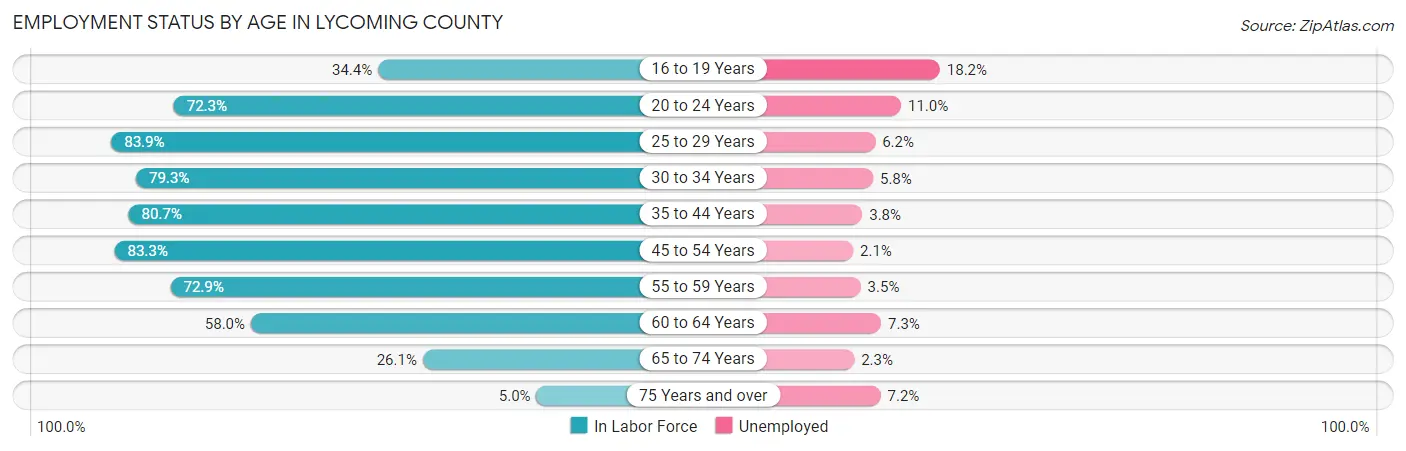
| Age Bracket | In Labor Force | Unemployed |
| 16 to 19 Years | 2,166 (34.4%) | 394 (18.2%) |
| 20 to 24 Years | 5,018 (72.3%) | 552 (11.0%) |
| 25 to 29 Years | 5,881 (83.9%) | 365 (6.2%) |
| 30 to 34 Years | 5,926 (79.3%) | 344 (5.8%) |
| 35 to 44 Years | 10,496 (80.7%) | 399 (3.8%) |
| 45 to 54 Years | 11,444 (83.3%) | 240 (2.1%) |
| 55 to 59 Years | 5,924 (72.9%) | 207 (3.5%) |
| 60 to 64 Years | 4,661 (58.0%) | 340 (7.3%) |
| 65 to 74 Years | 3,438 (26.1%) | 79 (2.3%) |
| 75 Years and over | 480 (5.0%) | 35 (7.2%) |
| Total | 55,474 (59.4%) | 2,940 (5.3%) |
Employment Status by Educational Attainment in Lycoming County
According to labor force statistics for Lycoming County, 77.2% of individuals (44,305) out of the total population between 25 and 64 years of age (57,390) are in the labor force, with 4.3% or 1,905 of them being unemployed. The group with the highest labor force participation rate are those with the educational attainment of bachelor's degree or higher, with 88.0% or 13,077 individuals in the labor force. Within the labor force, individuals with less than high school education have the highest percentage of unemployment, with 7.3% or 209 of them being unemployed.
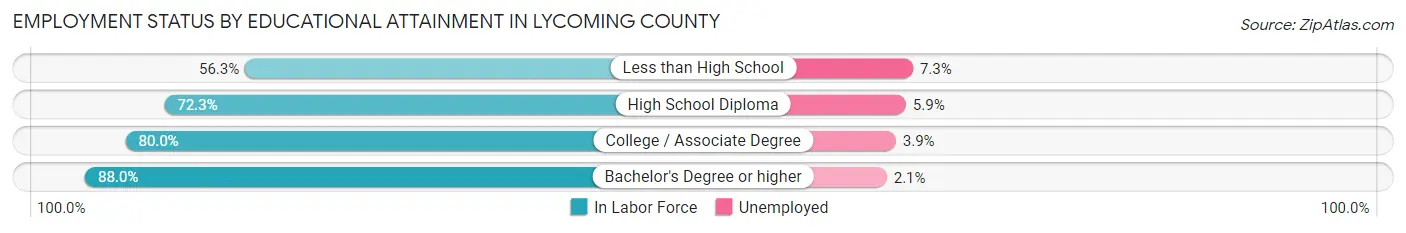
| Educational Attainment | In Labor Force | Unemployed |
| Less than High School | 2,859 (56.3%) | 371 (7.3%) |
| High School Diploma | 14,741 (72.3%) | 1,203 (5.9%) |
| College / Associate Degree | 13,650 (80.0%) | 665 (3.9%) |
| Bachelor's Degree or higher | 13,077 (88.0%) | 312 (2.1%) |
| Total | 44,305 (77.2%) | 2,468 (4.3%) |
Employment Occupations by Sex in Lycoming County
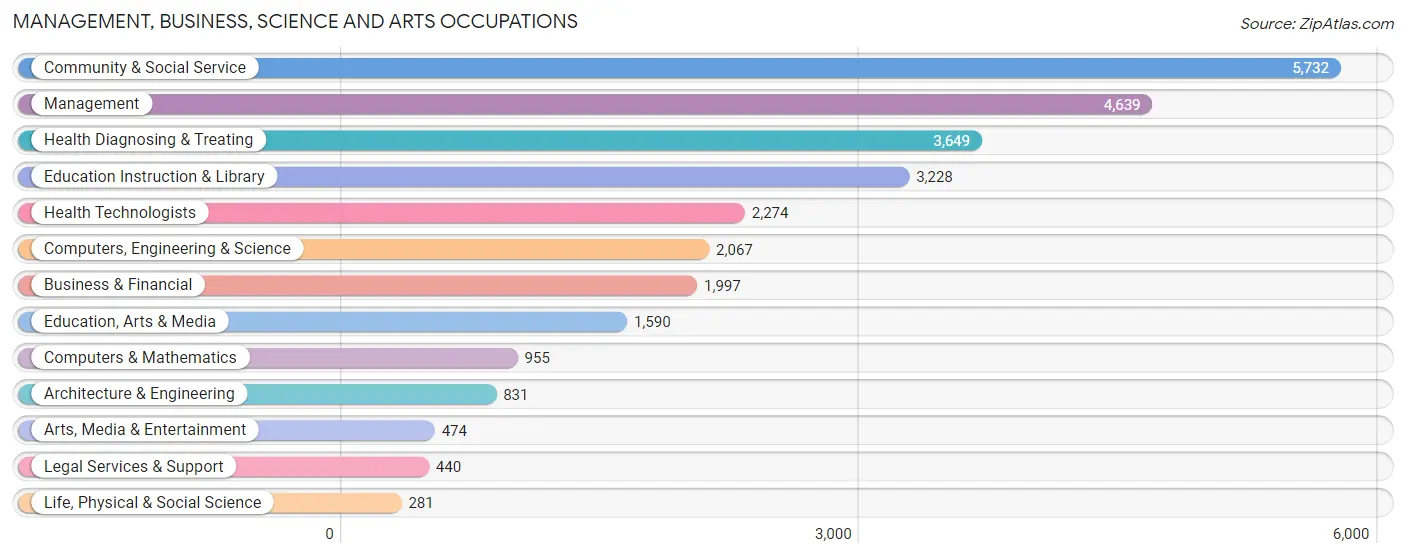
Management, Business, Science and Arts Occupations
The most common Management, Business, Science and Arts occupations in Lycoming County are Community & Social Service (5,732 | 10.9%), Management (4,639 | 8.8%), Health Diagnosing & Treating (3,649 | 7.0%), Education Instruction & Library (3,228 | 6.2%), and Health Technologists (2,274 | 4.3%).
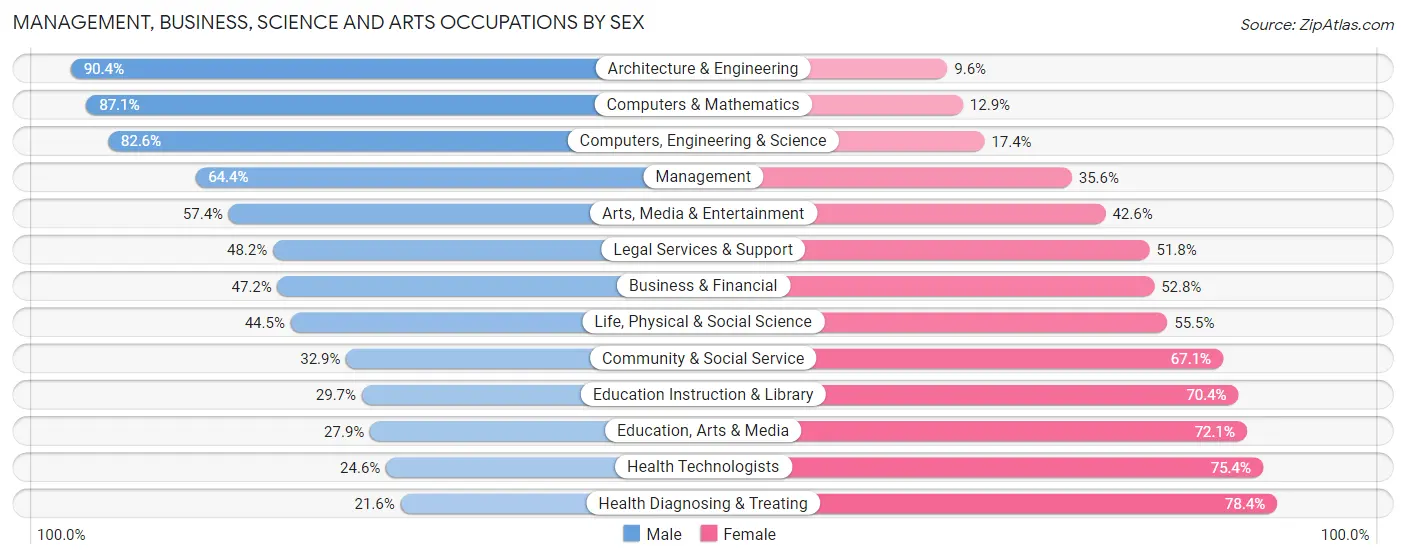
Management, Business, Science and Arts Occupations by Sex
Within the Management, Business, Science and Arts occupations in Lycoming County, the most male-oriented occupations are Architecture & Engineering (90.4%), Computers & Mathematics (87.1%), and Computers, Engineering & Science (82.6%), while the most female-oriented occupations are Health Diagnosing & Treating (78.4%), Health Technologists (75.4%), and Education, Arts & Media (72.1%).
| Occupation | Male | Female |
| Management | 2,988 (64.4%) | 1,651 (35.6%) |
| Business & Financial | 943 (47.2%) | 1,054 (52.8%) |
| Computers, Engineering & Science | 1,708 (82.6%) | 359 (17.4%) |
| Computers & Mathematics | 832 (87.1%) | 123 (12.9%) |
| Architecture & Engineering | 751 (90.4%) | 80 (9.6%) |
| Life, Physical & Social Science | 125 (44.5%) | 156 (55.5%) |
| Community & Social Service | 1,885 (32.9%) | 3,847 (67.1%) |
| Education, Arts & Media | 444 (27.9%) | 1,146 (72.1%) |
| Legal Services & Support | 212 (48.2%) | 228 (51.8%) |
| Education Instruction & Library | 957 (29.6%) | 2,271 (70.4%) |
| Arts, Media & Entertainment | 272 (57.4%) | 202 (42.6%) |
| Health Diagnosing & Treating | 787 (21.6%) | 2,862 (78.4%) |
| Health Technologists | 559 (24.6%) | 1,715 (75.4%) |
| Total (Category) | 8,311 (46.0%) | 9,773 (54.0%) |
| Total (Overall) | 27,627 (52.7%) | 24,802 (47.3%) |
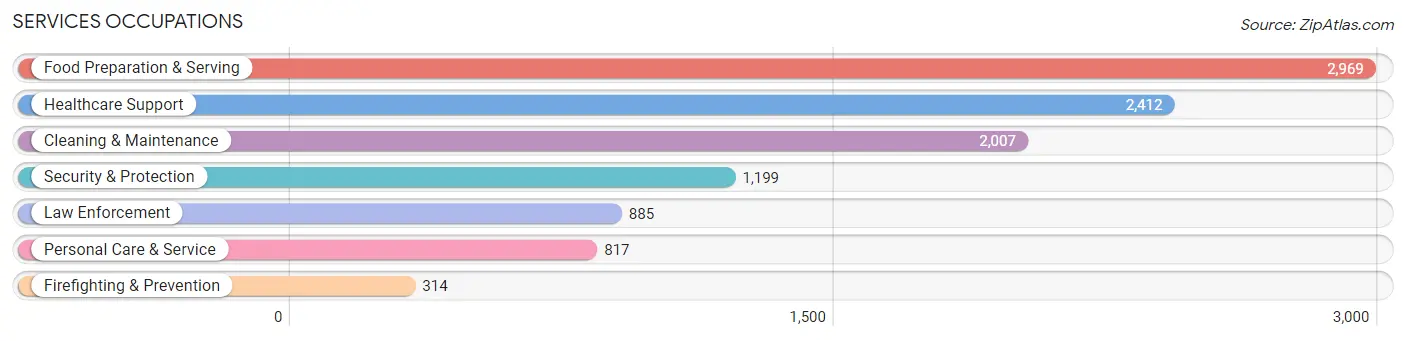
Services Occupations
The most common Services occupations in Lycoming County are Food Preparation & Serving (2,969 | 5.7%), Healthcare Support (2,412 | 4.6%), Cleaning & Maintenance (2,007 | 3.8%), Security & Protection (1,199 | 2.3%), and Law Enforcement (885 | 1.7%).
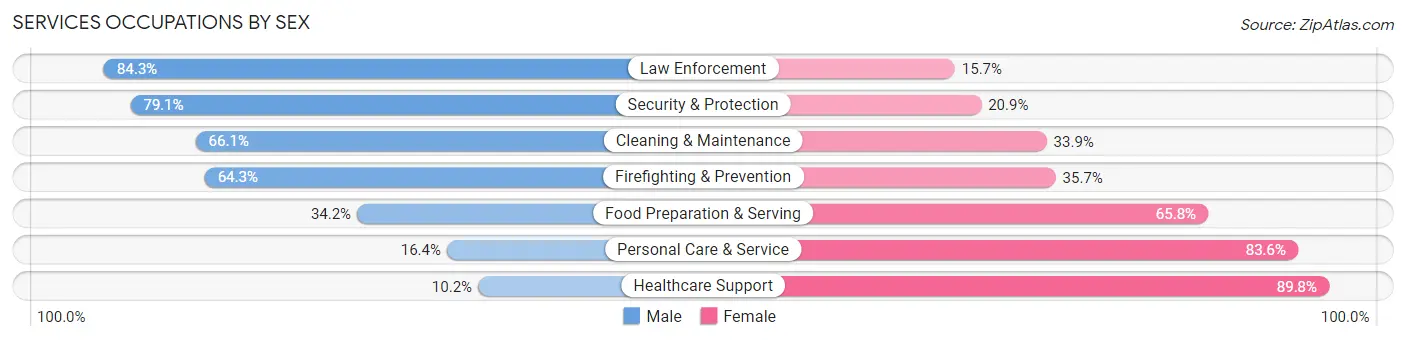
Services Occupations by Sex
Within the Services occupations in Lycoming County, the most male-oriented occupations are Law Enforcement (84.3%), Security & Protection (79.1%), and Cleaning & Maintenance (66.1%), while the most female-oriented occupations are Healthcare Support (89.8%), Personal Care & Service (83.6%), and Food Preparation & Serving (65.8%).
| Occupation | Male | Female |
| Healthcare Support | 247 (10.2%) | 2,165 (89.8%) |
| Security & Protection | 948 (79.1%) | 251 (20.9%) |
| Firefighting & Prevention | 202 (64.3%) | 112 (35.7%) |
| Law Enforcement | 746 (84.3%) | 139 (15.7%) |
| Food Preparation & Serving | 1,015 (34.2%) | 1,954 (65.8%) |
| Cleaning & Maintenance | 1,327 (66.1%) | 680 (33.9%) |
| Personal Care & Service | 134 (16.4%) | 683 (83.6%) |
| Total (Category) | 3,671 (39.0%) | 5,733 (61.0%) |
| Total (Overall) | 27,627 (52.7%) | 24,802 (47.3%) |
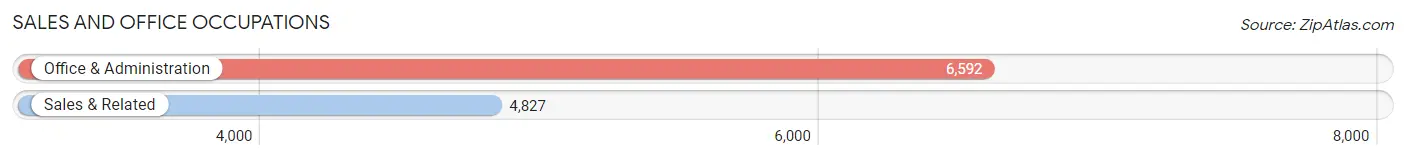
Sales and Office Occupations
The most common Sales and Office occupations in Lycoming County are Office & Administration (6,592 | 12.6%), and Sales & Related (4,827 | 9.2%).
Sales and Office Occupations by Sex
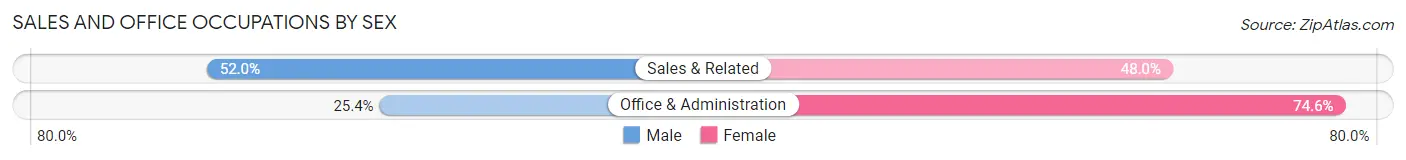
| Occupation | Male | Female |
| Sales & Related | 2,508 (52.0%) | 2,319 (48.0%) |
| Office & Administration | 1,675 (25.4%) | 4,917 (74.6%) |
| Total (Category) | 4,183 (36.6%) | 7,236 (63.4%) |
| Total (Overall) | 27,627 (52.7%) | 24,802 (47.3%) |
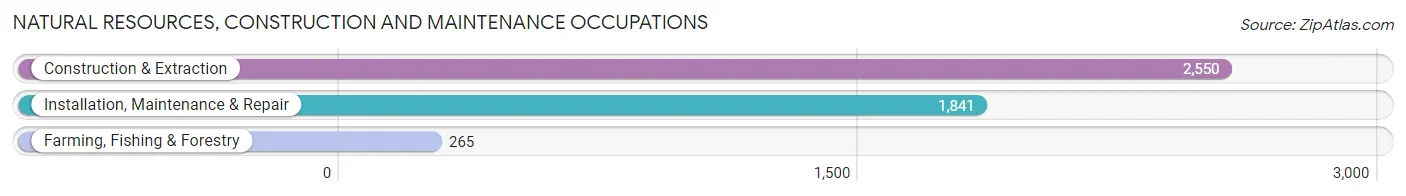
Natural Resources, Construction and Maintenance Occupations
The most common Natural Resources, Construction and Maintenance occupations in Lycoming County are Construction & Extraction (2,550 | 4.9%), Installation, Maintenance & Repair (1,841 | 3.5%), and Farming, Fishing & Forestry (265 | 0.5%).
Natural Resources, Construction and Maintenance Occupations by Sex
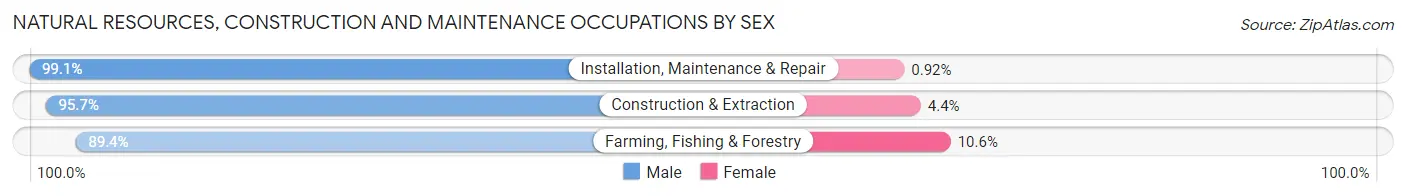
| Occupation | Male | Female |
| Farming, Fishing & Forestry | 237 (89.4%) | 28 (10.6%) |
| Construction & Extraction | 2,439 (95.7%) | 111 (4.3%) |
| Installation, Maintenance & Repair | 1,824 (99.1%) | 17 (0.9%) |
| Total (Category) | 4,500 (96.7%) | 156 (3.4%) |
| Total (Overall) | 27,627 (52.7%) | 24,802 (47.3%) |
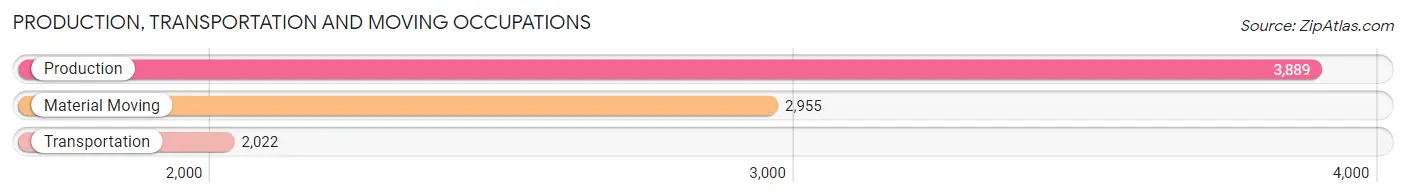
Production, Transportation and Moving Occupations
The most common Production, Transportation and Moving occupations in Lycoming County are Production (3,889 | 7.4%), Material Moving (2,955 | 5.6%), and Transportation (2,022 | 3.9%).
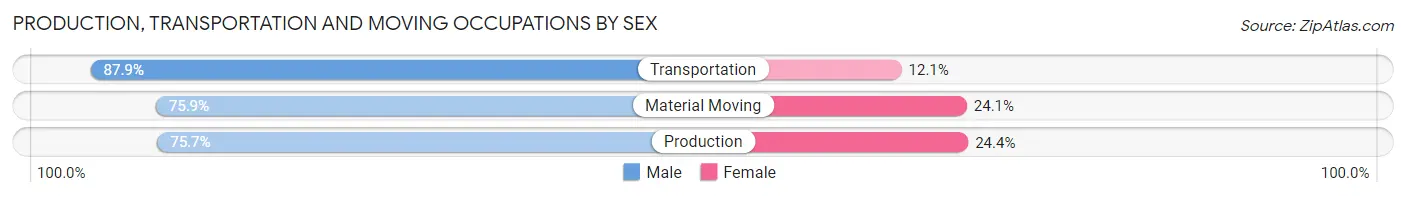
Production, Transportation and Moving Occupations by Sex
| Occupation | Male | Female |
| Production | 2,942 (75.6%) | 947 (24.3%) |
| Transportation | 1,777 (87.9%) | 245 (12.1%) |
| Material Moving | 2,243 (75.9%) | 712 (24.1%) |
| Total (Category) | 6,962 (78.5%) | 1,904 (21.5%) |
| Total (Overall) | 27,627 (52.7%) | 24,802 (47.3%) |
Employment Industries by Sex in Lycoming County
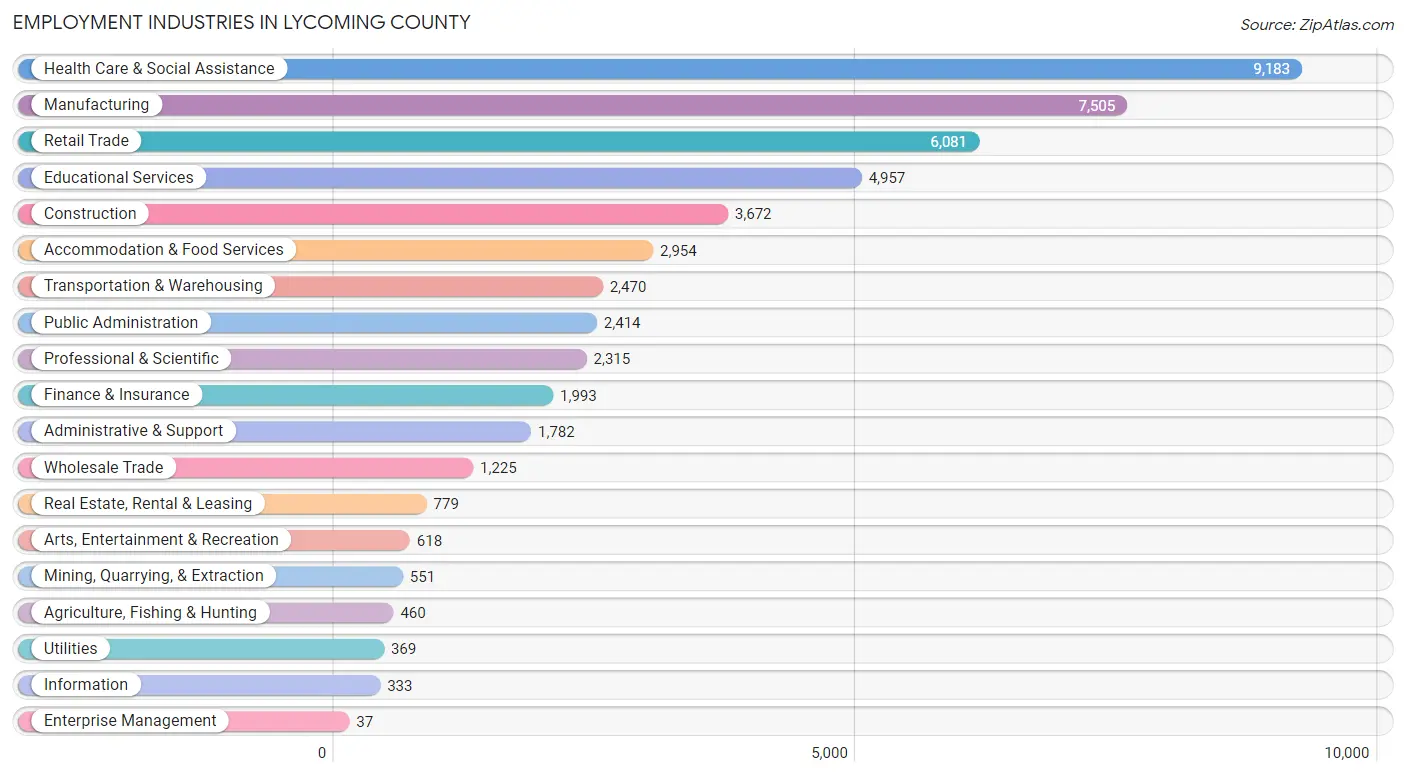
Employment Industries in Lycoming County
The major employment industries in Lycoming County include Health Care & Social Assistance (9,183 | 17.5%), Manufacturing (7,505 | 14.3%), Retail Trade (6,081 | 11.6%), Educational Services (4,957 | 9.5%), and Construction (3,672 | 7.0%).
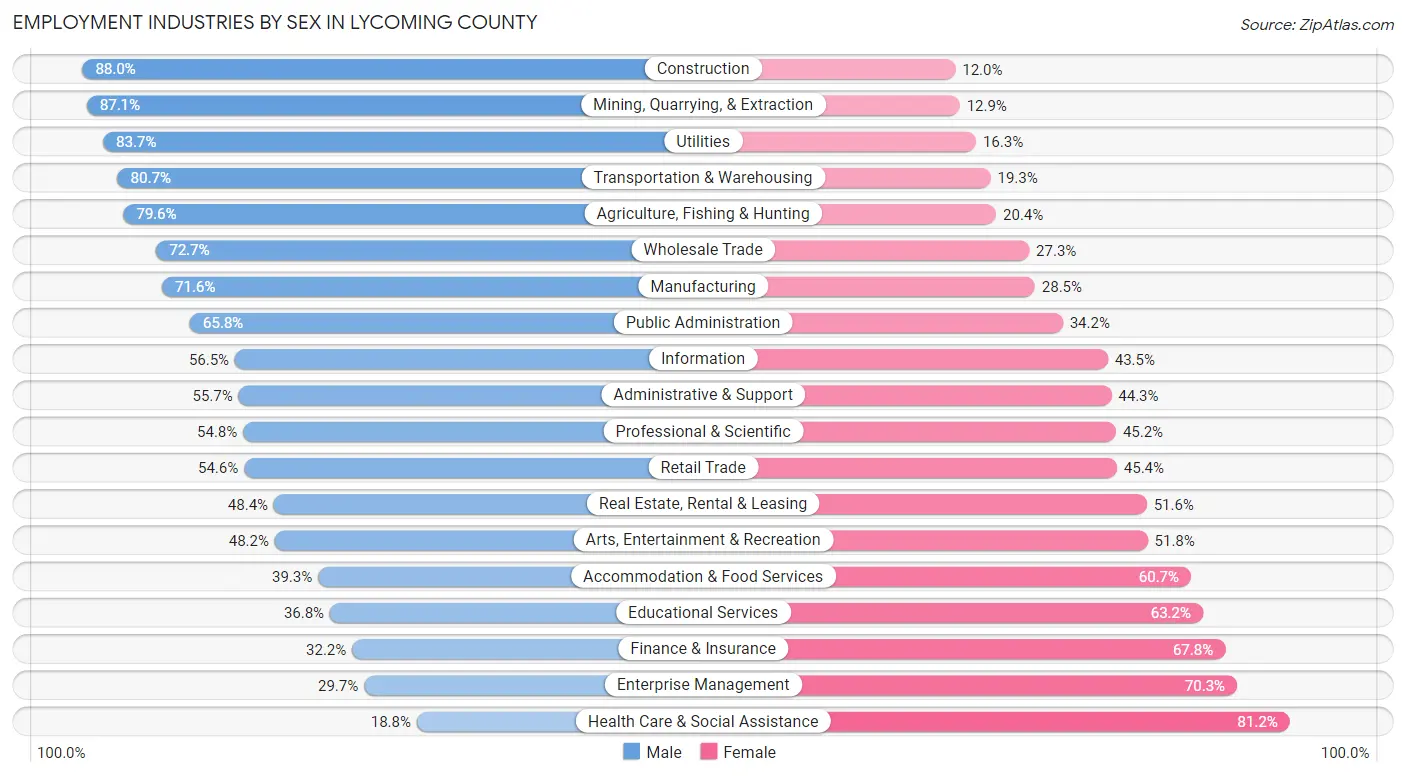
Employment Industries by Sex in Lycoming County
The Lycoming County industries that see more men than women are Construction (88.0%), Mining, Quarrying, & Extraction (87.1%), and Utilities (83.7%), whereas the industries that tend to have a higher number of women are Health Care & Social Assistance (81.2%), Enterprise Management (70.3%), and Finance & Insurance (67.8%).
| Industry | Male | Female |
| Agriculture, Fishing & Hunting | 366 (79.6%) | 94 (20.4%) |
| Mining, Quarrying, & Extraction | 480 (87.1%) | 71 (12.9%) |
| Construction | 3,232 (88.0%) | 440 (12.0%) |
| Manufacturing | 5,370 (71.6%) | 2,135 (28.4%) |
| Wholesale Trade | 891 (72.7%) | 334 (27.3%) |
| Retail Trade | 3,319 (54.6%) | 2,762 (45.4%) |
| Transportation & Warehousing | 1,994 (80.7%) | 476 (19.3%) |
| Utilities | 309 (83.7%) | 60 (16.3%) |
| Information | 188 (56.5%) | 145 (43.5%) |
| Finance & Insurance | 642 (32.2%) | 1,351 (67.8%) |
| Real Estate, Rental & Leasing | 377 (48.4%) | 402 (51.6%) |
| Professional & Scientific | 1,268 (54.8%) | 1,047 (45.2%) |
| Enterprise Management | 11 (29.7%) | 26 (70.3%) |
| Administrative & Support | 993 (55.7%) | 789 (44.3%) |
| Educational Services | 1,824 (36.8%) | 3,133 (63.2%) |
| Health Care & Social Assistance | 1,728 (18.8%) | 7,455 (81.2%) |
| Arts, Entertainment & Recreation | 298 (48.2%) | 320 (51.8%) |
| Accommodation & Food Services | 1,160 (39.3%) | 1,794 (60.7%) |
| Public Administration | 1,588 (65.8%) | 826 (34.2%) |
| Total | 27,627 (52.7%) | 24,802 (47.3%) |
Education in Lycoming County
School Enrollment in Lycoming County
The most common levels of schooling among the 25,011 students in Lycoming County are college / undergraduate (6,294 | 25.2%), high school (5,047 | 20.2%), and middle school (5,045 | 20.2%).
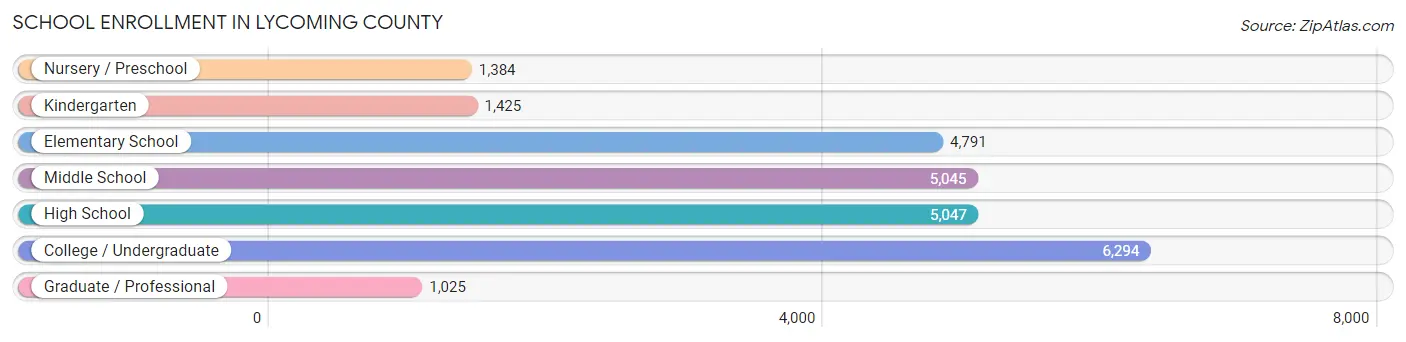
| School Level | # Students | % Students |
| Nursery / Preschool | 1,384 | 5.5% |
| Kindergarten | 1,425 | 5.7% |
| Elementary School | 4,791 | 19.2% |
| Middle School | 5,045 | 20.2% |
| High School | 5,047 | 20.2% |
| College / Undergraduate | 6,294 | 25.2% |
| Graduate / Professional | 1,025 | 4.1% |
| Total | 25,011 | 100.0% |
School Enrollment by Age by Funding Source in Lycoming County
Out of a total of 25,011 students who are enrolled in schools in Lycoming County, 4,627 (18.5%) attend a private institution, while the remaining 20,384 (81.5%) are enrolled in public schools. The age group of 3 to 4 year olds has the highest likelihood of being enrolled in private schools, with 440 (48.7% in the age bracket) enrolled. Conversely, the age group of 15 to 17 year olds has the lowest likelihood of being enrolled in a private school, with 3,607 (95.0% in the age bracket) attending a public institution.
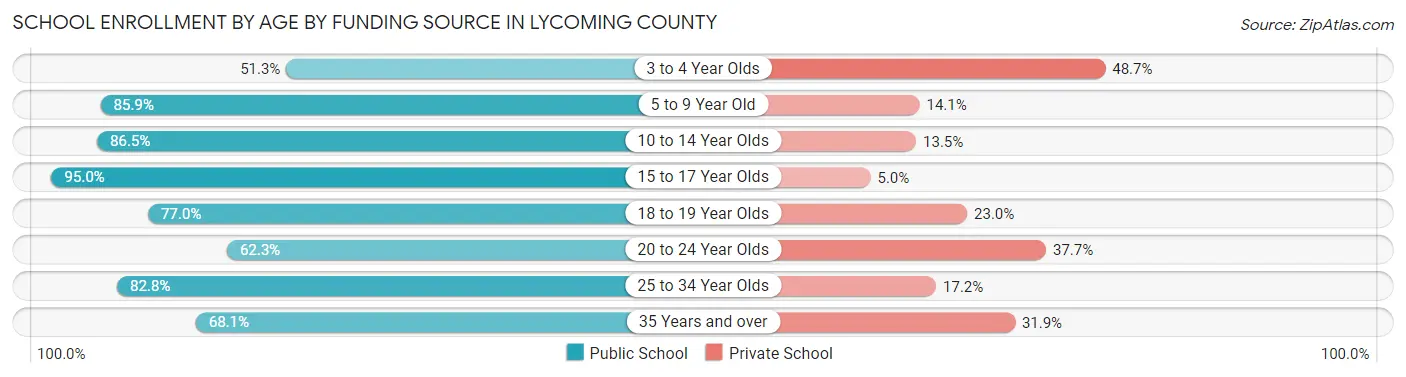
| Age Bracket | Public School | Private School |
| 3 to 4 Year Olds | 463 (51.3%) | 440 (48.7%) |
| 5 to 9 Year Old | 5,169 (85.9%) | 851 (14.1%) |
| 10 to 14 Year Olds | 5,443 (86.5%) | 849 (13.5%) |
| 15 to 17 Year Olds | 3,607 (95.0%) | 190 (5.0%) |
| 18 to 19 Year Olds | 2,100 (77.0%) | 627 (23.0%) |
| 20 to 24 Year Olds | 1,854 (62.3%) | 1,122 (37.7%) |
| 25 to 34 Year Olds | 995 (82.8%) | 207 (17.2%) |
| 35 Years and over | 745 (68.1%) | 349 (31.9%) |
| Total | 20,384 (81.5%) | 4,627 (18.5%) |
Educational Attainment by Field of Study in Lycoming County
Education (3,971 | 18.7%), business (3,020 | 14.2%), science & technology (2,892 | 13.6%), arts & humanities (2,167 | 10.2%), and bio, nature & agricultural (1,944 | 9.1%) are the most common fields of study among 21,254 individuals in Lycoming County who have obtained a bachelor's degree or higher.
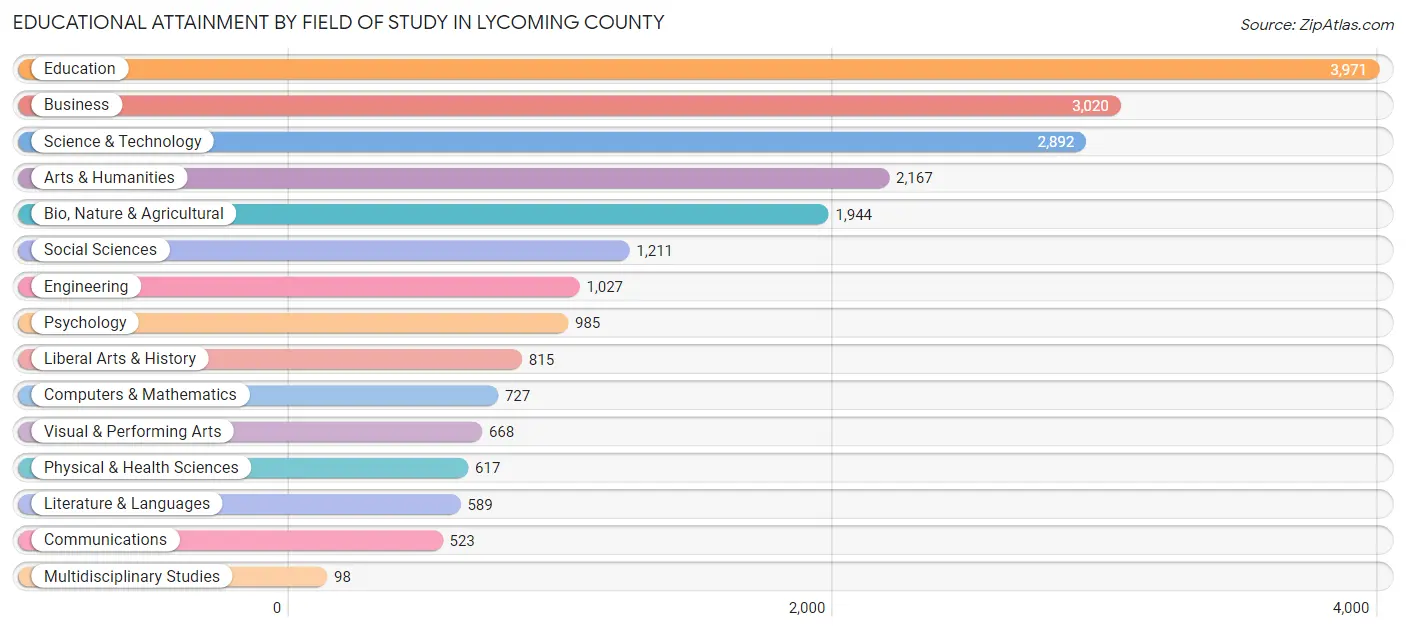
| Field of Study | # Graduates | % Graduates |
| Computers & Mathematics | 727 | 3.4% |
| Bio, Nature & Agricultural | 1,944 | 9.1% |
| Physical & Health Sciences | 617 | 2.9% |
| Psychology | 985 | 4.6% |
| Social Sciences | 1,211 | 5.7% |
| Engineering | 1,027 | 4.8% |
| Multidisciplinary Studies | 98 | 0.5% |
| Science & Technology | 2,892 | 13.6% |
| Business | 3,020 | 14.2% |
| Education | 3,971 | 18.7% |
| Literature & Languages | 589 | 2.8% |
| Liberal Arts & History | 815 | 3.8% |
| Visual & Performing Arts | 668 | 3.1% |
| Communications | 523 | 2.5% |
| Arts & Humanities | 2,167 | 10.2% |
| Total | 21,254 | 100.0% |
Transportation & Commute in Lycoming County
Vehicle Availability by Sex in Lycoming County
The most prevalent vehicle ownership categories in Lycoming County are males with 2 vehicles (10,692, accounting for 39.8%) and females with 2 vehicles (9,623, making up 45.0%).
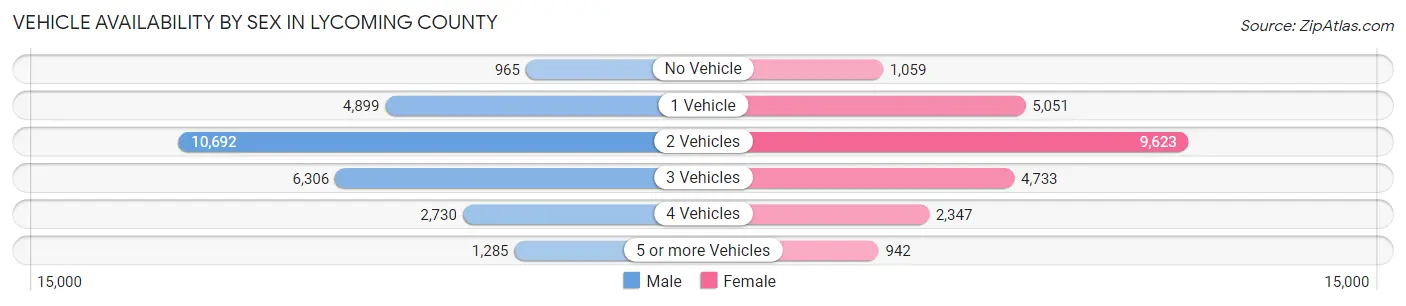
| Vehicles Available | Male | Female |
| No Vehicle | 965 (3.6%) | 1,059 (4.5%) |
| 1 Vehicle | 4,899 (18.2%) | 5,051 (21.3%) |
| 2 Vehicles | 10,692 (39.8%) | 9,623 (40.5%) |
| 3 Vehicles | 6,306 (23.5%) | 4,733 (19.9%) |
| 4 Vehicles | 2,730 (10.2%) | 2,347 (9.9%) |
| 5 or more Vehicles | 1,285 (4.8%) | 942 (4.0%) |
| Total | 26,877 (100.0%) | 23,755 (100.0%) |
Commute Time in Lycoming County
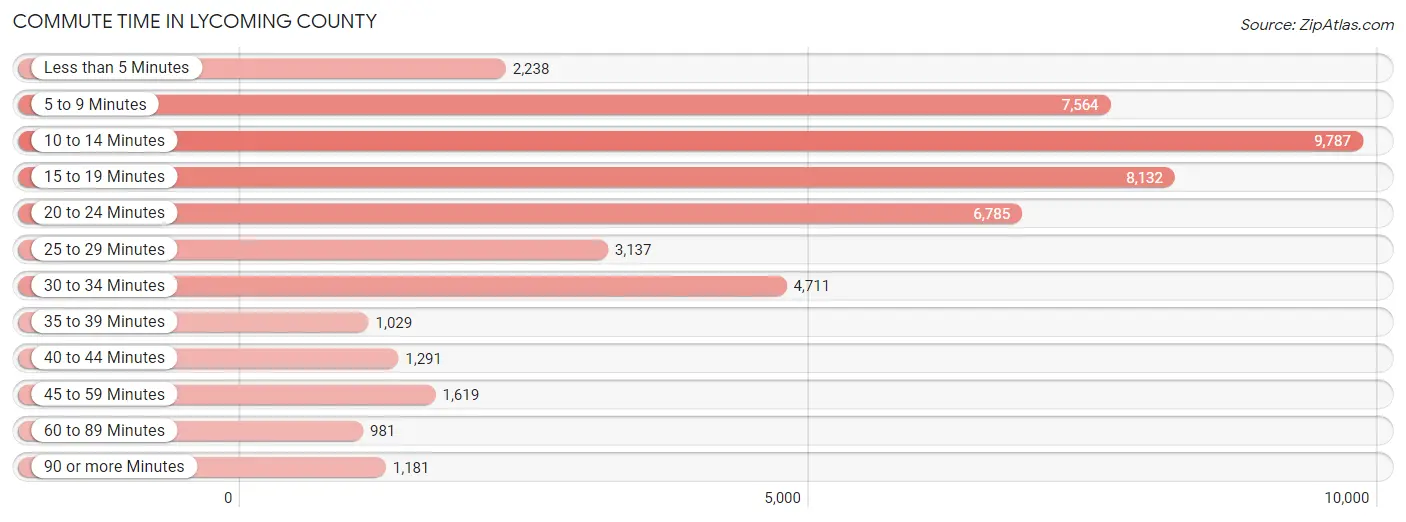
The most frequently occuring commute durations in Lycoming County are 10 to 14 minutes (9,787 commuters, 20.2%), 15 to 19 minutes (8,132 commuters, 16.8%), and 5 to 9 minutes (7,564 commuters, 15.6%).
| Commute Time | # Commuters | % Commuters |
| Less than 5 Minutes | 2,238 | 4.6% |
| 5 to 9 Minutes | 7,564 | 15.6% |
| 10 to 14 Minutes | 9,787 | 20.2% |
| 15 to 19 Minutes | 8,132 | 16.8% |
| 20 to 24 Minutes | 6,785 | 14.0% |
| 25 to 29 Minutes | 3,137 | 6.5% |
| 30 to 34 Minutes | 4,711 | 9.7% |
| 35 to 39 Minutes | 1,029 | 2.1% |
| 40 to 44 Minutes | 1,291 | 2.7% |
| 45 to 59 Minutes | 1,619 | 3.3% |
| 60 to 89 Minutes | 981 | 2.0% |
| 90 or more Minutes | 1,181 | 2.4% |
Commute Time by Sex in Lycoming County
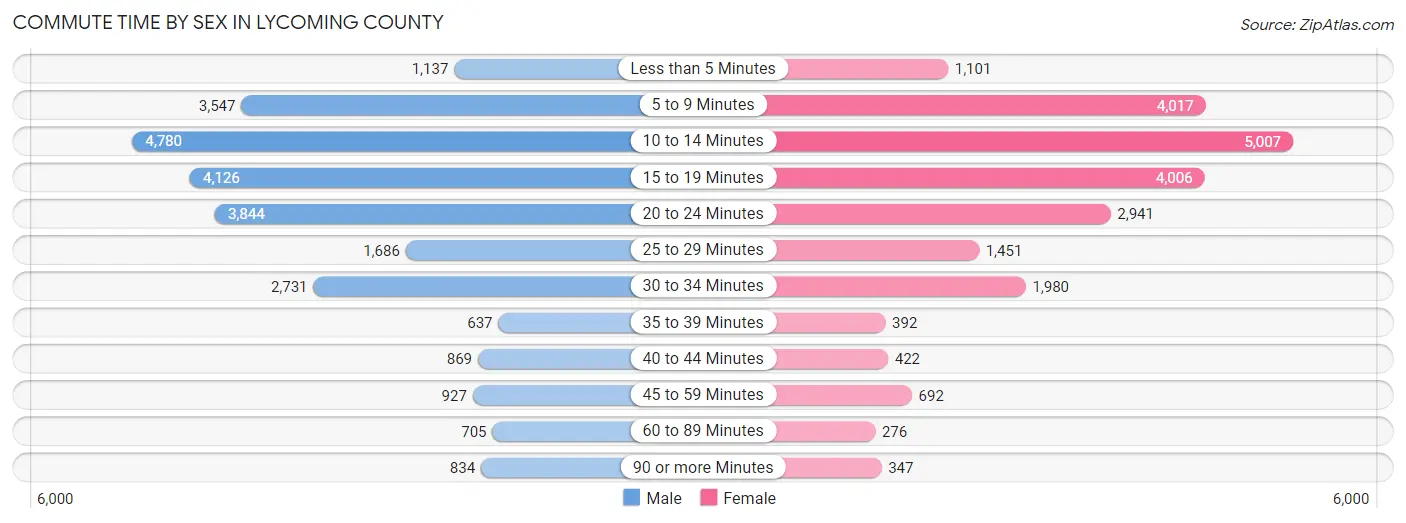
The most common commute times in Lycoming County are 10 to 14 minutes (4,780 commuters, 18.5%) for males and 10 to 14 minutes (5,007 commuters, 22.1%) for females.
| Commute Time | Male | Female |
| Less than 5 Minutes | 1,137 (4.4%) | 1,101 (4.9%) |
| 5 to 9 Minutes | 3,547 (13.7%) | 4,017 (17.7%) |
| 10 to 14 Minutes | 4,780 (18.5%) | 5,007 (22.1%) |
| 15 to 19 Minutes | 4,126 (16.0%) | 4,006 (17.7%) |
| 20 to 24 Minutes | 3,844 (14.9%) | 2,941 (13.0%) |
| 25 to 29 Minutes | 1,686 (6.5%) | 1,451 (6.4%) |
| 30 to 34 Minutes | 2,731 (10.6%) | 1,980 (8.7%) |
| 35 to 39 Minutes | 637 (2.5%) | 392 (1.7%) |
| 40 to 44 Minutes | 869 (3.4%) | 422 (1.9%) |
| 45 to 59 Minutes | 927 (3.6%) | 692 (3.1%) |
| 60 to 89 Minutes | 705 (2.7%) | 276 (1.2%) |
| 90 or more Minutes | 834 (3.2%) | 347 (1.5%) |
Time of Departure to Work by Sex in Lycoming County
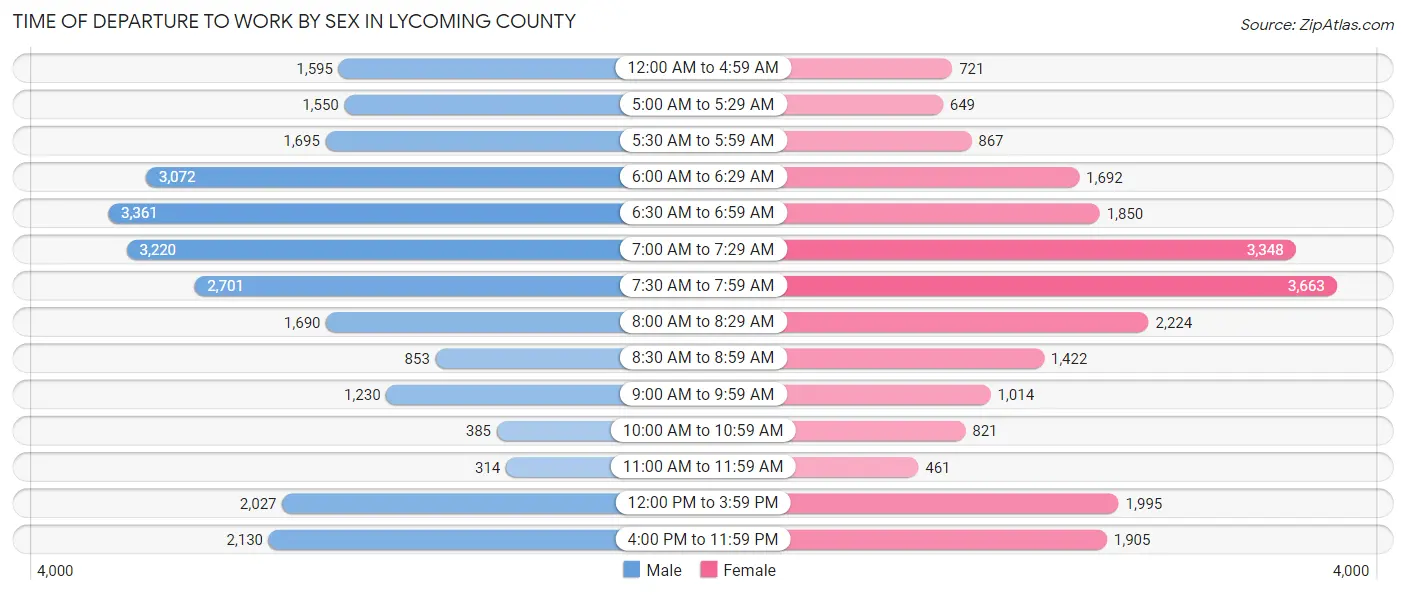
The most frequent times of departure to work in Lycoming County are 6:30 AM to 6:59 AM (3,361, 13.0%) for males and 7:30 AM to 7:59 AM (3,663, 16.2%) for females.
| Time of Departure | Male | Female |
| 12:00 AM to 4:59 AM | 1,595 (6.2%) | 721 (3.2%) |
| 5:00 AM to 5:29 AM | 1,550 (6.0%) | 649 (2.9%) |
| 5:30 AM to 5:59 AM | 1,695 (6.6%) | 867 (3.8%) |
| 6:00 AM to 6:29 AM | 3,072 (11.9%) | 1,692 (7.5%) |
| 6:30 AM to 6:59 AM | 3,361 (13.0%) | 1,850 (8.2%) |
| 7:00 AM to 7:29 AM | 3,220 (12.5%) | 3,348 (14.8%) |
| 7:30 AM to 7:59 AM | 2,701 (10.5%) | 3,663 (16.2%) |
| 8:00 AM to 8:29 AM | 1,690 (6.5%) | 2,224 (9.8%) |
| 8:30 AM to 8:59 AM | 853 (3.3%) | 1,422 (6.3%) |
| 9:00 AM to 9:59 AM | 1,230 (4.8%) | 1,014 (4.5%) |
| 10:00 AM to 10:59 AM | 385 (1.5%) | 821 (3.6%) |
| 11:00 AM to 11:59 AM | 314 (1.2%) | 461 (2.0%) |
| 12:00 PM to 3:59 PM | 2,027 (7.9%) | 1,995 (8.8%) |
| 4:00 PM to 11:59 PM | 2,130 (8.3%) | 1,905 (8.4%) |
| Total | 25,823 (100.0%) | 22,632 (100.0%) |
Housing Occupancy in Lycoming County
Occupancy by Ownership in Lycoming County
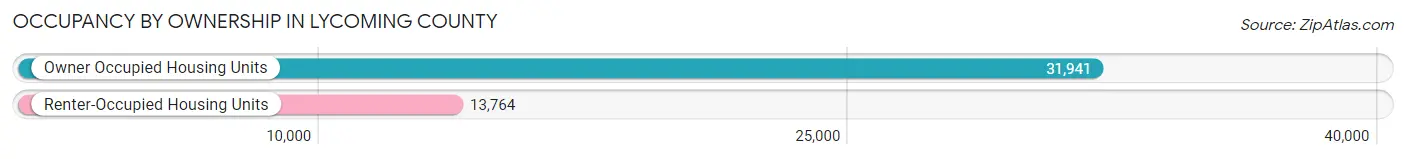
Of the total 45,705 dwellings in Lycoming County, owner-occupied units account for 31,941 (69.9%), while renter-occupied units make up 13,764 (30.1%).
| Occupancy | # Housing Units | % Housing Units |
| Owner Occupied Housing Units | 31,941 | 69.9% |
| Renter-Occupied Housing Units | 13,764 | 30.1% |
| Total Occupied Housing Units | 45,705 | 100.0% |
Occupancy by Household Size in Lycoming County
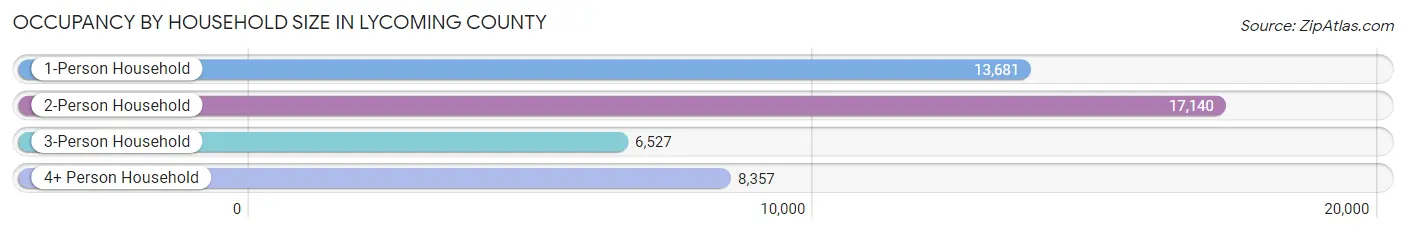
| Household Size | # Housing Units | % Housing Units |
| 1-Person Household | 13,681 | 29.9% |
| 2-Person Household | 17,140 | 37.5% |
| 3-Person Household | 6,527 | 14.3% |
| 4+ Person Household | 8,357 | 18.3% |
| Total Housing Units | 45,705 | 100.0% |
Occupancy by Ownership by Household Size in Lycoming County
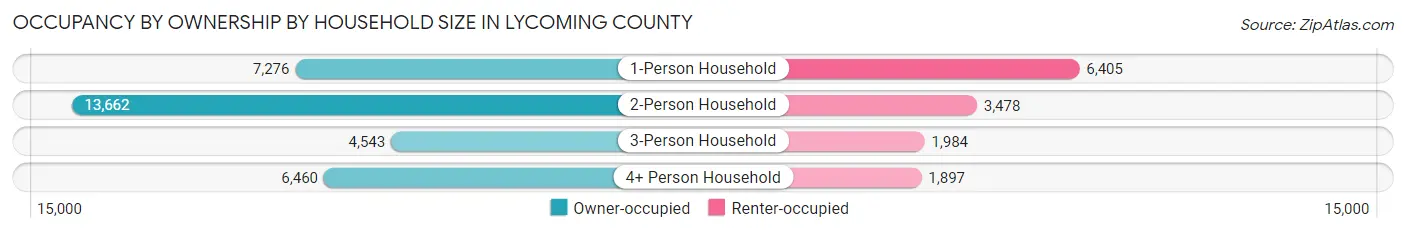
| Household Size | Owner-occupied | Renter-occupied |
| 1-Person Household | 7,276 (53.2%) | 6,405 (46.8%) |
| 2-Person Household | 13,662 (79.7%) | 3,478 (20.3%) |
| 3-Person Household | 4,543 (69.6%) | 1,984 (30.4%) |
| 4+ Person Household | 6,460 (77.3%) | 1,897 (22.7%) |
| Total Housing Units | 31,941 (69.9%) | 13,764 (30.1%) |
Occupancy by Educational Attainment in Lycoming County
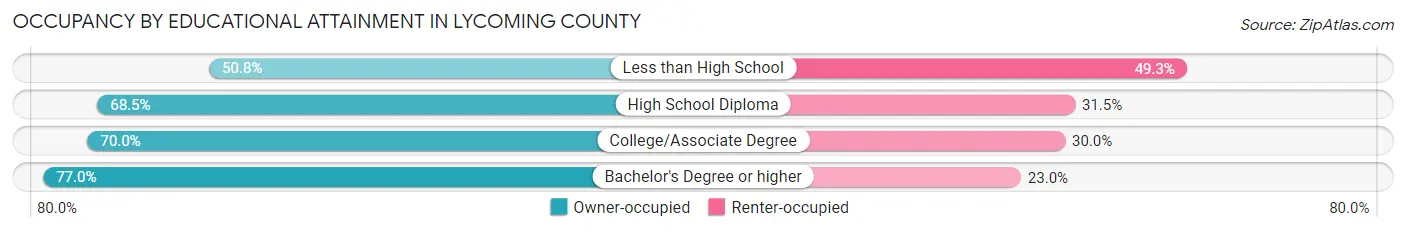
| Household Size | Owner-occupied | Renter-occupied |
| Less than High School | 1,759 (50.7%) | 1,707 (49.2%) |
| High School Diploma | 11,136 (68.5%) | 5,130 (31.5%) |
| College/Associate Degree | 9,636 (70.0%) | 4,123 (30.0%) |
| Bachelor's Degree or higher | 9,410 (77.0%) | 2,804 (23.0%) |
Occupancy by Age of Householder in Lycoming County
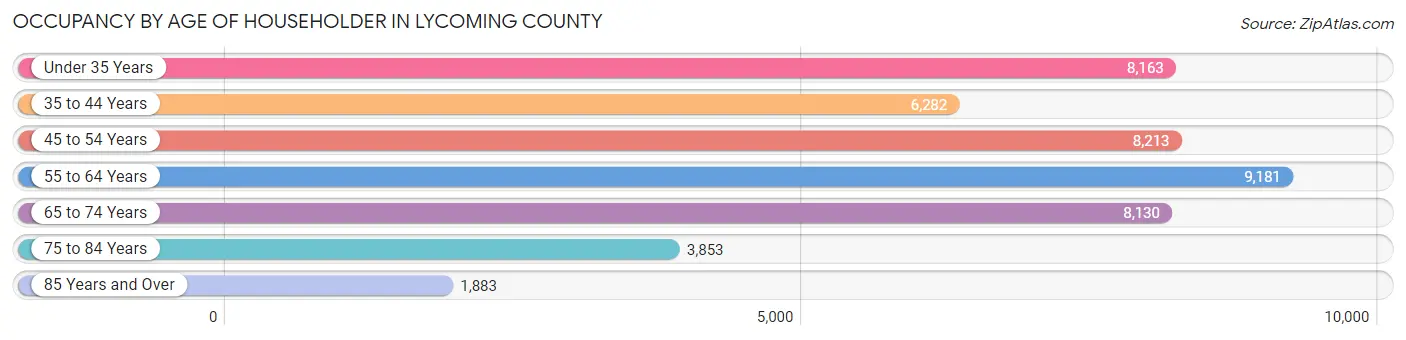
| Age Bracket | # Households | % Households |
| Under 35 Years | 8,163 | 17.9% |
| 35 to 44 Years | 6,282 | 13.7% |
| 45 to 54 Years | 8,213 | 18.0% |
| 55 to 64 Years | 9,181 | 20.1% |
| 65 to 74 Years | 8,130 | 17.8% |
| 75 to 84 Years | 3,853 | 8.4% |
| 85 Years and Over | 1,883 | 4.1% |
| Total | 45,705 | 100.0% |
Housing Finances in Lycoming County
Median Income by Occupancy in Lycoming County
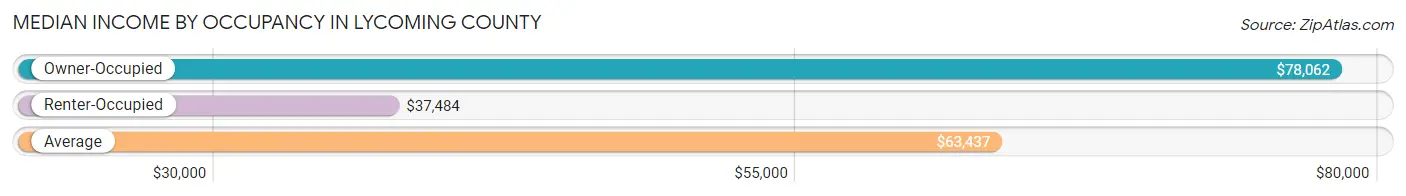
| Occupancy Type | # Households | Median Income |
| Owner-Occupied | 31,941 (69.9%) | $78,062 |
| Renter-Occupied | 13,764 (30.1%) | $37,484 |
| Average | 45,705 (100.0%) | $63,437 |
Occupancy by Householder Income Bracket in Lycoming County
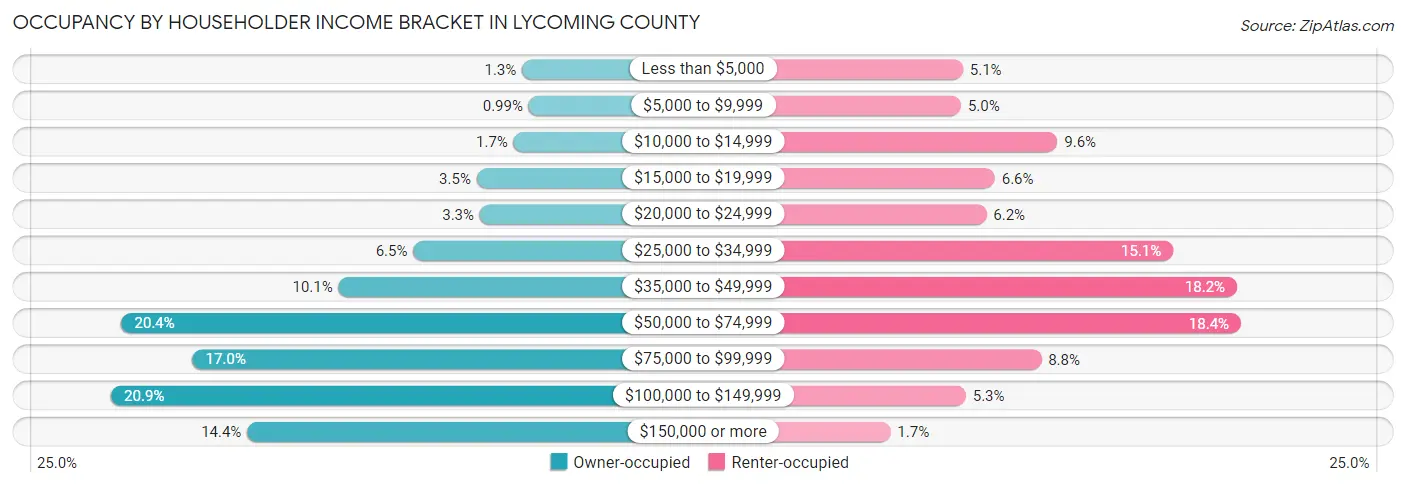
| Income Bracket | Owner-occupied | Renter-occupied |
| Less than $5,000 | 419 (1.3%) | 703 (5.1%) |
| $5,000 to $9,999 | 316 (1.0%) | 691 (5.0%) |
| $10,000 to $14,999 | 547 (1.7%) | 1,323 (9.6%) |
| $15,000 to $19,999 | 1,107 (3.5%) | 913 (6.6%) |
| $20,000 to $24,999 | 1,059 (3.3%) | 858 (6.2%) |
| $25,000 to $34,999 | 2,073 (6.5%) | 2,081 (15.1%) |
| $35,000 to $49,999 | 3,210 (10.1%) | 2,500 (18.2%) |
| $50,000 to $74,999 | 6,512 (20.4%) | 2,526 (18.3%) |
| $75,000 to $99,999 | 5,429 (17.0%) | 1,217 (8.8%) |
| $100,000 to $149,999 | 6,669 (20.9%) | 723 (5.2%) |
| $150,000 or more | 4,600 (14.4%) | 229 (1.7%) |
| Total | 31,941 (100.0%) | 13,764 (100.0%) |
Monthly Housing Cost Tiers in Lycoming County
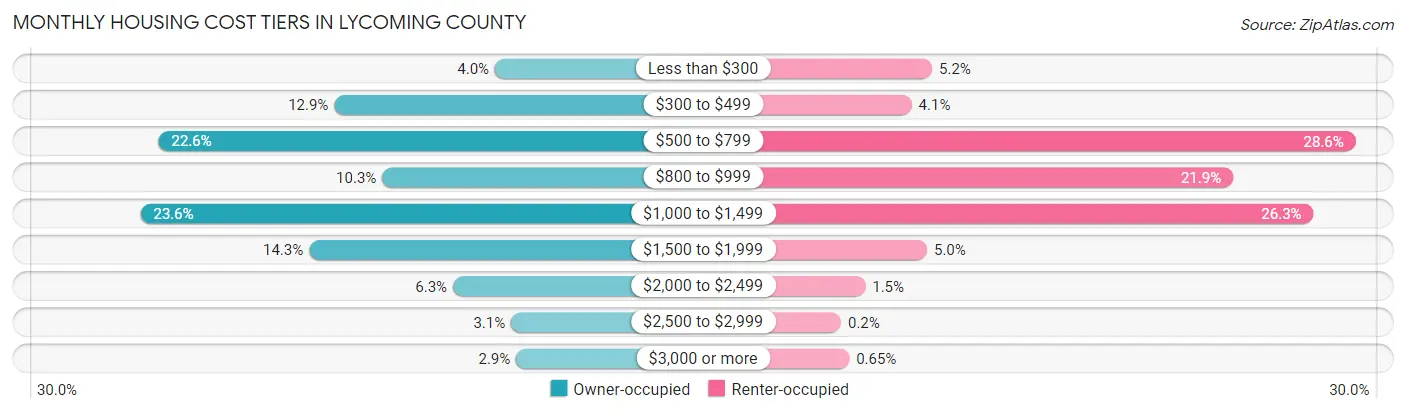
| Monthly Cost | Owner-occupied | Renter-occupied |
| Less than $300 | 1,284 (4.0%) | 720 (5.2%) |
| $300 to $499 | 4,121 (12.9%) | 564 (4.1%) |
| $500 to $799 | 7,223 (22.6%) | 3,939 (28.6%) |
| $800 to $999 | 3,273 (10.2%) | 3,008 (21.8%) |
| $1,000 to $1,499 | 7,541 (23.6%) | 3,618 (26.3%) |
| $1,500 to $1,999 | 4,563 (14.3%) | 682 (5.0%) |
| $2,000 to $2,499 | 2,026 (6.3%) | 212 (1.5%) |
| $2,500 to $2,999 | 999 (3.1%) | 27 (0.2%) |
| $3,000 or more | 911 (2.9%) | 90 (0.6%) |
| Total | 31,941 (100.0%) | 13,764 (100.0%) |
Physical Housing Characteristics in Lycoming County
Housing Structures in Lycoming County
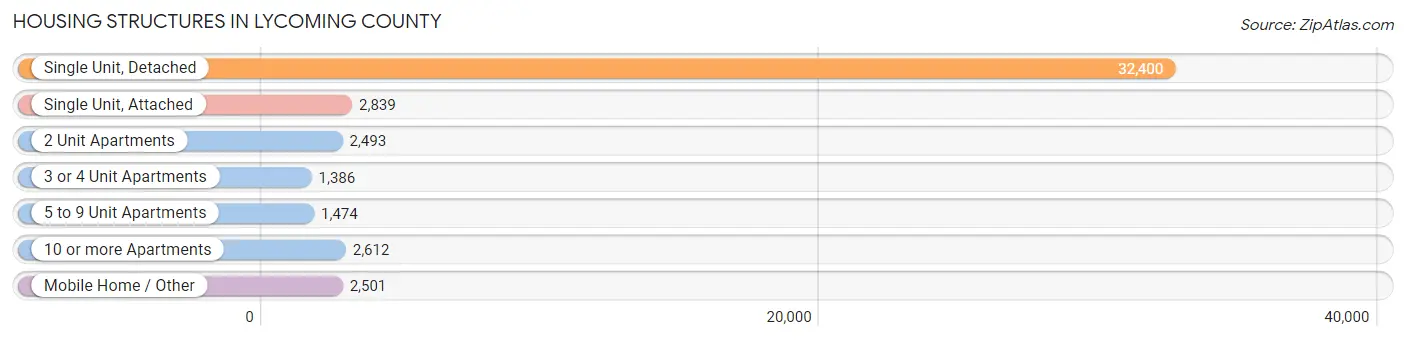
| Structure Type | # Housing Units | % Housing Units |
| Single Unit, Detached | 32,400 | 70.9% |
| Single Unit, Attached | 2,839 | 6.2% |
| 2 Unit Apartments | 2,493 | 5.4% |
| 3 or 4 Unit Apartments | 1,386 | 3.0% |
| 5 to 9 Unit Apartments | 1,474 | 3.2% |
| 10 or more Apartments | 2,612 | 5.7% |
| Mobile Home / Other | 2,501 | 5.5% |
| Total | 45,705 | 100.0% |
Housing Structures by Occupancy in Lycoming County
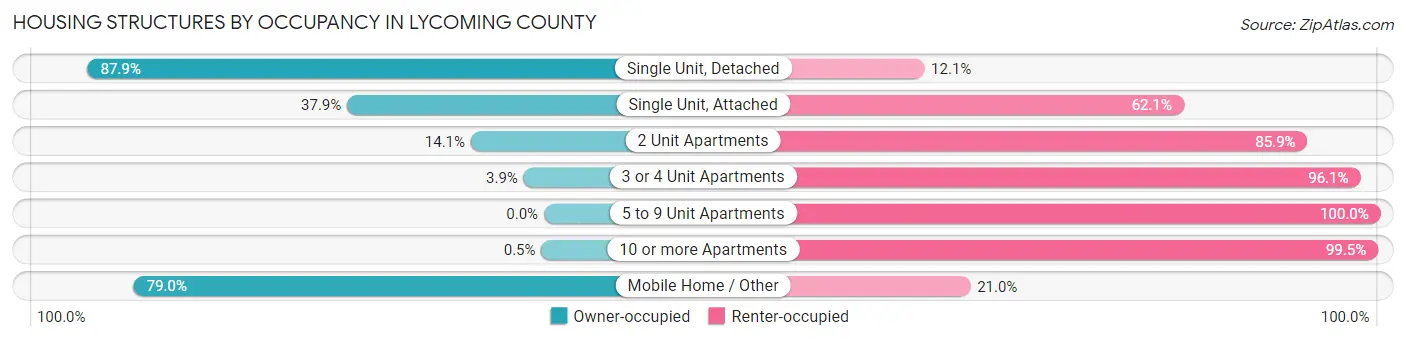
| Structure Type | Owner-occupied | Renter-occupied |
| Single Unit, Detached | 28,471 (87.9%) | 3,929 (12.1%) |
| Single Unit, Attached | 1,076 (37.9%) | 1,763 (62.1%) |
| 2 Unit Apartments | 351 (14.1%) | 2,142 (85.9%) |
| 3 or 4 Unit Apartments | 54 (3.9%) | 1,332 (96.1%) |
| 5 to 9 Unit Apartments | 0 (0.0%) | 1,474 (100.0%) |
| 10 or more Apartments | 13 (0.5%) | 2,599 (99.5%) |
| Mobile Home / Other | 1,976 (79.0%) | 525 (21.0%) |
| Total | 31,941 (69.9%) | 13,764 (30.1%) |
Housing Structures by Number of Rooms in Lycoming County
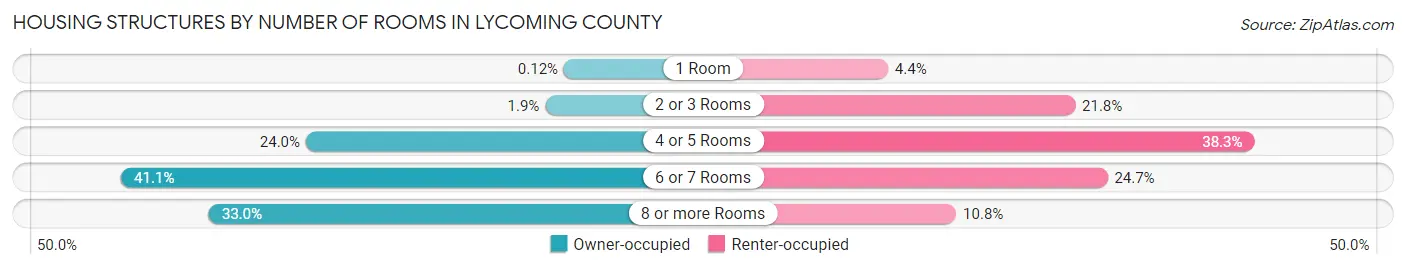
| Number of Rooms | Owner-occupied | Renter-occupied |
| 1 Room | 37 (0.1%) | 611 (4.4%) |
| 2 or 3 Rooms | 592 (1.8%) | 2,993 (21.7%) |
| 4 or 5 Rooms | 7,664 (24.0%) | 5,275 (38.3%) |
| 6 or 7 Rooms | 13,119 (41.1%) | 3,405 (24.7%) |
| 8 or more Rooms | 10,529 (33.0%) | 1,480 (10.7%) |
| Total | 31,941 (100.0%) | 13,764 (100.0%) |
Housing Structure by Heating Type in Lycoming County
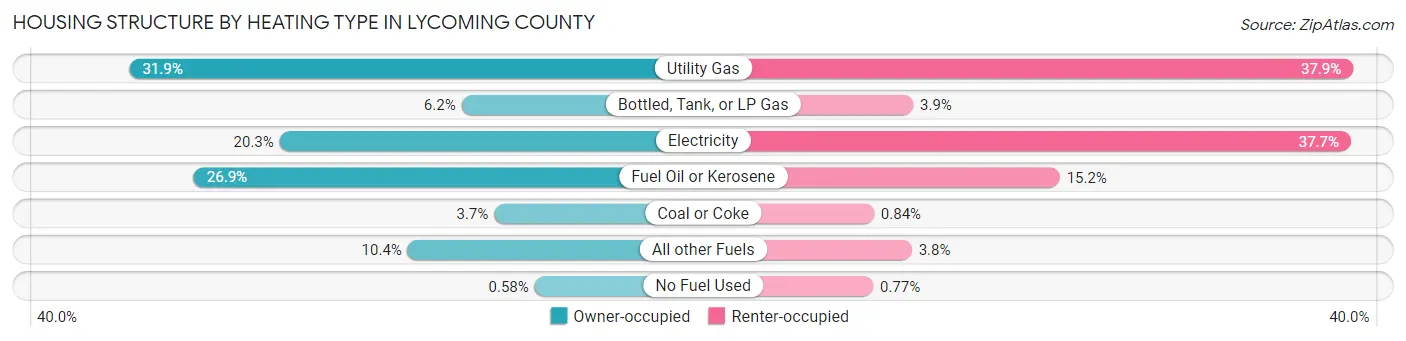
| Heating Type | Owner-occupied | Renter-occupied |
| Utility Gas | 10,186 (31.9%) | 5,212 (37.9%) |
| Bottled, Tank, or LP Gas | 1,989 (6.2%) | 532 (3.9%) |
| Electricity | 6,480 (20.3%) | 5,189 (37.7%) |
| Fuel Oil or Kerosene | 8,595 (26.9%) | 2,092 (15.2%) |
| Coal or Coke | 1,186 (3.7%) | 116 (0.8%) |
| All other Fuels | 3,319 (10.4%) | 517 (3.8%) |
| No Fuel Used | 186 (0.6%) | 106 (0.8%) |
| Total | 31,941 (100.0%) | 13,764 (100.0%) |
Household Vehicle Usage in Lycoming County
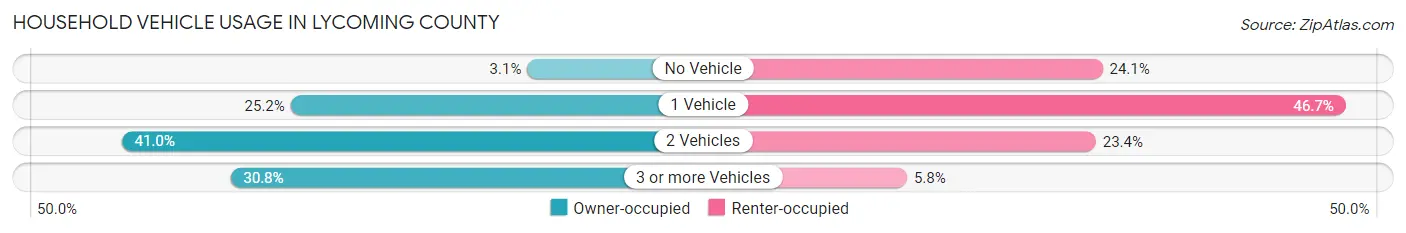
| Vehicles per Household | Owner-occupied | Renter-occupied |
| No Vehicle | 985 (3.1%) | 3,310 (24.0%) |
| 1 Vehicle | 8,040 (25.2%) | 6,433 (46.7%) |
| 2 Vehicles | 13,080 (40.9%) | 3,224 (23.4%) |
| 3 or more Vehicles | 9,836 (30.8%) | 797 (5.8%) |
| Total | 31,941 (100.0%) | 13,764 (100.0%) |
Real Estate & Mortgages in Lycoming County
Real Estate and Mortgage Overview in Lycoming County
| Characteristic | Without Mortgage | With Mortgage |
| Housing Units | 13,351 | 18,590 |
| Median Property Value | $170,900 | $189,600 |
| Median Household Income | $59,666 | $3,450 |
| Monthly Housing Costs | $548 | $862 |
| Real Estate Taxes | $2,484 | $205 |
Property Value by Mortgage Status in Lycoming County
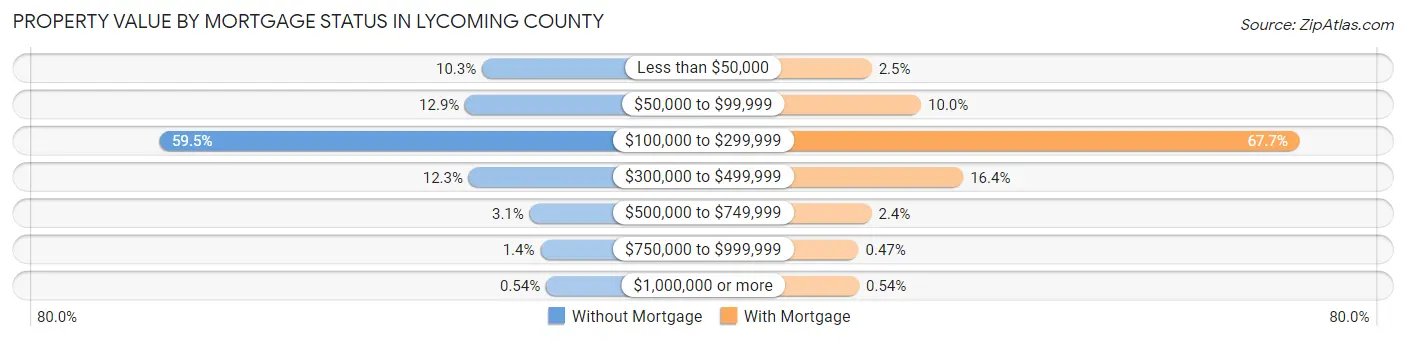
| Property Value | Without Mortgage | With Mortgage |
| Less than $50,000 | 1,375 (10.3%) | 460 (2.5%) |
| $50,000 to $99,999 | 1,718 (12.9%) | 1,857 (10.0%) |
| $100,000 to $299,999 | 7,947 (59.5%) | 12,581 (67.7%) |
| $300,000 to $499,999 | 1,643 (12.3%) | 3,051 (16.4%) |
| $500,000 to $749,999 | 407 (3.0%) | 454 (2.4%) |
| $750,000 to $999,999 | 189 (1.4%) | 87 (0.5%) |
| $1,000,000 or more | 72 (0.5%) | 100 (0.5%) |
| Total | 13,351 (100.0%) | 18,590 (100.0%) |
Household Income by Mortgage Status in Lycoming County
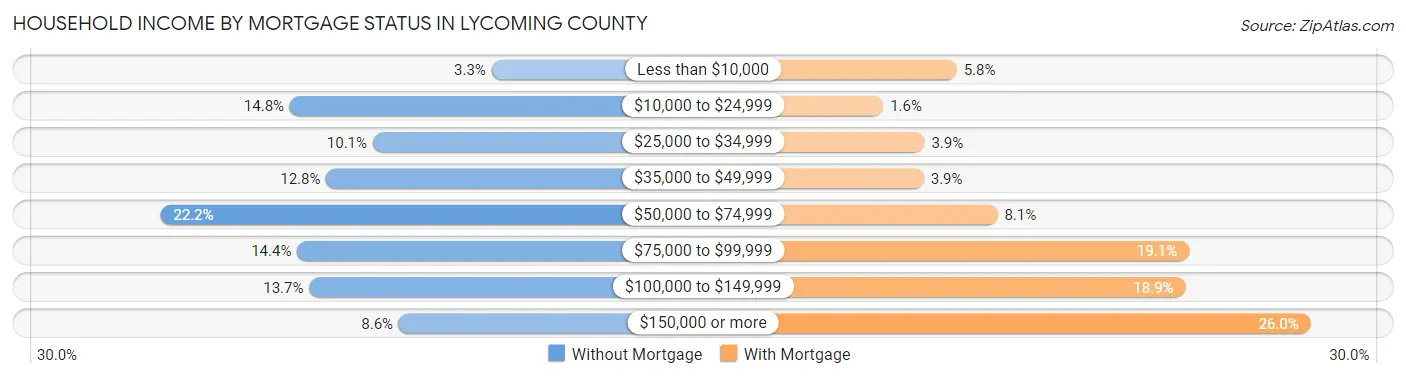
| Household Income | Without Mortgage | With Mortgage |
| Less than $10,000 | 442 (3.3%) | 1,074 (5.8%) |
| $10,000 to $24,999 | 1,981 (14.8%) | 293 (1.6%) |
| $25,000 to $34,999 | 1,348 (10.1%) | 732 (3.9%) |
| $35,000 to $49,999 | 1,703 (12.8%) | 725 (3.9%) |
| $50,000 to $74,999 | 2,969 (22.2%) | 1,507 (8.1%) |
| $75,000 to $99,999 | 1,925 (14.4%) | 3,543 (19.1%) |
| $100,000 to $149,999 | 1,833 (13.7%) | 3,504 (18.9%) |
| $150,000 or more | 1,150 (8.6%) | 4,836 (26.0%) |
| Total | 13,351 (100.0%) | 18,590 (100.0%) |
Property Value to Household Income Ratio in Lycoming County
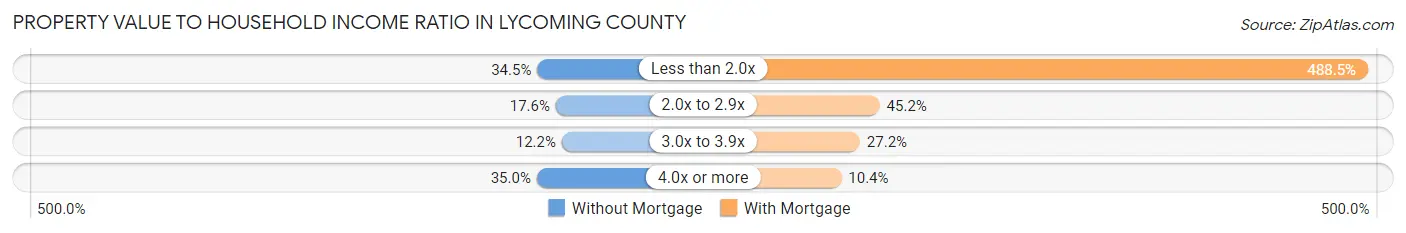
| Value-to-Income Ratio | Without Mortgage | With Mortgage |
| Less than 2.0x | 4,607 (34.5%) | 90,815 (488.5%) |
| 2.0x to 2.9x | 2,353 (17.6%) | 8,394 (45.2%) |
| 3.0x to 3.9x | 1,630 (12.2%) | 5,060 (27.2%) |
| 4.0x or more | 4,668 (35.0%) | 1,935 (10.4%) |
| Total | 13,351 (100.0%) | 18,590 (100.0%) |
Real Estate Taxes by Mortgage Status in Lycoming County
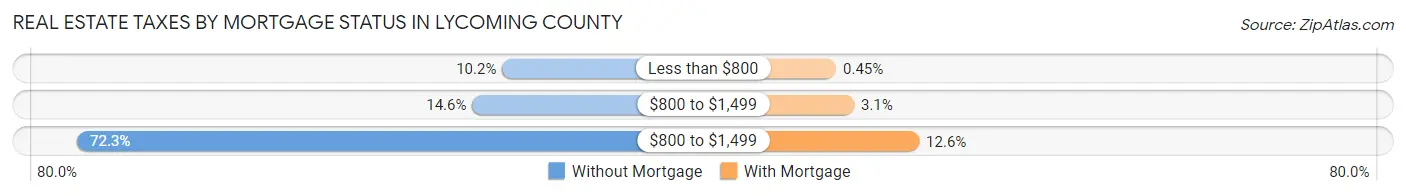
| Property Taxes | Without Mortgage | With Mortgage |
| Less than $800 | 1,363 (10.2%) | 83 (0.4%) |
| $800 to $1,499 | 1,947 (14.6%) | 571 (3.1%) |
| $800 to $1,499 | 9,655 (72.3%) | 2,338 (12.6%) |
| Total | 13,351 (100.0%) | 18,590 (100.0%) |
Health & Disability in Lycoming County
Health Insurance Coverage by Age in Lycoming County
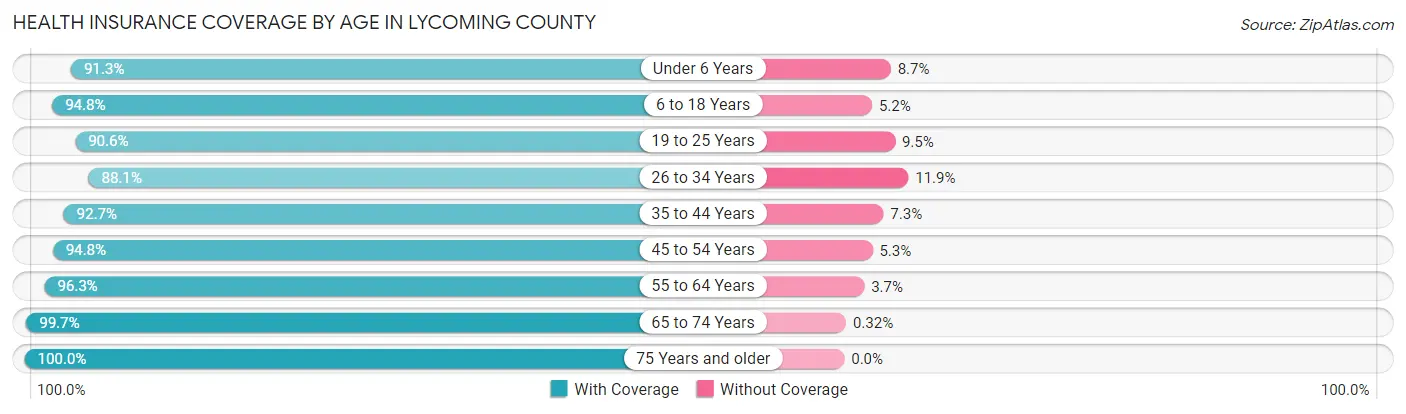
| Age Bracket | With Coverage | Without Coverage |
| Under 6 Years | 6,909 (91.3%) | 655 (8.7%) |
| 6 to 18 Years | 16,633 (94.8%) | 905 (5.2%) |
| 19 to 25 Years | 8,667 (90.5%) | 904 (9.5%) |
| 26 to 34 Years | 11,372 (88.1%) | 1,540 (11.9%) |
| 35 to 44 Years | 11,567 (92.7%) | 909 (7.3%) |
| 45 to 54 Years | 12,760 (94.8%) | 707 (5.2%) |
| 55 to 64 Years | 15,351 (96.3%) | 591 (3.7%) |
| 65 to 74 Years | 12,901 (99.7%) | 41 (0.3%) |
| 75 Years and older | 8,582 (100.0%) | 0 (0.0%) |
| Total | 104,742 (94.4%) | 6,252 (5.6%) |
Health Insurance Coverage by Citizenship Status in Lycoming County
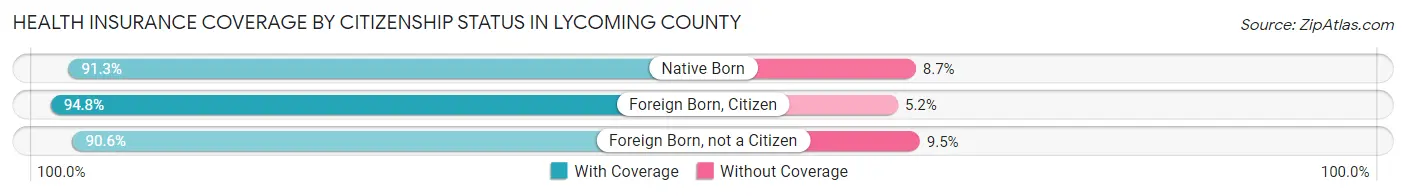
| Citizenship Status | With Coverage | Without Coverage |
| Native Born | 6,909 (91.3%) | 655 (8.7%) |
| Foreign Born, Citizen | 16,633 (94.8%) | 905 (5.2%) |
| Foreign Born, not a Citizen | 8,667 (90.5%) | 904 (9.5%) |
Health Insurance Coverage by Household Income in Lycoming County
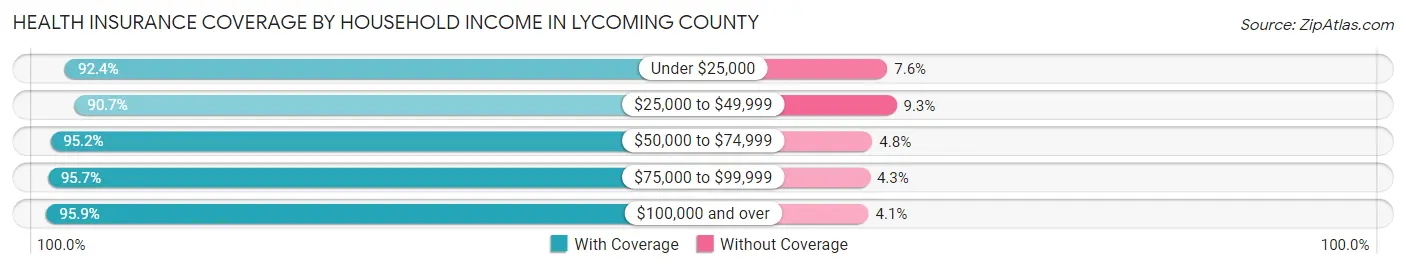
| Household Income | With Coverage | Without Coverage |
| Under $25,000 | 11,837 (92.4%) | 973 (7.6%) |
| $25,000 to $49,999 | 17,312 (90.7%) | 1,779 (9.3%) |
| $50,000 to $74,999 | 20,266 (95.2%) | 1,021 (4.8%) |
| $75,000 to $99,999 | 16,749 (95.7%) | 760 (4.3%) |
| $100,000 and over | 35,680 (95.9%) | 1,520 (4.1%) |
Public vs Private Health Insurance Coverage by Age in Lycoming County
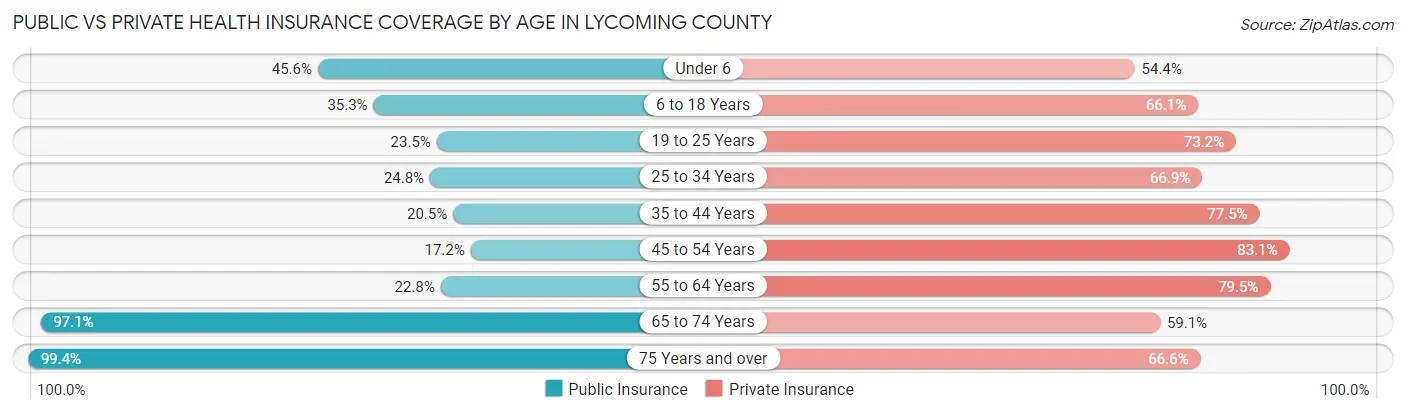
| Age Bracket | Public Insurance | Private Insurance |
| Under 6 | 3,447 (45.6%) | 4,111 (54.3%) |
| 6 to 18 Years | 6,182 (35.2%) | 11,597 (66.1%) |
| 19 to 25 Years | 2,251 (23.5%) | 7,003 (73.2%) |
| 25 to 34 Years | 3,197 (24.8%) | 8,635 (66.9%) |
| 35 to 44 Years | 2,554 (20.5%) | 9,670 (77.5%) |
| 45 to 54 Years | 2,320 (17.2%) | 11,187 (83.1%) |
| 55 to 64 Years | 3,633 (22.8%) | 12,675 (79.5%) |
| 65 to 74 Years | 12,567 (97.1%) | 7,642 (59.1%) |
| 75 Years and over | 8,532 (99.4%) | 5,713 (66.6%) |
| Total | 44,683 (40.3%) | 78,233 (70.5%) |
Disability Status by Sex by Age in Lycoming County
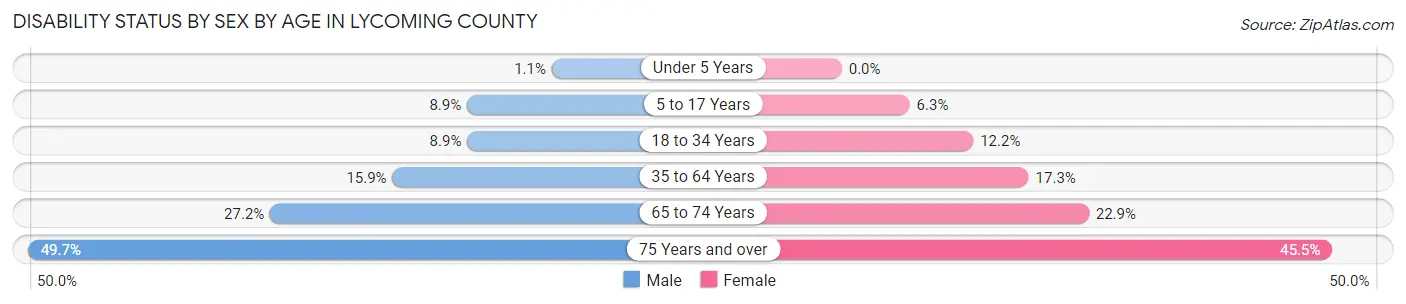
| Age Bracket | Male | Female |
| Under 5 Years | 33 (1.1%) | 0 (0.0%) |
| 5 to 17 Years | 784 (8.9%) | 543 (6.3%) |
| 18 to 34 Years | 1,142 (8.9%) | 1,389 (12.2%) |
| 35 to 64 Years | 3,332 (15.9%) | 3,620 (17.3%) |
| 65 to 74 Years | 1,704 (27.2%) | 1,531 (22.9%) |
| 75 Years and over | 1,785 (49.7%) | 2,272 (45.5%) |
Disability Class by Sex by Age in Lycoming County
Disability Class: Hearing Difficulty
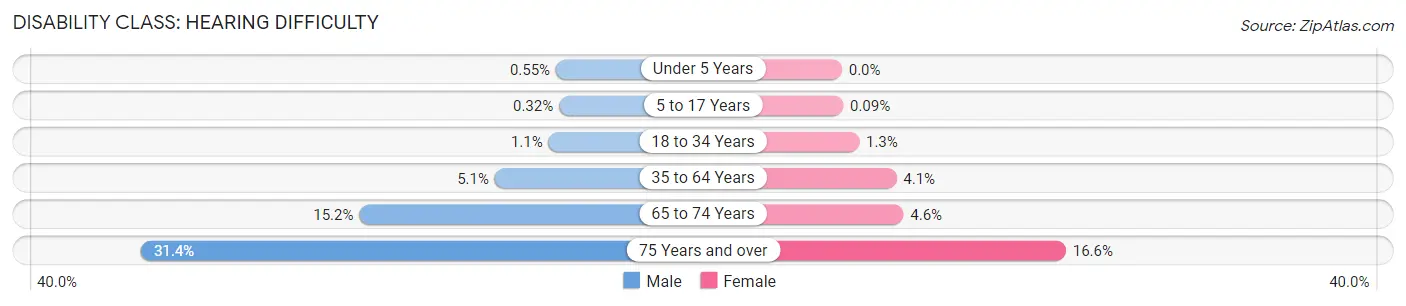
| Age Bracket | Male | Female |
| Under 5 Years | 17 (0.5%) | 0 (0.0%) |
| 5 to 17 Years | 28 (0.3%) | 8 (0.1%) |
| 18 to 34 Years | 141 (1.1%) | 146 (1.3%) |
| 35 to 64 Years | 1,069 (5.1%) | 846 (4.1%) |
| 65 to 74 Years | 949 (15.1%) | 305 (4.6%) |
| 75 Years and over | 1,126 (31.4%) | 830 (16.6%) |
Disability Class: Vision Difficulty
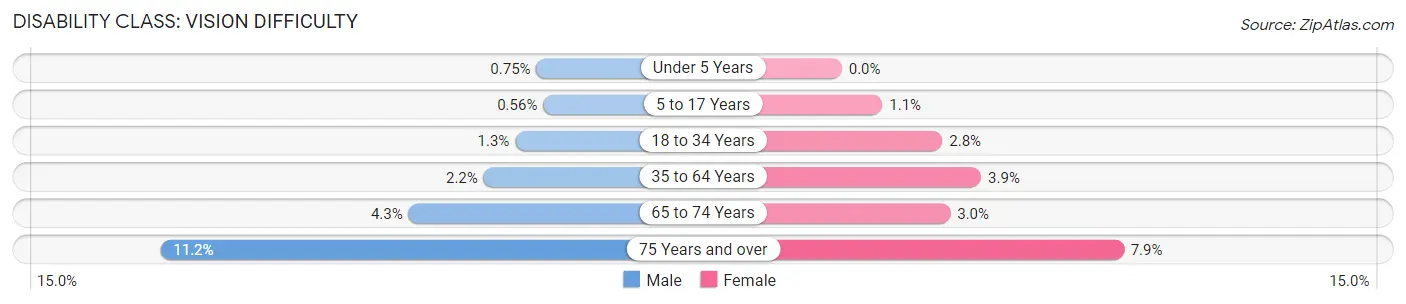
| Age Bracket | Male | Female |
| Under 5 Years | 23 (0.7%) | 0 (0.0%) |
| 5 to 17 Years | 49 (0.6%) | 97 (1.1%) |
| 18 to 34 Years | 171 (1.3%) | 319 (2.8%) |
| 35 to 64 Years | 466 (2.2%) | 811 (3.9%) |
| 65 to 74 Years | 270 (4.3%) | 202 (3.0%) |
| 75 Years and over | 403 (11.2%) | 392 (7.9%) |
Disability Class: Cognitive Difficulty
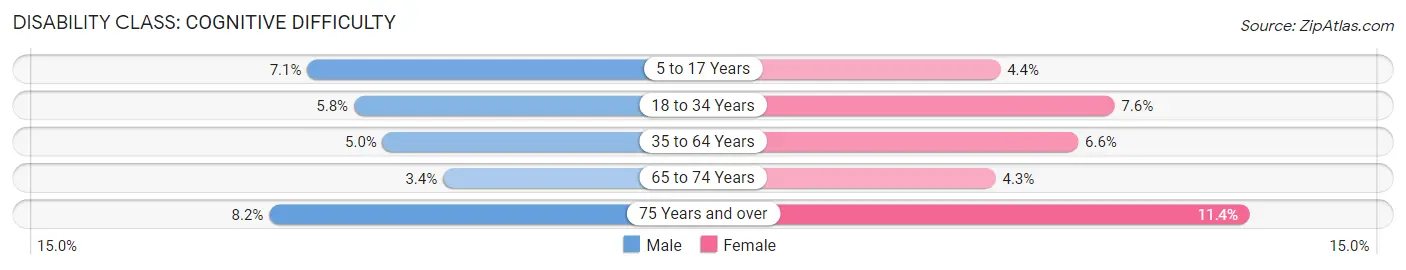
| Age Bracket | Male | Female |
| 5 to 17 Years | 625 (7.1%) | 380 (4.4%) |
| 18 to 34 Years | 746 (5.8%) | 864 (7.6%) |
| 35 to 64 Years | 1,057 (5.0%) | 1,374 (6.6%) |
| 65 to 74 Years | 210 (3.4%) | 286 (4.3%) |
| 75 Years and over | 294 (8.2%) | 567 (11.4%) |
Disability Class: Ambulatory Difficulty
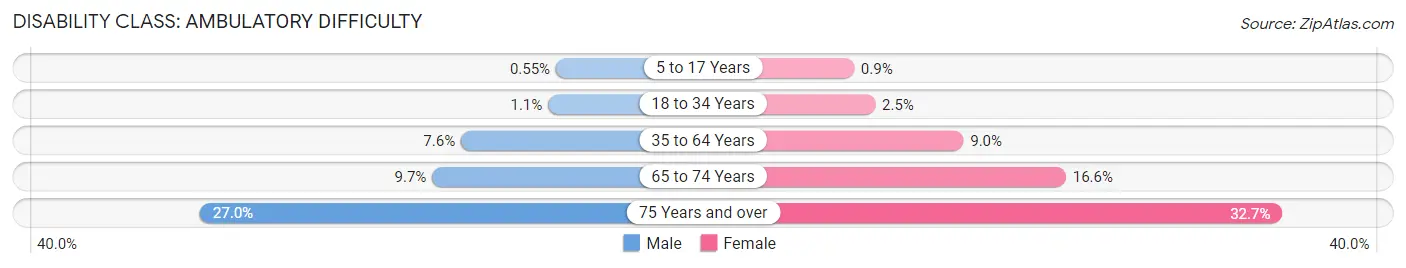
| Age Bracket | Male | Female |
| 5 to 17 Years | 48 (0.5%) | 78 (0.9%) |
| 18 to 34 Years | 145 (1.1%) | 281 (2.5%) |
| 35 to 64 Years | 1,596 (7.6%) | 1,882 (9.0%) |
| 65 to 74 Years | 610 (9.7%) | 1,111 (16.6%) |
| 75 Years and over | 969 (27.0%) | 1,632 (32.7%) |
Disability Class: Self-Care Difficulty
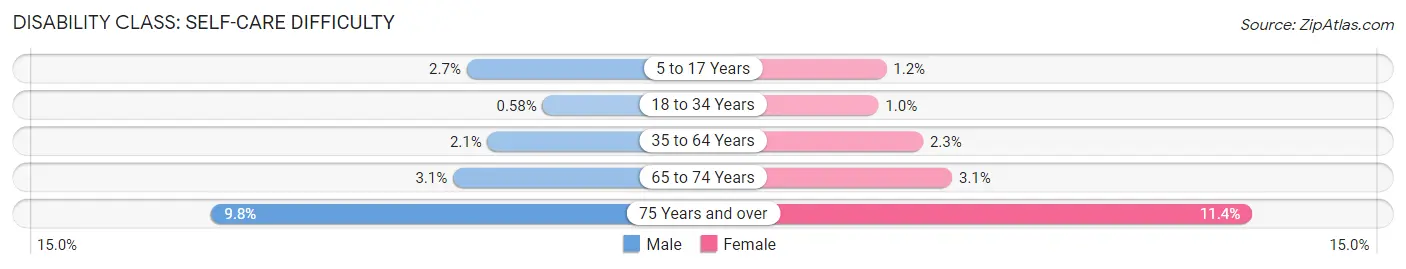
| Age Bracket | Male | Female |
| 5 to 17 Years | 236 (2.7%) | 107 (1.2%) |
| 18 to 34 Years | 74 (0.6%) | 116 (1.0%) |
| 35 to 64 Years | 443 (2.1%) | 471 (2.3%) |
| 65 to 74 Years | 192 (3.1%) | 205 (3.1%) |
| 75 Years and over | 352 (9.8%) | 570 (11.4%) |
Technology Access in Lycoming County
Computing Device Access in Lycoming County
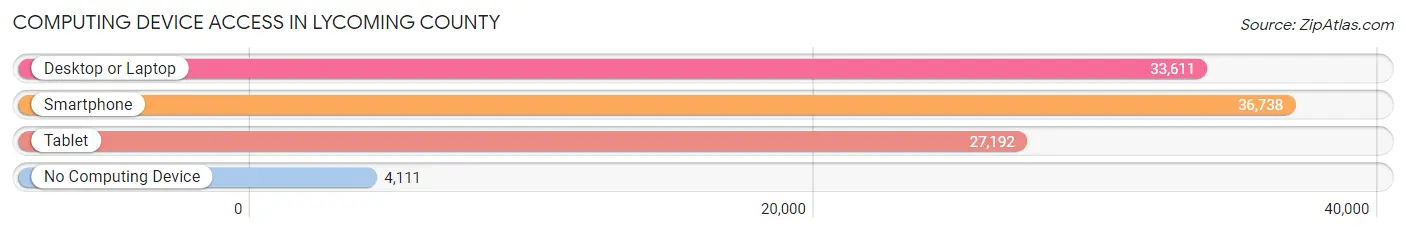
| Device Type | # Households | % Households |
| Desktop or Laptop | 33,611 | 73.5% |
| Smartphone | 36,738 | 80.4% |
| Tablet | 27,192 | 59.5% |
| No Computing Device | 4,111 | 9.0% |
| Total | 45,705 | 100.0% |
Internet Access in Lycoming County
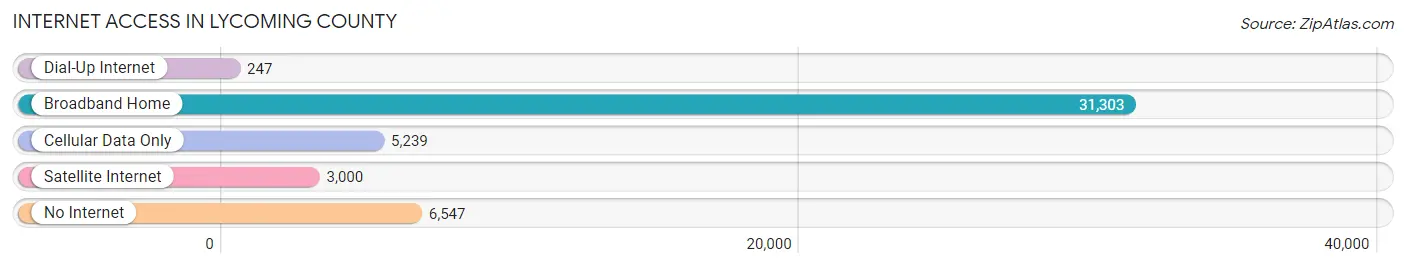
| Internet Type | # Households | % Households |
| Dial-Up Internet | 247 | 0.5% |
| Broadband Home | 31,303 | 68.5% |
| Cellular Data Only | 5,239 | 11.5% |
| Satellite Internet | 3,000 | 6.6% |
| No Internet | 6,547 | 14.3% |
| Total | 45,705 | 100.0% |
Lycoming County Summary
Lycoming County is located in the north-central region of Pennsylvania, and is part of the Williamsport, PA Metropolitan Statistical Area. The county was created in 1795 from a portion of Northumberland County and is named after the Lycoming Creek, which flows through the county. As of the 2010 census, the population of Lycoming County was 116,111.
Geography
Lycoming County is located in the Ridge and Valley region of the Appalachian Mountains. The county is bordered by Sullivan County to the north, Union County to the east, Clinton County to the southeast, Centre County to the south, and Tioga County to the west. The county is home to several mountain ranges, including the Bald Eagle Mountains, the Loyalsock Mountains, and the Pine Creek Mountains. The highest point in the county is the summit of Little Pine Mountain, which has an elevation of 2,890 feet. The county is also home to several rivers, including the Susquehanna River, the West Branch Susquehanna River, the Loyalsock Creek, and the Lycoming Creek.
Demographics
As of the 2010 census, the population of Lycoming County was 116,111, with a population density of 79.3 people per square mile. The racial makeup of the county was 95.3% White, 2.2% African American, 0.3% Native American, 0.7% Asian, 0.1% Pacific Islander, 0.5% from other races, and 0.9% from two or more races. Hispanic or Latino of any race were 1.7% of the population.
The median income for a household in the county was $41,945, and the median income for a family was $50,817. The per capita income for the county was $21,845. About 11.2% of families and 15.2% of the population were below the poverty line, including 21.2% of those under age 18 and 8.2% of those age 65 or over.
Economy
Lycoming County is home to a diverse economy, with a variety of industries providing employment opportunities. The largest employers in the county are the Williamsport Regional Medical Center, the Williamsport Area School District, and the Lycoming County government. Other major employers include UPMC Susquehanna, Weis Markets, and the Pennsylvania College of Technology.
The county is also home to several manufacturing companies, including C&D Technologies, Inc., which produces batteries and power systems; and Textron Lycoming, which manufactures aircraft engines. The county is also home to several energy companies, including UGI Energy Services, which provides natural gas and electricity to customers in the region; and Sunoco Logistics, which operates a pipeline system in the county.
The county is also home to several tourist attractions, including the Little League World Series, the Thomas T. Taber Museum, and the Lycoming County Historical Society. The county is also home to several wineries, breweries, and distilleries, including the Susquehanna Brewing Company and the Old Forge Distillery.
Conclusion
Lycoming County is a diverse and vibrant county located in the north-central region of Pennsylvania. The county is home to a variety of industries, including manufacturing, energy, and tourism. The county is also home to several attractions, including the Little League World Series, the Thomas T. Taber Museum, and the Lycoming County Historical Society. The county is also home to several wineries, breweries, and distilleries, providing visitors with a unique experience.
Common Questions
What is Per Capita Income in Lycoming County?
Per Capita income in Lycoming County is $32,968.
What is the Median Family Income in Lycoming County?
Median Family Income in Lycoming County is $77,846.
What is the Median Household income in Lycoming County?
Median Household Income in Lycoming County is $63,437.
What is Income or Wage Gap in Lycoming County?
Income or Wage Gap in Lycoming County is 30.3%.
Women in Lycoming County earn 69.7 cents for every dollar earned by a man.
What is Family Income Deficit in Lycoming County?
Family Income Deficit in Lycoming County is $11,104.
Families that are below poverty line in Lycoming County earn $11,104 less on average than the poverty threshold level.
What is Inequality or Gini Index in Lycoming County?
Inequality or Gini Index in Lycoming County is 0.43.
What is the Total Population of Lycoming County?
Total Population of Lycoming County is 114,022.
What is the Total Male Population of Lycoming County?
Total Male Population of Lycoming County is 56,229.
What is the Total Female Population of Lycoming County?
Total Female Population of Lycoming County is 57,793.
What is the Ratio of Males per 100 Females in Lycoming County?
There are 97.29 Males per 100 Females in Lycoming County.
What is the Ratio of Females per 100 Males in Lycoming County?
There are 102.78 Females per 100 Males in Lycoming County.
What is the Median Population Age in Lycoming County?
Median Population Age in Lycoming County is 41.4 Years.
What is the Average Family Size in Lycoming County
Average Family Size in Lycoming County is 2.9 People.
What is the Average Household Size in Lycoming County
Average Household Size in Lycoming County is 2.4 People.
How Large is the Labor Force in Lycoming County?
There are 55,474 People in the Labor Forcein in Lycoming County.
What is the Percentage of People in the Labor Force in Lycoming County?
59.4% of People are in the Labor Force in Lycoming County.
What is the Unemployment Rate in Lycoming County?
Unemployment Rate in Lycoming County is 5.3%.