Luzerne County, PA Map & Demographics
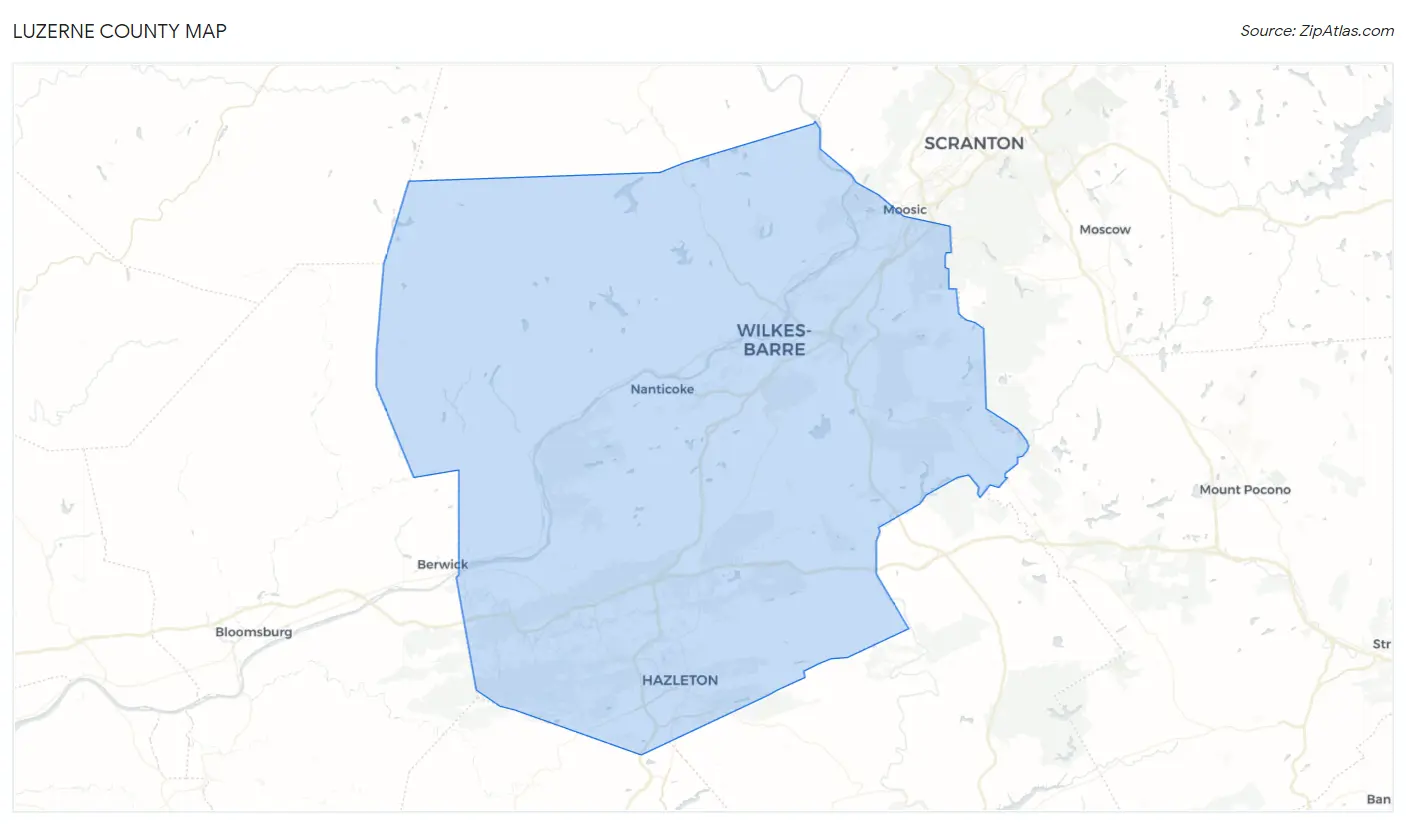
Luzerne County Map
Luzerne County Overview
$33,535
PER CAPITA INCOME
$78,501
AVG FAMILY INCOME
$60,836
AVG HOUSEHOLD INCOME
28.2%
WAGE / INCOME GAP [ % ]
71.8¢/ $1
WAGE / INCOME GAP [ $ ]
$11,334
FAMILY INCOME DEFICIT
0.45
INEQUALITY / GINI INDEX
325,396
TOTAL POPULATION
162,277
MALE POPULATION
163,119
FEMALE POPULATION
99.48
MALES / 100 FEMALES
100.52
FEMALES / 100 MALES
42.2
MEDIAN AGE
3.0
AVG FAMILY SIZE
2.4
AVG HOUSEHOLD SIZE
163,429
LABOR FORCE [ PEOPLE ]
61.0%
PERCENT IN LABOR FORCE
5.9%
UNEMPLOYMENT RATE
Luzerne County Area Codes
Income in Luzerne County
Income Overview in Luzerne County
Per Capita Income in Luzerne County is $33,535, while median incomes of families and households are $78,501 and $60,836 respectively.
| Characteristic | Number | Measure |
| Per Capita Income | 325,396 | $33,535 |
| Median Family Income | 81,984 | $78,501 |
| Mean Family Income | 81,984 | $95,870 |
| Median Household Income | 132,608 | $60,836 |
| Mean Household Income | 132,608 | $79,791 |
| Income Deficit | 81,984 | $11,334 |
| Wage / Income Gap (%) | 325,396 | 28.22% |
| Wage / Income Gap ($) | 325,396 | 71.78¢ per $1 |
| Gini / Inequality Index | 325,396 | 0.45 |
Earnings by Sex in Luzerne County
Average Earnings in Luzerne County are $37,352, $44,658 for men and $32,055 for women, a difference of 28.2%.
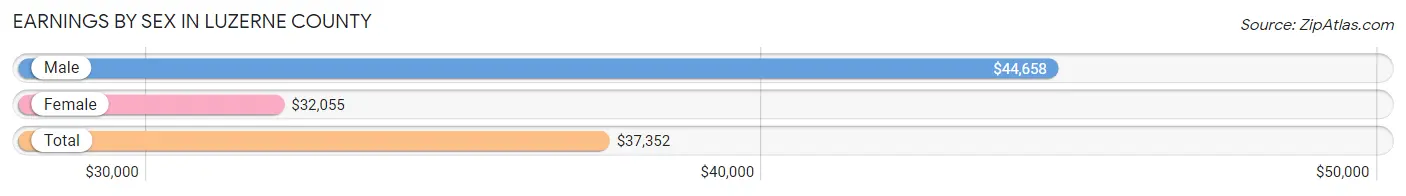
| Sex | Number | Average Earnings |
| Male | 89,813 (52.4%) | $44,658 |
| Female | 81,528 (47.6%) | $32,055 |
| Total | 171,341 (100.0%) | $37,352 |
Earnings by Sex by Income Bracket in Luzerne County
The most common earnings brackets in Luzerne County are $75,000 to $99,999 for men (10,924 | 12.2%) and $30,000 to $34,999 for women (6,615 | 8.1%).
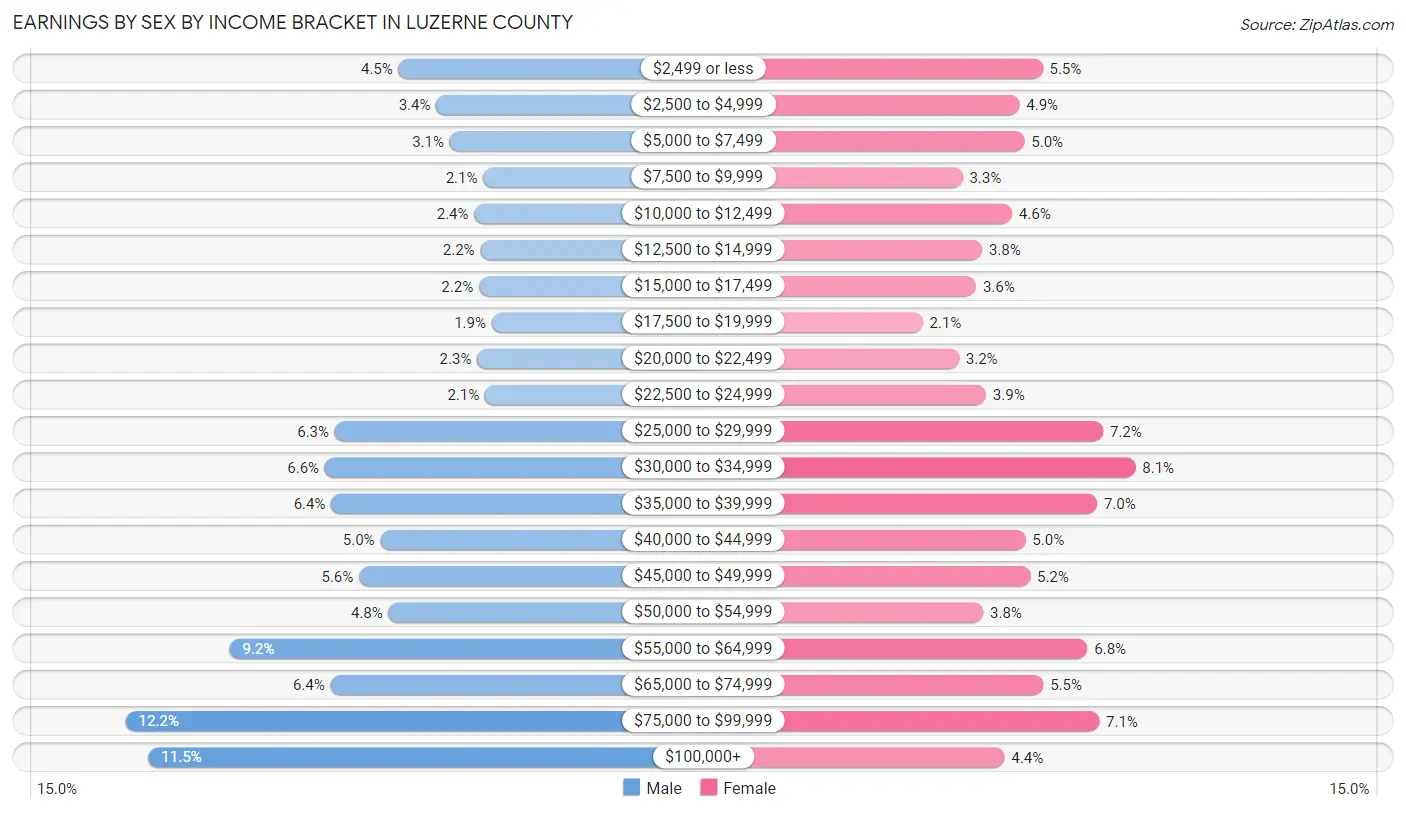
| Income | Male | Female |
| $2,499 or less | 4,031 (4.5%) | 4,483 (5.5%) |
| $2,500 to $4,999 | 3,082 (3.4%) | 3,958 (4.9%) |
| $5,000 to $7,499 | 2,741 (3.0%) | 4,072 (5.0%) |
| $7,500 to $9,999 | 1,891 (2.1%) | 2,650 (3.3%) |
| $10,000 to $12,499 | 2,122 (2.4%) | 3,779 (4.6%) |
| $12,500 to $14,999 | 1,964 (2.2%) | 3,095 (3.8%) |
| $15,000 to $17,499 | 2,004 (2.2%) | 2,962 (3.6%) |
| $17,500 to $19,999 | 1,682 (1.9%) | 1,738 (2.1%) |
| $20,000 to $22,499 | 2,049 (2.3%) | 2,568 (3.2%) |
| $22,500 to $24,999 | 1,846 (2.1%) | 3,189 (3.9%) |
| $25,000 to $29,999 | 5,644 (6.3%) | 5,874 (7.2%) |
| $30,000 to $34,999 | 5,890 (6.6%) | 6,615 (8.1%) |
| $35,000 to $39,999 | 5,734 (6.4%) | 5,734 (7.0%) |
| $40,000 to $44,999 | 4,493 (5.0%) | 4,093 (5.0%) |
| $45,000 to $49,999 | 5,032 (5.6%) | 4,199 (5.1%) |
| $50,000 to $54,999 | 4,286 (4.8%) | 3,123 (3.8%) |
| $55,000 to $64,999 | 8,303 (9.2%) | 5,508 (6.8%) |
| $65,000 to $74,999 | 5,749 (6.4%) | 4,497 (5.5%) |
| $75,000 to $99,999 | 10,924 (12.2%) | 5,779 (7.1%) |
| $100,000+ | 10,346 (11.5%) | 3,612 (4.4%) |
| Total | 89,813 (100.0%) | 81,528 (100.0%) |
Earnings by Sex by Educational Attainment in Luzerne County
Average earnings in Luzerne County are $50,389 for men and $35,718 for women, a difference of 29.1%. Men with an educational attainment of graduate degree enjoy the highest average annual earnings of $86,499, while those with less than high school education earn the least with $34,877. Women with an educational attainment of graduate degree earn the most with the average annual earnings of $70,572, while those with less than high school education have the smallest earnings of $21,464.
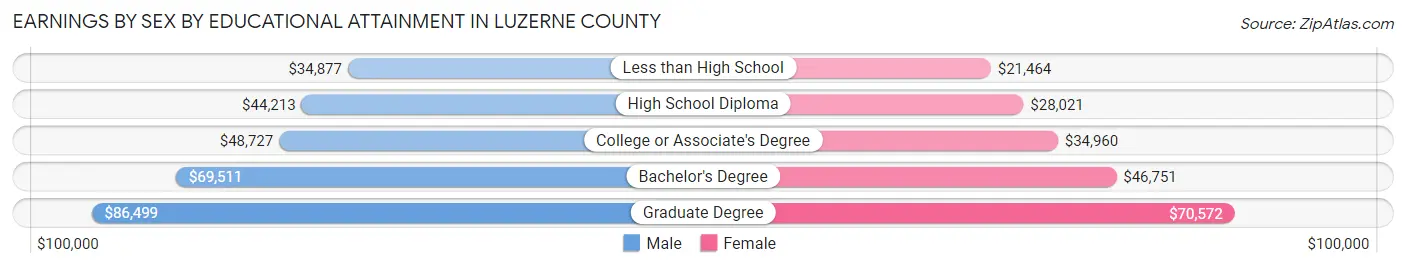
| Educational Attainment | Male Income | Female Income |
| Less than High School | $34,877 | $21,464 |
| High School Diploma | $44,213 | $28,021 |
| College or Associate's Degree | $48,727 | $34,960 |
| Bachelor's Degree | $69,511 | $46,751 |
| Graduate Degree | $86,499 | $70,572 |
| Total | $50,389 | $35,718 |
Family Income in Luzerne County
Family Income Brackets in Luzerne County
According to the Luzerne County family income data, there are 16,479 families falling into the $100,000 to $149,999 income range, which is the most common income bracket and makes up 20.1% of all families. Conversely, the $10,000 to $14,999 income bracket is the least frequent group with only 2,296 families (2.8%) belonging to this category.
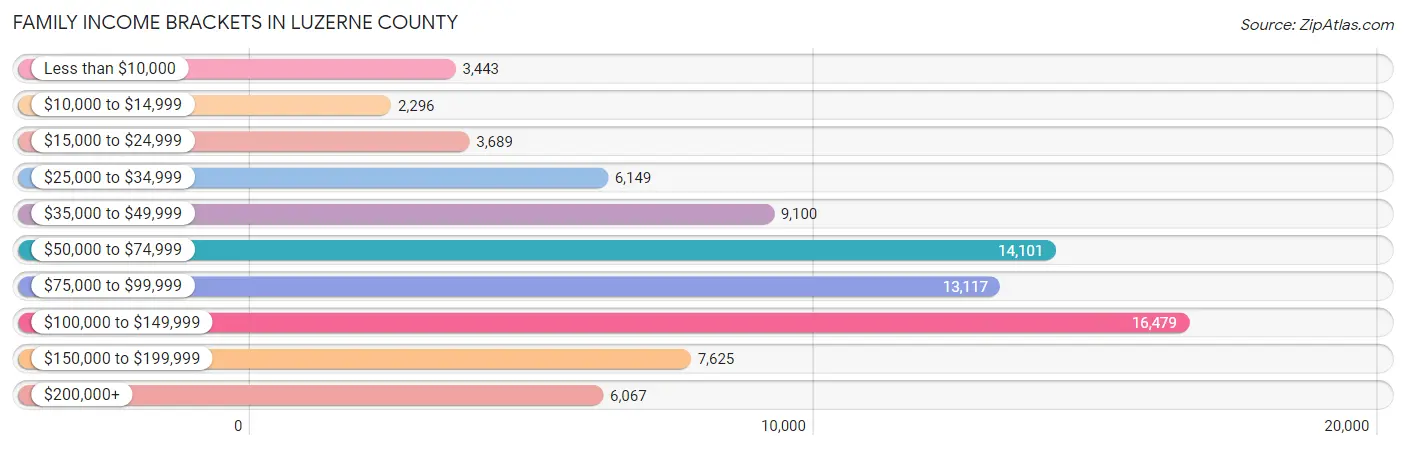
| Income Bracket | # Families | % Families |
| Less than $10,000 | 3,443 | 4.2% |
| $10,000 to $14,999 | 2,296 | 2.8% |
| $15,000 to $24,999 | 3,689 | 4.5% |
| $25,000 to $34,999 | 6,149 | 7.5% |
| $35,000 to $49,999 | 9,100 | 11.1% |
| $50,000 to $74,999 | 14,101 | 17.2% |
| $75,000 to $99,999 | 13,117 | 16.0% |
| $100,000 to $149,999 | 16,479 | 20.1% |
| $150,000 to $199,999 | 7,625 | 9.3% |
| $200,000+ | 6,067 | 7.4% |
Family Income by Famaliy Size in Luzerne County
4-person families (12,813 | 15.6%) account for the highest median family income in Luzerne County with $99,114 per family, while 2-person families (41,801 | 51.0%) have the highest median income of $35,198 per family member.
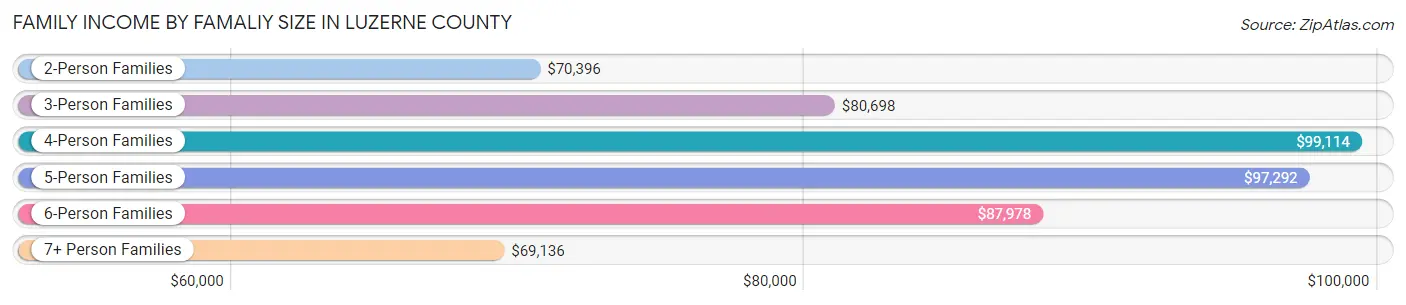
| Income Bracket | # Families | Median Income |
| 2-Person Families | 41,801 (51.0%) | $70,396 |
| 3-Person Families | 19,325 (23.6%) | $80,698 |
| 4-Person Families | 12,813 (15.6%) | $99,114 |
| 5-Person Families | 5,323 (6.5%) | $97,292 |
| 6-Person Families | 1,507 (1.8%) | $87,978 |
| 7+ Person Families | 1,215 (1.5%) | $69,136 |
| Total | 81,984 (100.0%) | $78,501 |
Family Income by Number of Earners in Luzerne County
The median family income in Luzerne County is $78,501, with families comprising 3+ earners (10,364) having the highest median family income of $132,019, while families with no earners (13,359) have the lowest median family income of $42,107, accounting for 12.6% and 16.3% of families, respectively.
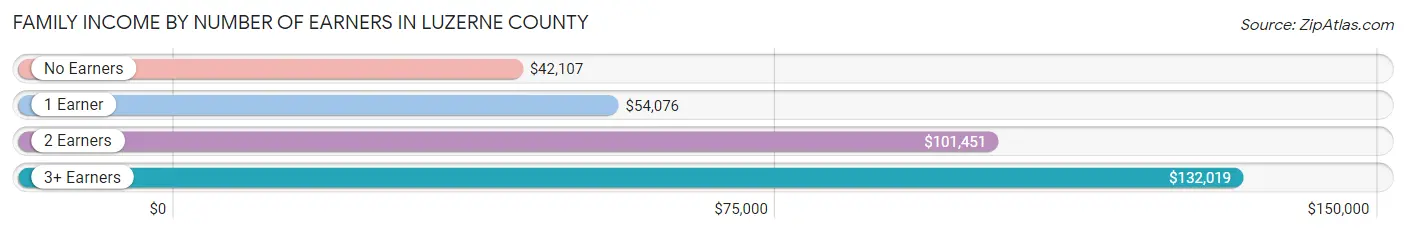
| Number of Earners | # Families | Median Income |
| No Earners | 13,359 (16.3%) | $42,107 |
| 1 Earner | 27,209 (33.2%) | $54,076 |
| 2 Earners | 31,052 (37.9%) | $101,451 |
| 3+ Earners | 10,364 (12.6%) | $132,019 |
| Total | 81,984 (100.0%) | $78,501 |
Household Income in Luzerne County
Household Income Brackets in Luzerne County
With 22,543 households falling in the category, the $50,000 to $74,999 income range is the most frequent in Luzerne County, accounting for 17.0% of all households. In contrast, only 7,028 households (5.3%) fall into the $10,000 to $14,999 income bracket, making it the least populous group.
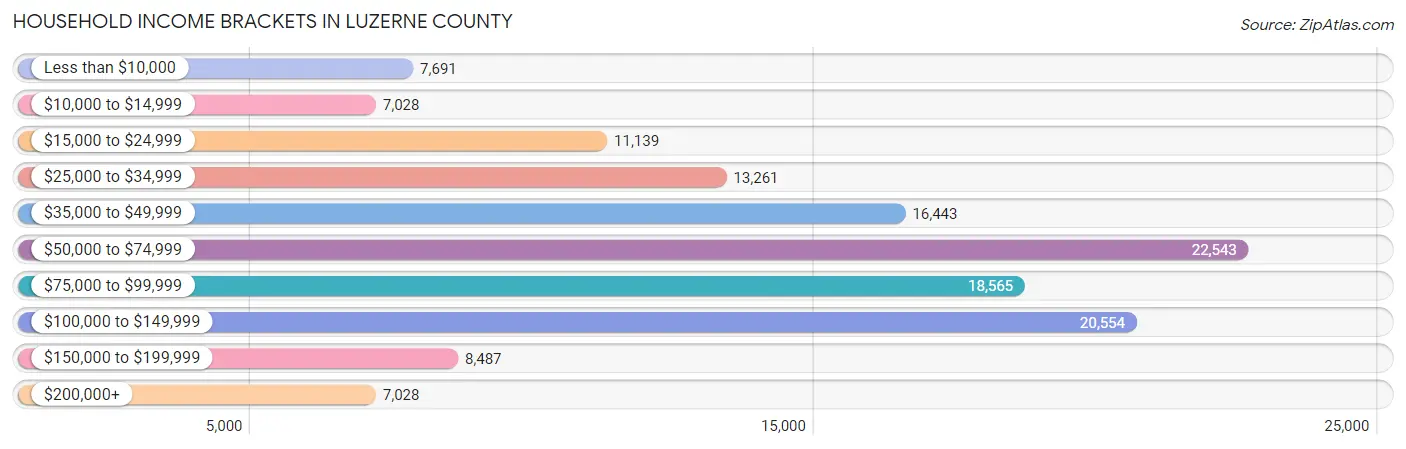
| Income Bracket | # Households | % Households |
| Less than $10,000 | 7,691 | 5.8% |
| $10,000 to $14,999 | 7,028 | 5.3% |
| $15,000 to $24,999 | 11,139 | 8.4% |
| $25,000 to $34,999 | 13,261 | 10.0% |
| $35,000 to $49,999 | 16,443 | 12.4% |
| $50,000 to $74,999 | 22,543 | 17.0% |
| $75,000 to $99,999 | 18,565 | 14.0% |
| $100,000 to $149,999 | 20,554 | 15.5% |
| $150,000 to $199,999 | 8,487 | 6.4% |
| $200,000+ | 7,028 | 5.3% |
Household Income by Householder Age in Luzerne County
The median household income in Luzerne County is $60,836, with the highest median household income of $75,858 found in the 45 to 64 years age bracket for the primary householder. A total of 50,447 households (38.0%) fall into this category. Meanwhile, the 15 to 24 years age bracket for the primary householder has the lowest median household income of $30,514, with 3,063 households (2.3%) in this group.
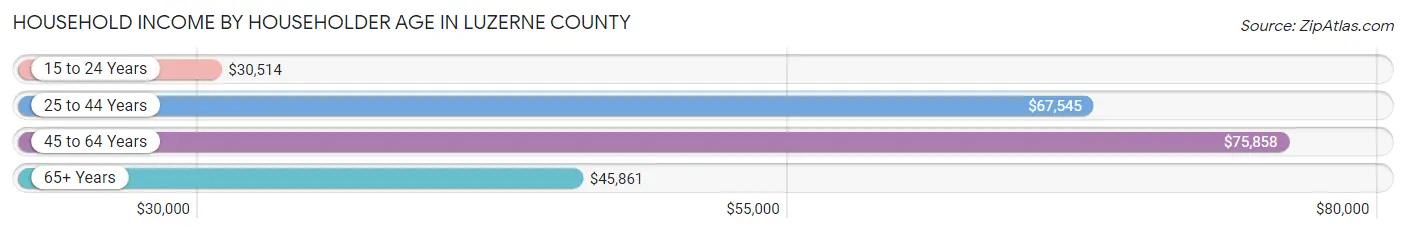
| Income Bracket | # Households | Median Income |
| 15 to 24 Years | 3,063 (2.3%) | $30,514 |
| 25 to 44 Years | 38,024 (28.7%) | $67,545 |
| 45 to 64 Years | 50,447 (38.0%) | $75,858 |
| 65+ Years | 41,074 (31.0%) | $45,861 |
| Total | 132,608 (100.0%) | $60,836 |
Poverty in Luzerne County
Income Below Poverty by Sex and Age in Luzerne County
With 13.5% poverty level for males and 16.3% for females among the residents of Luzerne County, 6 to 11 year old males and under 5 year old females are the most vulnerable to poverty, with 3,092 males (29.3%) and 2,475 females (30.1%) in their respective age groups living below the poverty level.
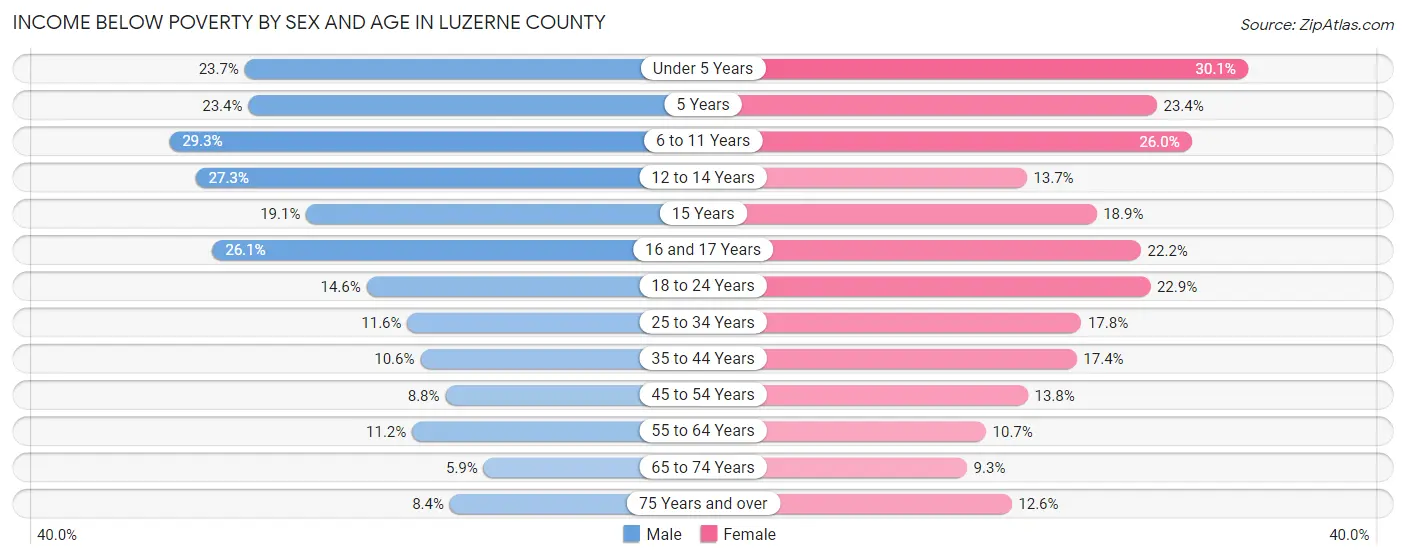
| Age Bracket | Male | Female |
| Under 5 Years | 2,016 (23.7%) | 2,475 (30.1%) |
| 5 Years | 413 (23.4%) | 333 (23.4%) |
| 6 to 11 Years | 3,092 (29.3%) | 2,780 (26.0%) |
| 12 to 14 Years | 1,514 (27.3%) | 686 (13.7%) |
| 15 Years | 400 (19.1%) | 382 (18.9%) |
| 16 and 17 Years | 1,037 (26.1%) | 846 (22.2%) |
| 18 to 24 Years | 1,921 (14.6%) | 2,772 (22.9%) |
| 25 to 34 Years | 2,399 (11.6%) | 3,411 (17.8%) |
| 35 to 44 Years | 2,018 (10.6%) | 3,206 (17.4%) |
| 45 to 54 Years | 1,825 (8.8%) | 2,823 (13.8%) |
| 55 to 64 Years | 2,489 (11.2%) | 2,411 (10.7%) |
| 65 to 74 Years | 1,005 (5.9%) | 1,754 (9.3%) |
| 75 Years and over | 850 (8.4%) | 1,954 (12.6%) |
| Total | 20,979 (13.5%) | 25,833 (16.3%) |
Income Above Poverty by Sex and Age in Luzerne County
According to the poverty statistics in Luzerne County, males aged 65 to 74 years and females aged 65 to 74 years are the age groups that are most secure financially, with 94.1% of males and 90.7% of females in these age groups living above the poverty line.
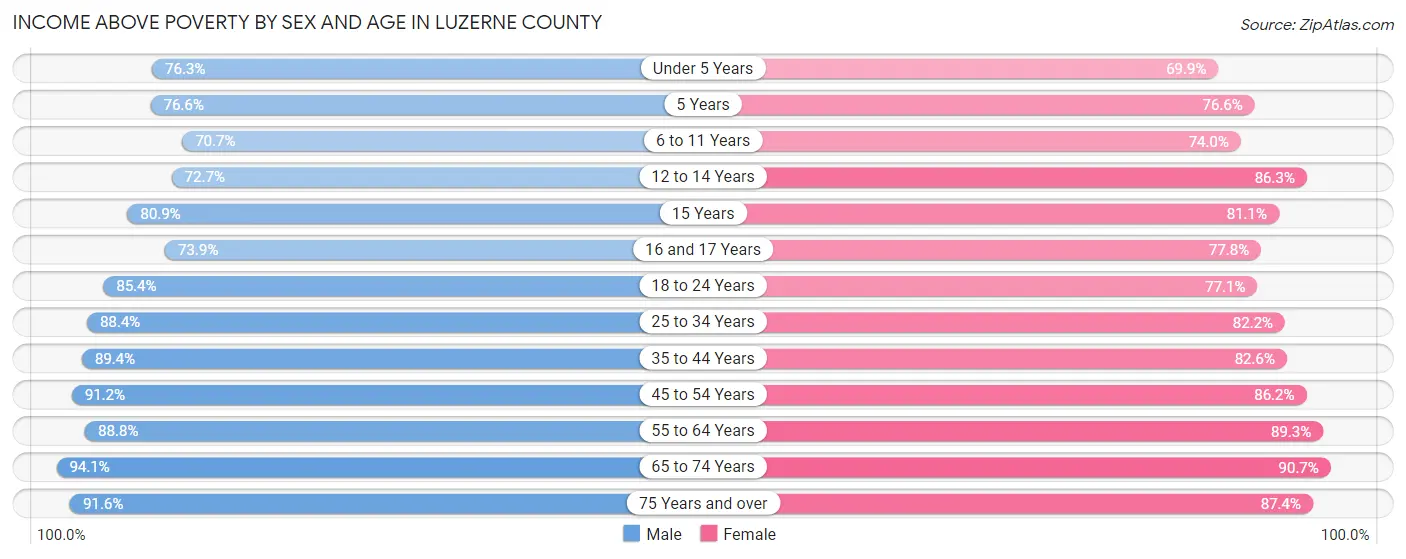
| Age Bracket | Male | Female |
| Under 5 Years | 6,505 (76.3%) | 5,740 (69.9%) |
| 5 Years | 1,353 (76.6%) | 1,092 (76.6%) |
| 6 to 11 Years | 7,476 (70.7%) | 7,928 (74.0%) |
| 12 to 14 Years | 4,032 (72.7%) | 4,318 (86.3%) |
| 15 Years | 1,695 (80.9%) | 1,640 (81.1%) |
| 16 and 17 Years | 2,943 (73.9%) | 2,967 (77.8%) |
| 18 to 24 Years | 11,232 (85.4%) | 9,343 (77.1%) |
| 25 to 34 Years | 18,316 (88.4%) | 15,795 (82.2%) |
| 35 to 44 Years | 16,978 (89.4%) | 15,201 (82.6%) |
| 45 to 54 Years | 19,008 (91.2%) | 17,653 (86.2%) |
| 55 to 64 Years | 19,682 (88.8%) | 20,163 (89.3%) |
| 65 to 74 Years | 15,962 (94.1%) | 17,166 (90.7%) |
| 75 Years and over | 9,237 (91.6%) | 13,567 (87.4%) |
| Total | 134,419 (86.5%) | 132,573 (83.7%) |
Income Below Poverty Among Married-Couple Families in Luzerne County
The poverty statistics for married-couple families in Luzerne County show that 4.2% or 2,350 of the total 55,843 families live below the poverty line. Families with 5 or more children have the highest poverty rate of 31.3%, comprising of 126 families. On the other hand, families with no children have the lowest poverty rate of 2.9%, which includes 1,074 families.
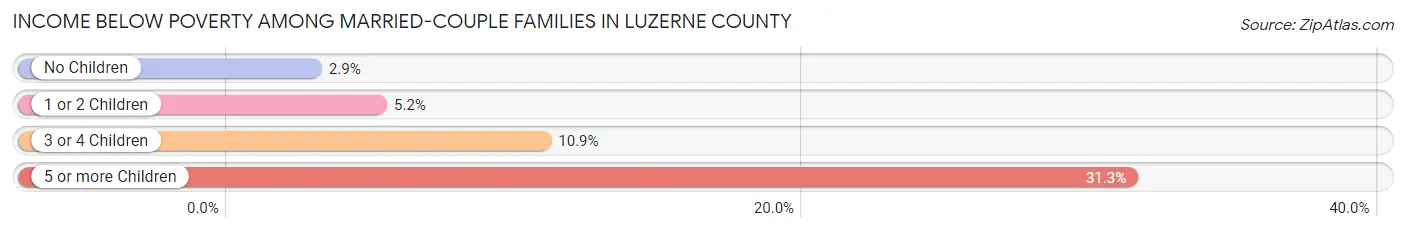
| Children | Above Poverty | Below Poverty |
| No Children | 35,650 (97.1%) | 1,074 (2.9%) |
| 1 or 2 Children | 14,792 (94.8%) | 810 (5.2%) |
| 3 or 4 Children | 2,775 (89.1%) | 340 (10.9%) |
| 5 or more Children | 276 (68.7%) | 126 (31.3%) |
| Total | 53,493 (95.8%) | 2,350 (4.2%) |
Income Below Poverty Among Single-Parent Households in Luzerne County
According to the poverty data in Luzerne County, 16.4% or 1,264 single-father households and 29.5% or 5,440 single-mother households are living below the poverty line. Among single-father households, those with 5 or more children have the highest poverty rate, with 7 households (100.0%) experiencing poverty. Likewise, among single-mother households, those with 5 or more children have the highest poverty rate, with 239 households (86.3%) falling below the poverty line.
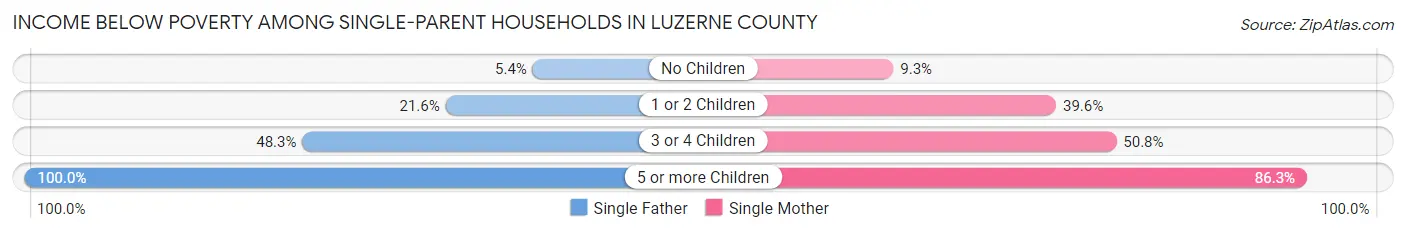
| Children | Single Father | Single Mother |
| No Children | 188 (5.4%) | 665 (9.2%) |
| 1 or 2 Children | 774 (21.6%) | 3,641 (39.6%) |
| 3 or 4 Children | 295 (48.3%) | 895 (50.8%) |
| 5 or more Children | 7 (100.0%) | 239 (86.3%) |
| Total | 1,264 (16.4%) | 5,440 (29.5%) |
Income Below Poverty Among Married-Couple vs Single-Parent Households in Luzerne County
The poverty data for Luzerne County shows that 2,350 of the married-couple family households (4.2%) and 6,704 of the single-parent households (25.7%) are living below the poverty level. Within the married-couple family households, those with 5 or more children have the highest poverty rate, with 126 households (31.3%) falling below the poverty line. Among the single-parent households, those with 5 or more children have the highest poverty rate, with 246 household (86.6%) living below poverty.
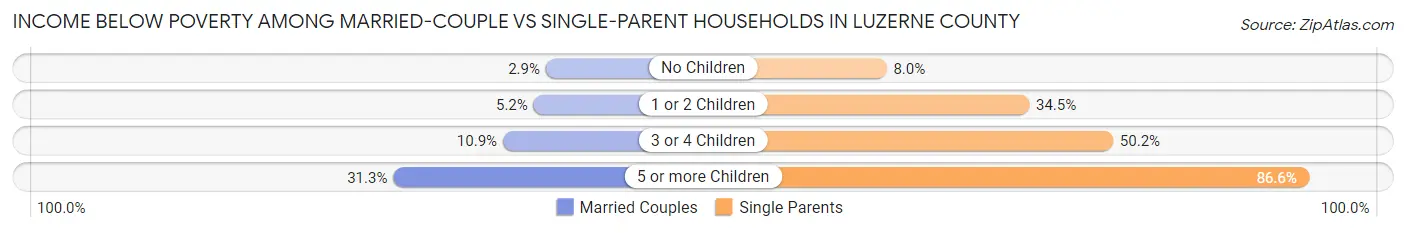
| Children | Married-Couple Families | Single-Parent Households |
| No Children | 1,074 (2.9%) | 853 (8.0%) |
| 1 or 2 Children | 810 (5.2%) | 4,415 (34.5%) |
| 3 or 4 Children | 340 (10.9%) | 1,190 (50.1%) |
| 5 or more Children | 126 (31.3%) | 246 (86.6%) |
| Total | 2,350 (4.2%) | 6,704 (25.7%) |
Race in Luzerne County
The most populous races in Luzerne County are White / Caucasian (262,196 | 80.6%), Hispanic or Latino (49,024 | 15.1%), and Some other Race (21,367 | 6.6%).
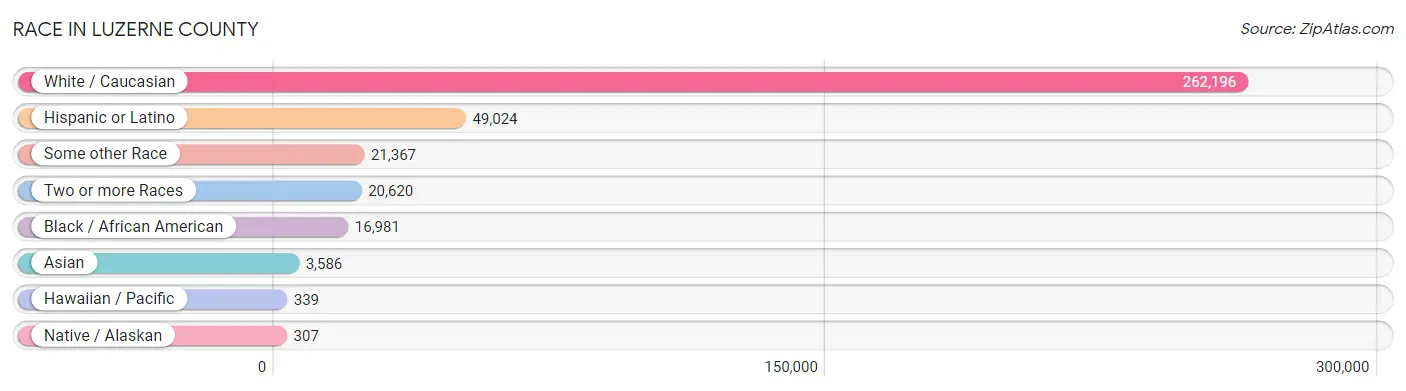
| Race | # Population | % Population |
| Asian | 3,586 | 1.1% |
| Black / African American | 16,981 | 5.2% |
| Hawaiian / Pacific | 339 | 0.1% |
| Hispanic or Latino | 49,024 | 15.1% |
| Native / Alaskan | 307 | 0.1% |
| White / Caucasian | 262,196 | 80.6% |
| Two or more Races | 20,620 | 6.3% |
| Some other Race | 21,367 | 6.6% |
| Total | 325,396 | 100.0% |
Ancestry in Luzerne County
The most populous ancestries reported in Luzerne County are Polish (56,383 | 17.3%), Irish (54,728 | 16.8%), Italian (49,373 | 15.2%), German (47,395 | 14.6%), and Dominican (22,672 | 7.0%), together accounting for 70.9% of all Luzerne County residents.
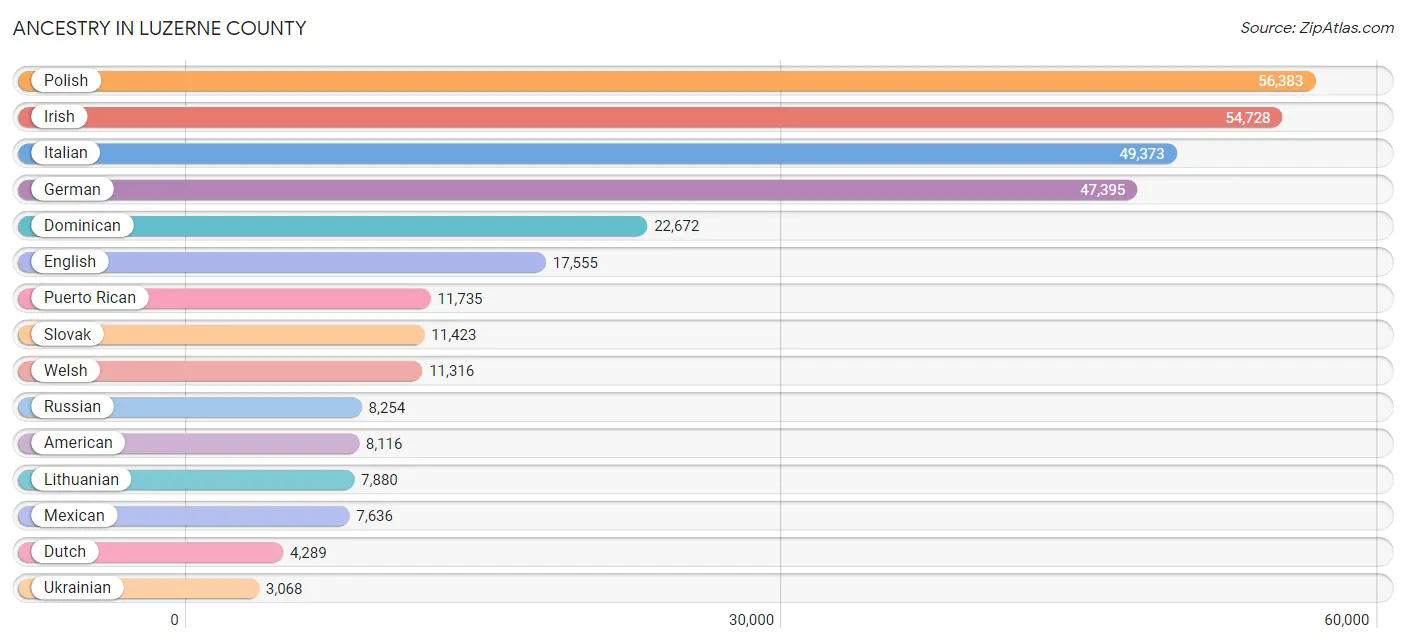
| Ancestry | # Population | % Population |
| African | 1,257 | 0.4% |
| Albanian | 99 | 0.0% |
| American | 8,116 | 2.5% |
| Apache | 5 | 0.0% |
| Arab | 2,423 | 0.7% |
| Argentinean | 39 | 0.0% |
| Armenian | 51 | 0.0% |
| Australian | 28 | 0.0% |
| Austrian | 1,451 | 0.4% |
| Bangladeshi | 297 | 0.1% |
| Belgian | 63 | 0.0% |
| Belizean | 4 | 0.0% |
| Bhutanese | 293 | 0.1% |
| Blackfeet | 189 | 0.1% |
| Bolivian | 52 | 0.0% |
| Brazilian | 111 | 0.0% |
| British | 714 | 0.2% |
| British West Indian | 86 | 0.0% |
| Bulgarian | 9 | 0.0% |
| Burmese | 890 | 0.3% |
| Canadian | 155 | 0.1% |
| Carpatho Rusyn | 171 | 0.1% |
| Celtic | 3 | 0.0% |
| Central American | 1,874 | 0.6% |
| Central American Indian | 224 | 0.1% |
| Cherokee | 312 | 0.1% |
| Chickasaw | 9 | 0.0% |
| Chilean | 276 | 0.1% |
| Chippewa | 13 | 0.0% |
| Colombian | 704 | 0.2% |
| Creek | 10 | 0.0% |
| Croatian | 134 | 0.0% |
| Cuban | 206 | 0.1% |
| Cypriot | 3 | 0.0% |
| Czech | 928 | 0.3% |
| Czechoslovakian | 879 | 0.3% |
| Danish | 175 | 0.1% |
| Delaware | 21 | 0.0% |
| Dominican | 22,672 | 7.0% |
| Dutch | 4,289 | 1.3% |
| Eastern European | 1,748 | 0.5% |
| Ecuadorian | 749 | 0.2% |
| Egyptian | 122 | 0.0% |
| English | 17,555 | 5.4% |
| Ethiopian | 174 | 0.1% |
| European | 2,190 | 0.7% |
| Filipino | 15 | 0.0% |
| Finnish | 220 | 0.1% |
| French | 2,782 | 0.9% |
| French American Indian | 2 | 0.0% |
| French Canadian | 540 | 0.2% |
| German | 47,395 | 14.6% |
| Ghanaian | 146 | 0.0% |
| Greek | 1,799 | 0.5% |
| Guamanian / Chamorro | 115 | 0.0% |
| Guatemalan | 504 | 0.2% |
| Guyanese | 144 | 0.0% |
| Haitian | 120 | 0.0% |
| Honduran | 358 | 0.1% |
| Hungarian | 1,333 | 0.4% |
| Indian (Asian) | 906 | 0.3% |
| Iranian | 45 | 0.0% |
| Iraqi | 195 | 0.1% |
| Irish | 54,728 | 16.8% |
| Iroquois | 52 | 0.0% |
| Israeli | 27 | 0.0% |
| Italian | 49,373 | 15.2% |
| Jamaican | 865 | 0.3% |
| Jordanian | 38 | 0.0% |
| Kenyan | 20 | 0.0% |
| Korean | 834 | 0.3% |
| Latvian | 57 | 0.0% |
| Lebanese | 1,265 | 0.4% |
| Liberian | 41 | 0.0% |
| Lithuanian | 7,880 | 2.4% |
| Luxembourger | 7 | 0.0% |
| Macedonian | 4 | 0.0% |
| Mexican | 7,636 | 2.4% |
| Mexican American Indian | 2 | 0.0% |
| Mongolian | 4 | 0.0% |
| Moroccan | 23 | 0.0% |
| Native Hawaiian | 286 | 0.1% |
| Navajo | 5 | 0.0% |
| Nicaraguan | 13 | 0.0% |
| Nigerian | 27 | 0.0% |
| Northern European | 110 | 0.0% |
| Norwegian | 806 | 0.3% |
| Osage | 2 | 0.0% |
| Pakistani | 4 | 0.0% |
| Panamanian | 190 | 0.1% |
| Pennsylvania German | 3,063 | 0.9% |
| Peruvian | 126 | 0.0% |
| Polish | 56,383 | 17.3% |
| Portuguese | 869 | 0.3% |
| Puerto Rican | 11,735 | 3.6% |
| Romanian | 340 | 0.1% |
| Russian | 8,254 | 2.5% |
| Salvadoran | 664 | 0.2% |
| Samoan | 75 | 0.0% |
| Scandinavian | 381 | 0.1% |
| Scotch-Irish | 1,040 | 0.3% |
| Scottish | 2,233 | 0.7% |
| Seminole | 2 | 0.0% |
| Serbian | 289 | 0.1% |
| Sioux | 18 | 0.0% |
| Slavic | 321 | 0.1% |
| Slovak | 11,423 | 3.5% |
| Slovene | 104 | 0.0% |
| South African | 15 | 0.0% |
| South American | 2,208 | 0.7% |
| Soviet Union | 16 | 0.0% |
| Spaniard | 545 | 0.2% |
| Spanish | 187 | 0.1% |
| Spanish American | 44 | 0.0% |
| Sri Lankan | 436 | 0.1% |
| Subsaharan African | 1,737 | 0.5% |
| Swedish | 969 | 0.3% |
| Swiss | 469 | 0.1% |
| Syrian | 665 | 0.2% |
| Thai | 1,433 | 0.4% |
| Tongan | 1 | 0.0% |
| Trinidadian and Tobagonian | 73 | 0.0% |
| Turkish | 142 | 0.0% |
| Ukrainian | 3,068 | 0.9% |
| Uruguayan | 14 | 0.0% |
| Venezuelan | 248 | 0.1% |
| Vietnamese | 25 | 0.0% |
| Welsh | 11,316 | 3.5% |
| West Indian | 307 | 0.1% |
| Yugoslavian | 346 | 0.1% | View All 130 Rows |
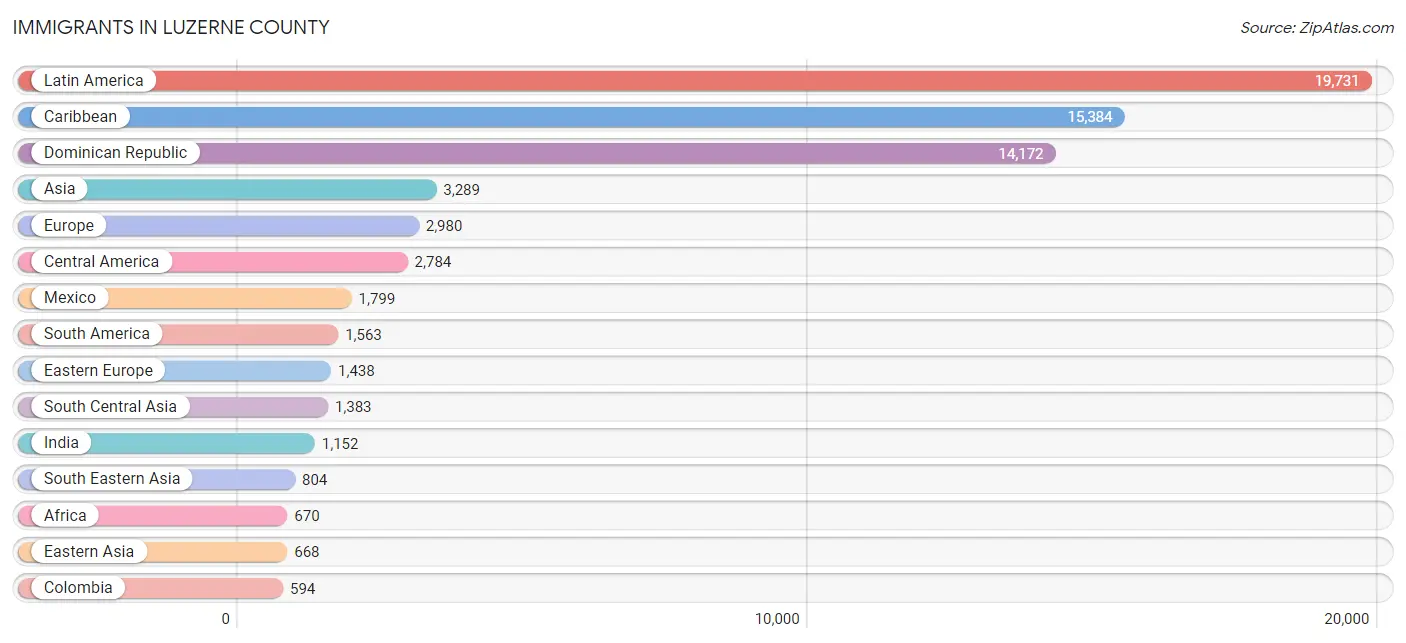
Immigrants in Luzerne County
The most numerous immigrant groups reported in Luzerne County came from Latin America (19,731 | 6.1%), Caribbean (15,384 | 4.7%), Dominican Republic (14,172 | 4.4%), Asia (3,289 | 1.0%), and Europe (2,980 | 0.9%), together accounting for 17.1% of all Luzerne County residents.
| Immigration Origin | # Population | % Population |
| Africa | 670 | 0.2% |
| Albania | 64 | 0.0% |
| Argentina | 44 | 0.0% |
| Asia | 3,289 | 1.0% |
| Australia | 12 | 0.0% |
| Austria | 121 | 0.0% |
| Bangladesh | 15 | 0.0% |
| Barbados | 45 | 0.0% |
| Belarus | 12 | 0.0% |
| Belize | 1 | 0.0% |
| Bolivia | 52 | 0.0% |
| Brazil | 64 | 0.0% |
| Bulgaria | 3 | 0.0% |
| Canada | 294 | 0.1% |
| Caribbean | 15,384 | 4.7% |
| Central America | 2,784 | 0.9% |
| Chile | 14 | 0.0% |
| China | 297 | 0.1% |
| Colombia | 594 | 0.2% |
| Cuba | 10 | 0.0% |
| Czechoslovakia | 21 | 0.0% |
| Dominica | 477 | 0.2% |
| Dominican Republic | 14,172 | 4.4% |
| Eastern Africa | 138 | 0.0% |
| Eastern Asia | 668 | 0.2% |
| Eastern Europe | 1,438 | 0.4% |
| Ecuador | 321 | 0.1% |
| Egypt | 26 | 0.0% |
| El Salvador | 203 | 0.1% |
| England | 170 | 0.1% |
| Ethiopia | 88 | 0.0% |
| Europe | 2,980 | 0.9% |
| France | 8 | 0.0% |
| Germany | 370 | 0.1% |
| Ghana | 104 | 0.0% |
| Greece | 51 | 0.0% |
| Grenada | 9 | 0.0% |
| Guatemala | 528 | 0.2% |
| Guyana | 102 | 0.0% |
| Haiti | 53 | 0.0% |
| Honduras | 139 | 0.0% |
| Hong Kong | 2 | 0.0% |
| Hungary | 58 | 0.0% |
| India | 1,152 | 0.4% |
| Indonesia | 36 | 0.0% |
| Iran | 25 | 0.0% |
| Iraq | 141 | 0.0% |
| Ireland | 106 | 0.0% |
| Israel | 16 | 0.0% |
| Italy | 282 | 0.1% |
| Jamaica | 448 | 0.1% |
| Japan | 62 | 0.0% |
| Jordan | 17 | 0.0% |
| Kazakhstan | 9 | 0.0% |
| Kenya | 20 | 0.0% |
| Korea | 309 | 0.1% |
| Kuwait | 6 | 0.0% |
| Laos | 88 | 0.0% |
| Latin America | 19,731 | 6.1% |
| Latvia | 5 | 0.0% |
| Lebanon | 8 | 0.0% |
| Liberia | 41 | 0.0% |
| Lithuania | 31 | 0.0% |
| Malaysia | 6 | 0.0% |
| Mexico | 1,799 | 0.5% |
| Middle Africa | 42 | 0.0% |
| Moldova | 10 | 0.0% |
| Morocco | 22 | 0.0% |
| Netherlands | 49 | 0.0% |
| Nicaragua | 2 | 0.0% |
| Nigeria | 30 | 0.0% |
| North Macedonia | 4 | 0.0% |
| Northern Africa | 56 | 0.0% |
| Northern Europe | 422 | 0.1% |
| Norway | 21 | 0.0% |
| Oceania | 28 | 0.0% |
| Pakistan | 97 | 0.0% |
| Panama | 112 | 0.0% |
| Peru | 95 | 0.0% |
| Philippines | 424 | 0.1% |
| Poland | 458 | 0.1% |
| Portugal | 43 | 0.0% |
| Romania | 126 | 0.0% |
| Russia | 144 | 0.0% |
| Scotland | 4 | 0.0% |
| Senegal | 39 | 0.0% |
| Serbia | 54 | 0.0% |
| South America | 1,563 | 0.5% |
| South Central Asia | 1,383 | 0.4% |
| South Eastern Asia | 804 | 0.3% |
| Southern Europe | 572 | 0.2% |
| Spain | 196 | 0.1% |
| St. Vincent and the Grenadines | 118 | 0.0% |
| Sweden | 10 | 0.0% |
| Syria | 8 | 0.0% |
| Taiwan | 7 | 0.0% |
| Thailand | 3 | 0.0% |
| Trinidad and Tobago | 7 | 0.0% |
| Turkey | 115 | 0.0% |
| Ukraine | 208 | 0.1% |
| Uruguay | 21 | 0.0% |
| Venezuela | 256 | 0.1% |
| Vietnam | 247 | 0.1% |
| Western Africa | 259 | 0.1% |
| Western Asia | 421 | 0.1% |
| Western Europe | 548 | 0.2% |
| Zaire | 24 | 0.0% | View All 107 Rows |
Sex and Age in Luzerne County
Sex and Age in Luzerne County
The most populous age groups in Luzerne County are 60 to 64 Years (11,734 | 7.2%) for men and 55 to 59 Years (11,737 | 7.2%) for women.
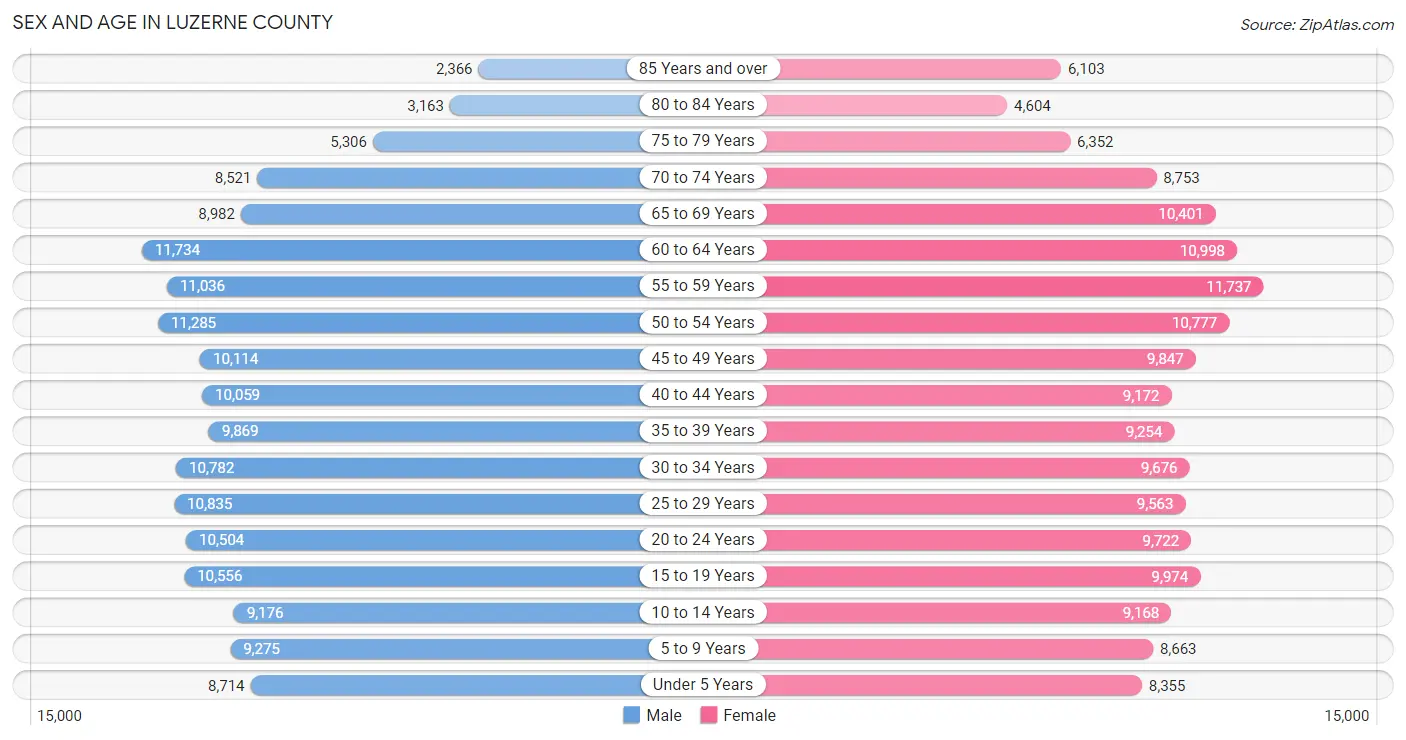
| Age Bracket | Male | Female |
| Under 5 Years | 8,714 (5.4%) | 8,355 (5.1%) |
| 5 to 9 Years | 9,275 (5.7%) | 8,663 (5.3%) |
| 10 to 14 Years | 9,176 (5.7%) | 9,168 (5.6%) |
| 15 to 19 Years | 10,556 (6.5%) | 9,974 (6.1%) |
| 20 to 24 Years | 10,504 (6.5%) | 9,722 (6.0%) |
| 25 to 29 Years | 10,835 (6.7%) | 9,563 (5.9%) |
| 30 to 34 Years | 10,782 (6.6%) | 9,676 (5.9%) |
| 35 to 39 Years | 9,869 (6.1%) | 9,254 (5.7%) |
| 40 to 44 Years | 10,059 (6.2%) | 9,172 (5.6%) |
| 45 to 49 Years | 10,114 (6.2%) | 9,847 (6.0%) |
| 50 to 54 Years | 11,285 (7.0%) | 10,777 (6.6%) |
| 55 to 59 Years | 11,036 (6.8%) | 11,737 (7.2%) |
| 60 to 64 Years | 11,734 (7.2%) | 10,998 (6.7%) |
| 65 to 69 Years | 8,982 (5.5%) | 10,401 (6.4%) |
| 70 to 74 Years | 8,521 (5.2%) | 8,753 (5.4%) |
| 75 to 79 Years | 5,306 (3.3%) | 6,352 (3.9%) |
| 80 to 84 Years | 3,163 (1.9%) | 4,604 (2.8%) |
| 85 Years and over | 2,366 (1.5%) | 6,103 (3.7%) |
| Total | 162,277 (100.0%) | 163,119 (100.0%) |
Families and Households in Luzerne County
Median Family Size in Luzerne County
The median family size in Luzerne County is 2.98 persons per family, with single female/mother families (18,434 | 22.5%) accounting for the largest median family size of 3.03 persons per family. On the other hand, single male/father families (7,707 | 9.4%) represent the smallest median family size with 2.69 persons per family.
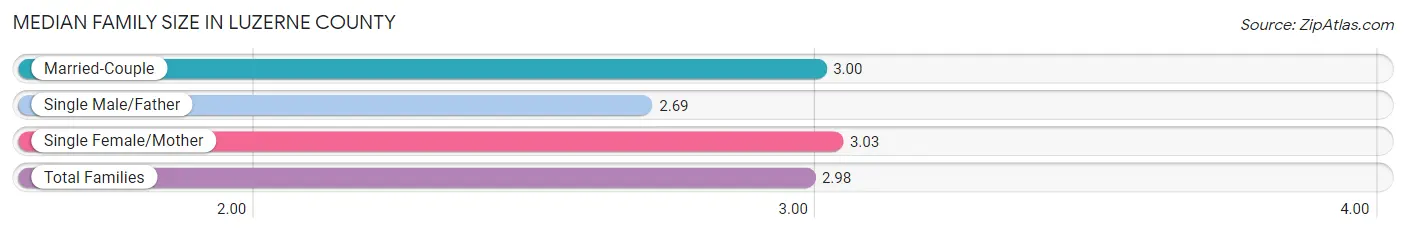
| Family Type | # Families | Family Size |
| Married-Couple | 55,843 (68.1%) | 3.00 |
| Single Male/Father | 7,707 (9.4%) | 2.69 |
| Single Female/Mother | 18,434 (22.5%) | 3.03 |
| Total Families | 81,984 (100.0%) | 2.98 |
Median Household Size in Luzerne County
The median household size in Luzerne County is 2.37 persons per household, with single female/mother households (18,434 | 13.9%) accounting for the largest median household size of 3.27 persons per household. non-family households (50,624 | 38.2%) represent the smallest median household size with 1.22 persons per household.
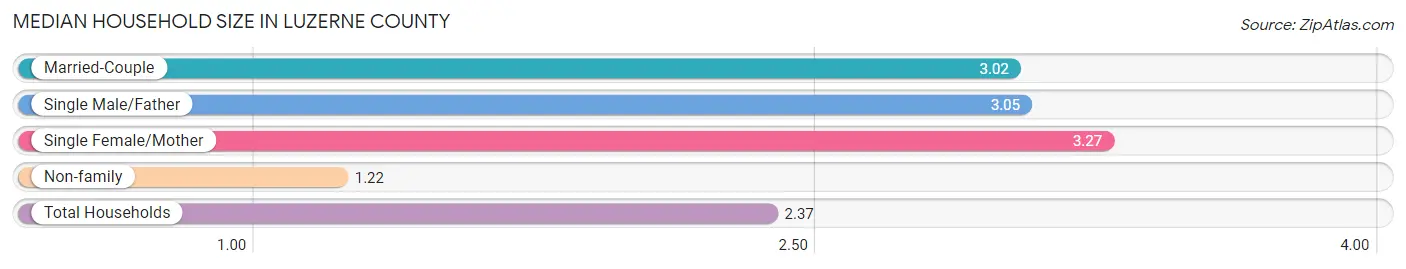
| Household Type | # Households | Household Size |
| Married-Couple | 55,843 (42.1%) | 3.02 |
| Single Male/Father | 7,707 (5.8%) | 3.05 |
| Single Female/Mother | 18,434 (13.9%) | 3.27 |
| Non-family | 50,624 (38.2%) | 1.22 |
| Total Households | 132,608 (100.0%) | 2.37 |
Household Size by Marriage Status in Luzerne County
Out of a total of 132,608 households in Luzerne County, 81,984 (61.8%) are family households, while 50,624 (38.2%) are nonfamily households. The most numerous type of family households are 2-person households, comprising 39,097, and the most common type of nonfamily households are 1-person households, comprising 42,299.
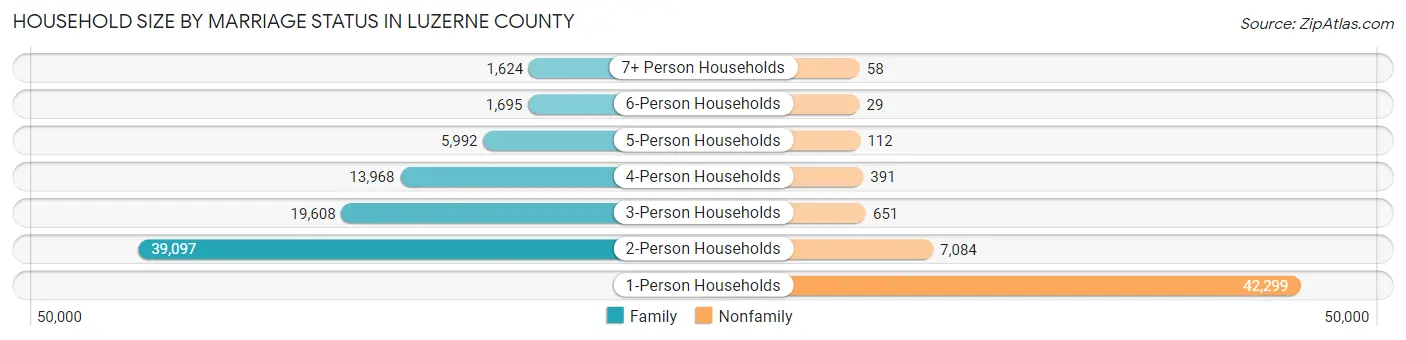
| Household Size | Family Households | Nonfamily Households |
| 1-Person Households | - | 42,299 (31.9%) |
| 2-Person Households | 39,097 (29.5%) | 7,084 (5.3%) |
| 3-Person Households | 19,608 (14.8%) | 651 (0.5%) |
| 4-Person Households | 13,968 (10.5%) | 391 (0.3%) |
| 5-Person Households | 5,992 (4.5%) | 112 (0.1%) |
| 6-Person Households | 1,695 (1.3%) | 29 (0.0%) |
| 7+ Person Households | 1,624 (1.2%) | 58 (0.0%) |
| Total | 81,984 (61.8%) | 50,624 (38.2%) |
Female Fertility in Luzerne County
Fertility by Age in Luzerne County
Average fertility rate in Luzerne County is 53.0 births per 1,000 women. Women in the age bracket of 20 to 34 years have the highest fertility rate with 87.0 births per 1,000 women. Women in the age bracket of 20 to 34 years acount for 68.6% of all women with births.
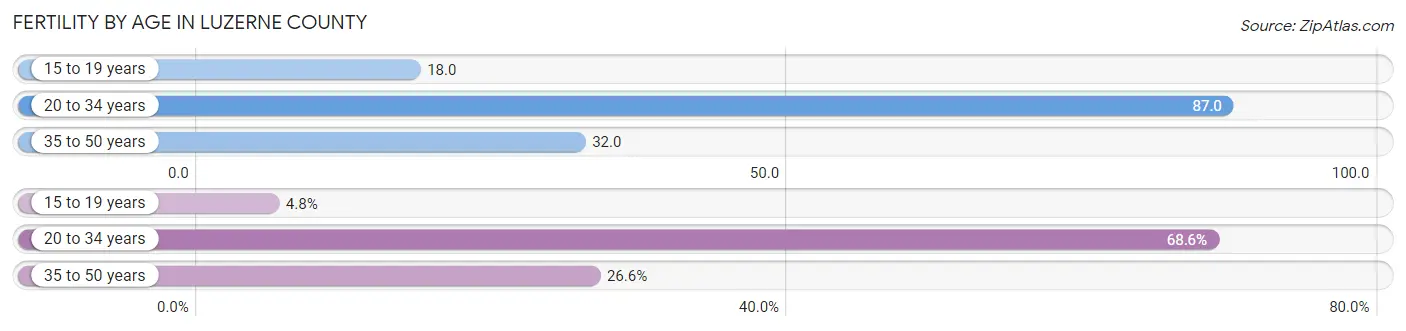
| Age Bracket | Women with Births | Births / 1,000 Women |
| 15 to 19 years | 176 (4.8%) | 18.0 |
| 20 to 34 years | 2,512 (68.6%) | 87.0 |
| 35 to 50 years | 974 (26.6%) | 32.0 |
| Total | 3,662 (100.0%) | 53.0 |
Fertility by Age by Marriage Status in Luzerne County
54.5% of women with births (3,662) in Luzerne County are married. The highest percentage of unmarried women with births falls into 15 to 19 years age bracket with 90.9% of them unmarried at the time of birth, while the lowest percentage of unmarried women with births belong to 35 to 50 years age bracket with 24.4% of them unmarried.
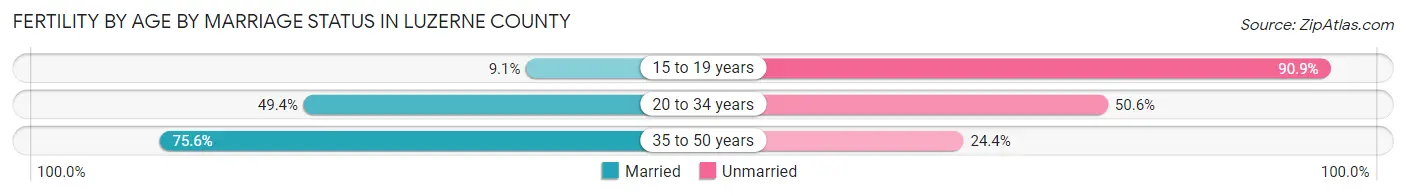
| Age Bracket | Married | Unmarried |
| 15 to 19 years | 16 (9.1%) | 160 (90.9%) |
| 20 to 34 years | 1,241 (49.4%) | 1,271 (50.6%) |
| 35 to 50 years | 736 (75.6%) | 238 (24.4%) |
| Total | 1,996 (54.5%) | 1,666 (45.5%) |
Fertility by Education in Luzerne County
Average fertility rate in Luzerne County is 53.0 births per 1,000 women. Women with the education attainment of college or associate's degree have the highest fertility rate of 62.0 births per 1,000 women, while women with the education attainment of less than high school have the lowest fertility at 28.0 births per 1,000 women. Women with the education attainment of college or associate's degree represent 37.6% of all women with births.
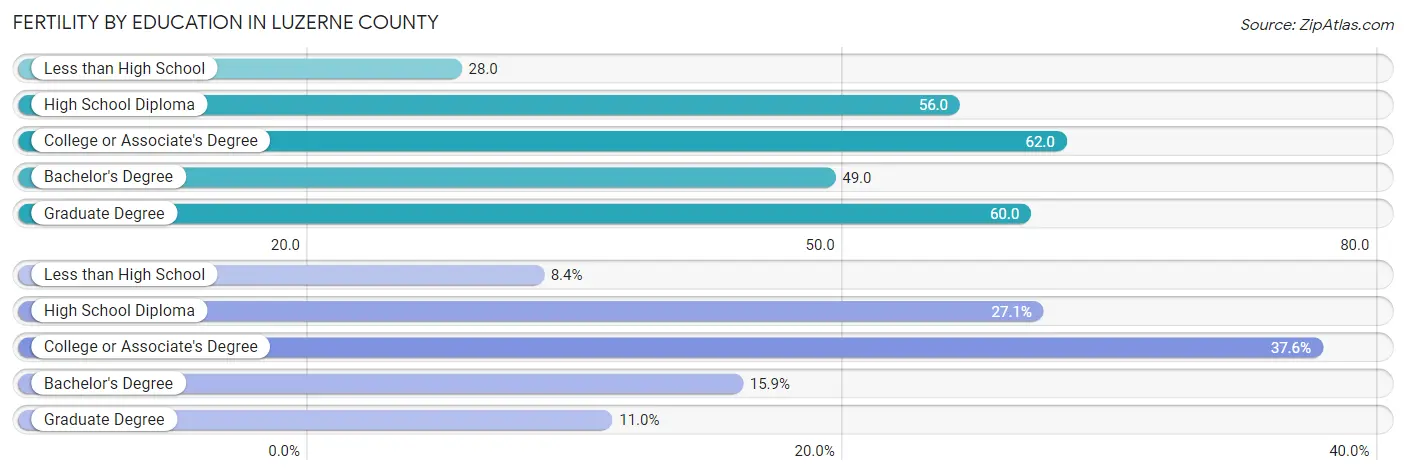
| Educational Attainment | Women with Births | Births / 1,000 Women |
| Less than High School | 308 (8.4%) | 28.0 |
| High School Diploma | 994 (27.1%) | 56.0 |
| College or Associate's Degree | 1,377 (37.6%) | 62.0 |
| Bachelor's Degree | 581 (15.9%) | 49.0 |
| Graduate Degree | 402 (11.0%) | 60.0 |
| Total | 3,662 (100.0%) | 53.0 |
Fertility by Education by Marriage Status in Luzerne County
45.5% of women with births in Luzerne County are unmarried. Women with the educational attainment of graduate degree are most likely to be married with 86.1% of them married at childbirth, while women with the educational attainment of high school diploma are least likely to be married with 67.8% of them unmarried at childbirth.
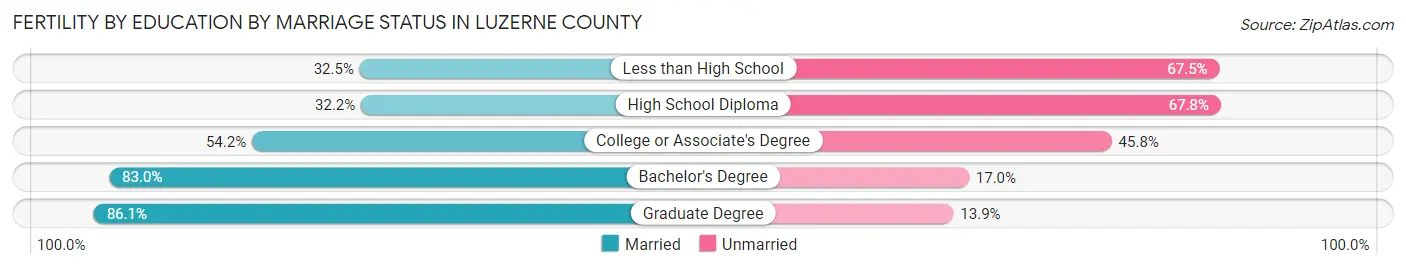
| Educational Attainment | Married | Unmarried |
| Less than High School | 100 (32.5%) | 208 (67.5%) |
| High School Diploma | 320 (32.2%) | 674 (67.8%) |
| College or Associate's Degree | 746 (54.2%) | 631 (45.8%) |
| Bachelor's Degree | 482 (83.0%) | 99 (17.0%) |
| Graduate Degree | 346 (86.1%) | 56 (13.9%) |
| Total | 1,996 (54.5%) | 1,666 (45.5%) |
Employment Characteristics in Luzerne County
Employment by Class of Employer in Luzerne County
Among the 150,800 employed individuals in Luzerne County, private company employees (108,170 | 71.7%), not-for-profit organizations (13,171 | 8.7%), and local government employees (9,268 | 6.1%) make up the most common classes of employment.
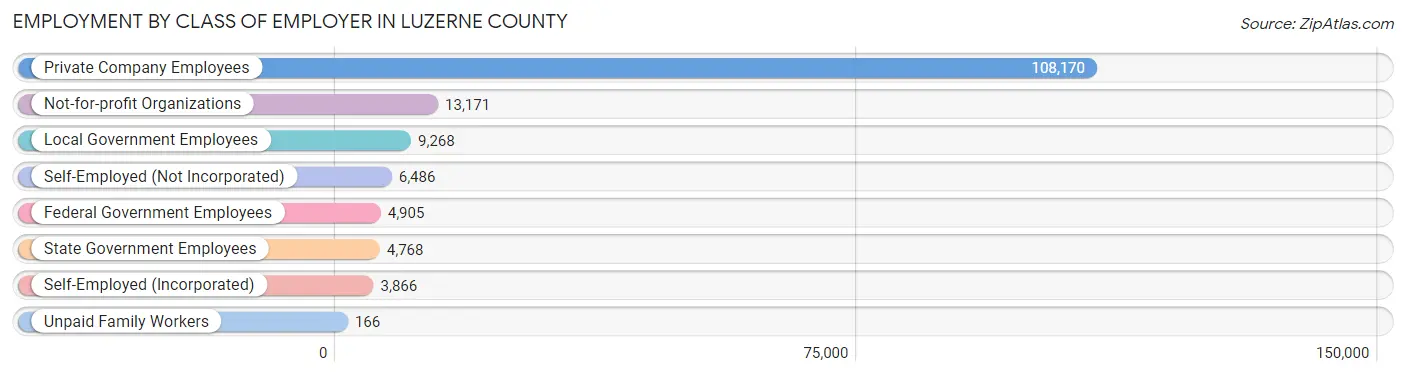
| Employer Class | # Employees | % Employees |
| Private Company Employees | 108,170 | 71.7% |
| Self-Employed (Incorporated) | 3,866 | 2.6% |
| Self-Employed (Not Incorporated) | 6,486 | 4.3% |
| Not-for-profit Organizations | 13,171 | 8.7% |
| Local Government Employees | 9,268 | 6.1% |
| State Government Employees | 4,768 | 3.2% |
| Federal Government Employees | 4,905 | 3.3% |
| Unpaid Family Workers | 166 | 0.1% |
| Total | 150,800 | 100.0% |
Employment Status by Age in Luzerne County
According to the labor force statistics for Luzerne County, out of the total population over 16 years of age (267,917), 61.0% or 163,429 individuals are in the labor force, with 5.9% or 9,642 of them unemployed. The age group with the highest labor force participation rate is 25 to 29 years, with 84.5% or 17,236 individuals in the labor force. Within the labor force, the 16 to 19 years age range has the highest percentage of unemployed individuals, with 19.6% or 1,402 of them being unemployed.
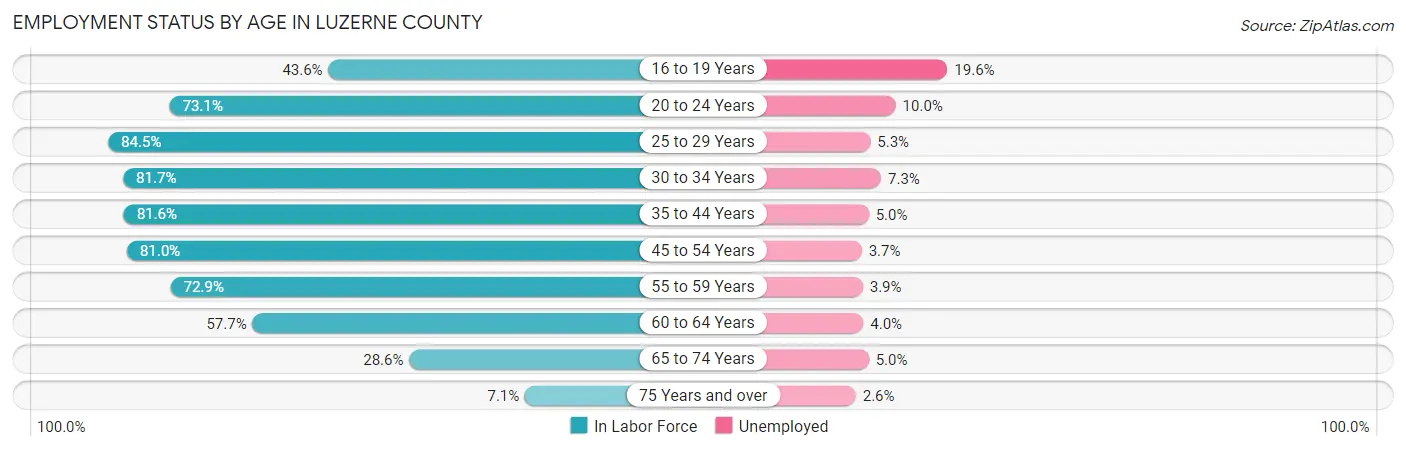
| Age Bracket | In Labor Force | Unemployed |
| 16 to 19 Years | 7,151 (43.6%) | 1,402 (19.6%) |
| 20 to 24 Years | 14,785 (73.1%) | 1,478 (10.0%) |
| 25 to 29 Years | 17,236 (84.5%) | 914 (5.3%) |
| 30 to 34 Years | 16,714 (81.7%) | 1,220 (7.3%) |
| 35 to 44 Years | 31,297 (81.6%) | 1,565 (5.0%) |
| 45 to 54 Years | 34,039 (81.0%) | 1,259 (3.7%) |
| 55 to 59 Years | 16,602 (72.9%) | 647 (3.9%) |
| 60 to 64 Years | 13,116 (57.7%) | 525 (4.0%) |
| 65 to 74 Years | 10,484 (28.6%) | 524 (5.0%) |
| 75 Years and over | 1,980 (7.1%) | 51 (2.6%) |
| Total | 163,429 (61.0%) | 9,642 (5.9%) |
Employment Status by Educational Attainment in Luzerne County
According to labor force statistics for Luzerne County, 77.4% of individuals (129,055) out of the total population between 25 and 64 years of age (166,738) are in the labor force, with 4.8% or 6,195 of them being unemployed. The group with the highest labor force participation rate are those with the educational attainment of bachelor's degree or higher, with 87.8% or 38,032 individuals in the labor force. Within the labor force, individuals with less than high school education have the highest percentage of unemployment, with 9.1% or 763 of them being unemployed.
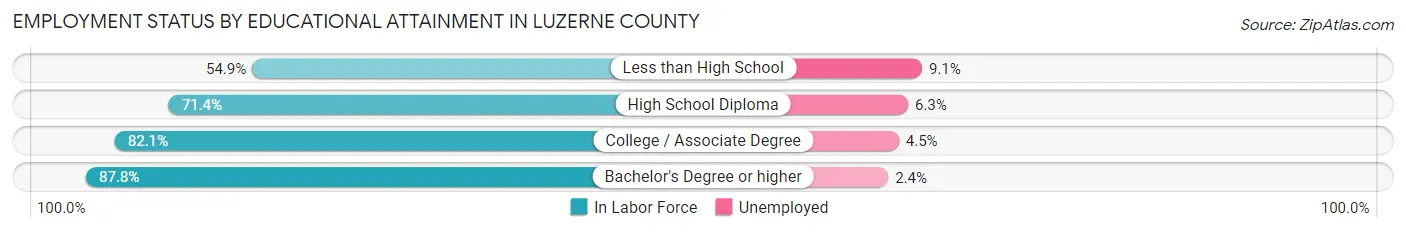
| Educational Attainment | In Labor Force | Unemployed |
| Less than High School | 8,383 (54.9%) | 1,389 (9.1%) |
| High School Diploma | 41,186 (71.4%) | 3,634 (6.3%) |
| College / Associate Degree | 41,435 (82.1%) | 2,271 (4.5%) |
| Bachelor's Degree or higher | 38,032 (87.8%) | 1,040 (2.4%) |
| Total | 129,055 (77.4%) | 8,003 (4.8%) |
Employment Occupations by Sex in Luzerne County
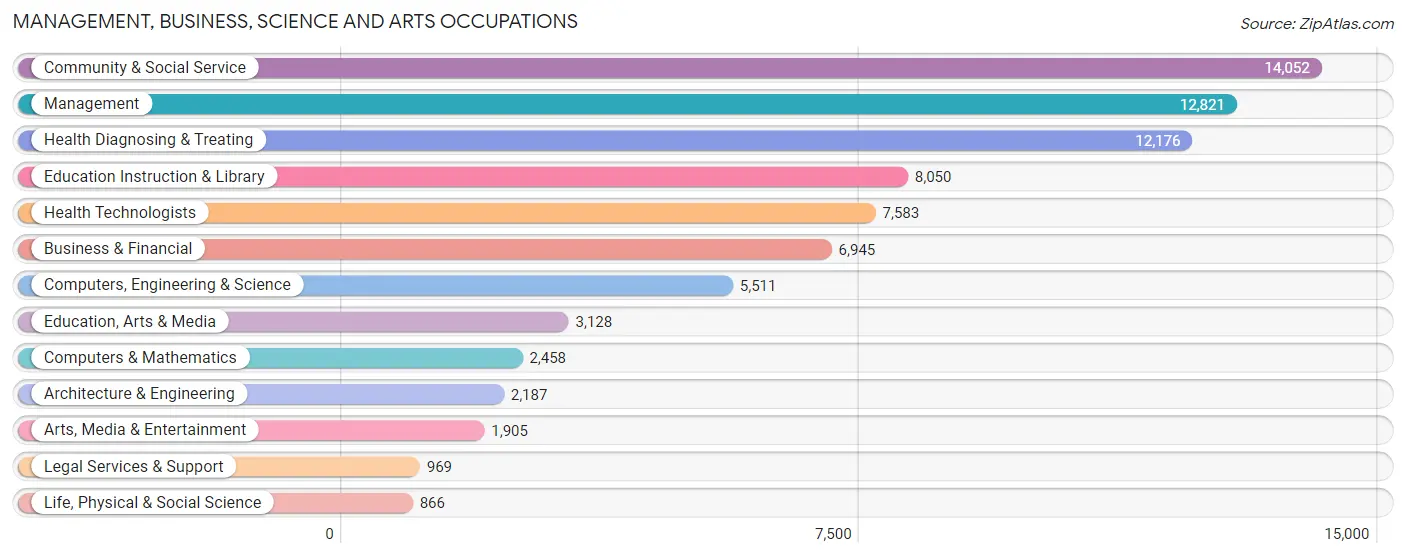
Management, Business, Science and Arts Occupations
The most common Management, Business, Science and Arts occupations in Luzerne County are Community & Social Service (14,052 | 9.1%), Management (12,821 | 8.3%), Health Diagnosing & Treating (12,176 | 7.9%), Education Instruction & Library (8,050 | 5.2%), and Health Technologists (7,583 | 4.9%).
Management, Business, Science and Arts Occupations by Sex
Within the Management, Business, Science and Arts occupations in Luzerne County, the most male-oriented occupations are Architecture & Engineering (83.8%), Computers, Engineering & Science (72.7%), and Computers & Mathematics (69.0%), while the most female-oriented occupations are Health Diagnosing & Treating (75.5%), Health Technologists (75.1%), and Education Instruction & Library (70.6%).
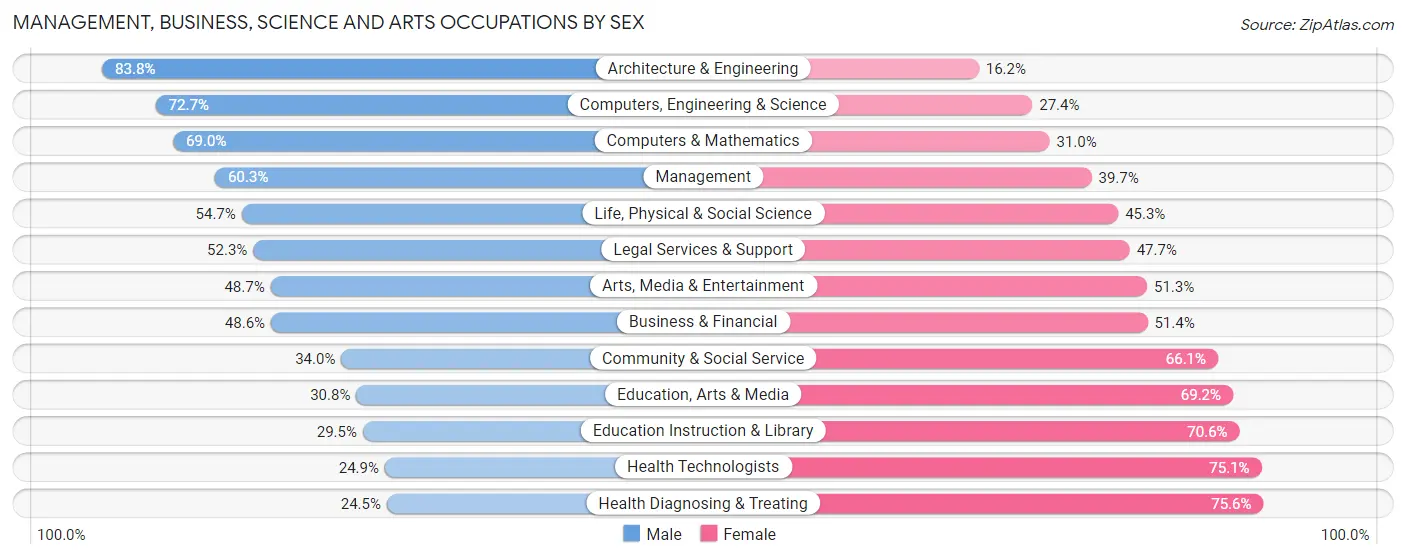
| Occupation | Male | Female |
| Management | 7,729 (60.3%) | 5,092 (39.7%) |
| Business & Financial | 3,377 (48.6%) | 3,568 (51.4%) |
| Computers, Engineering & Science | 4,004 (72.7%) | 1,507 (27.4%) |
| Computers & Mathematics | 1,697 (69.0%) | 761 (31.0%) |
| Architecture & Engineering | 1,833 (83.8%) | 354 (16.2%) |
| Life, Physical & Social Science | 474 (54.7%) | 392 (45.3%) |
| Community & Social Service | 4,770 (34.0%) | 9,282 (66.0%) |
| Education, Arts & Media | 964 (30.8%) | 2,164 (69.2%) |
| Legal Services & Support | 507 (52.3%) | 462 (47.7%) |
| Education Instruction & Library | 2,371 (29.4%) | 5,679 (70.6%) |
| Arts, Media & Entertainment | 928 (48.7%) | 977 (51.3%) |
| Health Diagnosing & Treating | 2,977 (24.4%) | 9,199 (75.5%) |
| Health Technologists | 1,885 (24.9%) | 5,698 (75.1%) |
| Total (Category) | 22,857 (44.4%) | 28,648 (55.6%) |
| Total (Overall) | 80,549 (52.4%) | 73,143 (47.6%) |
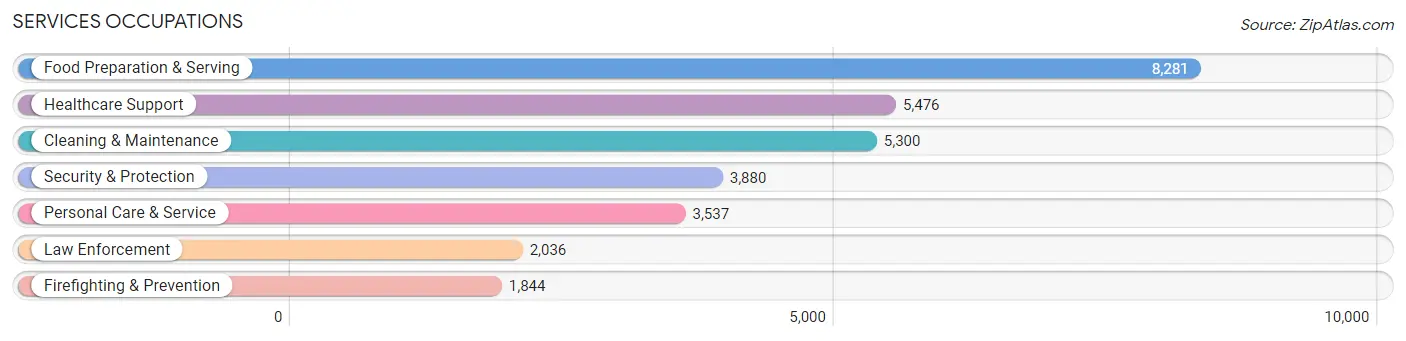
Services Occupations
The most common Services occupations in Luzerne County are Food Preparation & Serving (8,281 | 5.4%), Healthcare Support (5,476 | 3.6%), Cleaning & Maintenance (5,300 | 3.5%), Security & Protection (3,880 | 2.5%), and Personal Care & Service (3,537 | 2.3%).
Services Occupations by Sex
Within the Services occupations in Luzerne County, the most male-oriented occupations are Law Enforcement (92.2%), Security & Protection (80.6%), and Firefighting & Prevention (67.8%), while the most female-oriented occupations are Healthcare Support (88.8%), Personal Care & Service (72.6%), and Food Preparation & Serving (64.3%).
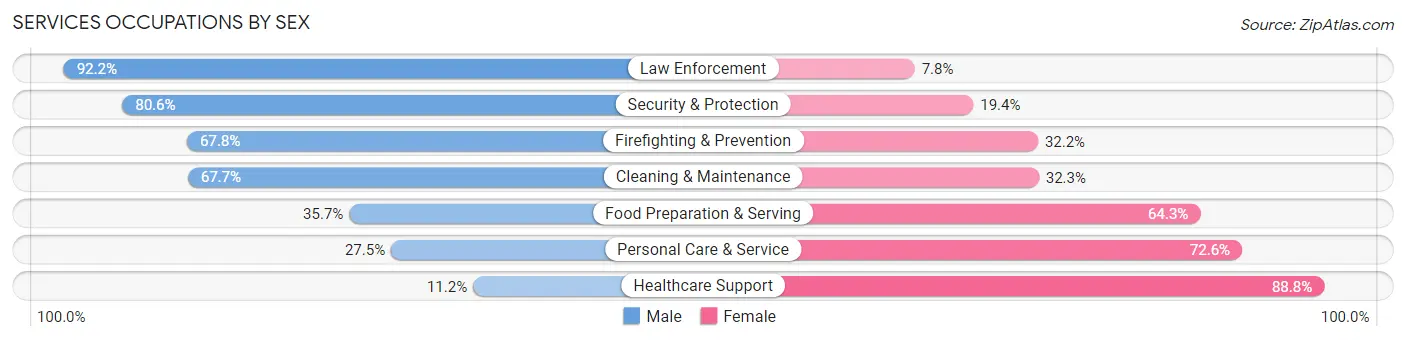
| Occupation | Male | Female |
| Healthcare Support | 614 (11.2%) | 4,862 (88.8%) |
| Security & Protection | 3,129 (80.6%) | 751 (19.4%) |
| Firefighting & Prevention | 1,251 (67.8%) | 593 (32.2%) |
| Law Enforcement | 1,878 (92.2%) | 158 (7.8%) |
| Food Preparation & Serving | 2,959 (35.7%) | 5,322 (64.3%) |
| Cleaning & Maintenance | 3,587 (67.7%) | 1,713 (32.3%) |
| Personal Care & Service | 971 (27.5%) | 2,566 (72.6%) |
| Total (Category) | 11,260 (42.5%) | 15,214 (57.5%) |
| Total (Overall) | 80,549 (52.4%) | 73,143 (47.6%) |
Sales and Office Occupations
The most common Sales and Office occupations in Luzerne County are Office & Administration (19,452 | 12.7%), and Sales & Related (12,975 | 8.4%).

Sales and Office Occupations by Sex

| Occupation | Male | Female |
| Sales & Related | 6,167 (47.5%) | 6,808 (52.5%) |
| Office & Administration | 4,836 (24.9%) | 14,616 (75.1%) |
| Total (Category) | 11,003 (33.9%) | 21,424 (66.1%) |
| Total (Overall) | 80,549 (52.4%) | 73,143 (47.6%) |
Natural Resources, Construction and Maintenance Occupations
The most common Natural Resources, Construction and Maintenance occupations in Luzerne County are Construction & Extraction (6,462 | 4.2%), Installation, Maintenance & Repair (5,540 | 3.6%), and Farming, Fishing & Forestry (556 | 0.4%).

Natural Resources, Construction and Maintenance Occupations by Sex

| Occupation | Male | Female |
| Farming, Fishing & Forestry | 383 (68.9%) | 173 (31.1%) |
| Construction & Extraction | 6,374 (98.6%) | 88 (1.4%) |
| Installation, Maintenance & Repair | 5,361 (96.8%) | 179 (3.2%) |
| Total (Category) | 12,118 (96.5%) | 440 (3.5%) |
| Total (Overall) | 80,549 (52.4%) | 73,143 (47.6%) |
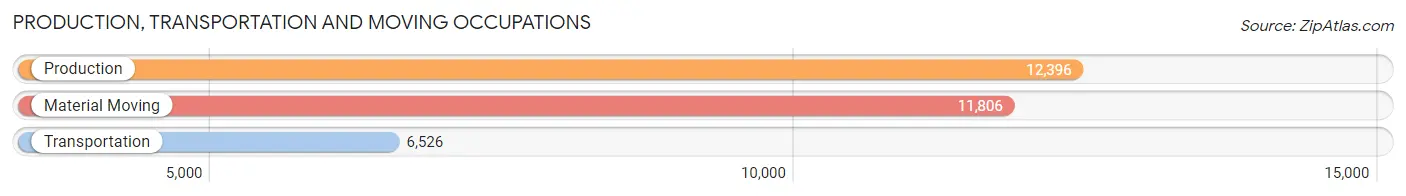
Production, Transportation and Moving Occupations
The most common Production, Transportation and Moving occupations in Luzerne County are Production (12,396 | 8.1%), Material Moving (11,806 | 7.7%), and Transportation (6,526 | 4.3%).
Production, Transportation and Moving Occupations by Sex

| Occupation | Male | Female |
| Production | 9,302 (75.0%) | 3,094 (25.0%) |
| Transportation | 5,737 (87.9%) | 789 (12.1%) |
| Material Moving | 8,272 (70.1%) | 3,534 (29.9%) |
| Total (Category) | 23,311 (75.9%) | 7,417 (24.1%) |
| Total (Overall) | 80,549 (52.4%) | 73,143 (47.6%) |
Employment Industries by Sex in Luzerne County
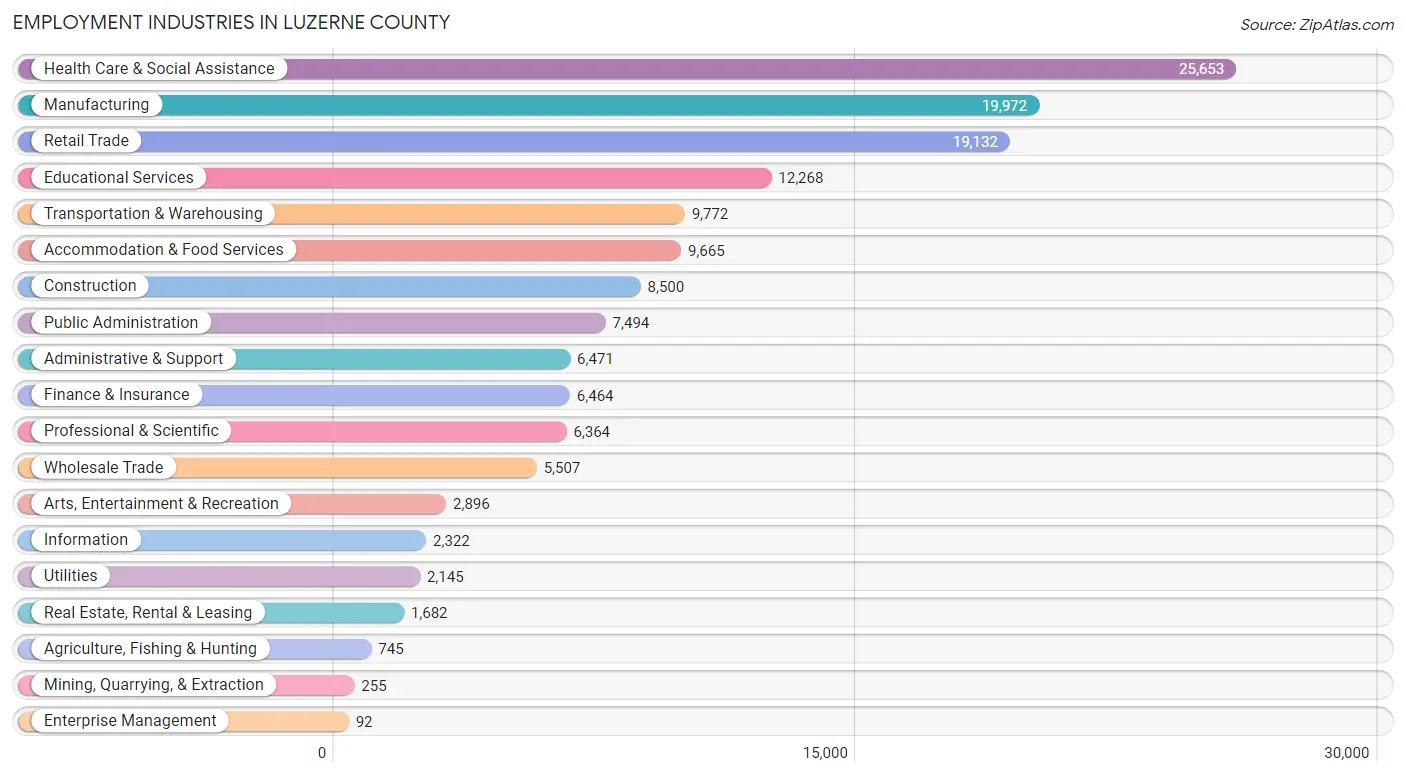
Employment Industries in Luzerne County
The major employment industries in Luzerne County include Health Care & Social Assistance (25,653 | 16.7%), Manufacturing (19,972 | 13.0%), Retail Trade (19,132 | 12.4%), Educational Services (12,268 | 8.0%), and Transportation & Warehousing (9,772 | 6.4%).
Employment Industries by Sex in Luzerne County
The Luzerne County industries that see more men than women are Construction (92.0%), Mining, Quarrying, & Extraction (88.6%), and Utilities (77.0%), whereas the industries that tend to have a higher number of women are Enterprise Management (84.8%), Health Care & Social Assistance (78.8%), and Finance & Insurance (69.4%).
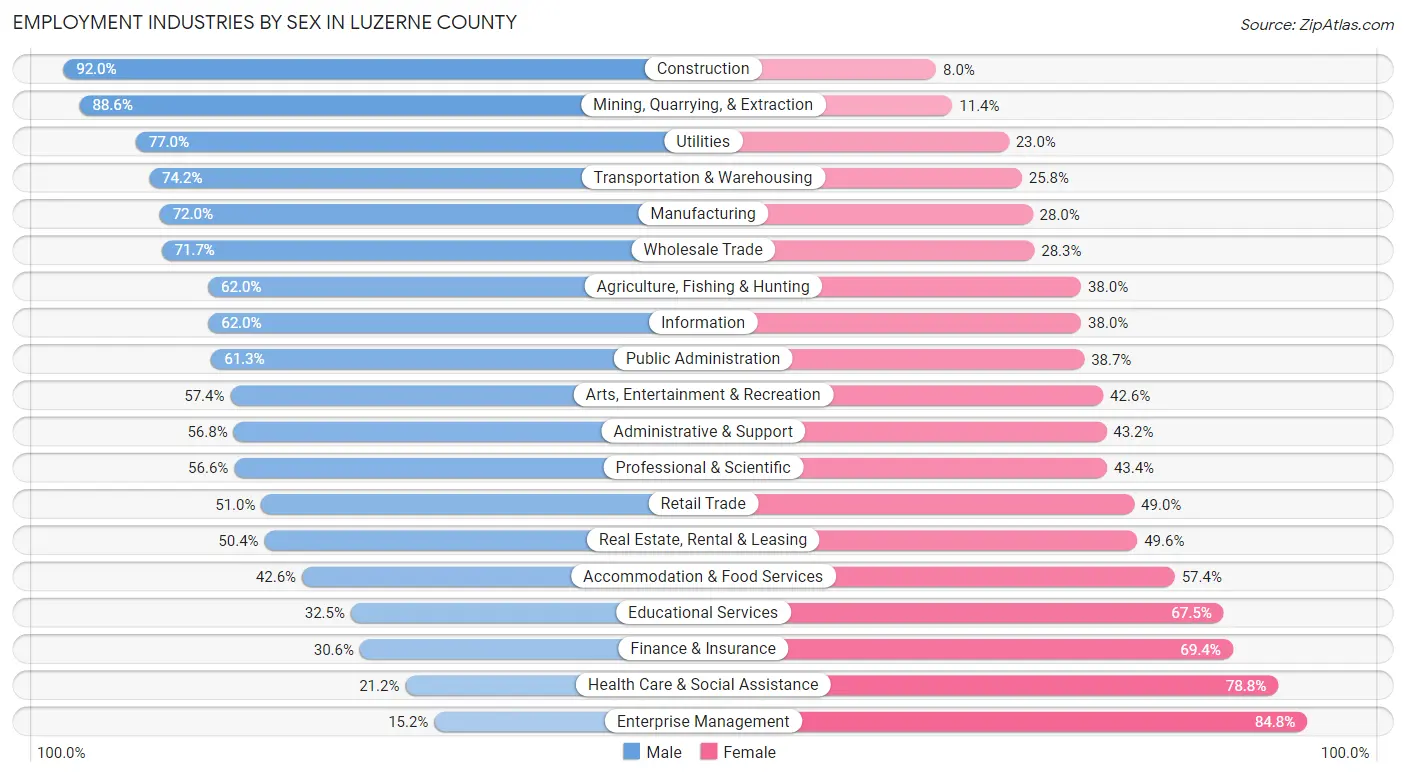
| Industry | Male | Female |
| Agriculture, Fishing & Hunting | 462 (62.0%) | 283 (38.0%) |
| Mining, Quarrying, & Extraction | 226 (88.6%) | 29 (11.4%) |
| Construction | 7,819 (92.0%) | 681 (8.0%) |
| Manufacturing | 14,383 (72.0%) | 5,589 (28.0%) |
| Wholesale Trade | 3,947 (71.7%) | 1,560 (28.3%) |
| Retail Trade | 9,757 (51.0%) | 9,375 (49.0%) |
| Transportation & Warehousing | 7,255 (74.2%) | 2,517 (25.8%) |
| Utilities | 1,651 (77.0%) | 494 (23.0%) |
| Information | 1,439 (62.0%) | 883 (38.0%) |
| Finance & Insurance | 1,979 (30.6%) | 4,485 (69.4%) |
| Real Estate, Rental & Leasing | 847 (50.4%) | 835 (49.6%) |
| Professional & Scientific | 3,604 (56.6%) | 2,760 (43.4%) |
| Enterprise Management | 14 (15.2%) | 78 (84.8%) |
| Administrative & Support | 3,673 (56.8%) | 2,798 (43.2%) |
| Educational Services | 3,985 (32.5%) | 8,283 (67.5%) |
| Health Care & Social Assistance | 5,444 (21.2%) | 20,209 (78.8%) |
| Arts, Entertainment & Recreation | 1,663 (57.4%) | 1,233 (42.6%) |
| Accommodation & Food Services | 4,117 (42.6%) | 5,548 (57.4%) |
| Public Administration | 4,597 (61.3%) | 2,897 (38.7%) |
| Total | 80,549 (52.4%) | 73,143 (47.6%) |
Education in Luzerne County
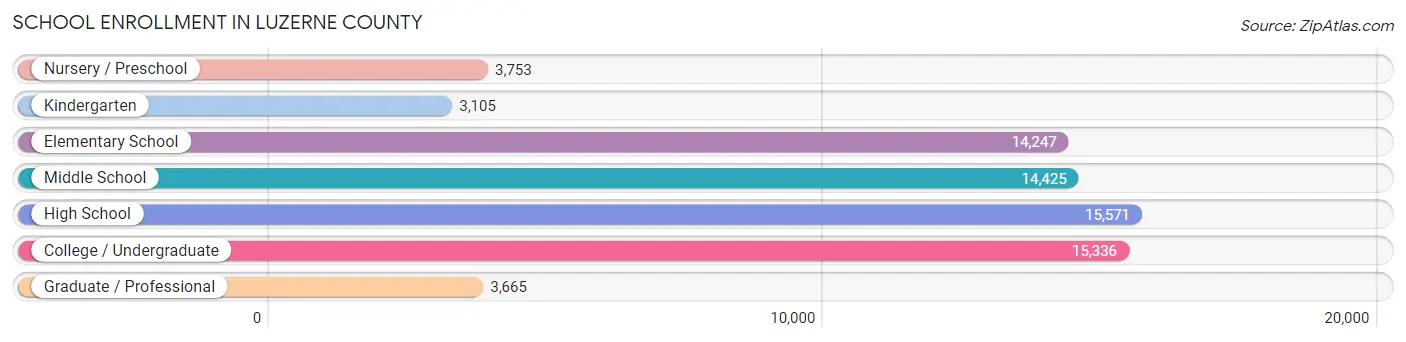
School Enrollment in Luzerne County
The most common levels of schooling among the 70,102 students in Luzerne County are high school (15,571 | 22.2%), college / undergraduate (15,336 | 21.9%), and middle school (14,425 | 20.6%).
| School Level | # Students | % Students |
| Nursery / Preschool | 3,753 | 5.3% |
| Kindergarten | 3,105 | 4.4% |
| Elementary School | 14,247 | 20.3% |
| Middle School | 14,425 | 20.6% |
| High School | 15,571 | 22.2% |
| College / Undergraduate | 15,336 | 21.9% |
| Graduate / Professional | 3,665 | 5.2% |
| Total | 70,102 | 100.0% |
School Enrollment by Age by Funding Source in Luzerne County
Out of a total of 70,102 students who are enrolled in schools in Luzerne County, 16,965 (24.2%) attend a private institution, while the remaining 53,137 (75.8%) are enrolled in public schools. The age group of 20 to 24 year olds has the highest likelihood of being enrolled in private schools, with 4,781 (58.9% in the age bracket) enrolled. Conversely, the age group of 5 to 9 year old has the lowest likelihood of being enrolled in a private school, with 14,979 (89.9% in the age bracket) attending a public institution.
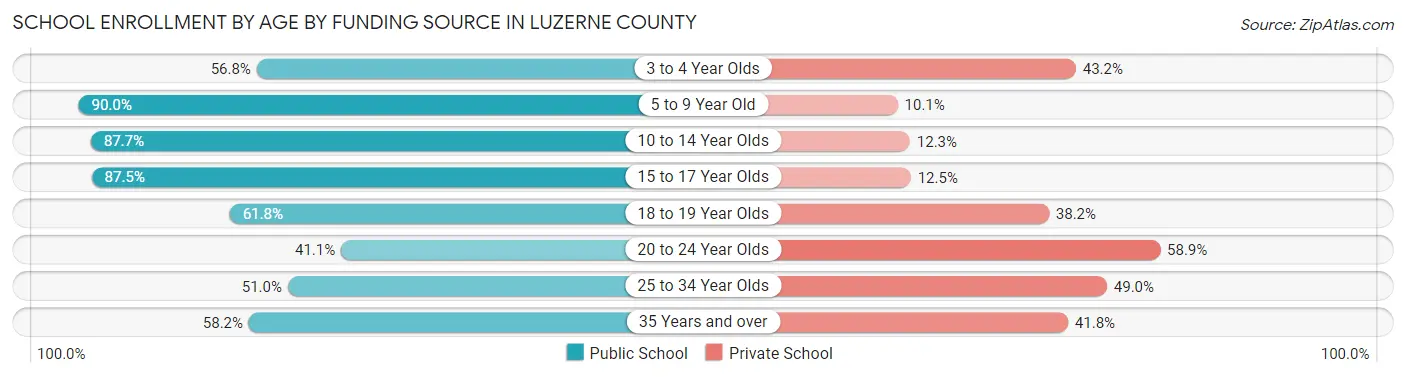
| Age Bracket | Public School | Private School |
| 3 to 4 Year Olds | 1,501 (56.8%) | 1,143 (43.2%) |
| 5 to 9 Year Old | 14,979 (89.9%) | 1,674 (10.1%) |
| 10 to 14 Year Olds | 15,657 (87.7%) | 2,201 (12.3%) |
| 15 to 17 Year Olds | 9,817 (87.5%) | 1,401 (12.5%) |
| 18 to 19 Year Olds | 3,698 (61.8%) | 2,288 (38.2%) |
| 20 to 24 Year Olds | 3,331 (41.1%) | 4,781 (58.9%) |
| 25 to 34 Year Olds | 2,267 (51.0%) | 2,180 (49.0%) |
| 35 Years and over | 1,854 (58.2%) | 1,330 (41.8%) |
| Total | 53,137 (75.8%) | 16,965 (24.2%) |
Educational Attainment by Field of Study in Luzerne County
Business (11,637 | 19.1%), education (10,240 | 16.8%), science & technology (8,044 | 13.2%), arts & humanities (4,533 | 7.4%), and bio, nature & agricultural (3,927 | 6.5%) are the most common fields of study among 60,913 individuals in Luzerne County who have obtained a bachelor's degree or higher.
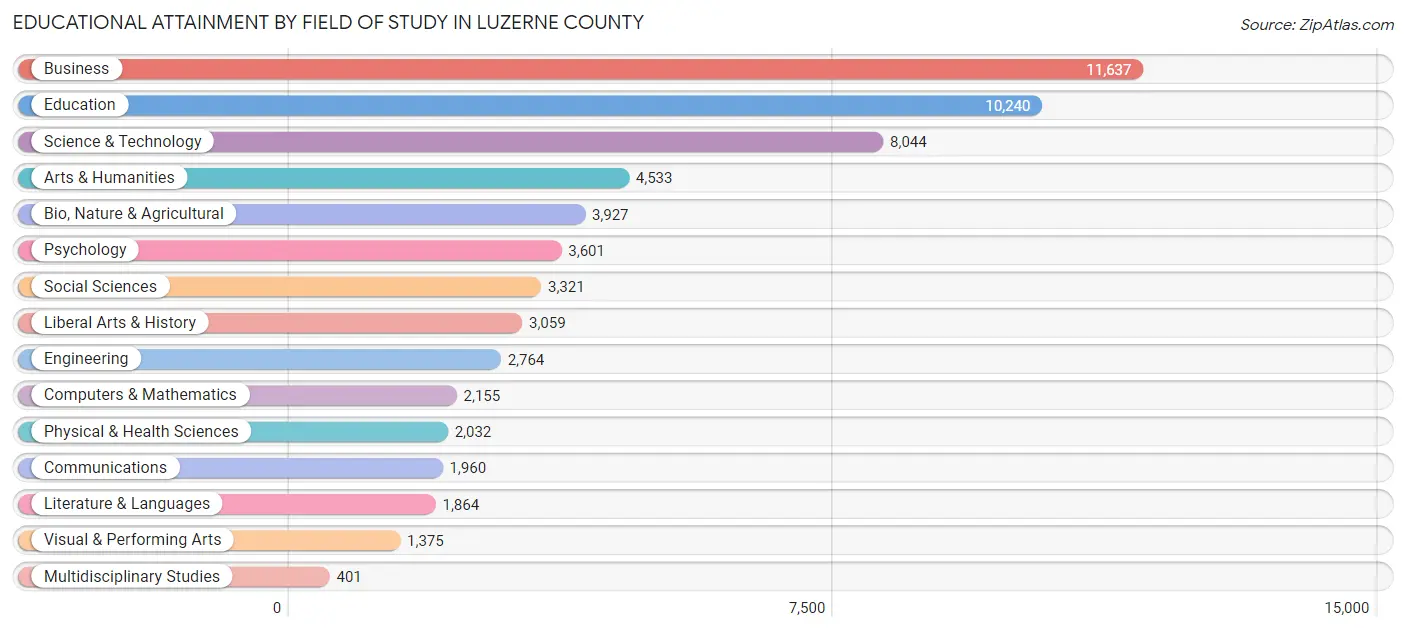
| Field of Study | # Graduates | % Graduates |
| Computers & Mathematics | 2,155 | 3.5% |
| Bio, Nature & Agricultural | 3,927 | 6.5% |
| Physical & Health Sciences | 2,032 | 3.3% |
| Psychology | 3,601 | 5.9% |
| Social Sciences | 3,321 | 5.4% |
| Engineering | 2,764 | 4.5% |
| Multidisciplinary Studies | 401 | 0.7% |
| Science & Technology | 8,044 | 13.2% |
| Business | 11,637 | 19.1% |
| Education | 10,240 | 16.8% |
| Literature & Languages | 1,864 | 3.1% |
| Liberal Arts & History | 3,059 | 5.0% |
| Visual & Performing Arts | 1,375 | 2.3% |
| Communications | 1,960 | 3.2% |
| Arts & Humanities | 4,533 | 7.4% |
| Total | 60,913 | 100.0% |
Transportation & Commute in Luzerne County
Vehicle Availability by Sex in Luzerne County
The most prevalent vehicle ownership categories in Luzerne County are males with 2 vehicles (32,187, accounting for 41.1%) and females with 2 vehicles (28,860, making up 45.1%).
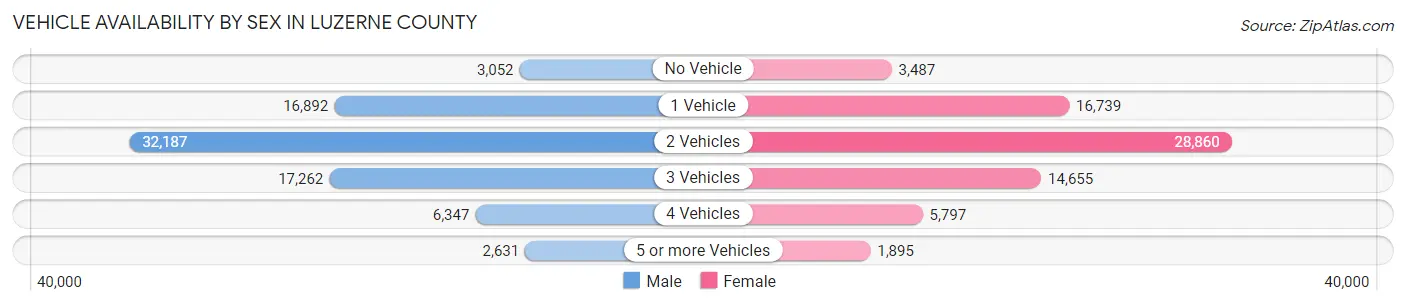
| Vehicles Available | Male | Female |
| No Vehicle | 3,052 (3.9%) | 3,487 (4.9%) |
| 1 Vehicle | 16,892 (21.5%) | 16,739 (23.4%) |
| 2 Vehicles | 32,187 (41.1%) | 28,860 (40.4%) |
| 3 Vehicles | 17,262 (22.0%) | 14,655 (20.5%) |
| 4 Vehicles | 6,347 (8.1%) | 5,797 (8.1%) |
| 5 or more Vehicles | 2,631 (3.4%) | 1,895 (2.6%) |
| Total | 78,371 (100.0%) | 71,433 (100.0%) |
Commute Time in Luzerne County
The most frequently occuring commute durations in Luzerne County are 15 to 19 minutes (25,651 commuters, 18.5%), 10 to 14 minutes (22,984 commuters, 16.6%), and 20 to 24 minutes (21,981 commuters, 15.9%).
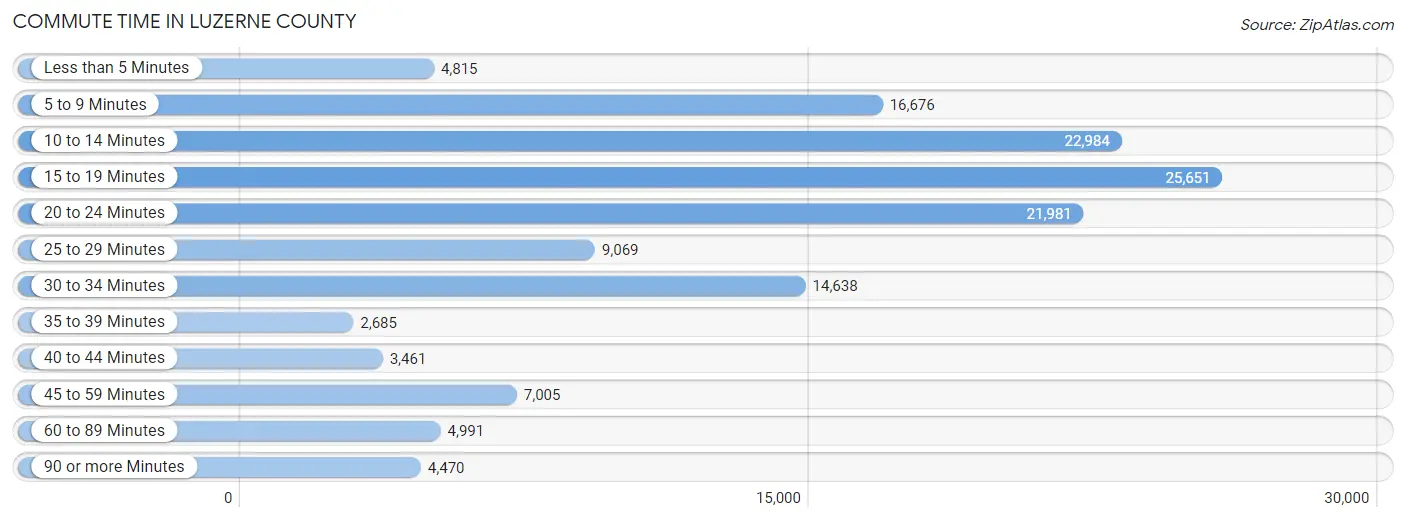
| Commute Time | # Commuters | % Commuters |
| Less than 5 Minutes | 4,815 | 3.5% |
| 5 to 9 Minutes | 16,676 | 12.0% |
| 10 to 14 Minutes | 22,984 | 16.6% |
| 15 to 19 Minutes | 25,651 | 18.5% |
| 20 to 24 Minutes | 21,981 | 15.9% |
| 25 to 29 Minutes | 9,069 | 6.6% |
| 30 to 34 Minutes | 14,638 | 10.6% |
| 35 to 39 Minutes | 2,685 | 1.9% |
| 40 to 44 Minutes | 3,461 | 2.5% |
| 45 to 59 Minutes | 7,005 | 5.1% |
| 60 to 89 Minutes | 4,991 | 3.6% |
| 90 or more Minutes | 4,470 | 3.2% |
Commute Time by Sex in Luzerne County
The most common commute times in Luzerne County are 15 to 19 minutes (12,651 commuters, 17.1%) for males and 15 to 19 minutes (13,000 commuters, 20.2%) for females.
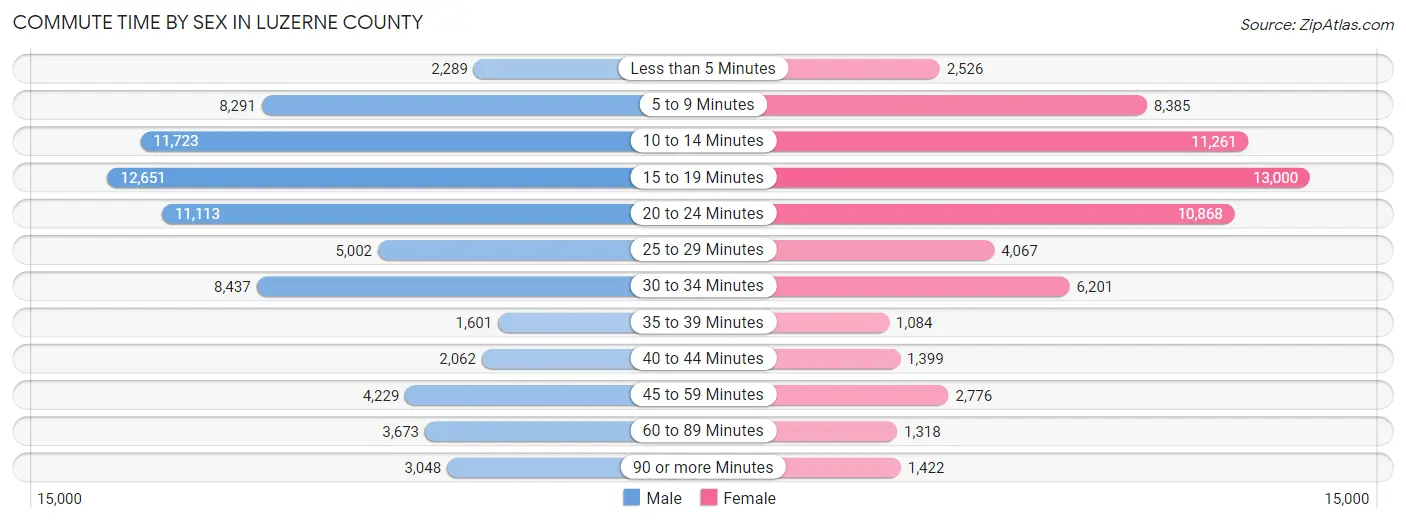
| Commute Time | Male | Female |
| Less than 5 Minutes | 2,289 (3.1%) | 2,526 (3.9%) |
| 5 to 9 Minutes | 8,291 (11.2%) | 8,385 (13.0%) |
| 10 to 14 Minutes | 11,723 (15.8%) | 11,261 (17.5%) |
| 15 to 19 Minutes | 12,651 (17.1%) | 13,000 (20.2%) |
| 20 to 24 Minutes | 11,113 (15.0%) | 10,868 (16.9%) |
| 25 to 29 Minutes | 5,002 (6.8%) | 4,067 (6.3%) |
| 30 to 34 Minutes | 8,437 (11.4%) | 6,201 (9.6%) |
| 35 to 39 Minutes | 1,601 (2.2%) | 1,084 (1.7%) |
| 40 to 44 Minutes | 2,062 (2.8%) | 1,399 (2.2%) |
| 45 to 59 Minutes | 4,229 (5.7%) | 2,776 (4.3%) |
| 60 to 89 Minutes | 3,673 (5.0%) | 1,318 (2.1%) |
| 90 or more Minutes | 3,048 (4.1%) | 1,422 (2.2%) |
Time of Departure to Work by Sex in Luzerne County
The most frequent times of departure to work in Luzerne County are 7:00 AM to 7:29 AM (8,848, 11.9%) for males and 7:30 AM to 7:59 AM (10,138, 15.8%) for females.
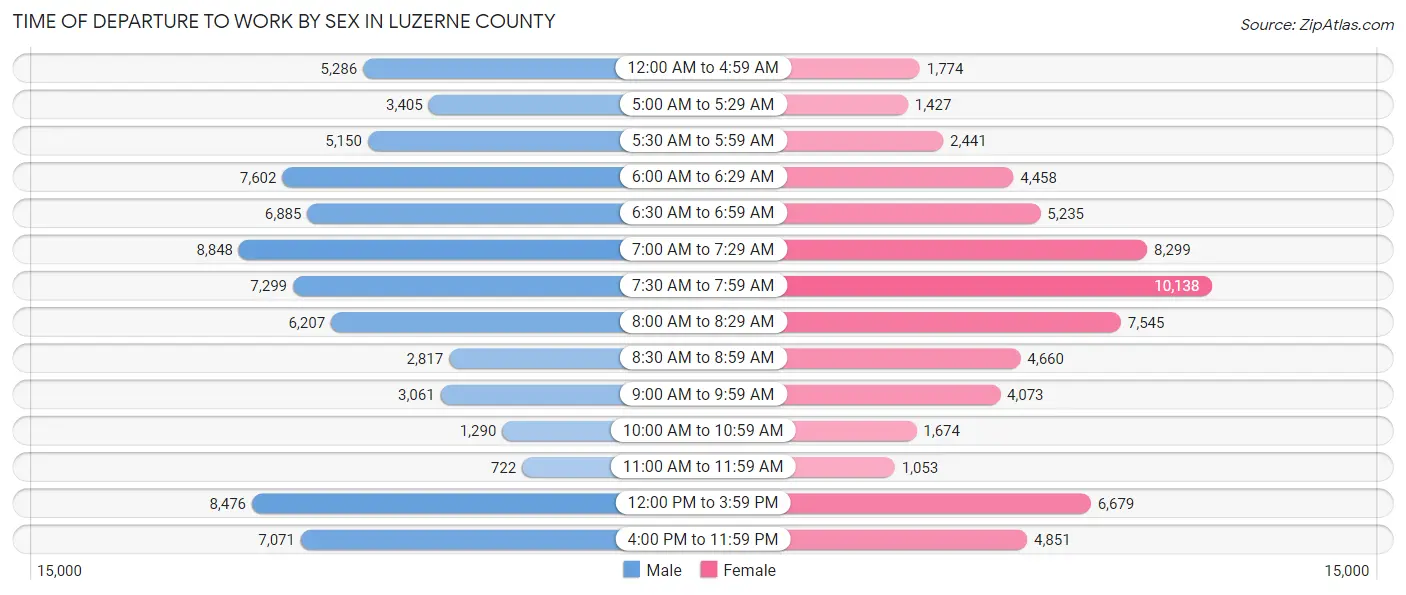
| Time of Departure | Male | Female |
| 12:00 AM to 4:59 AM | 5,286 (7.1%) | 1,774 (2.8%) |
| 5:00 AM to 5:29 AM | 3,405 (4.6%) | 1,427 (2.2%) |
| 5:30 AM to 5:59 AM | 5,150 (7.0%) | 2,441 (3.8%) |
| 6:00 AM to 6:29 AM | 7,602 (10.3%) | 4,458 (6.9%) |
| 6:30 AM to 6:59 AM | 6,885 (9.3%) | 5,235 (8.1%) |
| 7:00 AM to 7:29 AM | 8,848 (11.9%) | 8,299 (12.9%) |
| 7:30 AM to 7:59 AM | 7,299 (9.9%) | 10,138 (15.8%) |
| 8:00 AM to 8:29 AM | 6,207 (8.4%) | 7,545 (11.7%) |
| 8:30 AM to 8:59 AM | 2,817 (3.8%) | 4,660 (7.2%) |
| 9:00 AM to 9:59 AM | 3,061 (4.1%) | 4,073 (6.3%) |
| 10:00 AM to 10:59 AM | 1,290 (1.7%) | 1,674 (2.6%) |
| 11:00 AM to 11:59 AM | 722 (1.0%) | 1,053 (1.6%) |
| 12:00 PM to 3:59 PM | 8,476 (11.4%) | 6,679 (10.4%) |
| 4:00 PM to 11:59 PM | 7,071 (9.5%) | 4,851 (7.5%) |
| Total | 74,119 (100.0%) | 64,307 (100.0%) |
Housing Occupancy in Luzerne County
Occupancy by Ownership in Luzerne County
Of the total 132,608 dwellings in Luzerne County, owner-occupied units account for 89,266 (67.3%), while renter-occupied units make up 43,342 (32.7%).
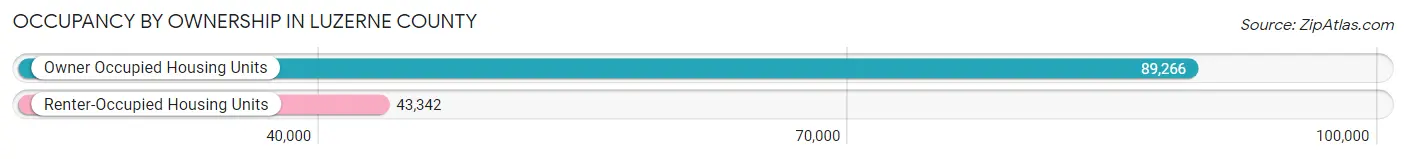
| Occupancy | # Housing Units | % Housing Units |
| Owner Occupied Housing Units | 89,266 | 67.3% |
| Renter-Occupied Housing Units | 43,342 | 32.7% |
| Total Occupied Housing Units | 132,608 | 100.0% |
Occupancy by Household Size in Luzerne County
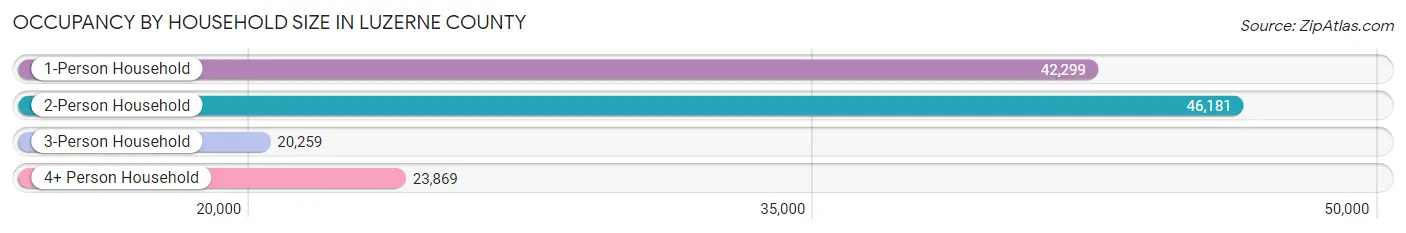
| Household Size | # Housing Units | % Housing Units |
| 1-Person Household | 42,299 | 31.9% |
| 2-Person Household | 46,181 | 34.8% |
| 3-Person Household | 20,259 | 15.3% |
| 4+ Person Household | 23,869 | 18.0% |
| Total Housing Units | 132,608 | 100.0% |
Occupancy by Ownership by Household Size in Luzerne County
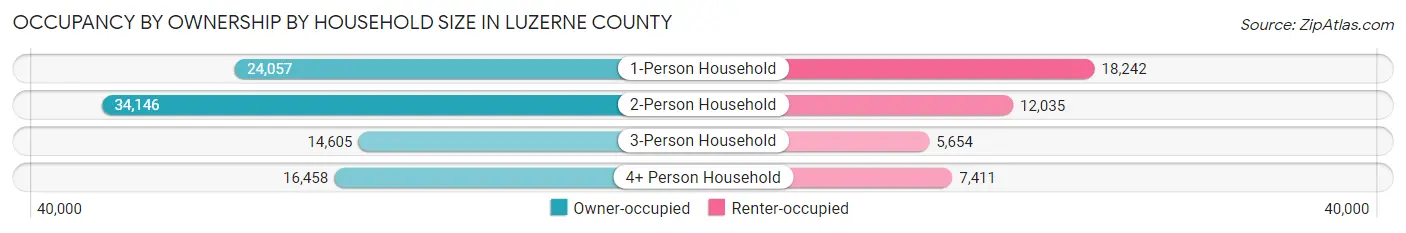
| Household Size | Owner-occupied | Renter-occupied |
| 1-Person Household | 24,057 (56.9%) | 18,242 (43.1%) |
| 2-Person Household | 34,146 (73.9%) | 12,035 (26.1%) |
| 3-Person Household | 14,605 (72.1%) | 5,654 (27.9%) |
| 4+ Person Household | 16,458 (69.0%) | 7,411 (31.0%) |
| Total Housing Units | 89,266 (67.3%) | 43,342 (32.7%) |
Occupancy by Educational Attainment in Luzerne County
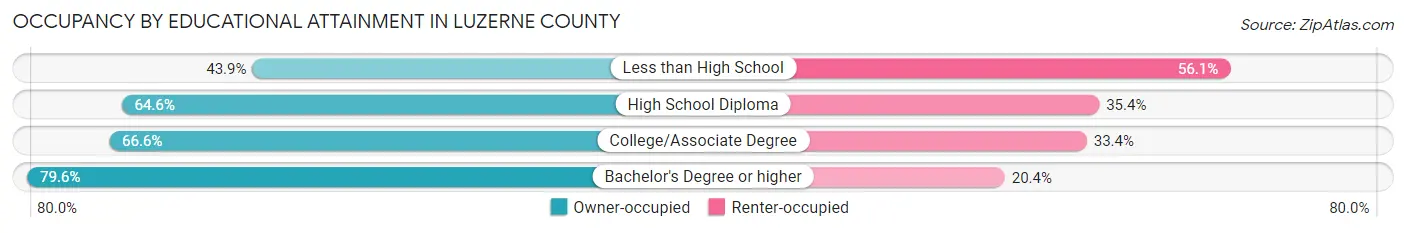
| Household Size | Owner-occupied | Renter-occupied |
| Less than High School | 4,998 (43.9%) | 6,393 (56.1%) |
| High School Diploma | 30,339 (64.6%) | 16,609 (35.4%) |
| College/Associate Degree | 26,558 (66.6%) | 13,327 (33.4%) |
| Bachelor's Degree or higher | 27,371 (79.6%) | 7,013 (20.4%) |
Occupancy by Age of Householder in Luzerne County
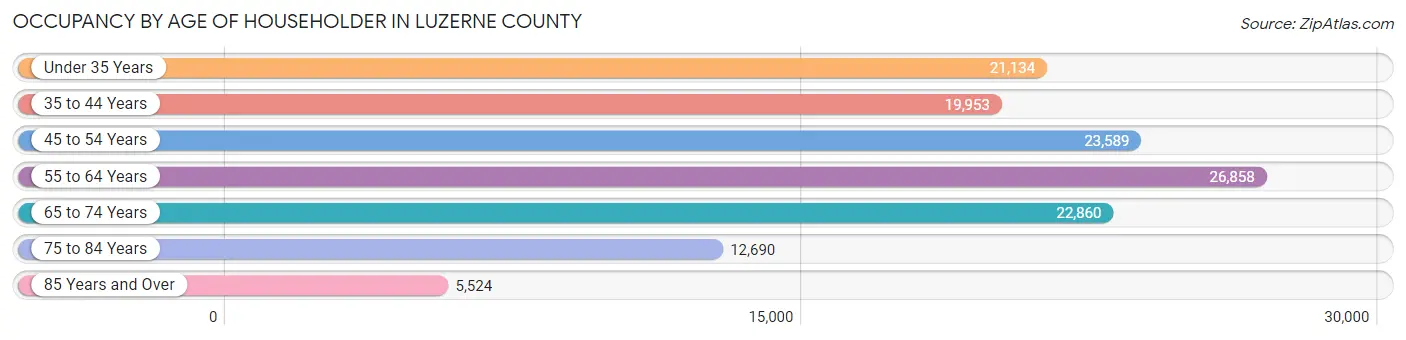
| Age Bracket | # Households | % Households |
| Under 35 Years | 21,134 | 15.9% |
| 35 to 44 Years | 19,953 | 15.0% |
| 45 to 54 Years | 23,589 | 17.8% |
| 55 to 64 Years | 26,858 | 20.3% |
| 65 to 74 Years | 22,860 | 17.2% |
| 75 to 84 Years | 12,690 | 9.6% |
| 85 Years and Over | 5,524 | 4.2% |
| Total | 132,608 | 100.0% |
Housing Finances in Luzerne County
Median Income by Occupancy in Luzerne County
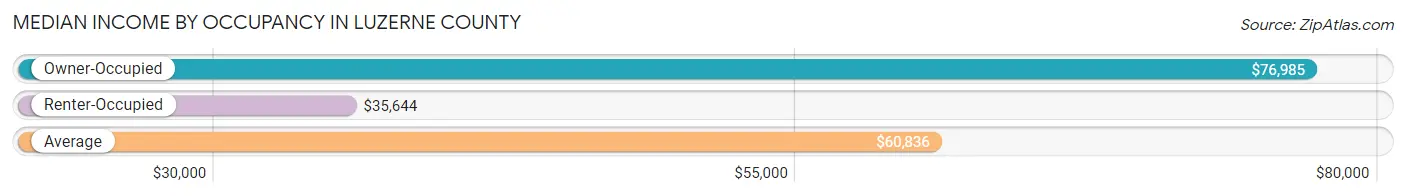
| Occupancy Type | # Households | Median Income |
| Owner-Occupied | 89,266 (67.3%) | $76,985 |
| Renter-Occupied | 43,342 (32.7%) | $35,644 |
| Average | 132,608 (100.0%) | $60,836 |
Occupancy by Householder Income Bracket in Luzerne County
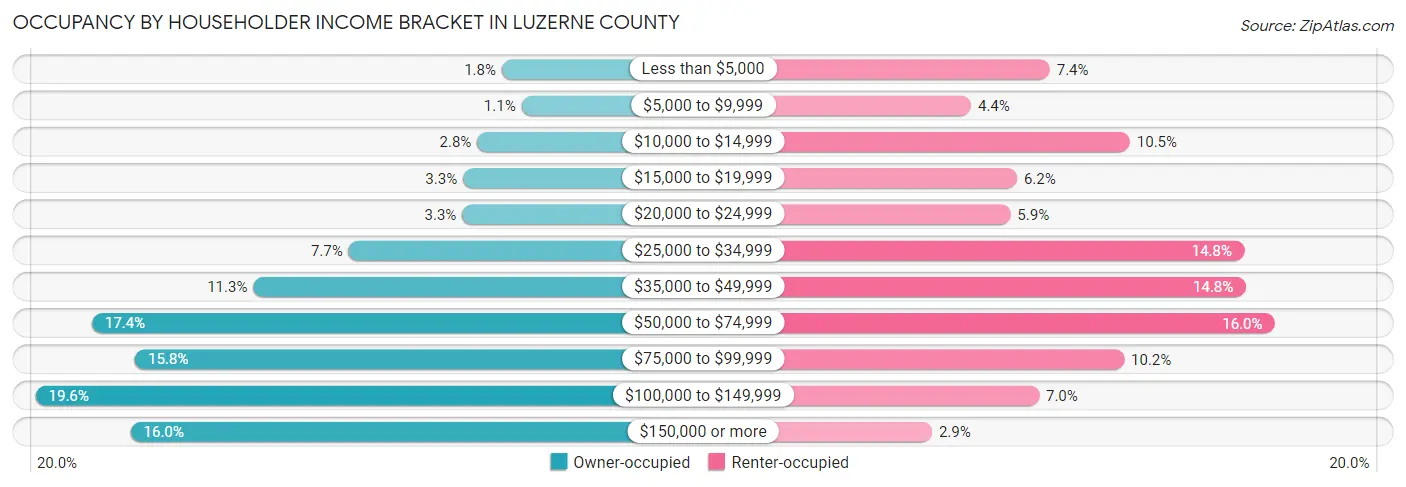
| Income Bracket | Owner-occupied | Renter-occupied |
| Less than $5,000 | 1,628 (1.8%) | 3,207 (7.4%) |
| $5,000 to $9,999 | 952 (1.1%) | 1,906 (4.4%) |
| $10,000 to $14,999 | 2,468 (2.8%) | 4,530 (10.4%) |
| $15,000 to $19,999 | 2,947 (3.3%) | 2,664 (6.1%) |
| $20,000 to $24,999 | 2,970 (3.3%) | 2,558 (5.9%) |
| $25,000 to $34,999 | 6,836 (7.7%) | 6,409 (14.8%) |
| $35,000 to $49,999 | 10,078 (11.3%) | 6,430 (14.8%) |
| $50,000 to $74,999 | 15,572 (17.4%) | 6,914 (16.0%) |
| $75,000 to $99,999 | 14,091 (15.8%) | 4,435 (10.2%) |
| $100,000 to $149,999 | 17,477 (19.6%) | 3,029 (7.0%) |
| $150,000 or more | 14,247 (16.0%) | 1,260 (2.9%) |
| Total | 89,266 (100.0%) | 43,342 (100.0%) |
Monthly Housing Cost Tiers in Luzerne County
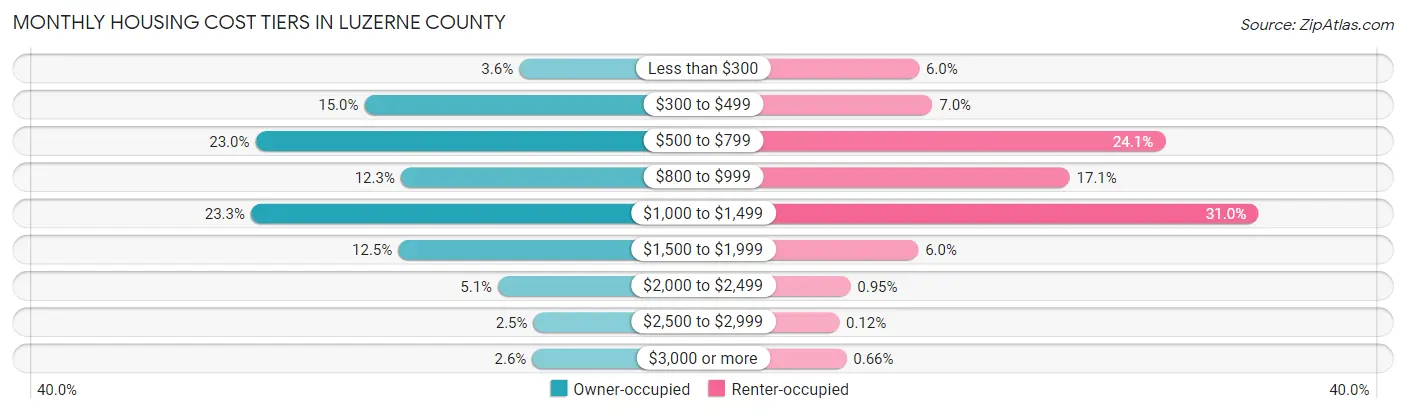
| Monthly Cost | Owner-occupied | Renter-occupied |
| Less than $300 | 3,206 (3.6%) | 2,607 (6.0%) |
| $300 to $499 | 13,370 (15.0%) | 3,030 (7.0%) |
| $500 to $799 | 20,538 (23.0%) | 10,453 (24.1%) |
| $800 to $999 | 10,980 (12.3%) | 7,412 (17.1%) |
| $1,000 to $1,499 | 20,833 (23.3%) | 13,421 (31.0%) |
| $1,500 to $1,999 | 11,150 (12.5%) | 2,578 (5.9%) |
| $2,000 to $2,499 | 4,588 (5.1%) | 412 (0.9%) |
| $2,500 to $2,999 | 2,262 (2.5%) | 54 (0.1%) |
| $3,000 or more | 2,339 (2.6%) | 286 (0.7%) |
| Total | 89,266 (100.0%) | 43,342 (100.0%) |
Physical Housing Characteristics in Luzerne County
Housing Structures in Luzerne County
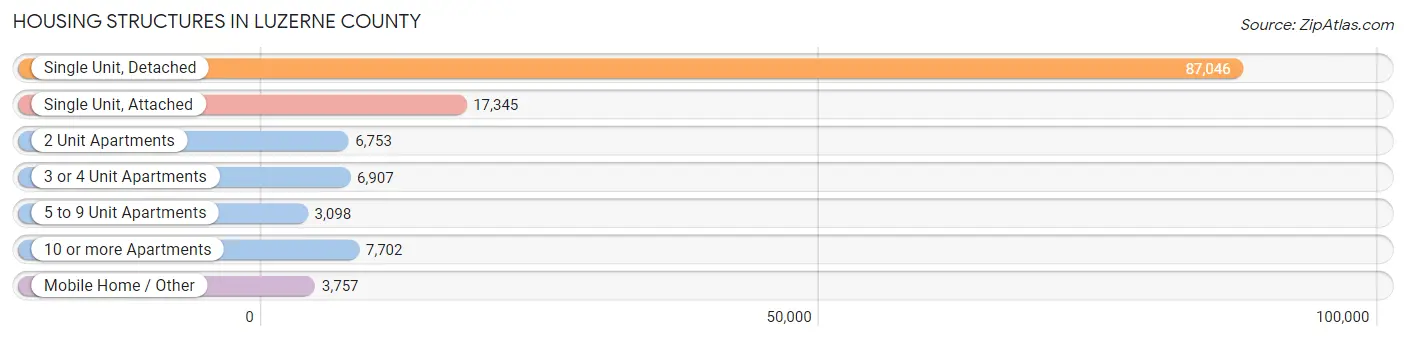
| Structure Type | # Housing Units | % Housing Units |
| Single Unit, Detached | 87,046 | 65.6% |
| Single Unit, Attached | 17,345 | 13.1% |
| 2 Unit Apartments | 6,753 | 5.1% |
| 3 or 4 Unit Apartments | 6,907 | 5.2% |
| 5 to 9 Unit Apartments | 3,098 | 2.3% |
| 10 or more Apartments | 7,702 | 5.8% |
| Mobile Home / Other | 3,757 | 2.8% |
| Total | 132,608 | 100.0% |
Housing Structures by Occupancy in Luzerne County
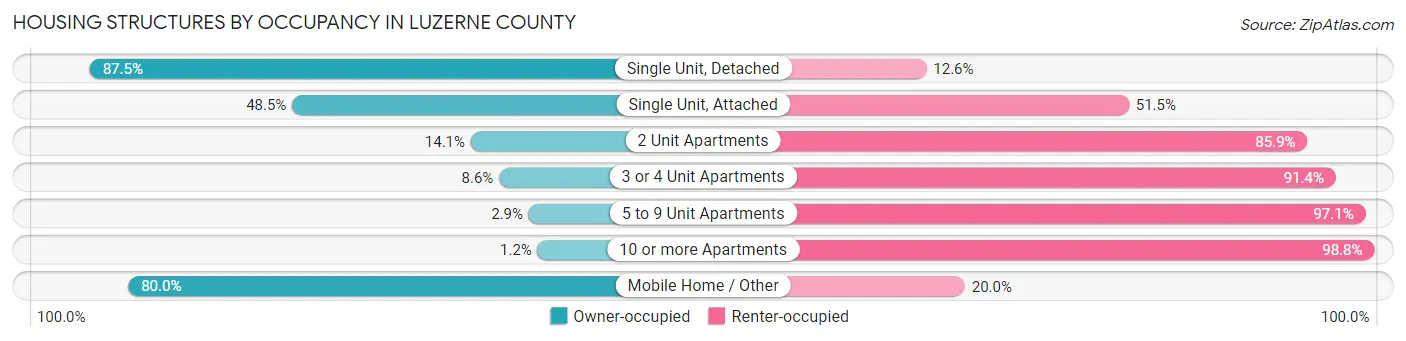
| Structure Type | Owner-occupied | Renter-occupied |
| Single Unit, Detached | 76,121 (87.5%) | 10,925 (12.6%) |
| Single Unit, Attached | 8,408 (48.5%) | 8,937 (51.5%) |
| 2 Unit Apartments | 951 (14.1%) | 5,802 (85.9%) |
| 3 or 4 Unit Apartments | 596 (8.6%) | 6,311 (91.4%) |
| 5 to 9 Unit Apartments | 90 (2.9%) | 3,008 (97.1%) |
| 10 or more Apartments | 93 (1.2%) | 7,609 (98.8%) |
| Mobile Home / Other | 3,007 (80.0%) | 750 (20.0%) |
| Total | 89,266 (67.3%) | 43,342 (32.7%) |
Housing Structures by Number of Rooms in Luzerne County
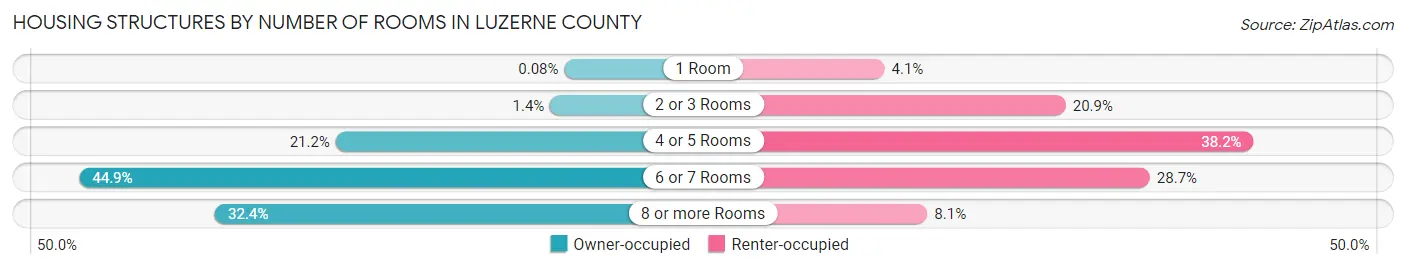
| Number of Rooms | Owner-occupied | Renter-occupied |
| 1 Room | 69 (0.1%) | 1,788 (4.1%) |
| 2 or 3 Rooms | 1,239 (1.4%) | 9,052 (20.9%) |
| 4 or 5 Rooms | 18,952 (21.2%) | 16,572 (38.2%) |
| 6 or 7 Rooms | 40,105 (44.9%) | 12,424 (28.7%) |
| 8 or more Rooms | 28,901 (32.4%) | 3,506 (8.1%) |
| Total | 89,266 (100.0%) | 43,342 (100.0%) |
Housing Structure by Heating Type in Luzerne County
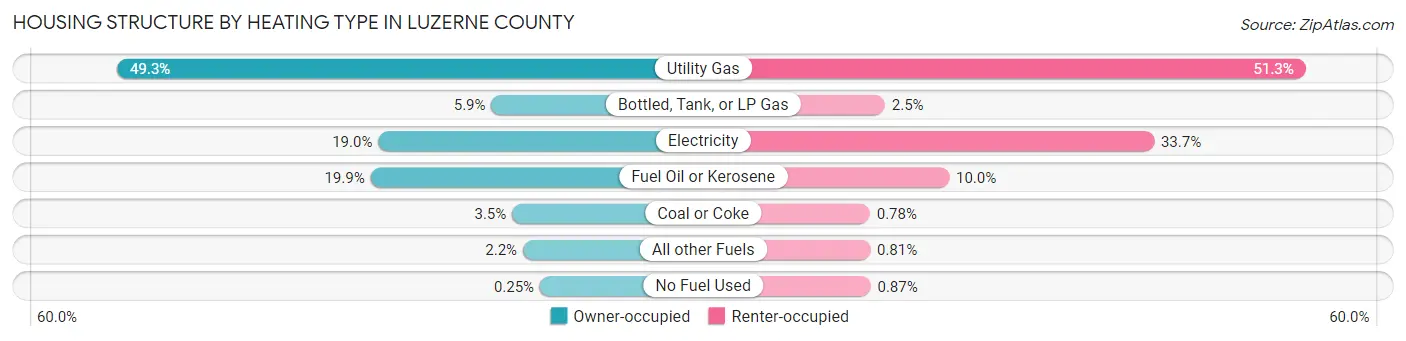
| Heating Type | Owner-occupied | Renter-occupied |
| Utility Gas | 44,002 (49.3%) | 22,238 (51.3%) |
| Bottled, Tank, or LP Gas | 5,246 (5.9%) | 1,095 (2.5%) |
| Electricity | 16,959 (19.0%) | 14,618 (33.7%) |
| Fuel Oil or Kerosene | 17,760 (19.9%) | 4,322 (10.0%) |
| Coal or Coke | 3,102 (3.5%) | 337 (0.8%) |
| All other Fuels | 1,978 (2.2%) | 353 (0.8%) |
| No Fuel Used | 219 (0.3%) | 379 (0.9%) |
| Total | 89,266 (100.0%) | 43,342 (100.0%) |
Household Vehicle Usage in Luzerne County
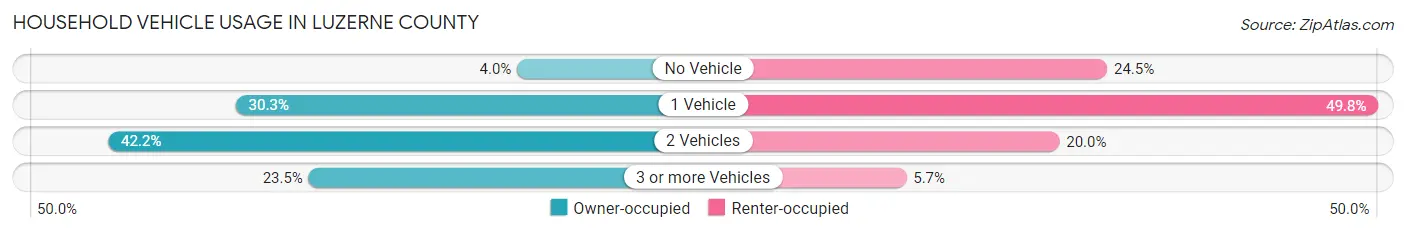
| Vehicles per Household | Owner-occupied | Renter-occupied |
| No Vehicle | 3,586 (4.0%) | 10,605 (24.5%) |
| 1 Vehicle | 27,047 (30.3%) | 21,582 (49.8%) |
| 2 Vehicles | 37,677 (42.2%) | 8,672 (20.0%) |
| 3 or more Vehicles | 20,956 (23.5%) | 2,483 (5.7%) |
| Total | 89,266 (100.0%) | 43,342 (100.0%) |
Real Estate & Mortgages in Luzerne County
Real Estate and Mortgage Overview in Luzerne County
| Characteristic | Without Mortgage | With Mortgage |
| Housing Units | 40,970 | 48,296 |
| Median Property Value | $129,100 | $167,200 |
| Median Household Income | $56,630 | $10,074 |
| Monthly Housing Costs | $568 | $2,239 |
| Real Estate Taxes | $2,136 | $596 |
Property Value by Mortgage Status in Luzerne County
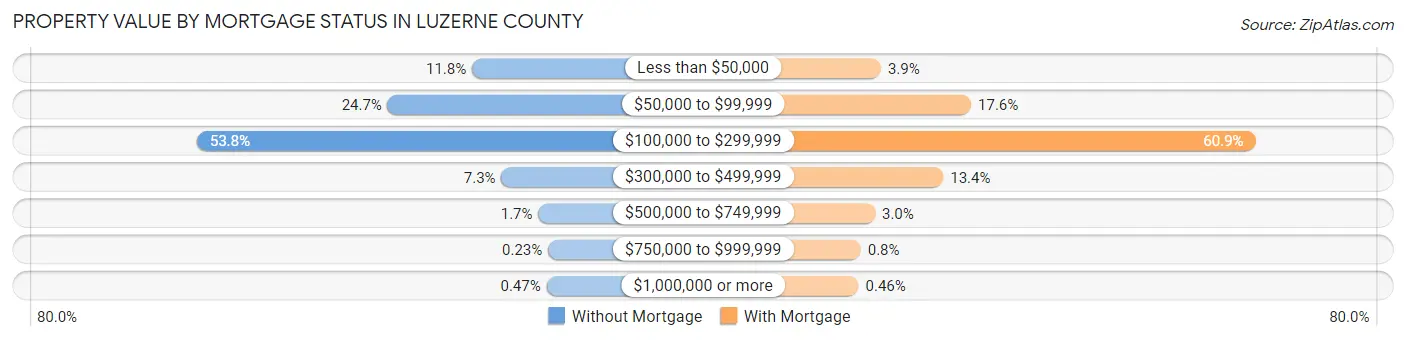
| Property Value | Without Mortgage | With Mortgage |
| Less than $50,000 | 4,843 (11.8%) | 1,869 (3.9%) |
| $50,000 to $99,999 | 10,106 (24.7%) | 8,503 (17.6%) |
| $100,000 to $299,999 | 22,024 (53.8%) | 29,427 (60.9%) |
| $300,000 to $499,999 | 3,009 (7.3%) | 6,457 (13.4%) |
| $500,000 to $749,999 | 700 (1.7%) | 1,433 (3.0%) |
| $750,000 to $999,999 | 94 (0.2%) | 384 (0.8%) |
| $1,000,000 or more | 194 (0.5%) | 223 (0.5%) |
| Total | 40,970 (100.0%) | 48,296 (100.0%) |
Household Income by Mortgage Status in Luzerne County
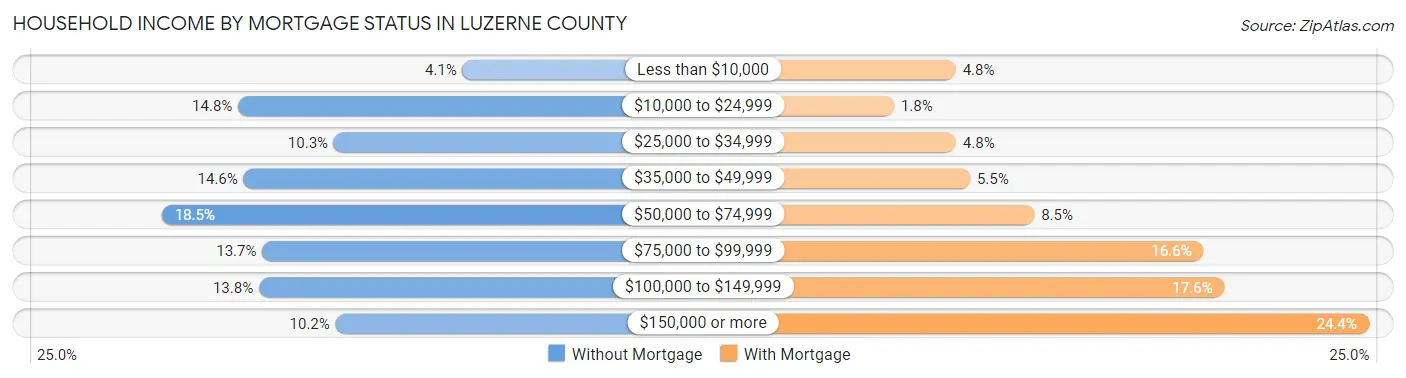
| Household Income | Without Mortgage | With Mortgage |
| Less than $10,000 | 1,698 (4.1%) | 2,302 (4.8%) |
| $10,000 to $24,999 | 6,076 (14.8%) | 882 (1.8%) |
| $25,000 to $34,999 | 4,206 (10.3%) | 2,309 (4.8%) |
| $35,000 to $49,999 | 5,970 (14.6%) | 2,630 (5.4%) |
| $50,000 to $74,999 | 7,569 (18.5%) | 4,108 (8.5%) |
| $75,000 to $99,999 | 5,606 (13.7%) | 8,003 (16.6%) |
| $100,000 to $149,999 | 5,672 (13.8%) | 8,485 (17.6%) |
| $150,000 or more | 4,173 (10.2%) | 11,805 (24.4%) |
| Total | 40,970 (100.0%) | 48,296 (100.0%) |
Property Value to Household Income Ratio in Luzerne County
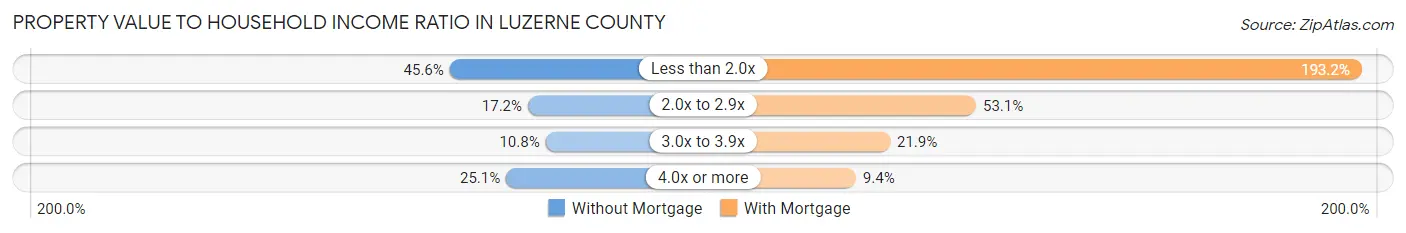
| Value-to-Income Ratio | Without Mortgage | With Mortgage |
| Less than 2.0x | 18,692 (45.6%) | 93,282 (193.1%) |
| 2.0x to 2.9x | 7,047 (17.2%) | 25,638 (53.1%) |
| 3.0x to 3.9x | 4,428 (10.8%) | 10,555 (21.8%) |
| 4.0x or more | 10,296 (25.1%) | 4,560 (9.4%) |
| Total | 40,970 (100.0%) | 48,296 (100.0%) |
Real Estate Taxes by Mortgage Status in Luzerne County

| Property Taxes | Without Mortgage | With Mortgage |
| Less than $800 | 4,832 (11.8%) | 122 (0.3%) |
| $800 to $1,499 | 8,280 (20.2%) | 2,863 (5.9%) |
| $800 to $1,499 | 26,722 (65.2%) | 8,001 (16.6%) |
| Total | 40,970 (100.0%) | 48,296 (100.0%) |
Health & Disability in Luzerne County
Health Insurance Coverage by Age in Luzerne County
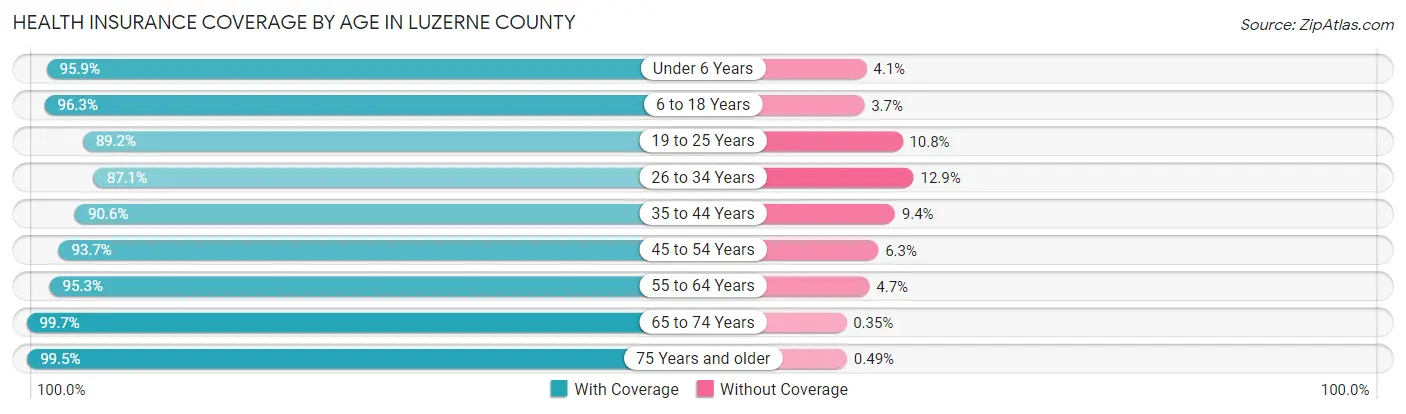
| Age Bracket | With Coverage | Without Coverage |
| Under 6 Years | 19,514 (95.9%) | 836 (4.1%) |
| 6 to 18 Years | 47,227 (96.3%) | 1,823 (3.7%) |
| 19 to 25 Years | 24,912 (89.2%) | 3,029 (10.8%) |
| 26 to 34 Years | 31,555 (87.1%) | 4,678 (12.9%) |
| 35 to 44 Years | 33,876 (90.6%) | 3,524 (9.4%) |
| 45 to 54 Years | 38,739 (93.7%) | 2,613 (6.3%) |
| 55 to 64 Years | 42,649 (95.3%) | 2,096 (4.7%) |
| 65 to 74 Years | 35,762 (99.7%) | 125 (0.4%) |
| 75 Years and older | 25,482 (99.5%) | 126 (0.5%) |
| Total | 299,716 (94.1%) | 18,850 (5.9%) |
Health Insurance Coverage by Citizenship Status in Luzerne County

| Citizenship Status | With Coverage | Without Coverage |
| Native Born | 19,514 (95.9%) | 836 (4.1%) |
| Foreign Born, Citizen | 47,227 (96.3%) | 1,823 (3.7%) |
| Foreign Born, not a Citizen | 24,912 (89.2%) | 3,029 (10.8%) |
Health Insurance Coverage by Household Income in Luzerne County

| Household Income | With Coverage | Without Coverage |
| Under $25,000 | 39,515 (91.8%) | 3,526 (8.2%) |
| $25,000 to $49,999 | 55,737 (93.3%) | 3,993 (6.7%) |
| $50,000 to $74,999 | 48,925 (92.2%) | 4,141 (7.8%) |
| $75,000 to $99,999 | 44,544 (94.0%) | 2,865 (6.0%) |
| $100,000 and over | 106,507 (96.2%) | 4,252 (3.8%) |
Public vs Private Health Insurance Coverage by Age in Luzerne County
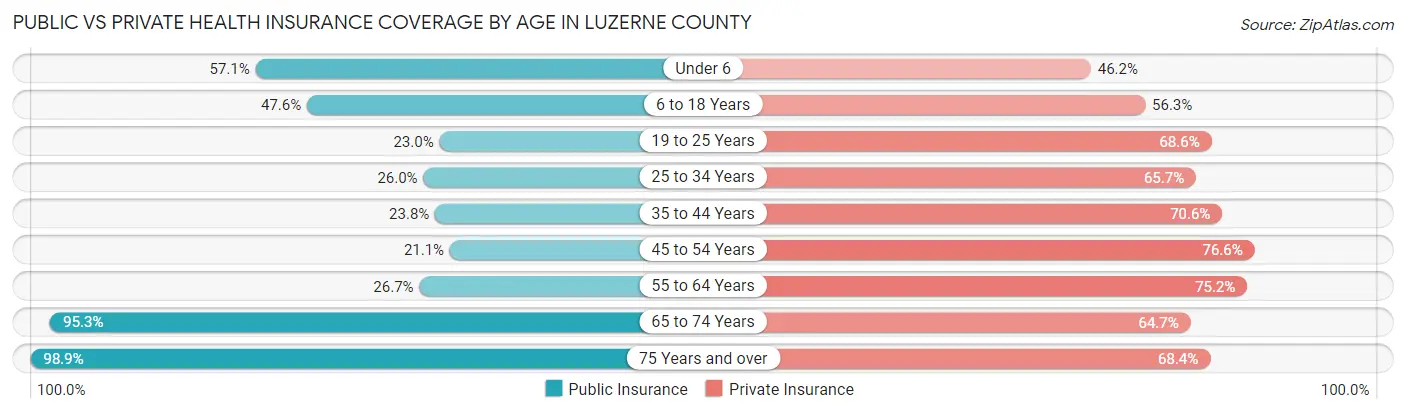
| Age Bracket | Public Insurance | Private Insurance |
| Under 6 | 11,625 (57.1%) | 9,405 (46.2%) |
| 6 to 18 Years | 23,336 (47.6%) | 27,617 (56.3%) |
| 19 to 25 Years | 6,423 (23.0%) | 19,169 (68.6%) |
| 25 to 34 Years | 9,409 (26.0%) | 23,820 (65.7%) |
| 35 to 44 Years | 8,902 (23.8%) | 26,406 (70.6%) |
| 45 to 54 Years | 8,704 (21.0%) | 31,685 (76.6%) |
| 55 to 64 Years | 11,956 (26.7%) | 33,667 (75.2%) |
| 65 to 74 Years | 34,185 (95.3%) | 23,228 (64.7%) |
| 75 Years and over | 25,336 (98.9%) | 17,505 (68.4%) |
| Total | 139,876 (43.9%) | 212,502 (66.7%) |
Disability Status by Sex by Age in Luzerne County
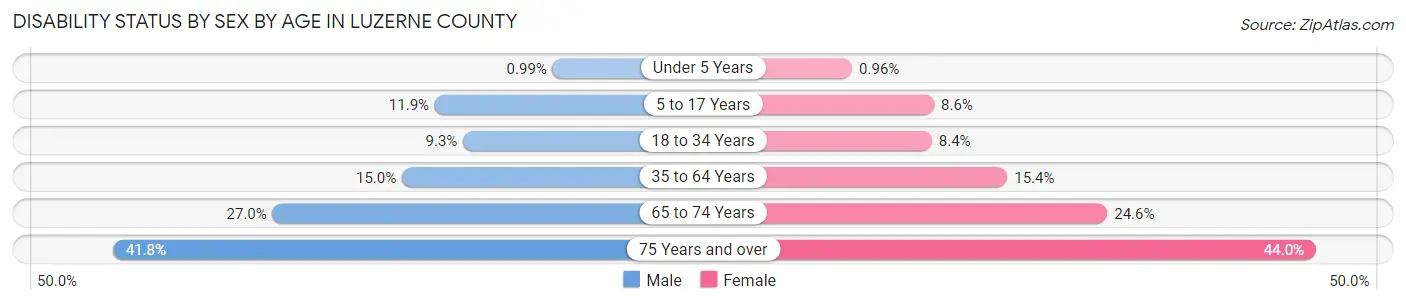
| Age Bracket | Male | Female |
| Under 5 Years | 86 (1.0%) | 80 (1.0%) |
| 5 to 17 Years | 2,922 (11.9%) | 2,027 (8.6%) |
| 18 to 34 Years | 3,282 (9.3%) | 2,761 (8.4%) |
| 35 to 64 Years | 9,279 (15.0%) | 9,448 (15.4%) |
| 65 to 74 Years | 4,580 (27.0%) | 4,661 (24.6%) |
| 75 Years and over | 4,217 (41.8%) | 6,829 (44.0%) |
Disability Class by Sex by Age in Luzerne County
Disability Class: Hearing Difficulty
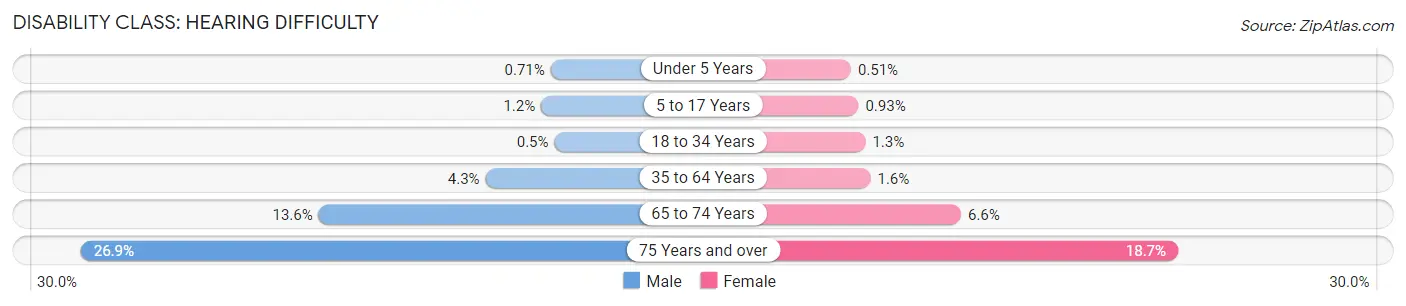
| Age Bracket | Male | Female |
| Under 5 Years | 62 (0.7%) | 43 (0.5%) |
| 5 to 17 Years | 305 (1.2%) | 221 (0.9%) |
| 18 to 34 Years | 175 (0.5%) | 435 (1.3%) |
| 35 to 64 Years | 2,688 (4.3%) | 987 (1.6%) |
| 65 to 74 Years | 2,312 (13.6%) | 1,256 (6.6%) |
| 75 Years and over | 2,710 (26.9%) | 2,904 (18.7%) |
Disability Class: Vision Difficulty
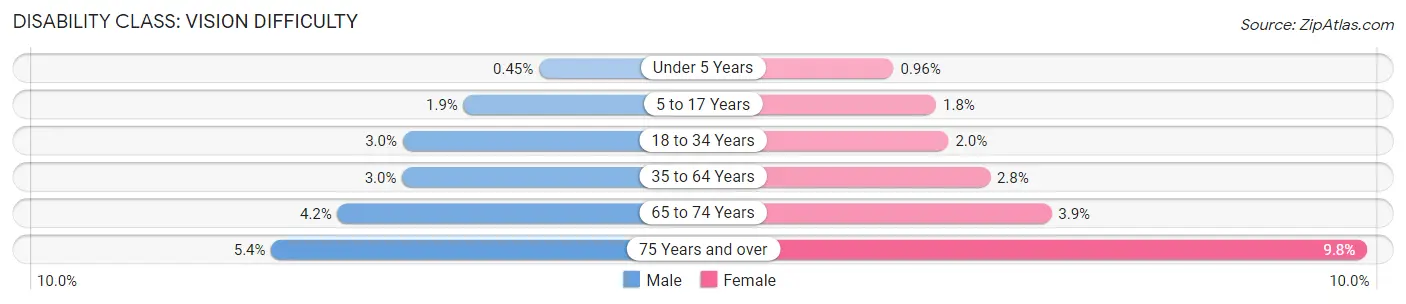
| Age Bracket | Male | Female |
| Under 5 Years | 39 (0.4%) | 80 (1.0%) |
| 5 to 17 Years | 454 (1.8%) | 413 (1.8%) |
| 18 to 34 Years | 1,051 (3.0%) | 654 (2.0%) |
| 35 to 64 Years | 1,853 (3.0%) | 1,691 (2.8%) |
| 65 to 74 Years | 711 (4.2%) | 736 (3.9%) |
| 75 Years and over | 547 (5.4%) | 1,513 (9.8%) |
Disability Class: Cognitive Difficulty
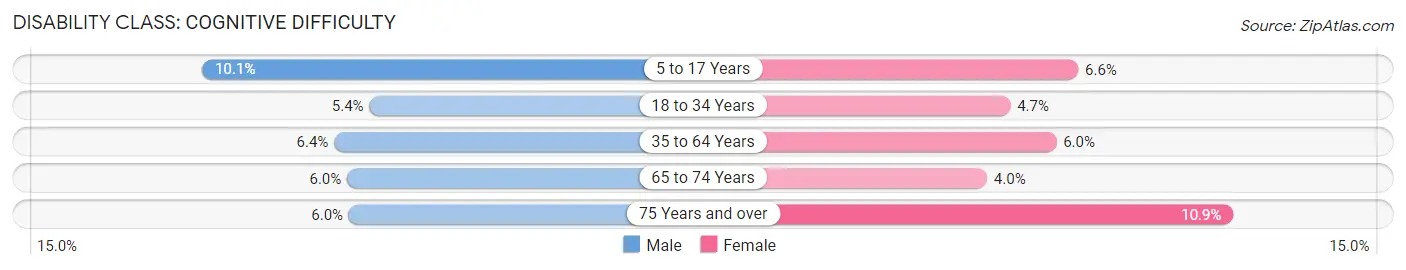
| Age Bracket | Male | Female |
| 5 to 17 Years | 2,467 (10.1%) | 1,556 (6.6%) |
| 18 to 34 Years | 1,907 (5.4%) | 1,550 (4.7%) |
| 35 to 64 Years | 3,956 (6.4%) | 3,674 (6.0%) |
| 65 to 74 Years | 1,021 (6.0%) | 764 (4.0%) |
| 75 Years and over | 602 (6.0%) | 1,692 (10.9%) |
Disability Class: Ambulatory Difficulty
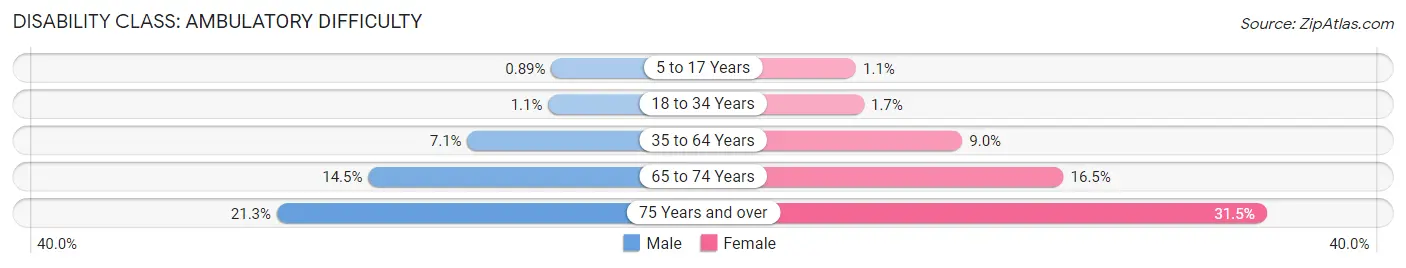
| Age Bracket | Male | Female |
| 5 to 17 Years | 218 (0.9%) | 250 (1.1%) |
| 18 to 34 Years | 396 (1.1%) | 544 (1.7%) |
| 35 to 64 Years | 4,411 (7.1%) | 5,508 (8.9%) |
| 65 to 74 Years | 2,456 (14.5%) | 3,117 (16.5%) |
| 75 Years and over | 2,146 (21.3%) | 4,893 (31.5%) |
Disability Class: Self-Care Difficulty
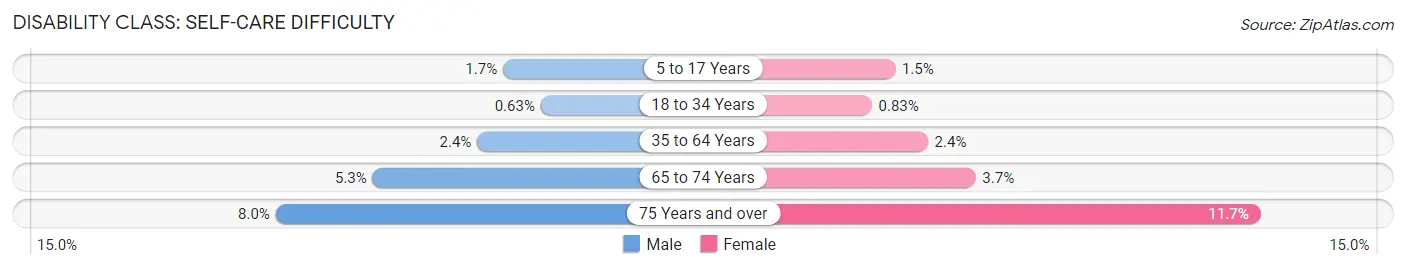
| Age Bracket | Male | Female |
| 5 to 17 Years | 413 (1.7%) | 350 (1.5%) |
| 18 to 34 Years | 221 (0.6%) | 273 (0.8%) |
| 35 to 64 Years | 1,489 (2.4%) | 1,472 (2.4%) |
| 65 to 74 Years | 901 (5.3%) | 703 (3.7%) |
| 75 Years and over | 808 (8.0%) | 1,809 (11.7%) |
Technology Access in Luzerne County
Computing Device Access in Luzerne County
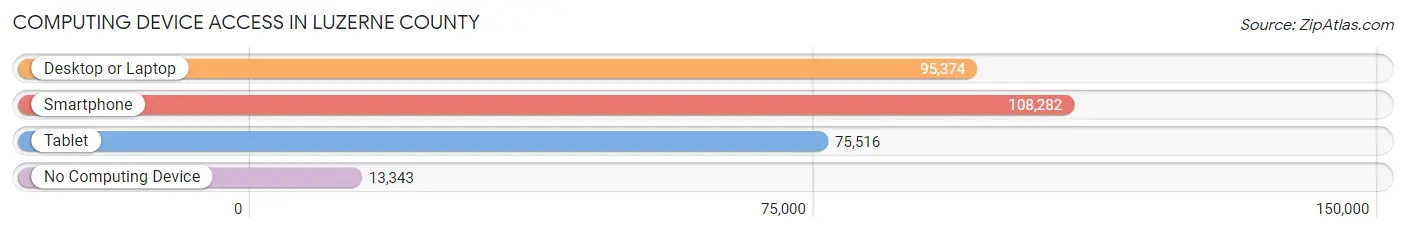
| Device Type | # Households | % Households |
| Desktop or Laptop | 95,374 | 71.9% |
| Smartphone | 108,282 | 81.7% |
| Tablet | 75,516 | 57.0% |
| No Computing Device | 13,343 | 10.1% |
| Total | 132,608 | 100.0% |
Internet Access in Luzerne County
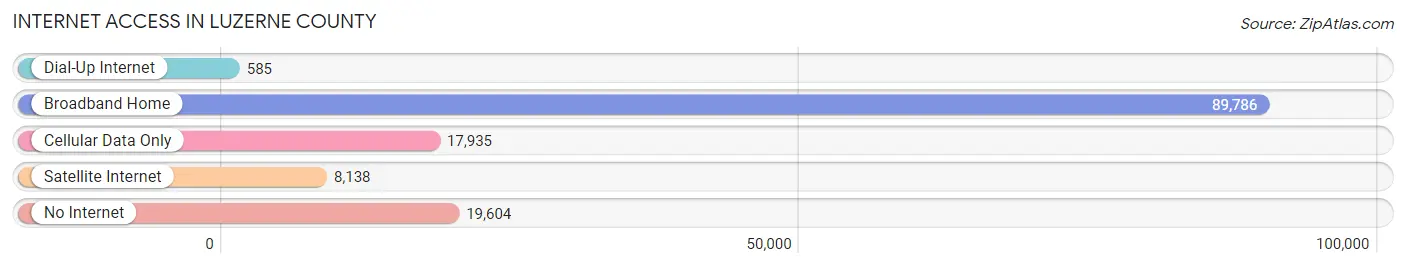
| Internet Type | # Households | % Households |
| Dial-Up Internet | 585 | 0.4% |
| Broadband Home | 89,786 | 67.7% |
| Cellular Data Only | 17,935 | 13.5% |
| Satellite Internet | 8,138 | 6.1% |
| No Internet | 19,604 | 14.8% |
| Total | 132,608 | 100.0% |
Luzerne County Summary
Luzerne County, Pennsylvania is located in the northeastern part of the state and is part of the Scranton/Wilkes-Barre metropolitan area. It is bordered by Lackawanna County to the north, Carbon County to the east, Schuylkill County to the south, and Wyoming County to the west. The county seat is Wilkes-Barre, and the county has a total area of 945 square miles.
History
Luzerne County was created in 1786 from part of Northumberland County. It was named after Chevalier de la Luzerne, a French soldier and diplomat who served as an ambassador to the United States during the American Revolution. The county was originally part of the Wyoming Valley, which was inhabited by the Susquehannock and Iroquois Native American tribes. The first European settlers arrived in the area in the late 17th century, and the county was officially established in 1786.
The county was an important center of the coal mining industry in the 19th and 20th centuries. The first coal mine in the county was opened in 1806, and by the late 19th century, the county was the leading coal-producing county in the state. The coal industry declined in the mid-20th century, and the county’s economy shifted to manufacturing and services.
Geography
Luzerne County is located in the northeastern part of Pennsylvania. It is bordered by Lackawanna County to the north, Carbon County to the east, Schuylkill County to the south, and Wyoming County to the west. The county has a total area of 945 square miles, and is part of the Appalachian Mountains. The highest point in the county is Mount Ararat, which has an elevation of 2,624 feet.
The county is home to several rivers, including the Susquehanna River, the Lackawanna River, and the Lehigh River. The county also contains several lakes, including Lake Jean, Lake Noxen, and Lake Winola. The county is home to several state parks, including Frances Slocum State Park, Nescopeck State Park, and Ricketts Glen State Park.
Economy
The economy of Luzerne County is largely based on services and manufacturing. The county is home to several large employers, including Geisinger Health System, Wilkes University, and the Wilkes-Barre/Scranton International Airport. The county is also home to several large manufacturing companies, including Procter & Gamble, Unilever, and Wegmans.
The county is also home to several tourist attractions, including the Mohegan Sun at Pocono Downs casino and racetrack, the Wilkes-Barre/Scranton Penguins hockey team, and the F.M. Kirby Center for the Performing Arts. The county is also home to several ski resorts, including Montage Mountain and Elk Mountain.
Demographics
As of the 2010 census, the population of Luzerne County was 320,918. The population is largely white (90.2%), with small percentages of African Americans (4.2%), Asians (2.2%), and Hispanics (2.7%). The median household income in the county is $45,945, and the median home value is $118,400. The county has a poverty rate of 13.3%.
Conclusion
Luzerne County, Pennsylvania is located in the northeastern part of the state and is part of the Scranton/Wilkes-Barre metropolitan area. It has a total area of 945 square miles and was created in 1786 from part of Northumberland County. The county was an important center of the coal mining industry in the 19th and 20th centuries, but the economy has since shifted to services and manufacturing. The population of the county is largely white, with small percentages of African Americans, Asians, and Hispanics. The median household income in the county is $45,945, and the median home value is $118,400. The county is home to several large employers, tourist attractions, and ski resorts.
Common Questions
What is Per Capita Income in Luzerne County?
Per Capita income in Luzerne County is $33,535.
What is the Median Family Income in Luzerne County?
Median Family Income in Luzerne County is $78,501.
What is the Median Household income in Luzerne County?
Median Household Income in Luzerne County is $60,836.
What is Income or Wage Gap in Luzerne County?
Income or Wage Gap in Luzerne County is 28.2%.
Women in Luzerne County earn 71.8 cents for every dollar earned by a man.
What is Family Income Deficit in Luzerne County?
Family Income Deficit in Luzerne County is $11,334.
Families that are below poverty line in Luzerne County earn $11,334 less on average than the poverty threshold level.
What is Inequality or Gini Index in Luzerne County?
Inequality or Gini Index in Luzerne County is 0.45.
What is the Total Population of Luzerne County?
Total Population of Luzerne County is 325,396.
What is the Total Male Population of Luzerne County?
Total Male Population of Luzerne County is 162,277.
What is the Total Female Population of Luzerne County?
Total Female Population of Luzerne County is 163,119.
What is the Ratio of Males per 100 Females in Luzerne County?
There are 99.48 Males per 100 Females in Luzerne County.
What is the Ratio of Females per 100 Males in Luzerne County?
There are 100.52 Females per 100 Males in Luzerne County.
What is the Median Population Age in Luzerne County?
Median Population Age in Luzerne County is 42.2 Years.
What is the Average Family Size in Luzerne County
Average Family Size in Luzerne County is 3.0 People.
What is the Average Household Size in Luzerne County
Average Household Size in Luzerne County is 2.4 People.
How Large is the Labor Force in Luzerne County?
There are 163,429 People in the Labor Forcein in Luzerne County.
What is the Percentage of People in the Labor Force in Luzerne County?
61.0% of People are in the Labor Force in Luzerne County.
What is the Unemployment Rate in Luzerne County?
Unemployment Rate in Luzerne County is 5.9%.