Lebanon County, PA Map & Demographics
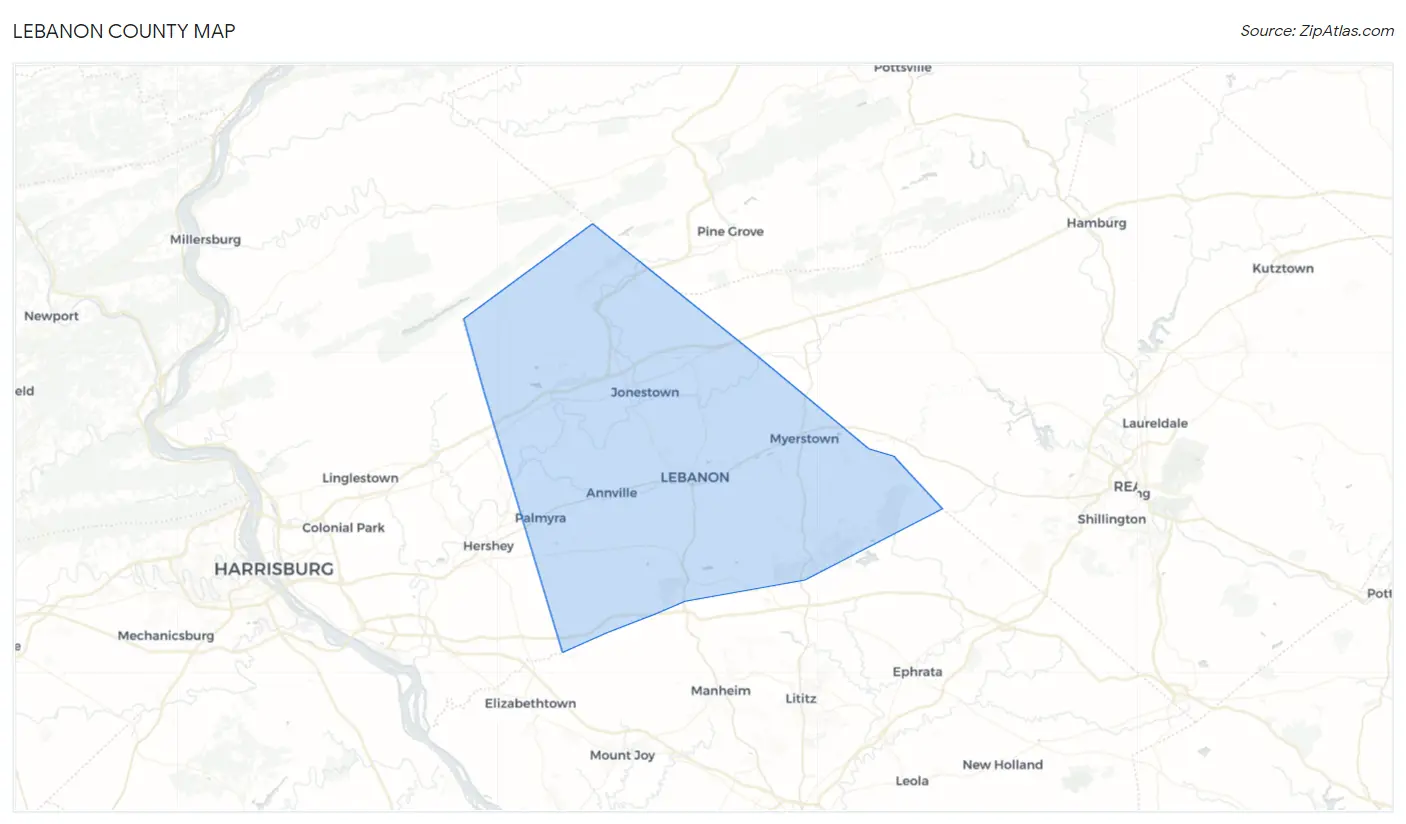
Lebanon County Map
Lebanon County Overview
$35,604
PER CAPITA INCOME
$88,582
AVG FAMILY INCOME
$72,532
AVG HOUSEHOLD INCOME
36.6%
WAGE / INCOME GAP [ % ]
63.4¢/ $1
WAGE / INCOME GAP [ $ ]
$10,506
FAMILY INCOME DEFICIT
0.42
INEQUALITY / GINI INDEX
143,258
TOTAL POPULATION
70,793
MALE POPULATION
72,465
FEMALE POPULATION
97.69
MALES / 100 FEMALES
102.36
FEMALES / 100 MALES
41.3
MEDIAN AGE
3.0
AVG FAMILY SIZE
2.5
AVG HOUSEHOLD SIZE
72,006
LABOR FORCE [ PEOPLE ]
63.0%
PERCENT IN LABOR FORCE
4.4%
UNEMPLOYMENT RATE
Lebanon County Area Codes
Income in Lebanon County
Income Overview in Lebanon County
Per Capita Income in Lebanon County is $35,604, while median incomes of families and households are $88,582 and $72,532 respectively.
| Characteristic | Number | Measure |
| Per Capita Income | 143,258 | $35,604 |
| Median Family Income | 37,704 | $88,582 |
| Mean Family Income | 37,704 | $105,385 |
| Median Household Income | 55,236 | $72,532 |
| Mean Household Income | 55,236 | $90,929 |
| Income Deficit | 37,704 | $10,506 |
| Wage / Income Gap (%) | 143,258 | 36.65% |
| Wage / Income Gap ($) | 143,258 | 63.35¢ per $1 |
| Gini / Inequality Index | 143,258 | 0.42 |
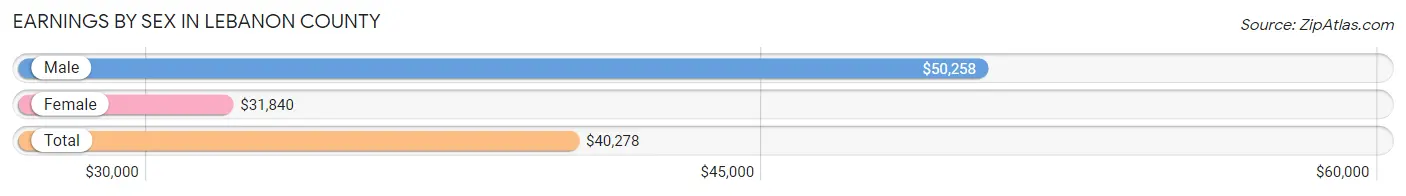
Earnings by Sex in Lebanon County
Average Earnings in Lebanon County are $40,278, $50,258 for men and $31,840 for women, a difference of 36.6%.
| Sex | Number | Average Earnings |
| Male | 40,442 (52.8%) | $50,258 |
| Female | 36,123 (47.2%) | $31,840 |
| Total | 76,565 (100.0%) | $40,278 |
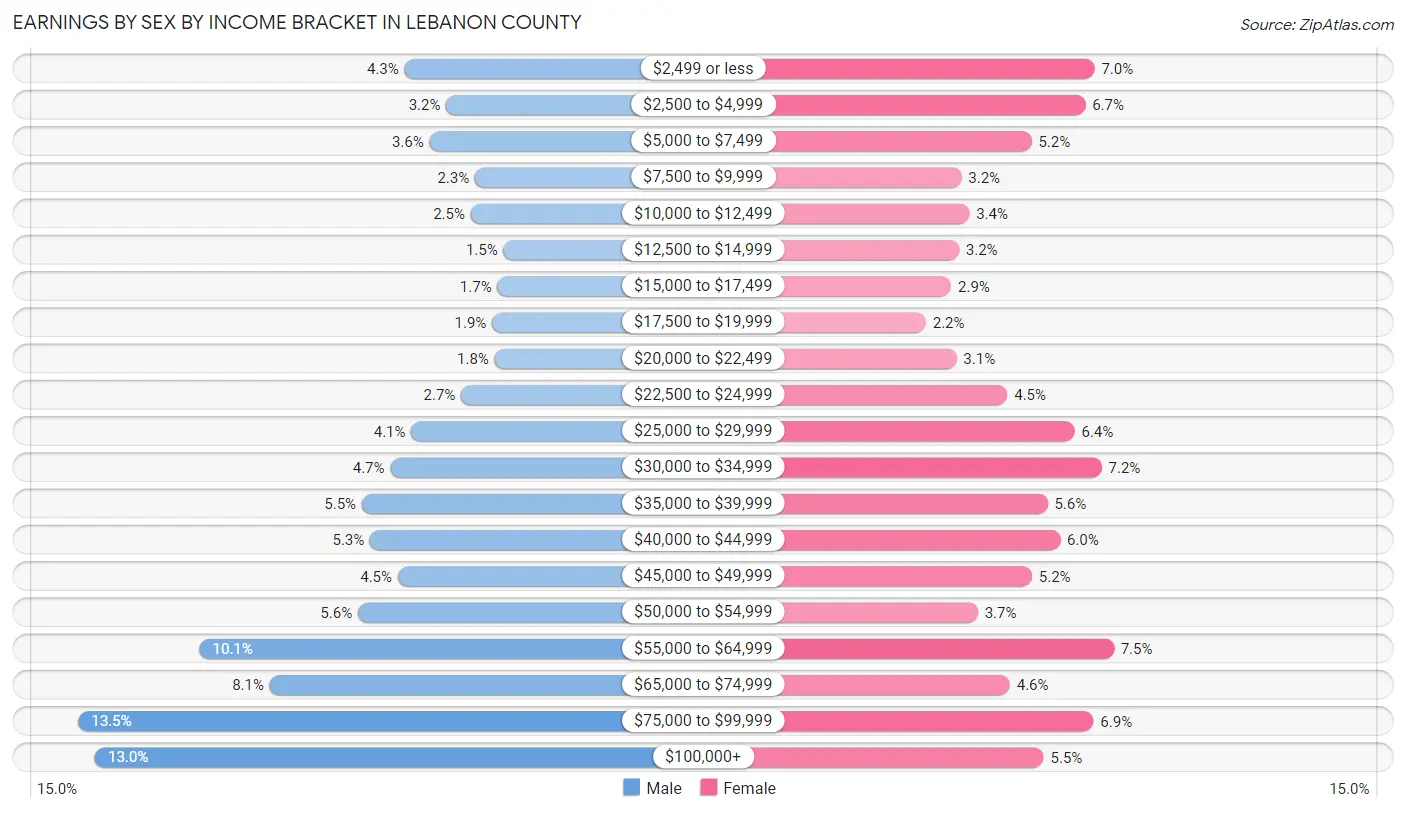
Earnings by Sex by Income Bracket in Lebanon County
The most common earnings brackets in Lebanon County are $75,000 to $99,999 for men (5,455 | 13.5%) and $55,000 to $64,999 for women (2,709 | 7.5%).
| Income | Male | Female |
| $2,499 or less | 1,748 (4.3%) | 2,515 (7.0%) |
| $2,500 to $4,999 | 1,272 (3.2%) | 2,419 (6.7%) |
| $5,000 to $7,499 | 1,462 (3.6%) | 1,873 (5.2%) |
| $7,500 to $9,999 | 946 (2.3%) | 1,164 (3.2%) |
| $10,000 to $12,499 | 996 (2.5%) | 1,241 (3.4%) |
| $12,500 to $14,999 | 621 (1.5%) | 1,137 (3.2%) |
| $15,000 to $17,499 | 693 (1.7%) | 1,058 (2.9%) |
| $17,500 to $19,999 | 751 (1.9%) | 802 (2.2%) |
| $20,000 to $22,499 | 723 (1.8%) | 1,114 (3.1%) |
| $22,500 to $24,999 | 1,106 (2.7%) | 1,629 (4.5%) |
| $25,000 to $29,999 | 1,672 (4.1%) | 2,311 (6.4%) |
| $30,000 to $34,999 | 1,909 (4.7%) | 2,586 (7.2%) |
| $35,000 to $39,999 | 2,232 (5.5%) | 2,037 (5.6%) |
| $40,000 to $44,999 | 2,138 (5.3%) | 2,163 (6.0%) |
| $45,000 to $49,999 | 1,823 (4.5%) | 1,877 (5.2%) |
| $50,000 to $54,999 | 2,275 (5.6%) | 1,329 (3.7%) |
| $55,000 to $64,999 | 4,076 (10.1%) | 2,709 (7.5%) |
| $65,000 to $74,999 | 3,279 (8.1%) | 1,656 (4.6%) |
| $75,000 to $99,999 | 5,455 (13.5%) | 2,504 (6.9%) |
| $100,000+ | 5,265 (13.0%) | 1,999 (5.5%) |
| Total | 40,442 (100.0%) | 36,123 (100.0%) |
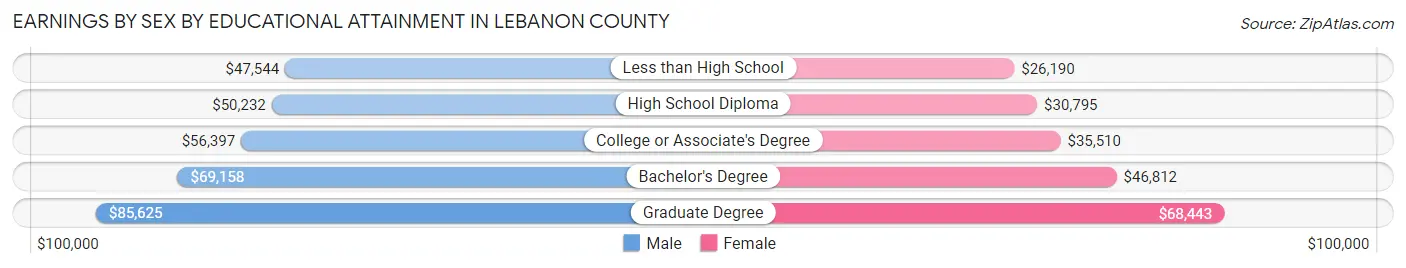
Earnings by Sex by Educational Attainment in Lebanon County
Average earnings in Lebanon County are $55,960 for men and $37,241 for women, a difference of 33.5%. Men with an educational attainment of graduate degree enjoy the highest average annual earnings of $85,625, while those with less than high school education earn the least with $47,544. Women with an educational attainment of graduate degree earn the most with the average annual earnings of $68,443, while those with less than high school education have the smallest earnings of $26,190.
| Educational Attainment | Male Income | Female Income |
| Less than High School | $47,544 | $26,190 |
| High School Diploma | $50,232 | $30,795 |
| College or Associate's Degree | $56,397 | $35,510 |
| Bachelor's Degree | $69,158 | $46,812 |
| Graduate Degree | $85,625 | $68,443 |
| Total | $55,960 | $37,241 |
Family Income in Lebanon County
Family Income Brackets in Lebanon County
According to the Lebanon County family income data, there are 8,634 families falling into the $100,000 to $149,999 income range, which is the most common income bracket and makes up 22.9% of all families. Conversely, the $10,000 to $14,999 income bracket is the least frequent group with only 566 families (1.5%) belonging to this category.
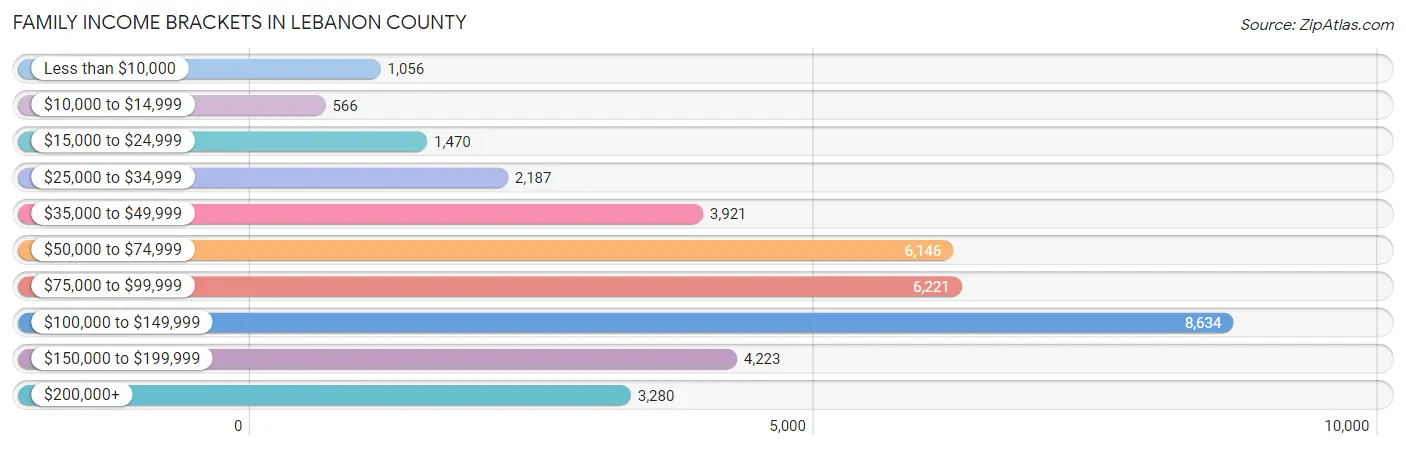
| Income Bracket | # Families | % Families |
| Less than $10,000 | 1,056 | 2.8% |
| $10,000 to $14,999 | 566 | 1.5% |
| $15,000 to $24,999 | 1,470 | 3.9% |
| $25,000 to $34,999 | 2,187 | 5.8% |
| $35,000 to $49,999 | 3,921 | 10.4% |
| $50,000 to $74,999 | 6,146 | 16.3% |
| $75,000 to $99,999 | 6,221 | 16.5% |
| $100,000 to $149,999 | 8,634 | 22.9% |
| $150,000 to $199,999 | 4,223 | 11.2% |
| $200,000+ | 3,280 | 8.7% |
Family Income by Famaliy Size in Lebanon County
7+ person families (867 | 2.3%) account for the highest median family income in Lebanon County with $155,438 per family, while 2-person families (19,126 | 50.7%) have the highest median income of $38,760 per family member.
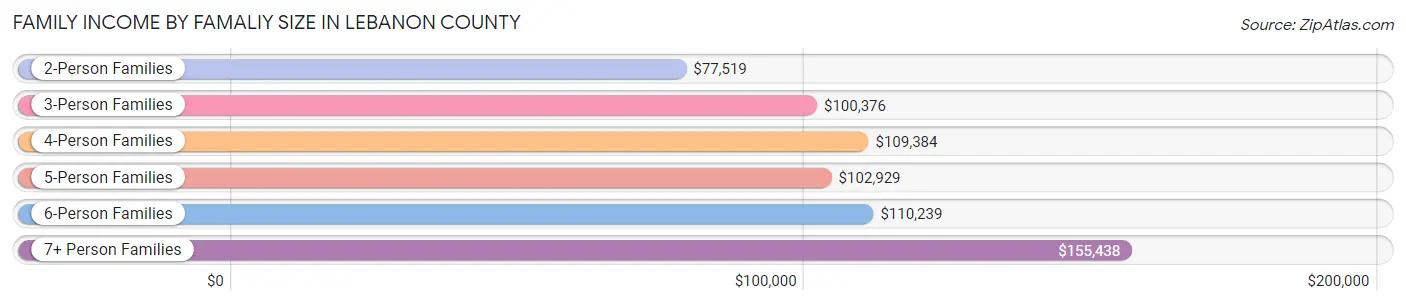
| Income Bracket | # Families | Median Income |
| 2-Person Families | 19,126 (50.7%) | $77,519 |
| 3-Person Families | 7,913 (21.0%) | $100,376 |
| 4-Person Families | 6,131 (16.3%) | $109,384 |
| 5-Person Families | 2,924 (7.8%) | $102,929 |
| 6-Person Families | 743 (2.0%) | $110,239 |
| 7+ Person Families | 867 (2.3%) | $155,438 |
| Total | 37,704 (100.0%) | $88,582 |
Family Income by Number of Earners in Lebanon County
The median family income in Lebanon County is $88,582, with families comprising 3+ earners (5,559) having the highest median family income of $142,281, while families with no earners (6,008) have the lowest median family income of $49,846, accounting for 14.7% and 15.9% of families, respectively.
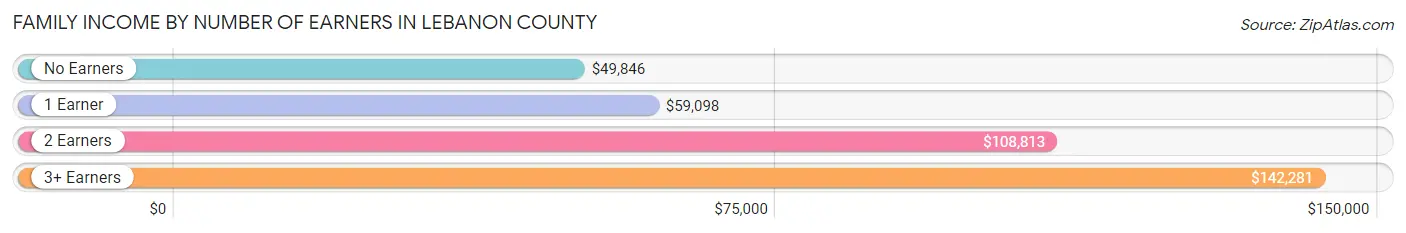
| Number of Earners | # Families | Median Income |
| No Earners | 6,008 (15.9%) | $49,846 |
| 1 Earner | 11,657 (30.9%) | $59,098 |
| 2 Earners | 14,480 (38.4%) | $108,813 |
| 3+ Earners | 5,559 (14.7%) | $142,281 |
| Total | 37,704 (100.0%) | $88,582 |
Household Income in Lebanon County
Household Income Brackets in Lebanon County
With 10,329 households falling in the category, the $100,000 to $149,999 income range is the most frequent in Lebanon County, accounting for 18.7% of all households. In contrast, only 1,436 households (2.6%) fall into the $10,000 to $14,999 income bracket, making it the least populous group.
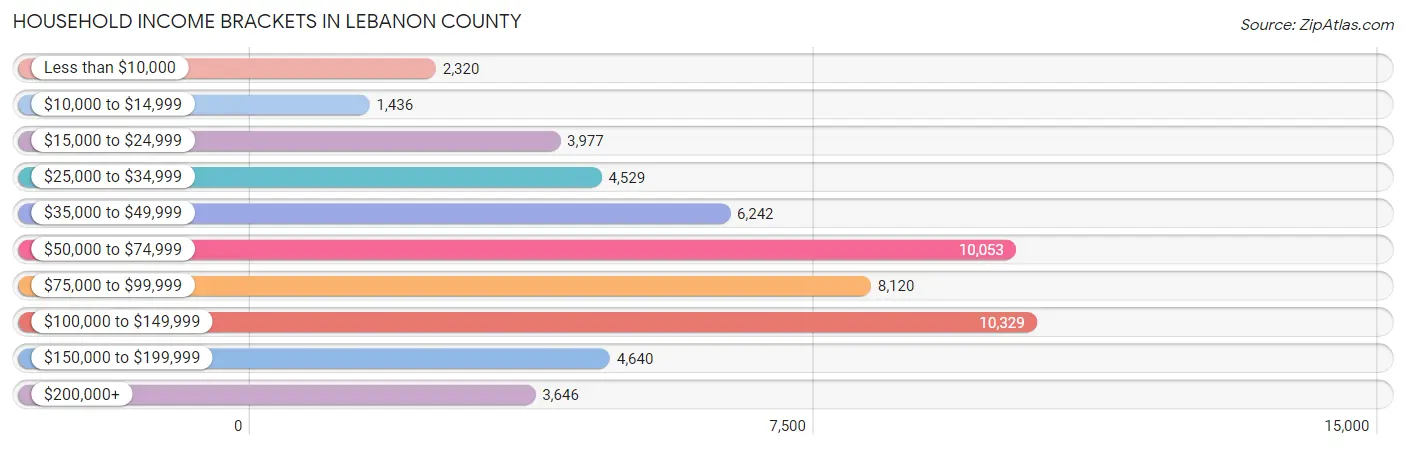
| Income Bracket | # Households | % Households |
| Less than $10,000 | 2,320 | 4.2% |
| $10,000 to $14,999 | 1,436 | 2.6% |
| $15,000 to $24,999 | 3,977 | 7.2% |
| $25,000 to $34,999 | 4,529 | 8.2% |
| $35,000 to $49,999 | 6,242 | 11.3% |
| $50,000 to $74,999 | 10,053 | 18.2% |
| $75,000 to $99,999 | 8,120 | 14.7% |
| $100,000 to $149,999 | 10,329 | 18.7% |
| $150,000 to $199,999 | 4,640 | 8.4% |
| $200,000+ | 3,646 | 6.6% |
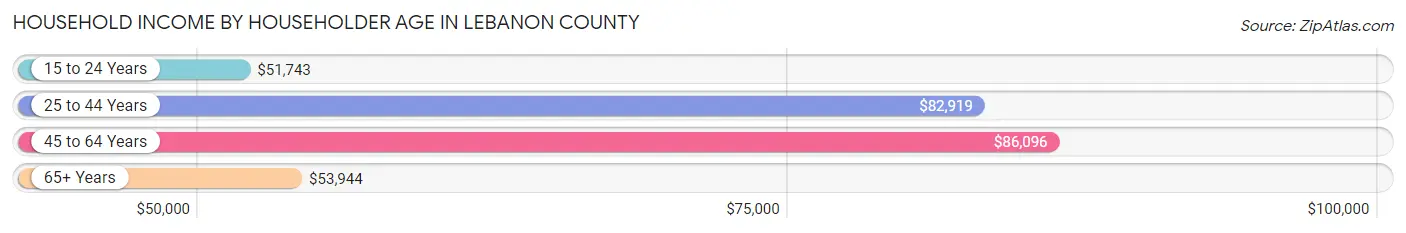
Household Income by Householder Age in Lebanon County
The median household income in Lebanon County is $72,532, with the highest median household income of $86,096 found in the 45 to 64 years age bracket for the primary householder. A total of 19,996 households (36.2%) fall into this category. Meanwhile, the 15 to 24 years age bracket for the primary householder has the lowest median household income of $51,743, with 1,811 households (3.3%) in this group.
| Income Bracket | # Households | Median Income |
| 15 to 24 Years | 1,811 (3.3%) | $51,743 |
| 25 to 44 Years | 15,826 (28.6%) | $82,919 |
| 45 to 64 Years | 19,996 (36.2%) | $86,096 |
| 65+ Years | 17,603 (31.9%) | $53,944 |
| Total | 55,236 (100.0%) | $72,532 |
Poverty in Lebanon County
Income Below Poverty by Sex and Age in Lebanon County
With 10.0% poverty level for males and 11.8% for females among the residents of Lebanon County, 15 year old males and under 5 year old females are the most vulnerable to poverty, with 381 males (34.8%) and 787 females (20.1%) in their respective age groups living below the poverty level.
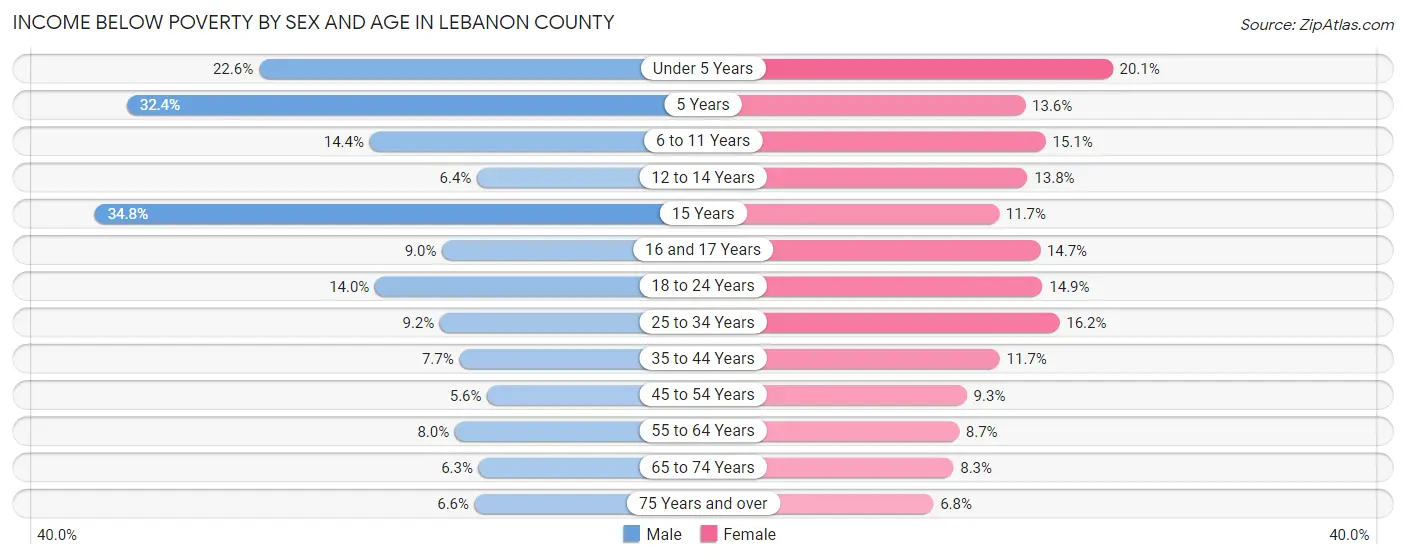
| Age Bracket | Male | Female |
| Under 5 Years | 905 (22.6%) | 787 (20.1%) |
| 5 Years | 281 (32.4%) | 98 (13.6%) |
| 6 to 11 Years | 784 (14.4%) | 819 (15.1%) |
| 12 to 14 Years | 193 (6.4%) | 396 (13.8%) |
| 15 Years | 381 (34.8%) | 126 (11.7%) |
| 16 and 17 Years | 158 (9.0%) | 248 (14.7%) |
| 18 to 24 Years | 761 (14.0%) | 775 (14.9%) |
| 25 to 34 Years | 757 (9.1%) | 1,283 (16.2%) |
| 35 to 44 Years | 657 (7.7%) | 992 (11.7%) |
| 45 to 54 Years | 497 (5.6%) | 789 (9.3%) |
| 55 to 64 Years | 764 (8.0%) | 844 (8.7%) |
| 65 to 74 Years | 470 (6.3%) | 676 (8.3%) |
| 75 Years and over | 312 (6.6%) | 461 (6.8%) |
| Total | 6,920 (10.0%) | 8,294 (11.8%) |
Income Above Poverty by Sex and Age in Lebanon County
According to the poverty statistics in Lebanon County, males aged 45 to 54 years and females aged 75 years and over are the age groups that are most secure financially, with 94.4% of males and 93.2% of females in these age groups living above the poverty line.
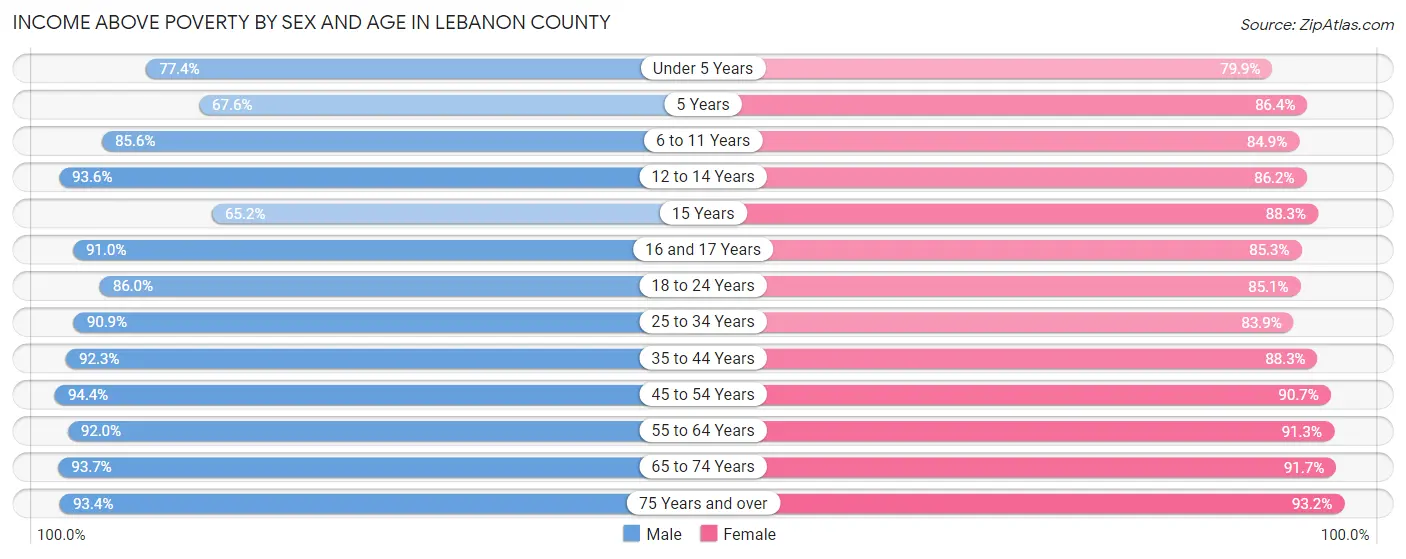
| Age Bracket | Male | Female |
| Under 5 Years | 3,100 (77.4%) | 3,129 (79.9%) |
| 5 Years | 586 (67.6%) | 622 (86.4%) |
| 6 to 11 Years | 4,673 (85.6%) | 4,594 (84.9%) |
| 12 to 14 Years | 2,823 (93.6%) | 2,477 (86.2%) |
| 15 Years | 714 (65.2%) | 955 (88.3%) |
| 16 and 17 Years | 1,599 (91.0%) | 1,438 (85.3%) |
| 18 to 24 Years | 4,685 (86.0%) | 4,431 (85.1%) |
| 25 to 34 Years | 7,520 (90.8%) | 6,660 (83.9%) |
| 35 to 44 Years | 7,865 (92.3%) | 7,474 (88.3%) |
| 45 to 54 Years | 8,316 (94.4%) | 7,719 (90.7%) |
| 55 to 64 Years | 8,735 (92.0%) | 8,869 (91.3%) |
| 65 to 74 Years | 7,015 (93.7%) | 7,491 (91.7%) |
| 75 Years and over | 4,440 (93.4%) | 6,333 (93.2%) |
| Total | 62,071 (90.0%) | 62,192 (88.2%) |
Income Below Poverty Among Married-Couple Families in Lebanon County
The poverty statistics for married-couple families in Lebanon County show that 3.8% or 1,116 of the total 29,140 families live below the poverty line. Families with 3 or 4 children have the highest poverty rate of 10.6%, comprising of 238 families. On the other hand, families with 1 or 2 children have the lowest poverty rate of 2.3%, which includes 183 families.
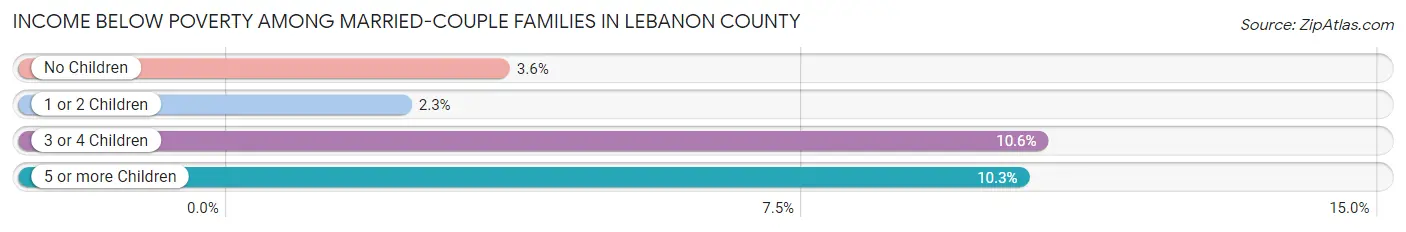
| Children | Above Poverty | Below Poverty |
| No Children | 17,784 (96.5%) | 654 (3.5%) |
| 1 or 2 Children | 7,872 (97.7%) | 183 (2.3%) |
| 3 or 4 Children | 2,012 (89.4%) | 238 (10.6%) |
| 5 or more Children | 356 (89.7%) | 41 (10.3%) |
| Total | 28,024 (96.2%) | 1,116 (3.8%) |
Income Below Poverty Among Single-Parent Households in Lebanon County
According to the poverty data in Lebanon County, 12.9% or 331 single-father households and 24.7% or 1,485 single-mother households are living below the poverty line. Among single-father households, those with no children have the highest poverty rate, with 215 households (20.2%) experiencing poverty. Likewise, among single-mother households, those with 5 or more children have the highest poverty rate, with 60 households (100.0%) falling below the poverty line.
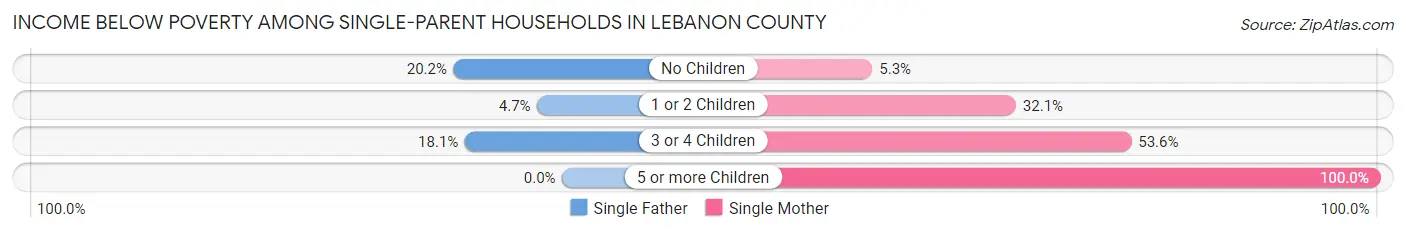
| Children | Single Father | Single Mother |
| No Children | 215 (20.2%) | 125 (5.3%) |
| 1 or 2 Children | 54 (4.7%) | 940 (32.1%) |
| 3 or 4 Children | 62 (18.1%) | 360 (53.6%) |
| 5 or more Children | 0 (0.0%) | 60 (100.0%) |
| Total | 331 (12.9%) | 1,485 (24.7%) |
Income Below Poverty Among Married-Couple vs Single-Parent Households in Lebanon County
The poverty data for Lebanon County shows that 1,116 of the married-couple family households (3.8%) and 1,816 of the single-parent households (21.2%) are living below the poverty level. Within the married-couple family households, those with 3 or 4 children have the highest poverty rate, with 238 households (10.6%) falling below the poverty line. Among the single-parent households, those with 5 or more children have the highest poverty rate, with 60 household (100.0%) living below poverty.
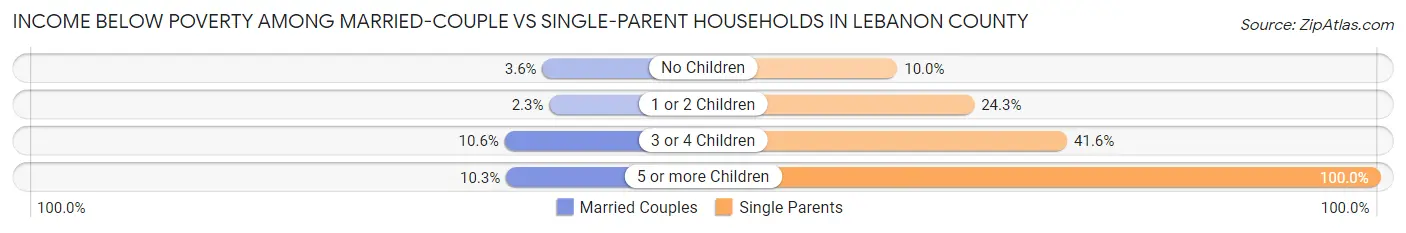
| Children | Married-Couple Families | Single-Parent Households |
| No Children | 654 (3.5%) | 340 (10.0%) |
| 1 or 2 Children | 183 (2.3%) | 994 (24.3%) |
| 3 or 4 Children | 238 (10.6%) | 422 (41.6%) |
| 5 or more Children | 41 (10.3%) | 60 (100.0%) |
| Total | 1,116 (3.8%) | 1,816 (21.2%) |
Race in Lebanon County
The most populous races in Lebanon County are White / Caucasian (119,157 | 83.2%), Hispanic or Latino (20,729 | 14.5%), and Some other Race (11,149 | 7.8%).
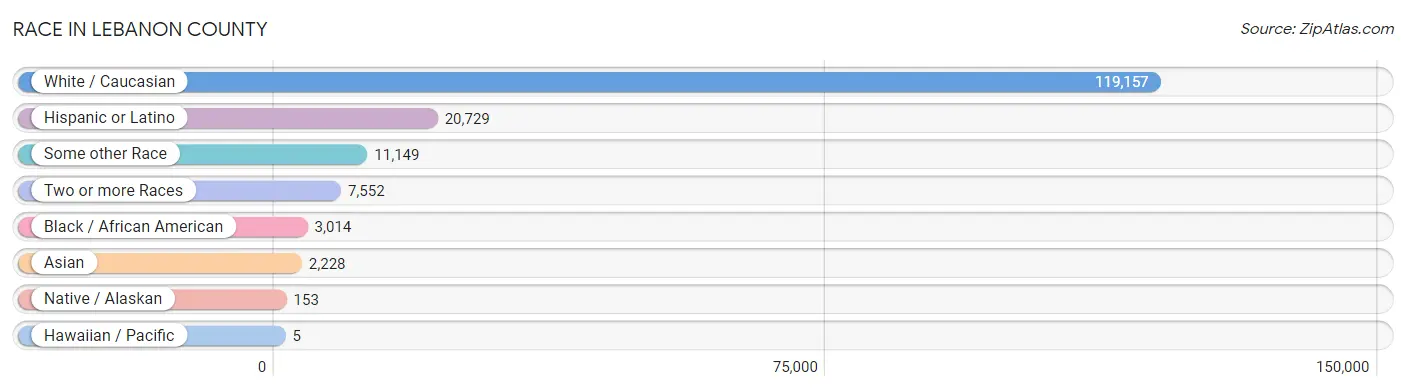
| Race | # Population | % Population |
| Asian | 2,228 | 1.6% |
| Black / African American | 3,014 | 2.1% |
| Hawaiian / Pacific | 5 | 0.0% |
| Hispanic or Latino | 20,729 | 14.5% |
| Native / Alaskan | 153 | 0.1% |
| White / Caucasian | 119,157 | 83.2% |
| Two or more Races | 7,552 | 5.3% |
| Some other Race | 11,149 | 7.8% |
| Total | 143,258 | 100.0% |
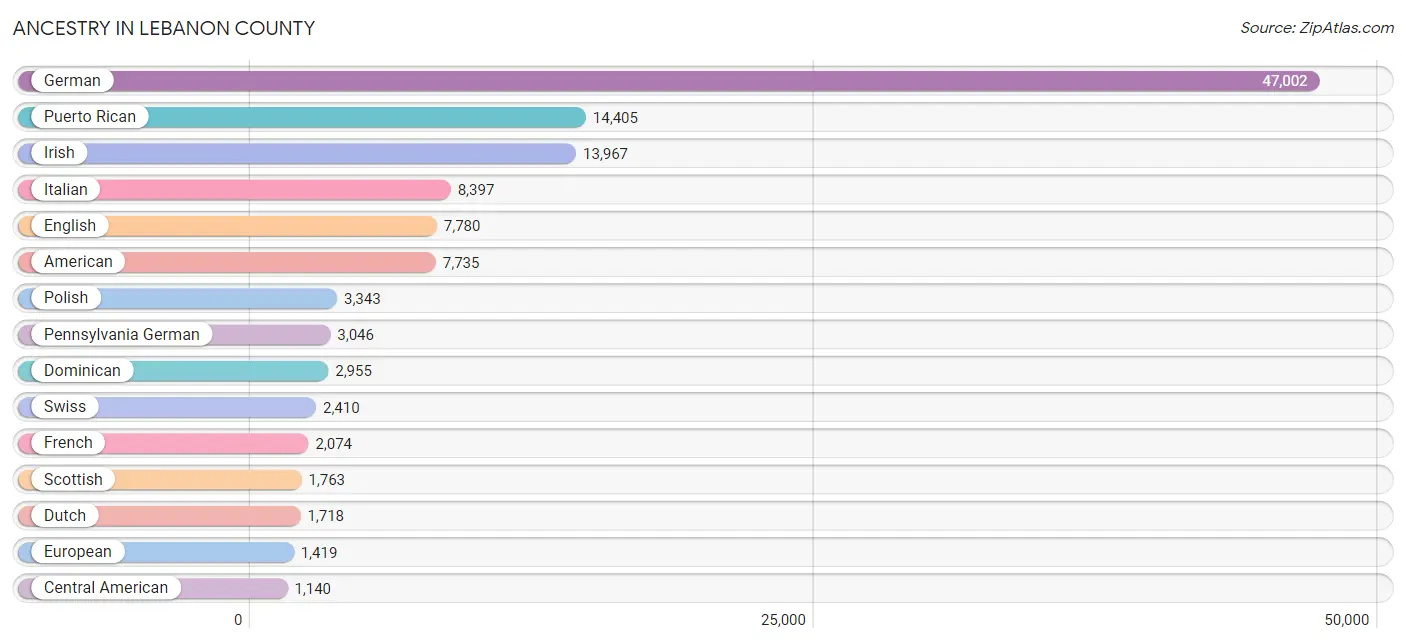
Ancestry in Lebanon County
The most populous ancestries reported in Lebanon County are German (47,002 | 32.8%), Puerto Rican (14,405 | 10.1%), Irish (13,967 | 9.8%), Italian (8,397 | 5.9%), and English (7,780 | 5.4%), together accounting for 63.9% of all Lebanon County residents.
| Ancestry | # Population | % Population |
| Afghan | 42 | 0.0% |
| African | 283 | 0.2% |
| Albanian | 12 | 0.0% |
| Alsatian | 4 | 0.0% |
| American | 7,735 | 5.4% |
| Arab | 366 | 0.3% |
| Argentinean | 26 | 0.0% |
| Armenian | 25 | 0.0% |
| Australian | 21 | 0.0% |
| Austrian | 296 | 0.2% |
| Basque | 269 | 0.2% |
| Belgian | 45 | 0.0% |
| Belizean | 19 | 0.0% |
| Bhutanese | 31 | 0.0% |
| Blackfeet | 30 | 0.0% |
| Brazilian | 145 | 0.1% |
| British | 396 | 0.3% |
| Bulgarian | 19 | 0.0% |
| Burmese | 214 | 0.2% |
| Canadian | 209 | 0.2% |
| Carpatho Rusyn | 26 | 0.0% |
| Central American | 1,140 | 0.8% |
| Central American Indian | 149 | 0.1% |
| Cherokee | 215 | 0.2% |
| Choctaw | 4 | 0.0% |
| Colombian | 115 | 0.1% |
| Costa Rican | 11 | 0.0% |
| Croatian | 139 | 0.1% |
| Cuban | 125 | 0.1% |
| Cypriot | 76 | 0.1% |
| Czech | 337 | 0.2% |
| Czechoslovakian | 70 | 0.1% |
| Danish | 112 | 0.1% |
| Dominican | 2,955 | 2.1% |
| Dutch | 1,718 | 1.2% |
| Eastern European | 272 | 0.2% |
| Ecuadorian | 150 | 0.1% |
| Egyptian | 28 | 0.0% |
| English | 7,780 | 5.4% |
| European | 1,419 | 1.0% |
| Finnish | 59 | 0.0% |
| French | 2,074 | 1.5% |
| French American Indian | 14 | 0.0% |
| French Canadian | 190 | 0.1% |
| German | 47,002 | 32.8% |
| Ghanaian | 11 | 0.0% |
| Greek | 495 | 0.4% |
| Guamanian / Chamorro | 5 | 0.0% |
| Guatemalan | 300 | 0.2% |
| Guyanese | 45 | 0.0% |
| Haitian | 200 | 0.1% |
| Honduran | 106 | 0.1% |
| Hungarian | 816 | 0.6% |
| Indian (Asian) | 582 | 0.4% |
| Indonesian | 18 | 0.0% |
| Iranian | 28 | 0.0% |
| Irish | 13,967 | 9.8% |
| Iroquois | 7 | 0.0% |
| Israeli | 24 | 0.0% |
| Italian | 8,397 | 5.9% |
| Jamaican | 156 | 0.1% |
| Japanese | 218 | 0.2% |
| Kenyan | 8 | 0.0% |
| Korean | 344 | 0.2% |
| Laotian | 43 | 0.0% |
| Latvian | 20 | 0.0% |
| Lebanese | 73 | 0.1% |
| Lithuanian | 449 | 0.3% |
| Lumbee | 25 | 0.0% |
| Macedonian | 71 | 0.1% |
| Maltese | 13 | 0.0% |
| Mexican | 1,070 | 0.7% |
| Mexican American Indian | 60 | 0.0% |
| Moroccan | 182 | 0.1% |
| Native Hawaiian | 12 | 0.0% |
| Nicaraguan | 9 | 0.0% |
| Nigerian | 159 | 0.1% |
| Northern European | 10 | 0.0% |
| Norwegian | 387 | 0.3% |
| Pakistani | 72 | 0.1% |
| Palestinian | 50 | 0.0% |
| Panamanian | 75 | 0.1% |
| Pennsylvania German | 3,046 | 2.1% |
| Peruvian | 81 | 0.1% |
| Polish | 3,343 | 2.3% |
| Portuguese | 45 | 0.0% |
| Puerto Rican | 14,405 | 10.1% |
| Romanian | 107 | 0.1% |
| Russian | 671 | 0.5% |
| Salvadoran | 639 | 0.4% |
| Scandinavian | 119 | 0.1% |
| Scotch-Irish | 968 | 0.7% |
| Scottish | 1,763 | 1.2% |
| Serbian | 76 | 0.1% |
| Sioux | 38 | 0.0% |
| Slavic | 151 | 0.1% |
| Slovak | 881 | 0.6% |
| Slovene | 80 | 0.1% |
| South American | 372 | 0.3% |
| Spaniard | 15 | 0.0% |
| Spanish | 11 | 0.0% |
| Sri Lankan | 328 | 0.2% |
| Subsaharan African | 502 | 0.4% |
| Swedish | 1,138 | 0.8% |
| Swiss | 2,410 | 1.7% |
| Thai | 528 | 0.4% |
| Tlingit-Haida | 2 | 0.0% |
| Ukrainian | 710 | 0.5% |
| Welsh | 979 | 0.7% |
| West Indian | 21 | 0.0% |
| Yugoslavian | 174 | 0.1% | View All 111 Rows |
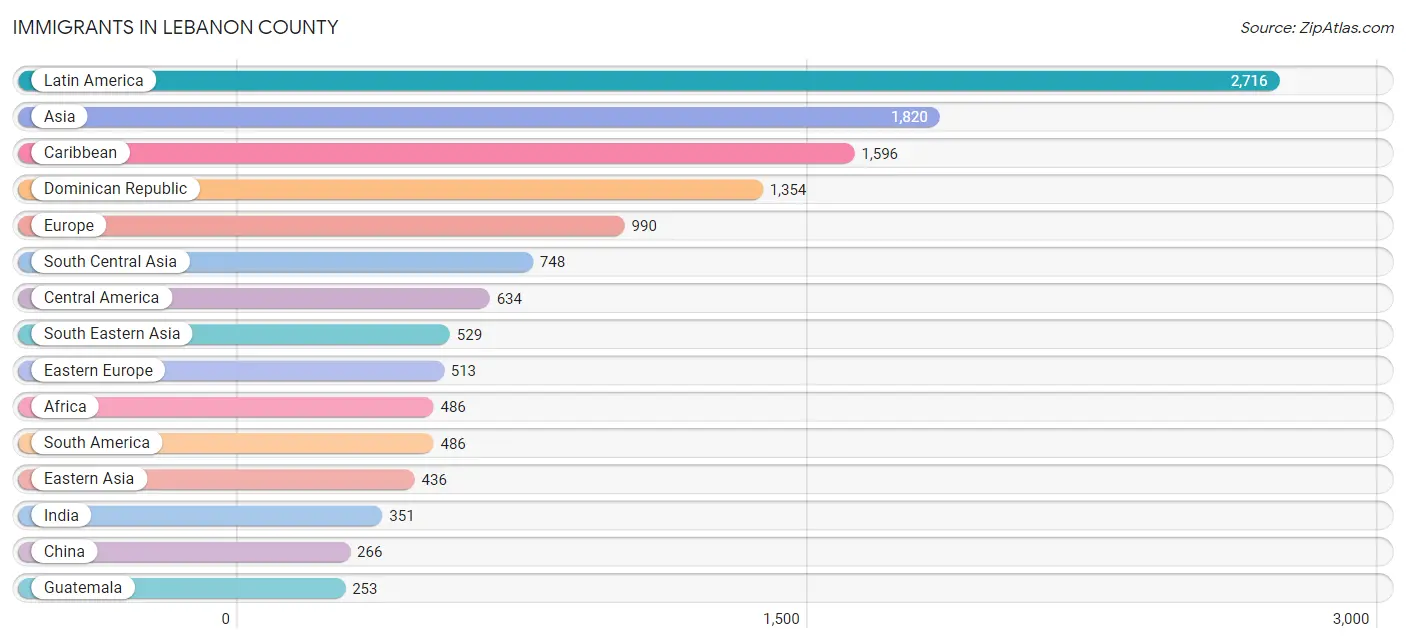
Immigrants in Lebanon County
The most numerous immigrant groups reported in Lebanon County came from Latin America (2,716 | 1.9%), Asia (1,820 | 1.3%), Caribbean (1,596 | 1.1%), Dominican Republic (1,354 | 0.9%), and Europe (990 | 0.7%), together accounting for 5.9% of all Lebanon County residents.
| Immigration Origin | # Population | % Population |
| Afghanistan | 29 | 0.0% |
| Africa | 486 | 0.3% |
| Argentina | 26 | 0.0% |
| Asia | 1,820 | 1.3% |
| Australia | 16 | 0.0% |
| Austria | 15 | 0.0% |
| Bangladesh | 75 | 0.1% |
| Belgium | 7 | 0.0% |
| Belize | 19 | 0.0% |
| Bosnia and Herzegovina | 16 | 0.0% |
| Brazil | 51 | 0.0% |
| Bulgaria | 19 | 0.0% |
| Cambodia | 136 | 0.1% |
| Canada | 74 | 0.1% |
| Caribbean | 1,596 | 1.1% |
| Central America | 634 | 0.4% |
| China | 266 | 0.2% |
| Colombia | 131 | 0.1% |
| Costa Rica | 11 | 0.0% |
| Croatia | 8 | 0.0% |
| Cuba | 31 | 0.0% |
| Denmark | 8 | 0.0% |
| Dominican Republic | 1,354 | 0.9% |
| Eastern Africa | 135 | 0.1% |
| Eastern Asia | 436 | 0.3% |
| Eastern Europe | 513 | 0.4% |
| Ecuador | 150 | 0.1% |
| Egypt | 25 | 0.0% |
| El Salvador | 32 | 0.0% |
| England | 51 | 0.0% |
| Europe | 990 | 0.7% |
| France | 90 | 0.1% |
| Germany | 88 | 0.1% |
| Ghana | 2 | 0.0% |
| Greece | 23 | 0.0% |
| Guatemala | 253 | 0.2% |
| Guyana | 64 | 0.0% |
| Haiti | 150 | 0.1% |
| Honduras | 37 | 0.0% |
| Hungary | 37 | 0.0% |
| India | 351 | 0.3% |
| Indonesia | 43 | 0.0% |
| Ireland | 8 | 0.0% |
| Italy | 148 | 0.1% |
| Jamaica | 61 | 0.0% |
| Japan | 5 | 0.0% |
| Kazakhstan | 8 | 0.0% |
| Kenya | 82 | 0.1% |
| Korea | 165 | 0.1% |
| Latin America | 2,716 | 1.9% |
| Latvia | 8 | 0.0% |
| Lebanon | 17 | 0.0% |
| Mexico | 151 | 0.1% |
| Morocco | 89 | 0.1% |
| Nepal | 31 | 0.0% |
| Netherlands | 25 | 0.0% |
| Nicaragua | 9 | 0.0% |
| Nigeria | 235 | 0.2% |
| North Macedonia | 44 | 0.0% |
| Northern Africa | 114 | 0.1% |
| Northern Europe | 81 | 0.1% |
| Oceania | 16 | 0.0% |
| Pakistan | 110 | 0.1% |
| Panama | 122 | 0.1% |
| Peru | 64 | 0.0% |
| Philippines | 165 | 0.1% |
| Poland | 65 | 0.1% |
| Romania | 34 | 0.0% |
| Russia | 125 | 0.1% |
| South America | 486 | 0.3% |
| South Central Asia | 748 | 0.5% |
| South Eastern Asia | 529 | 0.4% |
| Southern Europe | 171 | 0.1% |
| Thailand | 32 | 0.0% |
| Turkey | 14 | 0.0% |
| Ukraine | 157 | 0.1% |
| Uzbekistan | 5 | 0.0% |
| Vietnam | 135 | 0.1% |
| Western Africa | 237 | 0.2% |
| Western Asia | 107 | 0.1% |
| Western Europe | 225 | 0.2% |
| Zimbabwe | 5 | 0.0% | View All 82 Rows |
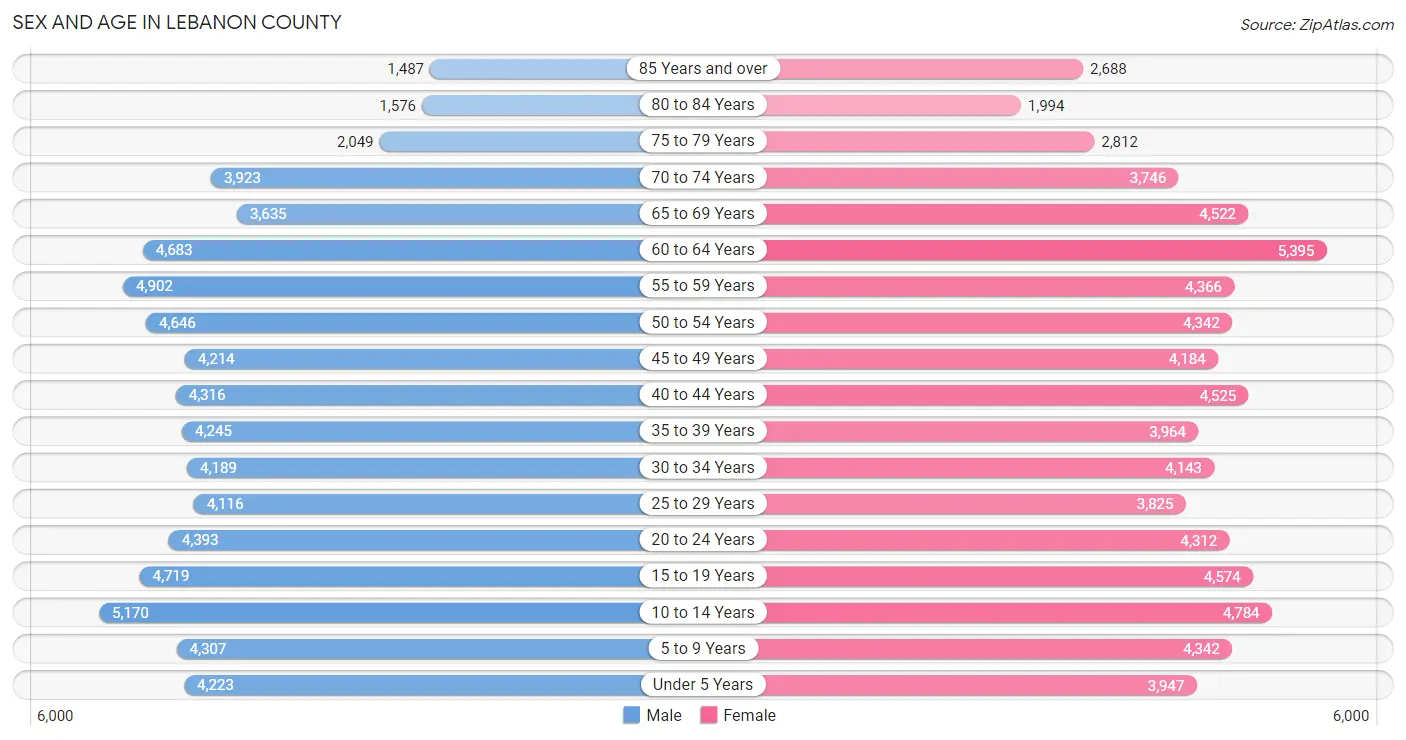
Sex and Age in Lebanon County
Sex and Age in Lebanon County
The most populous age groups in Lebanon County are 10 to 14 Years (5,170 | 7.3%) for men and 60 to 64 Years (5,395 | 7.4%) for women.
| Age Bracket | Male | Female |
| Under 5 Years | 4,223 (6.0%) | 3,947 (5.4%) |
| 5 to 9 Years | 4,307 (6.1%) | 4,342 (6.0%) |
| 10 to 14 Years | 5,170 (7.3%) | 4,784 (6.6%) |
| 15 to 19 Years | 4,719 (6.7%) | 4,574 (6.3%) |
| 20 to 24 Years | 4,393 (6.2%) | 4,312 (5.9%) |
| 25 to 29 Years | 4,116 (5.8%) | 3,825 (5.3%) |
| 30 to 34 Years | 4,189 (5.9%) | 4,143 (5.7%) |
| 35 to 39 Years | 4,245 (6.0%) | 3,964 (5.5%) |
| 40 to 44 Years | 4,316 (6.1%) | 4,525 (6.2%) |
| 45 to 49 Years | 4,214 (5.9%) | 4,184 (5.8%) |
| 50 to 54 Years | 4,646 (6.6%) | 4,342 (6.0%) |
| 55 to 59 Years | 4,902 (6.9%) | 4,366 (6.0%) |
| 60 to 64 Years | 4,683 (6.6%) | 5,395 (7.4%) |
| 65 to 69 Years | 3,635 (5.1%) | 4,522 (6.2%) |
| 70 to 74 Years | 3,923 (5.5%) | 3,746 (5.2%) |
| 75 to 79 Years | 2,049 (2.9%) | 2,812 (3.9%) |
| 80 to 84 Years | 1,576 (2.2%) | 1,994 (2.8%) |
| 85 Years and over | 1,487 (2.1%) | 2,688 (3.7%) |
| Total | 70,793 (100.0%) | 72,465 (100.0%) |
Families and Households in Lebanon County
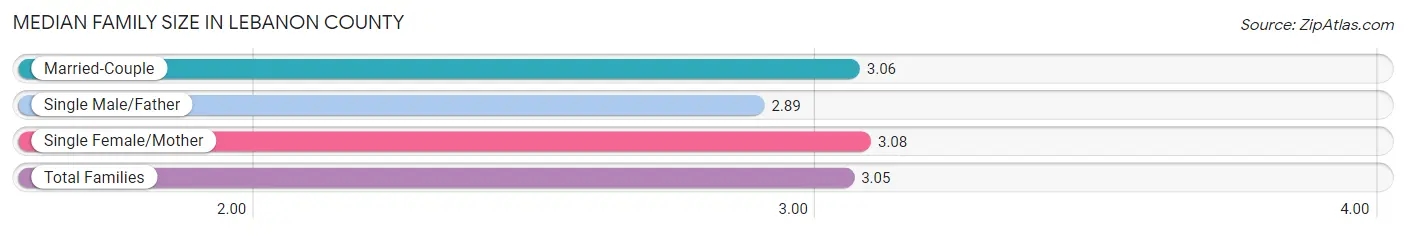
Median Family Size in Lebanon County
The median family size in Lebanon County is 3.05 persons per family, with single female/mother families (6,002 | 15.9%) accounting for the largest median family size of 3.08 persons per family. On the other hand, single male/father families (2,562 | 6.8%) represent the smallest median family size with 2.89 persons per family.
| Family Type | # Families | Family Size |
| Married-Couple | 29,140 (77.3%) | 3.06 |
| Single Male/Father | 2,562 (6.8%) | 2.89 |
| Single Female/Mother | 6,002 (15.9%) | 3.08 |
| Total Families | 37,704 (100.0%) | 3.05 |
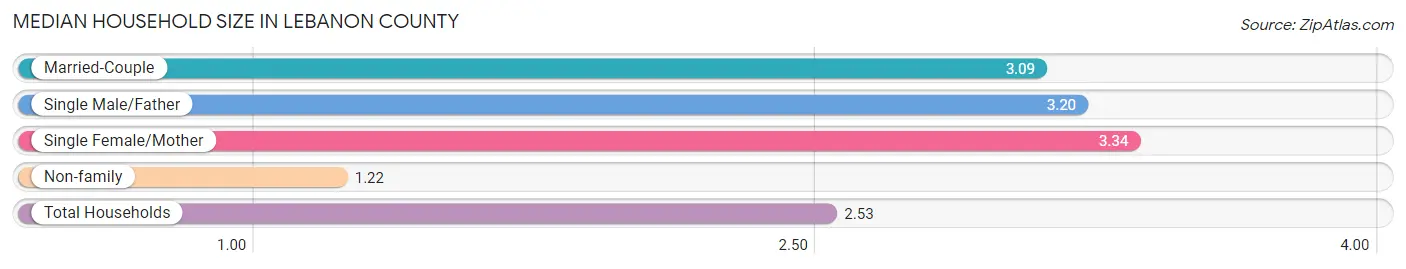
Median Household Size in Lebanon County
The median household size in Lebanon County is 2.53 persons per household, with single female/mother households (6,002 | 10.9%) accounting for the largest median household size of 3.34 persons per household. non-family households (17,532 | 31.7%) represent the smallest median household size with 1.22 persons per household.
| Household Type | # Households | Household Size |
| Married-Couple | 29,140 (52.8%) | 3.09 |
| Single Male/Father | 2,562 (4.6%) | 3.20 |
| Single Female/Mother | 6,002 (10.9%) | 3.34 |
| Non-family | 17,532 (31.7%) | 1.22 |
| Total Households | 55,236 (100.0%) | 2.53 |
Household Size by Marriage Status in Lebanon County
Out of a total of 55,236 households in Lebanon County, 37,704 (68.3%) are family households, while 17,532 (31.7%) are nonfamily households. The most numerous type of family households are 2-person households, comprising 17,997, and the most common type of nonfamily households are 1-person households, comprising 14,364.
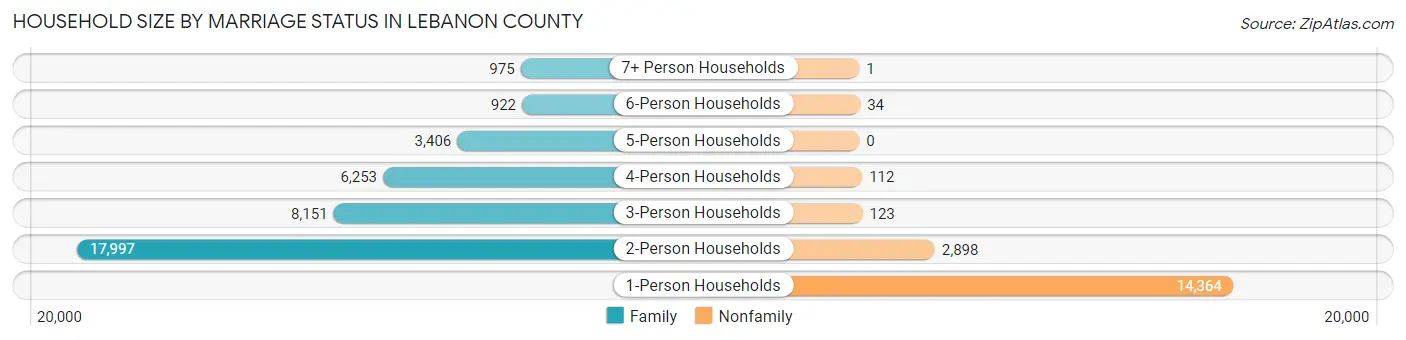
| Household Size | Family Households | Nonfamily Households |
| 1-Person Households | - | 14,364 (26.0%) |
| 2-Person Households | 17,997 (32.6%) | 2,898 (5.2%) |
| 3-Person Households | 8,151 (14.8%) | 123 (0.2%) |
| 4-Person Households | 6,253 (11.3%) | 112 (0.2%) |
| 5-Person Households | 3,406 (6.2%) | 0 (0.0%) |
| 6-Person Households | 922 (1.7%) | 34 (0.1%) |
| 7+ Person Households | 975 (1.8%) | 1 (0.0%) |
| Total | 37,704 (68.3%) | 17,532 (31.7%) |
Female Fertility in Lebanon County
Fertility by Age in Lebanon County
Average fertility rate in Lebanon County is 48.0 births per 1,000 women. Women in the age bracket of 20 to 34 years have the highest fertility rate with 91.0 births per 1,000 women. Women in the age bracket of 20 to 34 years acount for 77.1% of all women with births.
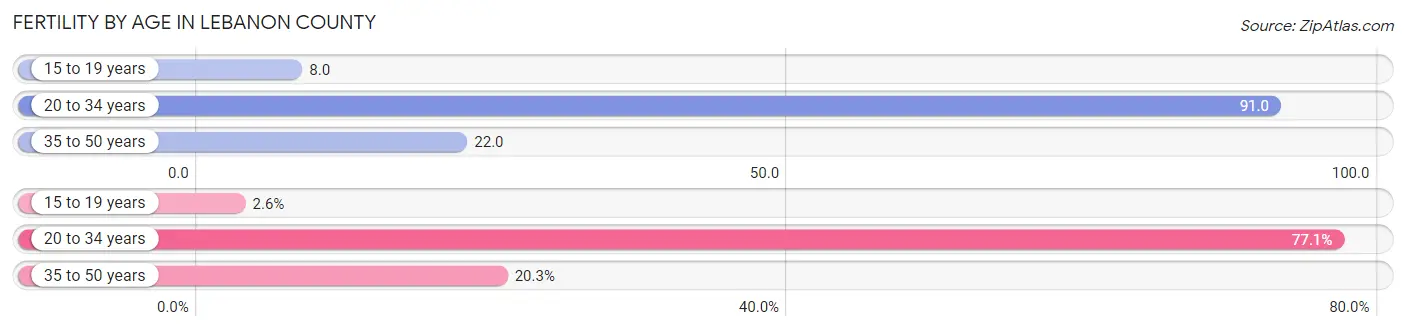
| Age Bracket | Women with Births | Births / 1,000 Women |
| 15 to 19 years | 37 (2.5%) | 8.0 |
| 20 to 34 years | 1,118 (77.1%) | 91.0 |
| 35 to 50 years | 295 (20.3%) | 22.0 |
| Total | 1,450 (100.0%) | 48.0 |
Fertility by Age by Marriage Status in Lebanon County
85.1% of women with births (1,450) in Lebanon County are married. The highest percentage of unmarried women with births falls into 15 to 19 years age bracket with 48.6% of them unmarried at the time of birth, while the lowest percentage of unmarried women with births belong to 35 to 50 years age bracket with 4.7% of them unmarried.
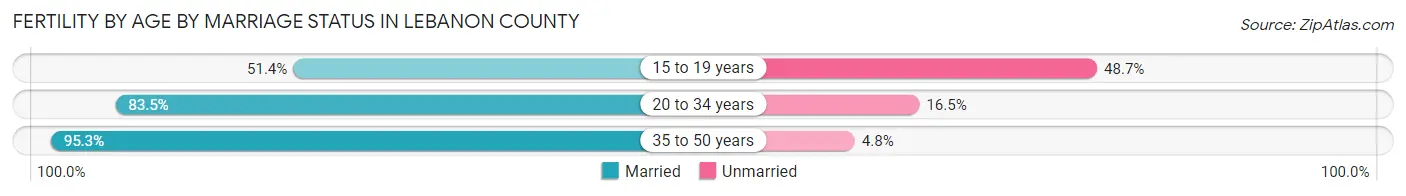
| Age Bracket | Married | Unmarried |
| 15 to 19 years | 19 (51.3%) | 18 (48.6%) |
| 20 to 34 years | 934 (83.5%) | 184 (16.5%) |
| 35 to 50 years | 281 (95.3%) | 14 (4.8%) |
| Total | 1,234 (85.1%) | 216 (14.9%) |
Fertility by Education in Lebanon County
Average fertility rate in Lebanon County is 48.0 births per 1,000 women. Women with the education attainment of graduate degree have the highest fertility rate of 85.0 births per 1,000 women, while women with the education attainment of less than high school have the lowest fertility at 26.0 births per 1,000 women. Women with the education attainment of high school diploma represent 26.9% of all women with births.
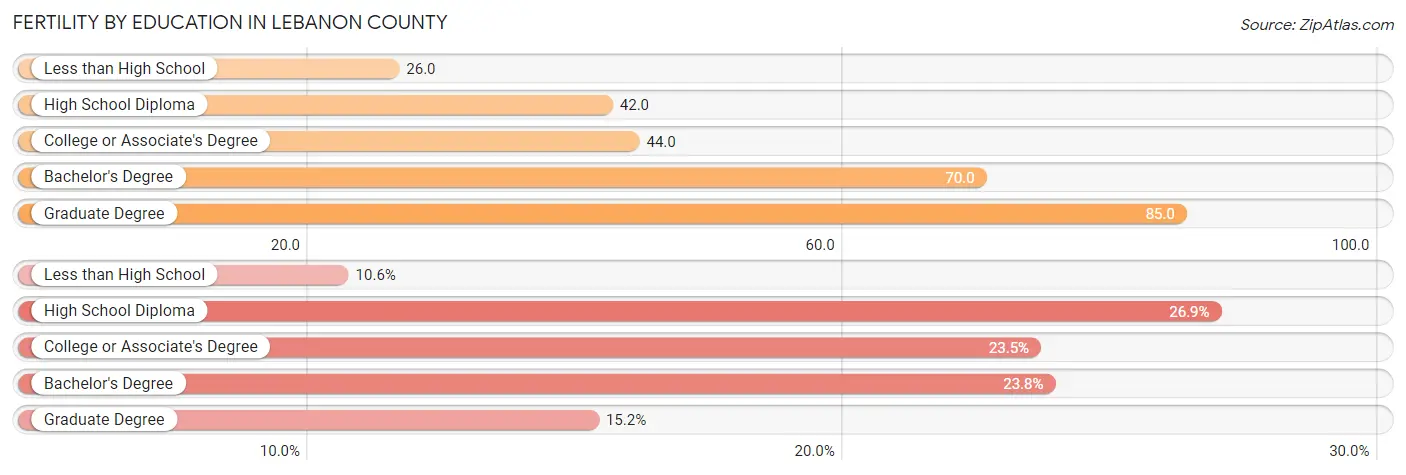
| Educational Attainment | Women with Births | Births / 1,000 Women |
| Less than High School | 153 (10.5%) | 26.0 |
| High School Diploma | 390 (26.9%) | 42.0 |
| College or Associate's Degree | 341 (23.5%) | 44.0 |
| Bachelor's Degree | 345 (23.8%) | 70.0 |
| Graduate Degree | 221 (15.2%) | 85.0 |
| Total | 1,450 (100.0%) | 48.0 |
Fertility by Education by Marriage Status in Lebanon County
14.9% of women with births in Lebanon County are unmarried. Women with the educational attainment of graduate degree are most likely to be married with 97.3% of them married at childbirth, while women with the educational attainment of high school diploma are least likely to be married with 34.9% of them unmarried at childbirth.
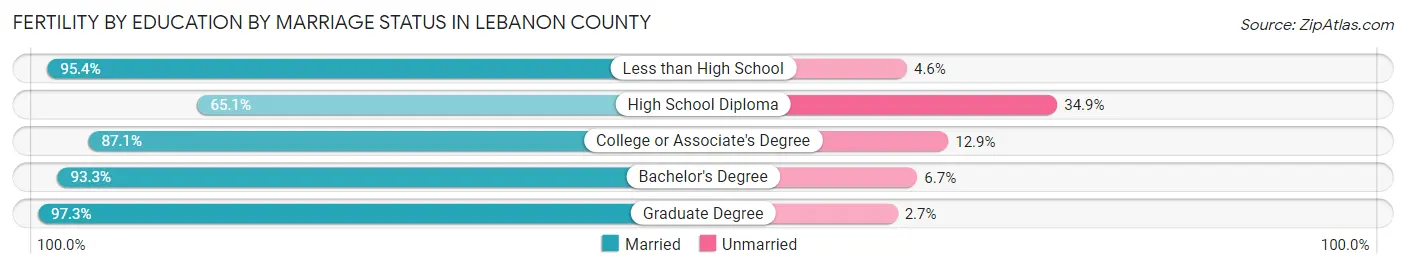
| Educational Attainment | Married | Unmarried |
| Less than High School | 146 (95.4%) | 7 (4.6%) |
| High School Diploma | 254 (65.1%) | 136 (34.9%) |
| College or Associate's Degree | 297 (87.1%) | 44 (12.9%) |
| Bachelor's Degree | 322 (93.3%) | 23 (6.7%) |
| Graduate Degree | 215 (97.3%) | 6 (2.7%) |
| Total | 1,234 (85.1%) | 216 (14.9%) |
Employment Characteristics in Lebanon County
Employment by Class of Employer in Lebanon County
Among the 68,005 employed individuals in Lebanon County, private company employees (46,431 | 68.3%), not-for-profit organizations (7,594 | 11.2%), and self-employed (not incorporated) (3,820 | 5.6%) make up the most common classes of employment.
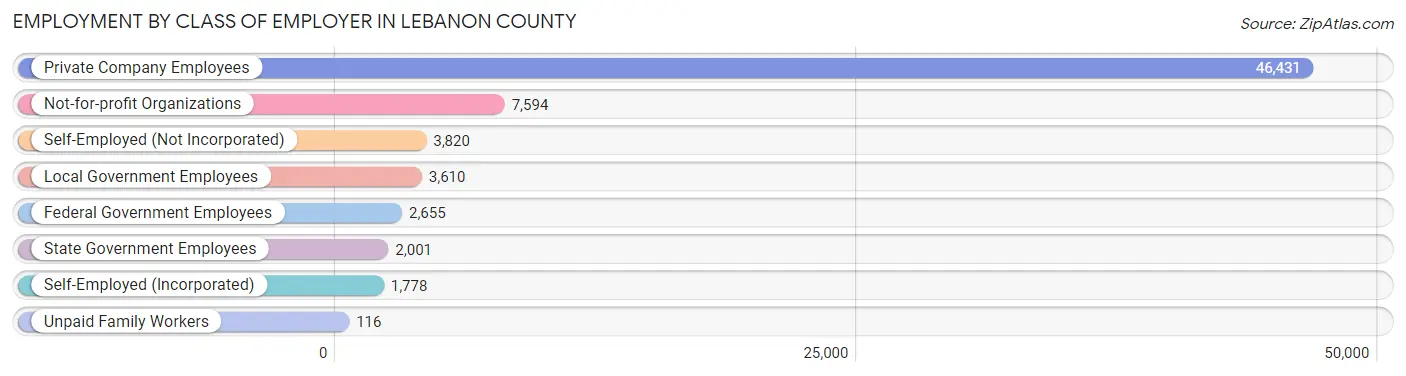
| Employer Class | # Employees | % Employees |
| Private Company Employees | 46,431 | 68.3% |
| Self-Employed (Incorporated) | 1,778 | 2.6% |
| Self-Employed (Not Incorporated) | 3,820 | 5.6% |
| Not-for-profit Organizations | 7,594 | 11.2% |
| Local Government Employees | 3,610 | 5.3% |
| State Government Employees | 2,001 | 2.9% |
| Federal Government Employees | 2,655 | 3.9% |
| Unpaid Family Workers | 116 | 0.2% |
| Total | 68,005 | 100.0% |
Employment Status by Age in Lebanon County
According to the labor force statistics for Lebanon County, out of the total population over 16 years of age (114,296), 63.0% or 72,006 individuals are in the labor force, with 4.4% or 3,168 of them unemployed. The age group with the highest labor force participation rate is 35 to 44 years, with 86.6% or 14,765 individuals in the labor force. Within the labor force, the 16 to 19 years age range has the highest percentage of unemployed individuals, with 13.7% or 532 of them being unemployed.
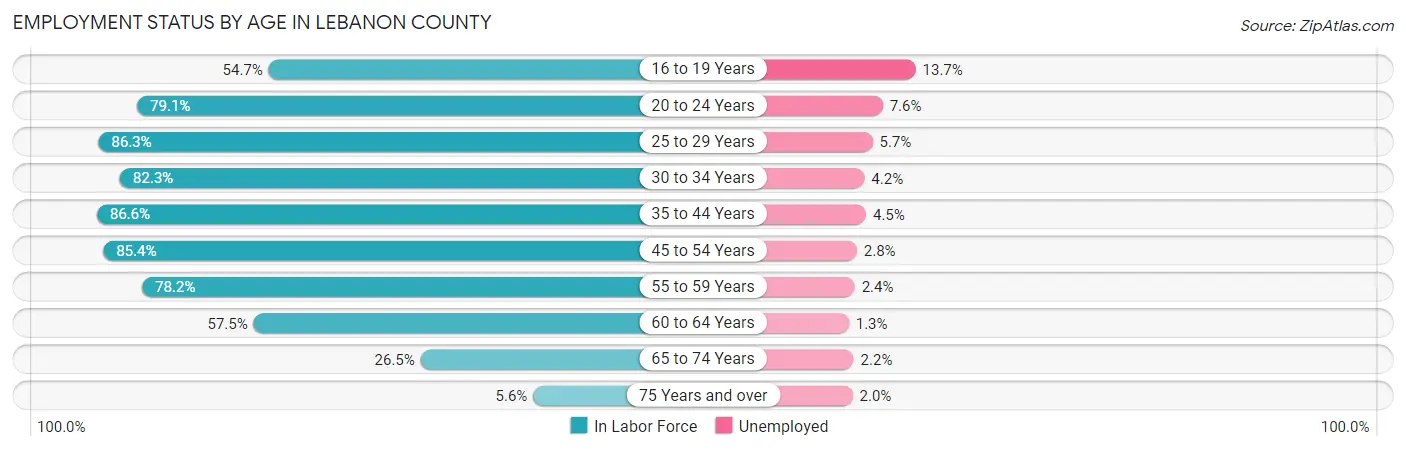
| Age Bracket | In Labor Force | Unemployed |
| 16 to 19 Years | 3,886 (54.7%) | 532 (13.7%) |
| 20 to 24 Years | 6,886 (79.1%) | 523 (7.6%) |
| 25 to 29 Years | 6,853 (86.3%) | 391 (5.7%) |
| 30 to 34 Years | 6,857 (82.3%) | 288 (4.2%) |
| 35 to 44 Years | 14,765 (86.6%) | 664 (4.5%) |
| 45 to 54 Years | 14,848 (85.4%) | 416 (2.8%) |
| 55 to 59 Years | 7,248 (78.2%) | 174 (2.4%) |
| 60 to 64 Years | 5,795 (57.5%) | 75 (1.3%) |
| 65 to 74 Years | 4,194 (26.5%) | 92 (2.2%) |
| 75 Years and over | 706 (5.6%) | 14 (2.0%) |
| Total | 72,006 (63.0%) | 3,168 (4.4%) |
Employment Status by Educational Attainment in Lebanon County
According to labor force statistics for Lebanon County, 80.5% of individuals (56,394) out of the total population between 25 and 64 years of age (70,055) are in the labor force, with 3.6% or 2,030 of them being unemployed. The group with the highest labor force participation rate are those with the educational attainment of bachelor's degree or higher, with 89.7% or 15,437 individuals in the labor force. Within the labor force, individuals with less than high school education have the highest percentage of unemployment, with 5.7% or 267 of them being unemployed.
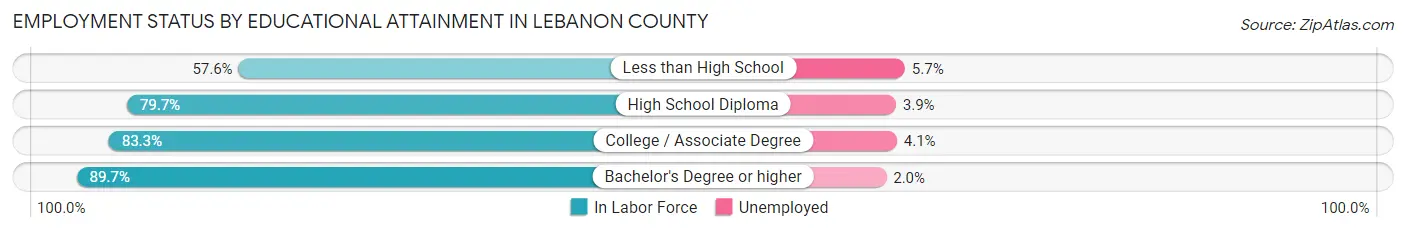
| Educational Attainment | In Labor Force | Unemployed |
| Less than High School | 4,685 (57.6%) | 464 (5.7%) |
| High School Diploma | 22,090 (79.7%) | 1,081 (3.9%) |
| College / Associate Degree | 14,156 (83.3%) | 697 (4.1%) |
| Bachelor's Degree or higher | 15,437 (89.7%) | 344 (2.0%) |
| Total | 56,394 (80.5%) | 2,522 (3.6%) |
Employment Occupations by Sex in Lebanon County
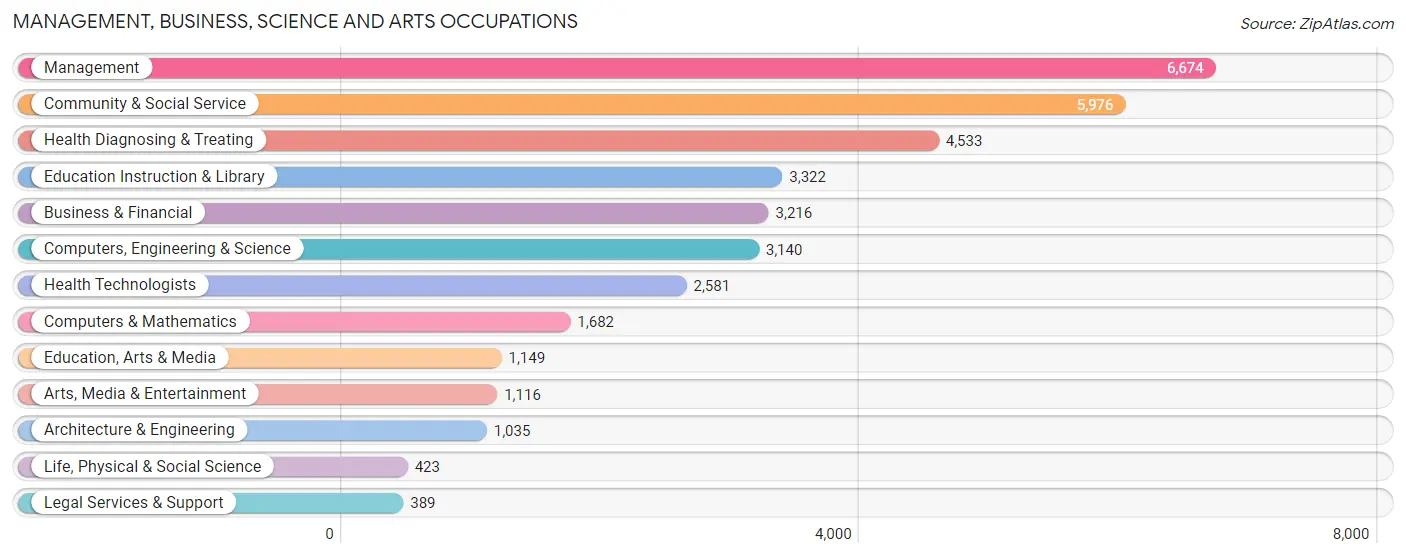
Management, Business, Science and Arts Occupations
The most common Management, Business, Science and Arts occupations in Lebanon County are Management (6,674 | 9.7%), Community & Social Service (5,976 | 8.7%), Health Diagnosing & Treating (4,533 | 6.6%), Education Instruction & Library (3,322 | 4.9%), and Business & Financial (3,216 | 4.7%).
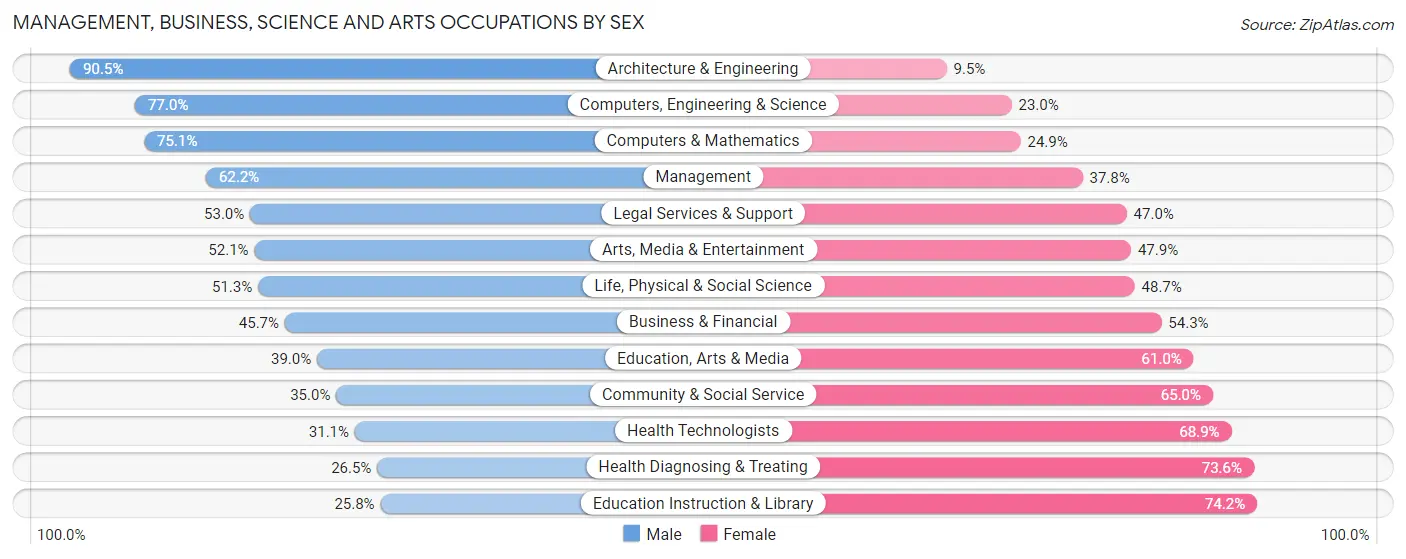
Management, Business, Science and Arts Occupations by Sex
Within the Management, Business, Science and Arts occupations in Lebanon County, the most male-oriented occupations are Architecture & Engineering (90.5%), Computers, Engineering & Science (77.0%), and Computers & Mathematics (75.1%), while the most female-oriented occupations are Education Instruction & Library (74.2%), Health Diagnosing & Treating (73.6%), and Health Technologists (68.9%).
| Occupation | Male | Female |
| Management | 4,149 (62.2%) | 2,525 (37.8%) |
| Business & Financial | 1,470 (45.7%) | 1,746 (54.3%) |
| Computers, Engineering & Science | 2,417 (77.0%) | 723 (23.0%) |
| Computers & Mathematics | 1,263 (75.1%) | 419 (24.9%) |
| Architecture & Engineering | 937 (90.5%) | 98 (9.5%) |
| Life, Physical & Social Science | 217 (51.3%) | 206 (48.7%) |
| Community & Social Service | 2,091 (35.0%) | 3,885 (65.0%) |
| Education, Arts & Media | 448 (39.0%) | 701 (61.0%) |
| Legal Services & Support | 206 (53.0%) | 183 (47.0%) |
| Education Instruction & Library | 856 (25.8%) | 2,466 (74.2%) |
| Arts, Media & Entertainment | 581 (52.1%) | 535 (47.9%) |
| Health Diagnosing & Treating | 1,199 (26.5%) | 3,334 (73.6%) |
| Health Technologists | 803 (31.1%) | 1,778 (68.9%) |
| Total (Category) | 11,326 (48.1%) | 12,213 (51.9%) |
| Total (Overall) | 36,487 (53.2%) | 32,028 (46.8%) |
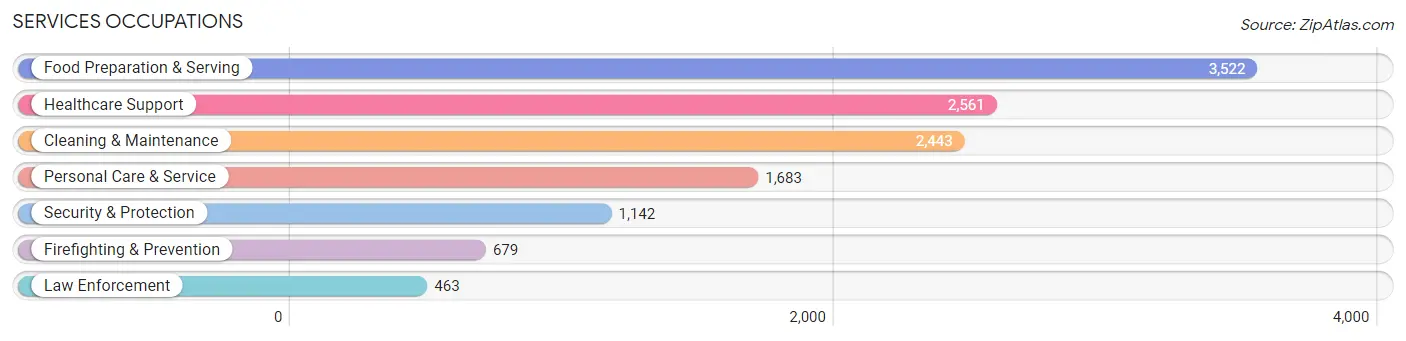
Services Occupations
The most common Services occupations in Lebanon County are Food Preparation & Serving (3,522 | 5.1%), Healthcare Support (2,561 | 3.7%), Cleaning & Maintenance (2,443 | 3.6%), Personal Care & Service (1,683 | 2.5%), and Security & Protection (1,142 | 1.7%).
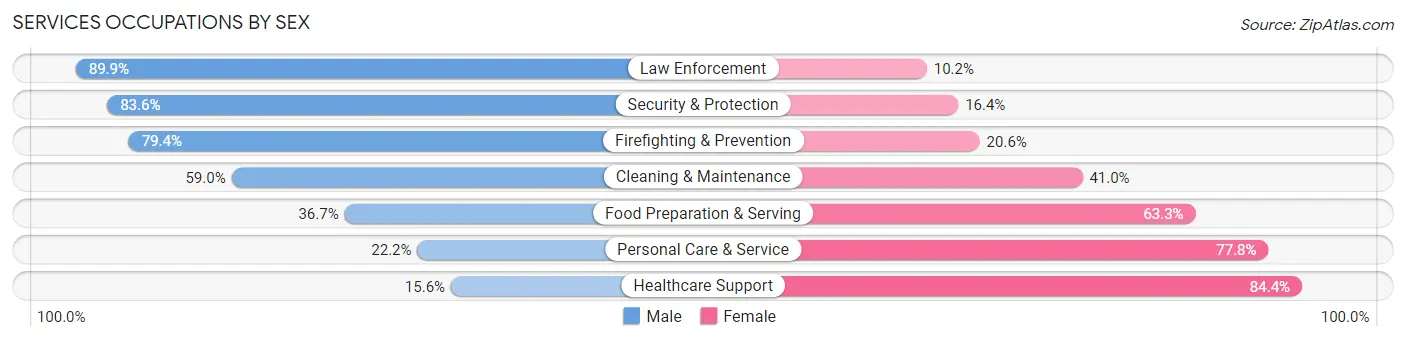
Services Occupations by Sex
Within the Services occupations in Lebanon County, the most male-oriented occupations are Law Enforcement (89.8%), Security & Protection (83.6%), and Firefighting & Prevention (79.4%), while the most female-oriented occupations are Healthcare Support (84.4%), Personal Care & Service (77.8%), and Food Preparation & Serving (63.3%).
| Occupation | Male | Female |
| Healthcare Support | 399 (15.6%) | 2,162 (84.4%) |
| Security & Protection | 955 (83.6%) | 187 (16.4%) |
| Firefighting & Prevention | 539 (79.4%) | 140 (20.6%) |
| Law Enforcement | 416 (89.8%) | 47 (10.2%) |
| Food Preparation & Serving | 1,291 (36.7%) | 2,231 (63.3%) |
| Cleaning & Maintenance | 1,442 (59.0%) | 1,001 (41.0%) |
| Personal Care & Service | 374 (22.2%) | 1,309 (77.8%) |
| Total (Category) | 4,461 (39.3%) | 6,890 (60.7%) |
| Total (Overall) | 36,487 (53.2%) | 32,028 (46.8%) |
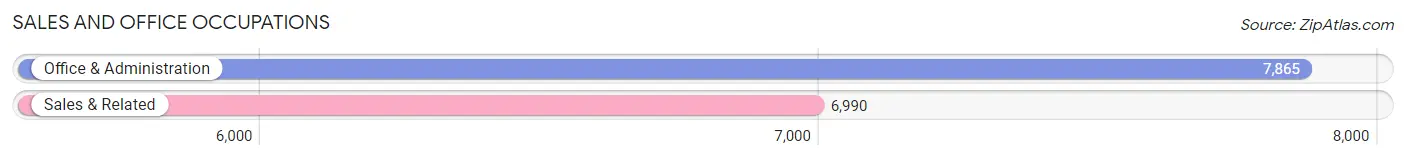
Sales and Office Occupations
The most common Sales and Office occupations in Lebanon County are Office & Administration (7,865 | 11.5%), and Sales & Related (6,990 | 10.2%).
Sales and Office Occupations by Sex
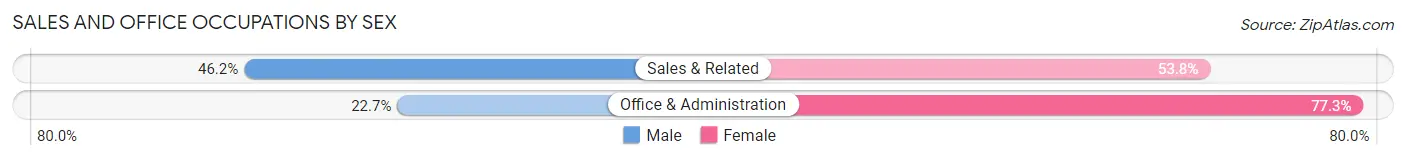
| Occupation | Male | Female |
| Sales & Related | 3,232 (46.2%) | 3,758 (53.8%) |
| Office & Administration | 1,783 (22.7%) | 6,082 (77.3%) |
| Total (Category) | 5,015 (33.8%) | 9,840 (66.2%) |
| Total (Overall) | 36,487 (53.2%) | 32,028 (46.8%) |
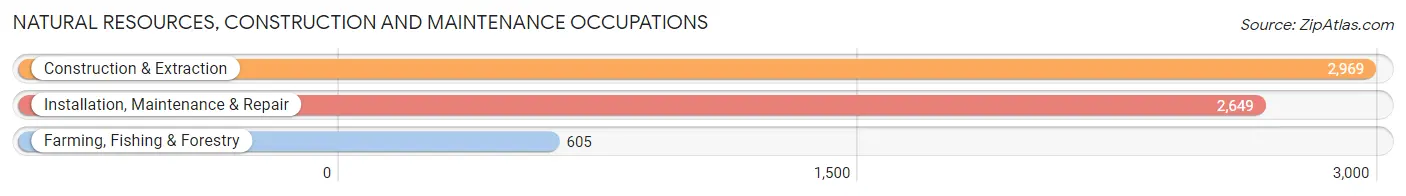
Natural Resources, Construction and Maintenance Occupations
The most common Natural Resources, Construction and Maintenance occupations in Lebanon County are Construction & Extraction (2,969 | 4.3%), Installation, Maintenance & Repair (2,649 | 3.9%), and Farming, Fishing & Forestry (605 | 0.9%).
Natural Resources, Construction and Maintenance Occupations by Sex
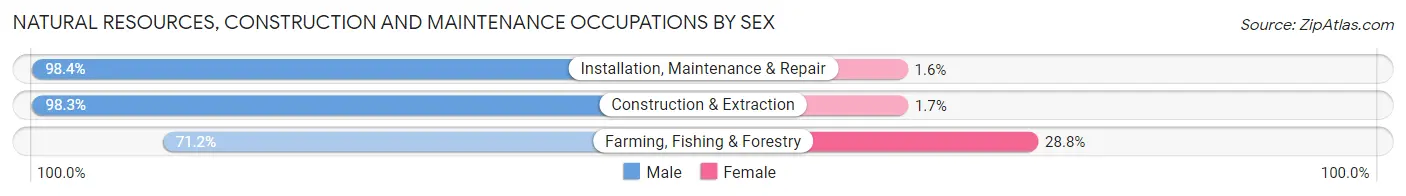
| Occupation | Male | Female |
| Farming, Fishing & Forestry | 431 (71.2%) | 174 (28.8%) |
| Construction & Extraction | 2,919 (98.3%) | 50 (1.7%) |
| Installation, Maintenance & Repair | 2,607 (98.4%) | 42 (1.6%) |
| Total (Category) | 5,957 (95.7%) | 266 (4.3%) |
| Total (Overall) | 36,487 (53.2%) | 32,028 (46.8%) |
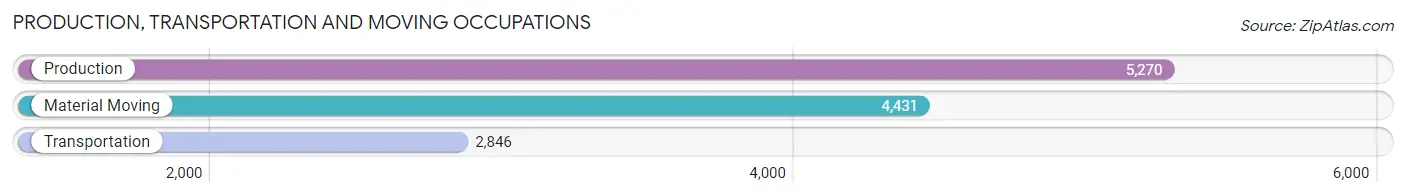
Production, Transportation and Moving Occupations
The most common Production, Transportation and Moving occupations in Lebanon County are Production (5,270 | 7.7%), Material Moving (4,431 | 6.5%), and Transportation (2,846 | 4.2%).
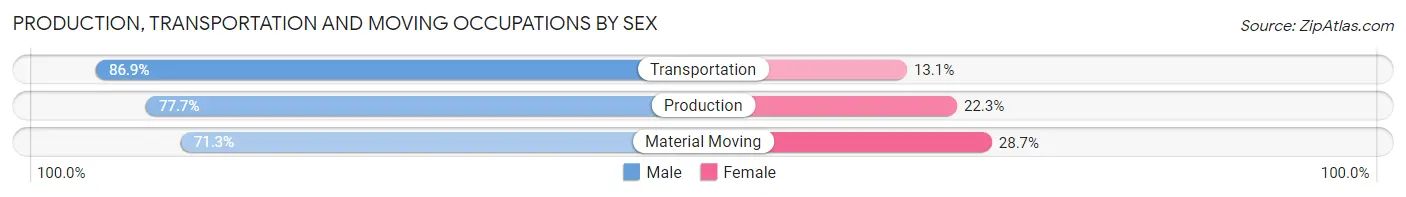
Production, Transportation and Moving Occupations by Sex
| Occupation | Male | Female |
| Production | 4,095 (77.7%) | 1,175 (22.3%) |
| Transportation | 2,473 (86.9%) | 373 (13.1%) |
| Material Moving | 3,160 (71.3%) | 1,271 (28.7%) |
| Total (Category) | 9,728 (77.5%) | 2,819 (22.5%) |
| Total (Overall) | 36,487 (53.2%) | 32,028 (46.8%) |
Employment Industries by Sex in Lebanon County
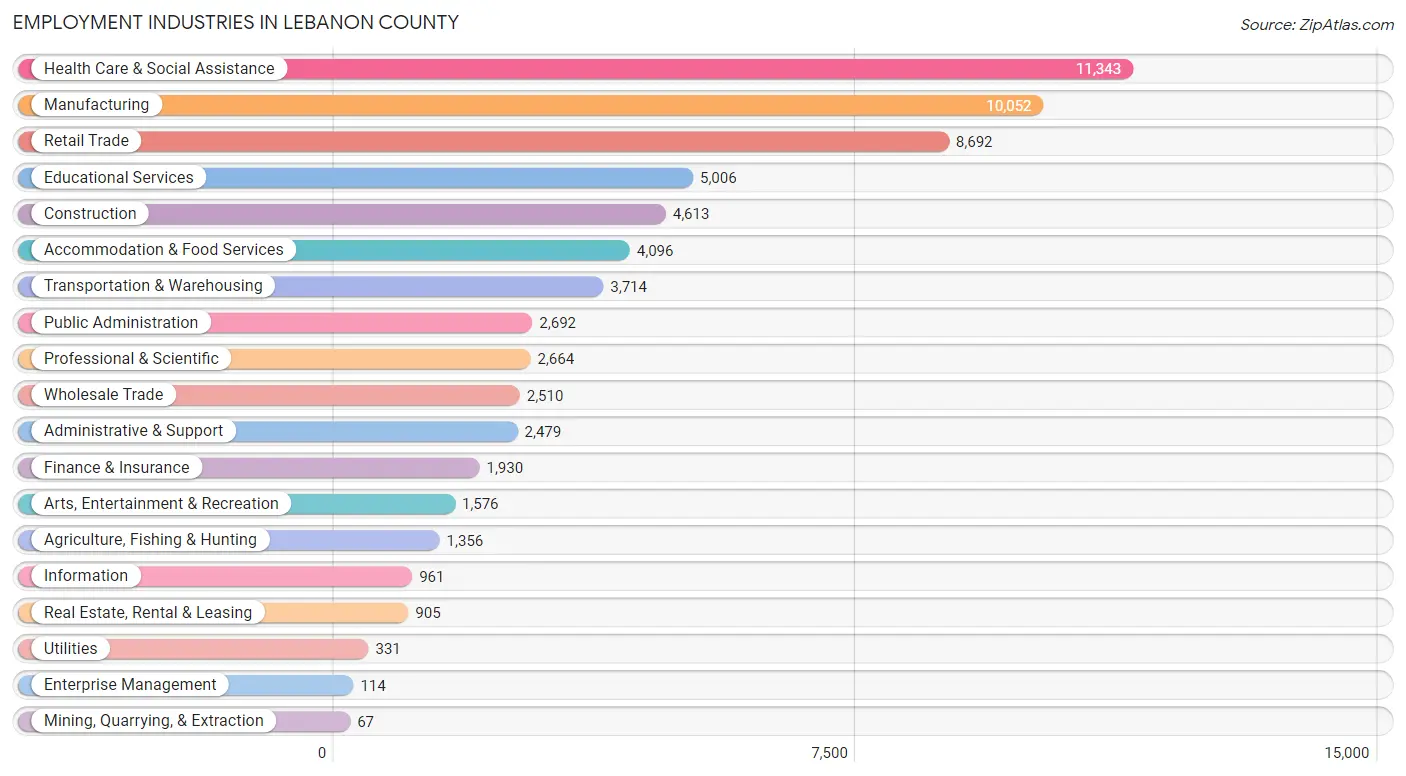
Employment Industries in Lebanon County
The major employment industries in Lebanon County include Health Care & Social Assistance (11,343 | 16.6%), Manufacturing (10,052 | 14.7%), Retail Trade (8,692 | 12.7%), Educational Services (5,006 | 7.3%), and Construction (4,613 | 6.7%).
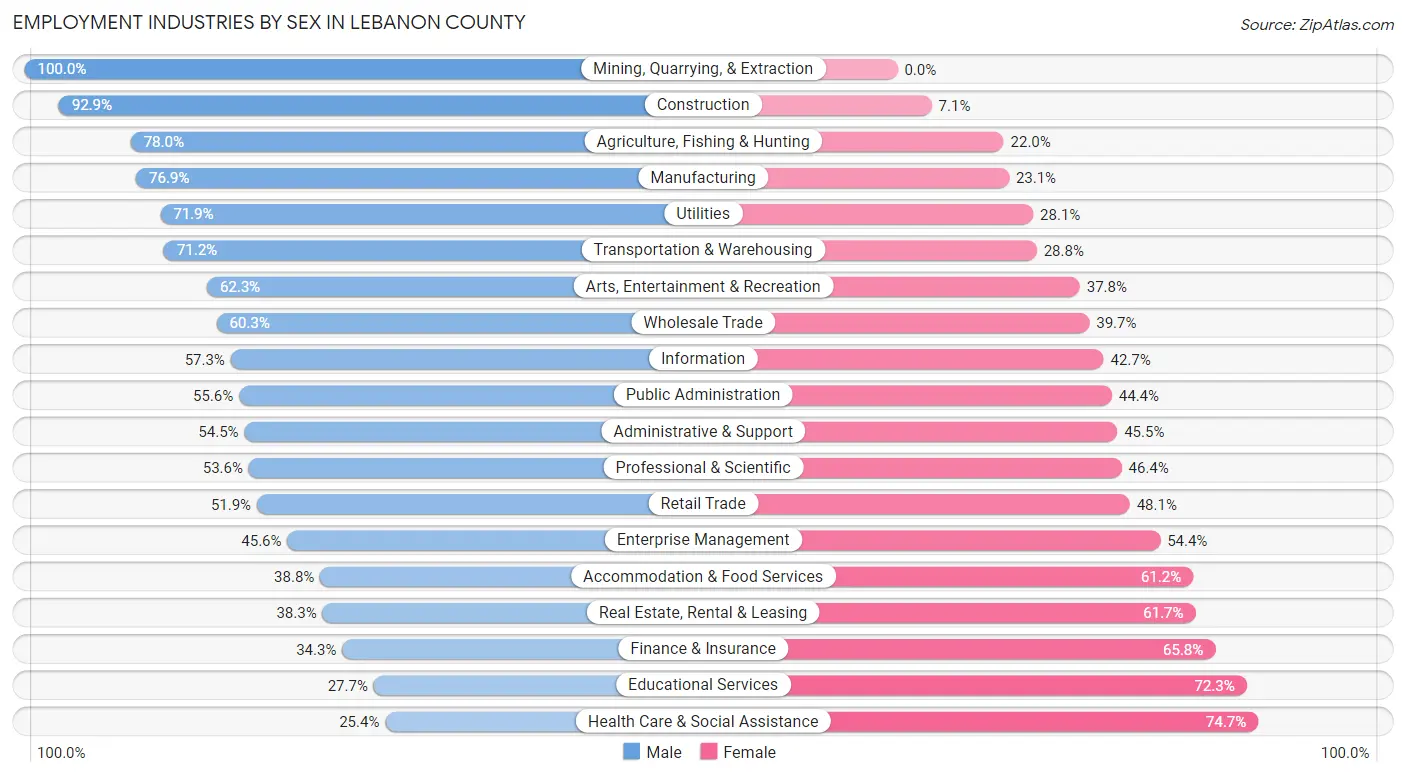
Employment Industries by Sex in Lebanon County
The Lebanon County industries that see more men than women are Mining, Quarrying, & Extraction (100.0%), Construction (92.9%), and Agriculture, Fishing & Hunting (78.0%), whereas the industries that tend to have a higher number of women are Health Care & Social Assistance (74.7%), Educational Services (72.3%), and Finance & Insurance (65.7%).
| Industry | Male | Female |
| Agriculture, Fishing & Hunting | 1,058 (78.0%) | 298 (22.0%) |
| Mining, Quarrying, & Extraction | 67 (100.0%) | 0 (0.0%) |
| Construction | 4,286 (92.9%) | 327 (7.1%) |
| Manufacturing | 7,732 (76.9%) | 2,320 (23.1%) |
| Wholesale Trade | 1,513 (60.3%) | 997 (39.7%) |
| Retail Trade | 4,512 (51.9%) | 4,180 (48.1%) |
| Transportation & Warehousing | 2,643 (71.2%) | 1,071 (28.8%) |
| Utilities | 238 (71.9%) | 93 (28.1%) |
| Information | 551 (57.3%) | 410 (42.7%) |
| Finance & Insurance | 661 (34.3%) | 1,269 (65.7%) |
| Real Estate, Rental & Leasing | 347 (38.3%) | 558 (61.7%) |
| Professional & Scientific | 1,428 (53.6%) | 1,236 (46.4%) |
| Enterprise Management | 52 (45.6%) | 62 (54.4%) |
| Administrative & Support | 1,351 (54.5%) | 1,128 (45.5%) |
| Educational Services | 1,388 (27.7%) | 3,618 (72.3%) |
| Health Care & Social Assistance | 2,875 (25.4%) | 8,468 (74.7%) |
| Arts, Entertainment & Recreation | 981 (62.3%) | 595 (37.8%) |
| Accommodation & Food Services | 1,590 (38.8%) | 2,506 (61.2%) |
| Public Administration | 1,497 (55.6%) | 1,195 (44.4%) |
| Total | 36,487 (53.2%) | 32,028 (46.8%) |
Education in Lebanon County
School Enrollment in Lebanon County
The most common levels of schooling among the 32,218 students in Lebanon County are middle school (7,787 | 24.2%), elementary school (7,485 | 23.2%), and high school (7,310 | 22.7%).
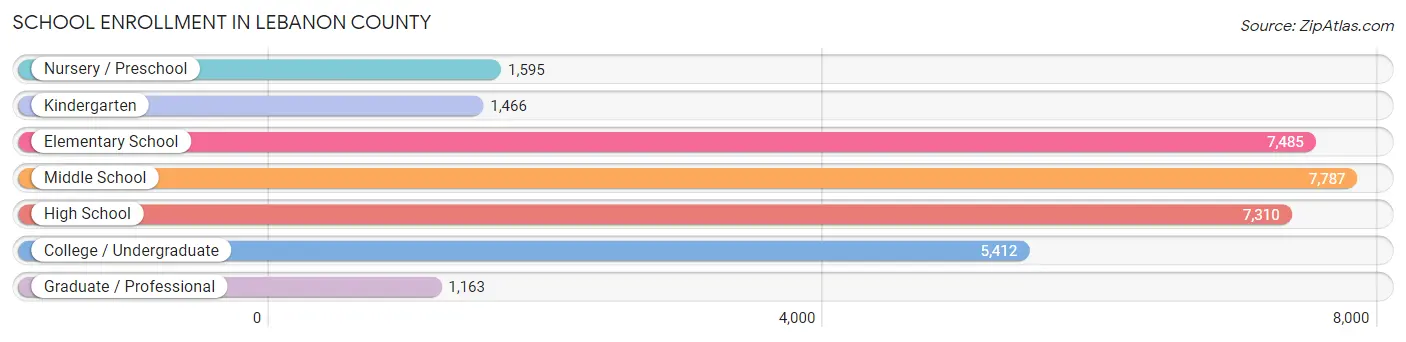
| School Level | # Students | % Students |
| Nursery / Preschool | 1,595 | 5.0% |
| Kindergarten | 1,466 | 4.5% |
| Elementary School | 7,485 | 23.2% |
| Middle School | 7,787 | 24.2% |
| High School | 7,310 | 22.7% |
| College / Undergraduate | 5,412 | 16.8% |
| Graduate / Professional | 1,163 | 3.6% |
| Total | 32,218 | 100.0% |
School Enrollment by Age by Funding Source in Lebanon County
Out of a total of 32,218 students who are enrolled in schools in Lebanon County, 8,409 (26.1%) attend a private institution, while the remaining 23,809 (73.9%) are enrolled in public schools. The age group of 20 to 24 year olds has the highest likelihood of being enrolled in private schools, with 1,473 (53.2% in the age bracket) enrolled. Conversely, the age group of 15 to 17 year olds has the lowest likelihood of being enrolled in a private school, with 4,395 (84.5% in the age bracket) attending a public institution.
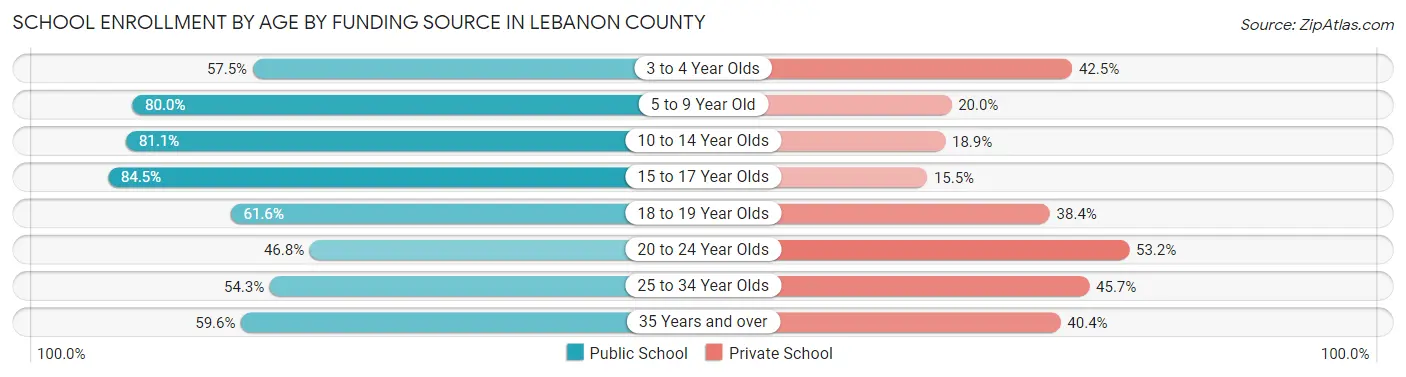
| Age Bracket | Public School | Private School |
| 3 to 4 Year Olds | 819 (57.5%) | 606 (42.5%) |
| 5 to 9 Year Old | 6,339 (80.0%) | 1,588 (20.0%) |
| 10 to 14 Year Olds | 7,945 (81.1%) | 1,849 (18.9%) |
| 15 to 17 Year Olds | 4,395 (84.5%) | 807 (15.5%) |
| 18 to 19 Year Olds | 1,484 (61.6%) | 924 (38.4%) |
| 20 to 24 Year Olds | 1,298 (46.8%) | 1,473 (53.2%) |
| 25 to 34 Year Olds | 697 (54.3%) | 587 (45.7%) |
| 35 Years and over | 839 (59.6%) | 568 (40.4%) |
| Total | 23,809 (73.9%) | 8,409 (26.1%) |
Educational Attainment by Field of Study in Lebanon County
Education (4,278 | 17.5%), business (4,238 | 17.4%), science & technology (2,725 | 11.2%), bio, nature & agricultural (1,916 | 7.9%), and arts & humanities (1,732 | 7.1%) are the most common fields of study among 24,418 individuals in Lebanon County who have obtained a bachelor's degree or higher.
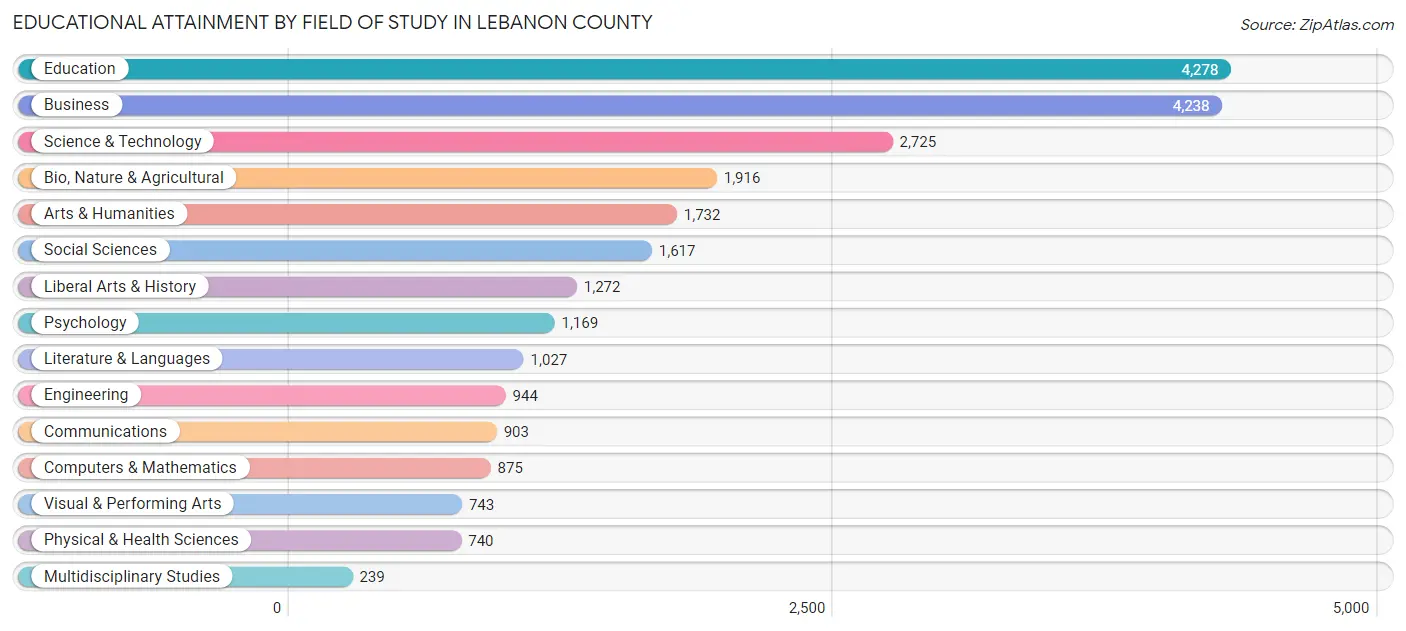
| Field of Study | # Graduates | % Graduates |
| Computers & Mathematics | 875 | 3.6% |
| Bio, Nature & Agricultural | 1,916 | 7.9% |
| Physical & Health Sciences | 740 | 3.0% |
| Psychology | 1,169 | 4.8% |
| Social Sciences | 1,617 | 6.6% |
| Engineering | 944 | 3.9% |
| Multidisciplinary Studies | 239 | 1.0% |
| Science & Technology | 2,725 | 11.2% |
| Business | 4,238 | 17.4% |
| Education | 4,278 | 17.5% |
| Literature & Languages | 1,027 | 4.2% |
| Liberal Arts & History | 1,272 | 5.2% |
| Visual & Performing Arts | 743 | 3.0% |
| Communications | 903 | 3.7% |
| Arts & Humanities | 1,732 | 7.1% |
| Total | 24,418 | 100.0% |
Transportation & Commute in Lebanon County
Vehicle Availability by Sex in Lebanon County
The most prevalent vehicle ownership categories in Lebanon County are males with 2 vehicles (15,851, accounting for 44.1%) and females with 2 vehicles (12,787, making up 50.7%).
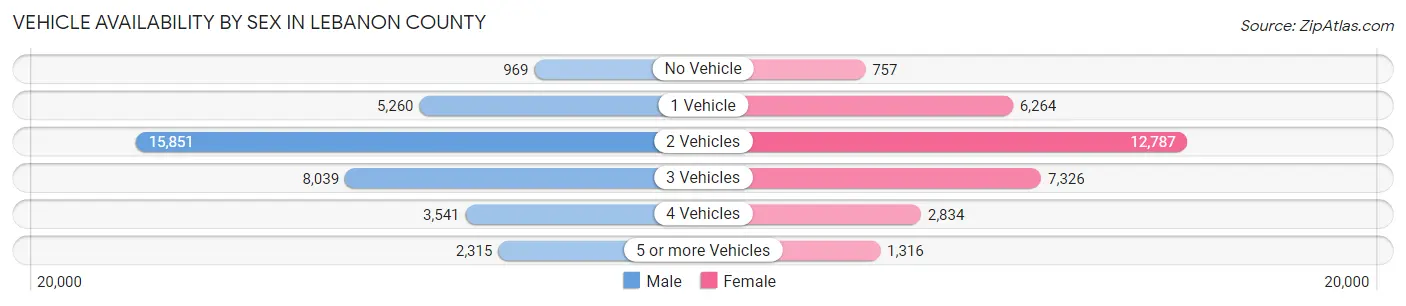
| Vehicles Available | Male | Female |
| No Vehicle | 969 (2.7%) | 757 (2.4%) |
| 1 Vehicle | 5,260 (14.6%) | 6,264 (20.0%) |
| 2 Vehicles | 15,851 (44.1%) | 12,787 (40.9%) |
| 3 Vehicles | 8,039 (22.4%) | 7,326 (23.4%) |
| 4 Vehicles | 3,541 (9.8%) | 2,834 (9.1%) |
| 5 or more Vehicles | 2,315 (6.4%) | 1,316 (4.2%) |
| Total | 35,975 (100.0%) | 31,284 (100.0%) |
Commute Time in Lebanon County
The most frequently occuring commute durations in Lebanon County are 10 to 14 minutes (10,376 commuters, 16.7%), 15 to 19 minutes (10,152 commuters, 16.3%), and 5 to 9 minutes (8,436 commuters, 13.6%).
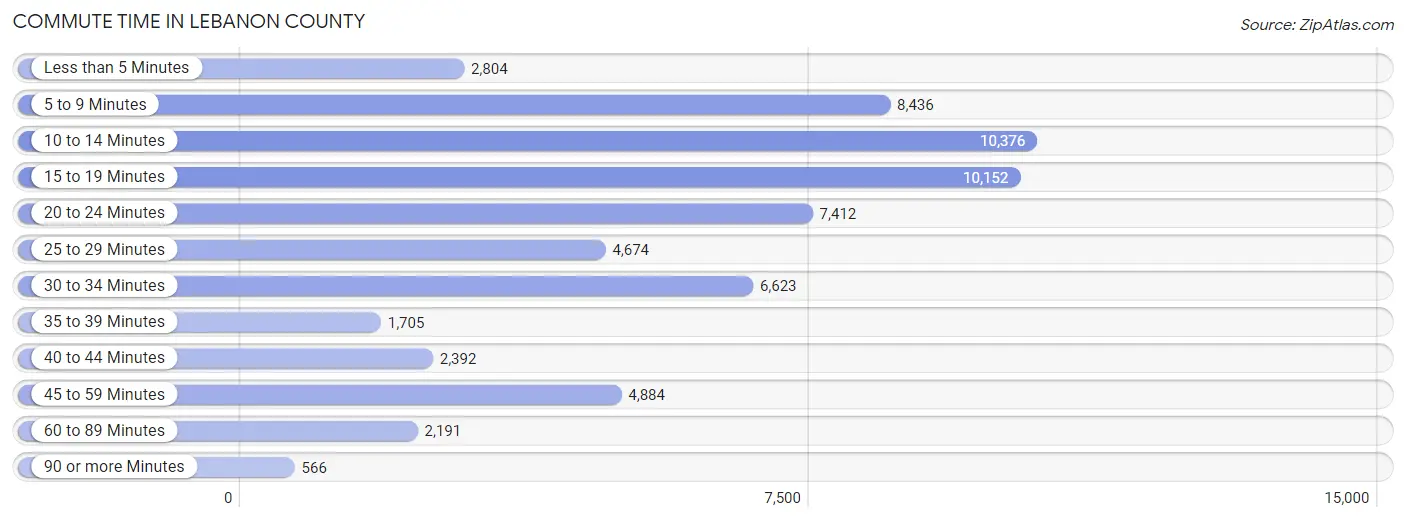
| Commute Time | # Commuters | % Commuters |
| Less than 5 Minutes | 2,804 | 4.5% |
| 5 to 9 Minutes | 8,436 | 13.6% |
| 10 to 14 Minutes | 10,376 | 16.7% |
| 15 to 19 Minutes | 10,152 | 16.3% |
| 20 to 24 Minutes | 7,412 | 11.9% |
| 25 to 29 Minutes | 4,674 | 7.5% |
| 30 to 34 Minutes | 6,623 | 10.6% |
| 35 to 39 Minutes | 1,705 | 2.7% |
| 40 to 44 Minutes | 2,392 | 3.8% |
| 45 to 59 Minutes | 4,884 | 7.9% |
| 60 to 89 Minutes | 2,191 | 3.5% |
| 90 or more Minutes | 566 | 0.9% |
Commute Time by Sex in Lebanon County
The most common commute times in Lebanon County are 15 to 19 minutes (5,524 commuters, 16.4%) for males and 10 to 14 minutes (5,498 commuters, 19.3%) for females.
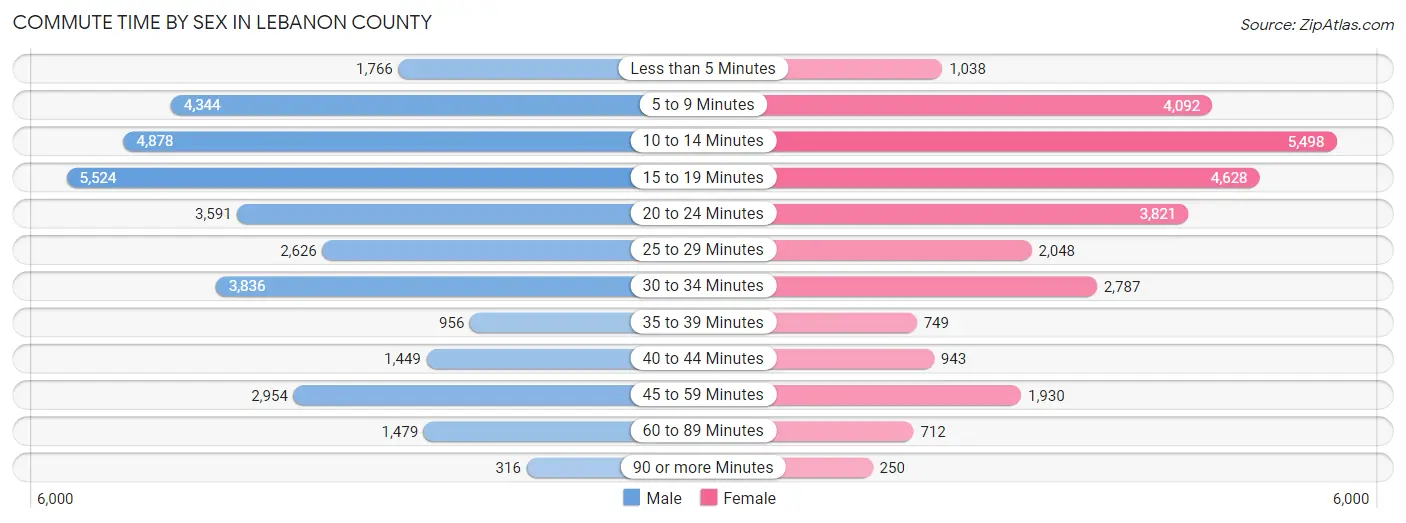
| Commute Time | Male | Female |
| Less than 5 Minutes | 1,766 (5.2%) | 1,038 (3.6%) |
| 5 to 9 Minutes | 4,344 (12.9%) | 4,092 (14.4%) |
| 10 to 14 Minutes | 4,878 (14.5%) | 5,498 (19.3%) |
| 15 to 19 Minutes | 5,524 (16.4%) | 4,628 (16.2%) |
| 20 to 24 Minutes | 3,591 (10.6%) | 3,821 (13.4%) |
| 25 to 29 Minutes | 2,626 (7.8%) | 2,048 (7.2%) |
| 30 to 34 Minutes | 3,836 (11.4%) | 2,787 (9.8%) |
| 35 to 39 Minutes | 956 (2.8%) | 749 (2.6%) |
| 40 to 44 Minutes | 1,449 (4.3%) | 943 (3.3%) |
| 45 to 59 Minutes | 2,954 (8.8%) | 1,930 (6.8%) |
| 60 to 89 Minutes | 1,479 (4.4%) | 712 (2.5%) |
| 90 or more Minutes | 316 (0.9%) | 250 (0.9%) |
Time of Departure to Work by Sex in Lebanon County
The most frequent times of departure to work in Lebanon County are 6:30 AM to 6:59 AM (4,428, 13.1%) for males and 7:30 AM to 7:59 AM (4,628, 16.2%) for females.
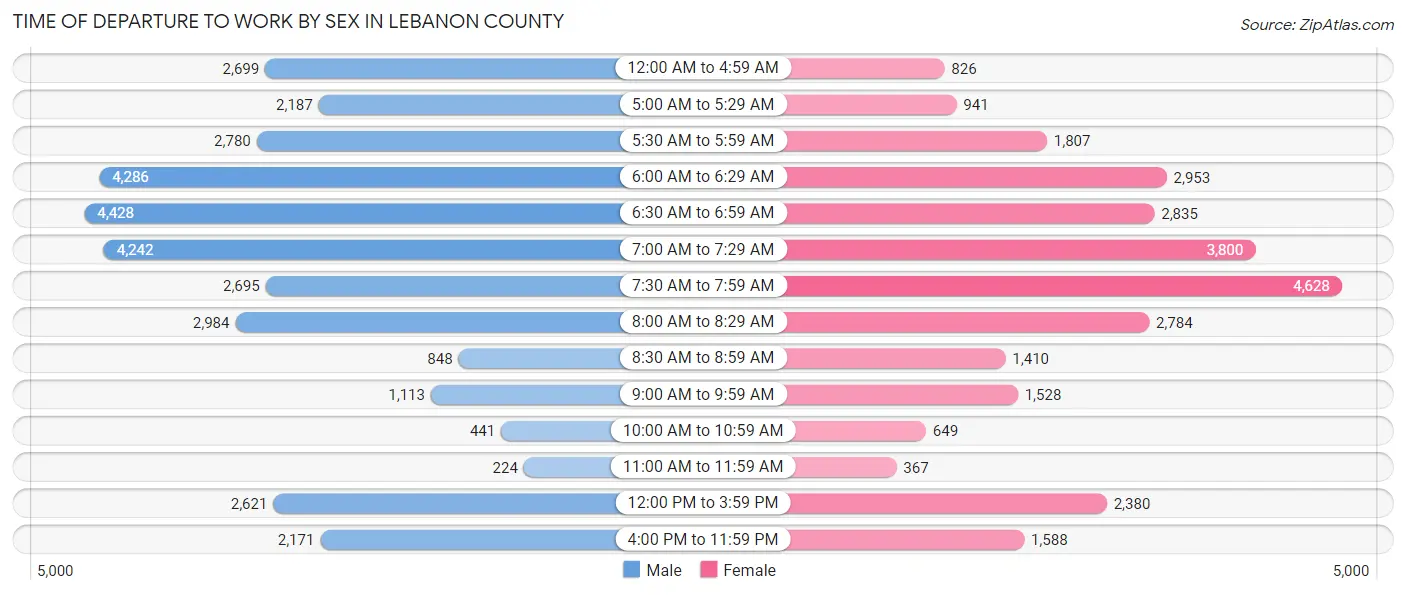
| Time of Departure | Male | Female |
| 12:00 AM to 4:59 AM | 2,699 (8.0%) | 826 (2.9%) |
| 5:00 AM to 5:29 AM | 2,187 (6.5%) | 941 (3.3%) |
| 5:30 AM to 5:59 AM | 2,780 (8.2%) | 1,807 (6.3%) |
| 6:00 AM to 6:29 AM | 4,286 (12.7%) | 2,953 (10.4%) |
| 6:30 AM to 6:59 AM | 4,428 (13.1%) | 2,835 (10.0%) |
| 7:00 AM to 7:29 AM | 4,242 (12.6%) | 3,800 (13.3%) |
| 7:30 AM to 7:59 AM | 2,695 (8.0%) | 4,628 (16.2%) |
| 8:00 AM to 8:29 AM | 2,984 (8.8%) | 2,784 (9.8%) |
| 8:30 AM to 8:59 AM | 848 (2.5%) | 1,410 (5.0%) |
| 9:00 AM to 9:59 AM | 1,113 (3.3%) | 1,528 (5.4%) |
| 10:00 AM to 10:59 AM | 441 (1.3%) | 649 (2.3%) |
| 11:00 AM to 11:59 AM | 224 (0.7%) | 367 (1.3%) |
| 12:00 PM to 3:59 PM | 2,621 (7.8%) | 2,380 (8.4%) |
| 4:00 PM to 11:59 PM | 2,171 (6.4%) | 1,588 (5.6%) |
| Total | 33,719 (100.0%) | 28,496 (100.0%) |
Housing Occupancy in Lebanon County
Occupancy by Ownership in Lebanon County
Of the total 55,236 dwellings in Lebanon County, owner-occupied units account for 39,519 (71.6%), while renter-occupied units make up 15,717 (28.4%).
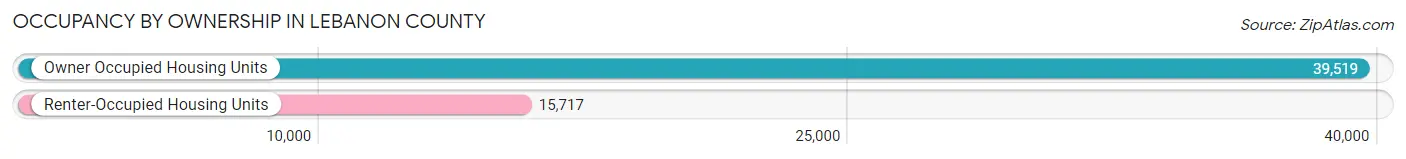
| Occupancy | # Housing Units | % Housing Units |
| Owner Occupied Housing Units | 39,519 | 71.6% |
| Renter-Occupied Housing Units | 15,717 | 28.4% |
| Total Occupied Housing Units | 55,236 | 100.0% |
Occupancy by Household Size in Lebanon County
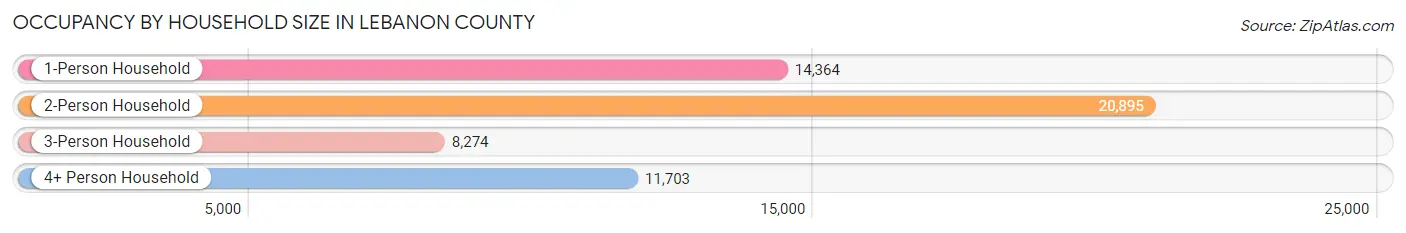
| Household Size | # Housing Units | % Housing Units |
| 1-Person Household | 14,364 | 26.0% |
| 2-Person Household | 20,895 | 37.8% |
| 3-Person Household | 8,274 | 15.0% |
| 4+ Person Household | 11,703 | 21.2% |
| Total Housing Units | 55,236 | 100.0% |
Occupancy by Ownership by Household Size in Lebanon County
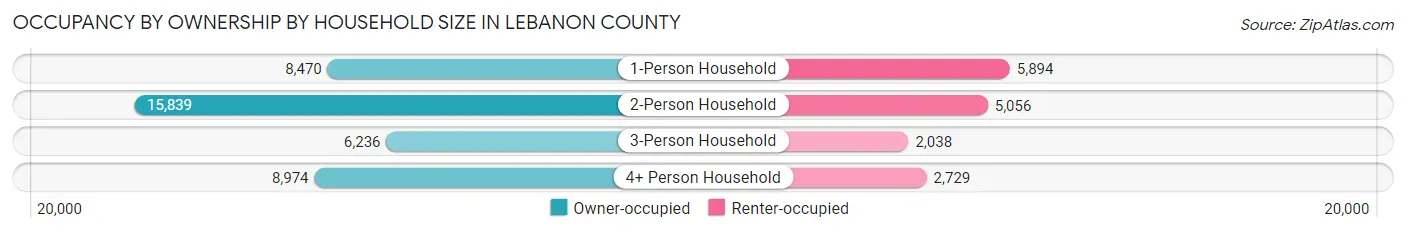
| Household Size | Owner-occupied | Renter-occupied |
| 1-Person Household | 8,470 (59.0%) | 5,894 (41.0%) |
| 2-Person Household | 15,839 (75.8%) | 5,056 (24.2%) |
| 3-Person Household | 6,236 (75.4%) | 2,038 (24.6%) |
| 4+ Person Household | 8,974 (76.7%) | 2,729 (23.3%) |
| Total Housing Units | 39,519 (71.6%) | 15,717 (28.4%) |
Occupancy by Educational Attainment in Lebanon County
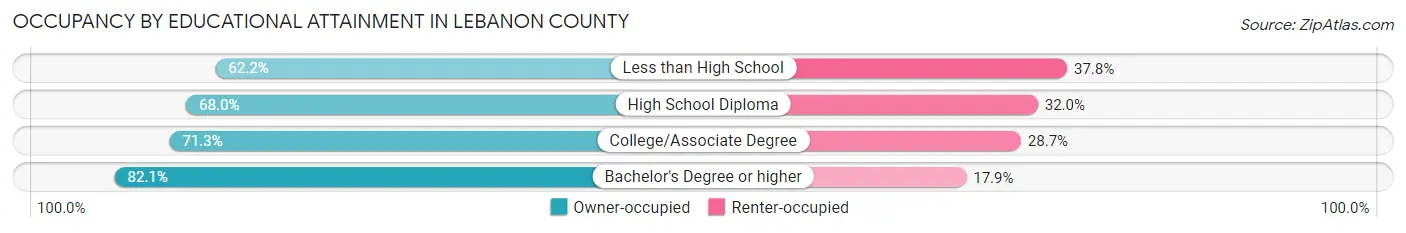
| Household Size | Owner-occupied | Renter-occupied |
| Less than High School | 3,946 (62.2%) | 2,402 (37.8%) |
| High School Diploma | 15,014 (68.0%) | 7,078 (32.0%) |
| College/Associate Degree | 9,546 (71.3%) | 3,843 (28.7%) |
| Bachelor's Degree or higher | 11,013 (82.1%) | 2,394 (17.9%) |
Occupancy by Age of Householder in Lebanon County
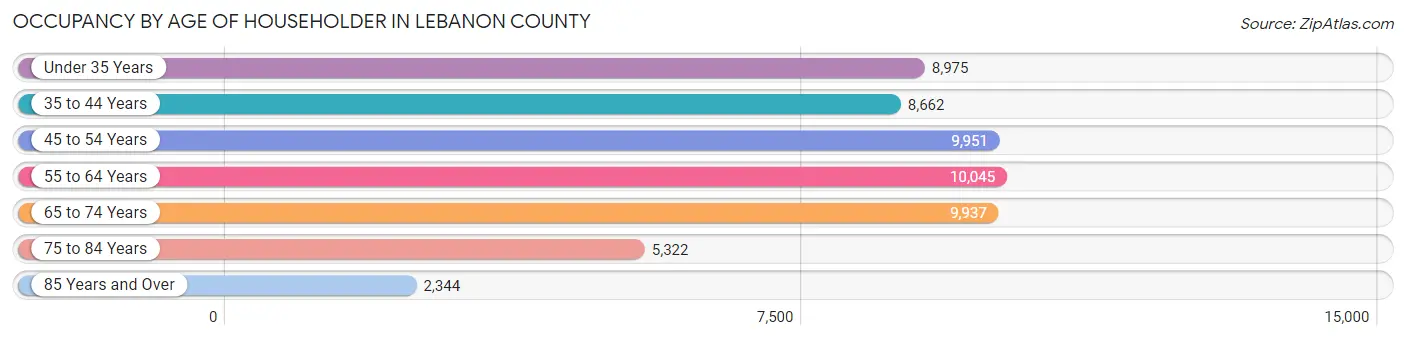
| Age Bracket | # Households | % Households |
| Under 35 Years | 8,975 | 16.3% |
| 35 to 44 Years | 8,662 | 15.7% |
| 45 to 54 Years | 9,951 | 18.0% |
| 55 to 64 Years | 10,045 | 18.2% |
| 65 to 74 Years | 9,937 | 18.0% |
| 75 to 84 Years | 5,322 | 9.6% |
| 85 Years and Over | 2,344 | 4.2% |
| Total | 55,236 | 100.0% |
Housing Finances in Lebanon County
Median Income by Occupancy in Lebanon County
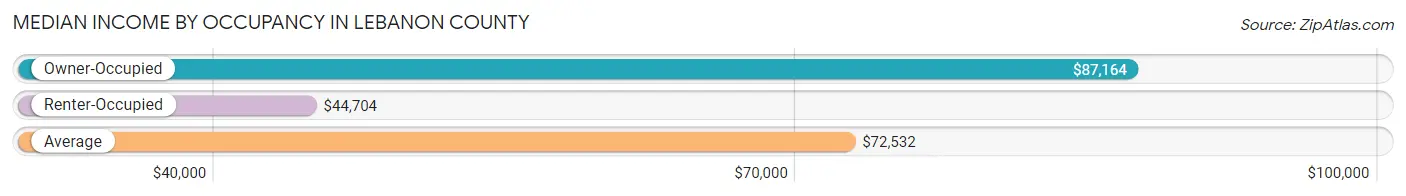
| Occupancy Type | # Households | Median Income |
| Owner-Occupied | 39,519 (71.6%) | $87,164 |
| Renter-Occupied | 15,717 (28.4%) | $44,704 |
| Average | 55,236 (100.0%) | $72,532 |
Occupancy by Householder Income Bracket in Lebanon County
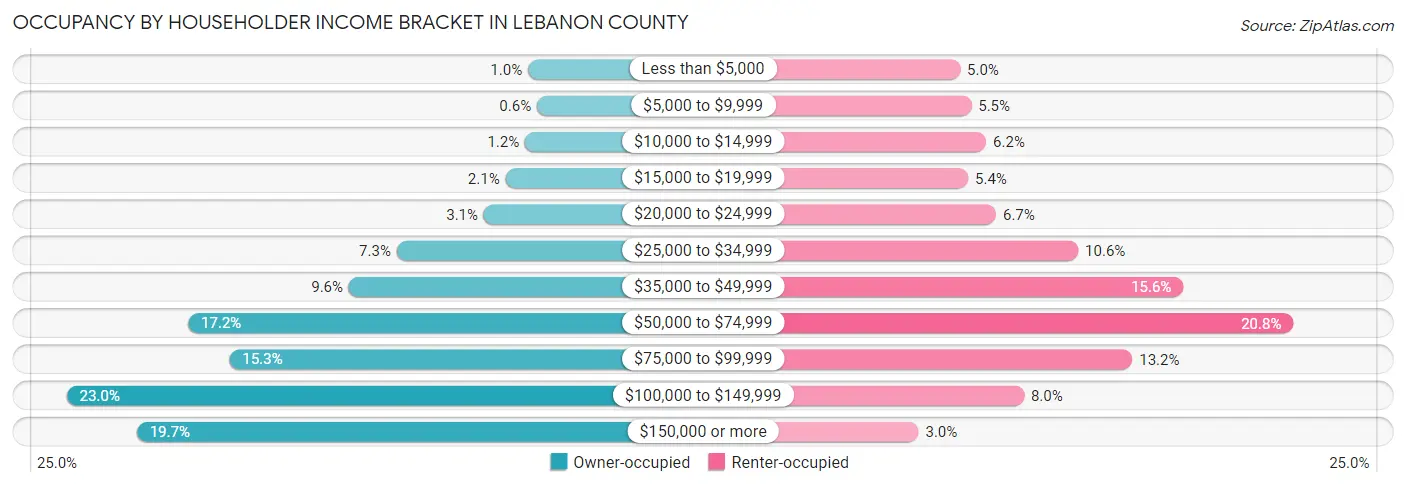
| Income Bracket | Owner-occupied | Renter-occupied |
| Less than $5,000 | 409 (1.0%) | 783 (5.0%) |
| $5,000 to $9,999 | 236 (0.6%) | 866 (5.5%) |
| $10,000 to $14,999 | 462 (1.2%) | 977 (6.2%) |
| $15,000 to $19,999 | 831 (2.1%) | 843 (5.4%) |
| $20,000 to $24,999 | 1,236 (3.1%) | 1,051 (6.7%) |
| $25,000 to $34,999 | 2,876 (7.3%) | 1,666 (10.6%) |
| $35,000 to $49,999 | 3,778 (9.6%) | 2,452 (15.6%) |
| $50,000 to $74,999 | 6,804 (17.2%) | 3,275 (20.8%) |
| $75,000 to $99,999 | 6,028 (15.2%) | 2,072 (13.2%) |
| $100,000 to $149,999 | 9,091 (23.0%) | 1,260 (8.0%) |
| $150,000 or more | 7,768 (19.7%) | 472 (3.0%) |
| Total | 39,519 (100.0%) | 15,717 (100.0%) |
Monthly Housing Cost Tiers in Lebanon County
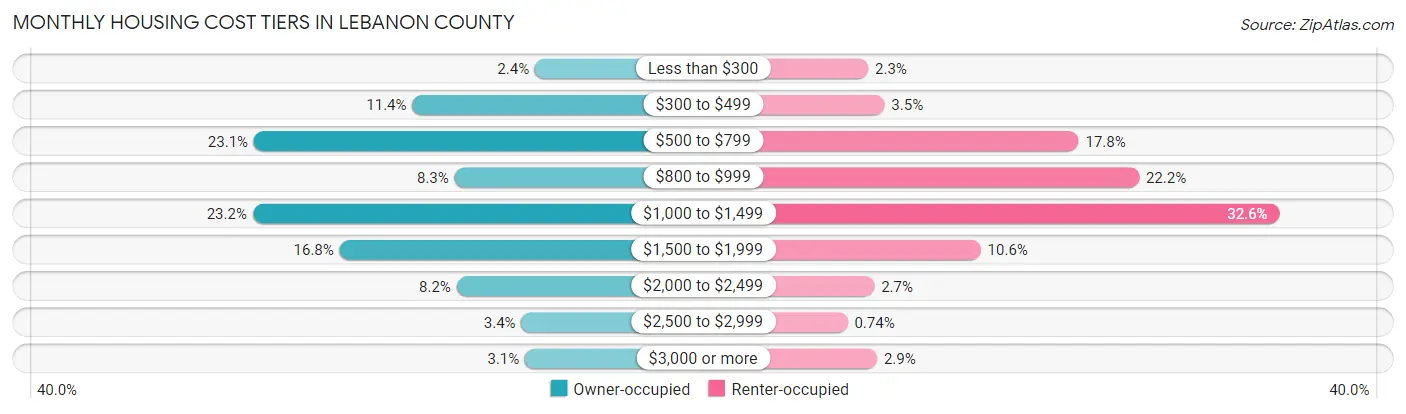
| Monthly Cost | Owner-occupied | Renter-occupied |
| Less than $300 | 951 (2.4%) | 355 (2.3%) |
| $300 to $499 | 4,519 (11.4%) | 544 (3.5%) |
| $500 to $799 | 9,131 (23.1%) | 2,792 (17.8%) |
| $800 to $999 | 3,292 (8.3%) | 3,490 (22.2%) |
| $1,000 to $1,499 | 9,167 (23.2%) | 5,116 (32.6%) |
| $1,500 to $1,999 | 6,641 (16.8%) | 1,658 (10.5%) |
| $2,000 to $2,499 | 3,232 (8.2%) | 426 (2.7%) |
| $2,500 to $2,999 | 1,347 (3.4%) | 117 (0.7%) |
| $3,000 or more | 1,239 (3.1%) | 457 (2.9%) |
| Total | 39,519 (100.0%) | 15,717 (100.0%) |
Physical Housing Characteristics in Lebanon County
Housing Structures in Lebanon County
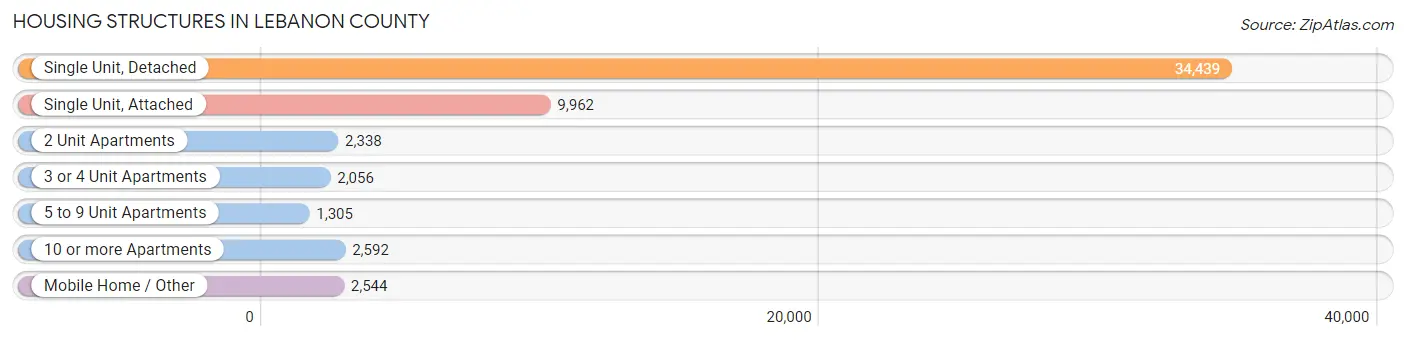
| Structure Type | # Housing Units | % Housing Units |
| Single Unit, Detached | 34,439 | 62.4% |
| Single Unit, Attached | 9,962 | 18.0% |
| 2 Unit Apartments | 2,338 | 4.2% |
| 3 or 4 Unit Apartments | 2,056 | 3.7% |
| 5 to 9 Unit Apartments | 1,305 | 2.4% |
| 10 or more Apartments | 2,592 | 4.7% |
| Mobile Home / Other | 2,544 | 4.6% |
| Total | 55,236 | 100.0% |
Housing Structures by Occupancy in Lebanon County
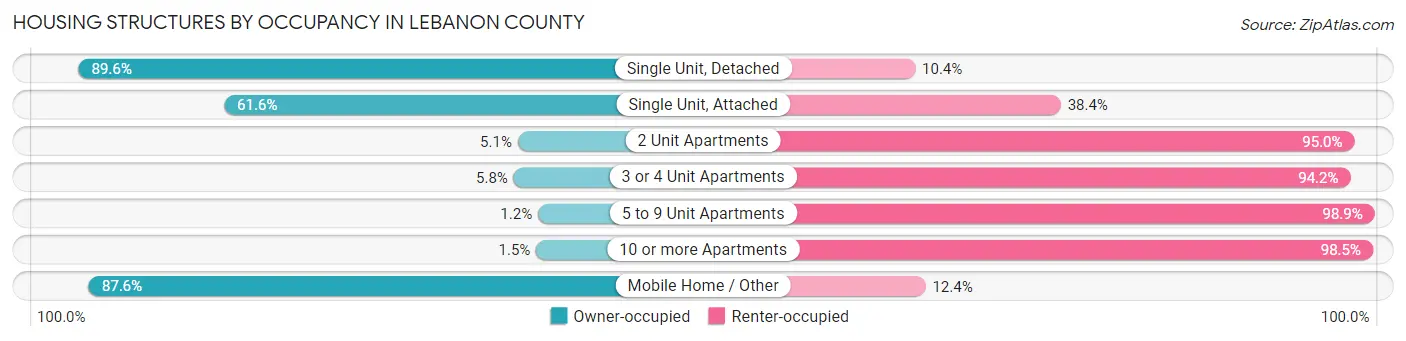
| Structure Type | Owner-occupied | Renter-occupied |
| Single Unit, Detached | 30,863 (89.6%) | 3,576 (10.4%) |
| Single Unit, Attached | 6,135 (61.6%) | 3,827 (38.4%) |
| 2 Unit Apartments | 118 (5.1%) | 2,220 (95.0%) |
| 3 or 4 Unit Apartments | 120 (5.8%) | 1,936 (94.2%) |
| 5 to 9 Unit Apartments | 15 (1.1%) | 1,290 (98.9%) |
| 10 or more Apartments | 39 (1.5%) | 2,553 (98.5%) |
| Mobile Home / Other | 2,229 (87.6%) | 315 (12.4%) |
| Total | 39,519 (71.6%) | 15,717 (28.4%) |
Housing Structures by Number of Rooms in Lebanon County
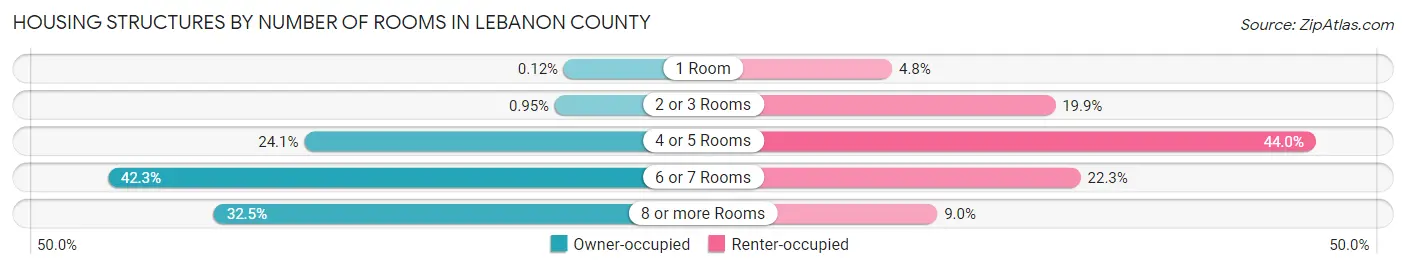
| Number of Rooms | Owner-occupied | Renter-occupied |
| 1 Room | 48 (0.1%) | 758 (4.8%) |
| 2 or 3 Rooms | 375 (0.9%) | 3,129 (19.9%) |
| 4 or 5 Rooms | 9,535 (24.1%) | 6,917 (44.0%) |
| 6 or 7 Rooms | 16,717 (42.3%) | 3,498 (22.3%) |
| 8 or more Rooms | 12,844 (32.5%) | 1,415 (9.0%) |
| Total | 39,519 (100.0%) | 15,717 (100.0%) |
Housing Structure by Heating Type in Lebanon County
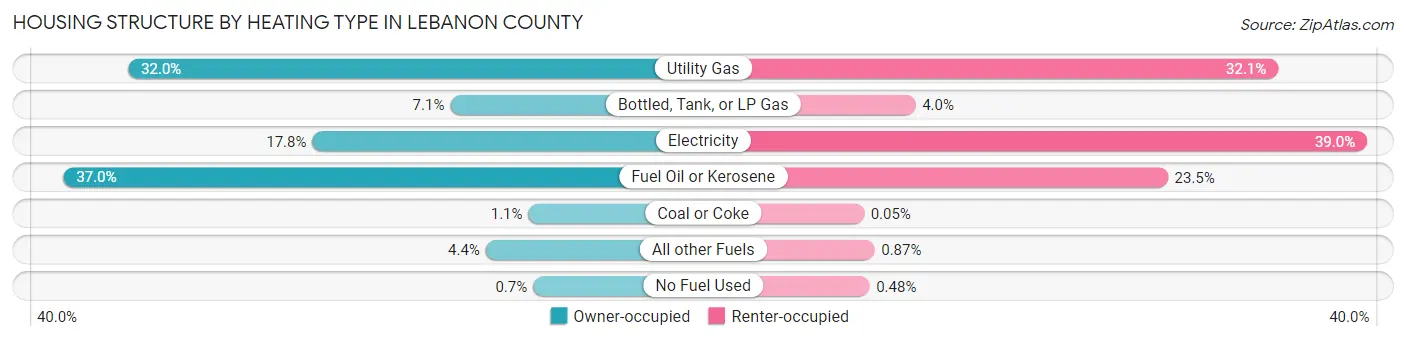
| Heating Type | Owner-occupied | Renter-occupied |
| Utility Gas | 12,649 (32.0%) | 5,042 (32.1%) |
| Bottled, Tank, or LP Gas | 2,805 (7.1%) | 634 (4.0%) |
| Electricity | 7,020 (17.8%) | 6,122 (39.0%) |
| Fuel Oil or Kerosene | 14,627 (37.0%) | 3,700 (23.5%) |
| Coal or Coke | 418 (1.1%) | 8 (0.1%) |
| All other Fuels | 1,722 (4.4%) | 136 (0.9%) |
| No Fuel Used | 278 (0.7%) | 75 (0.5%) |
| Total | 39,519 (100.0%) | 15,717 (100.0%) |
Household Vehicle Usage in Lebanon County
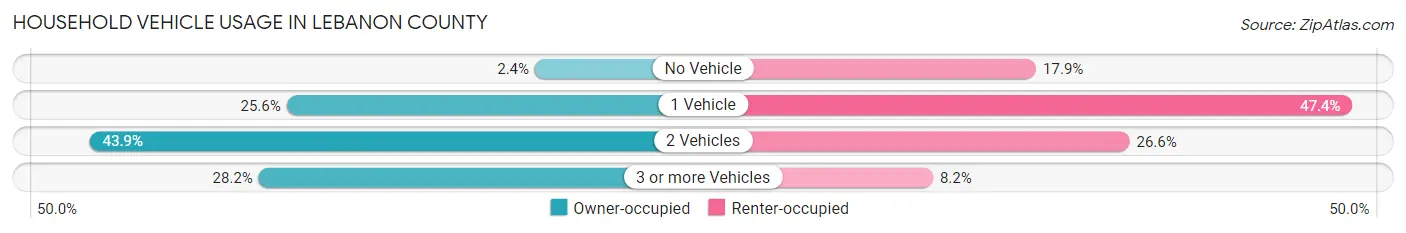
| Vehicles per Household | Owner-occupied | Renter-occupied |
| No Vehicle | 935 (2.4%) | 2,805 (17.8%) |
| 1 Vehicle | 10,096 (25.6%) | 7,444 (47.4%) |
| 2 Vehicles | 17,362 (43.9%) | 4,176 (26.6%) |
| 3 or more Vehicles | 11,126 (28.1%) | 1,292 (8.2%) |
| Total | 39,519 (100.0%) | 15,717 (100.0%) |
Real Estate & Mortgages in Lebanon County
Real Estate and Mortgage Overview in Lebanon County
| Characteristic | Without Mortgage | With Mortgage |
| Housing Units | 15,770 | 23,749 |
| Median Property Value | $199,400 | $219,800 |
| Median Household Income | $68,035 | $5,753 |
| Monthly Housing Costs | $596 | $1,204 |
| Real Estate Taxes | $2,972 | $283 |
Property Value by Mortgage Status in Lebanon County
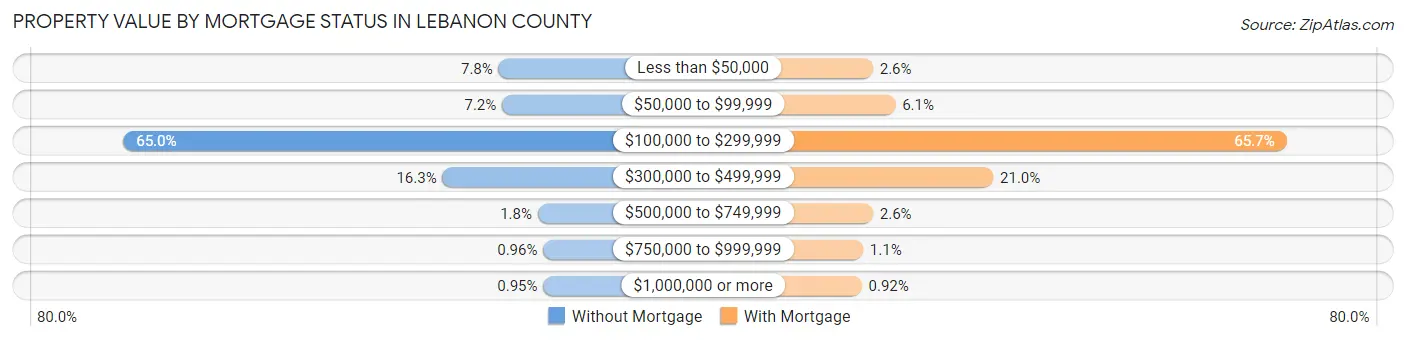
| Property Value | Without Mortgage | With Mortgage |
| Less than $50,000 | 1,225 (7.8%) | 625 (2.6%) |
| $50,000 to $99,999 | 1,142 (7.2%) | 1,437 (6.0%) |
| $100,000 to $299,999 | 10,244 (65.0%) | 15,596 (65.7%) |
| $300,000 to $499,999 | 2,573 (16.3%) | 4,978 (21.0%) |
| $500,000 to $749,999 | 284 (1.8%) | 628 (2.6%) |
| $750,000 to $999,999 | 152 (1.0%) | 267 (1.1%) |
| $1,000,000 or more | 150 (0.9%) | 218 (0.9%) |
| Total | 15,770 (100.0%) | 23,749 (100.0%) |
Household Income by Mortgage Status in Lebanon County
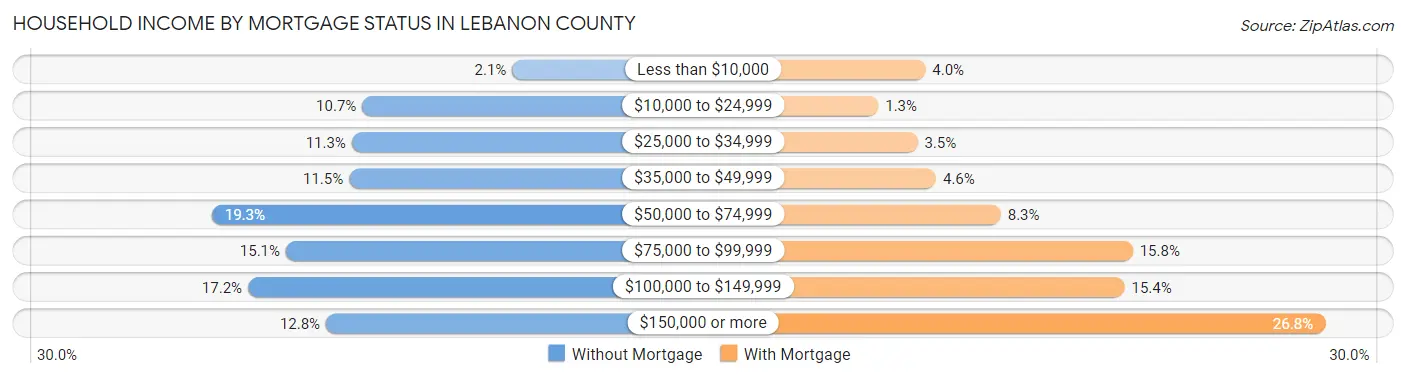
| Household Income | Without Mortgage | With Mortgage |
| Less than $10,000 | 337 (2.1%) | 947 (4.0%) |
| $10,000 to $24,999 | 1,689 (10.7%) | 308 (1.3%) |
| $25,000 to $34,999 | 1,783 (11.3%) | 840 (3.5%) |
| $35,000 to $49,999 | 1,808 (11.5%) | 1,093 (4.6%) |
| $50,000 to $74,999 | 3,043 (19.3%) | 1,970 (8.3%) |
| $75,000 to $99,999 | 2,377 (15.1%) | 3,761 (15.8%) |
| $100,000 to $149,999 | 2,718 (17.2%) | 3,651 (15.4%) |
| $150,000 or more | 2,015 (12.8%) | 6,373 (26.8%) |
| Total | 15,770 (100.0%) | 23,749 (100.0%) |
Property Value to Household Income Ratio in Lebanon County
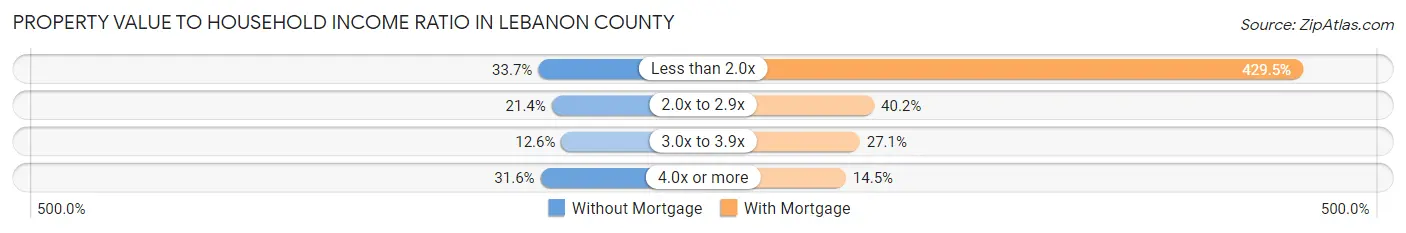
| Value-to-Income Ratio | Without Mortgage | With Mortgage |
| Less than 2.0x | 5,306 (33.7%) | 101,990 (429.5%) |
| 2.0x to 2.9x | 3,380 (21.4%) | 9,536 (40.2%) |
| 3.0x to 3.9x | 1,990 (12.6%) | 6,436 (27.1%) |
| 4.0x or more | 4,987 (31.6%) | 3,442 (14.5%) |
| Total | 15,770 (100.0%) | 23,749 (100.0%) |
Real Estate Taxes by Mortgage Status in Lebanon County
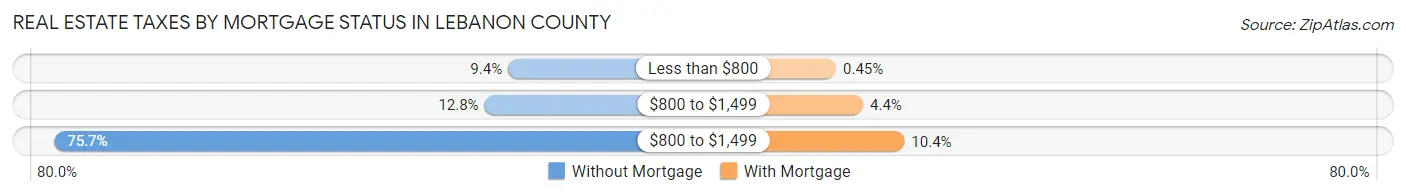
| Property Taxes | Without Mortgage | With Mortgage |
| Less than $800 | 1,478 (9.4%) | 106 (0.4%) |
| $800 to $1,499 | 2,020 (12.8%) | 1,042 (4.4%) |
| $800 to $1,499 | 11,930 (75.6%) | 2,478 (10.4%) |
| Total | 15,770 (100.0%) | 23,749 (100.0%) |
Health & Disability in Lebanon County
Health Insurance Coverage by Age in Lebanon County
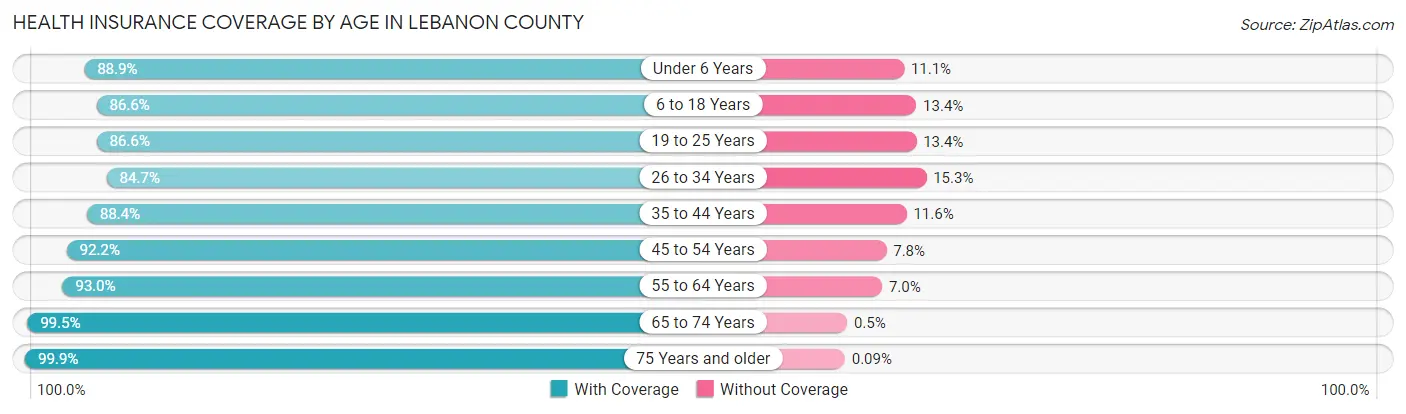
| Age Bracket | With Coverage | Without Coverage |
| Under 6 Years | 8,682 (88.9%) | 1,086 (11.1%) |
| 6 to 18 Years | 21,148 (86.6%) | 3,271 (13.4%) |
| 19 to 25 Years | 10,691 (86.6%) | 1,655 (13.4%) |
| 26 to 34 Years | 12,080 (84.7%) | 2,178 (15.3%) |
| 35 to 44 Years | 14,939 (88.4%) | 1,960 (11.6%) |
| 45 to 54 Years | 15,892 (92.2%) | 1,350 (7.8%) |
| 55 to 64 Years | 17,765 (93.0%) | 1,344 (7.0%) |
| 65 to 74 Years | 15,574 (99.5%) | 78 (0.5%) |
| 75 Years and older | 11,536 (99.9%) | 10 (0.1%) |
| Total | 128,307 (90.8%) | 12,932 (9.2%) |
Health Insurance Coverage by Citizenship Status in Lebanon County
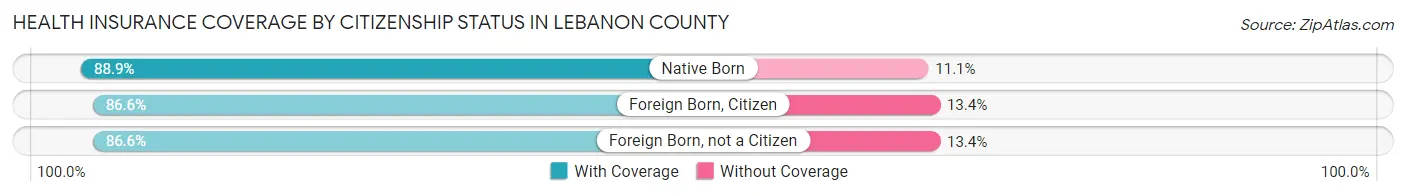
| Citizenship Status | With Coverage | Without Coverage |
| Native Born | 8,682 (88.9%) | 1,086 (11.1%) |
| Foreign Born, Citizen | 21,148 (86.6%) | 3,271 (13.4%) |
| Foreign Born, not a Citizen | 10,691 (86.6%) | 1,655 (13.4%) |
Health Insurance Coverage by Household Income in Lebanon County
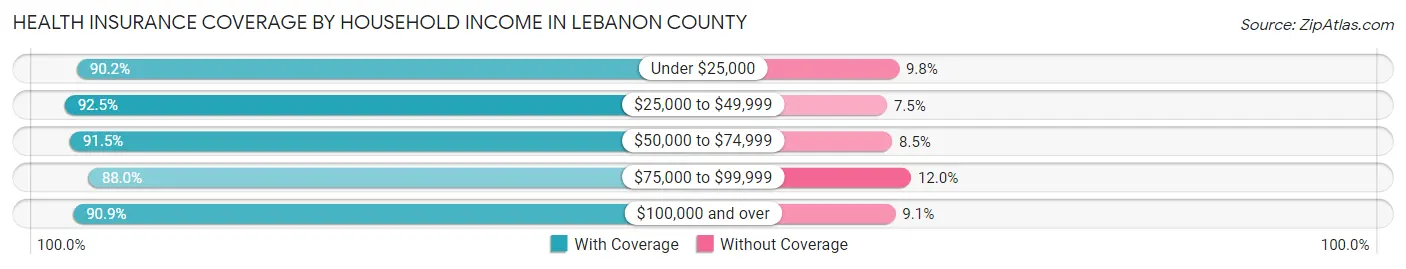
| Household Income | With Coverage | Without Coverage |
| Under $25,000 | 12,412 (90.2%) | 1,345 (9.8%) |
| $25,000 to $49,999 | 20,099 (92.5%) | 1,634 (7.5%) |
| $50,000 to $74,999 | 21,734 (91.5%) | 2,016 (8.5%) |
| $75,000 to $99,999 | 18,647 (88.0%) | 2,550 (12.0%) |
| $100,000 and over | 53,455 (90.9%) | 5,355 (9.1%) |
Public vs Private Health Insurance Coverage by Age in Lebanon County
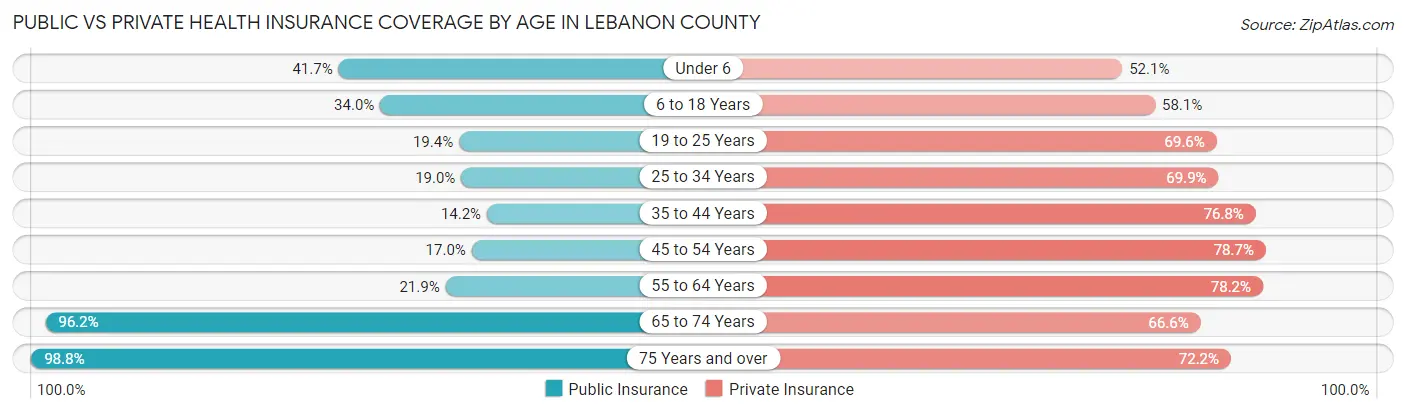
| Age Bracket | Public Insurance | Private Insurance |
| Under 6 | 4,077 (41.7%) | 5,084 (52.0%) |
| 6 to 18 Years | 8,302 (34.0%) | 14,198 (58.1%) |
| 19 to 25 Years | 2,392 (19.4%) | 8,588 (69.6%) |
| 25 to 34 Years | 2,703 (19.0%) | 9,966 (69.9%) |
| 35 to 44 Years | 2,397 (14.2%) | 12,982 (76.8%) |
| 45 to 54 Years | 2,934 (17.0%) | 13,566 (78.7%) |
| 55 to 64 Years | 4,181 (21.9%) | 14,934 (78.1%) |
| 65 to 74 Years | 15,051 (96.2%) | 10,423 (66.6%) |
| 75 Years and over | 11,403 (98.8%) | 8,337 (72.2%) |
| Total | 53,440 (37.8%) | 98,078 (69.4%) |
Disability Status by Sex by Age in Lebanon County
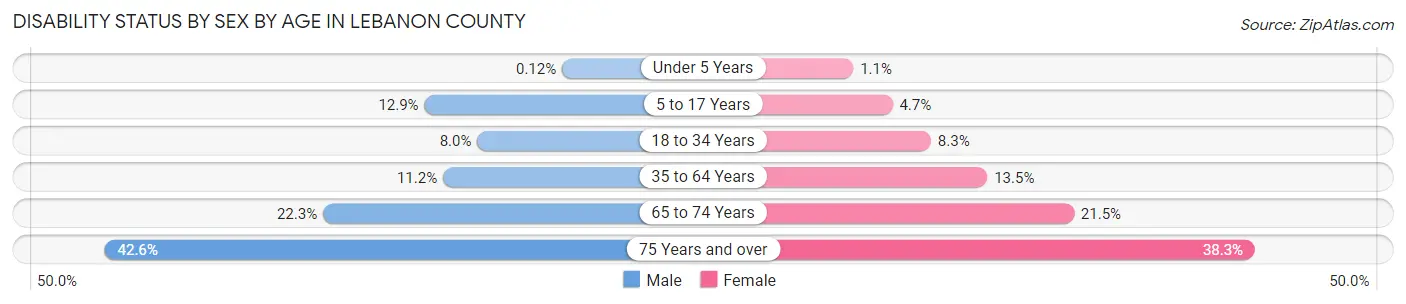
| Age Bracket | Male | Female |
| Under 5 Years | 5 (0.1%) | 42 (1.1%) |
| 5 to 17 Years | 1,588 (12.9%) | 559 (4.7%) |
| 18 to 34 Years | 1,152 (8.0%) | 1,157 (8.3%) |
| 35 to 64 Years | 2,967 (11.2%) | 3,602 (13.5%) |
| 65 to 74 Years | 1,670 (22.3%) | 1,759 (21.5%) |
| 75 Years and over | 2,023 (42.6%) | 2,605 (38.3%) |
Disability Class by Sex by Age in Lebanon County
Disability Class: Hearing Difficulty
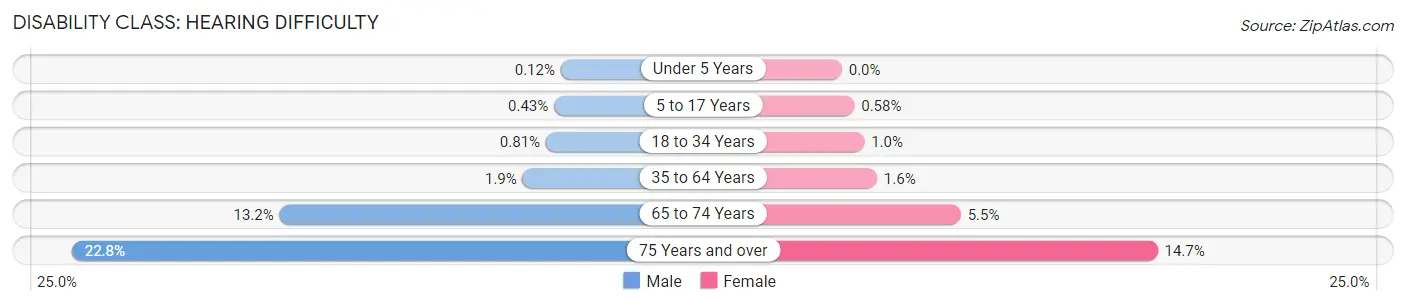
| Age Bracket | Male | Female |
| Under 5 Years | 5 (0.1%) | 0 (0.0%) |
| 5 to 17 Years | 53 (0.4%) | 69 (0.6%) |
| 18 to 34 Years | 117 (0.8%) | 146 (1.0%) |
| 35 to 64 Years | 503 (1.9%) | 436 (1.6%) |
| 65 to 74 Years | 986 (13.2%) | 451 (5.5%) |
| 75 Years and over | 1,084 (22.8%) | 995 (14.6%) |
Disability Class: Vision Difficulty
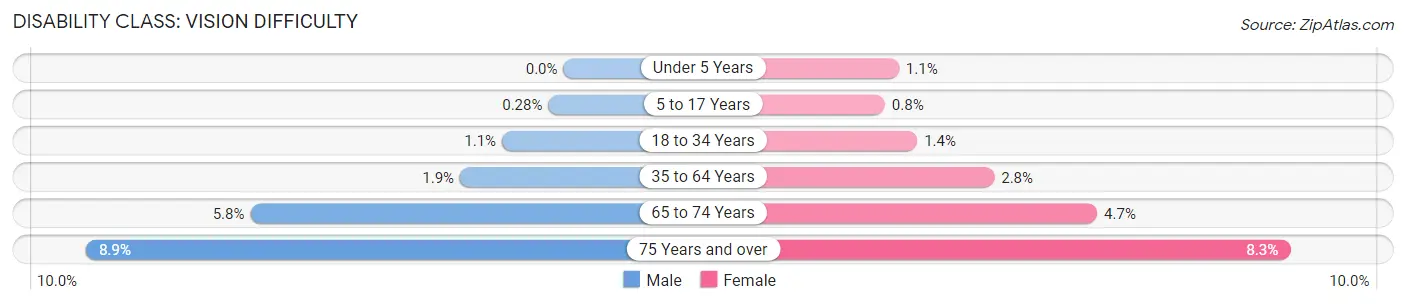
| Age Bracket | Male | Female |
| Under 5 Years | 0 (0.0%) | 42 (1.1%) |
| 5 to 17 Years | 34 (0.3%) | 95 (0.8%) |
| 18 to 34 Years | 165 (1.1%) | 196 (1.4%) |
| 35 to 64 Years | 509 (1.9%) | 754 (2.8%) |
| 65 to 74 Years | 435 (5.8%) | 387 (4.7%) |
| 75 Years and over | 421 (8.9%) | 565 (8.3%) |
Disability Class: Cognitive Difficulty
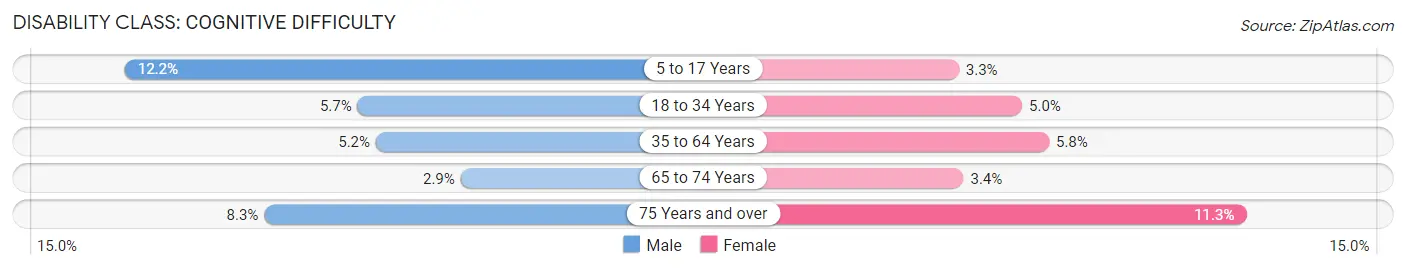
| Age Bracket | Male | Female |
| 5 to 17 Years | 1,504 (12.2%) | 388 (3.3%) |
| 18 to 34 Years | 826 (5.7%) | 703 (5.0%) |
| 35 to 64 Years | 1,386 (5.2%) | 1,540 (5.8%) |
| 65 to 74 Years | 214 (2.9%) | 277 (3.4%) |
| 75 Years and over | 396 (8.3%) | 765 (11.3%) |
Disability Class: Ambulatory Difficulty
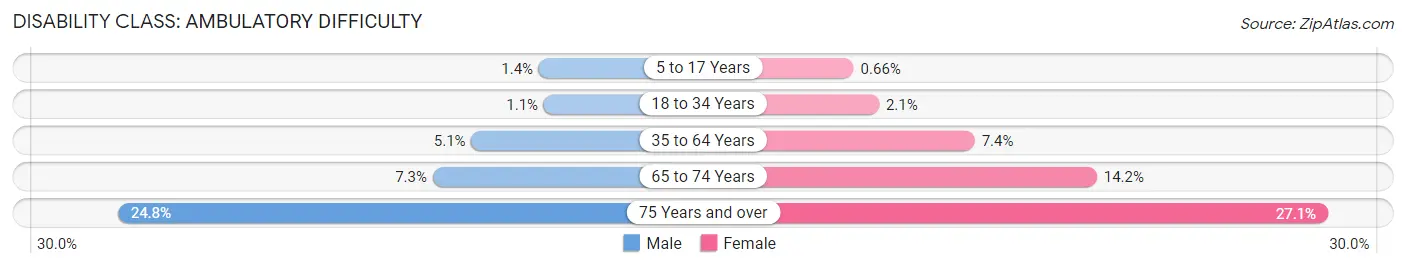
| Age Bracket | Male | Female |
| 5 to 17 Years | 168 (1.4%) | 78 (0.7%) |
| 18 to 34 Years | 156 (1.1%) | 290 (2.1%) |
| 35 to 64 Years | 1,359 (5.1%) | 1,975 (7.4%) |
| 65 to 74 Years | 544 (7.3%) | 1,160 (14.2%) |
| 75 Years and over | 1,179 (24.8%) | 1,839 (27.1%) |
Disability Class: Self-Care Difficulty
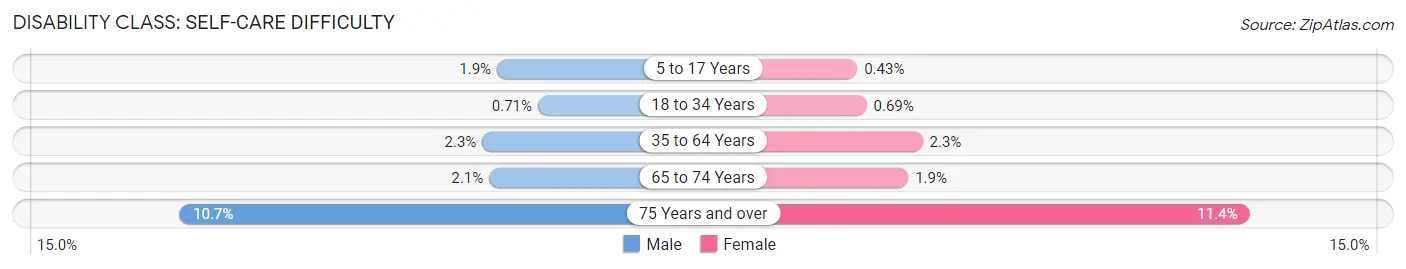
| Age Bracket | Male | Female |
| 5 to 17 Years | 228 (1.8%) | 51 (0.4%) |
| 18 to 34 Years | 102 (0.7%) | 97 (0.7%) |
| 35 to 64 Years | 601 (2.3%) | 601 (2.2%) |
| 65 to 74 Years | 155 (2.1%) | 151 (1.8%) |
| 75 Years and over | 507 (10.7%) | 771 (11.4%) |
Technology Access in Lebanon County
Computing Device Access in Lebanon County
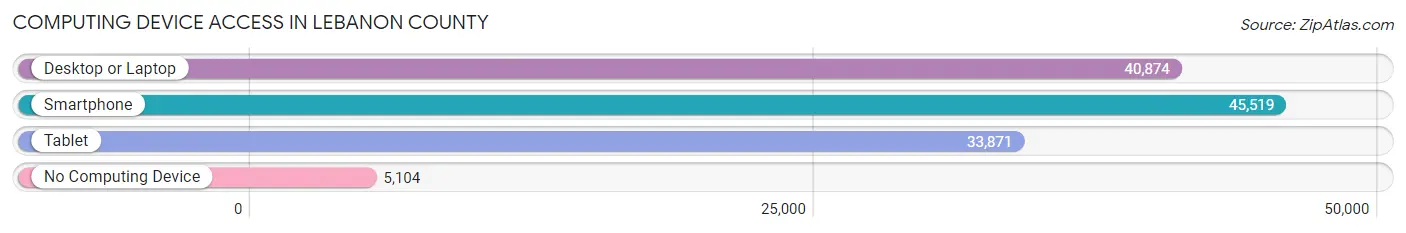
| Device Type | # Households | % Households |
| Desktop or Laptop | 40,874 | 74.0% |
| Smartphone | 45,519 | 82.4% |
| Tablet | 33,871 | 61.3% |
| No Computing Device | 5,104 | 9.2% |
| Total | 55,236 | 100.0% |
Internet Access in Lebanon County
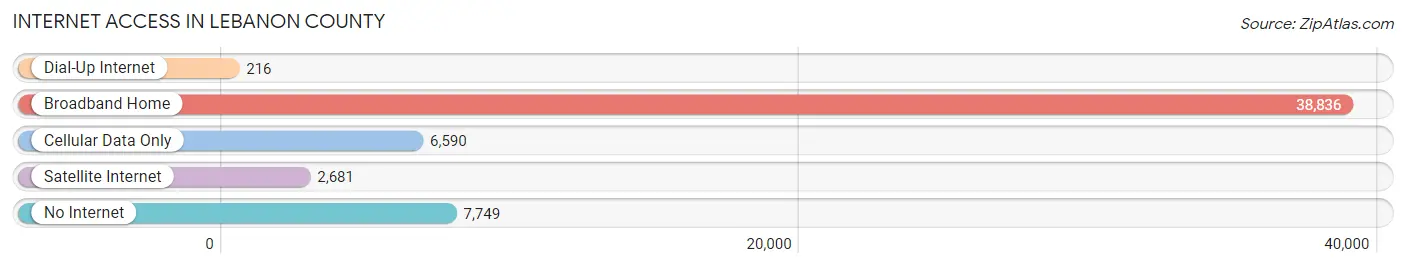
| Internet Type | # Households | % Households |
| Dial-Up Internet | 216 | 0.4% |
| Broadband Home | 38,836 | 70.3% |
| Cellular Data Only | 6,590 | 11.9% |
| Satellite Internet | 2,681 | 4.9% |
| No Internet | 7,749 | 14.0% |
| Total | 55,236 | 100.0% |
Lebanon County Summary
Lebanon County, Pennsylvania is located in the southeastern part of the state, and is part of the Harrisburg-Lebanon-Carlisle Metropolitan Statistical Area. It is bordered by Berks County to the north, Dauphin County to the east, Lancaster County to the west, and York County to the south. The county seat is Lebanon, and the county is home to a population of 133,568 as of the 2010 census.
History
Lebanon County was formed in 1813 from parts of Dauphin and Lancaster Counties. It was named after the Biblical city of Lebanon, which is mentioned in the Bible. The county was originally part of the William Penn Proprietary, and was settled by German immigrants in the early 1700s. The county was home to several Revolutionary War battles, including the Battle of Brandywine and the Battle of Germantown.
Geography
Lebanon County is located in the southeastern part of Pennsylvania, and is part of the Harrisburg-Lebanon-Carlisle Metropolitan Statistical Area. It is bordered by Berks County to the north, Dauphin County to the east, Lancaster County to the west, and York County to the south. The county has a total area of 362 square miles, of which 357 square miles is land and 5 square miles is water. The county is located in the Appalachian Mountains, and is home to several rivers, including the Swatara Creek, the Little Swatara Creek, and the Quittapahilla Creek.
Economy
Lebanon County has a diverse economy, with a mix of manufacturing, agriculture, and services. The county is home to several large employers, including Hershey Foods, Lebanon Valley College, and the Lebanon VA Medical Center. Agriculture is a major part of the county’s economy, with dairy farming, poultry farming, and fruit and vegetable production being the main agricultural activities. Manufacturing is also a major part of the economy, with companies such as Armstrong World Industries, Cargill, and Tyson Foods having a presence in the county.
Demographics
As of the 2010 census, Lebanon County had a population of 133,568. The racial makeup of the county was 90.3% White, 4.7% African American, 0.4% Native American, 1.2% Asian, 0.1% Pacific Islander, 1.7% from other races, and 1.6% from two or more races. Hispanic or Latino of any race were 4.2% of the population. The median income for a household in the county was $48,927, and the median income for a family was $58,927. The per capita income for the county was $22,945.
Lebanon County is home to a variety of religious denominations, with the largest being the Roman Catholic Church, followed by the United Methodist Church, the Church of the Brethren, and the Church of God. The county is also home to a variety of educational institutions, including Lebanon Valley College, Harrisburg Area Community College, and the Lebanon County Career and Technology Center.
Conclusion
Lebanon County, Pennsylvania is a diverse county located in the southeastern part of the state. It is home to a population of 133,568, and has a diverse economy that includes manufacturing, agriculture, and services. The county is home to several large employers, and is also home to a variety of religious denominations and educational institutions.
Common Questions
What is Per Capita Income in Lebanon County?
Per Capita income in Lebanon County is $35,604.
What is the Median Family Income in Lebanon County?
Median Family Income in Lebanon County is $88,582.
What is the Median Household income in Lebanon County?
Median Household Income in Lebanon County is $72,532.
What is Income or Wage Gap in Lebanon County?
Income or Wage Gap in Lebanon County is 36.6%.
Women in Lebanon County earn 63.4 cents for every dollar earned by a man.
What is Family Income Deficit in Lebanon County?
Family Income Deficit in Lebanon County is $10,506.
Families that are below poverty line in Lebanon County earn $10,506 less on average than the poverty threshold level.
What is Inequality or Gini Index in Lebanon County?
Inequality or Gini Index in Lebanon County is 0.42.
What is the Total Population of Lebanon County?
Total Population of Lebanon County is 143,258.
What is the Total Male Population of Lebanon County?
Total Male Population of Lebanon County is 70,793.
What is the Total Female Population of Lebanon County?
Total Female Population of Lebanon County is 72,465.
What is the Ratio of Males per 100 Females in Lebanon County?
There are 97.69 Males per 100 Females in Lebanon County.
What is the Ratio of Females per 100 Males in Lebanon County?
There are 102.36 Females per 100 Males in Lebanon County.
What is the Median Population Age in Lebanon County?
Median Population Age in Lebanon County is 41.3 Years.
What is the Average Family Size in Lebanon County
Average Family Size in Lebanon County is 3.0 People.
What is the Average Household Size in Lebanon County
Average Household Size in Lebanon County is 2.5 People.
How Large is the Labor Force in Lebanon County?
There are 72,006 People in the Labor Forcein in Lebanon County.
What is the Percentage of People in the Labor Force in Lebanon County?
63.0% of People are in the Labor Force in Lebanon County.
What is the Unemployment Rate in Lebanon County?
Unemployment Rate in Lebanon County is 4.4%.