Lancaster County, PA Map & Demographics
Lancaster County Overview
$39,872
PER CAPITA INCOME
$97,622
AVG FAMILY INCOME
$81,458
AVG HOUSEHOLD INCOME
38.4%
WAGE / INCOME GAP [ % ]
61.6¢/ $1
WAGE / INCOME GAP [ $ ]
$10,551
FAMILY INCOME DEFICIT
0.43
INEQUALITY / GINI INDEX
553,202
TOTAL POPULATION
272,524
MALE POPULATION
280,678
FEMALE POPULATION
97.09
MALES / 100 FEMALES
102.99
FEMALES / 100 MALES
39.0
MEDIAN AGE
3.1
AVG FAMILY SIZE
2.6
AVG HOUSEHOLD SIZE
289,739
LABOR FORCE [ PEOPLE ]
66.0%
PERCENT IN LABOR FORCE
3.4%
UNEMPLOYMENT RATE
Lancaster County Area Codes
Income in Lancaster County
Income Overview in Lancaster County
Per Capita Income in Lancaster County is $39,872, while median incomes of families and households are $97,622 and $81,458 respectively.
| Characteristic | Number | Measure |
| Per Capita Income | 553,202 | $39,872 |
| Median Family Income | 145,561 | $97,622 |
| Mean Family Income | 145,561 | $120,772 |
| Median Household Income | 208,988 | $81,458 |
| Mean Household Income | 208,988 | $104,217 |
| Income Deficit | 145,561 | $10,551 |
| Wage / Income Gap (%) | 553,202 | 38.37% |
| Wage / Income Gap ($) | 553,202 | 61.63¢ per $1 |
| Gini / Inequality Index | 553,202 | 0.43 |
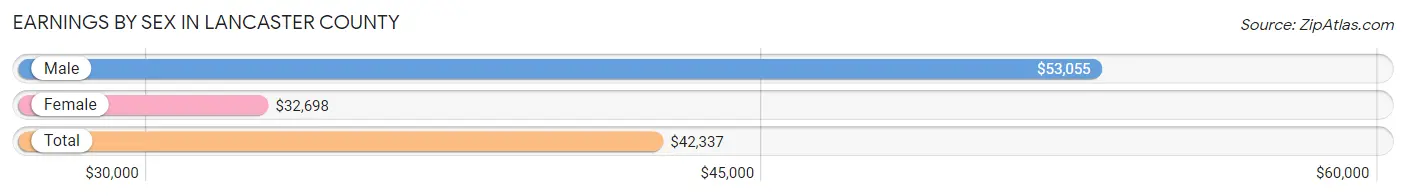
Earnings by Sex in Lancaster County
Average Earnings in Lancaster County are $42,337, $53,055 for men and $32,698 for women, a difference of 38.4%.
| Sex | Number | Average Earnings |
| Male | 164,261 (53.8%) | $53,055 |
| Female | 141,241 (46.2%) | $32,698 |
| Total | 305,502 (100.0%) | $42,337 |
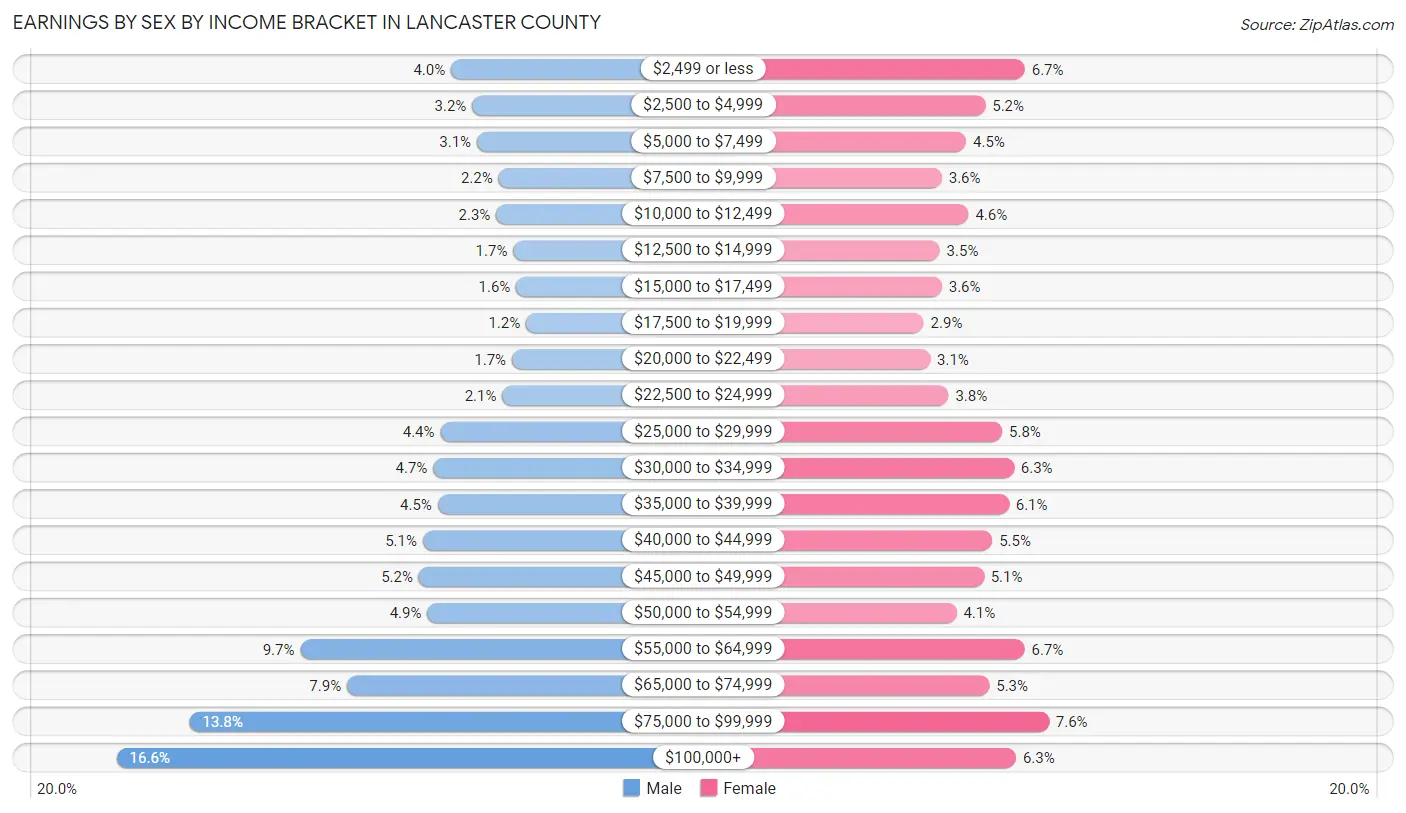
Earnings by Sex by Income Bracket in Lancaster County
The most common earnings brackets in Lancaster County are $100,000+ for men (27,190 | 16.6%) and $75,000 to $99,999 for women (10,686 | 7.6%).
| Income | Male | Female |
| $2,499 or less | 6,601 (4.0%) | 9,423 (6.7%) |
| $2,500 to $4,999 | 5,305 (3.2%) | 7,330 (5.2%) |
| $5,000 to $7,499 | 5,010 (3.0%) | 6,316 (4.5%) |
| $7,500 to $9,999 | 3,672 (2.2%) | 5,022 (3.6%) |
| $10,000 to $12,499 | 3,823 (2.3%) | 6,435 (4.6%) |
| $12,500 to $14,999 | 2,773 (1.7%) | 4,911 (3.5%) |
| $15,000 to $17,499 | 2,595 (1.6%) | 5,022 (3.6%) |
| $17,500 to $19,999 | 1,988 (1.2%) | 4,061 (2.9%) |
| $20,000 to $22,499 | 2,859 (1.7%) | 4,406 (3.1%) |
| $22,500 to $24,999 | 3,454 (2.1%) | 5,376 (3.8%) |
| $25,000 to $29,999 | 7,254 (4.4%) | 8,217 (5.8%) |
| $30,000 to $34,999 | 7,704 (4.7%) | 8,835 (6.3%) |
| $35,000 to $39,999 | 7,430 (4.5%) | 8,572 (6.1%) |
| $40,000 to $44,999 | 8,344 (5.1%) | 7,691 (5.4%) |
| $45,000 to $49,999 | 8,590 (5.2%) | 7,242 (5.1%) |
| $50,000 to $54,999 | 8,061 (4.9%) | 5,801 (4.1%) |
| $55,000 to $64,999 | 15,892 (9.7%) | 9,403 (6.7%) |
| $65,000 to $74,999 | 13,012 (7.9%) | 7,543 (5.3%) |
| $75,000 to $99,999 | 22,704 (13.8%) | 10,686 (7.6%) |
| $100,000+ | 27,190 (16.6%) | 8,949 (6.3%) |
| Total | 164,261 (100.0%) | 141,241 (100.0%) |
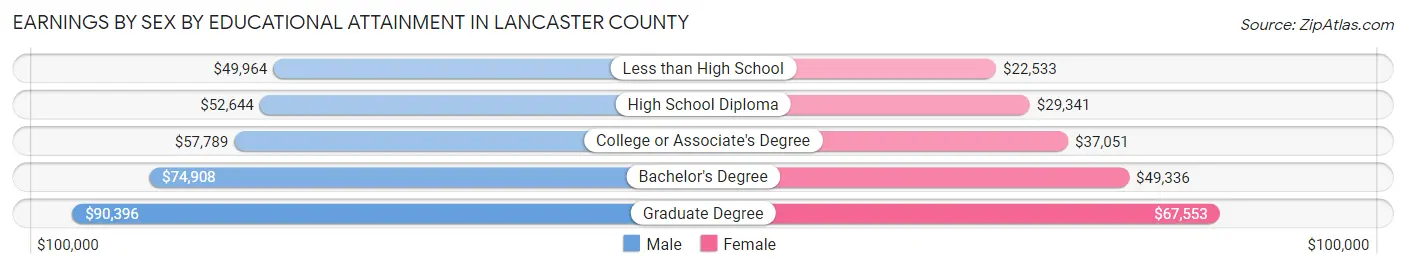
Earnings by Sex by Educational Attainment in Lancaster County
Average earnings in Lancaster County are $59,303 for men and $37,964 for women, a difference of 36.0%. Men with an educational attainment of graduate degree enjoy the highest average annual earnings of $90,396, while those with less than high school education earn the least with $49,964. Women with an educational attainment of graduate degree earn the most with the average annual earnings of $67,553, while those with less than high school education have the smallest earnings of $22,533.
| Educational Attainment | Male Income | Female Income |
| Less than High School | $49,964 | $22,533 |
| High School Diploma | $52,644 | $29,341 |
| College or Associate's Degree | $57,789 | $37,051 |
| Bachelor's Degree | $74,908 | $49,336 |
| Graduate Degree | $90,396 | $67,553 |
| Total | $59,303 | $37,964 |
Family Income in Lancaster County
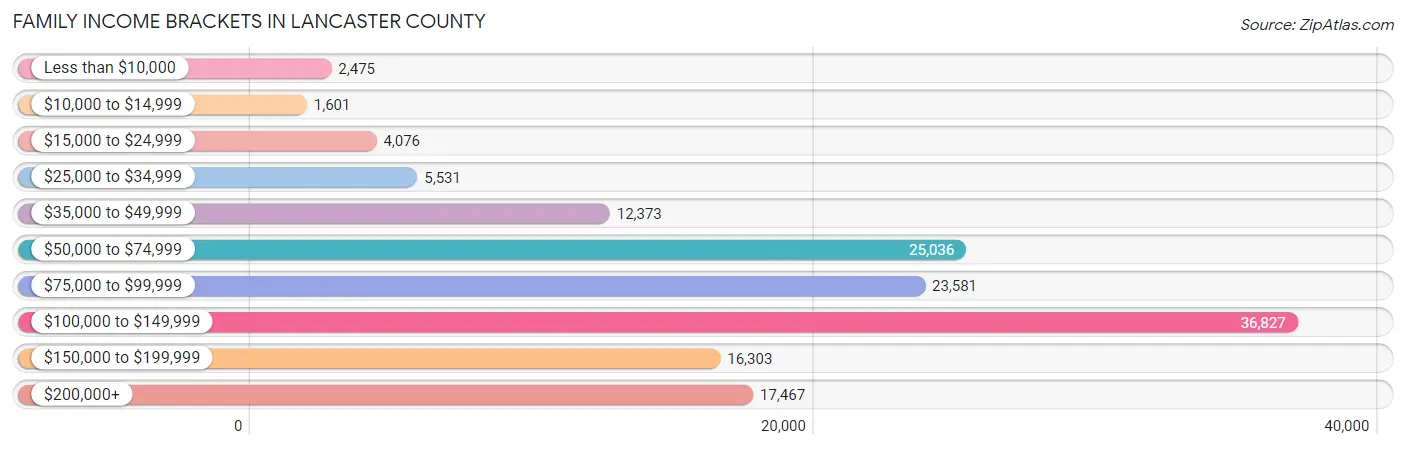
Family Income Brackets in Lancaster County
According to the Lancaster County family income data, there are 36,827 families falling into the $100,000 to $149,999 income range, which is the most common income bracket and makes up 25.3% of all families. Conversely, the $10,000 to $14,999 income bracket is the least frequent group with only 1,601 families (1.1%) belonging to this category.
| Income Bracket | # Families | % Families |
| Less than $10,000 | 2,475 | 1.7% |
| $10,000 to $14,999 | 1,601 | 1.1% |
| $15,000 to $24,999 | 4,076 | 2.8% |
| $25,000 to $34,999 | 5,531 | 3.8% |
| $35,000 to $49,999 | 12,373 | 8.5% |
| $50,000 to $74,999 | 25,036 | 17.2% |
| $75,000 to $99,999 | 23,581 | 16.2% |
| $100,000 to $149,999 | 36,827 | 25.3% |
| $150,000 to $199,999 | 16,303 | 11.2% |
| $200,000+ | 17,467 | 12.0% |
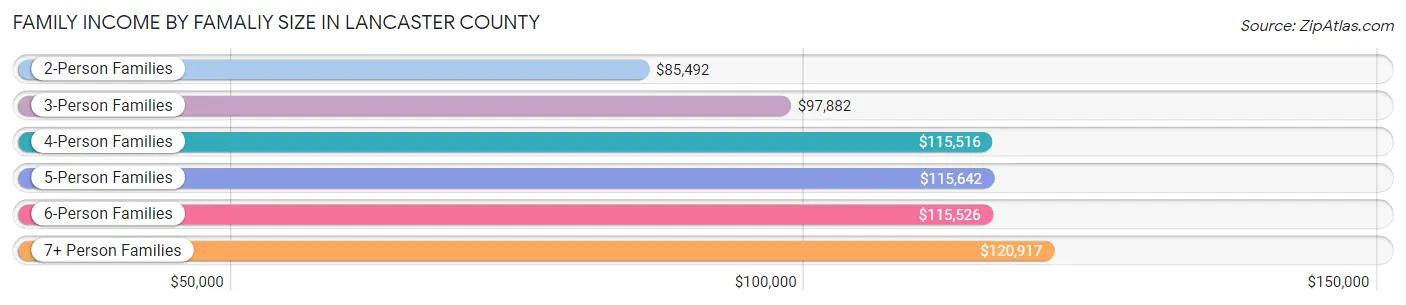
Family Income by Famaliy Size in Lancaster County
7+ person families (4,413 | 3.0%) account for the highest median family income in Lancaster County with $120,917 per family, while 2-person families (71,229 | 48.9%) have the highest median income of $42,746 per family member.
| Income Bracket | # Families | Median Income |
| 2-Person Families | 71,229 (48.9%) | $85,492 |
| 3-Person Families | 29,358 (20.2%) | $97,882 |
| 4-Person Families | 23,429 (16.1%) | $115,516 |
| 5-Person Families | 12,042 (8.3%) | $115,642 |
| 6-Person Families | 5,090 (3.5%) | $115,526 |
| 7+ Person Families | 4,413 (3.0%) | $120,917 |
| Total | 145,561 (100.0%) | $97,622 |
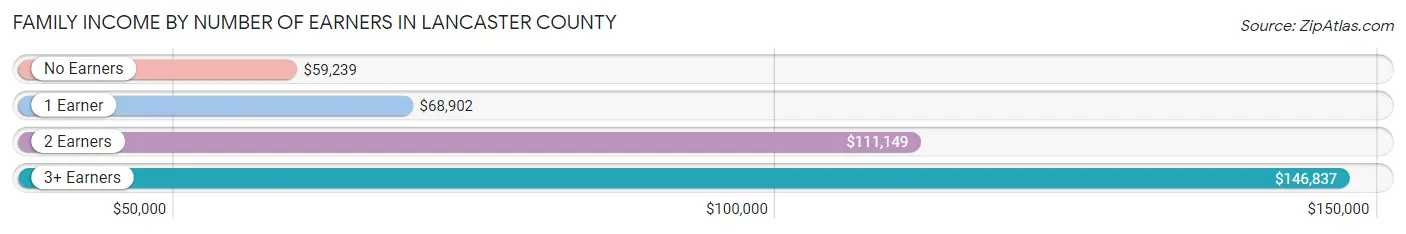
Family Income by Number of Earners in Lancaster County
The median family income in Lancaster County is $97,622, with families comprising 3+ earners (21,207) having the highest median family income of $146,837, while families with no earners (19,341) have the lowest median family income of $59,239, accounting for 14.6% and 13.3% of families, respectively.
| Number of Earners | # Families | Median Income |
| No Earners | 19,341 (13.3%) | $59,239 |
| 1 Earner | 40,464 (27.8%) | $68,902 |
| 2 Earners | 64,549 (44.3%) | $111,149 |
| 3+ Earners | 21,207 (14.6%) | $146,837 |
| Total | 145,561 (100.0%) | $97,622 |
Household Income in Lancaster County
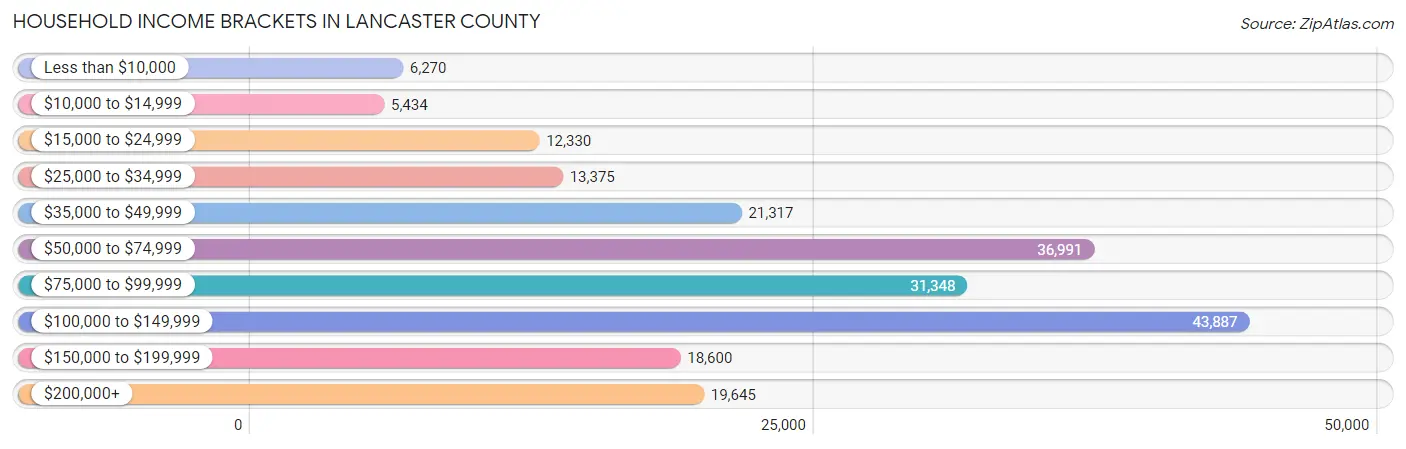
Household Income Brackets in Lancaster County
With 43,887 households falling in the category, the $100,000 to $149,999 income range is the most frequent in Lancaster County, accounting for 21.0% of all households. In contrast, only 5,434 households (2.6%) fall into the $10,000 to $14,999 income bracket, making it the least populous group.
| Income Bracket | # Households | % Households |
| Less than $10,000 | 6,270 | 3.0% |
| $10,000 to $14,999 | 5,434 | 2.6% |
| $15,000 to $24,999 | 12,330 | 5.9% |
| $25,000 to $34,999 | 13,375 | 6.4% |
| $35,000 to $49,999 | 21,317 | 10.2% |
| $50,000 to $74,999 | 36,991 | 17.7% |
| $75,000 to $99,999 | 31,348 | 15.0% |
| $100,000 to $149,999 | 43,887 | 21.0% |
| $150,000 to $199,999 | 18,600 | 8.9% |
| $200,000+ | 19,645 | 9.4% |
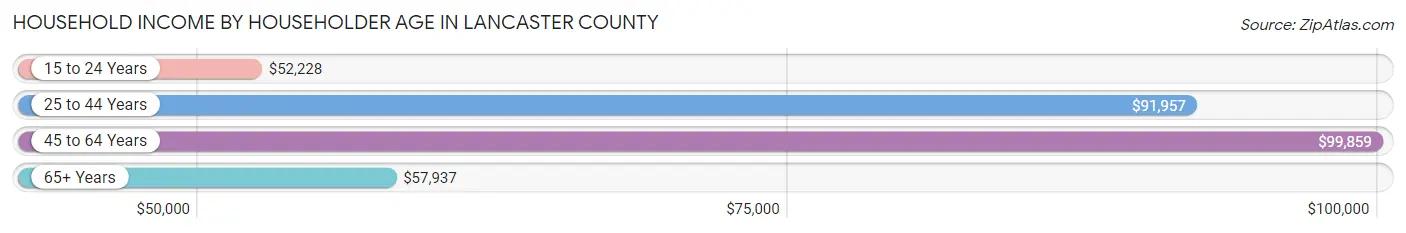
Household Income by Householder Age in Lancaster County
The median household income in Lancaster County is $81,458, with the highest median household income of $99,859 found in the 45 to 64 years age bracket for the primary householder. A total of 73,862 households (35.3%) fall into this category. Meanwhile, the 15 to 24 years age bracket for the primary householder has the lowest median household income of $52,228, with 7,563 households (3.6%) in this group.
| Income Bracket | # Households | Median Income |
| 15 to 24 Years | 7,563 (3.6%) | $52,228 |
| 25 to 44 Years | 65,084 (31.1%) | $91,957 |
| 45 to 64 Years | 73,862 (35.3%) | $99,859 |
| 65+ Years | 62,479 (29.9%) | $57,937 |
| Total | 208,988 (100.0%) | $81,458 |
Poverty in Lancaster County
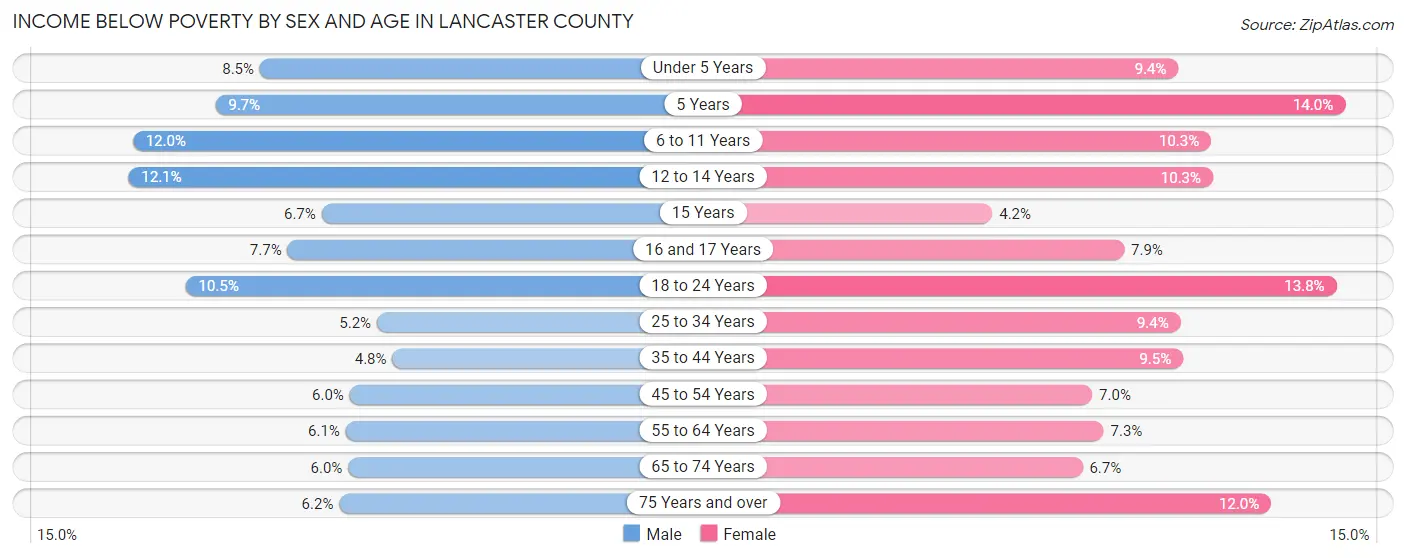
Income Below Poverty by Sex and Age in Lancaster County
With 7.1% poverty level for males and 9.2% for females among the residents of Lancaster County, 12 to 14 year old males and 5 year old females are the most vulnerable to poverty, with 1,334 males (12.1%) and 425 females (14.0%) in their respective age groups living below the poverty level.
| Age Bracket | Male | Female |
| Under 5 Years | 1,491 (8.5%) | 1,552 (9.4%) |
| 5 Years | 359 (9.7%) | 425 (14.0%) |
| 6 to 11 Years | 2,604 (12.0%) | 2,164 (10.3%) |
| 12 to 14 Years | 1,334 (12.1%) | 1,079 (10.3%) |
| 15 Years | 284 (6.7%) | 149 (4.2%) |
| 16 and 17 Years | 534 (7.7%) | 558 (7.9%) |
| 18 to 24 Years | 2,336 (10.5%) | 2,977 (13.8%) |
| 25 to 34 Years | 1,851 (5.2%) | 3,369 (9.4%) |
| 35 to 44 Years | 1,537 (4.8%) | 3,043 (9.5%) |
| 45 to 54 Years | 1,874 (5.9%) | 2,191 (7.0%) |
| 55 to 64 Years | 2,114 (6.1%) | 2,648 (7.3%) |
| 65 to 74 Years | 1,596 (6.0%) | 1,969 (6.7%) |
| 75 Years and over | 1,132 (6.2%) | 3,025 (11.9%) |
| Total | 19,046 (7.1%) | 25,149 (9.2%) |
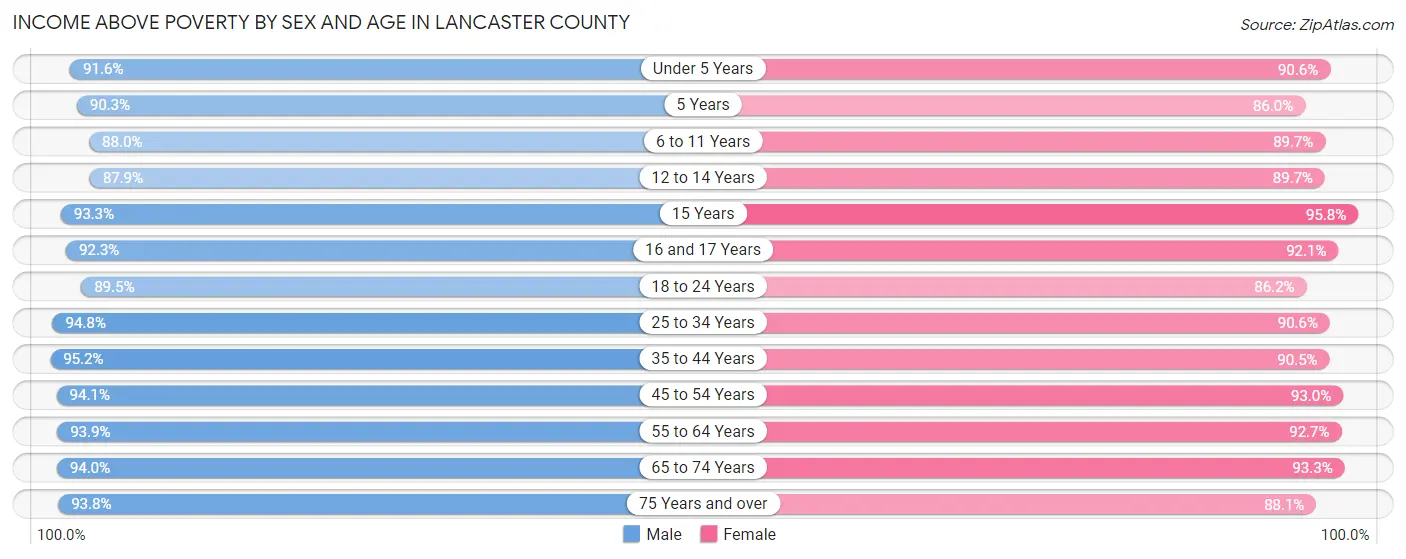
Income Above Poverty by Sex and Age in Lancaster County
According to the poverty statistics in Lancaster County, males aged 35 to 44 years and females aged 15 years are the age groups that are most secure financially, with 95.2% of males and 95.8% of females in these age groups living above the poverty line.
| Age Bracket | Male | Female |
| Under 5 Years | 16,151 (91.5%) | 15,018 (90.6%) |
| 5 Years | 3,346 (90.3%) | 2,608 (86.0%) |
| 6 to 11 Years | 19,118 (88.0%) | 18,877 (89.7%) |
| 12 to 14 Years | 9,682 (87.9%) | 9,362 (89.7%) |
| 15 Years | 3,937 (93.3%) | 3,409 (95.8%) |
| 16 and 17 Years | 6,418 (92.3%) | 6,541 (92.1%) |
| 18 to 24 Years | 19,859 (89.5%) | 18,641 (86.2%) |
| 25 to 34 Years | 33,802 (94.8%) | 32,347 (90.6%) |
| 35 to 44 Years | 30,729 (95.2%) | 28,974 (90.5%) |
| 45 to 54 Years | 29,624 (94.1%) | 29,224 (93.0%) |
| 55 to 64 Years | 32,791 (93.9%) | 33,657 (92.7%) |
| 65 to 74 Years | 25,057 (94.0%) | 27,398 (93.3%) |
| 75 Years and over | 17,009 (93.8%) | 22,288 (88.0%) |
| Total | 247,523 (92.9%) | 248,344 (90.8%) |
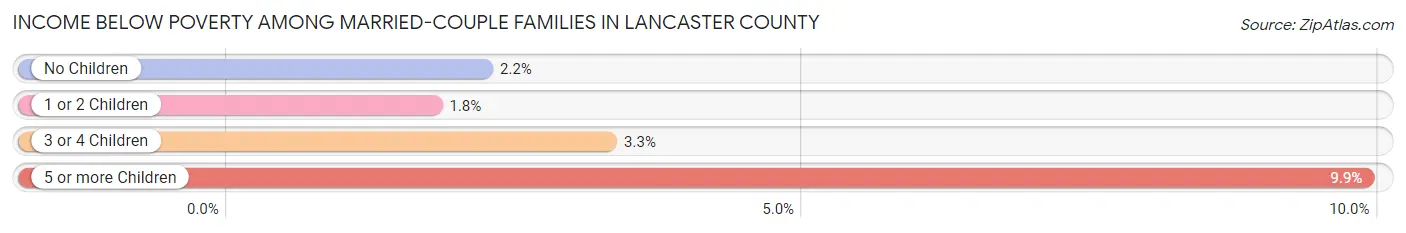
Income Below Poverty Among Married-Couple Families in Lancaster County
The poverty statistics for married-couple families in Lancaster County show that 2.4% or 2,818 of the total 118,944 families live below the poverty line. Families with 5 or more children have the highest poverty rate of 9.9%, comprising of 253 families. On the other hand, families with 1 or 2 children have the lowest poverty rate of 1.8%, which includes 590 families.
| Children | Above Poverty | Below Poverty |
| No Children | 70,310 (97.8%) | 1,599 (2.2%) |
| 1 or 2 Children | 32,488 (98.2%) | 590 (1.8%) |
| 3 or 4 Children | 11,024 (96.7%) | 376 (3.3%) |
| 5 or more Children | 2,304 (90.1%) | 253 (9.9%) |
| Total | 116,126 (97.6%) | 2,818 (2.4%) |
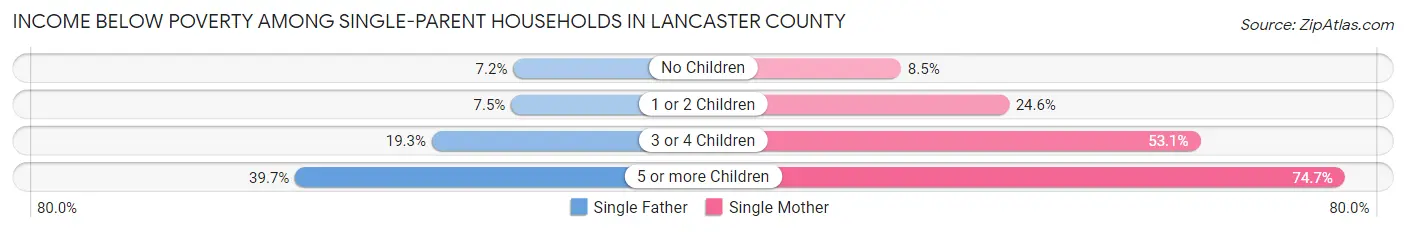
Income Below Poverty Among Single-Parent Households in Lancaster County
According to the poverty data in Lancaster County, 8.4% or 686 single-father households and 21.0% or 3,859 single-mother households are living below the poverty line. Among single-father households, those with 5 or more children have the highest poverty rate, with 25 households (39.7%) experiencing poverty. Likewise, among single-mother households, those with 5 or more children have the highest poverty rate, with 159 households (74.7%) falling below the poverty line.
| Children | Single Father | Single Mother |
| No Children | 300 (7.2%) | 667 (8.5%) |
| 1 or 2 Children | 258 (7.5%) | 2,134 (24.6%) |
| 3 or 4 Children | 103 (19.3%) | 899 (53.1%) |
| 5 or more Children | 25 (39.7%) | 159 (74.7%) |
| Total | 686 (8.4%) | 3,859 (21.0%) |
Income Below Poverty Among Married-Couple vs Single-Parent Households in Lancaster County
The poverty data for Lancaster County shows that 2,818 of the married-couple family households (2.4%) and 4,545 of the single-parent households (17.1%) are living below the poverty level. Within the married-couple family households, those with 5 or more children have the highest poverty rate, with 253 households (9.9%) falling below the poverty line. Among the single-parent households, those with 5 or more children have the highest poverty rate, with 184 household (66.7%) living below poverty.
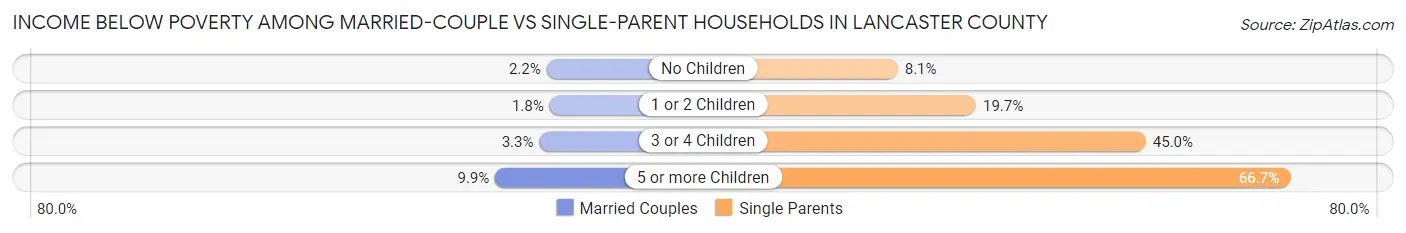
| Children | Married-Couple Families | Single-Parent Households |
| No Children | 1,599 (2.2%) | 967 (8.1%) |
| 1 or 2 Children | 590 (1.8%) | 2,392 (19.7%) |
| 3 or 4 Children | 376 (3.3%) | 1,002 (45.0%) |
| 5 or more Children | 253 (9.9%) | 184 (66.7%) |
| Total | 2,818 (2.4%) | 4,545 (17.1%) |
Race in Lancaster County
The most populous races in Lancaster County are White / Caucasian (466,989 | 84.4%), Hispanic or Latino (62,108 | 11.2%), and Two or more Races (29,631 | 5.4%).
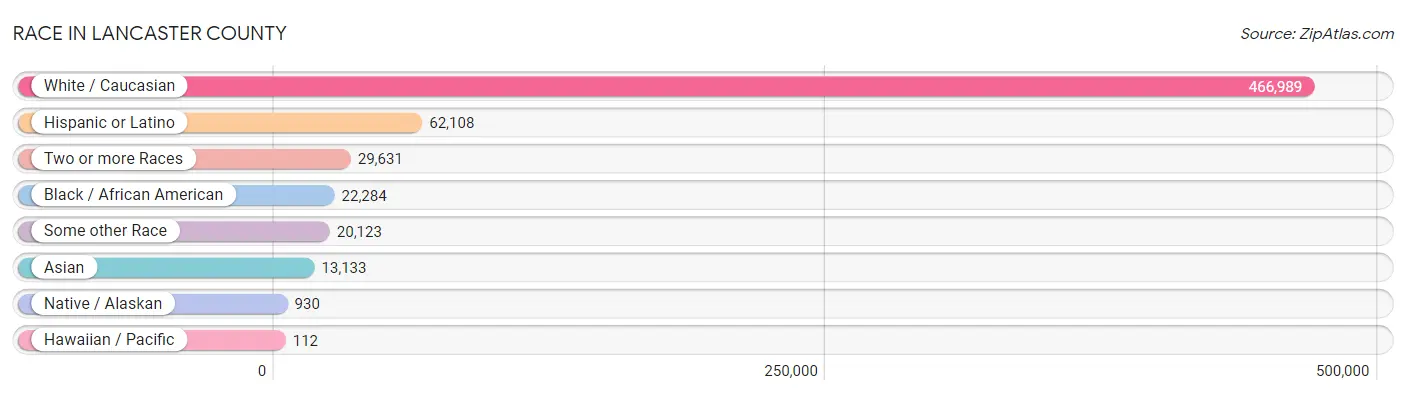
| Race | # Population | % Population |
| Asian | 13,133 | 2.4% |
| Black / African American | 22,284 | 4.0% |
| Hawaiian / Pacific | 112 | 0.0% |
| Hispanic or Latino | 62,108 | 11.2% |
| Native / Alaskan | 930 | 0.2% |
| White / Caucasian | 466,989 | 84.4% |
| Two or more Races | 29,631 | 5.4% |
| Some other Race | 20,123 | 3.6% |
| Total | 553,202 | 100.0% |
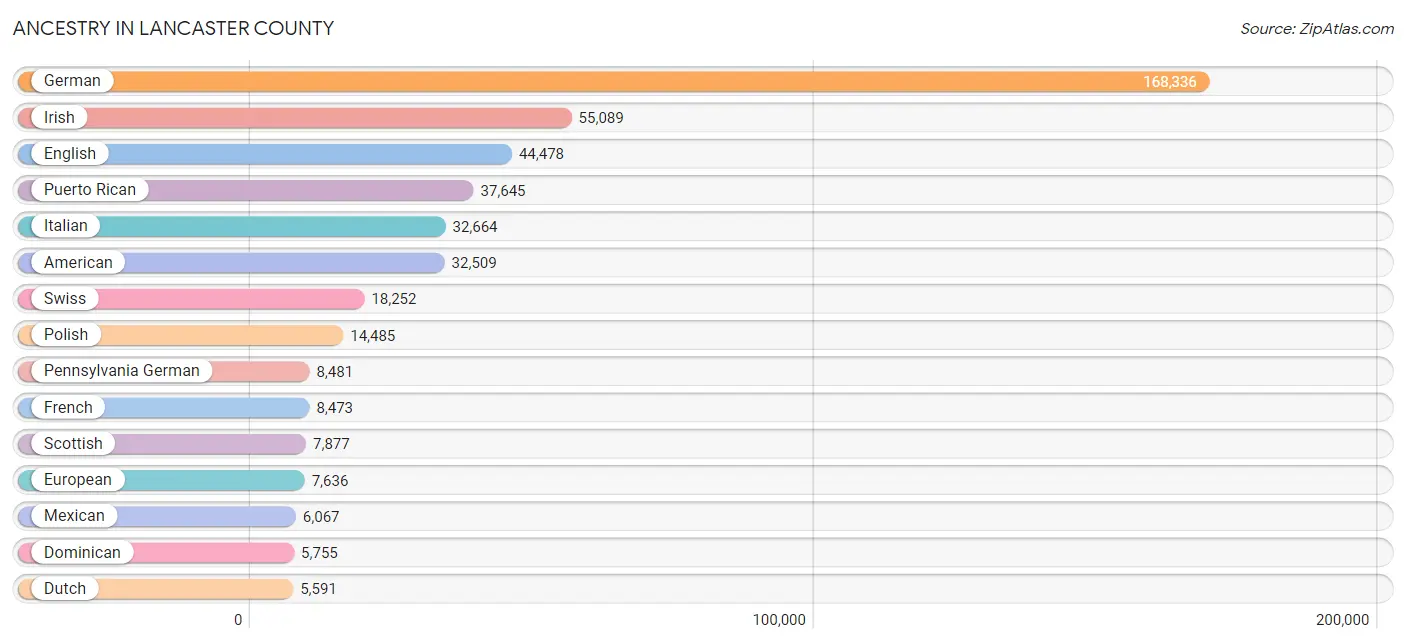
Ancestry in Lancaster County
The most populous ancestries reported in Lancaster County are German (168,336 | 30.4%), Irish (55,089 | 10.0%), English (44,478 | 8.0%), Puerto Rican (37,645 | 6.8%), and Italian (32,664 | 5.9%), together accounting for 61.1% of all Lancaster County residents.
| Ancestry | # Population | % Population |
| African | 1,876 | 0.3% |
| Albanian | 17 | 0.0% |
| Alsatian | 7 | 0.0% |
| American | 32,509 | 5.9% |
| Apache | 108 | 0.0% |
| Arab | 1,392 | 0.3% |
| Argentinean | 241 | 0.0% |
| Armenian | 171 | 0.0% |
| Assyrian / Chaldean / Syriac | 24 | 0.0% |
| Australian | 78 | 0.0% |
| Austrian | 995 | 0.2% |
| Bahamian | 2 | 0.0% |
| Bangladeshi | 674 | 0.1% |
| Barbadian | 55 | 0.0% |
| Belgian | 309 | 0.1% |
| Belizean | 90 | 0.0% |
| Bhutanese | 667 | 0.1% |
| Blackfeet | 244 | 0.0% |
| Bolivian | 93 | 0.0% |
| Brazilian | 134 | 0.0% |
| British | 3,207 | 0.6% |
| British West Indian | 15 | 0.0% |
| Bulgarian | 63 | 0.0% |
| Burmese | 1,283 | 0.2% |
| Cajun | 16 | 0.0% |
| Cambodian | 10 | 0.0% |
| Canadian | 629 | 0.1% |
| Carpatho Rusyn | 48 | 0.0% |
| Celtic | 70 | 0.0% |
| Central American | 2,591 | 0.5% |
| Central American Indian | 866 | 0.2% |
| Cherokee | 708 | 0.1% |
| Cheyenne | 8 | 0.0% |
| Chickasaw | 4 | 0.0% |
| Chilean | 137 | 0.0% |
| Chippewa | 99 | 0.0% |
| Choctaw | 54 | 0.0% |
| Colombian | 1,704 | 0.3% |
| Costa Rican | 50 | 0.0% |
| Creek | 2 | 0.0% |
| Croatian | 684 | 0.1% |
| Cuban | 2,712 | 0.5% |
| Czech | 921 | 0.2% |
| Czechoslovakian | 484 | 0.1% |
| Danish | 408 | 0.1% |
| Delaware | 26 | 0.0% |
| Dominican | 5,755 | 1.0% |
| Dutch | 5,591 | 1.0% |
| Dutch West Indian | 4 | 0.0% |
| Eastern European | 1,361 | 0.3% |
| Ecuadorian | 577 | 0.1% |
| Egyptian | 249 | 0.1% |
| English | 44,478 | 8.0% |
| Estonian | 73 | 0.0% |
| Ethiopian | 1,464 | 0.3% |
| European | 7,636 | 1.4% |
| Filipino | 72 | 0.0% |
| Finnish | 261 | 0.1% |
| French | 8,473 | 1.5% |
| French American Indian | 21 | 0.0% |
| French Canadian | 1,055 | 0.2% |
| German | 168,336 | 30.4% |
| Greek | 2,753 | 0.5% |
| Guamanian / Chamorro | 21 | 0.0% |
| Guatemalan | 1,002 | 0.2% |
| Guyanese | 43 | 0.0% |
| Haitian | 620 | 0.1% |
| Honduran | 519 | 0.1% |
| Hungarian | 1,985 | 0.4% |
| Icelander | 153 | 0.0% |
| Indian (Asian) | 3,047 | 0.5% |
| Indonesian | 365 | 0.1% |
| Inupiat | 60 | 0.0% |
| Iranian | 119 | 0.0% |
| Iraqi | 130 | 0.0% |
| Irish | 55,089 | 10.0% |
| Iroquois | 44 | 0.0% |
| Israeli | 73 | 0.0% |
| Italian | 32,664 | 5.9% |
| Jamaican | 678 | 0.1% |
| Japanese | 880 | 0.2% |
| Jordanian | 20 | 0.0% |
| Kenyan | 134 | 0.0% |
| Korean | 1,719 | 0.3% |
| Laotian | 83 | 0.0% |
| Latvian | 344 | 0.1% |
| Lebanese | 493 | 0.1% |
| Liberian | 105 | 0.0% |
| Lithuanian | 1,562 | 0.3% |
| Lumbee | 6 | 0.0% |
| Luxembourger | 35 | 0.0% |
| Macedonian | 54 | 0.0% |
| Malaysian | 489 | 0.1% |
| Mexican | 6,067 | 1.1% |
| Mexican American Indian | 237 | 0.0% |
| Moroccan | 46 | 0.0% |
| Native Hawaiian | 252 | 0.1% |
| Navajo | 108 | 0.0% |
| Nicaraguan | 200 | 0.0% |
| Nigerian | 199 | 0.0% |
| Northern European | 541 | 0.1% |
| Norwegian | 2,186 | 0.4% |
| Ottawa | 63 | 0.0% |
| Pakistani | 124 | 0.0% |
| Palestinian | 204 | 0.0% |
| Panamanian | 324 | 0.1% |
| Pennsylvania German | 8,481 | 1.5% |
| Peruvian | 1,210 | 0.2% |
| Polish | 14,485 | 2.6% |
| Portuguese | 852 | 0.2% |
| Puerto Rican | 37,645 | 6.8% |
| Romanian | 792 | 0.1% |
| Russian | 3,317 | 0.6% |
| Salvadoran | 496 | 0.1% |
| Samoan | 123 | 0.0% |
| Scandinavian | 874 | 0.2% |
| Scotch-Irish | 4,905 | 0.9% |
| Scottish | 7,877 | 1.4% |
| Seminole | 4 | 0.0% |
| Serbian | 437 | 0.1% |
| Shoshone | 15 | 0.0% |
| Sioux | 36 | 0.0% |
| Slavic | 167 | 0.0% |
| Slovak | 1,596 | 0.3% |
| Slovene | 275 | 0.1% |
| South African | 34 | 0.0% |
| South American | 4,378 | 0.8% |
| South American Indian | 183 | 0.0% |
| Spaniard | 648 | 0.1% |
| Spanish | 623 | 0.1% |
| Sri Lankan | 3,789 | 0.7% |
| Subsaharan African | 4,386 | 0.8% |
| Sudanese | 22 | 0.0% |
| Swedish | 4,174 | 0.7% |
| Swiss | 18,252 | 3.3% |
| Syrian | 100 | 0.0% |
| Thai | 2,243 | 0.4% |
| Tongan | 24 | 0.0% |
| Trinidadian and Tobagonian | 108 | 0.0% |
| Turkish | 117 | 0.0% |
| Ukrainian | 2,513 | 0.4% |
| Uruguayan | 308 | 0.1% |
| Venezuelan | 108 | 0.0% |
| Welsh | 4,736 | 0.9% |
| West Indian | 64 | 0.0% |
| Yugoslavian | 347 | 0.1% | View All 146 Rows |
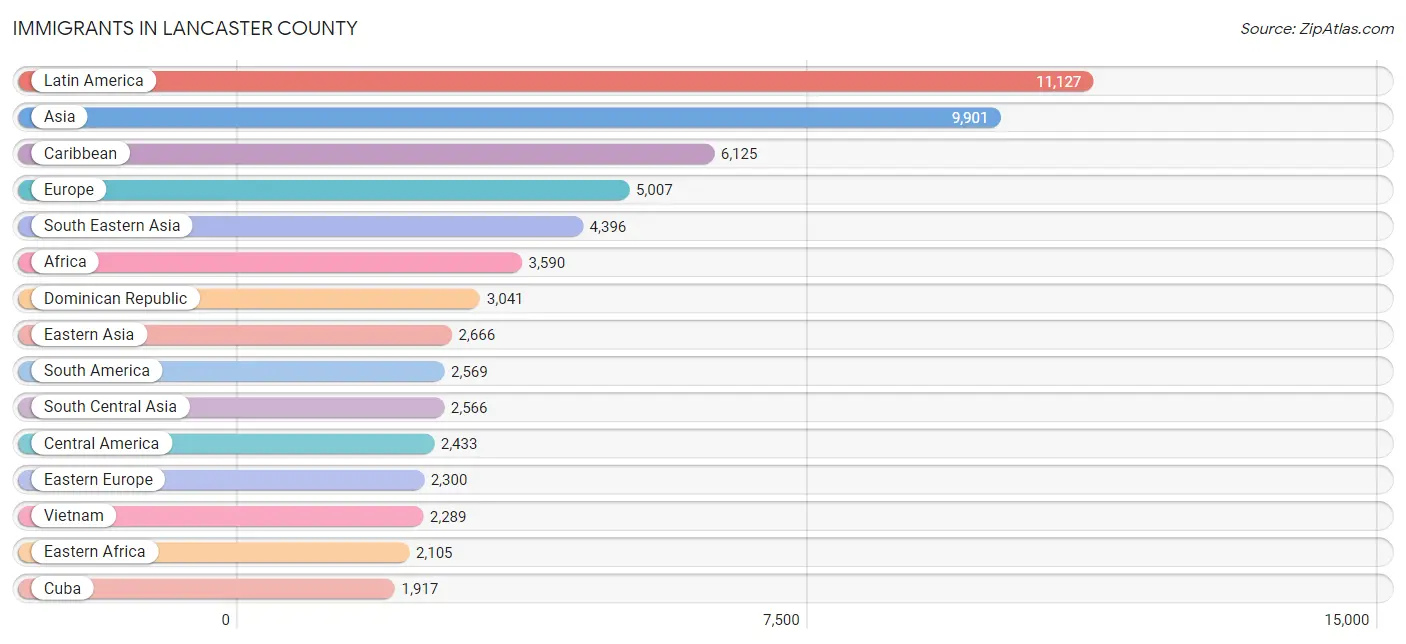
Immigrants in Lancaster County
The most numerous immigrant groups reported in Lancaster County came from Latin America (11,127 | 2.0%), Asia (9,901 | 1.8%), Caribbean (6,125 | 1.1%), Europe (5,007 | 0.9%), and South Eastern Asia (4,396 | 0.8%), together accounting for 6.6% of all Lancaster County residents.
| Immigration Origin | # Population | % Population |
| Afghanistan | 10 | 0.0% |
| Africa | 3,590 | 0.6% |
| Argentina | 169 | 0.0% |
| Armenia | 25 | 0.0% |
| Asia | 9,901 | 1.8% |
| Australia | 73 | 0.0% |
| Austria | 56 | 0.0% |
| Azores | 130 | 0.0% |
| Bahamas | 2 | 0.0% |
| Barbados | 30 | 0.0% |
| Belarus | 100 | 0.0% |
| Belgium | 24 | 0.0% |
| Belize | 23 | 0.0% |
| Bolivia | 64 | 0.0% |
| Bosnia and Herzegovina | 150 | 0.0% |
| Brazil | 152 | 0.0% |
| Bulgaria | 33 | 0.0% |
| Cambodia | 280 | 0.1% |
| Cameroon | 5 | 0.0% |
| Canada | 668 | 0.1% |
| Caribbean | 6,125 | 1.1% |
| Central America | 2,433 | 0.4% |
| Chile | 77 | 0.0% |
| China | 1,567 | 0.3% |
| Colombia | 896 | 0.2% |
| Congo | 453 | 0.1% |
| Costa Rica | 22 | 0.0% |
| Cuba | 1,917 | 0.4% |
| Czechoslovakia | 44 | 0.0% |
| Denmark | 20 | 0.0% |
| Dominican Republic | 3,041 | 0.5% |
| Eastern Africa | 2,105 | 0.4% |
| Eastern Asia | 2,666 | 0.5% |
| Eastern Europe | 2,300 | 0.4% |
| Ecuador | 151 | 0.0% |
| Egypt | 308 | 0.1% |
| El Salvador | 90 | 0.0% |
| England | 303 | 0.1% |
| Eritrea | 70 | 0.0% |
| Ethiopia | 1,240 | 0.2% |
| Europe | 5,007 | 0.9% |
| France | 197 | 0.0% |
| Germany | 423 | 0.1% |
| Ghana | 53 | 0.0% |
| Greece | 351 | 0.1% |
| Guatemala | 461 | 0.1% |
| Guyana | 67 | 0.0% |
| Haiti | 699 | 0.1% |
| Honduras | 327 | 0.1% |
| Hong Kong | 33 | 0.0% |
| Hungary | 70 | 0.0% |
| India | 1,165 | 0.2% |
| Indonesia | 51 | 0.0% |
| Iran | 61 | 0.0% |
| Iraq | 62 | 0.0% |
| Ireland | 125 | 0.0% |
| Israel | 77 | 0.0% |
| Italy | 538 | 0.1% |
| Jamaica | 221 | 0.0% |
| Japan | 413 | 0.1% |
| Jordan | 8 | 0.0% |
| Kenya | 339 | 0.1% |
| Korea | 686 | 0.1% |
| Laos | 330 | 0.1% |
| Latin America | 11,127 | 2.0% |
| Latvia | 10 | 0.0% |
| Liberia | 96 | 0.0% |
| Lithuania | 10 | 0.0% |
| Malaysia | 15 | 0.0% |
| Mexico | 1,452 | 0.3% |
| Middle Africa | 671 | 0.1% |
| Moldova | 17 | 0.0% |
| Morocco | 17 | 0.0% |
| Nepal | 493 | 0.1% |
| Netherlands | 11 | 0.0% |
| Nicaragua | 26 | 0.0% |
| Nigeria | 59 | 0.0% |
| Northern Africa | 431 | 0.1% |
| Northern Europe | 937 | 0.2% |
| Norway | 51 | 0.0% |
| Oceania | 115 | 0.0% |
| Pakistan | 176 | 0.0% |
| Panama | 32 | 0.0% |
| Peru | 730 | 0.1% |
| Philippines | 953 | 0.2% |
| Poland | 141 | 0.0% |
| Portugal | 130 | 0.0% |
| Romania | 354 | 0.1% |
| Russia | 609 | 0.1% |
| Saudi Arabia | 24 | 0.0% |
| Scotland | 45 | 0.0% |
| Somalia | 31 | 0.0% |
| South Africa | 91 | 0.0% |
| South America | 2,569 | 0.5% |
| South Central Asia | 2,566 | 0.5% |
| South Eastern Asia | 4,396 | 0.8% |
| Southern Europe | 1,037 | 0.2% |
| Spain | 18 | 0.0% |
| St. Vincent and the Grenadines | 125 | 0.0% |
| Sudan | 86 | 0.0% |
| Sweden | 35 | 0.0% |
| Switzerland | 22 | 0.0% |
| Syria | 13 | 0.0% |
| Taiwan | 93 | 0.0% |
| Thailand | 254 | 0.1% |
| Trinidad and Tobago | 90 | 0.0% |
| Turkey | 35 | 0.0% |
| Uganda | 136 | 0.0% |
| Ukraine | 578 | 0.1% |
| Uruguay | 74 | 0.0% |
| Venezuela | 183 | 0.0% |
| Vietnam | 2,289 | 0.4% |
| Western Africa | 224 | 0.0% |
| Western Asia | 260 | 0.1% |
| Western Europe | 733 | 0.1% |
| Zaire | 213 | 0.0% | View All 116 Rows |
Sex and Age in Lancaster County
Sex and Age in Lancaster County
The most populous age groups in Lancaster County are 10 to 14 Years (19,108 | 7.0%) for men and 60 to 64 Years (18,861 | 6.7%) for women.
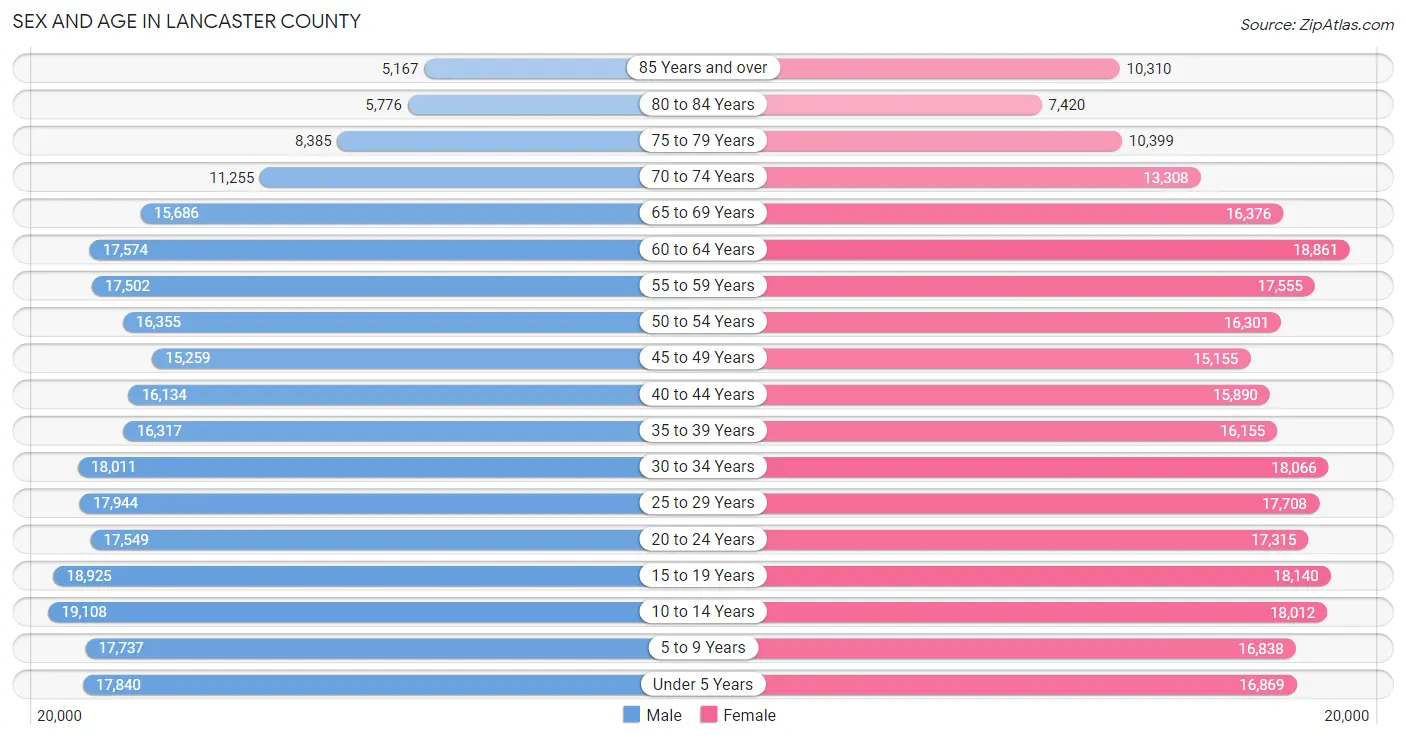
| Age Bracket | Male | Female |
| Under 5 Years | 17,840 (6.6%) | 16,869 (6.0%) |
| 5 to 9 Years | 17,737 (6.5%) | 16,838 (6.0%) |
| 10 to 14 Years | 19,108 (7.0%) | 18,012 (6.4%) |
| 15 to 19 Years | 18,925 (6.9%) | 18,140 (6.5%) |
| 20 to 24 Years | 17,549 (6.4%) | 17,315 (6.2%) |
| 25 to 29 Years | 17,944 (6.6%) | 17,708 (6.3%) |
| 30 to 34 Years | 18,011 (6.6%) | 18,066 (6.4%) |
| 35 to 39 Years | 16,317 (6.0%) | 16,155 (5.8%) |
| 40 to 44 Years | 16,134 (5.9%) | 15,890 (5.7%) |
| 45 to 49 Years | 15,259 (5.6%) | 15,155 (5.4%) |
| 50 to 54 Years | 16,355 (6.0%) | 16,301 (5.8%) |
| 55 to 59 Years | 17,502 (6.4%) | 17,555 (6.2%) |
| 60 to 64 Years | 17,574 (6.5%) | 18,861 (6.7%) |
| 65 to 69 Years | 15,686 (5.8%) | 16,376 (5.8%) |
| 70 to 74 Years | 11,255 (4.1%) | 13,308 (4.7%) |
| 75 to 79 Years | 8,385 (3.1%) | 10,399 (3.7%) |
| 80 to 84 Years | 5,776 (2.1%) | 7,420 (2.6%) |
| 85 Years and over | 5,167 (1.9%) | 10,310 (3.7%) |
| Total | 272,524 (100.0%) | 280,678 (100.0%) |
Families and Households in Lancaster County
Median Family Size in Lancaster County
The median family size in Lancaster County is 3.10 persons per family, with married-couple families (118,944 | 81.7%) accounting for the largest median family size of 3.15 persons per family. On the other hand, single male/father families (8,212 | 5.6%) represent the smallest median family size with 2.66 persons per family.
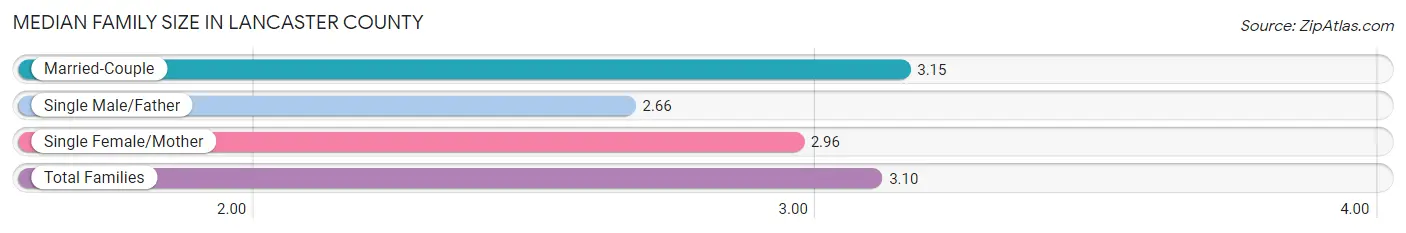
| Family Type | # Families | Family Size |
| Married-Couple | 118,944 (81.7%) | 3.15 |
| Single Male/Father | 8,212 (5.6%) | 2.66 |
| Single Female/Mother | 18,405 (12.6%) | 2.96 |
| Total Families | 145,561 (100.0%) | 3.10 |
Median Household Size in Lancaster County
The median household size in Lancaster County is 2.58 persons per household, with single female/mother households (18,405 | 8.8%) accounting for the largest median household size of 3.22 persons per household. non-family households (63,427 | 30.3%) represent the smallest median household size with 1.25 persons per household.
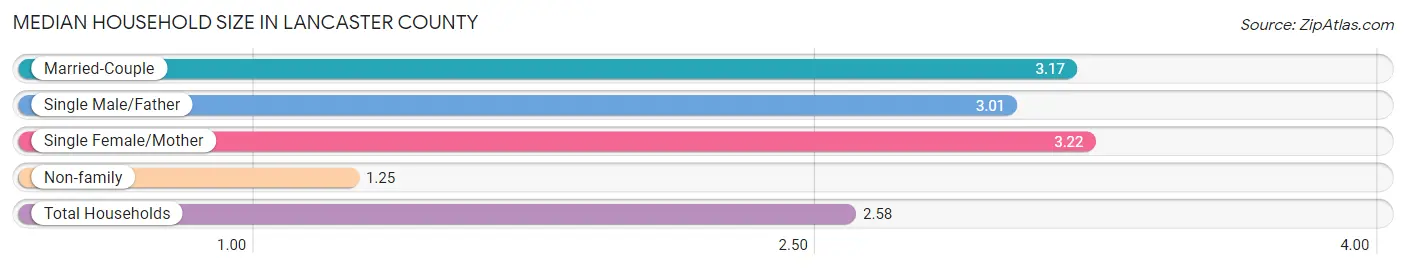
| Household Type | # Households | Household Size |
| Married-Couple | 118,944 (56.9%) | 3.17 |
| Single Male/Father | 8,212 (3.9%) | 3.01 |
| Single Female/Mother | 18,405 (8.8%) | 3.22 |
| Non-family | 63,427 (30.3%) | 1.25 |
| Total Households | 208,988 (100.0%) | 2.58 |
Household Size by Marriage Status in Lancaster County
Out of a total of 208,988 households in Lancaster County, 145,561 (69.7%) are family households, while 63,427 (30.3%) are nonfamily households. The most numerous type of family households are 2-person households, comprising 67,964, and the most common type of nonfamily households are 1-person households, comprising 50,745.
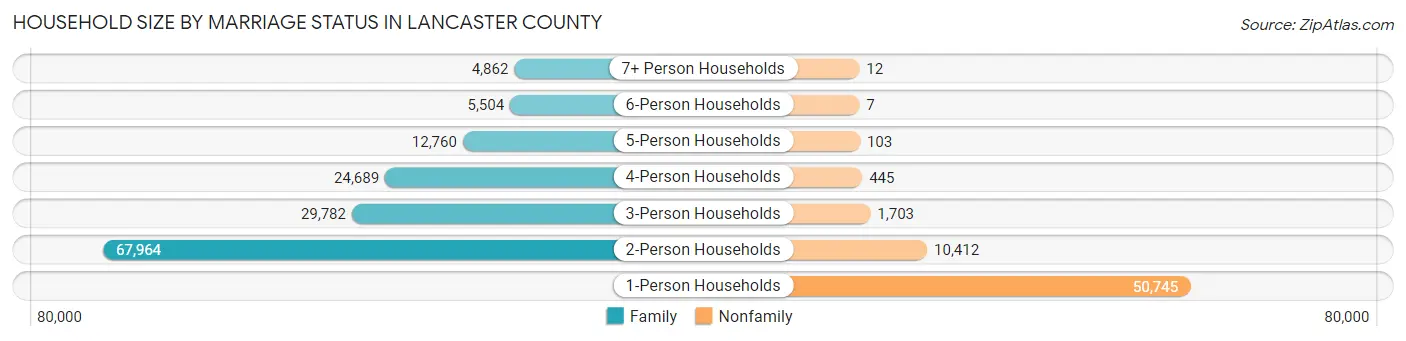
| Household Size | Family Households | Nonfamily Households |
| 1-Person Households | - | 50,745 (24.3%) |
| 2-Person Households | 67,964 (32.5%) | 10,412 (5.0%) |
| 3-Person Households | 29,782 (14.2%) | 1,703 (0.8%) |
| 4-Person Households | 24,689 (11.8%) | 445 (0.2%) |
| 5-Person Households | 12,760 (6.1%) | 103 (0.1%) |
| 6-Person Households | 5,504 (2.6%) | 7 (0.0%) |
| 7+ Person Households | 4,862 (2.3%) | 12 (0.0%) |
| Total | 145,561 (69.7%) | 63,427 (30.3%) |
Female Fertility in Lancaster County
Fertility by Age in Lancaster County
Average fertility rate in Lancaster County is 63.0 births per 1,000 women. Women in the age bracket of 20 to 34 years have the highest fertility rate with 113.0 births per 1,000 women. Women in the age bracket of 20 to 34 years acount for 78.2% of all women with births.
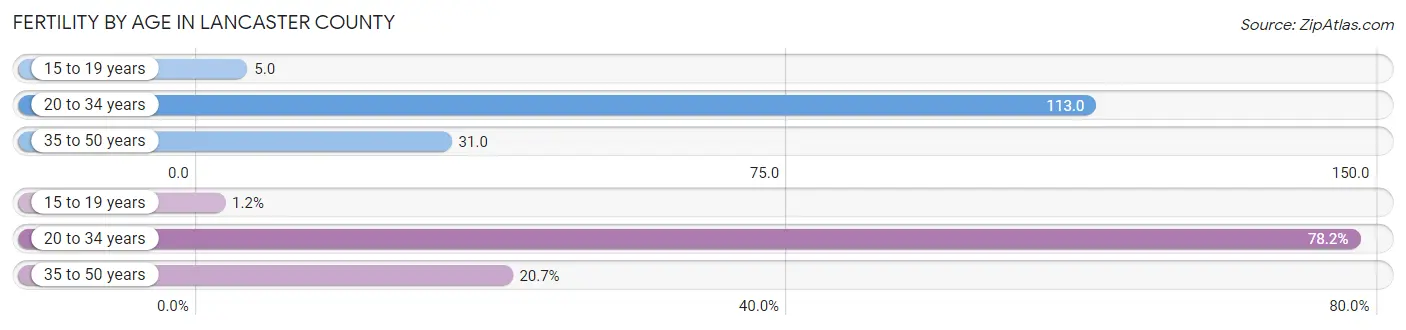
| Age Bracket | Women with Births | Births / 1,000 Women |
| 15 to 19 years | 89 (1.2%) | 5.0 |
| 20 to 34 years | 6,012 (78.2%) | 113.0 |
| 35 to 50 years | 1,589 (20.7%) | 31.0 |
| Total | 7,690 (100.0%) | 63.0 |
Fertility by Age by Marriage Status in Lancaster County
80.4% of women with births (7,690) in Lancaster County are married. The highest percentage of unmarried women with births falls into 15 to 19 years age bracket with 100.0% of them unmarried at the time of birth, while the lowest percentage of unmarried women with births belong to 35 to 50 years age bracket with 17.0% of them unmarried.
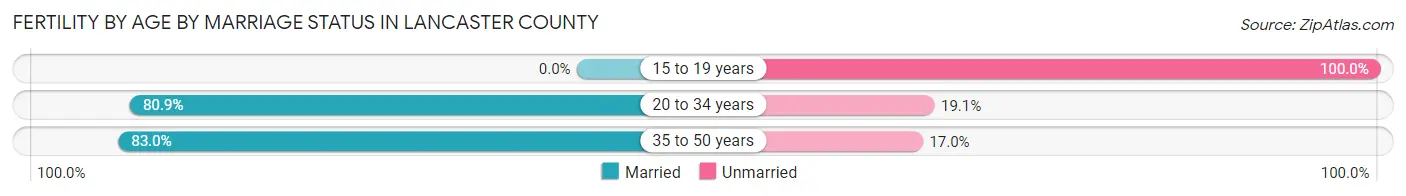
| Age Bracket | Married | Unmarried |
| 15 to 19 years | 0 (0.0%) | 89 (100.0%) |
| 20 to 34 years | 4,864 (80.9%) | 1,148 (19.1%) |
| 35 to 50 years | 1,319 (83.0%) | 270 (17.0%) |
| Total | 6,183 (80.4%) | 1,507 (19.6%) |
Fertility by Education in Lancaster County
Average fertility rate in Lancaster County is 63.0 births per 1,000 women. Women with the education attainment of graduate degree have the highest fertility rate of 77.0 births per 1,000 women, while women with the education attainment of high school diploma have the lowest fertility at 55.0 births per 1,000 women. Women with the education attainment of bachelor's degree represent 23.4% of all women with births.
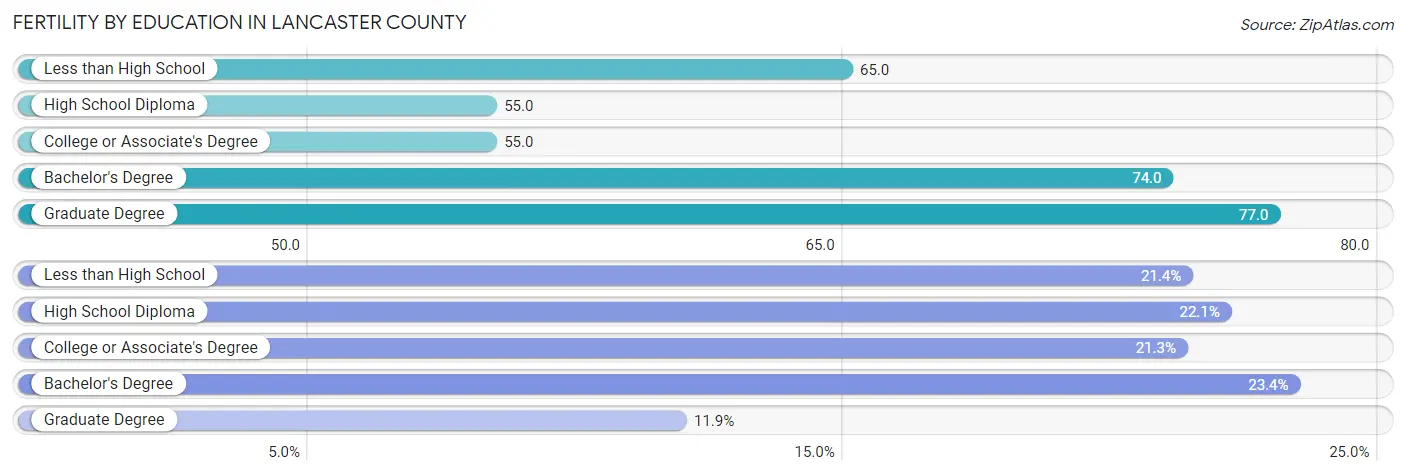
| Educational Attainment | Women with Births | Births / 1,000 Women |
| Less than High School | 1,643 (21.4%) | 65.0 |
| High School Diploma | 1,699 (22.1%) | 55.0 |
| College or Associate's Degree | 1,636 (21.3%) | 55.0 |
| Bachelor's Degree | 1,798 (23.4%) | 74.0 |
| Graduate Degree | 914 (11.9%) | 77.0 |
| Total | 7,690 (100.0%) | 63.0 |
Fertility by Education by Marriage Status in Lancaster County
19.6% of women with births in Lancaster County are unmarried. Women with the educational attainment of graduate degree are most likely to be married with 92.8% of them married at childbirth, while women with the educational attainment of high school diploma are least likely to be married with 38.9% of them unmarried at childbirth.
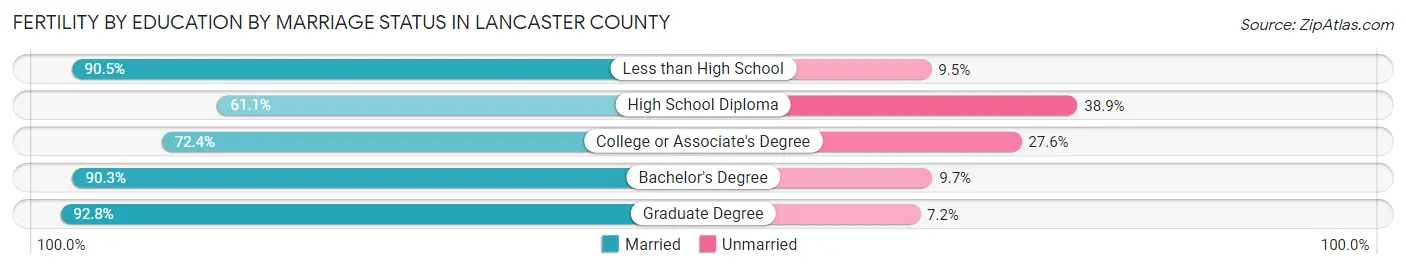
| Educational Attainment | Married | Unmarried |
| Less than High School | 1,487 (90.5%) | 156 (9.5%) |
| High School Diploma | 1,038 (61.1%) | 661 (38.9%) |
| College or Associate's Degree | 1,184 (72.4%) | 452 (27.6%) |
| Bachelor's Degree | 1,624 (90.3%) | 174 (9.7%) |
| Graduate Degree | 848 (92.8%) | 66 (7.2%) |
| Total | 6,183 (80.4%) | 1,507 (19.6%) |
Employment Characteristics in Lancaster County
Employment by Class of Employer in Lancaster County
Among the 274,411 employed individuals in Lancaster County, private company employees (189,637 | 69.1%), not-for-profit organizations (33,891 | 12.3%), and self-employed (not incorporated) (19,051 | 6.9%) make up the most common classes of employment.
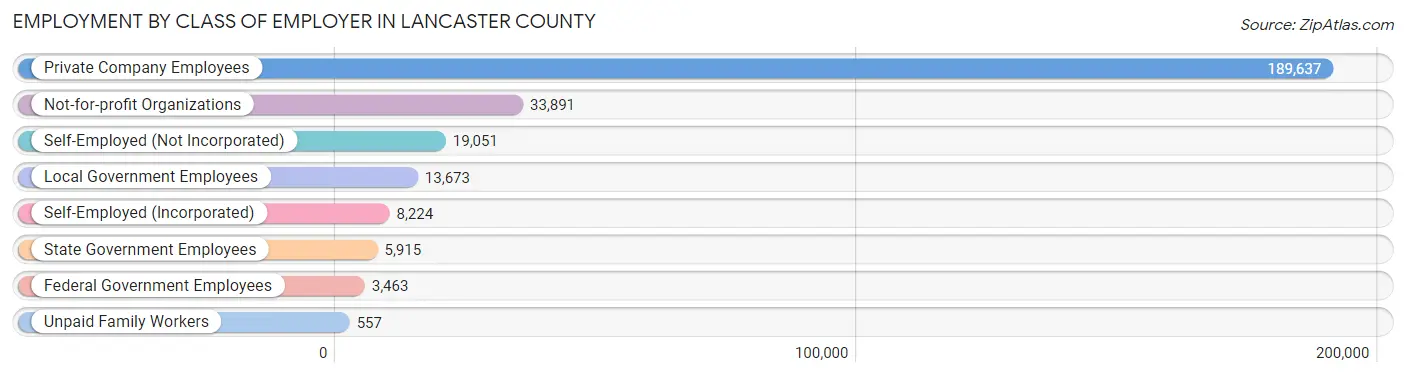
| Employer Class | # Employees | % Employees |
| Private Company Employees | 189,637 | 69.1% |
| Self-Employed (Incorporated) | 8,224 | 3.0% |
| Self-Employed (Not Incorporated) | 19,051 | 6.9% |
| Not-for-profit Organizations | 33,891 | 12.3% |
| Local Government Employees | 13,673 | 5.0% |
| State Government Employees | 5,915 | 2.2% |
| Federal Government Employees | 3,463 | 1.3% |
| Unpaid Family Workers | 557 | 0.2% |
| Total | 274,411 | 100.0% |
Employment Status by Age in Lancaster County
According to the labor force statistics for Lancaster County, out of the total population over 16 years of age (438,998), 66.0% or 289,739 individuals are in the labor force, with 3.4% or 9,851 of them unemployed. The age group with the highest labor force participation rate is 25 to 29 years, with 86.1% or 30,696 individuals in the labor force. Within the labor force, the 20 to 24 years age range has the highest percentage of unemployed individuals, with 7.3% or 2,013 of them being unemployed.
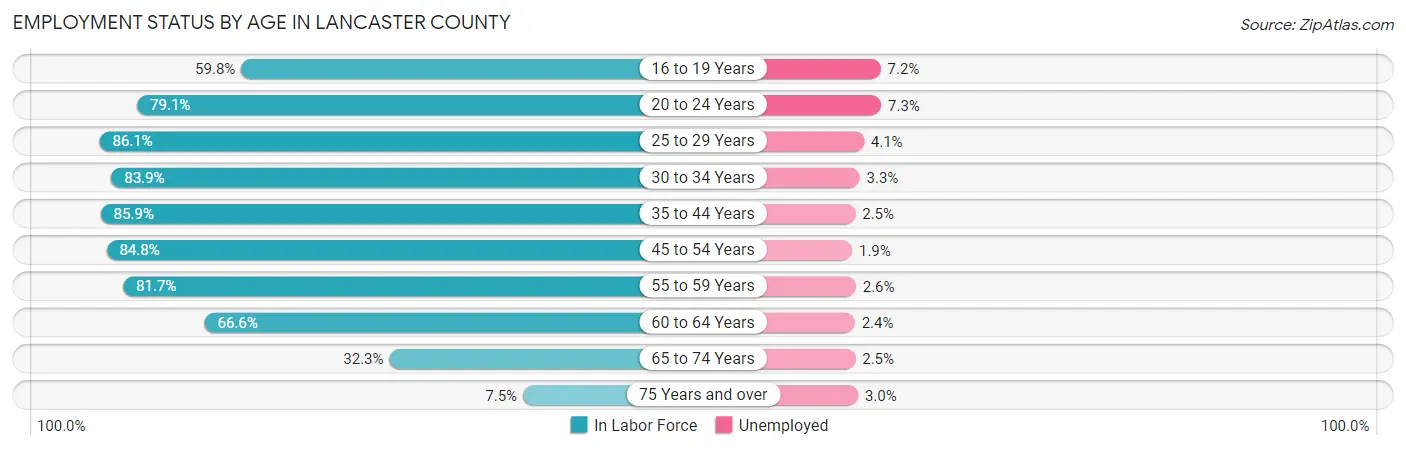
| Age Bracket | In Labor Force | Unemployed |
| 16 to 19 Years | 17,500 (59.8%) | 1,260 (7.2%) |
| 20 to 24 Years | 27,577 (79.1%) | 2,013 (7.3%) |
| 25 to 29 Years | 30,696 (86.1%) | 1,259 (4.1%) |
| 30 to 34 Years | 30,269 (83.9%) | 999 (3.3%) |
| 35 to 44 Years | 55,402 (85.9%) | 1,385 (2.5%) |
| 45 to 54 Years | 53,483 (84.8%) | 1,016 (1.9%) |
| 55 to 59 Years | 28,642 (81.7%) | 745 (2.6%) |
| 60 to 64 Years | 24,266 (66.6%) | 582 (2.4%) |
| 65 to 74 Years | 18,290 (32.3%) | 457 (2.5%) |
| 75 Years and over | 3,559 (7.5%) | 107 (3.0%) |
| Total | 289,739 (66.0%) | 9,851 (3.4%) |
Employment Status by Educational Attainment in Lancaster County
According to labor force statistics for Lancaster County, 82.3% of individuals (222,858) out of the total population between 25 and 64 years of age (270,787) are in the labor force, with 2.7% or 6,017 of them being unemployed. The group with the highest labor force participation rate are those with the educational attainment of bachelor's degree or higher, with 90.5% or 78,164 individuals in the labor force. Within the labor force, individuals with less than high school education have the highest percentage of unemployment, with 3.9% or 799 of them being unemployed.
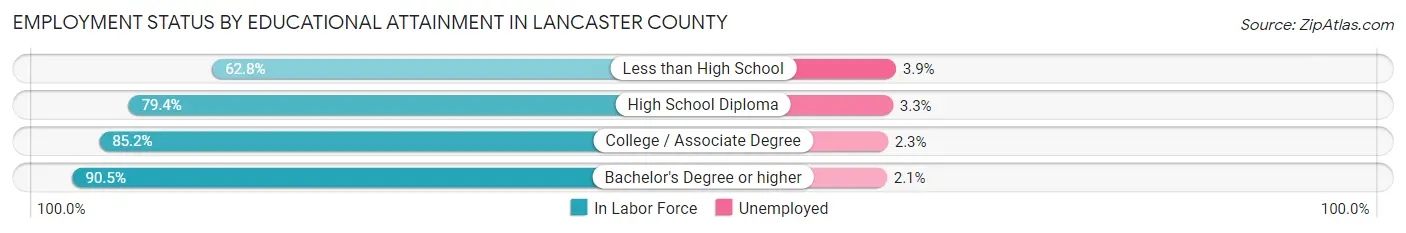
| Educational Attainment | In Labor Force | Unemployed |
| Less than High School | 20,497 (62.8%) | 1,273 (3.9%) |
| High School Diploma | 70,195 (79.4%) | 2,917 (3.3%) |
| College / Associate Degree | 53,994 (85.2%) | 1,458 (2.3%) |
| Bachelor's Degree or higher | 78,164 (90.5%) | 1,814 (2.1%) |
| Total | 222,858 (82.3%) | 7,311 (2.7%) |
Employment Occupations by Sex in Lancaster County
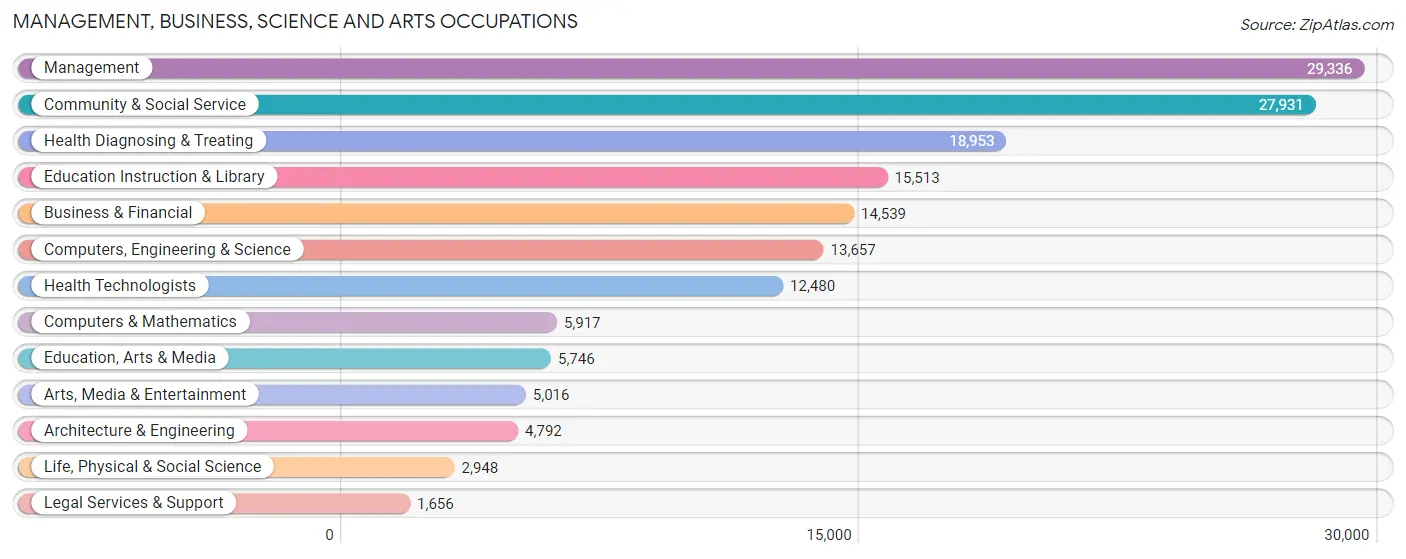
Management, Business, Science and Arts Occupations
The most common Management, Business, Science and Arts occupations in Lancaster County are Management (29,336 | 10.5%), Community & Social Service (27,931 | 10.0%), Health Diagnosing & Treating (18,953 | 6.8%), Education Instruction & Library (15,513 | 5.5%), and Business & Financial (14,539 | 5.2%).
Management, Business, Science and Arts Occupations by Sex
Within the Management, Business, Science and Arts occupations in Lancaster County, the most male-oriented occupations are Architecture & Engineering (87.3%), Computers, Engineering & Science (76.2%), and Computers & Mathematics (75.9%), while the most female-oriented occupations are Health Diagnosing & Treating (77.3%), Health Technologists (76.7%), and Education Instruction & Library (70.9%).
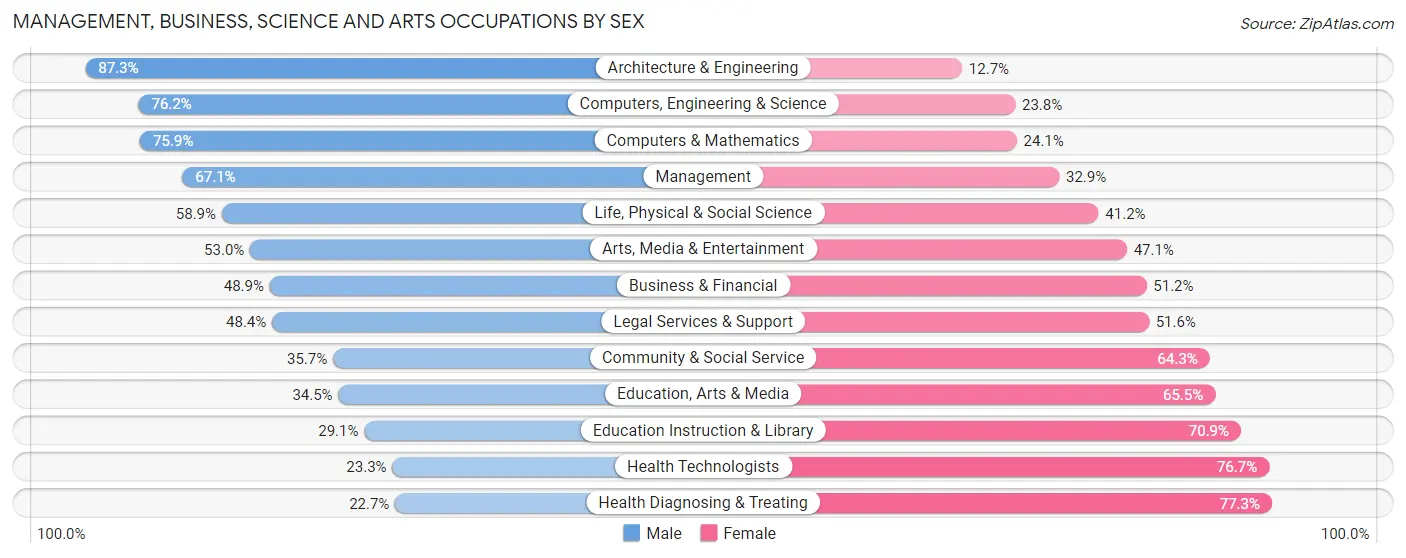
| Occupation | Male | Female |
| Management | 19,677 (67.1%) | 9,659 (32.9%) |
| Business & Financial | 7,102 (48.8%) | 7,437 (51.1%) |
| Computers, Engineering & Science | 10,412 (76.2%) | 3,245 (23.8%) |
| Computers & Mathematics | 4,492 (75.9%) | 1,425 (24.1%) |
| Architecture & Engineering | 4,185 (87.3%) | 607 (12.7%) |
| Life, Physical & Social Science | 1,735 (58.9%) | 1,213 (41.1%) |
| Community & Social Service | 9,961 (35.7%) | 17,970 (64.3%) |
| Education, Arts & Media | 1,984 (34.5%) | 3,762 (65.5%) |
| Legal Services & Support | 801 (48.4%) | 855 (51.6%) |
| Education Instruction & Library | 4,520 (29.1%) | 10,993 (70.9%) |
| Arts, Media & Entertainment | 2,656 (52.9%) | 2,360 (47.0%) |
| Health Diagnosing & Treating | 4,300 (22.7%) | 14,653 (77.3%) |
| Health Technologists | 2,904 (23.3%) | 9,576 (76.7%) |
| Total (Category) | 51,452 (49.3%) | 52,964 (50.7%) |
| Total (Overall) | 152,007 (54.3%) | 127,792 (45.7%) |
Services Occupations
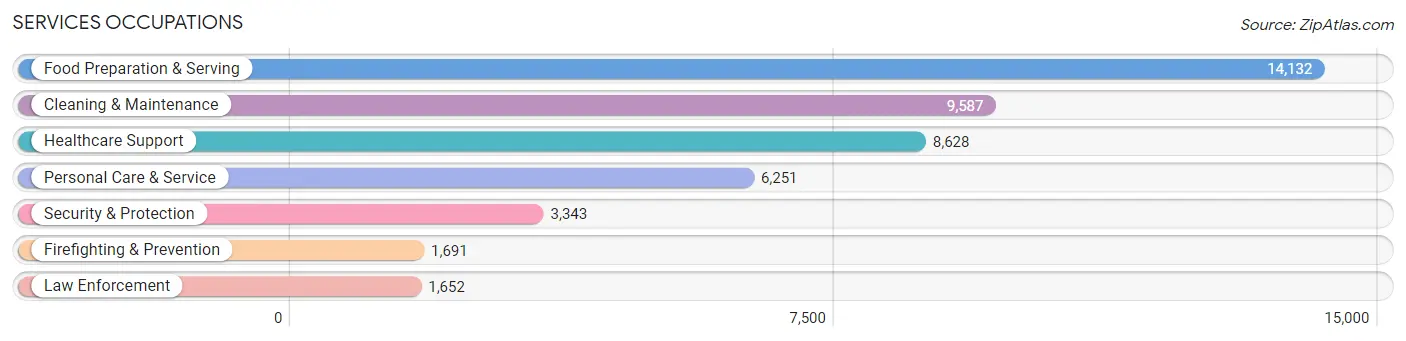
The most common Services occupations in Lancaster County are Food Preparation & Serving (14,132 | 5.1%), Cleaning & Maintenance (9,587 | 3.4%), Healthcare Support (8,628 | 3.1%), Personal Care & Service (6,251 | 2.2%), and Security & Protection (3,343 | 1.2%).
Services Occupations by Sex
Within the Services occupations in Lancaster County, the most male-oriented occupations are Law Enforcement (80.8%), Security & Protection (79.6%), and Firefighting & Prevention (78.4%), while the most female-oriented occupations are Healthcare Support (84.8%), Personal Care & Service (76.4%), and Food Preparation & Serving (61.3%).
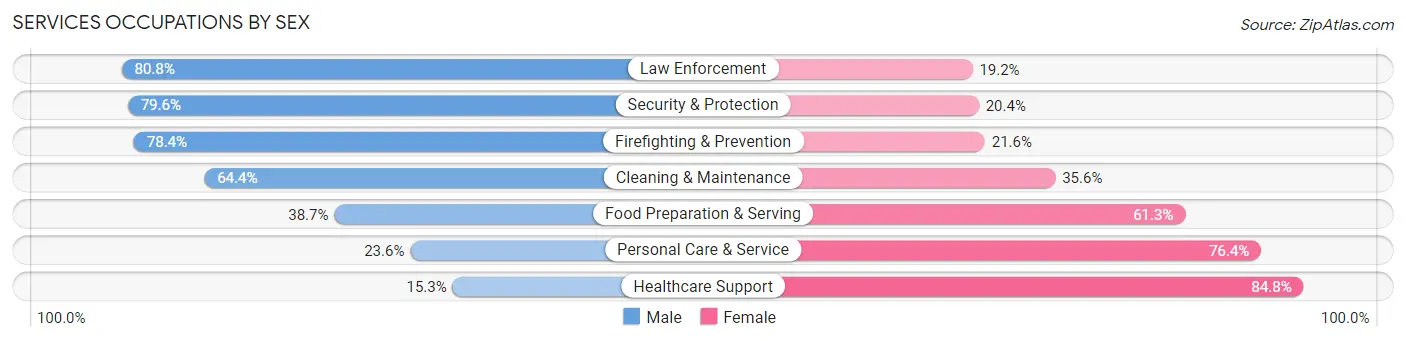
| Occupation | Male | Female |
| Healthcare Support | 1,316 (15.2%) | 7,312 (84.8%) |
| Security & Protection | 2,660 (79.6%) | 683 (20.4%) |
| Firefighting & Prevention | 1,325 (78.4%) | 366 (21.6%) |
| Law Enforcement | 1,335 (80.8%) | 317 (19.2%) |
| Food Preparation & Serving | 5,466 (38.7%) | 8,666 (61.3%) |
| Cleaning & Maintenance | 6,176 (64.4%) | 3,411 (35.6%) |
| Personal Care & Service | 1,478 (23.6%) | 4,773 (76.4%) |
| Total (Category) | 17,096 (40.8%) | 24,845 (59.2%) |
| Total (Overall) | 152,007 (54.3%) | 127,792 (45.7%) |
Sales and Office Occupations
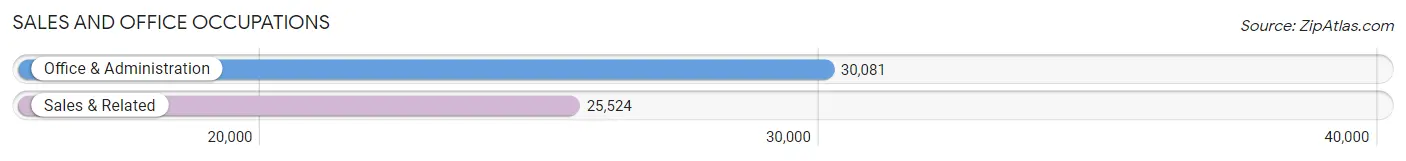
The most common Sales and Office occupations in Lancaster County are Office & Administration (30,081 | 10.7%), and Sales & Related (25,524 | 9.1%).
Sales and Office Occupations by Sex
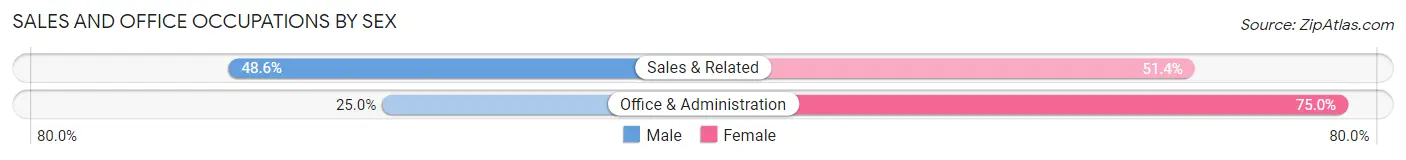
| Occupation | Male | Female |
| Sales & Related | 12,404 (48.6%) | 13,120 (51.4%) |
| Office & Administration | 7,525 (25.0%) | 22,556 (75.0%) |
| Total (Category) | 19,929 (35.8%) | 35,676 (64.2%) |
| Total (Overall) | 152,007 (54.3%) | 127,792 (45.7%) |
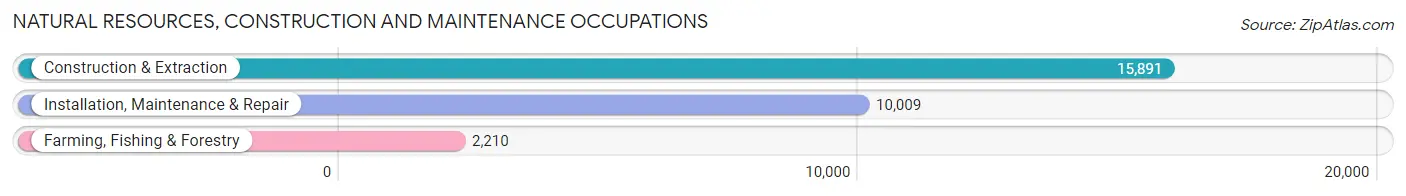
Natural Resources, Construction and Maintenance Occupations
The most common Natural Resources, Construction and Maintenance occupations in Lancaster County are Construction & Extraction (15,891 | 5.7%), Installation, Maintenance & Repair (10,009 | 3.6%), and Farming, Fishing & Forestry (2,210 | 0.8%).
Natural Resources, Construction and Maintenance Occupations by Sex
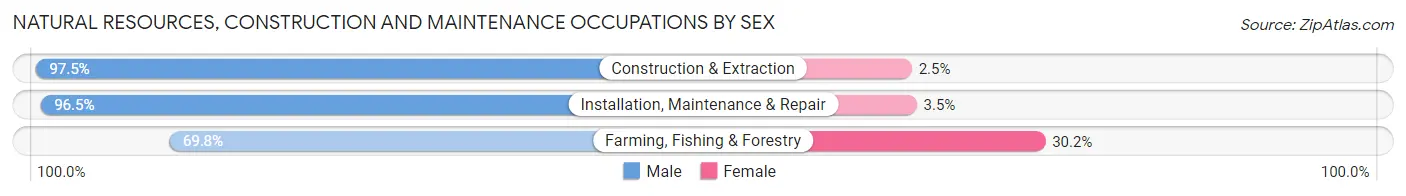
| Occupation | Male | Female |
| Farming, Fishing & Forestry | 1,542 (69.8%) | 668 (30.2%) |
| Construction & Extraction | 15,500 (97.5%) | 391 (2.5%) |
| Installation, Maintenance & Repair | 9,662 (96.5%) | 347 (3.5%) |
| Total (Category) | 26,704 (95.0%) | 1,406 (5.0%) |
| Total (Overall) | 152,007 (54.3%) | 127,792 (45.7%) |
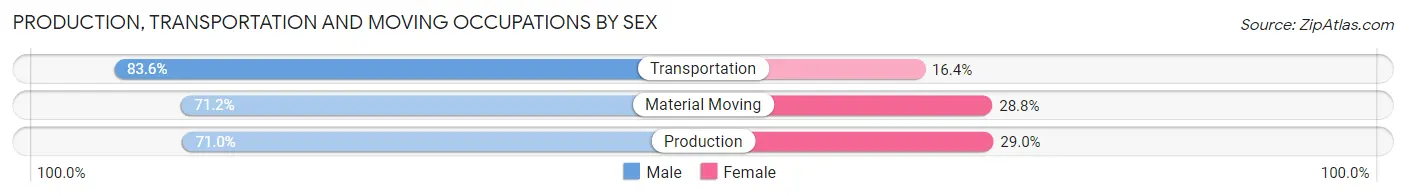
Production, Transportation and Moving Occupations
The most common Production, Transportation and Moving occupations in Lancaster County are Production (23,430 | 8.4%), Material Moving (14,542 | 5.2%), and Transportation (11,755 | 4.2%).
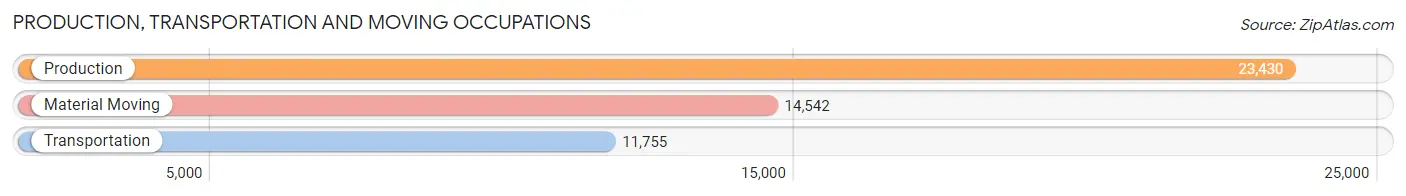
Production, Transportation and Moving Occupations by Sex
| Occupation | Male | Female |
| Production | 16,642 (71.0%) | 6,788 (29.0%) |
| Transportation | 9,826 (83.6%) | 1,929 (16.4%) |
| Material Moving | 10,358 (71.2%) | 4,184 (28.8%) |
| Total (Category) | 36,826 (74.1%) | 12,901 (25.9%) |
| Total (Overall) | 152,007 (54.3%) | 127,792 (45.7%) |
Employment Industries by Sex in Lancaster County
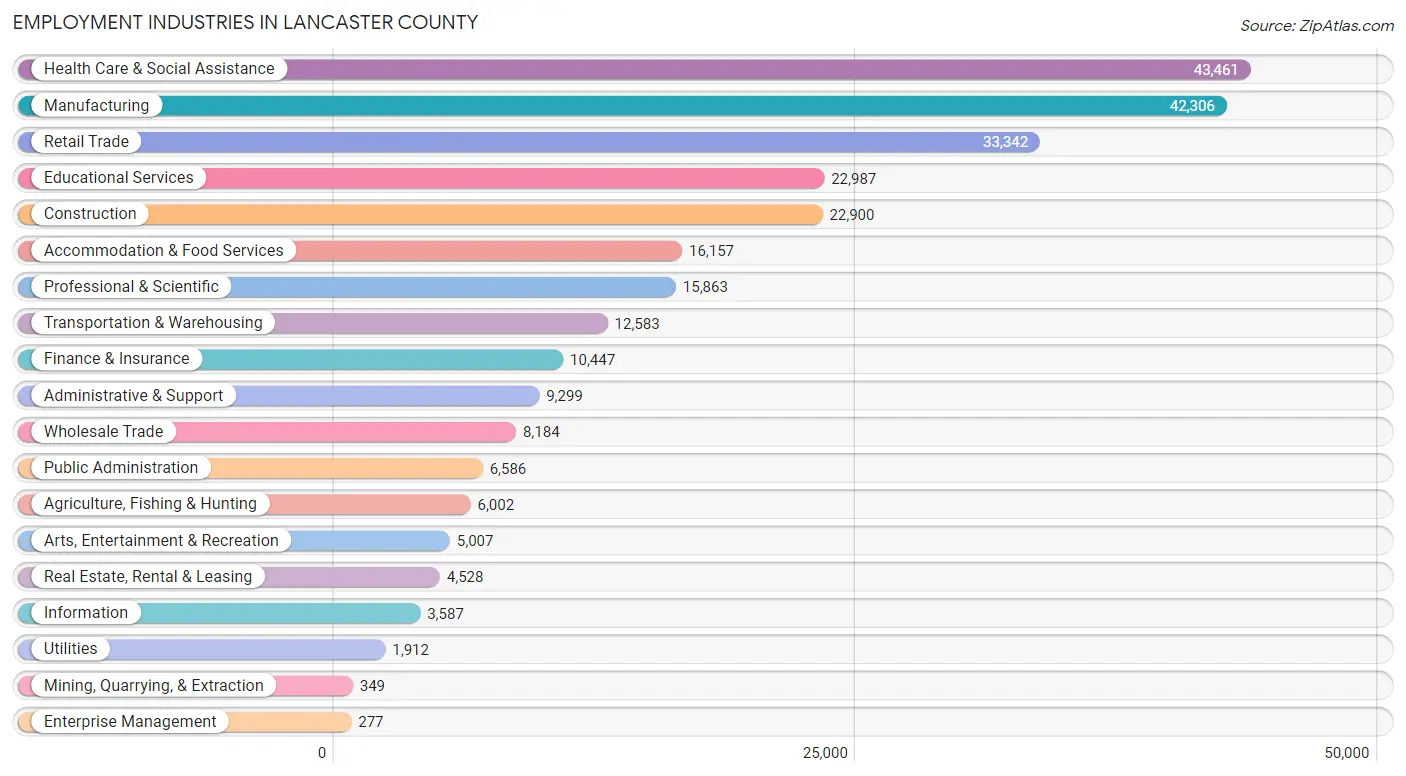
Employment Industries in Lancaster County
The major employment industries in Lancaster County include Health Care & Social Assistance (43,461 | 15.5%), Manufacturing (42,306 | 15.1%), Retail Trade (33,342 | 11.9%), Educational Services (22,987 | 8.2%), and Construction (22,900 | 8.2%).
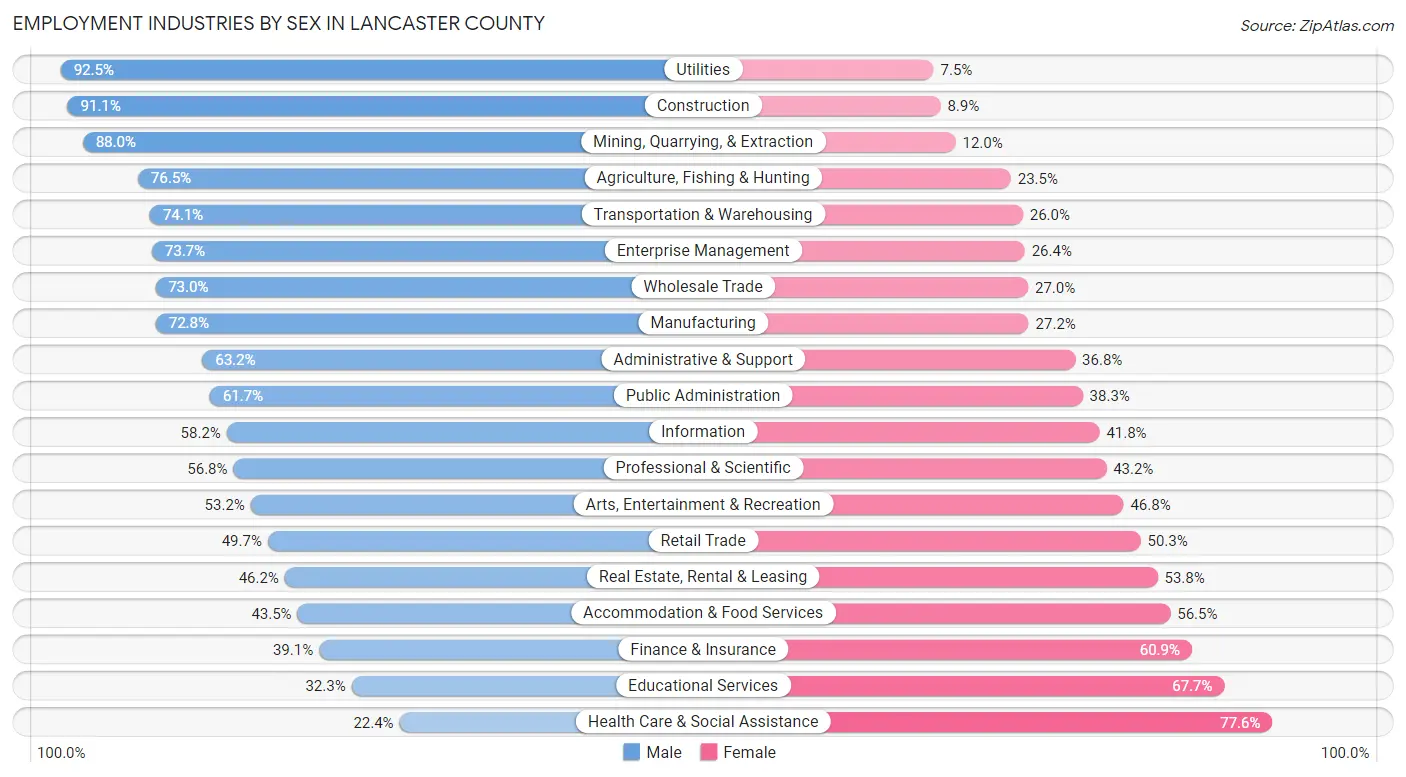
Employment Industries by Sex in Lancaster County
The Lancaster County industries that see more men than women are Utilities (92.5%), Construction (91.1%), and Mining, Quarrying, & Extraction (88.0%), whereas the industries that tend to have a higher number of women are Health Care & Social Assistance (77.6%), Educational Services (67.7%), and Finance & Insurance (60.9%).
| Industry | Male | Female |
| Agriculture, Fishing & Hunting | 4,594 (76.5%) | 1,408 (23.5%) |
| Mining, Quarrying, & Extraction | 307 (88.0%) | 42 (12.0%) |
| Construction | 20,860 (91.1%) | 2,040 (8.9%) |
| Manufacturing | 30,816 (72.8%) | 11,490 (27.2%) |
| Wholesale Trade | 5,971 (73.0%) | 2,213 (27.0%) |
| Retail Trade | 16,561 (49.7%) | 16,781 (50.3%) |
| Transportation & Warehousing | 9,318 (74.1%) | 3,265 (26.0%) |
| Utilities | 1,769 (92.5%) | 143 (7.5%) |
| Information | 2,087 (58.2%) | 1,500 (41.8%) |
| Finance & Insurance | 4,082 (39.1%) | 6,365 (60.9%) |
| Real Estate, Rental & Leasing | 2,090 (46.2%) | 2,438 (53.8%) |
| Professional & Scientific | 9,009 (56.8%) | 6,854 (43.2%) |
| Enterprise Management | 204 (73.7%) | 73 (26.4%) |
| Administrative & Support | 5,878 (63.2%) | 3,421 (36.8%) |
| Educational Services | 7,435 (32.3%) | 15,552 (67.7%) |
| Health Care & Social Assistance | 9,741 (22.4%) | 33,720 (77.6%) |
| Arts, Entertainment & Recreation | 2,664 (53.2%) | 2,343 (46.8%) |
| Accommodation & Food Services | 7,032 (43.5%) | 9,125 (56.5%) |
| Public Administration | 4,061 (61.7%) | 2,525 (38.3%) |
| Total | 152,007 (54.3%) | 127,792 (45.7%) |
Education in Lancaster County
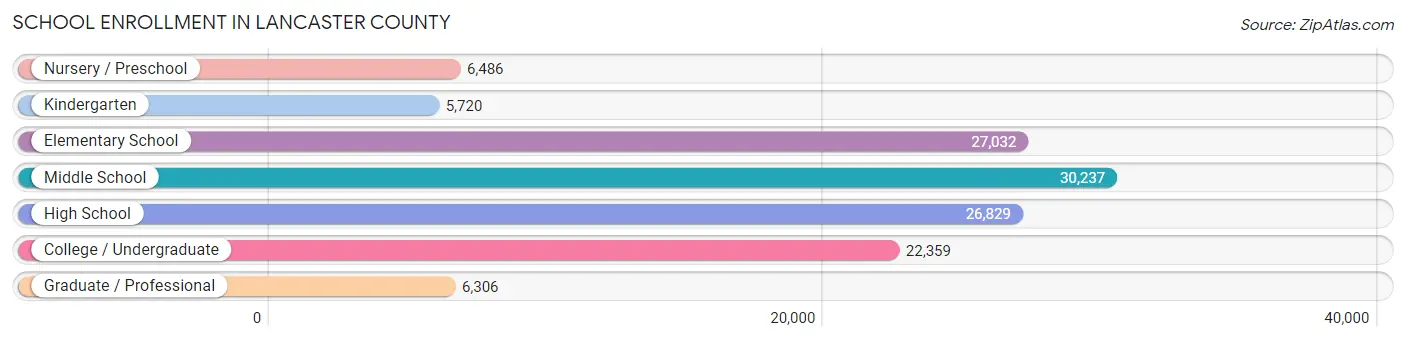
School Enrollment in Lancaster County
The most common levels of schooling among the 124,969 students in Lancaster County are middle school (30,237 | 24.2%), elementary school (27,032 | 21.6%), and high school (26,829 | 21.5%).
| School Level | # Students | % Students |
| Nursery / Preschool | 6,486 | 5.2% |
| Kindergarten | 5,720 | 4.6% |
| Elementary School | 27,032 | 21.6% |
| Middle School | 30,237 | 24.2% |
| High School | 26,829 | 21.5% |
| College / Undergraduate | 22,359 | 17.9% |
| Graduate / Professional | 6,306 | 5.1% |
| Total | 124,969 | 100.0% |
School Enrollment by Age by Funding Source in Lancaster County
Out of a total of 124,969 students who are enrolled in schools in Lancaster County, 35,866 (28.7%) attend a private institution, while the remaining 89,103 (71.3%) are enrolled in public schools. The age group of 3 to 4 year olds has the highest likelihood of being enrolled in private schools, with 2,844 (59.2% in the age bracket) enrolled. Conversely, the age group of 15 to 17 year olds has the lowest likelihood of being enrolled in a private school, with 16,664 (86.5% in the age bracket) attending a public institution.
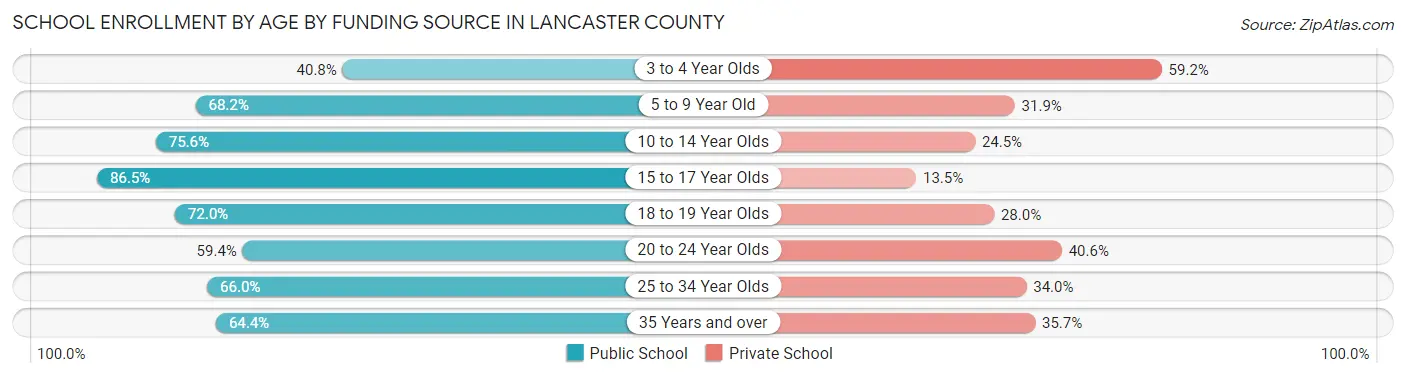
| Age Bracket | Public School | Private School |
| 3 to 4 Year Olds | 1,958 (40.8%) | 2,844 (59.2%) |
| 5 to 9 Year Old | 21,145 (68.1%) | 9,882 (31.9%) |
| 10 to 14 Year Olds | 27,578 (75.5%) | 8,924 (24.4%) |
| 15 to 17 Year Olds | 16,664 (86.5%) | 2,596 (13.5%) |
| 18 to 19 Year Olds | 6,964 (72.0%) | 2,708 (28.0%) |
| 20 to 24 Year Olds | 7,230 (59.4%) | 4,945 (40.6%) |
| 25 to 34 Year Olds | 4,050 (66.0%) | 2,087 (34.0%) |
| 35 Years and over | 3,471 (64.3%) | 1,923 (35.6%) |
| Total | 89,103 (71.3%) | 35,866 (28.7%) |
Educational Attainment by Field of Study in Lancaster County
Education (22,440 | 18.1%), business (22,247 | 18.0%), science & technology (14,033 | 11.3%), bio, nature & agricultural (8,258 | 6.7%), and social sciences (8,187 | 6.6%) are the most common fields of study among 123,781 individuals in Lancaster County who have obtained a bachelor's degree or higher.
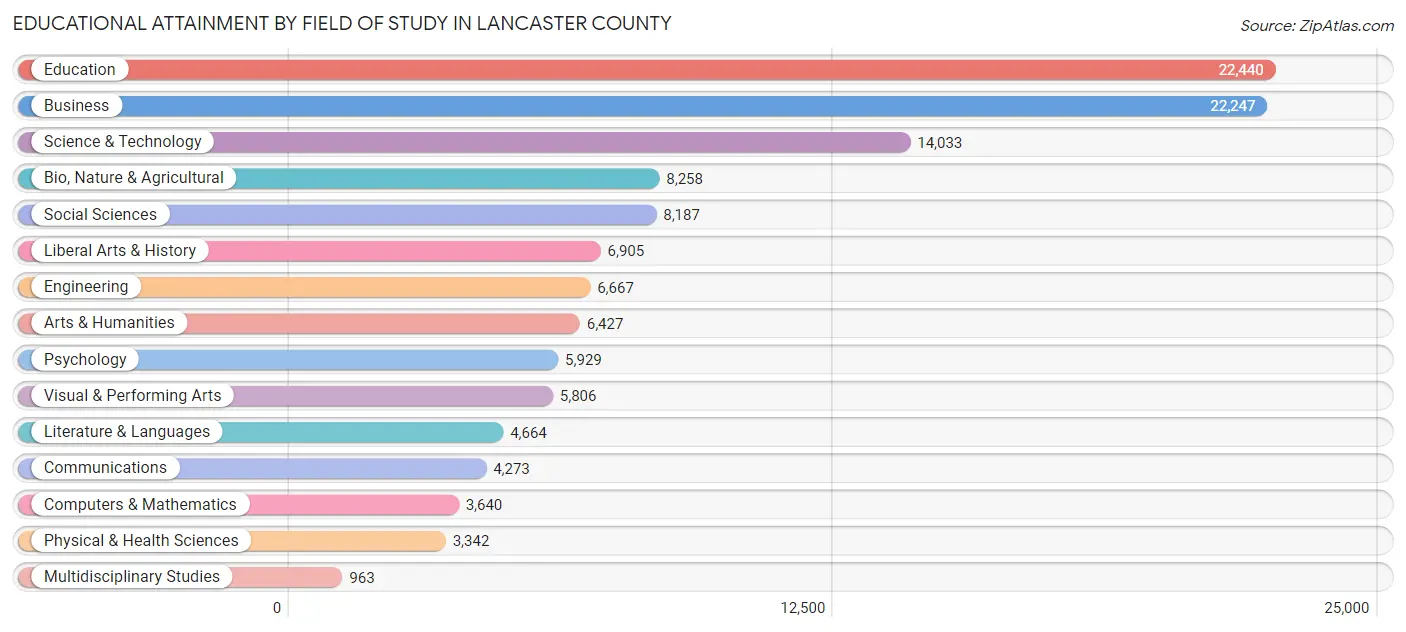
| Field of Study | # Graduates | % Graduates |
| Computers & Mathematics | 3,640 | 2.9% |
| Bio, Nature & Agricultural | 8,258 | 6.7% |
| Physical & Health Sciences | 3,342 | 2.7% |
| Psychology | 5,929 | 4.8% |
| Social Sciences | 8,187 | 6.6% |
| Engineering | 6,667 | 5.4% |
| Multidisciplinary Studies | 963 | 0.8% |
| Science & Technology | 14,033 | 11.3% |
| Business | 22,247 | 18.0% |
| Education | 22,440 | 18.1% |
| Literature & Languages | 4,664 | 3.8% |
| Liberal Arts & History | 6,905 | 5.6% |
| Visual & Performing Arts | 5,806 | 4.7% |
| Communications | 4,273 | 3.5% |
| Arts & Humanities | 6,427 | 5.2% |
| Total | 123,781 | 100.0% |
Transportation & Commute in Lancaster County
Vehicle Availability by Sex in Lancaster County
The most prevalent vehicle ownership categories in Lancaster County are males with 2 vehicles (63,888, accounting for 43.0%) and females with 2 vehicles (51,251, making up 52.0%).
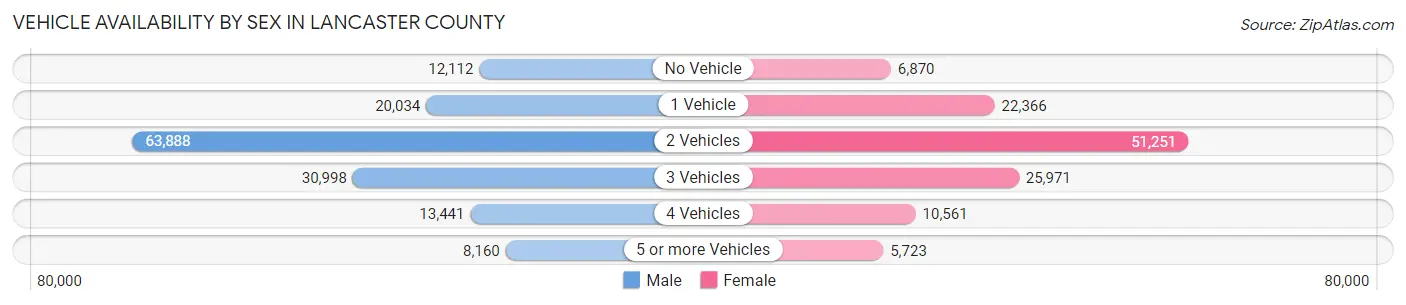
| Vehicles Available | Male | Female |
| No Vehicle | 12,112 (8.2%) | 6,870 (5.6%) |
| 1 Vehicle | 20,034 (13.5%) | 22,366 (18.2%) |
| 2 Vehicles | 63,888 (43.0%) | 51,251 (41.8%) |
| 3 Vehicles | 30,998 (20.9%) | 25,971 (21.2%) |
| 4 Vehicles | 13,441 (9.0%) | 10,561 (8.6%) |
| 5 or more Vehicles | 8,160 (5.5%) | 5,723 (4.7%) |
| Total | 148,633 (100.0%) | 122,742 (100.0%) |
Commute Time in Lancaster County
The most frequently occuring commute durations in Lancaster County are 15 to 19 minutes (41,687 commuters, 16.7%), 20 to 24 minutes (40,050 commuters, 16.1%), and 10 to 14 minutes (36,996 commuters, 14.8%).
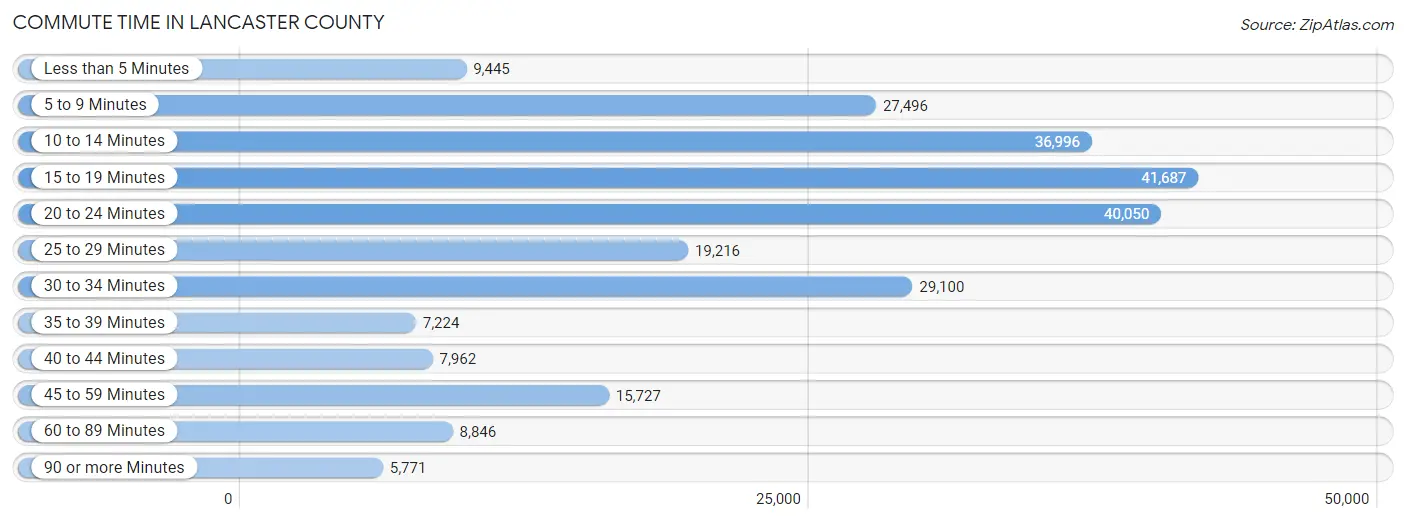
| Commute Time | # Commuters | % Commuters |
| Less than 5 Minutes | 9,445 | 3.8% |
| 5 to 9 Minutes | 27,496 | 11.0% |
| 10 to 14 Minutes | 36,996 | 14.8% |
| 15 to 19 Minutes | 41,687 | 16.7% |
| 20 to 24 Minutes | 40,050 | 16.1% |
| 25 to 29 Minutes | 19,216 | 7.7% |
| 30 to 34 Minutes | 29,100 | 11.7% |
| 35 to 39 Minutes | 7,224 | 2.9% |
| 40 to 44 Minutes | 7,962 | 3.2% |
| 45 to 59 Minutes | 15,727 | 6.3% |
| 60 to 89 Minutes | 8,846 | 3.5% |
| 90 or more Minutes | 5,771 | 2.3% |
Commute Time by Sex in Lancaster County
The most common commute times in Lancaster County are 20 to 24 minutes (21,867 commuters, 15.9%) for males and 15 to 19 minutes (19,862 commuters, 17.7%) for females.
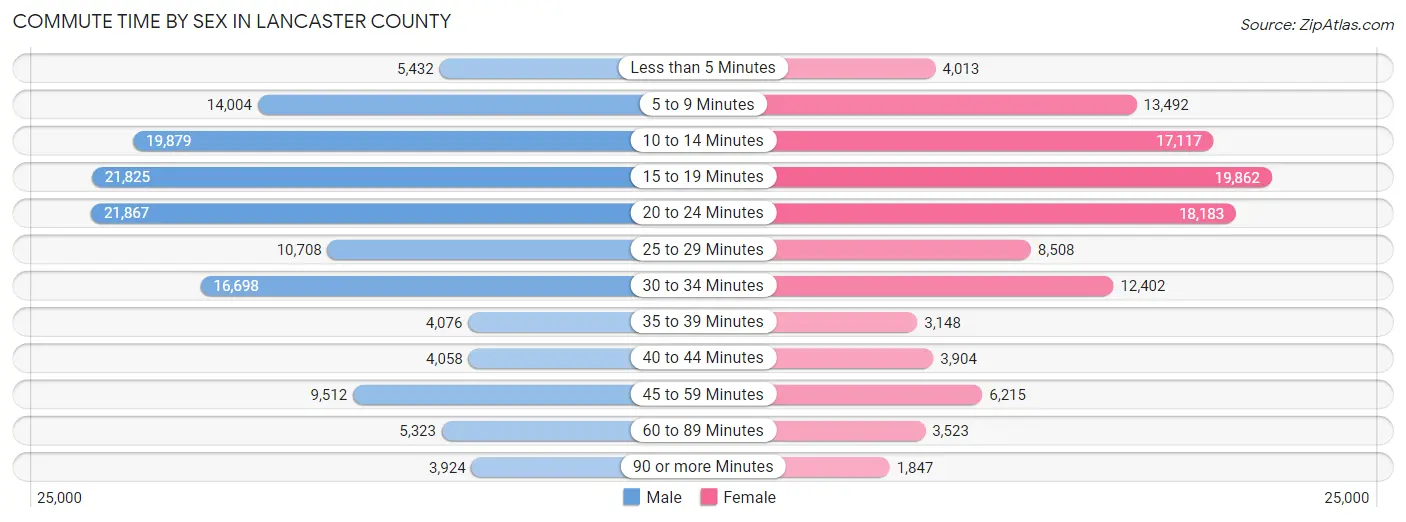
| Commute Time | Male | Female |
| Less than 5 Minutes | 5,432 (4.0%) | 4,013 (3.6%) |
| 5 to 9 Minutes | 14,004 (10.2%) | 13,492 (12.0%) |
| 10 to 14 Minutes | 19,879 (14.5%) | 17,117 (15.2%) |
| 15 to 19 Minutes | 21,825 (15.9%) | 19,862 (17.7%) |
| 20 to 24 Minutes | 21,867 (15.9%) | 18,183 (16.2%) |
| 25 to 29 Minutes | 10,708 (7.8%) | 8,508 (7.6%) |
| 30 to 34 Minutes | 16,698 (12.2%) | 12,402 (11.1%) |
| 35 to 39 Minutes | 4,076 (3.0%) | 3,148 (2.8%) |
| 40 to 44 Minutes | 4,058 (3.0%) | 3,904 (3.5%) |
| 45 to 59 Minutes | 9,512 (6.9%) | 6,215 (5.5%) |
| 60 to 89 Minutes | 5,323 (3.9%) | 3,523 (3.1%) |
| 90 or more Minutes | 3,924 (2.9%) | 1,847 (1.7%) |
Time of Departure to Work by Sex in Lancaster County
The most frequent times of departure to work in Lancaster County are 6:00 AM to 6:29 AM (18,448, 13.4%) for males and 7:00 AM to 7:29 AM (17,962, 16.0%) for females.
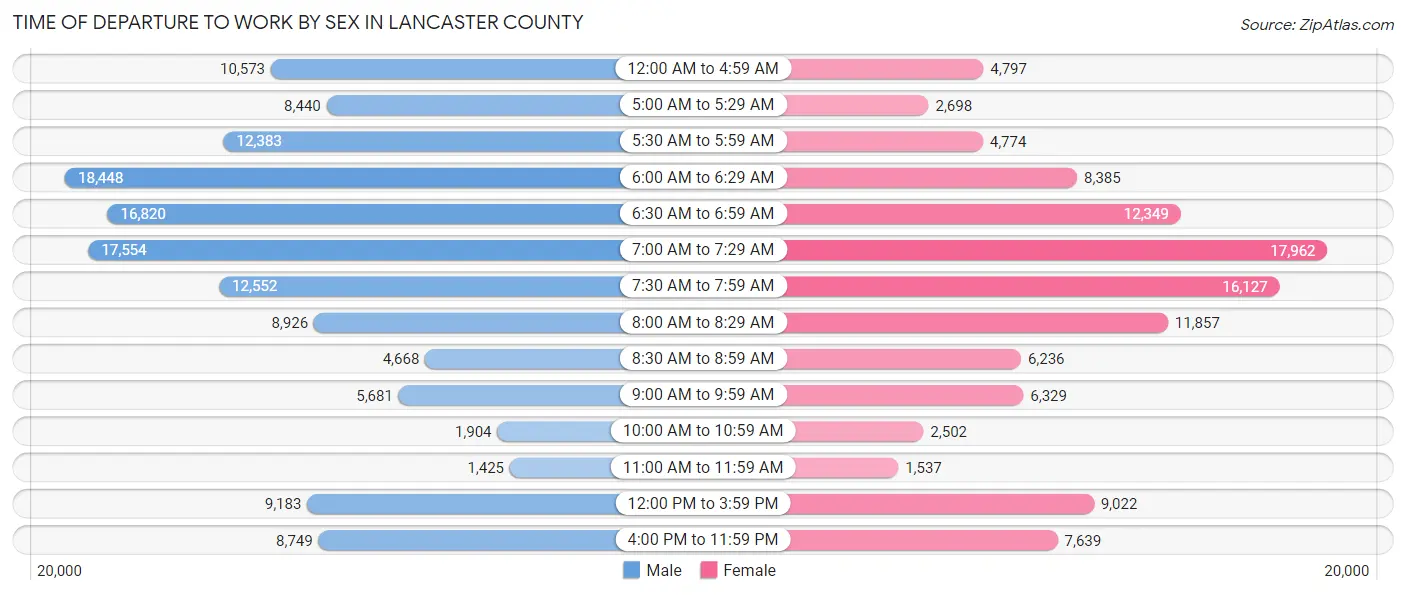
| Time of Departure | Male | Female |
| 12:00 AM to 4:59 AM | 10,573 (7.7%) | 4,797 (4.3%) |
| 5:00 AM to 5:29 AM | 8,440 (6.1%) | 2,698 (2.4%) |
| 5:30 AM to 5:59 AM | 12,383 (9.0%) | 4,774 (4.3%) |
| 6:00 AM to 6:29 AM | 18,448 (13.4%) | 8,385 (7.5%) |
| 6:30 AM to 6:59 AM | 16,820 (12.2%) | 12,349 (11.0%) |
| 7:00 AM to 7:29 AM | 17,554 (12.8%) | 17,962 (16.0%) |
| 7:30 AM to 7:59 AM | 12,552 (9.1%) | 16,127 (14.4%) |
| 8:00 AM to 8:29 AM | 8,926 (6.5%) | 11,857 (10.6%) |
| 8:30 AM to 8:59 AM | 4,668 (3.4%) | 6,236 (5.6%) |
| 9:00 AM to 9:59 AM | 5,681 (4.1%) | 6,329 (5.6%) |
| 10:00 AM to 10:59 AM | 1,904 (1.4%) | 2,502 (2.2%) |
| 11:00 AM to 11:59 AM | 1,425 (1.0%) | 1,537 (1.4%) |
| 12:00 PM to 3:59 PM | 9,183 (6.7%) | 9,022 (8.0%) |
| 4:00 PM to 11:59 PM | 8,749 (6.4%) | 7,639 (6.8%) |
| Total | 137,306 (100.0%) | 112,214 (100.0%) |
Housing Occupancy in Lancaster County
Occupancy by Ownership in Lancaster County
Of the total 208,988 dwellings in Lancaster County, owner-occupied units account for 146,185 (70.0%), while renter-occupied units make up 62,803 (30.0%).
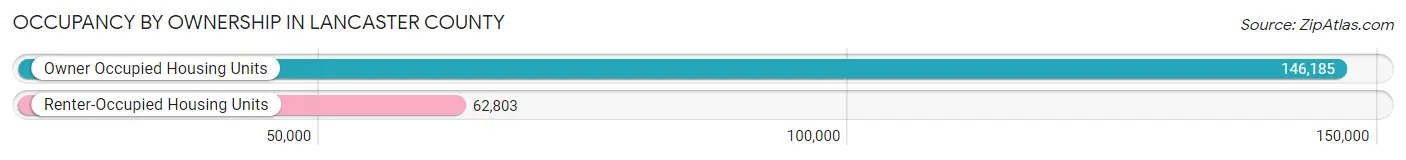
| Occupancy | # Housing Units | % Housing Units |
| Owner Occupied Housing Units | 146,185 | 70.0% |
| Renter-Occupied Housing Units | 62,803 | 30.0% |
| Total Occupied Housing Units | 208,988 | 100.0% |
Occupancy by Household Size in Lancaster County
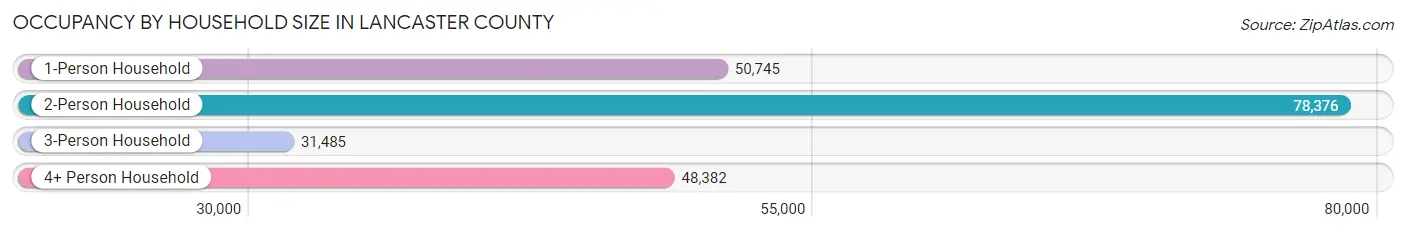
| Household Size | # Housing Units | % Housing Units |
| 1-Person Household | 50,745 | 24.3% |
| 2-Person Household | 78,376 | 37.5% |
| 3-Person Household | 31,485 | 15.1% |
| 4+ Person Household | 48,382 | 23.2% |
| Total Housing Units | 208,988 | 100.0% |
Occupancy by Ownership by Household Size in Lancaster County
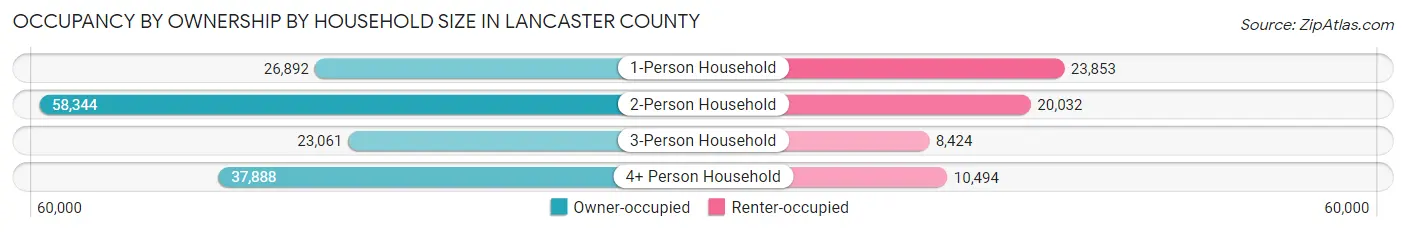
| Household Size | Owner-occupied | Renter-occupied |
| 1-Person Household | 26,892 (53.0%) | 23,853 (47.0%) |
| 2-Person Household | 58,344 (74.4%) | 20,032 (25.6%) |
| 3-Person Household | 23,061 (73.2%) | 8,424 (26.8%) |
| 4+ Person Household | 37,888 (78.3%) | 10,494 (21.7%) |
| Total Housing Units | 146,185 (70.0%) | 62,803 (30.0%) |
Occupancy by Educational Attainment in Lancaster County
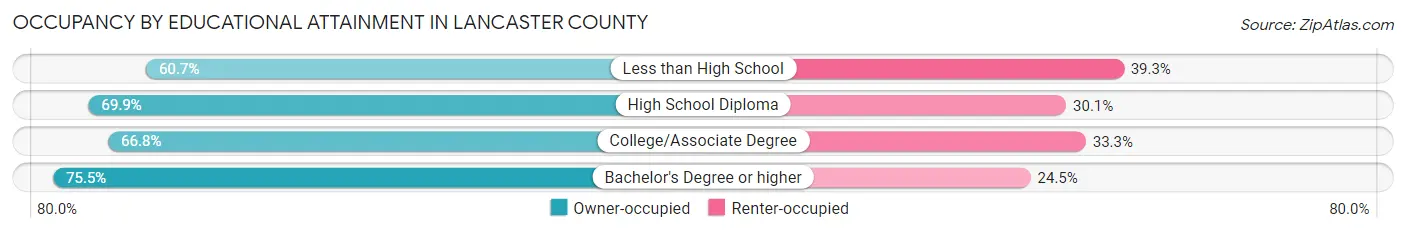
| Household Size | Owner-occupied | Renter-occupied |
| Less than High School | 14,510 (60.7%) | 9,377 (39.3%) |
| High School Diploma | 46,780 (69.9%) | 20,170 (30.1%) |
| College/Associate Degree | 32,870 (66.7%) | 16,376 (33.3%) |
| Bachelor's Degree or higher | 52,025 (75.5%) | 16,880 (24.5%) |
Occupancy by Age of Householder in Lancaster County
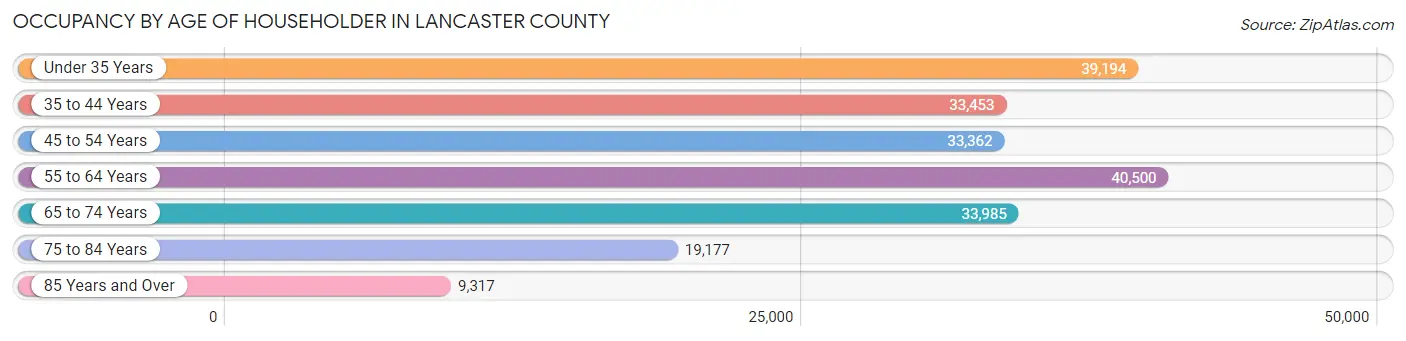
| Age Bracket | # Households | % Households |
| Under 35 Years | 39,194 | 18.8% |
| 35 to 44 Years | 33,453 | 16.0% |
| 45 to 54 Years | 33,362 | 16.0% |
| 55 to 64 Years | 40,500 | 19.4% |
| 65 to 74 Years | 33,985 | 16.3% |
| 75 to 84 Years | 19,177 | 9.2% |
| 85 Years and Over | 9,317 | 4.5% |
| Total | 208,988 | 100.0% |
Housing Finances in Lancaster County
Median Income by Occupancy in Lancaster County
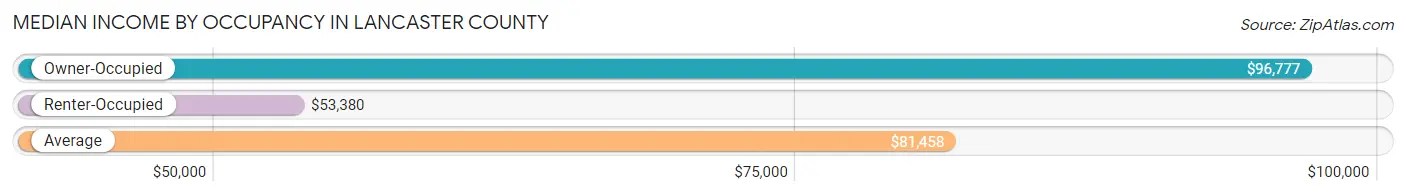
| Occupancy Type | # Households | Median Income |
| Owner-Occupied | 146,185 (70.0%) | $96,777 |
| Renter-Occupied | 62,803 (30.0%) | $53,380 |
| Average | 208,988 (100.0%) | $81,458 |
Occupancy by Householder Income Bracket in Lancaster County
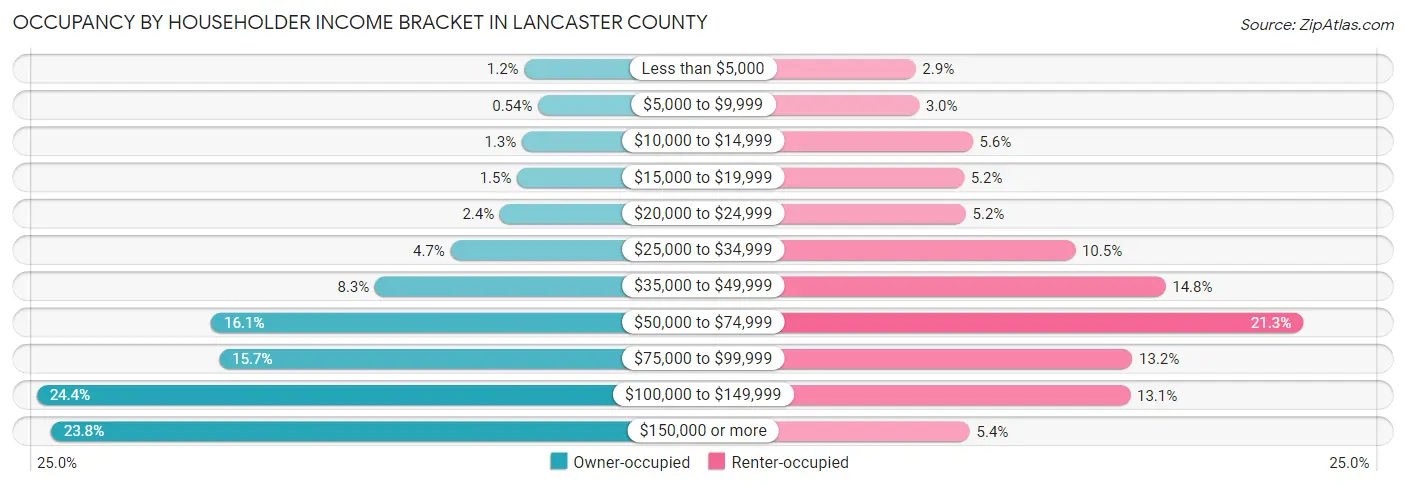
| Income Bracket | Owner-occupied | Renter-occupied |
| Less than $5,000 | 1,747 (1.2%) | 1,790 (2.9%) |
| $5,000 to $9,999 | 787 (0.5%) | 1,891 (3.0%) |
| $10,000 to $14,999 | 1,921 (1.3%) | 3,497 (5.6%) |
| $15,000 to $19,999 | 2,251 (1.5%) | 3,237 (5.1%) |
| $20,000 to $24,999 | 3,454 (2.4%) | 3,289 (5.2%) |
| $25,000 to $34,999 | 6,890 (4.7%) | 6,561 (10.4%) |
| $35,000 to $49,999 | 12,155 (8.3%) | 9,262 (14.7%) |
| $50,000 to $74,999 | 23,558 (16.1%) | 13,386 (21.3%) |
| $75,000 to $99,999 | 23,005 (15.7%) | 8,270 (13.2%) |
| $100,000 to $149,999 | 35,705 (24.4%) | 8,210 (13.1%) |
| $150,000 or more | 34,712 (23.7%) | 3,410 (5.4%) |
| Total | 146,185 (100.0%) | 62,803 (100.0%) |
Monthly Housing Cost Tiers in Lancaster County
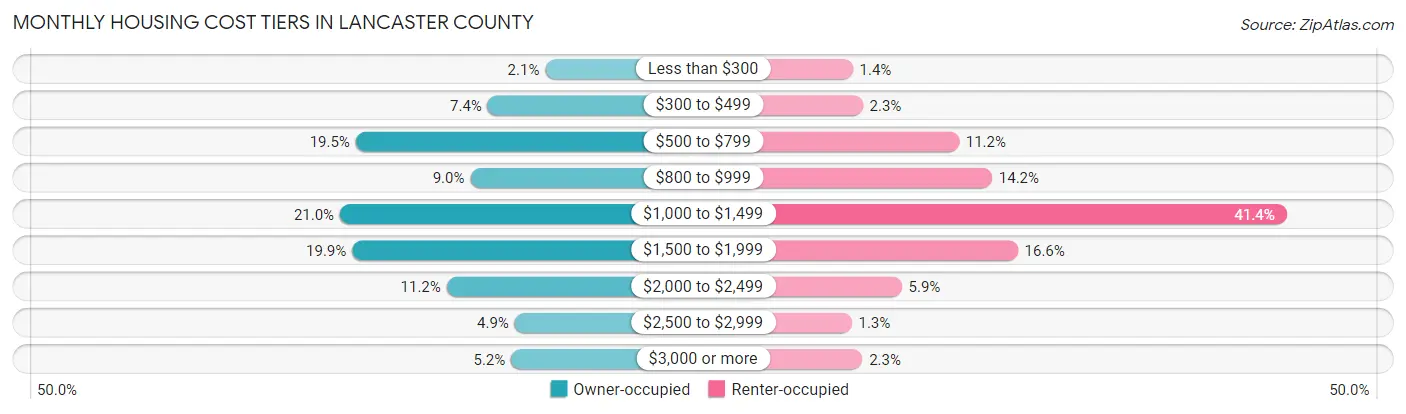
| Monthly Cost | Owner-occupied | Renter-occupied |
| Less than $300 | 3,025 (2.1%) | 877 (1.4%) |
| $300 to $499 | 10,769 (7.4%) | 1,459 (2.3%) |
| $500 to $799 | 28,540 (19.5%) | 7,016 (11.2%) |
| $800 to $999 | 13,114 (9.0%) | 8,930 (14.2%) |
| $1,000 to $1,499 | 30,656 (21.0%) | 25,969 (41.3%) |
| $1,500 to $1,999 | 29,023 (19.9%) | 10,422 (16.6%) |
| $2,000 to $2,499 | 16,304 (11.2%) | 3,711 (5.9%) |
| $2,500 to $2,999 | 7,136 (4.9%) | 816 (1.3%) |
| $3,000 or more | 7,618 (5.2%) | 1,431 (2.3%) |
| Total | 146,185 (100.0%) | 62,803 (100.0%) |
Physical Housing Characteristics in Lancaster County
Housing Structures in Lancaster County
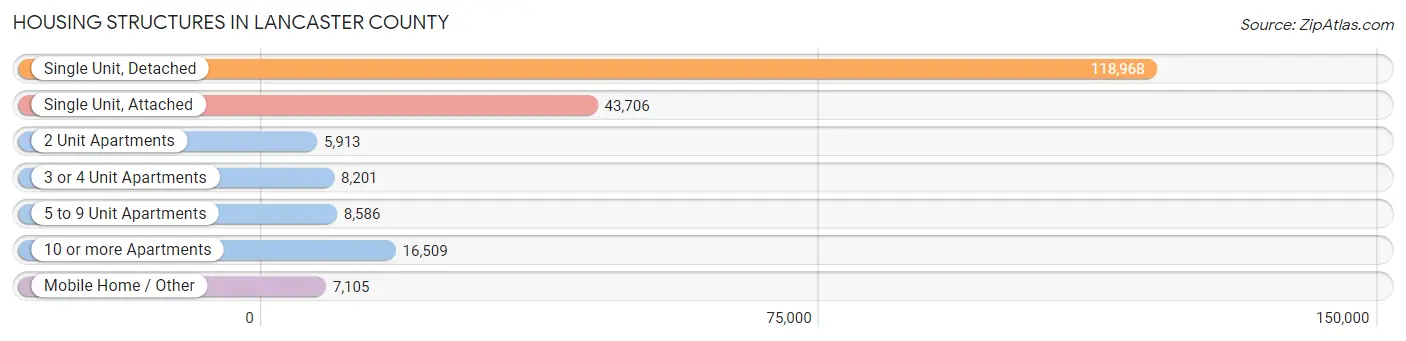
| Structure Type | # Housing Units | % Housing Units |
| Single Unit, Detached | 118,968 | 56.9% |
| Single Unit, Attached | 43,706 | 20.9% |
| 2 Unit Apartments | 5,913 | 2.8% |
| 3 or 4 Unit Apartments | 8,201 | 3.9% |
| 5 to 9 Unit Apartments | 8,586 | 4.1% |
| 10 or more Apartments | 16,509 | 7.9% |
| Mobile Home / Other | 7,105 | 3.4% |
| Total | 208,988 | 100.0% |
Housing Structures by Occupancy in Lancaster County
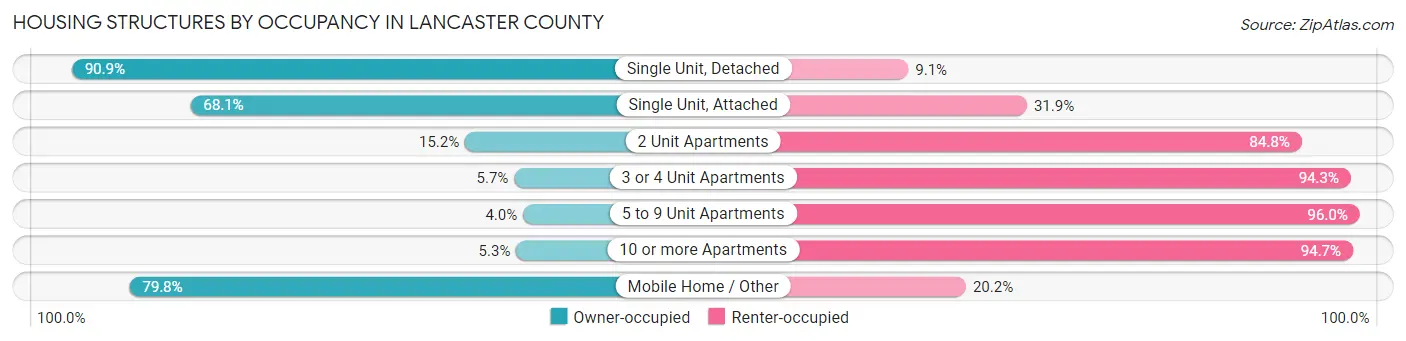
| Structure Type | Owner-occupied | Renter-occupied |
| Single Unit, Detached | 108,165 (90.9%) | 10,803 (9.1%) |
| Single Unit, Attached | 29,751 (68.1%) | 13,955 (31.9%) |
| 2 Unit Apartments | 899 (15.2%) | 5,014 (84.8%) |
| 3 or 4 Unit Apartments | 471 (5.7%) | 7,730 (94.3%) |
| 5 to 9 Unit Apartments | 346 (4.0%) | 8,240 (96.0%) |
| 10 or more Apartments | 882 (5.3%) | 15,627 (94.7%) |
| Mobile Home / Other | 5,671 (79.8%) | 1,434 (20.2%) |
| Total | 146,185 (70.0%) | 62,803 (30.0%) |
Housing Structures by Number of Rooms in Lancaster County
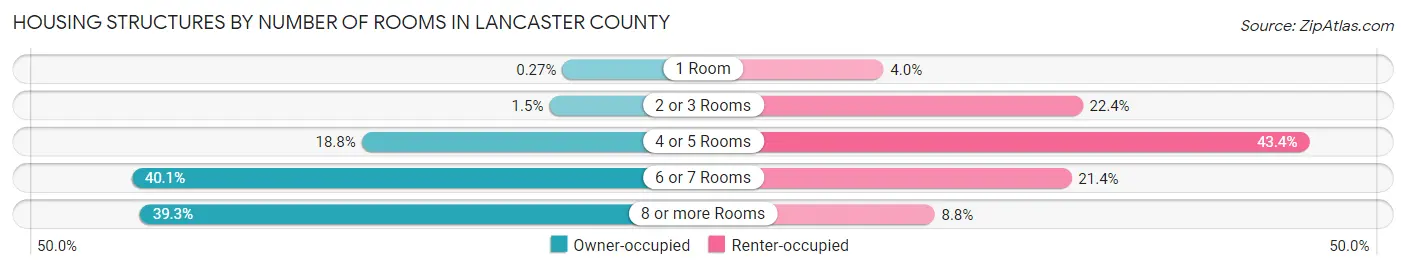
| Number of Rooms | Owner-occupied | Renter-occupied |
| 1 Room | 393 (0.3%) | 2,522 (4.0%) |
| 2 or 3 Rooms | 2,159 (1.5%) | 14,085 (22.4%) |
| 4 or 5 Rooms | 27,535 (18.8%) | 27,256 (43.4%) |
| 6 or 7 Rooms | 58,596 (40.1%) | 13,447 (21.4%) |
| 8 or more Rooms | 57,502 (39.3%) | 5,493 (8.7%) |
| Total | 146,185 (100.0%) | 62,803 (100.0%) |
Housing Structure by Heating Type in Lancaster County
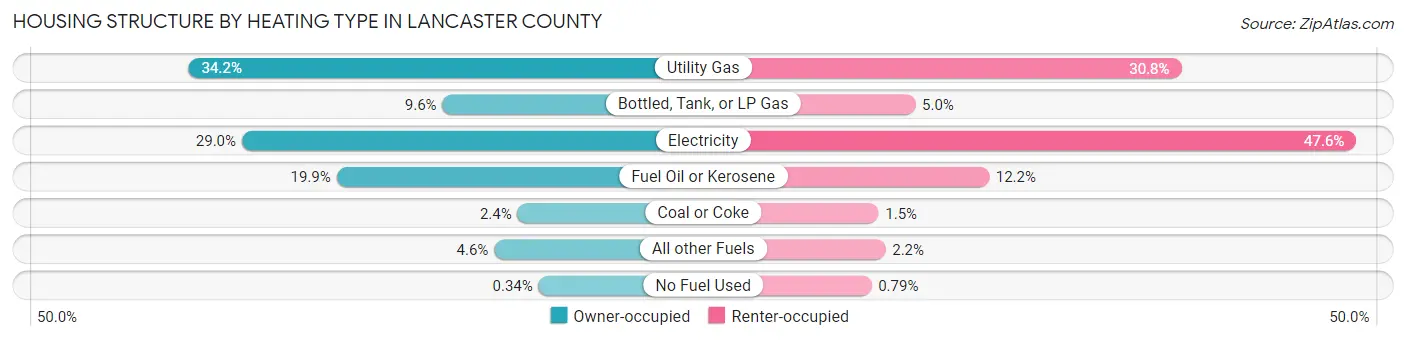
| Heating Type | Owner-occupied | Renter-occupied |
| Utility Gas | 49,944 (34.2%) | 19,310 (30.7%) |
| Bottled, Tank, or LP Gas | 14,075 (9.6%) | 3,161 (5.0%) |
| Electricity | 42,408 (29.0%) | 29,922 (47.6%) |
| Fuel Oil or Kerosene | 29,038 (19.9%) | 7,630 (12.1%) |
| Coal or Coke | 3,460 (2.4%) | 930 (1.5%) |
| All other Fuels | 6,768 (4.6%) | 1,351 (2.1%) |
| No Fuel Used | 492 (0.3%) | 499 (0.8%) |
| Total | 146,185 (100.0%) | 62,803 (100.0%) |
Household Vehicle Usage in Lancaster County
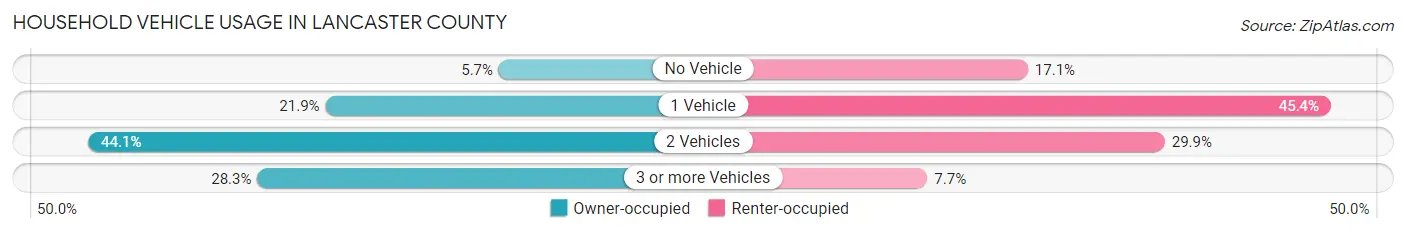
| Vehicles per Household | Owner-occupied | Renter-occupied |
| No Vehicle | 8,375 (5.7%) | 10,727 (17.1%) |
| 1 Vehicle | 32,050 (21.9%) | 28,490 (45.4%) |
| 2 Vehicles | 64,421 (44.1%) | 18,750 (29.9%) |
| 3 or more Vehicles | 41,339 (28.3%) | 4,836 (7.7%) |
| Total | 146,185 (100.0%) | 62,803 (100.0%) |
Real Estate & Mortgages in Lancaster County
Real Estate and Mortgage Overview in Lancaster County
| Characteristic | Without Mortgage | With Mortgage |
| Housing Units | 55,751 | 90,434 |
| Median Property Value | $257,600 | $267,000 |
| Median Household Income | $78,537 | $23,991 |
| Monthly Housing Costs | $668 | $7,344 |
| Real Estate Taxes | $3,836 | $892 |
Property Value by Mortgage Status in Lancaster County
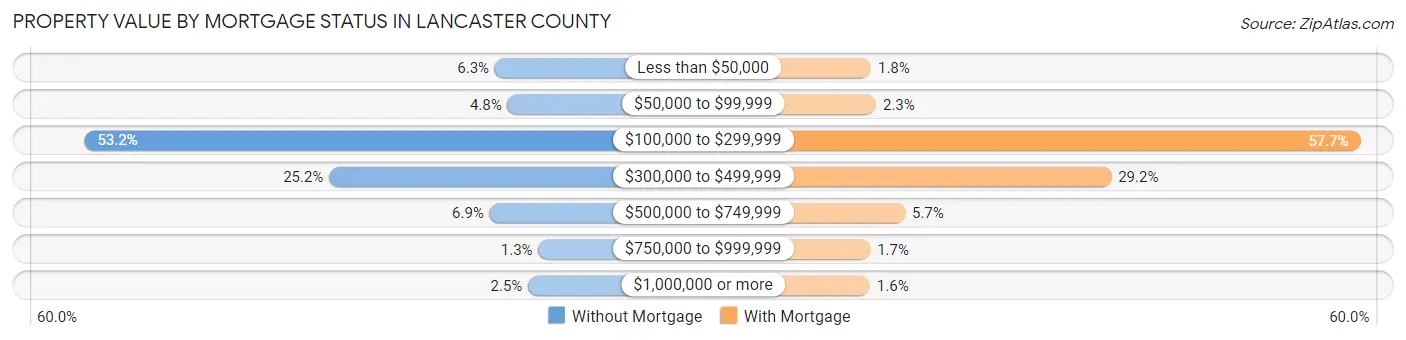
| Property Value | Without Mortgage | With Mortgage |
| Less than $50,000 | 3,485 (6.2%) | 1,605 (1.8%) |
| $50,000 to $99,999 | 2,683 (4.8%) | 2,115 (2.3%) |
| $100,000 to $299,999 | 29,640 (53.2%) | 52,179 (57.7%) |
| $300,000 to $499,999 | 14,041 (25.2%) | 26,428 (29.2%) |
| $500,000 to $749,999 | 3,820 (6.9%) | 5,109 (5.7%) |
| $750,000 to $999,999 | 715 (1.3%) | 1,516 (1.7%) |
| $1,000,000 or more | 1,367 (2.5%) | 1,482 (1.6%) |
| Total | 55,751 (100.0%) | 90,434 (100.0%) |
Household Income by Mortgage Status in Lancaster County
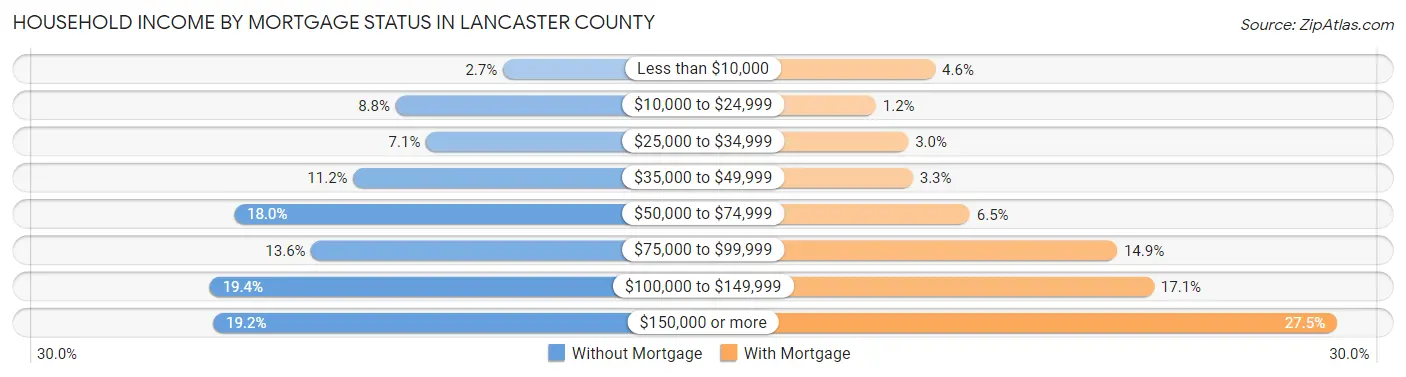
| Household Income | Without Mortgage | With Mortgage |
| Less than $10,000 | 1,485 (2.7%) | 4,113 (4.5%) |
| $10,000 to $24,999 | 4,900 (8.8%) | 1,049 (1.2%) |
| $25,000 to $34,999 | 3,932 (7.0%) | 2,726 (3.0%) |
| $35,000 to $49,999 | 6,250 (11.2%) | 2,958 (3.3%) |
| $50,000 to $74,999 | 10,051 (18.0%) | 5,905 (6.5%) |
| $75,000 to $99,999 | 7,586 (13.6%) | 13,507 (14.9%) |
| $100,000 to $149,999 | 10,826 (19.4%) | 15,419 (17.1%) |
| $150,000 or more | 10,721 (19.2%) | 24,879 (27.5%) |
| Total | 55,751 (100.0%) | 90,434 (100.0%) |
Property Value to Household Income Ratio in Lancaster County
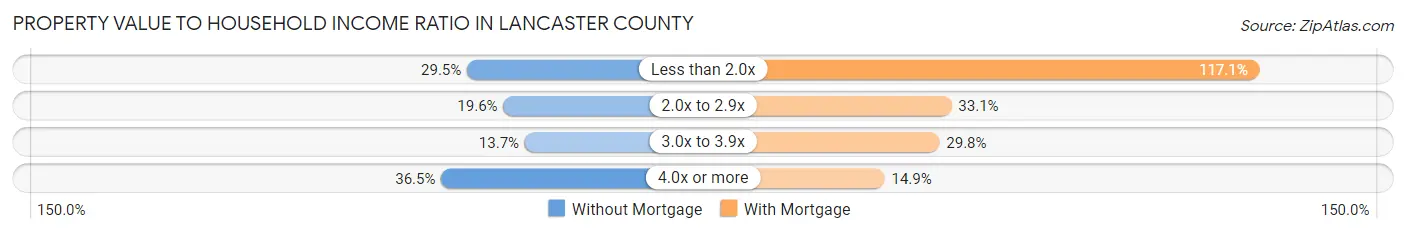
| Value-to-Income Ratio | Without Mortgage | With Mortgage |
| Less than 2.0x | 16,416 (29.4%) | 105,880 (117.1%) |
| 2.0x to 2.9x | 10,904 (19.6%) | 29,929 (33.1%) |
| 3.0x to 3.9x | 7,643 (13.7%) | 26,962 (29.8%) |
| 4.0x or more | 20,345 (36.5%) | 13,461 (14.9%) |
| Total | 55,751 (100.0%) | 90,434 (100.0%) |
Real Estate Taxes by Mortgage Status in Lancaster County
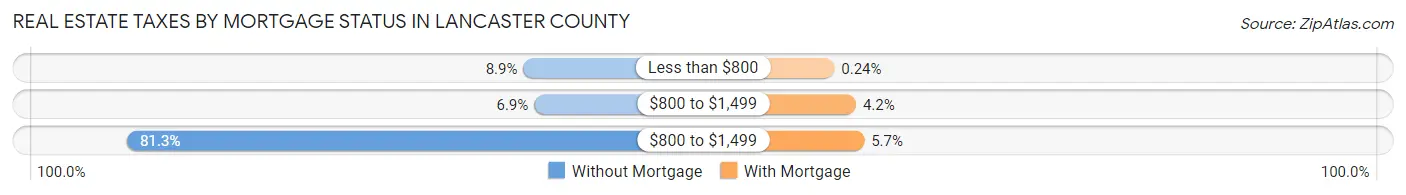
| Property Taxes | Without Mortgage | With Mortgage |
| Less than $800 | 4,969 (8.9%) | 219 (0.2%) |
| $800 to $1,499 | 3,871 (6.9%) | 3,785 (4.2%) |
| $800 to $1,499 | 45,321 (81.3%) | 5,147 (5.7%) |
| Total | 55,751 (100.0%) | 90,434 (100.0%) |
Health & Disability in Lancaster County
Health Insurance Coverage by Age in Lancaster County
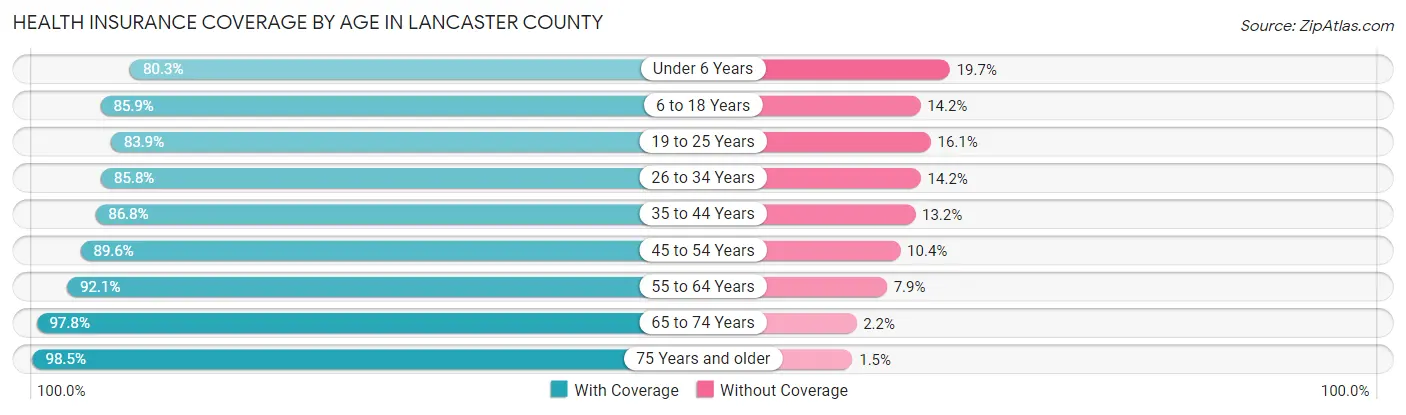
| Age Bracket | With Coverage | Without Coverage |
| Under 6 Years | 33,305 (80.3%) | 8,150 (19.7%) |
| 6 to 18 Years | 81,142 (85.9%) | 13,376 (14.1%) |
| 19 to 25 Years | 41,161 (83.9%) | 7,885 (16.1%) |
| 26 to 34 Years | 55,115 (85.8%) | 9,151 (14.2%) |
| 35 to 44 Years | 55,767 (86.8%) | 8,473 (13.2%) |
| 45 to 54 Years | 56,335 (89.6%) | 6,556 (10.4%) |
| 55 to 64 Years | 65,574 (92.1%) | 5,636 (7.9%) |
| 65 to 74 Years | 54,775 (97.8%) | 1,245 (2.2%) |
| 75 Years and older | 42,806 (98.5%) | 648 (1.5%) |
| Total | 485,980 (88.8%) | 61,120 (11.2%) |
Health Insurance Coverage by Citizenship Status in Lancaster County
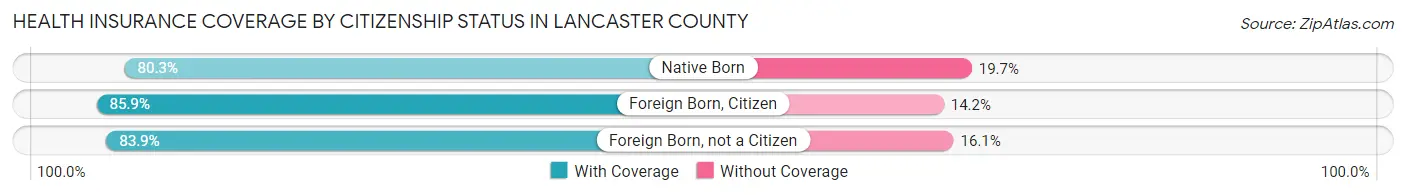
| Citizenship Status | With Coverage | Without Coverage |
| Native Born | 33,305 (80.3%) | 8,150 (19.7%) |
| Foreign Born, Citizen | 81,142 (85.9%) | 13,376 (14.1%) |
| Foreign Born, not a Citizen | 41,161 (83.9%) | 7,885 (16.1%) |
Health Insurance Coverage by Household Income in Lancaster County
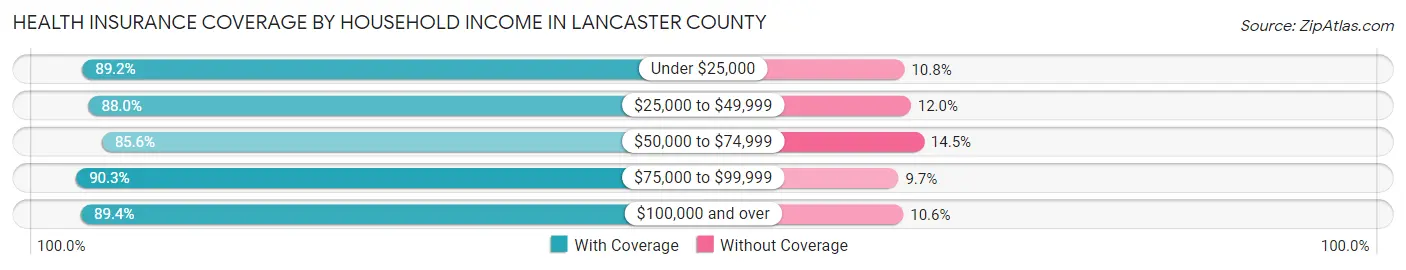
| Household Income | With Coverage | Without Coverage |
| Under $25,000 | 35,359 (89.2%) | 4,285 (10.8%) |
| $25,000 to $49,999 | 60,265 (88.0%) | 8,207 (12.0%) |
| $50,000 to $74,999 | 75,071 (85.6%) | 12,685 (14.4%) |
| $75,000 to $99,999 | 76,691 (90.3%) | 8,222 (9.7%) |
| $100,000 and over | 231,751 (89.4%) | 27,459 (10.6%) |
Public vs Private Health Insurance Coverage by Age in Lancaster County
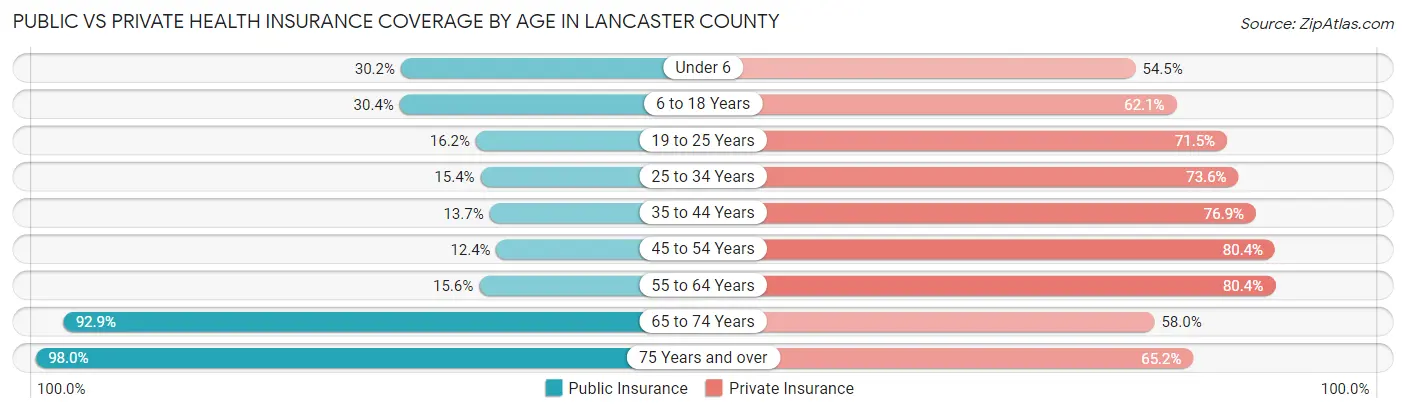
| Age Bracket | Public Insurance | Private Insurance |
| Under 6 | 12,506 (30.2%) | 22,607 (54.5%) |
| 6 to 18 Years | 28,718 (30.4%) | 58,697 (62.1%) |
| 19 to 25 Years | 7,963 (16.2%) | 35,057 (71.5%) |
| 25 to 34 Years | 9,898 (15.4%) | 47,303 (73.6%) |
| 35 to 44 Years | 8,807 (13.7%) | 49,372 (76.9%) |
| 45 to 54 Years | 7,814 (12.4%) | 50,557 (80.4%) |
| 55 to 64 Years | 11,135 (15.6%) | 57,253 (80.4%) |
| 65 to 74 Years | 52,053 (92.9%) | 32,512 (58.0%) |
| 75 Years and over | 42,594 (98.0%) | 28,345 (65.2%) |
| Total | 181,488 (33.2%) | 381,703 (69.8%) |
Disability Status by Sex by Age in Lancaster County
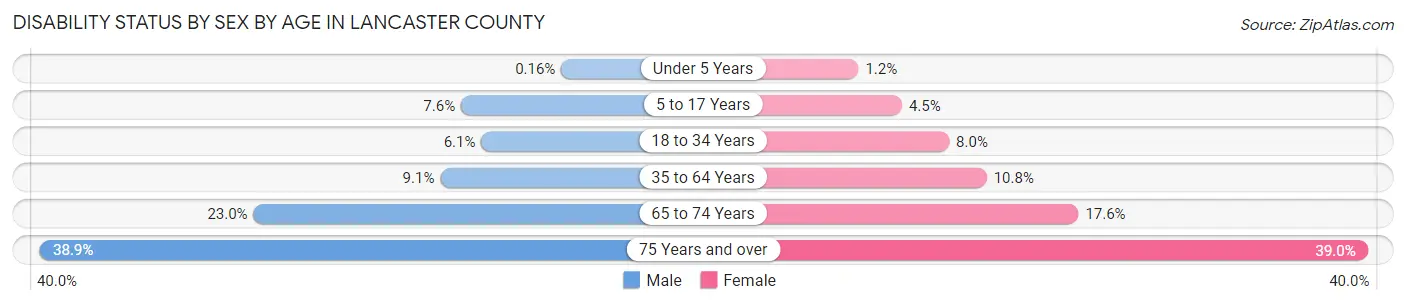
| Age Bracket | Male | Female |
| Under 5 Years | 29 (0.2%) | 209 (1.2%) |
| 5 to 17 Years | 3,648 (7.6%) | 2,034 (4.5%) |
| 18 to 34 Years | 3,691 (6.1%) | 4,819 (8.0%) |
| 35 to 64 Years | 9,011 (9.1%) | 10,734 (10.8%) |
| 65 to 74 Years | 6,133 (23.0%) | 5,159 (17.6%) |
| 75 Years and over | 7,048 (38.9%) | 9,880 (39.0%) |
Disability Class by Sex by Age in Lancaster County
Disability Class: Hearing Difficulty
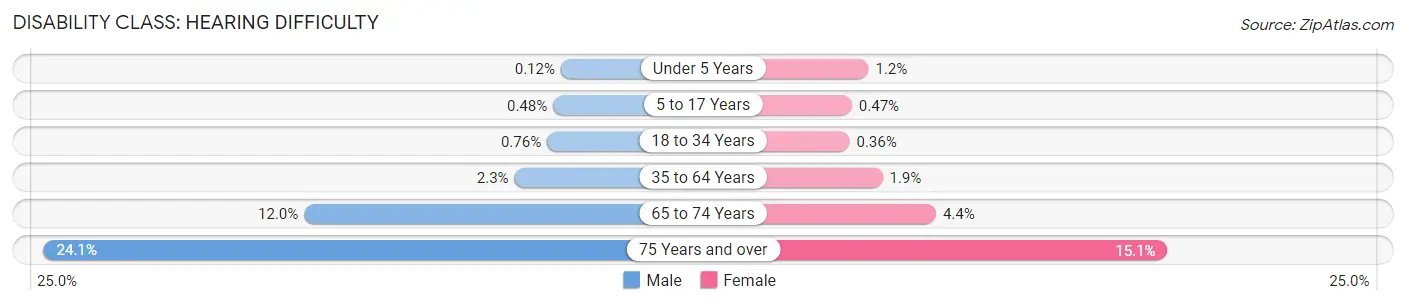
| Age Bracket | Male | Female |
| Under 5 Years | 21 (0.1%) | 209 (1.2%) |
| 5 to 17 Years | 229 (0.5%) | 214 (0.5%) |
| 18 to 34 Years | 461 (0.8%) | 217 (0.4%) |
| 35 to 64 Years | 2,241 (2.3%) | 1,884 (1.9%) |
| 65 to 74 Years | 3,207 (12.0%) | 1,283 (4.4%) |
| 75 Years and over | 4,376 (24.1%) | 3,826 (15.1%) |
Disability Class: Vision Difficulty
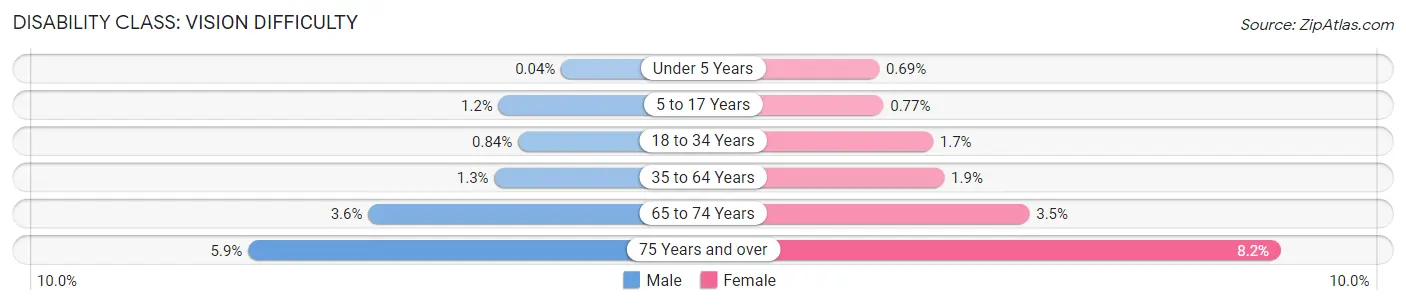
| Age Bracket | Male | Female |
| Under 5 Years | 8 (0.0%) | 116 (0.7%) |
| 5 to 17 Years | 576 (1.2%) | 352 (0.8%) |
| 18 to 34 Years | 507 (0.8%) | 1,022 (1.7%) |
| 35 to 64 Years | 1,265 (1.3%) | 1,891 (1.9%) |
| 65 to 74 Years | 965 (3.6%) | 1,023 (3.5%) |
| 75 Years and over | 1,062 (5.9%) | 2,064 (8.2%) |
Disability Class: Cognitive Difficulty
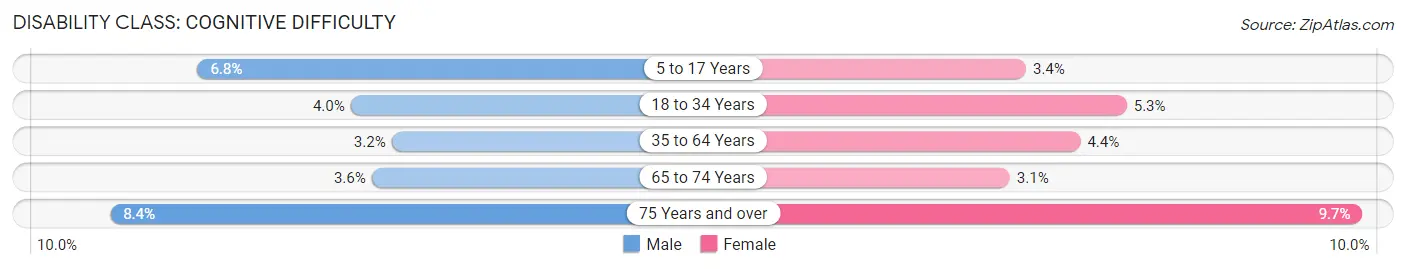
| Age Bracket | Male | Female |
| 5 to 17 Years | 3,258 (6.8%) | 1,555 (3.4%) |
| 18 to 34 Years | 2,397 (4.0%) | 3,198 (5.3%) |
| 35 to 64 Years | 3,142 (3.2%) | 4,416 (4.4%) |
| 65 to 74 Years | 949 (3.6%) | 916 (3.1%) |
| 75 Years and over | 1,526 (8.4%) | 2,444 (9.7%) |
Disability Class: Ambulatory Difficulty
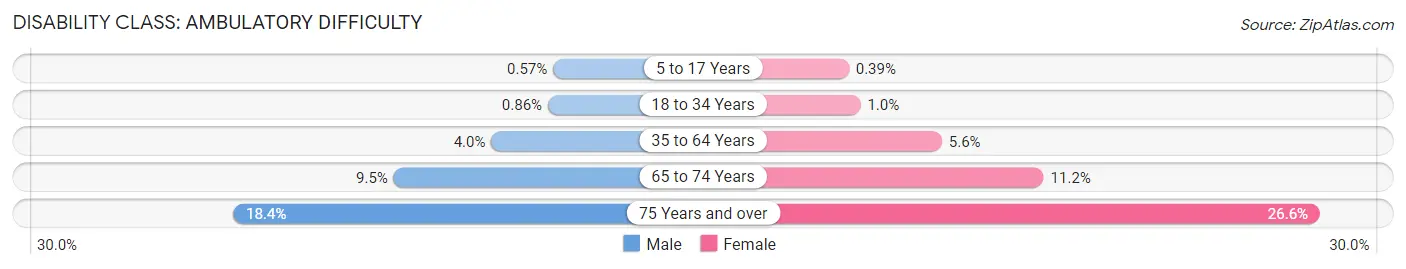
| Age Bracket | Male | Female |
| 5 to 17 Years | 273 (0.6%) | 178 (0.4%) |
| 18 to 34 Years | 523 (0.9%) | 628 (1.0%) |
| 35 to 64 Years | 3,955 (4.0%) | 5,555 (5.6%) |
| 65 to 74 Years | 2,518 (9.5%) | 3,302 (11.2%) |
| 75 Years and over | 3,337 (18.4%) | 6,738 (26.6%) |
Disability Class: Self-Care Difficulty
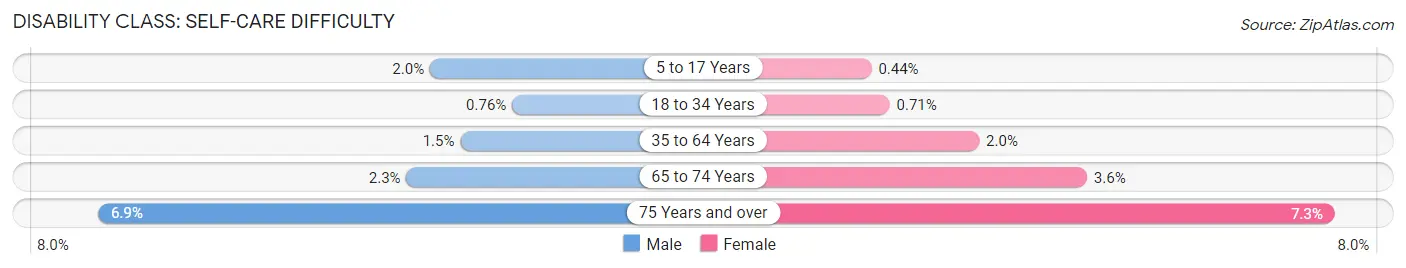
| Age Bracket | Male | Female |
| 5 to 17 Years | 951 (2.0%) | 202 (0.4%) |
| 18 to 34 Years | 461 (0.8%) | 431 (0.7%) |
| 35 to 64 Years | 1,505 (1.5%) | 2,030 (2.0%) |
| 65 to 74 Years | 622 (2.3%) | 1,070 (3.6%) |
| 75 Years and over | 1,254 (6.9%) | 1,854 (7.3%) |
Technology Access in Lancaster County
Computing Device Access in Lancaster County
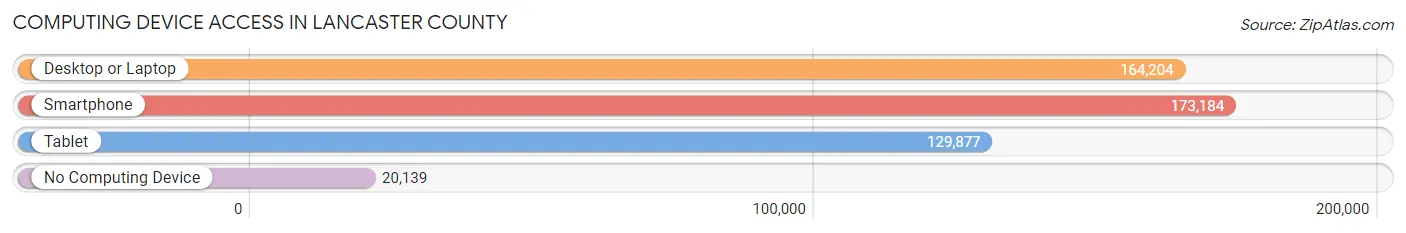
| Device Type | # Households | % Households |
| Desktop or Laptop | 164,204 | 78.6% |
| Smartphone | 173,184 | 82.9% |
| Tablet | 129,877 | 62.2% |
| No Computing Device | 20,139 | 9.6% |
| Total | 208,988 | 100.0% |
Internet Access in Lancaster County
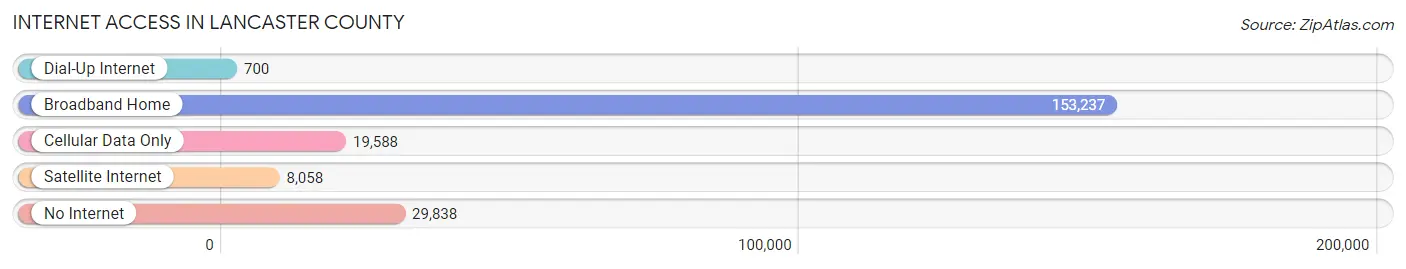
| Internet Type | # Households | % Households |
| Dial-Up Internet | 700 | 0.3% |
| Broadband Home | 153,237 | 73.3% |
| Cellular Data Only | 19,588 | 9.4% |
| Satellite Internet | 8,058 | 3.9% |
| No Internet | 29,838 | 14.3% |
| Total | 208,988 | 100.0% |
Lancaster County Summary
Lancaster County, Pennsylvania is located in the southeastern part of the state and is part of the Philadelphia metropolitan area. It is bordered by Berks, Lebanon, and Chester counties to the north, Dauphin County to the east, York County to the south, and Lebanon County to the west. The county seat is Lancaster, and the county is home to over 545,000 people.
History
Lancaster County was established in 1729 and was named after the city of Lancaster in England. The county was originally part of Chester County and was part of William Penn’s original land grant. The county was home to many Native American tribes, including the Susquehannock, Iroquois, and Lenape. The county was also home to many early settlers, including the Mennonites, Amish, and Quakers.
The county was an important part of the Revolutionary War, as it was the site of the Battle of Brandywine in 1777. The county was also home to the Continental Congress in 1777 and 1778.
Geography
Lancaster County is located in the southeastern part of Pennsylvania and is part of the Philadelphia metropolitan area. The county is bordered by Berks, Lebanon, and Chester counties to the north, Dauphin County to the east, York County to the south, and Lebanon County to the west. The county is home to many rivers, including the Susquehanna, Conestoga, and Pequea. The county is also home to many parks, including the Lancaster County Central Park, the Lancaster County Park, and the Lancaster County Nature Preserve.
Economy
Lancaster County has a diverse economy, with a mix of manufacturing, agriculture, and services. The county is home to many large companies, including Armstrong World Industries, Hershey Foods, and Lancaster General Hospital. The county is also home to many small businesses, including restaurants, retail stores, and professional services.
Agriculture is an important part of the county’s economy, with the county being home to many farms and agricultural businesses. The county is also home to many wineries and breweries, as well as a thriving tourism industry.
Demographics
As of the 2010 census, Lancaster County had a population of 545,717 people. The population is made up of a mix of races and ethnicities, with the largest group being White (83.3%), followed by Hispanic or Latino (7.7%), Black or African American (4.3%), and Asian (2.7%). The median household income in the county is $60,845, and the median age is 38.7 years.
Conclusion
Lancaster County, Pennsylvania is a diverse and vibrant county located in the southeastern part of the state. The county has a rich history, with many Native American tribes, early settlers, and Revolutionary War sites. The county is home to many large and small businesses, as well as a thriving agricultural and tourism industry. The county is also home to a diverse population, with a mix of races and ethnicities.
Common Questions
What is Per Capita Income in Lancaster County?
Per Capita income in Lancaster County is $39,872.
What is the Median Family Income in Lancaster County?
Median Family Income in Lancaster County is $97,622.
What is the Median Household income in Lancaster County?
Median Household Income in Lancaster County is $81,458.
What is Income or Wage Gap in Lancaster County?
Income or Wage Gap in Lancaster County is 38.4%.
Women in Lancaster County earn 61.6 cents for every dollar earned by a man.
What is Family Income Deficit in Lancaster County?
Family Income Deficit in Lancaster County is $10,551.
Families that are below poverty line in Lancaster County earn $10,551 less on average than the poverty threshold level.
What is Inequality or Gini Index in Lancaster County?
Inequality or Gini Index in Lancaster County is 0.43.
What is the Total Population of Lancaster County?
Total Population of Lancaster County is 553,202.
What is the Total Male Population of Lancaster County?
Total Male Population of Lancaster County is 272,524.
What is the Total Female Population of Lancaster County?
Total Female Population of Lancaster County is 280,678.
What is the Ratio of Males per 100 Females in Lancaster County?
There are 97.09 Males per 100 Females in Lancaster County.
What is the Ratio of Females per 100 Males in Lancaster County?
There are 102.99 Females per 100 Males in Lancaster County.
What is the Median Population Age in Lancaster County?
Median Population Age in Lancaster County is 39.0 Years.
What is the Average Family Size in Lancaster County
Average Family Size in Lancaster County is 3.1 People.
What is the Average Household Size in Lancaster County
Average Household Size in Lancaster County is 2.6 People.
How Large is the Labor Force in Lancaster County?
There are 289,739 People in the Labor Forcein in Lancaster County.
What is the Percentage of People in the Labor Force in Lancaster County?
66.0% of People are in the Labor Force in Lancaster County.
What is the Unemployment Rate in Lancaster County?
Unemployment Rate in Lancaster County is 3.4%.