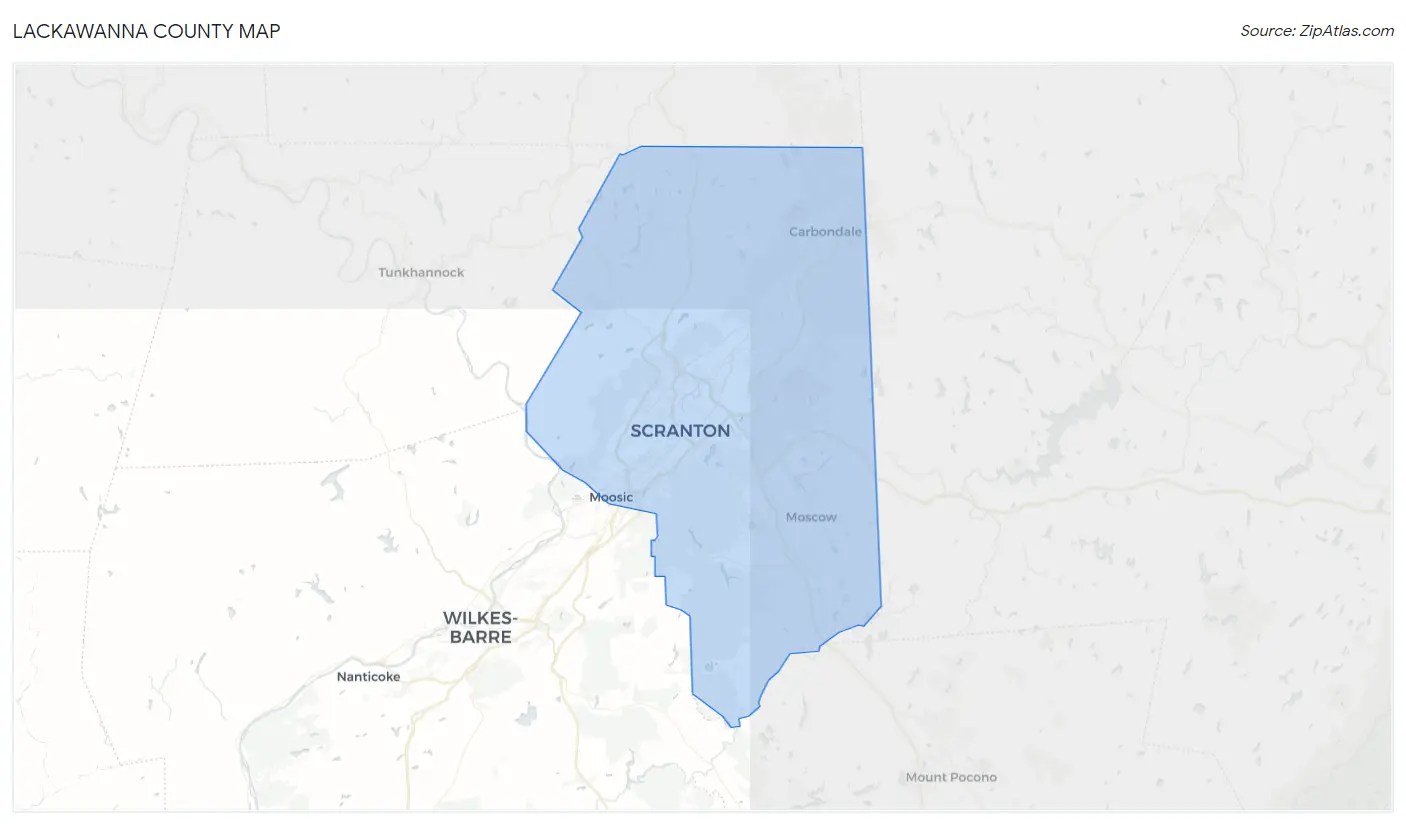
Lackawanna County, PA Map & Demographics
Lackawanna County Map
Lackawanna County Overview
$35,296
PER CAPITA INCOME
$82,944
AVG FAMILY INCOME
$63,739
AVG HOUSEHOLD INCOME
26.4%
WAGE / INCOME GAP [ % ]
73.6¢/ $1
WAGE / INCOME GAP [ $ ]
$10,256
FAMILY INCOME DEFICIT
0.46
INEQUALITY / GINI INDEX
215,672
TOTAL POPULATION
105,900
MALE POPULATION
109,772
FEMALE POPULATION
96.47
MALES / 100 FEMALES
103.66
FEMALES / 100 MALES
41.9
MEDIAN AGE
3.0
AVG FAMILY SIZE
2.4
AVG HOUSEHOLD SIZE
107,620
LABOR FORCE [ PEOPLE ]
60.6%
PERCENT IN LABOR FORCE
4.8%
UNEMPLOYMENT RATE
Lackawanna County Area Codes
Income in Lackawanna County
Income Overview in Lackawanna County
Per Capita Income in Lackawanna County is $35,296, while median incomes of families and households are $82,944 and $63,739 respectively.
| Characteristic | Number | Measure |
| Per Capita Income | 215,672 | $35,296 |
| Median Family Income | 53,783 | $82,944 |
| Mean Family Income | 53,783 | $102,868 |
| Median Household Income | 87,896 | $63,739 |
| Mean Household Income | 87,896 | $85,038 |
| Income Deficit | 53,783 | $10,256 |
| Wage / Income Gap (%) | 215,672 | 26.44% |
| Wage / Income Gap ($) | 215,672 | 73.56¢ per $1 |
| Gini / Inequality Index | 215,672 | 0.46 |
Earnings by Sex in Lackawanna County
Average Earnings in Lackawanna County are $38,430, $44,958 for men and $33,069 for women, a difference of 26.4%.
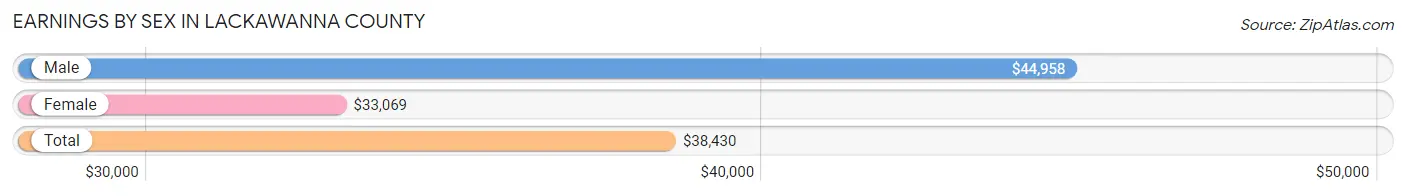
| Sex | Number | Average Earnings |
| Male | 59,867 (52.2%) | $44,958 |
| Female | 54,778 (47.8%) | $33,069 |
| Total | 114,645 (100.0%) | $38,430 |
Earnings by Sex by Income Bracket in Lackawanna County
The most common earnings brackets in Lackawanna County are $100,000+ for men (7,469 | 12.5%) and $75,000 to $99,999 for women (4,423 | 8.1%).
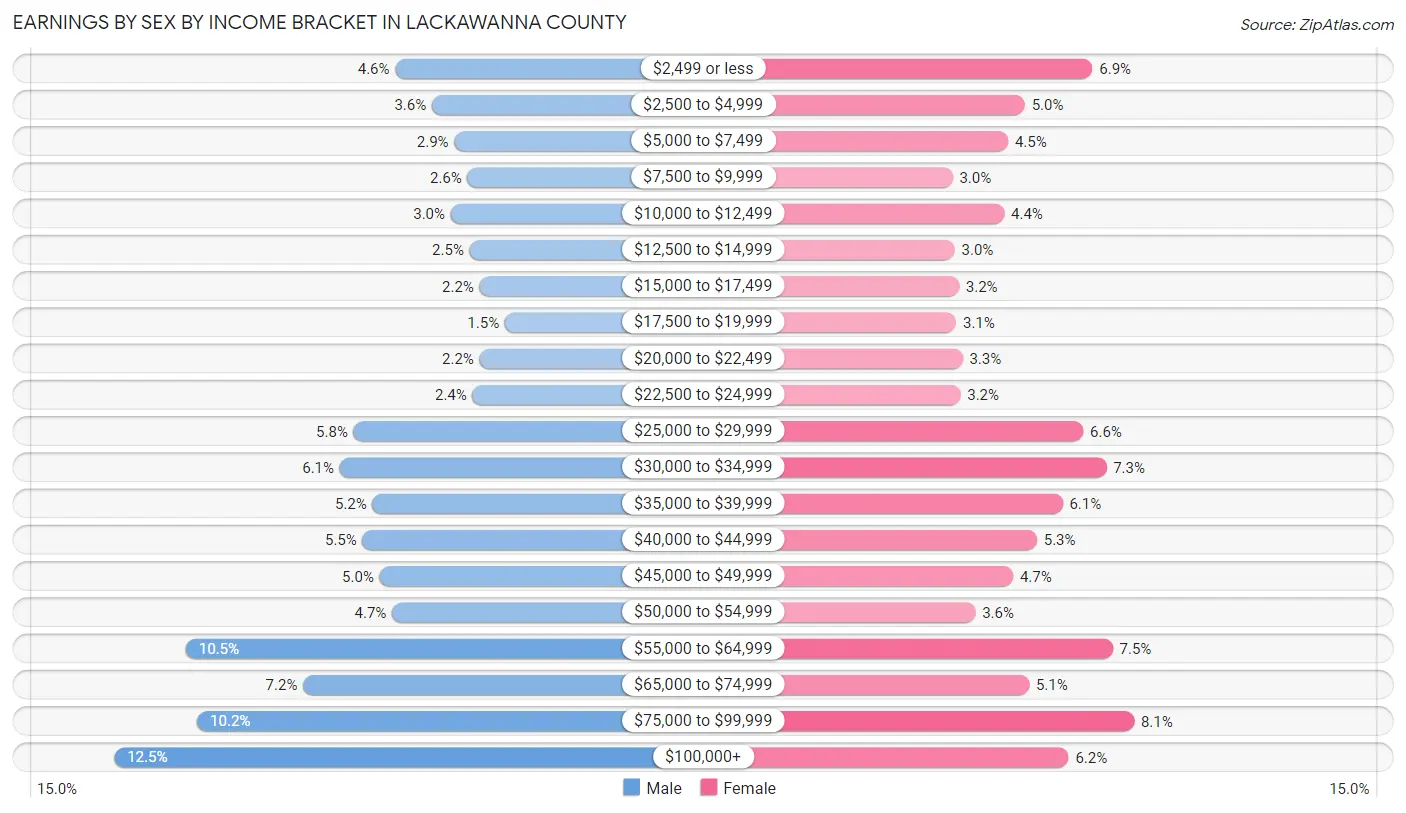
| Income | Male | Female |
| $2,499 or less | 2,741 (4.6%) | 3,780 (6.9%) |
| $2,500 to $4,999 | 2,123 (3.5%) | 2,738 (5.0%) |
| $5,000 to $7,499 | 1,746 (2.9%) | 2,481 (4.5%) |
| $7,500 to $9,999 | 1,527 (2.5%) | 1,628 (3.0%) |
| $10,000 to $12,499 | 1,809 (3.0%) | 2,420 (4.4%) |
| $12,500 to $14,999 | 1,493 (2.5%) | 1,659 (3.0%) |
| $15,000 to $17,499 | 1,321 (2.2%) | 1,723 (3.2%) |
| $17,500 to $19,999 | 896 (1.5%) | 1,683 (3.1%) |
| $20,000 to $22,499 | 1,324 (2.2%) | 1,782 (3.3%) |
| $22,500 to $24,999 | 1,442 (2.4%) | 1,749 (3.2%) |
| $25,000 to $29,999 | 3,440 (5.8%) | 3,638 (6.6%) |
| $30,000 to $34,999 | 3,674 (6.1%) | 3,991 (7.3%) |
| $35,000 to $39,999 | 3,128 (5.2%) | 3,317 (6.1%) |
| $40,000 to $44,999 | 3,292 (5.5%) | 2,924 (5.3%) |
| $45,000 to $49,999 | 3,004 (5.0%) | 2,557 (4.7%) |
| $50,000 to $54,999 | 2,796 (4.7%) | 1,977 (3.6%) |
| $55,000 to $64,999 | 6,270 (10.5%) | 4,091 (7.5%) |
| $65,000 to $74,999 | 4,293 (7.2%) | 2,807 (5.1%) |
| $75,000 to $99,999 | 6,079 (10.2%) | 4,423 (8.1%) |
| $100,000+ | 7,469 (12.5%) | 3,410 (6.2%) |
| Total | 59,867 (100.0%) | 54,778 (100.0%) |
Earnings by Sex by Educational Attainment in Lackawanna County
Average earnings in Lackawanna County are $51,481 for men and $38,422 for women, a difference of 25.4%. Men with an educational attainment of graduate degree enjoy the highest average annual earnings of $85,322, while those with less than high school education earn the least with $31,213. Women with an educational attainment of graduate degree earn the most with the average annual earnings of $70,344, while those with less than high school education have the smallest earnings of $24,316.
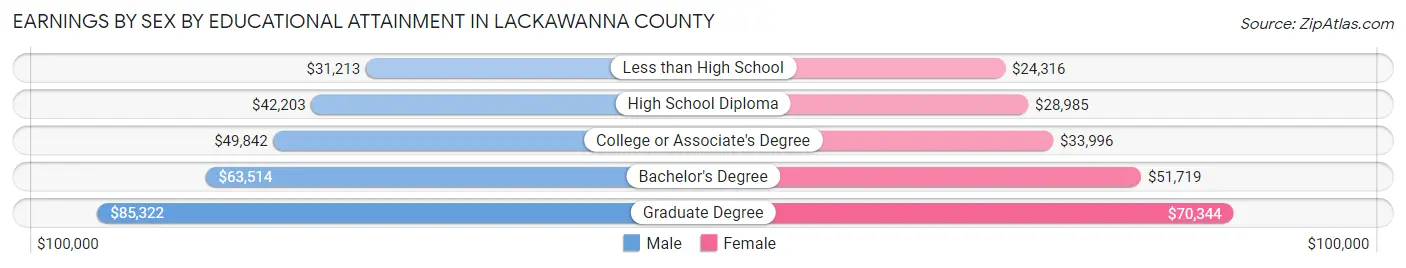
| Educational Attainment | Male Income | Female Income |
| Less than High School | $31,213 | $24,316 |
| High School Diploma | $42,203 | $28,985 |
| College or Associate's Degree | $49,842 | $33,996 |
| Bachelor's Degree | $63,514 | $51,719 |
| Graduate Degree | $85,322 | $70,344 |
| Total | $51,481 | $38,422 |
Family Income in Lackawanna County
Family Income Brackets in Lackawanna County
According to the Lackawanna County family income data, there are 11,510 families falling into the $100,000 to $149,999 income range, which is the most common income bracket and makes up 21.4% of all families. Conversely, the $10,000 to $14,999 income bracket is the least frequent group with only 1,183 families (2.2%) belonging to this category.
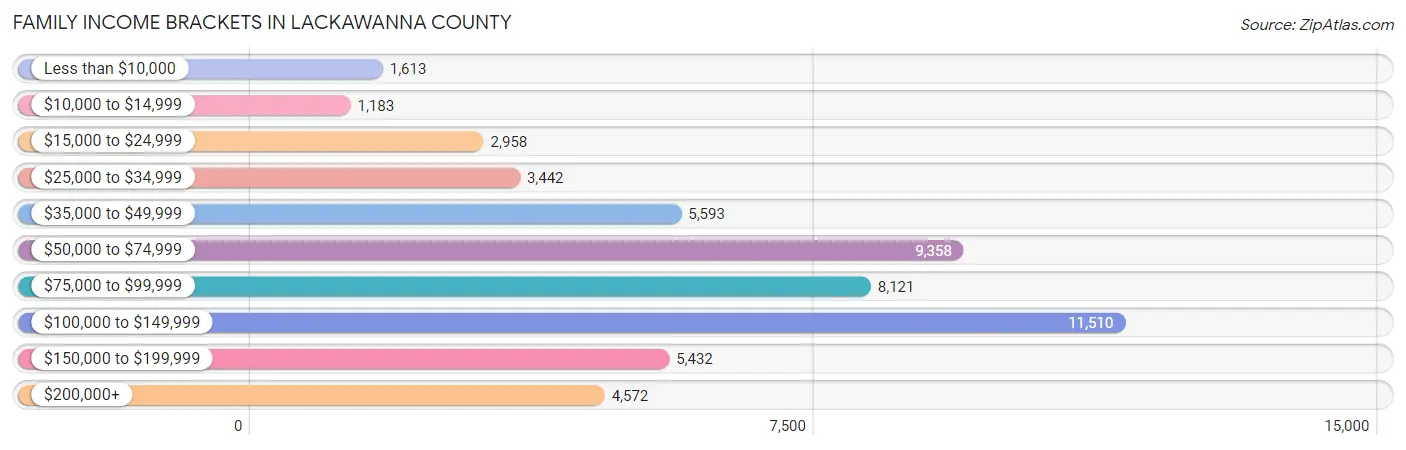
| Income Bracket | # Families | % Families |
| Less than $10,000 | 1,613 | 3.0% |
| $10,000 to $14,999 | 1,183 | 2.2% |
| $15,000 to $24,999 | 2,958 | 5.5% |
| $25,000 to $34,999 | 3,442 | 6.4% |
| $35,000 to $49,999 | 5,593 | 10.4% |
| $50,000 to $74,999 | 9,358 | 17.4% |
| $75,000 to $99,999 | 8,121 | 15.1% |
| $100,000 to $149,999 | 11,510 | 21.4% |
| $150,000 to $199,999 | 5,432 | 10.1% |
| $200,000+ | 4,572 | 8.5% |
Family Income by Famaliy Size in Lackawanna County
5-person families (3,607 | 6.7%) account for the highest median family income in Lackawanna County with $110,074 per family, while 2-person families (26,773 | 49.8%) have the highest median income of $36,192 per family member.
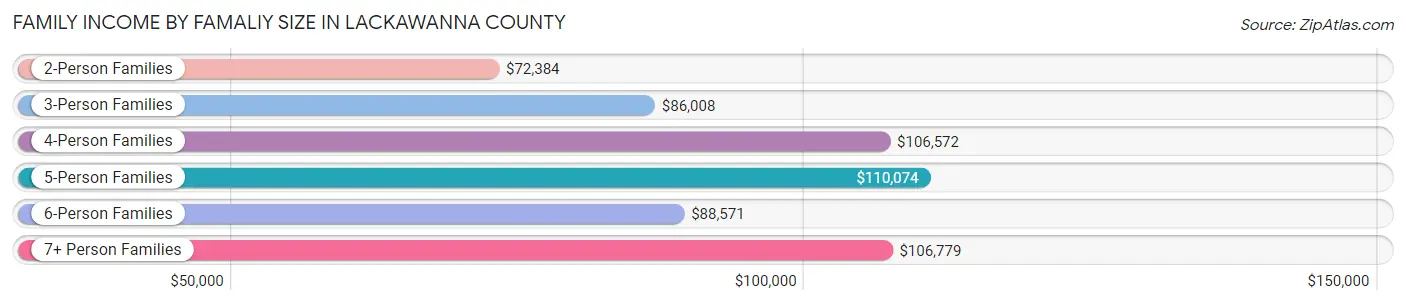
| Income Bracket | # Families | Median Income |
| 2-Person Families | 26,773 (49.8%) | $72,384 |
| 3-Person Families | 12,595 (23.4%) | $86,008 |
| 4-Person Families | 8,714 (16.2%) | $106,572 |
| 5-Person Families | 3,607 (6.7%) | $110,074 |
| 6-Person Families | 1,184 (2.2%) | $88,571 |
| 7+ Person Families | 910 (1.7%) | $106,779 |
| Total | 53,783 (100.0%) | $82,944 |
Family Income by Number of Earners in Lackawanna County
The median family income in Lackawanna County is $82,944, with families comprising 3+ earners (6,808) having the highest median family income of $130,750, while families with no earners (8,393) have the lowest median family income of $43,288, accounting for 12.7% and 15.6% of families, respectively.
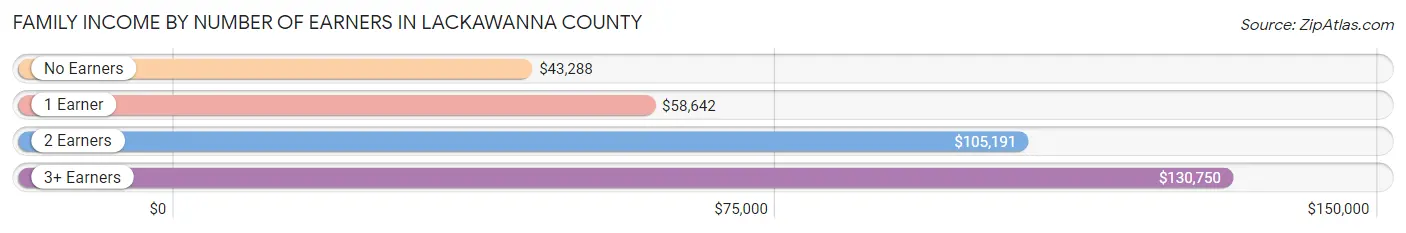
| Number of Earners | # Families | Median Income |
| No Earners | 8,393 (15.6%) | $43,288 |
| 1 Earner | 17,427 (32.4%) | $58,642 |
| 2 Earners | 21,155 (39.3%) | $105,191 |
| 3+ Earners | 6,808 (12.7%) | $130,750 |
| Total | 53,783 (100.0%) | $82,944 |
Household Income in Lackawanna County
Household Income Brackets in Lackawanna County
With 15,470 households falling in the category, the $50,000 to $74,999 income range is the most frequent in Lackawanna County, accounting for 17.6% of all households. In contrast, only 4,131 households (4.7%) fall into the less than $10,000 income bracket, making it the least populous group.
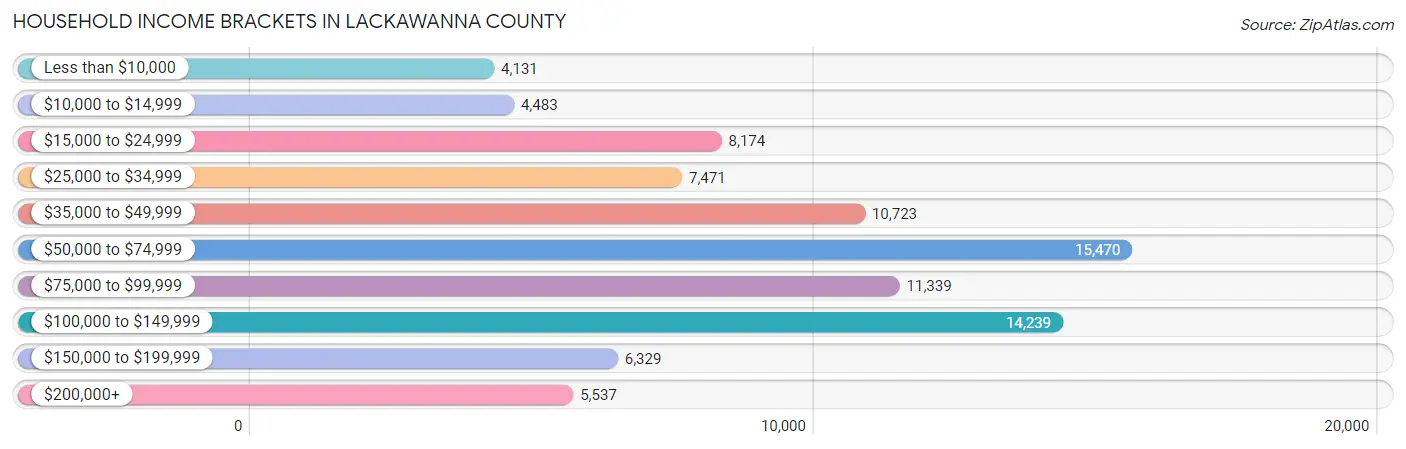
| Income Bracket | # Households | % Households |
| Less than $10,000 | 4,131 | 4.7% |
| $10,000 to $14,999 | 4,483 | 5.1% |
| $15,000 to $24,999 | 8,174 | 9.3% |
| $25,000 to $34,999 | 7,471 | 8.5% |
| $35,000 to $49,999 | 10,723 | 12.2% |
| $50,000 to $74,999 | 15,470 | 17.6% |
| $75,000 to $99,999 | 11,339 | 12.9% |
| $100,000 to $149,999 | 14,239 | 16.2% |
| $150,000 to $199,999 | 6,329 | 7.2% |
| $200,000+ | 5,537 | 6.3% |
Household Income by Householder Age in Lackawanna County
The median household income in Lackawanna County is $63,739, with the highest median household income of $77,226 found in the 45 to 64 years age bracket for the primary householder. A total of 33,265 households (37.9%) fall into this category. Meanwhile, the 15 to 24 years age bracket for the primary householder has the lowest median household income of $34,003, with 2,277 households (2.6%) in this group.
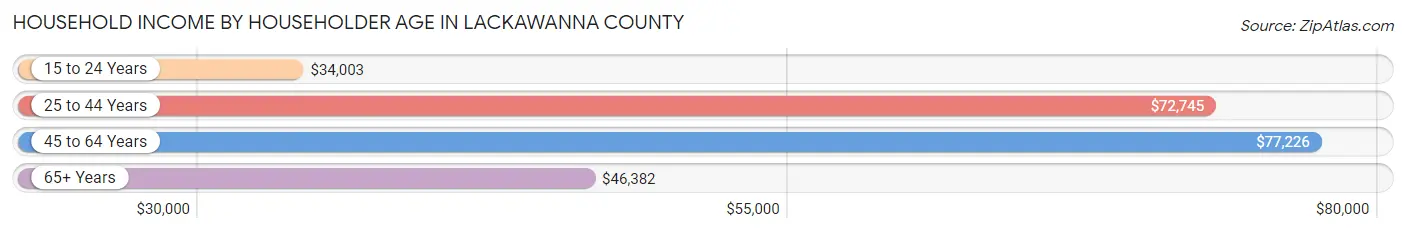
| Income Bracket | # Households | Median Income |
| 15 to 24 Years | 2,277 (2.6%) | $34,003 |
| 25 to 44 Years | 25,192 (28.7%) | $72,745 |
| 45 to 64 Years | 33,265 (37.9%) | $77,226 |
| 65+ Years | 27,162 (30.9%) | $46,382 |
| Total | 87,896 (100.0%) | $63,739 |
Poverty in Lackawanna County
Income Below Poverty by Sex and Age in Lackawanna County
With 11.1% poverty level for males and 14.8% for females among the residents of Lackawanna County, 18 to 24 year old males and under 5 year old females are the most vulnerable to poverty, with 1,612 males (20.0%) and 1,406 females (27.0%) in their respective age groups living below the poverty level.
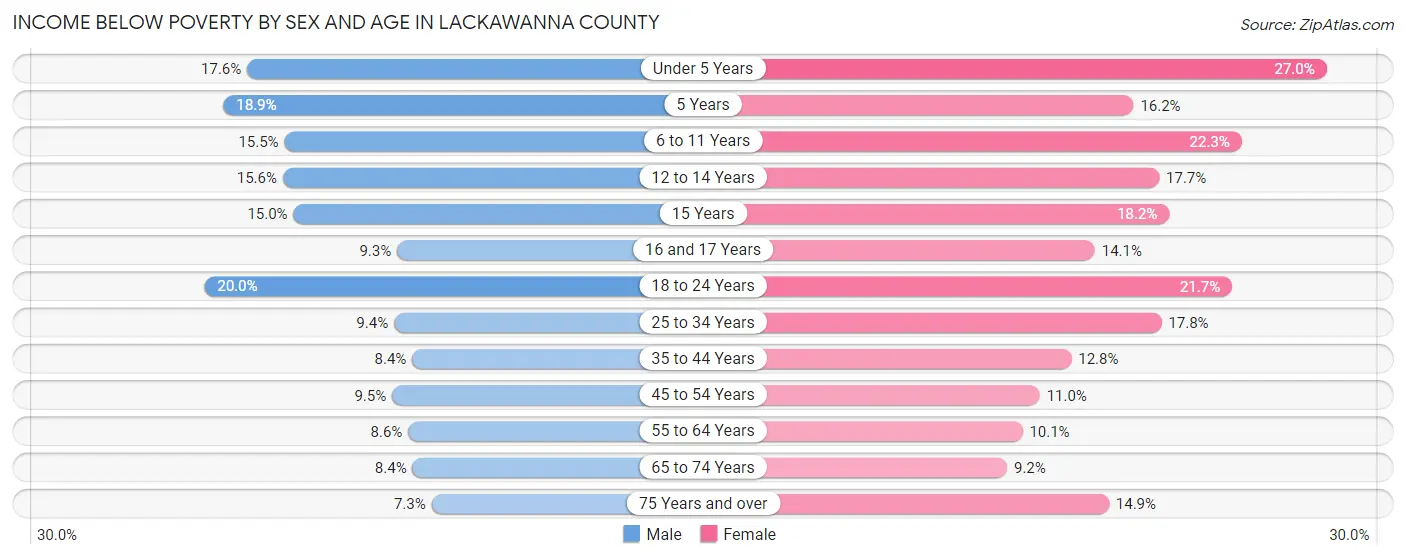
| Age Bracket | Male | Female |
| Under 5 Years | 987 (17.6%) | 1,406 (27.0%) |
| 5 Years | 222 (18.9%) | 160 (16.2%) |
| 6 to 11 Years | 1,202 (15.5%) | 1,560 (22.3%) |
| 12 to 14 Years | 608 (15.6%) | 715 (17.7%) |
| 15 Years | 138 (15.0%) | 183 (18.2%) |
| 16 and 17 Years | 303 (9.3%) | 371 (14.1%) |
| 18 to 24 Years | 1,612 (20.0%) | 1,683 (21.7%) |
| 25 to 34 Years | 1,229 (9.4%) | 2,297 (17.8%) |
| 35 to 44 Years | 1,057 (8.4%) | 1,599 (12.8%) |
| 45 to 54 Years | 1,264 (9.5%) | 1,466 (11.0%) |
| 55 to 64 Years | 1,272 (8.6%) | 1,537 (10.1%) |
| 65 to 74 Years | 968 (8.4%) | 1,164 (9.2%) |
| 75 Years and over | 486 (7.3%) | 1,521 (14.9%) |
| Total | 11,348 (11.1%) | 15,662 (14.8%) |
Income Above Poverty by Sex and Age in Lackawanna County
According to the poverty statistics in Lackawanna County, males aged 75 years and over and females aged 65 to 74 years are the age groups that are most secure financially, with 92.7% of males and 90.8% of females in these age groups living above the poverty line.
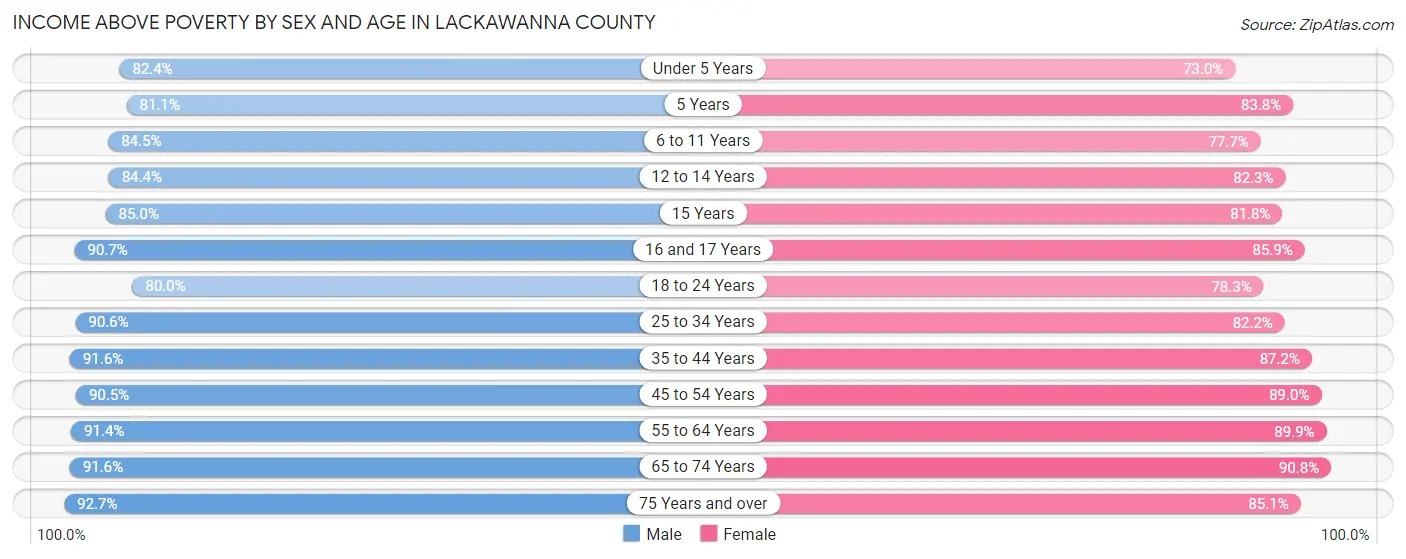
| Age Bracket | Male | Female |
| Under 5 Years | 4,619 (82.4%) | 3,803 (73.0%) |
| 5 Years | 951 (81.1%) | 825 (83.8%) |
| 6 to 11 Years | 6,539 (84.5%) | 5,447 (77.7%) |
| 12 to 14 Years | 3,284 (84.4%) | 3,332 (82.3%) |
| 15 Years | 780 (85.0%) | 821 (81.8%) |
| 16 and 17 Years | 2,970 (90.7%) | 2,262 (85.9%) |
| 18 to 24 Years | 6,453 (80.0%) | 6,063 (78.3%) |
| 25 to 34 Years | 11,798 (90.6%) | 10,605 (82.2%) |
| 35 to 44 Years | 11,502 (91.6%) | 10,913 (87.2%) |
| 45 to 54 Years | 11,992 (90.5%) | 11,835 (89.0%) |
| 55 to 64 Years | 13,446 (91.4%) | 13,748 (89.9%) |
| 65 to 74 Years | 10,556 (91.6%) | 11,482 (90.8%) |
| 75 Years and over | 6,132 (92.7%) | 8,710 (85.1%) |
| Total | 91,022 (88.9%) | 89,846 (85.2%) |
Income Below Poverty Among Married-Couple Families in Lackawanna County
The poverty statistics for married-couple families in Lackawanna County show that 3.7% or 1,406 of the total 37,993 families live below the poverty line. Families with 5 or more children have the highest poverty rate of 15.0%, comprising of 47 families. On the other hand, families with 1 or 2 children have the lowest poverty rate of 2.8%, which includes 290 families.
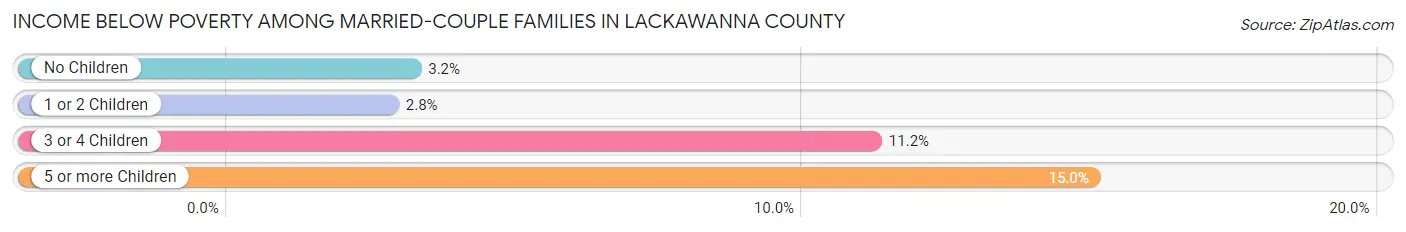
| Children | Above Poverty | Below Poverty |
| No Children | 24,081 (96.8%) | 794 (3.2%) |
| 1 or 2 Children | 10,062 (97.2%) | 290 (2.8%) |
| 3 or 4 Children | 2,178 (88.8%) | 275 (11.2%) |
| 5 or more Children | 266 (85.0%) | 47 (15.0%) |
| Total | 36,587 (96.3%) | 1,406 (3.7%) |
Income Below Poverty Among Single-Parent Households in Lackawanna County
According to the poverty data in Lackawanna County, 16.0% or 793 single-father households and 26.6% or 2,878 single-mother households are living below the poverty line. Among single-father households, those with 3 or 4 children have the highest poverty rate, with 108 households (23.9%) experiencing poverty. Likewise, among single-mother households, those with 3 or 4 children have the highest poverty rate, with 515 households (53.1%) falling below the poverty line.
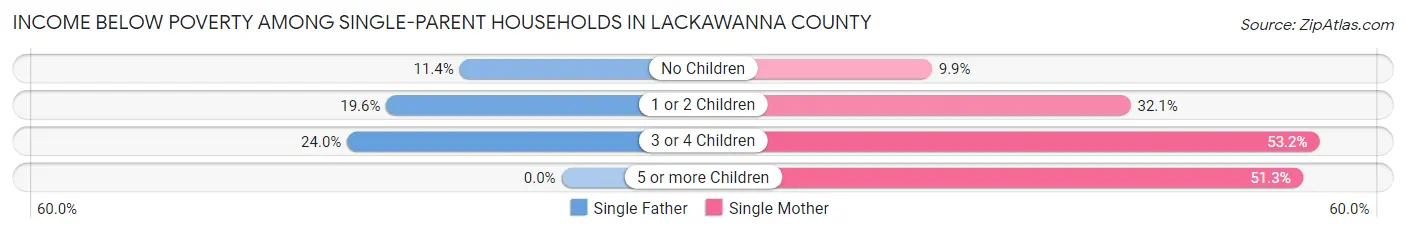
| Children | Single Father | Single Mother |
| No Children | 244 (11.4%) | 369 (9.9%) |
| 1 or 2 Children | 441 (19.6%) | 1,913 (32.1%) |
| 3 or 4 Children | 108 (23.9%) | 515 (53.1%) |
| 5 or more Children | 0 (0.0%) | 81 (51.3%) |
| Total | 793 (16.0%) | 2,878 (26.6%) |
Income Below Poverty Among Married-Couple vs Single-Parent Households in Lackawanna County
The poverty data for Lackawanna County shows that 1,406 of the married-couple family households (3.7%) and 3,671 of the single-parent households (23.3%) are living below the poverty level. Within the married-couple family households, those with 5 or more children have the highest poverty rate, with 47 households (15.0%) falling below the poverty line. Among the single-parent households, those with 3 or 4 children have the highest poverty rate, with 623 household (43.9%) living below poverty.
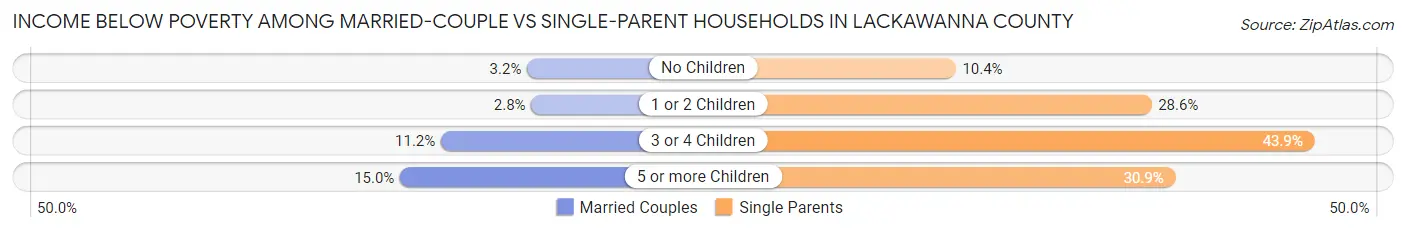
| Children | Married-Couple Families | Single-Parent Households |
| No Children | 794 (3.2%) | 613 (10.4%) |
| 1 or 2 Children | 290 (2.8%) | 2,354 (28.6%) |
| 3 or 4 Children | 275 (11.2%) | 623 (43.9%) |
| 5 or more Children | 47 (15.0%) | 81 (30.9%) |
| Total | 1,406 (3.7%) | 3,671 (23.3%) |
Race in Lackawanna County
The most populous races in Lackawanna County are White / Caucasian (183,886 | 85.3%), Hispanic or Latino (19,428 | 9.0%), and Two or more Races (14,635 | 6.8%).
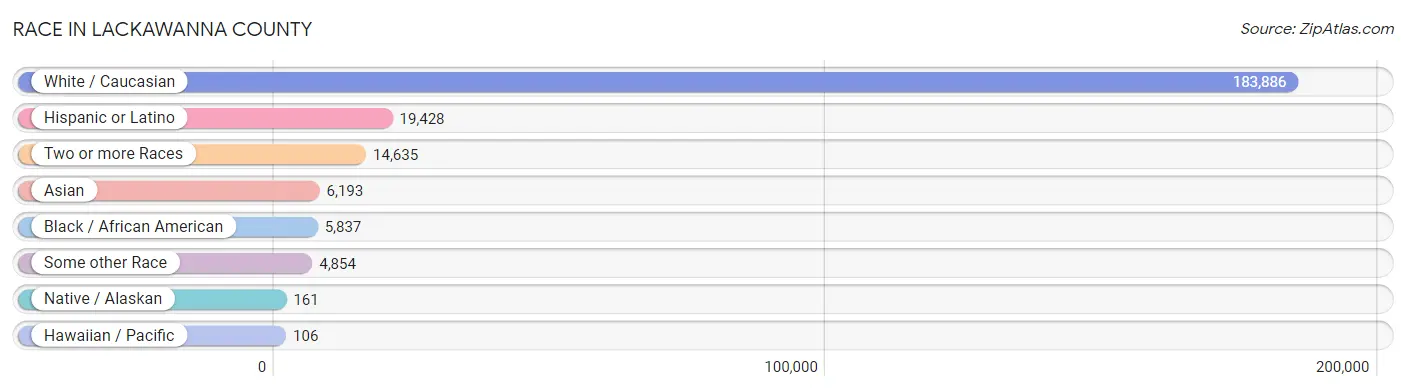
| Race | # Population | % Population |
| Asian | 6,193 | 2.9% |
| Black / African American | 5,837 | 2.7% |
| Hawaiian / Pacific | 106 | 0.1% |
| Hispanic or Latino | 19,428 | 9.0% |
| Native / Alaskan | 161 | 0.1% |
| White / Caucasian | 183,886 | 85.3% |
| Two or more Races | 14,635 | 6.8% |
| Some other Race | 4,854 | 2.2% |
| Total | 215,672 | 100.0% |
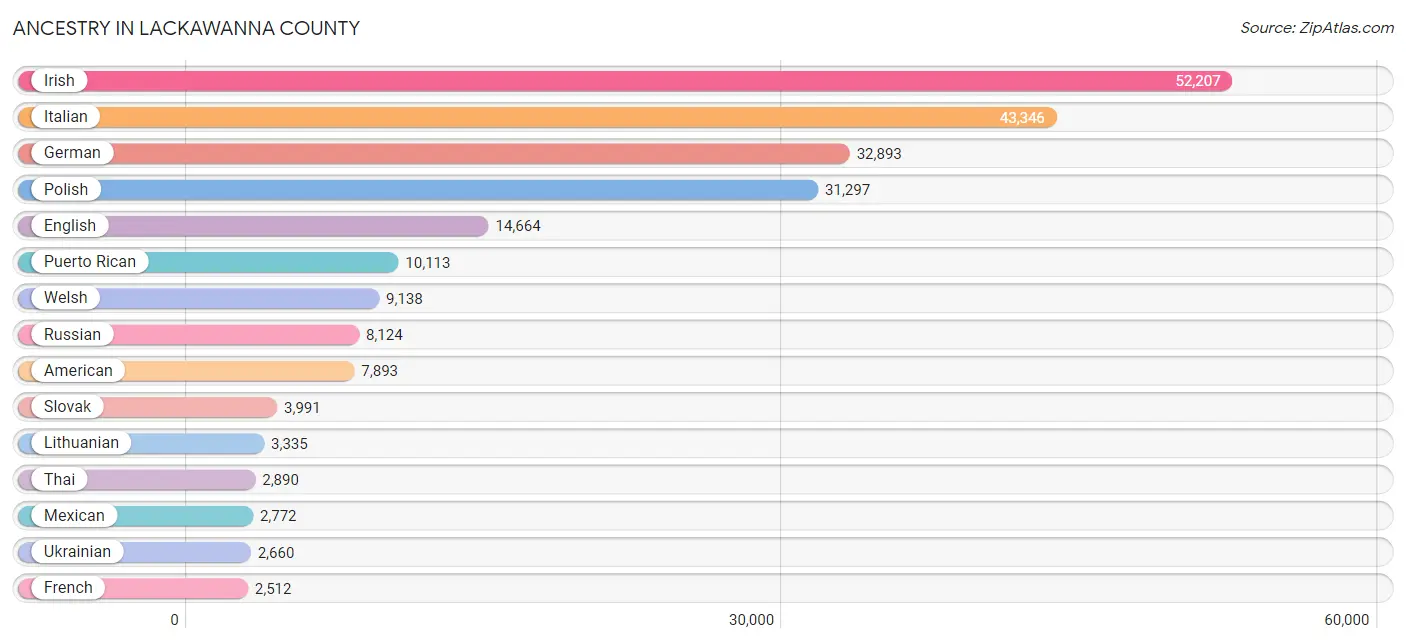
Ancestry in Lackawanna County
The most populous ancestries reported in Lackawanna County are Irish (52,207 | 24.2%), Italian (43,346 | 20.1%), German (32,893 | 15.2%), Polish (31,297 | 14.5%), and English (14,664 | 6.8%), together accounting for 80.9% of all Lackawanna County residents.
| Ancestry | # Population | % Population |
| Afghan | 31 | 0.0% |
| African | 134 | 0.1% |
| Albanian | 40 | 0.0% |
| Alsatian | 2 | 0.0% |
| American | 7,893 | 3.7% |
| Apache | 7 | 0.0% |
| Arab | 1,007 | 0.5% |
| Argentinean | 105 | 0.1% |
| Armenian | 69 | 0.0% |
| Australian | 91 | 0.0% |
| Austrian | 921 | 0.4% |
| Barbadian | 37 | 0.0% |
| Basque | 80 | 0.0% |
| Belgian | 29 | 0.0% |
| Bermudan | 15 | 0.0% |
| Bhutanese | 159 | 0.1% |
| Blackfeet | 42 | 0.0% |
| Brazilian | 255 | 0.1% |
| British | 420 | 0.2% |
| British West Indian | 23 | 0.0% |
| Bulgarian | 74 | 0.0% |
| Burmese | 541 | 0.3% |
| Cambodian | 11 | 0.0% |
| Canadian | 126 | 0.1% |
| Cape Verdean | 21 | 0.0% |
| Carpatho Rusyn | 78 | 0.0% |
| Celtic | 6 | 0.0% |
| Central American | 1,910 | 0.9% |
| Central American Indian | 171 | 0.1% |
| Cherokee | 304 | 0.1% |
| Cheyenne | 3 | 0.0% |
| Chickasaw | 2 | 0.0% |
| Chilean | 80 | 0.0% |
| Chinese | 6 | 0.0% |
| Choctaw | 3 | 0.0% |
| Colombian | 314 | 0.2% |
| Costa Rican | 27 | 0.0% |
| Cree | 4 | 0.0% |
| Creek | 3 | 0.0% |
| Croatian | 68 | 0.0% |
| Crow | 19 | 0.0% |
| Cuban | 427 | 0.2% |
| Czech | 608 | 0.3% |
| Czechoslovakian | 313 | 0.2% |
| Danish | 103 | 0.1% |
| Delaware | 7 | 0.0% |
| Dominican | 2,160 | 1.0% |
| Dutch | 1,724 | 0.8% |
| Eastern European | 944 | 0.4% |
| Ecuadorian | 316 | 0.2% |
| Egyptian | 26 | 0.0% |
| English | 14,664 | 6.8% |
| European | 1,249 | 0.6% |
| Filipino | 18 | 0.0% |
| Finnish | 43 | 0.0% |
| French | 2,512 | 1.2% |
| French American Indian | 3 | 0.0% |
| French Canadian | 261 | 0.1% |
| German | 32,893 | 15.2% |
| Greek | 806 | 0.4% |
| Guatemalan | 92 | 0.0% |
| Guyanese | 89 | 0.0% |
| Haitian | 58 | 0.0% |
| Honduran | 1,121 | 0.5% |
| Hungarian | 1,616 | 0.7% |
| Icelander | 35 | 0.0% |
| Indian (Asian) | 915 | 0.4% |
| Iranian | 283 | 0.1% |
| Irish | 52,207 | 24.2% |
| Iroquois | 89 | 0.0% |
| Israeli | 129 | 0.1% |
| Italian | 43,346 | 20.1% |
| Jamaican | 265 | 0.1% |
| Japanese | 55 | 0.0% |
| Kenyan | 53 | 0.0% |
| Korean | 797 | 0.4% |
| Laotian | 27 | 0.0% |
| Latvian | 91 | 0.0% |
| Lebanese | 699 | 0.3% |
| Lithuanian | 3,335 | 1.5% |
| Lumbee | 9 | 0.0% |
| Luxembourger | 2 | 0.0% |
| Macedonian | 22 | 0.0% |
| Malaysian | 131 | 0.1% |
| Maltese | 77 | 0.0% |
| Mexican | 2,772 | 1.3% |
| Mexican American Indian | 65 | 0.0% |
| Mongolian | 35 | 0.0% |
| Moroccan | 21 | 0.0% |
| Native Hawaiian | 41 | 0.0% |
| Navajo | 8 | 0.0% |
| New Zealander | 2 | 0.0% |
| Nicaraguan | 290 | 0.1% |
| Nigerian | 12 | 0.0% |
| Northern European | 225 | 0.1% |
| Norwegian | 382 | 0.2% |
| Pakistani | 183 | 0.1% |
| Panamanian | 46 | 0.0% |
| Pennsylvania German | 558 | 0.3% |
| Peruvian | 74 | 0.0% |
| Polish | 31,297 | 14.5% |
| Portuguese | 597 | 0.3% |
| Potawatomi | 9 | 0.0% |
| Puerto Rican | 10,113 | 4.7% |
| Romanian | 189 | 0.1% |
| Russian | 8,124 | 3.8% |
| Salvadoran | 334 | 0.2% |
| Samoan | 12 | 0.0% |
| Scandinavian | 121 | 0.1% |
| Scotch-Irish | 477 | 0.2% |
| Scottish | 1,829 | 0.9% |
| Seminole | 3 | 0.0% |
| Sierra Leonean | 8 | 0.0% |
| Sioux | 87 | 0.0% |
| Slavic | 167 | 0.1% |
| Slovak | 3,991 | 1.8% |
| Slovene | 183 | 0.1% |
| South African | 15 | 0.0% |
| South American | 1,161 | 0.5% |
| South American Indian | 15 | 0.0% |
| Spaniard | 96 | 0.0% |
| Spanish | 305 | 0.1% |
| Spanish American Indian | 13 | 0.0% |
| Sri Lankan | 187 | 0.1% |
| Subsaharan African | 678 | 0.3% |
| Swedish | 674 | 0.3% |
| Swiss | 397 | 0.2% |
| Syrian | 163 | 0.1% |
| Thai | 2,890 | 1.3% |
| Trinidadian and Tobagonian | 103 | 0.1% |
| Turkish | 195 | 0.1% |
| Ukrainian | 2,660 | 1.2% |
| Uruguayan | 155 | 0.1% |
| Venezuelan | 117 | 0.1% |
| Vietnamese | 46 | 0.0% |
| Welsh | 9,138 | 4.2% |
| West Indian | 275 | 0.1% |
| Yugoslavian | 65 | 0.0% | View All 138 Rows |
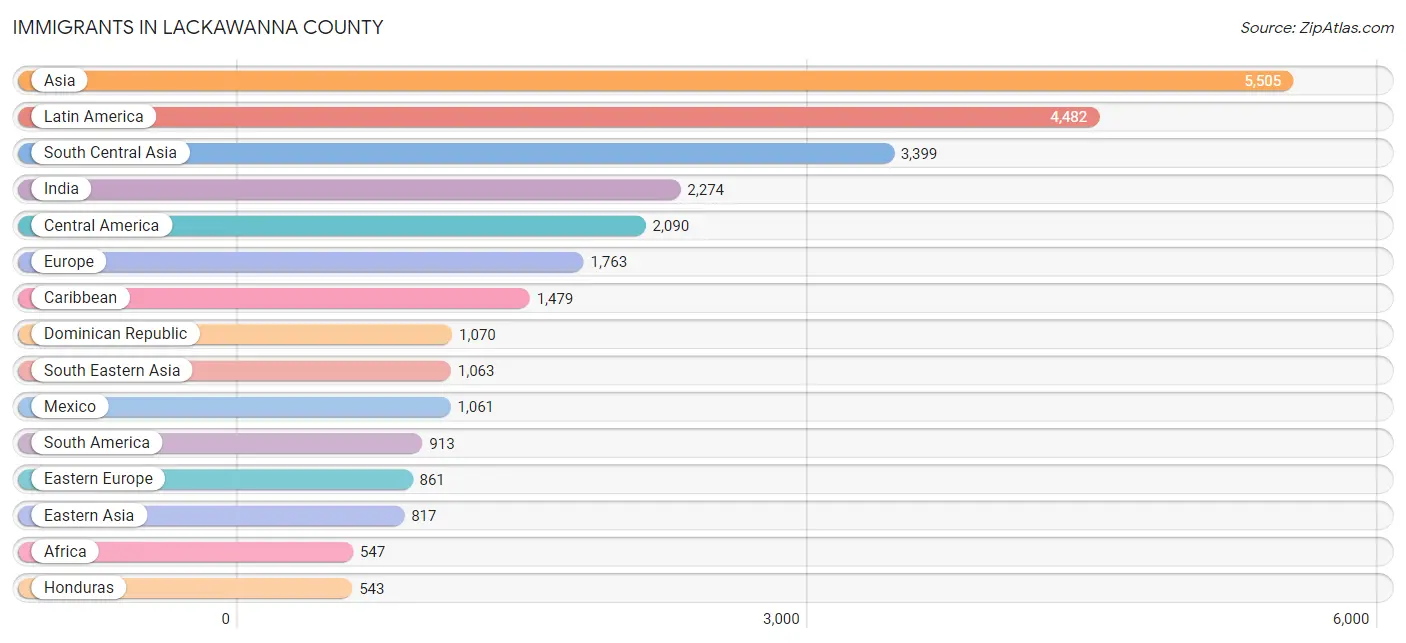
Immigrants in Lackawanna County
The most numerous immigrant groups reported in Lackawanna County came from Asia (5,505 | 2.5%), Latin America (4,482 | 2.1%), South Central Asia (3,399 | 1.6%), India (2,274 | 1.1%), and Central America (2,090 | 1.0%), together accounting for 8.2% of all Lackawanna County residents.
| Immigration Origin | # Population | % Population |
| Afghanistan | 100 | 0.1% |
| Africa | 547 | 0.3% |
| Albania | 11 | 0.0% |
| Argentina | 35 | 0.0% |
| Asia | 5,505 | 2.5% |
| Australia | 42 | 0.0% |
| Austria | 8 | 0.0% |
| Bahamas | 5 | 0.0% |
| Bangladesh | 46 | 0.0% |
| Belarus | 33 | 0.0% |
| Belgium | 2 | 0.0% |
| Bosnia and Herzegovina | 8 | 0.0% |
| Brazil | 321 | 0.2% |
| Bulgaria | 92 | 0.0% |
| Cabo Verde | 21 | 0.0% |
| Cambodia | 23 | 0.0% |
| Cameroon | 6 | 0.0% |
| Canada | 79 | 0.0% |
| Caribbean | 1,479 | 0.7% |
| Central America | 2,090 | 1.0% |
| Chile | 21 | 0.0% |
| China | 375 | 0.2% |
| Colombia | 154 | 0.1% |
| Croatia | 4 | 0.0% |
| Cuba | 176 | 0.1% |
| Denmark | 24 | 0.0% |
| Dominican Republic | 1,070 | 0.5% |
| Eastern Africa | 245 | 0.1% |
| Eastern Asia | 817 | 0.4% |
| Eastern Europe | 861 | 0.4% |
| Ecuador | 170 | 0.1% |
| Egypt | 11 | 0.0% |
| El Salvador | 115 | 0.1% |
| England | 65 | 0.0% |
| Europe | 1,763 | 0.8% |
| France | 24 | 0.0% |
| Germany | 205 | 0.1% |
| Greece | 39 | 0.0% |
| Guatemala | 30 | 0.0% |
| Guyana | 76 | 0.0% |
| Honduras | 543 | 0.3% |
| Hong Kong | 26 | 0.0% |
| Hungary | 10 | 0.0% |
| India | 2,274 | 1.1% |
| Indonesia | 115 | 0.1% |
| Iran | 155 | 0.1% |
| Iraq | 8 | 0.0% |
| Ireland | 102 | 0.1% |
| Israel | 24 | 0.0% |
| Italy | 238 | 0.1% |
| Jamaica | 141 | 0.1% |
| Japan | 50 | 0.0% |
| Kenya | 40 | 0.0% |
| Korea | 387 | 0.2% |
| Laos | 135 | 0.1% |
| Latin America | 4,482 | 2.1% |
| Lebanon | 4 | 0.0% |
| Mexico | 1,061 | 0.5% |
| Micronesia | 13 | 0.0% |
| Middle Africa | 71 | 0.0% |
| Morocco | 11 | 0.0% |
| Nepal | 332 | 0.2% |
| Netherlands | 32 | 0.0% |
| Nicaragua | 322 | 0.2% |
| Nigeria | 9 | 0.0% |
| Northern Africa | 22 | 0.0% |
| Northern Europe | 333 | 0.2% |
| Oceania | 57 | 0.0% |
| Pakistan | 139 | 0.1% |
| Panama | 19 | 0.0% |
| Peru | 51 | 0.0% |
| Philippines | 470 | 0.2% |
| Poland | 147 | 0.1% |
| Portugal | 8 | 0.0% |
| Romania | 19 | 0.0% |
| Russia | 521 | 0.2% |
| Saudi Arabia | 8 | 0.0% |
| Scotland | 51 | 0.0% |
| Serbia | 2 | 0.0% |
| Sierra Leone | 8 | 0.0% |
| South Africa | 45 | 0.0% |
| South America | 913 | 0.4% |
| South Central Asia | 3,399 | 1.6% |
| South Eastern Asia | 1,063 | 0.5% |
| Southern Europe | 298 | 0.1% |
| Spain | 13 | 0.0% |
| Syria | 22 | 0.0% |
| Taiwan | 17 | 0.0% |
| Thailand | 48 | 0.0% |
| Trinidad and Tobago | 72 | 0.0% |
| Turkey | 160 | 0.1% |
| Ukraine | 14 | 0.0% |
| Uruguay | 51 | 0.0% |
| Uzbekistan | 8 | 0.0% |
| Venezuela | 34 | 0.0% |
| Vietnam | 272 | 0.1% |
| Western Africa | 154 | 0.1% |
| Western Asia | 226 | 0.1% |
| Western Europe | 271 | 0.1% |
| Zaire | 65 | 0.0% | View All 100 Rows |
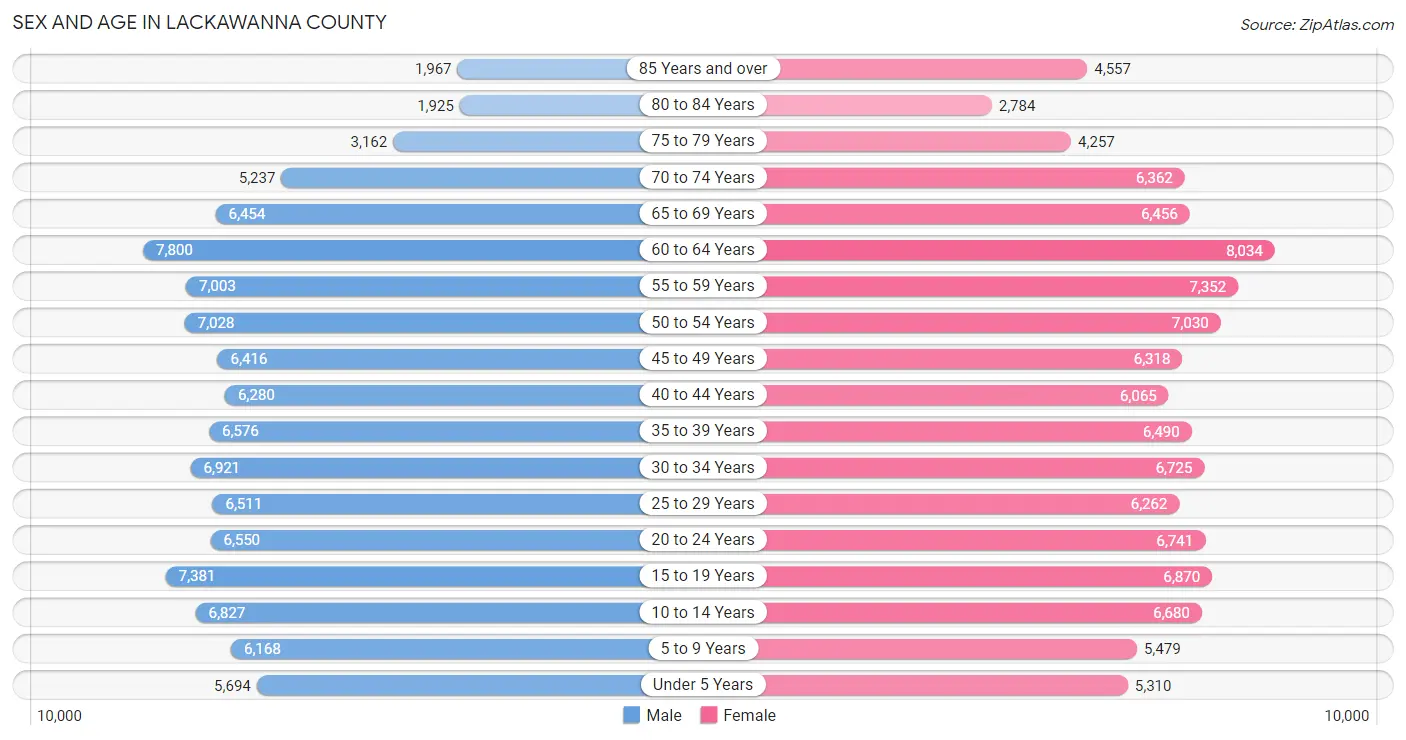
Sex and Age in Lackawanna County
Sex and Age in Lackawanna County
The most populous age groups in Lackawanna County are 60 to 64 Years (7,800 | 7.4%) for men and 60 to 64 Years (8,034 | 7.3%) for women.
| Age Bracket | Male | Female |
| Under 5 Years | 5,694 (5.4%) | 5,310 (4.8%) |
| 5 to 9 Years | 6,168 (5.8%) | 5,479 (5.0%) |
| 10 to 14 Years | 6,827 (6.5%) | 6,680 (6.1%) |
| 15 to 19 Years | 7,381 (7.0%) | 6,870 (6.3%) |
| 20 to 24 Years | 6,550 (6.2%) | 6,741 (6.1%) |
| 25 to 29 Years | 6,511 (6.1%) | 6,262 (5.7%) |
| 30 to 34 Years | 6,921 (6.5%) | 6,725 (6.1%) |
| 35 to 39 Years | 6,576 (6.2%) | 6,490 (5.9%) |
| 40 to 44 Years | 6,280 (5.9%) | 6,065 (5.5%) |
| 45 to 49 Years | 6,416 (6.1%) | 6,318 (5.8%) |
| 50 to 54 Years | 7,028 (6.6%) | 7,030 (6.4%) |
| 55 to 59 Years | 7,003 (6.6%) | 7,352 (6.7%) |
| 60 to 64 Years | 7,800 (7.4%) | 8,034 (7.3%) |
| 65 to 69 Years | 6,454 (6.1%) | 6,456 (5.9%) |
| 70 to 74 Years | 5,237 (5.0%) | 6,362 (5.8%) |
| 75 to 79 Years | 3,162 (3.0%) | 4,257 (3.9%) |
| 80 to 84 Years | 1,925 (1.8%) | 2,784 (2.5%) |
| 85 Years and over | 1,967 (1.9%) | 4,557 (4.2%) |
| Total | 105,900 (100.0%) | 109,772 (100.0%) |
Families and Households in Lackawanna County
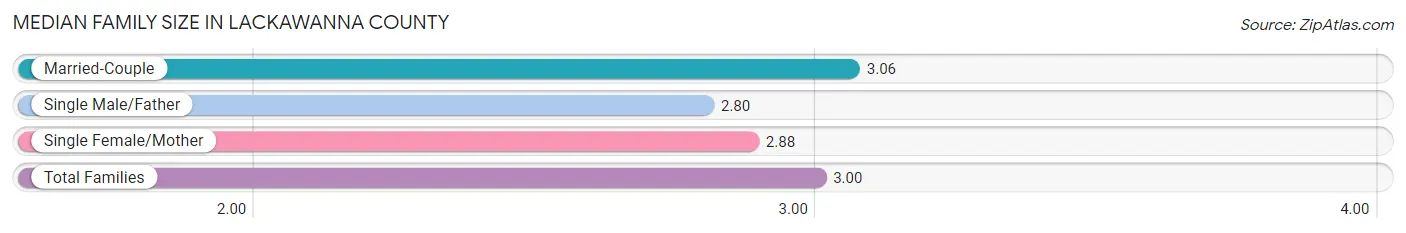
Median Family Size in Lackawanna County
The median family size in Lackawanna County is 3.00 persons per family, with married-couple families (37,993 | 70.6%) accounting for the largest median family size of 3.06 persons per family. On the other hand, single male/father families (4,949 | 9.2%) represent the smallest median family size with 2.80 persons per family.
| Family Type | # Families | Family Size |
| Married-Couple | 37,993 (70.6%) | 3.06 |
| Single Male/Father | 4,949 (9.2%) | 2.80 |
| Single Female/Mother | 10,841 (20.2%) | 2.88 |
| Total Families | 53,783 (100.0%) | 3.00 |
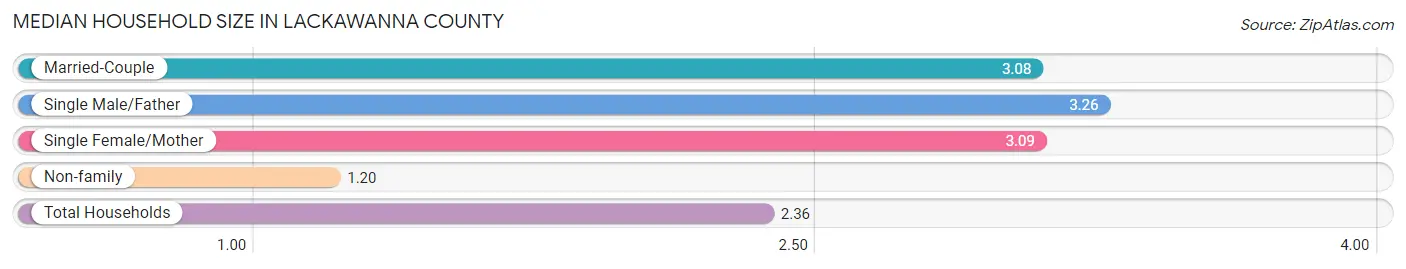
Median Household Size in Lackawanna County
The median household size in Lackawanna County is 2.36 persons per household, with single male/father households (4,949 | 5.6%) accounting for the largest median household size of 3.26 persons per household. non-family households (34,113 | 38.8%) represent the smallest median household size with 1.20 persons per household.
| Household Type | # Households | Household Size |
| Married-Couple | 37,993 (43.2%) | 3.08 |
| Single Male/Father | 4,949 (5.6%) | 3.26 |
| Single Female/Mother | 10,841 (12.3%) | 3.09 |
| Non-family | 34,113 (38.8%) | 1.20 |
| Total Households | 87,896 (100.0%) | 2.36 |
Household Size by Marriage Status in Lackawanna County
Out of a total of 87,896 households in Lackawanna County, 53,783 (61.2%) are family households, while 34,113 (38.8%) are nonfamily households. The most numerous type of family households are 2-person households, comprising 24,513, and the most common type of nonfamily households are 1-person households, comprising 28,395.
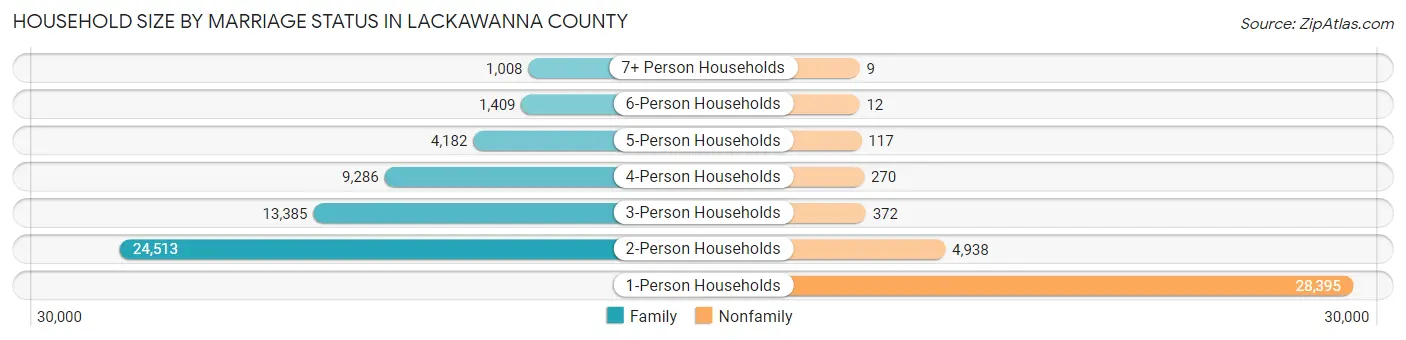
| Household Size | Family Households | Nonfamily Households |
| 1-Person Households | - | 28,395 (32.3%) |
| 2-Person Households | 24,513 (27.9%) | 4,938 (5.6%) |
| 3-Person Households | 13,385 (15.2%) | 372 (0.4%) |
| 4-Person Households | 9,286 (10.6%) | 270 (0.3%) |
| 5-Person Households | 4,182 (4.8%) | 117 (0.1%) |
| 6-Person Households | 1,409 (1.6%) | 12 (0.0%) |
| 7+ Person Households | 1,008 (1.1%) | 9 (0.0%) |
| Total | 53,783 (61.2%) | 34,113 (38.8%) |
Female Fertility in Lackawanna County
Fertility by Age in Lackawanna County
Average fertility rate in Lackawanna County is 48.0 births per 1,000 women. Women in the age bracket of 20 to 34 years have the highest fertility rate with 75.0 births per 1,000 women. Women in the age bracket of 20 to 34 years acount for 66.1% of all women with births.
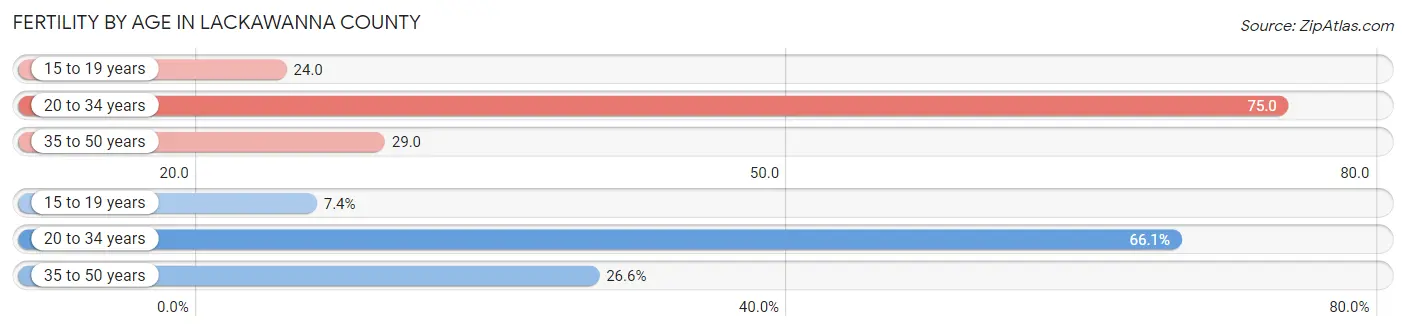
| Age Bracket | Women with Births | Births / 1,000 Women |
| 15 to 19 years | 165 (7.4%) | 24.0 |
| 20 to 34 years | 1,478 (66.1%) | 75.0 |
| 35 to 50 years | 594 (26.6%) | 29.0 |
| Total | 2,237 (100.0%) | 48.0 |
Fertility by Age by Marriage Status in Lackawanna County
58.6% of women with births (2,237) in Lackawanna County are married. The highest percentage of unmarried women with births falls into 15 to 19 years age bracket with 100.0% of them unmarried at the time of birth, while the lowest percentage of unmarried women with births belong to 35 to 50 years age bracket with 27.9% of them unmarried.
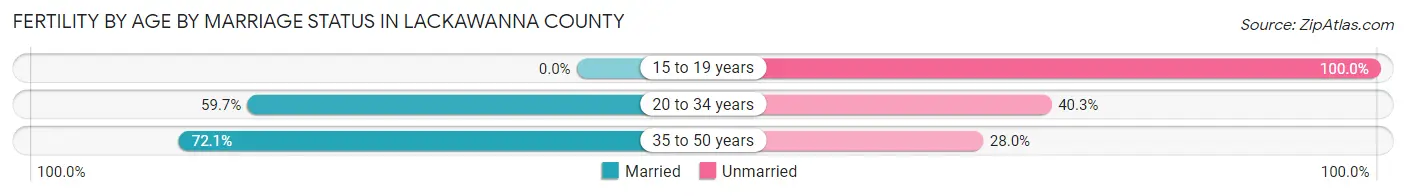
| Age Bracket | Married | Unmarried |
| 15 to 19 years | 0 (0.0%) | 165 (100.0%) |
| 20 to 34 years | 882 (59.7%) | 596 (40.3%) |
| 35 to 50 years | 428 (72.1%) | 166 (28.0%) |
| Total | 1,311 (58.6%) | 926 (41.4%) |
Fertility by Education in Lackawanna County
Average fertility rate in Lackawanna County is 48.0 births per 1,000 women. Women with the education attainment of high school diploma have the highest fertility rate of 62.0 births per 1,000 women, while women with the education attainment of college or associate's degree have the lowest fertility at 26.0 births per 1,000 women. Women with the education attainment of high school diploma represent 27.9% of all women with births.
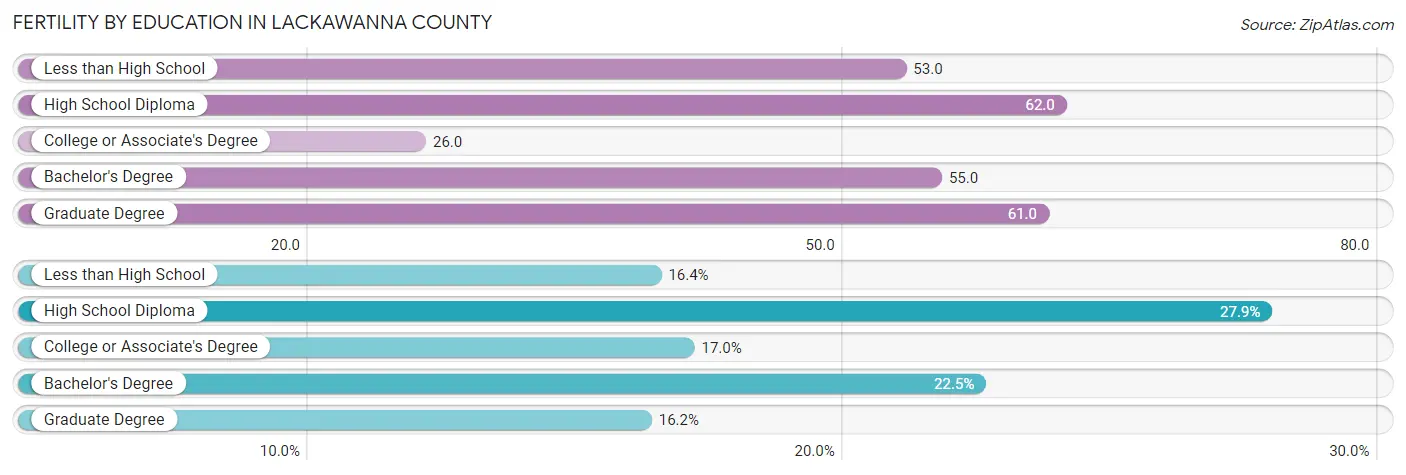
| Educational Attainment | Women with Births | Births / 1,000 Women |
| Less than High School | 367 (16.4%) | 53.0 |
| High School Diploma | 623 (27.9%) | 62.0 |
| College or Associate's Degree | 381 (17.0%) | 26.0 |
| Bachelor's Degree | 503 (22.5%) | 55.0 |
| Graduate Degree | 363 (16.2%) | 61.0 |
| Total | 2,237 (100.0%) | 48.0 |
Fertility by Education by Marriage Status in Lackawanna County
41.4% of women with births in Lackawanna County are unmarried. Women with the educational attainment of bachelor's degree are most likely to be married with 92.0% of them married at childbirth, while women with the educational attainment of less than high school are least likely to be married with 77.9% of them unmarried at childbirth.
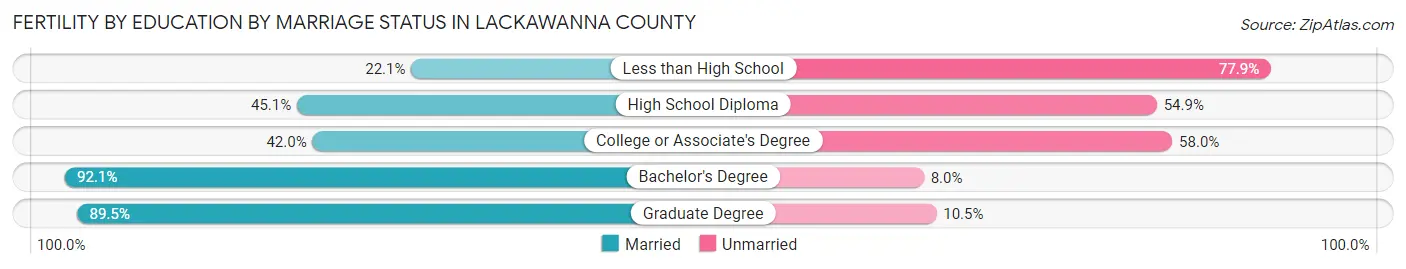
| Educational Attainment | Married | Unmarried |
| Less than High School | 81 (22.1%) | 286 (77.9%) |
| High School Diploma | 281 (45.1%) | 342 (54.9%) |
| College or Associate's Degree | 160 (42.0%) | 221 (58.0%) |
| Bachelor's Degree | 463 (92.0%) | 40 (8.0%) |
| Graduate Degree | 325 (89.5%) | 38 (10.5%) |
| Total | 1,311 (58.6%) | 926 (41.4%) |
Employment Characteristics in Lackawanna County
Employment by Class of Employer in Lackawanna County
Among the 100,713 employed individuals in Lackawanna County, private company employees (68,448 | 68.0%), not-for-profit organizations (12,450 | 12.4%), and local government employees (5,996 | 5.9%) make up the most common classes of employment.
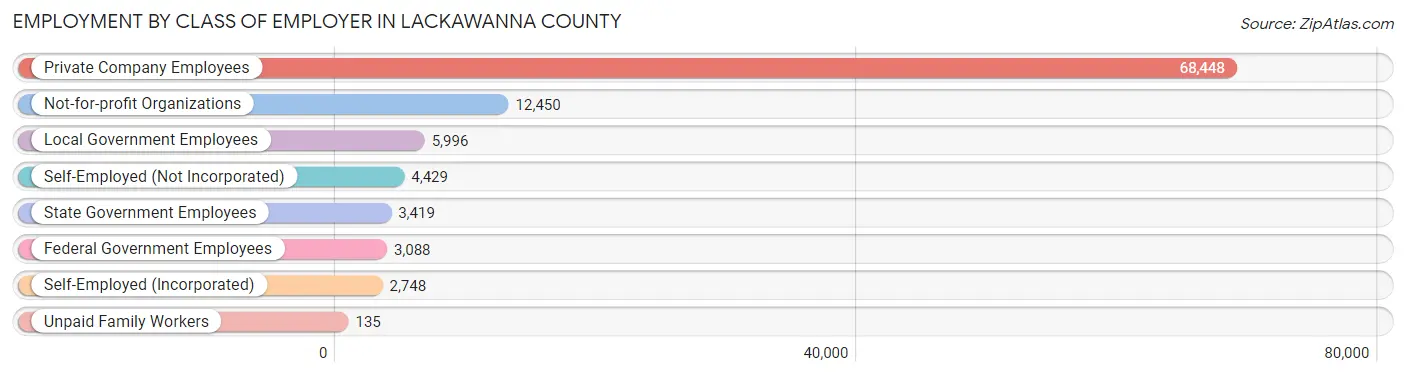
| Employer Class | # Employees | % Employees |
| Private Company Employees | 68,448 | 68.0% |
| Self-Employed (Incorporated) | 2,748 | 2.7% |
| Self-Employed (Not Incorporated) | 4,429 | 4.4% |
| Not-for-profit Organizations | 12,450 | 12.4% |
| Local Government Employees | 5,996 | 5.9% |
| State Government Employees | 3,419 | 3.4% |
| Federal Government Employees | 3,088 | 3.1% |
| Unpaid Family Workers | 135 | 0.1% |
| Total | 100,713 | 100.0% |
Employment Status by Age in Lackawanna County
According to the labor force statistics for Lackawanna County, out of the total population over 16 years of age (177,591), 60.6% or 107,620 individuals are in the labor force, with 4.8% or 5,166 of them unemployed. The age group with the highest labor force participation rate is 35 to 44 years, with 84.0% or 21,345 individuals in the labor force. Within the labor force, the 20 to 24 years age range has the highest percentage of unemployed individuals, with 12.3% or 1,185 of them being unemployed.
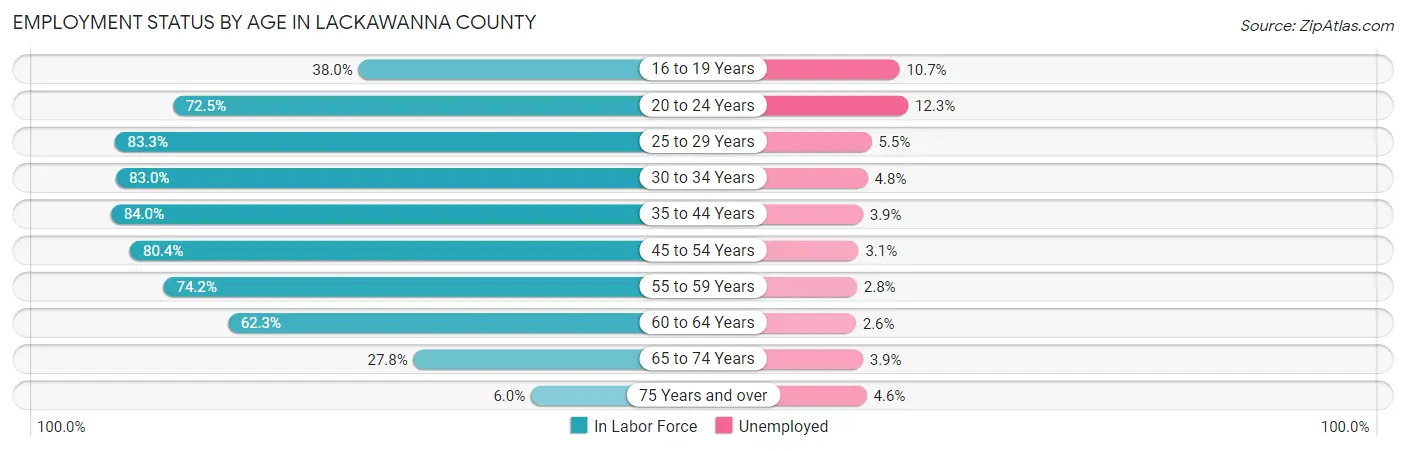
| Age Bracket | In Labor Force | Unemployed |
| 16 to 19 Years | 4,685 (38.0%) | 501 (10.7%) |
| 20 to 24 Years | 9,636 (72.5%) | 1,185 (12.3%) |
| 25 to 29 Years | 10,640 (83.3%) | 585 (5.5%) |
| 30 to 34 Years | 11,326 (83.0%) | 544 (4.8%) |
| 35 to 44 Years | 21,345 (84.0%) | 832 (3.9%) |
| 45 to 54 Years | 21,541 (80.4%) | 668 (3.1%) |
| 55 to 59 Years | 10,651 (74.2%) | 298 (2.8%) |
| 60 to 64 Years | 9,865 (62.3%) | 256 (2.6%) |
| 65 to 74 Years | 6,814 (27.8%) | 266 (3.9%) |
| 75 Years and over | 1,119 (6.0%) | 51 (4.6%) |
| Total | 107,620 (60.6%) | 5,166 (4.8%) |
Employment Status by Educational Attainment in Lackawanna County
According to labor force statistics for Lackawanna County, 78.4% of individuals (85,308) out of the total population between 25 and 64 years of age (108,811) are in the labor force, with 3.7% or 3,156 of them being unemployed. The group with the highest labor force participation rate are those with the educational attainment of bachelor's degree or higher, with 88.4% or 31,054 individuals in the labor force. Within the labor force, individuals with less than high school education have the highest percentage of unemployment, with 6.9% or 306 of them being unemployed.
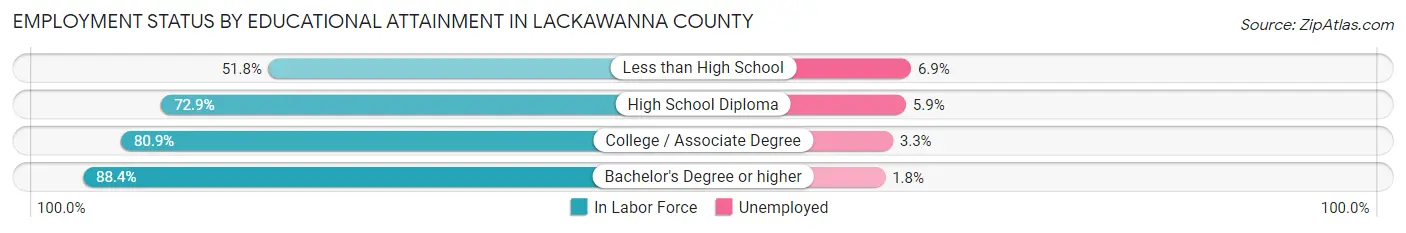
| Educational Attainment | In Labor Force | Unemployed |
| Less than High School | 4,439 (51.8%) | 591 (6.9%) |
| High School Diploma | 25,611 (72.9%) | 2,073 (5.9%) |
| College / Associate Degree | 24,255 (80.9%) | 989 (3.3%) |
| Bachelor's Degree or higher | 31,054 (88.4%) | 632 (1.8%) |
| Total | 85,308 (78.4%) | 4,026 (3.7%) |
Employment Occupations by Sex in Lackawanna County
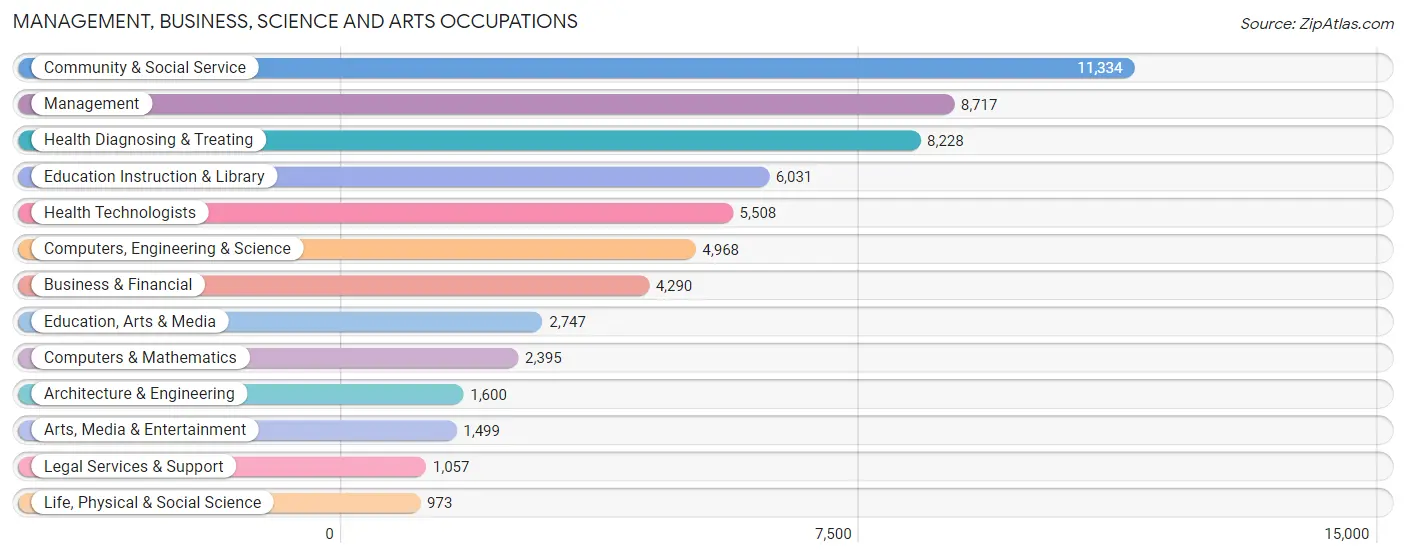
Management, Business, Science and Arts Occupations
The most common Management, Business, Science and Arts occupations in Lackawanna County are Community & Social Service (11,334 | 11.1%), Management (8,717 | 8.5%), Health Diagnosing & Treating (8,228 | 8.0%), Education Instruction & Library (6,031 | 5.9%), and Health Technologists (5,508 | 5.4%).
Management, Business, Science and Arts Occupations by Sex
Within the Management, Business, Science and Arts occupations in Lackawanna County, the most male-oriented occupations are Architecture & Engineering (83.3%), Computers & Mathematics (75.3%), and Computers, Engineering & Science (71.6%), while the most female-oriented occupations are Health Diagnosing & Treating (74.9%), Health Technologists (74.8%), and Education Instruction & Library (74.1%).
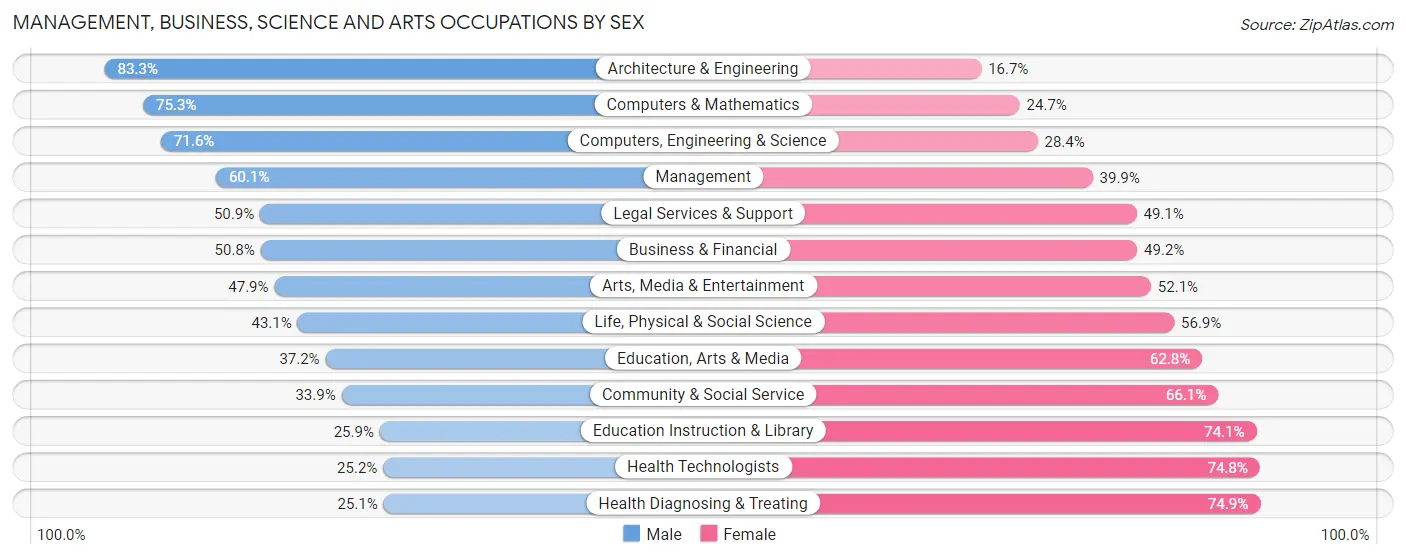
| Occupation | Male | Female |
| Management | 5,236 (60.1%) | 3,481 (39.9%) |
| Business & Financial | 2,178 (50.8%) | 2,112 (49.2%) |
| Computers, Engineering & Science | 3,555 (71.6%) | 1,413 (28.4%) |
| Computers & Mathematics | 1,803 (75.3%) | 592 (24.7%) |
| Architecture & Engineering | 1,333 (83.3%) | 267 (16.7%) |
| Life, Physical & Social Science | 419 (43.1%) | 554 (56.9%) |
| Community & Social Service | 3,842 (33.9%) | 7,492 (66.1%) |
| Education, Arts & Media | 1,023 (37.2%) | 1,724 (62.8%) |
| Legal Services & Support | 538 (50.9%) | 519 (49.1%) |
| Education Instruction & Library | 1,563 (25.9%) | 4,468 (74.1%) |
| Arts, Media & Entertainment | 718 (47.9%) | 781 (52.1%) |
| Health Diagnosing & Treating | 2,068 (25.1%) | 6,160 (74.9%) |
| Health Technologists | 1,388 (25.2%) | 4,120 (74.8%) |
| Total (Category) | 16,879 (45.0%) | 20,658 (55.0%) |
| Total (Overall) | 53,743 (52.5%) | 48,564 (47.5%) |
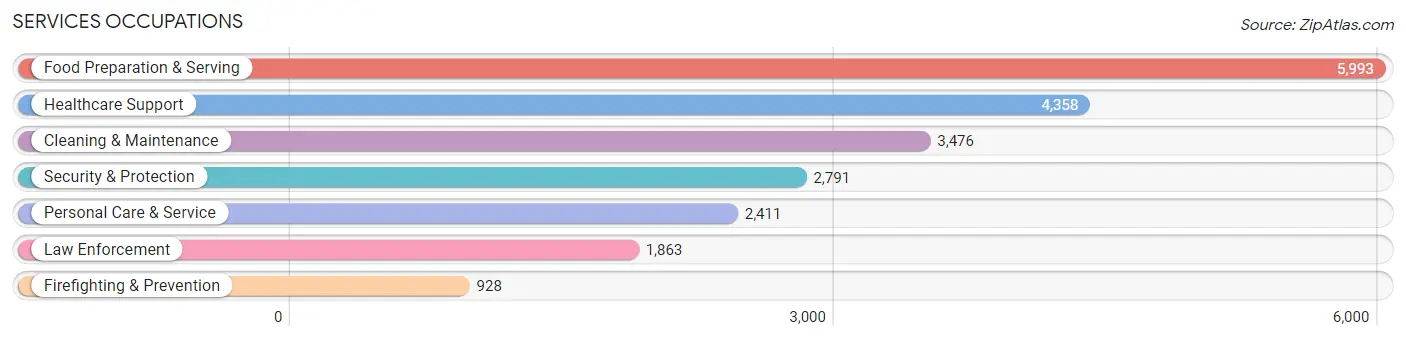
Services Occupations
The most common Services occupations in Lackawanna County are Food Preparation & Serving (5,993 | 5.9%), Healthcare Support (4,358 | 4.3%), Cleaning & Maintenance (3,476 | 3.4%), Security & Protection (2,791 | 2.7%), and Personal Care & Service (2,411 | 2.4%).
Services Occupations by Sex
Within the Services occupations in Lackawanna County, the most male-oriented occupations are Law Enforcement (90.8%), Security & Protection (89.3%), and Firefighting & Prevention (86.4%), while the most female-oriented occupations are Healthcare Support (81.3%), Personal Care & Service (74.0%), and Food Preparation & Serving (54.5%).
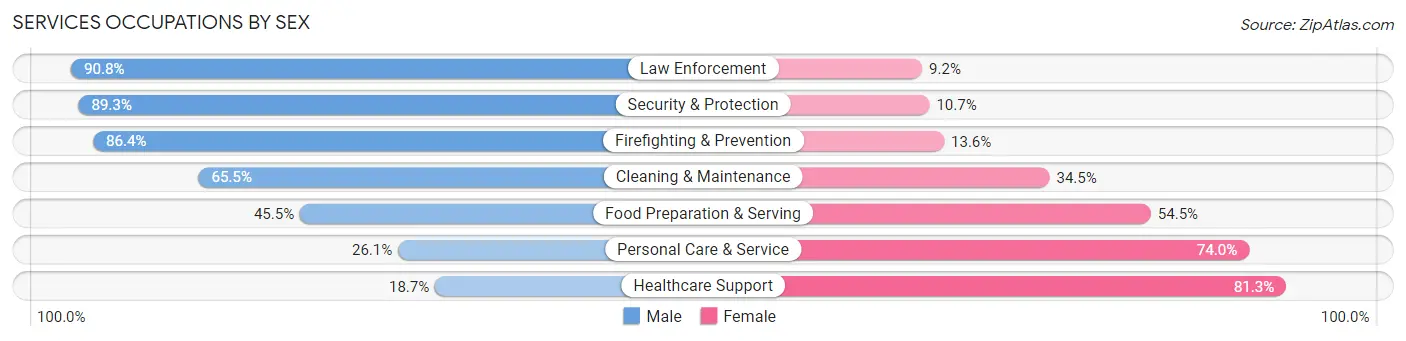
| Occupation | Male | Female |
| Healthcare Support | 816 (18.7%) | 3,542 (81.3%) |
| Security & Protection | 2,493 (89.3%) | 298 (10.7%) |
| Firefighting & Prevention | 802 (86.4%) | 126 (13.6%) |
| Law Enforcement | 1,691 (90.8%) | 172 (9.2%) |
| Food Preparation & Serving | 2,725 (45.5%) | 3,268 (54.5%) |
| Cleaning & Maintenance | 2,278 (65.5%) | 1,198 (34.5%) |
| Personal Care & Service | 628 (26.1%) | 1,783 (74.0%) |
| Total (Category) | 8,940 (47.0%) | 10,089 (53.0%) |
| Total (Overall) | 53,743 (52.5%) | 48,564 (47.5%) |
Sales and Office Occupations
The most common Sales and Office occupations in Lackawanna County are Office & Administration (11,630 | 11.4%), and Sales & Related (10,372 | 10.1%).

Sales and Office Occupations by Sex
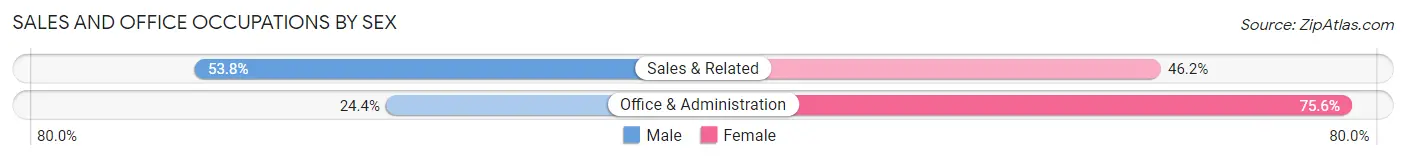
| Occupation | Male | Female |
| Sales & Related | 5,577 (53.8%) | 4,795 (46.2%) |
| Office & Administration | 2,842 (24.4%) | 8,788 (75.6%) |
| Total (Category) | 8,419 (38.3%) | 13,583 (61.7%) |
| Total (Overall) | 53,743 (52.5%) | 48,564 (47.5%) |
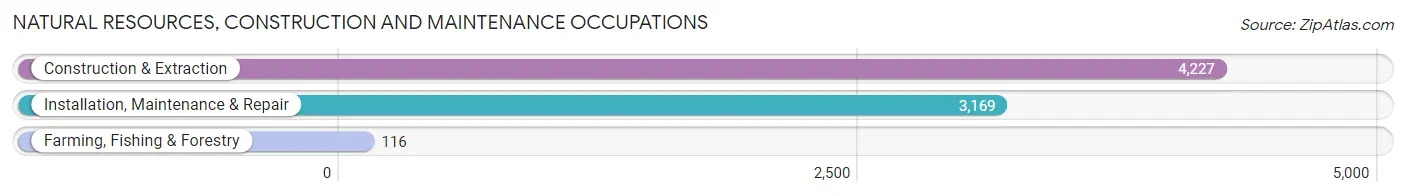
Natural Resources, Construction and Maintenance Occupations
The most common Natural Resources, Construction and Maintenance occupations in Lackawanna County are Construction & Extraction (4,227 | 4.1%), Installation, Maintenance & Repair (3,169 | 3.1%), and Farming, Fishing & Forestry (116 | 0.1%).
Natural Resources, Construction and Maintenance Occupations by Sex
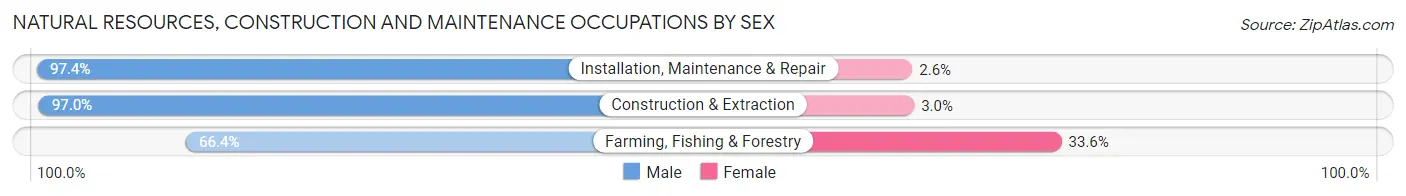
| Occupation | Male | Female |
| Farming, Fishing & Forestry | 77 (66.4%) | 39 (33.6%) |
| Construction & Extraction | 4,101 (97.0%) | 126 (3.0%) |
| Installation, Maintenance & Repair | 3,087 (97.4%) | 82 (2.6%) |
| Total (Category) | 7,265 (96.7%) | 247 (3.3%) |
| Total (Overall) | 53,743 (52.5%) | 48,564 (47.5%) |
Production, Transportation and Moving Occupations
The most common Production, Transportation and Moving occupations in Lackawanna County are Production (6,147 | 6.0%), Material Moving (5,055 | 4.9%), and Transportation (5,025 | 4.9%).
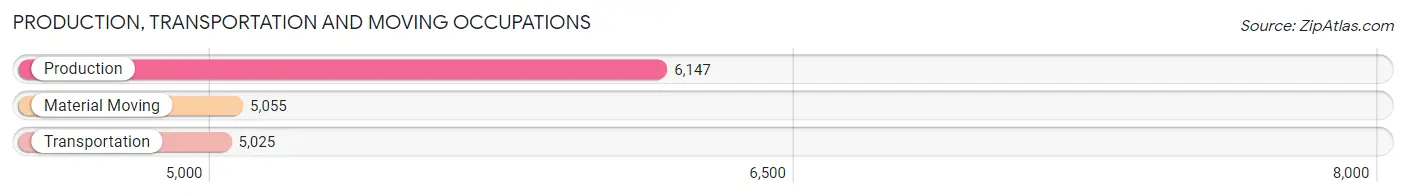
Production, Transportation and Moving Occupations by Sex
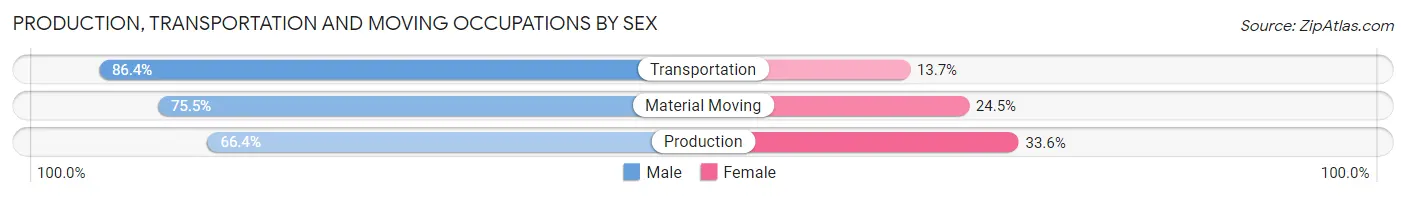
| Occupation | Male | Female |
| Production | 4,083 (66.4%) | 2,064 (33.6%) |
| Transportation | 4,339 (86.4%) | 686 (13.7%) |
| Material Moving | 3,818 (75.5%) | 1,237 (24.5%) |
| Total (Category) | 12,240 (75.4%) | 3,987 (24.6%) |
| Total (Overall) | 53,743 (52.5%) | 48,564 (47.5%) |
Employment Industries by Sex in Lackawanna County
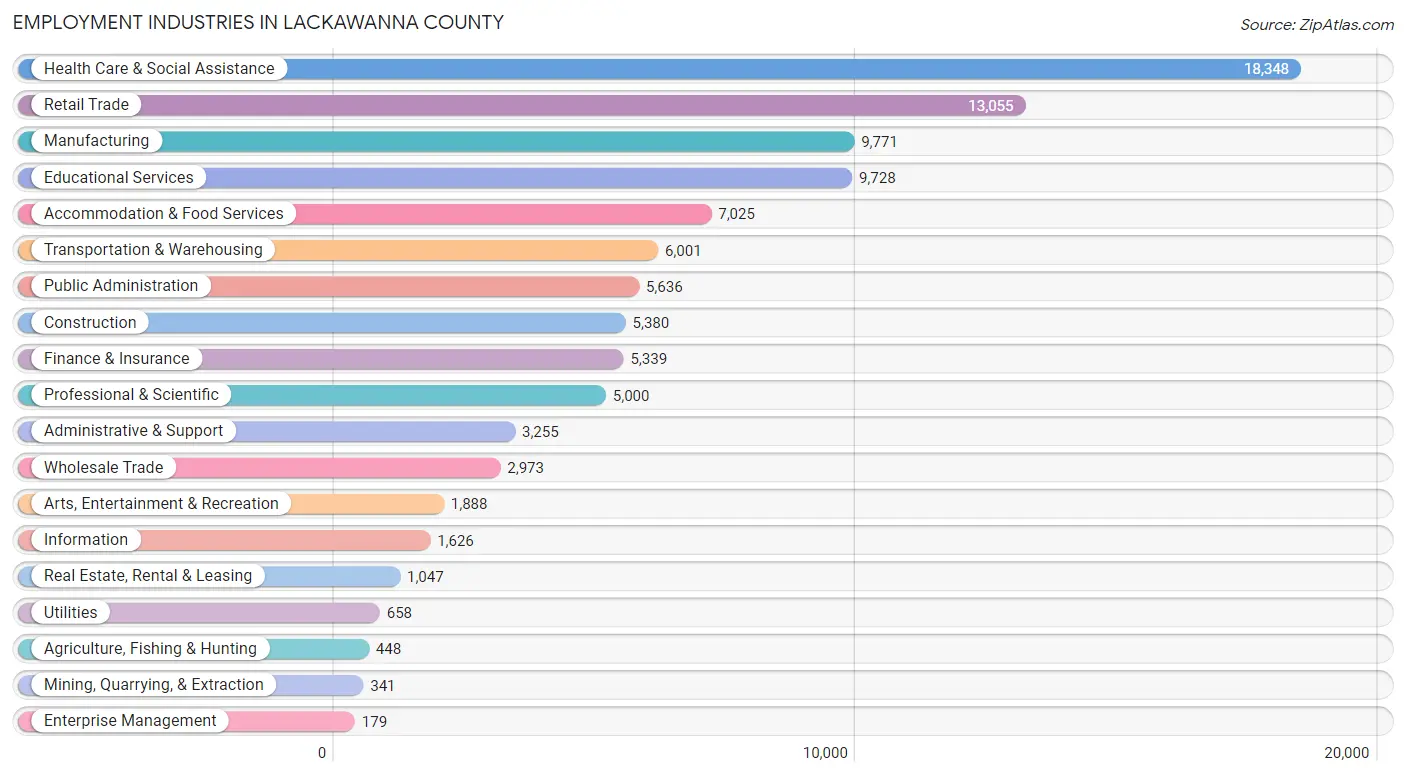
Employment Industries in Lackawanna County
The major employment industries in Lackawanna County include Health Care & Social Assistance (18,348 | 17.9%), Retail Trade (13,055 | 12.8%), Manufacturing (9,771 | 9.6%), Educational Services (9,728 | 9.5%), and Accommodation & Food Services (7,025 | 6.9%).
Employment Industries by Sex in Lackawanna County
The Lackawanna County industries that see more men than women are Mining, Quarrying, & Extraction (100.0%), Construction (91.9%), and Wholesale Trade (73.9%), whereas the industries that tend to have a higher number of women are Health Care & Social Assistance (75.6%), Educational Services (67.6%), and Finance & Insurance (57.7%).
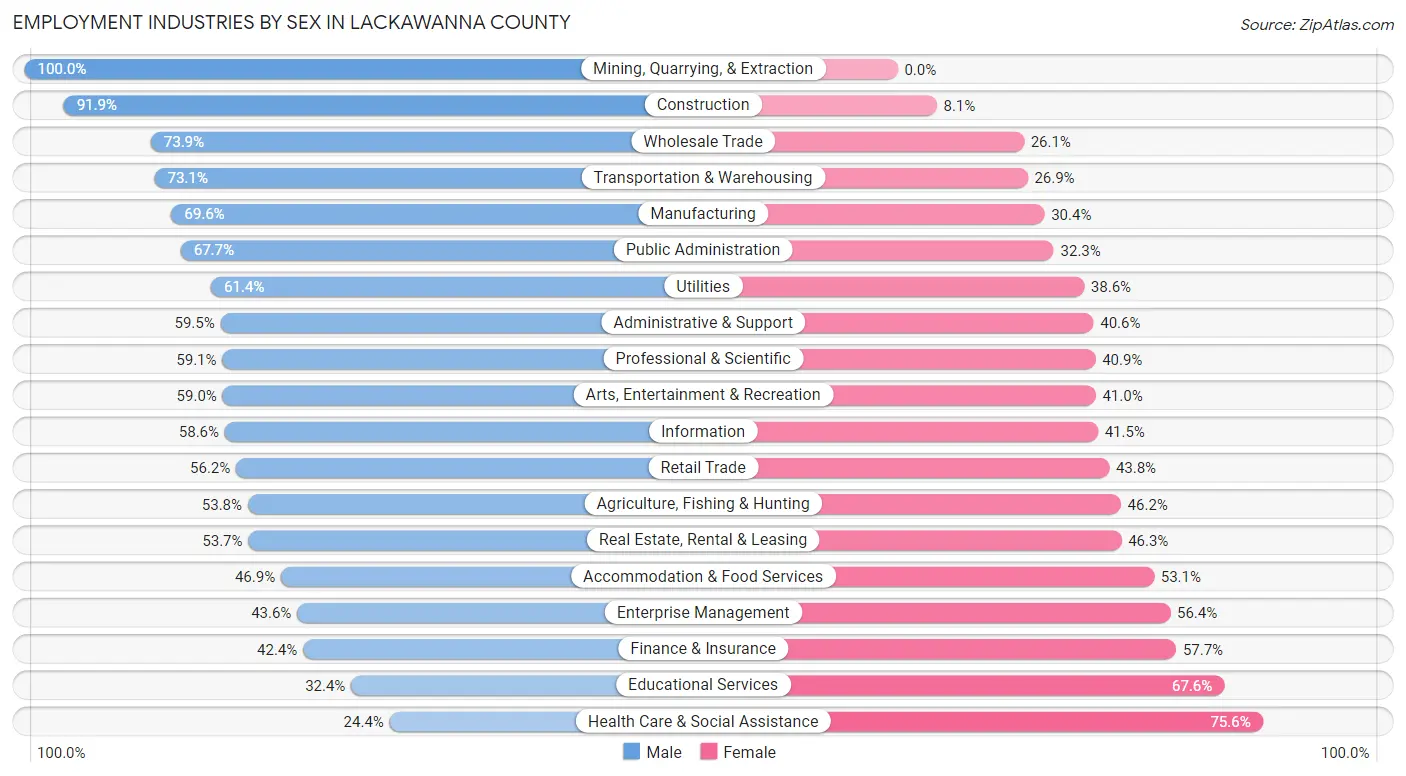
| Industry | Male | Female |
| Agriculture, Fishing & Hunting | 241 (53.8%) | 207 (46.2%) |
| Mining, Quarrying, & Extraction | 341 (100.0%) | 0 (0.0%) |
| Construction | 4,944 (91.9%) | 436 (8.1%) |
| Manufacturing | 6,802 (69.6%) | 2,969 (30.4%) |
| Wholesale Trade | 2,196 (73.9%) | 777 (26.1%) |
| Retail Trade | 7,340 (56.2%) | 5,715 (43.8%) |
| Transportation & Warehousing | 4,386 (73.1%) | 1,615 (26.9%) |
| Utilities | 404 (61.4%) | 254 (38.6%) |
| Information | 952 (58.6%) | 674 (41.4%) |
| Finance & Insurance | 2,261 (42.3%) | 3,078 (57.7%) |
| Real Estate, Rental & Leasing | 562 (53.7%) | 485 (46.3%) |
| Professional & Scientific | 2,953 (59.1%) | 2,047 (40.9%) |
| Enterprise Management | 78 (43.6%) | 101 (56.4%) |
| Administrative & Support | 1,935 (59.5%) | 1,320 (40.6%) |
| Educational Services | 3,152 (32.4%) | 6,576 (67.6%) |
| Health Care & Social Assistance | 4,485 (24.4%) | 13,863 (75.6%) |
| Arts, Entertainment & Recreation | 1,114 (59.0%) | 774 (41.0%) |
| Accommodation & Food Services | 3,297 (46.9%) | 3,728 (53.1%) |
| Public Administration | 3,814 (67.7%) | 1,822 (32.3%) |
| Total | 53,743 (52.5%) | 48,564 (47.5%) |
Education in Lackawanna County
School Enrollment in Lackawanna County
The most common levels of schooling among the 49,062 students in Lackawanna County are college / undergraduate (11,351 | 23.1%), middle school (10,696 | 21.8%), and high school (10,571 | 21.5%).
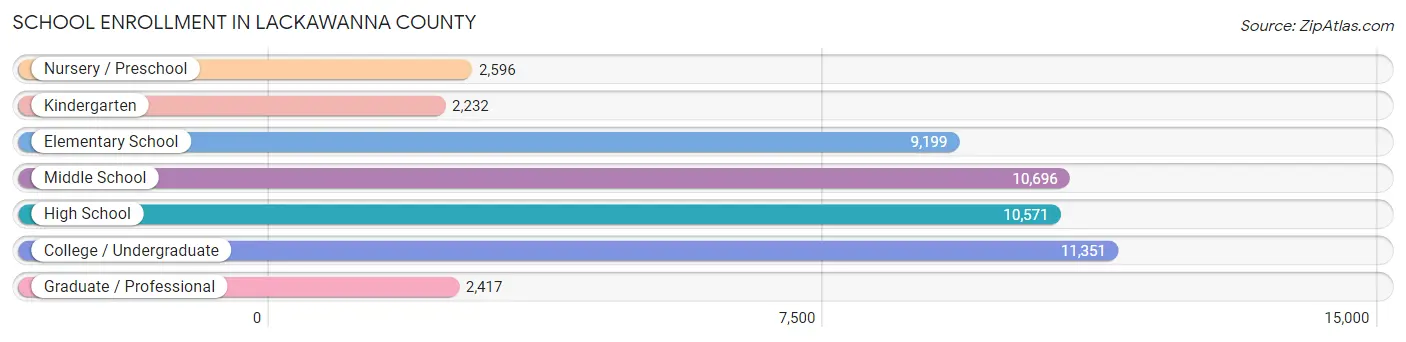
| School Level | # Students | % Students |
| Nursery / Preschool | 2,596 | 5.3% |
| Kindergarten | 2,232 | 4.5% |
| Elementary School | 9,199 | 18.8% |
| Middle School | 10,696 | 21.8% |
| High School | 10,571 | 21.5% |
| College / Undergraduate | 11,351 | 23.1% |
| Graduate / Professional | 2,417 | 4.9% |
| Total | 49,062 | 100.0% |
School Enrollment by Age by Funding Source in Lackawanna County
Out of a total of 49,062 students who are enrolled in schools in Lackawanna County, 14,424 (29.4%) attend a private institution, while the remaining 34,638 (70.6%) are enrolled in public schools. The age group of 20 to 24 year olds has the highest likelihood of being enrolled in private schools, with 4,489 (69.9% in the age bracket) enrolled. Conversely, the age group of 10 to 14 year olds has the lowest likelihood of being enrolled in a private school, with 11,560 (88.7% in the age bracket) attending a public institution.
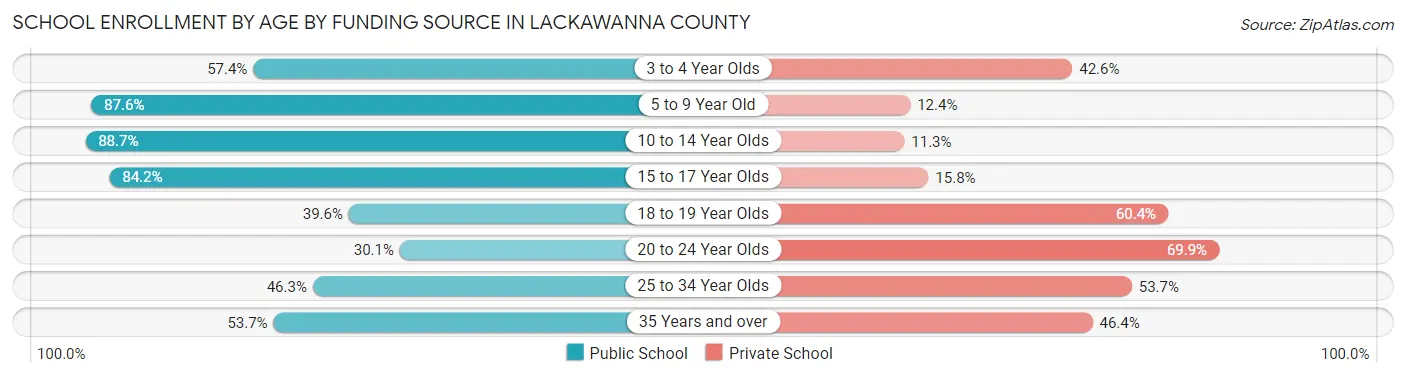
| Age Bracket | Public School | Private School |
| 3 to 4 Year Olds | 1,145 (57.4%) | 849 (42.6%) |
| 5 to 9 Year Old | 9,476 (87.6%) | 1,341 (12.4%) |
| 10 to 14 Year Olds | 11,560 (88.7%) | 1,472 (11.3%) |
| 15 to 17 Year Olds | 6,516 (84.2%) | 1,221 (15.8%) |
| 18 to 19 Year Olds | 1,966 (39.6%) | 2,997 (60.4%) |
| 20 to 24 Year Olds | 1,934 (30.1%) | 4,489 (69.9%) |
| 25 to 34 Year Olds | 1,028 (46.3%) | 1,191 (53.7%) |
| 35 Years and over | 1,007 (53.6%) | 870 (46.4%) |
| Total | 34,638 (70.6%) | 14,424 (29.4%) |
Educational Attainment by Field of Study in Lackawanna County
Business (9,201 | 18.7%), education (7,548 | 15.4%), science & technology (6,716 | 13.7%), arts & humanities (4,664 | 9.5%), and social sciences (2,943 | 6.0%) are the most common fields of study among 49,148 individuals in Lackawanna County who have obtained a bachelor's degree or higher.
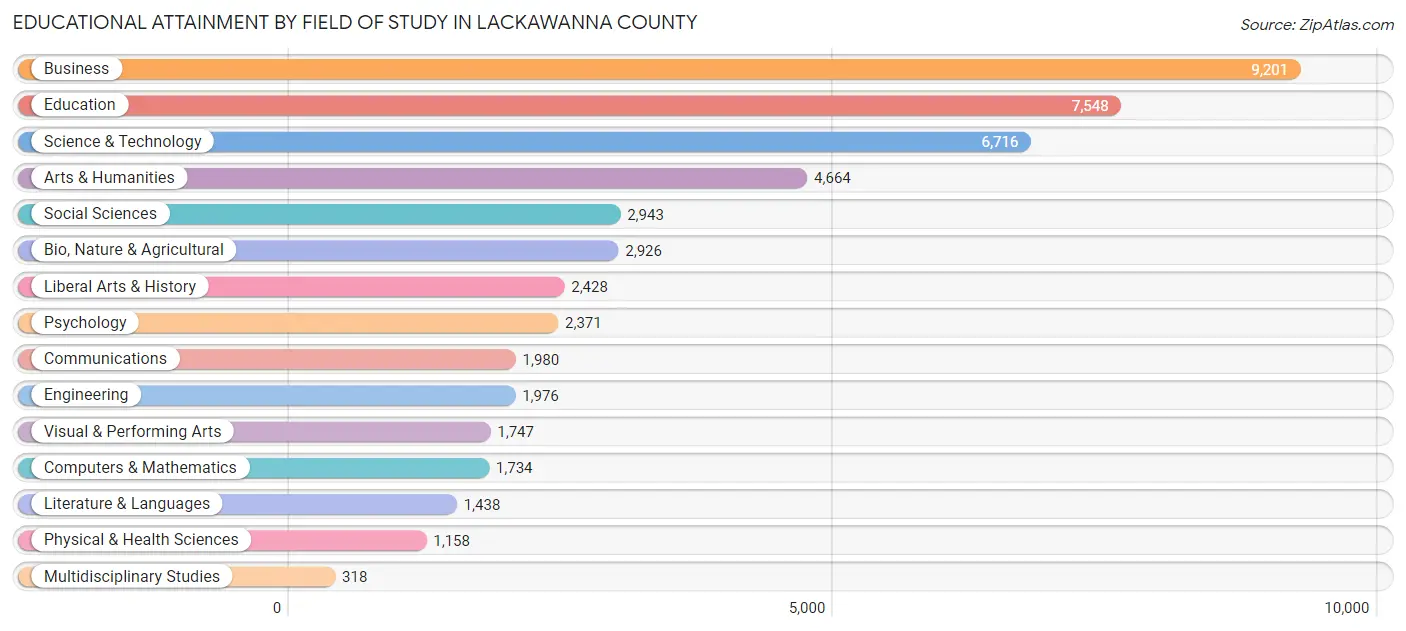
| Field of Study | # Graduates | % Graduates |
| Computers & Mathematics | 1,734 | 3.5% |
| Bio, Nature & Agricultural | 2,926 | 5.9% |
| Physical & Health Sciences | 1,158 | 2.4% |
| Psychology | 2,371 | 4.8% |
| Social Sciences | 2,943 | 6.0% |
| Engineering | 1,976 | 4.0% |
| Multidisciplinary Studies | 318 | 0.6% |
| Science & Technology | 6,716 | 13.7% |
| Business | 9,201 | 18.7% |
| Education | 7,548 | 15.4% |
| Literature & Languages | 1,438 | 2.9% |
| Liberal Arts & History | 2,428 | 4.9% |
| Visual & Performing Arts | 1,747 | 3.5% |
| Communications | 1,980 | 4.0% |
| Arts & Humanities | 4,664 | 9.5% |
| Total | 49,148 | 100.0% |
Transportation & Commute in Lackawanna County
Vehicle Availability by Sex in Lackawanna County
The most prevalent vehicle ownership categories in Lackawanna County are males with 2 vehicles (23,485, accounting for 44.6%) and females with 2 vehicles (19,728, making up 50.0%).
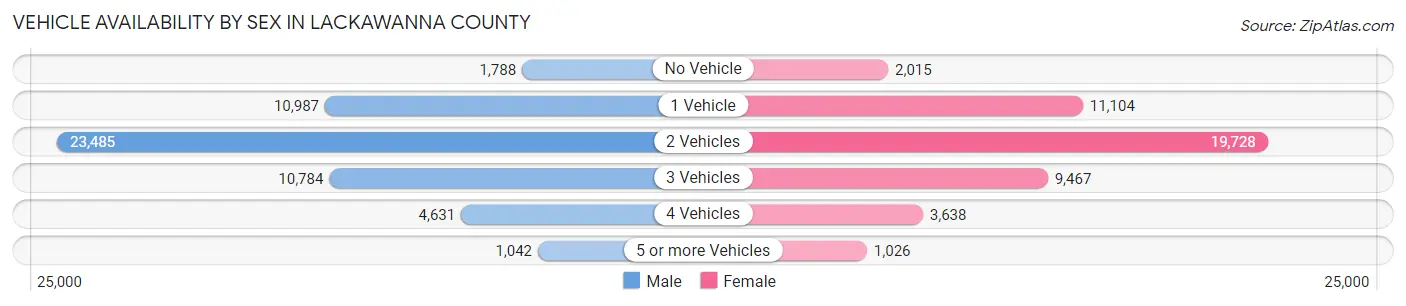
| Vehicles Available | Male | Female |
| No Vehicle | 1,788 (3.4%) | 2,015 (4.3%) |
| 1 Vehicle | 10,987 (20.8%) | 11,104 (23.6%) |
| 2 Vehicles | 23,485 (44.6%) | 19,728 (42.0%) |
| 3 Vehicles | 10,784 (20.5%) | 9,467 (20.2%) |
| 4 Vehicles | 4,631 (8.8%) | 3,638 (7.7%) |
| 5 or more Vehicles | 1,042 (2.0%) | 1,026 (2.2%) |
| Total | 52,717 (100.0%) | 46,978 (100.0%) |
Commute Time in Lackawanna County
The most frequently occuring commute durations in Lackawanna County are 10 to 14 minutes (18,798 commuters, 20.3%), 15 to 19 minutes (17,735 commuters, 19.2%), and 20 to 24 minutes (13,830 commuters, 15.0%).
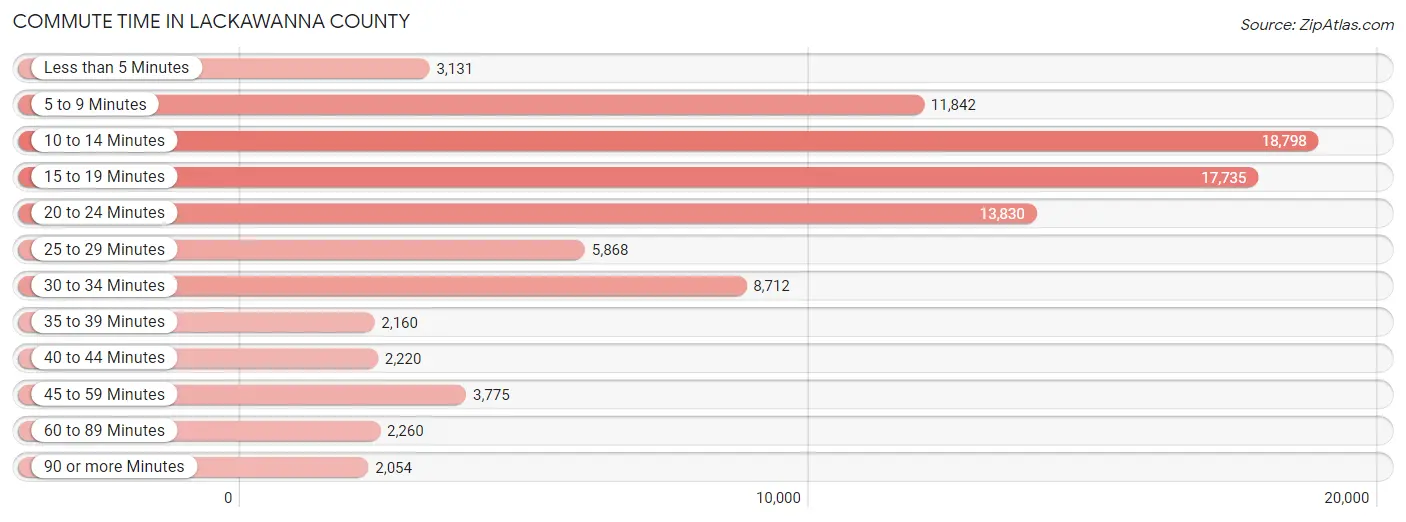
| Commute Time | # Commuters | % Commuters |
| Less than 5 Minutes | 3,131 | 3.4% |
| 5 to 9 Minutes | 11,842 | 12.8% |
| 10 to 14 Minutes | 18,798 | 20.3% |
| 15 to 19 Minutes | 17,735 | 19.2% |
| 20 to 24 Minutes | 13,830 | 15.0% |
| 25 to 29 Minutes | 5,868 | 6.4% |
| 30 to 34 Minutes | 8,712 | 9.4% |
| 35 to 39 Minutes | 2,160 | 2.3% |
| 40 to 44 Minutes | 2,220 | 2.4% |
| 45 to 59 Minutes | 3,775 | 4.1% |
| 60 to 89 Minutes | 2,260 | 2.5% |
| 90 or more Minutes | 2,054 | 2.2% |
Commute Time by Sex in Lackawanna County
The most common commute times in Lackawanna County are 15 to 19 minutes (9,409 commuters, 18.9%) for males and 10 to 14 minutes (9,441 commuters, 22.2%) for females.
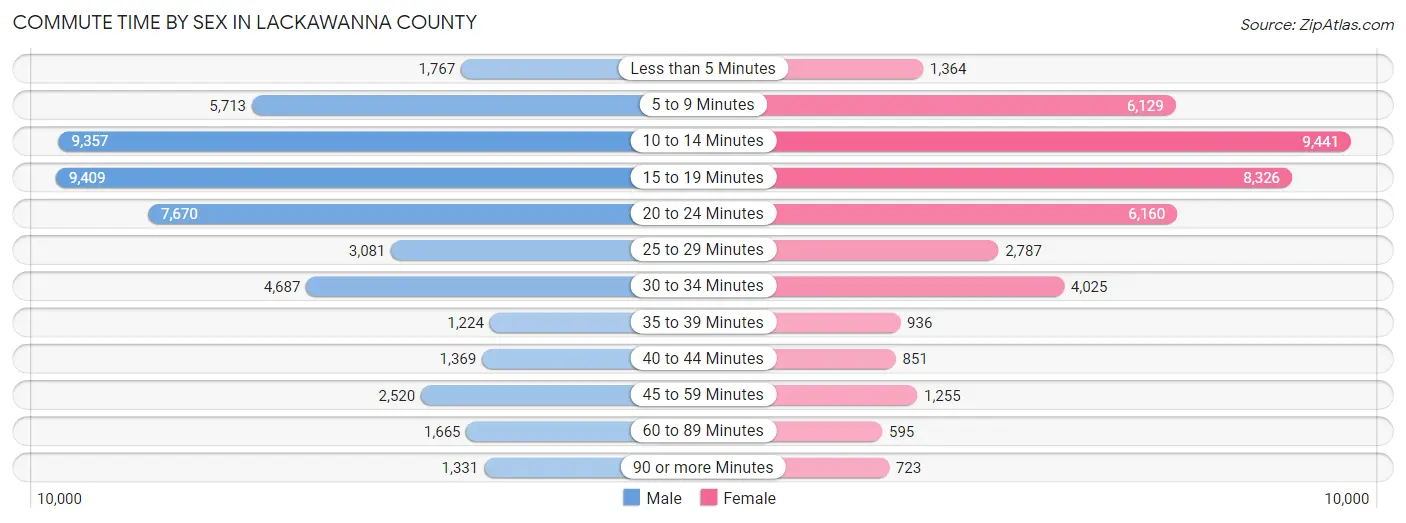
| Commute Time | Male | Female |
| Less than 5 Minutes | 1,767 (3.5%) | 1,364 (3.2%) |
| 5 to 9 Minutes | 5,713 (11.5%) | 6,129 (14.4%) |
| 10 to 14 Minutes | 9,357 (18.8%) | 9,441 (22.2%) |
| 15 to 19 Minutes | 9,409 (18.9%) | 8,326 (19.6%) |
| 20 to 24 Minutes | 7,670 (15.4%) | 6,160 (14.5%) |
| 25 to 29 Minutes | 3,081 (6.2%) | 2,787 (6.5%) |
| 30 to 34 Minutes | 4,687 (9.4%) | 4,025 (9.5%) |
| 35 to 39 Minutes | 1,224 (2.5%) | 936 (2.2%) |
| 40 to 44 Minutes | 1,369 (2.8%) | 851 (2.0%) |
| 45 to 59 Minutes | 2,520 (5.1%) | 1,255 (2.9%) |
| 60 to 89 Minutes | 1,665 (3.3%) | 595 (1.4%) |
| 90 or more Minutes | 1,331 (2.7%) | 723 (1.7%) |
Time of Departure to Work by Sex in Lackawanna County
The most frequent times of departure to work in Lackawanna County are 7:30 AM to 7:59 AM (6,042, 12.1%) for males and 7:30 AM to 7:59 AM (6,937, 16.3%) for females.
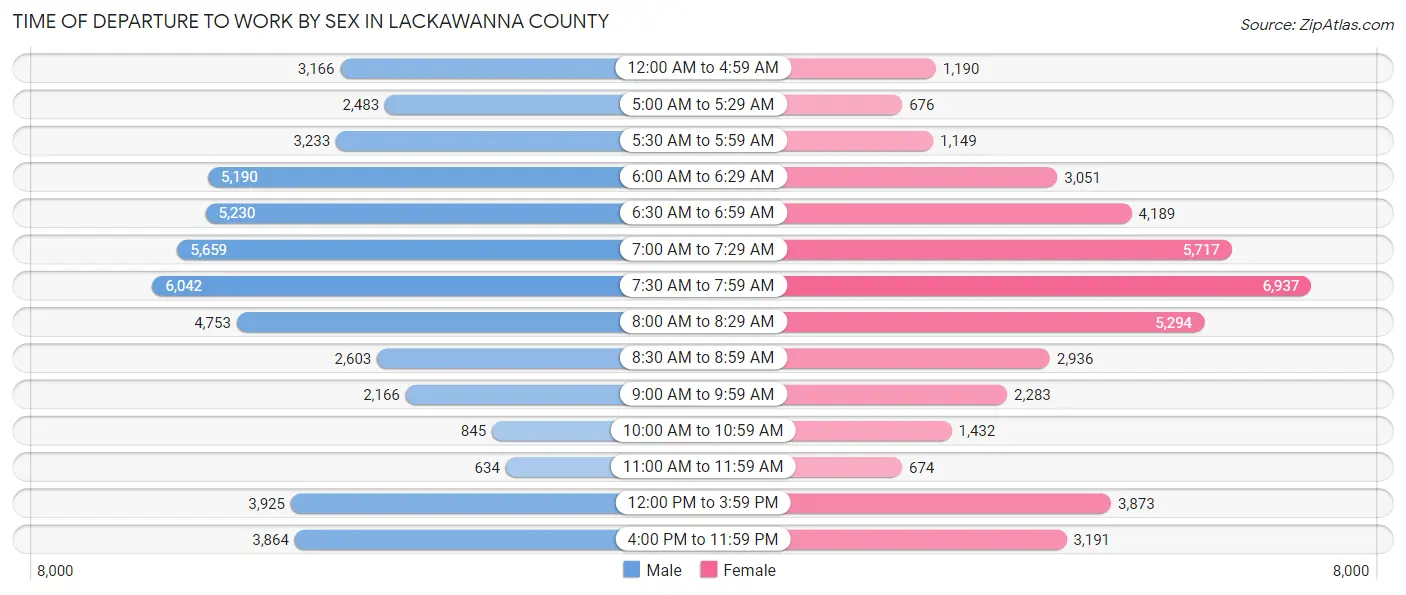
| Time of Departure | Male | Female |
| 12:00 AM to 4:59 AM | 3,166 (6.4%) | 1,190 (2.8%) |
| 5:00 AM to 5:29 AM | 2,483 (5.0%) | 676 (1.6%) |
| 5:30 AM to 5:59 AM | 3,233 (6.5%) | 1,149 (2.7%) |
| 6:00 AM to 6:29 AM | 5,190 (10.4%) | 3,051 (7.2%) |
| 6:30 AM to 6:59 AM | 5,230 (10.5%) | 4,189 (9.8%) |
| 7:00 AM to 7:29 AM | 5,659 (11.4%) | 5,717 (13.4%) |
| 7:30 AM to 7:59 AM | 6,042 (12.1%) | 6,937 (16.3%) |
| 8:00 AM to 8:29 AM | 4,753 (9.6%) | 5,294 (12.4%) |
| 8:30 AM to 8:59 AM | 2,603 (5.2%) | 2,936 (6.9%) |
| 9:00 AM to 9:59 AM | 2,166 (4.3%) | 2,283 (5.4%) |
| 10:00 AM to 10:59 AM | 845 (1.7%) | 1,432 (3.4%) |
| 11:00 AM to 11:59 AM | 634 (1.3%) | 674 (1.6%) |
| 12:00 PM to 3:59 PM | 3,925 (7.9%) | 3,873 (9.1%) |
| 4:00 PM to 11:59 PM | 3,864 (7.8%) | 3,191 (7.5%) |
| Total | 49,793 (100.0%) | 42,592 (100.0%) |
Housing Occupancy in Lackawanna County
Occupancy by Ownership in Lackawanna County
Of the total 87,896 dwellings in Lackawanna County, owner-occupied units account for 57,476 (65.4%), while renter-occupied units make up 30,420 (34.6%).
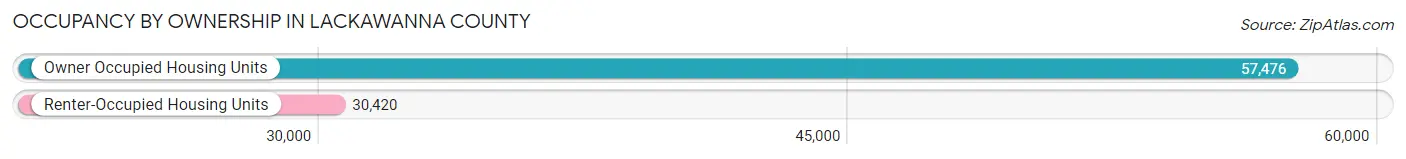
| Occupancy | # Housing Units | % Housing Units |
| Owner Occupied Housing Units | 57,476 | 65.4% |
| Renter-Occupied Housing Units | 30,420 | 34.6% |
| Total Occupied Housing Units | 87,896 | 100.0% |
Occupancy by Household Size in Lackawanna County
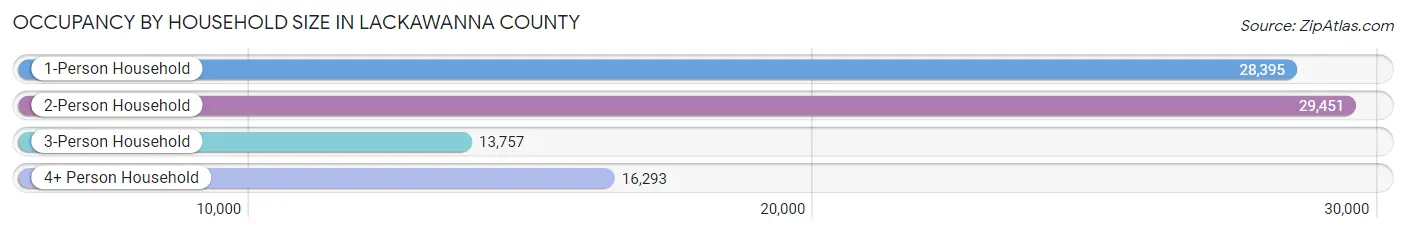
| Household Size | # Housing Units | % Housing Units |
| 1-Person Household | 28,395 | 32.3% |
| 2-Person Household | 29,451 | 33.5% |
| 3-Person Household | 13,757 | 15.7% |
| 4+ Person Household | 16,293 | 18.5% |
| Total Housing Units | 87,896 | 100.0% |
Occupancy by Ownership by Household Size in Lackawanna County
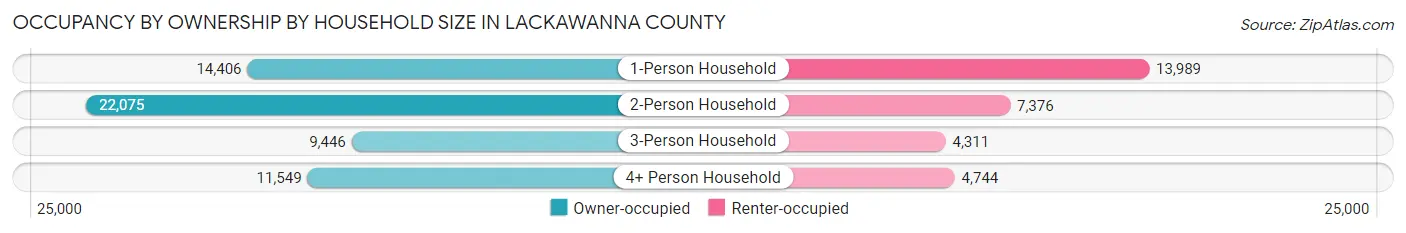
| Household Size | Owner-occupied | Renter-occupied |
| 1-Person Household | 14,406 (50.7%) | 13,989 (49.3%) |
| 2-Person Household | 22,075 (75.0%) | 7,376 (25.0%) |
| 3-Person Household | 9,446 (68.7%) | 4,311 (31.3%) |
| 4+ Person Household | 11,549 (70.9%) | 4,744 (29.1%) |
| Total Housing Units | 57,476 (65.4%) | 30,420 (34.6%) |
Occupancy by Educational Attainment in Lackawanna County
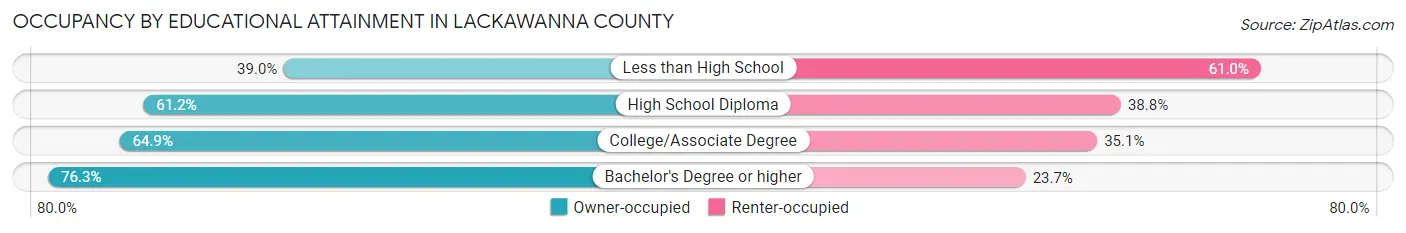
| Household Size | Owner-occupied | Renter-occupied |
| Less than High School | 2,568 (39.0%) | 4,019 (61.0%) |
| High School Diploma | 17,521 (61.2%) | 11,123 (38.8%) |
| College/Associate Degree | 15,954 (64.9%) | 8,613 (35.1%) |
| Bachelor's Degree or higher | 21,433 (76.3%) | 6,665 (23.7%) |
Occupancy by Age of Householder in Lackawanna County
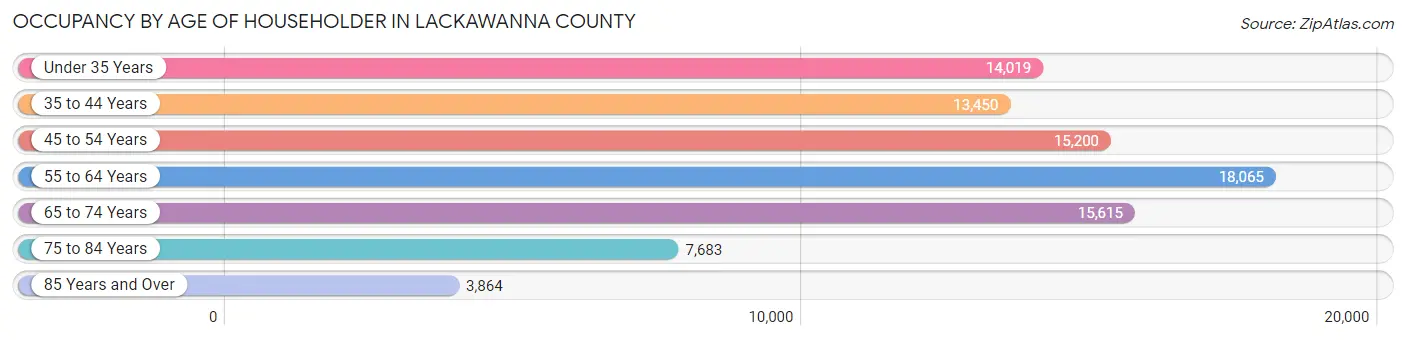
| Age Bracket | # Households | % Households |
| Under 35 Years | 14,019 | 16.0% |
| 35 to 44 Years | 13,450 | 15.3% |
| 45 to 54 Years | 15,200 | 17.3% |
| 55 to 64 Years | 18,065 | 20.5% |
| 65 to 74 Years | 15,615 | 17.8% |
| 75 to 84 Years | 7,683 | 8.7% |
| 85 Years and Over | 3,864 | 4.4% |
| Total | 87,896 | 100.0% |
Housing Finances in Lackawanna County
Median Income by Occupancy in Lackawanna County
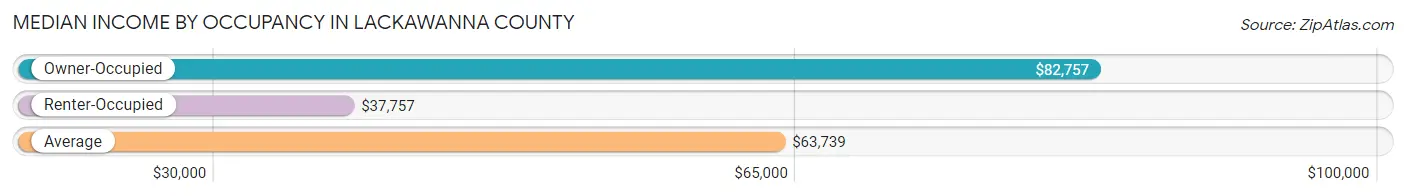
| Occupancy Type | # Households | Median Income |
| Owner-Occupied | 57,476 (65.4%) | $82,757 |
| Renter-Occupied | 30,420 (34.6%) | $37,757 |
| Average | 87,896 (100.0%) | $63,739 |
Occupancy by Householder Income Bracket in Lackawanna County
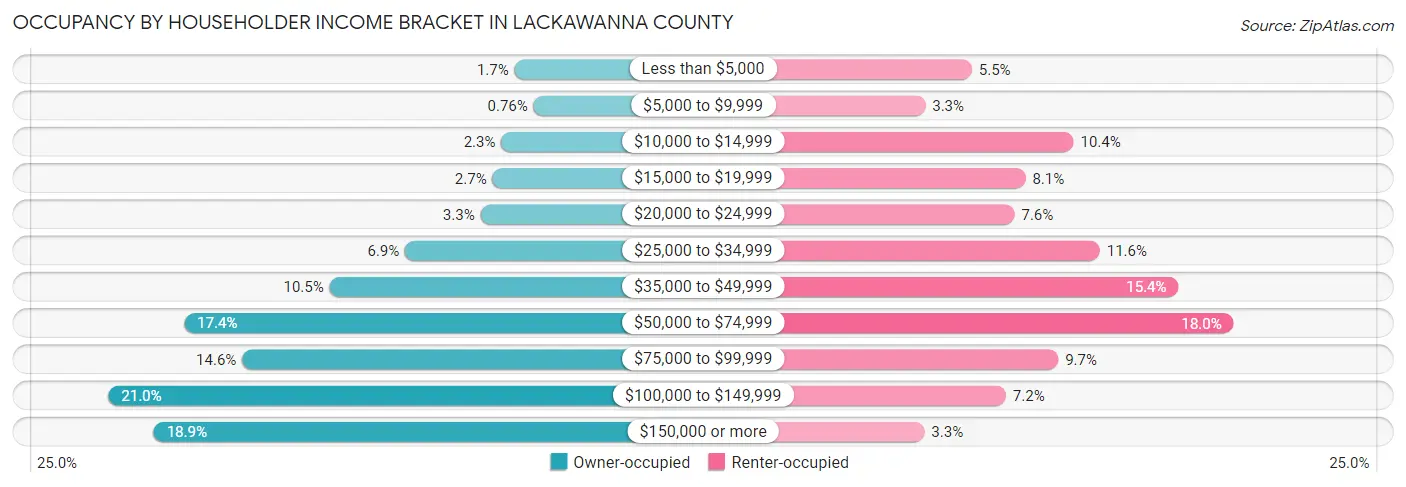
| Income Bracket | Owner-occupied | Renter-occupied |
| Less than $5,000 | 962 (1.7%) | 1,686 (5.5%) |
| $5,000 to $9,999 | 439 (0.8%) | 1,009 (3.3%) |
| $10,000 to $14,999 | 1,320 (2.3%) | 3,159 (10.4%) |
| $15,000 to $19,999 | 1,562 (2.7%) | 2,460 (8.1%) |
| $20,000 to $24,999 | 1,890 (3.3%) | 2,303 (7.6%) |
| $25,000 to $34,999 | 3,955 (6.9%) | 3,539 (11.6%) |
| $35,000 to $49,999 | 6,022 (10.5%) | 4,676 (15.4%) |
| $50,000 to $74,999 | 10,003 (17.4%) | 5,477 (18.0%) |
| $75,000 to $99,999 | 8,413 (14.6%) | 2,935 (9.7%) |
| $100,000 to $149,999 | 12,073 (21.0%) | 2,177 (7.2%) |
| $150,000 or more | 10,837 (18.9%) | 999 (3.3%) |
| Total | 57,476 (100.0%) | 30,420 (100.0%) |
Monthly Housing Cost Tiers in Lackawanna County
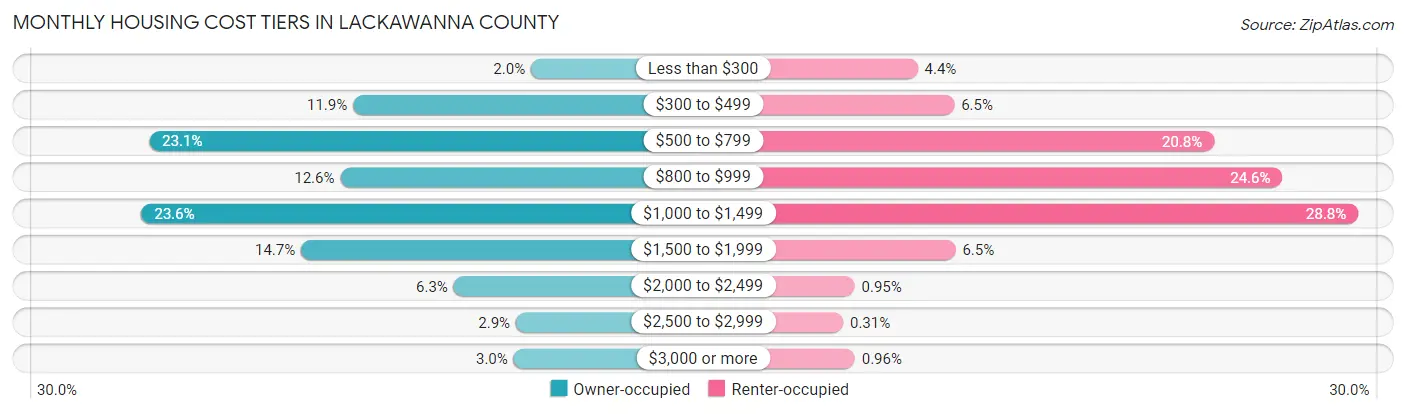
| Monthly Cost | Owner-occupied | Renter-occupied |
| Less than $300 | 1,166 (2.0%) | 1,347 (4.4%) |
| $300 to $499 | 6,816 (11.9%) | 1,963 (6.5%) |
| $500 to $799 | 13,286 (23.1%) | 6,328 (20.8%) |
| $800 to $999 | 7,219 (12.6%) | 7,473 (24.6%) |
| $1,000 to $1,499 | 13,535 (23.5%) | 8,750 (28.8%) |
| $1,500 to $1,999 | 8,469 (14.7%) | 1,984 (6.5%) |
| $2,000 to $2,499 | 3,623 (6.3%) | 290 (0.9%) |
| $2,500 to $2,999 | 1,646 (2.9%) | 95 (0.3%) |
| $3,000 or more | 1,716 (3.0%) | 292 (1.0%) |
| Total | 57,476 (100.0%) | 30,420 (100.0%) |
Physical Housing Characteristics in Lackawanna County
Housing Structures in Lackawanna County
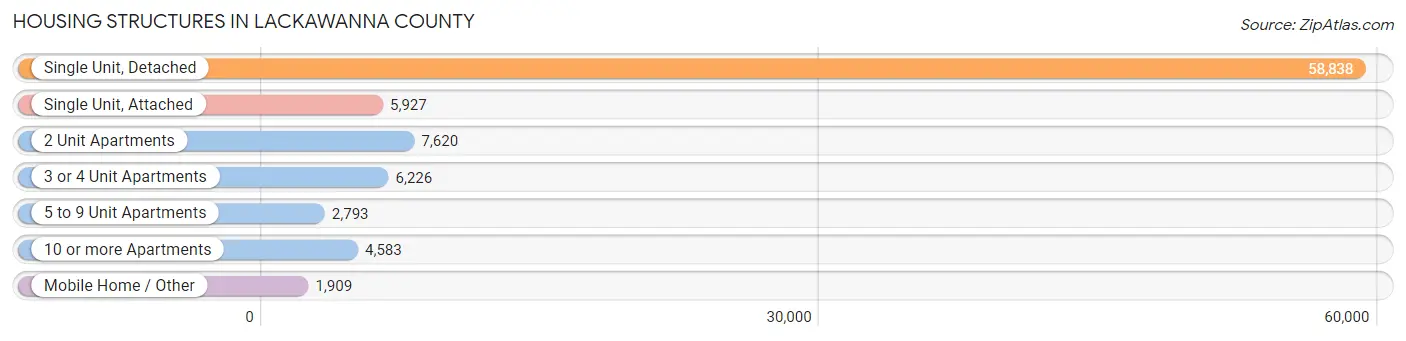
| Structure Type | # Housing Units | % Housing Units |
| Single Unit, Detached | 58,838 | 66.9% |
| Single Unit, Attached | 5,927 | 6.7% |
| 2 Unit Apartments | 7,620 | 8.7% |
| 3 or 4 Unit Apartments | 6,226 | 7.1% |
| 5 to 9 Unit Apartments | 2,793 | 3.2% |
| 10 or more Apartments | 4,583 | 5.2% |
| Mobile Home / Other | 1,909 | 2.2% |
| Total | 87,896 | 100.0% |
Housing Structures by Occupancy in Lackawanna County
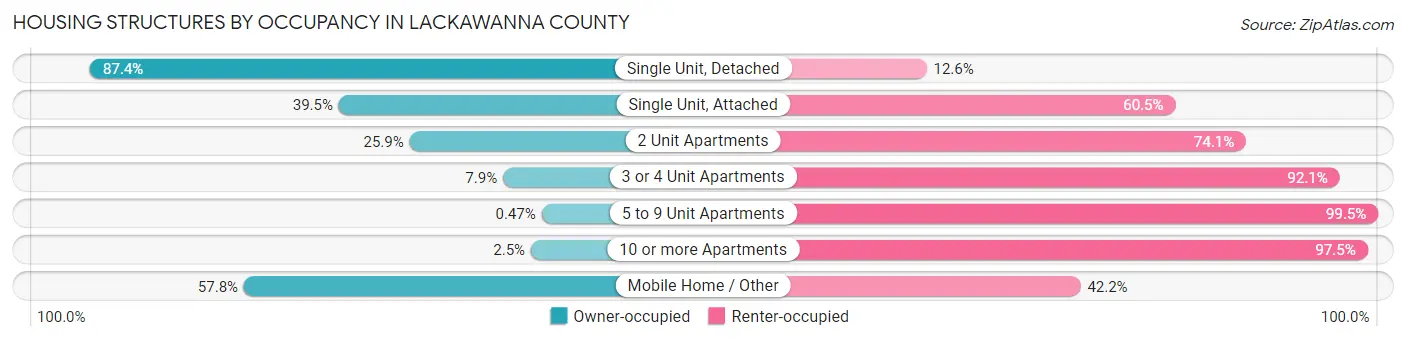
| Structure Type | Owner-occupied | Renter-occupied |
| Single Unit, Detached | 51,439 (87.4%) | 7,399 (12.6%) |
| Single Unit, Attached | 2,342 (39.5%) | 3,585 (60.5%) |
| 2 Unit Apartments | 1,973 (25.9%) | 5,647 (74.1%) |
| 3 or 4 Unit Apartments | 491 (7.9%) | 5,735 (92.1%) |
| 5 to 9 Unit Apartments | 13 (0.5%) | 2,780 (99.5%) |
| 10 or more Apartments | 115 (2.5%) | 4,468 (97.5%) |
| Mobile Home / Other | 1,103 (57.8%) | 806 (42.2%) |
| Total | 57,476 (65.4%) | 30,420 (34.6%) |
Housing Structures by Number of Rooms in Lackawanna County
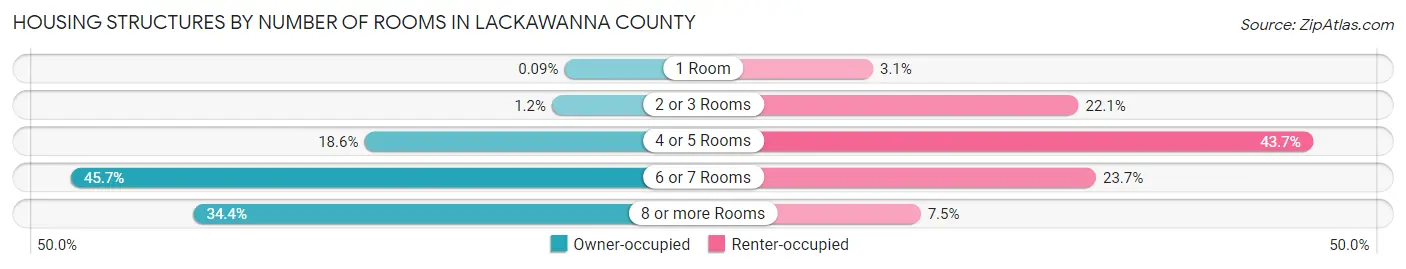
| Number of Rooms | Owner-occupied | Renter-occupied |
| 1 Room | 52 (0.1%) | 932 (3.1%) |
| 2 or 3 Rooms | 712 (1.2%) | 6,715 (22.1%) |
| 4 or 5 Rooms | 10,686 (18.6%) | 13,294 (43.7%) |
| 6 or 7 Rooms | 26,272 (45.7%) | 7,207 (23.7%) |
| 8 or more Rooms | 19,754 (34.4%) | 2,272 (7.5%) |
| Total | 57,476 (100.0%) | 30,420 (100.0%) |
Housing Structure by Heating Type in Lackawanna County
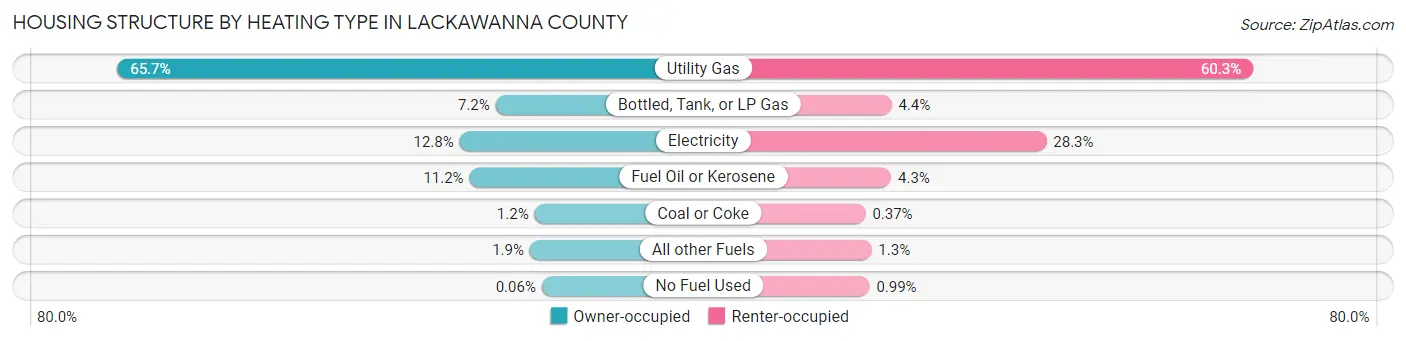
| Heating Type | Owner-occupied | Renter-occupied |
| Utility Gas | 37,746 (65.7%) | 18,337 (60.3%) |
| Bottled, Tank, or LP Gas | 4,141 (7.2%) | 1,337 (4.4%) |
| Electricity | 7,332 (12.8%) | 8,620 (28.3%) |
| Fuel Oil or Kerosene | 6,453 (11.2%) | 1,321 (4.3%) |
| Coal or Coke | 678 (1.2%) | 112 (0.4%) |
| All other Fuels | 1,094 (1.9%) | 391 (1.3%) |
| No Fuel Used | 32 (0.1%) | 302 (1.0%) |
| Total | 57,476 (100.0%) | 30,420 (100.0%) |
Household Vehicle Usage in Lackawanna County
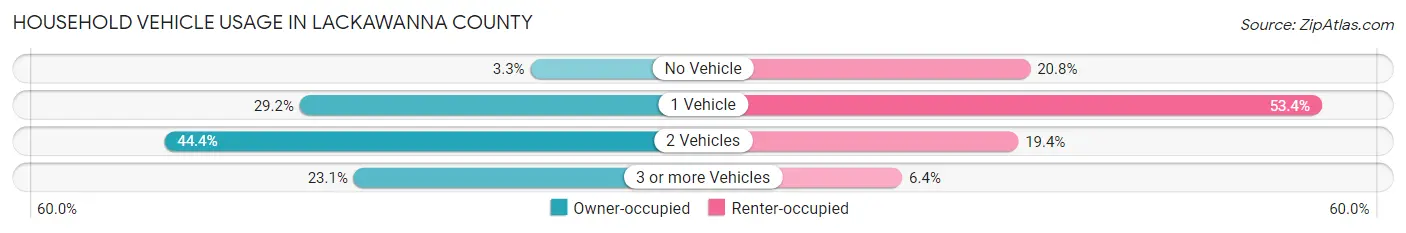
| Vehicles per Household | Owner-occupied | Renter-occupied |
| No Vehicle | 1,919 (3.3%) | 6,315 (20.8%) |
| 1 Vehicle | 16,771 (29.2%) | 16,248 (53.4%) |
| 2 Vehicles | 25,492 (44.4%) | 5,906 (19.4%) |
| 3 or more Vehicles | 13,294 (23.1%) | 1,951 (6.4%) |
| Total | 57,476 (100.0%) | 30,420 (100.0%) |
Real Estate & Mortgages in Lackawanna County
Real Estate and Mortgage Overview in Lackawanna County
| Characteristic | Without Mortgage | With Mortgage |
| Housing Units | 26,262 | 31,214 |
| Median Property Value | $160,900 | $188,600 |
| Median Household Income | $63,362 | $7,493 |
| Monthly Housing Costs | $627 | $1,697 |
| Real Estate Taxes | $2,724 | $339 |
Property Value by Mortgage Status in Lackawanna County
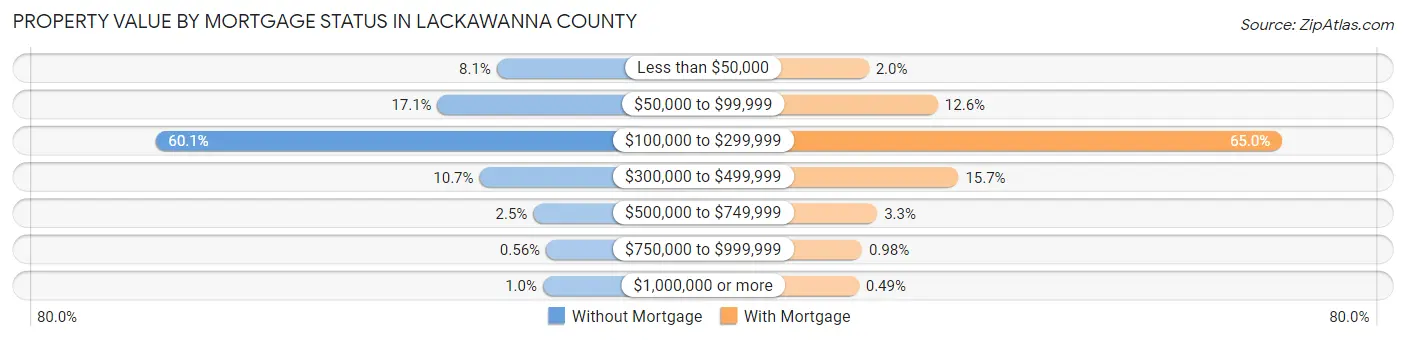
| Property Value | Without Mortgage | With Mortgage |
| Less than $50,000 | 2,117 (8.1%) | 623 (2.0%) |
| $50,000 to $99,999 | 4,488 (17.1%) | 3,917 (12.6%) |
| $100,000 to $299,999 | 15,772 (60.1%) | 20,292 (65.0%) |
| $300,000 to $499,999 | 2,811 (10.7%) | 4,893 (15.7%) |
| $500,000 to $749,999 | 656 (2.5%) | 1,030 (3.3%) |
| $750,000 to $999,999 | 147 (0.6%) | 305 (1.0%) |
| $1,000,000 or more | 271 (1.0%) | 154 (0.5%) |
| Total | 26,262 (100.0%) | 31,214 (100.0%) |
Household Income by Mortgage Status in Lackawanna County
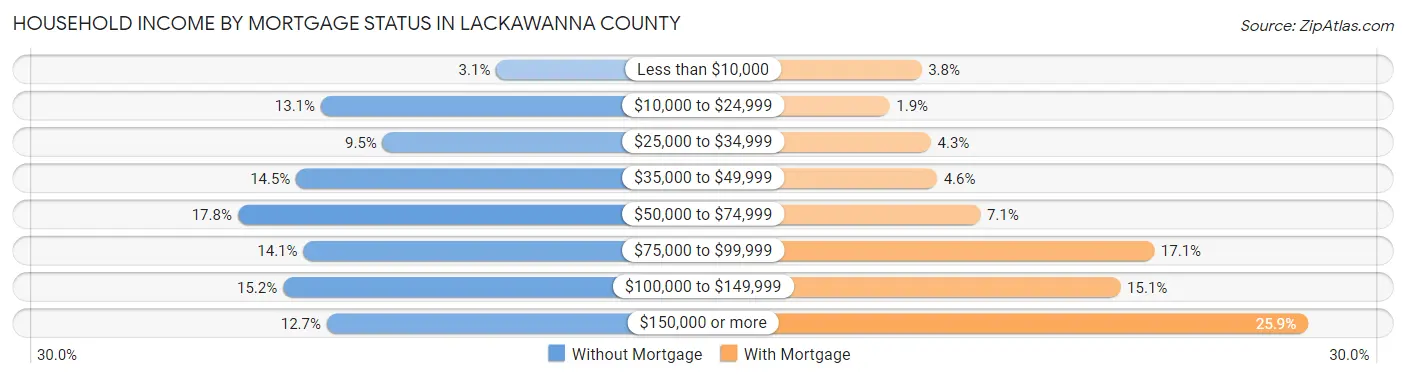
| Household Income | Without Mortgage | With Mortgage |
| Less than $10,000 | 800 (3.0%) | 1,170 (3.7%) |
| $10,000 to $24,999 | 3,433 (13.1%) | 601 (1.9%) |
| $25,000 to $34,999 | 2,506 (9.5%) | 1,339 (4.3%) |
| $35,000 to $49,999 | 3,804 (14.5%) | 1,449 (4.6%) |
| $50,000 to $74,999 | 4,681 (17.8%) | 2,218 (7.1%) |
| $75,000 to $99,999 | 3,694 (14.1%) | 5,322 (17.1%) |
| $100,000 to $149,999 | 4,000 (15.2%) | 4,719 (15.1%) |
| $150,000 or more | 3,344 (12.7%) | 8,073 (25.9%) |
| Total | 26,262 (100.0%) | 31,214 (100.0%) |
Property Value to Household Income Ratio in Lackawanna County
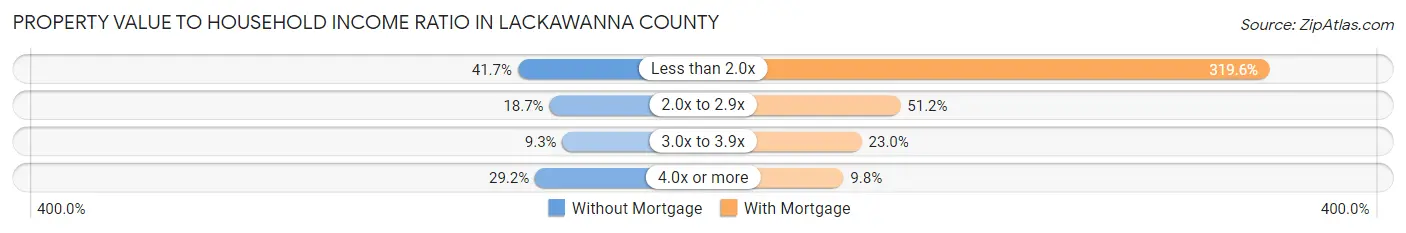
| Value-to-Income Ratio | Without Mortgage | With Mortgage |
| Less than 2.0x | 10,957 (41.7%) | 99,770 (319.6%) |
| 2.0x to 2.9x | 4,915 (18.7%) | 15,974 (51.2%) |
| 3.0x to 3.9x | 2,444 (9.3%) | 7,185 (23.0%) |
| 4.0x or more | 7,664 (29.2%) | 3,060 (9.8%) |
| Total | 26,262 (100.0%) | 31,214 (100.0%) |
Real Estate Taxes by Mortgage Status in Lackawanna County
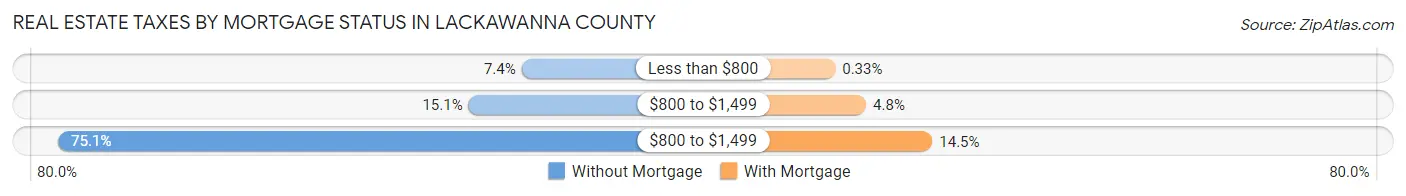
| Property Taxes | Without Mortgage | With Mortgage |
| Less than $800 | 1,942 (7.4%) | 104 (0.3%) |
| $800 to $1,499 | 3,976 (15.1%) | 1,510 (4.8%) |
| $800 to $1,499 | 19,720 (75.1%) | 4,529 (14.5%) |
| Total | 26,262 (100.0%) | 31,214 (100.0%) |
Health & Disability in Lackawanna County
Health Insurance Coverage by Age in Lackawanna County
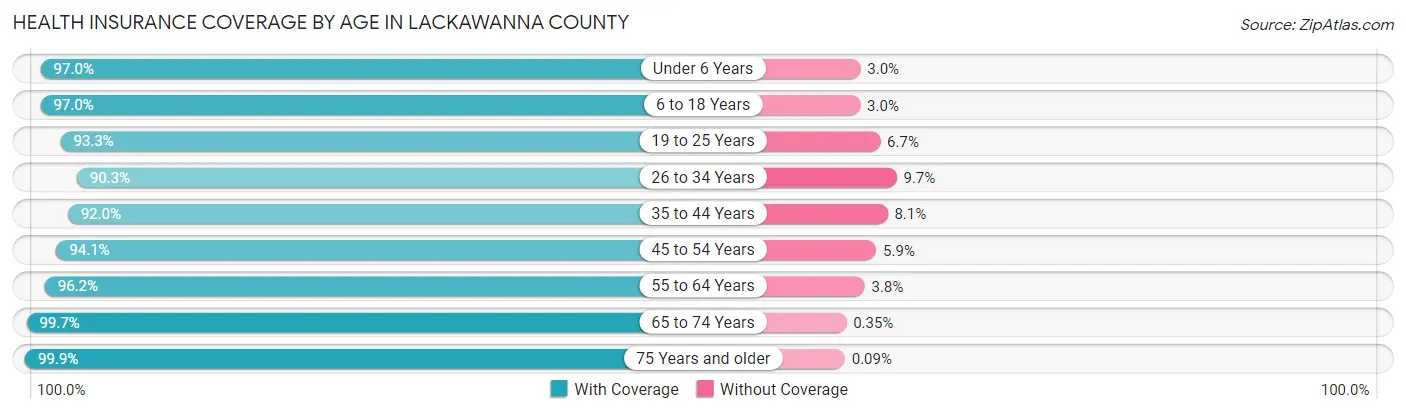
| Age Bracket | With Coverage | Without Coverage |
| Under 6 Years | 12,820 (97.0%) | 397 (3.0%) |
| 6 to 18 Years | 32,636 (97.0%) | 997 (3.0%) |
| 19 to 25 Years | 17,823 (93.3%) | 1,277 (6.7%) |
| 26 to 34 Years | 21,186 (90.3%) | 2,285 (9.7%) |
| 35 to 44 Years | 23,039 (91.9%) | 2,017 (8.1%) |
| 45 to 54 Years | 24,976 (94.1%) | 1,576 (5.9%) |
| 55 to 64 Years | 28,873 (96.2%) | 1,130 (3.8%) |
| 65 to 74 Years | 24,085 (99.7%) | 85 (0.4%) |
| 75 Years and older | 16,833 (99.9%) | 16 (0.1%) |
| Total | 202,271 (95.4%) | 9,780 (4.6%) |
Health Insurance Coverage by Citizenship Status in Lackawanna County
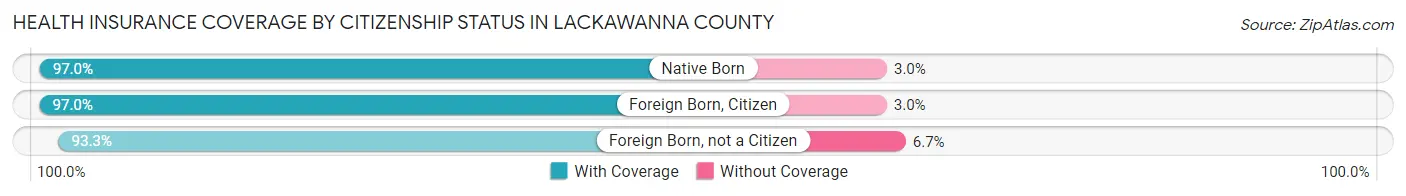
| Citizenship Status | With Coverage | Without Coverage |
| Native Born | 12,820 (97.0%) | 397 (3.0%) |
| Foreign Born, Citizen | 32,636 (97.0%) | 997 (3.0%) |
| Foreign Born, not a Citizen | 17,823 (93.3%) | 1,277 (6.7%) |
Health Insurance Coverage by Household Income in Lackawanna County
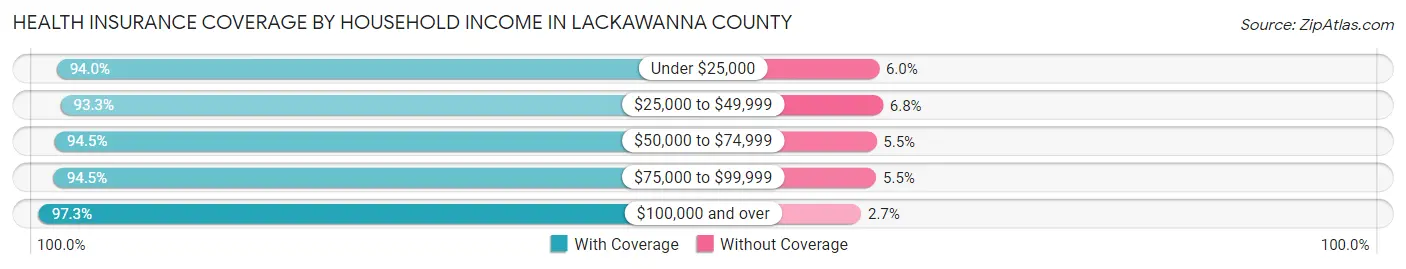
| Household Income | With Coverage | Without Coverage |
| Under $25,000 | 25,242 (94.0%) | 1,618 (6.0%) |
| $25,000 to $49,999 | 32,529 (93.2%) | 2,354 (6.8%) |
| $50,000 to $74,999 | 33,821 (94.5%) | 1,978 (5.5%) |
| $75,000 to $99,999 | 27,783 (94.5%) | 1,613 (5.5%) |
| $100,000 and over | 78,346 (97.3%) | 2,150 (2.7%) |
Public vs Private Health Insurance Coverage by Age in Lackawanna County
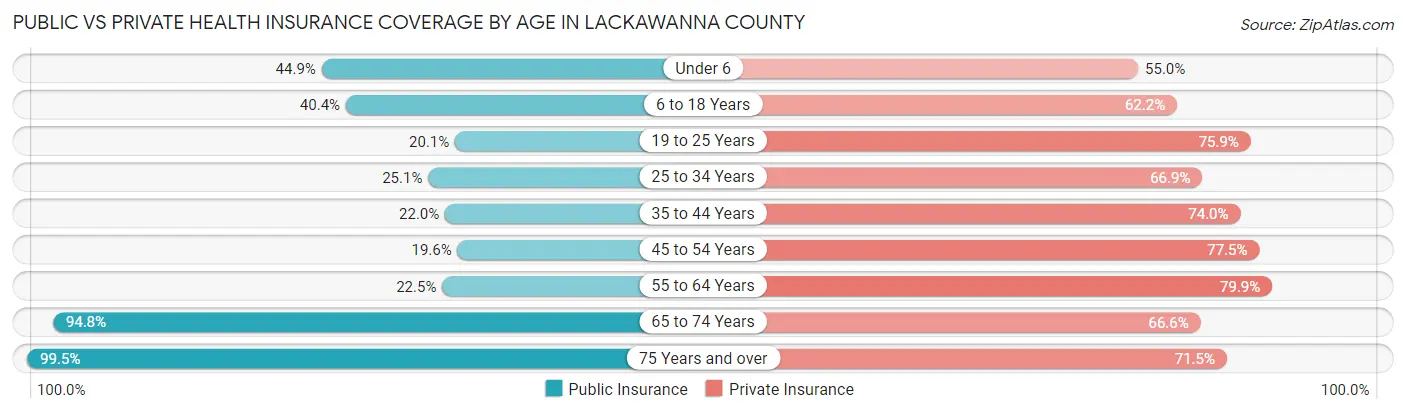
| Age Bracket | Public Insurance | Private Insurance |
| Under 6 | 5,929 (44.9%) | 7,270 (55.0%) |
| 6 to 18 Years | 13,574 (40.4%) | 20,922 (62.2%) |
| 19 to 25 Years | 3,838 (20.1%) | 14,495 (75.9%) |
| 25 to 34 Years | 5,886 (25.1%) | 15,701 (66.9%) |
| 35 to 44 Years | 5,499 (22.0%) | 18,534 (74.0%) |
| 45 to 54 Years | 5,215 (19.6%) | 20,579 (77.5%) |
| 55 to 64 Years | 6,744 (22.5%) | 23,962 (79.9%) |
| 65 to 74 Years | 22,901 (94.8%) | 16,092 (66.6%) |
| 75 Years and over | 16,772 (99.5%) | 12,041 (71.5%) |
| Total | 86,358 (40.7%) | 149,596 (70.6%) |
Disability Status by Sex by Age in Lackawanna County
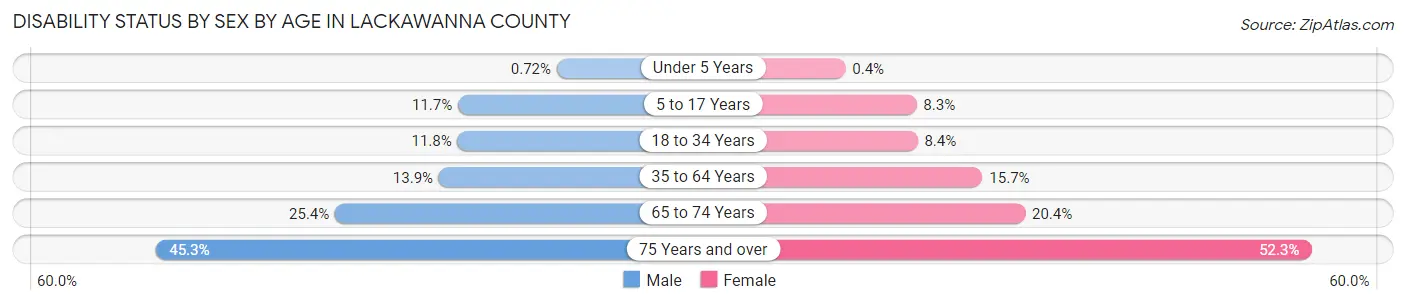
| Age Bracket | Male | Female |
| Under 5 Years | 41 (0.7%) | 21 (0.4%) |
| 5 to 17 Years | 2,017 (11.7%) | 1,318 (8.3%) |
| 18 to 34 Years | 2,656 (11.8%) | 1,923 (8.4%) |
| 35 to 64 Years | 5,618 (13.9%) | 6,434 (15.7%) |
| 65 to 74 Years | 2,929 (25.4%) | 2,581 (20.4%) |
| 75 Years and over | 3,000 (45.3%) | 5,349 (52.3%) |
Disability Class by Sex by Age in Lackawanna County
Disability Class: Hearing Difficulty
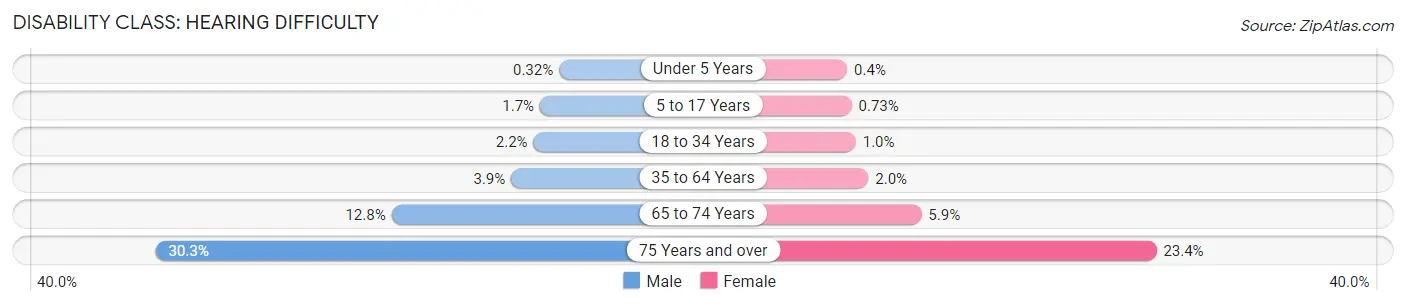
| Age Bracket | Male | Female |
| Under 5 Years | 18 (0.3%) | 21 (0.4%) |
| 5 to 17 Years | 300 (1.7%) | 116 (0.7%) |
| 18 to 34 Years | 501 (2.2%) | 238 (1.0%) |
| 35 to 64 Years | 1,571 (3.9%) | 810 (2.0%) |
| 65 to 74 Years | 1,471 (12.8%) | 748 (5.9%) |
| 75 Years and over | 2,004 (30.3%) | 2,390 (23.4%) |
Disability Class: Vision Difficulty
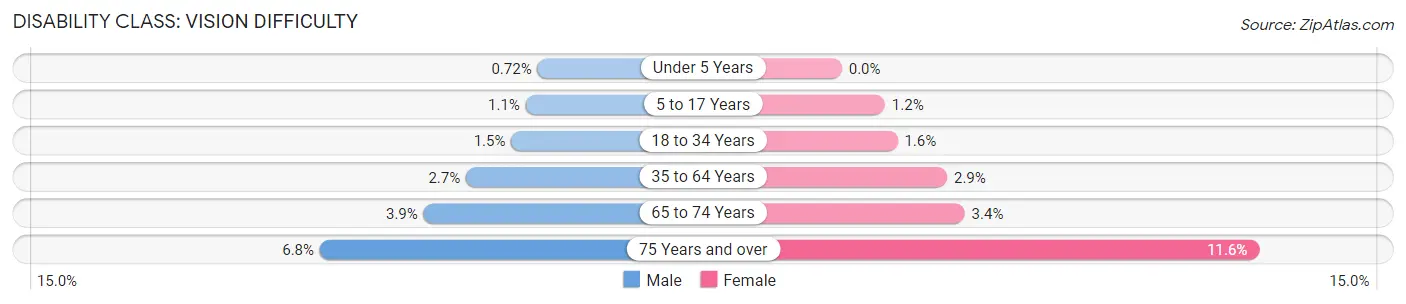
| Age Bracket | Male | Female |
| Under 5 Years | 41 (0.7%) | 0 (0.0%) |
| 5 to 17 Years | 181 (1.1%) | 191 (1.2%) |
| 18 to 34 Years | 327 (1.5%) | 353 (1.5%) |
| 35 to 64 Years | 1,098 (2.7%) | 1,203 (2.9%) |
| 65 to 74 Years | 448 (3.9%) | 433 (3.4%) |
| 75 Years and over | 449 (6.8%) | 1,189 (11.6%) |
Disability Class: Cognitive Difficulty
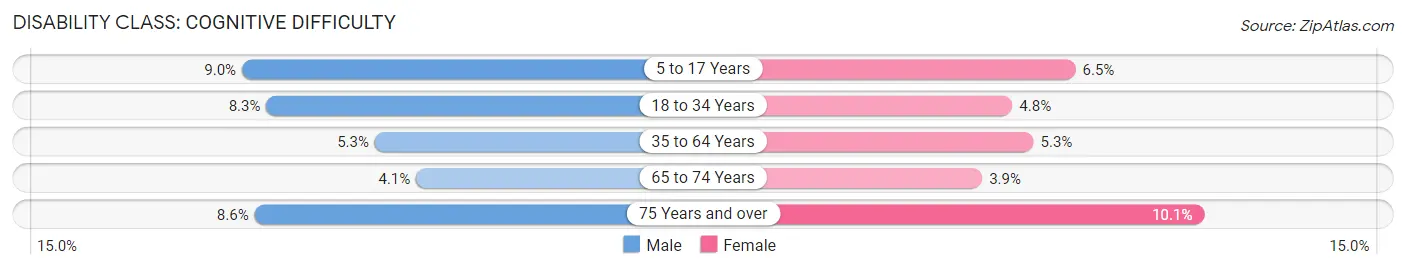
| Age Bracket | Male | Female |
| 5 to 17 Years | 1,539 (8.9%) | 1,032 (6.5%) |
| 18 to 34 Years | 1,866 (8.3%) | 1,083 (4.8%) |
| 35 to 64 Years | 2,127 (5.2%) | 2,193 (5.3%) |
| 65 to 74 Years | 472 (4.1%) | 494 (3.9%) |
| 75 Years and over | 569 (8.6%) | 1,032 (10.1%) |
Disability Class: Ambulatory Difficulty
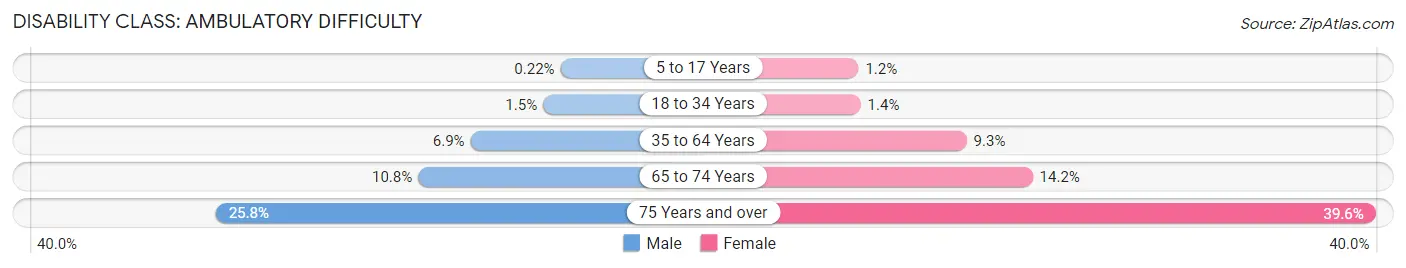
| Age Bracket | Male | Female |
| 5 to 17 Years | 37 (0.2%) | 196 (1.2%) |
| 18 to 34 Years | 341 (1.5%) | 320 (1.4%) |
| 35 to 64 Years | 2,798 (6.9%) | 3,808 (9.3%) |
| 65 to 74 Years | 1,244 (10.8%) | 1,792 (14.2%) |
| 75 Years and over | 1,708 (25.8%) | 4,055 (39.6%) |
Disability Class: Self-Care Difficulty
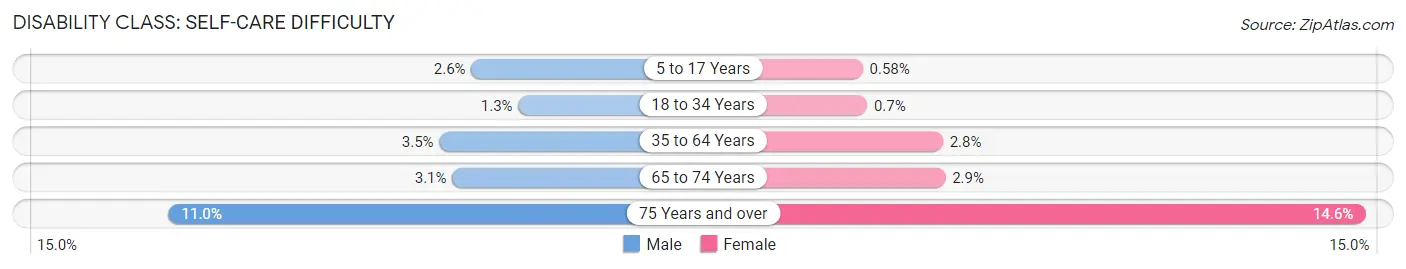
| Age Bracket | Male | Female |
| 5 to 17 Years | 440 (2.6%) | 92 (0.6%) |
| 18 to 34 Years | 281 (1.3%) | 159 (0.7%) |
| 35 to 64 Years | 1,400 (3.5%) | 1,154 (2.8%) |
| 65 to 74 Years | 356 (3.1%) | 364 (2.9%) |
| 75 Years and over | 727 (11.0%) | 1,491 (14.6%) |
Technology Access in Lackawanna County
Computing Device Access in Lackawanna County
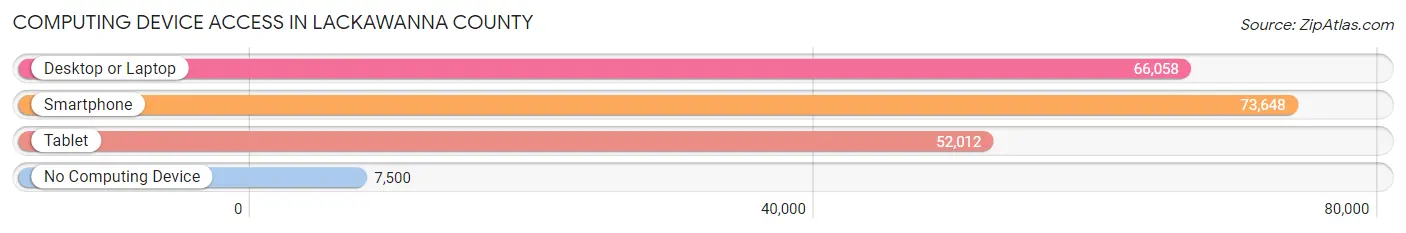
| Device Type | # Households | % Households |
| Desktop or Laptop | 66,058 | 75.1% |
| Smartphone | 73,648 | 83.8% |
| Tablet | 52,012 | 59.2% |
| No Computing Device | 7,500 | 8.5% |
| Total | 87,896 | 100.0% |
Internet Access in Lackawanna County
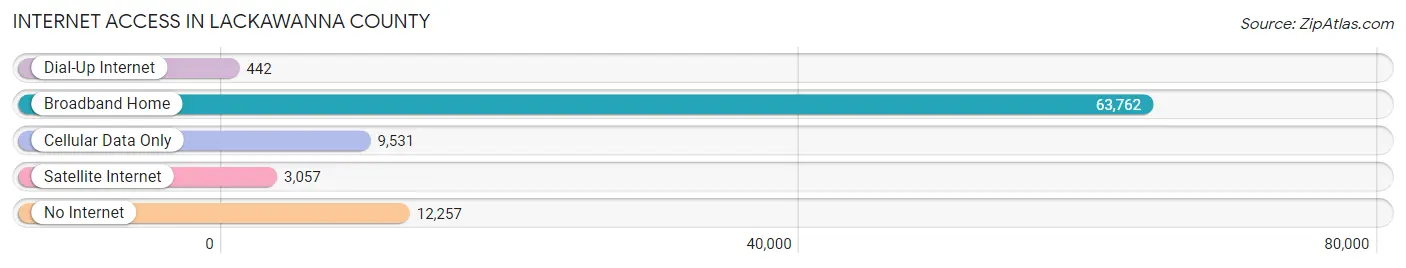
| Internet Type | # Households | % Households |
| Dial-Up Internet | 442 | 0.5% |
| Broadband Home | 63,762 | 72.5% |
| Cellular Data Only | 9,531 | 10.8% |
| Satellite Internet | 3,057 | 3.5% |
| No Internet | 12,257 | 13.9% |
| Total | 87,896 | 100.0% |
Lackawanna County Summary
Lackawanna County is located in Northeastern Pennsylvania and is part of the Scranton/Wilkes-Barre metropolitan area. The county was created in 1878 from part of Luzerne County and is named after the Lackawanna River. The county seat is Scranton, the sixth-largest city in the state. As of the 2010 census, the population of Lackawanna County was 214,437.
History
The area that is now Lackawanna County was originally inhabited by the Iroquois and Lenape Native American tribes. The first European settlers arrived in the area in the late 17th century, and the area was part of Luzerne County when it was created in 1786. In 1878, Lackawanna County was created from part of Luzerne County.
The county was an important center of the coal mining industry in the late 19th and early 20th centuries. The Delaware, Lackawanna and Western Railroad, which ran through the county, was an important part of the coal industry. The railroad was also important for the development of the county’s cities and towns.
In the late 19th and early 20th centuries, the county was a major center of the labor movement. The county was home to the first major labor strike in the United States, the Great Railroad Strike of 1877. The county was also the site of the first major labor union in the United States, the Knights of Labor.
Geography
Lackawanna County is located in Northeastern Pennsylvania and is part of the Scranton/Wilkes-Barre metropolitan area. The county is bordered by Susquehanna County to the north, Wayne County to the east, Luzerne County to the south, and Wyoming County to the west. The county has a total area of 465 square miles, of which 462 square miles is land and 3 square miles is water.
The county is located in the Appalachian Mountains and is home to several mountain ranges, including the Moosic Mountains, the Lackawanna Mountains, and the Pocono Mountains. The highest point in the county is the summit of Mount Mitchell, which has an elevation of 2,037 feet.
Economy
The economy of Lackawanna County is largely based on manufacturing, healthcare, and education. The county is home to several major employers, including Geisinger Health System, the University of Scranton, and the Commonwealth Medical College.
The county is also home to several major manufacturing companies, including Procter & Gamble, Unilever, and Kraft Foods. The county is also home to several major retail stores, including Walmart, Target, and Lowe’s.
Demographics
As of the 2010 census, the population of Lackawanna County was 214,437. The population is made up of 97.2% White, 1.2% African American, 0.3% Native American, 0.7% Asian, 0.1% Pacific Islander, 0.5% from other races, and 1.1% from two or more races. The median household income in the county is $45,837 and the median family income is $55,945. The per capita income in the county is $24,845.
Conclusion
Lackawanna County is located in Northeastern Pennsylvania and is part of the Scranton/Wilkes-Barre metropolitan area. The county was created in 1878 from part of Luzerne County and is named after the Lackawanna River. The county has a long history of coal mining and labor activism, and is now home to several major employers in the manufacturing, healthcare, and education sectors. The population of the county is 214,437, with a median household income of $45,837 and a median family income of $55,945.
Common Questions
What is Per Capita Income in Lackawanna County?
Per Capita income in Lackawanna County is $35,296.
What is the Median Family Income in Lackawanna County?
Median Family Income in Lackawanna County is $82,944.
What is the Median Household income in Lackawanna County?
Median Household Income in Lackawanna County is $63,739.
What is Income or Wage Gap in Lackawanna County?
Income or Wage Gap in Lackawanna County is 26.4%.
Women in Lackawanna County earn 73.6 cents for every dollar earned by a man.
What is Family Income Deficit in Lackawanna County?
Family Income Deficit in Lackawanna County is $10,256.
Families that are below poverty line in Lackawanna County earn $10,256 less on average than the poverty threshold level.
What is Inequality or Gini Index in Lackawanna County?
Inequality or Gini Index in Lackawanna County is 0.46.
What is the Total Population of Lackawanna County?
Total Population of Lackawanna County is 215,672.
What is the Total Male Population of Lackawanna County?
Total Male Population of Lackawanna County is 105,900.
What is the Total Female Population of Lackawanna County?
Total Female Population of Lackawanna County is 109,772.
What is the Ratio of Males per 100 Females in Lackawanna County?
There are 96.47 Males per 100 Females in Lackawanna County.
What is the Ratio of Females per 100 Males in Lackawanna County?
There are 103.66 Females per 100 Males in Lackawanna County.
What is the Median Population Age in Lackawanna County?
Median Population Age in Lackawanna County is 41.9 Years.
What is the Average Family Size in Lackawanna County
Average Family Size in Lackawanna County is 3.0 People.
What is the Average Household Size in Lackawanna County
Average Household Size in Lackawanna County is 2.4 People.
How Large is the Labor Force in Lackawanna County?
There are 107,620 People in the Labor Forcein in Lackawanna County.
What is the Percentage of People in the Labor Force in Lackawanna County?
60.6% of People are in the Labor Force in Lackawanna County.
What is the Unemployment Rate in Lackawanna County?
Unemployment Rate in Lackawanna County is 4.8%.