Juniata County, PA Map & Demographics
Juniata County Map
Juniata County Overview
$31,251
PER CAPITA INCOME
$78,555
AVG FAMILY INCOME
$61,915
AVG HOUSEHOLD INCOME
34.1%
WAGE / INCOME GAP [ % ]
65.9¢/ $1
WAGE / INCOME GAP [ $ ]
$10,773
FAMILY INCOME DEFICIT
0.41
INEQUALITY / GINI INDEX
23,535
TOTAL POPULATION
11,805
MALE POPULATION
11,730
FEMALE POPULATION
100.64
MALES / 100 FEMALES
99.36
FEMALES / 100 MALES
42.7
MEDIAN AGE
3.2
AVG FAMILY SIZE
2.6
AVG HOUSEHOLD SIZE
11,279
LABOR FORCE [ PEOPLE ]
59.1%
PERCENT IN LABOR FORCE
3.1%
UNEMPLOYMENT RATE
Juniata County Area Codes
Income in Juniata County
Income Overview in Juniata County
Per Capita Income in Juniata County is $31,251, while median incomes of families and households are $78,555 and $61,915 respectively.
| Characteristic | Number | Measure |
| Per Capita Income | 23,535 | $31,251 |
| Median Family Income | 6,099 | $78,555 |
| Mean Family Income | 6,099 | $92,729 |
| Median Household Income | 8,852 | $61,915 |
| Mean Household Income | 8,852 | $78,975 |
| Income Deficit | 6,099 | $10,773 |
| Wage / Income Gap (%) | 23,535 | 34.09% |
| Wage / Income Gap ($) | 23,535 | 65.91¢ per $1 |
| Gini / Inequality Index | 23,535 | 0.41 |
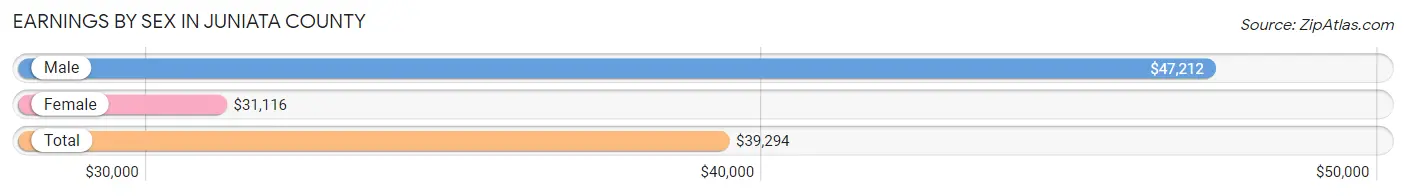
Earnings by Sex in Juniata County
Average Earnings in Juniata County are $39,294, $47,212 for men and $31,116 for women, a difference of 34.1%.
| Sex | Number | Average Earnings |
| Male | 6,717 (57.1%) | $47,212 |
| Female | 5,041 (42.9%) | $31,116 |
| Total | 11,758 (100.0%) | $39,294 |
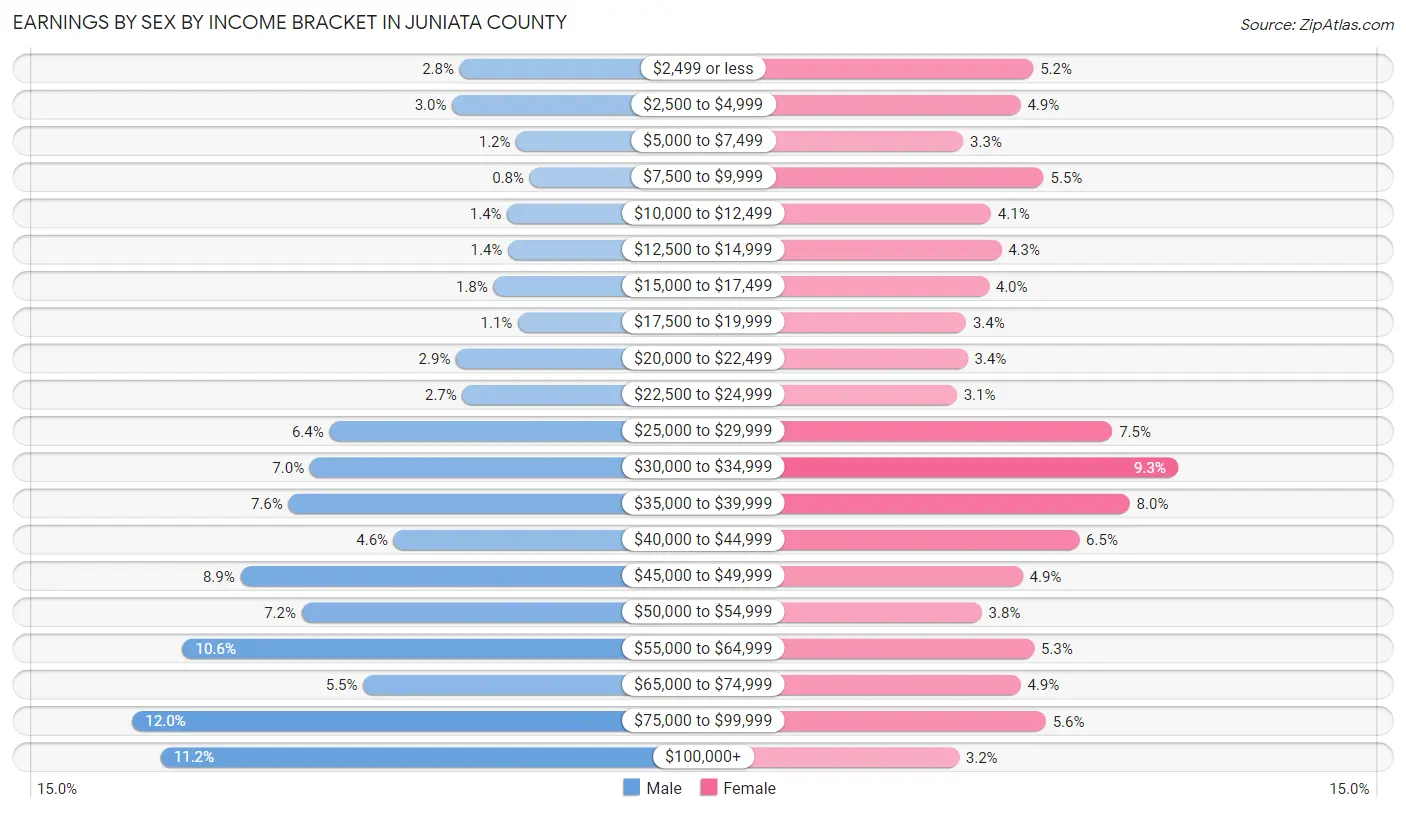
Earnings by Sex by Income Bracket in Juniata County
The most common earnings brackets in Juniata County are $75,000 to $99,999 for men (804 | 12.0%) and $30,000 to $34,999 for women (469 | 9.3%).
| Income | Male | Female |
| $2,499 or less | 186 (2.8%) | 264 (5.2%) |
| $2,500 to $4,999 | 200 (3.0%) | 246 (4.9%) |
| $5,000 to $7,499 | 79 (1.2%) | 165 (3.3%) |
| $7,500 to $9,999 | 54 (0.8%) | 279 (5.5%) |
| $10,000 to $12,499 | 96 (1.4%) | 204 (4.1%) |
| $12,500 to $14,999 | 95 (1.4%) | 219 (4.3%) |
| $15,000 to $17,499 | 122 (1.8%) | 201 (4.0%) |
| $17,500 to $19,999 | 76 (1.1%) | 169 (3.4%) |
| $20,000 to $22,499 | 193 (2.9%) | 171 (3.4%) |
| $22,500 to $24,999 | 181 (2.7%) | 156 (3.1%) |
| $25,000 to $29,999 | 432 (6.4%) | 376 (7.5%) |
| $30,000 to $34,999 | 469 (7.0%) | 469 (9.3%) |
| $35,000 to $39,999 | 509 (7.6%) | 401 (8.0%) |
| $40,000 to $44,999 | 310 (4.6%) | 329 (6.5%) |
| $45,000 to $49,999 | 600 (8.9%) | 249 (4.9%) |
| $50,000 to $54,999 | 484 (7.2%) | 191 (3.8%) |
| $55,000 to $64,999 | 709 (10.6%) | 265 (5.3%) |
| $65,000 to $74,999 | 368 (5.5%) | 246 (4.9%) |
| $75,000 to $99,999 | 804 (12.0%) | 282 (5.6%) |
| $100,000+ | 750 (11.2%) | 159 (3.2%) |
| Total | 6,717 (100.0%) | 5,041 (100.0%) |
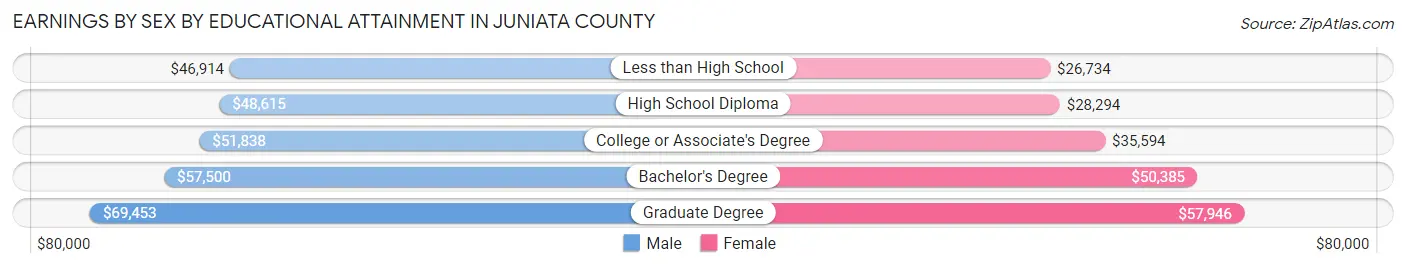
Earnings by Sex by Educational Attainment in Juniata County
Average earnings in Juniata County are $51,158 for men and $34,276 for women, a difference of 33.0%. Men with an educational attainment of graduate degree enjoy the highest average annual earnings of $69,453, while those with less than high school education earn the least with $46,914. Women with an educational attainment of graduate degree earn the most with the average annual earnings of $57,946, while those with less than high school education have the smallest earnings of $26,734.
| Educational Attainment | Male Income | Female Income |
| Less than High School | $46,914 | $26,734 |
| High School Diploma | $48,615 | $28,294 |
| College or Associate's Degree | $51,838 | $35,594 |
| Bachelor's Degree | $57,500 | $50,385 |
| Graduate Degree | $69,453 | $57,946 |
| Total | $51,158 | $34,276 |
Family Income in Juniata County
Family Income Brackets in Juniata County
According to the Juniata County family income data, there are 1,177 families falling into the $75,000 to $99,999 income range, which is the most common income bracket and makes up 19.3% of all families. Conversely, the $10,000 to $14,999 income bracket is the least frequent group with only 91 families (1.5%) belonging to this category.
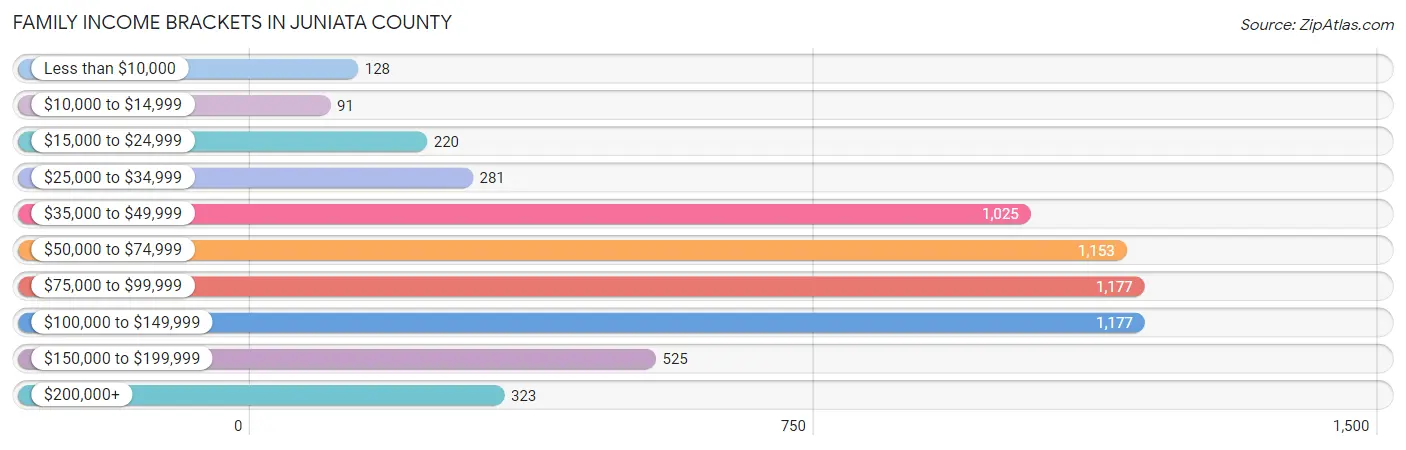
| Income Bracket | # Families | % Families |
| Less than $10,000 | 128 | 2.1% |
| $10,000 to $14,999 | 91 | 1.5% |
| $15,000 to $24,999 | 220 | 3.6% |
| $25,000 to $34,999 | 281 | 4.6% |
| $35,000 to $49,999 | 1,025 | 16.8% |
| $50,000 to $74,999 | 1,153 | 18.9% |
| $75,000 to $99,999 | 1,177 | 19.3% |
| $100,000 to $149,999 | 1,177 | 19.3% |
| $150,000 to $199,999 | 525 | 8.6% |
| $200,000+ | 323 | 5.3% |
Family Income by Famaliy Size in Juniata County
7+ person families (229 | 3.7%) account for the highest median family income in Juniata County with $115,625 per family, while 2-person families (3,184 | 52.2%) have the highest median income of $31,044 per family member.
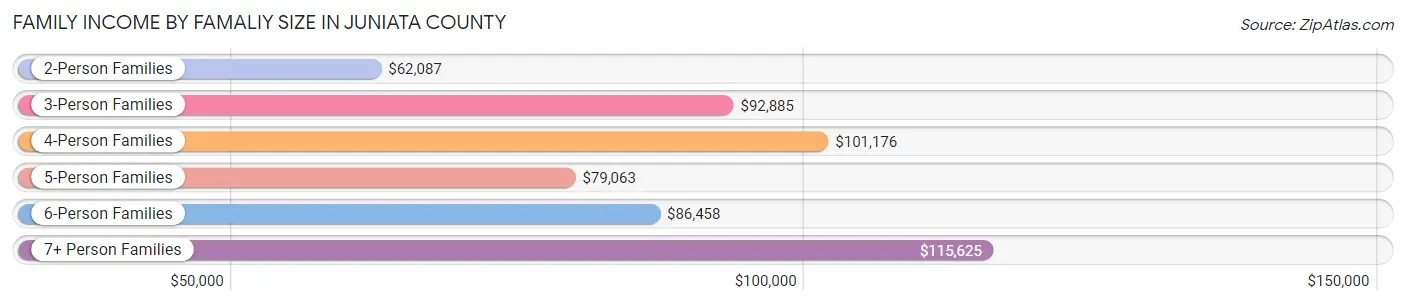
| Income Bracket | # Families | Median Income |
| 2-Person Families | 3,184 (52.2%) | $62,087 |
| 3-Person Families | 1,188 (19.5%) | $92,885 |
| 4-Person Families | 934 (15.3%) | $101,176 |
| 5-Person Families | 443 (7.3%) | $79,063 |
| 6-Person Families | 121 (2.0%) | $86,458 |
| 7+ Person Families | 229 (3.7%) | $115,625 |
| Total | 6,099 (100.0%) | $78,555 |
Family Income by Number of Earners in Juniata County
The median family income in Juniata County is $78,555, with families comprising 3+ earners (814) having the highest median family income of $133,438, while families with no earners (1,126) have the lowest median family income of $43,511, accounting for 13.4% and 18.5% of families, respectively.
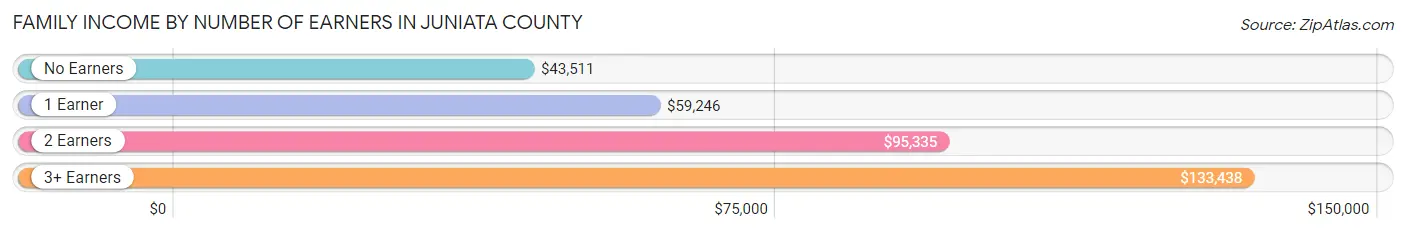
| Number of Earners | # Families | Median Income |
| No Earners | 1,126 (18.5%) | $43,511 |
| 1 Earner | 1,849 (30.3%) | $59,246 |
| 2 Earners | 2,310 (37.9%) | $95,335 |
| 3+ Earners | 814 (13.4%) | $133,438 |
| Total | 6,099 (100.0%) | $78,555 |
Household Income in Juniata County
Household Income Brackets in Juniata County
With 1,531 households falling in the category, the $50,000 to $74,999 income range is the most frequent in Juniata County, accounting for 17.3% of all households. In contrast, only 283 households (3.2%) fall into the less than $10,000 income bracket, making it the least populous group.
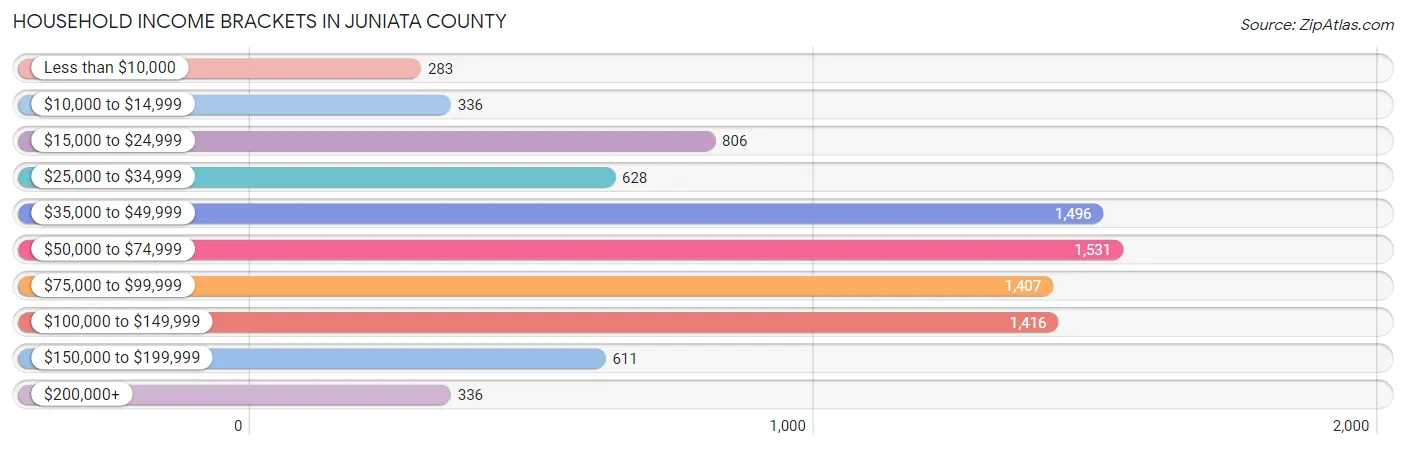
| Income Bracket | # Households | % Households |
| Less than $10,000 | 283 | 3.2% |
| $10,000 to $14,999 | 336 | 3.8% |
| $15,000 to $24,999 | 806 | 9.1% |
| $25,000 to $34,999 | 628 | 7.1% |
| $35,000 to $49,999 | 1,496 | 16.9% |
| $50,000 to $74,999 | 1,531 | 17.3% |
| $75,000 to $99,999 | 1,407 | 15.9% |
| $100,000 to $149,999 | 1,416 | 16.0% |
| $150,000 to $199,999 | 611 | 6.9% |
| $200,000+ | 336 | 3.8% |
Household Income by Householder Age in Juniata County
The median household income in Juniata County is $61,915, with the highest median household income of $83,052 found in the 25 to 44 years age bracket for the primary householder. A total of 2,280 households (25.8%) fall into this category. Meanwhile, the 65+ years age bracket for the primary householder has the lowest median household income of $41,618, with 2,845 households (32.1%) in this group.
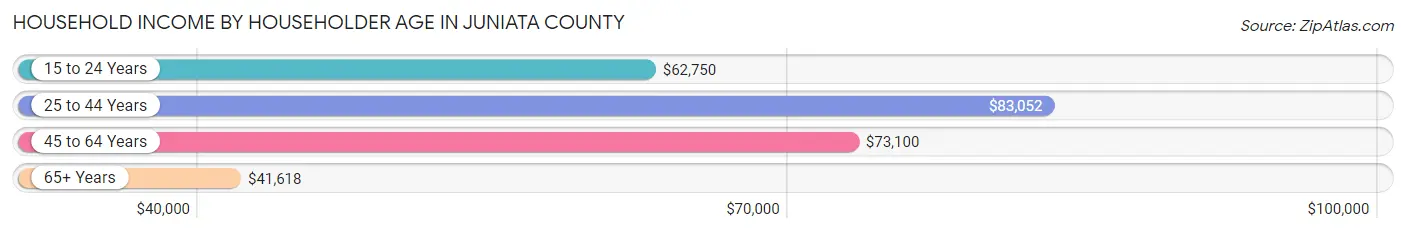
| Income Bracket | # Households | Median Income |
| 15 to 24 Years | 205 (2.3%) | $62,750 |
| 25 to 44 Years | 2,280 (25.8%) | $83,052 |
| 45 to 64 Years | 3,522 (39.8%) | $73,100 |
| 65+ Years | 2,845 (32.1%) | $41,618 |
| Total | 8,852 (100.0%) | $61,915 |
Poverty in Juniata County
Income Below Poverty by Sex and Age in Juniata County
With 7.2% poverty level for males and 10.7% for females among the residents of Juniata County, 15 year old males and under 5 year old females are the most vulnerable to poverty, with 21 males (23.3%) and 121 females (17.1%) in their respective age groups living below the poverty level.
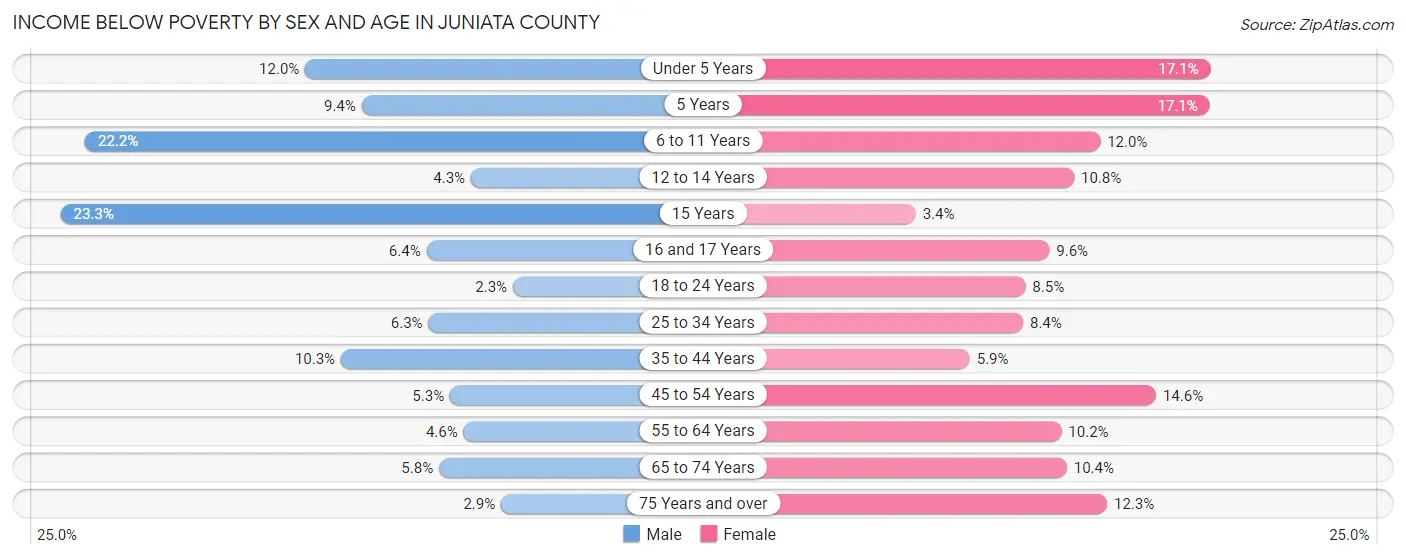
| Age Bracket | Male | Female |
| Under 5 Years | 78 (12.0%) | 121 (17.1%) |
| 5 Years | 16 (9.4%) | 14 (17.1%) |
| 6 to 11 Years | 174 (22.2%) | 120 (12.0%) |
| 12 to 14 Years | 19 (4.3%) | 33 (10.8%) |
| 15 Years | 21 (23.3%) | 6 (3.4%) |
| 16 and 17 Years | 27 (6.4%) | 34 (9.6%) |
| 18 to 24 Years | 21 (2.3%) | 78 (8.5%) |
| 25 to 34 Years | 86 (6.3%) | 107 (8.4%) |
| 35 to 44 Years | 142 (10.3%) | 74 (5.9%) |
| 45 to 54 Years | 80 (5.3%) | 207 (14.6%) |
| 55 to 64 Years | 81 (4.6%) | 170 (10.2%) |
| 65 to 74 Years | 80 (5.8%) | 138 (10.4%) |
| 75 Years and over | 25 (2.9%) | 130 (12.3%) |
| Total | 850 (7.2%) | 1,232 (10.7%) |
Income Above Poverty by Sex and Age in Juniata County
According to the poverty statistics in Juniata County, males aged 18 to 24 years and females aged 15 years are the age groups that are most secure financially, with 97.7% of males and 96.6% of females in these age groups living above the poverty line.
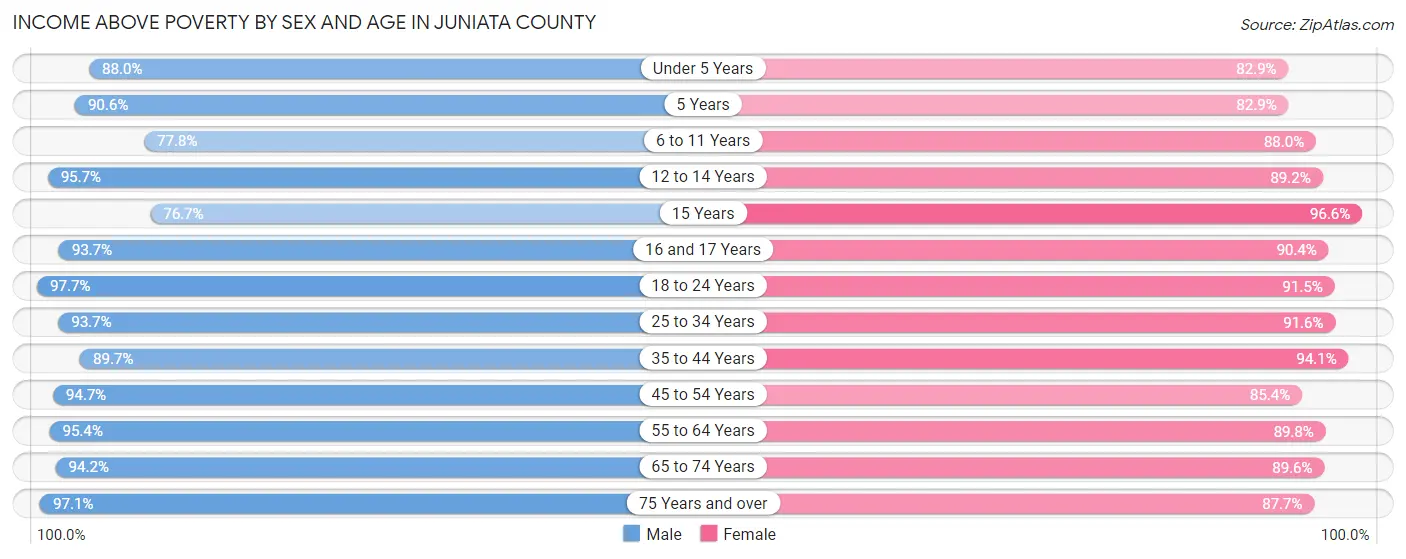
| Age Bracket | Male | Female |
| Under 5 Years | 573 (88.0%) | 586 (82.9%) |
| 5 Years | 155 (90.6%) | 68 (82.9%) |
| 6 to 11 Years | 610 (77.8%) | 881 (88.0%) |
| 12 to 14 Years | 424 (95.7%) | 273 (89.2%) |
| 15 Years | 69 (76.7%) | 169 (96.6%) |
| 16 and 17 Years | 398 (93.6%) | 319 (90.4%) |
| 18 to 24 Years | 878 (97.7%) | 837 (91.5%) |
| 25 to 34 Years | 1,287 (93.7%) | 1,166 (91.6%) |
| 35 to 44 Years | 1,234 (89.7%) | 1,172 (94.1%) |
| 45 to 54 Years | 1,442 (94.7%) | 1,213 (85.4%) |
| 55 to 64 Years | 1,667 (95.4%) | 1,499 (89.8%) |
| 65 to 74 Years | 1,307 (94.2%) | 1,184 (89.6%) |
| 75 Years and over | 840 (97.1%) | 926 (87.7%) |
| Total | 10,884 (92.8%) | 10,293 (89.3%) |
Income Below Poverty Among Married-Couple Families in Juniata County
The poverty statistics for married-couple families in Juniata County show that 4.0% or 202 of the total 5,112 families live below the poverty line. Families with 5 or more children have the highest poverty rate of 19.1%, comprising of 26 families. On the other hand, families with no children have the lowest poverty rate of 3.1%, which includes 103 families.
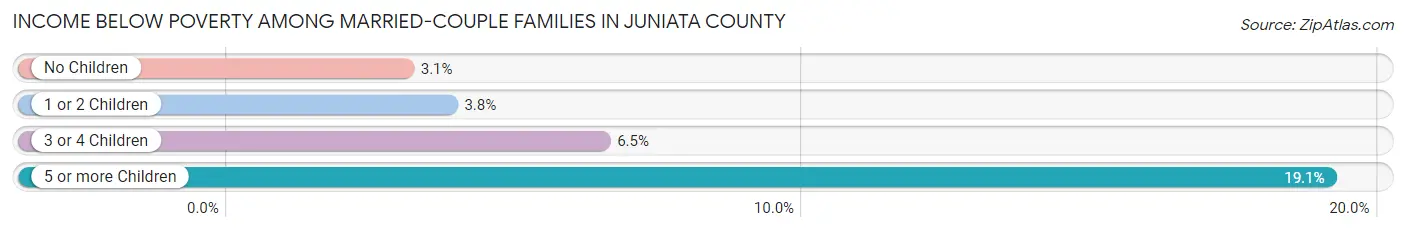
| Children | Above Poverty | Below Poverty |
| No Children | 3,264 (96.9%) | 103 (3.1%) |
| 1 or 2 Children | 1,132 (96.2%) | 45 (3.8%) |
| 3 or 4 Children | 404 (93.5%) | 28 (6.5%) |
| 5 or more Children | 110 (80.9%) | 26 (19.1%) |
| Total | 4,910 (96.1%) | 202 (4.0%) |
Income Below Poverty Among Single-Parent Households in Juniata County
According to the poverty data in Juniata County, 14.2% or 50 single-father households and 20.6% or 131 single-mother households are living below the poverty line. Among single-father households, those with 1 or 2 children have the highest poverty rate, with 42 households (23.0%) experiencing poverty. Likewise, among single-mother households, those with 5 or more children have the highest poverty rate, with 9 households (100.0%) falling below the poverty line.
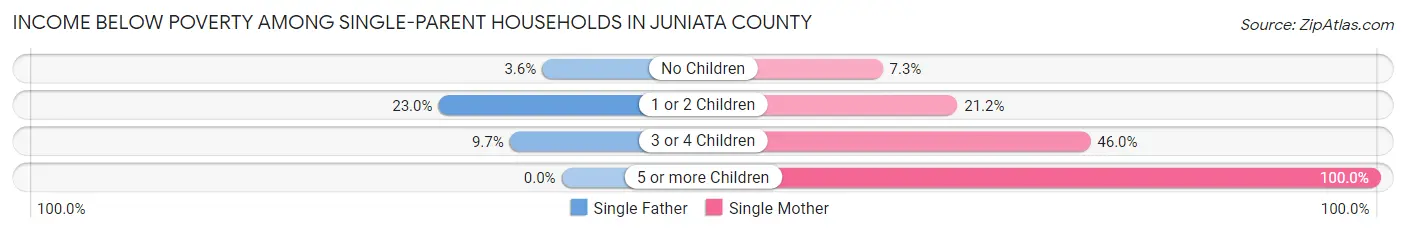
| Children | Single Father | Single Mother |
| No Children | 5 (3.6%) | 15 (7.2%) |
| 1 or 2 Children | 42 (23.0%) | 73 (21.2%) |
| 3 or 4 Children | 3 (9.7%) | 34 (46.0%) |
| 5 or more Children | 0 (0.0%) | 9 (100.0%) |
| Total | 50 (14.2%) | 131 (20.6%) |
Income Below Poverty Among Married-Couple vs Single-Parent Households in Juniata County
The poverty data for Juniata County shows that 202 of the married-couple family households (4.0%) and 181 of the single-parent households (18.3%) are living below the poverty level. Within the married-couple family households, those with 5 or more children have the highest poverty rate, with 26 households (19.1%) falling below the poverty line. Among the single-parent households, those with 5 or more children have the highest poverty rate, with 9 household (100.0%) living below poverty.
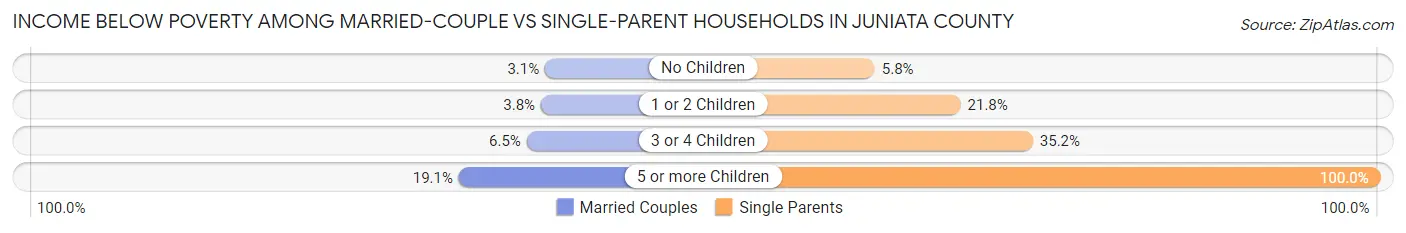
| Children | Married-Couple Families | Single-Parent Households |
| No Children | 103 (3.1%) | 20 (5.8%) |
| 1 or 2 Children | 45 (3.8%) | 115 (21.8%) |
| 3 or 4 Children | 28 (6.5%) | 37 (35.2%) |
| 5 or more Children | 26 (19.1%) | 9 (100.0%) |
| Total | 202 (4.0%) | 181 (18.3%) |
Race in Juniata County
The most populous races in Juniata County are White / Caucasian (22,155 | 94.1%), Hispanic or Latino (985 | 4.2%), and Two or more Races (773 | 3.3%).
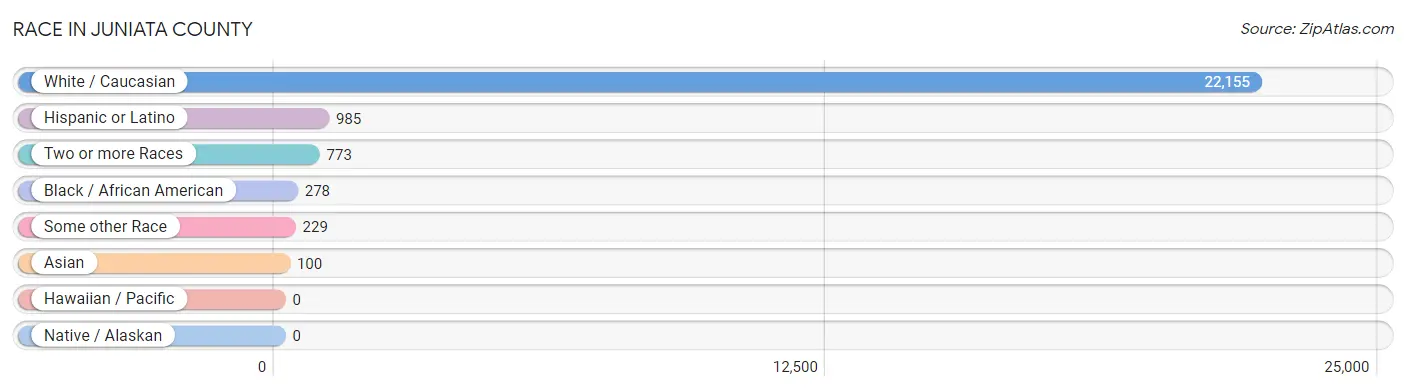
| Race | # Population | % Population |
| Asian | 100 | 0.4% |
| Black / African American | 278 | 1.2% |
| Hawaiian / Pacific | 0 | 0.0% |
| Hispanic or Latino | 985 | 4.2% |
| Native / Alaskan | 0 | 0.0% |
| White / Caucasian | 22,155 | 94.1% |
| Two or more Races | 773 | 3.3% |
| Some other Race | 229 | 1.0% |
| Total | 23,535 | 100.0% |
Ancestry in Juniata County
The most populous ancestries reported in Juniata County are German (8,552 | 36.3%), American (3,282 | 14.0%), Irish (1,919 | 8.2%), Pennsylvania German (1,823 | 7.7%), and English (1,199 | 5.1%), together accounting for 71.3% of all Juniata County residents.
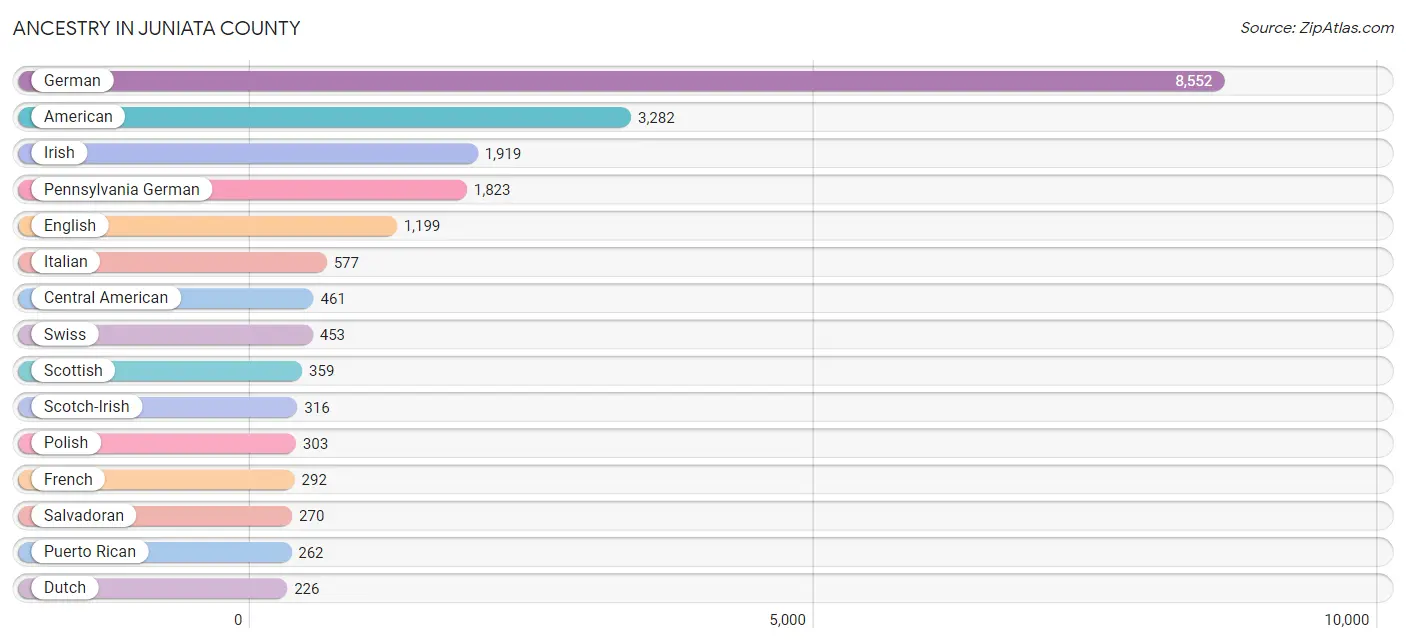
| Ancestry | # Population | % Population |
| African | 13 | 0.1% |
| Aleut | 1 | 0.0% |
| American | 3,282 | 14.0% |
| Arab | 33 | 0.1% |
| Armenian | 6 | 0.0% |
| Austrian | 20 | 0.1% |
| Belizean | 5 | 0.0% |
| Bhutanese | 3 | 0.0% |
| Brazilian | 1 | 0.0% |
| British | 11 | 0.1% |
| Bulgarian | 4 | 0.0% |
| Burmese | 12 | 0.1% |
| Canadian | 8 | 0.0% |
| Central American | 461 | 2.0% |
| Cherokee | 11 | 0.1% |
| Chilean | 63 | 0.3% |
| Chippewa | 2 | 0.0% |
| Choctaw | 2 | 0.0% |
| Colombian | 5 | 0.0% |
| Comanche | 1 | 0.0% |
| Croatian | 23 | 0.1% |
| Cuban | 4 | 0.0% |
| Czech | 8 | 0.0% |
| Czechoslovakian | 49 | 0.2% |
| Danish | 14 | 0.1% |
| Delaware | 2 | 0.0% |
| Dominican | 51 | 0.2% |
| Dutch | 226 | 1.0% |
| Eastern European | 27 | 0.1% |
| English | 1,199 | 5.1% |
| European | 162 | 0.7% |
| French | 292 | 1.2% |
| French Canadian | 30 | 0.1% |
| German | 8,552 | 36.3% |
| Greek | 50 | 0.2% |
| Guatemalan | 95 | 0.4% |
| Honduran | 96 | 0.4% |
| Hungarian | 20 | 0.1% |
| Indian (Asian) | 22 | 0.1% |
| Irish | 1,919 | 8.2% |
| Italian | 577 | 2.5% |
| Jamaican | 22 | 0.1% |
| Korean | 63 | 0.3% |
| Macedonian | 2 | 0.0% |
| Mexican | 45 | 0.2% |
| Moroccan | 11 | 0.1% |
| Norwegian | 17 | 0.1% |
| Pakistani | 13 | 0.1% |
| Palestinian | 4 | 0.0% |
| Pennsylvania German | 1,823 | 7.7% |
| Polish | 303 | 1.3% |
| Portuguese | 20 | 0.1% |
| Puerto Rican | 262 | 1.1% |
| Romanian | 13 | 0.1% |
| Russian | 47 | 0.2% |
| Salvadoran | 270 | 1.1% |
| Scandinavian | 5 | 0.0% |
| Scotch-Irish | 316 | 1.3% |
| Scottish | 359 | 1.5% |
| Slovak | 43 | 0.2% |
| Slovene | 7 | 0.0% |
| South American | 68 | 0.3% |
| Spanish | 59 | 0.3% |
| Sri Lankan | 5 | 0.0% |
| Subsaharan African | 13 | 0.1% |
| Swedish | 188 | 0.8% |
| Swiss | 453 | 1.9% |
| Syrian | 1 | 0.0% |
| Ukrainian | 21 | 0.1% |
| Welsh | 135 | 0.6% |
| Yugoslavian | 166 | 0.7% | View All 71 Rows |
Immigrants in Juniata County
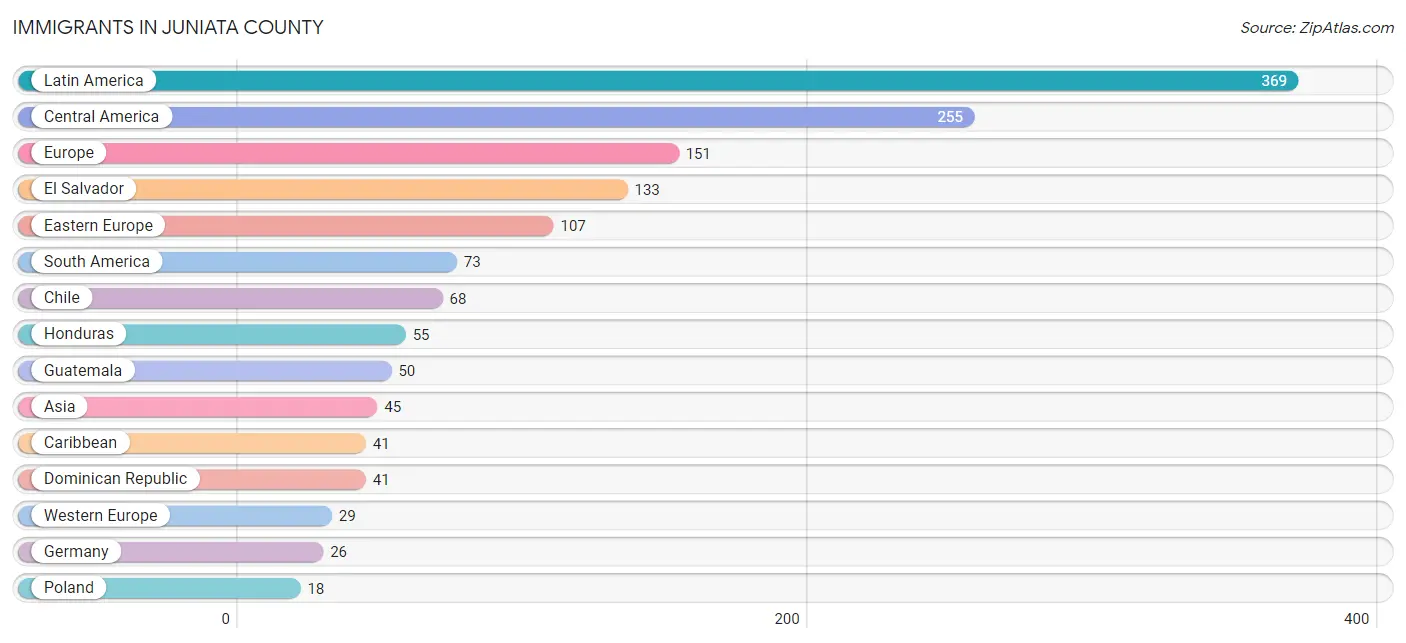
The most numerous immigrant groups reported in Juniata County came from Latin America (369 | 1.6%), Central America (255 | 1.1%), Europe (151 | 0.6%), El Salvador (133 | 0.6%), and Eastern Europe (107 | 0.4%), together accounting for 4.3% of all Juniata County residents.
| Immigration Origin | # Population | % Population |
| Africa | 17 | 0.1% |
| Asia | 45 | 0.2% |
| Belize | 5 | 0.0% |
| Canada | 7 | 0.0% |
| Caribbean | 41 | 0.2% |
| Central America | 255 | 1.1% |
| Chile | 68 | 0.3% |
| China | 6 | 0.0% |
| Colombia | 5 | 0.0% |
| Czechoslovakia | 4 | 0.0% |
| Dominican Republic | 41 | 0.2% |
| Eastern Asia | 16 | 0.1% |
| Eastern Europe | 107 | 0.4% |
| El Salvador | 133 | 0.6% |
| Europe | 151 | 0.6% |
| France | 3 | 0.0% |
| Germany | 26 | 0.1% |
| Guatemala | 50 | 0.2% |
| Honduras | 55 | 0.2% |
| India | 16 | 0.1% |
| Italy | 9 | 0.0% |
| Korea | 10 | 0.0% |
| Latin America | 369 | 1.6% |
| Mexico | 12 | 0.1% |
| Northern Africa | 17 | 0.1% |
| Philippines | 6 | 0.0% |
| Poland | 18 | 0.1% |
| Portugal | 6 | 0.0% |
| South America | 73 | 0.3% |
| South Central Asia | 16 | 0.1% |
| South Eastern Asia | 13 | 0.1% |
| Southern Europe | 15 | 0.1% |
| Taiwan | 3 | 0.0% |
| Thailand | 4 | 0.0% |
| Vietnam | 3 | 0.0% |
| Western Europe | 29 | 0.1% | View All 36 Rows |
Sex and Age in Juniata County
Sex and Age in Juniata County
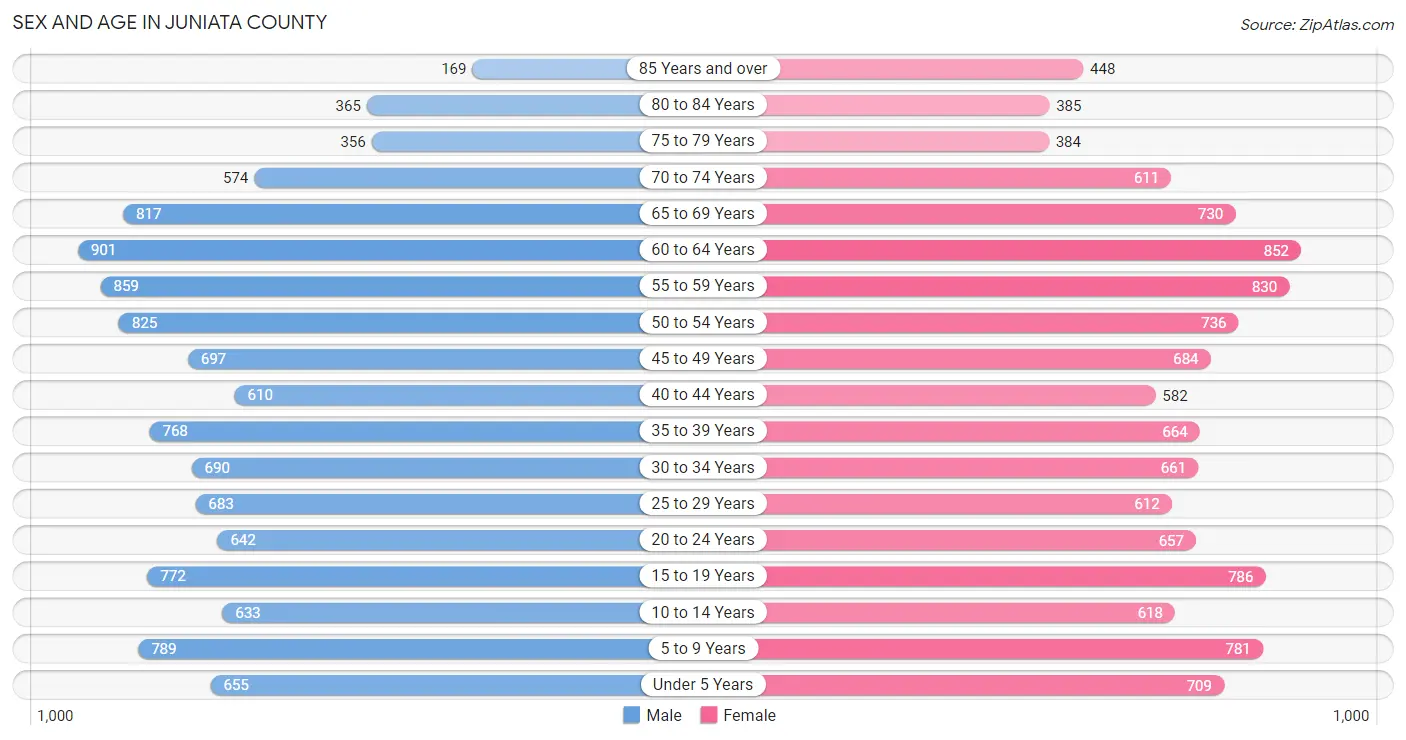
The most populous age groups in Juniata County are 60 to 64 Years (901 | 7.6%) for men and 60 to 64 Years (852 | 7.3%) for women.
| Age Bracket | Male | Female |
| Under 5 Years | 655 (5.6%) | 709 (6.0%) |
| 5 to 9 Years | 789 (6.7%) | 781 (6.7%) |
| 10 to 14 Years | 633 (5.4%) | 618 (5.3%) |
| 15 to 19 Years | 772 (6.5%) | 786 (6.7%) |
| 20 to 24 Years | 642 (5.4%) | 657 (5.6%) |
| 25 to 29 Years | 683 (5.8%) | 612 (5.2%) |
| 30 to 34 Years | 690 (5.8%) | 661 (5.6%) |
| 35 to 39 Years | 768 (6.5%) | 664 (5.7%) |
| 40 to 44 Years | 610 (5.2%) | 582 (5.0%) |
| 45 to 49 Years | 697 (5.9%) | 684 (5.8%) |
| 50 to 54 Years | 825 (7.0%) | 736 (6.3%) |
| 55 to 59 Years | 859 (7.3%) | 830 (7.1%) |
| 60 to 64 Years | 901 (7.6%) | 852 (7.3%) |
| 65 to 69 Years | 817 (6.9%) | 730 (6.2%) |
| 70 to 74 Years | 574 (4.9%) | 611 (5.2%) |
| 75 to 79 Years | 356 (3.0%) | 384 (3.3%) |
| 80 to 84 Years | 365 (3.1%) | 385 (3.3%) |
| 85 Years and over | 169 (1.4%) | 448 (3.8%) |
| Total | 11,805 (100.0%) | 11,730 (100.0%) |
Families and Households in Juniata County
Median Family Size in Juniata County
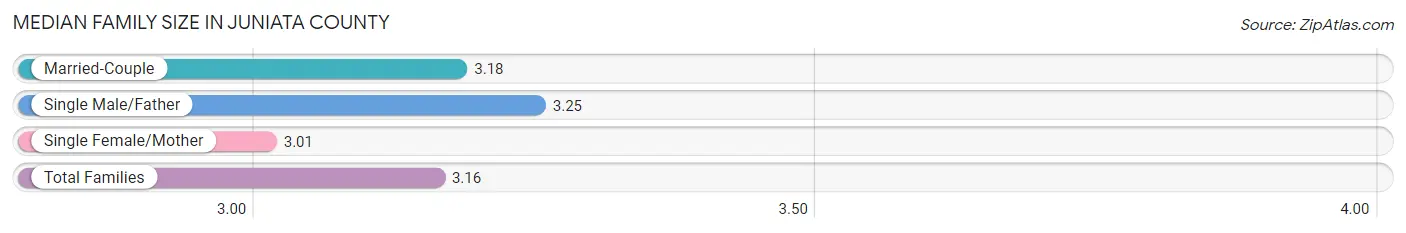
The median family size in Juniata County is 3.16 persons per family, with single male/father families (352 | 5.8%) accounting for the largest median family size of 3.25 persons per family. On the other hand, single female/mother families (635 | 10.4%) represent the smallest median family size with 3.01 persons per family.
| Family Type | # Families | Family Size |
| Married-Couple | 5,112 (83.8%) | 3.18 |
| Single Male/Father | 352 (5.8%) | 3.25 |
| Single Female/Mother | 635 (10.4%) | 3.01 |
| Total Families | 6,099 (100.0%) | 3.16 |
Median Household Size in Juniata County
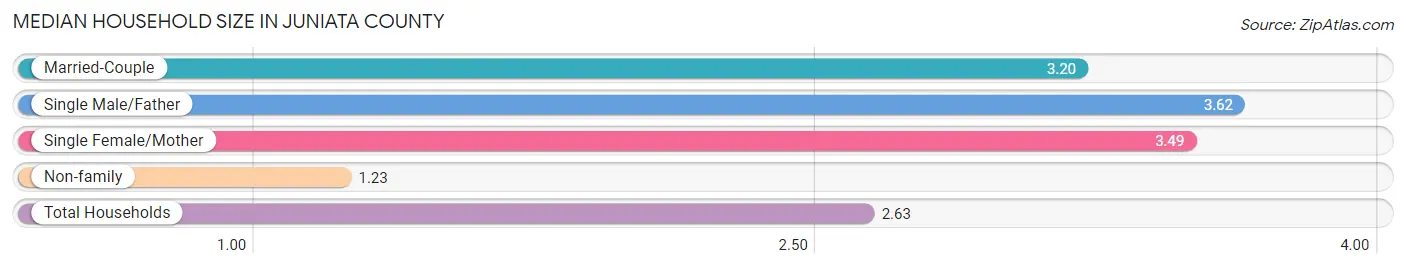
The median household size in Juniata County is 2.63 persons per household, with single male/father households (352 | 4.0%) accounting for the largest median household size of 3.62 persons per household. non-family households (2,753 | 31.1%) represent the smallest median household size with 1.23 persons per household.
| Household Type | # Households | Household Size |
| Married-Couple | 5,112 (57.8%) | 3.20 |
| Single Male/Father | 352 (4.0%) | 3.62 |
| Single Female/Mother | 635 (7.2%) | 3.49 |
| Non-family | 2,753 (31.1%) | 1.23 |
| Total Households | 8,852 (100.0%) | 2.63 |
Household Size by Marriage Status in Juniata County
Out of a total of 8,852 households in Juniata County, 6,099 (68.9%) are family households, while 2,753 (31.1%) are nonfamily households. The most numerous type of family households are 2-person households, comprising 2,993, and the most common type of nonfamily households are 1-person households, comprising 2,265.
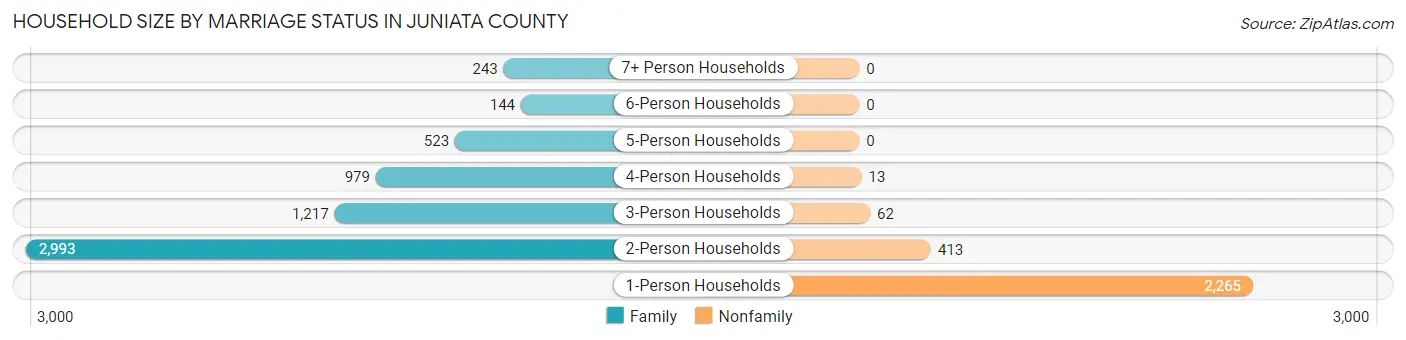
| Household Size | Family Households | Nonfamily Households |
| 1-Person Households | - | 2,265 (25.6%) |
| 2-Person Households | 2,993 (33.8%) | 413 (4.7%) |
| 3-Person Households | 1,217 (13.8%) | 62 (0.7%) |
| 4-Person Households | 979 (11.1%) | 13 (0.2%) |
| 5-Person Households | 523 (5.9%) | 0 (0.0%) |
| 6-Person Households | 144 (1.6%) | 0 (0.0%) |
| 7+ Person Households | 243 (2.8%) | 0 (0.0%) |
| Total | 6,099 (68.9%) | 2,753 (31.1%) |
Female Fertility in Juniata County
Fertility by Age in Juniata County
Average fertility rate in Juniata County is 65.0 births per 1,000 women. Women in the age bracket of 20 to 34 years have the highest fertility rate with 122.0 births per 1,000 women. Women in the age bracket of 20 to 34 years acount for 75.6% of all women with births.
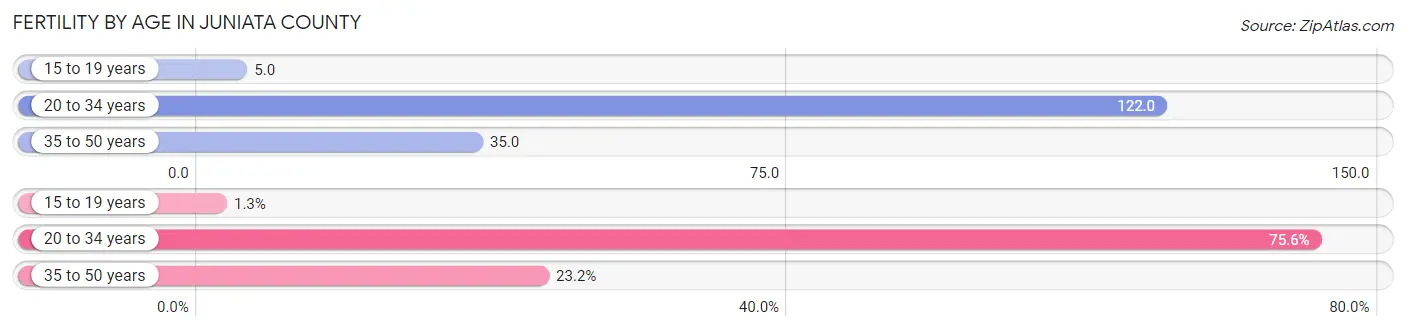
| Age Bracket | Women with Births | Births / 1,000 Women |
| 15 to 19 years | 4 (1.3%) | 5.0 |
| 20 to 34 years | 235 (75.6%) | 122.0 |
| 35 to 50 years | 72 (23.2%) | 35.0 |
| Total | 311 (100.0%) | 65.0 |
Fertility by Age by Marriage Status in Juniata County
79.7% of women with births (311) in Juniata County are married. The highest percentage of unmarried women with births falls into 15 to 19 years age bracket with 100.0% of them unmarried at the time of birth, while the lowest percentage of unmarried women with births belong to 20 to 34 years age bracket with 19.2% of them unmarried.
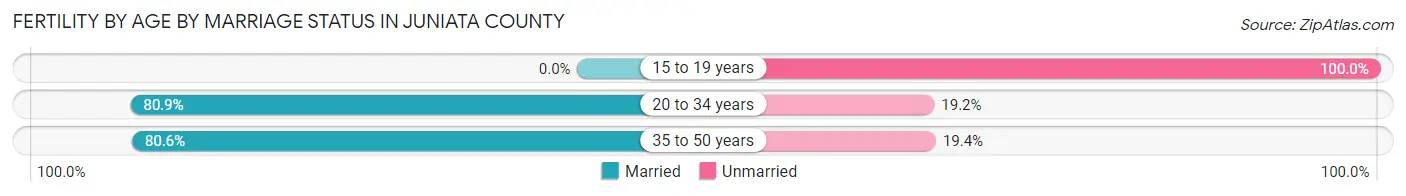
| Age Bracket | Married | Unmarried |
| 15 to 19 years | 0 (0.0%) | 4 (100.0%) |
| 20 to 34 years | 190 (80.8%) | 45 (19.2%) |
| 35 to 50 years | 58 (80.6%) | 14 (19.4%) |
| Total | 248 (79.7%) | 63 (20.3%) |
Fertility by Education in Juniata County
Average fertility rate in Juniata County is 65.0 births per 1,000 women. Women with the education attainment of less than high school have the highest fertility rate of 91.0 births per 1,000 women, while women with the education attainment of graduate degree have the lowest fertility at 17.0 births per 1,000 women. Women with the education attainment of high school diploma represent 36.7% of all women with births.
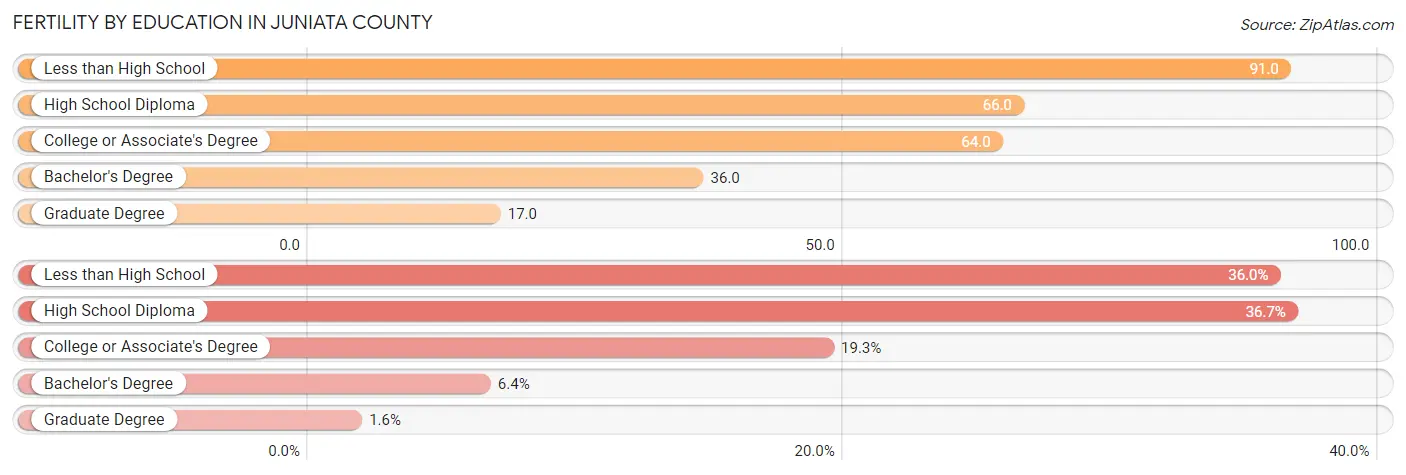
| Educational Attainment | Women with Births | Births / 1,000 Women |
| Less than High School | 112 (36.0%) | 91.0 |
| High School Diploma | 114 (36.7%) | 66.0 |
| College or Associate's Degree | 60 (19.3%) | 64.0 |
| Bachelor's Degree | 20 (6.4%) | 36.0 |
| Graduate Degree | 5 (1.6%) | 17.0 |
| Total | 311 (100.0%) | 65.0 |
Fertility by Education by Marriage Status in Juniata County
20.3% of women with births in Juniata County are unmarried. Women with the educational attainment of bachelor's degree are most likely to be married with 100.0% of them married at childbirth, while women with the educational attainment of college or associate's degree are least likely to be married with 51.7% of them unmarried at childbirth.
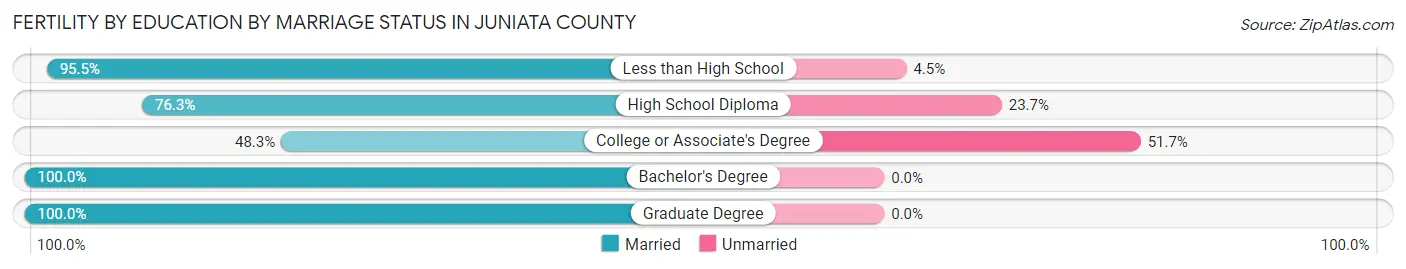
| Educational Attainment | Married | Unmarried |
| Less than High School | 107 (95.5%) | 5 (4.5%) |
| High School Diploma | 87 (76.3%) | 27 (23.7%) |
| College or Associate's Degree | 29 (48.3%) | 31 (51.7%) |
| Bachelor's Degree | 20 (100.0%) | 0 (0.0%) |
| Graduate Degree | 5 (100.0%) | 0 (0.0%) |
| Total | 248 (79.7%) | 63 (20.3%) |
Employment Characteristics in Juniata County
Employment by Class of Employer in Juniata County
Among the 10,838 employed individuals in Juniata County, private company employees (7,827 | 72.2%), self-employed (not incorporated) (797 | 7.3%), and state government employees (771 | 7.1%) make up the most common classes of employment.
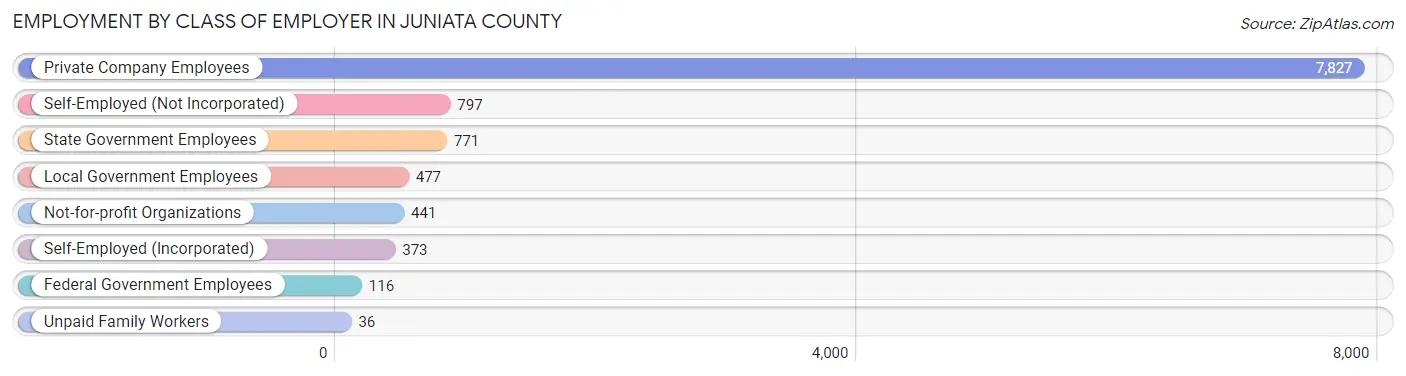
| Employer Class | # Employees | % Employees |
| Private Company Employees | 7,827 | 72.2% |
| Self-Employed (Incorporated) | 373 | 3.4% |
| Self-Employed (Not Incorporated) | 797 | 7.3% |
| Not-for-profit Organizations | 441 | 4.1% |
| Local Government Employees | 477 | 4.4% |
| State Government Employees | 771 | 7.1% |
| Federal Government Employees | 116 | 1.1% |
| Unpaid Family Workers | 36 | 0.3% |
| Total | 10,838 | 100.0% |
Employment Status by Age in Juniata County
According to the labor force statistics for Juniata County, out of the total population over 16 years of age (19,085), 59.1% or 11,279 individuals are in the labor force, with 3.1% or 350 of them unemployed. The age group with the highest labor force participation rate is 25 to 29 years, with 84.6% or 1,096 individuals in the labor force. Within the labor force, the 16 to 19 years age range has the highest percentage of unemployed individuals, with 10.5% or 68 of them being unemployed.
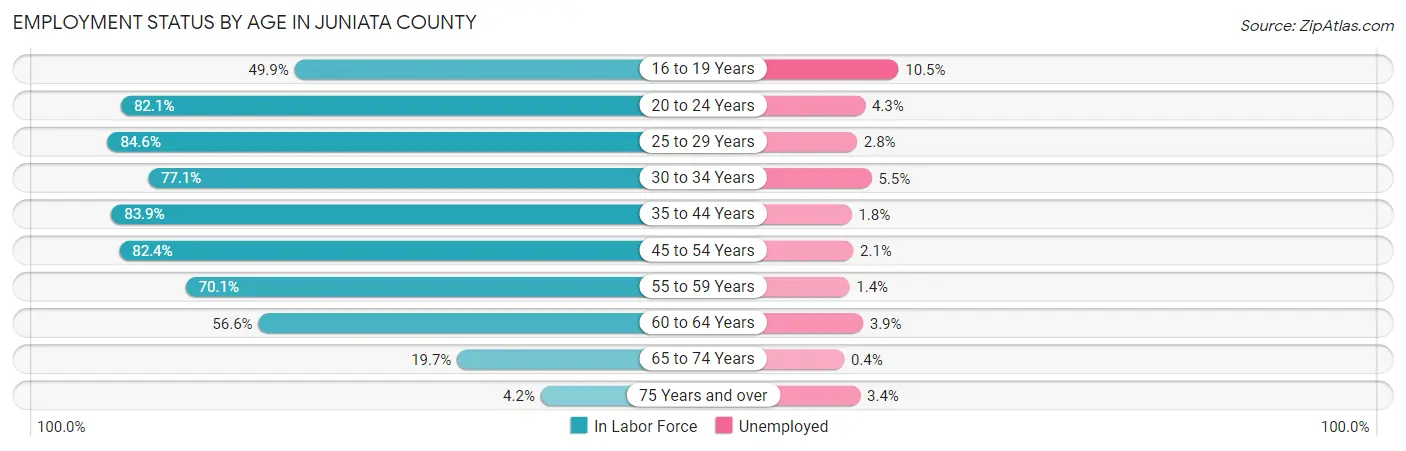
| Age Bracket | In Labor Force | Unemployed |
| 16 to 19 Years | 645 (49.9%) | 68 (10.5%) |
| 20 to 24 Years | 1,066 (82.1%) | 46 (4.3%) |
| 25 to 29 Years | 1,096 (84.6%) | 31 (2.8%) |
| 30 to 34 Years | 1,042 (77.1%) | 57 (5.5%) |
| 35 to 44 Years | 2,202 (83.9%) | 40 (1.8%) |
| 45 to 54 Years | 2,424 (82.4%) | 51 (2.1%) |
| 55 to 59 Years | 1,184 (70.1%) | 17 (1.4%) |
| 60 to 64 Years | 992 (56.6%) | 39 (3.9%) |
| 65 to 74 Years | 538 (19.7%) | 2 (0.4%) |
| 75 Years and over | 88 (4.2%) | 3 (3.4%) |
| Total | 11,279 (59.1%) | 350 (3.1%) |
Employment Status by Educational Attainment in Juniata County
According to labor force statistics for Juniata County, 76.7% of individuals (8,939) out of the total population between 25 and 64 years of age (11,654) are in the labor force, with 2.6% or 232 of them being unemployed. The group with the highest labor force participation rate are those with the educational attainment of bachelor's degree or higher, with 90.7% or 1,695 individuals in the labor force. Within the labor force, individuals with college / associate degree education have the highest percentage of unemployment, with 3.6% or 75 of them being unemployed.
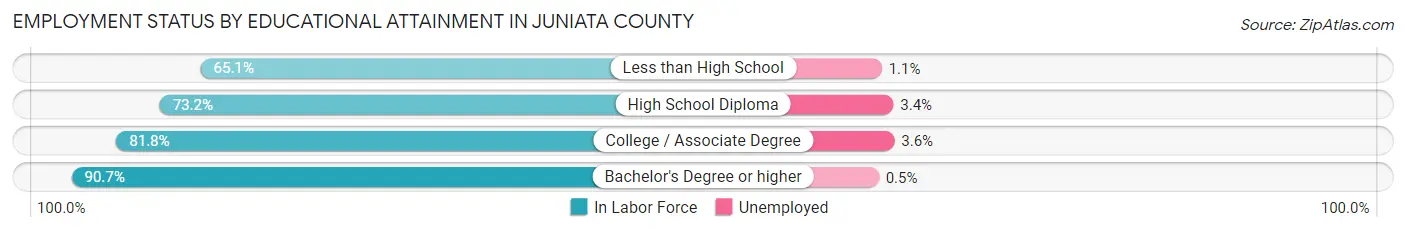
| Educational Attainment | In Labor Force | Unemployed |
| Less than High School | 1,115 (65.1%) | 19 (1.1%) |
| High School Diploma | 4,056 (73.2%) | 188 (3.4%) |
| College / Associate Degree | 2,070 (81.8%) | 91 (3.6%) |
| Bachelor's Degree or higher | 1,695 (90.7%) | 9 (0.5%) |
| Total | 8,939 (76.7%) | 303 (2.6%) |
Employment Occupations by Sex in Juniata County
Management, Business, Science and Arts Occupations
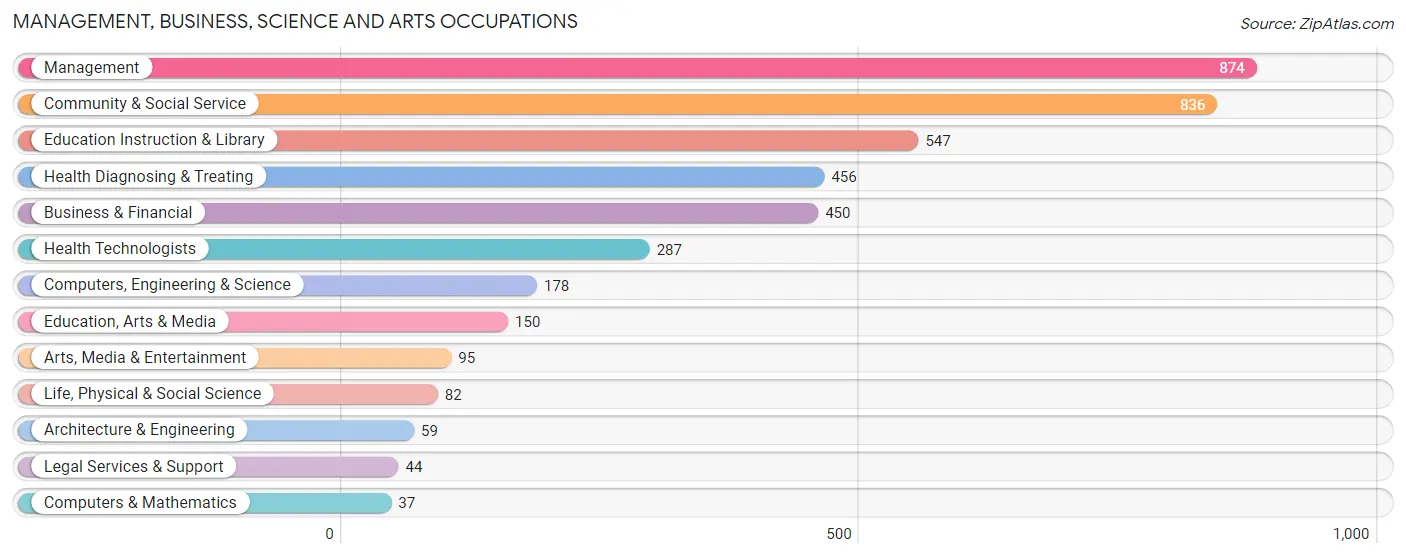
The most common Management, Business, Science and Arts occupations in Juniata County are Management (874 | 8.0%), Community & Social Service (836 | 7.7%), Education Instruction & Library (547 | 5.0%), Health Diagnosing & Treating (456 | 4.2%), and Business & Financial (450 | 4.1%).
Management, Business, Science and Arts Occupations by Sex
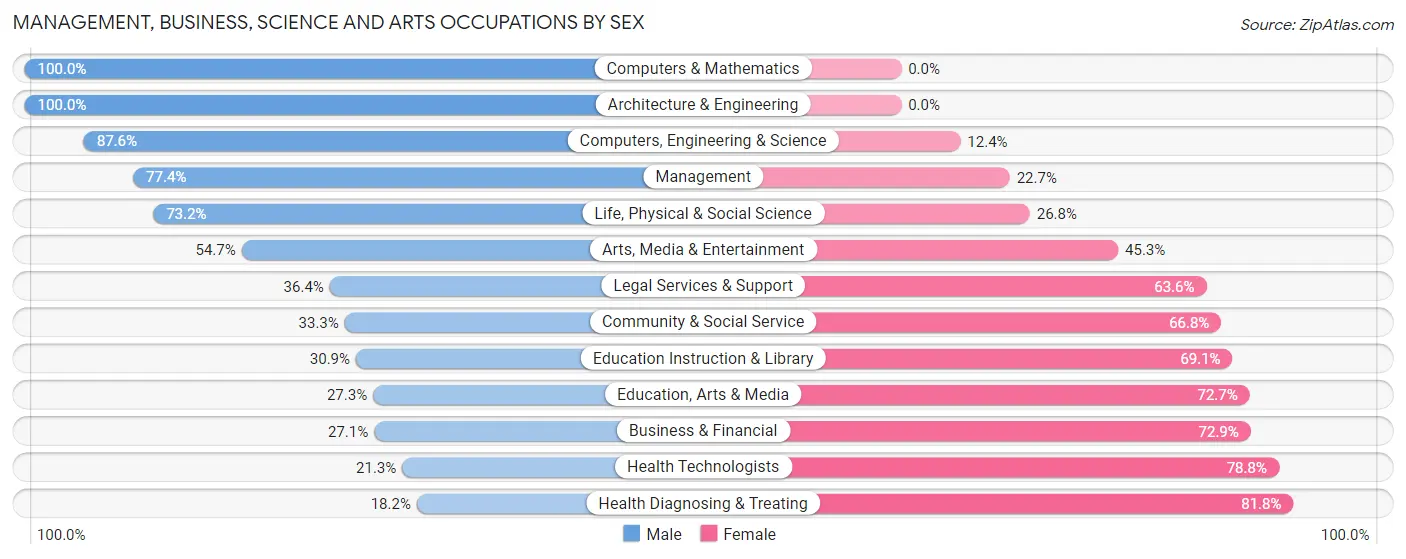
Within the Management, Business, Science and Arts occupations in Juniata County, the most male-oriented occupations are Computers & Mathematics (100.0%), Architecture & Engineering (100.0%), and Computers, Engineering & Science (87.6%), while the most female-oriented occupations are Health Diagnosing & Treating (81.8%), Health Technologists (78.7%), and Business & Financial (72.9%).
| Occupation | Male | Female |
| Management | 676 (77.3%) | 198 (22.7%) |
| Business & Financial | 122 (27.1%) | 328 (72.9%) |
| Computers, Engineering & Science | 156 (87.6%) | 22 (12.4%) |
| Computers & Mathematics | 37 (100.0%) | 0 (0.0%) |
| Architecture & Engineering | 59 (100.0%) | 0 (0.0%) |
| Life, Physical & Social Science | 60 (73.2%) | 22 (26.8%) |
| Community & Social Service | 278 (33.3%) | 558 (66.7%) |
| Education, Arts & Media | 41 (27.3%) | 109 (72.7%) |
| Legal Services & Support | 16 (36.4%) | 28 (63.6%) |
| Education Instruction & Library | 169 (30.9%) | 378 (69.1%) |
| Arts, Media & Entertainment | 52 (54.7%) | 43 (45.3%) |
| Health Diagnosing & Treating | 83 (18.2%) | 373 (81.8%) |
| Health Technologists | 61 (21.2%) | 226 (78.7%) |
| Total (Category) | 1,315 (47.1%) | 1,479 (52.9%) |
| Total (Overall) | 6,307 (57.8%) | 4,611 (42.2%) |
Services Occupations
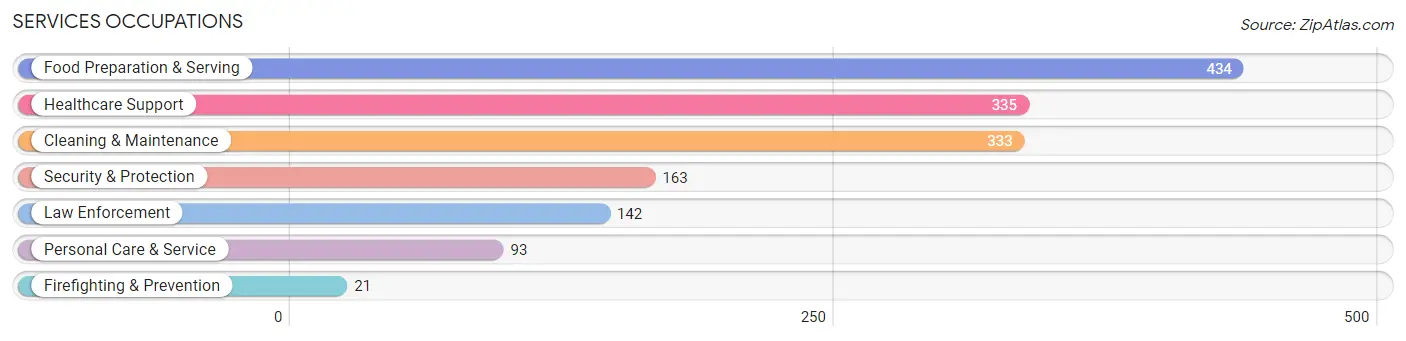
The most common Services occupations in Juniata County are Food Preparation & Serving (434 | 4.0%), Healthcare Support (335 | 3.1%), Cleaning & Maintenance (333 | 3.0%), Security & Protection (163 | 1.5%), and Law Enforcement (142 | 1.3%).
Services Occupations by Sex
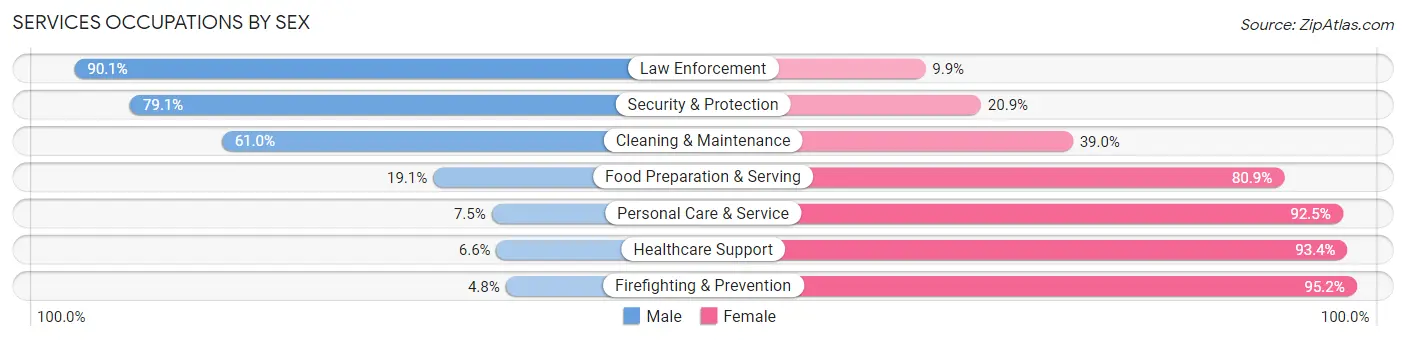
Within the Services occupations in Juniata County, the most male-oriented occupations are Law Enforcement (90.1%), Security & Protection (79.1%), and Cleaning & Maintenance (61.0%), while the most female-oriented occupations are Firefighting & Prevention (95.2%), Healthcare Support (93.4%), and Personal Care & Service (92.5%).
| Occupation | Male | Female |
| Healthcare Support | 22 (6.6%) | 313 (93.4%) |
| Security & Protection | 129 (79.1%) | 34 (20.9%) |
| Firefighting & Prevention | 1 (4.8%) | 20 (95.2%) |
| Law Enforcement | 128 (90.1%) | 14 (9.9%) |
| Food Preparation & Serving | 83 (19.1%) | 351 (80.9%) |
| Cleaning & Maintenance | 203 (61.0%) | 130 (39.0%) |
| Personal Care & Service | 7 (7.5%) | 86 (92.5%) |
| Total (Category) | 444 (32.7%) | 914 (67.3%) |
| Total (Overall) | 6,307 (57.8%) | 4,611 (42.2%) |
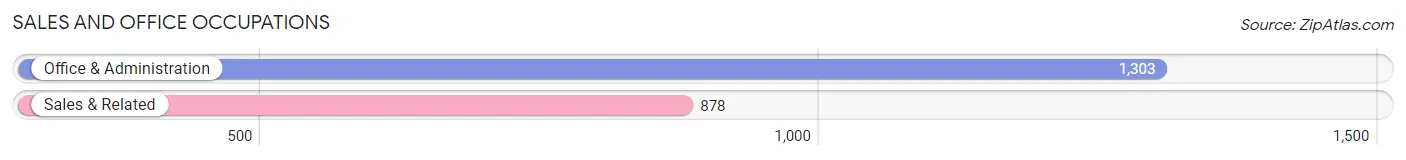
Sales and Office Occupations
The most common Sales and Office occupations in Juniata County are Office & Administration (1,303 | 11.9%), and Sales & Related (878 | 8.0%).
Sales and Office Occupations by Sex
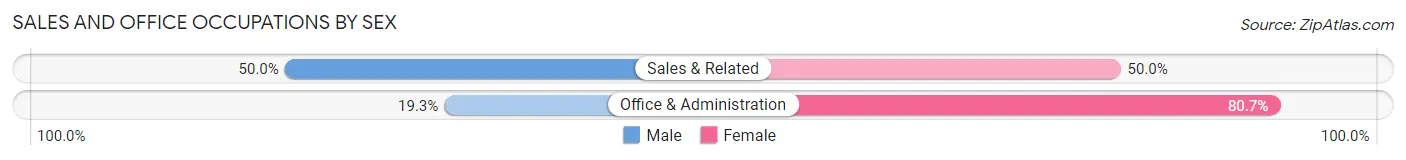
| Occupation | Male | Female |
| Sales & Related | 439 (50.0%) | 439 (50.0%) |
| Office & Administration | 252 (19.3%) | 1,051 (80.7%) |
| Total (Category) | 691 (31.7%) | 1,490 (68.3%) |
| Total (Overall) | 6,307 (57.8%) | 4,611 (42.2%) |
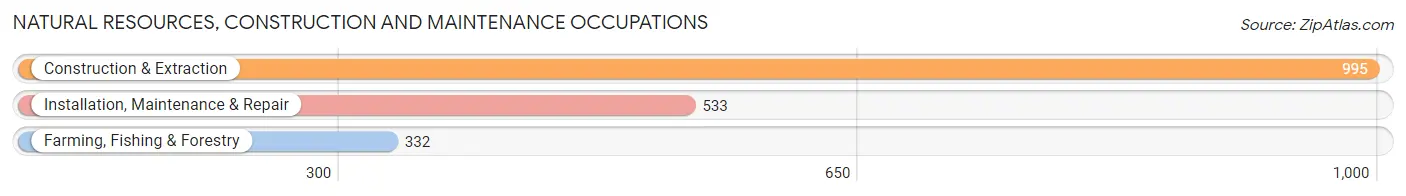
Natural Resources, Construction and Maintenance Occupations
The most common Natural Resources, Construction and Maintenance occupations in Juniata County are Construction & Extraction (995 | 9.1%), Installation, Maintenance & Repair (533 | 4.9%), and Farming, Fishing & Forestry (332 | 3.0%).
Natural Resources, Construction and Maintenance Occupations by Sex
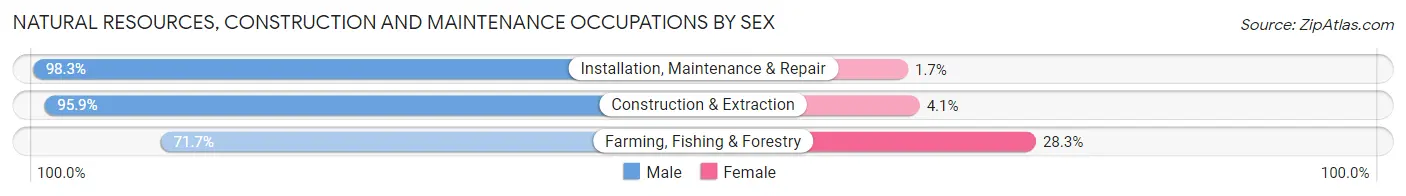
| Occupation | Male | Female |
| Farming, Fishing & Forestry | 238 (71.7%) | 94 (28.3%) |
| Construction & Extraction | 954 (95.9%) | 41 (4.1%) |
| Installation, Maintenance & Repair | 524 (98.3%) | 9 (1.7%) |
| Total (Category) | 1,716 (92.3%) | 144 (7.7%) |
| Total (Overall) | 6,307 (57.8%) | 4,611 (42.2%) |
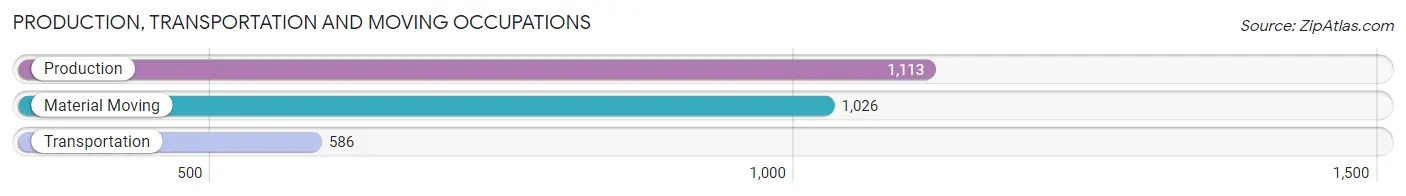
Production, Transportation and Moving Occupations
The most common Production, Transportation and Moving occupations in Juniata County are Production (1,113 | 10.2%), Material Moving (1,026 | 9.4%), and Transportation (586 | 5.4%).
Production, Transportation and Moving Occupations by Sex
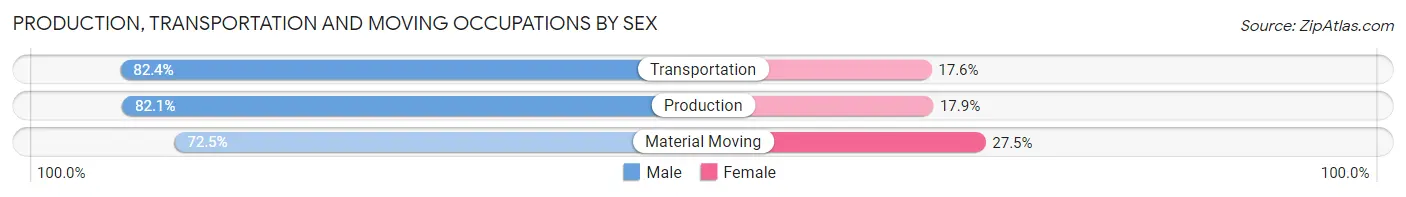
| Occupation | Male | Female |
| Production | 914 (82.1%) | 199 (17.9%) |
| Transportation | 483 (82.4%) | 103 (17.6%) |
| Material Moving | 744 (72.5%) | 282 (27.5%) |
| Total (Category) | 2,141 (78.6%) | 584 (21.4%) |
| Total (Overall) | 6,307 (57.8%) | 4,611 (42.2%) |
Employment Industries by Sex in Juniata County
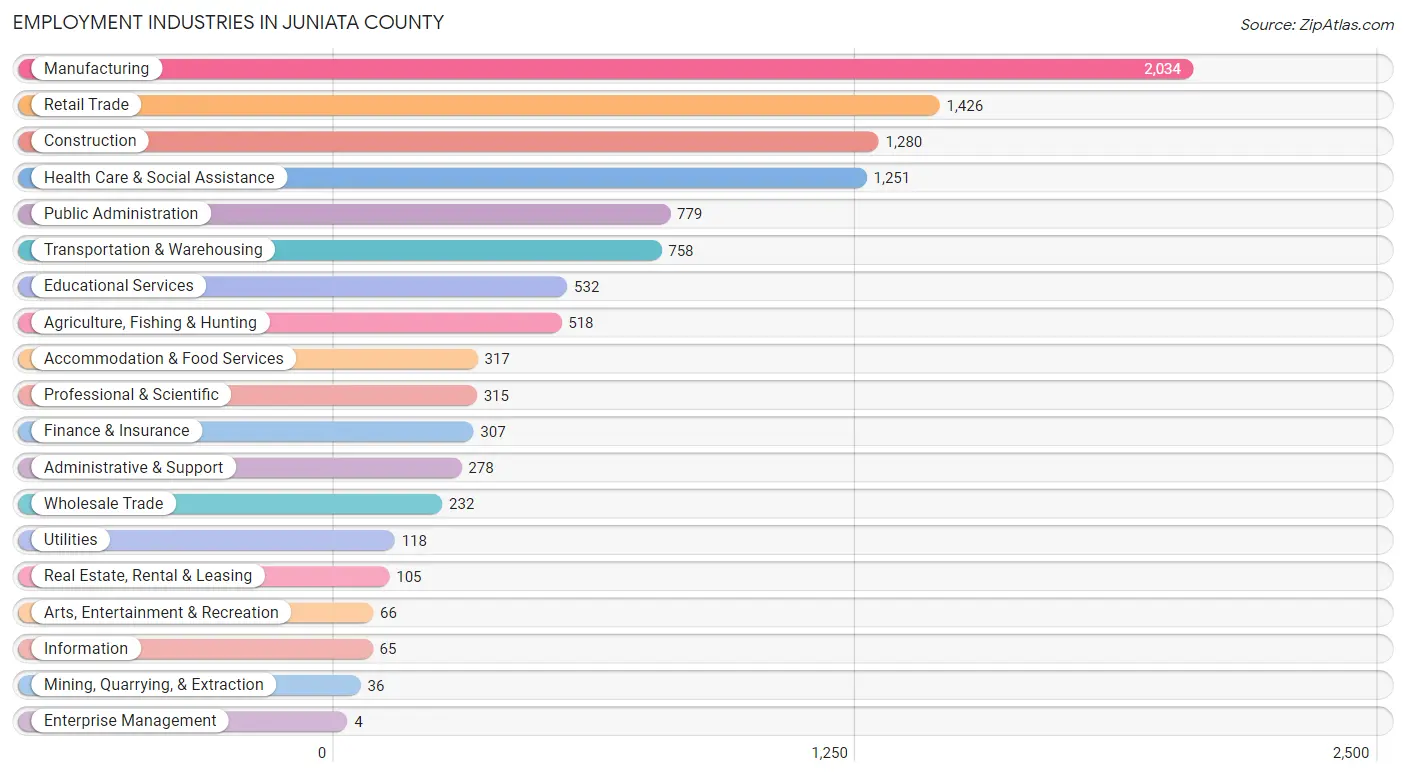
Employment Industries in Juniata County
The major employment industries in Juniata County include Manufacturing (2,034 | 18.6%), Retail Trade (1,426 | 13.1%), Construction (1,280 | 11.7%), Health Care & Social Assistance (1,251 | 11.5%), and Public Administration (779 | 7.1%).
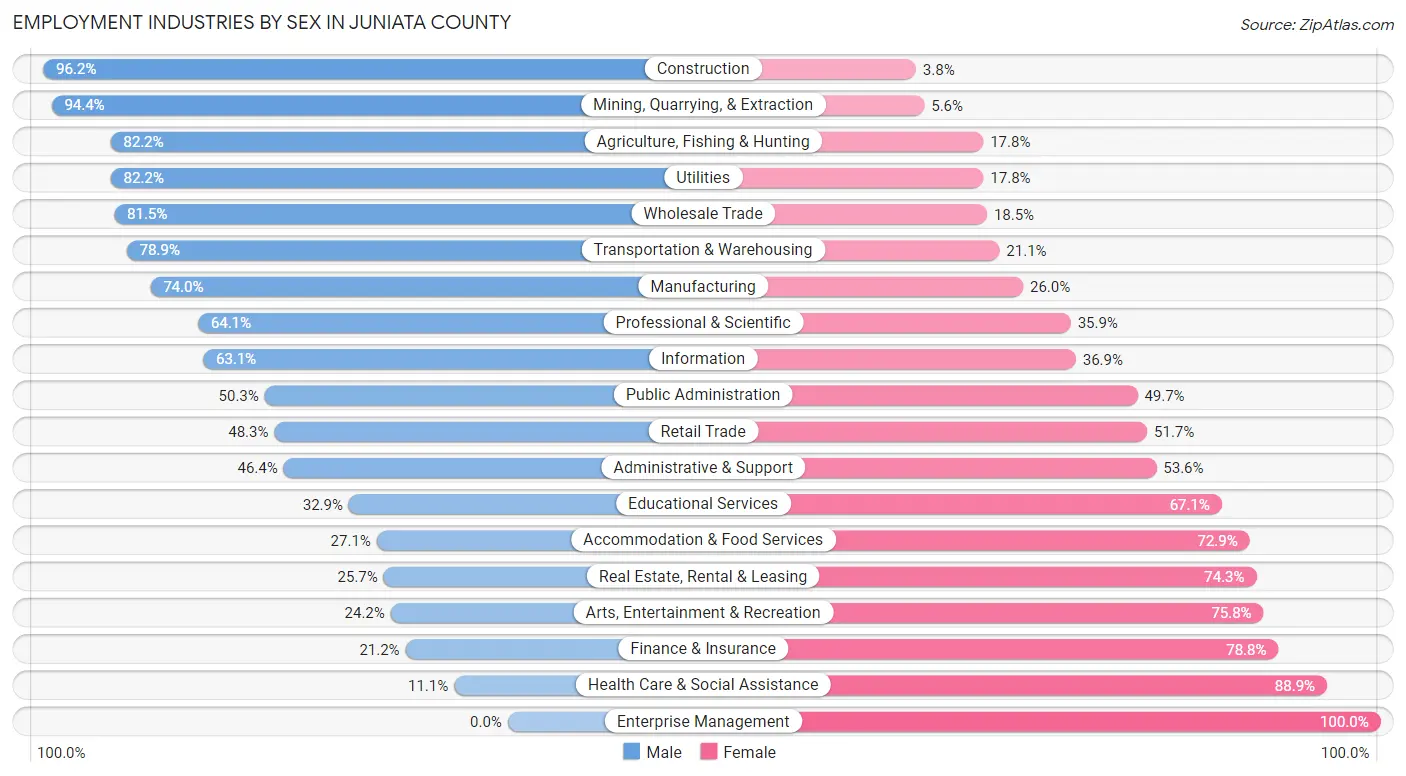
Employment Industries by Sex in Juniata County
The Juniata County industries that see more men than women are Construction (96.2%), Mining, Quarrying, & Extraction (94.4%), and Agriculture, Fishing & Hunting (82.2%), whereas the industries that tend to have a higher number of women are Enterprise Management (100.0%), Health Care & Social Assistance (88.9%), and Finance & Insurance (78.8%).
| Industry | Male | Female |
| Agriculture, Fishing & Hunting | 426 (82.2%) | 92 (17.8%) |
| Mining, Quarrying, & Extraction | 34 (94.4%) | 2 (5.6%) |
| Construction | 1,231 (96.2%) | 49 (3.8%) |
| Manufacturing | 1,505 (74.0%) | 529 (26.0%) |
| Wholesale Trade | 189 (81.5%) | 43 (18.5%) |
| Retail Trade | 689 (48.3%) | 737 (51.7%) |
| Transportation & Warehousing | 598 (78.9%) | 160 (21.1%) |
| Utilities | 97 (82.2%) | 21 (17.8%) |
| Information | 41 (63.1%) | 24 (36.9%) |
| Finance & Insurance | 65 (21.2%) | 242 (78.8%) |
| Real Estate, Rental & Leasing | 27 (25.7%) | 78 (74.3%) |
| Professional & Scientific | 202 (64.1%) | 113 (35.9%) |
| Enterprise Management | 0 (0.0%) | 4 (100.0%) |
| Administrative & Support | 129 (46.4%) | 149 (53.6%) |
| Educational Services | 175 (32.9%) | 357 (67.1%) |
| Health Care & Social Assistance | 139 (11.1%) | 1,112 (88.9%) |
| Arts, Entertainment & Recreation | 16 (24.2%) | 50 (75.8%) |
| Accommodation & Food Services | 86 (27.1%) | 231 (72.9%) |
| Public Administration | 392 (50.3%) | 387 (49.7%) |
| Total | 6,307 (57.8%) | 4,611 (42.2%) |
Education in Juniata County
School Enrollment in Juniata County
The most common levels of schooling among the 4,137 students in Juniata County are elementary school (1,233 | 29.8%), high school (1,130 | 27.3%), and middle school (997 | 24.1%).
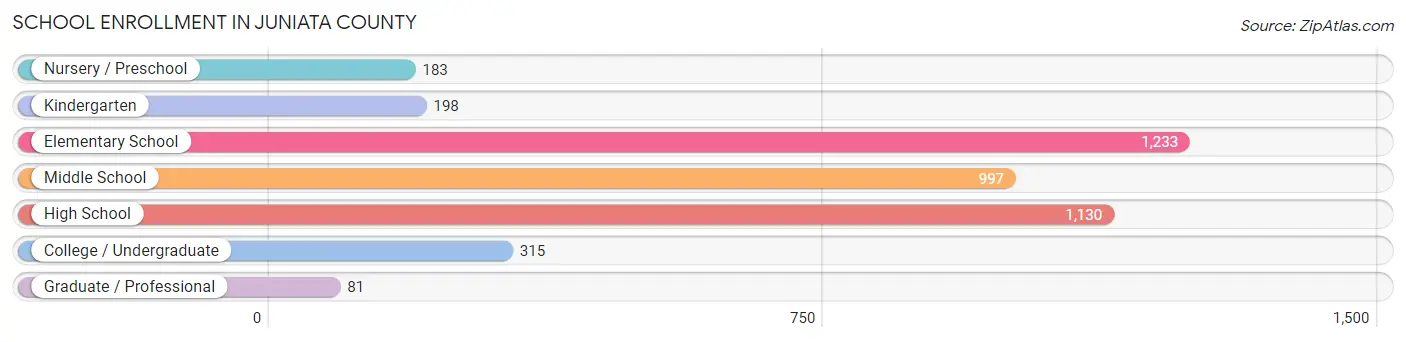
| School Level | # Students | % Students |
| Nursery / Preschool | 183 | 4.4% |
| Kindergarten | 198 | 4.8% |
| Elementary School | 1,233 | 29.8% |
| Middle School | 997 | 24.1% |
| High School | 1,130 | 27.3% |
| College / Undergraduate | 315 | 7.6% |
| Graduate / Professional | 81 | 2.0% |
| Total | 4,137 | 100.0% |
School Enrollment by Age by Funding Source in Juniata County
Out of a total of 4,137 students who are enrolled in schools in Juniata County, 1,183 (28.6%) attend a private institution, while the remaining 2,954 (71.4%) are enrolled in public schools. The age group of 20 to 24 year olds has the highest likelihood of being enrolled in private schools, with 69 (47.3% in the age bracket) enrolled. Conversely, the age group of 15 to 17 year olds has the lowest likelihood of being enrolled in a private school, with 819 (89.3% in the age bracket) attending a public institution.
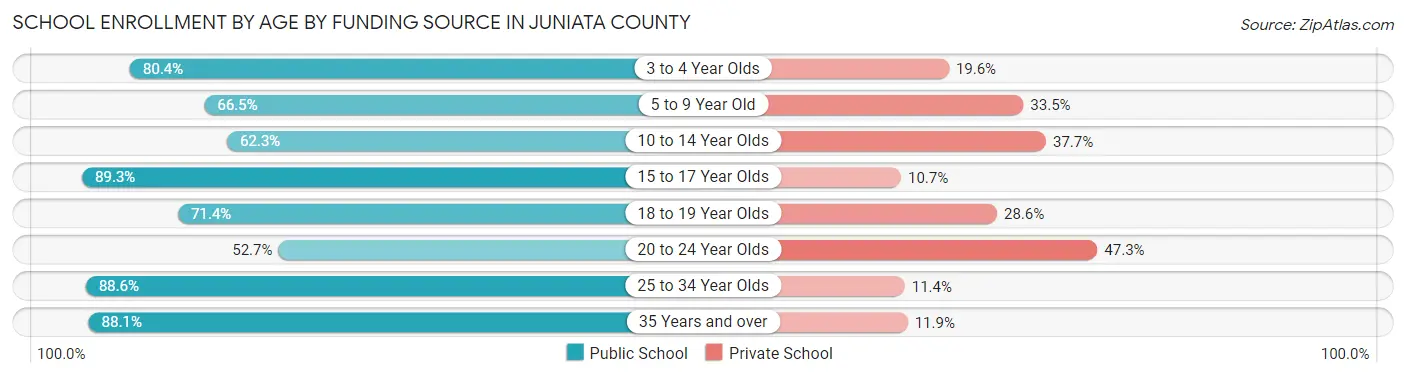
| Age Bracket | Public School | Private School |
| 3 to 4 Year Olds | 82 (80.4%) | 20 (19.6%) |
| 5 to 9 Year Old | 896 (66.5%) | 451 (33.5%) |
| 10 to 14 Year Olds | 760 (62.3%) | 460 (37.7%) |
| 15 to 17 Year Olds | 819 (89.3%) | 98 (10.7%) |
| 18 to 19 Year Olds | 155 (71.4%) | 62 (28.6%) |
| 20 to 24 Year Olds | 77 (52.7%) | 69 (47.3%) |
| 25 to 34 Year Olds | 70 (88.6%) | 9 (11.4%) |
| 35 Years and over | 96 (88.1%) | 13 (11.9%) |
| Total | 2,954 (71.4%) | 1,183 (28.6%) |
Educational Attainment by Field of Study in Juniata County
Education (532 | 21.1%), science & technology (407 | 16.2%), bio, nature & agricultural (266 | 10.6%), business (234 | 9.3%), and arts & humanities (207 | 8.2%) are the most common fields of study among 2,515 individuals in Juniata County who have obtained a bachelor's degree or higher.
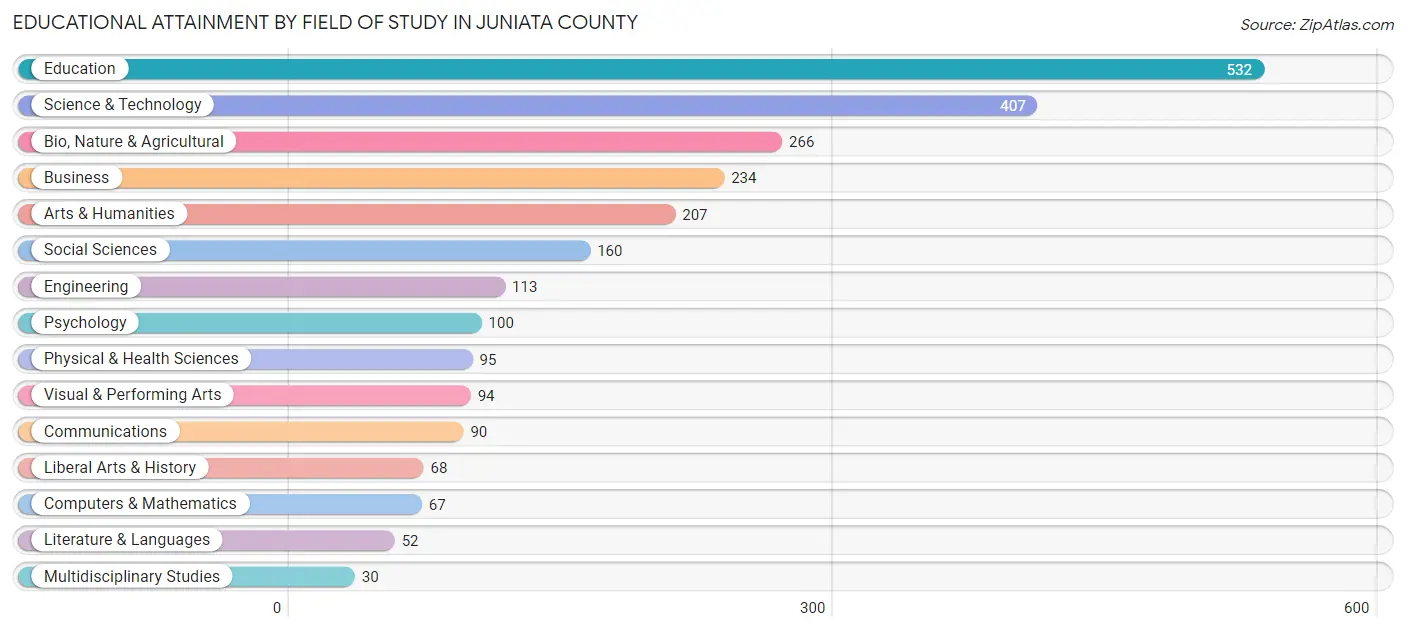
| Field of Study | # Graduates | % Graduates |
| Computers & Mathematics | 67 | 2.7% |
| Bio, Nature & Agricultural | 266 | 10.6% |
| Physical & Health Sciences | 95 | 3.8% |
| Psychology | 100 | 4.0% |
| Social Sciences | 160 | 6.4% |
| Engineering | 113 | 4.5% |
| Multidisciplinary Studies | 30 | 1.2% |
| Science & Technology | 407 | 16.2% |
| Business | 234 | 9.3% |
| Education | 532 | 21.1% |
| Literature & Languages | 52 | 2.1% |
| Liberal Arts & History | 68 | 2.7% |
| Visual & Performing Arts | 94 | 3.7% |
| Communications | 90 | 3.6% |
| Arts & Humanities | 207 | 8.2% |
| Total | 2,515 | 100.0% |
Transportation & Commute in Juniata County
Vehicle Availability by Sex in Juniata County
The most prevalent vehicle ownership categories in Juniata County are males with 2 vehicles (1,956, accounting for 31.1%) and females with 2 vehicles (1,354, making up 42.9%).
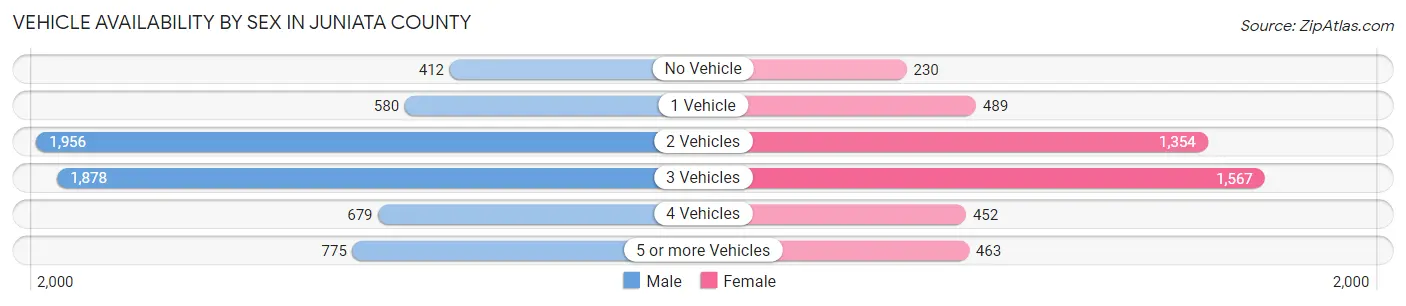
| Vehicles Available | Male | Female |
| No Vehicle | 412 (6.6%) | 230 (5.1%) |
| 1 Vehicle | 580 (9.2%) | 489 (10.7%) |
| 2 Vehicles | 1,956 (31.1%) | 1,354 (29.7%) |
| 3 Vehicles | 1,878 (29.9%) | 1,567 (34.4%) |
| 4 Vehicles | 679 (10.8%) | 452 (9.9%) |
| 5 or more Vehicles | 775 (12.3%) | 463 (10.2%) |
| Total | 6,280 (100.0%) | 4,555 (100.0%) |
Commute Time in Juniata County
The most frequently occuring commute durations in Juniata County are 60 to 89 minutes (1,454 commuters, 14.7%), 5 to 9 minutes (1,235 commuters, 12.5%), and 15 to 19 minutes (1,222 commuters, 12.4%).
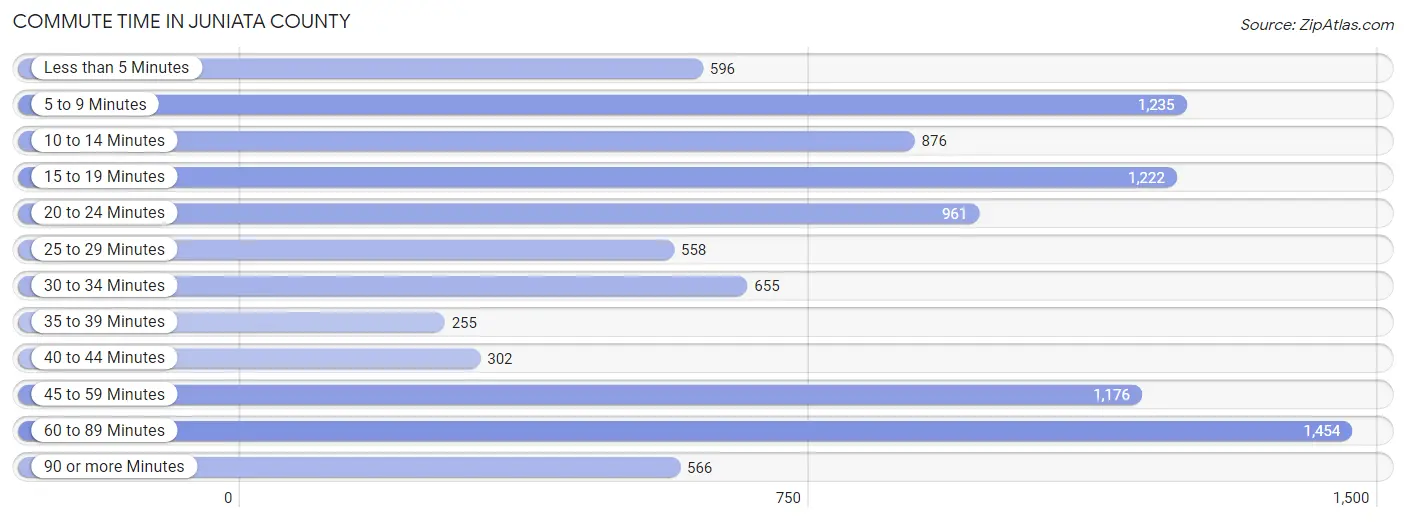
| Commute Time | # Commuters | % Commuters |
| Less than 5 Minutes | 596 | 6.0% |
| 5 to 9 Minutes | 1,235 | 12.5% |
| 10 to 14 Minutes | 876 | 8.9% |
| 15 to 19 Minutes | 1,222 | 12.4% |
| 20 to 24 Minutes | 961 | 9.8% |
| 25 to 29 Minutes | 558 | 5.7% |
| 30 to 34 Minutes | 655 | 6.7% |
| 35 to 39 Minutes | 255 | 2.6% |
| 40 to 44 Minutes | 302 | 3.1% |
| 45 to 59 Minutes | 1,176 | 11.9% |
| 60 to 89 Minutes | 1,454 | 14.7% |
| 90 or more Minutes | 566 | 5.7% |
Commute Time by Sex in Juniata County
The most common commute times in Juniata County are 60 to 89 minutes (1,038 commuters, 18.1%) for males and 15 to 19 minutes (636 commuters, 15.4%) for females.
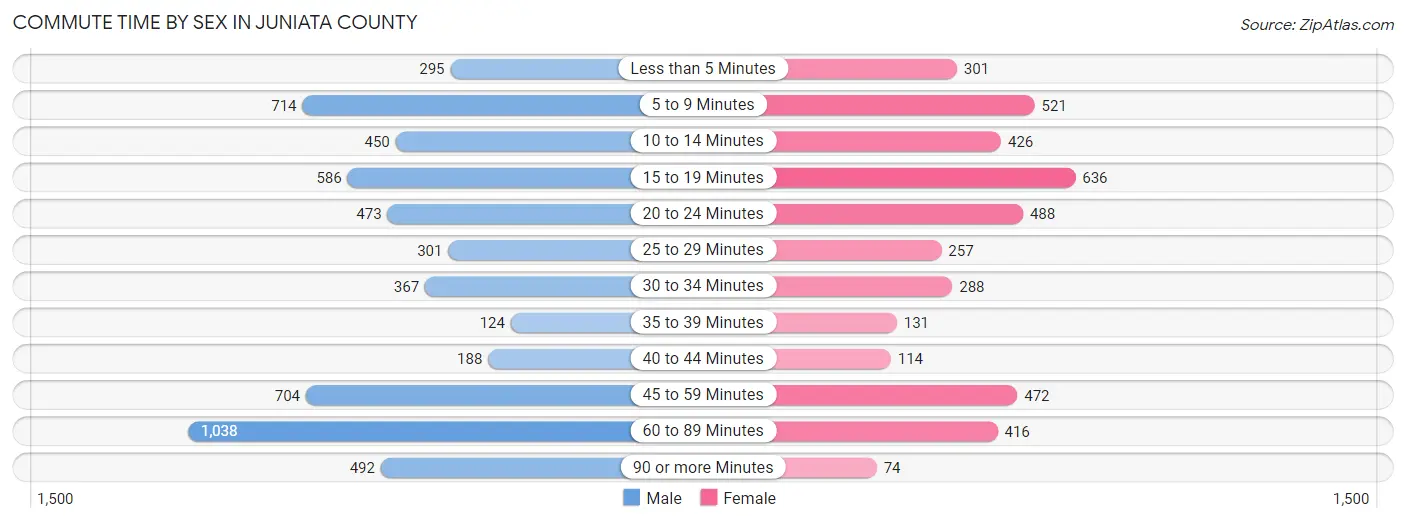
| Commute Time | Male | Female |
| Less than 5 Minutes | 295 (5.1%) | 301 (7.3%) |
| 5 to 9 Minutes | 714 (12.5%) | 521 (12.6%) |
| 10 to 14 Minutes | 450 (7.9%) | 426 (10.3%) |
| 15 to 19 Minutes | 586 (10.2%) | 636 (15.4%) |
| 20 to 24 Minutes | 473 (8.3%) | 488 (11.8%) |
| 25 to 29 Minutes | 301 (5.2%) | 257 (6.2%) |
| 30 to 34 Minutes | 367 (6.4%) | 288 (7.0%) |
| 35 to 39 Minutes | 124 (2.2%) | 131 (3.2%) |
| 40 to 44 Minutes | 188 (3.3%) | 114 (2.8%) |
| 45 to 59 Minutes | 704 (12.3%) | 472 (11.5%) |
| 60 to 89 Minutes | 1,038 (18.1%) | 416 (10.1%) |
| 90 or more Minutes | 492 (8.6%) | 74 (1.8%) |
Time of Departure to Work by Sex in Juniata County
The most frequent times of departure to work in Juniata County are 12:00 AM to 4:59 AM (962, 16.8%) for males and 7:00 AM to 7:29 AM (613, 14.9%) for females.
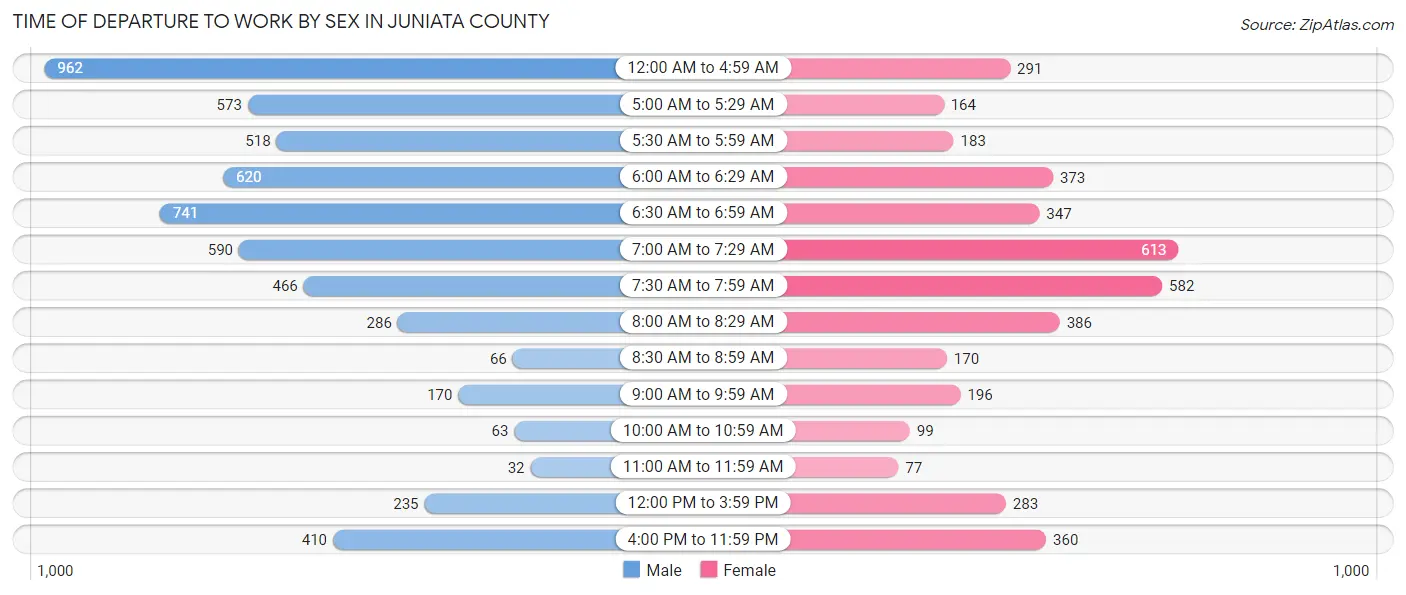
| Time of Departure | Male | Female |
| 12:00 AM to 4:59 AM | 962 (16.8%) | 291 (7.1%) |
| 5:00 AM to 5:29 AM | 573 (10.0%) | 164 (4.0%) |
| 5:30 AM to 5:59 AM | 518 (9.0%) | 183 (4.4%) |
| 6:00 AM to 6:29 AM | 620 (10.8%) | 373 (9.0%) |
| 6:30 AM to 6:59 AM | 741 (12.9%) | 347 (8.4%) |
| 7:00 AM to 7:29 AM | 590 (10.3%) | 613 (14.9%) |
| 7:30 AM to 7:59 AM | 466 (8.1%) | 582 (14.1%) |
| 8:00 AM to 8:29 AM | 286 (5.0%) | 386 (9.4%) |
| 8:30 AM to 8:59 AM | 66 (1.1%) | 170 (4.1%) |
| 9:00 AM to 9:59 AM | 170 (3.0%) | 196 (4.8%) |
| 10:00 AM to 10:59 AM | 63 (1.1%) | 99 (2.4%) |
| 11:00 AM to 11:59 AM | 32 (0.6%) | 77 (1.9%) |
| 12:00 PM to 3:59 PM | 235 (4.1%) | 283 (6.9%) |
| 4:00 PM to 11:59 PM | 410 (7.1%) | 360 (8.7%) |
| Total | 5,732 (100.0%) | 4,124 (100.0%) |
Housing Occupancy in Juniata County
Occupancy by Ownership in Juniata County
Of the total 8,852 dwellings in Juniata County, owner-occupied units account for 6,466 (73.1%), while renter-occupied units make up 2,386 (27.0%).
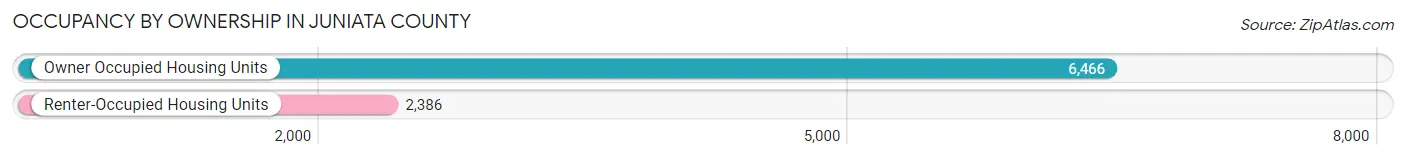
| Occupancy | # Housing Units | % Housing Units |
| Owner Occupied Housing Units | 6,466 | 73.1% |
| Renter-Occupied Housing Units | 2,386 | 27.0% |
| Total Occupied Housing Units | 8,852 | 100.0% |
Occupancy by Household Size in Juniata County
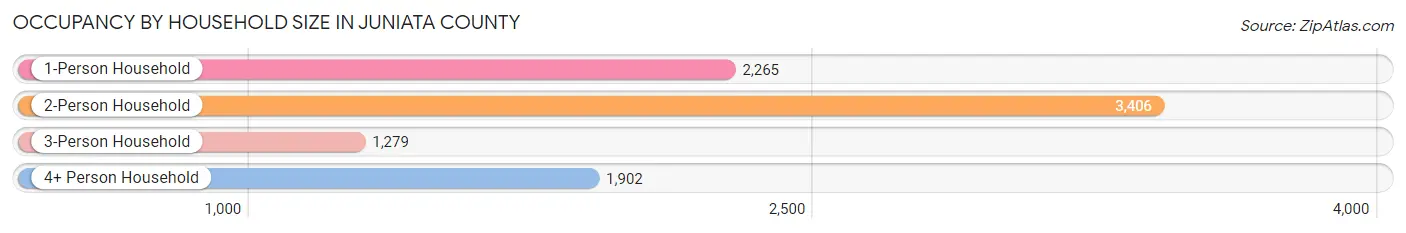
| Household Size | # Housing Units | % Housing Units |
| 1-Person Household | 2,265 | 25.6% |
| 2-Person Household | 3,406 | 38.5% |
| 3-Person Household | 1,279 | 14.4% |
| 4+ Person Household | 1,902 | 21.5% |
| Total Housing Units | 8,852 | 100.0% |
Occupancy by Ownership by Household Size in Juniata County
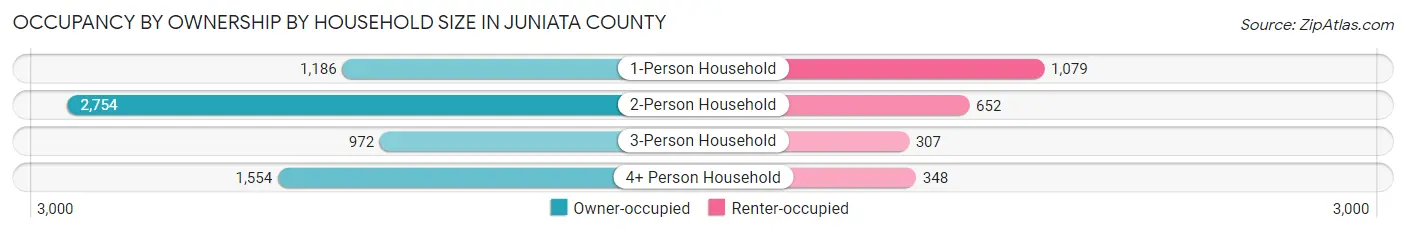
| Household Size | Owner-occupied | Renter-occupied |
| 1-Person Household | 1,186 (52.4%) | 1,079 (47.6%) |
| 2-Person Household | 2,754 (80.9%) | 652 (19.1%) |
| 3-Person Household | 972 (76.0%) | 307 (24.0%) |
| 4+ Person Household | 1,554 (81.7%) | 348 (18.3%) |
| Total Housing Units | 6,466 (73.1%) | 2,386 (27.0%) |
Occupancy by Educational Attainment in Juniata County
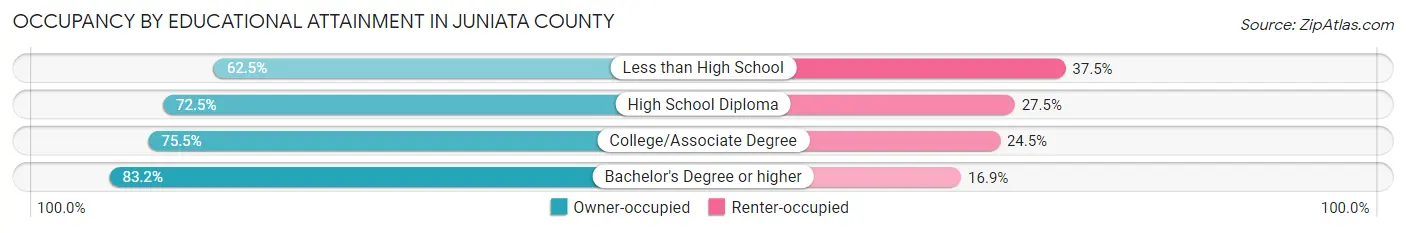
| Household Size | Owner-occupied | Renter-occupied |
| Less than High School | 956 (62.5%) | 574 (37.5%) |
| High School Diploma | 3,031 (72.5%) | 1,148 (27.5%) |
| College/Associate Degree | 1,319 (75.5%) | 429 (24.5%) |
| Bachelor's Degree or higher | 1,160 (83.2%) | 235 (16.9%) |
Occupancy by Age of Householder in Juniata County
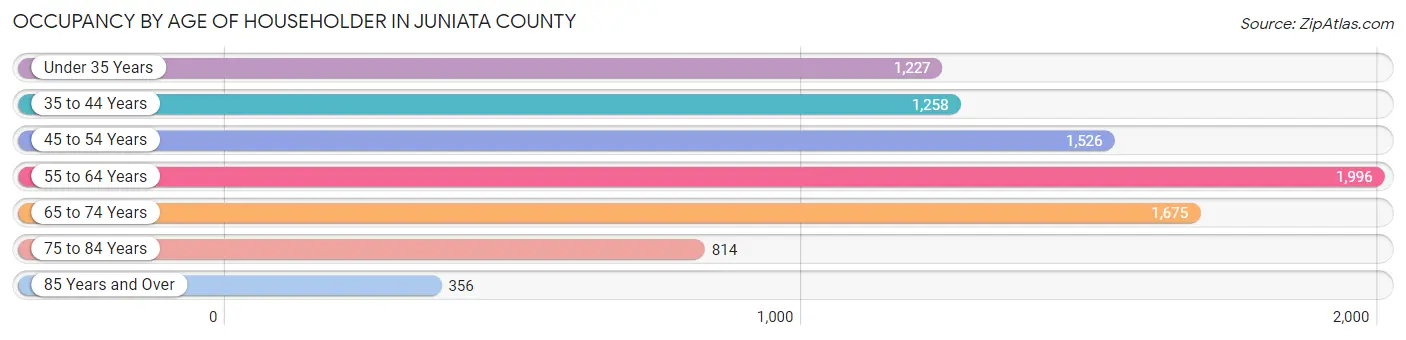
| Age Bracket | # Households | % Households |
| Under 35 Years | 1,227 | 13.9% |
| 35 to 44 Years | 1,258 | 14.2% |
| 45 to 54 Years | 1,526 | 17.2% |
| 55 to 64 Years | 1,996 | 22.6% |
| 65 to 74 Years | 1,675 | 18.9% |
| 75 to 84 Years | 814 | 9.2% |
| 85 Years and Over | 356 | 4.0% |
| Total | 8,852 | 100.0% |
Housing Finances in Juniata County
Median Income by Occupancy in Juniata County
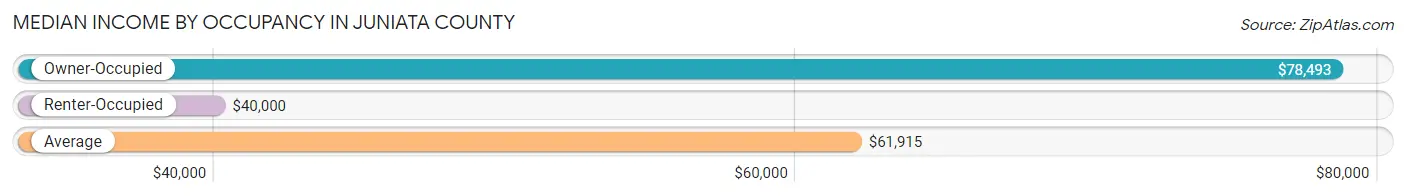
| Occupancy Type | # Households | Median Income |
| Owner-Occupied | 6,466 (73.1%) | $78,493 |
| Renter-Occupied | 2,386 (27.0%) | $40,000 |
| Average | 8,852 (100.0%) | $61,915 |
Occupancy by Householder Income Bracket in Juniata County
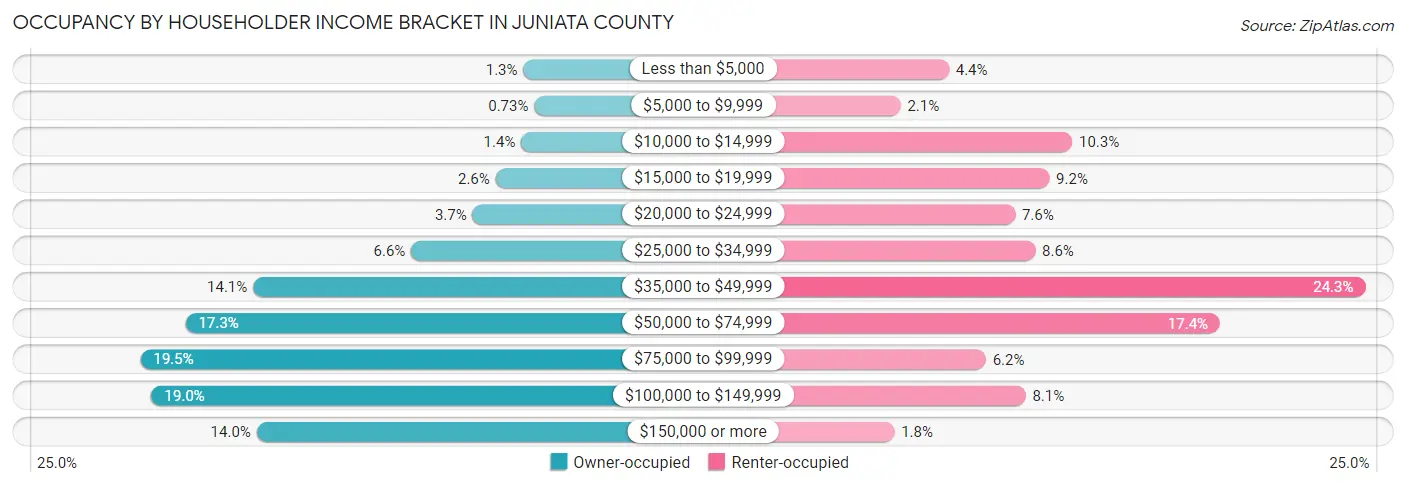
| Income Bracket | Owner-occupied | Renter-occupied |
| Less than $5,000 | 81 (1.3%) | 106 (4.4%) |
| $5,000 to $9,999 | 47 (0.7%) | 51 (2.1%) |
| $10,000 to $14,999 | 87 (1.3%) | 246 (10.3%) |
| $15,000 to $19,999 | 166 (2.6%) | 220 (9.2%) |
| $20,000 to $24,999 | 237 (3.7%) | 181 (7.6%) |
| $25,000 to $34,999 | 426 (6.6%) | 204 (8.6%) |
| $35,000 to $49,999 | 913 (14.1%) | 579 (24.3%) |
| $50,000 to $74,999 | 1,121 (17.3%) | 414 (17.3%) |
| $75,000 to $99,999 | 1,260 (19.5%) | 148 (6.2%) |
| $100,000 to $149,999 | 1,226 (19.0%) | 193 (8.1%) |
| $150,000 or more | 902 (14.0%) | 44 (1.8%) |
| Total | 6,466 (100.0%) | 2,386 (100.0%) |
Monthly Housing Cost Tiers in Juniata County
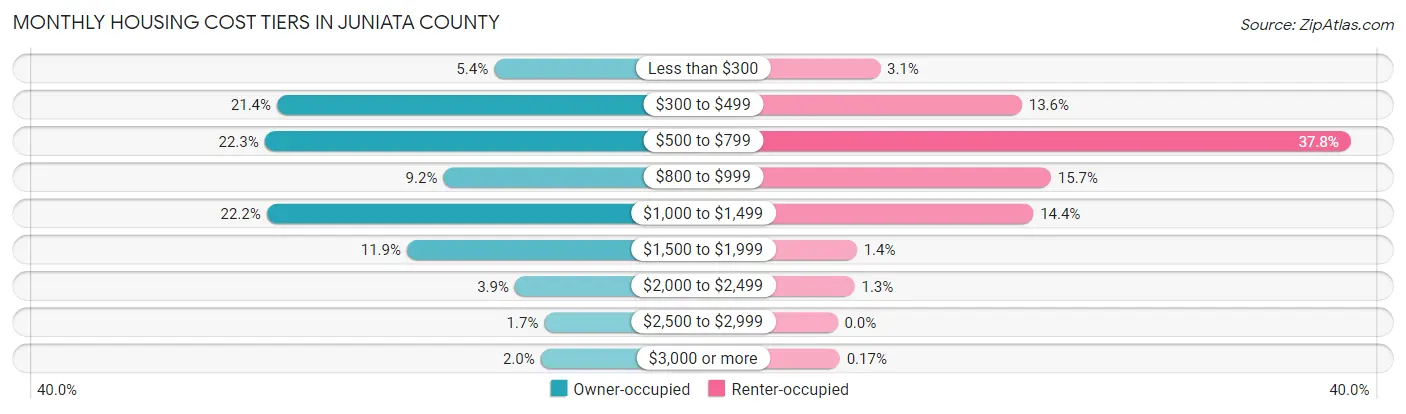
| Monthly Cost | Owner-occupied | Renter-occupied |
| Less than $300 | 351 (5.4%) | 75 (3.1%) |
| $300 to $499 | 1,385 (21.4%) | 324 (13.6%) |
| $500 to $799 | 1,444 (22.3%) | 902 (37.8%) |
| $800 to $999 | 593 (9.2%) | 375 (15.7%) |
| $1,000 to $1,499 | 1,434 (22.2%) | 344 (14.4%) |
| $1,500 to $1,999 | 766 (11.8%) | 34 (1.4%) |
| $2,000 to $2,499 | 252 (3.9%) | 30 (1.3%) |
| $2,500 to $2,999 | 112 (1.7%) | 0 (0.0%) |
| $3,000 or more | 129 (2.0%) | 4 (0.2%) |
| Total | 6,466 (100.0%) | 2,386 (100.0%) |
Physical Housing Characteristics in Juniata County
Housing Structures in Juniata County
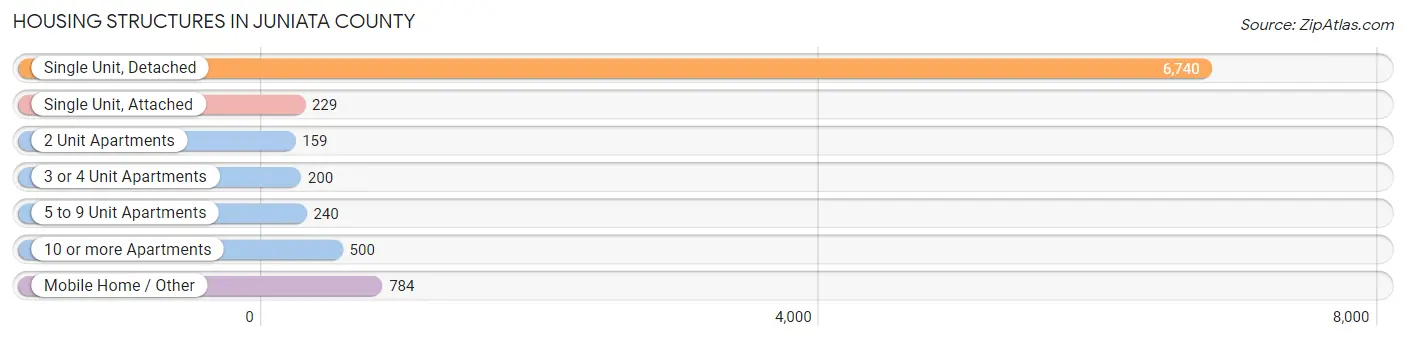
| Structure Type | # Housing Units | % Housing Units |
| Single Unit, Detached | 6,740 | 76.1% |
| Single Unit, Attached | 229 | 2.6% |
| 2 Unit Apartments | 159 | 1.8% |
| 3 or 4 Unit Apartments | 200 | 2.3% |
| 5 to 9 Unit Apartments | 240 | 2.7% |
| 10 or more Apartments | 500 | 5.7% |
| Mobile Home / Other | 784 | 8.9% |
| Total | 8,852 | 100.0% |
Housing Structures by Occupancy in Juniata County
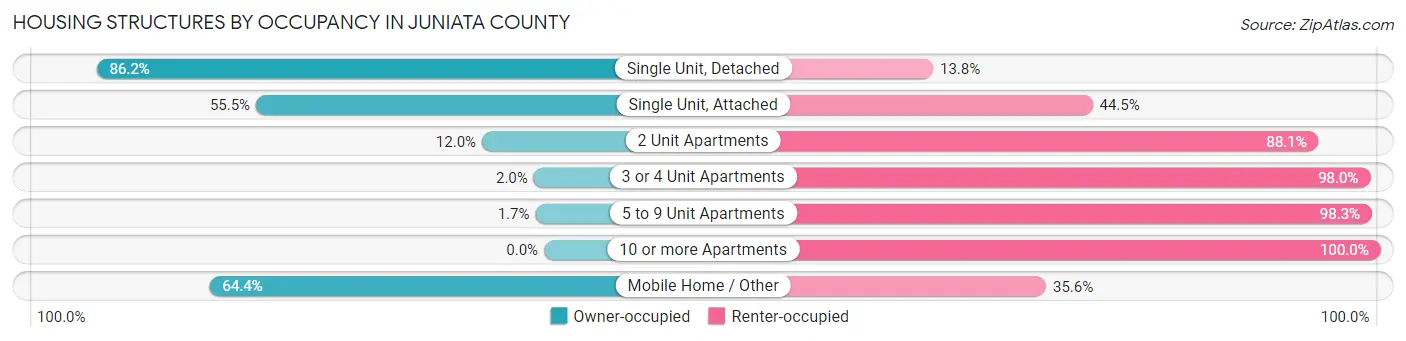
| Structure Type | Owner-occupied | Renter-occupied |
| Single Unit, Detached | 5,807 (86.2%) | 933 (13.8%) |
| Single Unit, Attached | 127 (55.5%) | 102 (44.5%) |
| 2 Unit Apartments | 19 (11.9%) | 140 (88.0%) |
| 3 or 4 Unit Apartments | 4 (2.0%) | 196 (98.0%) |
| 5 to 9 Unit Apartments | 4 (1.7%) | 236 (98.3%) |
| 10 or more Apartments | 0 (0.0%) | 500 (100.0%) |
| Mobile Home / Other | 505 (64.4%) | 279 (35.6%) |
| Total | 6,466 (73.1%) | 2,386 (27.0%) |
Housing Structures by Number of Rooms in Juniata County
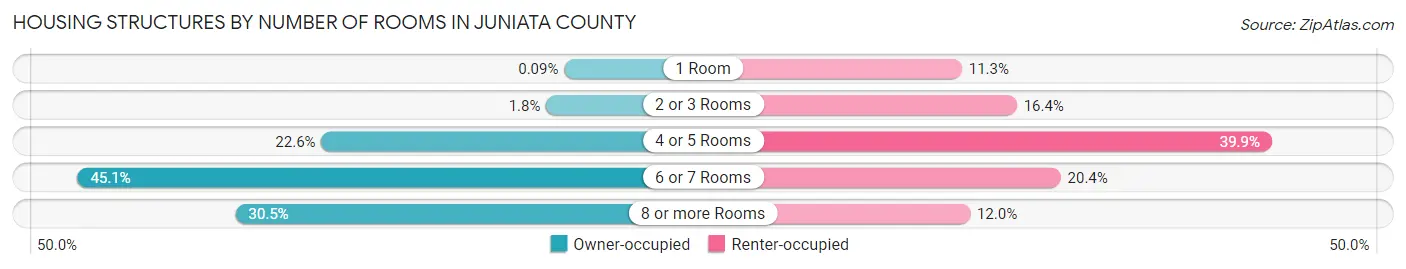
| Number of Rooms | Owner-occupied | Renter-occupied |
| 1 Room | 6 (0.1%) | 269 (11.3%) |
| 2 or 3 Rooms | 113 (1.8%) | 390 (16.4%) |
| 4 or 5 Rooms | 1,458 (22.6%) | 953 (39.9%) |
| 6 or 7 Rooms | 2,917 (45.1%) | 487 (20.4%) |
| 8 or more Rooms | 1,972 (30.5%) | 287 (12.0%) |
| Total | 6,466 (100.0%) | 2,386 (100.0%) |
Housing Structure by Heating Type in Juniata County
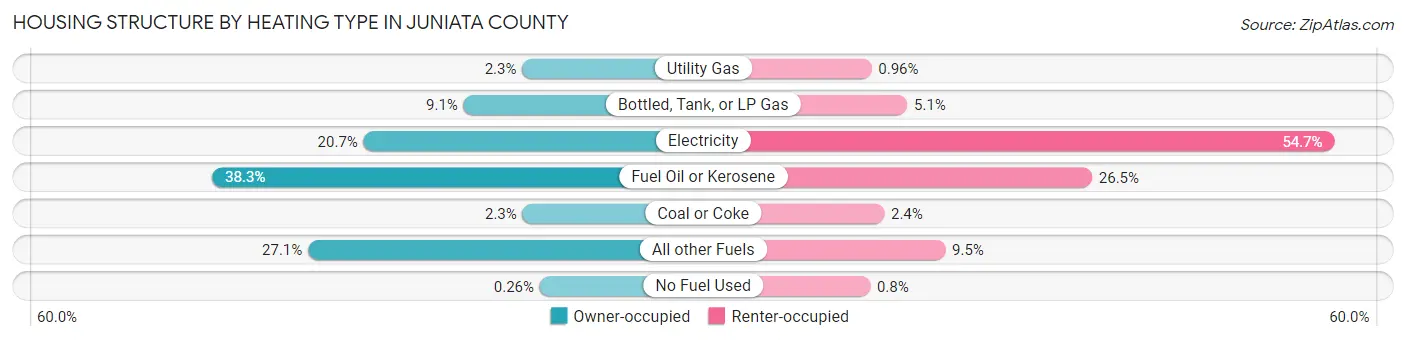
| Heating Type | Owner-occupied | Renter-occupied |
| Utility Gas | 149 (2.3%) | 23 (1.0%) |
| Bottled, Tank, or LP Gas | 588 (9.1%) | 122 (5.1%) |
| Electricity | 1,338 (20.7%) | 1,304 (54.6%) |
| Fuel Oil or Kerosene | 2,474 (38.3%) | 633 (26.5%) |
| Coal or Coke | 146 (2.3%) | 58 (2.4%) |
| All other Fuels | 1,754 (27.1%) | 227 (9.5%) |
| No Fuel Used | 17 (0.3%) | 19 (0.8%) |
| Total | 6,466 (100.0%) | 2,386 (100.0%) |
Household Vehicle Usage in Juniata County
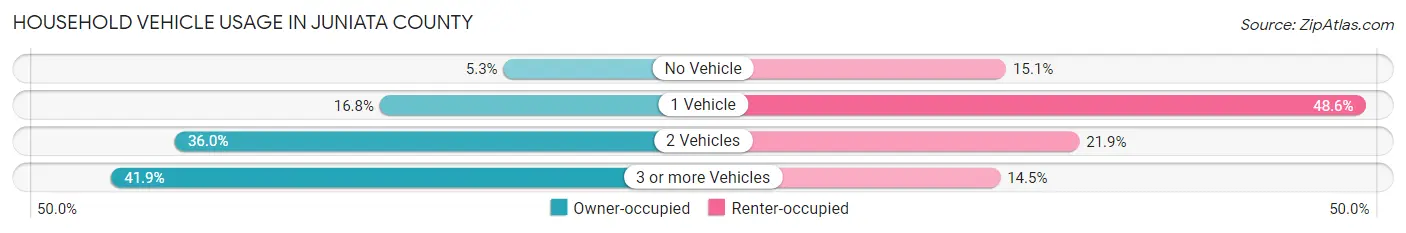
| Vehicles per Household | Owner-occupied | Renter-occupied |
| No Vehicle | 343 (5.3%) | 359 (15.0%) |
| 1 Vehicle | 1,089 (16.8%) | 1,159 (48.6%) |
| 2 Vehicles | 2,325 (36.0%) | 522 (21.9%) |
| 3 or more Vehicles | 2,709 (41.9%) | 346 (14.5%) |
| Total | 6,466 (100.0%) | 2,386 (100.0%) |
Real Estate & Mortgages in Juniata County
Real Estate and Mortgage Overview in Juniata County
| Characteristic | Without Mortgage | With Mortgage |
| Housing Units | 3,152 | 3,314 |
| Median Property Value | $180,100 | $190,600 |
| Median Household Income | $59,086 | $618 |
| Monthly Housing Costs | $486 | $103 |
| Real Estate Taxes | $1,984 | $45 |
Property Value by Mortgage Status in Juniata County
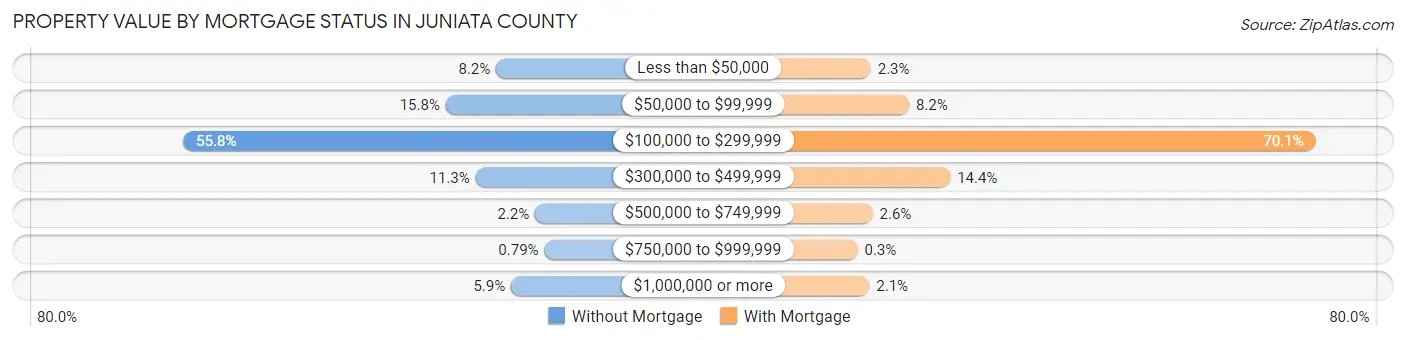
| Property Value | Without Mortgage | With Mortgage |
| Less than $50,000 | 257 (8.2%) | 77 (2.3%) |
| $50,000 to $99,999 | 499 (15.8%) | 270 (8.2%) |
| $100,000 to $299,999 | 1,760 (55.8%) | 2,323 (70.1%) |
| $300,000 to $499,999 | 356 (11.3%) | 478 (14.4%) |
| $500,000 to $749,999 | 70 (2.2%) | 86 (2.6%) |
| $750,000 to $999,999 | 25 (0.8%) | 10 (0.3%) |
| $1,000,000 or more | 185 (5.9%) | 70 (2.1%) |
| Total | 3,152 (100.0%) | 3,314 (100.0%) |
Household Income by Mortgage Status in Juniata County
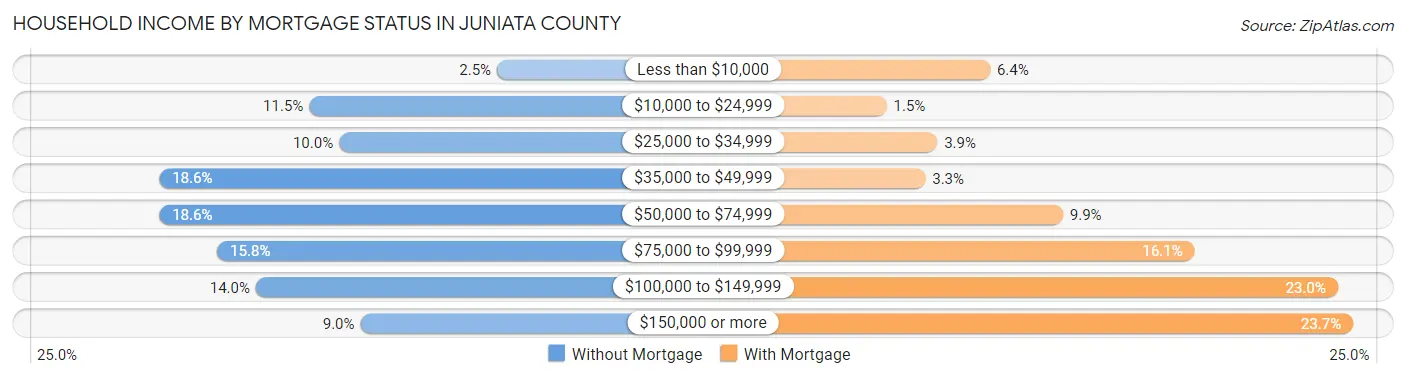
| Household Income | Without Mortgage | With Mortgage |
| Less than $10,000 | 79 (2.5%) | 212 (6.4%) |
| $10,000 to $24,999 | 361 (11.5%) | 49 (1.5%) |
| $25,000 to $34,999 | 316 (10.0%) | 129 (3.9%) |
| $35,000 to $49,999 | 586 (18.6%) | 110 (3.3%) |
| $50,000 to $74,999 | 586 (18.6%) | 327 (9.9%) |
| $75,000 to $99,999 | 499 (15.8%) | 535 (16.1%) |
| $100,000 to $149,999 | 441 (14.0%) | 761 (23.0%) |
| $150,000 or more | 284 (9.0%) | 785 (23.7%) |
| Total | 3,152 (100.0%) | 3,314 (100.0%) |
Property Value to Household Income Ratio in Juniata County
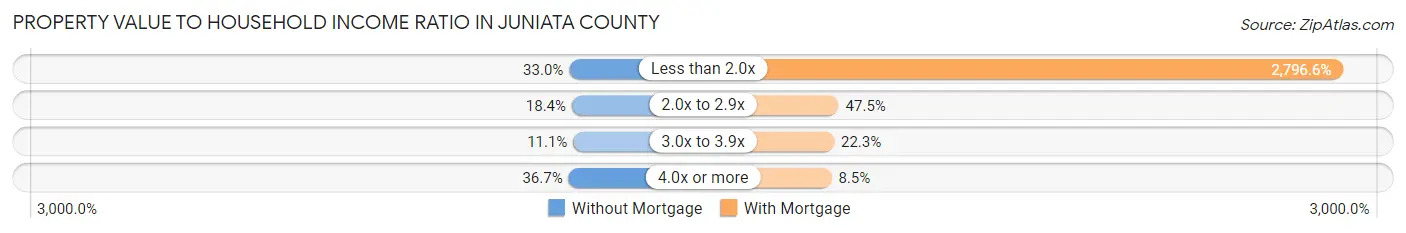
| Value-to-Income Ratio | Without Mortgage | With Mortgage |
| Less than 2.0x | 1,040 (33.0%) | 92,679 (2,796.6%) |
| 2.0x to 2.9x | 580 (18.4%) | 1,574 (47.5%) |
| 3.0x to 3.9x | 349 (11.1%) | 738 (22.3%) |
| 4.0x or more | 1,157 (36.7%) | 280 (8.5%) |
| Total | 3,152 (100.0%) | 3,314 (100.0%) |
Real Estate Taxes by Mortgage Status in Juniata County
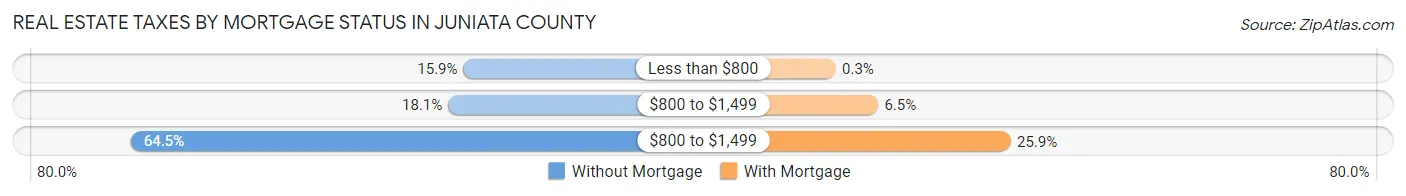
| Property Taxes | Without Mortgage | With Mortgage |
| Less than $800 | 501 (15.9%) | 10 (0.3%) |
| $800 to $1,499 | 571 (18.1%) | 215 (6.5%) |
| $800 to $1,499 | 2,032 (64.5%) | 857 (25.9%) |
| Total | 3,152 (100.0%) | 3,314 (100.0%) |
Health & Disability in Juniata County
Health Insurance Coverage by Age in Juniata County
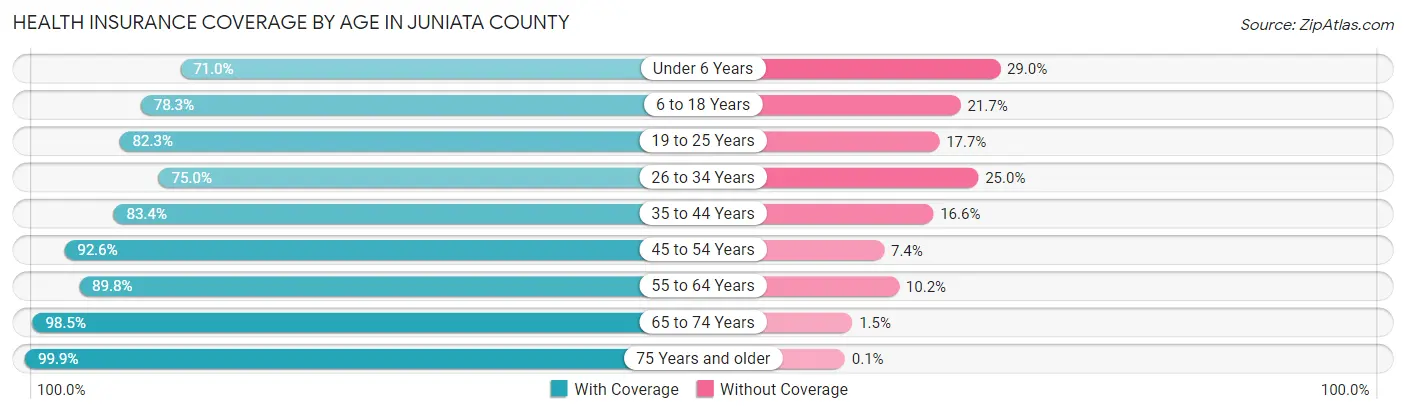
| Age Bracket | With Coverage | Without Coverage |
| Under 6 Years | 1,159 (71.0%) | 474 (29.0%) |
| 6 to 18 Years | 3,004 (78.3%) | 831 (21.7%) |
| 19 to 25 Years | 1,525 (82.3%) | 328 (17.7%) |
| 26 to 34 Years | 1,772 (75.0%) | 590 (25.0%) |
| 35 to 44 Years | 2,187 (83.4%) | 435 (16.6%) |
| 45 to 54 Years | 2,724 (92.6%) | 218 (7.4%) |
| 55 to 64 Years | 3,069 (89.8%) | 348 (10.2%) |
| 65 to 74 Years | 2,669 (98.5%) | 40 (1.5%) |
| 75 Years and older | 1,919 (99.9%) | 2 (0.1%) |
| Total | 20,028 (86.0%) | 3,266 (14.0%) |
Health Insurance Coverage by Citizenship Status in Juniata County
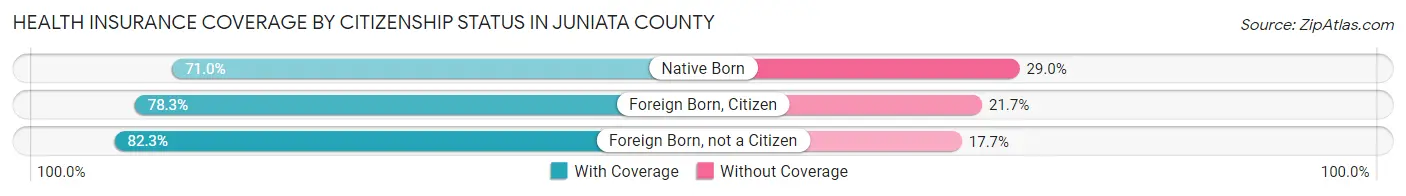
| Citizenship Status | With Coverage | Without Coverage |
| Native Born | 1,159 (71.0%) | 474 (29.0%) |
| Foreign Born, Citizen | 3,004 (78.3%) | 831 (21.7%) |
| Foreign Born, not a Citizen | 1,525 (82.3%) | 328 (17.7%) |
Health Insurance Coverage by Household Income in Juniata County
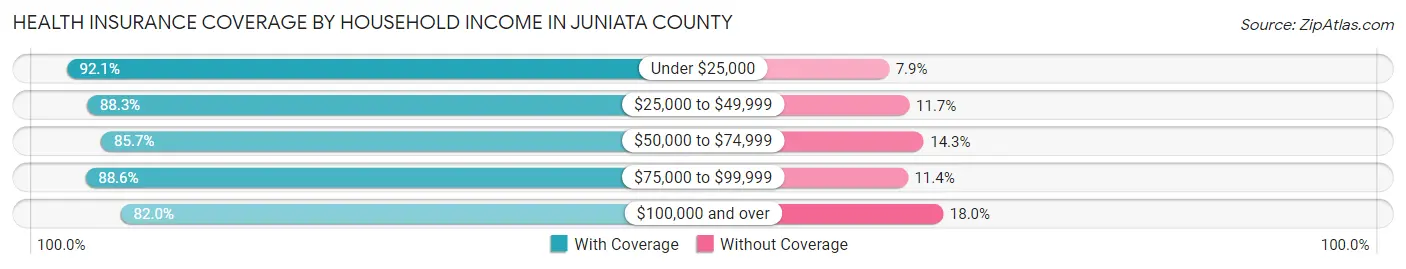
| Household Income | With Coverage | Without Coverage |
| Under $25,000 | 1,900 (92.1%) | 162 (7.9%) |
| $25,000 to $49,999 | 3,850 (88.3%) | 509 (11.7%) |
| $50,000 to $74,999 | 3,363 (85.7%) | 563 (14.3%) |
| $75,000 to $99,999 | 3,891 (88.6%) | 499 (11.4%) |
| $100,000 and over | 6,982 (82.0%) | 1,533 (18.0%) |
Public vs Private Health Insurance Coverage by Age in Juniata County
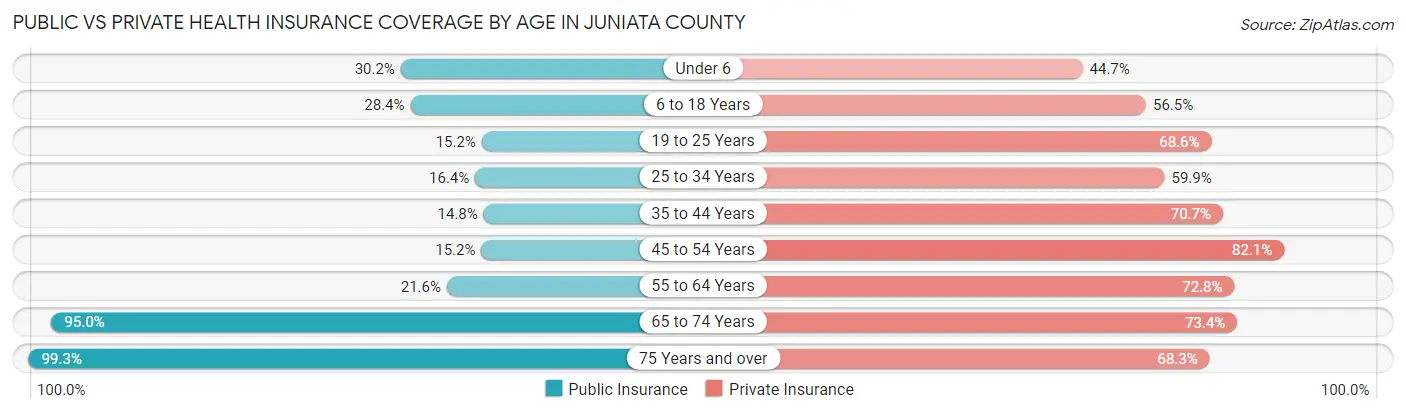
| Age Bracket | Public Insurance | Private Insurance |
| Under 6 | 493 (30.2%) | 730 (44.7%) |
| 6 to 18 Years | 1,089 (28.4%) | 2,166 (56.5%) |
| 19 to 25 Years | 281 (15.2%) | 1,271 (68.6%) |
| 25 to 34 Years | 387 (16.4%) | 1,415 (59.9%) |
| 35 to 44 Years | 388 (14.8%) | 1,854 (70.7%) |
| 45 to 54 Years | 448 (15.2%) | 2,415 (82.1%) |
| 55 to 64 Years | 739 (21.6%) | 2,489 (72.8%) |
| 65 to 74 Years | 2,574 (95.0%) | 1,988 (73.4%) |
| 75 Years and over | 1,907 (99.3%) | 1,311 (68.2%) |
| Total | 8,306 (35.7%) | 15,639 (67.1%) |
Disability Status by Sex by Age in Juniata County
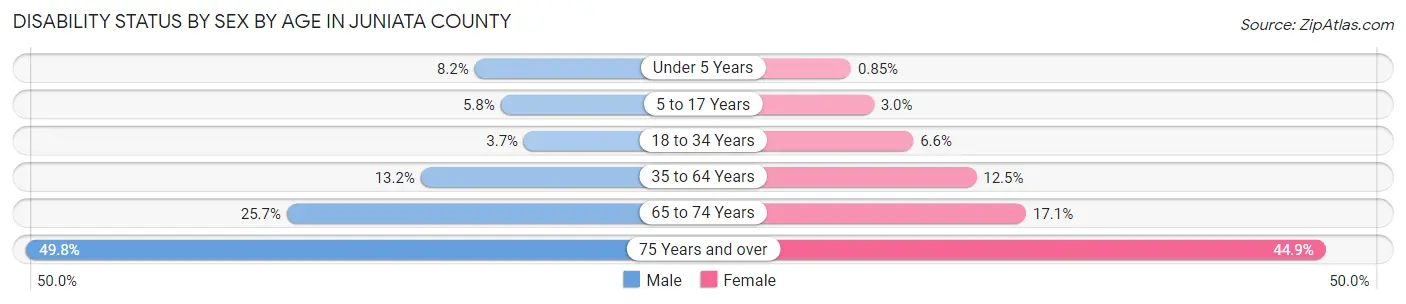
| Age Bracket | Male | Female |
| Under 5 Years | 54 (8.2%) | 6 (0.9%) |
| 5 to 17 Years | 113 (5.8%) | 57 (3.0%) |
| 18 to 34 Years | 83 (3.7%) | 145 (6.6%) |
| 35 to 64 Years | 615 (13.2%) | 541 (12.5%) |
| 65 to 74 Years | 356 (25.7%) | 226 (17.1%) |
| 75 Years and over | 431 (49.8%) | 474 (44.9%) |
Disability Class by Sex by Age in Juniata County
Disability Class: Hearing Difficulty
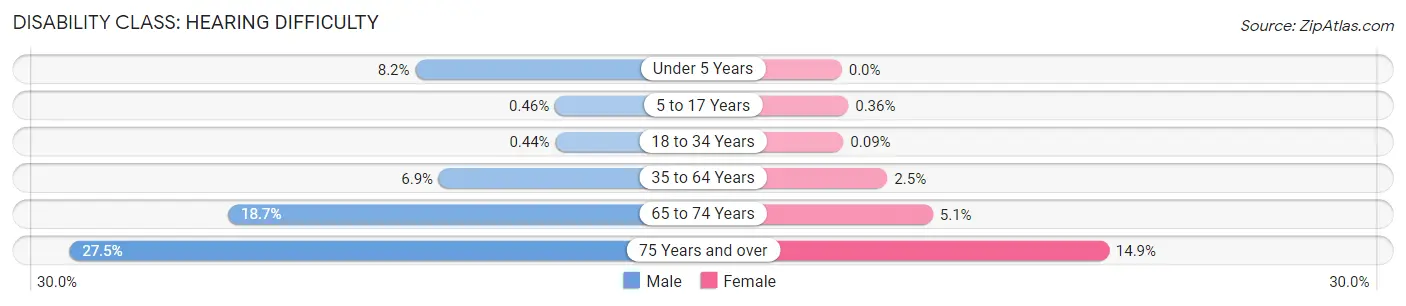
| Age Bracket | Male | Female |
| Under 5 Years | 54 (8.2%) | 0 (0.0%) |
| 5 to 17 Years | 9 (0.5%) | 7 (0.4%) |
| 18 to 34 Years | 10 (0.4%) | 2 (0.1%) |
| 35 to 64 Years | 322 (6.9%) | 110 (2.5%) |
| 65 to 74 Years | 259 (18.7%) | 67 (5.1%) |
| 75 Years and over | 238 (27.5%) | 157 (14.9%) |
Disability Class: Vision Difficulty
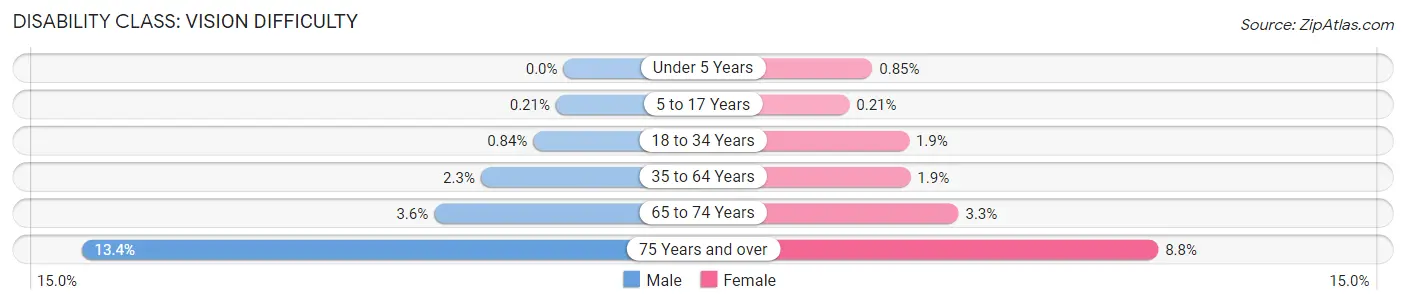
| Age Bracket | Male | Female |
| Under 5 Years | 0 (0.0%) | 6 (0.9%) |
| 5 to 17 Years | 4 (0.2%) | 4 (0.2%) |
| 18 to 34 Years | 19 (0.8%) | 41 (1.9%) |
| 35 to 64 Years | 107 (2.3%) | 83 (1.9%) |
| 65 to 74 Years | 50 (3.6%) | 43 (3.3%) |
| 75 Years and over | 116 (13.4%) | 93 (8.8%) |
Disability Class: Cognitive Difficulty
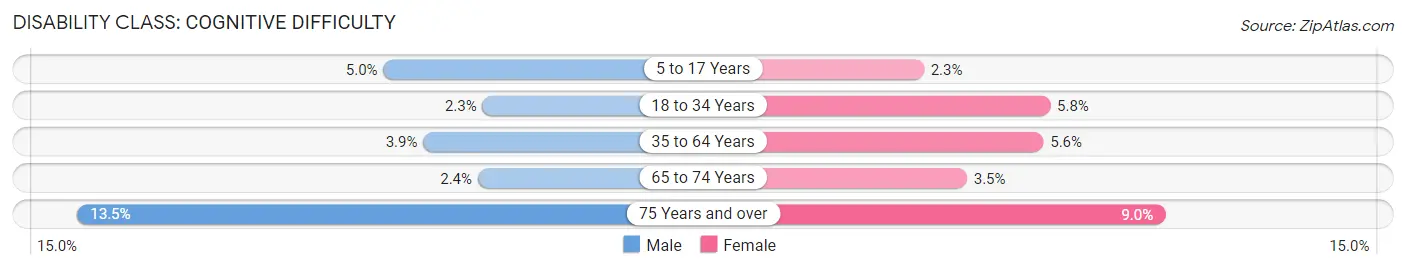
| Age Bracket | Male | Female |
| 5 to 17 Years | 97 (5.0%) | 44 (2.3%) |
| 18 to 34 Years | 51 (2.2%) | 127 (5.8%) |
| 35 to 64 Years | 181 (3.9%) | 243 (5.6%) |
| 65 to 74 Years | 33 (2.4%) | 46 (3.5%) |
| 75 Years and over | 117 (13.5%) | 95 (9.0%) |
Disability Class: Ambulatory Difficulty
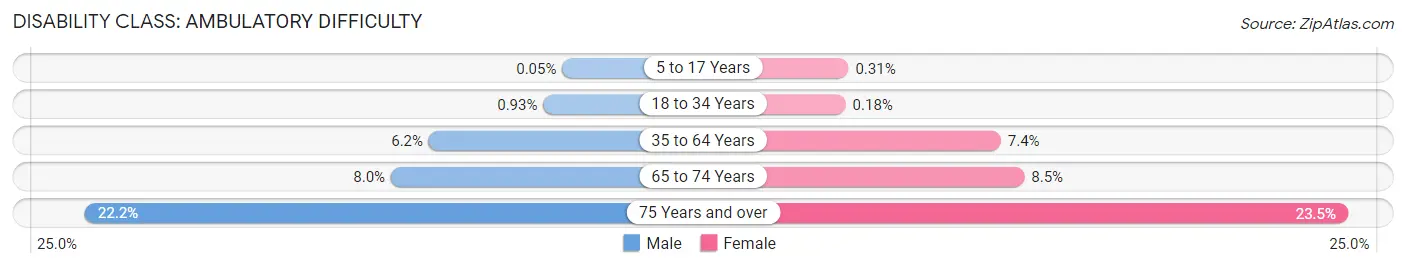
| Age Bracket | Male | Female |
| 5 to 17 Years | 1 (0.1%) | 6 (0.3%) |
| 18 to 34 Years | 21 (0.9%) | 4 (0.2%) |
| 35 to 64 Years | 290 (6.2%) | 320 (7.4%) |
| 65 to 74 Years | 111 (8.0%) | 112 (8.5%) |
| 75 Years and over | 192 (22.2%) | 248 (23.5%) |
Disability Class: Self-Care Difficulty
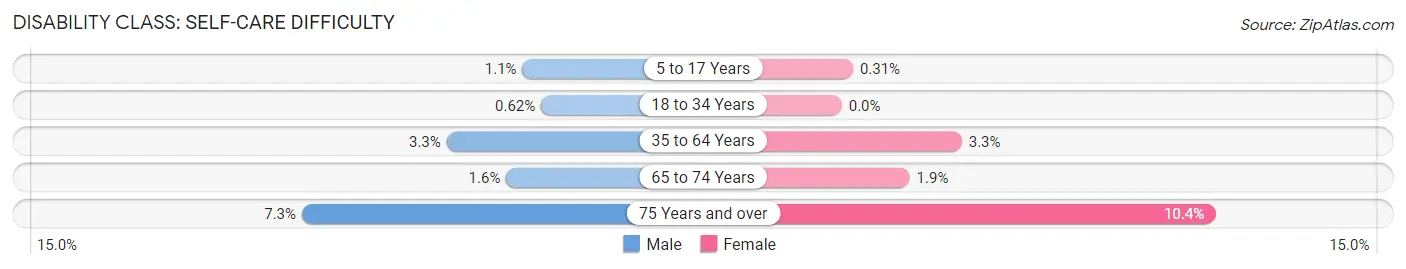
| Age Bracket | Male | Female |
| 5 to 17 Years | 22 (1.1%) | 6 (0.3%) |
| 18 to 34 Years | 14 (0.6%) | 0 (0.0%) |
| 35 to 64 Years | 151 (3.3%) | 145 (3.3%) |
| 65 to 74 Years | 22 (1.6%) | 25 (1.9%) |
| 75 Years and over | 63 (7.3%) | 110 (10.4%) |
Technology Access in Juniata County
Computing Device Access in Juniata County
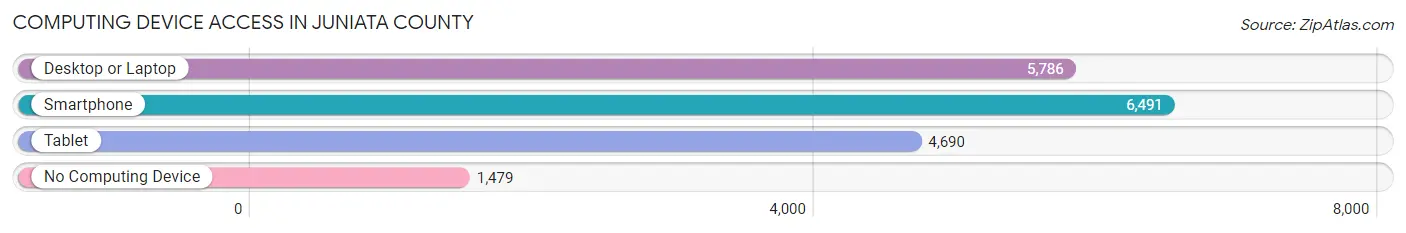
| Device Type | # Households | % Households |
| Desktop or Laptop | 5,786 | 65.4% |
| Smartphone | 6,491 | 73.3% |
| Tablet | 4,690 | 53.0% |
| No Computing Device | 1,479 | 16.7% |
| Total | 8,852 | 100.0% |
Internet Access in Juniata County
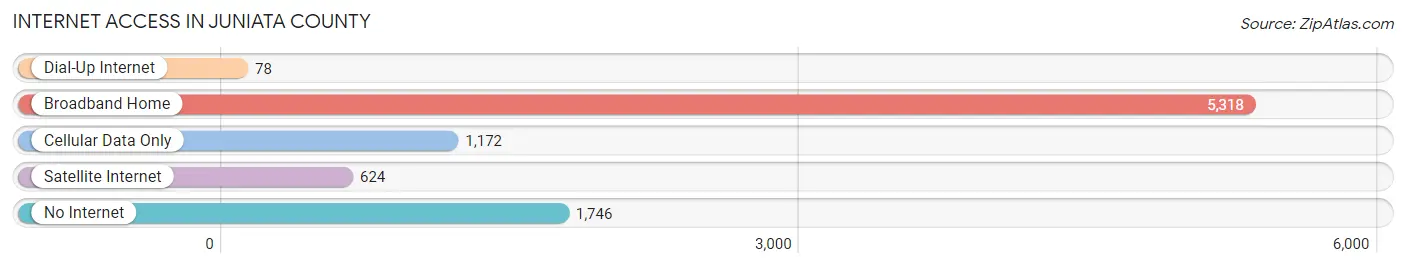
| Internet Type | # Households | % Households |
| Dial-Up Internet | 78 | 0.9% |
| Broadband Home | 5,318 | 60.1% |
| Cellular Data Only | 1,172 | 13.2% |
| Satellite Internet | 624 | 7.0% |
| No Internet | 1,746 | 19.7% |
| Total | 8,852 | 100.0% |
Juniata County Summary
Juniata County is a county located in the U.S. state of Pennsylvania. As of the 2010 census, the population was 24,636. The county seat is Mifflintown. The county was created on March 2, 1831, from part of Mifflin County and named for the Juniata River.
History
Juniata County was formed in 1831 from part of Mifflin County. The county was named after the Juniata River, which flows through the county. The first settlers in the area were Native Americans, who were followed by European settlers in the late 1700s. The first county seat was Mifflintown, which was established in 1790.
The county was home to several industries, including iron and steel production, lumbering, and coal mining. The county was also home to several railroads, including the Pennsylvania Railroad, the Reading Railroad, and the Pennsylvania and Reading Coal and Iron Company.
Geography
Juniata County is located in the central part of Pennsylvania. It is bordered by Mifflin County to the north, Perry County to the east, Snyder County to the south, and Huntingdon County to the west. The county has a total area of 517 square miles, of which 514 square miles is land and 3 square miles is water.
The Juniata River flows through the county, and the county is home to several state parks, including Raystown Lake, Greenwood Furnace State Park, and Cowans Gap State Park.
Economy
The economy of Juniata County is largely based on agriculture and manufacturing. The county is home to several large farms, and the county's agricultural products include corn, hay, soybeans, and wheat.
Manufacturing is also an important part of the county's economy. The county is home to several manufacturing companies, including a paper mill, a plastics manufacturer, and a metal fabrication plant.
Demographics
As of the 2010 census, there were 24,636 people, 9,845 households, and 6,845 families living in the county. The population density was 48 people per square mile. The racial makeup of the county was 97.3% White, 0.7% Black or African American, 0.2% Native American, 0.3% Asian, 0.1% Pacific Islander, 0.4% from other races, and 1.0% from two or more races.
The median income for a household in the county was $41,945, and the median income for a family was $50,945. The per capita income for the county was $20,945. About 8.7% of families and 11.2% of the population were below the poverty line, including 15.2% of those under age 18 and 8.2% of those age 65 or over.
Common Questions
What is Per Capita Income in Juniata County?
Per Capita income in Juniata County is $31,251.
What is the Median Family Income in Juniata County?
Median Family Income in Juniata County is $78,555.
What is the Median Household income in Juniata County?
Median Household Income in Juniata County is $61,915.
What is Income or Wage Gap in Juniata County?
Income or Wage Gap in Juniata County is 34.1%.
Women in Juniata County earn 65.9 cents for every dollar earned by a man.
What is Family Income Deficit in Juniata County?
Family Income Deficit in Juniata County is $10,773.
Families that are below poverty line in Juniata County earn $10,773 less on average than the poverty threshold level.
What is Inequality or Gini Index in Juniata County?
Inequality or Gini Index in Juniata County is 0.41.
What is the Total Population of Juniata County?
Total Population of Juniata County is 23,535.
What is the Total Male Population of Juniata County?
Total Male Population of Juniata County is 11,805.
What is the Total Female Population of Juniata County?
Total Female Population of Juniata County is 11,730.
What is the Ratio of Males per 100 Females in Juniata County?
There are 100.64 Males per 100 Females in Juniata County.
What is the Ratio of Females per 100 Males in Juniata County?
There are 99.36 Females per 100 Males in Juniata County.
What is the Median Population Age in Juniata County?
Median Population Age in Juniata County is 42.7 Years.
What is the Average Family Size in Juniata County
Average Family Size in Juniata County is 3.2 People.
What is the Average Household Size in Juniata County
Average Household Size in Juniata County is 2.6 People.
How Large is the Labor Force in Juniata County?
There are 11,279 People in the Labor Forcein in Juniata County.
What is the Percentage of People in the Labor Force in Juniata County?
59.1% of People are in the Labor Force in Juniata County.
What is the Unemployment Rate in Juniata County?
Unemployment Rate in Juniata County is 3.1%.