Greene County, PA Map & Demographics
Greene County Map
Greene County Overview
$32,272
PER CAPITA INCOME
$84,630
AVG FAMILY INCOME
$66,283
AVG HOUSEHOLD INCOME
42.0%
WAGE / INCOME GAP [ % ]
58.0¢/ $1
WAGE / INCOME GAP [ $ ]
$11,297
FAMILY INCOME DEFICIT
0.43
INEQUALITY / GINI INDEX
35,781
TOTAL POPULATION
18,713
MALE POPULATION
17,068
FEMALE POPULATION
109.64
MALES / 100 FEMALES
91.21
FEMALES / 100 MALES
43.1
MEDIAN AGE
2.9
AVG FAMILY SIZE
2.3
AVG HOUSEHOLD SIZE
15,016
LABOR FORCE [ PEOPLE ]
50.3%
PERCENT IN LABOR FORCE
5.2%
UNEMPLOYMENT RATE
Greene County Area Codes
Income in Greene County
Income Overview in Greene County
Per Capita Income in Greene County is $32,272, while median incomes of families and households are $84,630 and $66,283 respectively.
| Characteristic | Number | Measure |
| Per Capita Income | 35,781 | $32,272 |
| Median Family Income | 9,237 | $84,630 |
| Mean Family Income | 9,237 | $95,816 |
| Median Household Income | 13,957 | $66,283 |
| Mean Household Income | 13,957 | $80,653 |
| Income Deficit | 9,237 | $11,297 |
| Wage / Income Gap (%) | 35,781 | 42.03% |
| Wage / Income Gap ($) | 35,781 | 57.97¢ per $1 |
| Gini / Inequality Index | 35,781 | 0.43 |
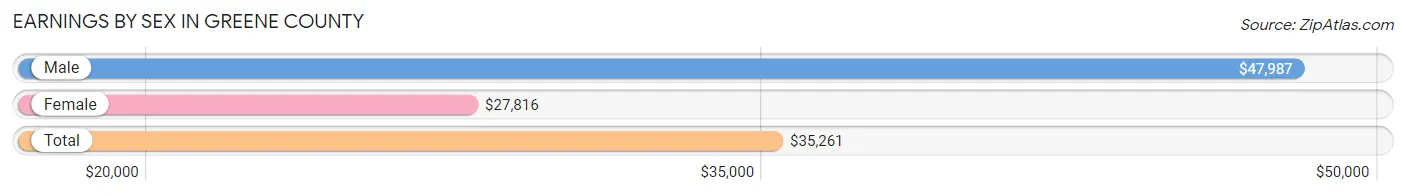
Earnings by Sex in Greene County
Average Earnings in Greene County are $35,261, $47,987 for men and $27,816 for women, a difference of 42.0%.
| Sex | Number | Average Earnings |
| Male | 9,430 (55.3%) | $47,987 |
| Female | 7,608 (44.7%) | $27,816 |
| Total | 17,038 (100.0%) | $35,261 |
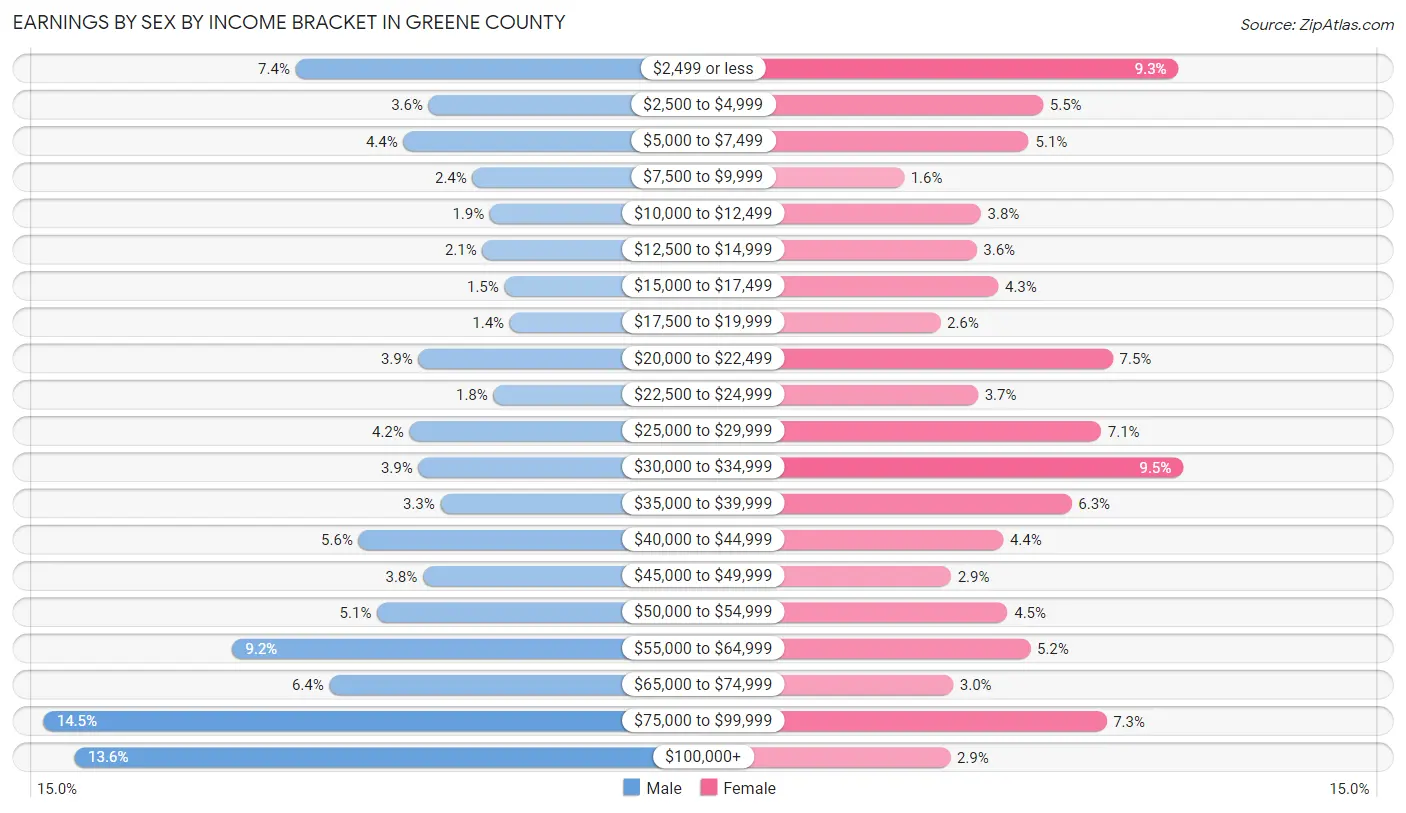
Earnings by Sex by Income Bracket in Greene County
The most common earnings brackets in Greene County are $75,000 to $99,999 for men (1,364 | 14.5%) and $30,000 to $34,999 for women (719 | 9.5%).
| Income | Male | Female |
| $2,499 or less | 696 (7.4%) | 709 (9.3%) |
| $2,500 to $4,999 | 343 (3.6%) | 419 (5.5%) |
| $5,000 to $7,499 | 410 (4.3%) | 389 (5.1%) |
| $7,500 to $9,999 | 227 (2.4%) | 122 (1.6%) |
| $10,000 to $12,499 | 181 (1.9%) | 286 (3.8%) |
| $12,500 to $14,999 | 201 (2.1%) | 277 (3.6%) |
| $15,000 to $17,499 | 142 (1.5%) | 323 (4.3%) |
| $17,500 to $19,999 | 128 (1.4%) | 199 (2.6%) |
| $20,000 to $22,499 | 371 (3.9%) | 568 (7.5%) |
| $22,500 to $24,999 | 172 (1.8%) | 280 (3.7%) |
| $25,000 to $29,999 | 394 (4.2%) | 543 (7.1%) |
| $30,000 to $34,999 | 371 (3.9%) | 719 (9.5%) |
| $35,000 to $39,999 | 312 (3.3%) | 480 (6.3%) |
| $40,000 to $44,999 | 529 (5.6%) | 334 (4.4%) |
| $45,000 to $49,999 | 358 (3.8%) | 222 (2.9%) |
| $50,000 to $54,999 | 480 (5.1%) | 343 (4.5%) |
| $55,000 to $64,999 | 864 (9.2%) | 392 (5.1%) |
| $65,000 to $74,999 | 606 (6.4%) | 227 (3.0%) |
| $75,000 to $99,999 | 1,364 (14.5%) | 555 (7.3%) |
| $100,000+ | 1,281 (13.6%) | 221 (2.9%) |
| Total | 9,430 (100.0%) | 7,608 (100.0%) |
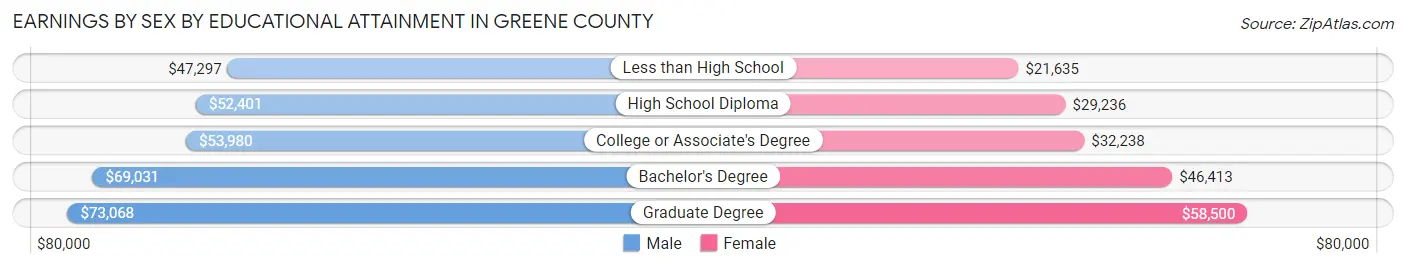
Earnings by Sex by Educational Attainment in Greene County
Average earnings in Greene County are $57,587 for men and $33,279 for women, a difference of 42.2%. Men with an educational attainment of graduate degree enjoy the highest average annual earnings of $73,068, while those with less than high school education earn the least with $47,297. Women with an educational attainment of graduate degree earn the most with the average annual earnings of $58,500, while those with less than high school education have the smallest earnings of $21,635.
| Educational Attainment | Male Income | Female Income |
| Less than High School | $47,297 | $21,635 |
| High School Diploma | $52,401 | $29,236 |
| College or Associate's Degree | $53,980 | $32,238 |
| Bachelor's Degree | $69,031 | $46,413 |
| Graduate Degree | $73,068 | $58,500 |
| Total | $57,587 | $33,279 |
Family Income in Greene County
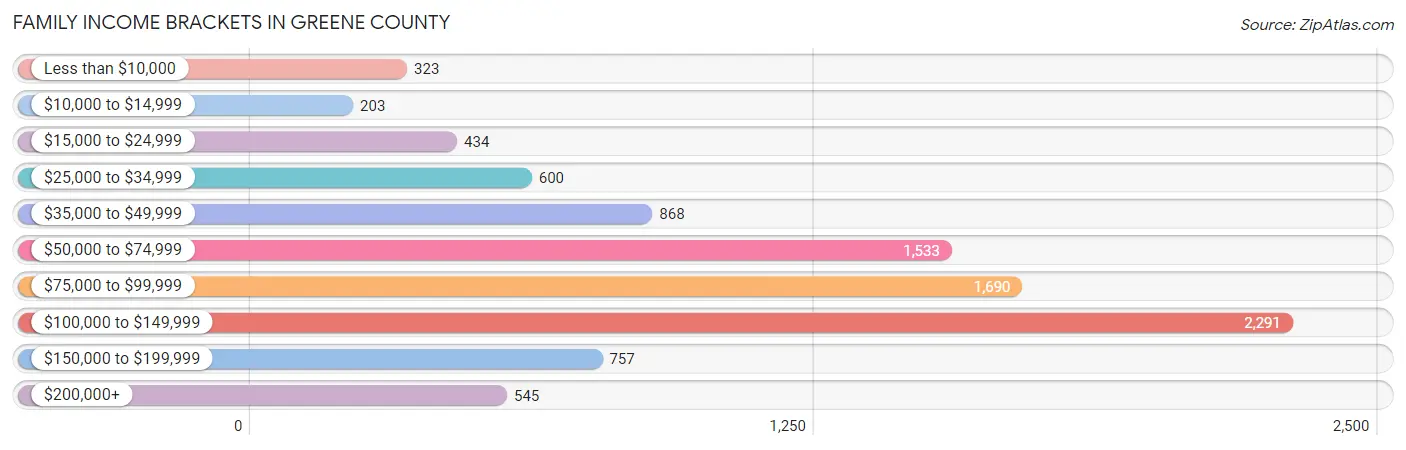
Family Income Brackets in Greene County
According to the Greene County family income data, there are 2,291 families falling into the $100,000 to $149,999 income range, which is the most common income bracket and makes up 24.8% of all families. Conversely, the $10,000 to $14,999 income bracket is the least frequent group with only 203 families (2.2%) belonging to this category.
| Income Bracket | # Families | % Families |
| Less than $10,000 | 323 | 3.5% |
| $10,000 to $14,999 | 203 | 2.2% |
| $15,000 to $24,999 | 434 | 4.7% |
| $25,000 to $34,999 | 600 | 6.5% |
| $35,000 to $49,999 | 868 | 9.4% |
| $50,000 to $74,999 | 1,533 | 16.6% |
| $75,000 to $99,999 | 1,690 | 18.3% |
| $100,000 to $149,999 | 2,291 | 24.8% |
| $150,000 to $199,999 | 757 | 8.2% |
| $200,000+ | 545 | 5.9% |
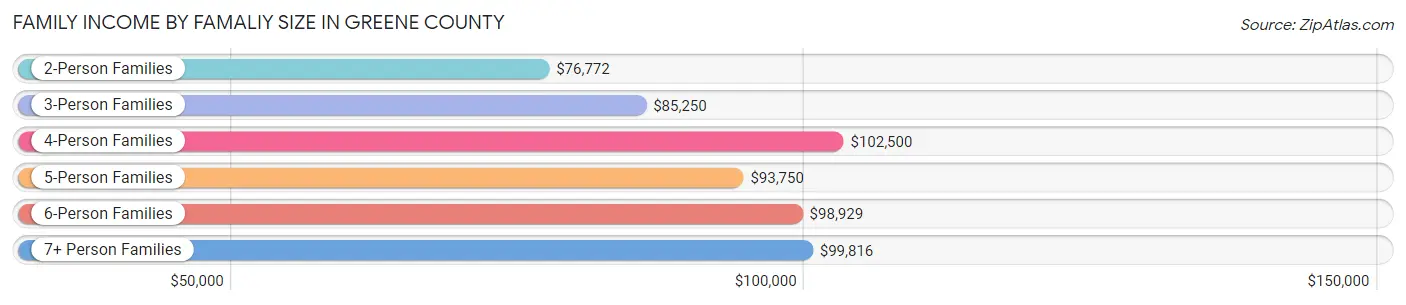
Family Income by Famaliy Size in Greene County
4-person families (1,438 | 15.6%) account for the highest median family income in Greene County with $102,500 per family, while 2-person families (4,836 | 52.3%) have the highest median income of $38,386 per family member.
| Income Bracket | # Families | Median Income |
| 2-Person Families | 4,836 (52.3%) | $76,772 |
| 3-Person Families | 2,046 (22.2%) | $85,250 |
| 4-Person Families | 1,438 (15.6%) | $102,500 |
| 5-Person Families | 500 (5.4%) | $93,750 |
| 6-Person Families | 262 (2.8%) | $98,929 |
| 7+ Person Families | 155 (1.7%) | $99,816 |
| Total | 9,237 (100.0%) | $84,630 |
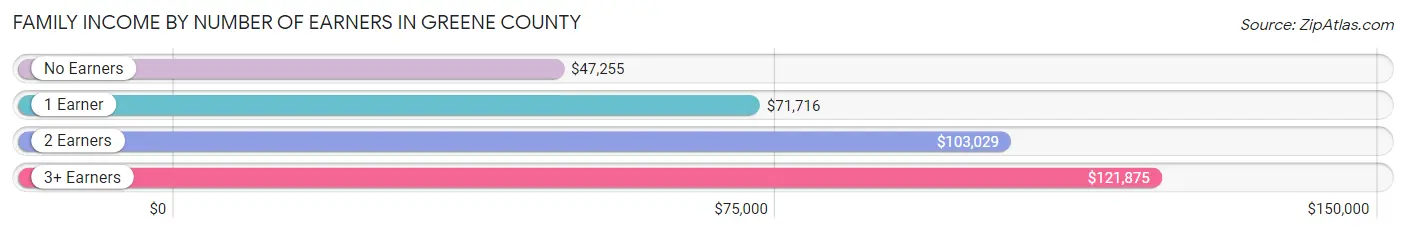
Family Income by Number of Earners in Greene County
The median family income in Greene County is $84,630, with families comprising 3+ earners (917) having the highest median family income of $121,875, while families with no earners (2,071) have the lowest median family income of $47,255, accounting for 9.9% and 22.4% of families, respectively.
| Number of Earners | # Families | Median Income |
| No Earners | 2,071 (22.4%) | $47,255 |
| 1 Earner | 2,940 (31.8%) | $71,716 |
| 2 Earners | 3,309 (35.8%) | $103,029 |
| 3+ Earners | 917 (9.9%) | $121,875 |
| Total | 9,237 (100.0%) | $84,630 |
Household Income in Greene County
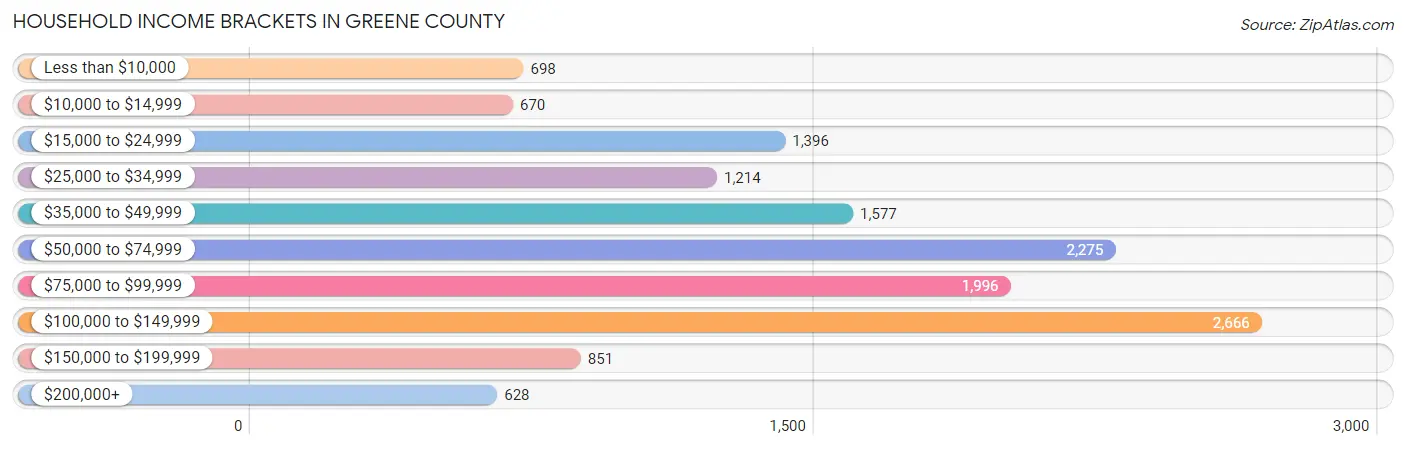
Household Income Brackets in Greene County
With 2,666 households falling in the category, the $100,000 to $149,999 income range is the most frequent in Greene County, accounting for 19.1% of all households. In contrast, only 628 households (4.5%) fall into the $200,000+ income bracket, making it the least populous group.
| Income Bracket | # Households | % Households |
| Less than $10,000 | 698 | 5.0% |
| $10,000 to $14,999 | 670 | 4.8% |
| $15,000 to $24,999 | 1,396 | 10.0% |
| $25,000 to $34,999 | 1,214 | 8.7% |
| $35,000 to $49,999 | 1,577 | 11.3% |
| $50,000 to $74,999 | 2,275 | 16.3% |
| $75,000 to $99,999 | 1,996 | 14.3% |
| $100,000 to $149,999 | 2,666 | 19.1% |
| $150,000 to $199,999 | 851 | 6.1% |
| $200,000+ | 628 | 4.5% |
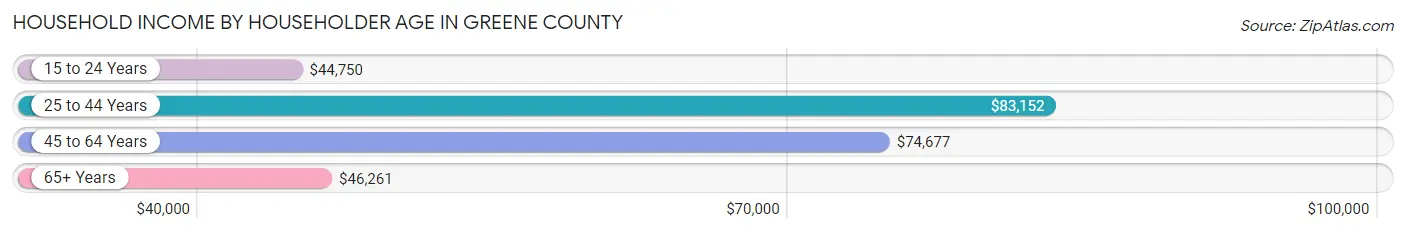
Household Income by Householder Age in Greene County
The median household income in Greene County is $66,283, with the highest median household income of $83,152 found in the 25 to 44 years age bracket for the primary householder. A total of 3,771 households (27.0%) fall into this category. Meanwhile, the 15 to 24 years age bracket for the primary householder has the lowest median household income of $44,750, with 422 households (3.0%) in this group.
| Income Bracket | # Households | Median Income |
| 15 to 24 Years | 422 (3.0%) | $44,750 |
| 25 to 44 Years | 3,771 (27.0%) | $83,152 |
| 45 to 64 Years | 5,267 (37.7%) | $74,677 |
| 65+ Years | 4,497 (32.2%) | $46,261 |
| Total | 13,957 (100.0%) | $66,283 |
Poverty in Greene County
Income Below Poverty by Sex and Age in Greene County
With 10.3% poverty level for males and 15.5% for females among the residents of Greene County, 15 year old males and 5 year old females are the most vulnerable to poverty, with 32 males (20.6%) and 69 females (46.9%) in their respective age groups living below the poverty level.
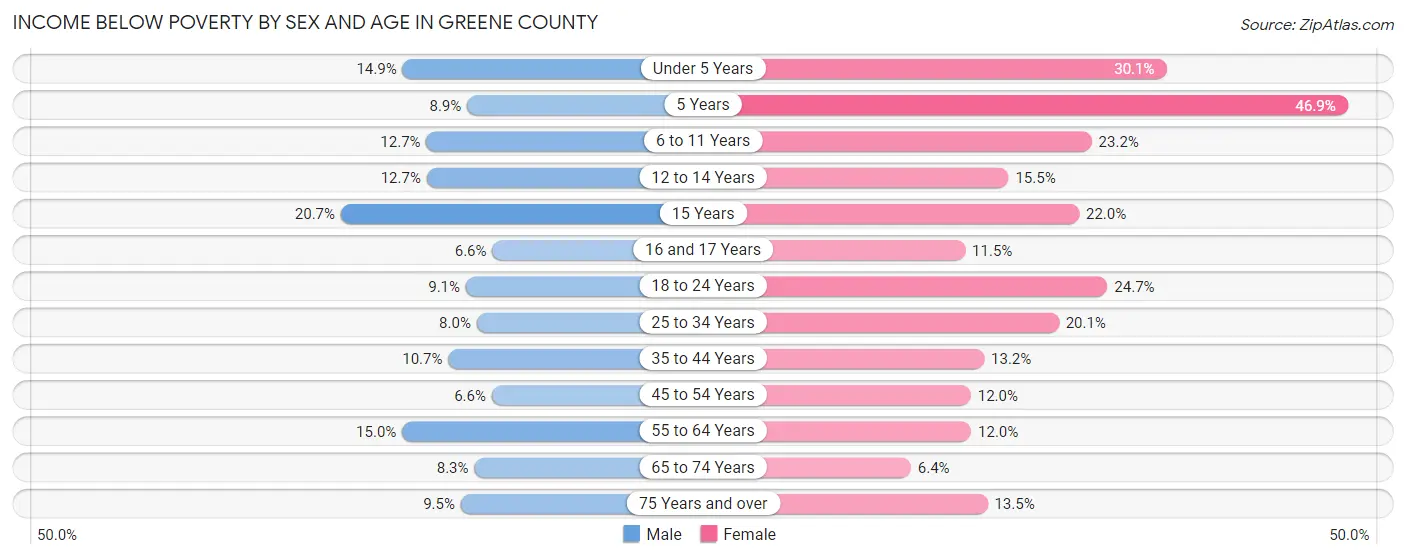
| Age Bracket | Male | Female |
| Under 5 Years | 136 (14.9%) | 249 (30.1%) |
| 5 Years | 15 (8.9%) | 69 (46.9%) |
| 6 to 11 Years | 141 (12.7%) | 247 (23.2%) |
| 12 to 14 Years | 88 (12.7%) | 88 (15.5%) |
| 15 Years | 32 (20.6%) | 48 (22.0%) |
| 16 and 17 Years | 34 (6.6%) | 45 (11.5%) |
| 18 to 24 Years | 112 (9.0%) | 263 (24.6%) |
| 25 to 34 Years | 162 (8.0%) | 367 (20.1%) |
| 35 to 44 Years | 195 (10.7%) | 248 (13.2%) |
| 45 to 54 Years | 149 (6.6%) | 260 (12.0%) |
| 55 to 64 Years | 350 (15.0%) | 301 (12.0%) |
| 65 to 74 Years | 168 (8.3%) | 134 (6.4%) |
| 75 Years and over | 104 (9.5%) | 203 (13.5%) |
| Total | 1,686 (10.3%) | 2,522 (15.5%) |
Income Above Poverty by Sex and Age in Greene County
According to the poverty statistics in Greene County, males aged 16 and 17 years and females aged 65 to 74 years are the age groups that are most secure financially, with 93.4% of males and 93.6% of females in these age groups living above the poverty line.
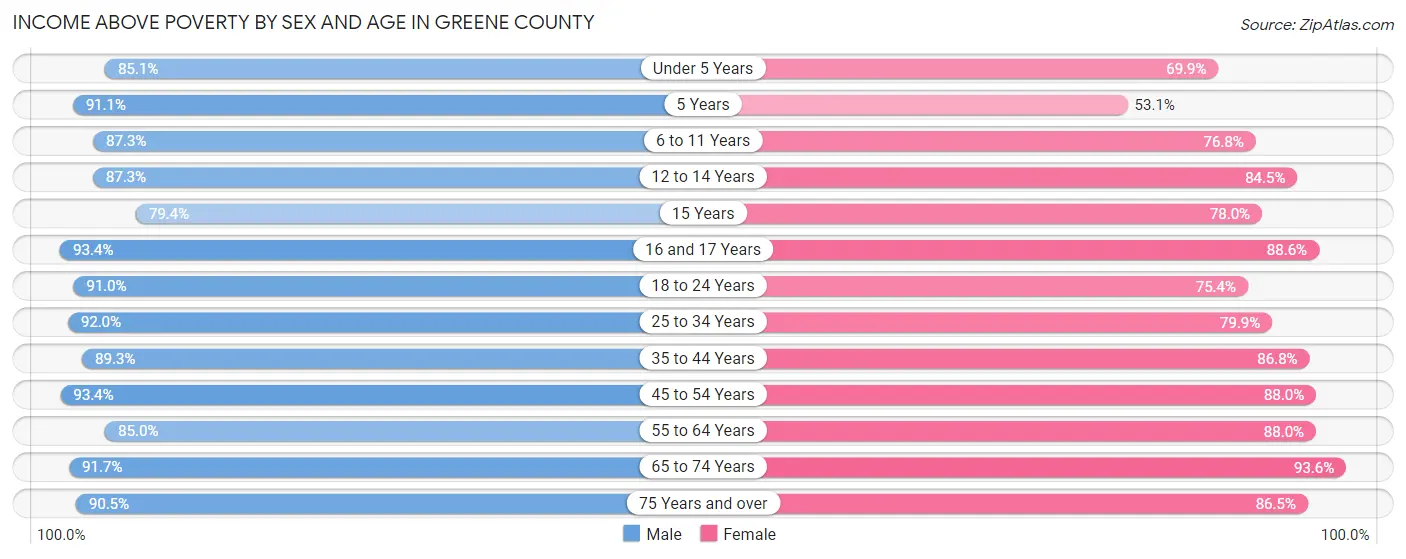
| Age Bracket | Male | Female |
| Under 5 Years | 775 (85.1%) | 578 (69.9%) |
| 5 Years | 153 (91.1%) | 78 (53.1%) |
| 6 to 11 Years | 968 (87.3%) | 818 (76.8%) |
| 12 to 14 Years | 606 (87.3%) | 481 (84.5%) |
| 15 Years | 123 (79.3%) | 170 (78.0%) |
| 16 and 17 Years | 482 (93.4%) | 348 (88.5%) |
| 18 to 24 Years | 1,126 (90.9%) | 804 (75.3%) |
| 25 to 34 Years | 1,854 (92.0%) | 1,456 (79.9%) |
| 35 to 44 Years | 1,630 (89.3%) | 1,630 (86.8%) |
| 45 to 54 Years | 2,096 (93.4%) | 1,912 (88.0%) |
| 55 to 64 Years | 1,990 (85.0%) | 2,207 (88.0%) |
| 65 to 74 Years | 1,867 (91.7%) | 1,957 (93.6%) |
| 75 Years and over | 988 (90.5%) | 1,299 (86.5%) |
| Total | 14,658 (89.7%) | 13,738 (84.5%) |
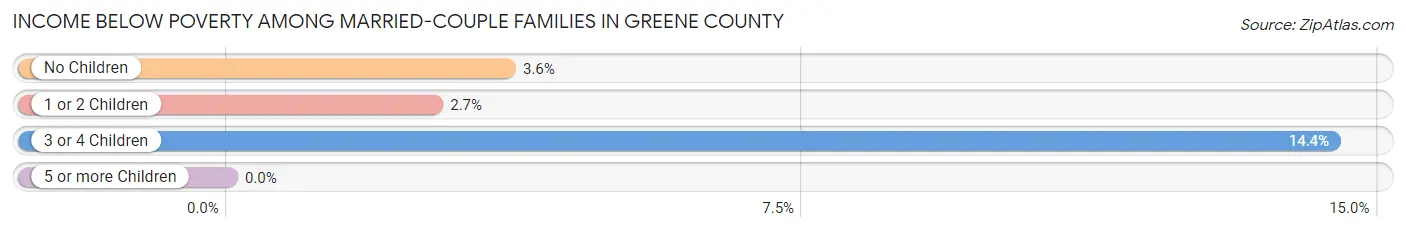
Income Below Poverty Among Married-Couple Families in Greene County
The poverty statistics for married-couple families in Greene County show that 4.1% or 293 of the total 7,082 families live below the poverty line. Families with 3 or 4 children have the highest poverty rate of 14.4%, comprising of 72 families. On the other hand, families with 5 or more children have the lowest poverty rate of 0.0%, which includes 0 families.
| Children | Above Poverty | Below Poverty |
| No Children | 4,614 (96.4%) | 174 (3.6%) |
| 1 or 2 Children | 1,704 (97.3%) | 47 (2.7%) |
| 3 or 4 Children | 428 (85.6%) | 72 (14.4%) |
| 5 or more Children | 43 (100.0%) | 0 (0.0%) |
| Total | 6,789 (95.9%) | 293 (4.1%) |
Income Below Poverty Among Single-Parent Households in Greene County
According to the poverty data in Greene County, 22.4% or 157 single-father households and 32.4% or 471 single-mother households are living below the poverty line. Among single-father households, those with 3 or 4 children have the highest poverty rate, with 44 households (41.5%) experiencing poverty. Likewise, among single-mother households, those with 5 or more children have the highest poverty rate, with 26 households (100.0%) falling below the poverty line.
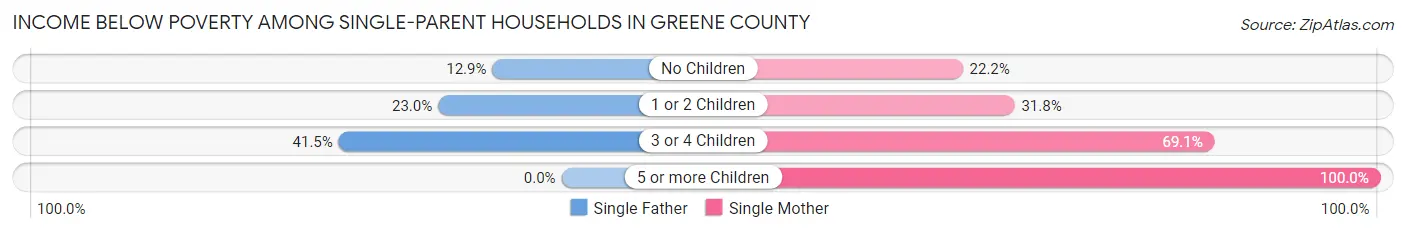
| Children | Single Father | Single Mother |
| No Children | 30 (12.9%) | 105 (22.2%) |
| 1 or 2 Children | 83 (23.0%) | 273 (31.8%) |
| 3 or 4 Children | 44 (41.5%) | 67 (69.1%) |
| 5 or more Children | 0 (0.0%) | 26 (100.0%) |
| Total | 157 (22.4%) | 471 (32.4%) |
Income Below Poverty Among Married-Couple vs Single-Parent Households in Greene County
The poverty data for Greene County shows that 293 of the married-couple family households (4.1%) and 628 of the single-parent households (29.1%) are living below the poverty level. Within the married-couple family households, those with 3 or 4 children have the highest poverty rate, with 72 households (14.4%) falling below the poverty line. Among the single-parent households, those with 5 or more children have the highest poverty rate, with 26 household (100.0%) living below poverty.
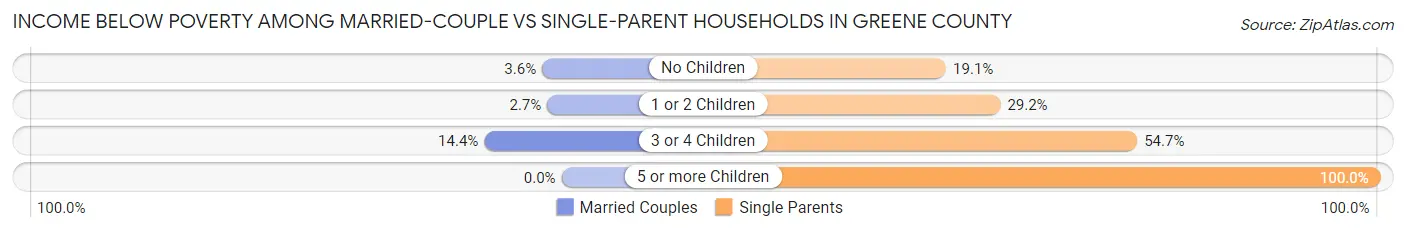
| Children | Married-Couple Families | Single-Parent Households |
| No Children | 174 (3.6%) | 135 (19.1%) |
| 1 or 2 Children | 47 (2.7%) | 356 (29.2%) |
| 3 or 4 Children | 72 (14.4%) | 111 (54.7%) |
| 5 or more Children | 0 (0.0%) | 26 (100.0%) |
| Total | 293 (4.1%) | 628 (29.1%) |
Race in Greene County
The most populous races in Greene County are White / Caucasian (33,087 | 92.5%), Two or more Races (1,503 | 4.2%), and Black / African American (979 | 2.7%).
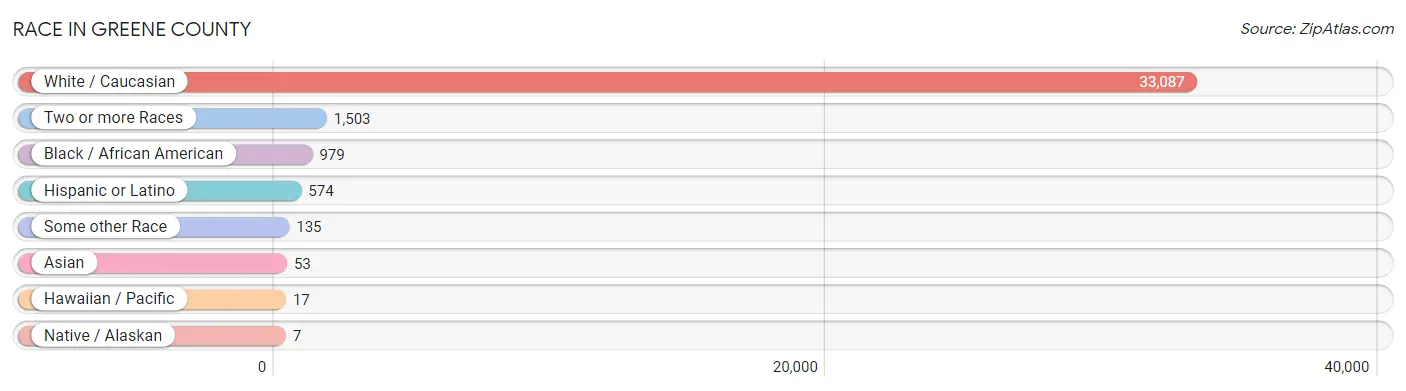
| Race | # Population | % Population |
| Asian | 53 | 0.2% |
| Black / African American | 979 | 2.7% |
| Hawaiian / Pacific | 17 | 0.1% |
| Hispanic or Latino | 574 | 1.6% |
| Native / Alaskan | 7 | 0.0% |
| White / Caucasian | 33,087 | 92.5% |
| Two or more Races | 1,503 | 4.2% |
| Some other Race | 135 | 0.4% |
| Total | 35,781 | 100.0% |
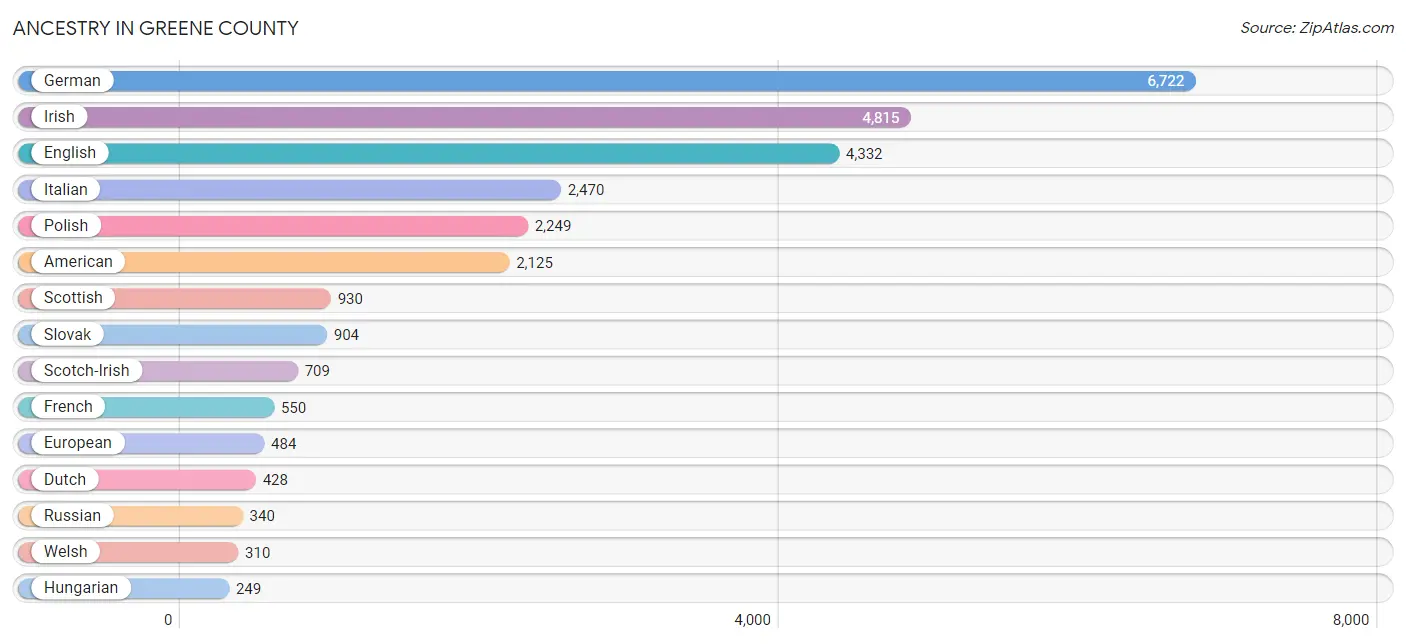
Ancestry in Greene County
The most populous ancestries reported in Greene County are German (6,722 | 18.8%), Irish (4,815 | 13.5%), English (4,332 | 12.1%), Italian (2,470 | 6.9%), and Polish (2,249 | 6.3%), together accounting for 57.5% of all Greene County residents.
| Ancestry | # Population | % Population |
| African | 73 | 0.2% |
| American | 2,125 | 5.9% |
| Apache | 7 | 0.0% |
| Arab | 81 | 0.2% |
| Argentinean | 5 | 0.0% |
| Australian | 3 | 0.0% |
| Austrian | 30 | 0.1% |
| Belgian | 9 | 0.0% |
| Bhutanese | 108 | 0.3% |
| Blackfeet | 5 | 0.0% |
| British | 140 | 0.4% |
| Burmese | 7 | 0.0% |
| Carpatho Rusyn | 3 | 0.0% |
| Central American | 3 | 0.0% |
| Cherokee | 100 | 0.3% |
| Cheyenne | 5 | 0.0% |
| Chippewa | 1 | 0.0% |
| Colombian | 39 | 0.1% |
| Croatian | 152 | 0.4% |
| Cuban | 52 | 0.2% |
| Czech | 226 | 0.6% |
| Czechoslovakian | 88 | 0.3% |
| Dominican | 2 | 0.0% |
| Dutch | 428 | 1.2% |
| Eastern European | 111 | 0.3% |
| English | 4,332 | 12.1% |
| European | 484 | 1.3% |
| Finnish | 7 | 0.0% |
| French | 550 | 1.5% |
| French Canadian | 4 | 0.0% |
| German | 6,722 | 18.8% |
| Greek | 103 | 0.3% |
| Guatemalan | 3 | 0.0% |
| Haitian | 71 | 0.2% |
| Hungarian | 249 | 0.7% |
| Indian (Asian) | 37 | 0.1% |
| Irish | 4,815 | 13.5% |
| Iroquois | 15 | 0.0% |
| Italian | 2,470 | 6.9% |
| Jamaican | 24 | 0.1% |
| Korean | 31 | 0.1% |
| Lebanese | 48 | 0.1% |
| Lithuanian | 51 | 0.1% |
| Mexican | 120 | 0.3% |
| Native Hawaiian | 21 | 0.1% |
| Northern European | 4 | 0.0% |
| Norwegian | 22 | 0.1% |
| Paraguayan | 14 | 0.0% |
| Pennsylvania German | 163 | 0.5% |
| Peruvian | 8 | 0.0% |
| Polish | 2,249 | 6.3% |
| Portuguese | 4 | 0.0% |
| Puerto Rican | 165 | 0.5% |
| Romanian | 7 | 0.0% |
| Russian | 340 | 0.9% |
| Samoan | 21 | 0.1% |
| Scandinavian | 82 | 0.2% |
| Scotch-Irish | 709 | 2.0% |
| Scottish | 930 | 2.6% |
| Seminole | 28 | 0.1% |
| Serbian | 63 | 0.2% |
| Shoshone | 4 | 0.0% |
| Slavic | 39 | 0.1% |
| Slovak | 904 | 2.5% |
| Slovene | 123 | 0.3% |
| South American | 66 | 0.2% |
| South American Indian | 14 | 0.0% |
| Spaniard | 11 | 0.0% |
| Spanish | 17 | 0.1% |
| Spanish American Indian | 16 | 0.0% |
| Subsaharan African | 83 | 0.2% |
| Swedish | 96 | 0.3% |
| Swiss | 85 | 0.2% |
| Syrian | 33 | 0.1% |
| Tlingit-Haida | 10 | 0.0% |
| Trinidadian and Tobagonian | 2 | 0.0% |
| Ukrainian | 23 | 0.1% |
| Welsh | 310 | 0.9% |
| West Indian | 2 | 0.0% |
| Yugoslavian | 9 | 0.0% | View All 80 Rows |
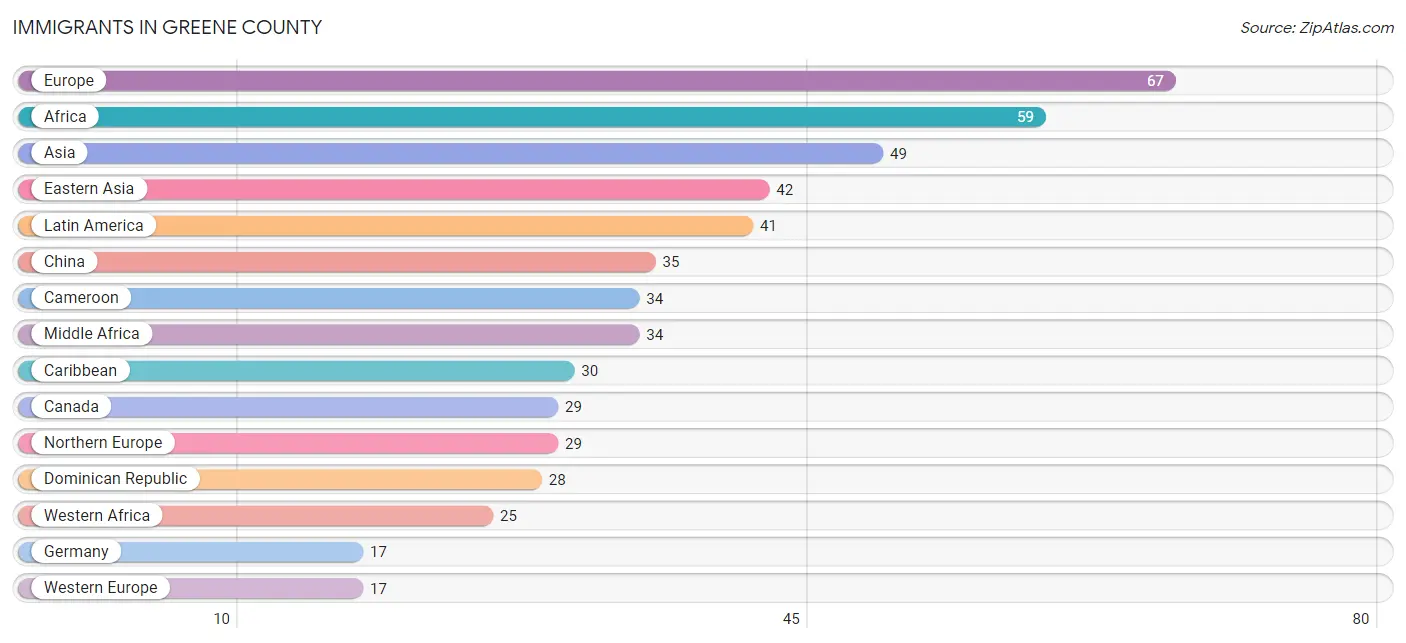
Immigrants in Greene County
The most numerous immigrant groups reported in Greene County came from Europe (67 | 0.2%), Africa (59 | 0.2%), Asia (49 | 0.1%), Eastern Asia (42 | 0.1%), and Latin America (41 | 0.1%), together accounting for 0.7% of all Greene County residents.
| Immigration Origin | # Population | % Population |
| Africa | 59 | 0.2% |
| Argentina | 2 | 0.0% |
| Asia | 49 | 0.1% |
| Cameroon | 34 | 0.1% |
| Canada | 29 | 0.1% |
| Caribbean | 30 | 0.1% |
| Central America | 7 | 0.0% |
| China | 35 | 0.1% |
| Dominican Republic | 28 | 0.1% |
| Eastern Asia | 42 | 0.1% |
| Eastern Europe | 14 | 0.0% |
| England | 12 | 0.0% |
| Europe | 67 | 0.2% |
| Germany | 17 | 0.1% |
| Haiti | 2 | 0.0% |
| Ireland | 4 | 0.0% |
| Italy | 4 | 0.0% |
| Korea | 7 | 0.0% |
| Latin America | 41 | 0.1% |
| Mexico | 7 | 0.0% |
| Middle Africa | 34 | 0.1% |
| Nepal | 1 | 0.0% |
| Northern Europe | 29 | 0.1% |
| Poland | 5 | 0.0% |
| Portugal | 3 | 0.0% |
| Romania | 1 | 0.0% |
| Russia | 8 | 0.0% |
| South America | 4 | 0.0% |
| South Central Asia | 7 | 0.0% |
| Southern Europe | 7 | 0.0% |
| Sweden | 13 | 0.0% |
| Western Africa | 25 | 0.1% |
| Western Europe | 17 | 0.1% | View All 33 Rows |
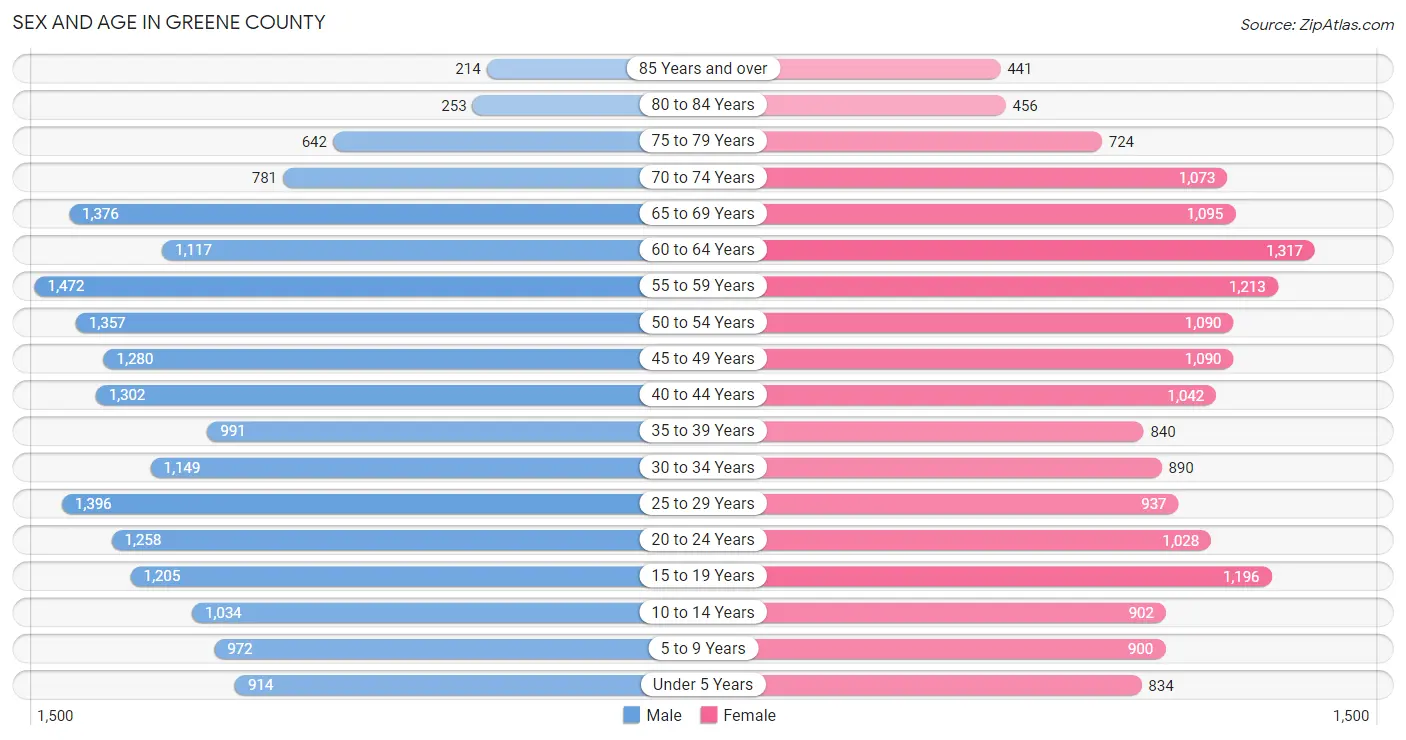
Sex and Age in Greene County
Sex and Age in Greene County
The most populous age groups in Greene County are 55 to 59 Years (1,472 | 7.9%) for men and 60 to 64 Years (1,317 | 7.7%) for women.
| Age Bracket | Male | Female |
| Under 5 Years | 914 (4.9%) | 834 (4.9%) |
| 5 to 9 Years | 972 (5.2%) | 900 (5.3%) |
| 10 to 14 Years | 1,034 (5.5%) | 902 (5.3%) |
| 15 to 19 Years | 1,205 (6.4%) | 1,196 (7.0%) |
| 20 to 24 Years | 1,258 (6.7%) | 1,028 (6.0%) |
| 25 to 29 Years | 1,396 (7.5%) | 937 (5.5%) |
| 30 to 34 Years | 1,149 (6.1%) | 890 (5.2%) |
| 35 to 39 Years | 991 (5.3%) | 840 (4.9%) |
| 40 to 44 Years | 1,302 (7.0%) | 1,042 (6.1%) |
| 45 to 49 Years | 1,280 (6.8%) | 1,090 (6.4%) |
| 50 to 54 Years | 1,357 (7.2%) | 1,090 (6.4%) |
| 55 to 59 Years | 1,472 (7.9%) | 1,213 (7.1%) |
| 60 to 64 Years | 1,117 (6.0%) | 1,317 (7.7%) |
| 65 to 69 Years | 1,376 (7.3%) | 1,095 (6.4%) |
| 70 to 74 Years | 781 (4.2%) | 1,073 (6.3%) |
| 75 to 79 Years | 642 (3.4%) | 724 (4.2%) |
| 80 to 84 Years | 253 (1.3%) | 456 (2.7%) |
| 85 Years and over | 214 (1.1%) | 441 (2.6%) |
| Total | 18,713 (100.0%) | 17,068 (100.0%) |
Families and Households in Greene County
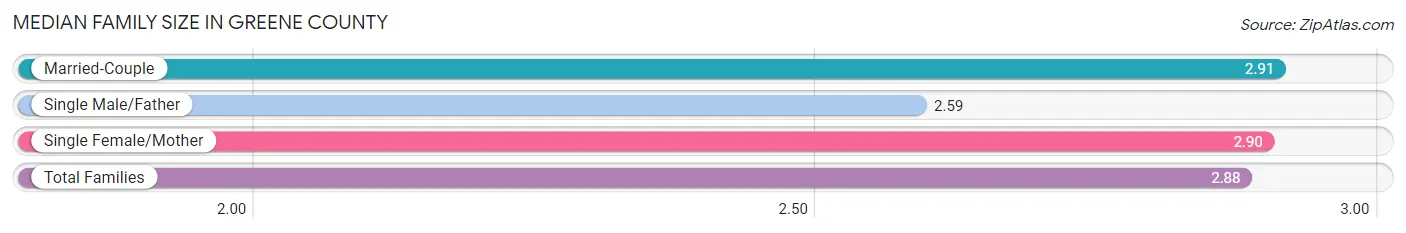
Median Family Size in Greene County
The median family size in Greene County is 2.88 persons per family, with married-couple families (7,082 | 76.7%) accounting for the largest median family size of 2.91 persons per family. On the other hand, single male/father families (700 | 7.6%) represent the smallest median family size with 2.59 persons per family.
| Family Type | # Families | Family Size |
| Married-Couple | 7,082 (76.7%) | 2.91 |
| Single Male/Father | 700 (7.6%) | 2.59 |
| Single Female/Mother | 1,455 (15.8%) | 2.90 |
| Total Families | 9,237 (100.0%) | 2.88 |
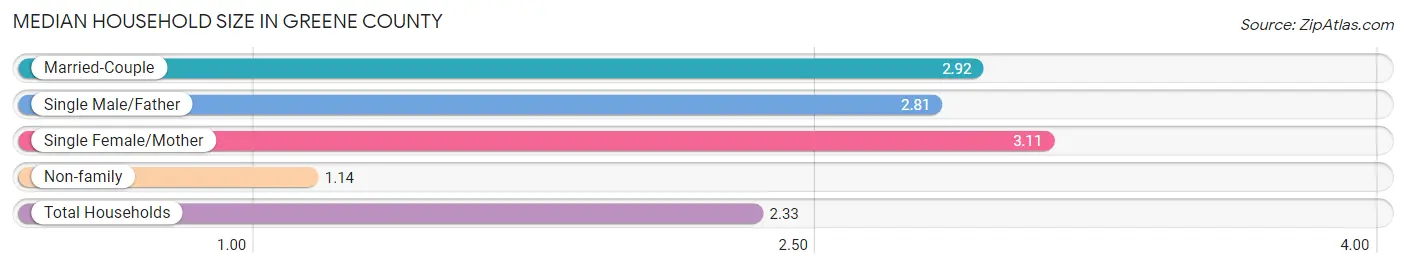
Median Household Size in Greene County
The median household size in Greene County is 2.33 persons per household, with single female/mother households (1,455 | 10.4%) accounting for the largest median household size of 3.11 persons per household. non-family households (4,720 | 33.8%) represent the smallest median household size with 1.14 persons per household.
| Household Type | # Households | Household Size |
| Married-Couple | 7,082 (50.7%) | 2.92 |
| Single Male/Father | 700 (5.0%) | 2.81 |
| Single Female/Mother | 1,455 (10.4%) | 3.11 |
| Non-family | 4,720 (33.8%) | 1.14 |
| Total Households | 13,957 (100.0%) | 2.33 |
Household Size by Marriage Status in Greene County
Out of a total of 13,957 households in Greene County, 9,237 (66.2%) are family households, while 4,720 (33.8%) are nonfamily households. The most numerous type of family households are 2-person households, comprising 4,620, and the most common type of nonfamily households are 1-person households, comprising 3,945.
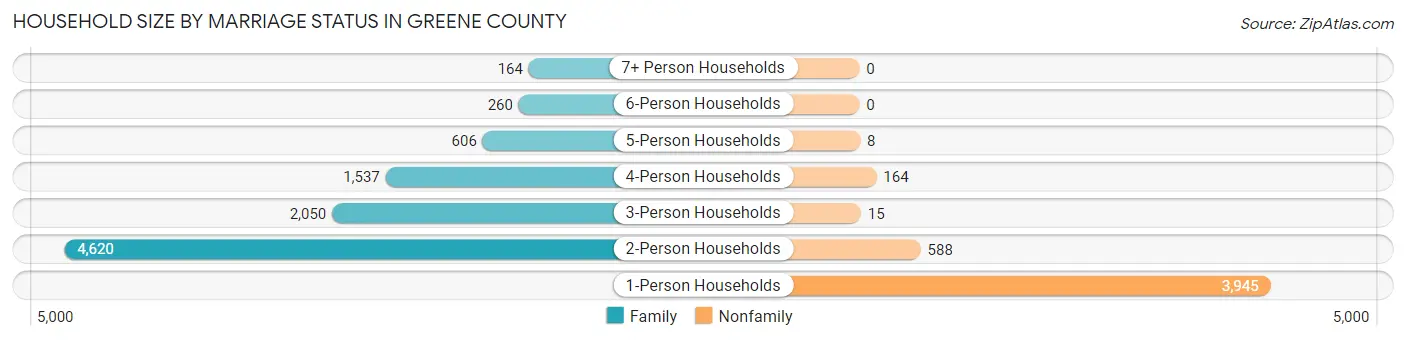
| Household Size | Family Households | Nonfamily Households |
| 1-Person Households | - | 3,945 (28.3%) |
| 2-Person Households | 4,620 (33.1%) | 588 (4.2%) |
| 3-Person Households | 2,050 (14.7%) | 15 (0.1%) |
| 4-Person Households | 1,537 (11.0%) | 164 (1.2%) |
| 5-Person Households | 606 (4.3%) | 8 (0.1%) |
| 6-Person Households | 260 (1.9%) | 0 (0.0%) |
| 7+ Person Households | 164 (1.2%) | 0 (0.0%) |
| Total | 9,237 (66.2%) | 4,720 (33.8%) |
Female Fertility in Greene County
Fertility by Age in Greene County
Average fertility rate in Greene County is 56.0 births per 1,000 women. Women in the age bracket of 20 to 34 years have the highest fertility rate with 132.0 births per 1,000 women. Women in the age bracket of 20 to 34 years acount for 91.5% of all women with births.
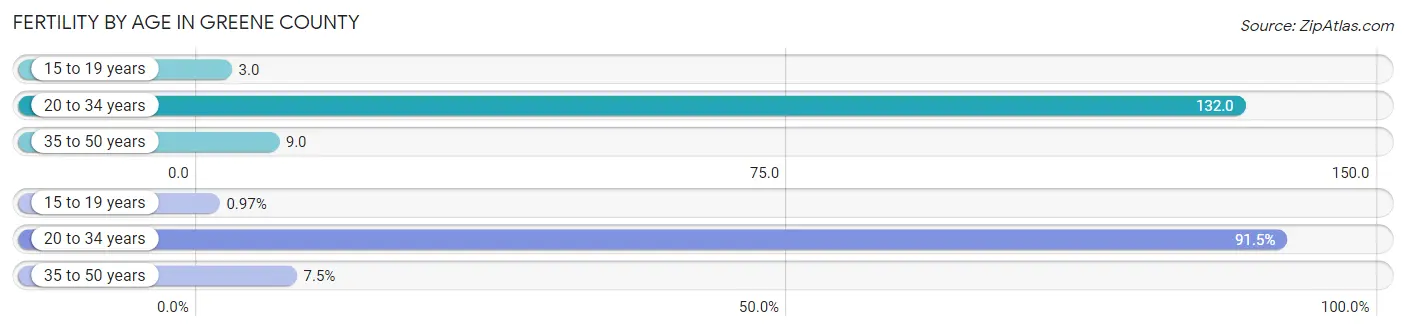
| Age Bracket | Women with Births | Births / 1,000 Women |
| 15 to 19 years | 4 (1.0%) | 3.0 |
| 20 to 34 years | 378 (91.5%) | 132.0 |
| 35 to 50 years | 31 (7.5%) | 9.0 |
| Total | 413 (100.0%) | 56.0 |
Fertility by Age by Marriage Status in Greene County
59.8% of women with births (413) in Greene County are married. The highest percentage of unmarried women with births falls into 15 to 19 years age bracket with 100.0% of them unmarried at the time of birth, while the lowest percentage of unmarried women with births belong to 20 to 34 years age bracket with 37.8% of them unmarried.
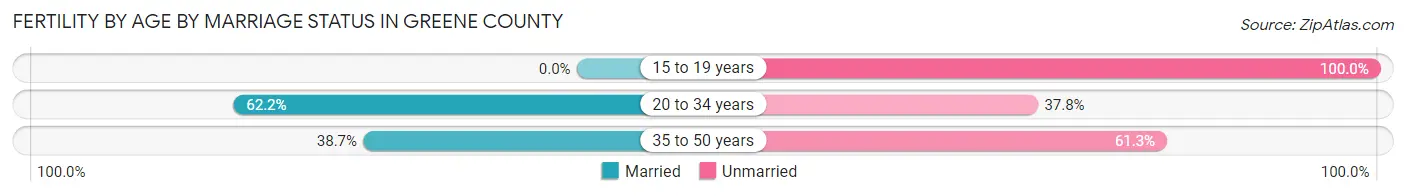
| Age Bracket | Married | Unmarried |
| 15 to 19 years | 0 (0.0%) | 4 (100.0%) |
| 20 to 34 years | 235 (62.2%) | 143 (37.8%) |
| 35 to 50 years | 12 (38.7%) | 19 (61.3%) |
| Total | 247 (59.8%) | 166 (40.2%) |
Fertility by Education in Greene County
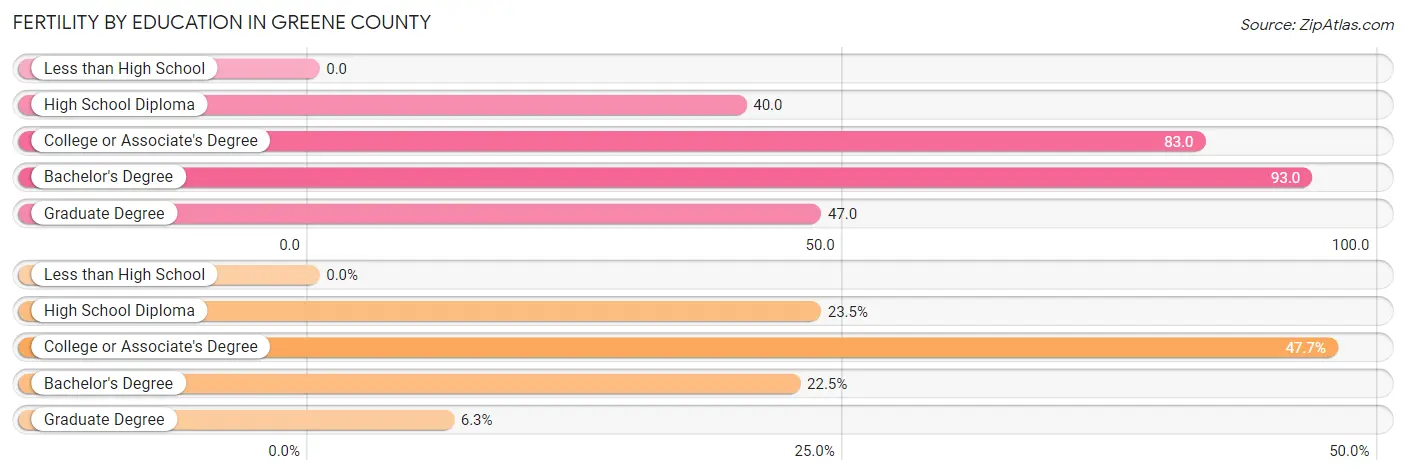
| Educational Attainment | Women with Births | Births / 1,000 Women |
| Less than High School | 0 (0.0%) | 0.0 |
| High School Diploma | 97 (23.5%) | 40.0 |
| College or Associate's Degree | 197 (47.7%) | 83.0 |
| Bachelor's Degree | 93 (22.5%) | 93.0 |
| Graduate Degree | 26 (6.3%) | 47.0 |
| Total | 413 (100.0%) | 56.0 |
Fertility by Education by Marriage Status in Greene County
40.2% of women with births in Greene County are unmarried. Women with the educational attainment of bachelor's degree are most likely to be married with 100.0% of them married at childbirth, while women with the educational attainment of high school diploma are least likely to be married with 76.3% of them unmarried at childbirth.
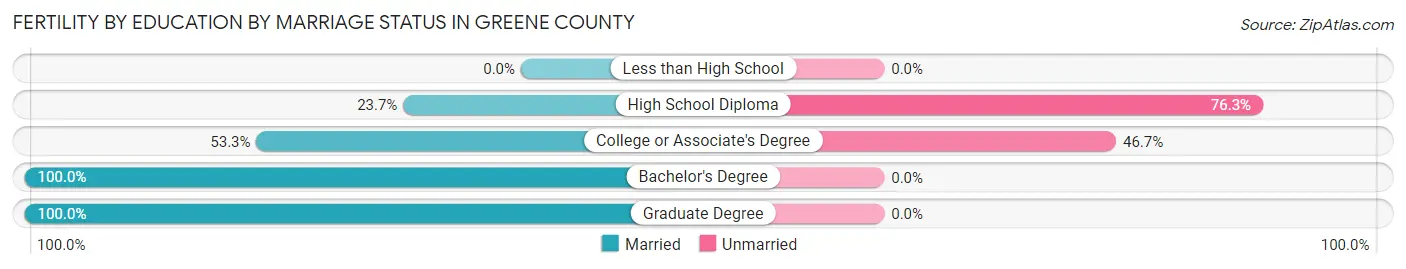
| Educational Attainment | Married | Unmarried |
| Less than High School | 0 (0.0%) | 0 (0.0%) |
| High School Diploma | 23 (23.7%) | 74 (76.3%) |
| College or Associate's Degree | 105 (53.3%) | 92 (46.7%) |
| Bachelor's Degree | 93 (100.0%) | 0 (0.0%) |
| Graduate Degree | 26 (100.0%) | 0 (0.0%) |
| Total | 247 (59.8%) | 166 (40.2%) |
Employment Characteristics in Greene County
Employment by Class of Employer in Greene County
Among the 13,771 employed individuals in Greene County, private company employees (9,115 | 66.2%), not-for-profit organizations (1,430 | 10.4%), and local government employees (1,107 | 8.0%) make up the most common classes of employment.
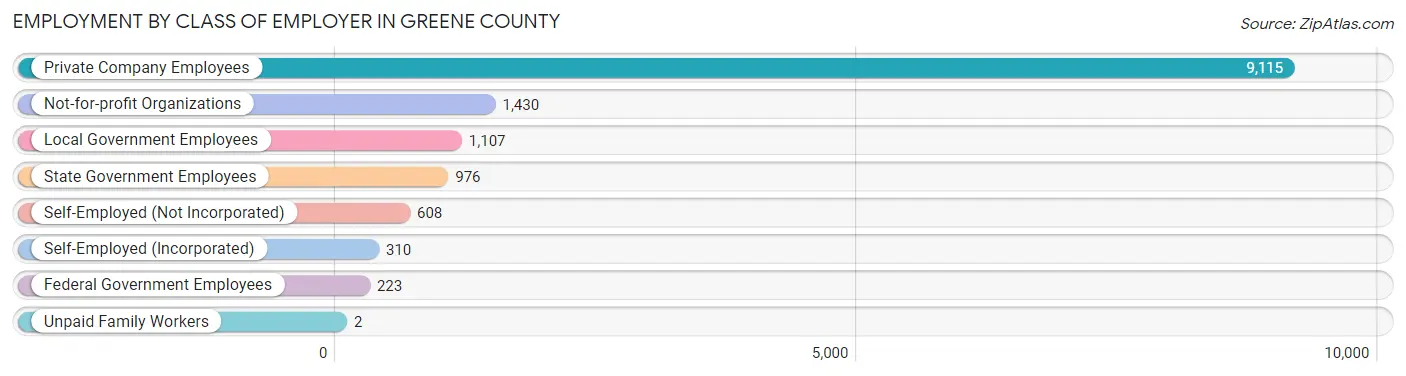
| Employer Class | # Employees | % Employees |
| Private Company Employees | 9,115 | 66.2% |
| Self-Employed (Incorporated) | 310 | 2.2% |
| Self-Employed (Not Incorporated) | 608 | 4.4% |
| Not-for-profit Organizations | 1,430 | 10.4% |
| Local Government Employees | 1,107 | 8.0% |
| State Government Employees | 976 | 7.1% |
| Federal Government Employees | 223 | 1.6% |
| Unpaid Family Workers | 2 | 0.0% |
| Total | 13,771 | 100.0% |
Employment Status by Age in Greene County
According to the labor force statistics for Greene County, out of the total population over 16 years of age (29,852), 50.3% or 15,016 individuals are in the labor force, with 5.2% or 781 of them unemployed. The age group with the highest labor force participation rate is 25 to 29 years, with 71.6% or 1,670 individuals in the labor force. Within the labor force, the 16 to 19 years age range has the highest percentage of unemployed individuals, with 14.3% or 116 of them being unemployed.
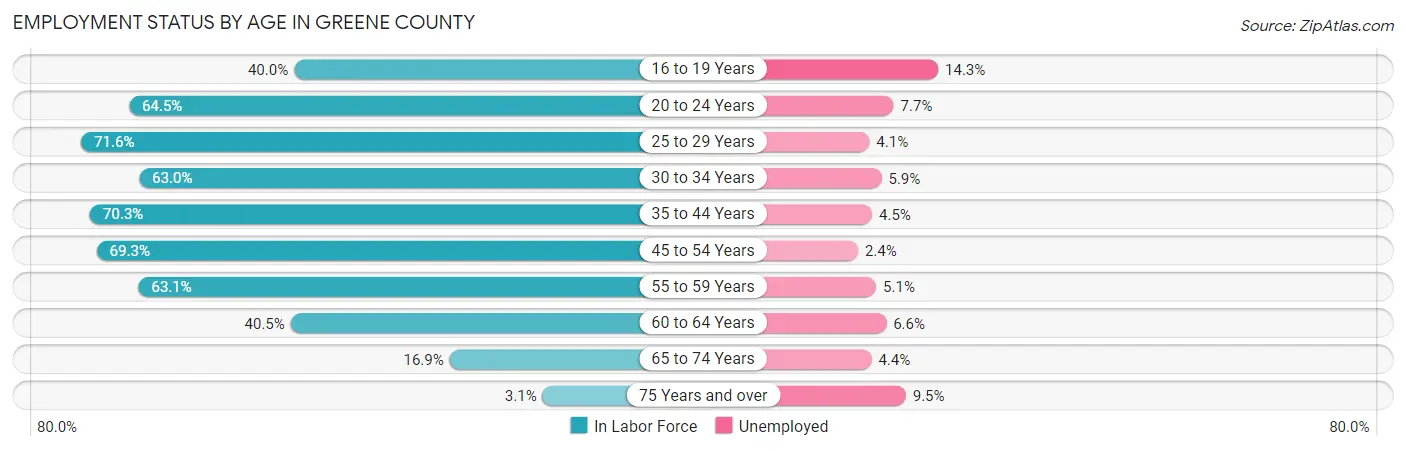
| Age Bracket | In Labor Force | Unemployed |
| 16 to 19 Years | 811 (40.0%) | 116 (14.3%) |
| 20 to 24 Years | 1,474 (64.5%) | 113 (7.7%) |
| 25 to 29 Years | 1,670 (71.6%) | 68 (4.1%) |
| 30 to 34 Years | 1,285 (63.0%) | 76 (5.9%) |
| 35 to 44 Years | 2,935 (70.3%) | 132 (4.5%) |
| 45 to 54 Years | 3,338 (69.3%) | 80 (2.4%) |
| 55 to 59 Years | 1,694 (63.1%) | 86 (5.1%) |
| 60 to 64 Years | 986 (40.5%) | 65 (6.6%) |
| 65 to 74 Years | 731 (16.9%) | 32 (4.4%) |
| 75 Years and over | 85 (3.1%) | 8 (9.5%) |
| Total | 15,016 (50.3%) | 781 (5.2%) |
Employment Status by Educational Attainment in Greene County
According to labor force statistics for Greene County, 64.4% of individuals (11,903) out of the total population between 25 and 64 years of age (18,483) are in the labor force, with 4.3% or 512 of them being unemployed. The group with the highest labor force participation rate are those with the educational attainment of bachelor's degree or higher, with 88.7% or 3,435 individuals in the labor force. Within the labor force, individuals with less than high school education have the highest percentage of unemployment, with 6.2% or 37 of them being unemployed.
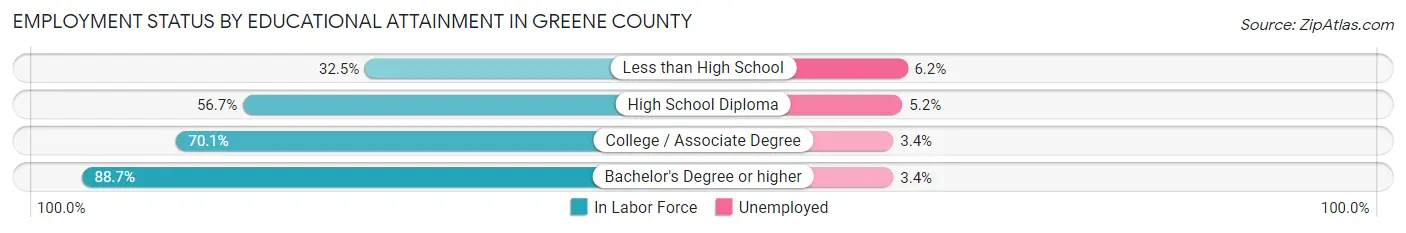
| Educational Attainment | In Labor Force | Unemployed |
| Less than High School | 595 (32.5%) | 113 (6.2%) |
| High School Diploma | 4,565 (56.7%) | 419 (5.2%) |
| College / Associate Degree | 3,314 (70.1%) | 161 (3.4%) |
| Bachelor's Degree or higher | 3,435 (88.7%) | 132 (3.4%) |
| Total | 11,903 (64.4%) | 795 (4.3%) |
Employment Occupations by Sex in Greene County
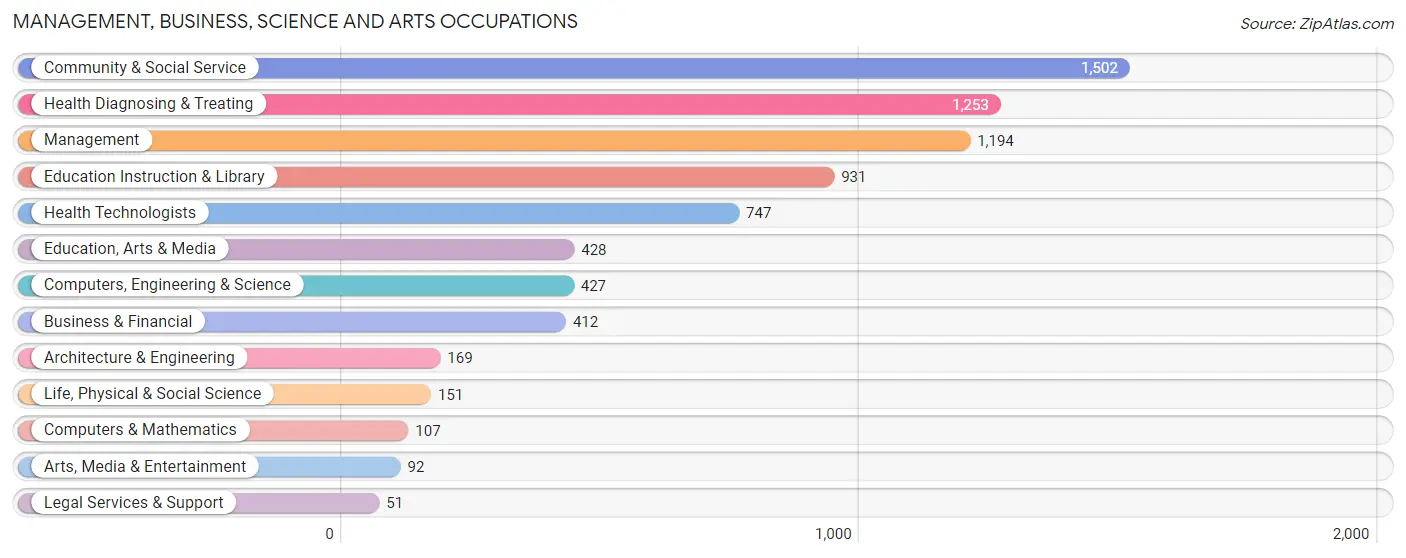
Management, Business, Science and Arts Occupations
The most common Management, Business, Science and Arts occupations in Greene County are Community & Social Service (1,502 | 10.6%), Health Diagnosing & Treating (1,253 | 8.8%), Management (1,194 | 8.4%), Education Instruction & Library (931 | 6.6%), and Health Technologists (747 | 5.2%).
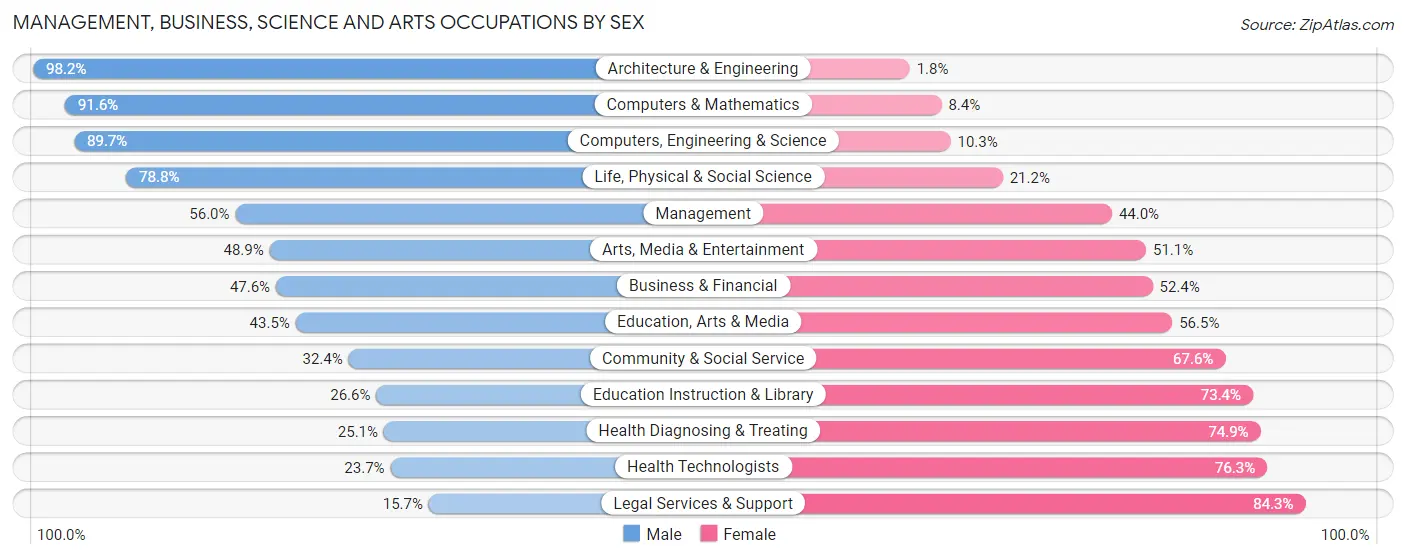
Management, Business, Science and Arts Occupations by Sex
Within the Management, Business, Science and Arts occupations in Greene County, the most male-oriented occupations are Architecture & Engineering (98.2%), Computers & Mathematics (91.6%), and Computers, Engineering & Science (89.7%), while the most female-oriented occupations are Legal Services & Support (84.3%), Health Technologists (76.3%), and Health Diagnosing & Treating (74.9%).
| Occupation | Male | Female |
| Management | 669 (56.0%) | 525 (44.0%) |
| Business & Financial | 196 (47.6%) | 216 (52.4%) |
| Computers, Engineering & Science | 383 (89.7%) | 44 (10.3%) |
| Computers & Mathematics | 98 (91.6%) | 9 (8.4%) |
| Architecture & Engineering | 166 (98.2%) | 3 (1.8%) |
| Life, Physical & Social Science | 119 (78.8%) | 32 (21.2%) |
| Community & Social Service | 487 (32.4%) | 1,015 (67.6%) |
| Education, Arts & Media | 186 (43.5%) | 242 (56.5%) |
| Legal Services & Support | 8 (15.7%) | 43 (84.3%) |
| Education Instruction & Library | 248 (26.6%) | 683 (73.4%) |
| Arts, Media & Entertainment | 45 (48.9%) | 47 (51.1%) |
| Health Diagnosing & Treating | 314 (25.1%) | 939 (74.9%) |
| Health Technologists | 177 (23.7%) | 570 (76.3%) |
| Total (Category) | 2,049 (42.8%) | 2,739 (57.2%) |
| Total (Overall) | 7,551 (53.1%) | 6,672 (46.9%) |
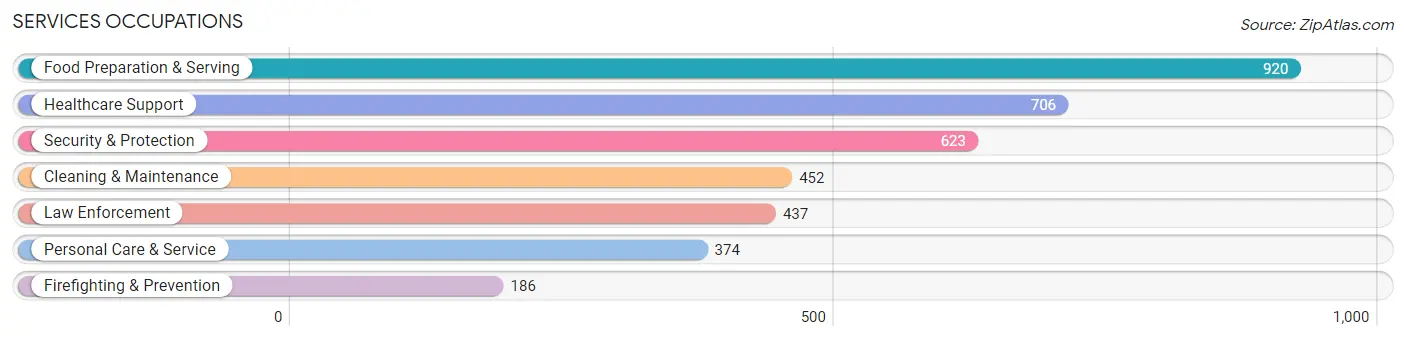
Services Occupations
The most common Services occupations in Greene County are Food Preparation & Serving (920 | 6.5%), Healthcare Support (706 | 5.0%), Security & Protection (623 | 4.4%), Cleaning & Maintenance (452 | 3.2%), and Law Enforcement (437 | 3.1%).
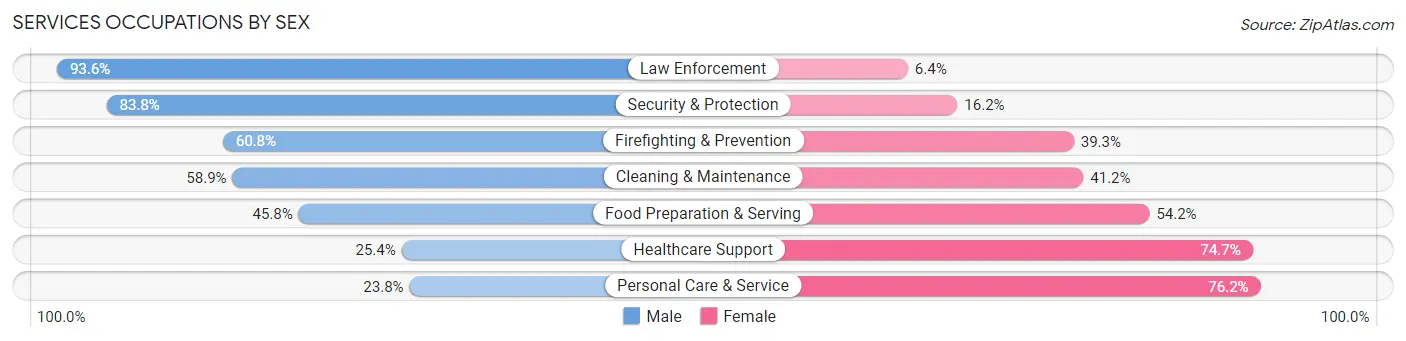
Services Occupations by Sex
Within the Services occupations in Greene County, the most male-oriented occupations are Law Enforcement (93.6%), Security & Protection (83.8%), and Firefighting & Prevention (60.8%), while the most female-oriented occupations are Personal Care & Service (76.2%), Healthcare Support (74.7%), and Food Preparation & Serving (54.2%).
| Occupation | Male | Female |
| Healthcare Support | 179 (25.4%) | 527 (74.7%) |
| Security & Protection | 522 (83.8%) | 101 (16.2%) |
| Firefighting & Prevention | 113 (60.8%) | 73 (39.3%) |
| Law Enforcement | 409 (93.6%) | 28 (6.4%) |
| Food Preparation & Serving | 421 (45.8%) | 499 (54.2%) |
| Cleaning & Maintenance | 266 (58.9%) | 186 (41.1%) |
| Personal Care & Service | 89 (23.8%) | 285 (76.2%) |
| Total (Category) | 1,477 (48.0%) | 1,598 (52.0%) |
| Total (Overall) | 7,551 (53.1%) | 6,672 (46.9%) |
Sales and Office Occupations
The most common Sales and Office occupations in Greene County are Office & Administration (1,535 | 10.8%), and Sales & Related (1,090 | 7.7%).

Sales and Office Occupations by Sex
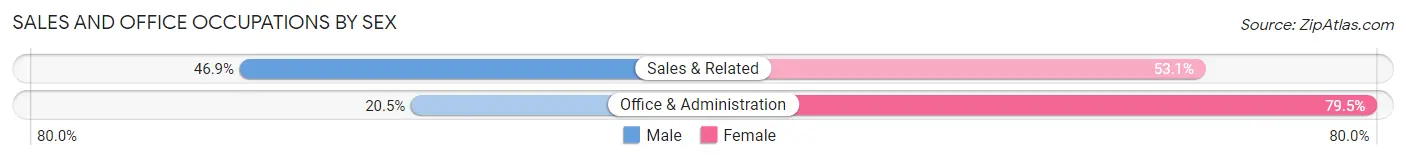
| Occupation | Male | Female |
| Sales & Related | 511 (46.9%) | 579 (53.1%) |
| Office & Administration | 315 (20.5%) | 1,220 (79.5%) |
| Total (Category) | 826 (31.5%) | 1,799 (68.5%) |
| Total (Overall) | 7,551 (53.1%) | 6,672 (46.9%) |
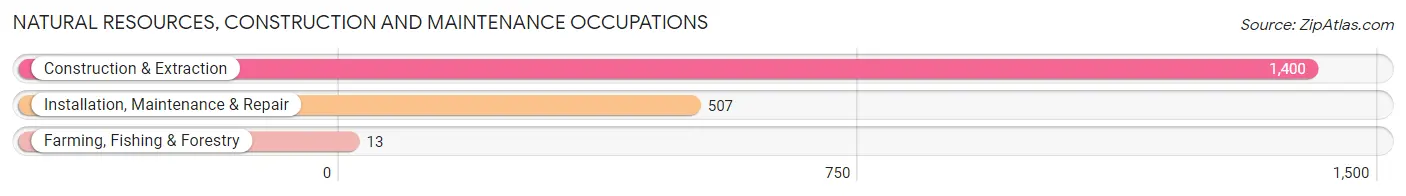
Natural Resources, Construction and Maintenance Occupations
The most common Natural Resources, Construction and Maintenance occupations in Greene County are Construction & Extraction (1,400 | 9.8%), Installation, Maintenance & Repair (507 | 3.6%), and Farming, Fishing & Forestry (13 | 0.1%).
Natural Resources, Construction and Maintenance Occupations by Sex
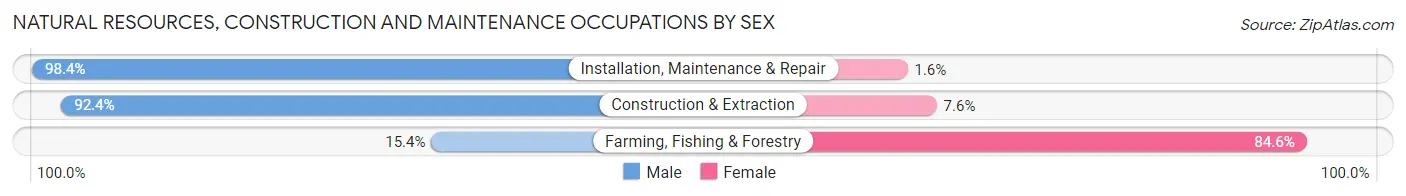
| Occupation | Male | Female |
| Farming, Fishing & Forestry | 2 (15.4%) | 11 (84.6%) |
| Construction & Extraction | 1,293 (92.4%) | 107 (7.6%) |
| Installation, Maintenance & Repair | 499 (98.4%) | 8 (1.6%) |
| Total (Category) | 1,794 (93.4%) | 126 (6.6%) |
| Total (Overall) | 7,551 (53.1%) | 6,672 (46.9%) |
Production, Transportation and Moving Occupations
The most common Production, Transportation and Moving occupations in Greene County are Material Moving (644 | 4.5%), Production (627 | 4.4%), and Transportation (544 | 3.8%).
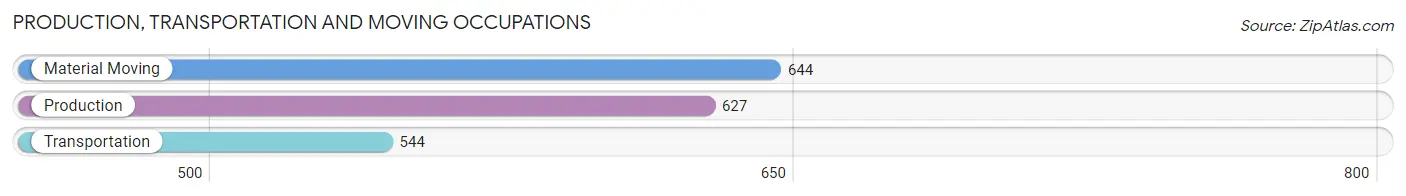
Production, Transportation and Moving Occupations by Sex
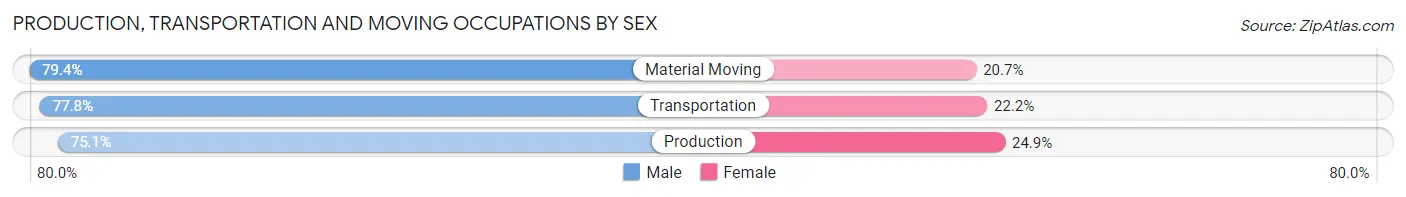
| Occupation | Male | Female |
| Production | 471 (75.1%) | 156 (24.9%) |
| Transportation | 423 (77.8%) | 121 (22.2%) |
| Material Moving | 511 (79.3%) | 133 (20.6%) |
| Total (Category) | 1,405 (77.4%) | 410 (22.6%) |
| Total (Overall) | 7,551 (53.1%) | 6,672 (46.9%) |
Employment Industries by Sex in Greene County
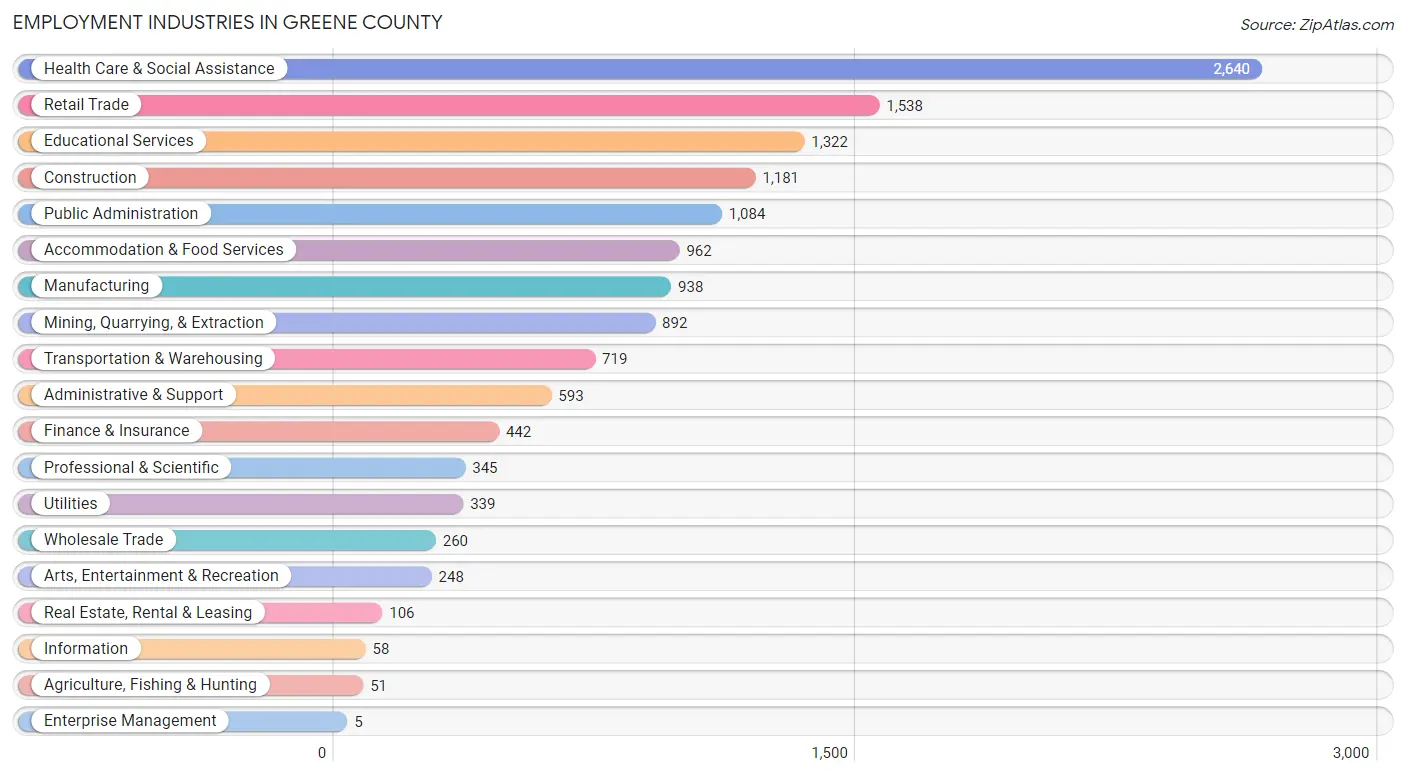
Employment Industries in Greene County
The major employment industries in Greene County include Health Care & Social Assistance (2,640 | 18.6%), Retail Trade (1,538 | 10.8%), Educational Services (1,322 | 9.3%), Construction (1,181 | 8.3%), and Public Administration (1,084 | 7.6%).
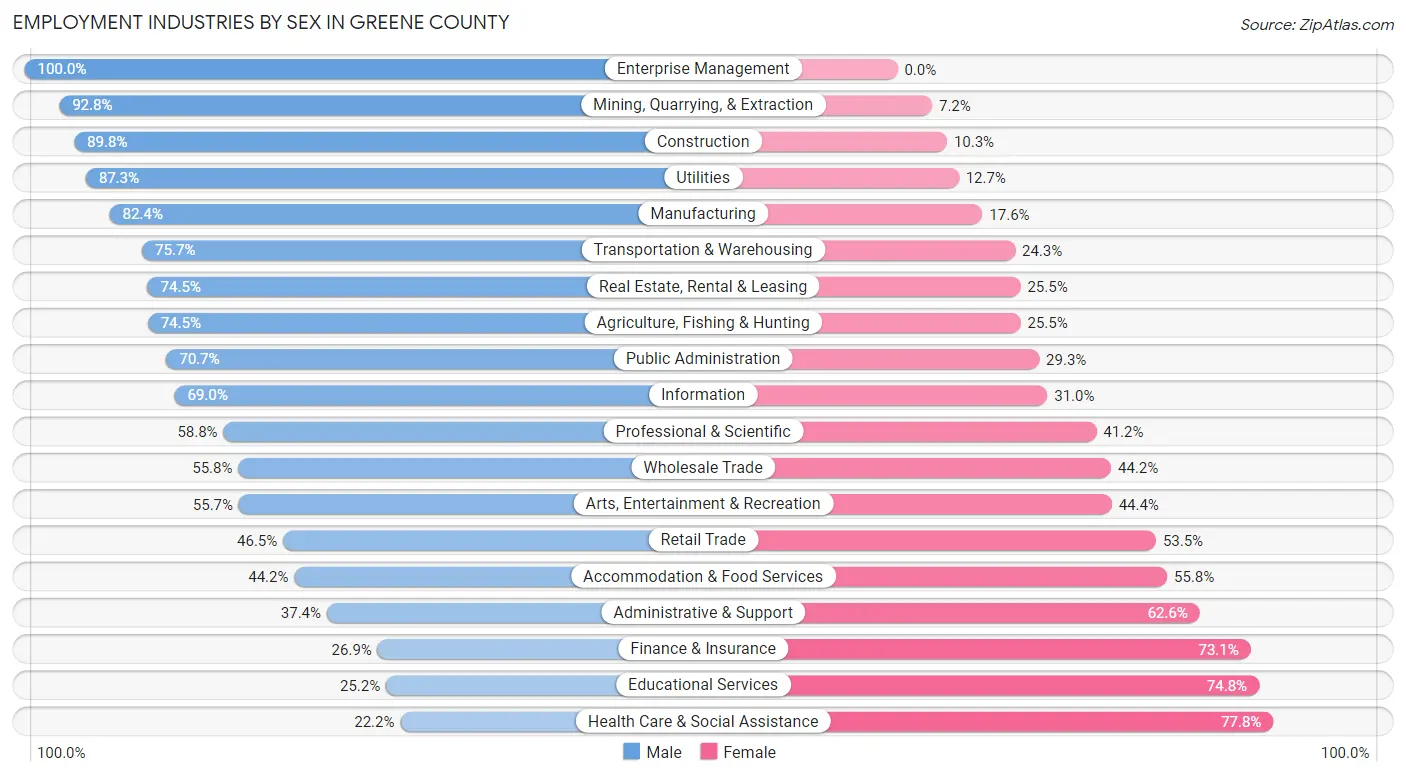
Employment Industries by Sex in Greene County
The Greene County industries that see more men than women are Enterprise Management (100.0%), Mining, Quarrying, & Extraction (92.8%), and Construction (89.7%), whereas the industries that tend to have a higher number of women are Health Care & Social Assistance (77.8%), Educational Services (74.8%), and Finance & Insurance (73.1%).
| Industry | Male | Female |
| Agriculture, Fishing & Hunting | 38 (74.5%) | 13 (25.5%) |
| Mining, Quarrying, & Extraction | 828 (92.8%) | 64 (7.2%) |
| Construction | 1,060 (89.7%) | 121 (10.2%) |
| Manufacturing | 773 (82.4%) | 165 (17.6%) |
| Wholesale Trade | 145 (55.8%) | 115 (44.2%) |
| Retail Trade | 715 (46.5%) | 823 (53.5%) |
| Transportation & Warehousing | 544 (75.7%) | 175 (24.3%) |
| Utilities | 296 (87.3%) | 43 (12.7%) |
| Information | 40 (69.0%) | 18 (31.0%) |
| Finance & Insurance | 119 (26.9%) | 323 (73.1%) |
| Real Estate, Rental & Leasing | 79 (74.5%) | 27 (25.5%) |
| Professional & Scientific | 203 (58.8%) | 142 (41.2%) |
| Enterprise Management | 5 (100.0%) | 0 (0.0%) |
| Administrative & Support | 222 (37.4%) | 371 (62.6%) |
| Educational Services | 333 (25.2%) | 989 (74.8%) |
| Health Care & Social Assistance | 587 (22.2%) | 2,053 (77.8%) |
| Arts, Entertainment & Recreation | 138 (55.6%) | 110 (44.4%) |
| Accommodation & Food Services | 425 (44.2%) | 537 (55.8%) |
| Public Administration | 766 (70.7%) | 318 (29.3%) |
| Total | 7,551 (53.1%) | 6,672 (46.9%) |
Education in Greene County
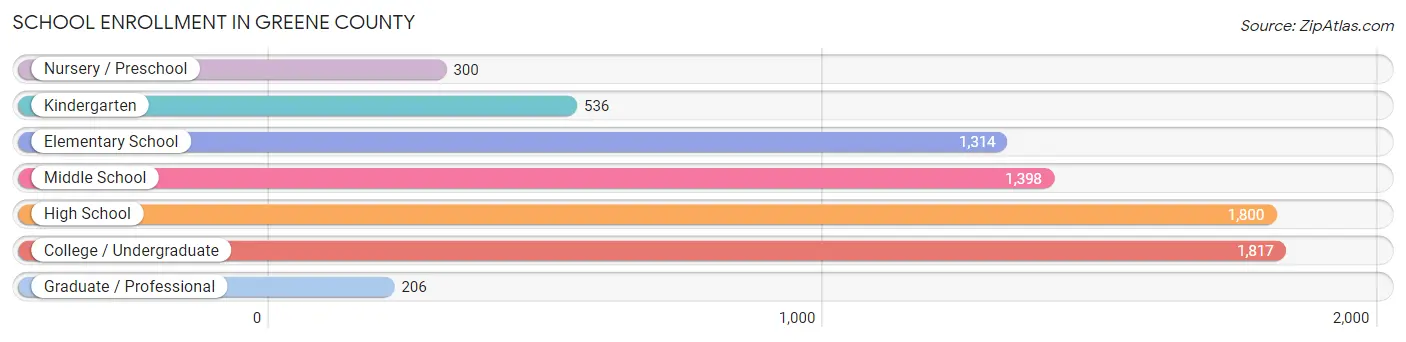
School Enrollment in Greene County
The most common levels of schooling among the 7,371 students in Greene County are college / undergraduate (1,817 | 24.6%), high school (1,800 | 24.4%), and middle school (1,398 | 19.0%).
| School Level | # Students | % Students |
| Nursery / Preschool | 300 | 4.1% |
| Kindergarten | 536 | 7.3% |
| Elementary School | 1,314 | 17.8% |
| Middle School | 1,398 | 19.0% |
| High School | 1,800 | 24.4% |
| College / Undergraduate | 1,817 | 24.6% |
| Graduate / Professional | 206 | 2.8% |
| Total | 7,371 | 100.0% |
School Enrollment by Age by Funding Source in Greene County
Out of a total of 7,371 students who are enrolled in schools in Greene County, 1,916 (26.0%) attend a private institution, while the remaining 5,455 (74.0%) are enrolled in public schools. The age group of 18 to 19 year olds has the highest likelihood of being enrolled in private schools, with 667 (68.4% in the age bracket) enrolled. Conversely, the age group of 25 to 34 year olds has the lowest likelihood of being enrolled in a private school, with 164 (93.2% in the age bracket) attending a public institution.
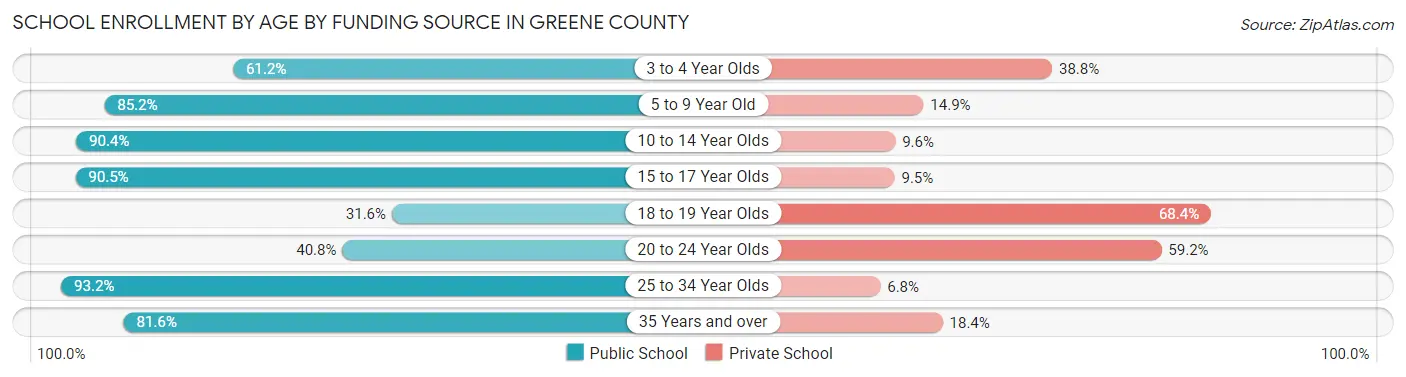
| Age Bracket | Public School | Private School |
| 3 to 4 Year Olds | 156 (61.2%) | 99 (38.8%) |
| 5 to 9 Year Old | 1,462 (85.2%) | 255 (14.8%) |
| 10 to 14 Year Olds | 1,705 (90.4%) | 181 (9.6%) |
| 15 to 17 Year Olds | 1,099 (90.5%) | 115 (9.5%) |
| 18 to 19 Year Olds | 308 (31.6%) | 667 (68.4%) |
| 20 to 24 Year Olds | 380 (40.8%) | 551 (59.2%) |
| 25 to 34 Year Olds | 164 (93.2%) | 12 (6.8%) |
| 35 Years and over | 177 (81.6%) | 40 (18.4%) |
| Total | 5,455 (74.0%) | 1,916 (26.0%) |
Educational Attainment by Field of Study in Greene County
Education (1,422 | 24.5%), science & technology (897 | 15.5%), business (742 | 12.8%), arts & humanities (705 | 12.2%), and bio, nature & agricultural (482 | 8.3%) are the most common fields of study among 5,797 individuals in Greene County who have obtained a bachelor's degree or higher.
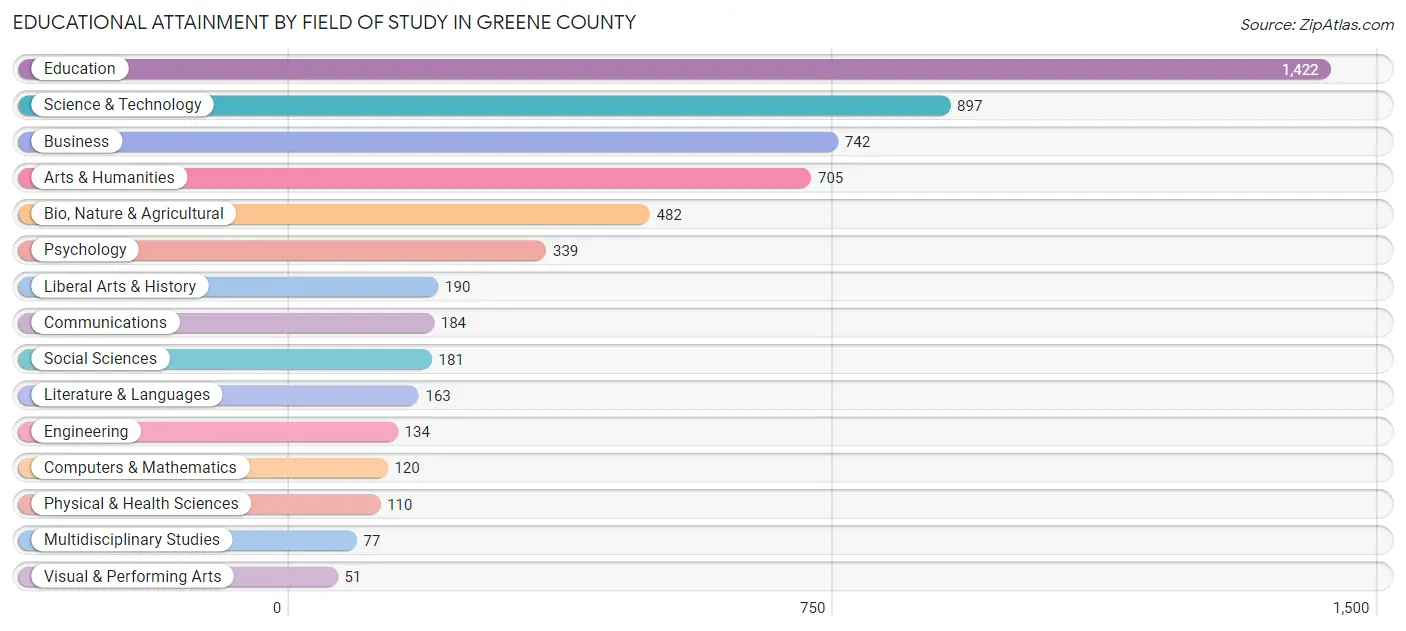
| Field of Study | # Graduates | % Graduates |
| Computers & Mathematics | 120 | 2.1% |
| Bio, Nature & Agricultural | 482 | 8.3% |
| Physical & Health Sciences | 110 | 1.9% |
| Psychology | 339 | 5.9% |
| Social Sciences | 181 | 3.1% |
| Engineering | 134 | 2.3% |
| Multidisciplinary Studies | 77 | 1.3% |
| Science & Technology | 897 | 15.5% |
| Business | 742 | 12.8% |
| Education | 1,422 | 24.5% |
| Literature & Languages | 163 | 2.8% |
| Liberal Arts & History | 190 | 3.3% |
| Visual & Performing Arts | 51 | 0.9% |
| Communications | 184 | 3.2% |
| Arts & Humanities | 705 | 12.2% |
| Total | 5,797 | 100.0% |
Transportation & Commute in Greene County
Vehicle Availability by Sex in Greene County
The most prevalent vehicle ownership categories in Greene County are males with 2 vehicles (3,111, accounting for 43.4%) and females with 2 vehicles (2,668, making up 49.7%).
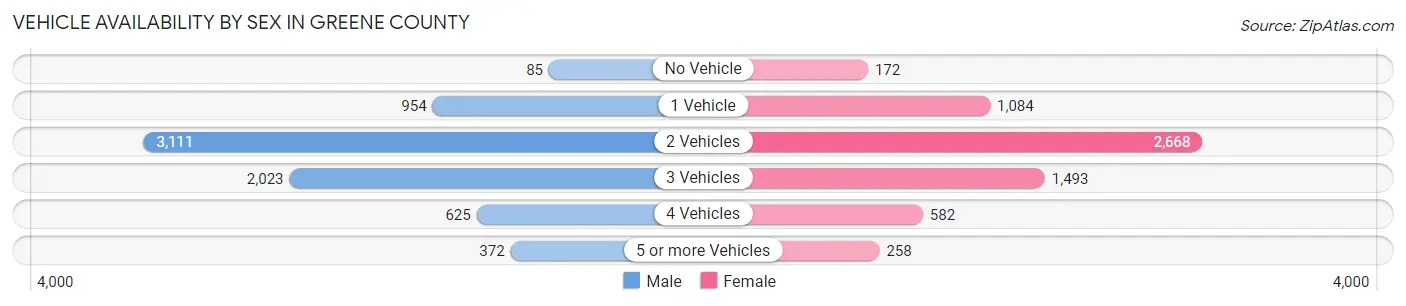
| Vehicles Available | Male | Female |
| No Vehicle | 85 (1.2%) | 172 (2.8%) |
| 1 Vehicle | 954 (13.3%) | 1,084 (17.3%) |
| 2 Vehicles | 3,111 (43.4%) | 2,668 (42.6%) |
| 3 Vehicles | 2,023 (28.2%) | 1,493 (23.9%) |
| 4 Vehicles | 625 (8.7%) | 582 (9.3%) |
| 5 or more Vehicles | 372 (5.2%) | 258 (4.1%) |
| Total | 7,170 (100.0%) | 6,257 (100.0%) |
Commute Time in Greene County
The most frequently occuring commute durations in Greene County are 30 to 34 minutes (1,776 commuters, 13.6%), 15 to 19 minutes (1,521 commuters, 11.7%), and 10 to 14 minutes (1,512 commuters, 11.6%).
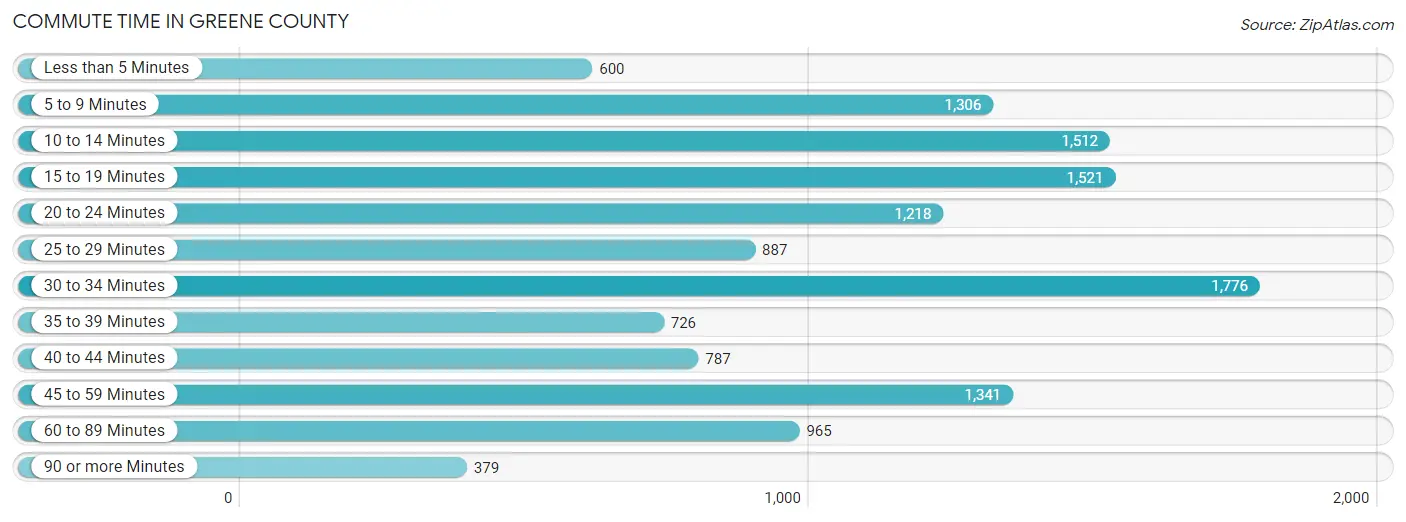
| Commute Time | # Commuters | % Commuters |
| Less than 5 Minutes | 600 | 4.6% |
| 5 to 9 Minutes | 1,306 | 10.0% |
| 10 to 14 Minutes | 1,512 | 11.6% |
| 15 to 19 Minutes | 1,521 | 11.7% |
| 20 to 24 Minutes | 1,218 | 9.4% |
| 25 to 29 Minutes | 887 | 6.8% |
| 30 to 34 Minutes | 1,776 | 13.6% |
| 35 to 39 Minutes | 726 | 5.6% |
| 40 to 44 Minutes | 787 | 6.0% |
| 45 to 59 Minutes | 1,341 | 10.3% |
| 60 to 89 Minutes | 965 | 7.4% |
| 90 or more Minutes | 379 | 2.9% |
Commute Time by Sex in Greene County
The most common commute times in Greene County are 30 to 34 minutes (1,054 commuters, 14.9%) for males and 30 to 34 minutes (722 commuters, 12.2%) for females.
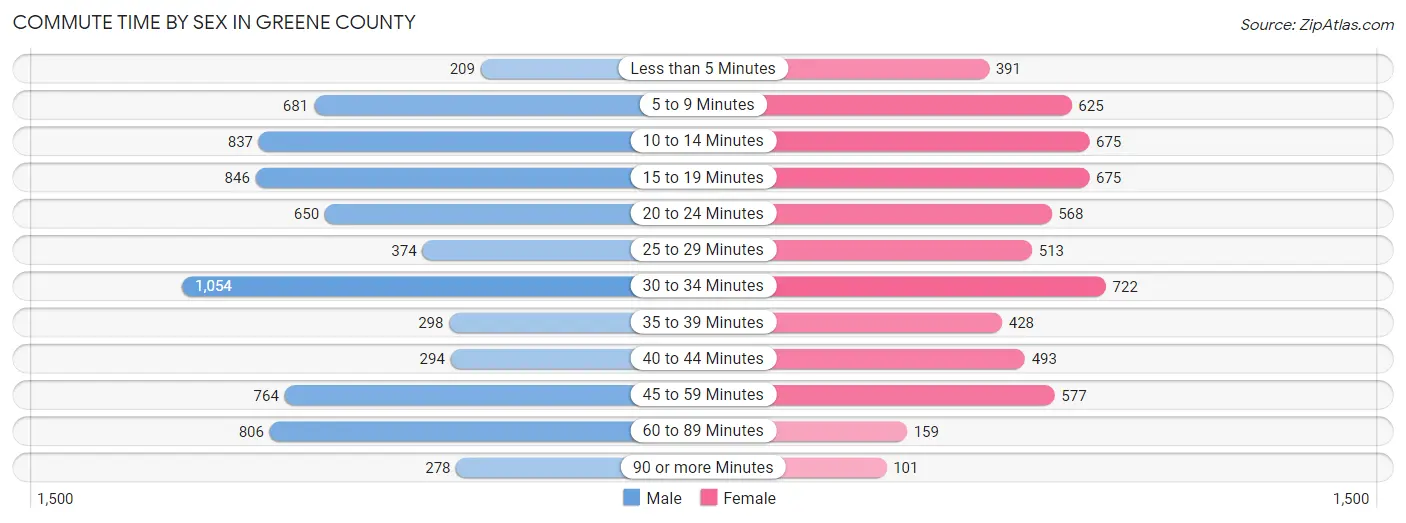
| Commute Time | Male | Female |
| Less than 5 Minutes | 209 (2.9%) | 391 (6.6%) |
| 5 to 9 Minutes | 681 (9.6%) | 625 (10.5%) |
| 10 to 14 Minutes | 837 (11.8%) | 675 (11.4%) |
| 15 to 19 Minutes | 846 (11.9%) | 675 (11.4%) |
| 20 to 24 Minutes | 650 (9.2%) | 568 (9.6%) |
| 25 to 29 Minutes | 374 (5.3%) | 513 (8.7%) |
| 30 to 34 Minutes | 1,054 (14.9%) | 722 (12.2%) |
| 35 to 39 Minutes | 298 (4.2%) | 428 (7.2%) |
| 40 to 44 Minutes | 294 (4.2%) | 493 (8.3%) |
| 45 to 59 Minutes | 764 (10.8%) | 577 (9.7%) |
| 60 to 89 Minutes | 806 (11.4%) | 159 (2.7%) |
| 90 or more Minutes | 278 (3.9%) | 101 (1.7%) |
Time of Departure to Work by Sex in Greene County
The most frequent times of departure to work in Greene County are 6:00 AM to 6:29 AM (1,097, 15.5%) for males and 7:00 AM to 7:29 AM (946, 16.0%) for females.
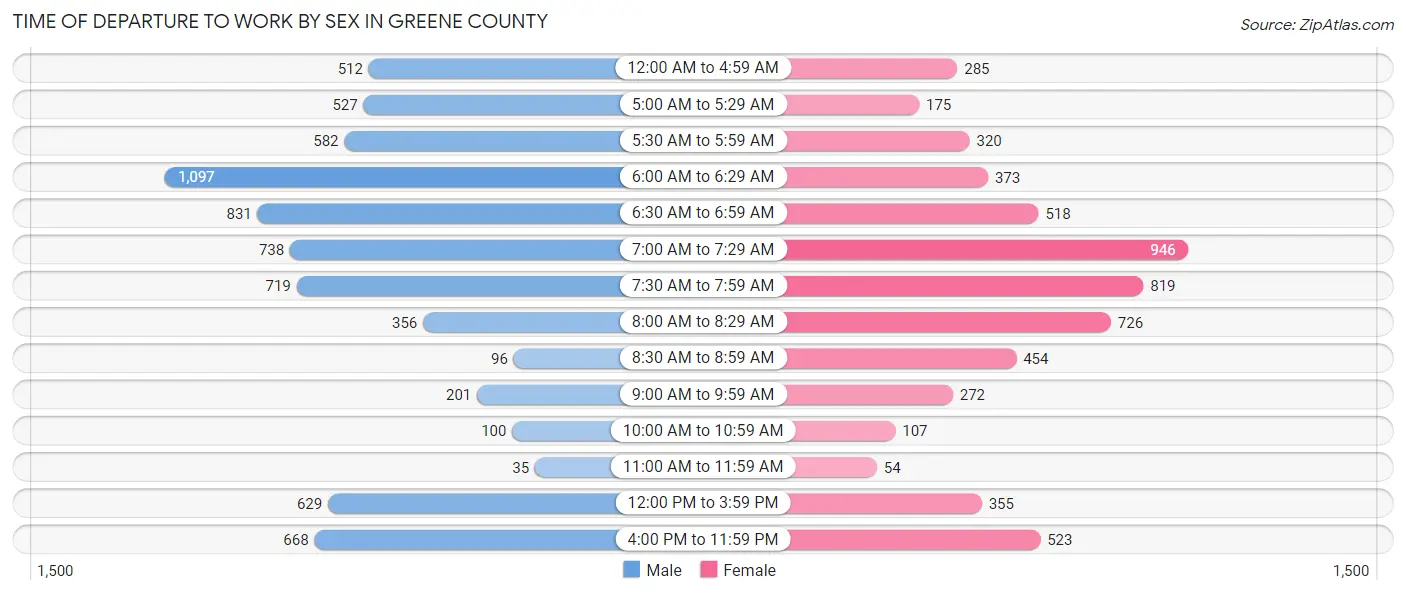
| Time of Departure | Male | Female |
| 12:00 AM to 4:59 AM | 512 (7.2%) | 285 (4.8%) |
| 5:00 AM to 5:29 AM | 527 (7.4%) | 175 (2.9%) |
| 5:30 AM to 5:59 AM | 582 (8.2%) | 320 (5.4%) |
| 6:00 AM to 6:29 AM | 1,097 (15.5%) | 373 (6.3%) |
| 6:30 AM to 6:59 AM | 831 (11.7%) | 518 (8.7%) |
| 7:00 AM to 7:29 AM | 738 (10.4%) | 946 (16.0%) |
| 7:30 AM to 7:59 AM | 719 (10.1%) | 819 (13.8%) |
| 8:00 AM to 8:29 AM | 356 (5.0%) | 726 (12.2%) |
| 8:30 AM to 8:59 AM | 96 (1.3%) | 454 (7.7%) |
| 9:00 AM to 9:59 AM | 201 (2.8%) | 272 (4.6%) |
| 10:00 AM to 10:59 AM | 100 (1.4%) | 107 (1.8%) |
| 11:00 AM to 11:59 AM | 35 (0.5%) | 54 (0.9%) |
| 12:00 PM to 3:59 PM | 629 (8.9%) | 355 (6.0%) |
| 4:00 PM to 11:59 PM | 668 (9.4%) | 523 (8.8%) |
| Total | 7,091 (100.0%) | 5,927 (100.0%) |
Housing Occupancy in Greene County
Occupancy by Ownership in Greene County
Of the total 13,957 dwellings in Greene County, owner-occupied units account for 10,959 (78.5%), while renter-occupied units make up 2,998 (21.5%).
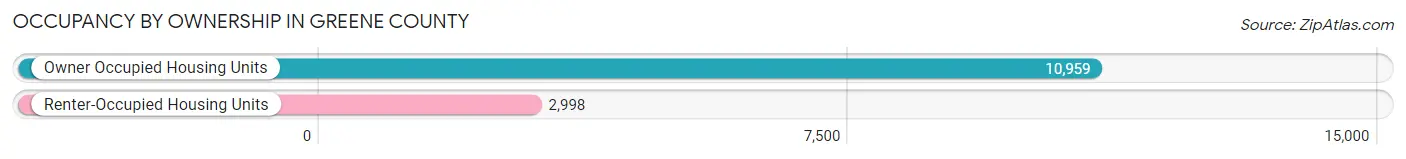
| Occupancy | # Housing Units | % Housing Units |
| Owner Occupied Housing Units | 10,959 | 78.5% |
| Renter-Occupied Housing Units | 2,998 | 21.5% |
| Total Occupied Housing Units | 13,957 | 100.0% |
Occupancy by Household Size in Greene County
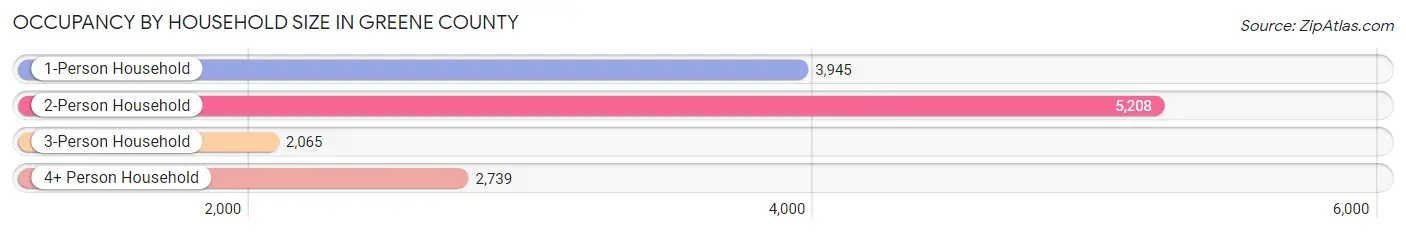
| Household Size | # Housing Units | % Housing Units |
| 1-Person Household | 3,945 | 28.3% |
| 2-Person Household | 5,208 | 37.3% |
| 3-Person Household | 2,065 | 14.8% |
| 4+ Person Household | 2,739 | 19.6% |
| Total Housing Units | 13,957 | 100.0% |
Occupancy by Ownership by Household Size in Greene County
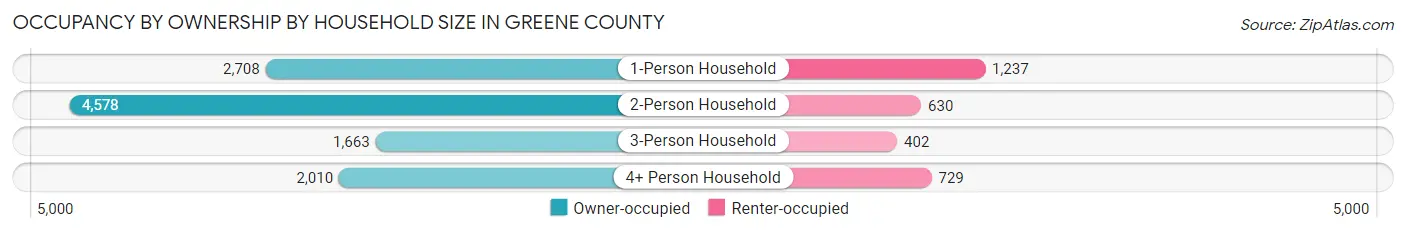
| Household Size | Owner-occupied | Renter-occupied |
| 1-Person Household | 2,708 (68.6%) | 1,237 (31.4%) |
| 2-Person Household | 4,578 (87.9%) | 630 (12.1%) |
| 3-Person Household | 1,663 (80.5%) | 402 (19.5%) |
| 4+ Person Household | 2,010 (73.4%) | 729 (26.6%) |
| Total Housing Units | 10,959 (78.5%) | 2,998 (21.5%) |
Occupancy by Educational Attainment in Greene County
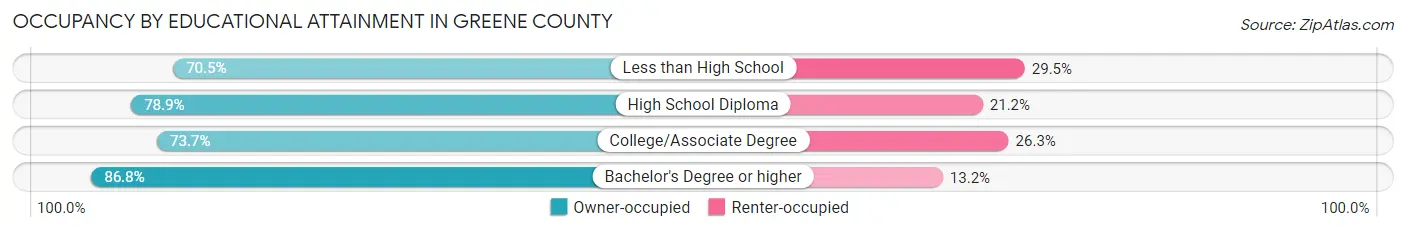
| Household Size | Owner-occupied | Renter-occupied |
| Less than High School | 1,000 (70.5%) | 418 (29.5%) |
| High School Diploma | 4,572 (78.8%) | 1,226 (21.1%) |
| College/Associate Degree | 2,613 (73.7%) | 931 (26.3%) |
| Bachelor's Degree or higher | 2,774 (86.8%) | 423 (13.2%) |
Occupancy by Age of Householder in Greene County
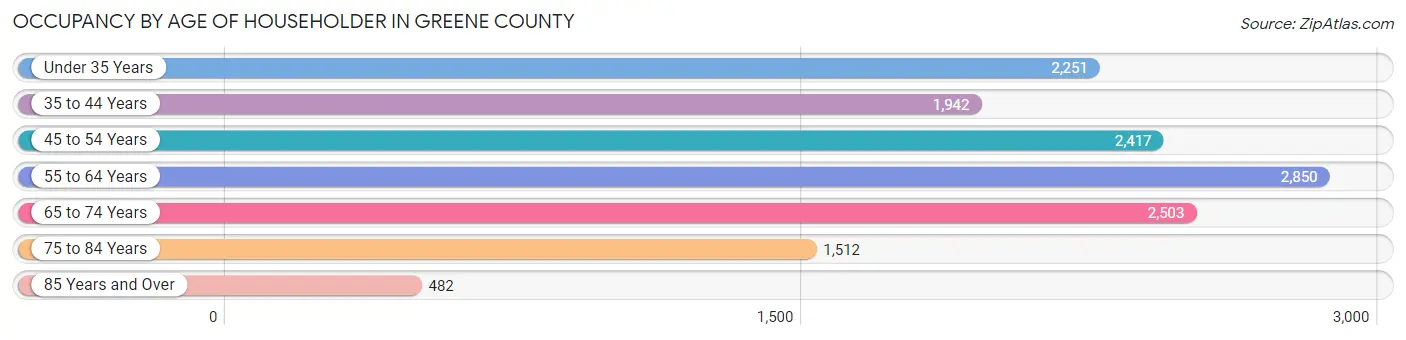
| Age Bracket | # Households | % Households |
| Under 35 Years | 2,251 | 16.1% |
| 35 to 44 Years | 1,942 | 13.9% |
| 45 to 54 Years | 2,417 | 17.3% |
| 55 to 64 Years | 2,850 | 20.4% |
| 65 to 74 Years | 2,503 | 17.9% |
| 75 to 84 Years | 1,512 | 10.8% |
| 85 Years and Over | 482 | 3.5% |
| Total | 13,957 | 100.0% |
Housing Finances in Greene County
Median Income by Occupancy in Greene County
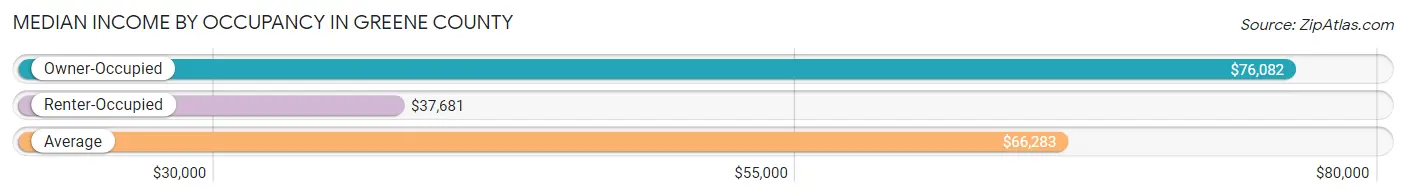
| Occupancy Type | # Households | Median Income |
| Owner-Occupied | 10,959 (78.5%) | $76,082 |
| Renter-Occupied | 2,998 (21.5%) | $37,681 |
| Average | 13,957 (100.0%) | $66,283 |
Occupancy by Householder Income Bracket in Greene County
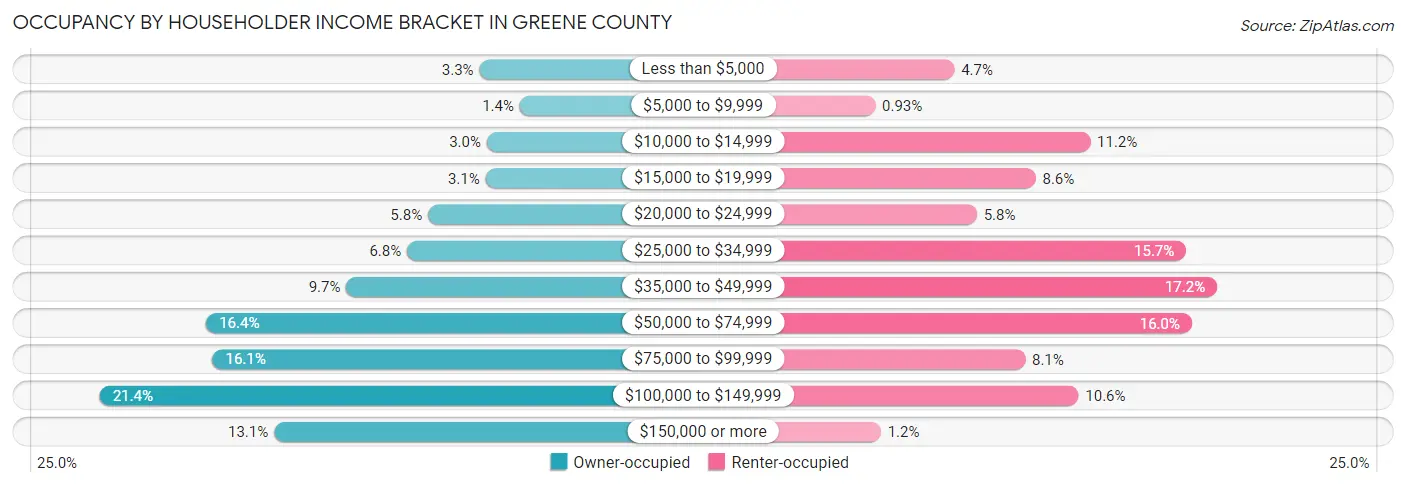
| Income Bracket | Owner-occupied | Renter-occupied |
| Less than $5,000 | 366 (3.3%) | 141 (4.7%) |
| $5,000 to $9,999 | 156 (1.4%) | 28 (0.9%) |
| $10,000 to $14,999 | 328 (3.0%) | 335 (11.2%) |
| $15,000 to $19,999 | 334 (3.0%) | 257 (8.6%) |
| $20,000 to $24,999 | 634 (5.8%) | 173 (5.8%) |
| $25,000 to $34,999 | 744 (6.8%) | 472 (15.7%) |
| $35,000 to $49,999 | 1,061 (9.7%) | 516 (17.2%) |
| $50,000 to $74,999 | 1,792 (16.4%) | 480 (16.0%) |
| $75,000 to $99,999 | 1,759 (16.1%) | 242 (8.1%) |
| $100,000 to $149,999 | 2,347 (21.4%) | 318 (10.6%) |
| $150,000 or more | 1,438 (13.1%) | 36 (1.2%) |
| Total | 10,959 (100.0%) | 2,998 (100.0%) |
Monthly Housing Cost Tiers in Greene County
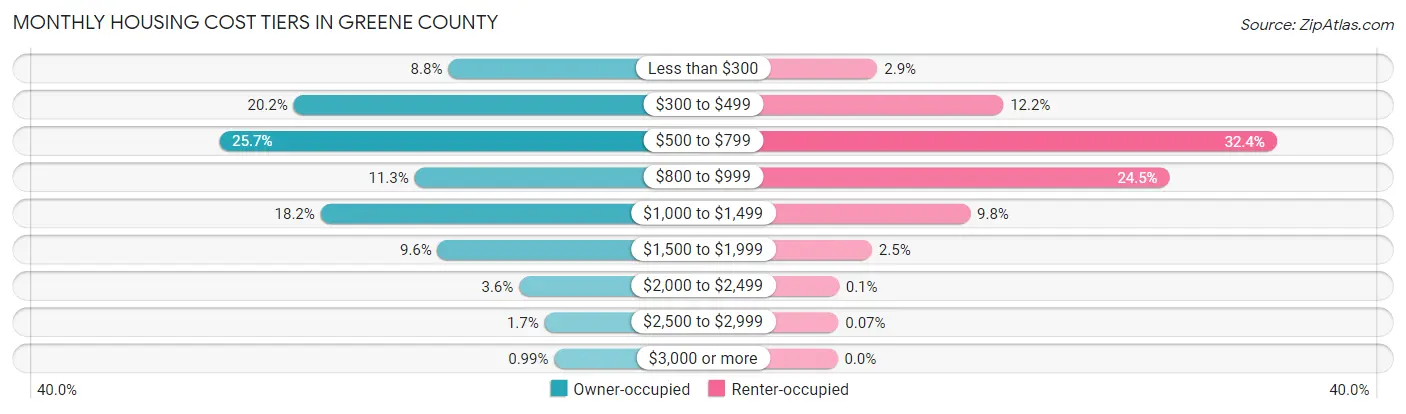
| Monthly Cost | Owner-occupied | Renter-occupied |
| Less than $300 | 964 (8.8%) | 88 (2.9%) |
| $300 to $499 | 2,213 (20.2%) | 366 (12.2%) |
| $500 to $799 | 2,813 (25.7%) | 970 (32.4%) |
| $800 to $999 | 1,236 (11.3%) | 733 (24.4%) |
| $1,000 to $1,499 | 1,995 (18.2%) | 293 (9.8%) |
| $1,500 to $1,999 | 1,050 (9.6%) | 76 (2.5%) |
| $2,000 to $2,499 | 392 (3.6%) | 3 (0.1%) |
| $2,500 to $2,999 | 187 (1.7%) | 2 (0.1%) |
| $3,000 or more | 109 (1.0%) | 0 (0.0%) |
| Total | 10,959 (100.0%) | 2,998 (100.0%) |
Physical Housing Characteristics in Greene County
Housing Structures in Greene County
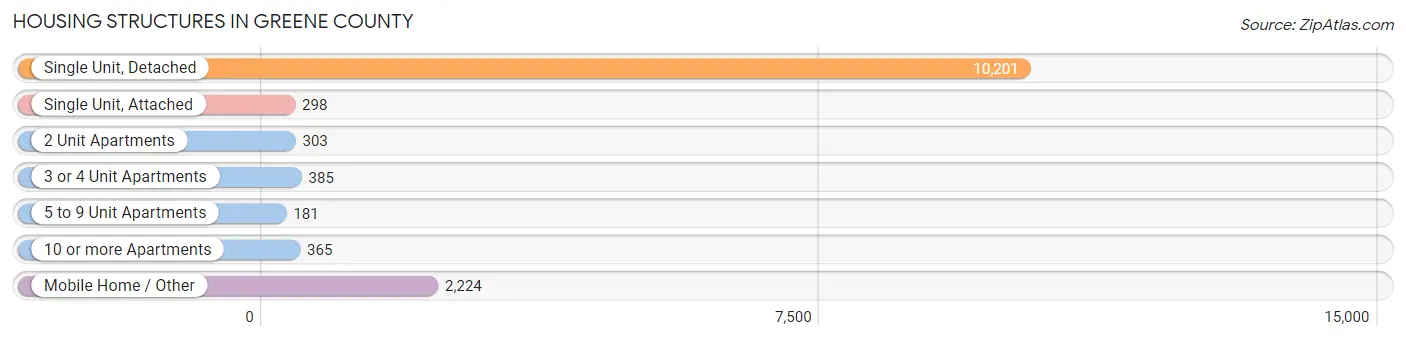
| Structure Type | # Housing Units | % Housing Units |
| Single Unit, Detached | 10,201 | 73.1% |
| Single Unit, Attached | 298 | 2.1% |
| 2 Unit Apartments | 303 | 2.2% |
| 3 or 4 Unit Apartments | 385 | 2.8% |
| 5 to 9 Unit Apartments | 181 | 1.3% |
| 10 or more Apartments | 365 | 2.6% |
| Mobile Home / Other | 2,224 | 15.9% |
| Total | 13,957 | 100.0% |
Housing Structures by Occupancy in Greene County
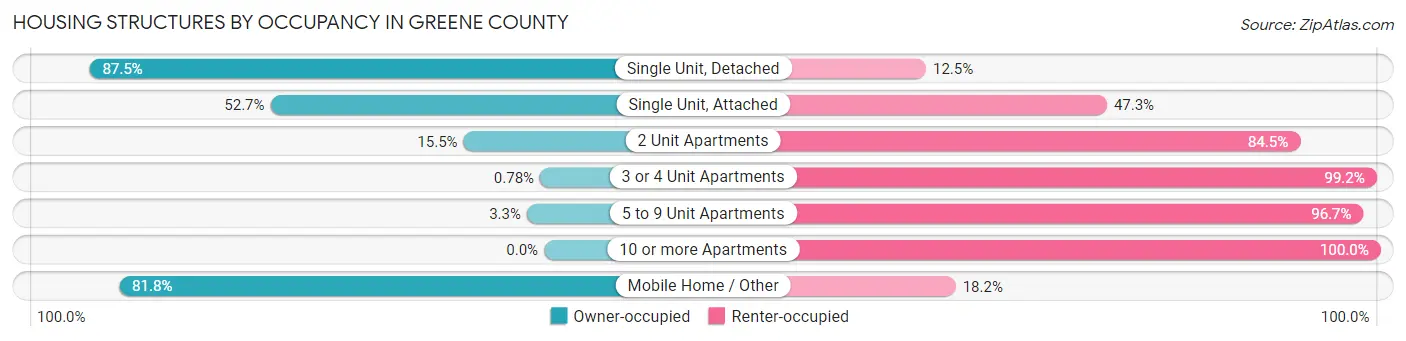
| Structure Type | Owner-occupied | Renter-occupied |
| Single Unit, Detached | 8,927 (87.5%) | 1,274 (12.5%) |
| Single Unit, Attached | 157 (52.7%) | 141 (47.3%) |
| 2 Unit Apartments | 47 (15.5%) | 256 (84.5%) |
| 3 or 4 Unit Apartments | 3 (0.8%) | 382 (99.2%) |
| 5 to 9 Unit Apartments | 6 (3.3%) | 175 (96.7%) |
| 10 or more Apartments | 0 (0.0%) | 365 (100.0%) |
| Mobile Home / Other | 1,819 (81.8%) | 405 (18.2%) |
| Total | 10,959 (78.5%) | 2,998 (21.5%) |
Housing Structures by Number of Rooms in Greene County
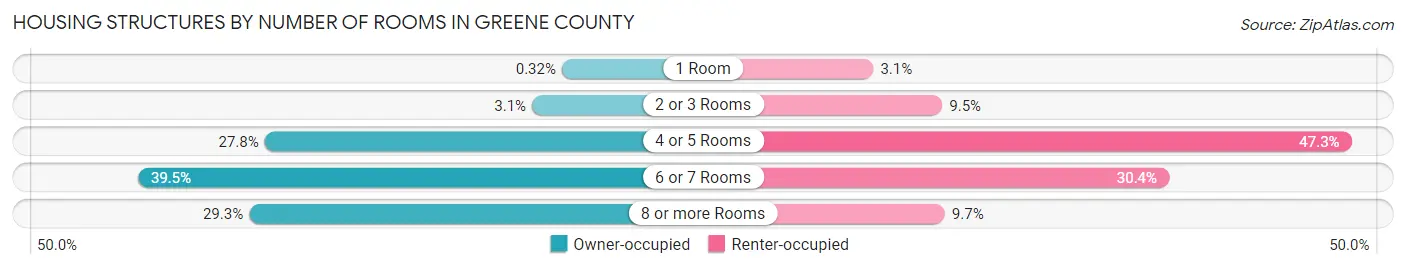
| Number of Rooms | Owner-occupied | Renter-occupied |
| 1 Room | 35 (0.3%) | 93 (3.1%) |
| 2 or 3 Rooms | 338 (3.1%) | 284 (9.5%) |
| 4 or 5 Rooms | 3,048 (27.8%) | 1,418 (47.3%) |
| 6 or 7 Rooms | 4,332 (39.5%) | 912 (30.4%) |
| 8 or more Rooms | 3,206 (29.2%) | 291 (9.7%) |
| Total | 10,959 (100.0%) | 2,998 (100.0%) |
Housing Structure by Heating Type in Greene County
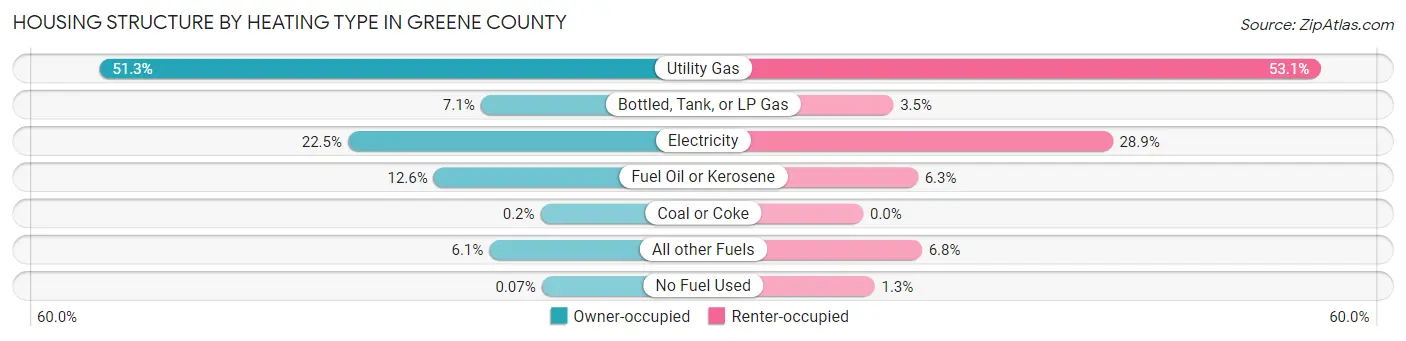
| Heating Type | Owner-occupied | Renter-occupied |
| Utility Gas | 5,625 (51.3%) | 1,592 (53.1%) |
| Bottled, Tank, or LP Gas | 782 (7.1%) | 105 (3.5%) |
| Electricity | 2,469 (22.5%) | 867 (28.9%) |
| Fuel Oil or Kerosene | 1,380 (12.6%) | 190 (6.3%) |
| Coal or Coke | 22 (0.2%) | 0 (0.0%) |
| All other Fuels | 673 (6.1%) | 204 (6.8%) |
| No Fuel Used | 8 (0.1%) | 40 (1.3%) |
| Total | 10,959 (100.0%) | 2,998 (100.0%) |
Household Vehicle Usage in Greene County
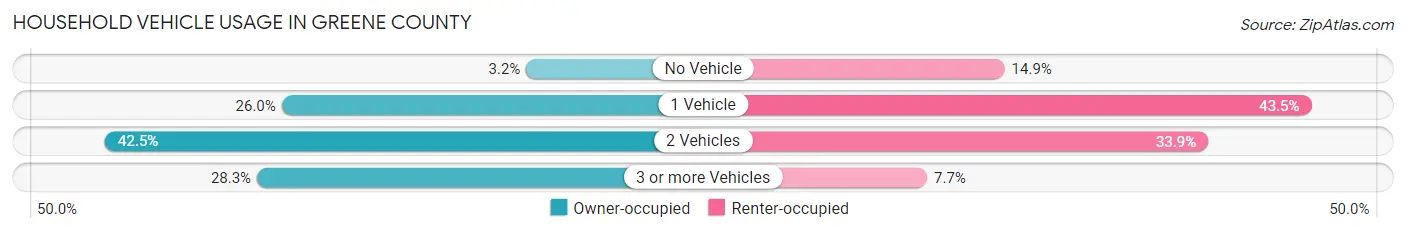
| Vehicles per Household | Owner-occupied | Renter-occupied |
| No Vehicle | 349 (3.2%) | 447 (14.9%) |
| 1 Vehicle | 2,850 (26.0%) | 1,305 (43.5%) |
| 2 Vehicles | 4,658 (42.5%) | 1,016 (33.9%) |
| 3 or more Vehicles | 3,102 (28.3%) | 230 (7.7%) |
| Total | 10,959 (100.0%) | 2,998 (100.0%) |
Real Estate & Mortgages in Greene County
Real Estate and Mortgage Overview in Greene County
| Characteristic | Without Mortgage | With Mortgage |
| Housing Units | 5,717 | 5,242 |
| Median Property Value | $120,400 | $160,600 |
| Median Household Income | $55,785 | $853 |
| Monthly Housing Costs | $479 | $82 |
| Real Estate Taxes | $1,561 | $65 |
Property Value by Mortgage Status in Greene County
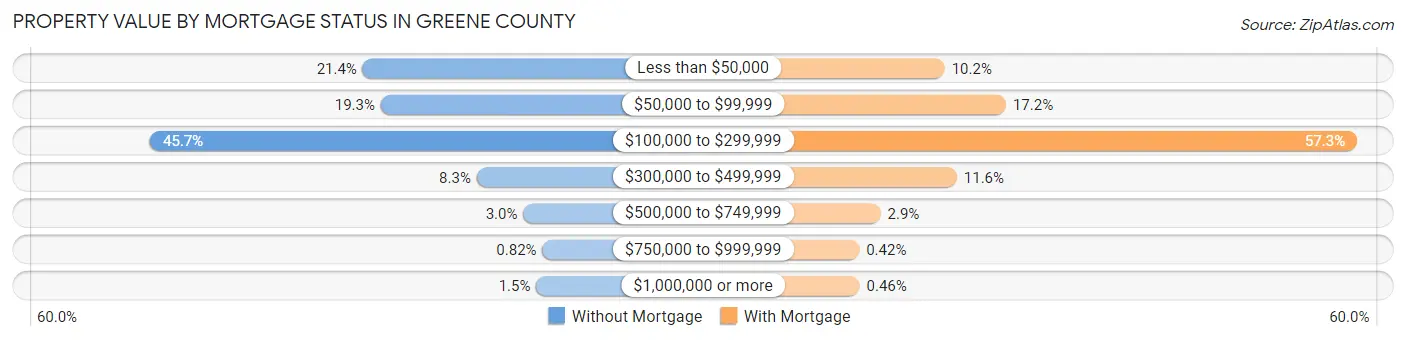
| Property Value | Without Mortgage | With Mortgage |
| Less than $50,000 | 1,221 (21.4%) | 534 (10.2%) |
| $50,000 to $99,999 | 1,103 (19.3%) | 901 (17.2%) |
| $100,000 to $299,999 | 2,611 (45.7%) | 3,004 (57.3%) |
| $300,000 to $499,999 | 476 (8.3%) | 607 (11.6%) |
| $500,000 to $749,999 | 172 (3.0%) | 150 (2.9%) |
| $750,000 to $999,999 | 47 (0.8%) | 22 (0.4%) |
| $1,000,000 or more | 87 (1.5%) | 24 (0.5%) |
| Total | 5,717 (100.0%) | 5,242 (100.0%) |
Household Income by Mortgage Status in Greene County
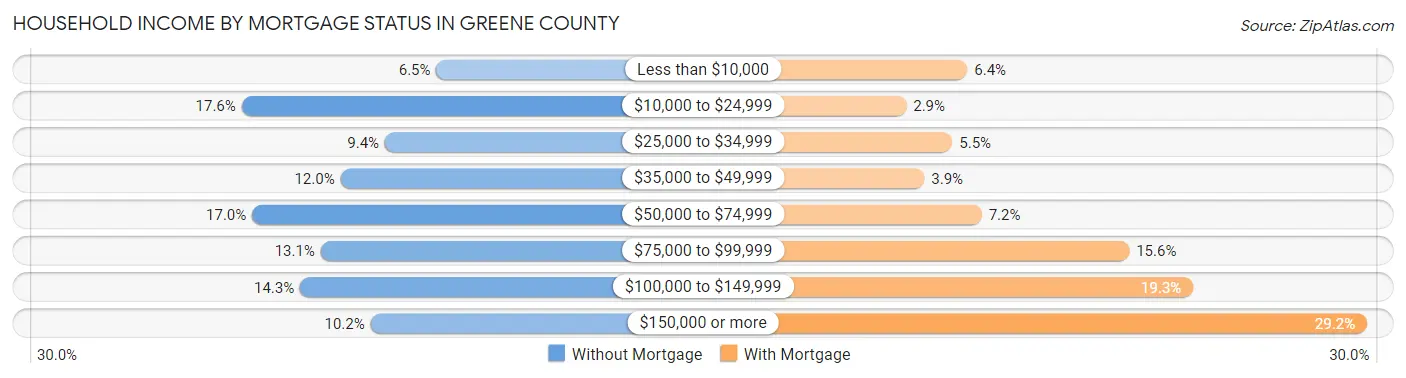
| Household Income | Without Mortgage | With Mortgage |
| Less than $10,000 | 370 (6.5%) | 335 (6.4%) |
| $10,000 to $24,999 | 1,006 (17.6%) | 152 (2.9%) |
| $25,000 to $34,999 | 538 (9.4%) | 290 (5.5%) |
| $35,000 to $49,999 | 683 (11.9%) | 206 (3.9%) |
| $50,000 to $74,999 | 972 (17.0%) | 378 (7.2%) |
| $75,000 to $99,999 | 748 (13.1%) | 820 (15.6%) |
| $100,000 to $149,999 | 815 (14.3%) | 1,011 (19.3%) |
| $150,000 or more | 585 (10.2%) | 1,532 (29.2%) |
| Total | 5,717 (100.0%) | 5,242 (100.0%) |
Property Value to Household Income Ratio in Greene County
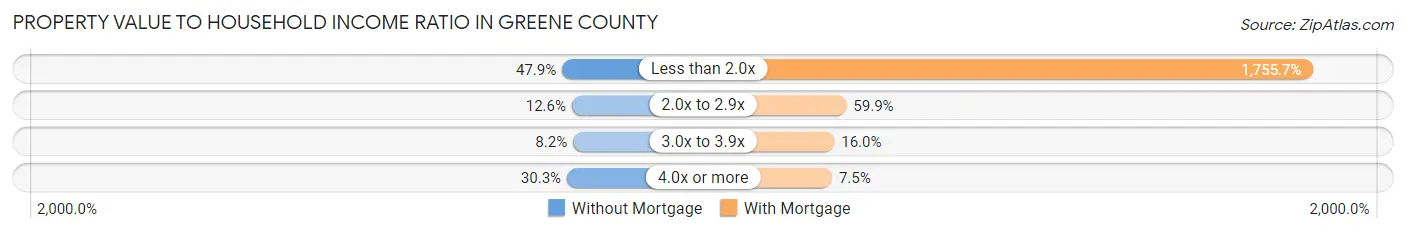
| Value-to-Income Ratio | Without Mortgage | With Mortgage |
| Less than 2.0x | 2,737 (47.9%) | 92,031 (1,755.6%) |
| 2.0x to 2.9x | 719 (12.6%) | 3,139 (59.9%) |
| 3.0x to 3.9x | 466 (8.2%) | 837 (16.0%) |
| 4.0x or more | 1,730 (30.3%) | 395 (7.5%) |
| Total | 5,717 (100.0%) | 5,242 (100.0%) |
Real Estate Taxes by Mortgage Status in Greene County
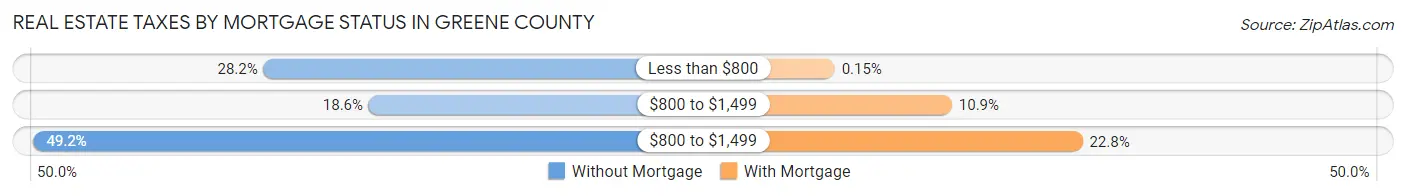
| Property Taxes | Without Mortgage | With Mortgage |
| Less than $800 | 1,611 (28.2%) | 8 (0.2%) |
| $800 to $1,499 | 1,061 (18.6%) | 569 (10.8%) |
| $800 to $1,499 | 2,812 (49.2%) | 1,194 (22.8%) |
| Total | 5,717 (100.0%) | 5,242 (100.0%) |
Health & Disability in Greene County
Health Insurance Coverage by Age in Greene County
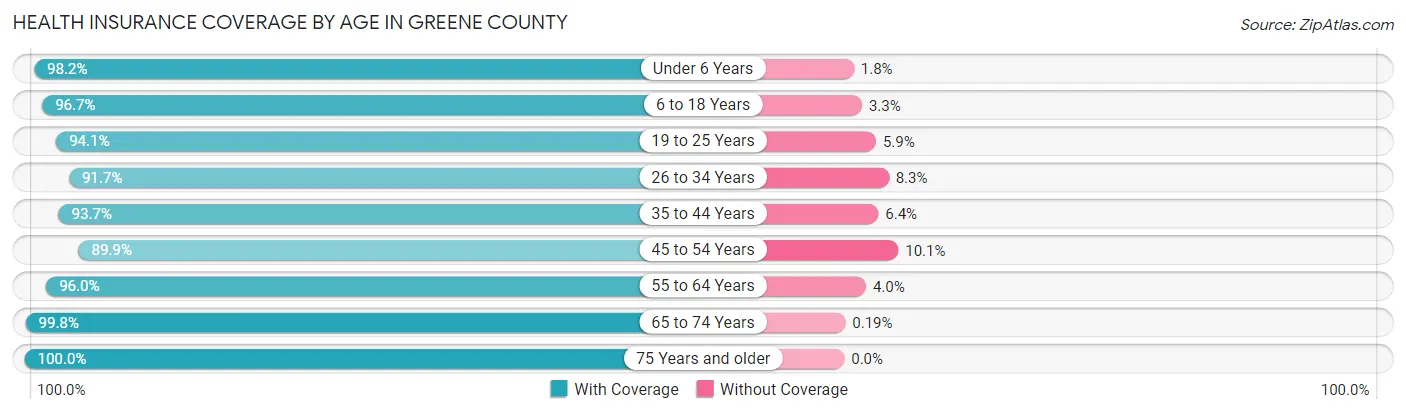
| Age Bracket | With Coverage | Without Coverage |
| Under 6 Years | 2,040 (98.2%) | 37 (1.8%) |
| 6 to 18 Years | 5,169 (96.7%) | 176 (3.3%) |
| 19 to 25 Years | 2,739 (94.1%) | 172 (5.9%) |
| 26 to 34 Years | 3,344 (91.7%) | 302 (8.3%) |
| 35 to 44 Years | 3,468 (93.6%) | 235 (6.4%) |
| 45 to 54 Years | 3,972 (89.9%) | 445 (10.1%) |
| 55 to 64 Years | 4,652 (96.0%) | 196 (4.0%) |
| 65 to 74 Years | 4,118 (99.8%) | 8 (0.2%) |
| 75 Years and older | 2,594 (100.0%) | 0 (0.0%) |
| Total | 32,096 (95.3%) | 1,571 (4.7%) |
Health Insurance Coverage by Citizenship Status in Greene County
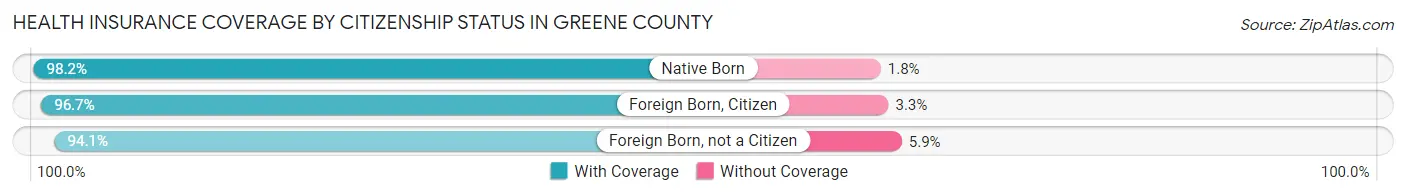
| Citizenship Status | With Coverage | Without Coverage |
| Native Born | 2,040 (98.2%) | 37 (1.8%) |
| Foreign Born, Citizen | 5,169 (96.7%) | 176 (3.3%) |
| Foreign Born, not a Citizen | 2,739 (94.1%) | 172 (5.9%) |
Health Insurance Coverage by Household Income in Greene County
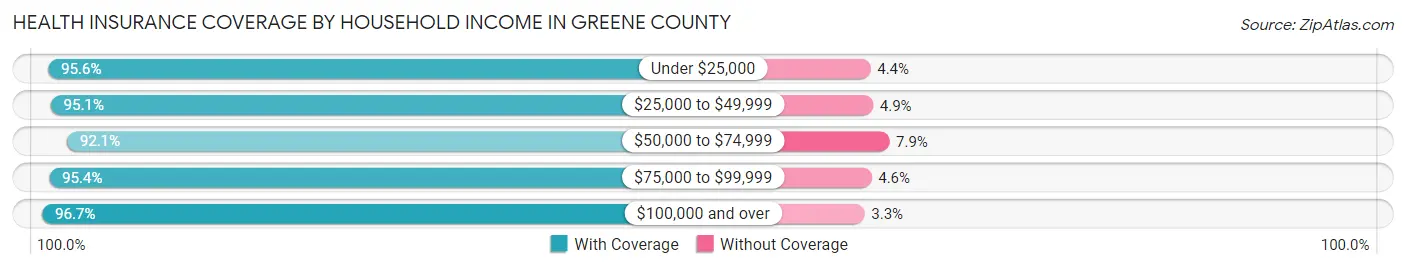
| Household Income | With Coverage | Without Coverage |
| Under $25,000 | 4,167 (95.6%) | 192 (4.4%) |
| $25,000 to $49,999 | 4,929 (95.1%) | 253 (4.9%) |
| $50,000 to $74,999 | 4,698 (92.1%) | 404 (7.9%) |
| $75,000 to $99,999 | 5,259 (95.4%) | 253 (4.6%) |
| $100,000 and over | 11,981 (96.7%) | 407 (3.3%) |
Public vs Private Health Insurance Coverage by Age in Greene County
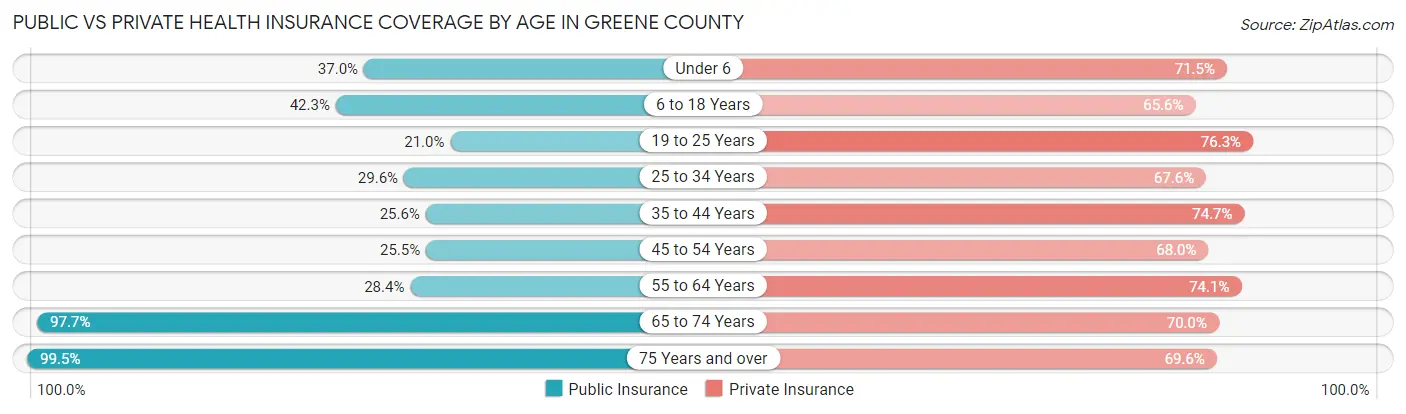
| Age Bracket | Public Insurance | Private Insurance |
| Under 6 | 769 (37.0%) | 1,484 (71.5%) |
| 6 to 18 Years | 2,258 (42.2%) | 3,507 (65.6%) |
| 19 to 25 Years | 611 (21.0%) | 2,221 (76.3%) |
| 25 to 34 Years | 1,079 (29.6%) | 2,465 (67.6%) |
| 35 to 44 Years | 946 (25.6%) | 2,767 (74.7%) |
| 45 to 54 Years | 1,126 (25.5%) | 3,005 (68.0%) |
| 55 to 64 Years | 1,378 (28.4%) | 3,594 (74.1%) |
| 65 to 74 Years | 4,030 (97.7%) | 2,887 (70.0%) |
| 75 Years and over | 2,582 (99.5%) | 1,805 (69.6%) |
| Total | 14,779 (43.9%) | 23,735 (70.5%) |
Disability Status by Sex by Age in Greene County
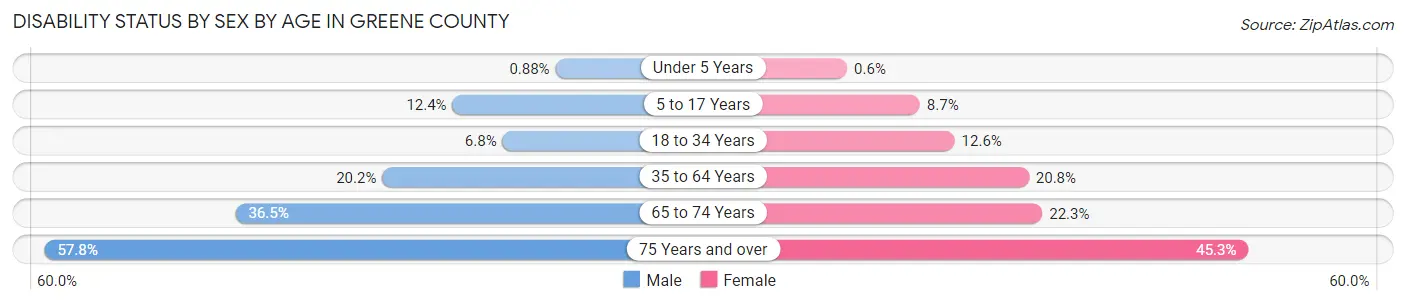
| Age Bracket | Male | Female |
| Under 5 Years | 8 (0.9%) | 5 (0.6%) |
| 5 to 17 Years | 331 (12.3%) | 210 (8.7%) |
| 18 to 34 Years | 251 (6.8%) | 432 (12.6%) |
| 35 to 64 Years | 1,293 (20.2%) | 1,366 (20.8%) |
| 65 to 74 Years | 743 (36.5%) | 467 (22.3%) |
| 75 Years and over | 631 (57.8%) | 680 (45.3%) |
Disability Class by Sex by Age in Greene County
Disability Class: Hearing Difficulty
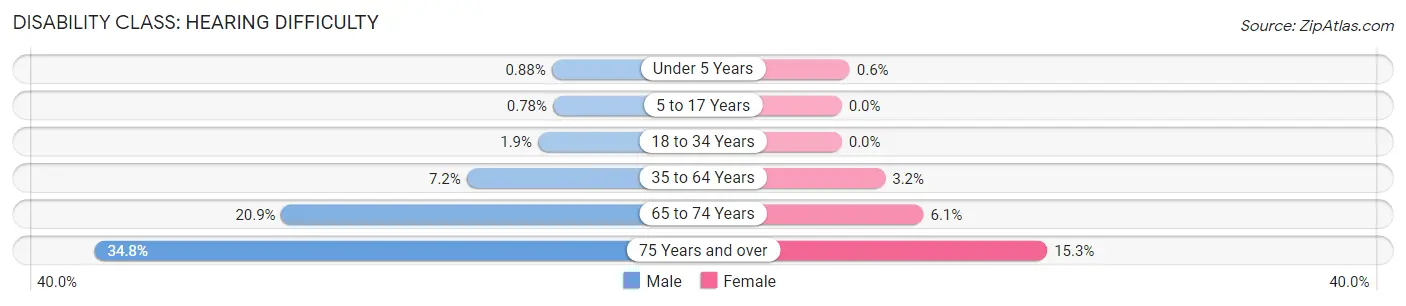
| Age Bracket | Male | Female |
| Under 5 Years | 8 (0.9%) | 5 (0.6%) |
| 5 to 17 Years | 21 (0.8%) | 0 (0.0%) |
| 18 to 34 Years | 70 (1.9%) | 0 (0.0%) |
| 35 to 64 Years | 460 (7.2%) | 212 (3.2%) |
| 65 to 74 Years | 426 (20.9%) | 127 (6.1%) |
| 75 Years and over | 380 (34.8%) | 229 (15.2%) |
Disability Class: Vision Difficulty
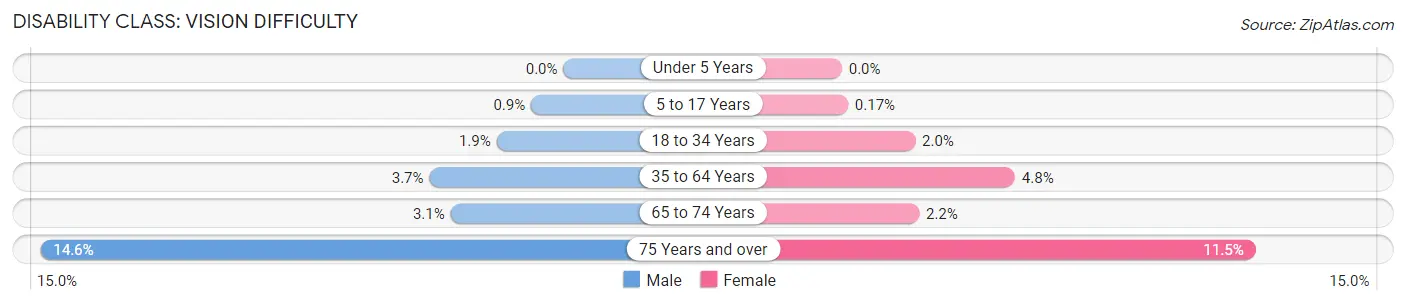
| Age Bracket | Male | Female |
| Under 5 Years | 0 (0.0%) | 0 (0.0%) |
| 5 to 17 Years | 24 (0.9%) | 4 (0.2%) |
| 18 to 34 Years | 69 (1.9%) | 70 (2.0%) |
| 35 to 64 Years | 239 (3.7%) | 316 (4.8%) |
| 65 to 74 Years | 64 (3.1%) | 45 (2.1%) |
| 75 Years and over | 159 (14.6%) | 173 (11.5%) |
Disability Class: Cognitive Difficulty
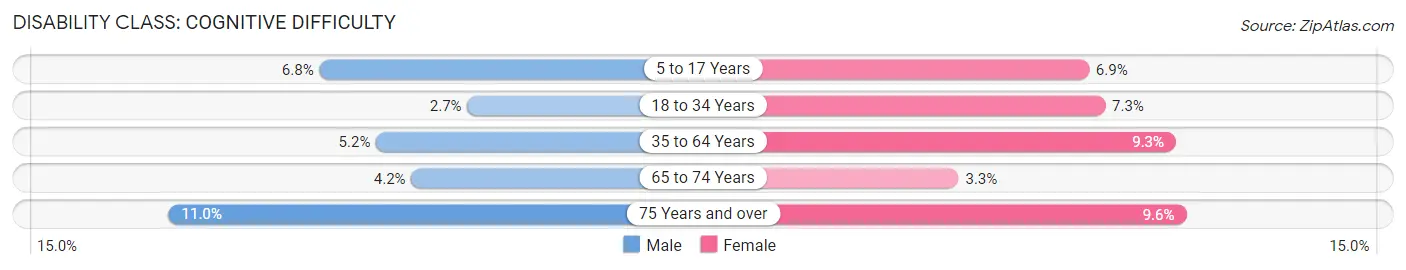
| Age Bracket | Male | Female |
| 5 to 17 Years | 182 (6.8%) | 166 (6.9%) |
| 18 to 34 Years | 99 (2.7%) | 252 (7.3%) |
| 35 to 64 Years | 334 (5.2%) | 610 (9.3%) |
| 65 to 74 Years | 86 (4.2%) | 68 (3.3%) |
| 75 Years and over | 120 (11.0%) | 144 (9.6%) |
Disability Class: Ambulatory Difficulty
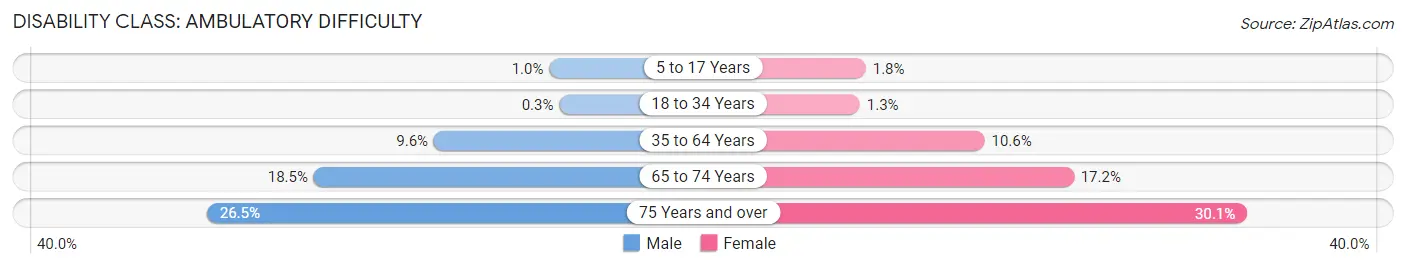
| Age Bracket | Male | Female |
| 5 to 17 Years | 28 (1.0%) | 43 (1.8%) |
| 18 to 34 Years | 11 (0.3%) | 46 (1.3%) |
| 35 to 64 Years | 616 (9.6%) | 695 (10.6%) |
| 65 to 74 Years | 377 (18.5%) | 360 (17.2%) |
| 75 Years and over | 289 (26.5%) | 452 (30.1%) |
Disability Class: Self-Care Difficulty
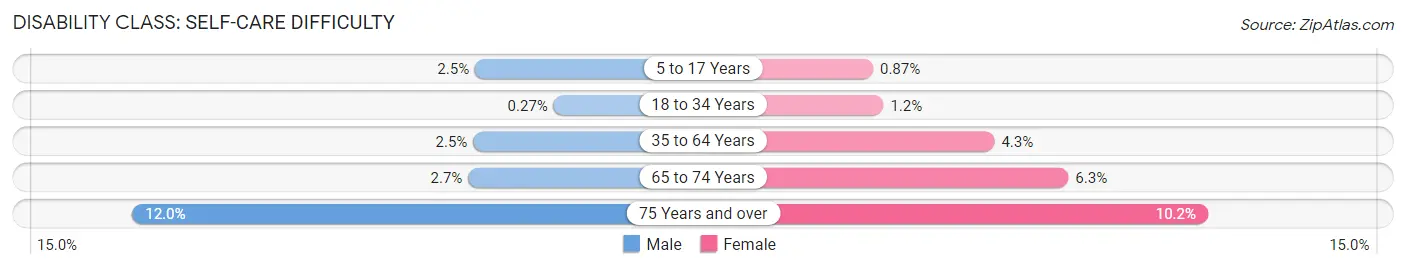
| Age Bracket | Male | Female |
| 5 to 17 Years | 66 (2.5%) | 21 (0.9%) |
| 18 to 34 Years | 10 (0.3%) | 40 (1.2%) |
| 35 to 64 Years | 161 (2.5%) | 279 (4.3%) |
| 65 to 74 Years | 54 (2.6%) | 132 (6.3%) |
| 75 Years and over | 131 (12.0%) | 153 (10.2%) |
Technology Access in Greene County
Computing Device Access in Greene County
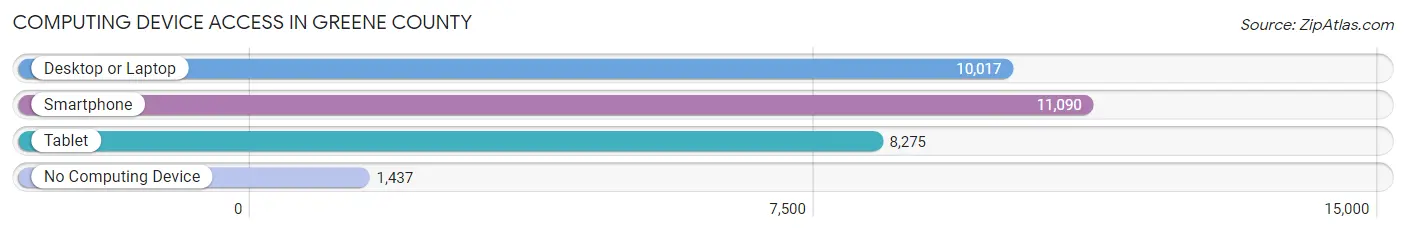
| Device Type | # Households | % Households |
| Desktop or Laptop | 10,017 | 71.8% |
| Smartphone | 11,090 | 79.5% |
| Tablet | 8,275 | 59.3% |
| No Computing Device | 1,437 | 10.3% |
| Total | 13,957 | 100.0% |
Internet Access in Greene County
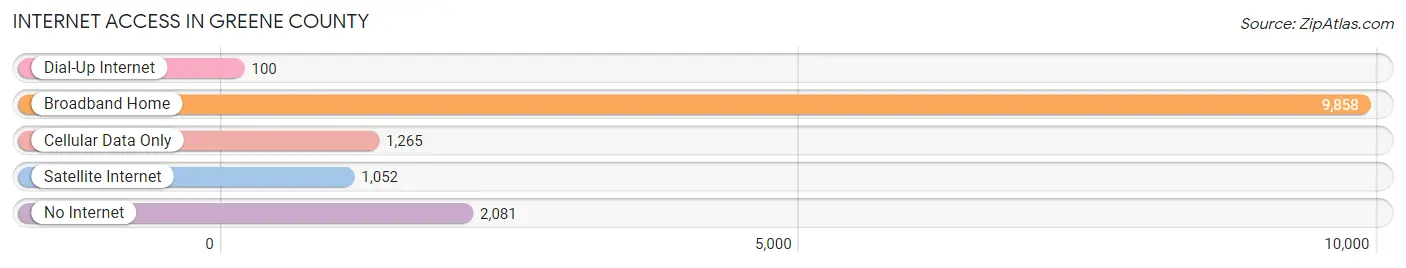
| Internet Type | # Households | % Households |
| Dial-Up Internet | 100 | 0.7% |
| Broadband Home | 9,858 | 70.6% |
| Cellular Data Only | 1,265 | 9.1% |
| Satellite Internet | 1,052 | 7.5% |
| No Internet | 2,081 | 14.9% |
| Total | 13,957 | 100.0% |
Greene County Summary
Greene County, Pennsylvania is located in the southwestern corner of the state, and is part of the Pittsburgh metropolitan area. It is bordered by Washington County to the north, Fayette County to the east, West Virginia to the south, and Westmoreland County to the west. The county seat is Waynesburg, and the county was created in 1796 from part of Washington County.
Geography
Greene County is located in the Appalachian Mountains region of Pennsylvania, and is part of the Allegheny Plateau. The county is mostly rural, with rolling hills and valleys. The highest point in the county is 2,890 feet above sea level, located on the summit of Mount Davis. The county is drained by the Monongahela River, which forms the northern border of the county. Other major waterways include Dunkard Creek, Tenmile Creek, and Whiteley Creek.
The county is home to several state parks, including Ohiopyle State Park, which is located in the southwestern corner of the county. The park is known for its whitewater rafting and hiking trails. Other parks in the county include Greene County State Park, which is located in the northern part of the county, and Greene County Park, which is located in the southeastern part of the county.
Economy
Greene County has a diverse economy, with a mix of agriculture, manufacturing, and services. The county is home to several large employers, including Greene County Medical Center, Greene County Public Schools, and Greene County Correctional Facility.
Agriculture is an important part of the county’s economy, with dairy farming, beef cattle, and poultry being the main agricultural products. Other agricultural products include corn, hay, and soybeans.
Manufacturing is also an important part of the county’s economy, with several large employers in the county. The largest employer is Greene County Medical Center, which employs over 1,000 people. Other major employers include Greene County Public Schools, Greene County Correctional Facility, and Greene County Industries.
Demographics
As of the 2010 census, Greene County had a population of 38,686. The population is mostly white (96.2%), with small percentages of African American (1.7%), Hispanic (0.7%), and Asian (0.4%) residents. The median household income in the county is $45,837, and the median age is 42.
The county is home to several colleges and universities, including Waynesburg University, California University of Pennsylvania, and the University of Pittsburgh at Greensburg.
Conclusion
Greene County, Pennsylvania is a rural county located in the southwestern corner of the state. It is part of the Pittsburgh metropolitan area, and is bordered by Washington County to the north, Fayette County to the east, West Virginia to the south, and Westmoreland County to the west. The county has a diverse economy, with a mix of agriculture, manufacturing, and services. The population is mostly white, with small percentages of African American, Hispanic, and Asian residents. The county is home to several colleges and universities, and is a popular destination for outdoor recreation.
Common Questions
What is Per Capita Income in Greene County?
Per Capita income in Greene County is $32,272.
What is the Median Family Income in Greene County?
Median Family Income in Greene County is $84,630.
What is the Median Household income in Greene County?
Median Household Income in Greene County is $66,283.
What is Income or Wage Gap in Greene County?
Income or Wage Gap in Greene County is 42.0%.
Women in Greene County earn 58.0 cents for every dollar earned by a man.
What is Family Income Deficit in Greene County?
Family Income Deficit in Greene County is $11,297.
Families that are below poverty line in Greene County earn $11,297 less on average than the poverty threshold level.
What is Inequality or Gini Index in Greene County?
Inequality or Gini Index in Greene County is 0.43.
What is the Total Population of Greene County?
Total Population of Greene County is 35,781.
What is the Total Male Population of Greene County?
Total Male Population of Greene County is 18,713.
What is the Total Female Population of Greene County?
Total Female Population of Greene County is 17,068.
What is the Ratio of Males per 100 Females in Greene County?
There are 109.64 Males per 100 Females in Greene County.
What is the Ratio of Females per 100 Males in Greene County?
There are 91.21 Females per 100 Males in Greene County.
What is the Median Population Age in Greene County?
Median Population Age in Greene County is 43.1 Years.
What is the Average Family Size in Greene County
Average Family Size in Greene County is 2.9 People.
What is the Average Household Size in Greene County
Average Household Size in Greene County is 2.3 People.
How Large is the Labor Force in Greene County?
There are 15,016 People in the Labor Forcein in Greene County.
What is the Percentage of People in the Labor Force in Greene County?
50.3% of People are in the Labor Force in Greene County.
What is the Unemployment Rate in Greene County?
Unemployment Rate in Greene County is 5.2%.