Fulton County, PA Map & Demographics
Fulton County Map
Fulton County Overview
$33,601
PER CAPITA INCOME
$77,817
AVG FAMILY INCOME
$63,153
AVG HOUSEHOLD INCOME
33.8%
WAGE / INCOME GAP [ % ]
66.2¢/ $1
WAGE / INCOME GAP [ $ ]
$9,031
FAMILY INCOME DEFICIT
0.41
INEQUALITY / GINI INDEX
14,545
TOTAL POPULATION
7,485
MALE POPULATION
7,060
FEMALE POPULATION
106.02
MALES / 100 FEMALES
94.32
FEMALES / 100 MALES
45.7
MEDIAN AGE
2.9
AVG FAMILY SIZE
2.4
AVG HOUSEHOLD SIZE
7,138
LABOR FORCE [ PEOPLE ]
59.1%
PERCENT IN LABOR FORCE
3.7%
UNEMPLOYMENT RATE
Income in Fulton County
Income Overview in Fulton County
Per Capita Income in Fulton County is $33,601, while median incomes of families and households are $77,817 and $63,153 respectively.
| Characteristic | Number | Measure |
| Per Capita Income | 14,545 | $33,601 |
| Median Family Income | 4,112 | $77,817 |
| Mean Family Income | 4,112 | $91,227 |
| Median Household Income | 6,126 | $63,153 |
| Mean Household Income | 6,126 | $77,650 |
| Income Deficit | 4,112 | $9,031 |
| Wage / Income Gap (%) | 14,545 | 33.83% |
| Wage / Income Gap ($) | 14,545 | 66.17¢ per $1 |
| Gini / Inequality Index | 14,545 | 0.41 |
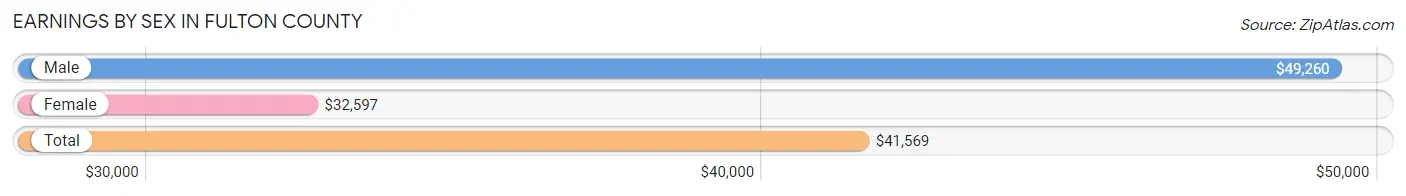
Earnings by Sex in Fulton County
Average Earnings in Fulton County are $41,569, $49,260 for men and $32,597 for women, a difference of 33.8%.
| Sex | Number | Average Earnings |
| Male | 4,240 (56.2%) | $49,260 |
| Female | 3,301 (43.8%) | $32,597 |
| Total | 7,541 (100.0%) | $41,569 |
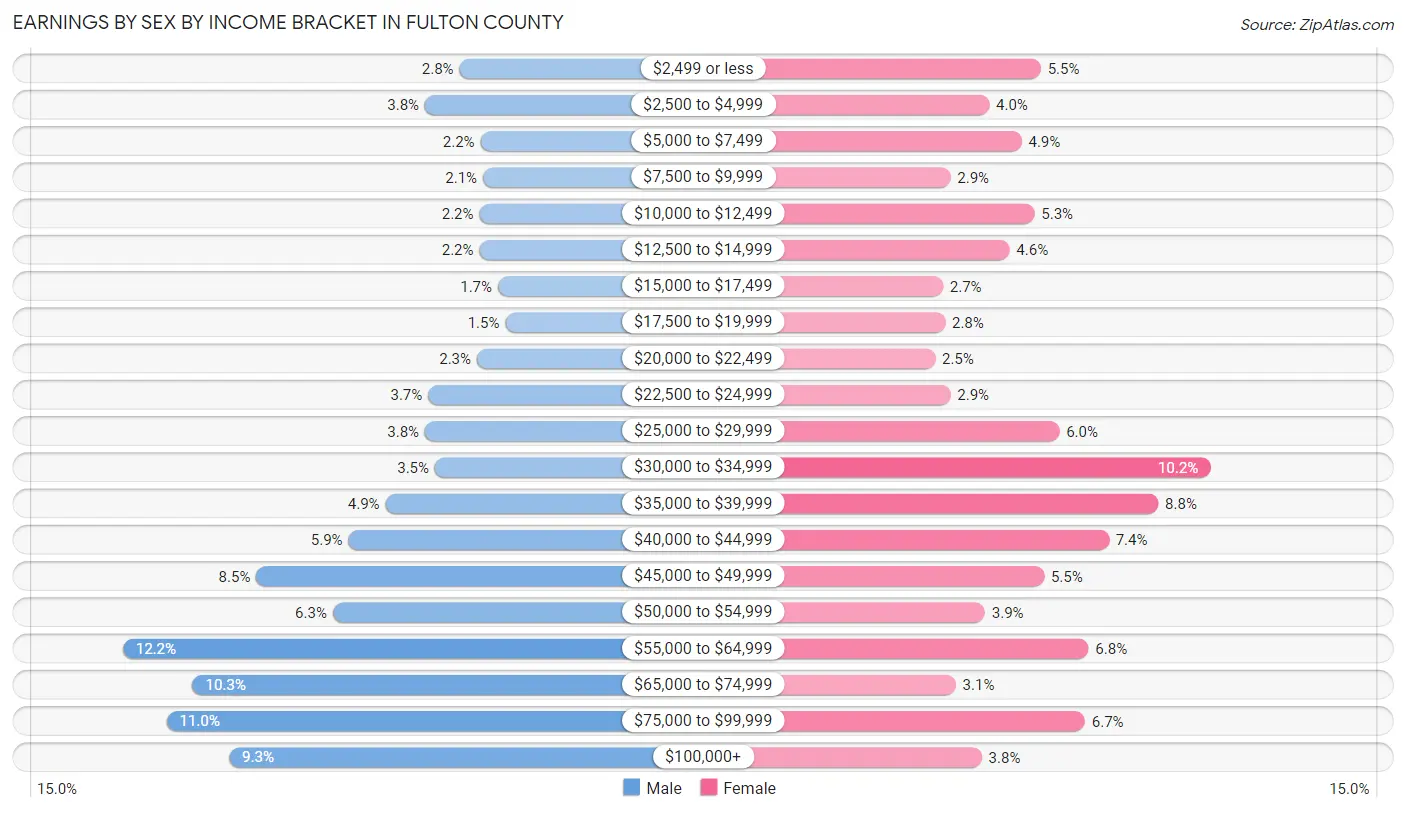
Earnings by Sex by Income Bracket in Fulton County
The most common earnings brackets in Fulton County are $55,000 to $64,999 for men (519 | 12.2%) and $30,000 to $34,999 for women (337 | 10.2%).
| Income | Male | Female |
| $2,499 or less | 118 (2.8%) | 180 (5.4%) |
| $2,500 to $4,999 | 159 (3.7%) | 132 (4.0%) |
| $5,000 to $7,499 | 93 (2.2%) | 162 (4.9%) |
| $7,500 to $9,999 | 90 (2.1%) | 96 (2.9%) |
| $10,000 to $12,499 | 94 (2.2%) | 174 (5.3%) |
| $12,500 to $14,999 | 94 (2.2%) | 151 (4.6%) |
| $15,000 to $17,499 | 72 (1.7%) | 89 (2.7%) |
| $17,500 to $19,999 | 63 (1.5%) | 91 (2.8%) |
| $20,000 to $22,499 | 97 (2.3%) | 82 (2.5%) |
| $22,500 to $24,999 | 155 (3.7%) | 96 (2.9%) |
| $25,000 to $29,999 | 159 (3.7%) | 197 (6.0%) |
| $30,000 to $34,999 | 147 (3.5%) | 337 (10.2%) |
| $35,000 to $39,999 | 206 (4.9%) | 289 (8.7%) |
| $40,000 to $44,999 | 250 (5.9%) | 243 (7.4%) |
| $45,000 to $49,999 | 360 (8.5%) | 183 (5.5%) |
| $50,000 to $54,999 | 269 (6.3%) | 128 (3.9%) |
| $55,000 to $64,999 | 519 (12.2%) | 224 (6.8%) |
| $65,000 to $74,999 | 436 (10.3%) | 101 (3.1%) |
| $75,000 to $99,999 | 467 (11.0%) | 221 (6.7%) |
| $100,000+ | 392 (9.2%) | 125 (3.8%) |
| Total | 4,240 (100.0%) | 3,301 (100.0%) |
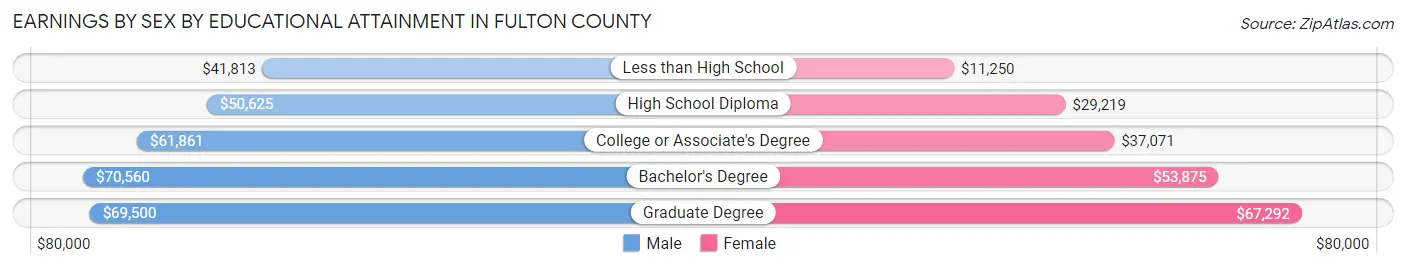
Earnings by Sex by Educational Attainment in Fulton County
Average earnings in Fulton County are $54,665 for men and $35,685 for women, a difference of 34.7%. Men with an educational attainment of bachelor's degree enjoy the highest average annual earnings of $70,560, while those with less than high school education earn the least with $41,813. Women with an educational attainment of graduate degree earn the most with the average annual earnings of $67,292, while those with less than high school education have the smallest earnings of $11,250.
| Educational Attainment | Male Income | Female Income |
| Less than High School | $41,813 | $11,250 |
| High School Diploma | $50,625 | $29,219 |
| College or Associate's Degree | $61,861 | $37,071 |
| Bachelor's Degree | $70,560 | $53,875 |
| Graduate Degree | $69,500 | $67,292 |
| Total | $54,665 | $35,685 |
Family Income in Fulton County
Family Income Brackets in Fulton County
According to the Fulton County family income data, there are 946 families falling into the $100,000 to $149,999 income range, which is the most common income bracket and makes up 23.0% of all families. Conversely, the less than $10,000 income bracket is the least frequent group with only 78 families (1.9%) belonging to this category.
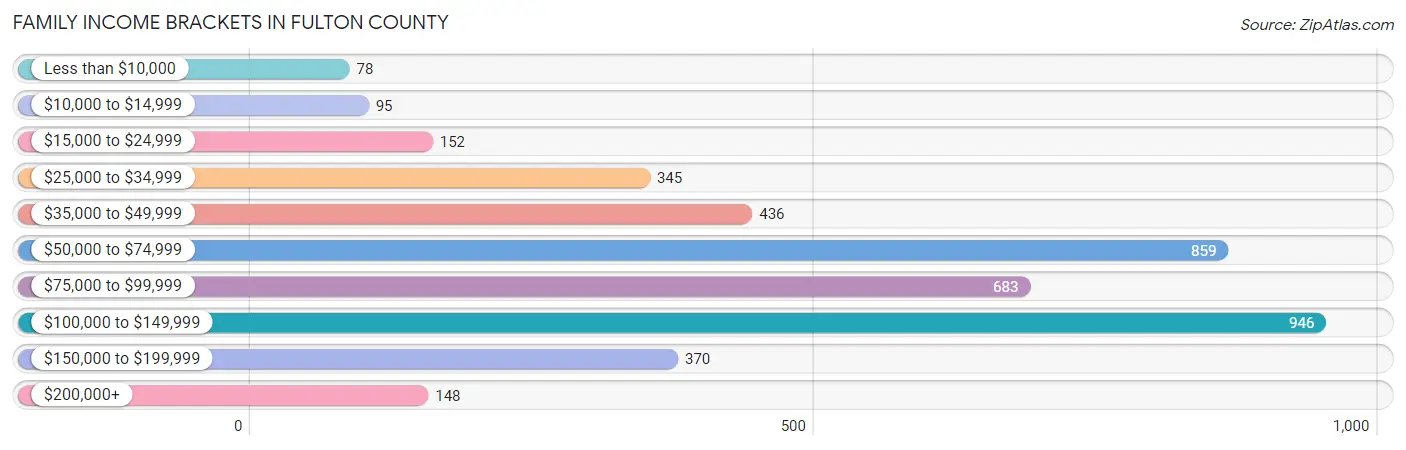
| Income Bracket | # Families | % Families |
| Less than $10,000 | 78 | 1.9% |
| $10,000 to $14,999 | 95 | 2.3% |
| $15,000 to $24,999 | 152 | 3.7% |
| $25,000 to $34,999 | 345 | 8.4% |
| $35,000 to $49,999 | 436 | 10.6% |
| $50,000 to $74,999 | 859 | 20.9% |
| $75,000 to $99,999 | 683 | 16.6% |
| $100,000 to $149,999 | 946 | 23.0% |
| $150,000 to $199,999 | 370 | 9.0% |
| $200,000+ | 148 | 3.6% |
Family Income by Famaliy Size in Fulton County
5-person families (352 | 8.6%) account for the highest median family income in Fulton County with $113,125 per family, while 2-person families (2,135 | 51.9%) have the highest median income of $34,375 per family member.
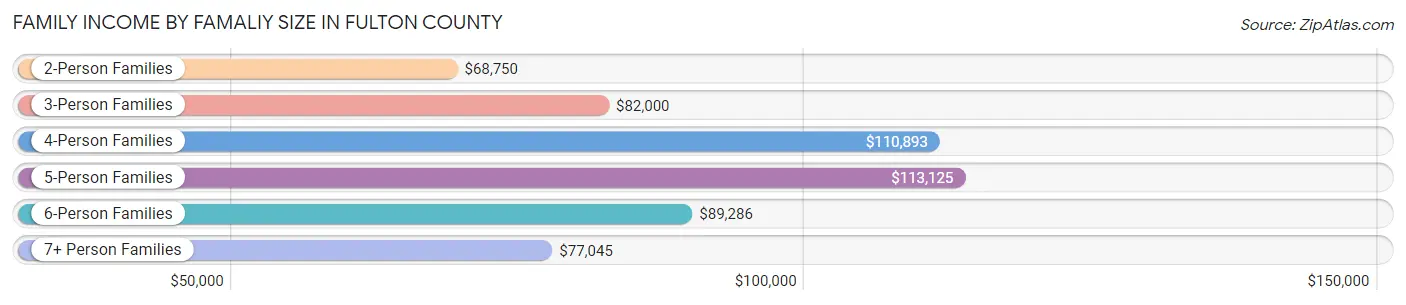
| Income Bracket | # Families | Median Income |
| 2-Person Families | 2,135 (51.9%) | $68,750 |
| 3-Person Families | 886 (21.5%) | $82,000 |
| 4-Person Families | 613 (14.9%) | $110,893 |
| 5-Person Families | 352 (8.6%) | $113,125 |
| 6-Person Families | 76 (1.8%) | $89,286 |
| 7+ Person Families | 50 (1.2%) | $77,045 |
| Total | 4,112 (100.0%) | $77,817 |
Family Income by Number of Earners in Fulton County
The median family income in Fulton County is $77,817, with families comprising 3+ earners (515) having the highest median family income of $124,191, while families with no earners (744) have the lowest median family income of $40,577, accounting for 12.5% and 18.1% of families, respectively.
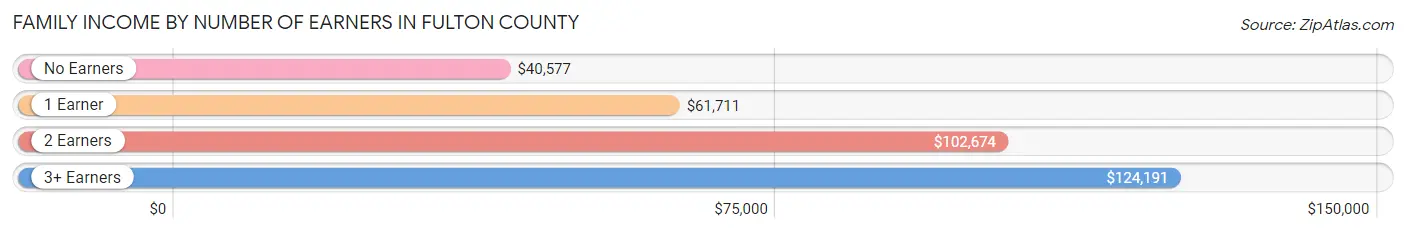
| Number of Earners | # Families | Median Income |
| No Earners | 744 (18.1%) | $40,577 |
| 1 Earner | 1,296 (31.5%) | $61,711 |
| 2 Earners | 1,557 (37.9%) | $102,674 |
| 3+ Earners | 515 (12.5%) | $124,191 |
| Total | 4,112 (100.0%) | $77,817 |
Household Income in Fulton County
Household Income Brackets in Fulton County
With 1,158 households falling in the category, the $100,000 to $149,999 income range is the most frequent in Fulton County, accounting for 18.9% of all households. In contrast, only 165 households (2.7%) fall into the $200,000+ income bracket, making it the least populous group.
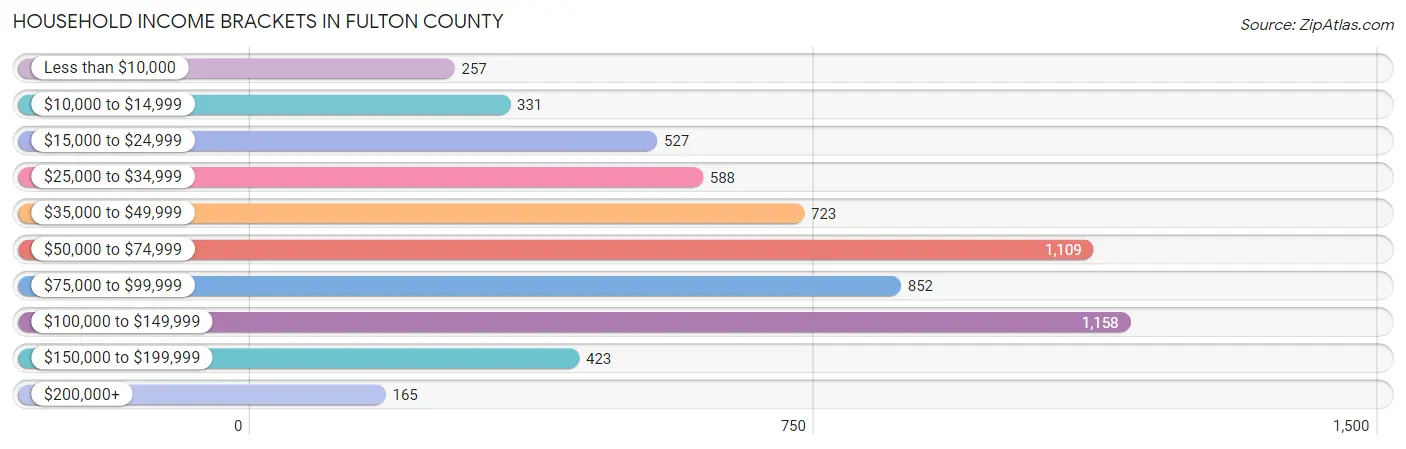
| Income Bracket | # Households | % Households |
| Less than $10,000 | 257 | 4.2% |
| $10,000 to $14,999 | 331 | 5.4% |
| $15,000 to $24,999 | 527 | 8.6% |
| $25,000 to $34,999 | 588 | 9.6% |
| $35,000 to $49,999 | 723 | 11.8% |
| $50,000 to $74,999 | 1,109 | 18.1% |
| $75,000 to $99,999 | 852 | 13.9% |
| $100,000 to $149,999 | 1,158 | 18.9% |
| $150,000 to $199,999 | 423 | 6.9% |
| $200,000+ | 165 | 2.7% |
Household Income by Householder Age in Fulton County
The median household income in Fulton County is $63,153, with the highest median household income of $86,250 found in the 25 to 44 years age bracket for the primary householder. A total of 1,465 households (23.9%) fall into this category. Meanwhile, the 65+ years age bracket for the primary householder has the lowest median household income of $43,030, with 2,021 households (33.0%) in this group.
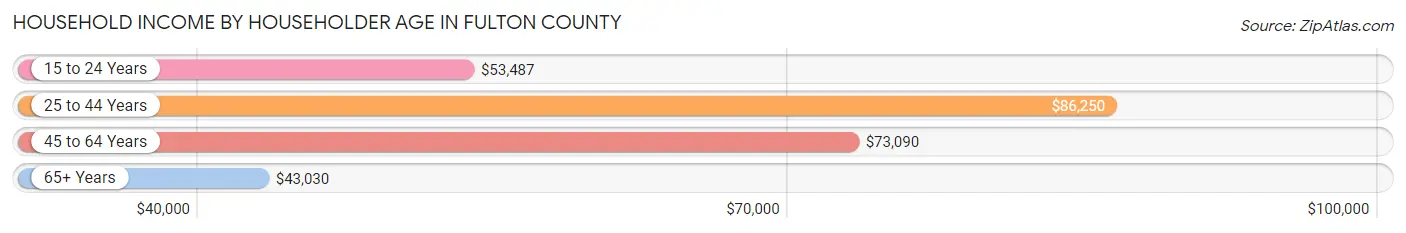
| Income Bracket | # Households | Median Income |
| 15 to 24 Years | 151 (2.5%) | $53,487 |
| 25 to 44 Years | 1,465 (23.9%) | $86,250 |
| 45 to 64 Years | 2,489 (40.6%) | $73,090 |
| 65+ Years | 2,021 (33.0%) | $43,030 |
| Total | 6,126 (100.0%) | $63,153 |
Poverty in Fulton County
Income Below Poverty by Sex and Age in Fulton County
With 9.5% poverty level for males and 11.9% for females among the residents of Fulton County, under 5 year old males and 5 year old females are the most vulnerable to poverty, with 77 males (21.6%) and 18 females (27.3%) in their respective age groups living below the poverty level.
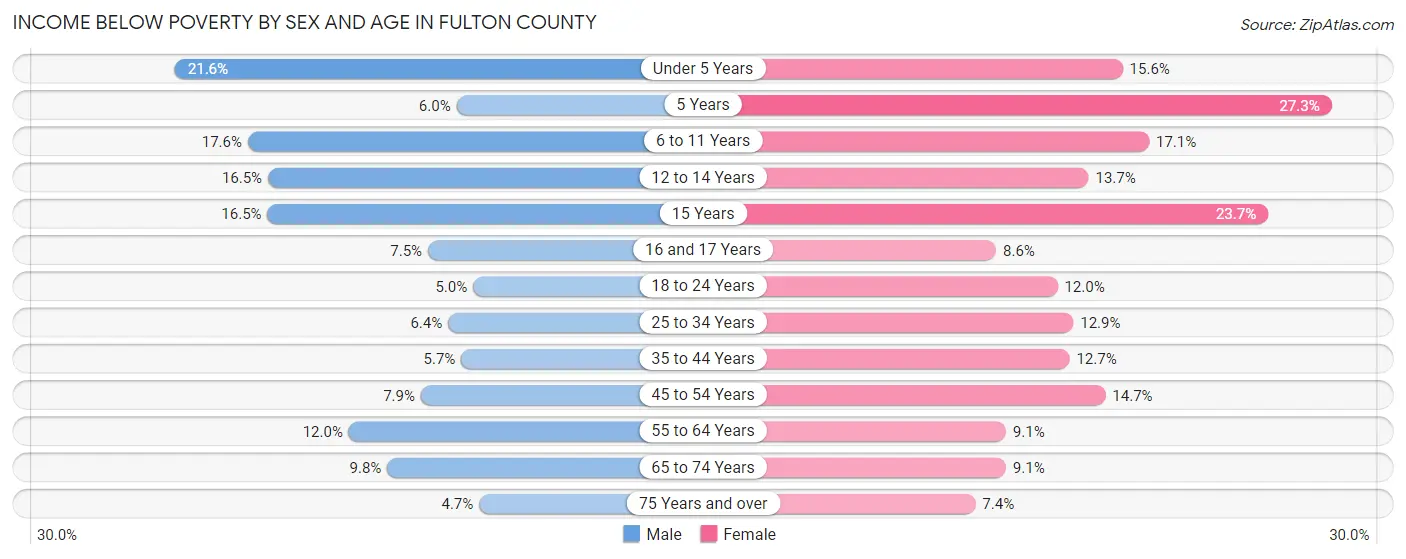
| Age Bracket | Male | Female |
| Under 5 Years | 77 (21.6%) | 51 (15.6%) |
| 5 Years | 5 (5.9%) | 18 (27.3%) |
| 6 to 11 Years | 78 (17.6%) | 83 (17.1%) |
| 12 to 14 Years | 51 (16.5%) | 29 (13.7%) |
| 15 Years | 15 (16.5%) | 14 (23.7%) |
| 16 and 17 Years | 15 (7.5%) | 17 (8.6%) |
| 18 to 24 Years | 29 (5.0%) | 61 (12.0%) |
| 25 to 34 Years | 53 (6.4%) | 96 (12.9%) |
| 35 to 44 Years | 49 (5.7%) | 98 (12.7%) |
| 45 to 54 Years | 84 (7.9%) | 138 (14.7%) |
| 55 to 64 Years | 140 (11.9%) | 94 (9.1%) |
| 65 to 74 Years | 86 (9.8%) | 82 (9.1%) |
| 75 Years and over | 28 (4.7%) | 59 (7.4%) |
| Total | 710 (9.5%) | 840 (11.9%) |
Income Above Poverty by Sex and Age in Fulton County
According to the poverty statistics in Fulton County, males aged 75 years and over and females aged 75 years and over are the age groups that are most secure financially, with 95.3% of males and 92.6% of females in these age groups living above the poverty line.
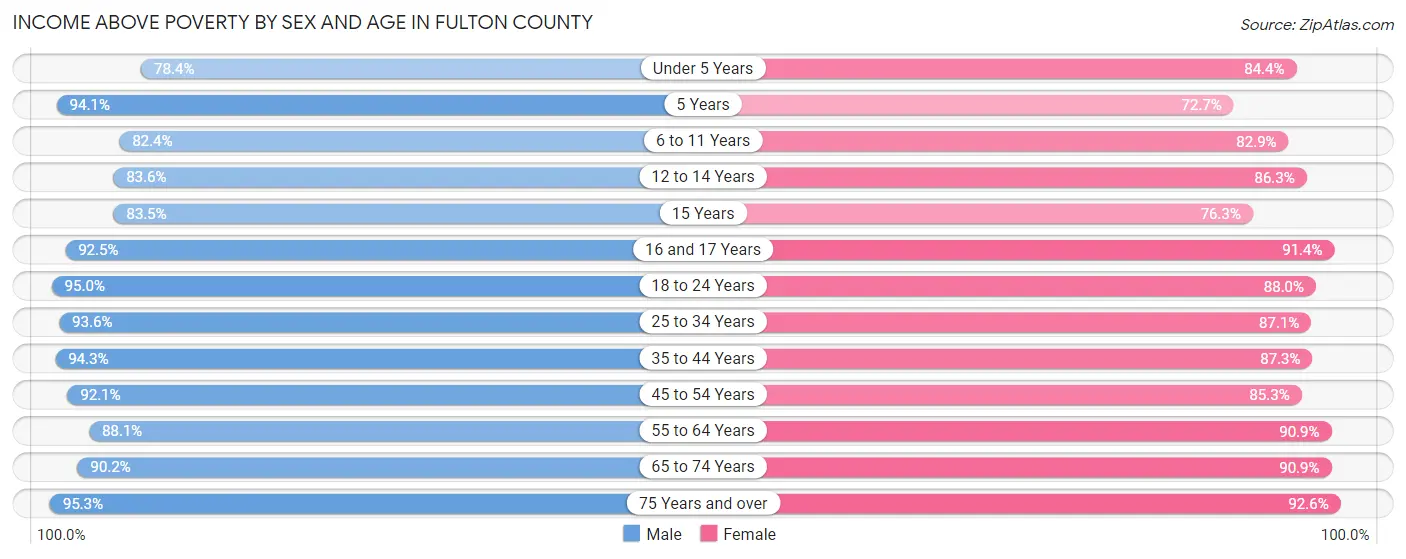
| Age Bracket | Male | Female |
| Under 5 Years | 279 (78.4%) | 275 (84.4%) |
| 5 Years | 79 (94.1%) | 48 (72.7%) |
| 6 to 11 Years | 366 (82.4%) | 402 (82.9%) |
| 12 to 14 Years | 259 (83.6%) | 182 (86.3%) |
| 15 Years | 76 (83.5%) | 45 (76.3%) |
| 16 and 17 Years | 184 (92.5%) | 181 (91.4%) |
| 18 to 24 Years | 548 (95.0%) | 447 (88.0%) |
| 25 to 34 Years | 772 (93.6%) | 649 (87.1%) |
| 35 to 44 Years | 812 (94.3%) | 675 (87.3%) |
| 45 to 54 Years | 974 (92.1%) | 802 (85.3%) |
| 55 to 64 Years | 1,032 (88.0%) | 934 (90.9%) |
| 65 to 74 Years | 791 (90.2%) | 815 (90.9%) |
| 75 Years and over | 569 (95.3%) | 734 (92.6%) |
| Total | 6,741 (90.5%) | 6,189 (88.0%) |
Income Below Poverty Among Married-Couple Families in Fulton County
The poverty statistics for married-couple families in Fulton County show that 5.0% or 163 of the total 3,285 families live below the poverty line. Families with 5 or more children have the highest poverty rate of 17.6%, comprising of 6 families. On the other hand, families with no children have the lowest poverty rate of 4.3%, which includes 91 families.
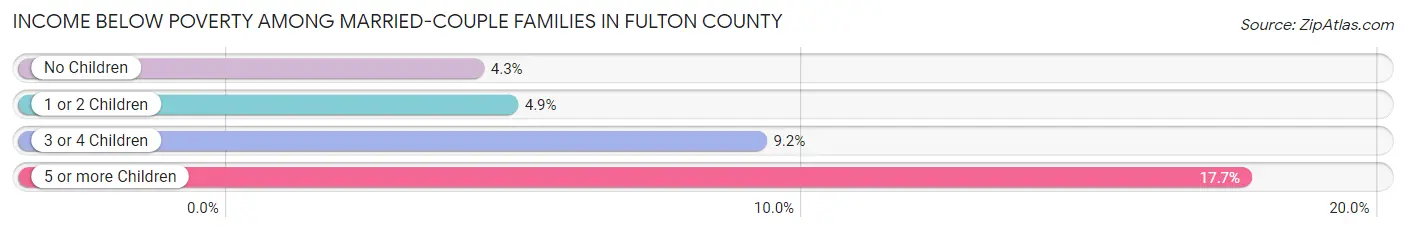
| Children | Above Poverty | Below Poverty |
| No Children | 2,037 (95.7%) | 91 (4.3%) |
| 1 or 2 Children | 820 (95.1%) | 42 (4.9%) |
| 3 or 4 Children | 237 (90.8%) | 24 (9.2%) |
| 5 or more Children | 28 (82.4%) | 6 (17.6%) |
| Total | 3,122 (95.0%) | 163 (5.0%) |
Income Below Poverty Among Single-Parent Households in Fulton County
According to the poverty data in Fulton County, 4.0% or 10 single-father households and 26.7% or 154 single-mother households are living below the poverty line. Among single-father households, those with 3 or 4 children have the highest poverty rate, with 3 households (50.0%) experiencing poverty. Likewise, among single-mother households, those with 3 or 4 children have the highest poverty rate, with 66 households (82.5%) falling below the poverty line.
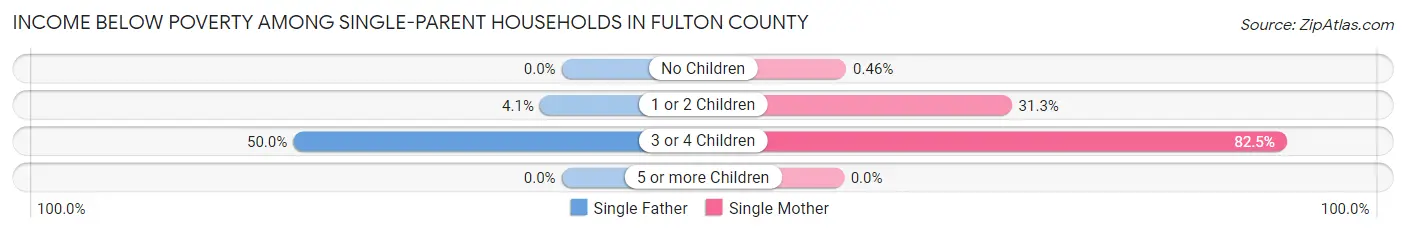
| Children | Single Father | Single Mother |
| No Children | 0 (0.0%) | 1 (0.5%) |
| 1 or 2 Children | 7 (4.1%) | 87 (31.3%) |
| 3 or 4 Children | 3 (50.0%) | 66 (82.5%) |
| 5 or more Children | 0 (0.0%) | 0 (0.0%) |
| Total | 10 (4.0%) | 154 (26.7%) |
Income Below Poverty Among Married-Couple vs Single-Parent Households in Fulton County
The poverty data for Fulton County shows that 163 of the married-couple family households (5.0%) and 164 of the single-parent households (19.8%) are living below the poverty level. Within the married-couple family households, those with 5 or more children have the highest poverty rate, with 6 households (17.6%) falling below the poverty line. Among the single-parent households, those with 3 or 4 children have the highest poverty rate, with 69 household (80.2%) living below poverty.
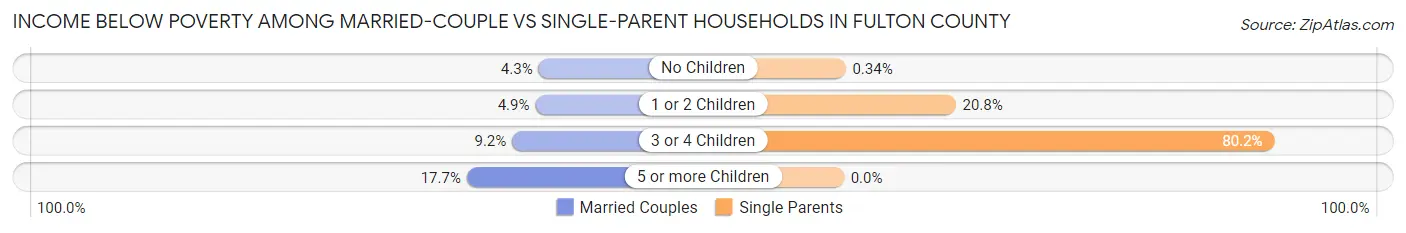
| Children | Married-Couple Families | Single-Parent Households |
| No Children | 91 (4.3%) | 1 (0.3%) |
| 1 or 2 Children | 42 (4.9%) | 94 (20.8%) |
| 3 or 4 Children | 24 (9.2%) | 69 (80.2%) |
| 5 or more Children | 6 (17.6%) | 0 (0.0%) |
| Total | 163 (5.0%) | 164 (19.8%) |
Race in Fulton County
The most populous races in Fulton County are White / Caucasian (13,782 | 94.8%), Two or more Races (301 | 2.1%), and Some other Race (224 | 1.5%).
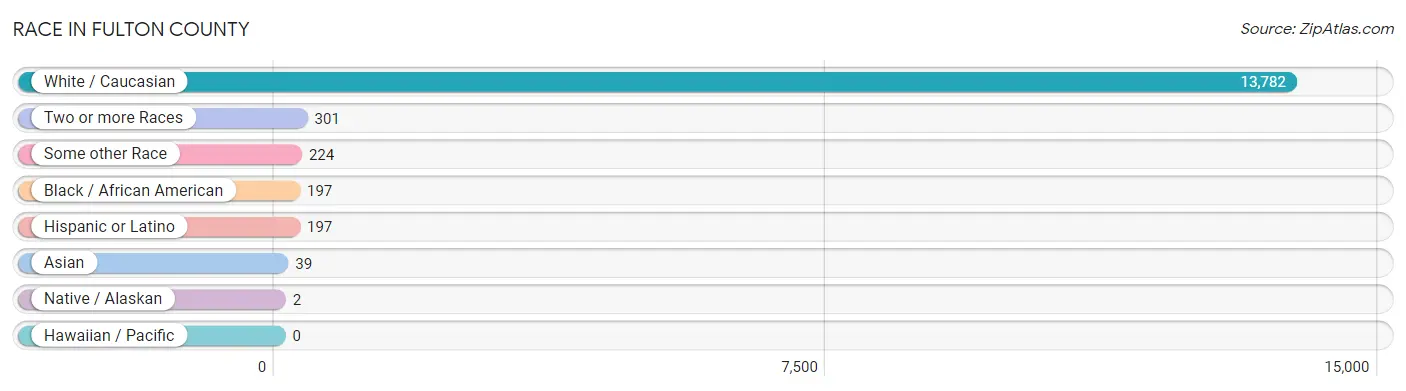
| Race | # Population | % Population |
| Asian | 39 | 0.3% |
| Black / African American | 197 | 1.3% |
| Hawaiian / Pacific | 0 | 0.0% |
| Hispanic or Latino | 197 | 1.3% |
| Native / Alaskan | 2 | 0.0% |
| White / Caucasian | 13,782 | 94.8% |
| Two or more Races | 301 | 2.1% |
| Some other Race | 224 | 1.5% |
| Total | 14,545 | 100.0% |
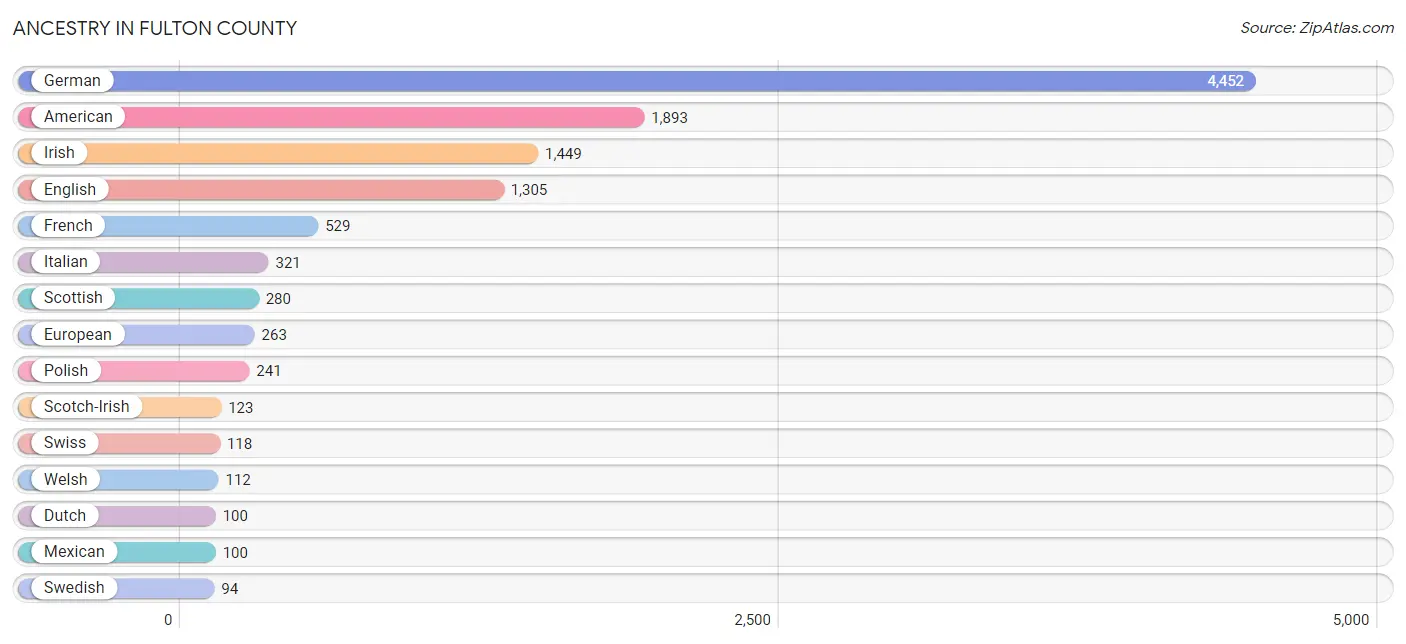
Ancestry in Fulton County
The most populous ancestries reported in Fulton County are German (4,452 | 30.6%), American (1,893 | 13.0%), Irish (1,449 | 10.0%), English (1,305 | 9.0%), and French (529 | 3.6%), together accounting for 66.2% of all Fulton County residents.
| Ancestry | # Population | % Population |
| African | 36 | 0.3% |
| American | 1,893 | 13.0% |
| Arab | 2 | 0.0% |
| Australian | 6 | 0.0% |
| Austrian | 18 | 0.1% |
| Belgian | 3 | 0.0% |
| Blackfeet | 1 | 0.0% |
| British | 28 | 0.2% |
| Burmese | 12 | 0.1% |
| Central American | 27 | 0.2% |
| Cherokee | 26 | 0.2% |
| Chippewa | 1 | 0.0% |
| Choctaw | 3 | 0.0% |
| Croatian | 6 | 0.0% |
| Crow | 1 | 0.0% |
| Cuban | 2 | 0.0% |
| Czech | 14 | 0.1% |
| Czechoslovakian | 6 | 0.0% |
| Danish | 12 | 0.1% |
| Delaware | 2 | 0.0% |
| Dutch | 100 | 0.7% |
| Eastern European | 8 | 0.1% |
| English | 1,305 | 9.0% |
| European | 263 | 1.8% |
| Finnish | 7 | 0.1% |
| French | 529 | 3.6% |
| French Canadian | 34 | 0.2% |
| German | 4,452 | 30.6% |
| Greek | 27 | 0.2% |
| Guatemalan | 15 | 0.1% |
| Haitian | 10 | 0.1% |
| Hungarian | 25 | 0.2% |
| Indian (Asian) | 45 | 0.3% |
| Irish | 1,449 | 10.0% |
| Iroquois | 6 | 0.0% |
| Italian | 321 | 2.2% |
| Latvian | 2 | 0.0% |
| Lebanese | 2 | 0.0% |
| Lithuanian | 8 | 0.1% |
| Mexican | 100 | 0.7% |
| Native Hawaiian | 6 | 0.0% |
| Nicaraguan | 12 | 0.1% |
| Norwegian | 15 | 0.1% |
| Pennsylvania German | 56 | 0.4% |
| Polish | 241 | 1.7% |
| Portuguese | 3 | 0.0% |
| Puerto Rican | 54 | 0.4% |
| Romanian | 20 | 0.1% |
| Russian | 41 | 0.3% |
| Scandinavian | 47 | 0.3% |
| Scotch-Irish | 123 | 0.9% |
| Scottish | 280 | 1.9% |
| Sioux | 5 | 0.0% |
| Slavic | 12 | 0.1% |
| Slovak | 19 | 0.1% |
| Subsaharan African | 36 | 0.3% |
| Swedish | 94 | 0.6% |
| Swiss | 118 | 0.8% |
| Ukrainian | 11 | 0.1% |
| Welsh | 112 | 0.8% |
| Yugoslavian | 2 | 0.0% | View All 61 Rows |
Immigrants in Fulton County
The most numerous immigrant groups reported in Fulton County came from Latin America (44 | 0.3%), Central America (34 | 0.2%), Europe (27 | 0.2%), Africa (22 | 0.2%), and Western Africa (22 | 0.2%), together accounting for 1.0% of all Fulton County residents.
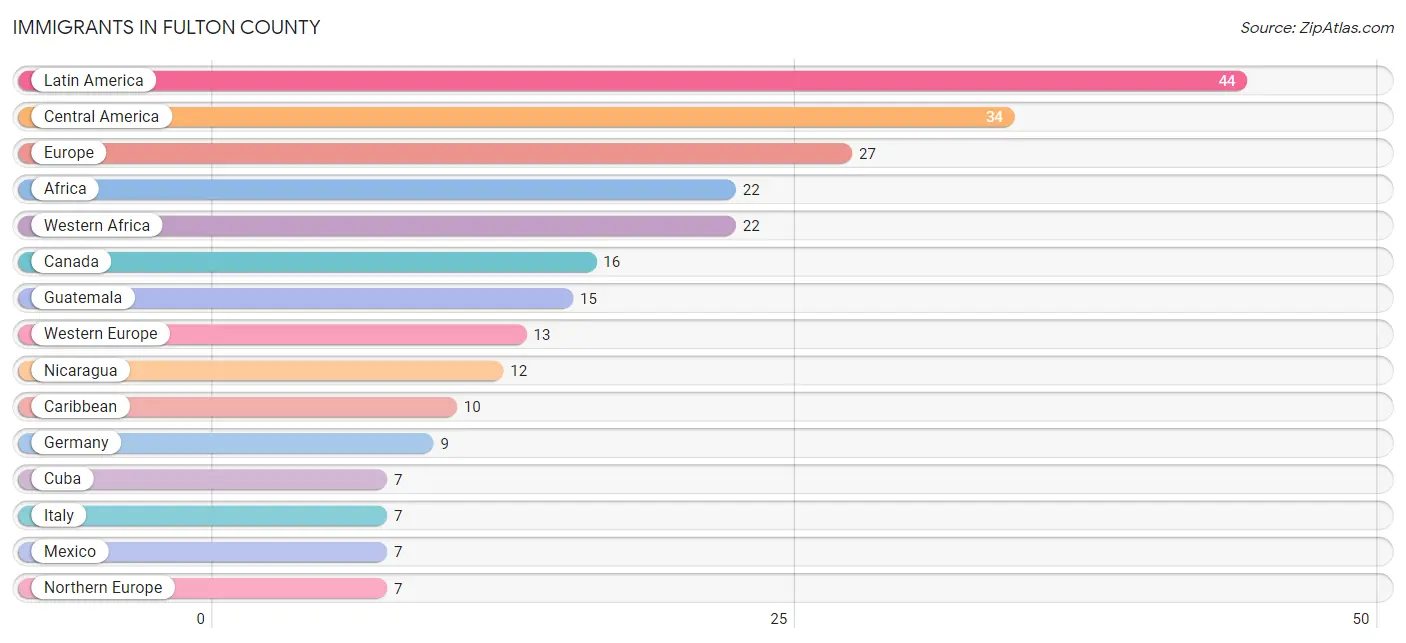
| Immigration Origin | # Population | % Population |
| Africa | 22 | 0.2% |
| Asia | 2 | 0.0% |
| Australia | 2 | 0.0% |
| Canada | 16 | 0.1% |
| Caribbean | 10 | 0.1% |
| Central America | 34 | 0.2% |
| Cuba | 7 | 0.1% |
| Denmark | 4 | 0.0% |
| England | 2 | 0.0% |
| Europe | 27 | 0.2% |
| Germany | 9 | 0.1% |
| Guatemala | 15 | 0.1% |
| Haiti | 3 | 0.0% |
| Italy | 7 | 0.1% |
| Kazakhstan | 2 | 0.0% |
| Latin America | 44 | 0.3% |
| Mexico | 7 | 0.1% |
| Netherlands | 4 | 0.0% |
| Nicaragua | 12 | 0.1% |
| Northern Europe | 7 | 0.1% |
| Oceania | 2 | 0.0% |
| Scotland | 1 | 0.0% |
| South Central Asia | 2 | 0.0% |
| Southern Europe | 7 | 0.1% |
| Western Africa | 22 | 0.2% |
| Western Europe | 13 | 0.1% | View All 26 Rows |
Sex and Age in Fulton County
Sex and Age in Fulton County
The most populous age groups in Fulton County are 60 to 64 Years (596 | 8.0%) for men and 55 to 59 Years (524 | 7.4%) for women.
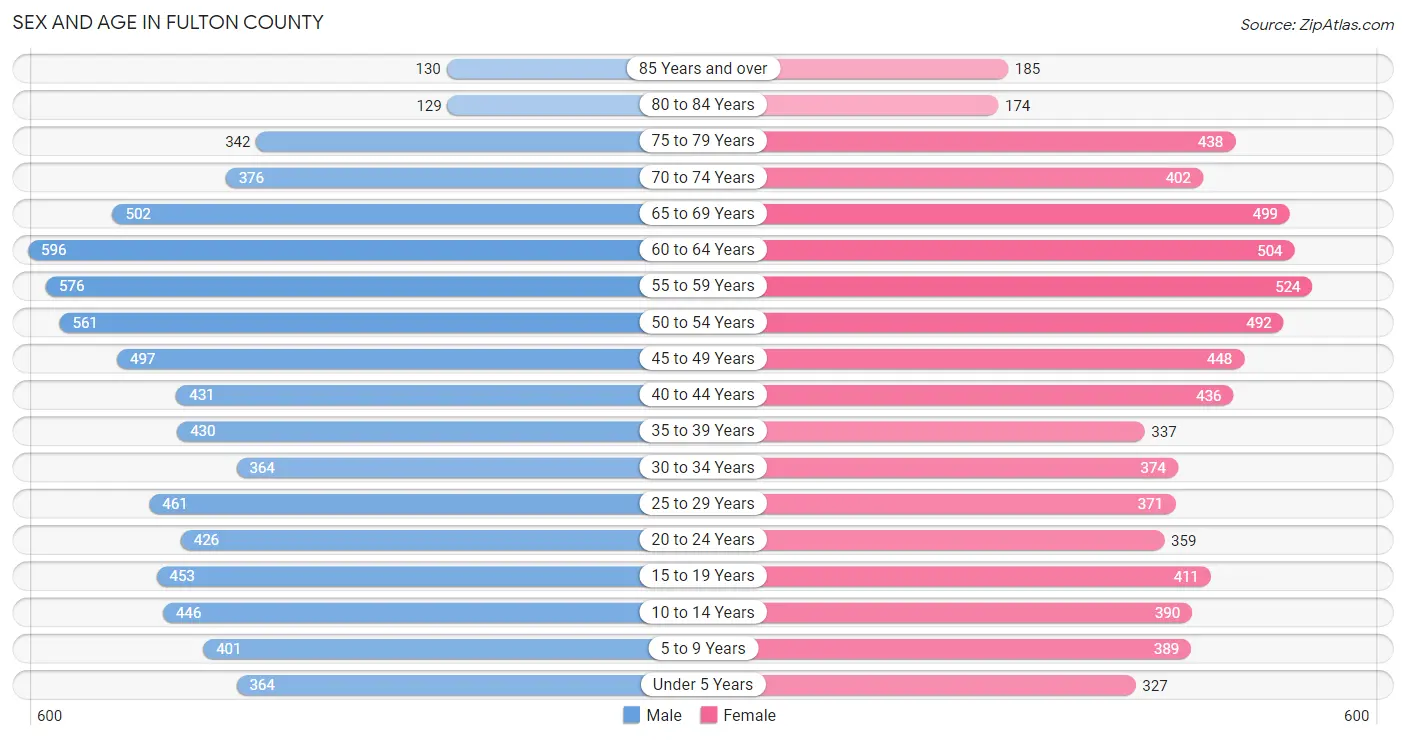
| Age Bracket | Male | Female |
| Under 5 Years | 364 (4.9%) | 327 (4.6%) |
| 5 to 9 Years | 401 (5.4%) | 389 (5.5%) |
| 10 to 14 Years | 446 (6.0%) | 390 (5.5%) |
| 15 to 19 Years | 453 (6.0%) | 411 (5.8%) |
| 20 to 24 Years | 426 (5.7%) | 359 (5.1%) |
| 25 to 29 Years | 461 (6.2%) | 371 (5.2%) |
| 30 to 34 Years | 364 (4.9%) | 374 (5.3%) |
| 35 to 39 Years | 430 (5.7%) | 337 (4.8%) |
| 40 to 44 Years | 431 (5.8%) | 436 (6.2%) |
| 45 to 49 Years | 497 (6.6%) | 448 (6.4%) |
| 50 to 54 Years | 561 (7.5%) | 492 (7.0%) |
| 55 to 59 Years | 576 (7.7%) | 524 (7.4%) |
| 60 to 64 Years | 596 (8.0%) | 504 (7.1%) |
| 65 to 69 Years | 502 (6.7%) | 499 (7.1%) |
| 70 to 74 Years | 376 (5.0%) | 402 (5.7%) |
| 75 to 79 Years | 342 (4.6%) | 438 (6.2%) |
| 80 to 84 Years | 129 (1.7%) | 174 (2.5%) |
| 85 Years and over | 130 (1.7%) | 185 (2.6%) |
| Total | 7,485 (100.0%) | 7,060 (100.0%) |
Families and Households in Fulton County
Median Family Size in Fulton County
The median family size in Fulton County is 2.90 persons per family, with married-couple families (3,285 | 79.9%) accounting for the largest median family size of 2.95 persons per family. On the other hand, single male/father families (251 | 6.1%) represent the smallest median family size with 2.42 persons per family.
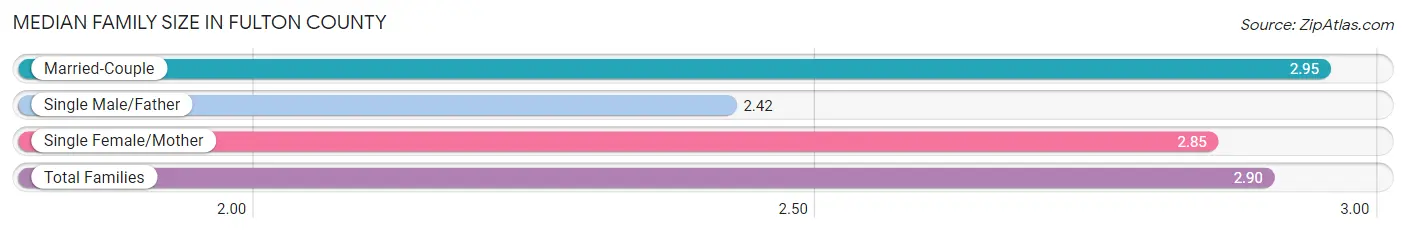
| Family Type | # Families | Family Size |
| Married-Couple | 3,285 (79.9%) | 2.95 |
| Single Male/Father | 251 (6.1%) | 2.42 |
| Single Female/Mother | 576 (14.0%) | 2.85 |
| Total Families | 4,112 (100.0%) | 2.90 |
Median Household Size in Fulton County
The median household size in Fulton County is 2.37 persons per household, with single female/mother households (576 | 9.4%) accounting for the largest median household size of 3.12 persons per household. non-family households (2,014 | 32.9%) represent the smallest median household size with 1.12 persons per household.
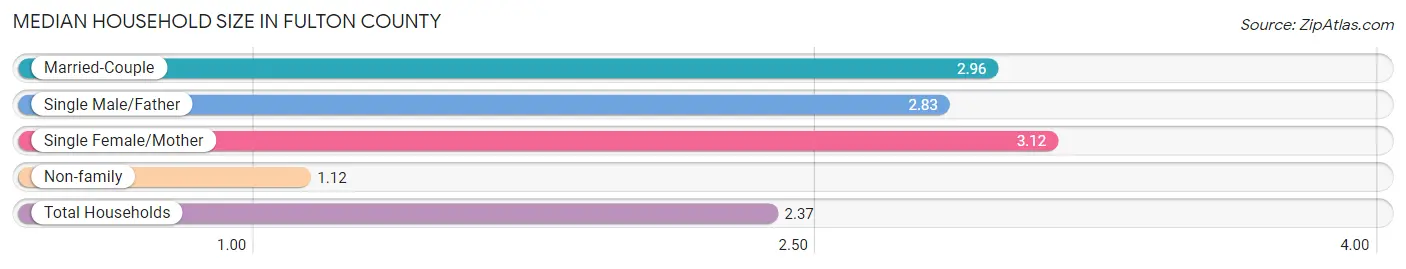
| Household Type | # Households | Household Size |
| Married-Couple | 3,285 (53.6%) | 2.96 |
| Single Male/Father | 251 (4.1%) | 2.83 |
| Single Female/Mother | 576 (9.4%) | 3.12 |
| Non-family | 2,014 (32.9%) | 1.12 |
| Total Households | 6,126 (100.0%) | 2.37 |
Household Size by Marriage Status in Fulton County
Out of a total of 6,126 households in Fulton County, 4,112 (67.1%) are family households, while 2,014 (32.9%) are nonfamily households. The most numerous type of family households are 2-person households, comprising 1,981, and the most common type of nonfamily households are 1-person households, comprising 1,766.
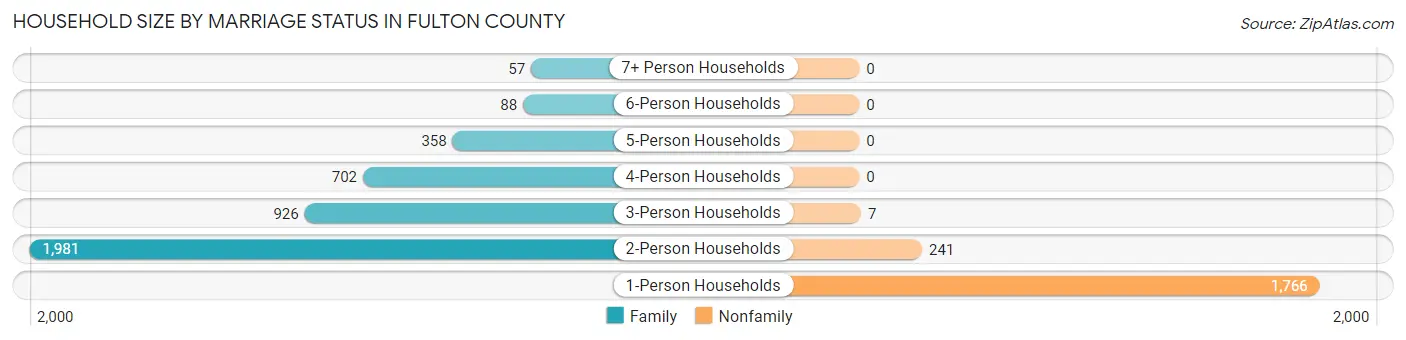
| Household Size | Family Households | Nonfamily Households |
| 1-Person Households | - | 1,766 (28.8%) |
| 2-Person Households | 1,981 (32.3%) | 241 (3.9%) |
| 3-Person Households | 926 (15.1%) | 7 (0.1%) |
| 4-Person Households | 702 (11.5%) | 0 (0.0%) |
| 5-Person Households | 358 (5.8%) | 0 (0.0%) |
| 6-Person Households | 88 (1.4%) | 0 (0.0%) |
| 7+ Person Households | 57 (0.9%) | 0 (0.0%) |
| Total | 4,112 (67.1%) | 2,014 (32.9%) |
Female Fertility in Fulton County
Fertility by Age in Fulton County
Average fertility rate in Fulton County is 56.0 births per 1,000 women. Women in the age bracket of 20 to 34 years have the highest fertility rate with 120.0 births per 1,000 women. Women in the age bracket of 20 to 34 years acount for 84.7% of all women with births.
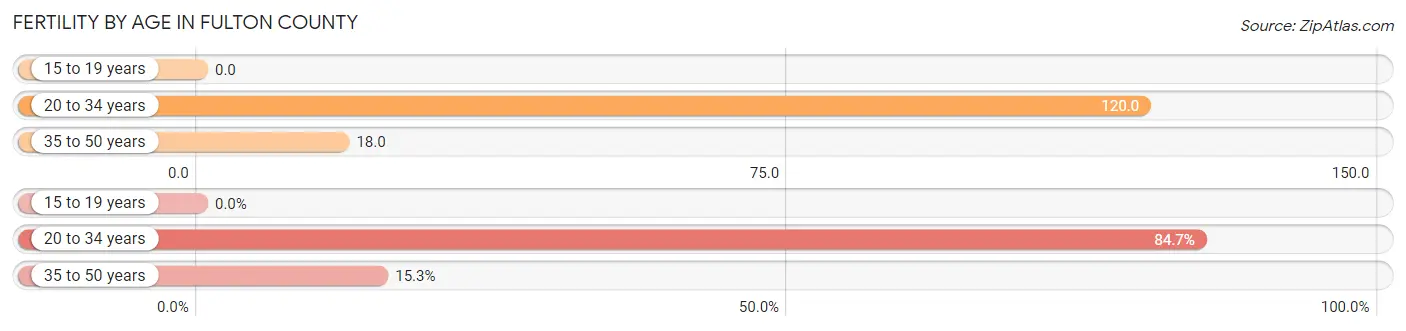
| Age Bracket | Women with Births | Births / 1,000 Women |
| 15 to 19 years | 0 (0.0%) | 0.0 |
| 20 to 34 years | 133 (84.7%) | 120.0 |
| 35 to 50 years | 24 (15.3%) | 18.0 |
| Total | 157 (100.0%) | 56.0 |
Fertility by Age by Marriage Status in Fulton County
44.6% of women with births (157) in Fulton County are married. The highest percentage of unmarried women with births falls into 35 to 50 years age bracket with 87.5% of them unmarried at the time of birth, while the lowest percentage of unmarried women with births belong to 20 to 34 years age bracket with 49.6% of them unmarried.
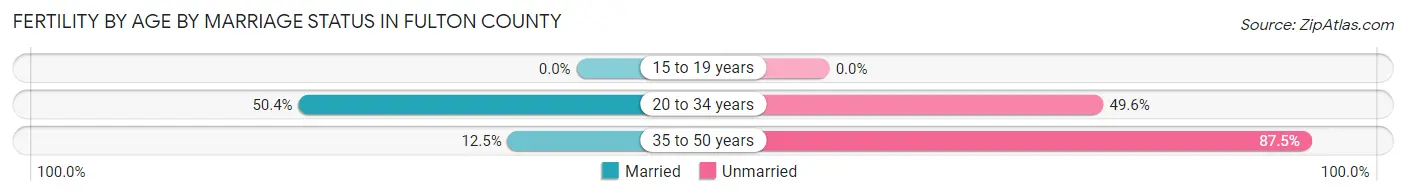
| Age Bracket | Married | Unmarried |
| 15 to 19 years | 0 (0.0%) | 0 (0.0%) |
| 20 to 34 years | 67 (50.4%) | 66 (49.6%) |
| 35 to 50 years | 3 (12.5%) | 21 (87.5%) |
| Total | 70 (44.6%) | 87 (55.4%) |
Fertility by Education in Fulton County
Average fertility rate in Fulton County is 56.0 births per 1,000 women. Women with the education attainment of bachelor's degree have the highest fertility rate of 123.0 births per 1,000 women, while women with the education attainment of less than high school have the lowest fertility at 20.0 births per 1,000 women. Women with the education attainment of high school diploma represent 45.2% of all women with births.
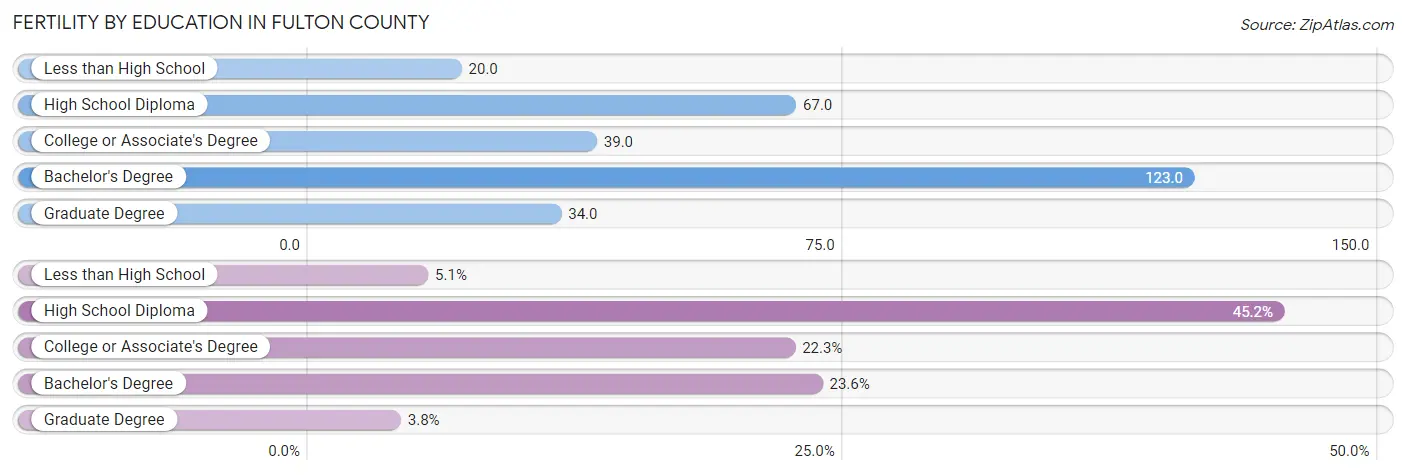
| Educational Attainment | Women with Births | Births / 1,000 Women |
| Less than High School | 8 (5.1%) | 20.0 |
| High School Diploma | 71 (45.2%) | 67.0 |
| College or Associate's Degree | 35 (22.3%) | 39.0 |
| Bachelor's Degree | 37 (23.6%) | 123.0 |
| Graduate Degree | 6 (3.8%) | 34.0 |
| Total | 157 (100.0%) | 56.0 |
Fertility by Education by Marriage Status in Fulton County
55.4% of women with births in Fulton County are unmarried. Women with the educational attainment of graduate degree are most likely to be married with 100.0% of them married at childbirth, while women with the educational attainment of less than high school are least likely to be married with 100.0% of them unmarried at childbirth.
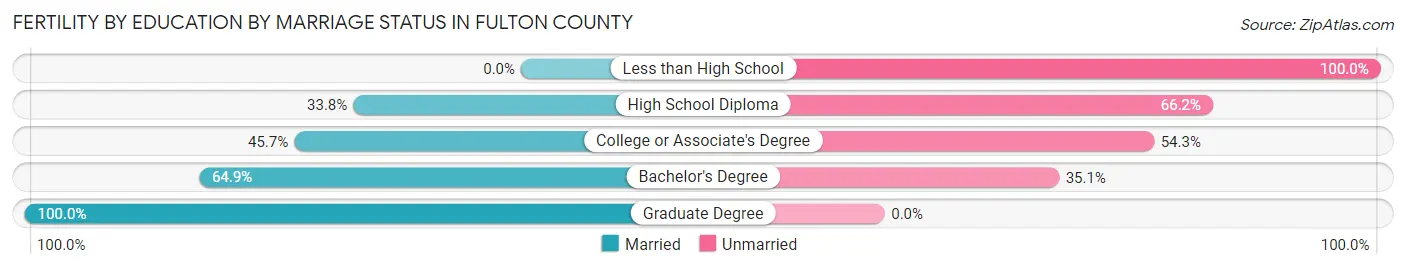
| Educational Attainment | Married | Unmarried |
| Less than High School | 0 (0.0%) | 8 (100.0%) |
| High School Diploma | 24 (33.8%) | 47 (66.2%) |
| College or Associate's Degree | 16 (45.7%) | 19 (54.3%) |
| Bachelor's Degree | 24 (64.9%) | 13 (35.1%) |
| Graduate Degree | 6 (100.0%) | 0 (0.0%) |
| Total | 70 (44.6%) | 87 (55.4%) |
Employment Characteristics in Fulton County
Employment by Class of Employer in Fulton County
Among the 6,793 employed individuals in Fulton County, private company employees (4,562 | 67.2%), not-for-profit organizations (606 | 8.9%), and local government employees (501 | 7.4%) make up the most common classes of employment.
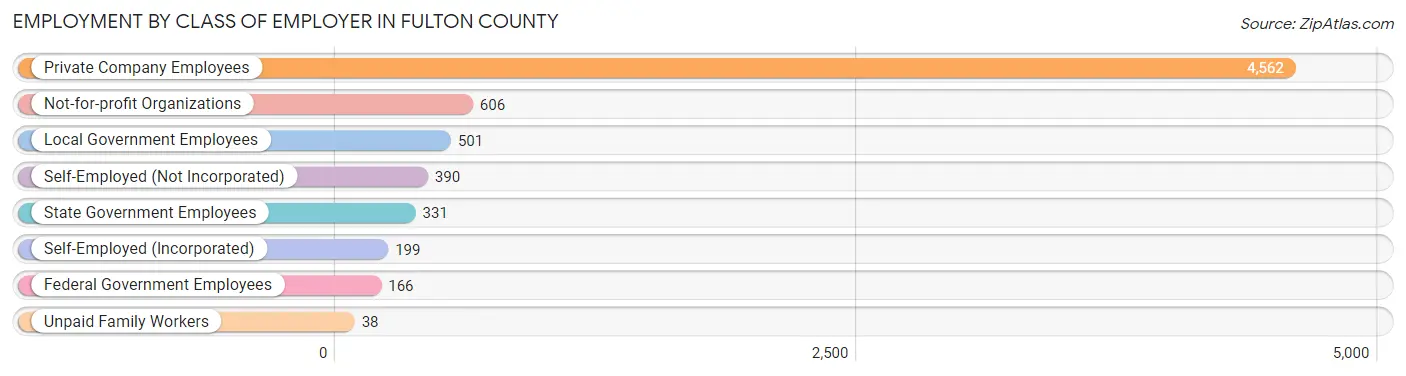
| Employer Class | # Employees | % Employees |
| Private Company Employees | 4,562 | 67.2% |
| Self-Employed (Incorporated) | 199 | 2.9% |
| Self-Employed (Not Incorporated) | 390 | 5.7% |
| Not-for-profit Organizations | 606 | 8.9% |
| Local Government Employees | 501 | 7.4% |
| State Government Employees | 331 | 4.9% |
| Federal Government Employees | 166 | 2.4% |
| Unpaid Family Workers | 38 | 0.6% |
| Total | 6,793 | 100.0% |
Employment Status by Age in Fulton County
According to the labor force statistics for Fulton County, out of the total population over 16 years of age (12,078), 59.1% or 7,138 individuals are in the labor force, with 3.7% or 264 of them unemployed. The age group with the highest labor force participation rate is 25 to 29 years, with 85.2% or 709 individuals in the labor force. Within the labor force, the 16 to 19 years age range has the highest percentage of unemployed individuals, with 7.7% or 28 of them being unemployed.
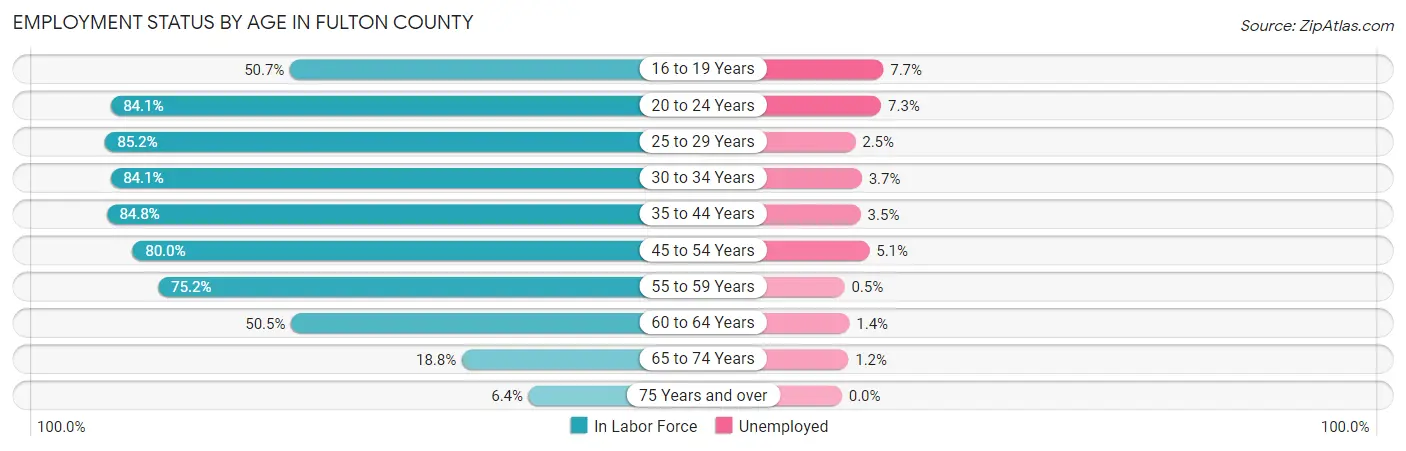
| Age Bracket | In Labor Force | Unemployed |
| 16 to 19 Years | 362 (50.7%) | 28 (7.7%) |
| 20 to 24 Years | 660 (84.1%) | 48 (7.3%) |
| 25 to 29 Years | 709 (85.2%) | 18 (2.5%) |
| 30 to 34 Years | 621 (84.1%) | 23 (3.7%) |
| 35 to 44 Years | 1,386 (84.8%) | 49 (3.5%) |
| 45 to 54 Years | 1,598 (80.0%) | 81 (5.1%) |
| 55 to 59 Years | 827 (75.2%) | 4 (0.5%) |
| 60 to 64 Years | 556 (50.5%) | 8 (1.4%) |
| 65 to 74 Years | 334 (18.8%) | 4 (1.2%) |
| 75 Years and over | 89 (6.4%) | 0 (0.0%) |
| Total | 7,138 (59.1%) | 264 (3.7%) |
Employment Status by Educational Attainment in Fulton County
According to labor force statistics for Fulton County, 77.0% of individuals (5,700) out of the total population between 25 and 64 years of age (7,402) are in the labor force, with 3.2% or 182 of them being unemployed. The group with the highest labor force participation rate are those with the educational attainment of bachelor's degree or higher, with 88.9% or 1,093 individuals in the labor force. Within the labor force, individuals with less than high school education have the highest percentage of unemployment, with 8.3% or 22 of them being unemployed.
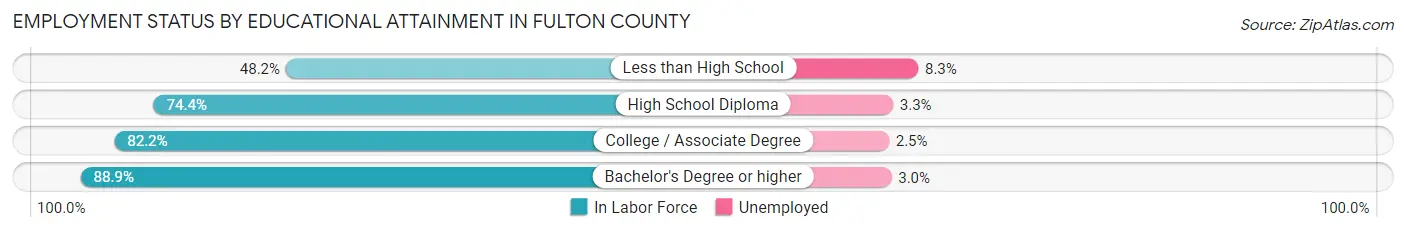
| Educational Attainment | In Labor Force | Unemployed |
| Less than High School | 266 (48.2%) | 46 (8.3%) |
| High School Diploma | 2,710 (74.4%) | 120 (3.3%) |
| College / Associate Degree | 1,625 (82.2%) | 49 (2.5%) |
| Bachelor's Degree or higher | 1,093 (88.9%) | 37 (3.0%) |
| Total | 5,700 (77.0%) | 237 (3.2%) |
Employment Occupations by Sex in Fulton County
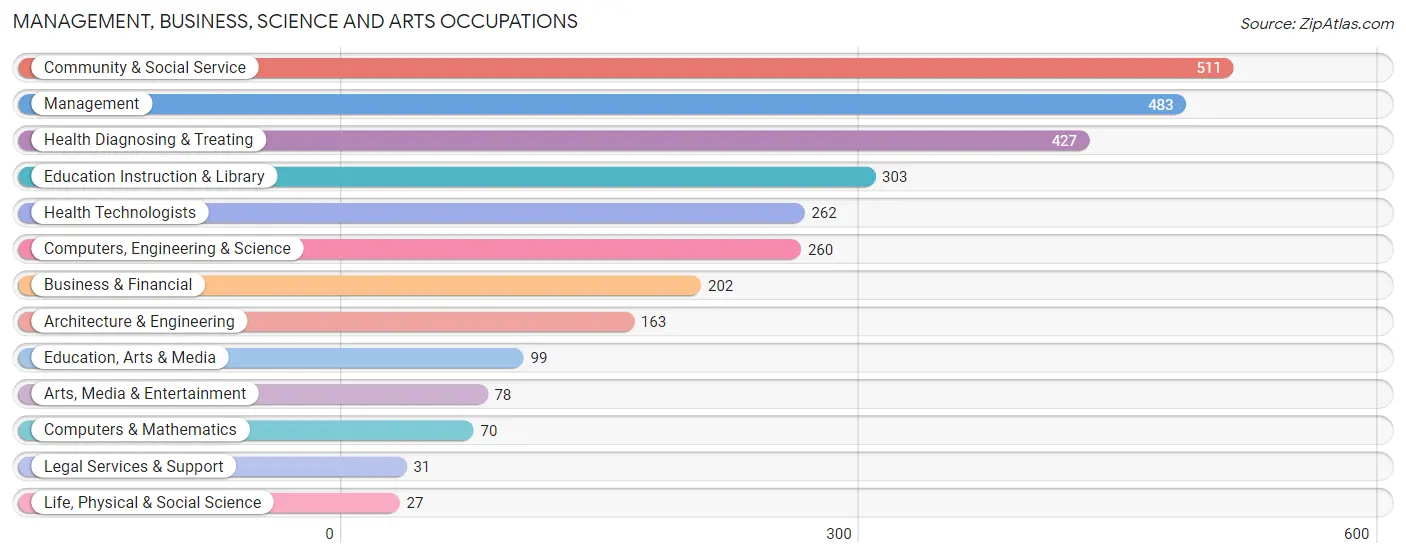
Management, Business, Science and Arts Occupations
The most common Management, Business, Science and Arts occupations in Fulton County are Community & Social Service (511 | 7.4%), Management (483 | 7.0%), Health Diagnosing & Treating (427 | 6.2%), Education Instruction & Library (303 | 4.4%), and Health Technologists (262 | 3.8%).
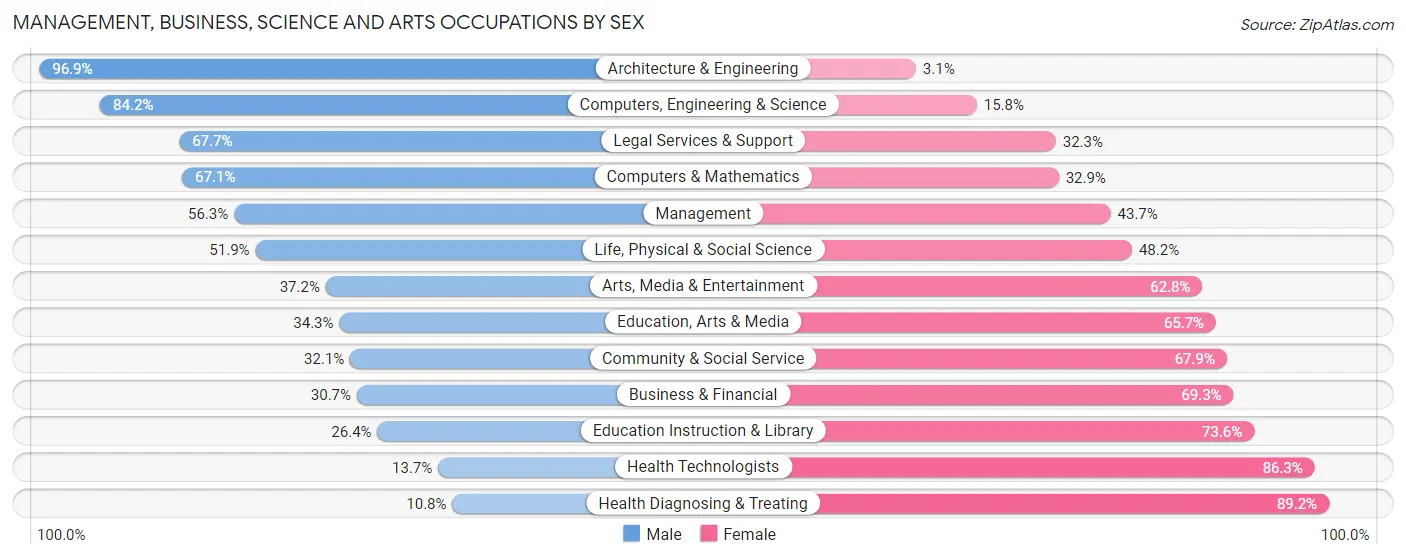
Management, Business, Science and Arts Occupations by Sex
Within the Management, Business, Science and Arts occupations in Fulton County, the most male-oriented occupations are Architecture & Engineering (96.9%), Computers, Engineering & Science (84.2%), and Legal Services & Support (67.7%), while the most female-oriented occupations are Health Diagnosing & Treating (89.2%), Health Technologists (86.3%), and Education Instruction & Library (73.6%).
| Occupation | Male | Female |
| Management | 272 (56.3%) | 211 (43.7%) |
| Business & Financial | 62 (30.7%) | 140 (69.3%) |
| Computers, Engineering & Science | 219 (84.2%) | 41 (15.8%) |
| Computers & Mathematics | 47 (67.1%) | 23 (32.9%) |
| Architecture & Engineering | 158 (96.9%) | 5 (3.1%) |
| Life, Physical & Social Science | 14 (51.8%) | 13 (48.1%) |
| Community & Social Service | 164 (32.1%) | 347 (67.9%) |
| Education, Arts & Media | 34 (34.3%) | 65 (65.7%) |
| Legal Services & Support | 21 (67.7%) | 10 (32.3%) |
| Education Instruction & Library | 80 (26.4%) | 223 (73.6%) |
| Arts, Media & Entertainment | 29 (37.2%) | 49 (62.8%) |
| Health Diagnosing & Treating | 46 (10.8%) | 381 (89.2%) |
| Health Technologists | 36 (13.7%) | 226 (86.3%) |
| Total (Category) | 763 (40.5%) | 1,120 (59.5%) |
| Total (Overall) | 3,840 (55.8%) | 3,039 (44.2%) |
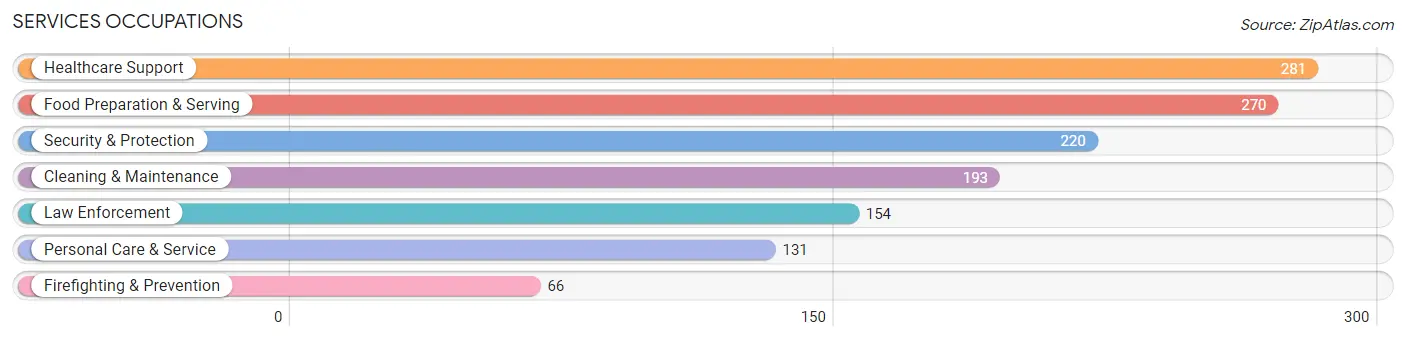
Services Occupations
The most common Services occupations in Fulton County are Healthcare Support (281 | 4.1%), Food Preparation & Serving (270 | 3.9%), Security & Protection (220 | 3.2%), Cleaning & Maintenance (193 | 2.8%), and Law Enforcement (154 | 2.2%).
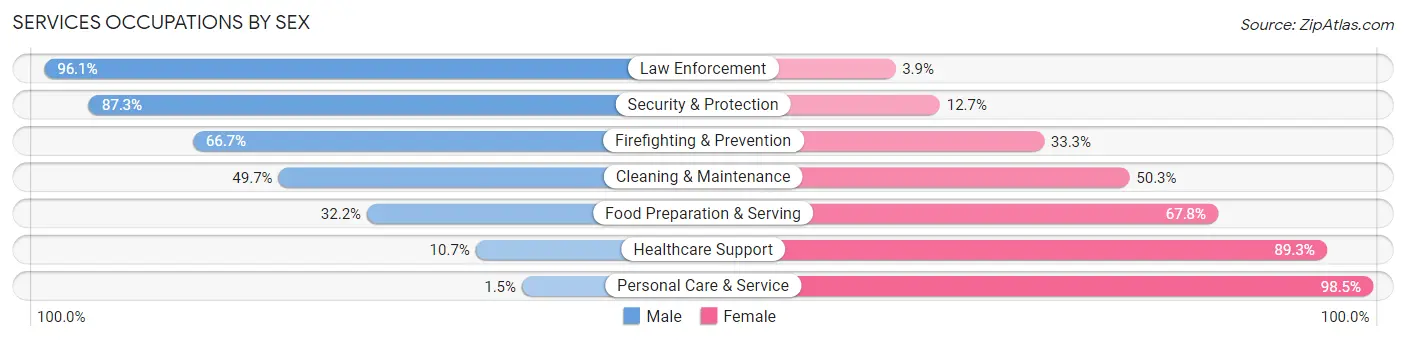
Services Occupations by Sex
Within the Services occupations in Fulton County, the most male-oriented occupations are Law Enforcement (96.1%), Security & Protection (87.3%), and Firefighting & Prevention (66.7%), while the most female-oriented occupations are Personal Care & Service (98.5%), Healthcare Support (89.3%), and Food Preparation & Serving (67.8%).
| Occupation | Male | Female |
| Healthcare Support | 30 (10.7%) | 251 (89.3%) |
| Security & Protection | 192 (87.3%) | 28 (12.7%) |
| Firefighting & Prevention | 44 (66.7%) | 22 (33.3%) |
| Law Enforcement | 148 (96.1%) | 6 (3.9%) |
| Food Preparation & Serving | 87 (32.2%) | 183 (67.8%) |
| Cleaning & Maintenance | 96 (49.7%) | 97 (50.3%) |
| Personal Care & Service | 2 (1.5%) | 129 (98.5%) |
| Total (Category) | 407 (37.2%) | 688 (62.8%) |
| Total (Overall) | 3,840 (55.8%) | 3,039 (44.2%) |
Sales and Office Occupations
The most common Sales and Office occupations in Fulton County are Office & Administration (684 | 9.9%), and Sales & Related (579 | 8.4%).
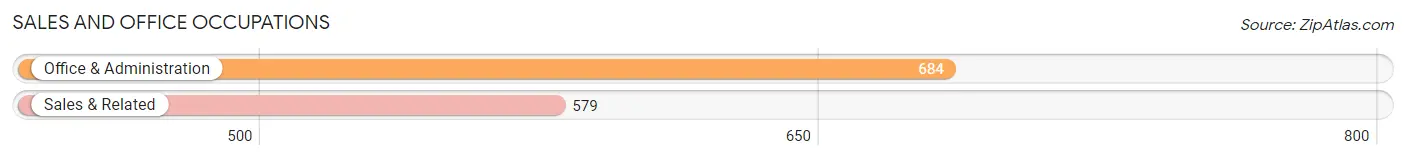
Sales and Office Occupations by Sex

| Occupation | Male | Female |
| Sales & Related | 311 (53.7%) | 268 (46.3%) |
| Office & Administration | 130 (19.0%) | 554 (81.0%) |
| Total (Category) | 441 (34.9%) | 822 (65.1%) |
| Total (Overall) | 3,840 (55.8%) | 3,039 (44.2%) |
Natural Resources, Construction and Maintenance Occupations
The most common Natural Resources, Construction and Maintenance occupations in Fulton County are Construction & Extraction (501 | 7.3%), Installation, Maintenance & Repair (336 | 4.9%), and Farming, Fishing & Forestry (76 | 1.1%).
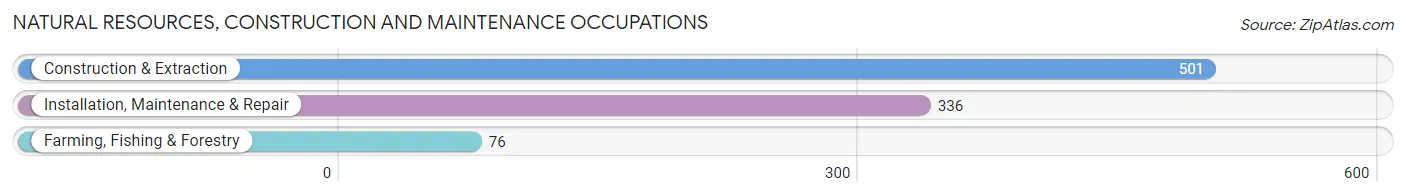
Natural Resources, Construction and Maintenance Occupations by Sex
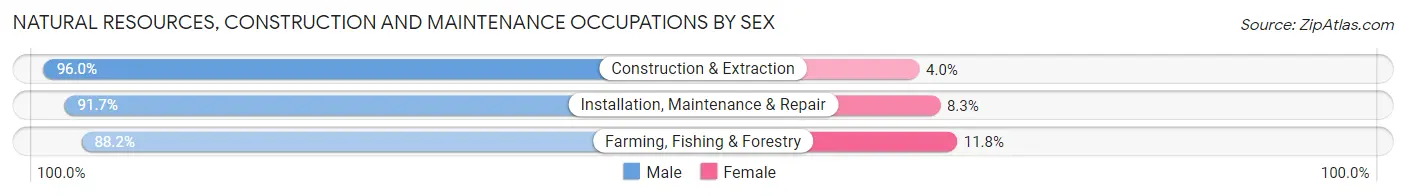
| Occupation | Male | Female |
| Farming, Fishing & Forestry | 67 (88.2%) | 9 (11.8%) |
| Construction & Extraction | 481 (96.0%) | 20 (4.0%) |
| Installation, Maintenance & Repair | 308 (91.7%) | 28 (8.3%) |
| Total (Category) | 856 (93.8%) | 57 (6.2%) |
| Total (Overall) | 3,840 (55.8%) | 3,039 (44.2%) |
Production, Transportation and Moving Occupations
The most common Production, Transportation and Moving occupations in Fulton County are Production (883 | 12.8%), Material Moving (497 | 7.2%), and Transportation (345 | 5.0%).
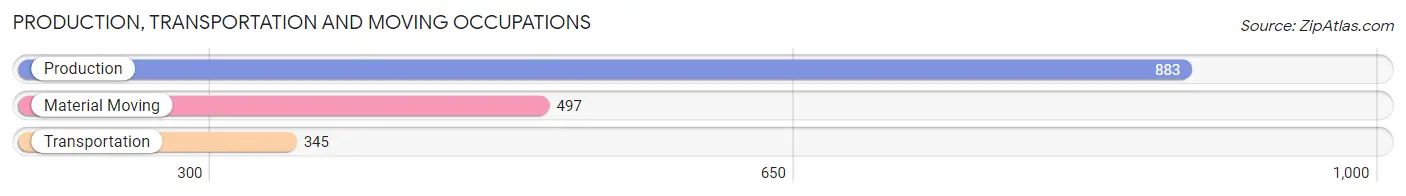
Production, Transportation and Moving Occupations by Sex
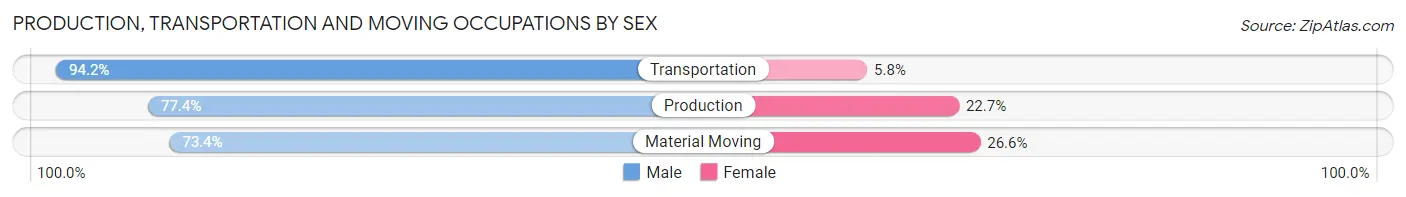
| Occupation | Male | Female |
| Production | 683 (77.3%) | 200 (22.7%) |
| Transportation | 325 (94.2%) | 20 (5.8%) |
| Material Moving | 365 (73.4%) | 132 (26.6%) |
| Total (Category) | 1,373 (79.6%) | 352 (20.4%) |
| Total (Overall) | 3,840 (55.8%) | 3,039 (44.2%) |
Employment Industries by Sex in Fulton County
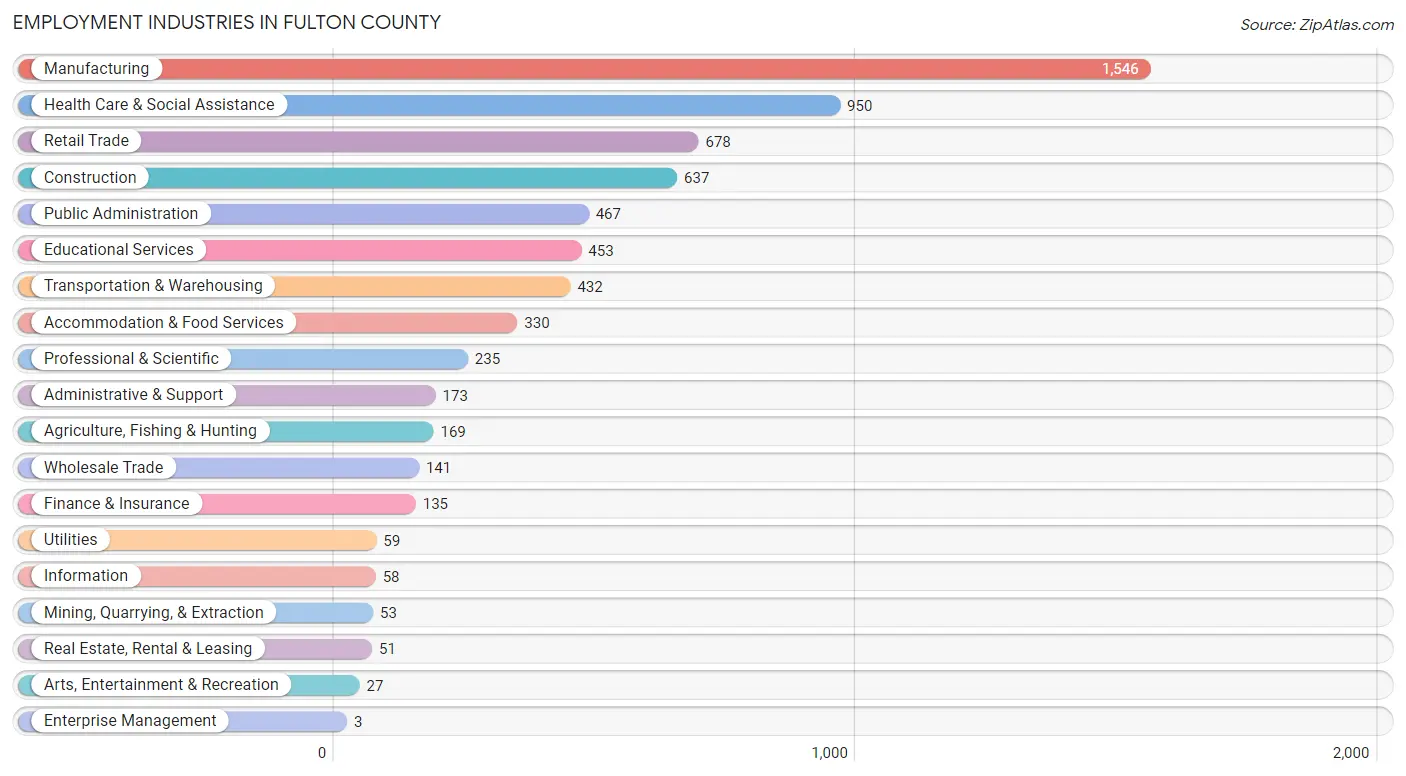
Employment Industries in Fulton County
The major employment industries in Fulton County include Manufacturing (1,546 | 22.5%), Health Care & Social Assistance (950 | 13.8%), Retail Trade (678 | 9.9%), Construction (637 | 9.3%), and Public Administration (467 | 6.8%).
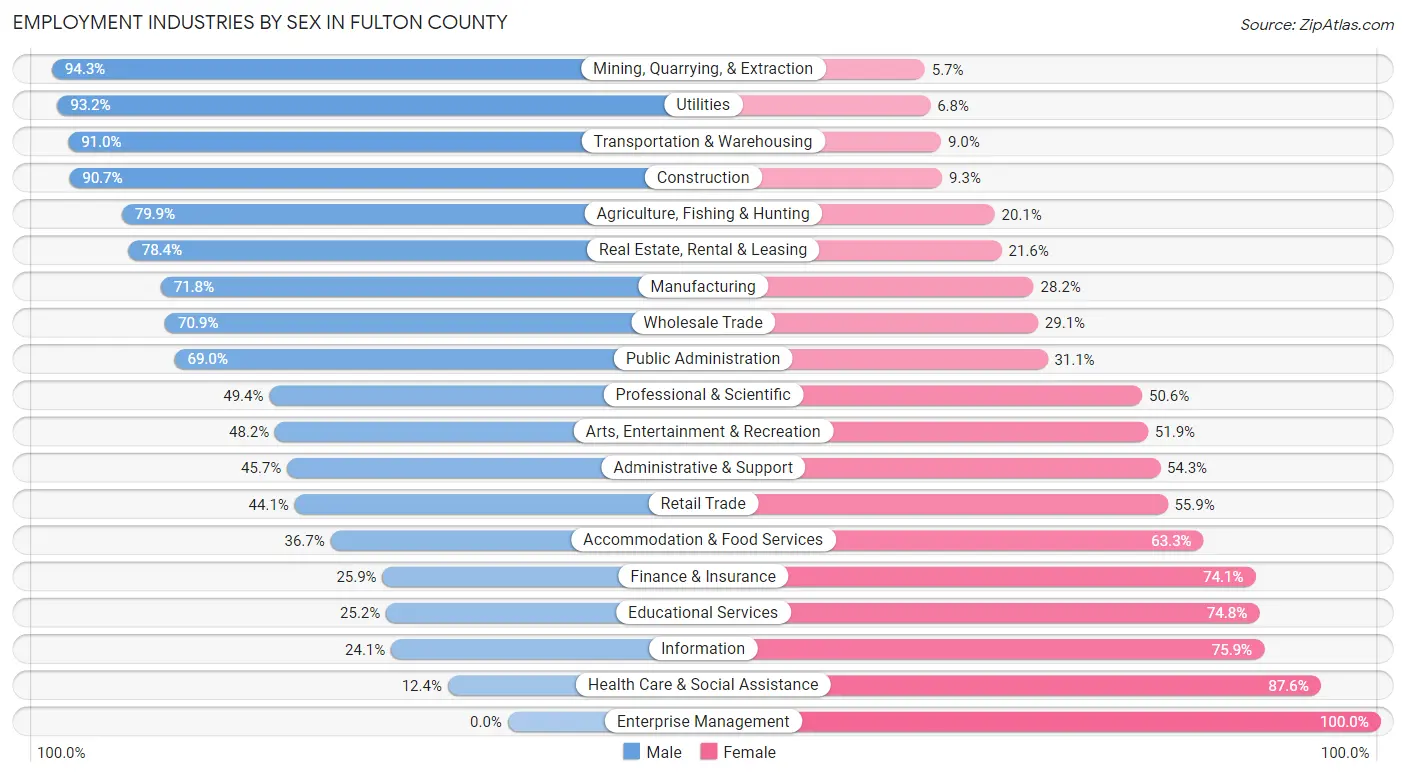
Employment Industries by Sex in Fulton County
The Fulton County industries that see more men than women are Mining, Quarrying, & Extraction (94.3%), Utilities (93.2%), and Transportation & Warehousing (91.0%), whereas the industries that tend to have a higher number of women are Enterprise Management (100.0%), Health Care & Social Assistance (87.6%), and Information (75.9%).
| Industry | Male | Female |
| Agriculture, Fishing & Hunting | 135 (79.9%) | 34 (20.1%) |
| Mining, Quarrying, & Extraction | 50 (94.3%) | 3 (5.7%) |
| Construction | 578 (90.7%) | 59 (9.3%) |
| Manufacturing | 1,110 (71.8%) | 436 (28.2%) |
| Wholesale Trade | 100 (70.9%) | 41 (29.1%) |
| Retail Trade | 299 (44.1%) | 379 (55.9%) |
| Transportation & Warehousing | 393 (91.0%) | 39 (9.0%) |
| Utilities | 55 (93.2%) | 4 (6.8%) |
| Information | 14 (24.1%) | 44 (75.9%) |
| Finance & Insurance | 35 (25.9%) | 100 (74.1%) |
| Real Estate, Rental & Leasing | 40 (78.4%) | 11 (21.6%) |
| Professional & Scientific | 116 (49.4%) | 119 (50.6%) |
| Enterprise Management | 0 (0.0%) | 3 (100.0%) |
| Administrative & Support | 79 (45.7%) | 94 (54.3%) |
| Educational Services | 114 (25.2%) | 339 (74.8%) |
| Health Care & Social Assistance | 118 (12.4%) | 832 (87.6%) |
| Arts, Entertainment & Recreation | 13 (48.1%) | 14 (51.8%) |
| Accommodation & Food Services | 121 (36.7%) | 209 (63.3%) |
| Public Administration | 322 (69.0%) | 145 (31.0%) |
| Total | 3,840 (55.8%) | 3,039 (44.2%) |
Education in Fulton County
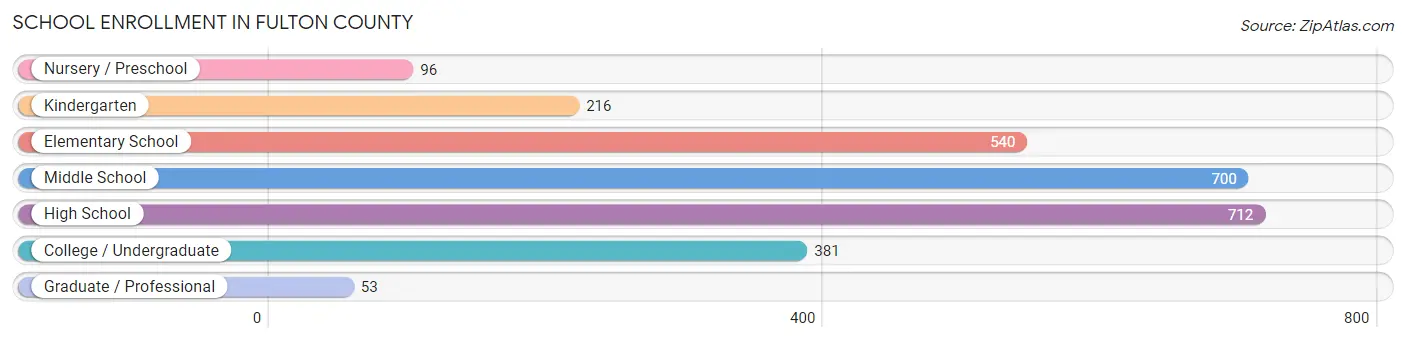
School Enrollment in Fulton County
The most common levels of schooling among the 2,698 students in Fulton County are high school (712 | 26.4%), middle school (700 | 26.0%), and elementary school (540 | 20.0%).
| School Level | # Students | % Students |
| Nursery / Preschool | 96 | 3.6% |
| Kindergarten | 216 | 8.0% |
| Elementary School | 540 | 20.0% |
| Middle School | 700 | 26.0% |
| High School | 712 | 26.4% |
| College / Undergraduate | 381 | 14.1% |
| Graduate / Professional | 53 | 2.0% |
| Total | 2,698 | 100.0% |
School Enrollment by Age by Funding Source in Fulton County
Out of a total of 2,698 students who are enrolled in schools in Fulton County, 394 (14.6%) attend a private institution, while the remaining 2,304 (85.4%) are enrolled in public schools. The age group of 25 to 34 year olds has the highest likelihood of being enrolled in private schools, with 32 (36.8% in the age bracket) enrolled. Conversely, the age group of 35 years and over has the lowest likelihood of being enrolled in a private school, with 78 (90.7% in the age bracket) attending a public institution.
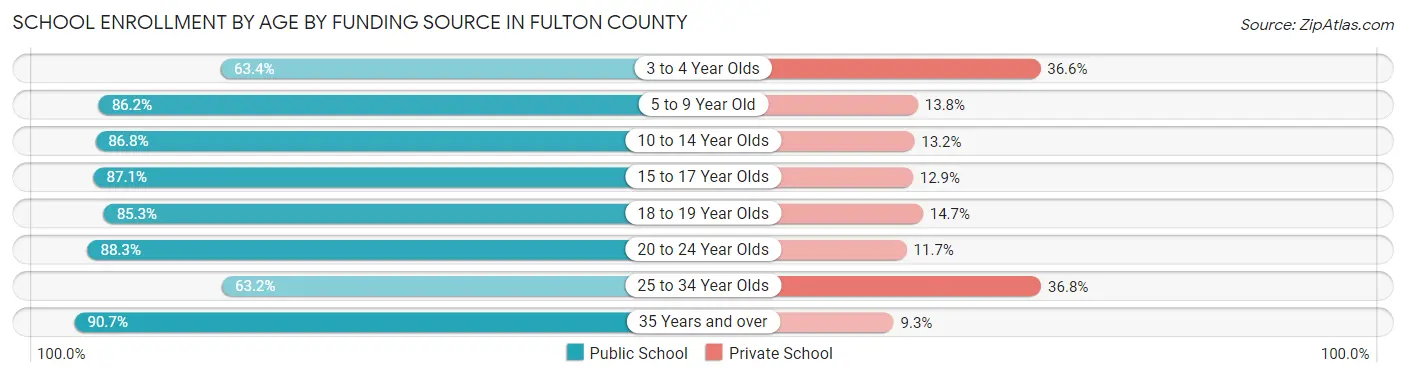
| Age Bracket | Public School | Private School |
| 3 to 4 Year Olds | 45 (63.4%) | 26 (36.6%) |
| 5 to 9 Year Old | 636 (86.2%) | 102 (13.8%) |
| 10 to 14 Year Olds | 719 (86.8%) | 109 (13.2%) |
| 15 to 17 Year Olds | 467 (87.1%) | 69 (12.9%) |
| 18 to 19 Year Olds | 162 (85.3%) | 28 (14.7%) |
| 20 to 24 Year Olds | 143 (88.3%) | 19 (11.7%) |
| 25 to 34 Year Olds | 55 (63.2%) | 32 (36.8%) |
| 35 Years and over | 78 (90.7%) | 8 (9.3%) |
| Total | 2,304 (85.4%) | 394 (14.6%) |
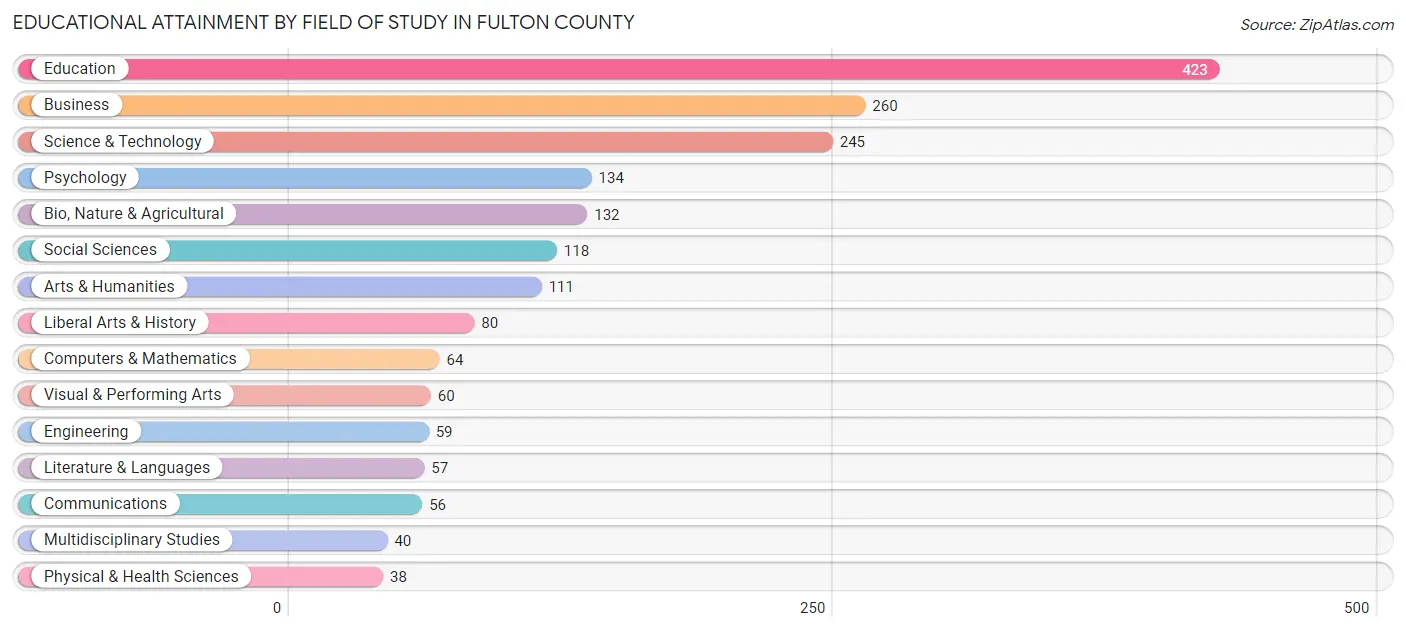
Educational Attainment by Field of Study in Fulton County
Education (423 | 22.5%), business (260 | 13.9%), science & technology (245 | 13.1%), psychology (134 | 7.1%), and bio, nature & agricultural (132 | 7.0%) are the most common fields of study among 1,877 individuals in Fulton County who have obtained a bachelor's degree or higher.
| Field of Study | # Graduates | % Graduates |
| Computers & Mathematics | 64 | 3.4% |
| Bio, Nature & Agricultural | 132 | 7.0% |
| Physical & Health Sciences | 38 | 2.0% |
| Psychology | 134 | 7.1% |
| Social Sciences | 118 | 6.3% |
| Engineering | 59 | 3.1% |
| Multidisciplinary Studies | 40 | 2.1% |
| Science & Technology | 245 | 13.1% |
| Business | 260 | 13.9% |
| Education | 423 | 22.5% |
| Literature & Languages | 57 | 3.0% |
| Liberal Arts & History | 80 | 4.3% |
| Visual & Performing Arts | 60 | 3.2% |
| Communications | 56 | 3.0% |
| Arts & Humanities | 111 | 5.9% |
| Total | 1,877 | 100.0% |
Transportation & Commute in Fulton County
Vehicle Availability by Sex in Fulton County
The most prevalent vehicle ownership categories in Fulton County are males with 2 vehicles (1,150, accounting for 30.2%) and females with 2 vehicles (875, making up 38.5%).
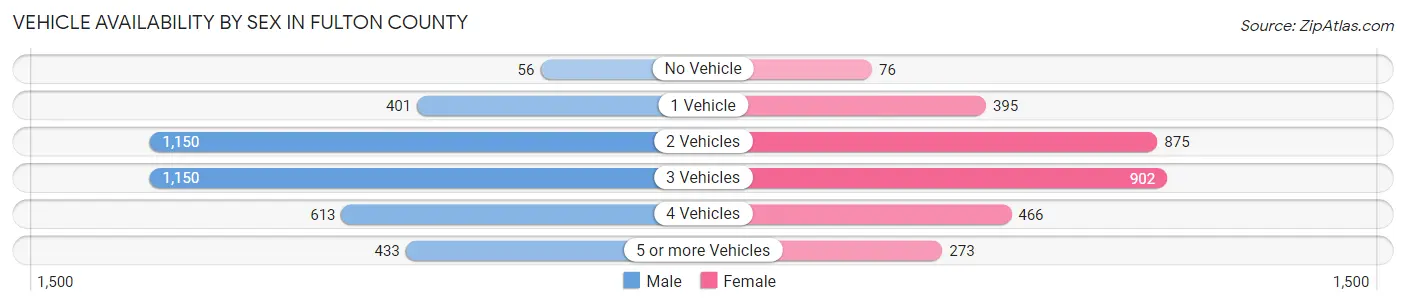
| Vehicles Available | Male | Female |
| No Vehicle | 56 (1.5%) | 76 (2.5%) |
| 1 Vehicle | 401 (10.5%) | 395 (13.2%) |
| 2 Vehicles | 1,150 (30.2%) | 875 (29.3%) |
| 3 Vehicles | 1,150 (30.2%) | 902 (30.2%) |
| 4 Vehicles | 613 (16.1%) | 466 (15.6%) |
| 5 or more Vehicles | 433 (11.4%) | 273 (9.1%) |
| Total | 3,803 (100.0%) | 2,987 (100.0%) |
Commute Time in Fulton County
The most frequently occuring commute durations in Fulton County are 45 to 59 minutes (1,154 commuters, 18.1%), 5 to 9 minutes (743 commuters, 11.6%), and 10 to 14 minutes (641 commuters, 10.0%).
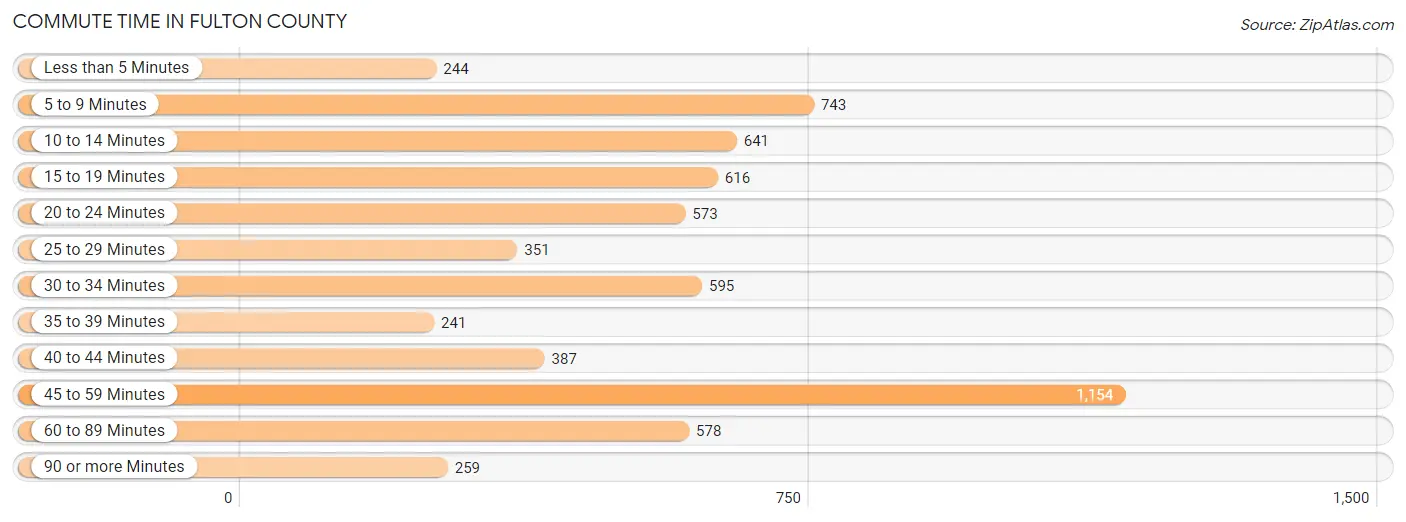
| Commute Time | # Commuters | % Commuters |
| Less than 5 Minutes | 244 | 3.8% |
| 5 to 9 Minutes | 743 | 11.6% |
| 10 to 14 Minutes | 641 | 10.0% |
| 15 to 19 Minutes | 616 | 9.7% |
| 20 to 24 Minutes | 573 | 9.0% |
| 25 to 29 Minutes | 351 | 5.5% |
| 30 to 34 Minutes | 595 | 9.3% |
| 35 to 39 Minutes | 241 | 3.8% |
| 40 to 44 Minutes | 387 | 6.1% |
| 45 to 59 Minutes | 1,154 | 18.1% |
| 60 to 89 Minutes | 578 | 9.1% |
| 90 or more Minutes | 259 | 4.1% |
Commute Time by Sex in Fulton County
The most common commute times in Fulton County are 45 to 59 minutes (716 commuters, 19.8%) for males and 45 to 59 minutes (438 commuters, 15.9%) for females.
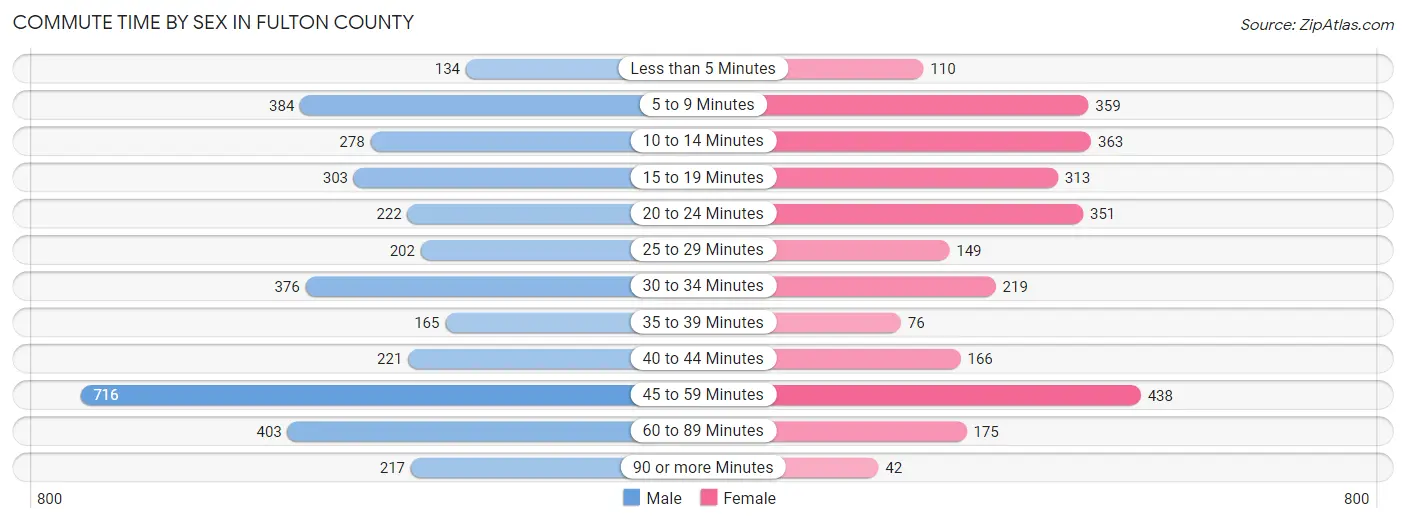
| Commute Time | Male | Female |
| Less than 5 Minutes | 134 (3.7%) | 110 (4.0%) |
| 5 to 9 Minutes | 384 (10.6%) | 359 (13.0%) |
| 10 to 14 Minutes | 278 (7.7%) | 363 (13.2%) |
| 15 to 19 Minutes | 303 (8.4%) | 313 (11.3%) |
| 20 to 24 Minutes | 222 (6.1%) | 351 (12.7%) |
| 25 to 29 Minutes | 202 (5.6%) | 149 (5.4%) |
| 30 to 34 Minutes | 376 (10.4%) | 219 (7.9%) |
| 35 to 39 Minutes | 165 (4.6%) | 76 (2.8%) |
| 40 to 44 Minutes | 221 (6.1%) | 166 (6.0%) |
| 45 to 59 Minutes | 716 (19.8%) | 438 (15.9%) |
| 60 to 89 Minutes | 403 (11.1%) | 175 (6.3%) |
| 90 or more Minutes | 217 (6.0%) | 42 (1.5%) |
Time of Departure to Work by Sex in Fulton County
The most frequent times of departure to work in Fulton County are 12:00 AM to 4:59 AM (681, 18.8%) for males and 7:30 AM to 7:59 AM (438, 15.9%) for females.
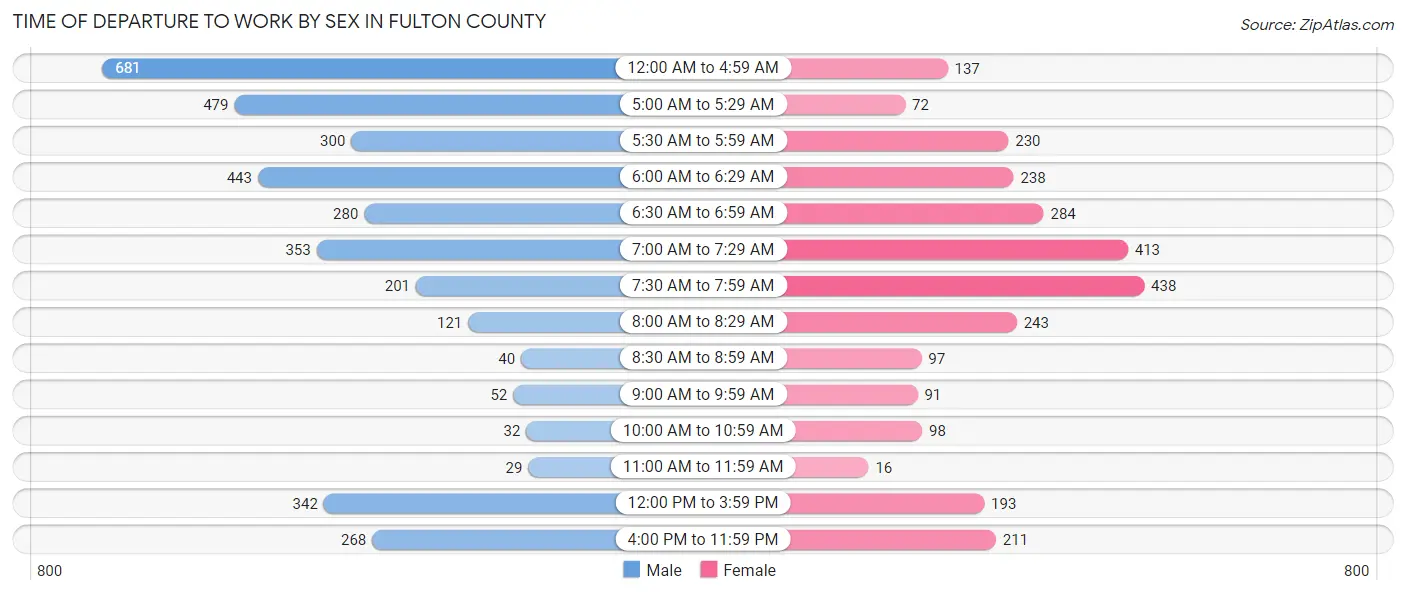
| Time of Departure | Male | Female |
| 12:00 AM to 4:59 AM | 681 (18.8%) | 137 (5.0%) |
| 5:00 AM to 5:29 AM | 479 (13.2%) | 72 (2.6%) |
| 5:30 AM to 5:59 AM | 300 (8.3%) | 230 (8.3%) |
| 6:00 AM to 6:29 AM | 443 (12.2%) | 238 (8.6%) |
| 6:30 AM to 6:59 AM | 280 (7.7%) | 284 (10.3%) |
| 7:00 AM to 7:29 AM | 353 (9.8%) | 413 (15.0%) |
| 7:30 AM to 7:59 AM | 201 (5.6%) | 438 (15.9%) |
| 8:00 AM to 8:29 AM | 121 (3.3%) | 243 (8.8%) |
| 8:30 AM to 8:59 AM | 40 (1.1%) | 97 (3.5%) |
| 9:00 AM to 9:59 AM | 52 (1.4%) | 91 (3.3%) |
| 10:00 AM to 10:59 AM | 32 (0.9%) | 98 (3.5%) |
| 11:00 AM to 11:59 AM | 29 (0.8%) | 16 (0.6%) |
| 12:00 PM to 3:59 PM | 342 (9.4%) | 193 (7.0%) |
| 4:00 PM to 11:59 PM | 268 (7.4%) | 211 (7.6%) |
| Total | 3,621 (100.0%) | 2,761 (100.0%) |
Housing Occupancy in Fulton County
Occupancy by Ownership in Fulton County
Of the total 6,126 dwellings in Fulton County, owner-occupied units account for 4,720 (77.0%), while renter-occupied units make up 1,406 (23.0%).
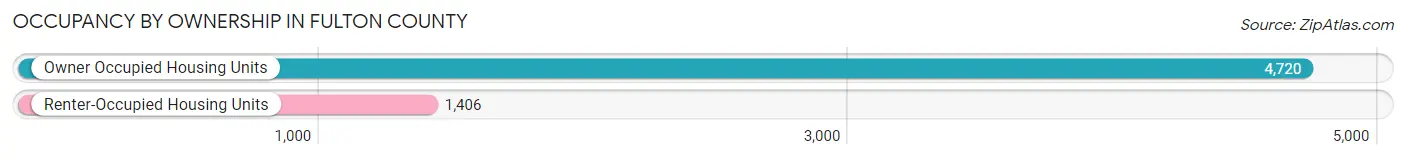
| Occupancy | # Housing Units | % Housing Units |
| Owner Occupied Housing Units | 4,720 | 77.0% |
| Renter-Occupied Housing Units | 1,406 | 23.0% |
| Total Occupied Housing Units | 6,126 | 100.0% |
Occupancy by Household Size in Fulton County
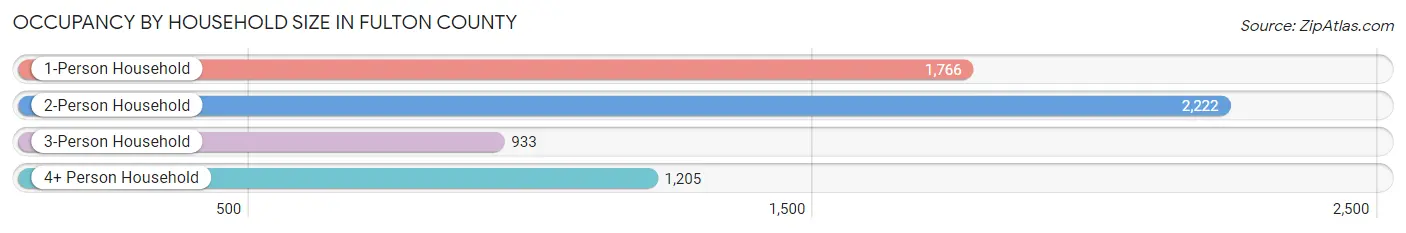
| Household Size | # Housing Units | % Housing Units |
| 1-Person Household | 1,766 | 28.8% |
| 2-Person Household | 2,222 | 36.3% |
| 3-Person Household | 933 | 15.2% |
| 4+ Person Household | 1,205 | 19.7% |
| Total Housing Units | 6,126 | 100.0% |
Occupancy by Ownership by Household Size in Fulton County
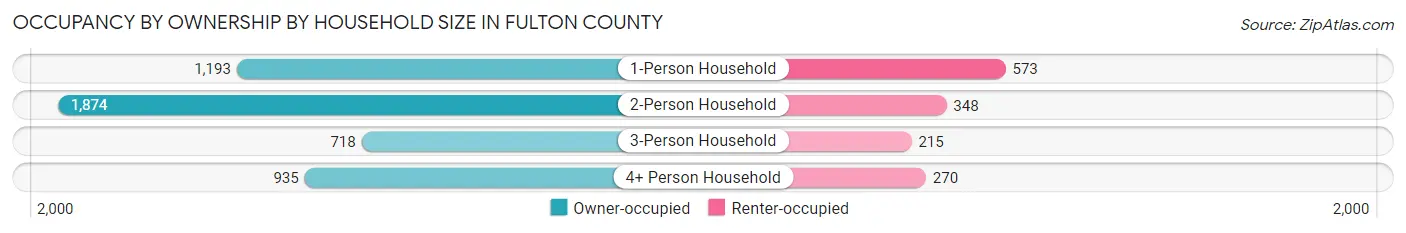
| Household Size | Owner-occupied | Renter-occupied |
| 1-Person Household | 1,193 (67.5%) | 573 (32.5%) |
| 2-Person Household | 1,874 (84.3%) | 348 (15.7%) |
| 3-Person Household | 718 (77.0%) | 215 (23.0%) |
| 4+ Person Household | 935 (77.6%) | 270 (22.4%) |
| Total Housing Units | 4,720 (77.0%) | 1,406 (23.0%) |
Occupancy by Educational Attainment in Fulton County
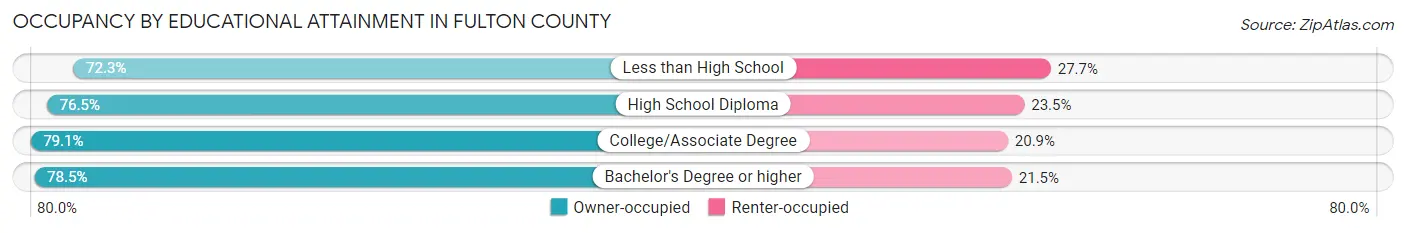
| Household Size | Owner-occupied | Renter-occupied |
| Less than High School | 428 (72.3%) | 164 (27.7%) |
| High School Diploma | 2,331 (76.5%) | 716 (23.5%) |
| College/Associate Degree | 1,144 (79.1%) | 302 (20.9%) |
| Bachelor's Degree or higher | 817 (78.5%) | 224 (21.5%) |
Occupancy by Age of Householder in Fulton County
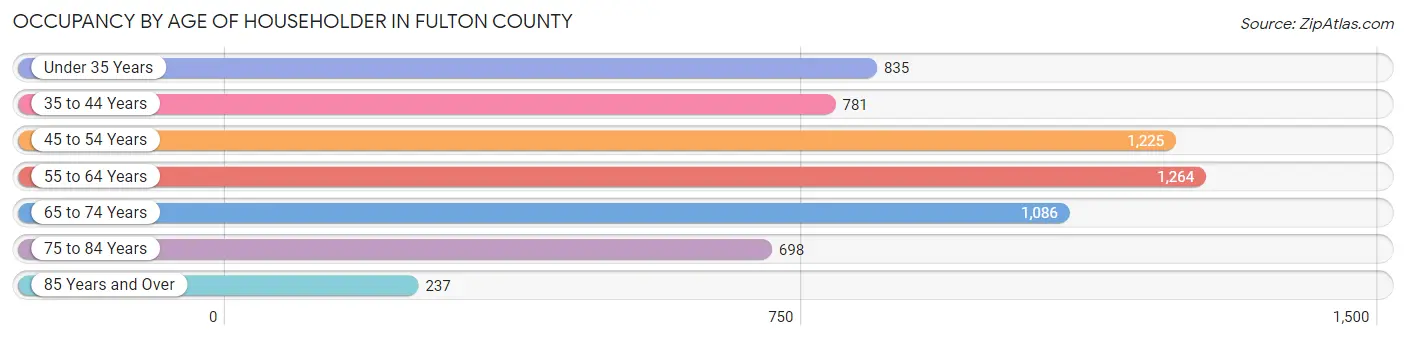
| Age Bracket | # Households | % Households |
| Under 35 Years | 835 | 13.6% |
| 35 to 44 Years | 781 | 12.8% |
| 45 to 54 Years | 1,225 | 20.0% |
| 55 to 64 Years | 1,264 | 20.6% |
| 65 to 74 Years | 1,086 | 17.7% |
| 75 to 84 Years | 698 | 11.4% |
| 85 Years and Over | 237 | 3.9% |
| Total | 6,126 | 100.0% |
Housing Finances in Fulton County
Median Income by Occupancy in Fulton County
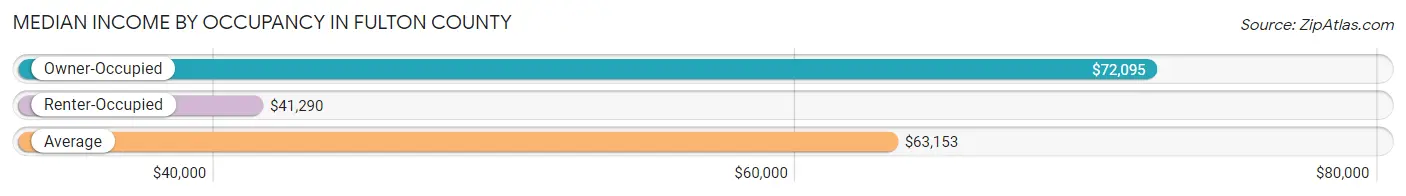
| Occupancy Type | # Households | Median Income |
| Owner-Occupied | 4,720 (77.0%) | $72,095 |
| Renter-Occupied | 1,406 (23.0%) | $41,290 |
| Average | 6,126 (100.0%) | $63,153 |
Occupancy by Householder Income Bracket in Fulton County
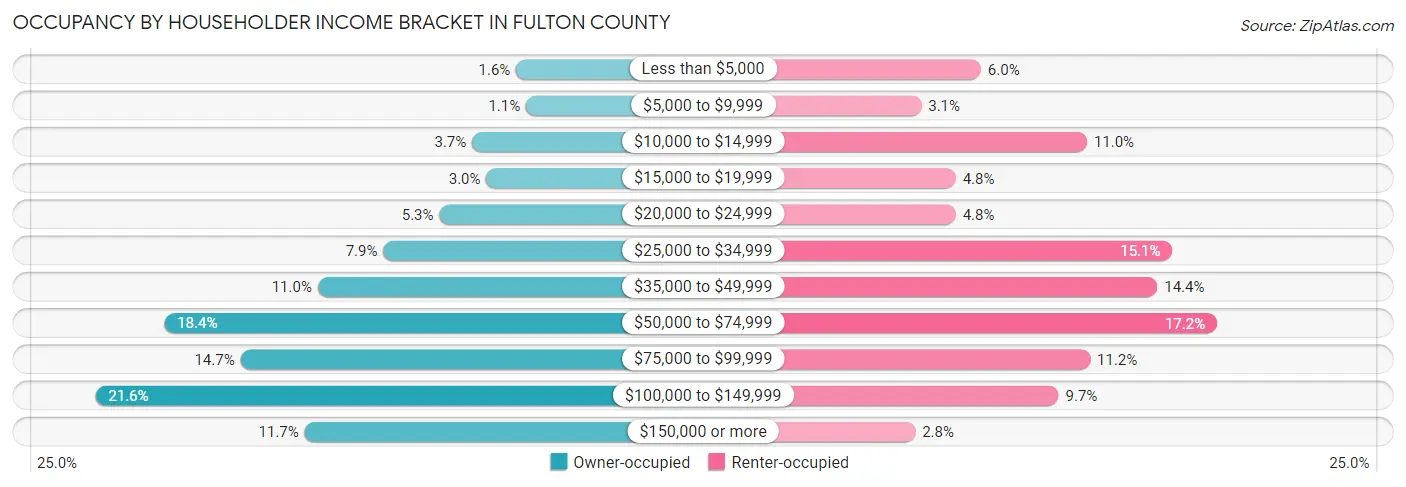
| Income Bracket | Owner-occupied | Renter-occupied |
| Less than $5,000 | 75 (1.6%) | 84 (6.0%) |
| $5,000 to $9,999 | 53 (1.1%) | 44 (3.1%) |
| $10,000 to $14,999 | 174 (3.7%) | 155 (11.0%) |
| $15,000 to $19,999 | 142 (3.0%) | 67 (4.8%) |
| $20,000 to $24,999 | 248 (5.2%) | 67 (4.8%) |
| $25,000 to $34,999 | 374 (7.9%) | 212 (15.1%) |
| $35,000 to $49,999 | 521 (11.0%) | 202 (14.4%) |
| $50,000 to $74,999 | 866 (18.3%) | 242 (17.2%) |
| $75,000 to $99,999 | 695 (14.7%) | 157 (11.2%) |
| $100,000 to $149,999 | 1,021 (21.6%) | 136 (9.7%) |
| $150,000 or more | 551 (11.7%) | 40 (2.8%) |
| Total | 4,720 (100.0%) | 1,406 (100.0%) |
Monthly Housing Cost Tiers in Fulton County
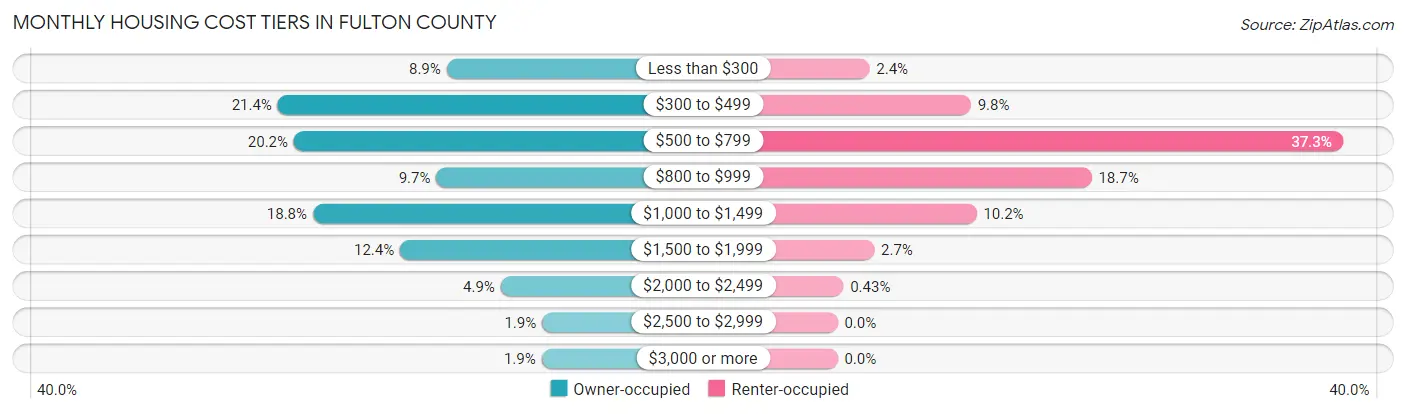
| Monthly Cost | Owner-occupied | Renter-occupied |
| Less than $300 | 421 (8.9%) | 33 (2.4%) |
| $300 to $499 | 1,008 (21.4%) | 138 (9.8%) |
| $500 to $799 | 952 (20.2%) | 524 (37.3%) |
| $800 to $999 | 457 (9.7%) | 263 (18.7%) |
| $1,000 to $1,499 | 886 (18.8%) | 144 (10.2%) |
| $1,500 to $1,999 | 583 (12.3%) | 38 (2.7%) |
| $2,000 to $2,499 | 233 (4.9%) | 6 (0.4%) |
| $2,500 to $2,999 | 89 (1.9%) | 0 (0.0%) |
| $3,000 or more | 91 (1.9%) | 0 (0.0%) |
| Total | 4,720 (100.0%) | 1,406 (100.0%) |
Physical Housing Characteristics in Fulton County
Housing Structures in Fulton County
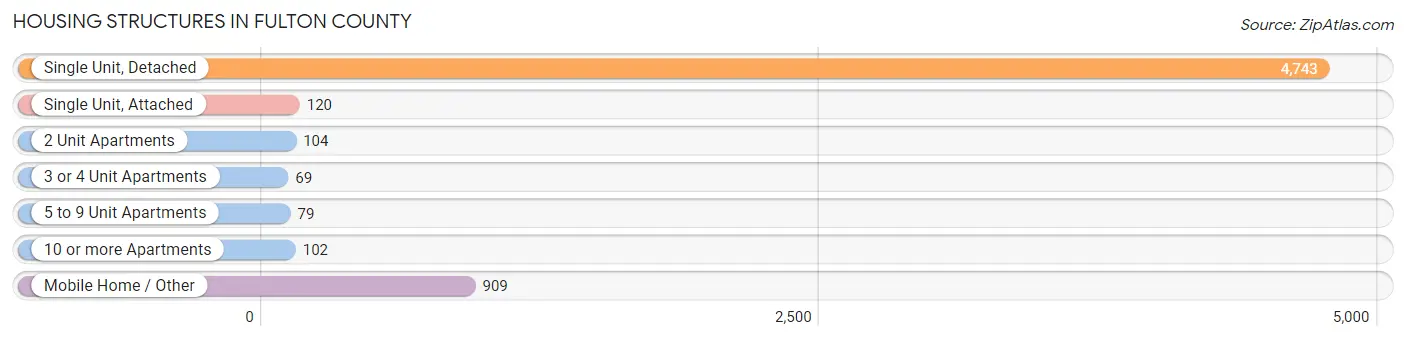
| Structure Type | # Housing Units | % Housing Units |
| Single Unit, Detached | 4,743 | 77.4% |
| Single Unit, Attached | 120 | 2.0% |
| 2 Unit Apartments | 104 | 1.7% |
| 3 or 4 Unit Apartments | 69 | 1.1% |
| 5 to 9 Unit Apartments | 79 | 1.3% |
| 10 or more Apartments | 102 | 1.7% |
| Mobile Home / Other | 909 | 14.8% |
| Total | 6,126 | 100.0% |
Housing Structures by Occupancy in Fulton County
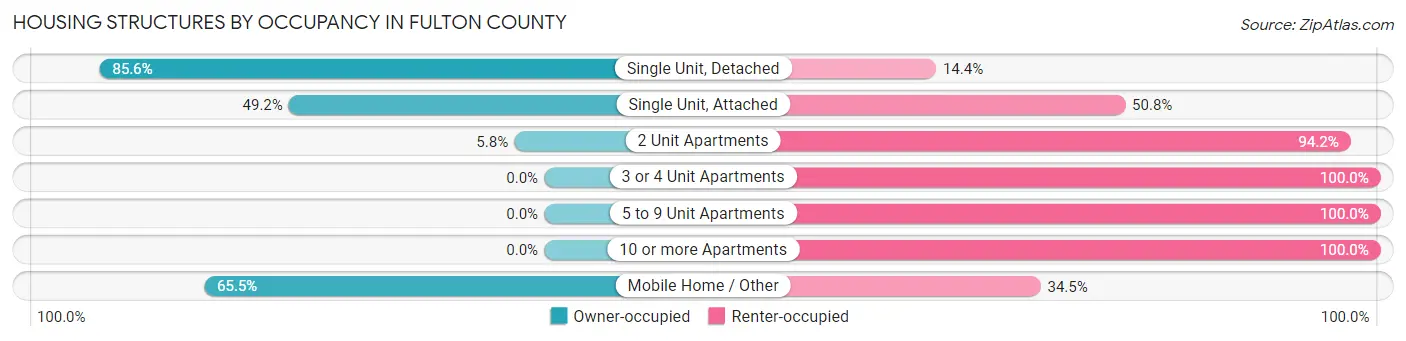
| Structure Type | Owner-occupied | Renter-occupied |
| Single Unit, Detached | 4,060 (85.6%) | 683 (14.4%) |
| Single Unit, Attached | 59 (49.2%) | 61 (50.8%) |
| 2 Unit Apartments | 6 (5.8%) | 98 (94.2%) |
| 3 or 4 Unit Apartments | 0 (0.0%) | 69 (100.0%) |
| 5 to 9 Unit Apartments | 0 (0.0%) | 79 (100.0%) |
| 10 or more Apartments | 0 (0.0%) | 102 (100.0%) |
| Mobile Home / Other | 595 (65.5%) | 314 (34.5%) |
| Total | 4,720 (77.0%) | 1,406 (23.0%) |
Housing Structures by Number of Rooms in Fulton County
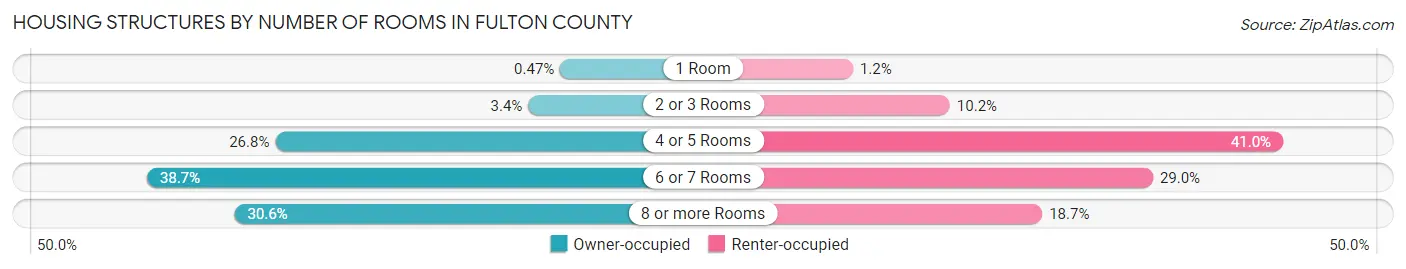
| Number of Rooms | Owner-occupied | Renter-occupied |
| 1 Room | 22 (0.5%) | 17 (1.2%) |
| 2 or 3 Rooms | 162 (3.4%) | 143 (10.2%) |
| 4 or 5 Rooms | 1,266 (26.8%) | 576 (41.0%) |
| 6 or 7 Rooms | 1,826 (38.7%) | 407 (28.9%) |
| 8 or more Rooms | 1,444 (30.6%) | 263 (18.7%) |
| Total | 4,720 (100.0%) | 1,406 (100.0%) |
Housing Structure by Heating Type in Fulton County
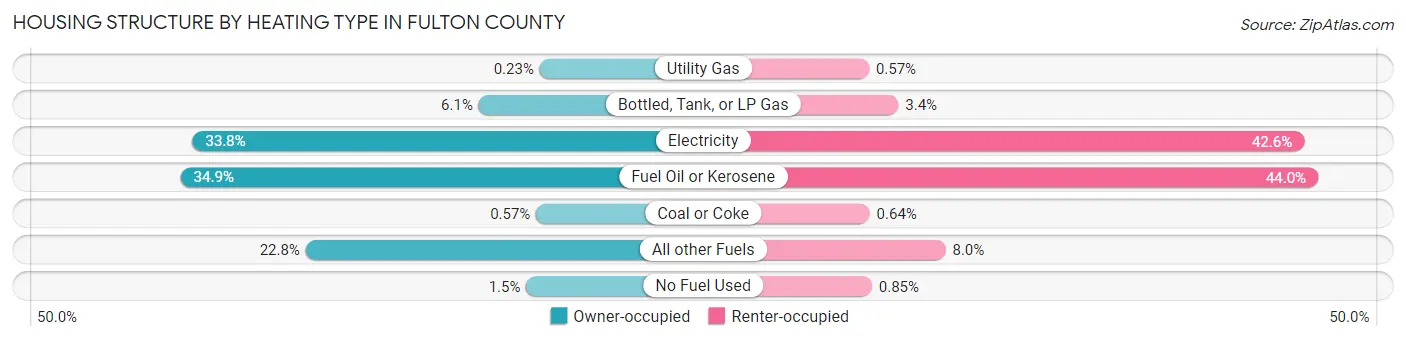
| Heating Type | Owner-occupied | Renter-occupied |
| Utility Gas | 11 (0.2%) | 8 (0.6%) |
| Bottled, Tank, or LP Gas | 289 (6.1%) | 48 (3.4%) |
| Electricity | 1,595 (33.8%) | 599 (42.6%) |
| Fuel Oil or Kerosene | 1,648 (34.9%) | 618 (44.0%) |
| Coal or Coke | 27 (0.6%) | 9 (0.6%) |
| All other Fuels | 1,078 (22.8%) | 112 (8.0%) |
| No Fuel Used | 72 (1.5%) | 12 (0.9%) |
| Total | 4,720 (100.0%) | 1,406 (100.0%) |
Household Vehicle Usage in Fulton County
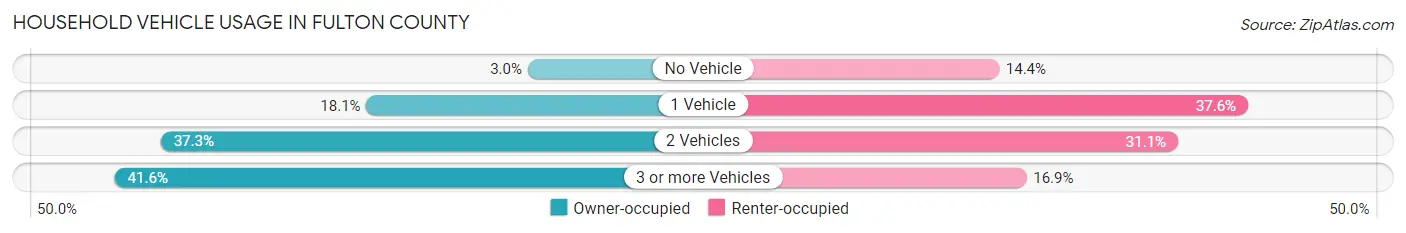
| Vehicles per Household | Owner-occupied | Renter-occupied |
| No Vehicle | 143 (3.0%) | 202 (14.4%) |
| 1 Vehicle | 854 (18.1%) | 529 (37.6%) |
| 2 Vehicles | 1,760 (37.3%) | 437 (31.1%) |
| 3 or more Vehicles | 1,963 (41.6%) | 238 (16.9%) |
| Total | 4,720 (100.0%) | 1,406 (100.0%) |
Real Estate & Mortgages in Fulton County
Real Estate and Mortgage Overview in Fulton County
| Characteristic | Without Mortgage | With Mortgage |
| Housing Units | 2,455 | 2,265 |
| Median Property Value | $169,600 | $207,300 |
| Median Household Income | $52,781 | $403 |
| Monthly Housing Costs | $468 | $82 |
| Real Estate Taxes | $1,887 | $28 |
Property Value by Mortgage Status in Fulton County
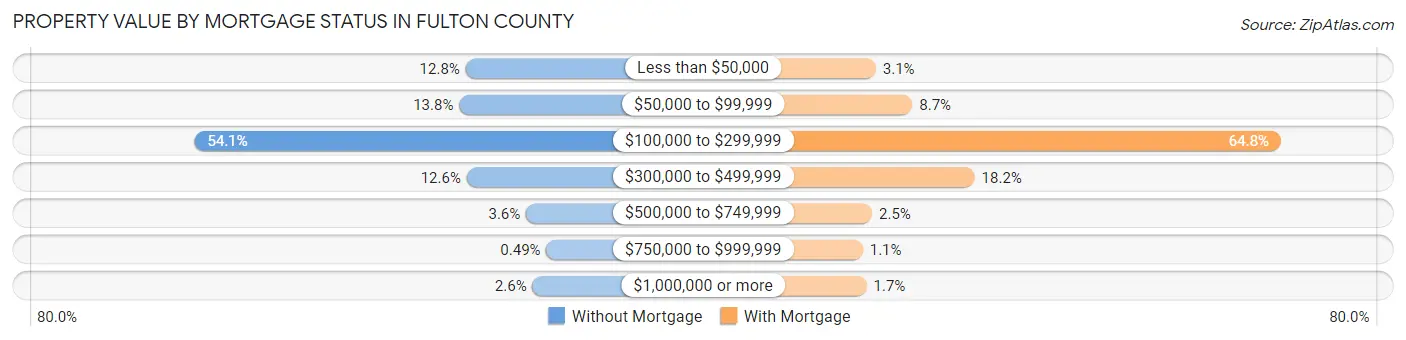
| Property Value | Without Mortgage | With Mortgage |
| Less than $50,000 | 314 (12.8%) | 70 (3.1%) |
| $50,000 to $99,999 | 338 (13.8%) | 196 (8.6%) |
| $100,000 to $299,999 | 1,329 (54.1%) | 1,468 (64.8%) |
| $300,000 to $499,999 | 310 (12.6%) | 411 (18.1%) |
| $500,000 to $749,999 | 88 (3.6%) | 57 (2.5%) |
| $750,000 to $999,999 | 12 (0.5%) | 25 (1.1%) |
| $1,000,000 or more | 64 (2.6%) | 38 (1.7%) |
| Total | 2,455 (100.0%) | 2,265 (100.0%) |
Household Income by Mortgage Status in Fulton County
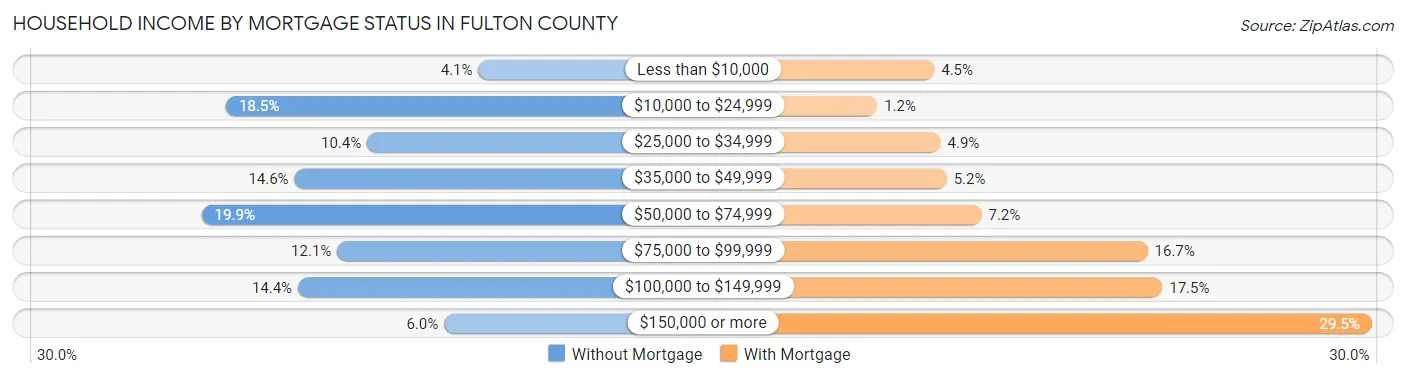
| Household Income | Without Mortgage | With Mortgage |
| Less than $10,000 | 100 (4.1%) | 102 (4.5%) |
| $10,000 to $24,999 | 454 (18.5%) | 28 (1.2%) |
| $25,000 to $34,999 | 256 (10.4%) | 110 (4.9%) |
| $35,000 to $49,999 | 358 (14.6%) | 118 (5.2%) |
| $50,000 to $74,999 | 488 (19.9%) | 163 (7.2%) |
| $75,000 to $99,999 | 298 (12.1%) | 378 (16.7%) |
| $100,000 to $149,999 | 353 (14.4%) | 397 (17.5%) |
| $150,000 or more | 148 (6.0%) | 668 (29.5%) |
| Total | 2,455 (100.0%) | 2,265 (100.0%) |
Property Value to Household Income Ratio in Fulton County
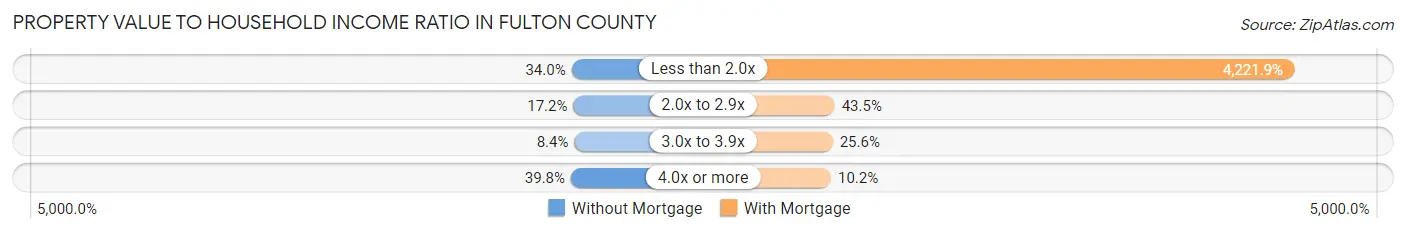
| Value-to-Income Ratio | Without Mortgage | With Mortgage |
| Less than 2.0x | 834 (34.0%) | 95,625 (4,221.8%) |
| 2.0x to 2.9x | 423 (17.2%) | 985 (43.5%) |
| 3.0x to 3.9x | 206 (8.4%) | 580 (25.6%) |
| 4.0x or more | 978 (39.8%) | 232 (10.2%) |
| Total | 2,455 (100.0%) | 2,265 (100.0%) |
Real Estate Taxes by Mortgage Status in Fulton County
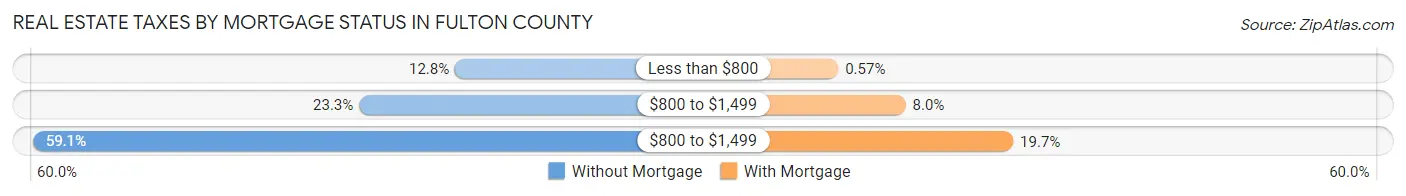
| Property Taxes | Without Mortgage | With Mortgage |
| Less than $800 | 315 (12.8%) | 13 (0.6%) |
| $800 to $1,499 | 573 (23.3%) | 180 (8.0%) |
| $800 to $1,499 | 1,451 (59.1%) | 447 (19.7%) |
| Total | 2,455 (100.0%) | 2,265 (100.0%) |
Health & Disability in Fulton County
Health Insurance Coverage by Age in Fulton County
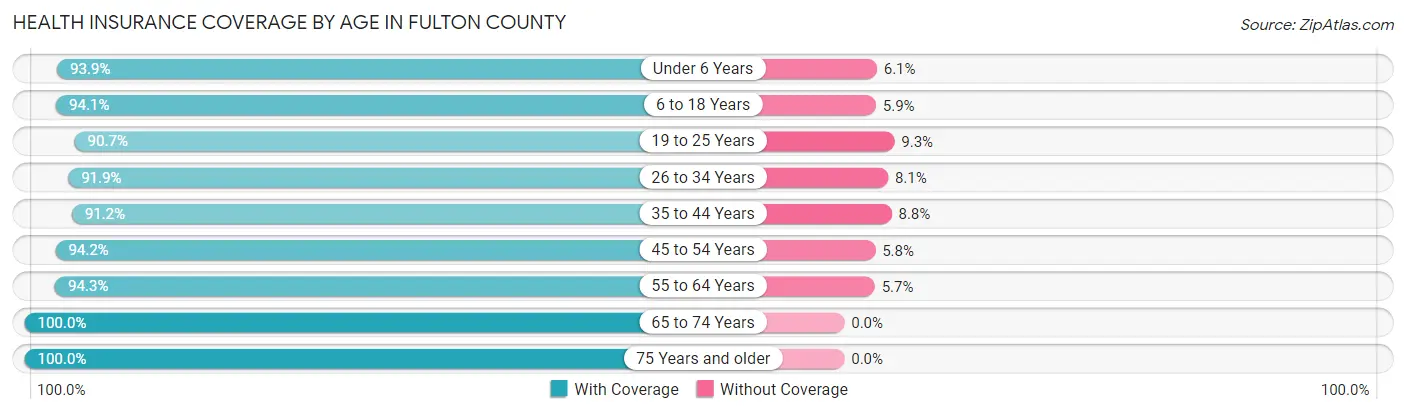
| Age Bracket | With Coverage | Without Coverage |
| Under 6 Years | 790 (93.9%) | 51 (6.1%) |
| 6 to 18 Years | 2,034 (94.1%) | 127 (5.9%) |
| 19 to 25 Years | 1,029 (90.7%) | 106 (9.3%) |
| 26 to 34 Years | 1,276 (91.9%) | 113 (8.1%) |
| 35 to 44 Years | 1,490 (91.2%) | 144 (8.8%) |
| 45 to 54 Years | 1,883 (94.2%) | 115 (5.8%) |
| 55 to 64 Years | 2,075 (94.3%) | 125 (5.7%) |
| 65 to 74 Years | 1,774 (100.0%) | 0 (0.0%) |
| 75 Years and older | 1,390 (100.0%) | 0 (0.0%) |
| Total | 13,741 (94.6%) | 781 (5.4%) |
Health Insurance Coverage by Citizenship Status in Fulton County
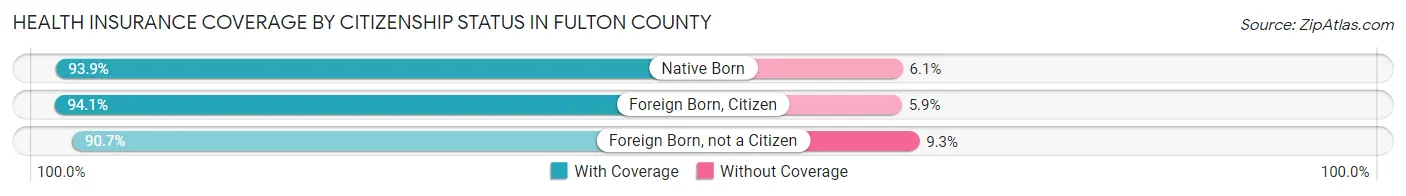
| Citizenship Status | With Coverage | Without Coverage |
| Native Born | 790 (93.9%) | 51 (6.1%) |
| Foreign Born, Citizen | 2,034 (94.1%) | 127 (5.9%) |
| Foreign Born, not a Citizen | 1,029 (90.7%) | 106 (9.3%) |
Health Insurance Coverage by Household Income in Fulton County
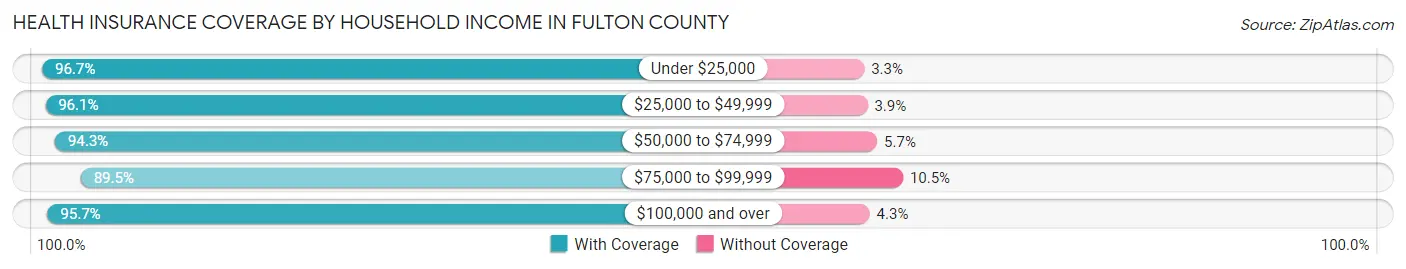
| Household Income | With Coverage | Without Coverage |
| Under $25,000 | 1,536 (96.7%) | 52 (3.3%) |
| $25,000 to $49,999 | 2,509 (96.1%) | 101 (3.9%) |
| $50,000 to $74,999 | 2,303 (94.3%) | 139 (5.7%) |
| $75,000 to $99,999 | 2,185 (89.5%) | 257 (10.5%) |
| $100,000 and over | 5,190 (95.7%) | 232 (4.3%) |
Public vs Private Health Insurance Coverage by Age in Fulton County
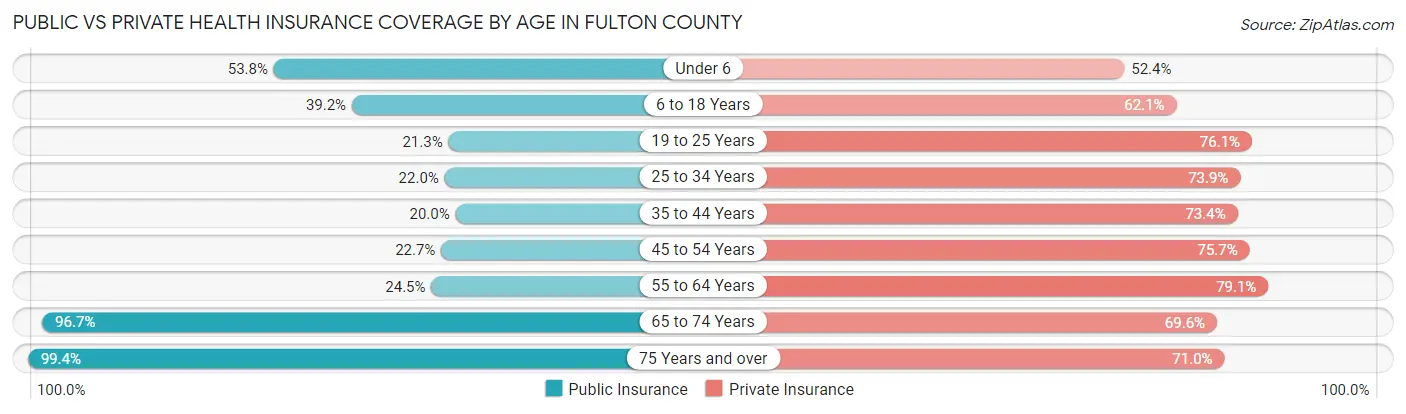
| Age Bracket | Public Insurance | Private Insurance |
| Under 6 | 452 (53.7%) | 441 (52.4%) |
| 6 to 18 Years | 848 (39.2%) | 1,342 (62.1%) |
| 19 to 25 Years | 242 (21.3%) | 864 (76.1%) |
| 25 to 34 Years | 306 (22.0%) | 1,027 (73.9%) |
| 35 to 44 Years | 327 (20.0%) | 1,200 (73.4%) |
| 45 to 54 Years | 453 (22.7%) | 1,512 (75.7%) |
| 55 to 64 Years | 539 (24.5%) | 1,741 (79.1%) |
| 65 to 74 Years | 1,716 (96.7%) | 1,235 (69.6%) |
| 75 Years and over | 1,382 (99.4%) | 987 (71.0%) |
| Total | 6,265 (43.1%) | 10,349 (71.3%) |
Disability Status by Sex by Age in Fulton County
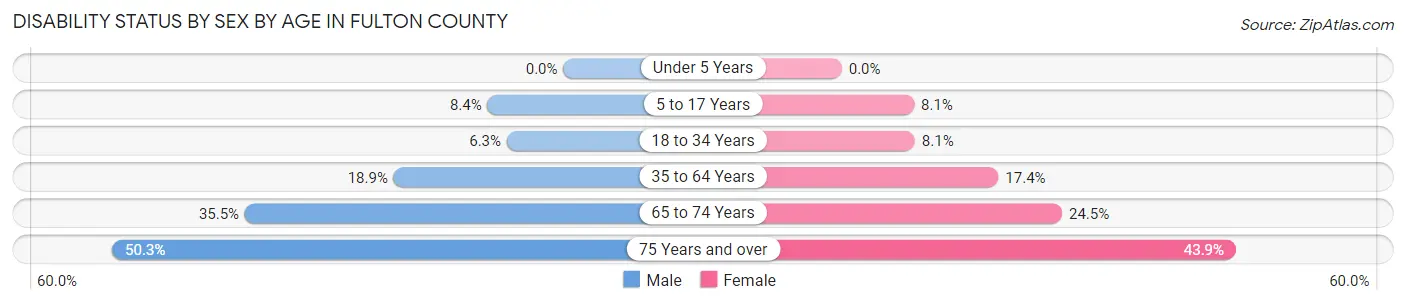
| Age Bracket | Male | Female |
| Under 5 Years | 0 (0.0%) | 0 (0.0%) |
| 5 to 17 Years | 96 (8.4%) | 83 (8.1%) |
| 18 to 34 Years | 89 (6.3%) | 102 (8.1%) |
| 35 to 64 Years | 584 (18.9%) | 478 (17.4%) |
| 65 to 74 Years | 311 (35.5%) | 220 (24.5%) |
| 75 Years and over | 300 (50.2%) | 348 (43.9%) |
Disability Class by Sex by Age in Fulton County
Disability Class: Hearing Difficulty
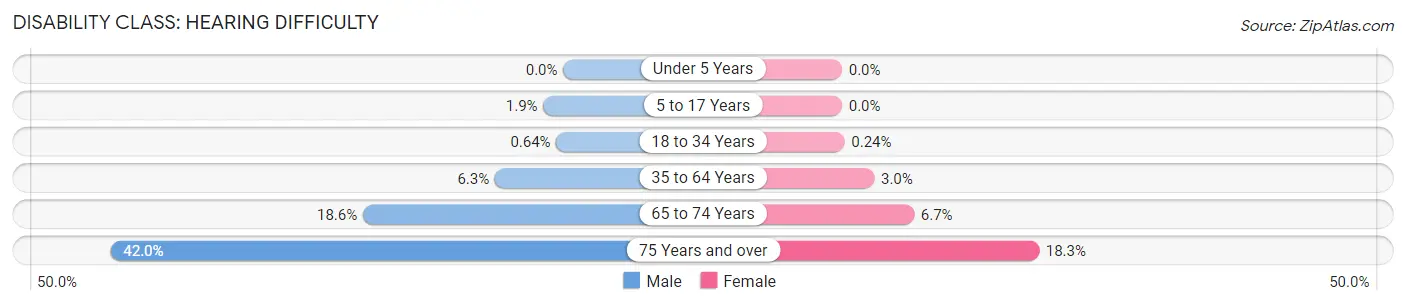
| Age Bracket | Male | Female |
| Under 5 Years | 0 (0.0%) | 0 (0.0%) |
| 5 to 17 Years | 21 (1.8%) | 0 (0.0%) |
| 18 to 34 Years | 9 (0.6%) | 3 (0.2%) |
| 35 to 64 Years | 196 (6.3%) | 82 (3.0%) |
| 65 to 74 Years | 163 (18.6%) | 60 (6.7%) |
| 75 Years and over | 251 (42.0%) | 145 (18.3%) |
Disability Class: Vision Difficulty
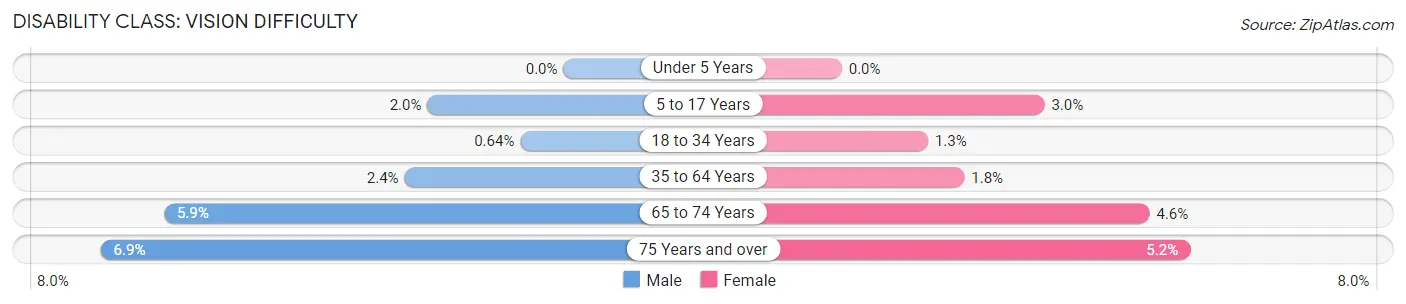
| Age Bracket | Male | Female |
| Under 5 Years | 0 (0.0%) | 0 (0.0%) |
| 5 to 17 Years | 23 (2.0%) | 31 (3.0%) |
| 18 to 34 Years | 9 (0.6%) | 16 (1.3%) |
| 35 to 64 Years | 73 (2.4%) | 50 (1.8%) |
| 65 to 74 Years | 52 (5.9%) | 41 (4.6%) |
| 75 Years and over | 41 (6.9%) | 41 (5.2%) |
Disability Class: Cognitive Difficulty
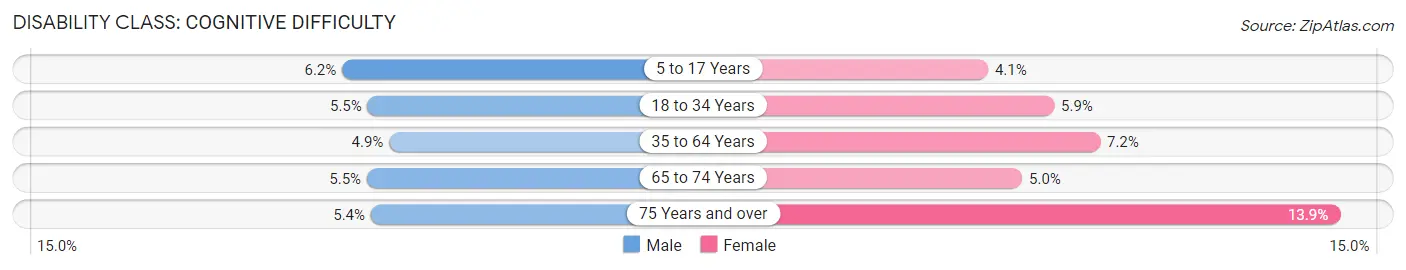
| Age Bracket | Male | Female |
| 5 to 17 Years | 70 (6.2%) | 42 (4.1%) |
| 18 to 34 Years | 77 (5.4%) | 74 (5.9%) |
| 35 to 64 Years | 150 (4.9%) | 197 (7.2%) |
| 65 to 74 Years | 48 (5.5%) | 45 (5.0%) |
| 75 Years and over | 32 (5.4%) | 110 (13.9%) |
Disability Class: Ambulatory Difficulty
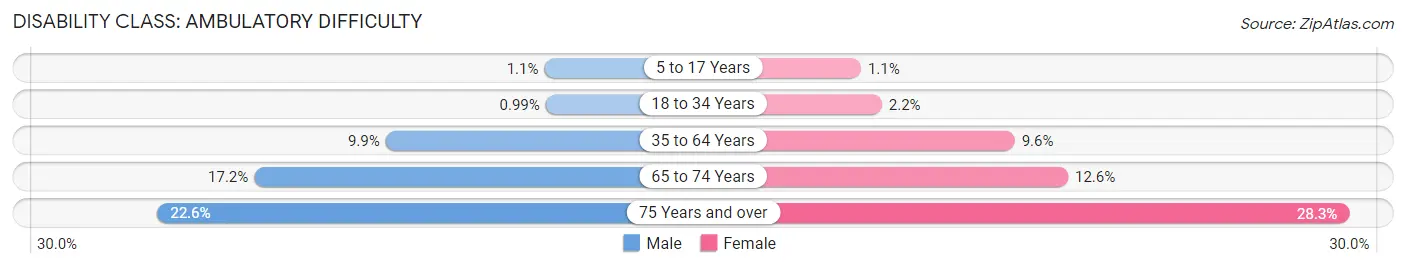
| Age Bracket | Male | Female |
| 5 to 17 Years | 12 (1.1%) | 11 (1.1%) |
| 18 to 34 Years | 14 (1.0%) | 28 (2.2%) |
| 35 to 64 Years | 306 (9.9%) | 264 (9.6%) |
| 65 to 74 Years | 151 (17.2%) | 113 (12.6%) |
| 75 Years and over | 135 (22.6%) | 224 (28.2%) |
Disability Class: Self-Care Difficulty
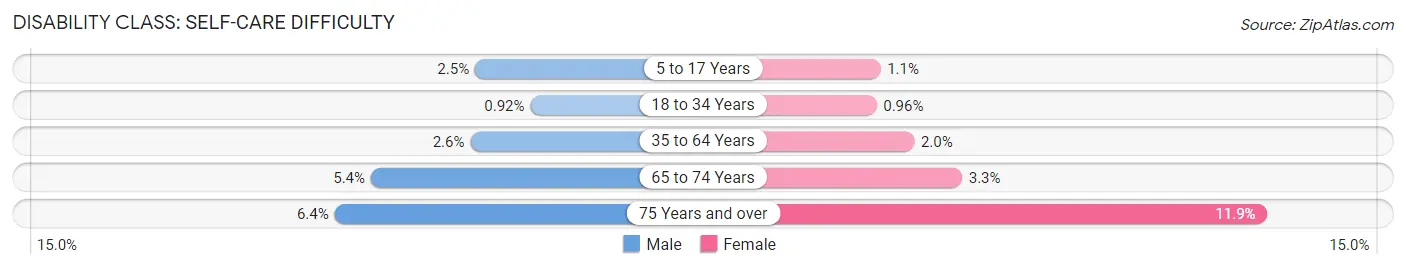
| Age Bracket | Male | Female |
| 5 to 17 Years | 28 (2.5%) | 11 (1.1%) |
| 18 to 34 Years | 13 (0.9%) | 12 (1.0%) |
| 35 to 64 Years | 80 (2.6%) | 55 (2.0%) |
| 65 to 74 Years | 47 (5.4%) | 30 (3.3%) |
| 75 Years and over | 38 (6.4%) | 94 (11.8%) |
Technology Access in Fulton County
Computing Device Access in Fulton County
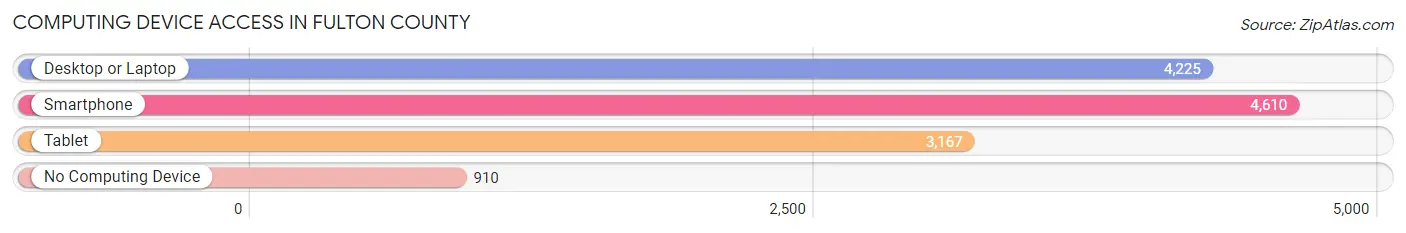
| Device Type | # Households | % Households |
| Desktop or Laptop | 4,225 | 69.0% |
| Smartphone | 4,610 | 75.2% |
| Tablet | 3,167 | 51.7% |
| No Computing Device | 910 | 14.8% |
| Total | 6,126 | 100.0% |
Internet Access in Fulton County
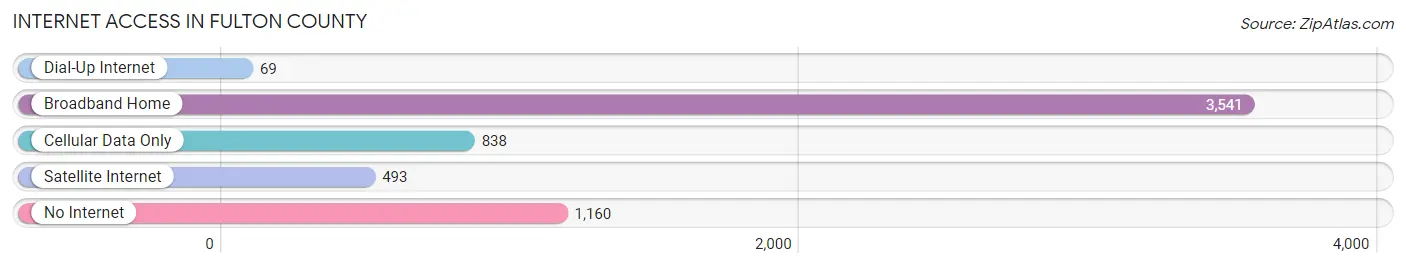
| Internet Type | # Households | % Households |
| Dial-Up Internet | 69 | 1.1% |
| Broadband Home | 3,541 | 57.8% |
| Cellular Data Only | 838 | 13.7% |
| Satellite Internet | 493 | 8.1% |
| No Internet | 1,160 | 18.9% |
| Total | 6,126 | 100.0% |
Fulton County Summary
Fulton County, Pennsylvania is located in the south-central part of the state, and is bordered by Franklin, Bedford, Huntingdon, and Perry Counties. The county seat is McConnellsburg, and the county was created in 1850 from parts of Bedford, Franklin, and Huntingdon Counties. The county has a total area of 545 square miles, and a population of 14,261 as of the 2010 census.
History
The area that is now Fulton County was originally inhabited by the Susquehannock and Iroquois Native American tribes. The first European settlers arrived in the area in the mid-1700s, and the county was officially established in 1850. The county was named after Robert Fulton, the inventor of the steamboat.
During the Civil War, the county was divided in its loyalties, with some residents supporting the Union and others supporting the Confederacy. The county was home to several skirmishes during the war, and the town of McConnellsburg was the site of a Confederate victory in 1863.
Geography
Fulton County is located in the Appalachian Mountains of south-central Pennsylvania. The county is mostly mountainous, with the highest point being Tuscarora Mountain at 2,890 feet. The county is drained by the Raystown Branch of the Juniata River, which flows through the county from east to west.
The county is home to several state parks, including Cowans Gap State Park, Buchanan State Forest, and Forbes State Forest. The county also contains several small towns, including McConnellsburg, Needmore, and Hustontown.
Economy
The economy of Fulton County is largely based on agriculture and tourism. The county is home to several farms, which produce a variety of crops, including corn, soybeans, hay, and wheat. The county is also home to several wineries, which produce a variety of wines.
Tourism is also an important part of the county’s economy. The county is home to several state parks, which attract visitors from all over the state. The county is also home to several historic sites, including the Fulton County Courthouse and the Fulton County Historical Society.
Demographics
As of the 2010 census, the population of Fulton County was 14,261. The population is mostly white (97.3%), with small percentages of African American (1.2%), Hispanic (0.7%), and Asian (0.3%) residents. The median household income in the county is $41,945, and the median age is 43.
The county is home to several religious denominations, including Baptist, Methodist, Lutheran, and Presbyterian. The county is also home to several private schools, including the Fulton County Christian School and the McConnellsburg Christian Academy.
Conclusion
Fulton County, Pennsylvania is a rural county located in the Appalachian Mountains of south-central Pennsylvania. The county was established in 1850, and is home to a population of 14,261 as of the 2010 census. The economy of the county is largely based on agriculture and tourism, and the county is home to several state parks and historic sites. The county is mostly white, with small percentages of African American, Hispanic, and Asian residents.
Common Questions
What is Per Capita Income in Fulton County?
Per Capita income in Fulton County is $33,601.
What is the Median Family Income in Fulton County?
Median Family Income in Fulton County is $77,817.
What is the Median Household income in Fulton County?
Median Household Income in Fulton County is $63,153.
What is Income or Wage Gap in Fulton County?
Income or Wage Gap in Fulton County is 33.8%.
Women in Fulton County earn 66.2 cents for every dollar earned by a man.
What is Family Income Deficit in Fulton County?
Family Income Deficit in Fulton County is $9,031.
Families that are below poverty line in Fulton County earn $9,031 less on average than the poverty threshold level.
What is Inequality or Gini Index in Fulton County?
Inequality or Gini Index in Fulton County is 0.41.
What is the Total Population of Fulton County?
Total Population of Fulton County is 14,545.
What is the Total Male Population of Fulton County?
Total Male Population of Fulton County is 7,485.
What is the Total Female Population of Fulton County?
Total Female Population of Fulton County is 7,060.
What is the Ratio of Males per 100 Females in Fulton County?
There are 106.02 Males per 100 Females in Fulton County.
What is the Ratio of Females per 100 Males in Fulton County?
There are 94.32 Females per 100 Males in Fulton County.
What is the Median Population Age in Fulton County?
Median Population Age in Fulton County is 45.7 Years.
What is the Average Family Size in Fulton County
Average Family Size in Fulton County is 2.9 People.
What is the Average Household Size in Fulton County
Average Household Size in Fulton County is 2.4 People.
How Large is the Labor Force in Fulton County?
There are 7,138 People in the Labor Forcein in Fulton County.
What is the Percentage of People in the Labor Force in Fulton County?
59.1% of People are in the Labor Force in Fulton County.
What is the Unemployment Rate in Fulton County?
Unemployment Rate in Fulton County is 3.7%.