Franklin County, PA Map & Demographics
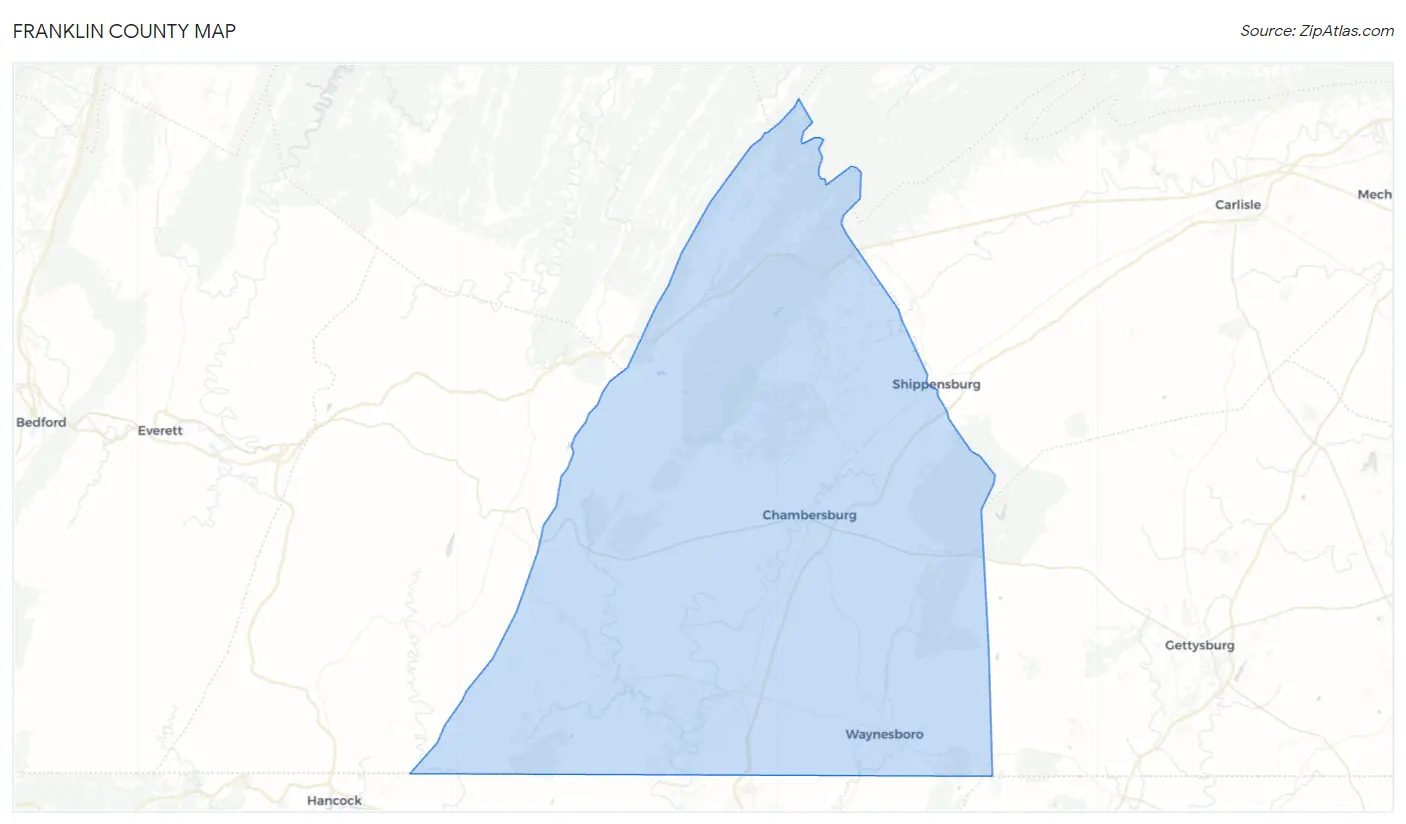
Franklin County Map
Franklin County Overview
$37,520
PER CAPITA INCOME
$85,138
AVG FAMILY INCOME
$71,808
AVG HOUSEHOLD INCOME
30.7%
WAGE / INCOME GAP [ % ]
69.3¢/ $1
WAGE / INCOME GAP [ $ ]
$12,045
FAMILY INCOME DEFICIT
0.42
INEQUALITY / GINI INDEX
156,084
TOTAL POPULATION
77,293
MALE POPULATION
78,791
FEMALE POPULATION
98.10
MALES / 100 FEMALES
101.94
FEMALES / 100 MALES
42.2
MEDIAN AGE
3.0
AVG FAMILY SIZE
2.5
AVG HOUSEHOLD SIZE
78,558
LABOR FORCE [ PEOPLE ]
62.5%
PERCENT IN LABOR FORCE
3.4%
UNEMPLOYMENT RATE
Franklin County Area Codes
Income in Franklin County
Income Overview in Franklin County
Per Capita Income in Franklin County is $37,520, while median incomes of families and households are $85,138 and $71,808 respectively.
| Characteristic | Number | Measure |
| Per Capita Income | 156,084 | $37,520 |
| Median Family Income | 42,855 | $85,138 |
| Mean Family Income | 42,855 | $106,207 |
| Median Household Income | 62,576 | $71,808 |
| Mean Household Income | 62,576 | $91,710 |
| Income Deficit | 42,855 | $12,045 |
| Wage / Income Gap (%) | 156,084 | 30.68% |
| Wage / Income Gap ($) | 156,084 | 69.32¢ per $1 |
| Gini / Inequality Index | 156,084 | 0.42 |
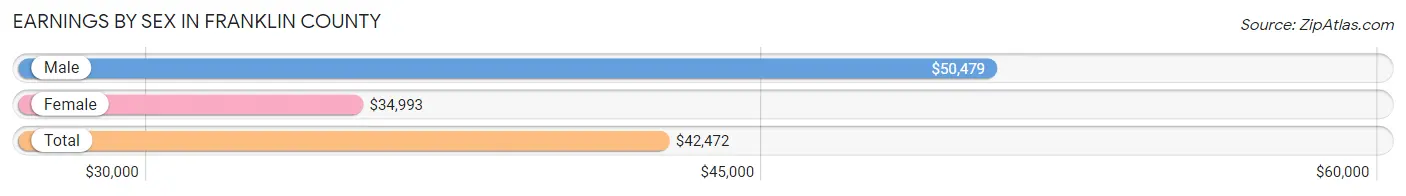
Earnings by Sex in Franklin County
Average Earnings in Franklin County are $42,472, $50,479 for men and $34,993 for women, a difference of 30.7%.
| Sex | Number | Average Earnings |
| Male | 44,169 (53.4%) | $50,479 |
| Female | 38,478 (46.6%) | $34,993 |
| Total | 82,647 (100.0%) | $42,472 |
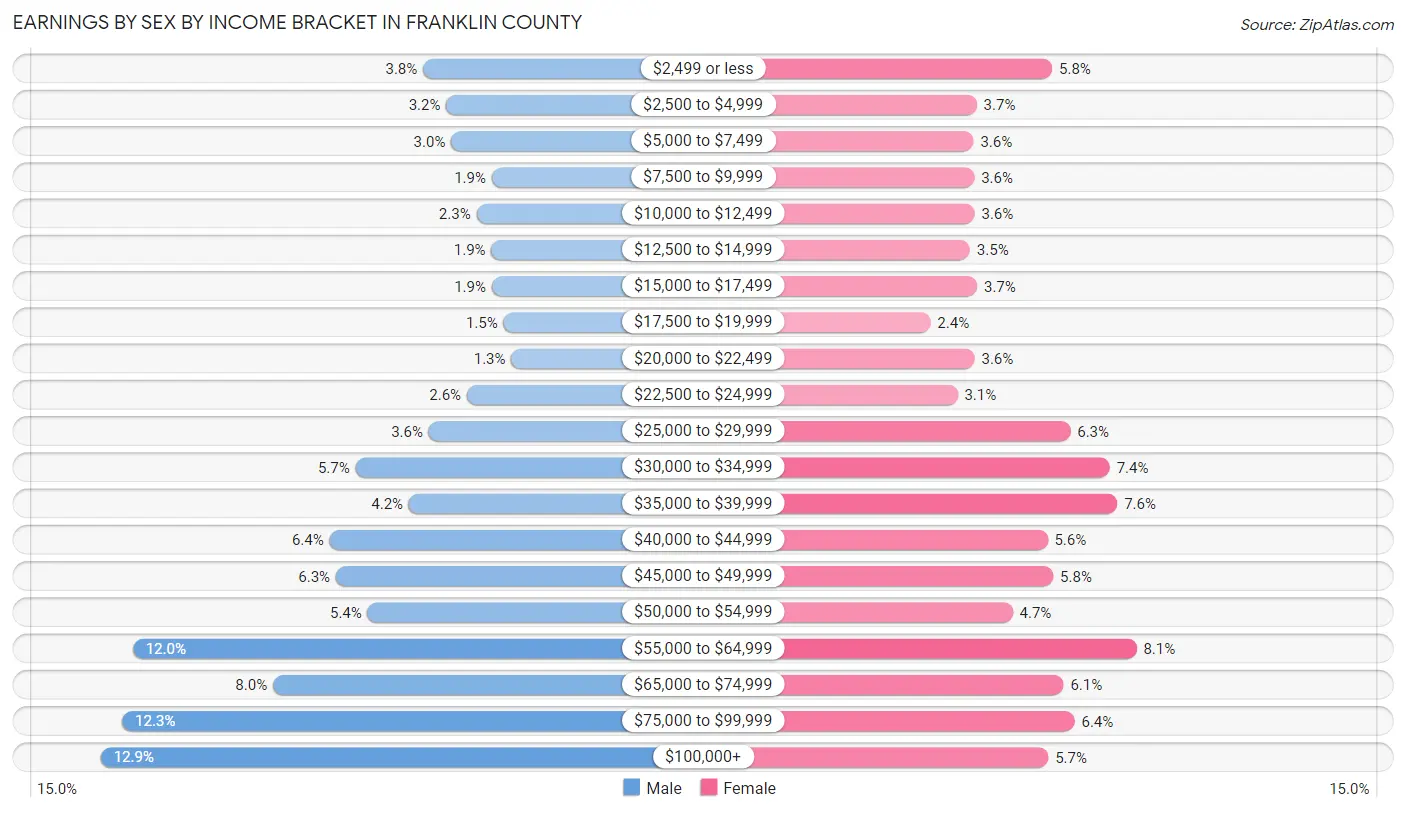
Earnings by Sex by Income Bracket in Franklin County
The most common earnings brackets in Franklin County are $100,000+ for men (5,679 | 12.9%) and $55,000 to $64,999 for women (3,134 | 8.1%).
| Income | Male | Female |
| $2,499 or less | 1,680 (3.8%) | 2,222 (5.8%) |
| $2,500 to $4,999 | 1,393 (3.2%) | 1,405 (3.6%) |
| $5,000 to $7,499 | 1,329 (3.0%) | 1,368 (3.6%) |
| $7,500 to $9,999 | 827 (1.9%) | 1,378 (3.6%) |
| $10,000 to $12,499 | 1,016 (2.3%) | 1,383 (3.6%) |
| $12,500 to $14,999 | 831 (1.9%) | 1,332 (3.5%) |
| $15,000 to $17,499 | 825 (1.9%) | 1,410 (3.7%) |
| $17,500 to $19,999 | 680 (1.5%) | 905 (2.4%) |
| $20,000 to $22,499 | 582 (1.3%) | 1,381 (3.6%) |
| $22,500 to $24,999 | 1,134 (2.6%) | 1,198 (3.1%) |
| $25,000 to $29,999 | 1,608 (3.6%) | 2,418 (6.3%) |
| $30,000 to $34,999 | 2,519 (5.7%) | 2,843 (7.4%) |
| $35,000 to $39,999 | 1,857 (4.2%) | 2,923 (7.6%) |
| $40,000 to $44,999 | 2,839 (6.4%) | 2,170 (5.6%) |
| $45,000 to $49,999 | 2,762 (6.2%) | 2,233 (5.8%) |
| $50,000 to $54,999 | 2,369 (5.4%) | 1,793 (4.7%) |
| $55,000 to $64,999 | 5,282 (12.0%) | 3,134 (8.1%) |
| $65,000 to $74,999 | 3,541 (8.0%) | 2,343 (6.1%) |
| $75,000 to $99,999 | 5,416 (12.3%) | 2,463 (6.4%) |
| $100,000+ | 5,679 (12.9%) | 2,176 (5.7%) |
| Total | 44,169 (100.0%) | 38,478 (100.0%) |
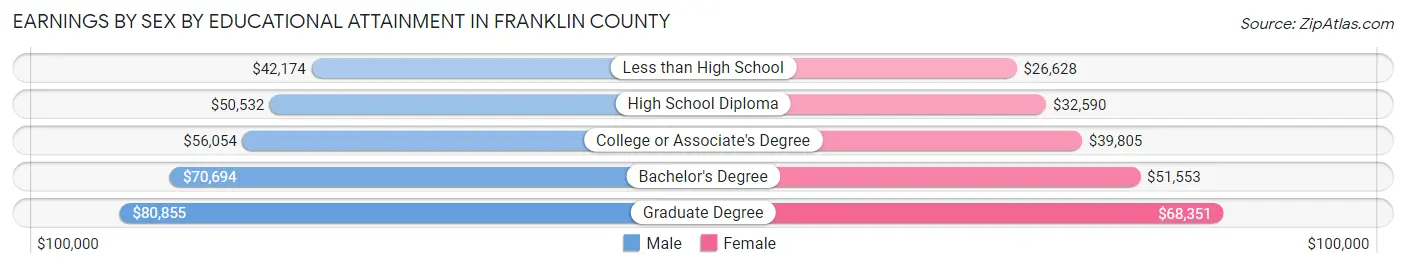
Earnings by Sex by Educational Attainment in Franklin County
Average earnings in Franklin County are $55,436 for men and $38,877 for women, a difference of 29.9%. Men with an educational attainment of graduate degree enjoy the highest average annual earnings of $80,855, while those with less than high school education earn the least with $42,174. Women with an educational attainment of graduate degree earn the most with the average annual earnings of $68,351, while those with less than high school education have the smallest earnings of $26,628.
| Educational Attainment | Male Income | Female Income |
| Less than High School | $42,174 | $26,628 |
| High School Diploma | $50,532 | $32,590 |
| College or Associate's Degree | $56,054 | $39,805 |
| Bachelor's Degree | $70,694 | $51,553 |
| Graduate Degree | $80,855 | $68,351 |
| Total | $55,436 | $38,877 |
Family Income in Franklin County
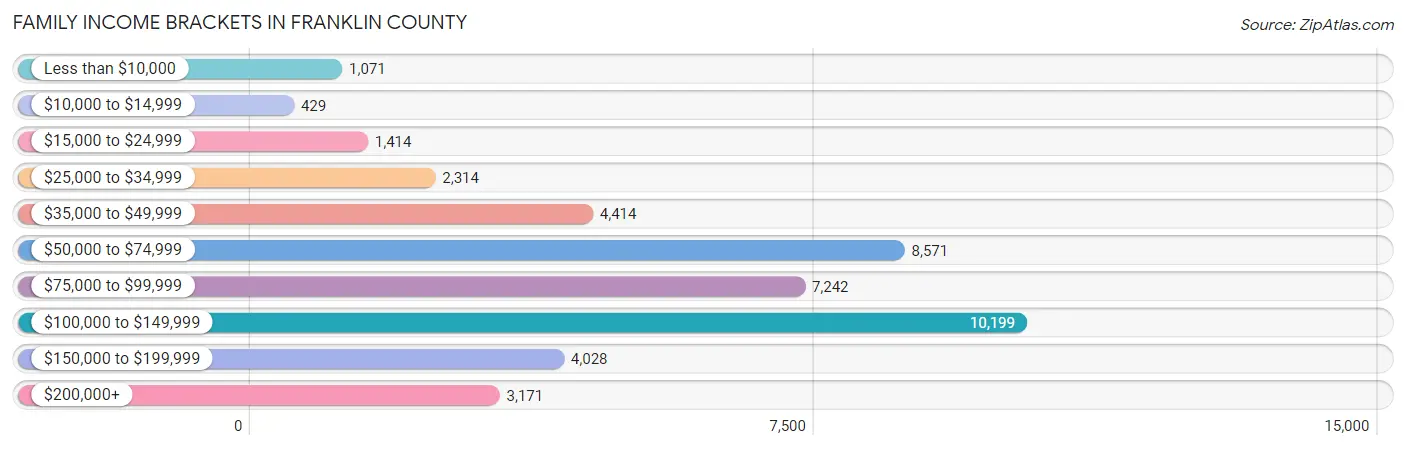
Family Income Brackets in Franklin County
According to the Franklin County family income data, there are 10,199 families falling into the $100,000 to $149,999 income range, which is the most common income bracket and makes up 23.8% of all families. Conversely, the $10,000 to $14,999 income bracket is the least frequent group with only 429 families (1.0%) belonging to this category.
| Income Bracket | # Families | % Families |
| Less than $10,000 | 1,071 | 2.5% |
| $10,000 to $14,999 | 429 | 1.0% |
| $15,000 to $24,999 | 1,414 | 3.3% |
| $25,000 to $34,999 | 2,314 | 5.4% |
| $35,000 to $49,999 | 4,414 | 10.3% |
| $50,000 to $74,999 | 8,571 | 20.0% |
| $75,000 to $99,999 | 7,242 | 16.9% |
| $100,000 to $149,999 | 10,199 | 23.8% |
| $150,000 to $199,999 | 4,028 | 9.4% |
| $200,000+ | 3,171 | 7.4% |
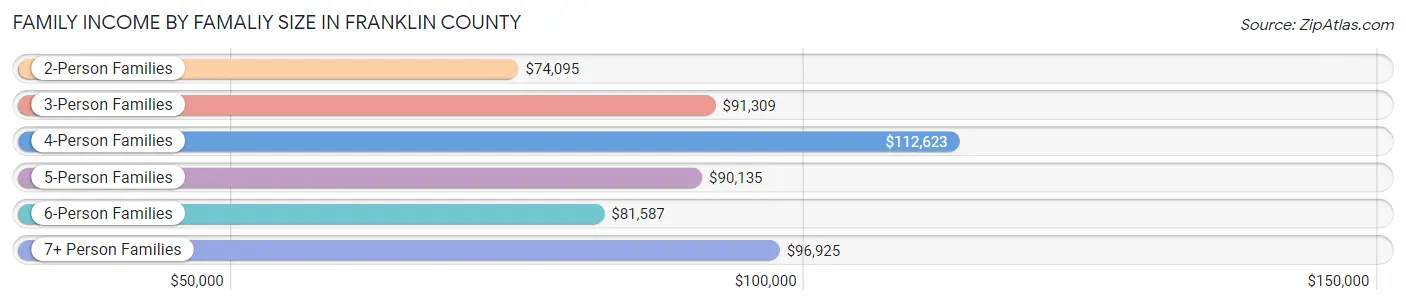
Family Income by Famaliy Size in Franklin County
4-person families (7,155 | 16.7%) account for the highest median family income in Franklin County with $112,623 per family, while 2-person families (22,200 | 51.8%) have the highest median income of $37,048 per family member.
| Income Bracket | # Families | Median Income |
| 2-Person Families | 22,200 (51.8%) | $74,095 |
| 3-Person Families | 8,399 (19.6%) | $91,309 |
| 4-Person Families | 7,155 (16.7%) | $112,623 |
| 5-Person Families | 2,676 (6.2%) | $90,135 |
| 6-Person Families | 1,166 (2.7%) | $81,587 |
| 7+ Person Families | 1,259 (2.9%) | $96,925 |
| Total | 42,855 (100.0%) | $85,138 |
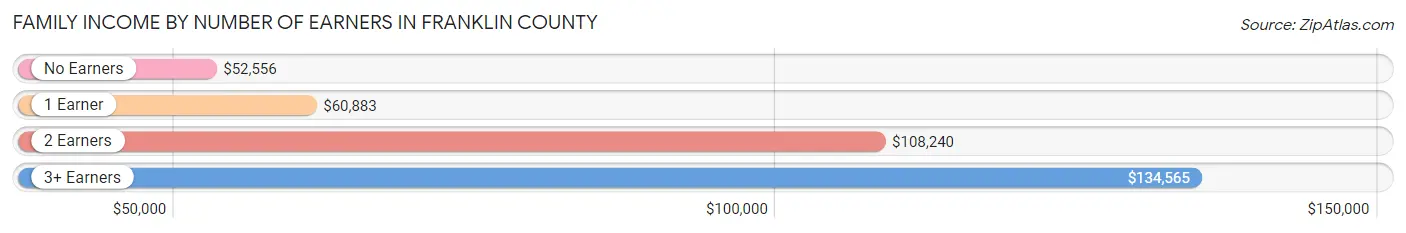
Family Income by Number of Earners in Franklin County
The median family income in Franklin County is $85,138, with families comprising 3+ earners (5,374) having the highest median family income of $134,565, while families with no earners (7,632) have the lowest median family income of $52,556, accounting for 12.5% and 17.8% of families, respectively.
| Number of Earners | # Families | Median Income |
| No Earners | 7,632 (17.8%) | $52,556 |
| 1 Earner | 12,779 (29.8%) | $60,883 |
| 2 Earners | 17,070 (39.8%) | $108,240 |
| 3+ Earners | 5,374 (12.5%) | $134,565 |
| Total | 42,855 (100.0%) | $85,138 |
Household Income in Franklin County
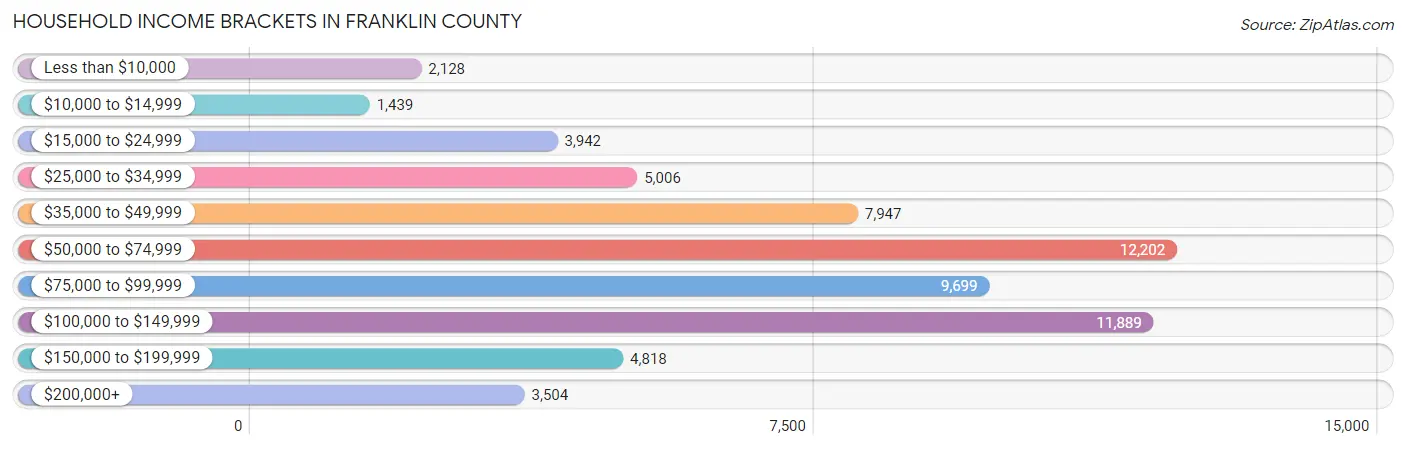
Household Income Brackets in Franklin County
With 12,202 households falling in the category, the $50,000 to $74,999 income range is the most frequent in Franklin County, accounting for 19.5% of all households. In contrast, only 1,439 households (2.3%) fall into the $10,000 to $14,999 income bracket, making it the least populous group.
| Income Bracket | # Households | % Households |
| Less than $10,000 | 2,128 | 3.4% |
| $10,000 to $14,999 | 1,439 | 2.3% |
| $15,000 to $24,999 | 3,942 | 6.3% |
| $25,000 to $34,999 | 5,006 | 8.0% |
| $35,000 to $49,999 | 7,947 | 12.7% |
| $50,000 to $74,999 | 12,202 | 19.5% |
| $75,000 to $99,999 | 9,699 | 15.5% |
| $100,000 to $149,999 | 11,889 | 19.0% |
| $150,000 to $199,999 | 4,818 | 7.7% |
| $200,000+ | 3,504 | 5.6% |
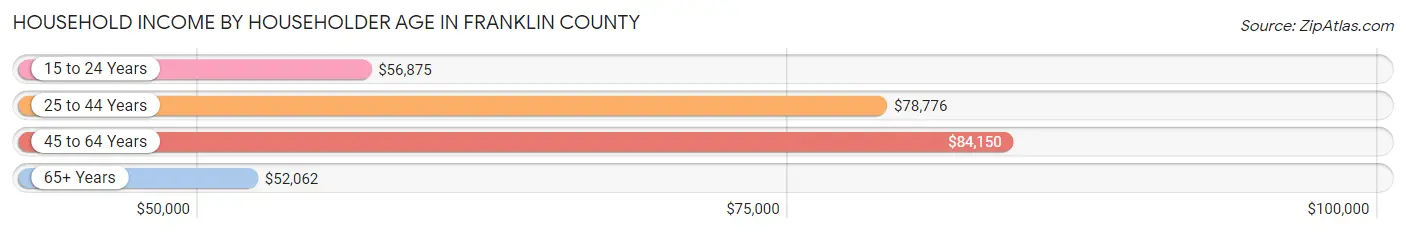
Household Income by Householder Age in Franklin County
The median household income in Franklin County is $71,808, with the highest median household income of $84,150 found in the 45 to 64 years age bracket for the primary householder. A total of 23,404 households (37.4%) fall into this category. Meanwhile, the 65+ years age bracket for the primary householder has the lowest median household income of $52,062, with 19,156 households (30.6%) in this group.
| Income Bracket | # Households | Median Income |
| 15 to 24 Years | 2,064 (3.3%) | $56,875 |
| 25 to 44 Years | 17,952 (28.7%) | $78,776 |
| 45 to 64 Years | 23,404 (37.4%) | $84,150 |
| 65+ Years | 19,156 (30.6%) | $52,062 |
| Total | 62,576 (100.0%) | $71,808 |
Poverty in Franklin County
Income Below Poverty by Sex and Age in Franklin County
With 8.1% poverty level for males and 9.9% for females among the residents of Franklin County, under 5 year old males and 5 year old females are the most vulnerable to poverty, with 846 males (19.3%) and 305 females (30.4%) in their respective age groups living below the poverty level.
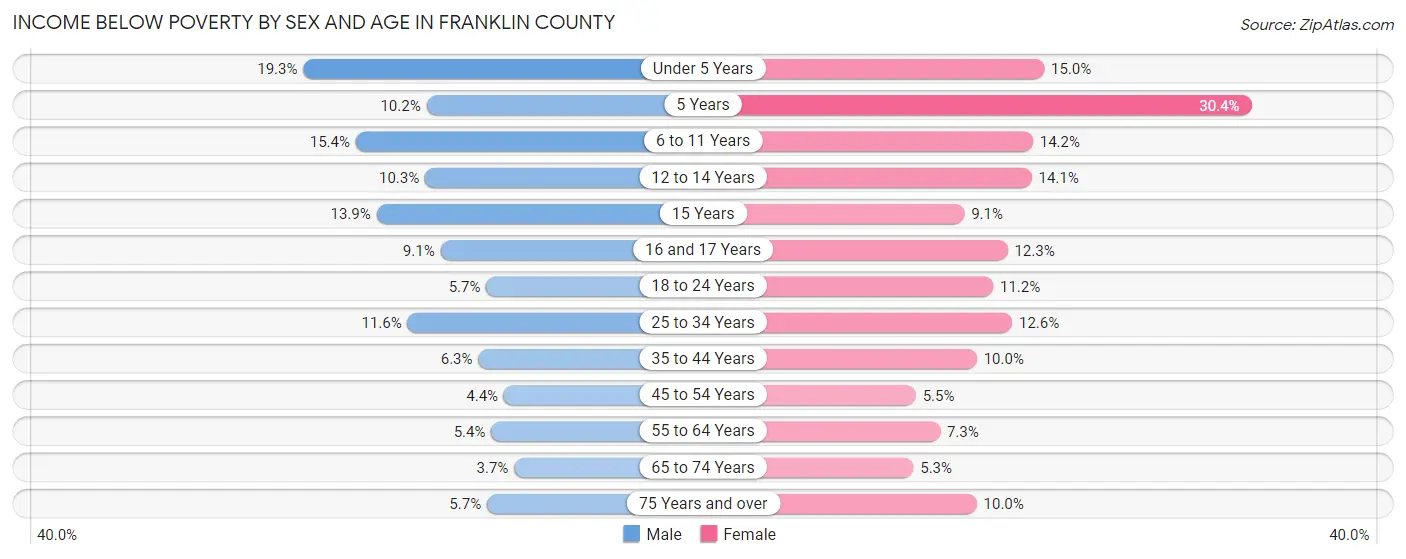
| Age Bracket | Male | Female |
| Under 5 Years | 846 (19.3%) | 640 (15.0%) |
| 5 Years | 109 (10.2%) | 305 (30.4%) |
| 6 to 11 Years | 924 (15.4%) | 720 (14.2%) |
| 12 to 14 Years | 281 (10.3%) | 443 (14.1%) |
| 15 Years | 172 (13.9%) | 88 (9.1%) |
| 16 and 17 Years | 183 (9.1%) | 213 (12.3%) |
| 18 to 24 Years | 333 (5.7%) | 601 (11.2%) |
| 25 to 34 Years | 1,098 (11.6%) | 1,203 (12.6%) |
| 35 to 44 Years | 578 (6.3%) | 922 (10.0%) |
| 45 to 54 Years | 455 (4.4%) | 547 (5.5%) |
| 55 to 64 Years | 564 (5.3%) | 794 (7.3%) |
| 65 to 74 Years | 298 (3.6%) | 476 (5.3%) |
| 75 Years and over | 309 (5.7%) | 755 (10.0%) |
| Total | 6,150 (8.1%) | 7,707 (9.9%) |
Income Above Poverty by Sex and Age in Franklin County
According to the poverty statistics in Franklin County, males aged 65 to 74 years and females aged 65 to 74 years are the age groups that are most secure financially, with 96.4% of males and 94.7% of females in these age groups living above the poverty line.
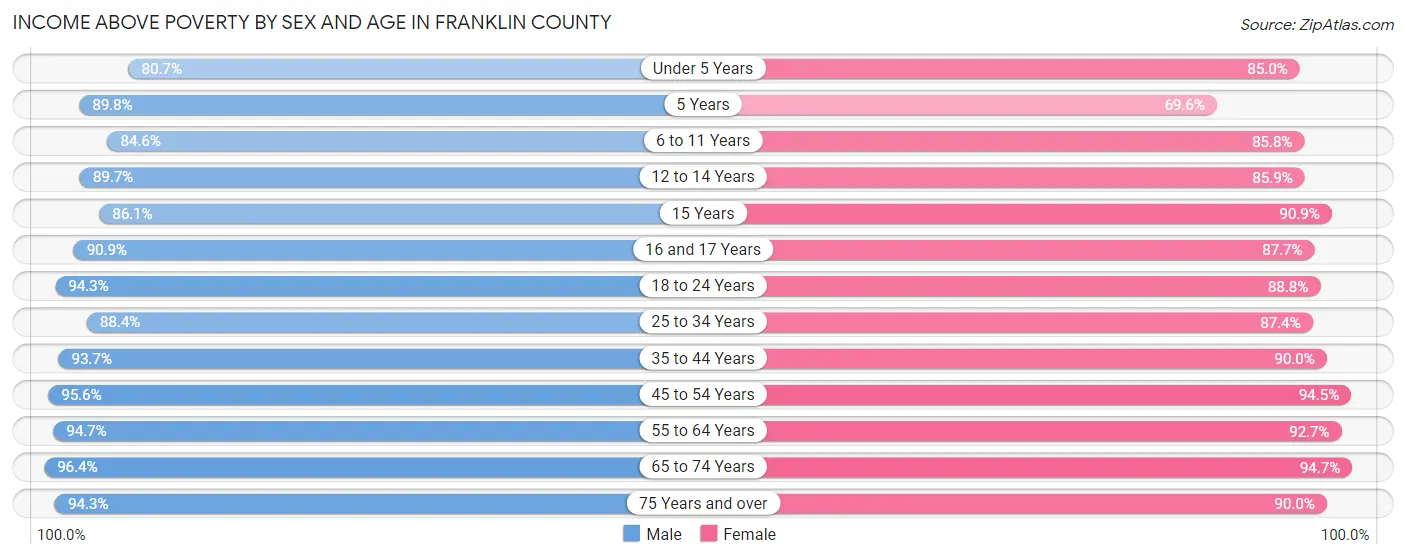
| Age Bracket | Male | Female |
| Under 5 Years | 3,535 (80.7%) | 3,621 (85.0%) |
| 5 Years | 964 (89.8%) | 698 (69.6%) |
| 6 to 11 Years | 5,072 (84.6%) | 4,359 (85.8%) |
| 12 to 14 Years | 2,455 (89.7%) | 2,700 (85.9%) |
| 15 Years | 1,068 (86.1%) | 880 (90.9%) |
| 16 and 17 Years | 1,824 (90.9%) | 1,519 (87.7%) |
| 18 to 24 Years | 5,489 (94.3%) | 4,753 (88.8%) |
| 25 to 34 Years | 8,391 (88.4%) | 8,315 (87.4%) |
| 35 to 44 Years | 8,582 (93.7%) | 8,276 (90.0%) |
| 45 to 54 Years | 9,865 (95.6%) | 9,417 (94.5%) |
| 55 to 64 Years | 9,983 (94.7%) | 10,097 (92.7%) |
| 65 to 74 Years | 7,860 (96.4%) | 8,488 (94.7%) |
| 75 Years and over | 5,141 (94.3%) | 6,791 (90.0%) |
| Total | 70,229 (91.9%) | 69,914 (90.1%) |
Income Below Poverty Among Married-Couple Families in Franklin County
The poverty statistics for married-couple families in Franklin County show that 3.0% or 1,046 of the total 34,257 families live below the poverty line. Families with 5 or more children have the highest poverty rate of 14.8%, comprising of 92 families. On the other hand, families with 1 or 2 children have the lowest poverty rate of 2.2%, which includes 214 families.
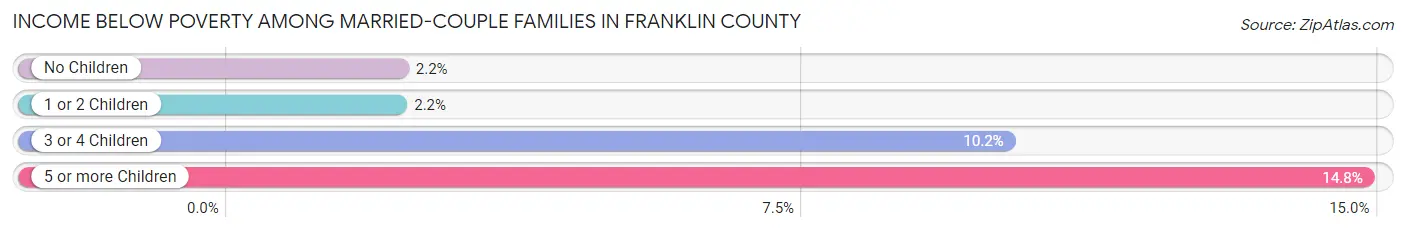
| Children | Above Poverty | Below Poverty |
| No Children | 20,859 (97.8%) | 475 (2.2%) |
| 1 or 2 Children | 9,478 (97.8%) | 214 (2.2%) |
| 3 or 4 Children | 2,346 (89.8%) | 265 (10.2%) |
| 5 or more Children | 528 (85.2%) | 92 (14.8%) |
| Total | 33,211 (97.0%) | 1,046 (3.0%) |
Income Below Poverty Among Single-Parent Households in Franklin County
According to the poverty data in Franklin County, 15.4% or 419 single-father households and 19.2% or 1,131 single-mother households are living below the poverty line. Among single-father households, those with 5 or more children have the highest poverty rate, with 21 households (100.0%) experiencing poverty. Likewise, among single-mother households, those with 3 or 4 children have the highest poverty rate, with 484 households (56.2%) falling below the poverty line.
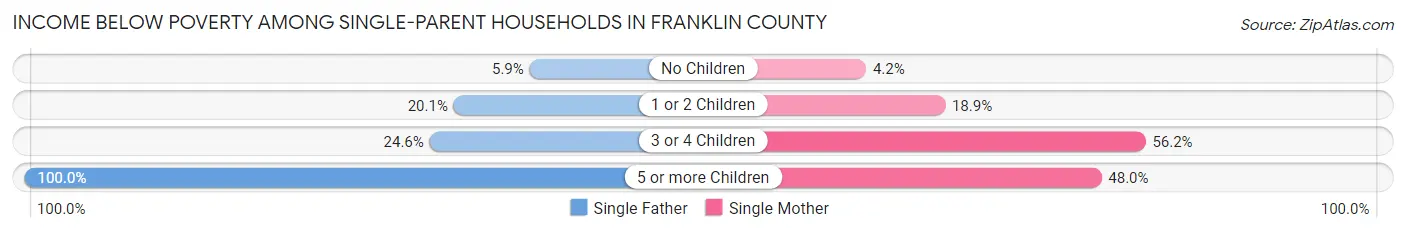
| Children | Single Father | Single Mother |
| No Children | 62 (5.9%) | 87 (4.2%) |
| 1 or 2 Children | 308 (20.1%) | 548 (18.9%) |
| 3 or 4 Children | 28 (24.6%) | 484 (56.2%) |
| 5 or more Children | 21 (100.0%) | 12 (48.0%) |
| Total | 419 (15.4%) | 1,131 (19.2%) |
Income Below Poverty Among Married-Couple vs Single-Parent Households in Franklin County
The poverty data for Franklin County shows that 1,046 of the married-couple family households (3.0%) and 1,550 of the single-parent households (18.0%) are living below the poverty level. Within the married-couple family households, those with 5 or more children have the highest poverty rate, with 92 households (14.8%) falling below the poverty line. Among the single-parent households, those with 5 or more children have the highest poverty rate, with 33 household (71.7%) living below poverty.
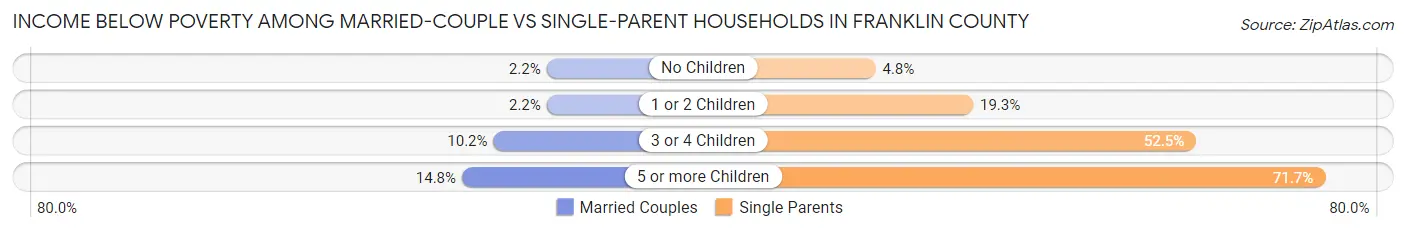
| Children | Married-Couple Families | Single-Parent Households |
| No Children | 475 (2.2%) | 149 (4.8%) |
| 1 or 2 Children | 214 (2.2%) | 856 (19.3%) |
| 3 or 4 Children | 265 (10.2%) | 512 (52.5%) |
| 5 or more Children | 92 (14.8%) | 33 (71.7%) |
| Total | 1,046 (3.0%) | 1,550 (18.0%) |
Race in Franklin County
The most populous races in Franklin County are White / Caucasian (139,482 | 89.4%), Hispanic or Latino (10,108 | 6.5%), and Two or more Races (7,017 | 4.5%).
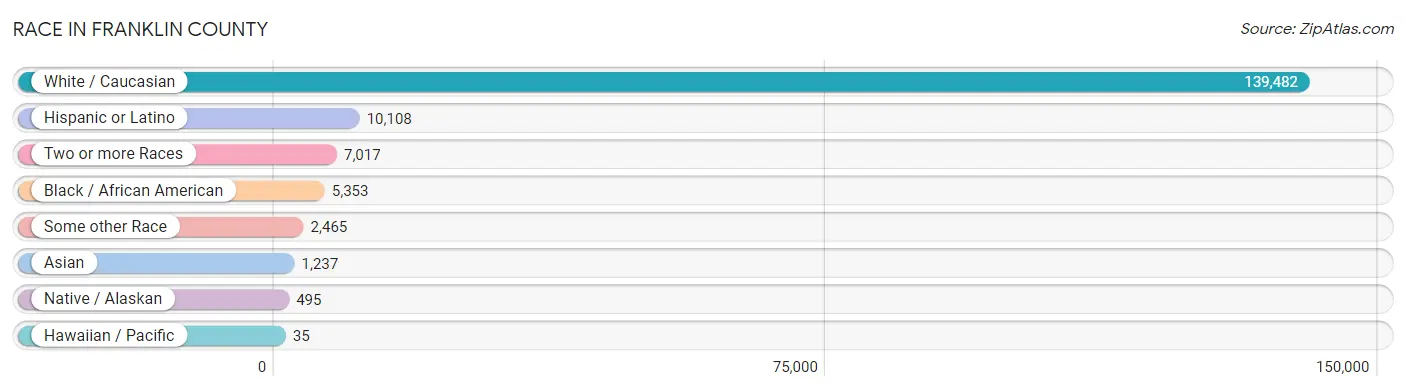
| Race | # Population | % Population |
| Asian | 1,237 | 0.8% |
| Black / African American | 5,353 | 3.4% |
| Hawaiian / Pacific | 35 | 0.0% |
| Hispanic or Latino | 10,108 | 6.5% |
| Native / Alaskan | 495 | 0.3% |
| White / Caucasian | 139,482 | 89.4% |
| Two or more Races | 7,017 | 4.5% |
| Some other Race | 2,465 | 1.6% |
| Total | 156,084 | 100.0% |
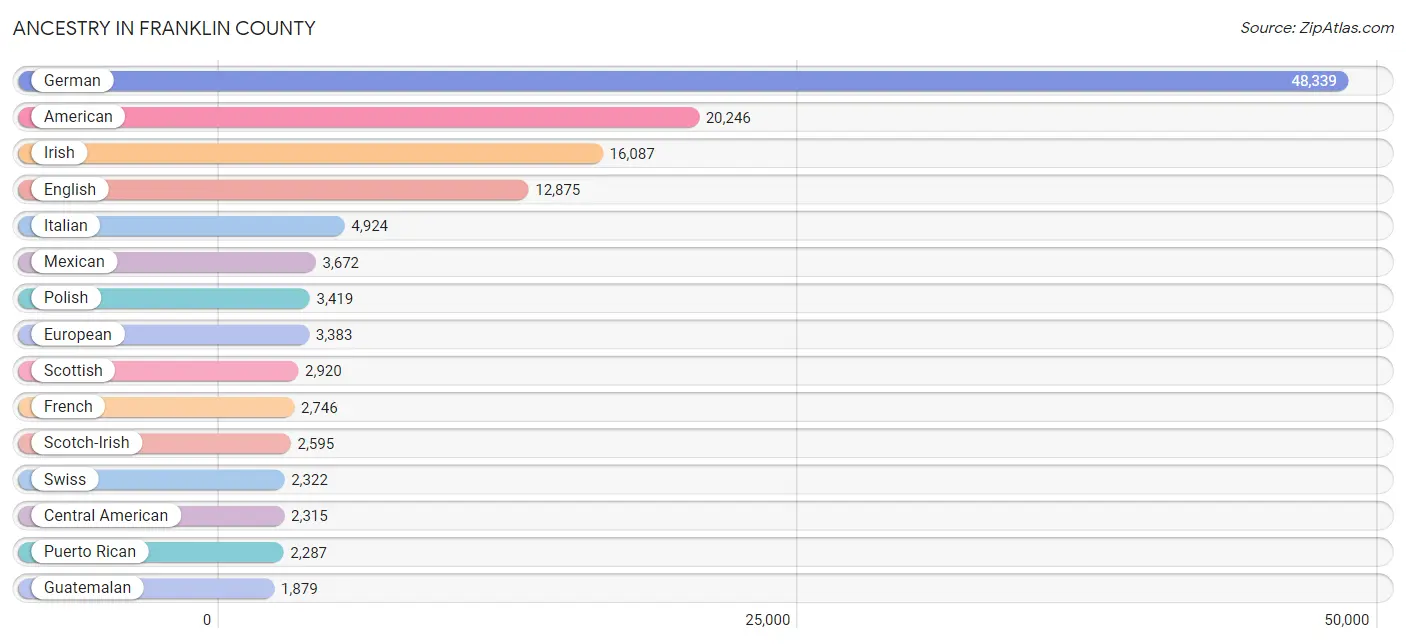
Ancestry in Franklin County
The most populous ancestries reported in Franklin County are German (48,339 | 31.0%), American (20,246 | 13.0%), Irish (16,087 | 10.3%), English (12,875 | 8.3%), and Italian (4,924 | 3.2%), together accounting for 65.6% of all Franklin County residents.
| Ancestry | # Population | % Population |
| African | 576 | 0.4% |
| Albanian | 80 | 0.1% |
| Alsatian | 2 | 0.0% |
| American | 20,246 | 13.0% |
| Apache | 15 | 0.0% |
| Arab | 364 | 0.2% |
| Argentinean | 3 | 0.0% |
| Armenian | 93 | 0.1% |
| Austrian | 176 | 0.1% |
| Bahamian | 15 | 0.0% |
| Barbadian | 100 | 0.1% |
| Belgian | 22 | 0.0% |
| Belizean | 80 | 0.1% |
| Bermudan | 13 | 0.0% |
| Bhutanese | 229 | 0.2% |
| Blackfeet | 125 | 0.1% |
| Bolivian | 56 | 0.0% |
| Brazilian | 26 | 0.0% |
| British | 583 | 0.4% |
| Bulgarian | 22 | 0.0% |
| Burmese | 261 | 0.2% |
| Cambodian | 8 | 0.0% |
| Canadian | 143 | 0.1% |
| Cape Verdean | 11 | 0.0% |
| Carpatho Rusyn | 18 | 0.0% |
| Central American | 2,315 | 1.5% |
| Central American Indian | 38 | 0.0% |
| Cherokee | 332 | 0.2% |
| Chilean | 24 | 0.0% |
| Choctaw | 67 | 0.0% |
| Colombian | 18 | 0.0% |
| Costa Rican | 48 | 0.0% |
| Croatian | 183 | 0.1% |
| Cuban | 232 | 0.2% |
| Czech | 218 | 0.1% |
| Czechoslovakian | 122 | 0.1% |
| Danish | 367 | 0.2% |
| Delaware | 26 | 0.0% |
| Dominican | 632 | 0.4% |
| Dutch | 1,653 | 1.1% |
| Dutch West Indian | 14 | 0.0% |
| Eastern European | 244 | 0.2% |
| Ecuadorian | 36 | 0.0% |
| English | 12,875 | 8.3% |
| Estonian | 12 | 0.0% |
| European | 3,383 | 2.2% |
| Finnish | 118 | 0.1% |
| French | 2,746 | 1.8% |
| French American Indian | 5 | 0.0% |
| French Canadian | 218 | 0.1% |
| German | 48,339 | 31.0% |
| German Russian | 57 | 0.0% |
| Greek | 163 | 0.1% |
| Guatemalan | 1,879 | 1.2% |
| Guyanese | 5 | 0.0% |
| Haitian | 160 | 0.1% |
| Hungarian | 791 | 0.5% |
| Icelander | 10 | 0.0% |
| Indian (Asian) | 298 | 0.2% |
| Indonesian | 34 | 0.0% |
| Iranian | 51 | 0.0% |
| Irish | 16,087 | 10.3% |
| Iroquois | 43 | 0.0% |
| Israeli | 2 | 0.0% |
| Italian | 4,924 | 3.2% |
| Jamaican | 493 | 0.3% |
| Korean | 277 | 0.2% |
| Laotian | 83 | 0.1% |
| Latvian | 13 | 0.0% |
| Lebanese | 44 | 0.0% |
| Liberian | 23 | 0.0% |
| Lithuanian | 208 | 0.1% |
| Lumbee | 49 | 0.0% |
| Luxembourger | 1 | 0.0% |
| Macedonian | 12 | 0.0% |
| Mexican | 3,672 | 2.4% |
| Mexican American Indian | 186 | 0.1% |
| Moroccan | 15 | 0.0% |
| Native Hawaiian | 35 | 0.0% |
| New Zealander | 12 | 0.0% |
| Nigerian | 32 | 0.0% |
| Northern European | 200 | 0.1% |
| Norwegian | 576 | 0.4% |
| Pakistani | 132 | 0.1% |
| Palestinian | 101 | 0.1% |
| Panamanian | 78 | 0.1% |
| Pennsylvania German | 686 | 0.4% |
| Peruvian | 200 | 0.1% |
| Polish | 3,419 | 2.2% |
| Portuguese | 144 | 0.1% |
| Puerto Rican | 2,287 | 1.5% |
| Romanian | 62 | 0.0% |
| Russian | 401 | 0.3% |
| Salvadoran | 310 | 0.2% |
| Scandinavian | 576 | 0.4% |
| Scotch-Irish | 2,595 | 1.7% |
| Scottish | 2,920 | 1.9% |
| Serbian | 32 | 0.0% |
| Shoshone | 9 | 0.0% |
| Sierra Leonean | 183 | 0.1% |
| Sioux | 74 | 0.1% |
| Slavic | 12 | 0.0% |
| Slovak | 340 | 0.2% |
| Slovene | 54 | 0.0% |
| South African | 33 | 0.0% |
| South American | 585 | 0.4% |
| Spaniard | 77 | 0.1% |
| Spanish | 174 | 0.1% |
| Sri Lankan | 138 | 0.1% |
| Subsaharan African | 858 | 0.5% |
| Swedish | 1,047 | 0.7% |
| Swiss | 2,322 | 1.5% |
| Syrian | 88 | 0.1% |
| Taiwanese | 136 | 0.1% |
| Thai | 369 | 0.2% |
| Tohono O'Odham | 24 | 0.0% |
| Trinidadian and Tobagonian | 130 | 0.1% |
| Turkish | 17 | 0.0% |
| Ugandan | 10 | 0.0% |
| Ukrainian | 185 | 0.1% |
| Uruguayan | 127 | 0.1% |
| Venezuelan | 121 | 0.1% |
| Welsh | 1,217 | 0.8% |
| West Indian | 278 | 0.2% |
| Yugoslavian | 510 | 0.3% | View All 125 Rows |
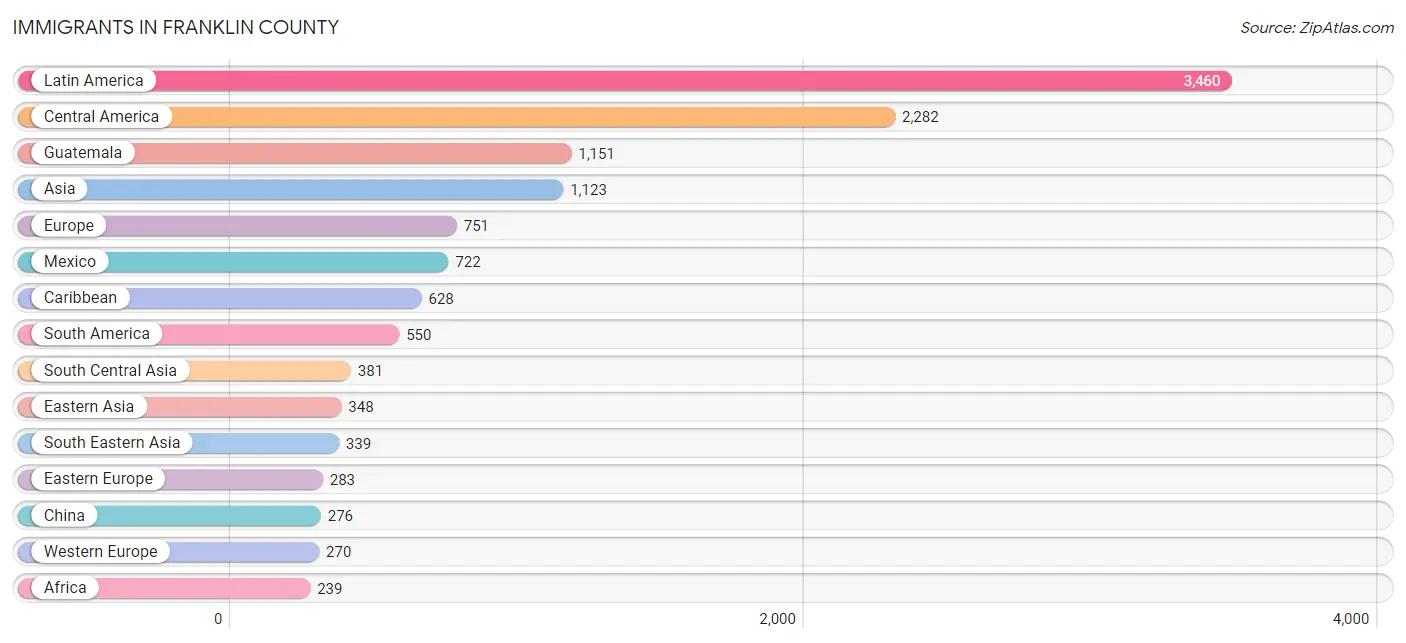
Immigrants in Franklin County
The most numerous immigrant groups reported in Franklin County came from Latin America (3,460 | 2.2%), Central America (2,282 | 1.5%), Guatemala (1,151 | 0.7%), Asia (1,123 | 0.7%), and Europe (751 | 0.5%), together accounting for 5.6% of all Franklin County residents.
| Immigration Origin | # Population | % Population |
| Africa | 239 | 0.2% |
| Argentina | 9 | 0.0% |
| Armenia | 39 | 0.0% |
| Asia | 1,123 | 0.7% |
| Azores | 28 | 0.0% |
| Barbados | 100 | 0.1% |
| Belize | 76 | 0.1% |
| Bolivia | 72 | 0.1% |
| Bosnia and Herzegovina | 58 | 0.0% |
| Brazil | 20 | 0.0% |
| Bulgaria | 9 | 0.0% |
| Canada | 207 | 0.1% |
| Caribbean | 628 | 0.4% |
| Central America | 2,282 | 1.5% |
| China | 276 | 0.2% |
| Colombia | 18 | 0.0% |
| Costa Rica | 10 | 0.0% |
| Croatia | 5 | 0.0% |
| Cuba | 61 | 0.0% |
| Denmark | 27 | 0.0% |
| Dominican Republic | 148 | 0.1% |
| Eastern Africa | 20 | 0.0% |
| Eastern Asia | 348 | 0.2% |
| Eastern Europe | 283 | 0.2% |
| Ecuador | 59 | 0.0% |
| El Salvador | 191 | 0.1% |
| England | 47 | 0.0% |
| Europe | 751 | 0.5% |
| France | 2 | 0.0% |
| Germany | 207 | 0.1% |
| Greece | 13 | 0.0% |
| Guatemala | 1,151 | 0.7% |
| Guyana | 19 | 0.0% |
| Haiti | 161 | 0.1% |
| Honduras | 80 | 0.1% |
| Hungary | 8 | 0.0% |
| India | 235 | 0.2% |
| Indonesia | 37 | 0.0% |
| Italy | 24 | 0.0% |
| Jamaica | 131 | 0.1% |
| Japan | 13 | 0.0% |
| Kenya | 10 | 0.0% |
| Korea | 59 | 0.0% |
| Latin America | 3,460 | 2.2% |
| Latvia | 13 | 0.0% |
| Lebanon | 16 | 0.0% |
| Liberia | 23 | 0.0% |
| Mexico | 722 | 0.5% |
| Morocco | 15 | 0.0% |
| Nepal | 33 | 0.0% |
| Netherlands | 56 | 0.0% |
| Northern Africa | 49 | 0.0% |
| Northern Europe | 133 | 0.1% |
| Pakistan | 51 | 0.0% |
| Panama | 52 | 0.0% |
| Peru | 197 | 0.1% |
| Philippines | 98 | 0.1% |
| Poland | 108 | 0.1% |
| Portugal | 28 | 0.0% |
| Romania | 19 | 0.0% |
| Russia | 36 | 0.0% |
| Scotland | 15 | 0.0% |
| Sierra Leone | 136 | 0.1% |
| South America | 550 | 0.4% |
| South Central Asia | 381 | 0.2% |
| South Eastern Asia | 339 | 0.2% |
| Southern Europe | 65 | 0.0% |
| Sri Lanka | 48 | 0.0% |
| Switzerland | 5 | 0.0% |
| Taiwan | 16 | 0.0% |
| Thailand | 103 | 0.1% |
| Trinidad and Tobago | 27 | 0.0% |
| Uganda | 10 | 0.0% |
| Ukraine | 27 | 0.0% |
| Uruguay | 106 | 0.1% |
| Venezuela | 50 | 0.0% |
| Vietnam | 67 | 0.0% |
| Western Africa | 159 | 0.1% |
| Western Asia | 55 | 0.0% |
| Western Europe | 270 | 0.2% | View All 80 Rows |
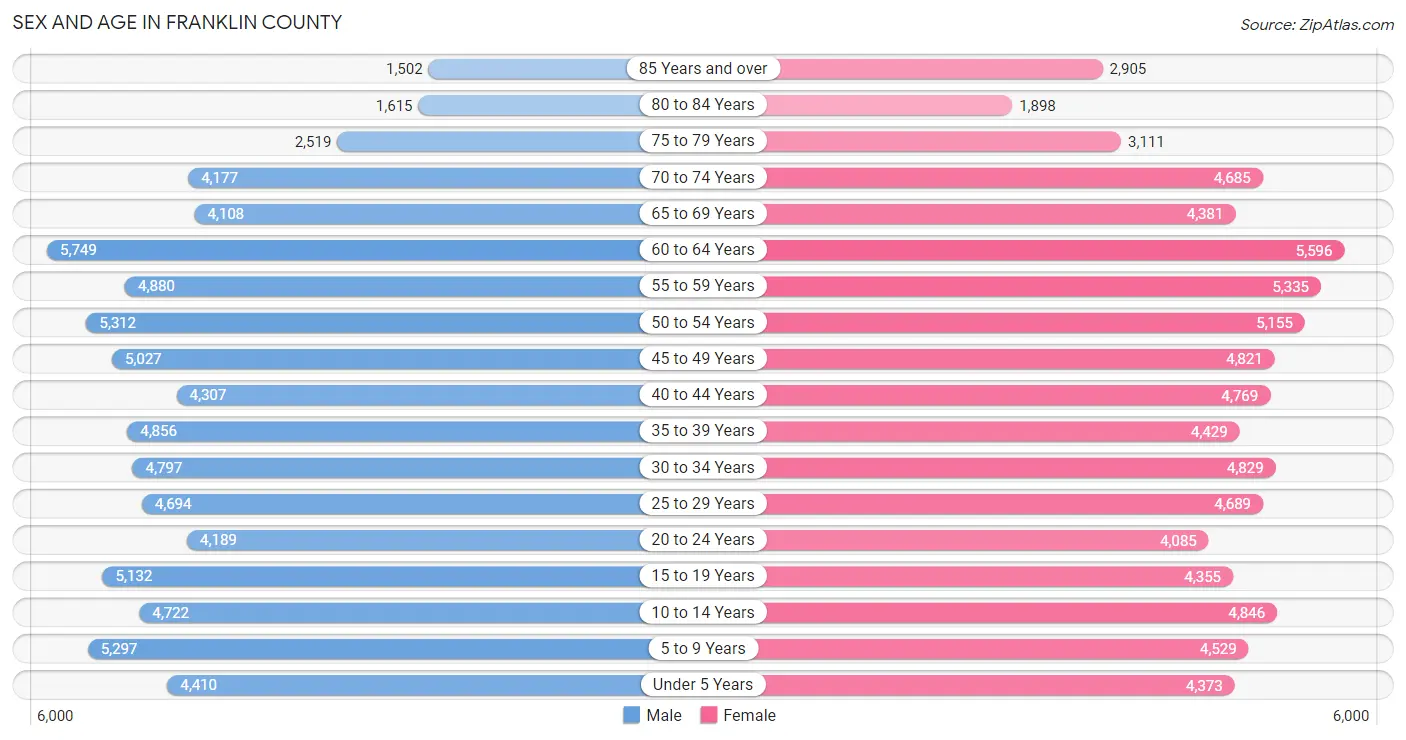
Sex and Age in Franklin County
Sex and Age in Franklin County
The most populous age groups in Franklin County are 60 to 64 Years (5,749 | 7.4%) for men and 60 to 64 Years (5,596 | 7.1%) for women.
| Age Bracket | Male | Female |
| Under 5 Years | 4,410 (5.7%) | 4,373 (5.6%) |
| 5 to 9 Years | 5,297 (6.9%) | 4,529 (5.8%) |
| 10 to 14 Years | 4,722 (6.1%) | 4,846 (6.1%) |
| 15 to 19 Years | 5,132 (6.6%) | 4,355 (5.5%) |
| 20 to 24 Years | 4,189 (5.4%) | 4,085 (5.2%) |
| 25 to 29 Years | 4,694 (6.1%) | 4,689 (5.9%) |
| 30 to 34 Years | 4,797 (6.2%) | 4,829 (6.1%) |
| 35 to 39 Years | 4,856 (6.3%) | 4,429 (5.6%) |
| 40 to 44 Years | 4,307 (5.6%) | 4,769 (6.0%) |
| 45 to 49 Years | 5,027 (6.5%) | 4,821 (6.1%) |
| 50 to 54 Years | 5,312 (6.9%) | 5,155 (6.5%) |
| 55 to 59 Years | 4,880 (6.3%) | 5,335 (6.8%) |
| 60 to 64 Years | 5,749 (7.4%) | 5,596 (7.1%) |
| 65 to 69 Years | 4,108 (5.3%) | 4,381 (5.6%) |
| 70 to 74 Years | 4,177 (5.4%) | 4,685 (5.9%) |
| 75 to 79 Years | 2,519 (3.3%) | 3,111 (4.0%) |
| 80 to 84 Years | 1,615 (2.1%) | 1,898 (2.4%) |
| 85 Years and over | 1,502 (1.9%) | 2,905 (3.7%) |
| Total | 77,293 (100.0%) | 78,791 (100.0%) |
Families and Households in Franklin County
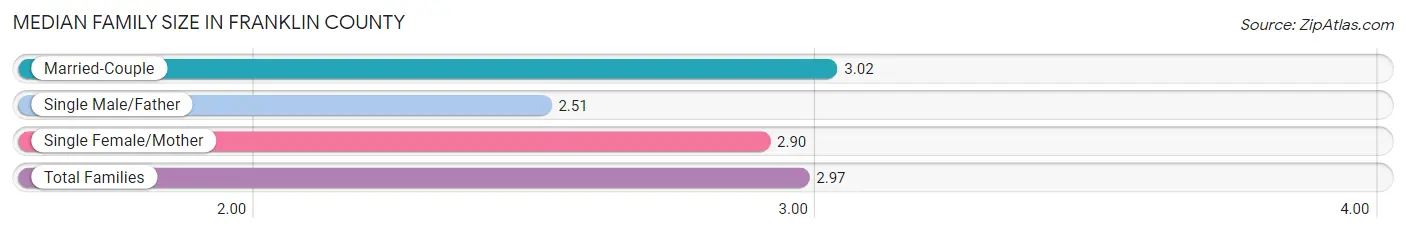
Median Family Size in Franklin County
The median family size in Franklin County is 2.97 persons per family, with married-couple families (34,257 | 79.9%) accounting for the largest median family size of 3.02 persons per family. On the other hand, single male/father families (2,715 | 6.3%) represent the smallest median family size with 2.51 persons per family.
| Family Type | # Families | Family Size |
| Married-Couple | 34,257 (79.9%) | 3.02 |
| Single Male/Father | 2,715 (6.3%) | 2.51 |
| Single Female/Mother | 5,883 (13.7%) | 2.90 |
| Total Families | 42,855 (100.0%) | 2.97 |
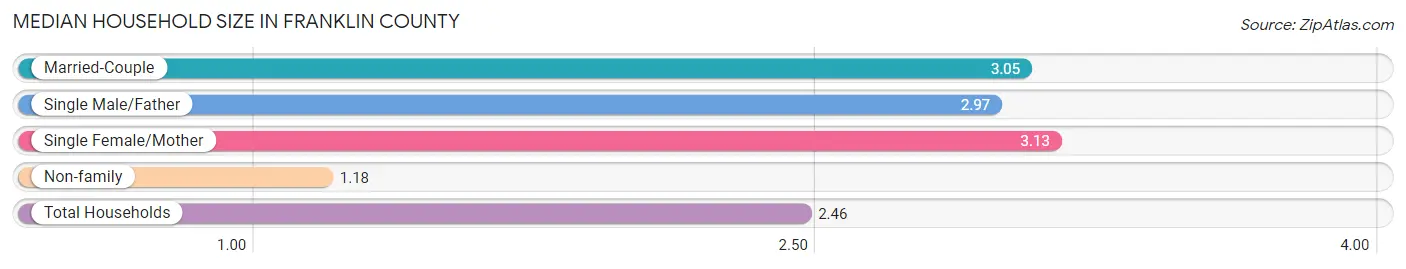
Median Household Size in Franklin County
The median household size in Franklin County is 2.46 persons per household, with single female/mother households (5,883 | 9.4%) accounting for the largest median household size of 3.13 persons per household. non-family households (19,721 | 31.5%) represent the smallest median household size with 1.18 persons per household.
| Household Type | # Households | Household Size |
| Married-Couple | 34,257 (54.7%) | 3.05 |
| Single Male/Father | 2,715 (4.3%) | 2.97 |
| Single Female/Mother | 5,883 (9.4%) | 3.13 |
| Non-family | 19,721 (31.5%) | 1.18 |
| Total Households | 62,576 (100.0%) | 2.46 |
Household Size by Marriage Status in Franklin County
Out of a total of 62,576 households in Franklin County, 42,855 (68.5%) are family households, while 19,721 (31.5%) are nonfamily households. The most numerous type of family households are 2-person households, comprising 20,918, and the most common type of nonfamily households are 1-person households, comprising 16,405.
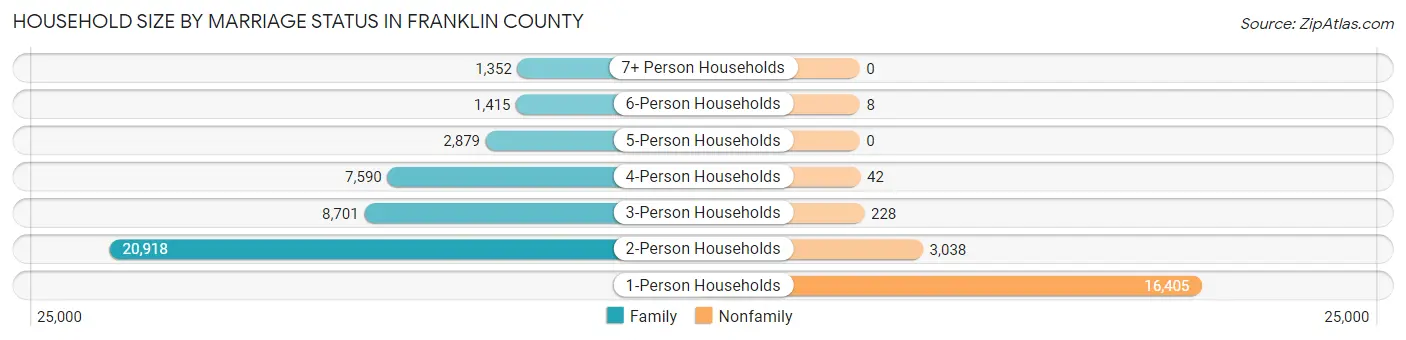
| Household Size | Family Households | Nonfamily Households |
| 1-Person Households | - | 16,405 (26.2%) |
| 2-Person Households | 20,918 (33.4%) | 3,038 (4.9%) |
| 3-Person Households | 8,701 (13.9%) | 228 (0.4%) |
| 4-Person Households | 7,590 (12.1%) | 42 (0.1%) |
| 5-Person Households | 2,879 (4.6%) | 0 (0.0%) |
| 6-Person Households | 1,415 (2.3%) | 8 (0.0%) |
| 7+ Person Households | 1,352 (2.2%) | 0 (0.0%) |
| Total | 42,855 (68.5%) | 19,721 (31.5%) |
Female Fertility in Franklin County
Fertility by Age in Franklin County
Average fertility rate in Franklin County is 48.0 births per 1,000 women. Women in the age bracket of 20 to 34 years have the highest fertility rate with 83.0 births per 1,000 women. Women in the age bracket of 20 to 34 years acount for 71.2% of all women with births.
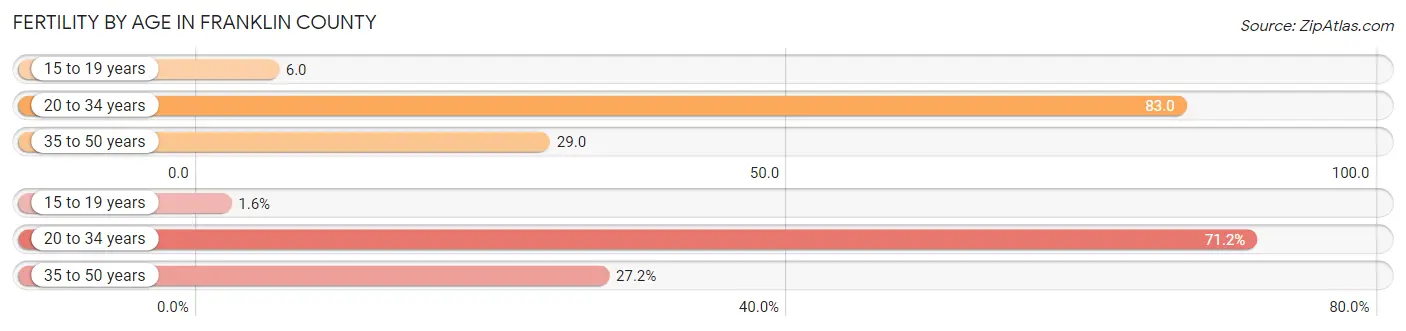
| Age Bracket | Women with Births | Births / 1,000 Women |
| 15 to 19 years | 25 (1.6%) | 6.0 |
| 20 to 34 years | 1,130 (71.2%) | 83.0 |
| 35 to 50 years | 432 (27.2%) | 29.0 |
| Total | 1,587 (100.0%) | 48.0 |
Fertility by Age by Marriage Status in Franklin County
64.8% of women with births (1,587) in Franklin County are married. The highest percentage of unmarried women with births falls into 15 to 19 years age bracket with 100.0% of them unmarried at the time of birth, while the lowest percentage of unmarried women with births belong to 35 to 50 years age bracket with 32.6% of them unmarried.
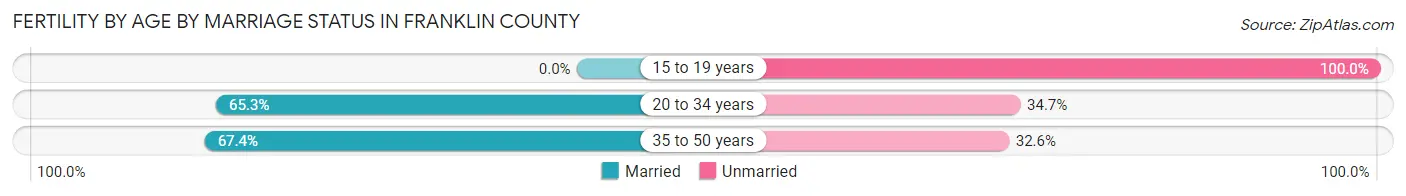
| Age Bracket | Married | Unmarried |
| 15 to 19 years | 0 (0.0%) | 25 (100.0%) |
| 20 to 34 years | 738 (65.3%) | 392 (34.7%) |
| 35 to 50 years | 291 (67.4%) | 141 (32.6%) |
| Total | 1,028 (64.8%) | 559 (35.2%) |
Fertility by Education in Franklin County
Average fertility rate in Franklin County is 48.0 births per 1,000 women. Women with the education attainment of bachelor's degree have the highest fertility rate of 55.0 births per 1,000 women, while women with the education attainment of graduate degree have the lowest fertility at 37.0 births per 1,000 women. Women with the education attainment of high school diploma represent 31.6% of all women with births.
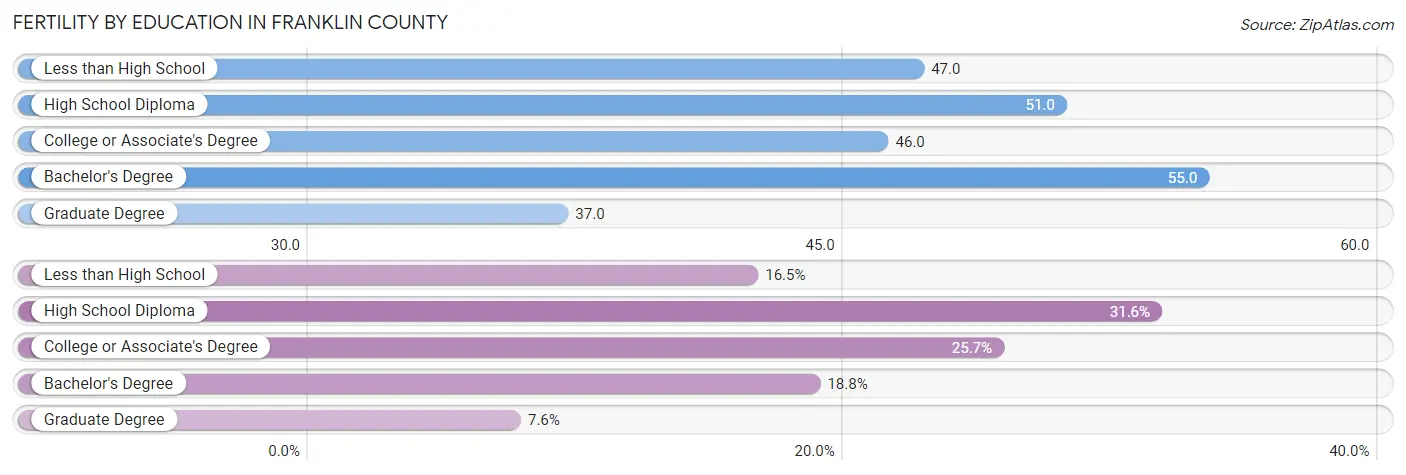
| Educational Attainment | Women with Births | Births / 1,000 Women |
| Less than High School | 261 (16.5%) | 47.0 |
| High School Diploma | 501 (31.6%) | 51.0 |
| College or Associate's Degree | 407 (25.7%) | 46.0 |
| Bachelor's Degree | 298 (18.8%) | 55.0 |
| Graduate Degree | 120 (7.6%) | 37.0 |
| Total | 1,587 (100.0%) | 48.0 |
Fertility by Education by Marriage Status in Franklin County
35.2% of women with births in Franklin County are unmarried. Women with the educational attainment of graduate degree are most likely to be married with 100.0% of them married at childbirth, while women with the educational attainment of less than high school are least likely to be married with 68.6% of them unmarried at childbirth.
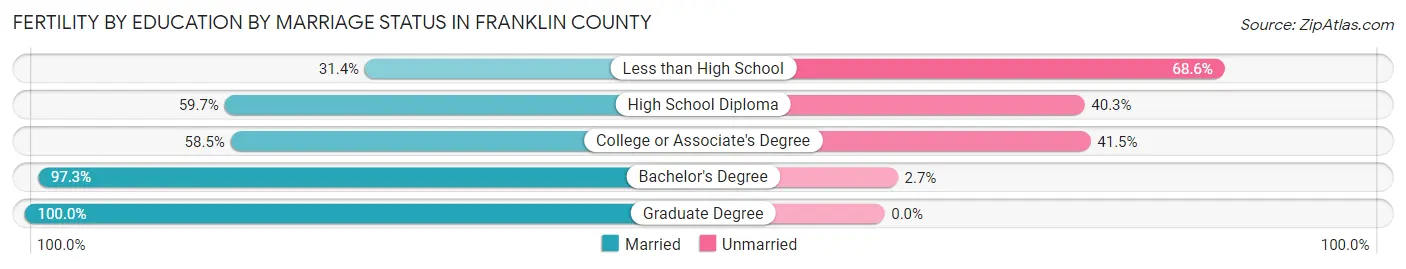
| Educational Attainment | Married | Unmarried |
| Less than High School | 82 (31.4%) | 179 (68.6%) |
| High School Diploma | 299 (59.7%) | 202 (40.3%) |
| College or Associate's Degree | 238 (58.5%) | 169 (41.5%) |
| Bachelor's Degree | 290 (97.3%) | 8 (2.7%) |
| Graduate Degree | 120 (100.0%) | 0 (0.0%) |
| Total | 1,028 (64.8%) | 559 (35.2%) |
Employment Characteristics in Franklin County
Employment by Class of Employer in Franklin County
Among the 74,492 employed individuals in Franklin County, private company employees (49,447 | 66.4%), not-for-profit organizations (7,662 | 10.3%), and self-employed (not incorporated) (5,152 | 6.9%) make up the most common classes of employment.
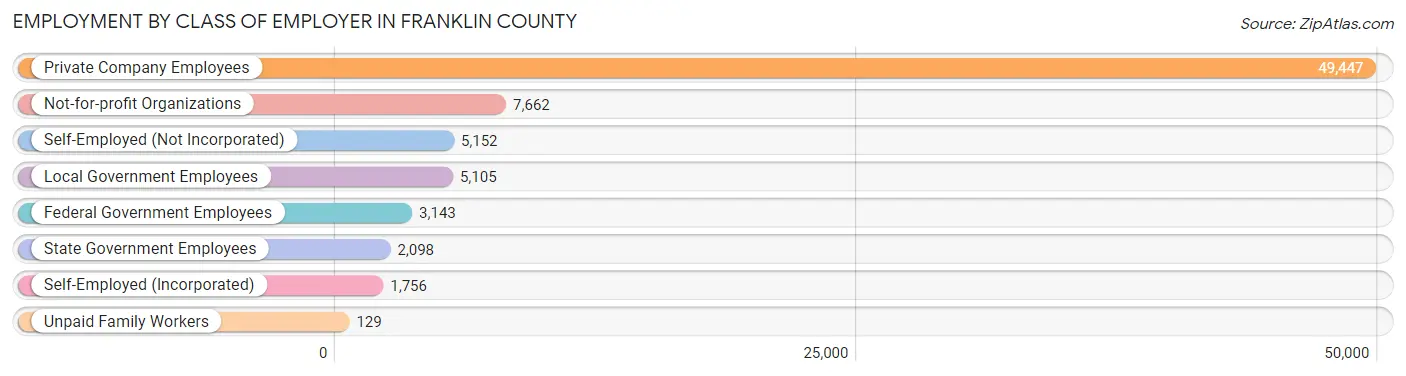
| Employer Class | # Employees | % Employees |
| Private Company Employees | 49,447 | 66.4% |
| Self-Employed (Incorporated) | 1,756 | 2.4% |
| Self-Employed (Not Incorporated) | 5,152 | 6.9% |
| Not-for-profit Organizations | 7,662 | 10.3% |
| Local Government Employees | 5,105 | 6.9% |
| State Government Employees | 2,098 | 2.8% |
| Federal Government Employees | 3,143 | 4.2% |
| Unpaid Family Workers | 129 | 0.2% |
| Total | 74,492 | 100.0% |
Employment Status by Age in Franklin County
According to the labor force statistics for Franklin County, out of the total population over 16 years of age (125,692), 62.5% or 78,558 individuals are in the labor force, with 3.4% or 2,671 of them unemployed. The age group with the highest labor force participation rate is 35 to 44 years, with 86.9% or 15,956 individuals in the labor force. Within the labor force, the 16 to 19 years age range has the highest percentage of unemployed individuals, with 7.2% or 274 of them being unemployed.
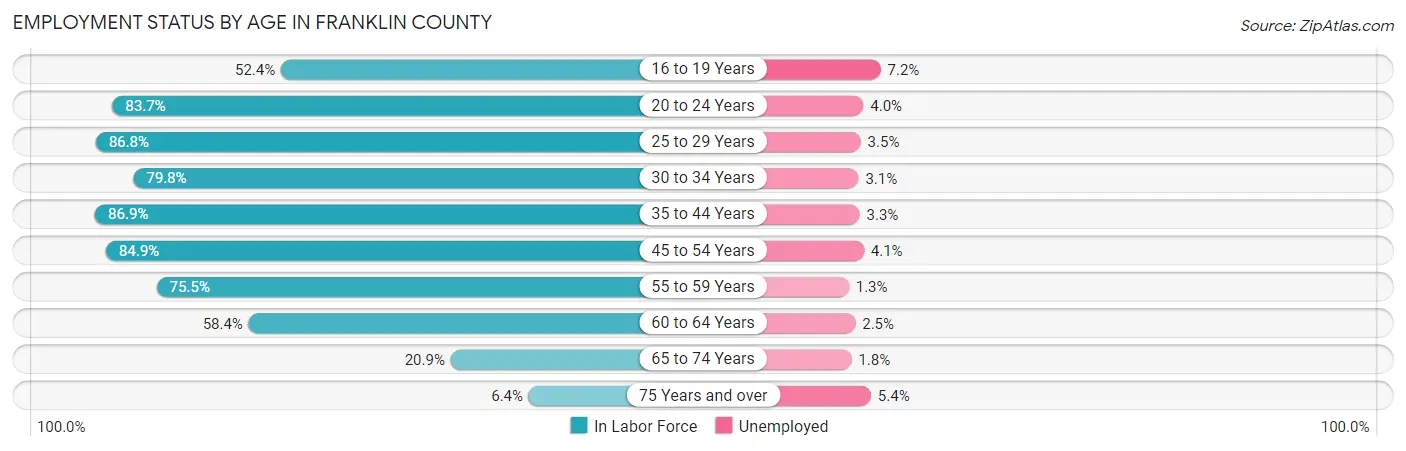
| Age Bracket | In Labor Force | Unemployed |
| 16 to 19 Years | 3,811 (52.4%) | 274 (7.2%) |
| 20 to 24 Years | 6,925 (83.7%) | 277 (4.0%) |
| 25 to 29 Years | 8,144 (86.8%) | 285 (3.5%) |
| 30 to 34 Years | 7,682 (79.8%) | 238 (3.1%) |
| 35 to 44 Years | 15,956 (86.9%) | 527 (3.3%) |
| 45 to 54 Years | 17,247 (84.9%) | 707 (4.1%) |
| 55 to 59 Years | 7,712 (75.5%) | 100 (1.3%) |
| 60 to 64 Years | 6,625 (58.4%) | 166 (2.5%) |
| 65 to 74 Years | 3,626 (20.9%) | 65 (1.8%) |
| 75 Years and over | 867 (6.4%) | 47 (5.4%) |
| Total | 78,558 (62.5%) | 2,671 (3.4%) |
Employment Status by Educational Attainment in Franklin County
According to labor force statistics for Franklin County, 80.0% of individuals (63,396) out of the total population between 25 and 64 years of age (79,245) are in the labor force, with 3.2% or 2,029 of them being unemployed. The group with the highest labor force participation rate are those with the educational attainment of bachelor's degree or higher, with 87.6% or 16,789 individuals in the labor force. Within the labor force, individuals with less than high school education have the highest percentage of unemployment, with 4.0% or 185 of them being unemployed.
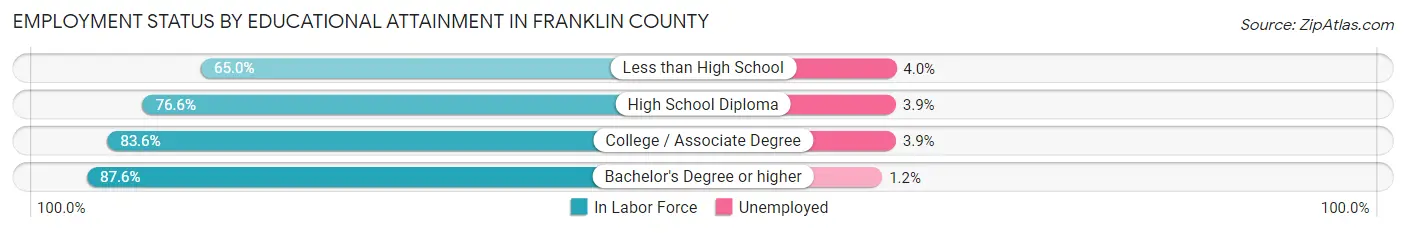
| Educational Attainment | In Labor Force | Unemployed |
| Less than High School | 4,634 (65.0%) | 285 (4.0%) |
| High School Diploma | 25,571 (76.6%) | 1,302 (3.9%) |
| College / Associate Degree | 16,359 (83.6%) | 763 (3.9%) |
| Bachelor's Degree or higher | 16,789 (87.6%) | 230 (1.2%) |
| Total | 63,396 (80.0%) | 2,536 (3.2%) |
Employment Occupations by Sex in Franklin County
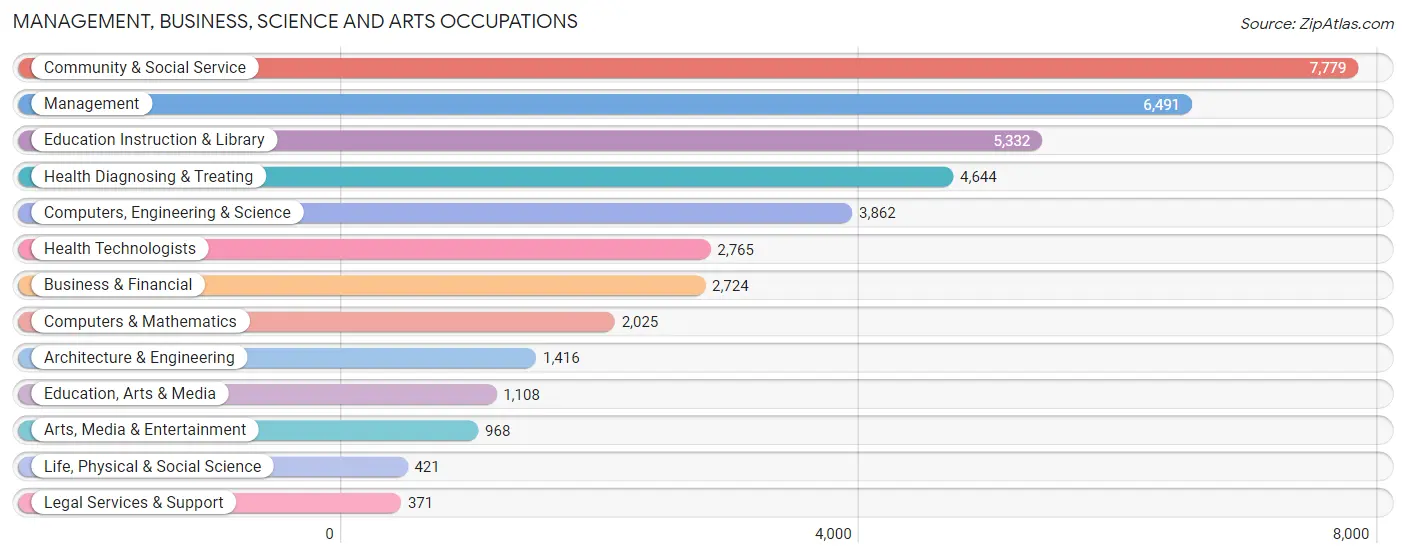
Management, Business, Science and Arts Occupations
The most common Management, Business, Science and Arts occupations in Franklin County are Community & Social Service (7,779 | 10.3%), Management (6,491 | 8.6%), Education Instruction & Library (5,332 | 7.0%), Health Diagnosing & Treating (4,644 | 6.1%), and Computers, Engineering & Science (3,862 | 5.1%).
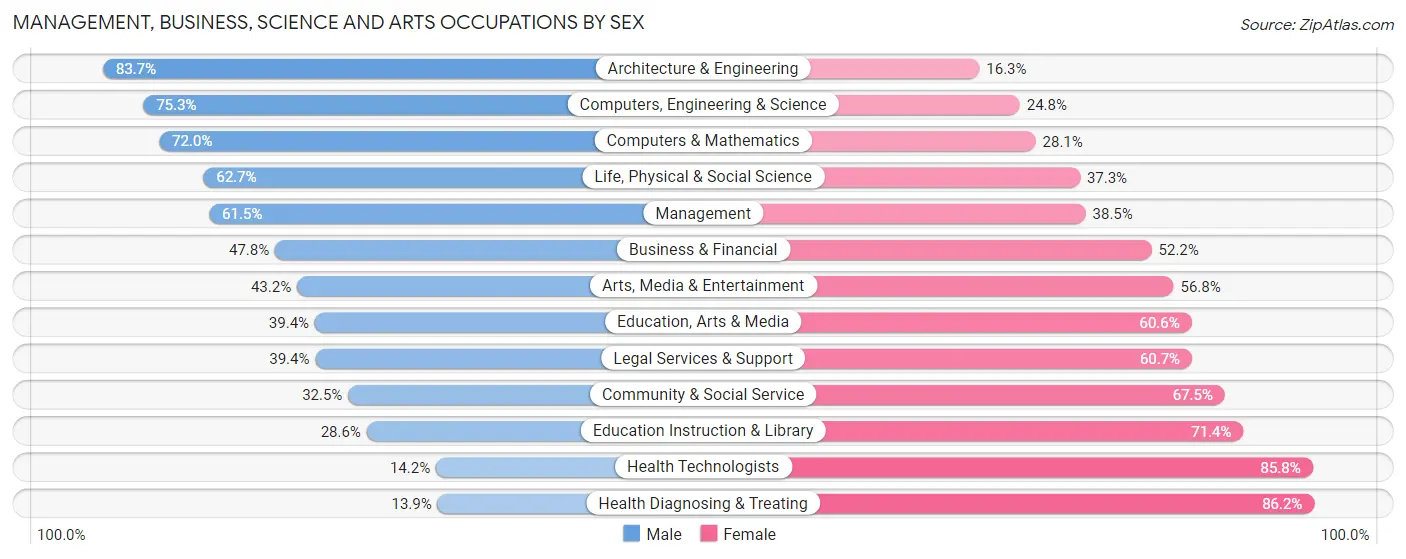
Management, Business, Science and Arts Occupations by Sex
Within the Management, Business, Science and Arts occupations in Franklin County, the most male-oriented occupations are Architecture & Engineering (83.7%), Computers, Engineering & Science (75.2%), and Computers & Mathematics (72.0%), while the most female-oriented occupations are Health Diagnosing & Treating (86.2%), Health Technologists (85.8%), and Education Instruction & Library (71.4%).
| Occupation | Male | Female |
| Management | 3,993 (61.5%) | 2,498 (38.5%) |
| Business & Financial | 1,301 (47.8%) | 1,423 (52.2%) |
| Computers, Engineering & Science | 2,906 (75.2%) | 956 (24.7%) |
| Computers & Mathematics | 1,457 (72.0%) | 568 (28.1%) |
| Architecture & Engineering | 1,185 (83.7%) | 231 (16.3%) |
| Life, Physical & Social Science | 264 (62.7%) | 157 (37.3%) |
| Community & Social Service | 2,528 (32.5%) | 5,251 (67.5%) |
| Education, Arts & Media | 437 (39.4%) | 671 (60.6%) |
| Legal Services & Support | 146 (39.4%) | 225 (60.7%) |
| Education Instruction & Library | 1,527 (28.6%) | 3,805 (71.4%) |
| Arts, Media & Entertainment | 418 (43.2%) | 550 (56.8%) |
| Health Diagnosing & Treating | 643 (13.9%) | 4,001 (86.2%) |
| Health Technologists | 392 (14.2%) | 2,373 (85.8%) |
| Total (Category) | 11,371 (44.6%) | 14,129 (55.4%) |
| Total (Overall) | 40,609 (53.5%) | 35,241 (46.5%) |
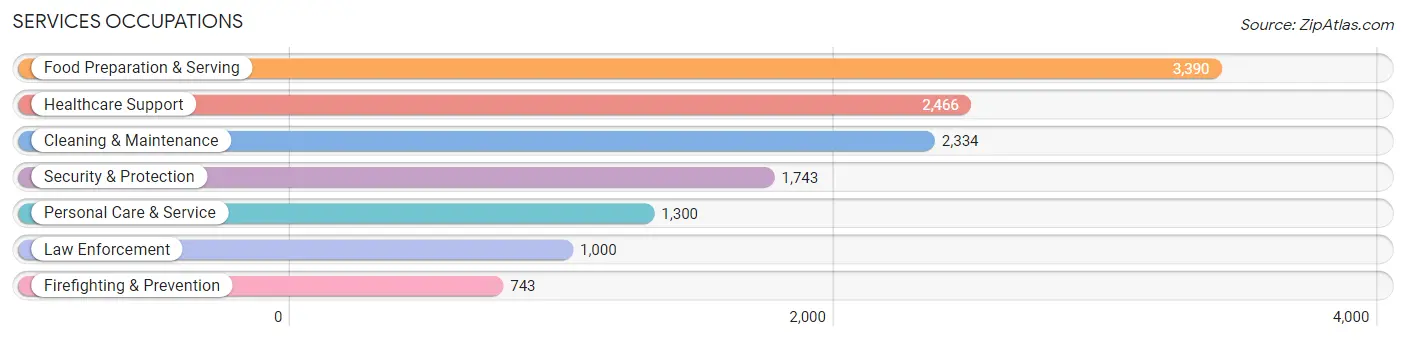
Services Occupations
The most common Services occupations in Franklin County are Food Preparation & Serving (3,390 | 4.5%), Healthcare Support (2,466 | 3.3%), Cleaning & Maintenance (2,334 | 3.1%), Security & Protection (1,743 | 2.3%), and Personal Care & Service (1,300 | 1.7%).
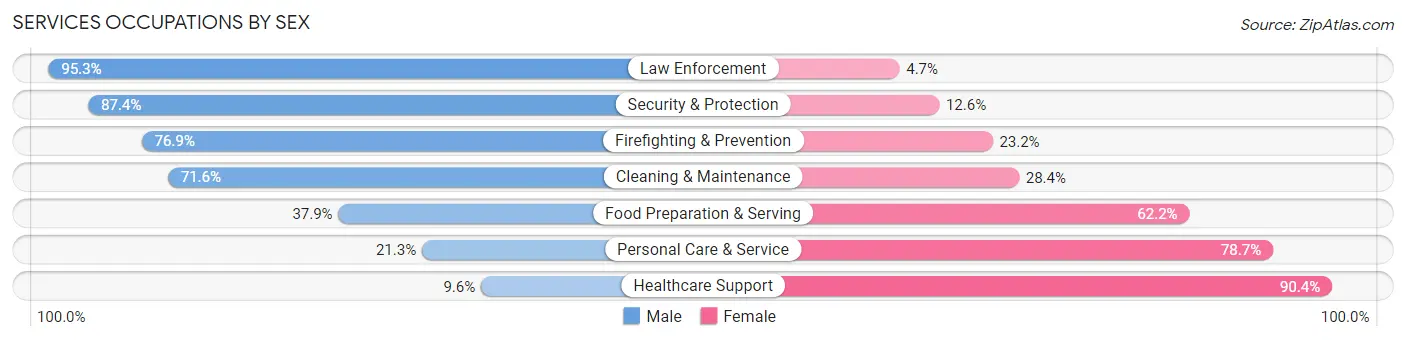
Services Occupations by Sex
Within the Services occupations in Franklin County, the most male-oriented occupations are Law Enforcement (95.3%), Security & Protection (87.4%), and Firefighting & Prevention (76.8%), while the most female-oriented occupations are Healthcare Support (90.4%), Personal Care & Service (78.7%), and Food Preparation & Serving (62.2%).
| Occupation | Male | Female |
| Healthcare Support | 237 (9.6%) | 2,229 (90.4%) |
| Security & Protection | 1,524 (87.4%) | 219 (12.6%) |
| Firefighting & Prevention | 571 (76.8%) | 172 (23.2%) |
| Law Enforcement | 953 (95.3%) | 47 (4.7%) |
| Food Preparation & Serving | 1,283 (37.9%) | 2,107 (62.2%) |
| Cleaning & Maintenance | 1,672 (71.6%) | 662 (28.4%) |
| Personal Care & Service | 277 (21.3%) | 1,023 (78.7%) |
| Total (Category) | 4,993 (44.5%) | 6,240 (55.5%) |
| Total (Overall) | 40,609 (53.5%) | 35,241 (46.5%) |
Sales and Office Occupations
The most common Sales and Office occupations in Franklin County are Office & Administration (8,583 | 11.3%), and Sales & Related (6,624 | 8.7%).

Sales and Office Occupations by Sex

| Occupation | Male | Female |
| Sales & Related | 3,651 (55.1%) | 2,973 (44.9%) |
| Office & Administration | 1,664 (19.4%) | 6,919 (80.6%) |
| Total (Category) | 5,315 (34.9%) | 9,892 (65.0%) |
| Total (Overall) | 40,609 (53.5%) | 35,241 (46.5%) |
Natural Resources, Construction and Maintenance Occupations
The most common Natural Resources, Construction and Maintenance occupations in Franklin County are Installation, Maintenance & Repair (3,486 | 4.6%), Construction & Extraction (3,291 | 4.3%), and Farming, Fishing & Forestry (971 | 1.3%).
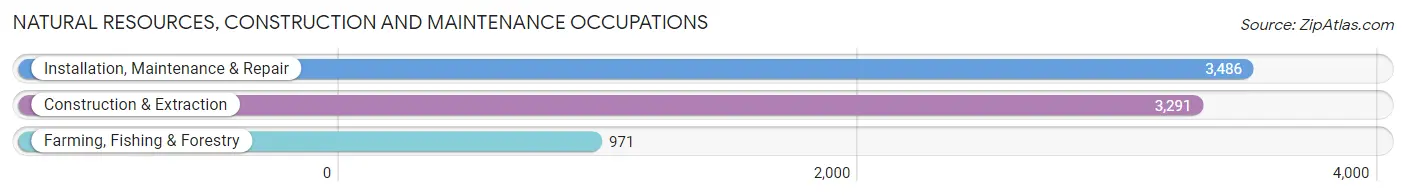
Natural Resources, Construction and Maintenance Occupations by Sex
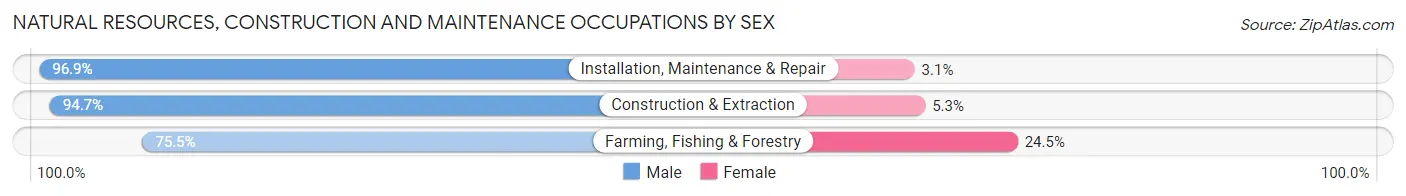
| Occupation | Male | Female |
| Farming, Fishing & Forestry | 733 (75.5%) | 238 (24.5%) |
| Construction & Extraction | 3,118 (94.7%) | 173 (5.3%) |
| Installation, Maintenance & Repair | 3,379 (96.9%) | 107 (3.1%) |
| Total (Category) | 7,230 (93.3%) | 518 (6.7%) |
| Total (Overall) | 40,609 (53.5%) | 35,241 (46.5%) |
Production, Transportation and Moving Occupations
The most common Production, Transportation and Moving occupations in Franklin County are Production (7,118 | 9.4%), Material Moving (5,696 | 7.5%), and Transportation (3,348 | 4.4%).
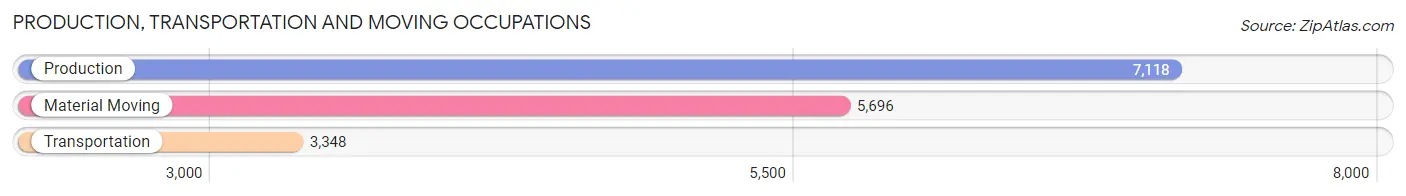
Production, Transportation and Moving Occupations by Sex
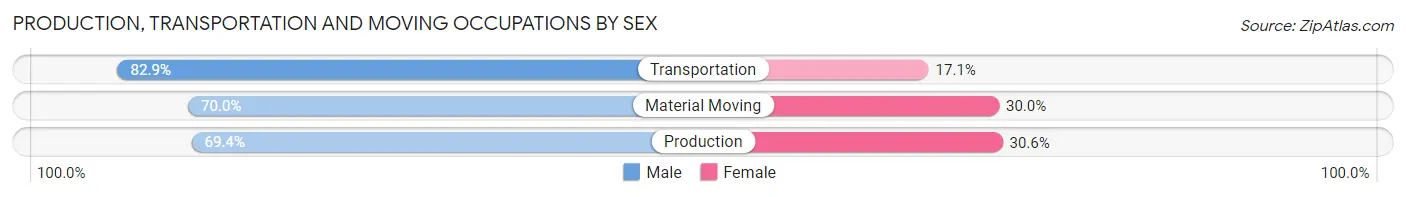
| Occupation | Male | Female |
| Production | 4,937 (69.4%) | 2,181 (30.6%) |
| Transportation | 2,776 (82.9%) | 572 (17.1%) |
| Material Moving | 3,987 (70.0%) | 1,709 (30.0%) |
| Total (Category) | 11,700 (72.4%) | 4,462 (27.6%) |
| Total (Overall) | 40,609 (53.5%) | 35,241 (46.5%) |
Employment Industries by Sex in Franklin County
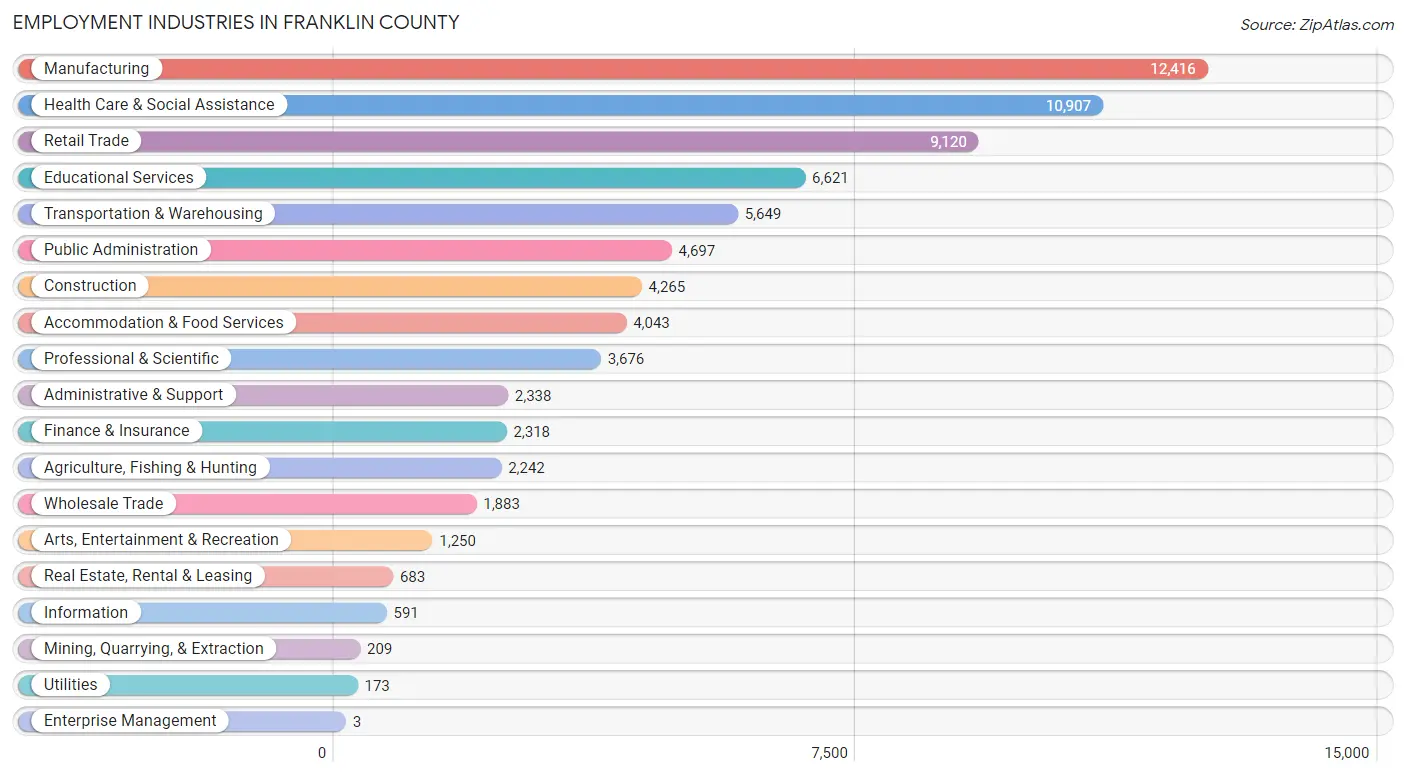
Employment Industries in Franklin County
The major employment industries in Franklin County include Manufacturing (12,416 | 16.4%), Health Care & Social Assistance (10,907 | 14.4%), Retail Trade (9,120 | 12.0%), Educational Services (6,621 | 8.7%), and Transportation & Warehousing (5,649 | 7.4%).
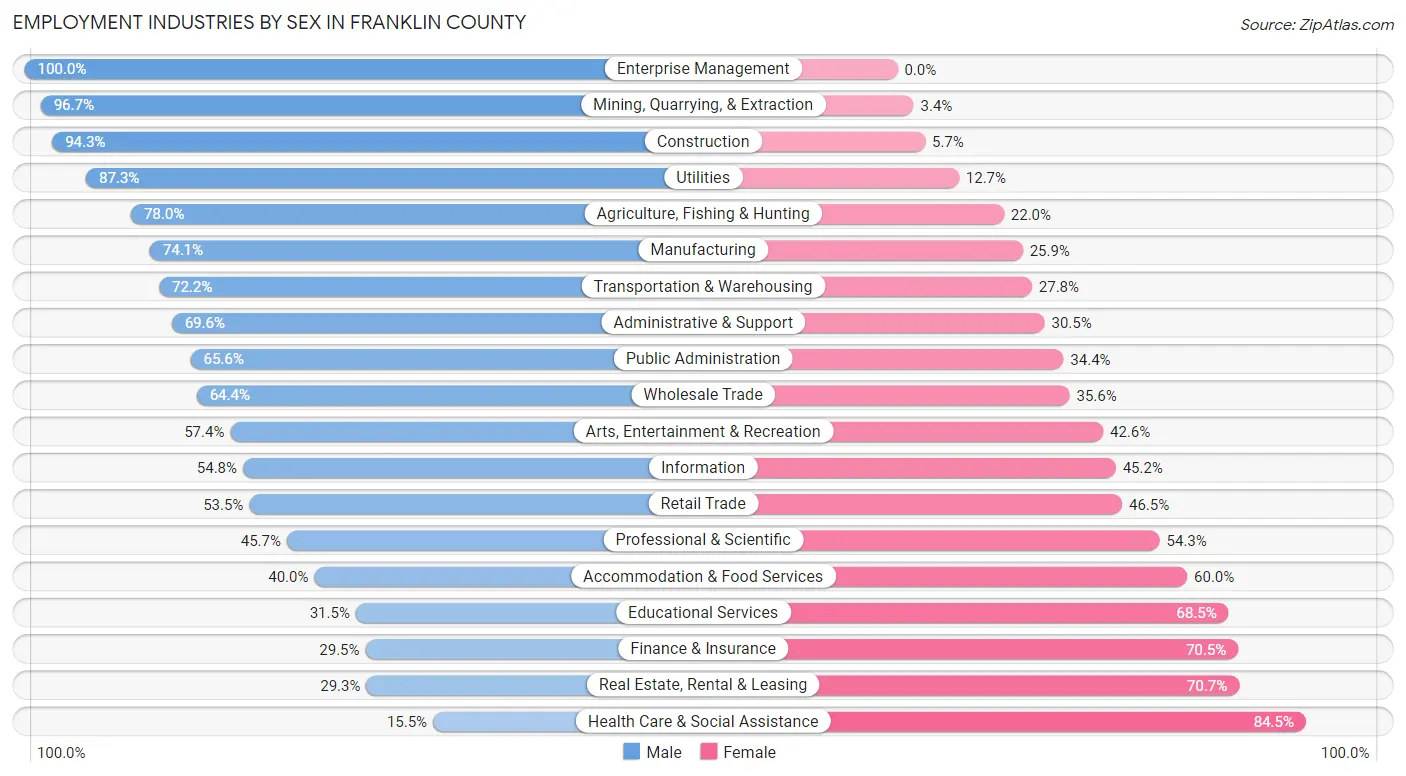
Employment Industries by Sex in Franklin County
The Franklin County industries that see more men than women are Enterprise Management (100.0%), Mining, Quarrying, & Extraction (96.7%), and Construction (94.3%), whereas the industries that tend to have a higher number of women are Health Care & Social Assistance (84.5%), Real Estate, Rental & Leasing (70.7%), and Finance & Insurance (70.5%).
| Industry | Male | Female |
| Agriculture, Fishing & Hunting | 1,748 (78.0%) | 494 (22.0%) |
| Mining, Quarrying, & Extraction | 202 (96.7%) | 7 (3.4%) |
| Construction | 4,021 (94.3%) | 244 (5.7%) |
| Manufacturing | 9,197 (74.1%) | 3,219 (25.9%) |
| Wholesale Trade | 1,212 (64.4%) | 671 (35.6%) |
| Retail Trade | 4,880 (53.5%) | 4,240 (46.5%) |
| Transportation & Warehousing | 4,077 (72.2%) | 1,572 (27.8%) |
| Utilities | 151 (87.3%) | 22 (12.7%) |
| Information | 324 (54.8%) | 267 (45.2%) |
| Finance & Insurance | 683 (29.5%) | 1,635 (70.5%) |
| Real Estate, Rental & Leasing | 200 (29.3%) | 483 (70.7%) |
| Professional & Scientific | 1,681 (45.7%) | 1,995 (54.3%) |
| Enterprise Management | 3 (100.0%) | 0 (0.0%) |
| Administrative & Support | 1,626 (69.6%) | 712 (30.4%) |
| Educational Services | 2,083 (31.5%) | 4,538 (68.5%) |
| Health Care & Social Assistance | 1,688 (15.5%) | 9,219 (84.5%) |
| Arts, Entertainment & Recreation | 718 (57.4%) | 532 (42.6%) |
| Accommodation & Food Services | 1,619 (40.0%) | 2,424 (60.0%) |
| Public Administration | 3,083 (65.6%) | 1,614 (34.4%) |
| Total | 40,609 (53.5%) | 35,241 (46.5%) |
Education in Franklin County
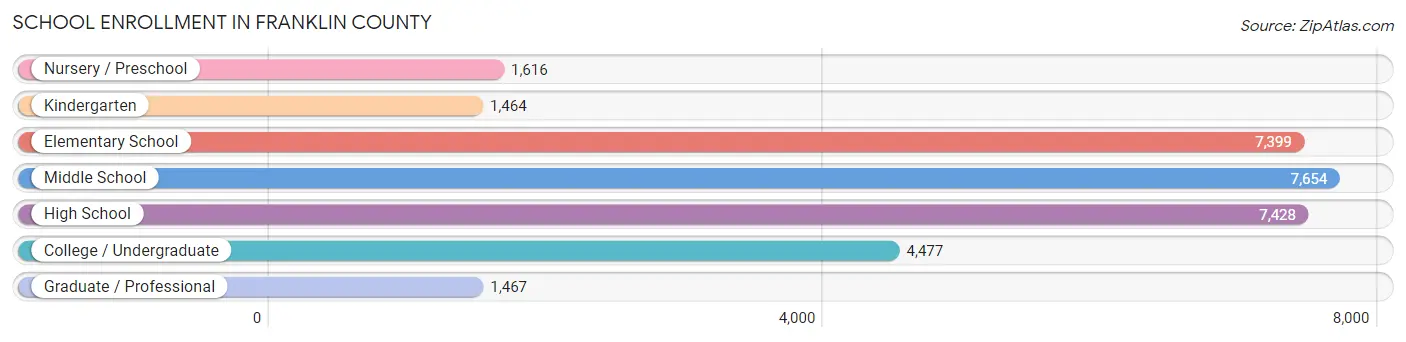
School Enrollment in Franklin County
The most common levels of schooling among the 31,505 students in Franklin County are middle school (7,654 | 24.3%), high school (7,428 | 23.6%), and elementary school (7,399 | 23.5%).
| School Level | # Students | % Students |
| Nursery / Preschool | 1,616 | 5.1% |
| Kindergarten | 1,464 | 4.6% |
| Elementary School | 7,399 | 23.5% |
| Middle School | 7,654 | 24.3% |
| High School | 7,428 | 23.6% |
| College / Undergraduate | 4,477 | 14.2% |
| Graduate / Professional | 1,467 | 4.7% |
| Total | 31,505 | 100.0% |
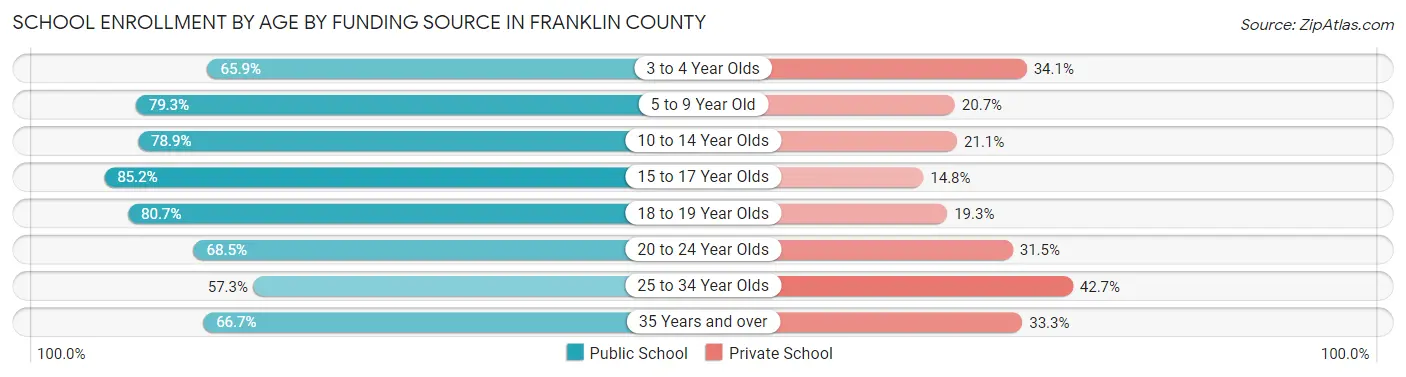
School Enrollment by Age by Funding Source in Franklin County
Out of a total of 31,505 students who are enrolled in schools in Franklin County, 7,120 (22.6%) attend a private institution, while the remaining 24,385 (77.4%) are enrolled in public schools. The age group of 25 to 34 year olds has the highest likelihood of being enrolled in private schools, with 771 (42.7% in the age bracket) enrolled. Conversely, the age group of 15 to 17 year olds has the lowest likelihood of being enrolled in a private school, with 4,707 (85.2% in the age bracket) attending a public institution.
| Age Bracket | Public School | Private School |
| 3 to 4 Year Olds | 717 (65.9%) | 371 (34.1%) |
| 5 to 9 Year Old | 6,850 (79.3%) | 1,790 (20.7%) |
| 10 to 14 Year Olds | 7,213 (78.9%) | 1,932 (21.1%) |
| 15 to 17 Year Olds | 4,707 (85.2%) | 820 (14.8%) |
| 18 to 19 Year Olds | 1,623 (80.7%) | 388 (19.3%) |
| 20 to 24 Year Olds | 1,231 (68.5%) | 566 (31.5%) |
| 25 to 34 Year Olds | 1,035 (57.3%) | 771 (42.7%) |
| 35 Years and over | 995 (66.7%) | 496 (33.3%) |
| Total | 24,385 (77.4%) | 7,120 (22.6%) |
Educational Attainment by Field of Study in Franklin County
Education (5,696 | 21.0%), business (4,253 | 15.7%), science & technology (2,705 | 10.0%), arts & humanities (2,686 | 9.9%), and bio, nature & agricultural (2,036 | 7.5%) are the most common fields of study among 27,107 individuals in Franklin County who have obtained a bachelor's degree or higher.
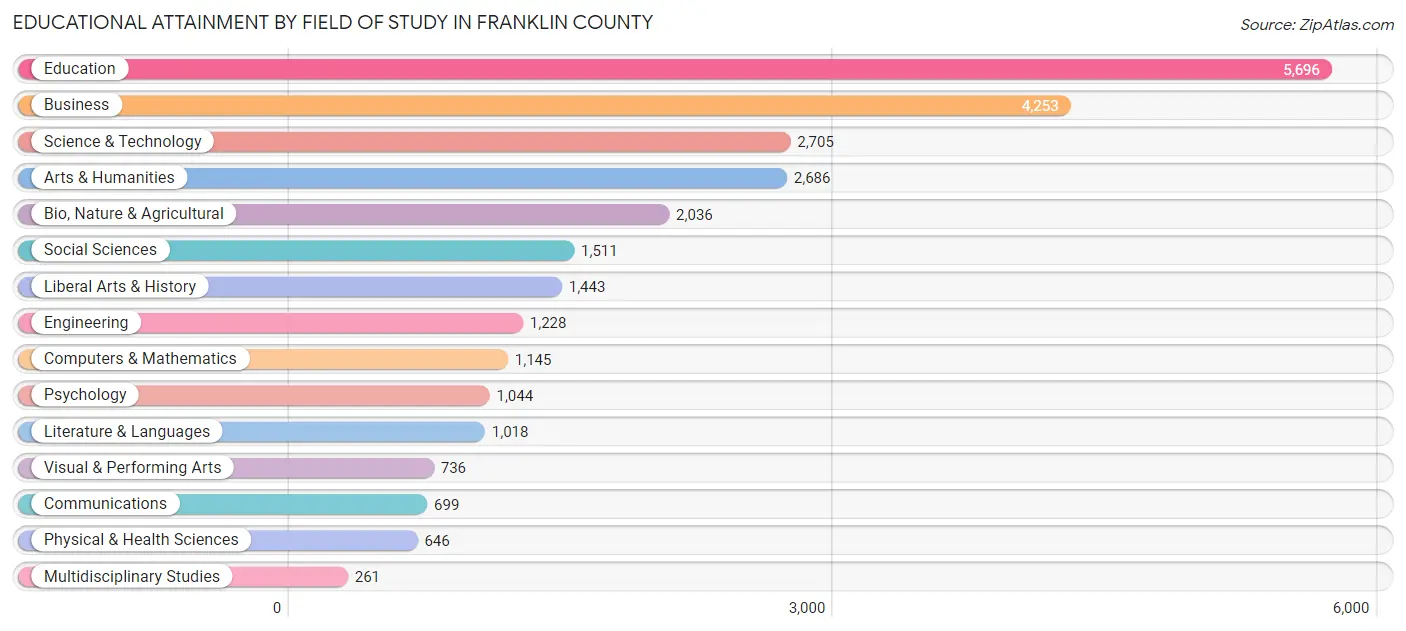
| Field of Study | # Graduates | % Graduates |
| Computers & Mathematics | 1,145 | 4.2% |
| Bio, Nature & Agricultural | 2,036 | 7.5% |
| Physical & Health Sciences | 646 | 2.4% |
| Psychology | 1,044 | 3.8% |
| Social Sciences | 1,511 | 5.6% |
| Engineering | 1,228 | 4.5% |
| Multidisciplinary Studies | 261 | 1.0% |
| Science & Technology | 2,705 | 10.0% |
| Business | 4,253 | 15.7% |
| Education | 5,696 | 21.0% |
| Literature & Languages | 1,018 | 3.8% |
| Liberal Arts & History | 1,443 | 5.3% |
| Visual & Performing Arts | 736 | 2.7% |
| Communications | 699 | 2.6% |
| Arts & Humanities | 2,686 | 9.9% |
| Total | 27,107 | 100.0% |
Transportation & Commute in Franklin County
Vehicle Availability by Sex in Franklin County
The most prevalent vehicle ownership categories in Franklin County are males with 2 vehicles (14,844, accounting for 37.3%) and females with 2 vehicles (12,602, making up 43.1%).
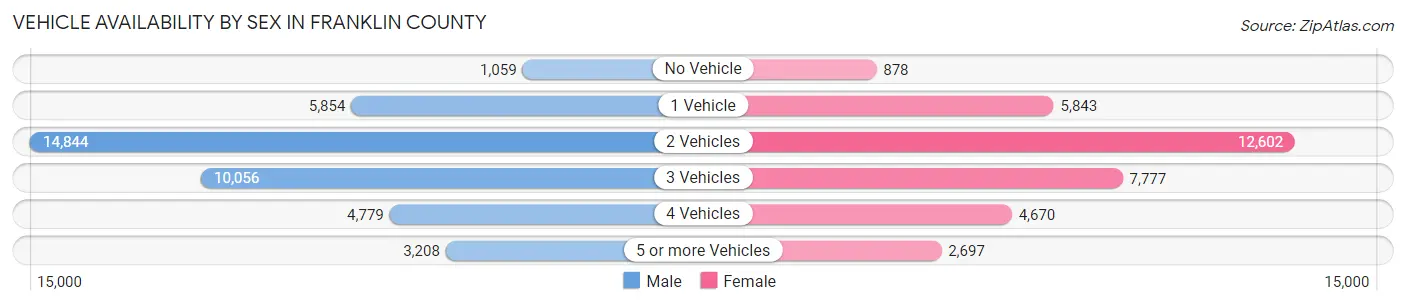
| Vehicles Available | Male | Female |
| No Vehicle | 1,059 (2.7%) | 878 (2.5%) |
| 1 Vehicle | 5,854 (14.7%) | 5,843 (17.0%) |
| 2 Vehicles | 14,844 (37.3%) | 12,602 (36.6%) |
| 3 Vehicles | 10,056 (25.3%) | 7,777 (22.6%) |
| 4 Vehicles | 4,779 (12.0%) | 4,670 (13.6%) |
| 5 or more Vehicles | 3,208 (8.1%) | 2,697 (7.8%) |
| Total | 39,800 (100.0%) | 34,467 (100.0%) |
Commute Time in Franklin County
The most frequently occuring commute durations in Franklin County are 15 to 19 minutes (11,095 commuters, 16.2%), 10 to 14 minutes (10,036 commuters, 14.6%), and 20 to 24 minutes (9,960 commuters, 14.5%).
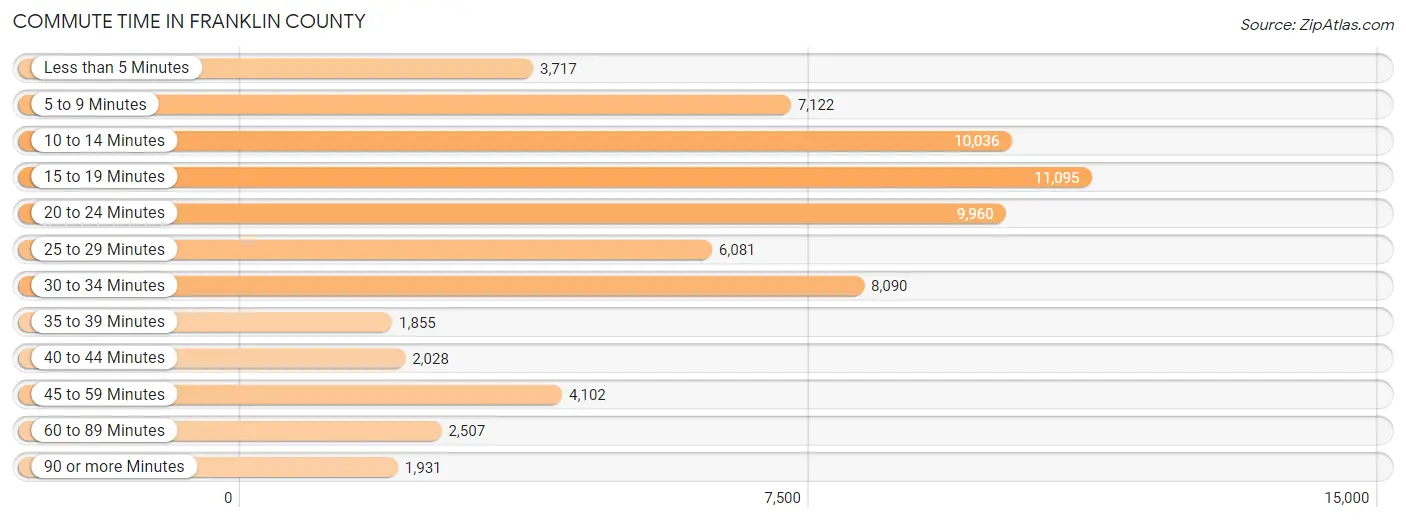
| Commute Time | # Commuters | % Commuters |
| Less than 5 Minutes | 3,717 | 5.4% |
| 5 to 9 Minutes | 7,122 | 10.4% |
| 10 to 14 Minutes | 10,036 | 14.6% |
| 15 to 19 Minutes | 11,095 | 16.2% |
| 20 to 24 Minutes | 9,960 | 14.5% |
| 25 to 29 Minutes | 6,081 | 8.9% |
| 30 to 34 Minutes | 8,090 | 11.8% |
| 35 to 39 Minutes | 1,855 | 2.7% |
| 40 to 44 Minutes | 2,028 | 3.0% |
| 45 to 59 Minutes | 4,102 | 6.0% |
| 60 to 89 Minutes | 2,507 | 3.7% |
| 90 or more Minutes | 1,931 | 2.8% |
Commute Time by Sex in Franklin County
The most common commute times in Franklin County are 15 to 19 minutes (5,716 commuters, 15.4%) for males and 15 to 19 minutes (5,379 commuters, 17.1%) for females.
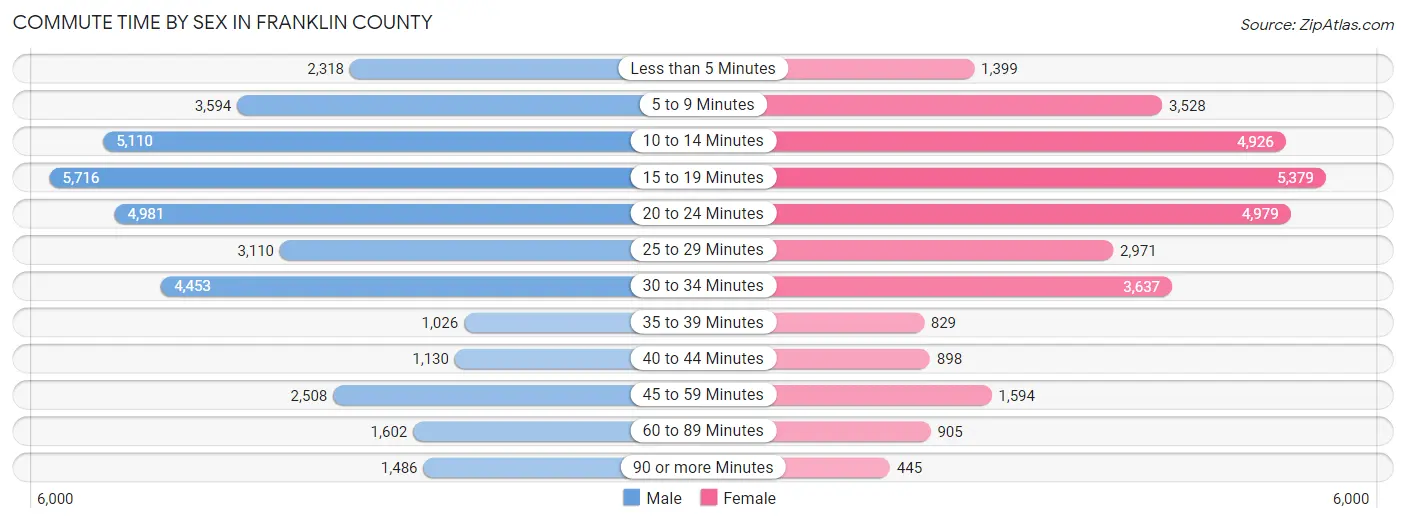
| Commute Time | Male | Female |
| Less than 5 Minutes | 2,318 (6.3%) | 1,399 (4.4%) |
| 5 to 9 Minutes | 3,594 (9.7%) | 3,528 (11.2%) |
| 10 to 14 Minutes | 5,110 (13.8%) | 4,926 (15.6%) |
| 15 to 19 Minutes | 5,716 (15.4%) | 5,379 (17.1%) |
| 20 to 24 Minutes | 4,981 (13.5%) | 4,979 (15.8%) |
| 25 to 29 Minutes | 3,110 (8.4%) | 2,971 (9.4%) |
| 30 to 34 Minutes | 4,453 (12.0%) | 3,637 (11.6%) |
| 35 to 39 Minutes | 1,026 (2.8%) | 829 (2.6%) |
| 40 to 44 Minutes | 1,130 (3.0%) | 898 (2.9%) |
| 45 to 59 Minutes | 2,508 (6.8%) | 1,594 (5.1%) |
| 60 to 89 Minutes | 1,602 (4.3%) | 905 (2.9%) |
| 90 or more Minutes | 1,486 (4.0%) | 445 (1.4%) |
Time of Departure to Work by Sex in Franklin County
The most frequent times of departure to work in Franklin County are 12:00 AM to 4:59 AM (4,542, 12.3%) for males and 7:00 AM to 7:29 AM (4,686, 14.9%) for females.
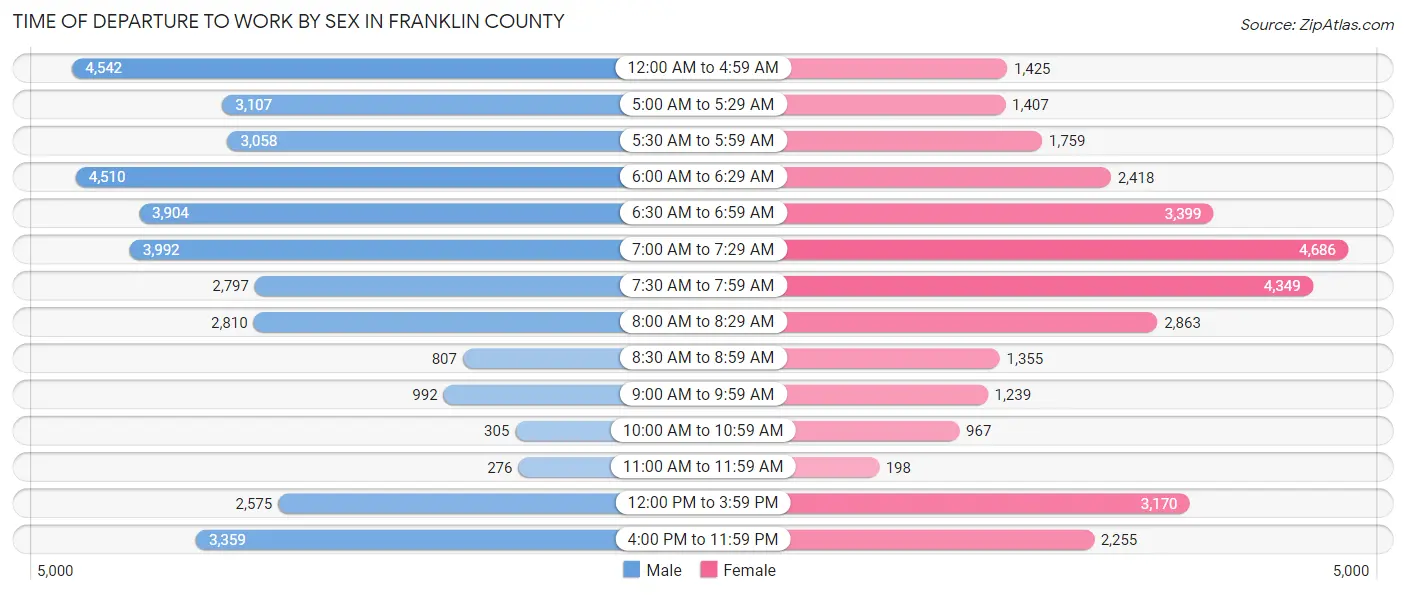
| Time of Departure | Male | Female |
| 12:00 AM to 4:59 AM | 4,542 (12.3%) | 1,425 (4.5%) |
| 5:00 AM to 5:29 AM | 3,107 (8.4%) | 1,407 (4.5%) |
| 5:30 AM to 5:59 AM | 3,058 (8.3%) | 1,759 (5.6%) |
| 6:00 AM to 6:29 AM | 4,510 (12.2%) | 2,418 (7.7%) |
| 6:30 AM to 6:59 AM | 3,904 (10.5%) | 3,399 (10.8%) |
| 7:00 AM to 7:29 AM | 3,992 (10.8%) | 4,686 (14.9%) |
| 7:30 AM to 7:59 AM | 2,797 (7.5%) | 4,349 (13.8%) |
| 8:00 AM to 8:29 AM | 2,810 (7.6%) | 2,863 (9.1%) |
| 8:30 AM to 8:59 AM | 807 (2.2%) | 1,355 (4.3%) |
| 9:00 AM to 9:59 AM | 992 (2.7%) | 1,239 (3.9%) |
| 10:00 AM to 10:59 AM | 305 (0.8%) | 967 (3.1%) |
| 11:00 AM to 11:59 AM | 276 (0.7%) | 198 (0.6%) |
| 12:00 PM to 3:59 PM | 2,575 (7.0%) | 3,170 (10.1%) |
| 4:00 PM to 11:59 PM | 3,359 (9.1%) | 2,255 (7.2%) |
| Total | 37,034 (100.0%) | 31,490 (100.0%) |
Housing Occupancy in Franklin County
Occupancy by Ownership in Franklin County
Of the total 62,576 dwellings in Franklin County, owner-occupied units account for 45,631 (72.9%), while renter-occupied units make up 16,945 (27.1%).
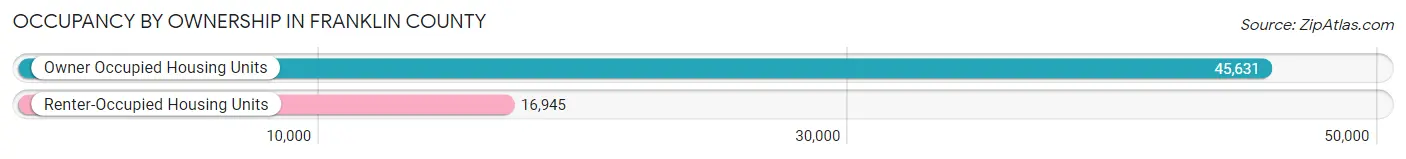
| Occupancy | # Housing Units | % Housing Units |
| Owner Occupied Housing Units | 45,631 | 72.9% |
| Renter-Occupied Housing Units | 16,945 | 27.1% |
| Total Occupied Housing Units | 62,576 | 100.0% |
Occupancy by Household Size in Franklin County
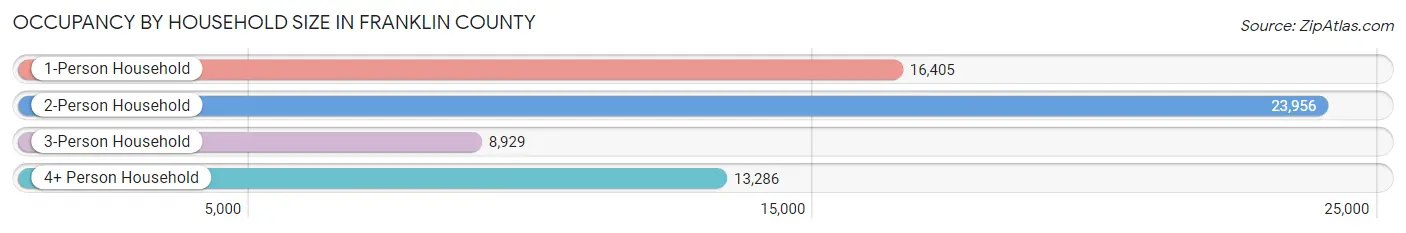
| Household Size | # Housing Units | % Housing Units |
| 1-Person Household | 16,405 | 26.2% |
| 2-Person Household | 23,956 | 38.3% |
| 3-Person Household | 8,929 | 14.3% |
| 4+ Person Household | 13,286 | 21.2% |
| Total Housing Units | 62,576 | 100.0% |
Occupancy by Ownership by Household Size in Franklin County
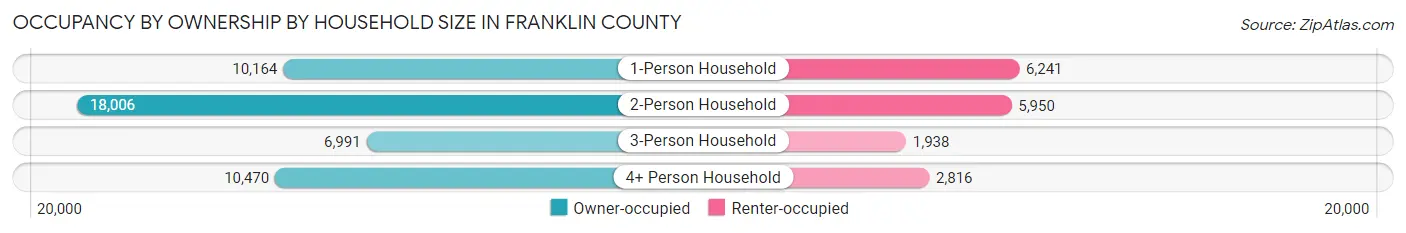
| Household Size | Owner-occupied | Renter-occupied |
| 1-Person Household | 10,164 (62.0%) | 6,241 (38.0%) |
| 2-Person Household | 18,006 (75.2%) | 5,950 (24.8%) |
| 3-Person Household | 6,991 (78.3%) | 1,938 (21.7%) |
| 4+ Person Household | 10,470 (78.8%) | 2,816 (21.2%) |
| Total Housing Units | 45,631 (72.9%) | 16,945 (27.1%) |
Occupancy by Educational Attainment in Franklin County
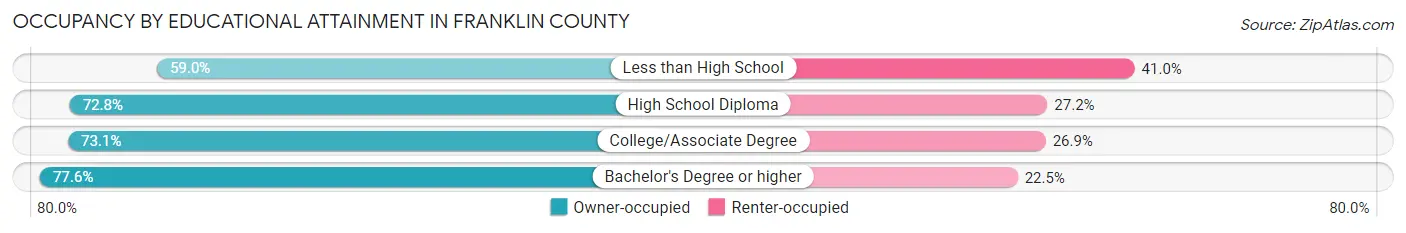
| Household Size | Owner-occupied | Renter-occupied |
| Less than High School | 3,105 (59.0%) | 2,158 (41.0%) |
| High School Diploma | 18,304 (72.8%) | 6,826 (27.2%) |
| College/Associate Degree | 12,125 (73.1%) | 4,459 (26.9%) |
| Bachelor's Degree or higher | 12,097 (77.5%) | 3,502 (22.5%) |
Occupancy by Age of Householder in Franklin County
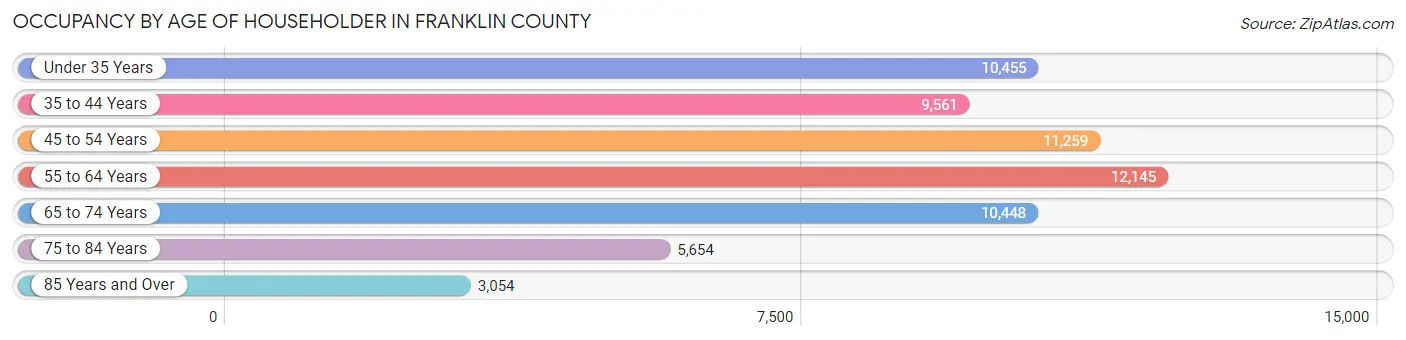
| Age Bracket | # Households | % Households |
| Under 35 Years | 10,455 | 16.7% |
| 35 to 44 Years | 9,561 | 15.3% |
| 45 to 54 Years | 11,259 | 18.0% |
| 55 to 64 Years | 12,145 | 19.4% |
| 65 to 74 Years | 10,448 | 16.7% |
| 75 to 84 Years | 5,654 | 9.0% |
| 85 Years and Over | 3,054 | 4.9% |
| Total | 62,576 | 100.0% |
Housing Finances in Franklin County
Median Income by Occupancy in Franklin County
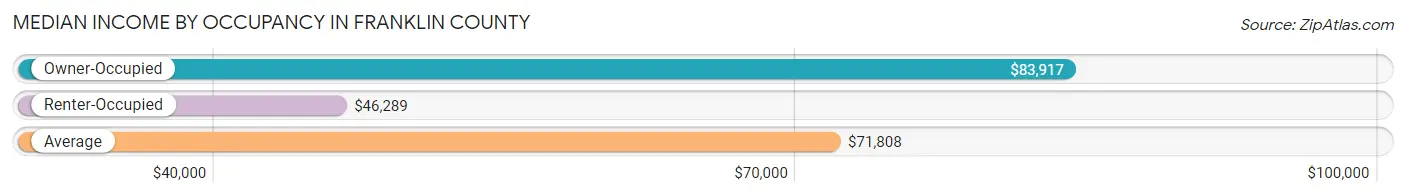
| Occupancy Type | # Households | Median Income |
| Owner-Occupied | 45,631 (72.9%) | $83,917 |
| Renter-Occupied | 16,945 (27.1%) | $46,289 |
| Average | 62,576 (100.0%) | $71,808 |
Occupancy by Householder Income Bracket in Franklin County
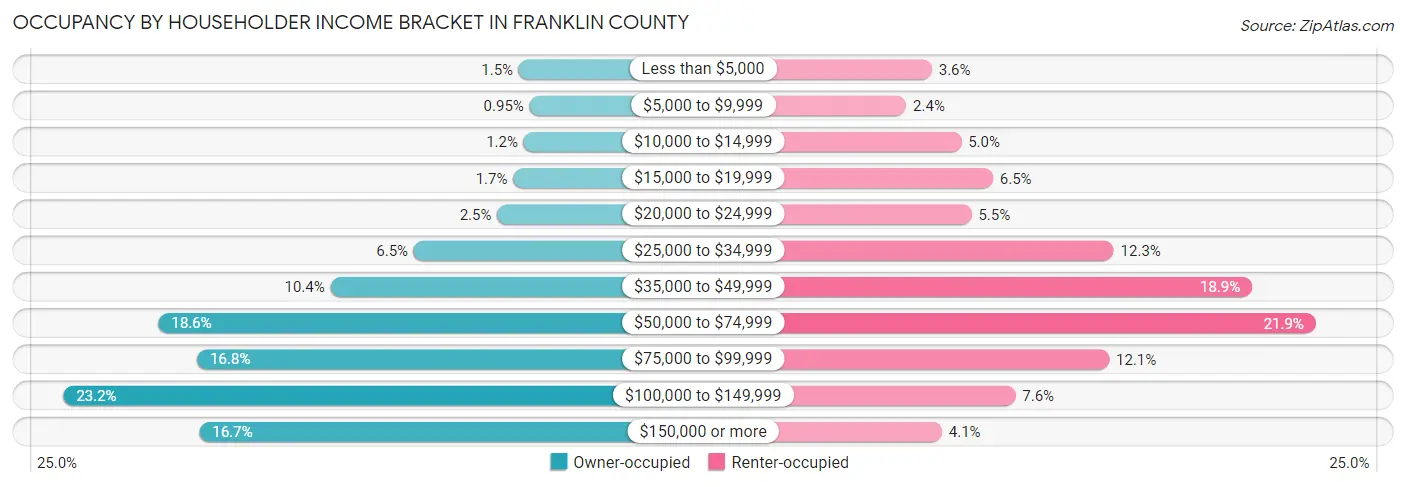
| Income Bracket | Owner-occupied | Renter-occupied |
| Less than $5,000 | 667 (1.5%) | 615 (3.6%) |
| $5,000 to $9,999 | 435 (0.9%) | 408 (2.4%) |
| $10,000 to $14,999 | 560 (1.2%) | 853 (5.0%) |
| $15,000 to $19,999 | 790 (1.7%) | 1,108 (6.5%) |
| $20,000 to $24,999 | 1,135 (2.5%) | 936 (5.5%) |
| $25,000 to $34,999 | 2,946 (6.5%) | 2,082 (12.3%) |
| $35,000 to $49,999 | 4,758 (10.4%) | 3,199 (18.9%) |
| $50,000 to $74,999 | 8,500 (18.6%) | 3,712 (21.9%) |
| $75,000 to $99,999 | 7,660 (16.8%) | 2,046 (12.1%) |
| $100,000 to $149,999 | 10,570 (23.2%) | 1,290 (7.6%) |
| $150,000 or more | 7,610 (16.7%) | 696 (4.1%) |
| Total | 45,631 (100.0%) | 16,945 (100.0%) |
Monthly Housing Cost Tiers in Franklin County
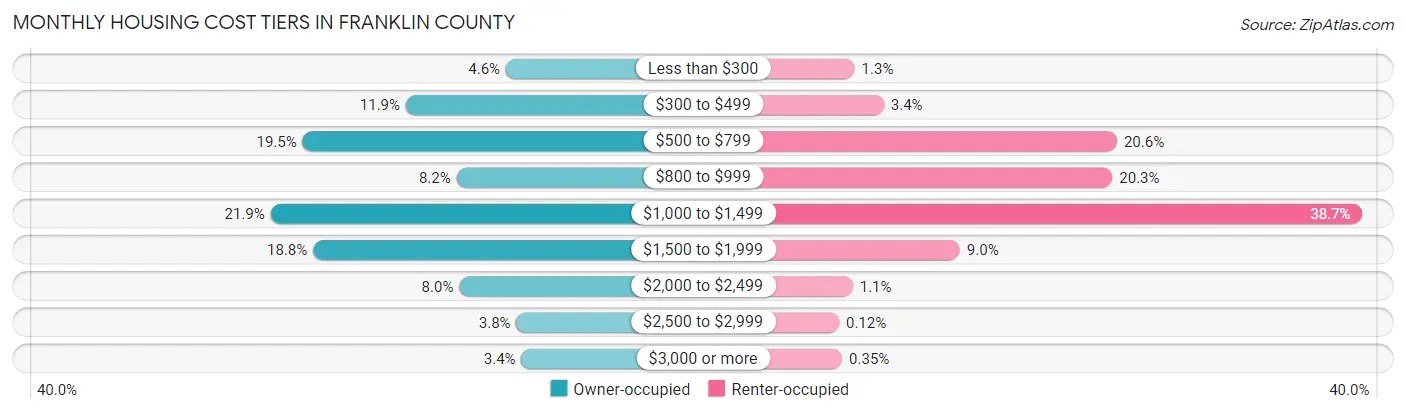
| Monthly Cost | Owner-occupied | Renter-occupied |
| Less than $300 | 2,074 (4.5%) | 215 (1.3%) |
| $300 to $499 | 5,437 (11.9%) | 579 (3.4%) |
| $500 to $799 | 8,911 (19.5%) | 3,489 (20.6%) |
| $800 to $999 | 3,738 (8.2%) | 3,431 (20.3%) |
| $1,000 to $1,499 | 9,988 (21.9%) | 6,551 (38.7%) |
| $1,500 to $1,999 | 8,558 (18.8%) | 1,529 (9.0%) |
| $2,000 to $2,499 | 3,645 (8.0%) | 191 (1.1%) |
| $2,500 to $2,999 | 1,724 (3.8%) | 20 (0.1%) |
| $3,000 or more | 1,556 (3.4%) | 60 (0.4%) |
| Total | 45,631 (100.0%) | 16,945 (100.0%) |
Physical Housing Characteristics in Franklin County
Housing Structures in Franklin County
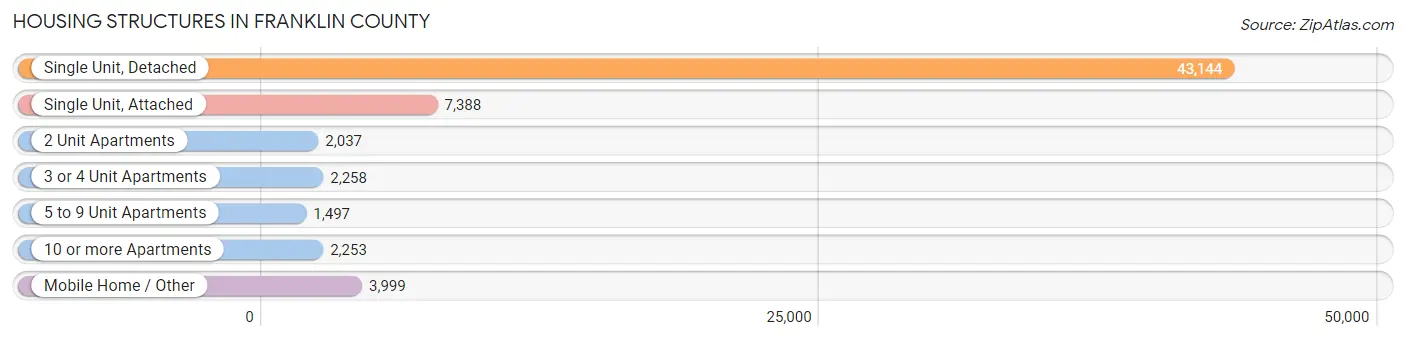
| Structure Type | # Housing Units | % Housing Units |
| Single Unit, Detached | 43,144 | 69.0% |
| Single Unit, Attached | 7,388 | 11.8% |
| 2 Unit Apartments | 2,037 | 3.3% |
| 3 or 4 Unit Apartments | 2,258 | 3.6% |
| 5 to 9 Unit Apartments | 1,497 | 2.4% |
| 10 or more Apartments | 2,253 | 3.6% |
| Mobile Home / Other | 3,999 | 6.4% |
| Total | 62,576 | 100.0% |
Housing Structures by Occupancy in Franklin County
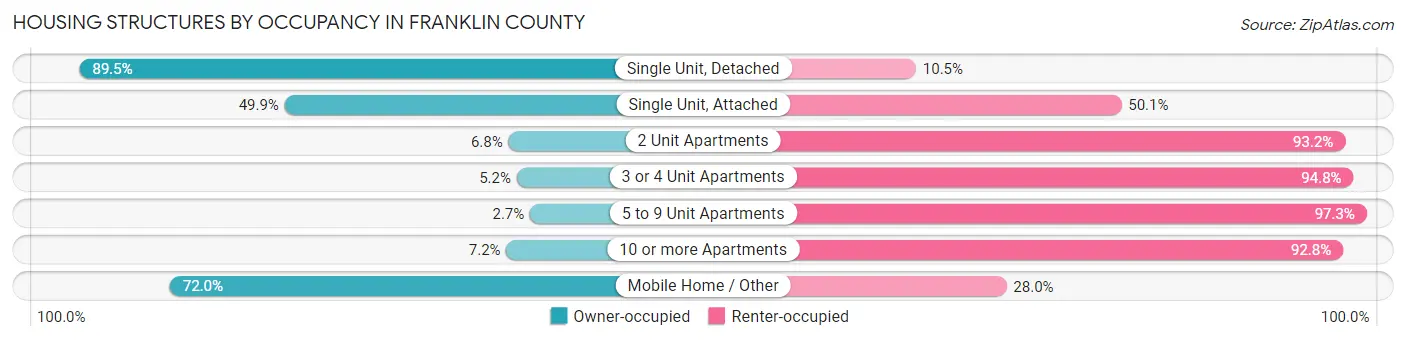
| Structure Type | Owner-occupied | Renter-occupied |
| Single Unit, Detached | 38,602 (89.5%) | 4,542 (10.5%) |
| Single Unit, Attached | 3,688 (49.9%) | 3,700 (50.1%) |
| 2 Unit Apartments | 139 (6.8%) | 1,898 (93.2%) |
| 3 or 4 Unit Apartments | 118 (5.2%) | 2,140 (94.8%) |
| 5 to 9 Unit Apartments | 40 (2.7%) | 1,457 (97.3%) |
| 10 or more Apartments | 163 (7.2%) | 2,090 (92.8%) |
| Mobile Home / Other | 2,881 (72.0%) | 1,118 (28.0%) |
| Total | 45,631 (72.9%) | 16,945 (27.1%) |
Housing Structures by Number of Rooms in Franklin County
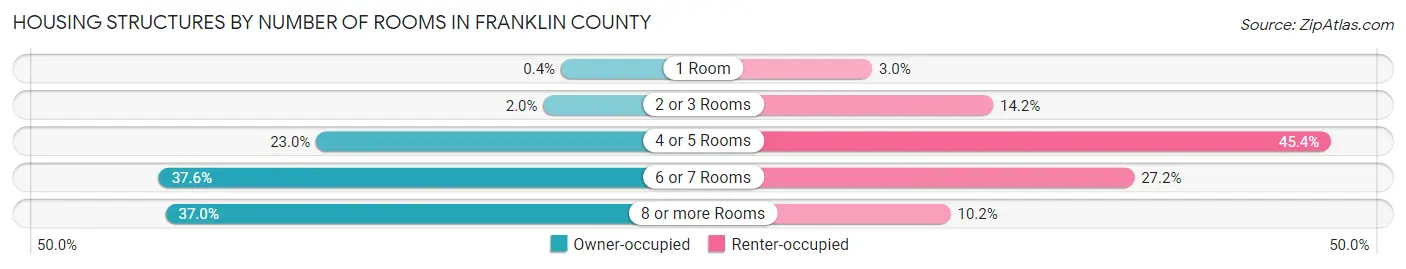
| Number of Rooms | Owner-occupied | Renter-occupied |
| 1 Room | 182 (0.4%) | 503 (3.0%) |
| 2 or 3 Rooms | 923 (2.0%) | 2,399 (14.2%) |
| 4 or 5 Rooms | 10,509 (23.0%) | 7,697 (45.4%) |
| 6 or 7 Rooms | 17,152 (37.6%) | 4,612 (27.2%) |
| 8 or more Rooms | 16,865 (37.0%) | 1,734 (10.2%) |
| Total | 45,631 (100.0%) | 16,945 (100.0%) |
Housing Structure by Heating Type in Franklin County
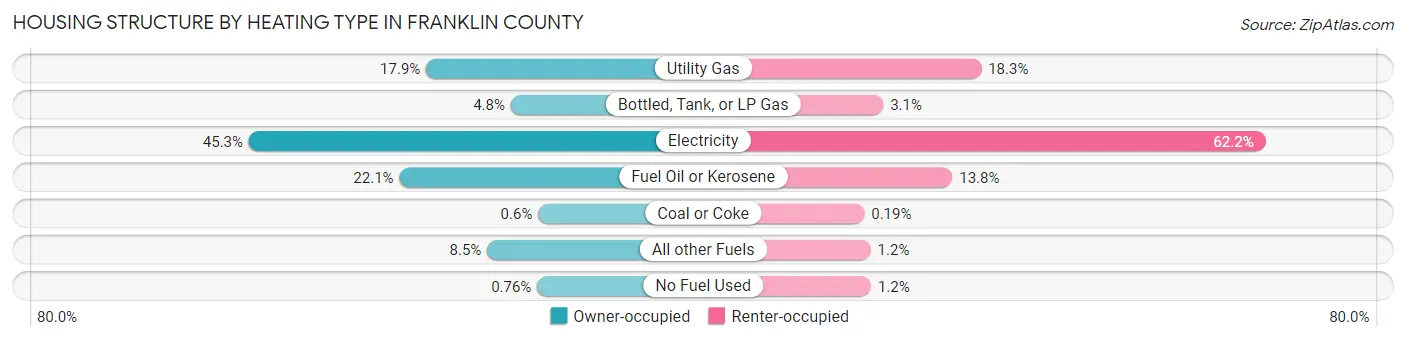
| Heating Type | Owner-occupied | Renter-occupied |
| Utility Gas | 8,177 (17.9%) | 3,096 (18.3%) |
| Bottled, Tank, or LP Gas | 2,207 (4.8%) | 529 (3.1%) |
| Electricity | 20,684 (45.3%) | 10,542 (62.2%) |
| Fuel Oil or Kerosene | 10,066 (22.1%) | 2,339 (13.8%) |
| Coal or Coke | 274 (0.6%) | 32 (0.2%) |
| All other Fuels | 3,874 (8.5%) | 200 (1.2%) |
| No Fuel Used | 349 (0.8%) | 207 (1.2%) |
| Total | 45,631 (100.0%) | 16,945 (100.0%) |
Household Vehicle Usage in Franklin County
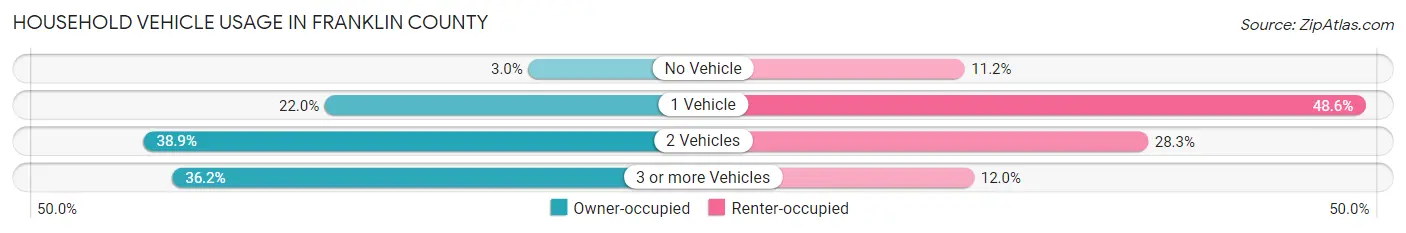
| Vehicles per Household | Owner-occupied | Renter-occupied |
| No Vehicle | 1,347 (2.9%) | 1,890 (11.2%) |
| 1 Vehicle | 10,015 (22.0%) | 8,226 (48.5%) |
| 2 Vehicles | 17,745 (38.9%) | 4,791 (28.3%) |
| 3 or more Vehicles | 16,524 (36.2%) | 2,038 (12.0%) |
| Total | 45,631 (100.0%) | 16,945 (100.0%) |
Real Estate & Mortgages in Franklin County
Real Estate and Mortgage Overview in Franklin County
| Characteristic | Without Mortgage | With Mortgage |
| Housing Units | 17,488 | 28,143 |
| Median Property Value | $217,400 | $224,600 |
| Median Household Income | $63,364 | $5,304 |
| Monthly Housing Costs | $550 | $1,543 |
| Real Estate Taxes | $2,398 | $543 |
Property Value by Mortgage Status in Franklin County
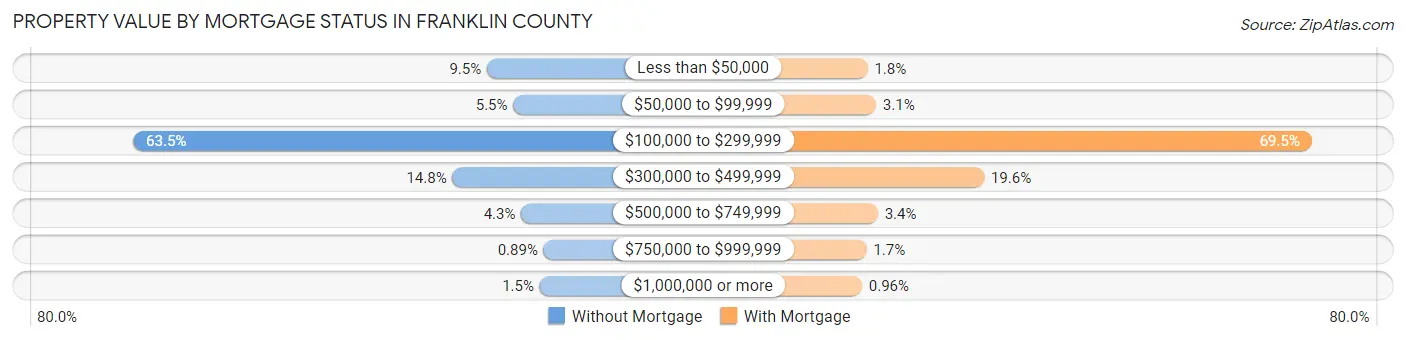
| Property Value | Without Mortgage | With Mortgage |
| Less than $50,000 | 1,666 (9.5%) | 513 (1.8%) |
| $50,000 to $99,999 | 966 (5.5%) | 873 (3.1%) |
| $100,000 to $299,999 | 11,097 (63.4%) | 19,561 (69.5%) |
| $300,000 to $499,999 | 2,589 (14.8%) | 5,507 (19.6%) |
| $500,000 to $749,999 | 754 (4.3%) | 951 (3.4%) |
| $750,000 to $999,999 | 156 (0.9%) | 468 (1.7%) |
| $1,000,000 or more | 260 (1.5%) | 270 (1.0%) |
| Total | 17,488 (100.0%) | 28,143 (100.0%) |
Household Income by Mortgage Status in Franklin County
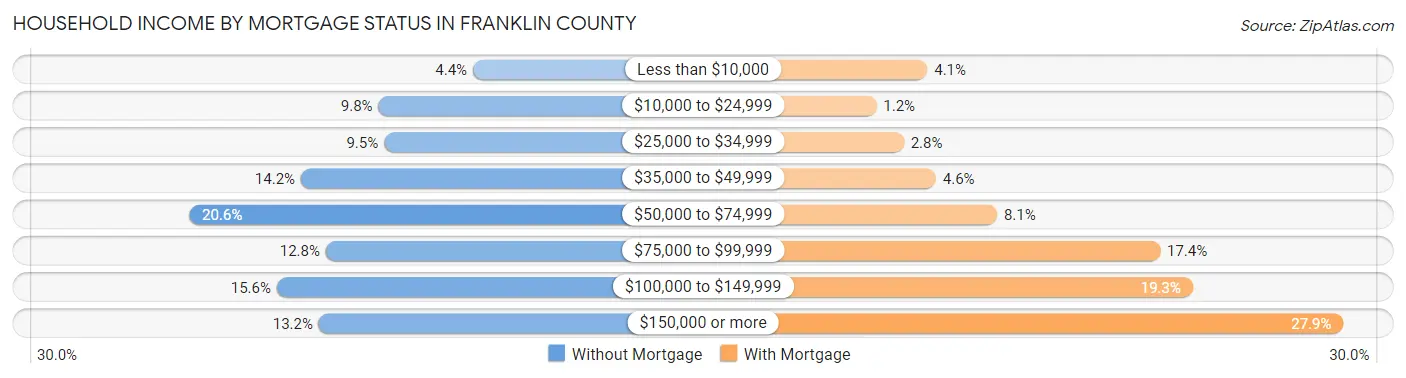
| Household Income | Without Mortgage | With Mortgage |
| Less than $10,000 | 766 (4.4%) | 1,153 (4.1%) |
| $10,000 to $24,999 | 1,710 (9.8%) | 336 (1.2%) |
| $25,000 to $34,999 | 1,655 (9.5%) | 775 (2.8%) |
| $35,000 to $49,999 | 2,485 (14.2%) | 1,291 (4.6%) |
| $50,000 to $74,999 | 3,602 (20.6%) | 2,273 (8.1%) |
| $75,000 to $99,999 | 2,237 (12.8%) | 4,898 (17.4%) |
| $100,000 to $149,999 | 2,727 (15.6%) | 5,423 (19.3%) |
| $150,000 or more | 2,306 (13.2%) | 7,843 (27.9%) |
| Total | 17,488 (100.0%) | 28,143 (100.0%) |
Property Value to Household Income Ratio in Franklin County
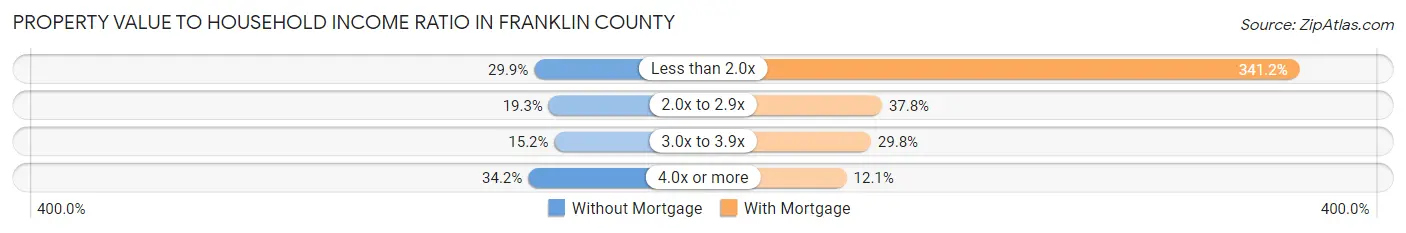
| Value-to-Income Ratio | Without Mortgage | With Mortgage |
| Less than 2.0x | 5,222 (29.9%) | 96,009 (341.2%) |
| 2.0x to 2.9x | 3,371 (19.3%) | 10,637 (37.8%) |
| 3.0x to 3.9x | 2,652 (15.2%) | 8,374 (29.8%) |
| 4.0x or more | 5,988 (34.2%) | 3,411 (12.1%) |
| Total | 17,488 (100.0%) | 28,143 (100.0%) |
Real Estate Taxes by Mortgage Status in Franklin County
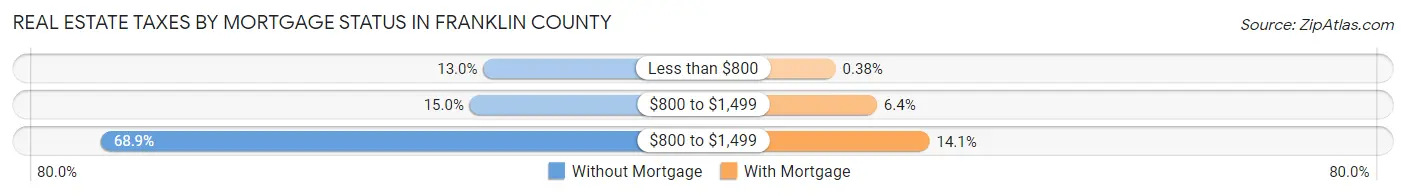
| Property Taxes | Without Mortgage | With Mortgage |
| Less than $800 | 2,270 (13.0%) | 107 (0.4%) |
| $800 to $1,499 | 2,617 (15.0%) | 1,804 (6.4%) |
| $800 to $1,499 | 12,040 (68.9%) | 3,967 (14.1%) |
| Total | 17,488 (100.0%) | 28,143 (100.0%) |
Health & Disability in Franklin County
Health Insurance Coverage by Age in Franklin County
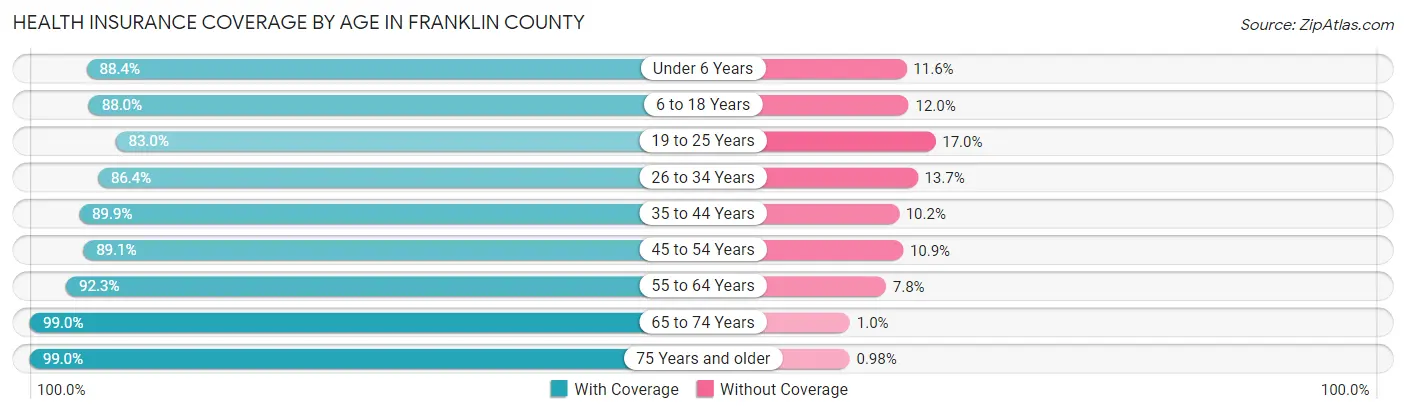
| Age Bracket | With Coverage | Without Coverage |
| Under 6 Years | 9,615 (88.4%) | 1,259 (11.6%) |
| 6 to 18 Years | 22,087 (88.0%) | 3,010 (12.0%) |
| 19 to 25 Years | 9,717 (83.0%) | 1,986 (17.0%) |
| 26 to 34 Years | 14,763 (86.4%) | 2,334 (13.7%) |
| 35 to 44 Years | 16,480 (89.8%) | 1,862 (10.2%) |
| 45 to 54 Years | 18,059 (89.1%) | 2,218 (10.9%) |
| 55 to 64 Years | 19,746 (92.2%) | 1,660 (7.7%) |
| 65 to 74 Years | 16,945 (99.0%) | 177 (1.0%) |
| 75 Years and older | 12,869 (99.0%) | 127 (1.0%) |
| Total | 140,281 (90.5%) | 14,633 (9.5%) |
Health Insurance Coverage by Citizenship Status in Franklin County
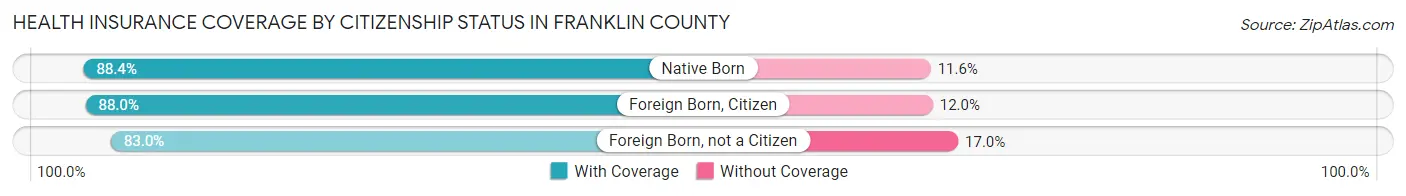
| Citizenship Status | With Coverage | Without Coverage |
| Native Born | 9,615 (88.4%) | 1,259 (11.6%) |
| Foreign Born, Citizen | 22,087 (88.0%) | 3,010 (12.0%) |
| Foreign Born, not a Citizen | 9,717 (83.0%) | 1,986 (17.0%) |
Health Insurance Coverage by Household Income in Franklin County
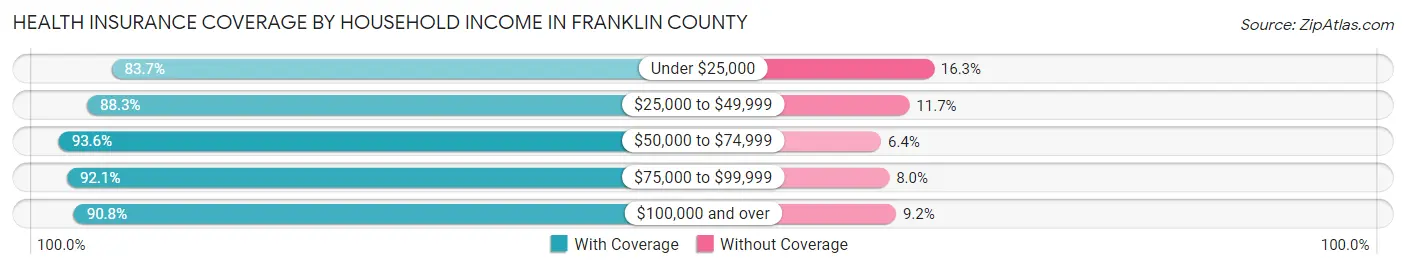
| Household Income | With Coverage | Without Coverage |
| Under $25,000 | 10,307 (83.7%) | 2,009 (16.3%) |
| $25,000 to $49,999 | 23,099 (88.3%) | 3,071 (11.7%) |
| $50,000 to $74,999 | 26,001 (93.6%) | 1,783 (6.4%) |
| $75,000 to $99,999 | 24,478 (92.0%) | 2,113 (8.0%) |
| $100,000 and over | 55,576 (90.8%) | 5,645 (9.2%) |
Public vs Private Health Insurance Coverage by Age in Franklin County
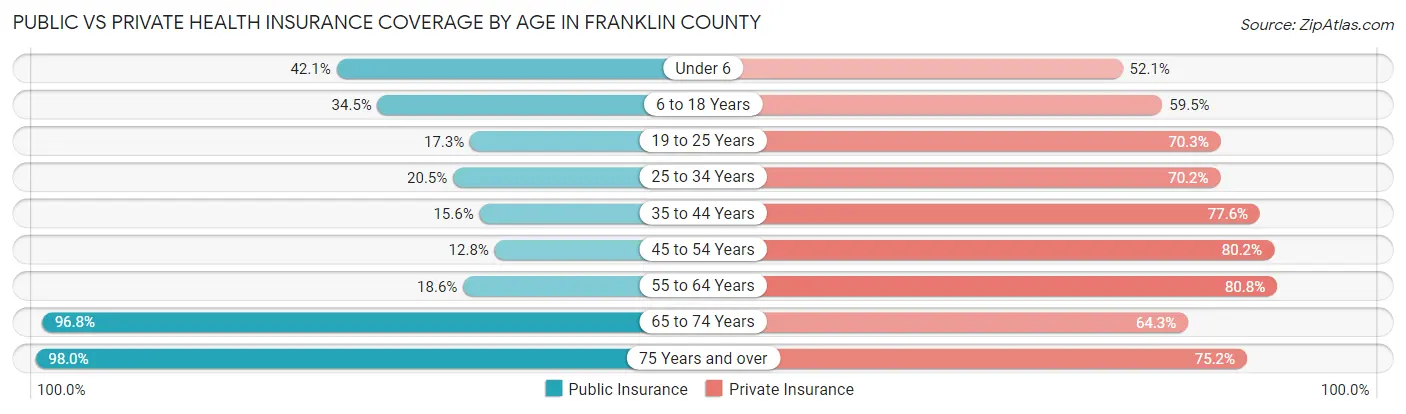
| Age Bracket | Public Insurance | Private Insurance |
| Under 6 | 4,579 (42.1%) | 5,669 (52.1%) |
| 6 to 18 Years | 8,652 (34.5%) | 14,934 (59.5%) |
| 19 to 25 Years | 2,027 (17.3%) | 8,225 (70.3%) |
| 25 to 34 Years | 3,498 (20.5%) | 12,009 (70.2%) |
| 35 to 44 Years | 2,855 (15.6%) | 14,233 (77.6%) |
| 45 to 54 Years | 2,586 (12.8%) | 16,261 (80.2%) |
| 55 to 64 Years | 3,982 (18.6%) | 17,292 (80.8%) |
| 65 to 74 Years | 16,577 (96.8%) | 11,006 (64.3%) |
| 75 Years and over | 12,736 (98.0%) | 9,771 (75.2%) |
| Total | 57,492 (37.1%) | 109,400 (70.6%) |
Disability Status by Sex by Age in Franklin County
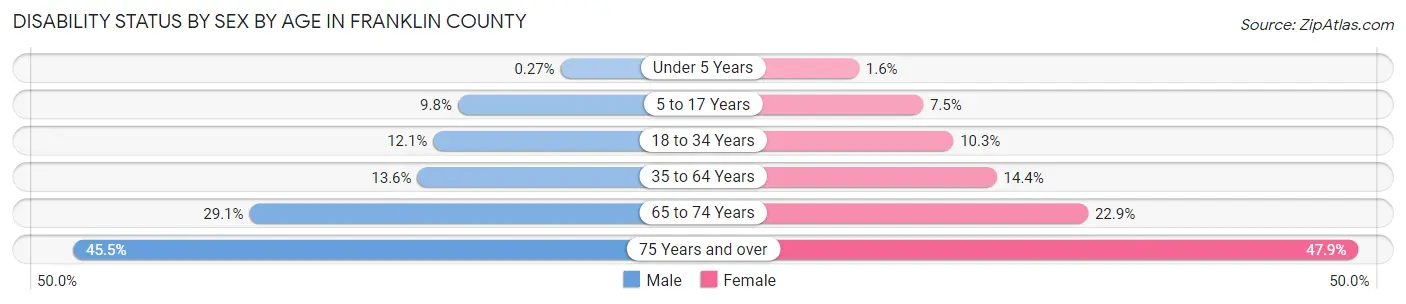
| Age Bracket | Male | Female |
| Under 5 Years | 12 (0.3%) | 69 (1.6%) |
| 5 to 17 Years | 1,299 (9.8%) | 908 (7.5%) |
| 18 to 34 Years | 1,865 (12.1%) | 1,575 (10.3%) |
| 35 to 64 Years | 4,066 (13.6%) | 4,315 (14.4%) |
| 65 to 74 Years | 2,377 (29.1%) | 2,048 (22.9%) |
| 75 Years and over | 2,480 (45.5%) | 3,617 (47.9%) |
Disability Class by Sex by Age in Franklin County
Disability Class: Hearing Difficulty
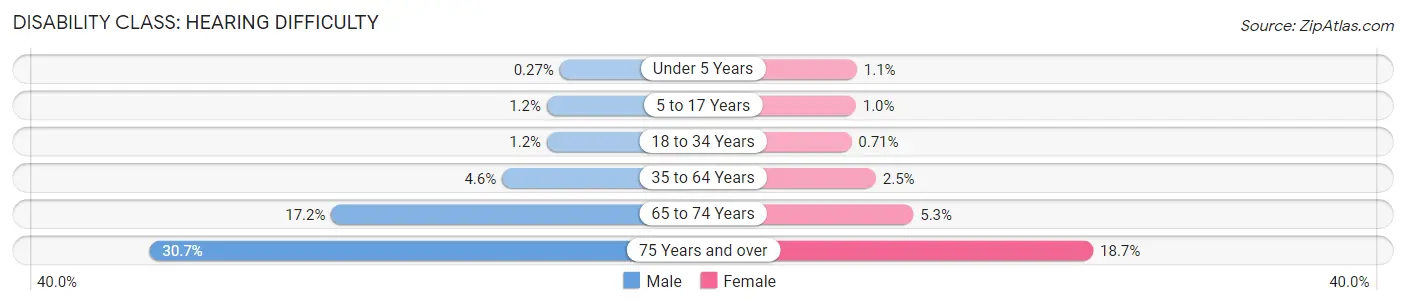
| Age Bracket | Male | Female |
| Under 5 Years | 12 (0.3%) | 49 (1.1%) |
| 5 to 17 Years | 163 (1.2%) | 125 (1.0%) |
| 18 to 34 Years | 189 (1.2%) | 108 (0.7%) |
| 35 to 64 Years | 1,365 (4.5%) | 759 (2.5%) |
| 65 to 74 Years | 1,406 (17.2%) | 476 (5.3%) |
| 75 Years and over | 1,675 (30.7%) | 1,408 (18.7%) |
Disability Class: Vision Difficulty
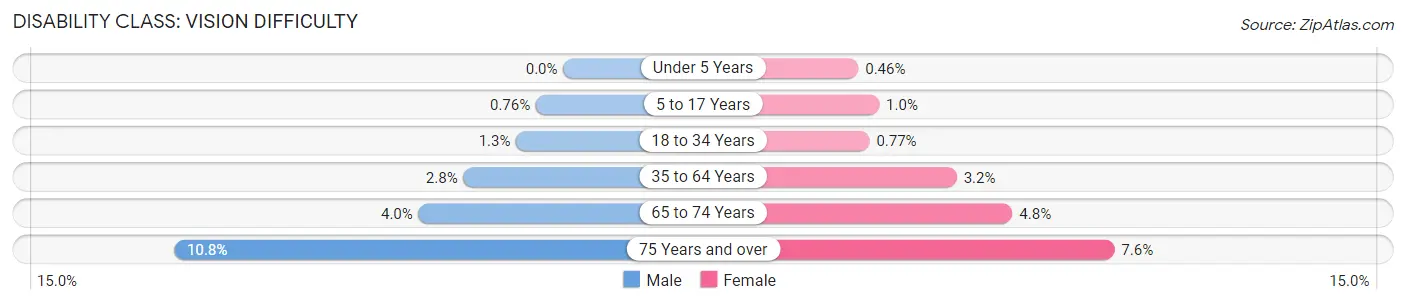
| Age Bracket | Male | Female |
| Under 5 Years | 0 (0.0%) | 20 (0.5%) |
| 5 to 17 Years | 101 (0.8%) | 126 (1.0%) |
| 18 to 34 Years | 203 (1.3%) | 118 (0.8%) |
| 35 to 64 Years | 834 (2.8%) | 962 (3.2%) |
| 65 to 74 Years | 329 (4.0%) | 426 (4.8%) |
| 75 Years and over | 591 (10.8%) | 573 (7.6%) |
Disability Class: Cognitive Difficulty
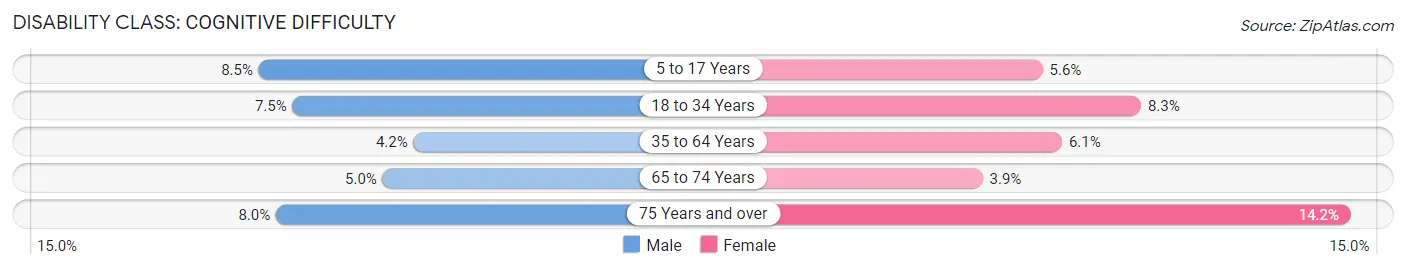
| Age Bracket | Male | Female |
| 5 to 17 Years | 1,124 (8.5%) | 674 (5.6%) |
| 18 to 34 Years | 1,164 (7.5%) | 1,269 (8.3%) |
| 35 to 64 Years | 1,251 (4.2%) | 1,841 (6.1%) |
| 65 to 74 Years | 410 (5.0%) | 351 (3.9%) |
| 75 Years and over | 436 (8.0%) | 1,069 (14.2%) |
Disability Class: Ambulatory Difficulty
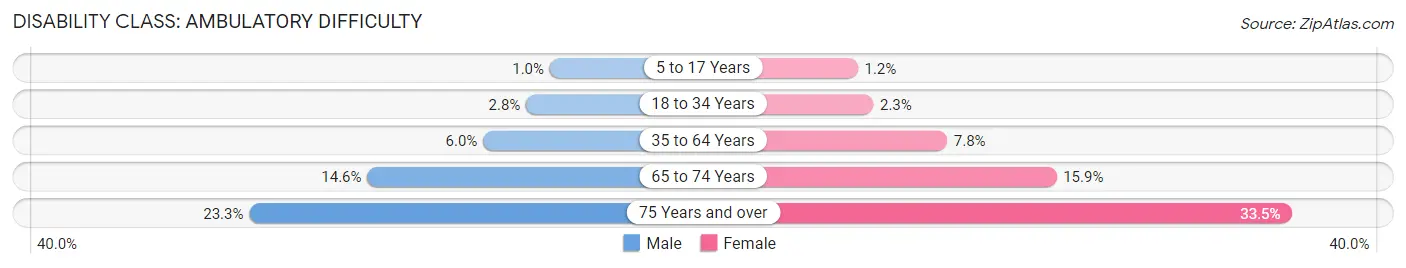
| Age Bracket | Male | Female |
| 5 to 17 Years | 132 (1.0%) | 141 (1.2%) |
| 18 to 34 Years | 427 (2.8%) | 353 (2.3%) |
| 35 to 64 Years | 1,785 (5.9%) | 2,342 (7.8%) |
| 65 to 74 Years | 1,187 (14.5%) | 1,427 (15.9%) |
| 75 Years and over | 1,271 (23.3%) | 2,524 (33.5%) |
Disability Class: Self-Care Difficulty
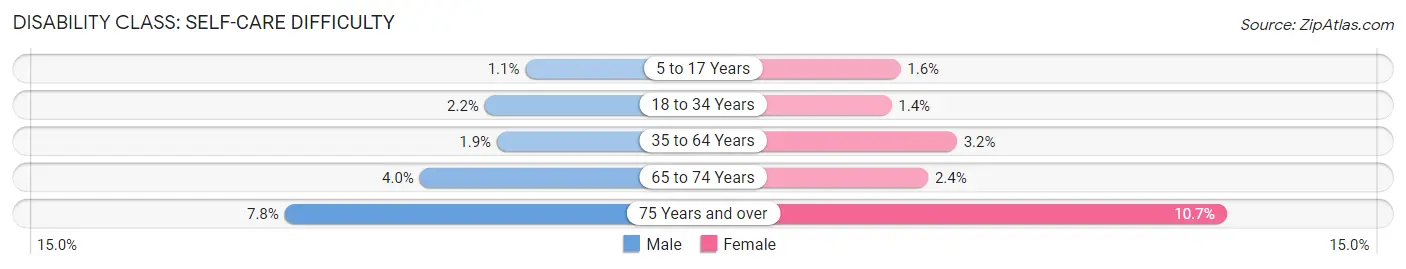
| Age Bracket | Male | Female |
| 5 to 17 Years | 141 (1.1%) | 196 (1.6%) |
| 18 to 34 Years | 338 (2.2%) | 210 (1.4%) |
| 35 to 64 Years | 554 (1.8%) | 961 (3.2%) |
| 65 to 74 Years | 326 (4.0%) | 215 (2.4%) |
| 75 Years and over | 423 (7.8%) | 808 (10.7%) |
Technology Access in Franklin County
Computing Device Access in Franklin County
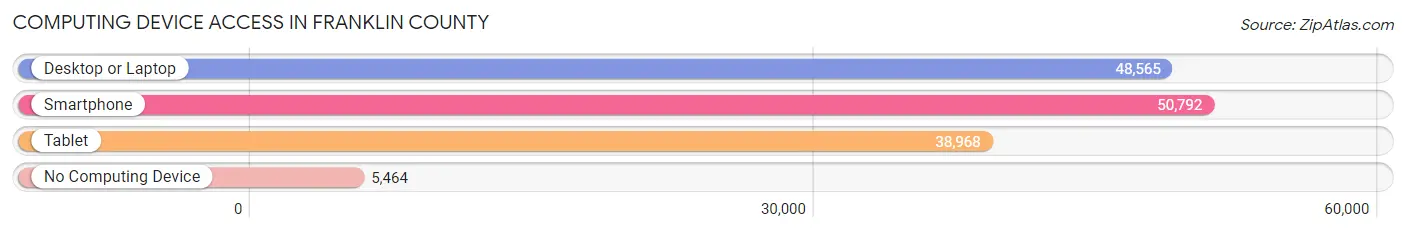
| Device Type | # Households | % Households |
| Desktop or Laptop | 48,565 | 77.6% |
| Smartphone | 50,792 | 81.2% |
| Tablet | 38,968 | 62.3% |
| No Computing Device | 5,464 | 8.7% |
| Total | 62,576 | 100.0% |
Internet Access in Franklin County
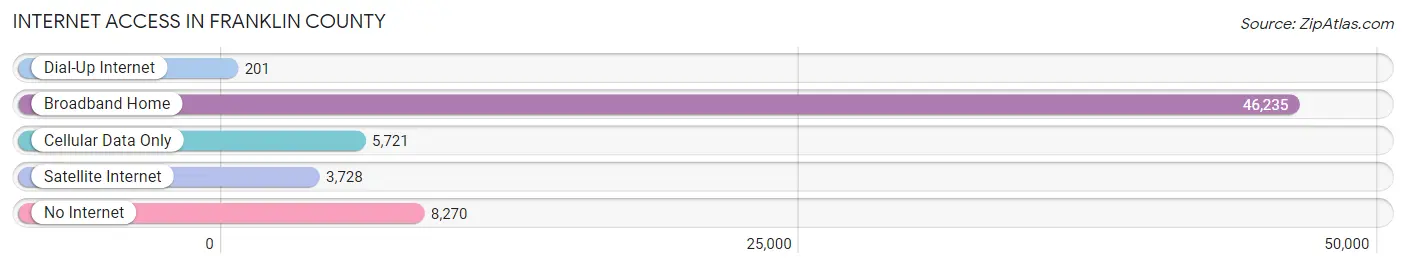
| Internet Type | # Households | % Households |
| Dial-Up Internet | 201 | 0.3% |
| Broadband Home | 46,235 | 73.9% |
| Cellular Data Only | 5,721 | 9.1% |
| Satellite Internet | 3,728 | 6.0% |
| No Internet | 8,270 | 13.2% |
| Total | 62,576 | 100.0% |
Franklin County Summary
Franklin County, Pennsylvania is located in the south-central part of the state and is part of the Cumberland Valley region. It is bordered by Adams, Cumberland, and Fulton counties to the north, Perry County to the east, and the state of Maryland to the south and west. The county seat is Chambersburg, and the county is home to a population of approximately 151,000 people.
History
Franklin County was established in 1784, and was named after Benjamin Franklin. The county was formed from parts of Cumberland and Lancaster counties. The county was originally part of the vast territory of the Iroquois Nation, and was later settled by German and Scots-Irish immigrants. The county was an important part of the Underground Railroad, and was home to many abolitionists. During the Civil War, the county was the site of the Battle of Gettysburg, and the county seat of Chambersburg was burned by Confederate troops in 1864.
Geography
Franklin County is located in the south-central part of Pennsylvania, and is part of the Cumberland Valley region. The county is bordered by Adams, Cumberland, and Fulton counties to the north, Perry County to the east, and the state of Maryland to the south and west. The county has a total area of 545 square miles, and is home to the Tuscarora State Forest, Michaux State Forest, and Caledonia State Park. The county is also home to the Appalachian Trail, which runs through the county for approximately 40 miles.
Economy
Franklin County’s economy is largely based on agriculture, manufacturing, and tourism. The county is home to a number of large agricultural operations, including dairy farms, poultry farms, and fruit and vegetable farms. The county is also home to a number of manufacturing companies, including automotive parts manufacturers, food processing companies, and paper mills. Tourism is also an important part of the county’s economy, with the county being home to a number of historic sites, museums, and outdoor recreation areas.
Demographics
As of the 2010 census, Franklin County had a population of 151,000 people. The racial makeup of the county was 90.3% White, 5.2% African American, 0.7% Native American, 1.2% Asian, 0.2% Pacific Islander, and 2.4% from other races. The county’s median household income was $50,845, and the median family income was $60,945. The county’s unemployment rate was 5.2%. The county’s largest employers are Summit Health, Letterkenny Army Depot, and JLG Industries.
Common Questions
What is Per Capita Income in Franklin County?
Per Capita income in Franklin County is $37,520.
What is the Median Family Income in Franklin County?
Median Family Income in Franklin County is $85,138.
What is the Median Household income in Franklin County?
Median Household Income in Franklin County is $71,808.
What is Income or Wage Gap in Franklin County?
Income or Wage Gap in Franklin County is 30.7%.
Women in Franklin County earn 69.3 cents for every dollar earned by a man.
What is Family Income Deficit in Franklin County?
Family Income Deficit in Franklin County is $12,045.
Families that are below poverty line in Franklin County earn $12,045 less on average than the poverty threshold level.
What is Inequality or Gini Index in Franklin County?
Inequality or Gini Index in Franklin County is 0.42.
What is the Total Population of Franklin County?
Total Population of Franklin County is 156,084.
What is the Total Male Population of Franklin County?
Total Male Population of Franklin County is 77,293.
What is the Total Female Population of Franklin County?
Total Female Population of Franklin County is 78,791.
What is the Ratio of Males per 100 Females in Franklin County?
There are 98.10 Males per 100 Females in Franklin County.
What is the Ratio of Females per 100 Males in Franklin County?
There are 101.94 Females per 100 Males in Franklin County.
What is the Median Population Age in Franklin County?
Median Population Age in Franklin County is 42.2 Years.
What is the Average Family Size in Franklin County
Average Family Size in Franklin County is 3.0 People.
What is the Average Household Size in Franklin County
Average Household Size in Franklin County is 2.5 People.
How Large is the Labor Force in Franklin County?
There are 78,558 People in the Labor Forcein in Franklin County.
What is the Percentage of People in the Labor Force in Franklin County?
62.5% of People are in the Labor Force in Franklin County.
What is the Unemployment Rate in Franklin County?
Unemployment Rate in Franklin County is 3.4%.