Fayette County, PA Map & Demographics
Fayette County Map
Fayette County Overview
$31,498
PER CAPITA INCOME
$73,849
AVG FAMILY INCOME
$55,579
AVG HOUSEHOLD INCOME
35.6%
WAGE / INCOME GAP [ % ]
64.4¢/ $1
WAGE / INCOME GAP [ $ ]
$10,353
FAMILY INCOME DEFICIT
0.45
INEQUALITY / GINI INDEX
128,417
TOTAL POPULATION
64,341
MALE POPULATION
64,076
FEMALE POPULATION
100.41
MALES / 100 FEMALES
99.59
FEMALES / 100 MALES
45.2
MEDIAN AGE
2.8
AVG FAMILY SIZE
2.2
AVG HOUSEHOLD SIZE
58,576
LABOR FORCE [ PEOPLE ]
54.8%
PERCENT IN LABOR FORCE
7.2%
UNEMPLOYMENT RATE
Income in Fayette County
Income Overview in Fayette County
Per Capita Income in Fayette County is $31,498, while median incomes of families and households are $73,849 and $55,579 respectively.
| Characteristic | Number | Measure |
| Per Capita Income | 128,417 | $31,498 |
| Median Family Income | 33,848 | $73,849 |
| Mean Family Income | 33,848 | $88,680 |
| Median Household Income | 54,937 | $55,579 |
| Mean Household Income | 54,937 | $73,221 |
| Income Deficit | 33,848 | $10,353 |
| Wage / Income Gap (%) | 128,417 | 35.57% |
| Wage / Income Gap ($) | 128,417 | 64.43¢ per $1 |
| Gini / Inequality Index | 128,417 | 0.45 |
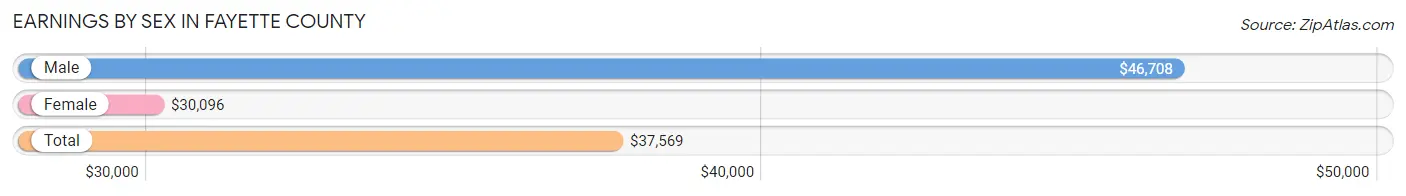
Earnings by Sex in Fayette County
Average Earnings in Fayette County are $37,569, $46,708 for men and $30,096 for women, a difference of 35.6%.
| Sex | Number | Average Earnings |
| Male | 32,495 (53.2%) | $46,708 |
| Female | 28,543 (46.8%) | $30,096 |
| Total | 61,038 (100.0%) | $37,569 |
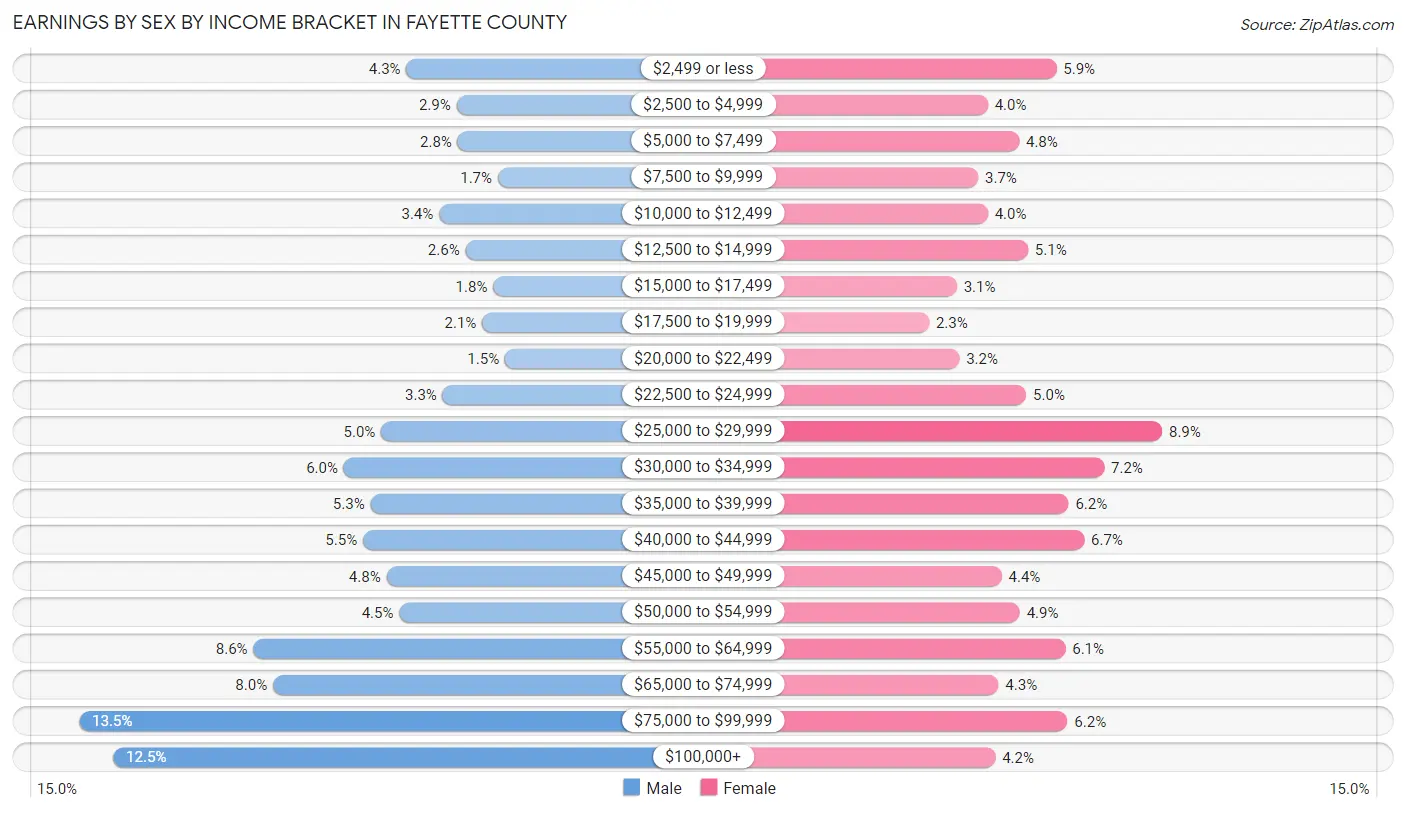
Earnings by Sex by Income Bracket in Fayette County
The most common earnings brackets in Fayette County are $75,000 to $99,999 for men (4,377 | 13.5%) and $25,000 to $29,999 for women (2,529 | 8.9%).
| Income | Male | Female |
| $2,499 or less | 1,388 (4.3%) | 1,682 (5.9%) |
| $2,500 to $4,999 | 929 (2.9%) | 1,129 (4.0%) |
| $5,000 to $7,499 | 921 (2.8%) | 1,382 (4.8%) |
| $7,500 to $9,999 | 552 (1.7%) | 1,053 (3.7%) |
| $10,000 to $12,499 | 1,088 (3.4%) | 1,130 (4.0%) |
| $12,500 to $14,999 | 848 (2.6%) | 1,453 (5.1%) |
| $15,000 to $17,499 | 594 (1.8%) | 882 (3.1%) |
| $17,500 to $19,999 | 696 (2.1%) | 659 (2.3%) |
| $20,000 to $22,499 | 487 (1.5%) | 902 (3.2%) |
| $22,500 to $24,999 | 1,057 (3.3%) | 1,438 (5.0%) |
| $25,000 to $29,999 | 1,618 (5.0%) | 2,529 (8.9%) |
| $30,000 to $34,999 | 1,959 (6.0%) | 2,065 (7.2%) |
| $35,000 to $39,999 | 1,717 (5.3%) | 1,778 (6.2%) |
| $40,000 to $44,999 | 1,784 (5.5%) | 1,904 (6.7%) |
| $45,000 to $49,999 | 1,570 (4.8%) | 1,243 (4.3%) |
| $50,000 to $54,999 | 1,453 (4.5%) | 1,386 (4.9%) |
| $55,000 to $64,999 | 2,786 (8.6%) | 1,753 (6.1%) |
| $65,000 to $74,999 | 2,607 (8.0%) | 1,215 (4.3%) |
| $75,000 to $99,999 | 4,377 (13.5%) | 1,770 (6.2%) |
| $100,000+ | 4,064 (12.5%) | 1,190 (4.2%) |
| Total | 32,495 (100.0%) | 28,543 (100.0%) |
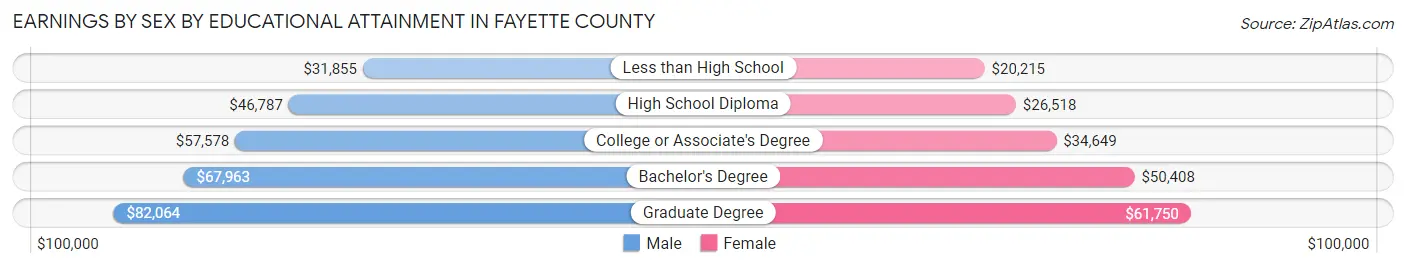
Earnings by Sex by Educational Attainment in Fayette County
Average earnings in Fayette County are $52,627 for men and $34,115 for women, a difference of 35.2%. Men with an educational attainment of graduate degree enjoy the highest average annual earnings of $82,064, while those with less than high school education earn the least with $31,855. Women with an educational attainment of graduate degree earn the most with the average annual earnings of $61,750, while those with less than high school education have the smallest earnings of $20,215.
| Educational Attainment | Male Income | Female Income |
| Less than High School | $31,855 | $20,215 |
| High School Diploma | $46,787 | $26,518 |
| College or Associate's Degree | $57,578 | $34,649 |
| Bachelor's Degree | $67,963 | $50,408 |
| Graduate Degree | $82,064 | $61,750 |
| Total | $52,627 | $34,115 |
Family Income in Fayette County
Family Income Brackets in Fayette County
According to the Fayette County family income data, there are 6,600 families falling into the $100,000 to $149,999 income range, which is the most common income bracket and makes up 19.5% of all families. Conversely, the $10,000 to $14,999 income bracket is the least frequent group with only 1,083 families (3.2%) belonging to this category.
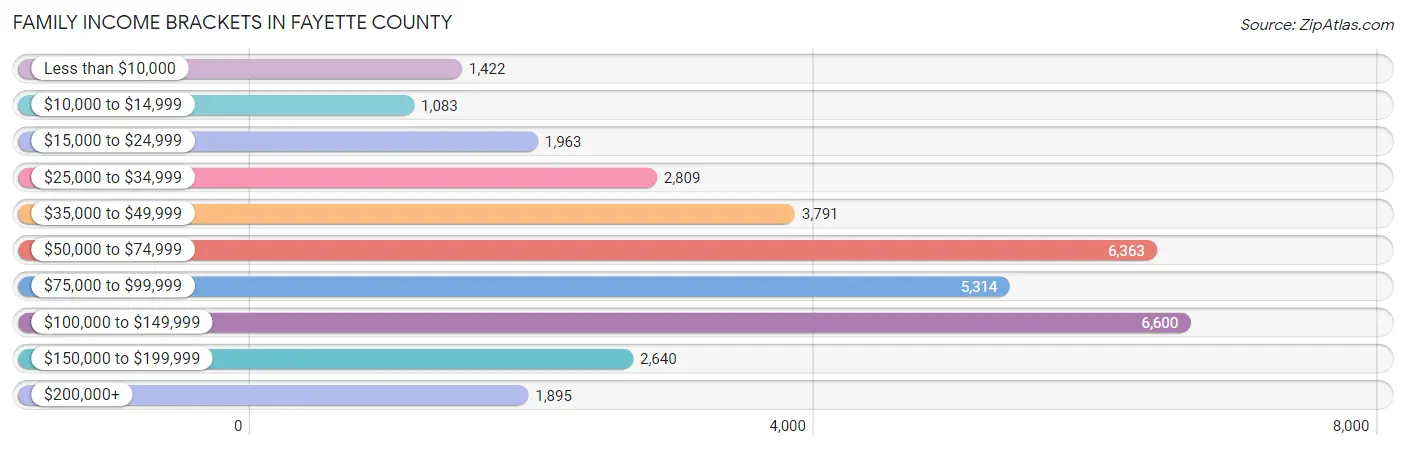
| Income Bracket | # Families | % Families |
| Less than $10,000 | 1,422 | 4.2% |
| $10,000 to $14,999 | 1,083 | 3.2% |
| $15,000 to $24,999 | 1,963 | 5.8% |
| $25,000 to $34,999 | 2,809 | 8.3% |
| $35,000 to $49,999 | 3,791 | 11.2% |
| $50,000 to $74,999 | 6,363 | 18.8% |
| $75,000 to $99,999 | 5,314 | 15.7% |
| $100,000 to $149,999 | 6,600 | 19.5% |
| $150,000 to $199,999 | 2,640 | 7.8% |
| $200,000+ | 1,895 | 5.6% |
Family Income by Famaliy Size in Fayette County
7+ person families (348 | 1.0%) account for the highest median family income in Fayette County with $155,071 per family, while 2-person families (17,747 | 52.4%) have the highest median income of $31,216 per family member.
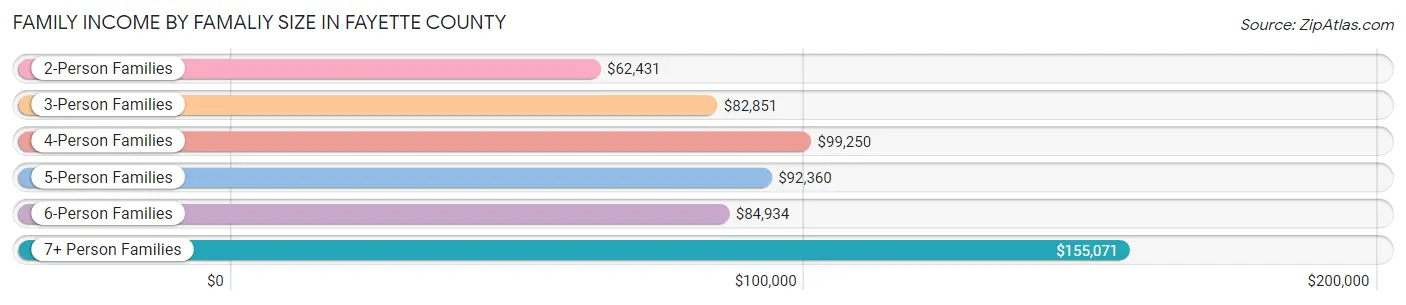
| Income Bracket | # Families | Median Income |
| 2-Person Families | 17,747 (52.4%) | $62,431 |
| 3-Person Families | 7,190 (21.2%) | $82,851 |
| 4-Person Families | 5,760 (17.0%) | $99,250 |
| 5-Person Families | 2,232 (6.6%) | $92,360 |
| 6-Person Families | 571 (1.7%) | $84,934 |
| 7+ Person Families | 348 (1.0%) | $155,071 |
| Total | 33,848 (100.0%) | $73,849 |
Family Income by Number of Earners in Fayette County
The median family income in Fayette County is $73,849, with families comprising 3+ earners (3,352) having the highest median family income of $131,935, while families with no earners (7,682) have the lowest median family income of $35,521, accounting for 9.9% and 22.7% of families, respectively.
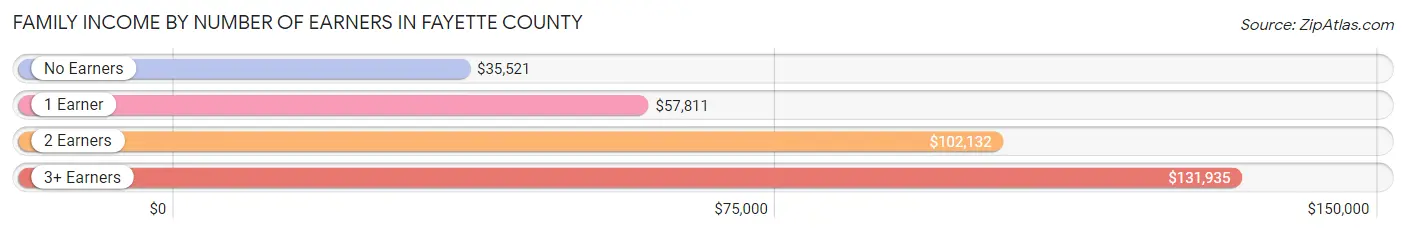
| Number of Earners | # Families | Median Income |
| No Earners | 7,682 (22.7%) | $35,521 |
| 1 Earner | 11,270 (33.3%) | $57,811 |
| 2 Earners | 11,544 (34.1%) | $102,132 |
| 3+ Earners | 3,352 (9.9%) | $131,935 |
| Total | 33,848 (100.0%) | $73,849 |
Household Income in Fayette County
Household Income Brackets in Fayette County
With 9,229 households falling in the category, the $50,000 to $74,999 income range is the most frequent in Fayette County, accounting for 16.8% of all households. In contrast, only 2,197 households (4.0%) fall into the $200,000+ income bracket, making it the least populous group.
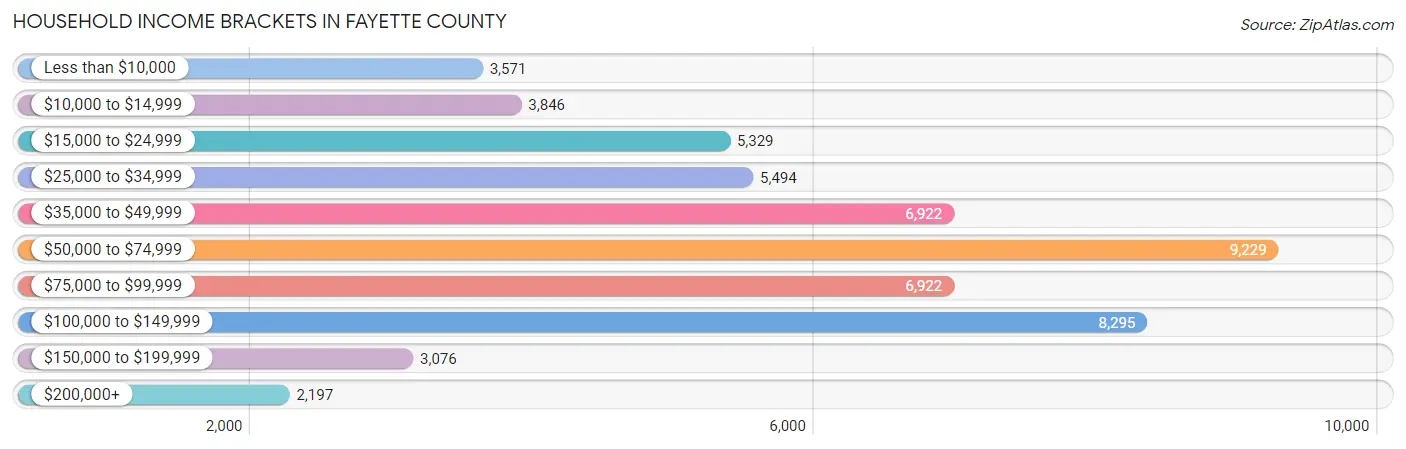
| Income Bracket | # Households | % Households |
| Less than $10,000 | 3,571 | 6.5% |
| $10,000 to $14,999 | 3,846 | 7.0% |
| $15,000 to $24,999 | 5,329 | 9.7% |
| $25,000 to $34,999 | 5,494 | 10.0% |
| $35,000 to $49,999 | 6,922 | 12.6% |
| $50,000 to $74,999 | 9,229 | 16.8% |
| $75,000 to $99,999 | 6,922 | 12.6% |
| $100,000 to $149,999 | 8,295 | 15.1% |
| $150,000 to $199,999 | 3,076 | 5.6% |
| $200,000+ | 2,197 | 4.0% |
Household Income by Householder Age in Fayette County
The median household income in Fayette County is $55,579, with the highest median household income of $74,950 found in the 25 to 44 years age bracket for the primary householder. A total of 14,241 households (25.9%) fall into this category. Meanwhile, the 65+ years age bracket for the primary householder has the lowest median household income of $39,746, with 18,330 households (33.4%) in this group.
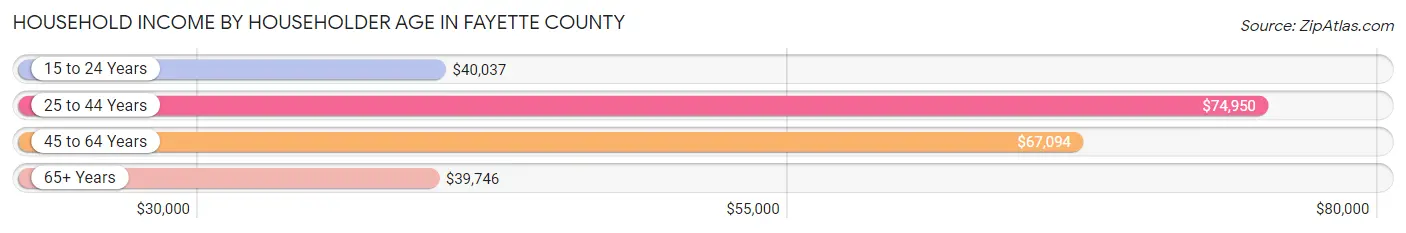
| Income Bracket | # Households | Median Income |
| 15 to 24 Years | 1,453 (2.6%) | $40,037 |
| 25 to 44 Years | 14,241 (25.9%) | $74,950 |
| 45 to 64 Years | 20,913 (38.1%) | $67,094 |
| 65+ Years | 18,330 (33.4%) | $39,746 |
| Total | 54,937 (100.0%) | $55,579 |
Poverty in Fayette County
Income Below Poverty by Sex and Age in Fayette County
With 14.0% poverty level for males and 18.3% for females among the residents of Fayette County, under 5 year old males and 16 and 17 year old females are the most vulnerable to poverty, with 950 males (29.7%) and 389 females (27.4%) in their respective age groups living below the poverty level.
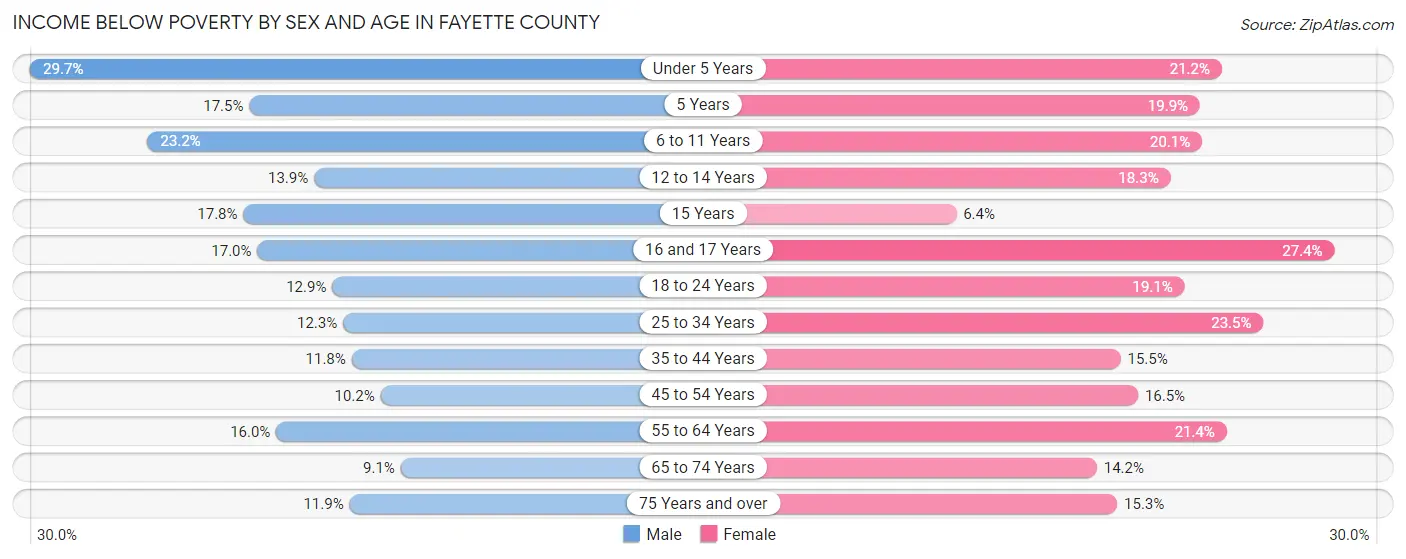
| Age Bracket | Male | Female |
| Under 5 Years | 950 (29.7%) | 599 (21.2%) |
| 5 Years | 120 (17.5%) | 126 (19.9%) |
| 6 to 11 Years | 893 (23.2%) | 758 (20.1%) |
| 12 to 14 Years | 297 (13.9%) | 335 (18.3%) |
| 15 Years | 103 (17.8%) | 50 (6.4%) |
| 16 and 17 Years | 289 (17.0%) | 389 (27.4%) |
| 18 to 24 Years | 615 (12.9%) | 814 (19.1%) |
| 25 to 34 Years | 909 (12.3%) | 1,700 (23.5%) |
| 35 to 44 Years | 823 (11.8%) | 1,094 (15.5%) |
| 45 to 54 Years | 843 (10.2%) | 1,372 (16.5%) |
| 55 to 64 Years | 1,484 (16.0%) | 2,096 (21.4%) |
| 65 to 74 Years | 706 (9.1%) | 1,182 (14.2%) |
| 75 Years and over | 530 (11.9%) | 1,013 (15.3%) |
| Total | 8,562 (14.0%) | 11,528 (18.3%) |
Income Above Poverty by Sex and Age in Fayette County
According to the poverty statistics in Fayette County, males aged 65 to 74 years and females aged 15 years are the age groups that are most secure financially, with 90.9% of males and 93.6% of females in these age groups living above the poverty line.
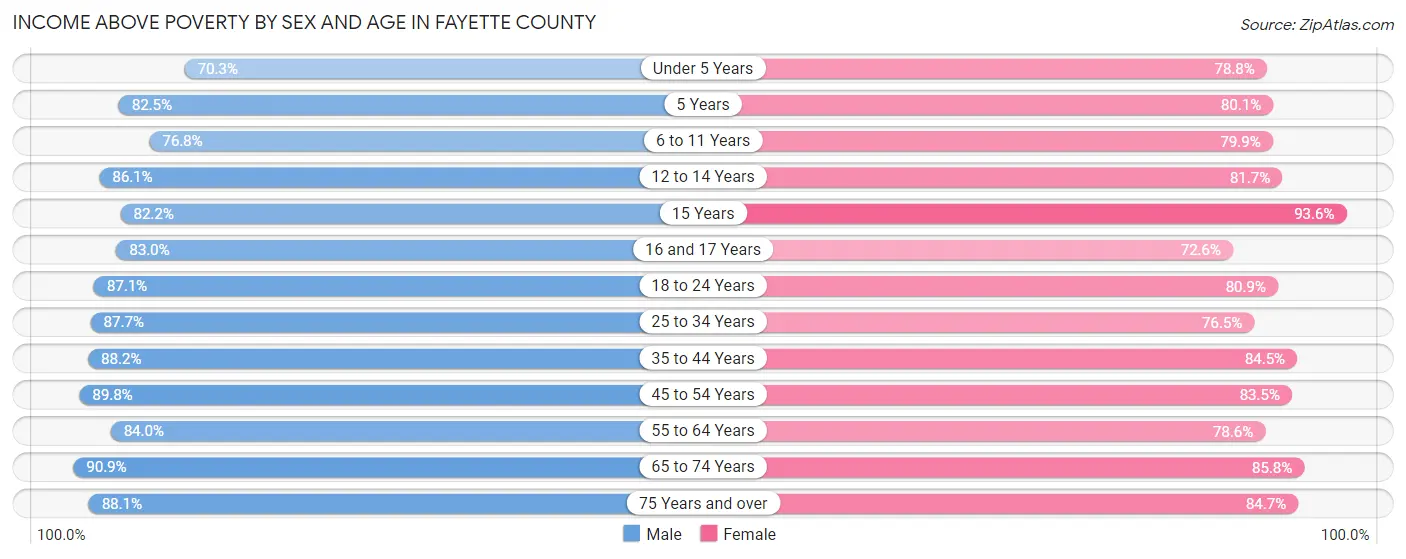
| Age Bracket | Male | Female |
| Under 5 Years | 2,250 (70.3%) | 2,232 (78.8%) |
| 5 Years | 566 (82.5%) | 506 (80.1%) |
| 6 to 11 Years | 2,963 (76.8%) | 3,020 (79.9%) |
| 12 to 14 Years | 1,842 (86.1%) | 1,496 (81.7%) |
| 15 Years | 475 (82.2%) | 735 (93.6%) |
| 16 and 17 Years | 1,407 (83.0%) | 1,029 (72.6%) |
| 18 to 24 Years | 4,164 (87.1%) | 3,449 (80.9%) |
| 25 to 34 Years | 6,498 (87.7%) | 5,542 (76.5%) |
| 35 to 44 Years | 6,159 (88.2%) | 5,957 (84.5%) |
| 45 to 54 Years | 7,438 (89.8%) | 6,947 (83.5%) |
| 55 to 64 Years | 7,799 (84.0%) | 7,684 (78.6%) |
| 65 to 74 Years | 7,089 (90.9%) | 7,144 (85.8%) |
| 75 Years and over | 3,920 (88.1%) | 5,596 (84.7%) |
| Total | 52,570 (86.0%) | 51,337 (81.7%) |
Income Below Poverty Among Married-Couple Families in Fayette County
The poverty statistics for married-couple families in Fayette County show that 5.6% or 1,396 of the total 24,759 families live below the poverty line. Families with 3 or 4 children have the highest poverty rate of 18.4%, comprising of 262 families. On the other hand, families with no children have the lowest poverty rate of 4.5%, which includes 735 families.
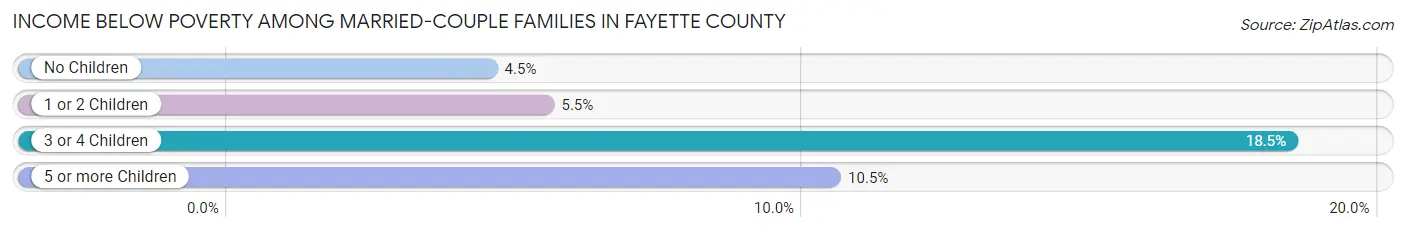
| Children | Above Poverty | Below Poverty |
| No Children | 15,524 (95.5%) | 735 (4.5%) |
| 1 or 2 Children | 6,519 (94.5%) | 380 (5.5%) |
| 3 or 4 Children | 1,158 (81.6%) | 262 (18.4%) |
| 5 or more Children | 162 (89.5%) | 19 (10.5%) |
| Total | 23,363 (94.4%) | 1,396 (5.6%) |
Income Below Poverty Among Single-Parent Households in Fayette County
According to the poverty data in Fayette County, 18.8% or 481 single-father households and 32.2% or 2,102 single-mother households are living below the poverty line. Among single-father households, those with 5 or more children have the highest poverty rate, with 9 households (100.0%) experiencing poverty. Likewise, among single-mother households, those with 3 or 4 children have the highest poverty rate, with 573 households (77.5%) falling below the poverty line.
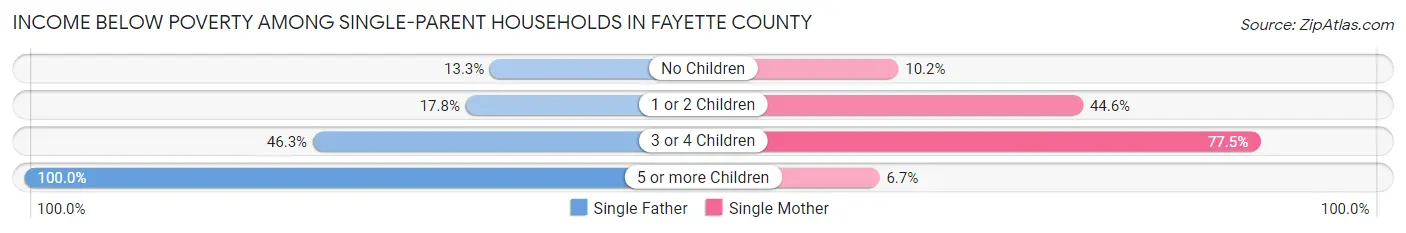
| Children | Single Father | Single Mother |
| No Children | 132 (13.3%) | 309 (10.2%) |
| 1 or 2 Children | 240 (17.8%) | 1,219 (44.6%) |
| 3 or 4 Children | 100 (46.3%) | 573 (77.5%) |
| 5 or more Children | 9 (100.0%) | 1 (6.7%) |
| Total | 481 (18.8%) | 2,102 (32.2%) |
Income Below Poverty Among Married-Couple vs Single-Parent Households in Fayette County
The poverty data for Fayette County shows that 1,396 of the married-couple family households (5.6%) and 2,583 of the single-parent households (28.4%) are living below the poverty level. Within the married-couple family households, those with 3 or 4 children have the highest poverty rate, with 262 households (18.4%) falling below the poverty line. Among the single-parent households, those with 3 or 4 children have the highest poverty rate, with 673 household (70.5%) living below poverty.
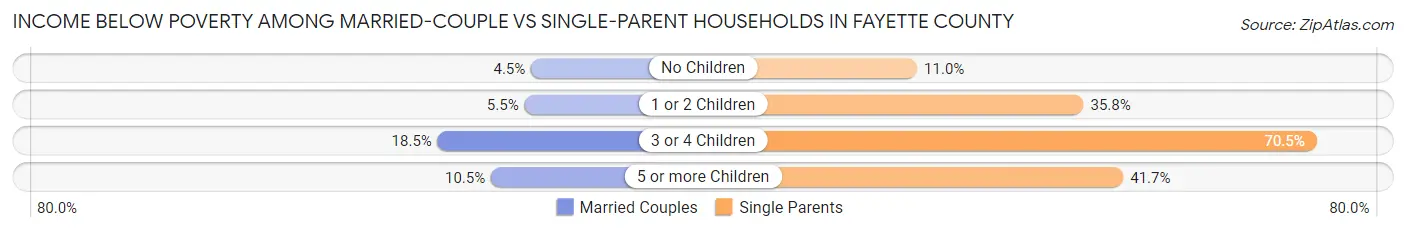
| Children | Married-Couple Families | Single-Parent Households |
| No Children | 735 (4.5%) | 441 (11.0%) |
| 1 or 2 Children | 380 (5.5%) | 1,459 (35.7%) |
| 3 or 4 Children | 262 (18.4%) | 673 (70.5%) |
| 5 or more Children | 19 (10.5%) | 10 (41.7%) |
| Total | 1,396 (5.6%) | 2,583 (28.4%) |
Race in Fayette County
The most populous races in Fayette County are White / Caucasian (116,188 | 90.5%), Black / African American (5,437 | 4.2%), and Two or more Races (5,168 | 4.0%).
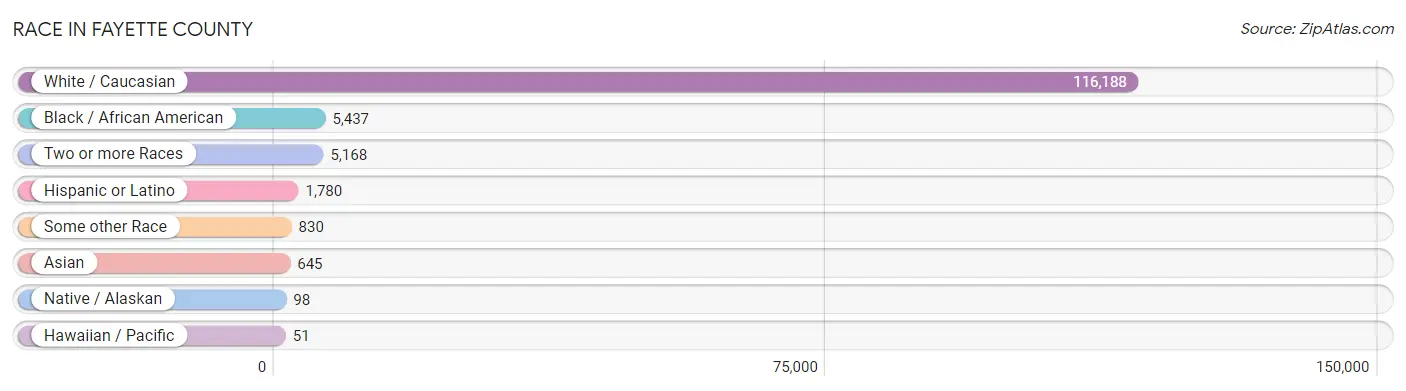
| Race | # Population | % Population |
| Asian | 645 | 0.5% |
| Black / African American | 5,437 | 4.2% |
| Hawaiian / Pacific | 51 | 0.0% |
| Hispanic or Latino | 1,780 | 1.4% |
| Native / Alaskan | 98 | 0.1% |
| White / Caucasian | 116,188 | 90.5% |
| Two or more Races | 5,168 | 4.0% |
| Some other Race | 830 | 0.6% |
| Total | 128,417 | 100.0% |
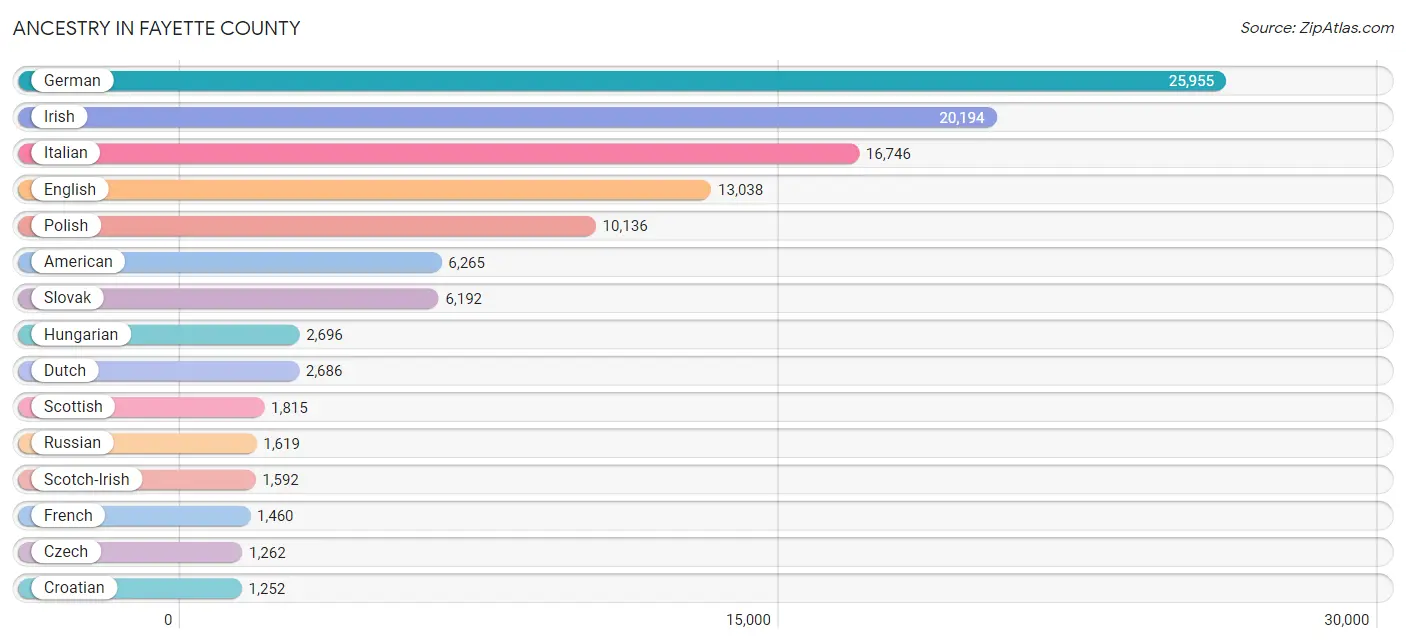
Ancestry in Fayette County
The most populous ancestries reported in Fayette County are German (25,955 | 20.2%), Irish (20,194 | 15.7%), Italian (16,746 | 13.0%), English (13,038 | 10.2%), and Polish (10,136 | 7.9%), together accounting for 67.0% of all Fayette County residents.
| Ancestry | # Population | % Population |
| African | 404 | 0.3% |
| Albanian | 49 | 0.0% |
| American | 6,265 | 4.9% |
| Apache | 38 | 0.0% |
| Arab | 1,159 | 0.9% |
| Arapaho | 5 | 0.0% |
| Australian | 16 | 0.0% |
| Austrian | 161 | 0.1% |
| Bangladeshi | 22 | 0.0% |
| Belgian | 166 | 0.1% |
| Bhutanese | 23 | 0.0% |
| Blackfeet | 69 | 0.1% |
| Brazilian | 9 | 0.0% |
| British | 222 | 0.2% |
| Bulgarian | 4 | 0.0% |
| Burmese | 123 | 0.1% |
| Cambodian | 13 | 0.0% |
| Canadian | 28 | 0.0% |
| Carpatho Rusyn | 75 | 0.1% |
| Celtic | 19 | 0.0% |
| Central American | 80 | 0.1% |
| Central American Indian | 85 | 0.1% |
| Cherokee | 368 | 0.3% |
| Cheyenne | 17 | 0.0% |
| Colombian | 3 | 0.0% |
| Croatian | 1,252 | 1.0% |
| Cuban | 15 | 0.0% |
| Czech | 1,262 | 1.0% |
| Czechoslovakian | 477 | 0.4% |
| Danish | 82 | 0.1% |
| Delaware | 4 | 0.0% |
| Dominican | 16 | 0.0% |
| Dutch | 2,686 | 2.1% |
| Eastern European | 491 | 0.4% |
| Egyptian | 16 | 0.0% |
| English | 13,038 | 10.2% |
| Ethiopian | 59 | 0.1% |
| European | 1,147 | 0.9% |
| Finnish | 99 | 0.1% |
| French | 1,460 | 1.1% |
| French American Indian | 20 | 0.0% |
| French Canadian | 348 | 0.3% |
| German | 25,955 | 20.2% |
| German Russian | 5 | 0.0% |
| Greek | 309 | 0.2% |
| Guamanian / Chamorro | 57 | 0.0% |
| Guatemalan | 26 | 0.0% |
| Haitian | 22 | 0.0% |
| Hungarian | 2,696 | 2.1% |
| Indian (Asian) | 213 | 0.2% |
| Indonesian | 5 | 0.0% |
| Iranian | 75 | 0.1% |
| Irish | 20,194 | 15.7% |
| Italian | 16,746 | 13.0% |
| Jamaican | 158 | 0.1% |
| Japanese | 6 | 0.0% |
| Korean | 275 | 0.2% |
| Laotian | 13 | 0.0% |
| Latvian | 4 | 0.0% |
| Lebanese | 868 | 0.7% |
| Lithuanian | 202 | 0.2% |
| Maltese | 10 | 0.0% |
| Mexican | 711 | 0.5% |
| Mexican American Indian | 6 | 0.0% |
| Moroccan | 93 | 0.1% |
| Native Hawaiian | 51 | 0.0% |
| Navajo | 2 | 0.0% |
| Nigerian | 58 | 0.1% |
| Northern European | 9 | 0.0% |
| Norwegian | 253 | 0.2% |
| Osage | 8 | 0.0% |
| Panamanian | 18 | 0.0% |
| Pennsylvania German | 533 | 0.4% |
| Peruvian | 5 | 0.0% |
| Polish | 10,136 | 7.9% |
| Portuguese | 49 | 0.0% |
| Puerto Rican | 609 | 0.5% |
| Romanian | 31 | 0.0% |
| Russian | 1,619 | 1.3% |
| Salvadoran | 36 | 0.0% |
| Samoan | 11 | 0.0% |
| Scandinavian | 90 | 0.1% |
| Scotch-Irish | 1,592 | 1.2% |
| Scottish | 1,815 | 1.4% |
| Serbian | 131 | 0.1% |
| Shoshone | 2 | 0.0% |
| Sioux | 31 | 0.0% |
| Slavic | 144 | 0.1% |
| Slovak | 6,192 | 4.8% |
| Slovene | 132 | 0.1% |
| South African | 2 | 0.0% |
| South American | 21 | 0.0% |
| Spaniard | 20 | 0.0% |
| Spanish | 64 | 0.1% |
| Subsaharan African | 816 | 0.6% |
| Sudanese | 8 | 0.0% |
| Swedish | 321 | 0.3% |
| Swiss | 275 | 0.2% |
| Syrian | 146 | 0.1% |
| Thai | 469 | 0.4% |
| Trinidadian and Tobagonian | 53 | 0.0% |
| Ukrainian | 233 | 0.2% |
| Venezuelan | 13 | 0.0% |
| Welsh | 673 | 0.5% |
| Yugoslavian | 43 | 0.0% | View All 105 Rows |
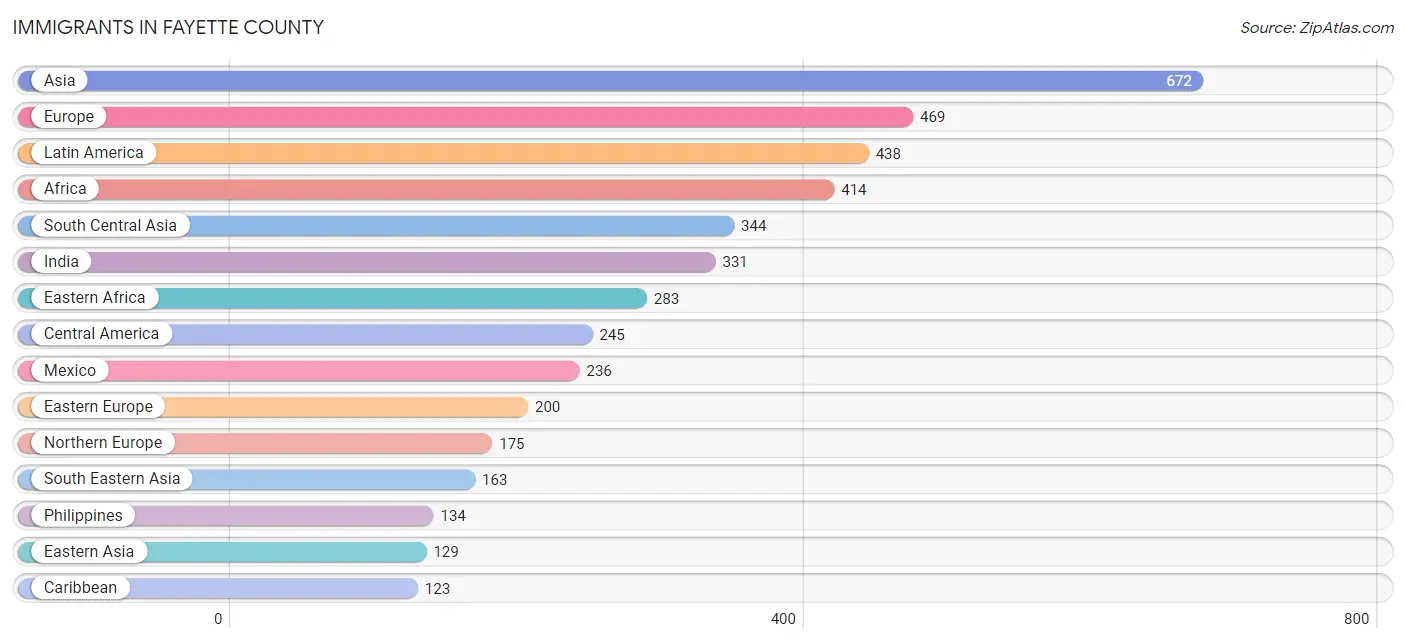
Immigrants in Fayette County
The most numerous immigrant groups reported in Fayette County came from Asia (672 | 0.5%), Europe (469 | 0.4%), Latin America (438 | 0.3%), Africa (414 | 0.3%), and South Central Asia (344 | 0.3%), together accounting for 1.8% of all Fayette County residents.
| Immigration Origin | # Population | % Population |
| Africa | 414 | 0.3% |
| Albania | 19 | 0.0% |
| Asia | 672 | 0.5% |
| Australia | 13 | 0.0% |
| Brazil | 14 | 0.0% |
| Cameroon | 2 | 0.0% |
| Canada | 48 | 0.0% |
| Caribbean | 123 | 0.1% |
| Central America | 245 | 0.2% |
| China | 51 | 0.0% |
| Colombia | 2 | 0.0% |
| Croatia | 41 | 0.0% |
| Cuba | 10 | 0.0% |
| Eastern Africa | 283 | 0.2% |
| Eastern Asia | 129 | 0.1% |
| Eastern Europe | 200 | 0.2% |
| England | 29 | 0.0% |
| Ethiopia | 20 | 0.0% |
| Europe | 469 | 0.4% |
| Germany | 66 | 0.1% |
| Hungary | 29 | 0.0% |
| India | 331 | 0.3% |
| Indonesia | 18 | 0.0% |
| Ireland | 9 | 0.0% |
| Italy | 28 | 0.0% |
| Jamaica | 78 | 0.1% |
| Japan | 8 | 0.0% |
| Jordan | 12 | 0.0% |
| Korea | 70 | 0.1% |
| Laos | 6 | 0.0% |
| Latin America | 438 | 0.3% |
| Latvia | 4 | 0.0% |
| Lebanon | 19 | 0.0% |
| Mexico | 236 | 0.2% |
| Middle Africa | 12 | 0.0% |
| Morocco | 80 | 0.1% |
| Nepal | 13 | 0.0% |
| Nigeria | 14 | 0.0% |
| Northern Africa | 88 | 0.1% |
| Northern Europe | 175 | 0.1% |
| Oceania | 13 | 0.0% |
| Panama | 9 | 0.0% |
| Peru | 30 | 0.0% |
| Philippines | 134 | 0.1% |
| Poland | 16 | 0.0% |
| Russia | 80 | 0.1% |
| South Africa | 17 | 0.0% |
| South America | 70 | 0.1% |
| South Central Asia | 344 | 0.3% |
| South Eastern Asia | 163 | 0.1% |
| Southern Europe | 28 | 0.0% |
| Sudan | 8 | 0.0% |
| Sweden | 50 | 0.0% |
| Taiwan | 9 | 0.0% |
| Thailand | 5 | 0.0% |
| Trinidad and Tobago | 35 | 0.0% |
| Ukraine | 11 | 0.0% |
| Western Africa | 14 | 0.0% |
| Western Asia | 36 | 0.0% |
| Western Europe | 66 | 0.1% |
| Zaire | 10 | 0.0% | View All 61 Rows |
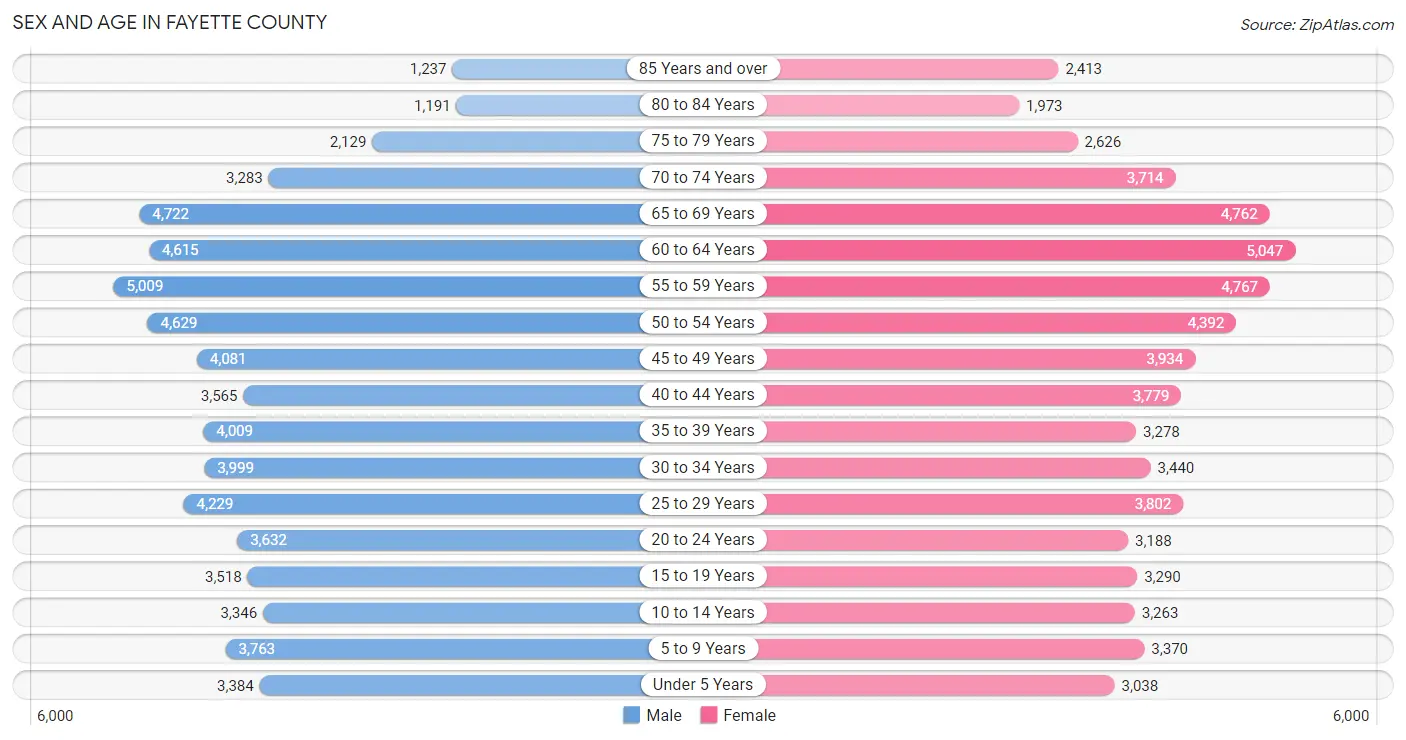
Sex and Age in Fayette County
Sex and Age in Fayette County
The most populous age groups in Fayette County are 55 to 59 Years (5,009 | 7.8%) for men and 60 to 64 Years (5,047 | 7.9%) for women.
| Age Bracket | Male | Female |
| Under 5 Years | 3,384 (5.3%) | 3,038 (4.7%) |
| 5 to 9 Years | 3,763 (5.9%) | 3,370 (5.3%) |
| 10 to 14 Years | 3,346 (5.2%) | 3,263 (5.1%) |
| 15 to 19 Years | 3,518 (5.5%) | 3,290 (5.1%) |
| 20 to 24 Years | 3,632 (5.6%) | 3,188 (5.0%) |
| 25 to 29 Years | 4,229 (6.6%) | 3,802 (5.9%) |
| 30 to 34 Years | 3,999 (6.2%) | 3,440 (5.4%) |
| 35 to 39 Years | 4,009 (6.2%) | 3,278 (5.1%) |
| 40 to 44 Years | 3,565 (5.5%) | 3,779 (5.9%) |
| 45 to 49 Years | 4,081 (6.3%) | 3,934 (6.1%) |
| 50 to 54 Years | 4,629 (7.2%) | 4,392 (6.9%) |
| 55 to 59 Years | 5,009 (7.8%) | 4,767 (7.4%) |
| 60 to 64 Years | 4,615 (7.2%) | 5,047 (7.9%) |
| 65 to 69 Years | 4,722 (7.3%) | 4,762 (7.4%) |
| 70 to 74 Years | 3,283 (5.1%) | 3,714 (5.8%) |
| 75 to 79 Years | 2,129 (3.3%) | 2,626 (4.1%) |
| 80 to 84 Years | 1,191 (1.8%) | 1,973 (3.1%) |
| 85 Years and over | 1,237 (1.9%) | 2,413 (3.8%) |
| Total | 64,341 (100.0%) | 64,076 (100.0%) |
Families and Households in Fayette County
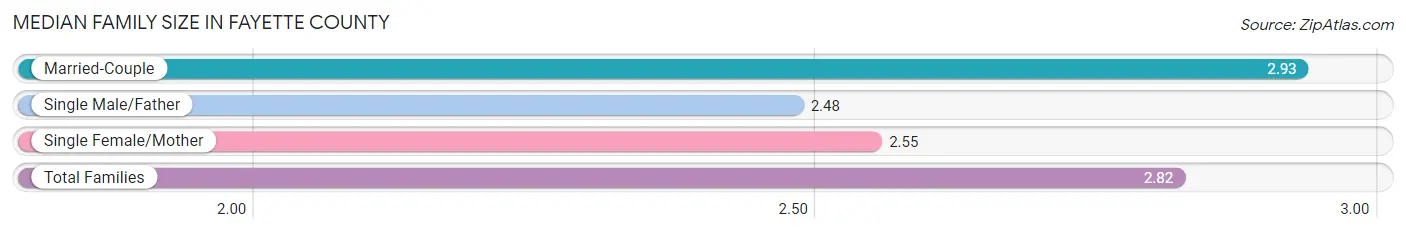
Median Family Size in Fayette County
The median family size in Fayette County is 2.82 persons per family, with married-couple families (24,759 | 73.2%) accounting for the largest median family size of 2.93 persons per family. On the other hand, single male/father families (2,564 | 7.6%) represent the smallest median family size with 2.48 persons per family.
| Family Type | # Families | Family Size |
| Married-Couple | 24,759 (73.2%) | 2.93 |
| Single Male/Father | 2,564 (7.6%) | 2.48 |
| Single Female/Mother | 6,525 (19.3%) | 2.55 |
| Total Families | 33,848 (100.0%) | 2.82 |
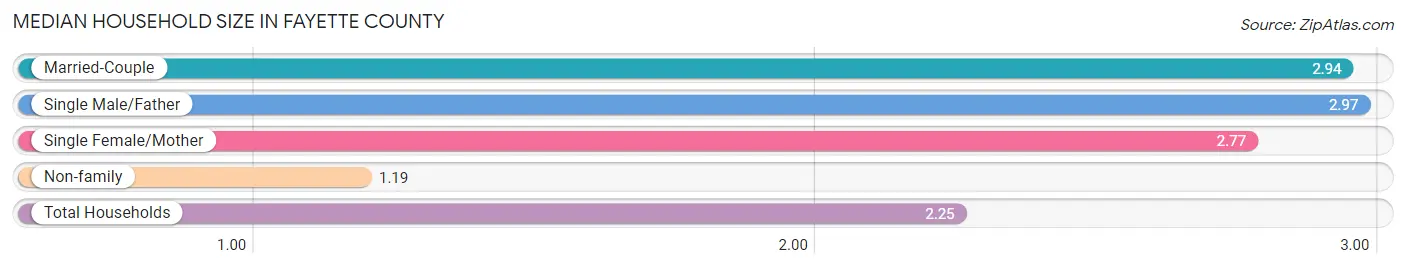
Median Household Size in Fayette County
The median household size in Fayette County is 2.25 persons per household, with single male/father households (2,564 | 4.7%) accounting for the largest median household size of 2.97 persons per household. non-family households (21,089 | 38.4%) represent the smallest median household size with 1.19 persons per household.
| Household Type | # Households | Household Size |
| Married-Couple | 24,759 (45.1%) | 2.94 |
| Single Male/Father | 2,564 (4.7%) | 2.97 |
| Single Female/Mother | 6,525 (11.9%) | 2.77 |
| Non-family | 21,089 (38.4%) | 1.19 |
| Total Households | 54,937 (100.0%) | 2.25 |
Household Size by Marriage Status in Fayette County
Out of a total of 54,937 households in Fayette County, 33,848 (61.6%) are family households, while 21,089 (38.4%) are nonfamily households. The most numerous type of family households are 2-person households, comprising 16,435, and the most common type of nonfamily households are 1-person households, comprising 17,509.
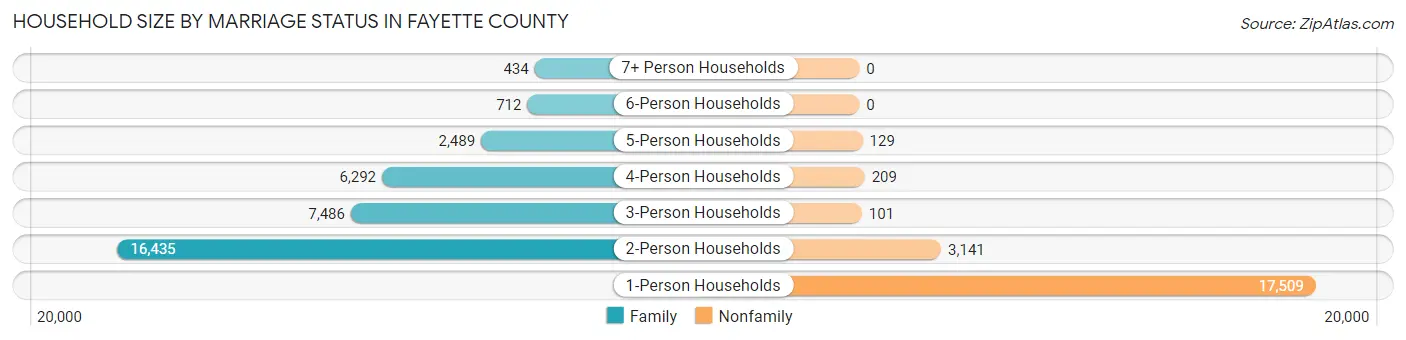
| Household Size | Family Households | Nonfamily Households |
| 1-Person Households | - | 17,509 (31.9%) |
| 2-Person Households | 16,435 (29.9%) | 3,141 (5.7%) |
| 3-Person Households | 7,486 (13.6%) | 101 (0.2%) |
| 4-Person Households | 6,292 (11.5%) | 209 (0.4%) |
| 5-Person Households | 2,489 (4.5%) | 129 (0.2%) |
| 6-Person Households | 712 (1.3%) | 0 (0.0%) |
| 7+ Person Households | 434 (0.8%) | 0 (0.0%) |
| Total | 33,848 (61.6%) | 21,089 (38.4%) |
Female Fertility in Fayette County
Fertility by Age in Fayette County
Average fertility rate in Fayette County is 49.0 births per 1,000 women. Women in the age bracket of 20 to 34 years have the highest fertility rate with 102.0 births per 1,000 women. Women in the age bracket of 20 to 34 years acount for 85.2% of all women with births.
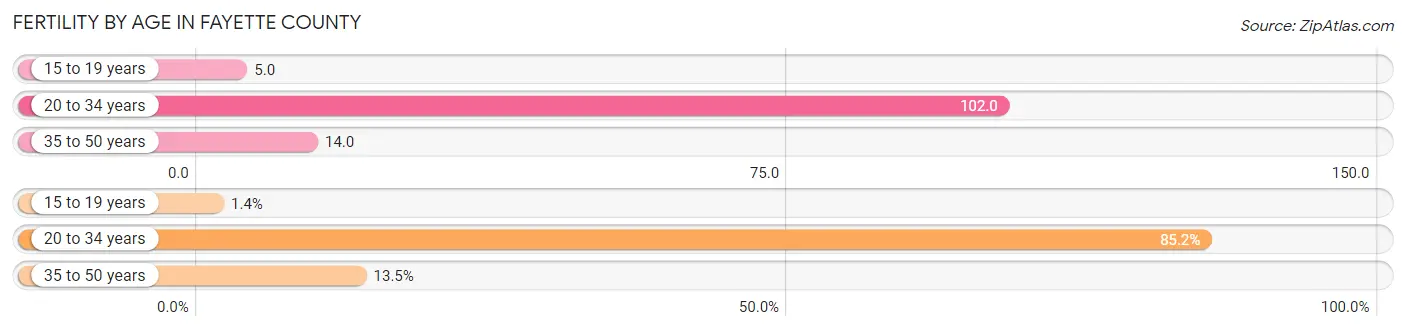
| Age Bracket | Women with Births | Births / 1,000 Women |
| 15 to 19 years | 17 (1.4%) | 5.0 |
| 20 to 34 years | 1,064 (85.2%) | 102.0 |
| 35 to 50 years | 168 (13.5%) | 14.0 |
| Total | 1,249 (100.0%) | 49.0 |
Fertility by Age by Marriage Status in Fayette County
61.2% of women with births (1,249) in Fayette County are married. The highest percentage of unmarried women with births falls into 15 to 19 years age bracket with 100.0% of them unmarried at the time of birth, while the lowest percentage of unmarried women with births belong to 35 to 50 years age bracket with 10.7% of them unmarried.
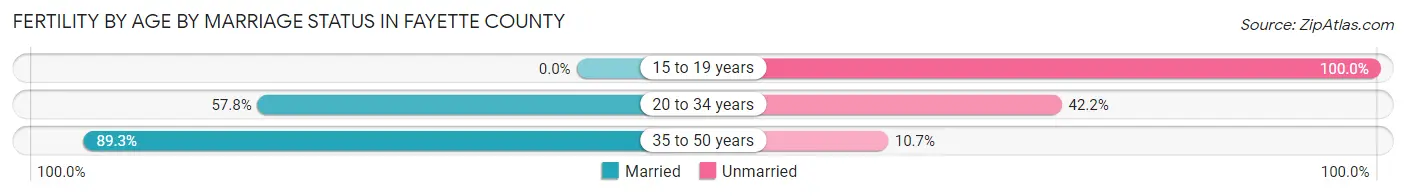
| Age Bracket | Married | Unmarried |
| 15 to 19 years | 0 (0.0%) | 17 (100.0%) |
| 20 to 34 years | 615 (57.8%) | 449 (42.2%) |
| 35 to 50 years | 150 (89.3%) | 18 (10.7%) |
| Total | 764 (61.2%) | 485 (38.8%) |
Fertility by Education in Fayette County
Average fertility rate in Fayette County is 49.0 births per 1,000 women. Women with the education attainment of bachelor's degree have the highest fertility rate of 66.0 births per 1,000 women, while women with the education attainment of graduate degree have the lowest fertility at 13.0 births per 1,000 women. Women with the education attainment of high school diploma represent 39.4% of all women with births.
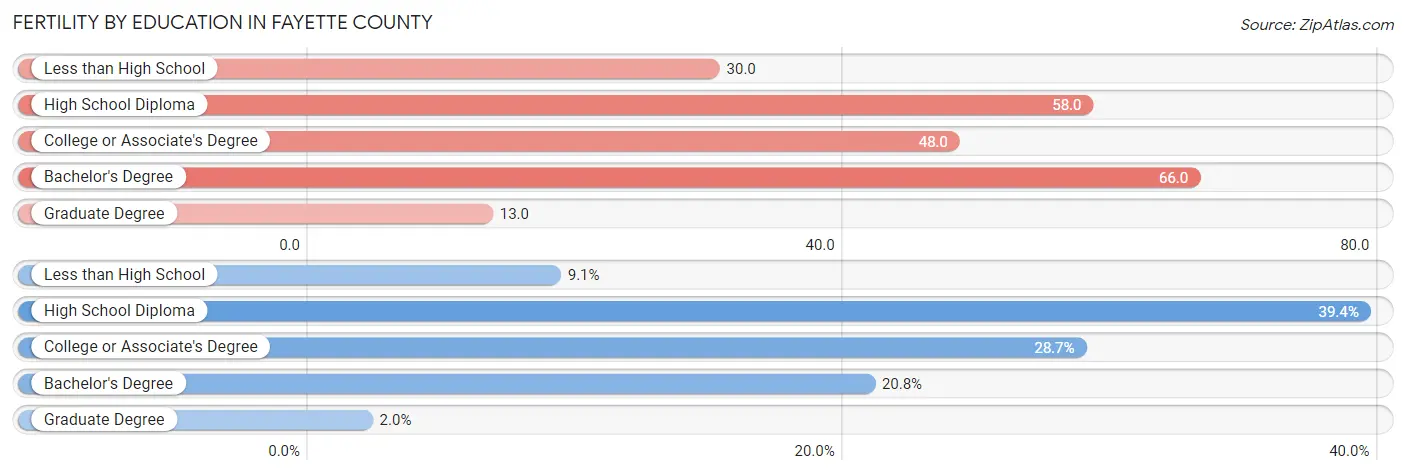
| Educational Attainment | Women with Births | Births / 1,000 Women |
| Less than High School | 113 (9.0%) | 30.0 |
| High School Diploma | 492 (39.4%) | 58.0 |
| College or Associate's Degree | 359 (28.7%) | 48.0 |
| Bachelor's Degree | 260 (20.8%) | 66.0 |
| Graduate Degree | 25 (2.0%) | 13.0 |
| Total | 1,249 (100.0%) | 49.0 |
Fertility by Education by Marriage Status in Fayette County
38.8% of women with births in Fayette County are unmarried. Women with the educational attainment of graduate degree are most likely to be married with 100.0% of them married at childbirth, while women with the educational attainment of high school diploma are least likely to be married with 63.6% of them unmarried at childbirth.
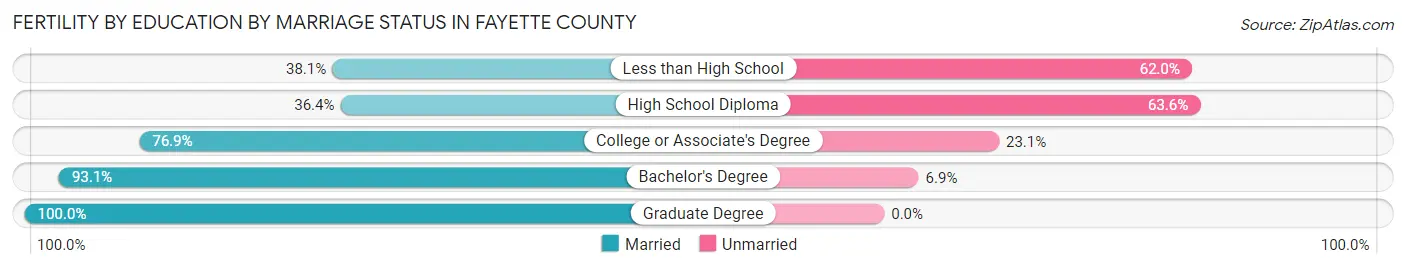
| Educational Attainment | Married | Unmarried |
| Less than High School | 43 (38.1%) | 70 (62.0%) |
| High School Diploma | 179 (36.4%) | 313 (63.6%) |
| College or Associate's Degree | 276 (76.9%) | 83 (23.1%) |
| Bachelor's Degree | 242 (93.1%) | 18 (6.9%) |
| Graduate Degree | 25 (100.0%) | 0 (0.0%) |
| Total | 764 (61.2%) | 485 (38.8%) |
Employment Characteristics in Fayette County
Employment by Class of Employer in Fayette County
Among the 53,239 employed individuals in Fayette County, private company employees (37,286 | 70.0%), not-for-profit organizations (5,460 | 10.3%), and local government employees (3,144 | 5.9%) make up the most common classes of employment.
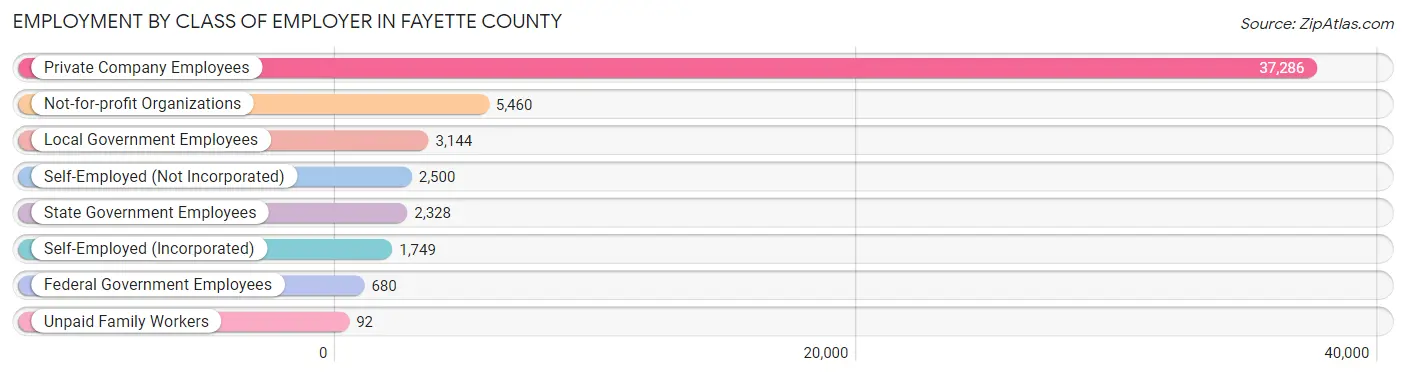
| Employer Class | # Employees | % Employees |
| Private Company Employees | 37,286 | 70.0% |
| Self-Employed (Incorporated) | 1,749 | 3.3% |
| Self-Employed (Not Incorporated) | 2,500 | 4.7% |
| Not-for-profit Organizations | 5,460 | 10.3% |
| Local Government Employees | 3,144 | 5.9% |
| State Government Employees | 2,328 | 4.4% |
| Federal Government Employees | 680 | 1.3% |
| Unpaid Family Workers | 92 | 0.2% |
| Total | 53,239 | 100.0% |
Employment Status by Age in Fayette County
According to the labor force statistics for Fayette County, out of the total population over 16 years of age (106,890), 54.8% or 58,576 individuals are in the labor force, with 7.2% or 4,217 of them unemployed. The age group with the highest labor force participation rate is 25 to 29 years, with 79.0% or 6,344 individuals in the labor force. Within the labor force, the 16 to 19 years age range has the highest percentage of unemployed individuals, with 19.8% or 502 of them being unemployed.
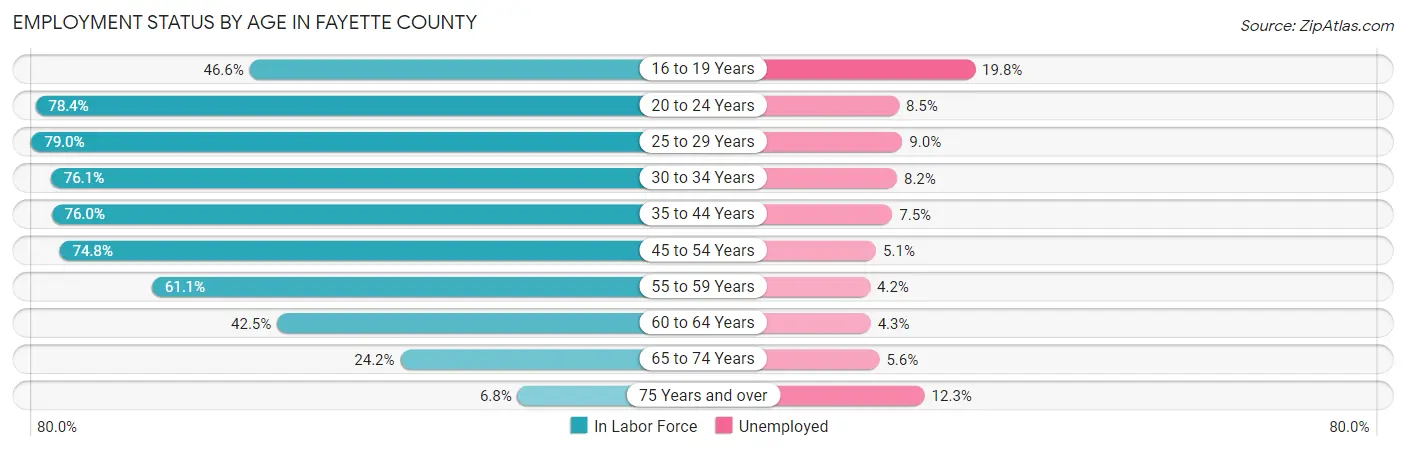
| Age Bracket | In Labor Force | Unemployed |
| 16 to 19 Years | 2,537 (46.6%) | 502 (19.8%) |
| 20 to 24 Years | 5,347 (78.4%) | 454 (8.5%) |
| 25 to 29 Years | 6,344 (79.0%) | 571 (9.0%) |
| 30 to 34 Years | 5,661 (76.1%) | 464 (8.2%) |
| 35 to 44 Years | 11,120 (76.0%) | 834 (7.5%) |
| 45 to 54 Years | 12,743 (74.8%) | 650 (5.1%) |
| 55 to 59 Years | 5,973 (61.1%) | 251 (4.2%) |
| 60 to 64 Years | 4,106 (42.5%) | 177 (4.3%) |
| 65 to 74 Years | 3,988 (24.2%) | 223 (5.6%) |
| 75 Years and over | 787 (6.8%) | 97 (12.3%) |
| Total | 58,576 (54.8%) | 4,217 (7.2%) |
Employment Status by Educational Attainment in Fayette County
According to labor force statistics for Fayette County, 69.0% of individuals (45,937) out of the total population between 25 and 64 years of age (66,575) are in the labor force, with 6.4% or 2,940 of them being unemployed. The group with the highest labor force participation rate are those with the educational attainment of bachelor's degree or higher, with 85.3% or 11,521 individuals in the labor force. Within the labor force, individuals with less than high school education have the highest percentage of unemployment, with 15.0% or 350 of them being unemployed.
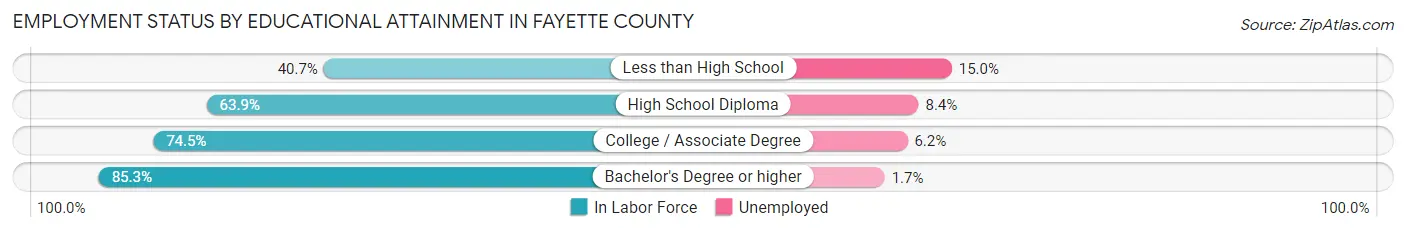
| Educational Attainment | In Labor Force | Unemployed |
| Less than High School | 2,336 (40.7%) | 861 (15.0%) |
| High School Diploma | 19,048 (63.9%) | 2,504 (8.4%) |
| College / Associate Degree | 13,053 (74.5%) | 1,086 (6.2%) |
| Bachelor's Degree or higher | 11,521 (85.3%) | 230 (1.7%) |
| Total | 45,937 (69.0%) | 4,261 (6.4%) |
Employment Occupations by Sex in Fayette County
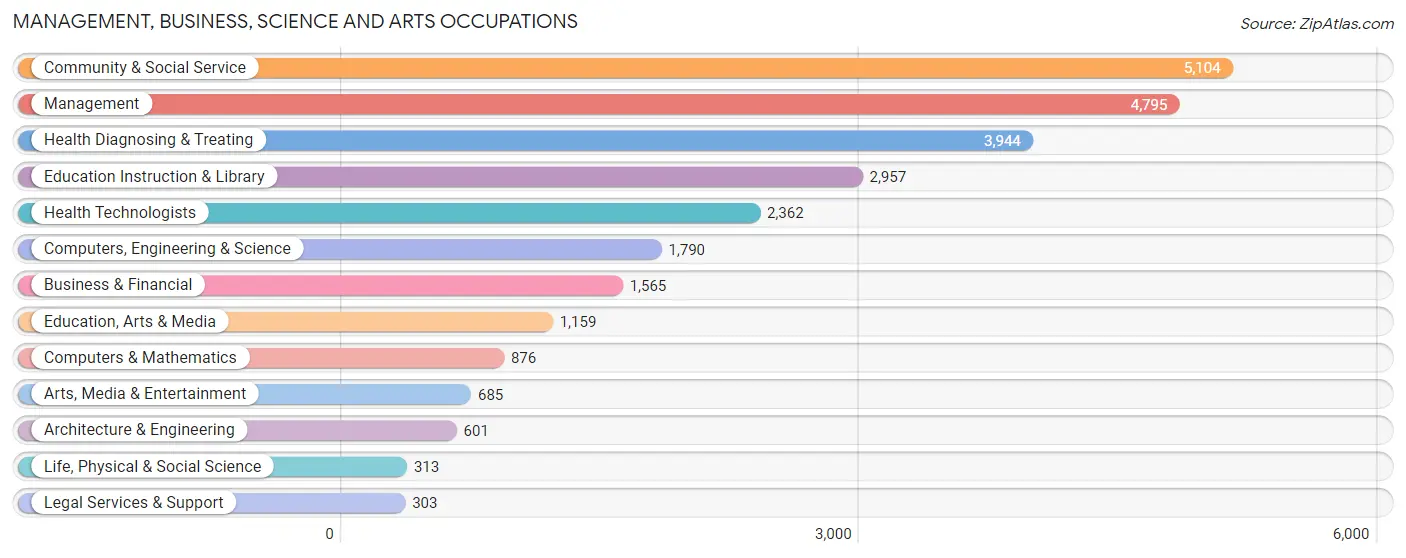
Management, Business, Science and Arts Occupations
The most common Management, Business, Science and Arts occupations in Fayette County are Community & Social Service (5,104 | 9.4%), Management (4,795 | 8.8%), Health Diagnosing & Treating (3,944 | 7.2%), Education Instruction & Library (2,957 | 5.4%), and Health Technologists (2,362 | 4.3%).
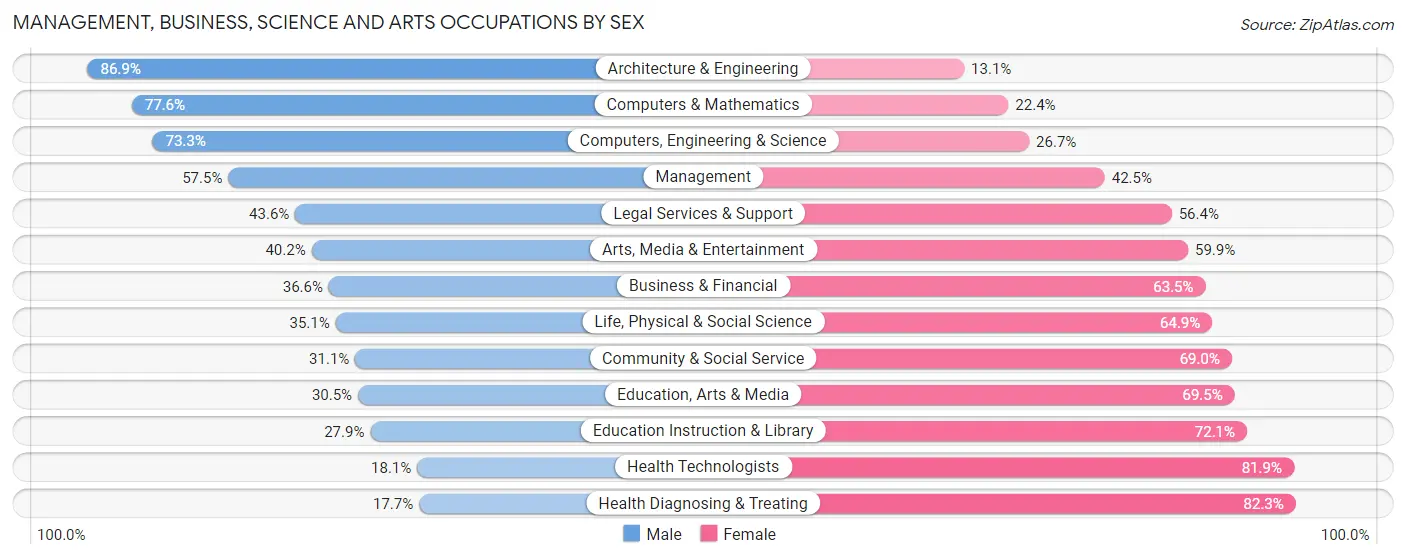
Management, Business, Science and Arts Occupations by Sex
Within the Management, Business, Science and Arts occupations in Fayette County, the most male-oriented occupations are Architecture & Engineering (86.9%), Computers & Mathematics (77.6%), and Computers, Engineering & Science (73.3%), while the most female-oriented occupations are Health Diagnosing & Treating (82.3%), Health Technologists (81.9%), and Education Instruction & Library (72.1%).
| Occupation | Male | Female |
| Management | 2,758 (57.5%) | 2,037 (42.5%) |
| Business & Financial | 572 (36.5%) | 993 (63.4%) |
| Computers, Engineering & Science | 1,312 (73.3%) | 478 (26.7%) |
| Computers & Mathematics | 680 (77.6%) | 196 (22.4%) |
| Architecture & Engineering | 522 (86.9%) | 79 (13.1%) |
| Life, Physical & Social Science | 110 (35.1%) | 203 (64.9%) |
| Community & Social Service | 1,585 (31.0%) | 3,519 (69.0%) |
| Education, Arts & Media | 353 (30.5%) | 806 (69.5%) |
| Legal Services & Support | 132 (43.6%) | 171 (56.4%) |
| Education Instruction & Library | 825 (27.9%) | 2,132 (72.1%) |
| Arts, Media & Entertainment | 275 (40.2%) | 410 (59.9%) |
| Health Diagnosing & Treating | 699 (17.7%) | 3,245 (82.3%) |
| Health Technologists | 428 (18.1%) | 1,934 (81.9%) |
| Total (Category) | 6,926 (40.3%) | 10,272 (59.7%) |
| Total (Overall) | 28,753 (52.9%) | 25,610 (47.1%) |
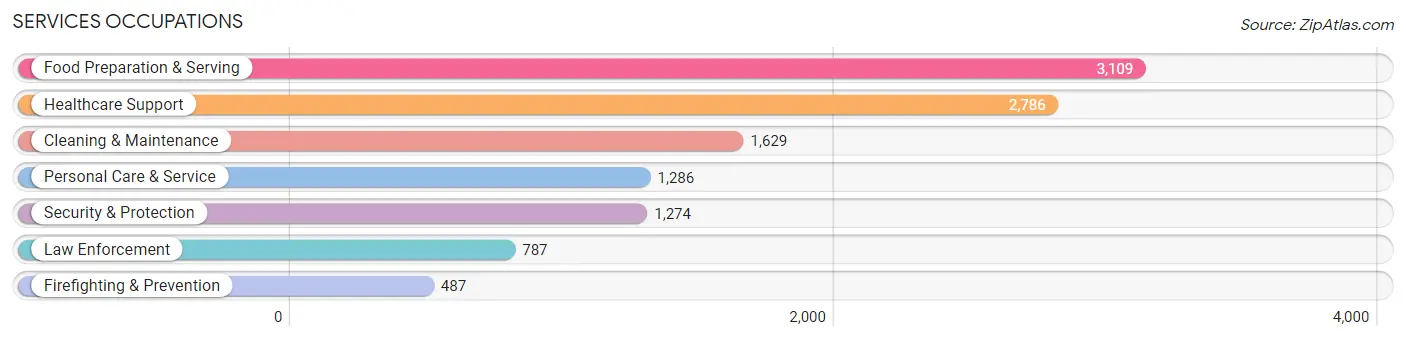
Services Occupations
The most common Services occupations in Fayette County are Food Preparation & Serving (3,109 | 5.7%), Healthcare Support (2,786 | 5.1%), Cleaning & Maintenance (1,629 | 3.0%), Personal Care & Service (1,286 | 2.4%), and Security & Protection (1,274 | 2.3%).
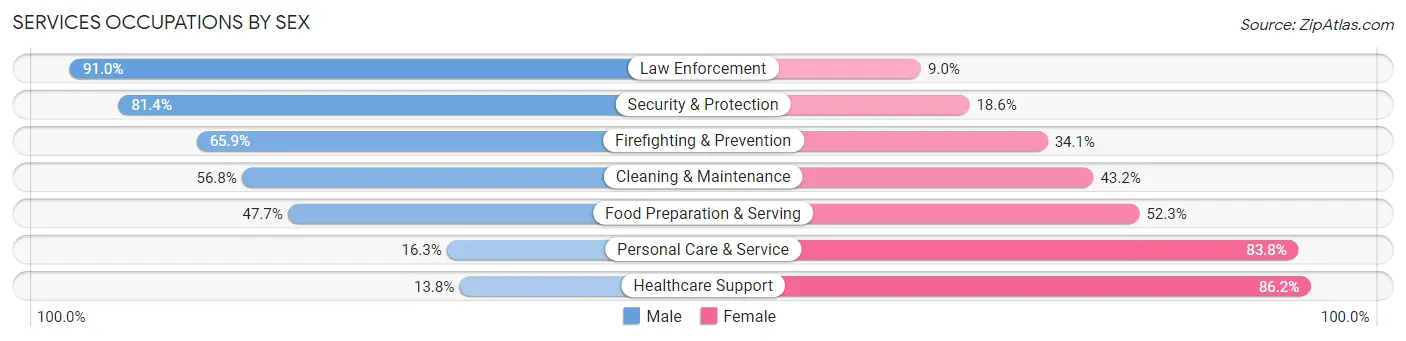
Services Occupations by Sex
Within the Services occupations in Fayette County, the most male-oriented occupations are Law Enforcement (91.0%), Security & Protection (81.4%), and Firefighting & Prevention (65.9%), while the most female-oriented occupations are Healthcare Support (86.2%), Personal Care & Service (83.8%), and Food Preparation & Serving (52.3%).
| Occupation | Male | Female |
| Healthcare Support | 384 (13.8%) | 2,402 (86.2%) |
| Security & Protection | 1,037 (81.4%) | 237 (18.6%) |
| Firefighting & Prevention | 321 (65.9%) | 166 (34.1%) |
| Law Enforcement | 716 (91.0%) | 71 (9.0%) |
| Food Preparation & Serving | 1,484 (47.7%) | 1,625 (52.3%) |
| Cleaning & Maintenance | 926 (56.8%) | 703 (43.2%) |
| Personal Care & Service | 209 (16.3%) | 1,077 (83.8%) |
| Total (Category) | 4,040 (40.1%) | 6,044 (59.9%) |
| Total (Overall) | 28,753 (52.9%) | 25,610 (47.1%) |
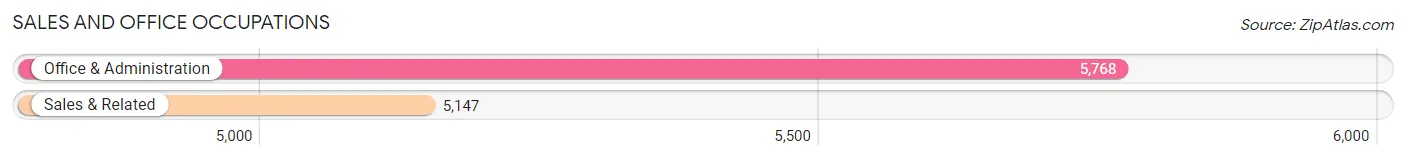
Sales and Office Occupations
The most common Sales and Office occupations in Fayette County are Office & Administration (5,768 | 10.6%), and Sales & Related (5,147 | 9.5%).
Sales and Office Occupations by Sex
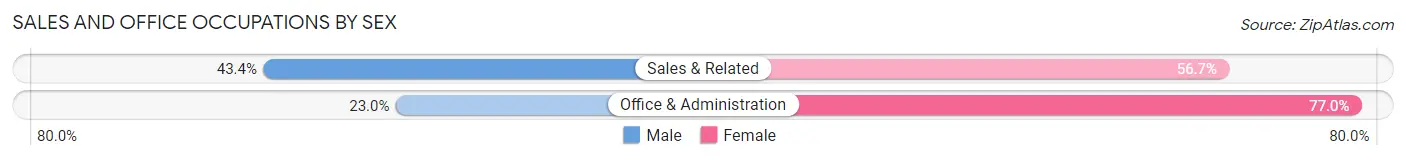
| Occupation | Male | Female |
| Sales & Related | 2,231 (43.3%) | 2,916 (56.7%) |
| Office & Administration | 1,325 (23.0%) | 4,443 (77.0%) |
| Total (Category) | 3,556 (32.6%) | 7,359 (67.4%) |
| Total (Overall) | 28,753 (52.9%) | 25,610 (47.1%) |
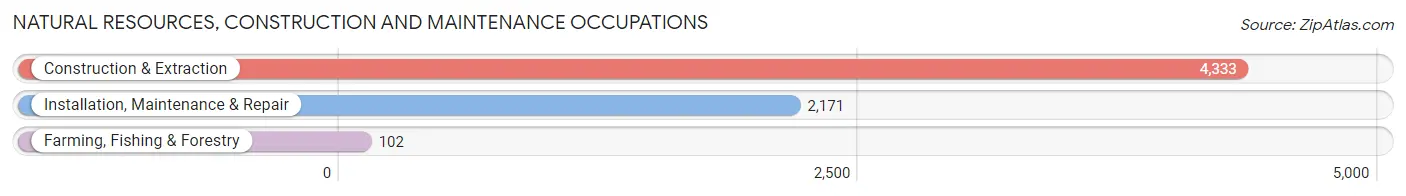
Natural Resources, Construction and Maintenance Occupations
The most common Natural Resources, Construction and Maintenance occupations in Fayette County are Construction & Extraction (4,333 | 8.0%), Installation, Maintenance & Repair (2,171 | 4.0%), and Farming, Fishing & Forestry (102 | 0.2%).
Natural Resources, Construction and Maintenance Occupations by Sex
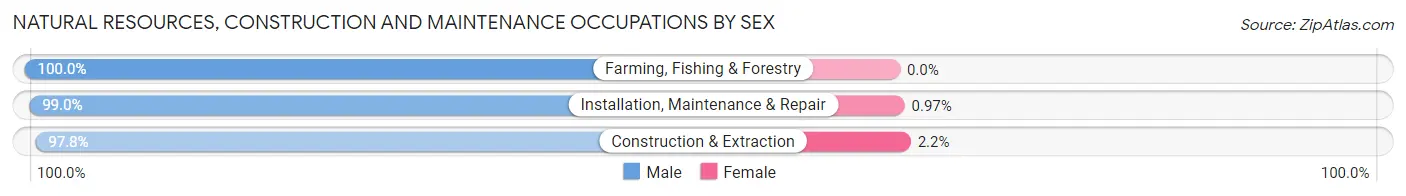
| Occupation | Male | Female |
| Farming, Fishing & Forestry | 102 (100.0%) | 0 (0.0%) |
| Construction & Extraction | 4,236 (97.8%) | 97 (2.2%) |
| Installation, Maintenance & Repair | 2,150 (99.0%) | 21 (1.0%) |
| Total (Category) | 6,488 (98.2%) | 118 (1.8%) |
| Total (Overall) | 28,753 (52.9%) | 25,610 (47.1%) |
Production, Transportation and Moving Occupations
The most common Production, Transportation and Moving occupations in Fayette County are Transportation (3,707 | 6.8%), Production (3,078 | 5.7%), and Material Moving (2,775 | 5.1%).
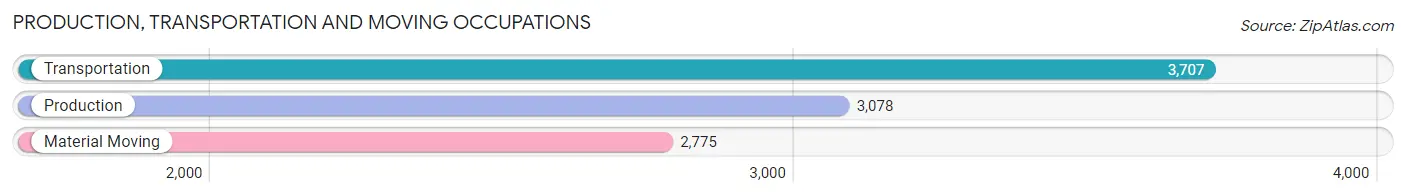
Production, Transportation and Moving Occupations by Sex
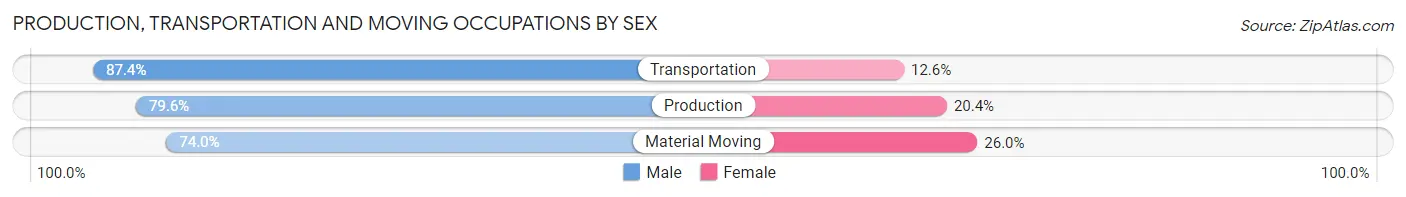
| Occupation | Male | Female |
| Production | 2,449 (79.6%) | 629 (20.4%) |
| Transportation | 3,241 (87.4%) | 466 (12.6%) |
| Material Moving | 2,053 (74.0%) | 722 (26.0%) |
| Total (Category) | 7,743 (81.0%) | 1,817 (19.0%) |
| Total (Overall) | 28,753 (52.9%) | 25,610 (47.1%) |
Employment Industries by Sex in Fayette County
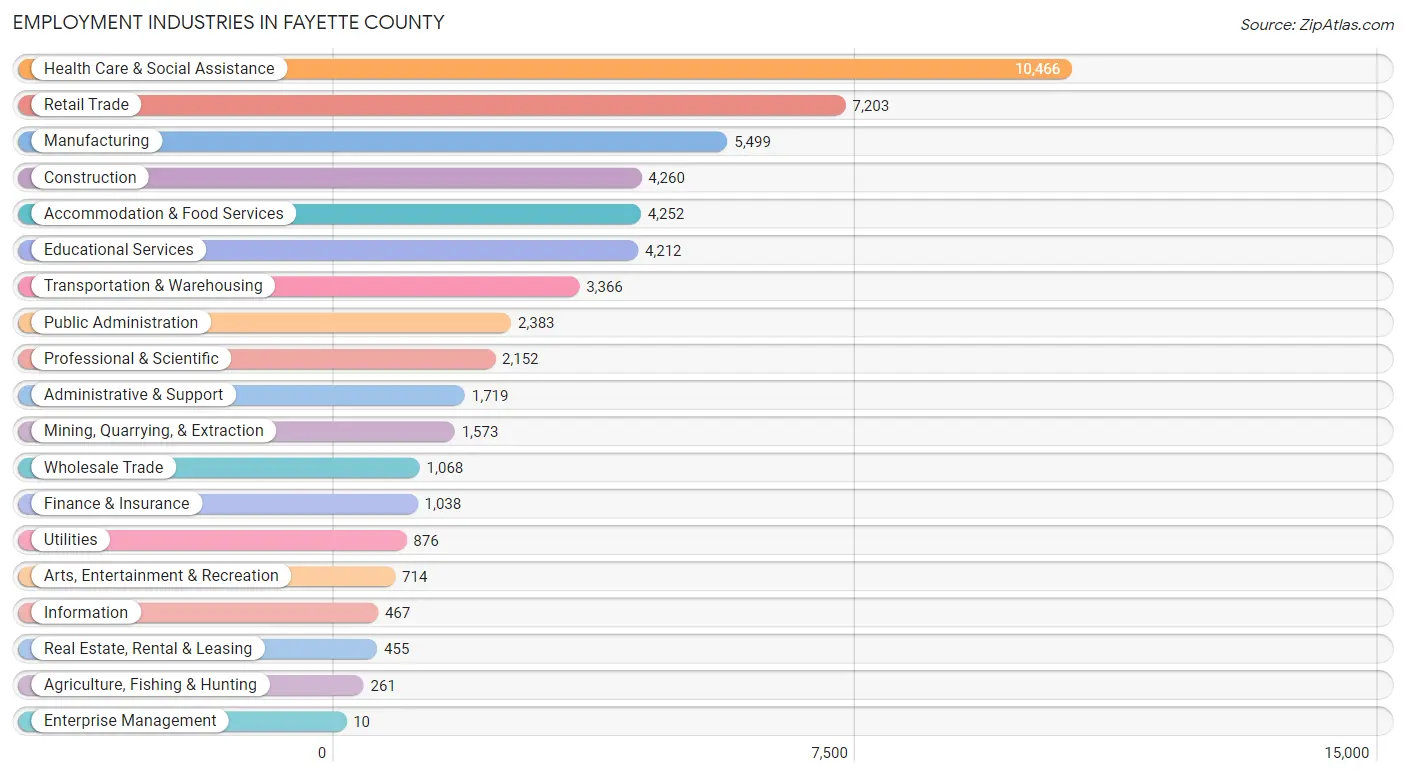
Employment Industries in Fayette County
The major employment industries in Fayette County include Health Care & Social Assistance (10,466 | 19.3%), Retail Trade (7,203 | 13.3%), Manufacturing (5,499 | 10.1%), Construction (4,260 | 7.8%), and Accommodation & Food Services (4,252 | 7.8%).
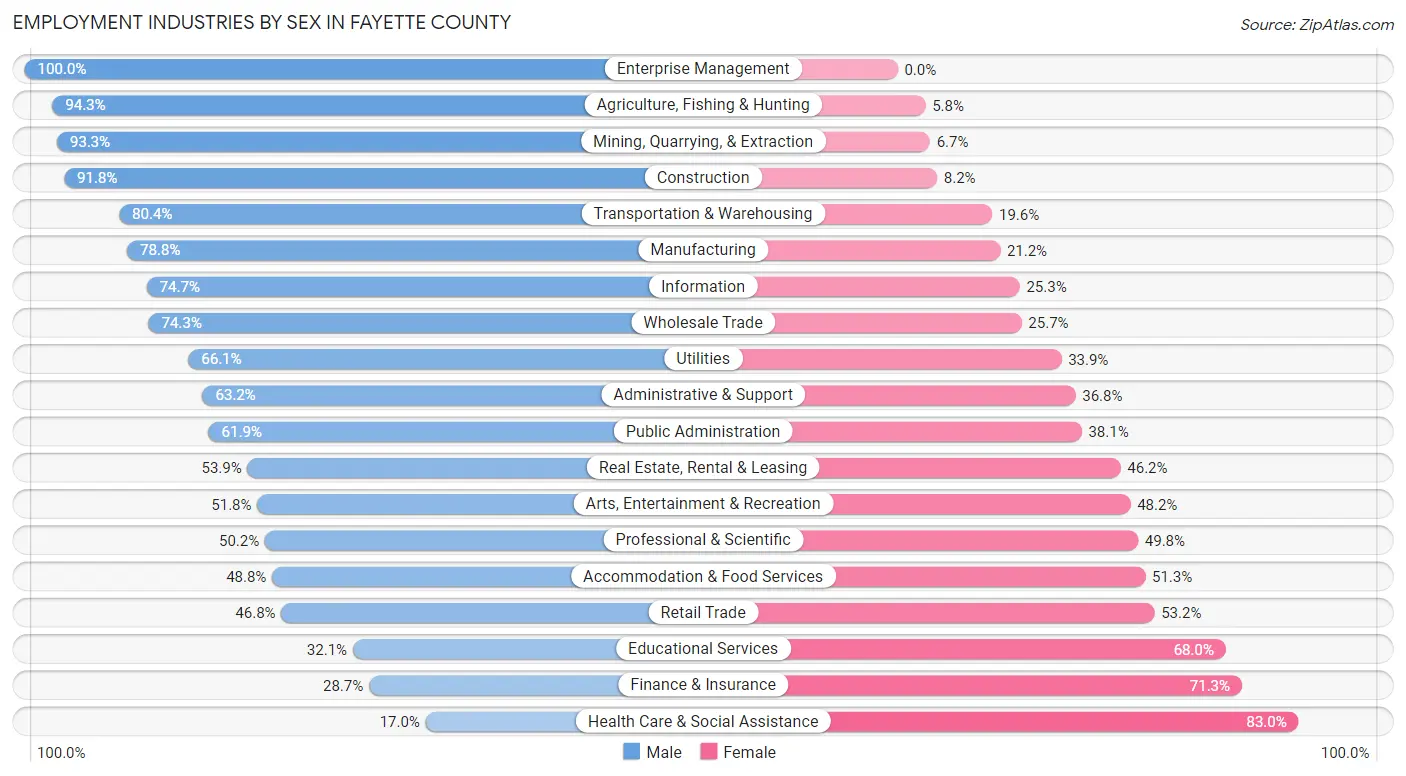
Employment Industries by Sex in Fayette County
The Fayette County industries that see more men than women are Enterprise Management (100.0%), Agriculture, Fishing & Hunting (94.3%), and Mining, Quarrying, & Extraction (93.3%), whereas the industries that tend to have a higher number of women are Health Care & Social Assistance (83.0%), Finance & Insurance (71.3%), and Educational Services (67.9%).
| Industry | Male | Female |
| Agriculture, Fishing & Hunting | 246 (94.3%) | 15 (5.8%) |
| Mining, Quarrying, & Extraction | 1,468 (93.3%) | 105 (6.7%) |
| Construction | 3,912 (91.8%) | 348 (8.2%) |
| Manufacturing | 4,332 (78.8%) | 1,167 (21.2%) |
| Wholesale Trade | 794 (74.3%) | 274 (25.7%) |
| Retail Trade | 3,374 (46.8%) | 3,829 (53.2%) |
| Transportation & Warehousing | 2,707 (80.4%) | 659 (19.6%) |
| Utilities | 579 (66.1%) | 297 (33.9%) |
| Information | 349 (74.7%) | 118 (25.3%) |
| Finance & Insurance | 298 (28.7%) | 740 (71.3%) |
| Real Estate, Rental & Leasing | 245 (53.8%) | 210 (46.2%) |
| Professional & Scientific | 1,081 (50.2%) | 1,071 (49.8%) |
| Enterprise Management | 10 (100.0%) | 0 (0.0%) |
| Administrative & Support | 1,086 (63.2%) | 633 (36.8%) |
| Educational Services | 1,350 (32.1%) | 2,862 (67.9%) |
| Health Care & Social Assistance | 1,777 (17.0%) | 8,689 (83.0%) |
| Arts, Entertainment & Recreation | 370 (51.8%) | 344 (48.2%) |
| Accommodation & Food Services | 2,073 (48.7%) | 2,179 (51.2%) |
| Public Administration | 1,475 (61.9%) | 908 (38.1%) |
| Total | 28,753 (52.9%) | 25,610 (47.1%) |
Education in Fayette County
School Enrollment in Fayette County
The most common levels of schooling among the 23,575 students in Fayette County are high school (5,708 | 24.2%), elementary school (5,667 | 24.0%), and middle school (5,225 | 22.2%).
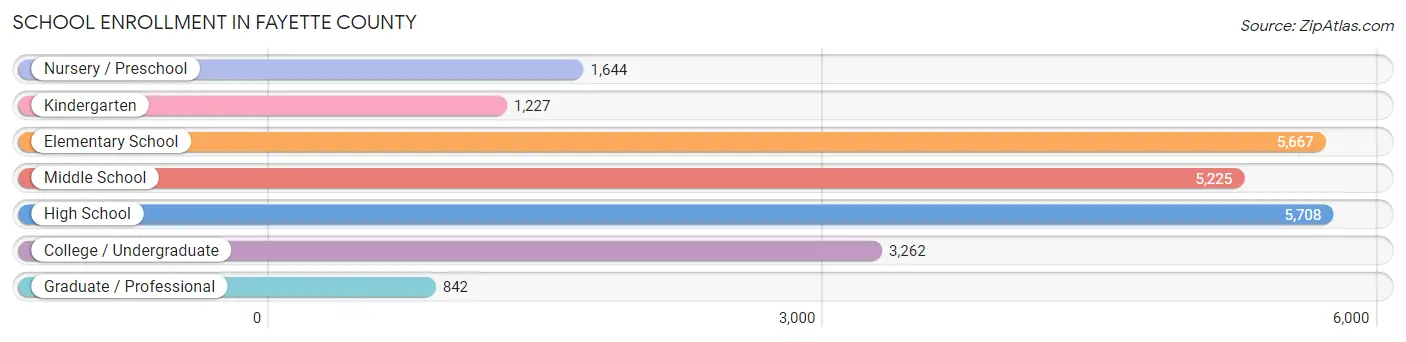
| School Level | # Students | % Students |
| Nursery / Preschool | 1,644 | 7.0% |
| Kindergarten | 1,227 | 5.2% |
| Elementary School | 5,667 | 24.0% |
| Middle School | 5,225 | 22.2% |
| High School | 5,708 | 24.2% |
| College / Undergraduate | 3,262 | 13.8% |
| Graduate / Professional | 842 | 3.6% |
| Total | 23,575 | 100.0% |
School Enrollment by Age by Funding Source in Fayette County
Out of a total of 23,575 students who are enrolled in schools in Fayette County, 3,206 (13.6%) attend a private institution, while the remaining 20,369 (86.4%) are enrolled in public schools. The age group of 3 to 4 year olds has the highest likelihood of being enrolled in private schools, with 367 (33.8% in the age bracket) enrolled. Conversely, the age group of 15 to 17 year olds has the lowest likelihood of being enrolled in a private school, with 4,019 (91.9% in the age bracket) attending a public institution.
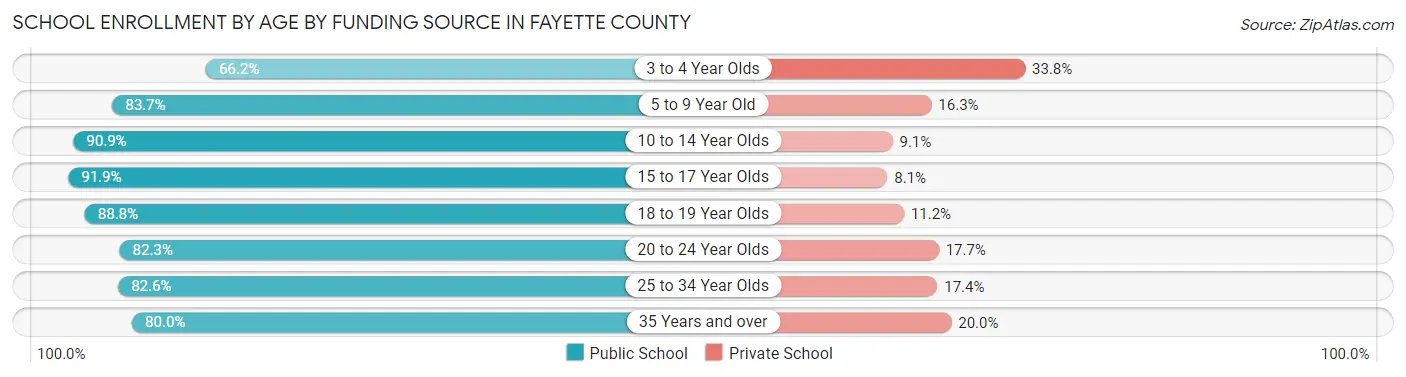
| Age Bracket | Public School | Private School |
| 3 to 4 Year Olds | 719 (66.2%) | 367 (33.8%) |
| 5 to 9 Year Old | 5,469 (83.7%) | 1,068 (16.3%) |
| 10 to 14 Year Olds | 5,925 (90.9%) | 593 (9.1%) |
| 15 to 17 Year Olds | 4,019 (91.9%) | 356 (8.1%) |
| 18 to 19 Year Olds | 1,170 (88.8%) | 148 (11.2%) |
| 20 to 24 Year Olds | 1,623 (82.3%) | 349 (17.7%) |
| 25 to 34 Year Olds | 587 (82.6%) | 124 (17.4%) |
| 35 Years and over | 846 (80.0%) | 212 (20.0%) |
| Total | 20,369 (86.4%) | 3,206 (13.6%) |
Educational Attainment by Field of Study in Fayette County
Education (4,302 | 23.0%), business (2,894 | 15.5%), science & technology (2,715 | 14.5%), arts & humanities (1,533 | 8.2%), and bio, nature & agricultural (1,054 | 5.6%) are the most common fields of study among 18,681 individuals in Fayette County who have obtained a bachelor's degree or higher.
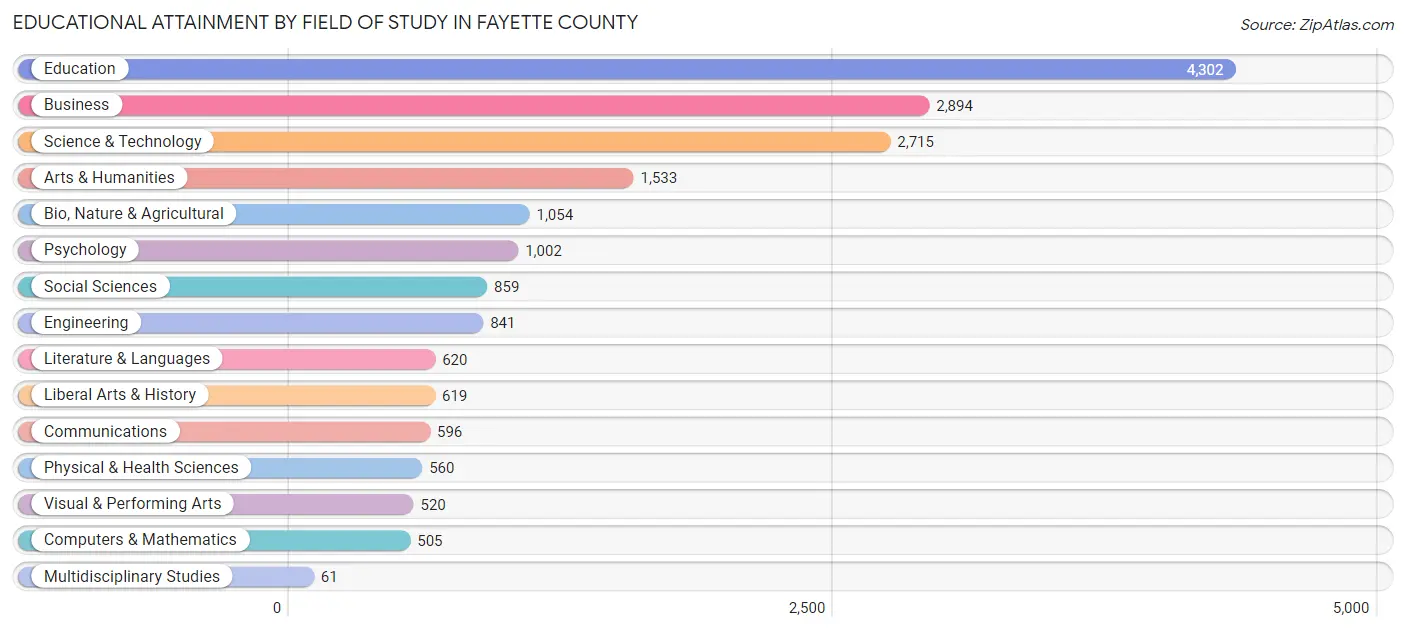
| Field of Study | # Graduates | % Graduates |
| Computers & Mathematics | 505 | 2.7% |
| Bio, Nature & Agricultural | 1,054 | 5.6% |
| Physical & Health Sciences | 560 | 3.0% |
| Psychology | 1,002 | 5.4% |
| Social Sciences | 859 | 4.6% |
| Engineering | 841 | 4.5% |
| Multidisciplinary Studies | 61 | 0.3% |
| Science & Technology | 2,715 | 14.5% |
| Business | 2,894 | 15.5% |
| Education | 4,302 | 23.0% |
| Literature & Languages | 620 | 3.3% |
| Liberal Arts & History | 619 | 3.3% |
| Visual & Performing Arts | 520 | 2.8% |
| Communications | 596 | 3.2% |
| Arts & Humanities | 1,533 | 8.2% |
| Total | 18,681 | 100.0% |
Transportation & Commute in Fayette County
Vehicle Availability by Sex in Fayette County
The most prevalent vehicle ownership categories in Fayette County are males with 2 vehicles (12,159, accounting for 43.1%) and females with 2 vehicles (10,034, making up 48.7%).
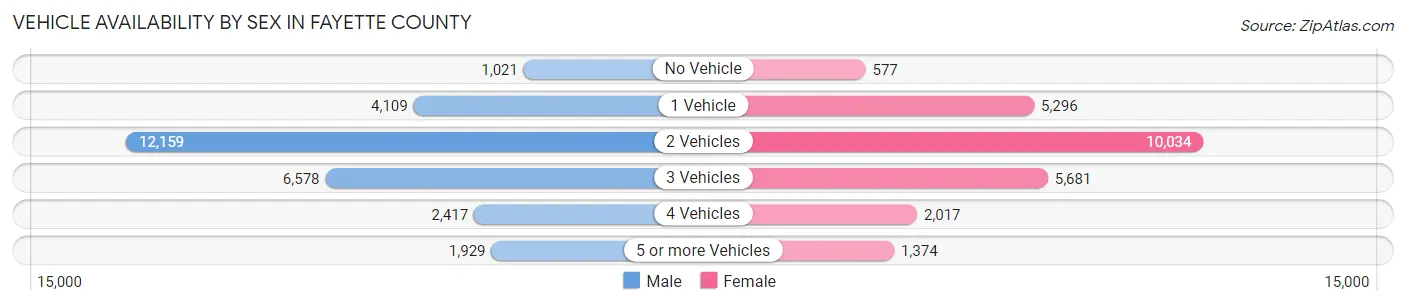
| Vehicles Available | Male | Female |
| No Vehicle | 1,021 (3.6%) | 577 (2.3%) |
| 1 Vehicle | 4,109 (14.6%) | 5,296 (21.2%) |
| 2 Vehicles | 12,159 (43.1%) | 10,034 (40.2%) |
| 3 Vehicles | 6,578 (23.3%) | 5,681 (22.7%) |
| 4 Vehicles | 2,417 (8.6%) | 2,017 (8.1%) |
| 5 or more Vehicles | 1,929 (6.8%) | 1,374 (5.5%) |
| Total | 28,213 (100.0%) | 24,979 (100.0%) |
Commute Time in Fayette County
The most frequently occuring commute durations in Fayette County are 10 to 14 minutes (7,464 commuters, 14.9%), 15 to 19 minutes (6,581 commuters, 13.1%), and 5 to 9 minutes (6,292 commuters, 12.6%).
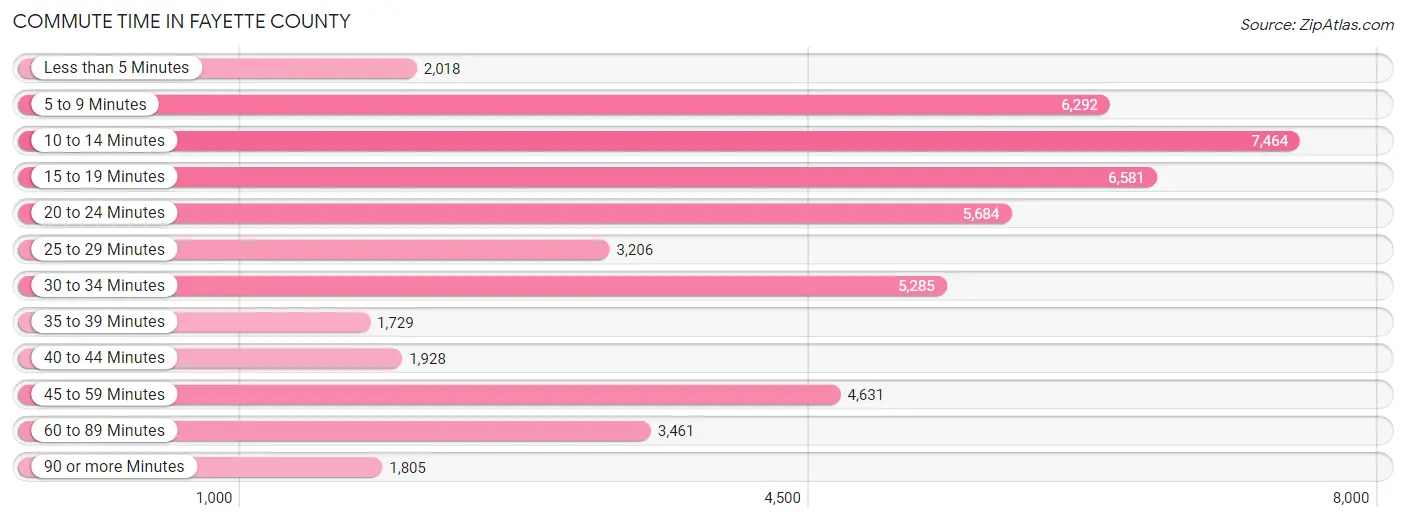
| Commute Time | # Commuters | % Commuters |
| Less than 5 Minutes | 2,018 | 4.0% |
| 5 to 9 Minutes | 6,292 | 12.6% |
| 10 to 14 Minutes | 7,464 | 14.9% |
| 15 to 19 Minutes | 6,581 | 13.1% |
| 20 to 24 Minutes | 5,684 | 11.4% |
| 25 to 29 Minutes | 3,206 | 6.4% |
| 30 to 34 Minutes | 5,285 | 10.5% |
| 35 to 39 Minutes | 1,729 | 3.5% |
| 40 to 44 Minutes | 1,928 | 3.8% |
| 45 to 59 Minutes | 4,631 | 9.2% |
| 60 to 89 Minutes | 3,461 | 6.9% |
| 90 or more Minutes | 1,805 | 3.6% |
Commute Time by Sex in Fayette County
The most common commute times in Fayette County are 10 to 14 minutes (3,675 commuters, 13.6%) for males and 10 to 14 minutes (3,789 commuters, 16.4%) for females.
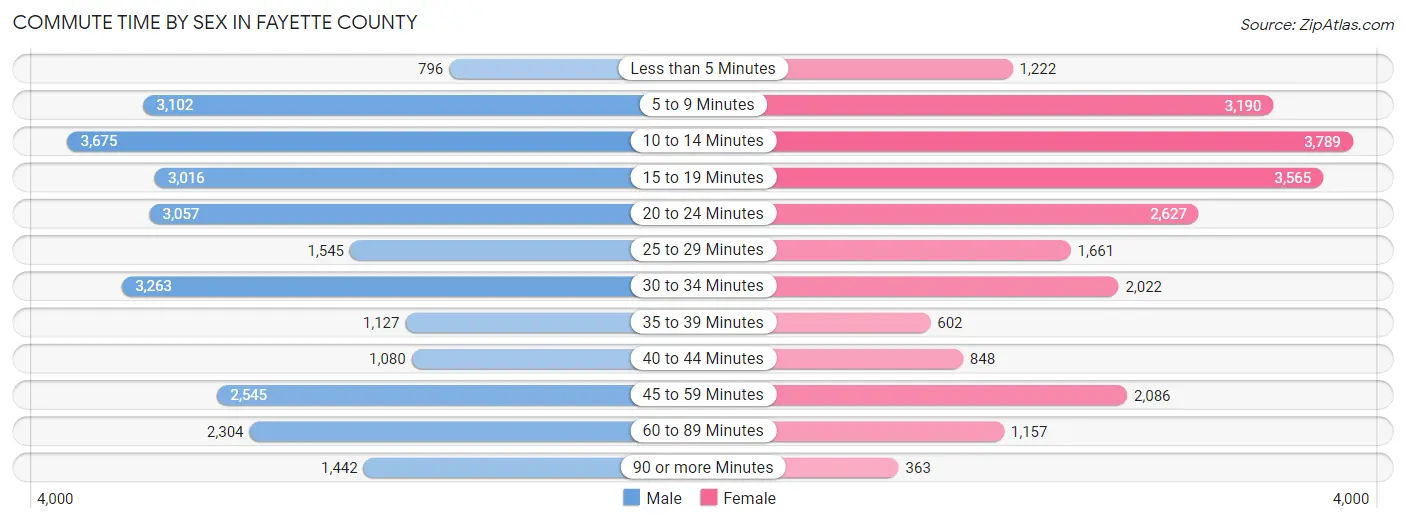
| Commute Time | Male | Female |
| Less than 5 Minutes | 796 (2.9%) | 1,222 (5.3%) |
| 5 to 9 Minutes | 3,102 (11.5%) | 3,190 (13.8%) |
| 10 to 14 Minutes | 3,675 (13.6%) | 3,789 (16.4%) |
| 15 to 19 Minutes | 3,016 (11.2%) | 3,565 (15.4%) |
| 20 to 24 Minutes | 3,057 (11.3%) | 2,627 (11.4%) |
| 25 to 29 Minutes | 1,545 (5.7%) | 1,661 (7.2%) |
| 30 to 34 Minutes | 3,263 (12.1%) | 2,022 (8.7%) |
| 35 to 39 Minutes | 1,127 (4.2%) | 602 (2.6%) |
| 40 to 44 Minutes | 1,080 (4.0%) | 848 (3.7%) |
| 45 to 59 Minutes | 2,545 (9.4%) | 2,086 (9.0%) |
| 60 to 89 Minutes | 2,304 (8.6%) | 1,157 (5.0%) |
| 90 or more Minutes | 1,442 (5.3%) | 363 (1.6%) |
Time of Departure to Work by Sex in Fayette County
The most frequent times of departure to work in Fayette County are 6:00 AM to 6:29 AM (3,034, 11.3%) for males and 7:30 AM to 7:59 AM (3,359, 14.5%) for females.
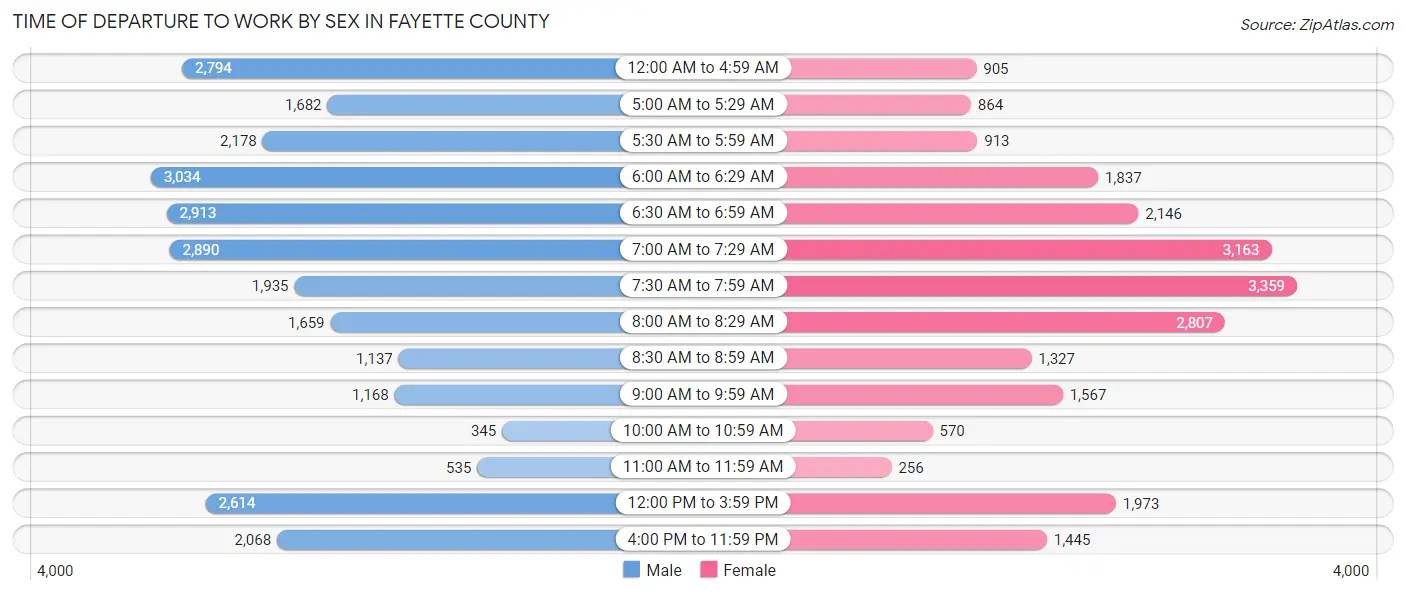
| Time of Departure | Male | Female |
| 12:00 AM to 4:59 AM | 2,794 (10.4%) | 905 (3.9%) |
| 5:00 AM to 5:29 AM | 1,682 (6.2%) | 864 (3.7%) |
| 5:30 AM to 5:59 AM | 2,178 (8.1%) | 913 (4.0%) |
| 6:00 AM to 6:29 AM | 3,034 (11.3%) | 1,837 (7.9%) |
| 6:30 AM to 6:59 AM | 2,913 (10.8%) | 2,146 (9.3%) |
| 7:00 AM to 7:29 AM | 2,890 (10.7%) | 3,163 (13.7%) |
| 7:30 AM to 7:59 AM | 1,935 (7.2%) | 3,359 (14.5%) |
| 8:00 AM to 8:29 AM | 1,659 (6.2%) | 2,807 (12.1%) |
| 8:30 AM to 8:59 AM | 1,137 (4.2%) | 1,327 (5.7%) |
| 9:00 AM to 9:59 AM | 1,168 (4.3%) | 1,567 (6.8%) |
| 10:00 AM to 10:59 AM | 345 (1.3%) | 570 (2.5%) |
| 11:00 AM to 11:59 AM | 535 (2.0%) | 256 (1.1%) |
| 12:00 PM to 3:59 PM | 2,614 (9.7%) | 1,973 (8.5%) |
| 4:00 PM to 11:59 PM | 2,068 (7.7%) | 1,445 (6.2%) |
| Total | 26,952 (100.0%) | 23,132 (100.0%) |
Housing Occupancy in Fayette County
Occupancy by Ownership in Fayette County
Of the total 54,937 dwellings in Fayette County, owner-occupied units account for 40,370 (73.5%), while renter-occupied units make up 14,567 (26.5%).
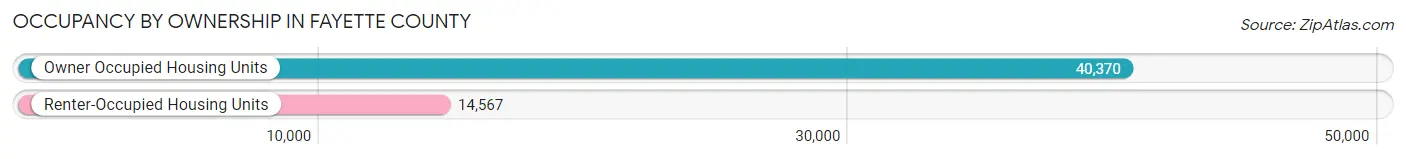
| Occupancy | # Housing Units | % Housing Units |
| Owner Occupied Housing Units | 40,370 | 73.5% |
| Renter-Occupied Housing Units | 14,567 | 26.5% |
| Total Occupied Housing Units | 54,937 | 100.0% |
Occupancy by Household Size in Fayette County
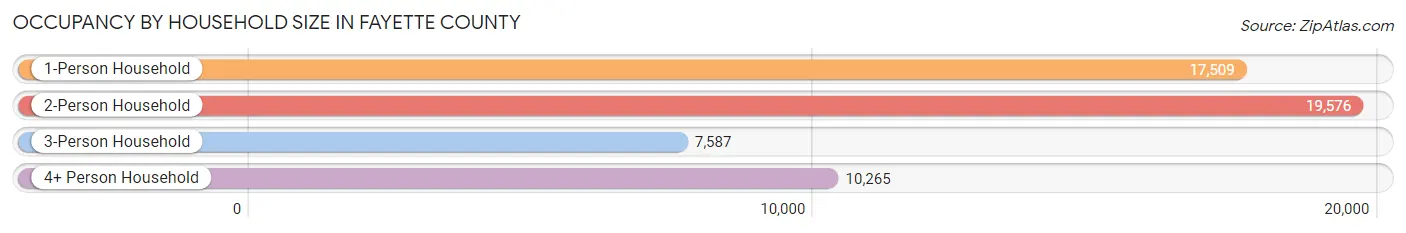
| Household Size | # Housing Units | % Housing Units |
| 1-Person Household | 17,509 | 31.9% |
| 2-Person Household | 19,576 | 35.6% |
| 3-Person Household | 7,587 | 13.8% |
| 4+ Person Household | 10,265 | 18.7% |
| Total Housing Units | 54,937 | 100.0% |
Occupancy by Ownership by Household Size in Fayette County
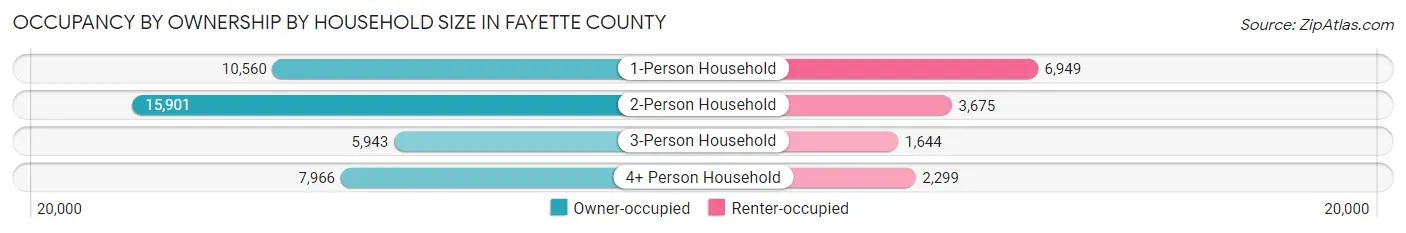
| Household Size | Owner-occupied | Renter-occupied |
| 1-Person Household | 10,560 (60.3%) | 6,949 (39.7%) |
| 2-Person Household | 15,901 (81.2%) | 3,675 (18.8%) |
| 3-Person Household | 5,943 (78.3%) | 1,644 (21.7%) |
| 4+ Person Household | 7,966 (77.6%) | 2,299 (22.4%) |
| Total Housing Units | 40,370 (73.5%) | 14,567 (26.5%) |
Occupancy by Educational Attainment in Fayette County
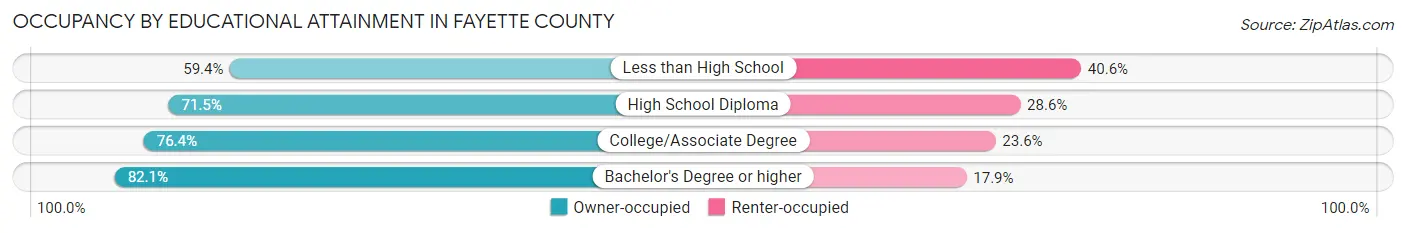
| Household Size | Owner-occupied | Renter-occupied |
| Less than High School | 3,418 (59.4%) | 2,335 (40.6%) |
| High School Diploma | 17,870 (71.5%) | 7,140 (28.5%) |
| College/Associate Degree | 10,209 (76.4%) | 3,160 (23.6%) |
| Bachelor's Degree or higher | 8,873 (82.1%) | 1,932 (17.9%) |
Occupancy by Age of Householder in Fayette County
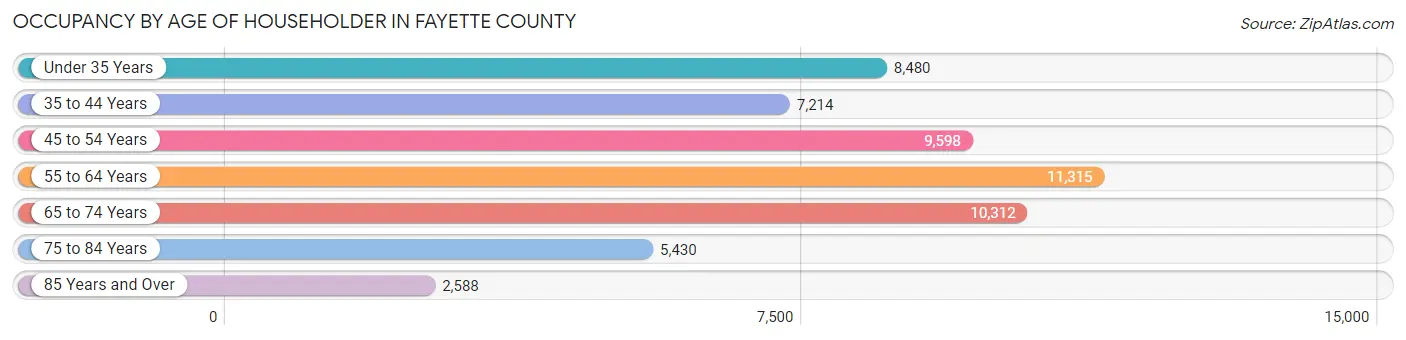
| Age Bracket | # Households | % Households |
| Under 35 Years | 8,480 | 15.4% |
| 35 to 44 Years | 7,214 | 13.1% |
| 45 to 54 Years | 9,598 | 17.5% |
| 55 to 64 Years | 11,315 | 20.6% |
| 65 to 74 Years | 10,312 | 18.8% |
| 75 to 84 Years | 5,430 | 9.9% |
| 85 Years and Over | 2,588 | 4.7% |
| Total | 54,937 | 100.0% |
Housing Finances in Fayette County
Median Income by Occupancy in Fayette County
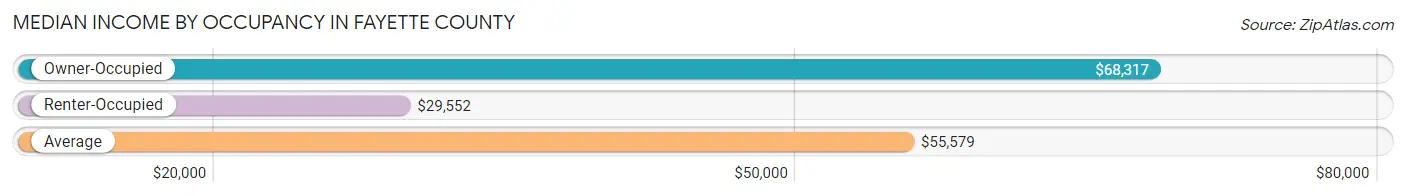
| Occupancy Type | # Households | Median Income |
| Owner-Occupied | 40,370 (73.5%) | $68,317 |
| Renter-Occupied | 14,567 (26.5%) | $29,552 |
| Average | 54,937 (100.0%) | $55,579 |
Occupancy by Householder Income Bracket in Fayette County
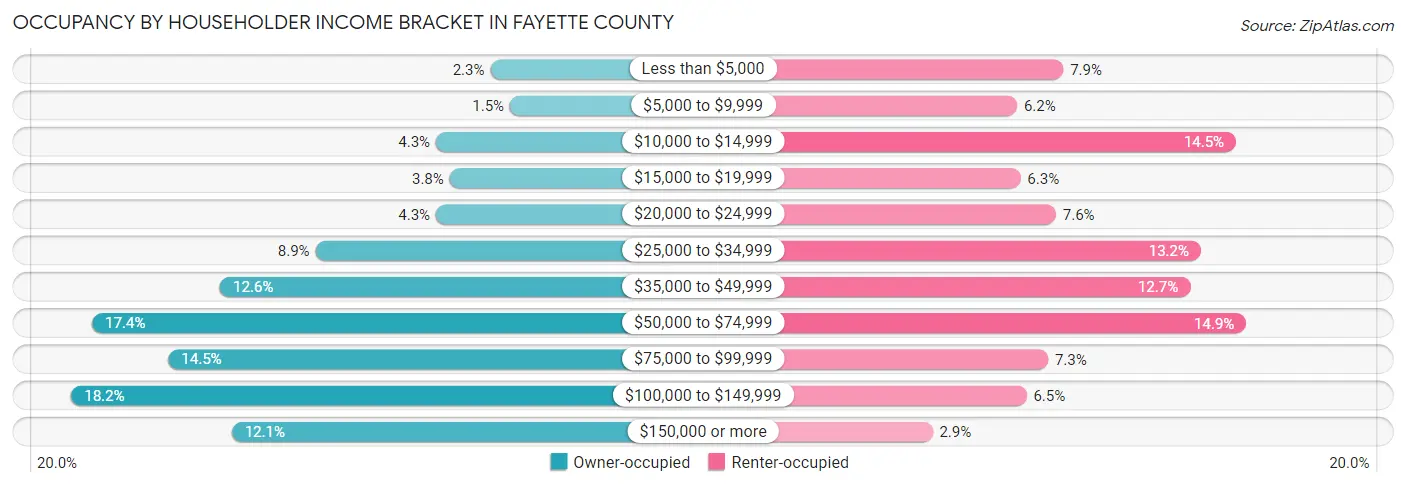
| Income Bracket | Owner-occupied | Renter-occupied |
| Less than $5,000 | 913 (2.3%) | 1,152 (7.9%) |
| $5,000 to $9,999 | 609 (1.5%) | 896 (6.1%) |
| $10,000 to $14,999 | 1,750 (4.3%) | 2,111 (14.5%) |
| $15,000 to $19,999 | 1,539 (3.8%) | 915 (6.3%) |
| $20,000 to $24,999 | 1,748 (4.3%) | 1,111 (7.6%) |
| $25,000 to $34,999 | 3,600 (8.9%) | 1,915 (13.2%) |
| $35,000 to $49,999 | 5,066 (12.6%) | 1,856 (12.7%) |
| $50,000 to $74,999 | 7,036 (17.4%) | 2,168 (14.9%) |
| $75,000 to $99,999 | 5,863 (14.5%) | 1,068 (7.3%) |
| $100,000 to $149,999 | 7,357 (18.2%) | 948 (6.5%) |
| $150,000 or more | 4,889 (12.1%) | 427 (2.9%) |
| Total | 40,370 (100.0%) | 14,567 (100.0%) |
Monthly Housing Cost Tiers in Fayette County
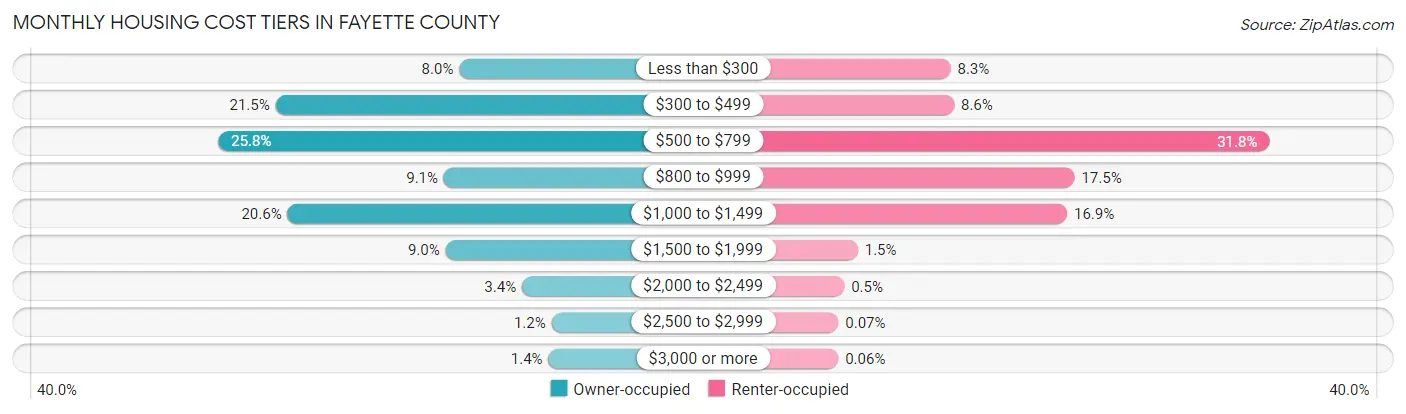
| Monthly Cost | Owner-occupied | Renter-occupied |
| Less than $300 | 3,224 (8.0%) | 1,214 (8.3%) |
| $300 to $499 | 8,688 (21.5%) | 1,252 (8.6%) |
| $500 to $799 | 10,396 (25.8%) | 4,633 (31.8%) |
| $800 to $999 | 3,680 (9.1%) | 2,544 (17.5%) |
| $1,000 to $1,499 | 8,332 (20.6%) | 2,463 (16.9%) |
| $1,500 to $1,999 | 3,635 (9.0%) | 218 (1.5%) |
| $2,000 to $2,499 | 1,359 (3.4%) | 73 (0.5%) |
| $2,500 to $2,999 | 481 (1.2%) | 10 (0.1%) |
| $3,000 or more | 575 (1.4%) | 9 (0.1%) |
| Total | 40,370 (100.0%) | 14,567 (100.0%) |
Physical Housing Characteristics in Fayette County
Housing Structures in Fayette County
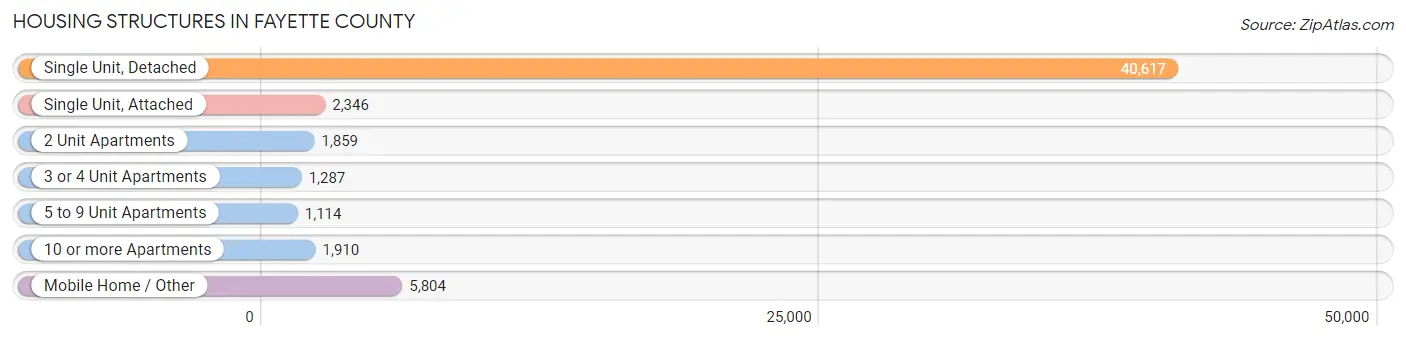
| Structure Type | # Housing Units | % Housing Units |
| Single Unit, Detached | 40,617 | 73.9% |
| Single Unit, Attached | 2,346 | 4.3% |
| 2 Unit Apartments | 1,859 | 3.4% |
| 3 or 4 Unit Apartments | 1,287 | 2.3% |
| 5 to 9 Unit Apartments | 1,114 | 2.0% |
| 10 or more Apartments | 1,910 | 3.5% |
| Mobile Home / Other | 5,804 | 10.6% |
| Total | 54,937 | 100.0% |
Housing Structures by Occupancy in Fayette County
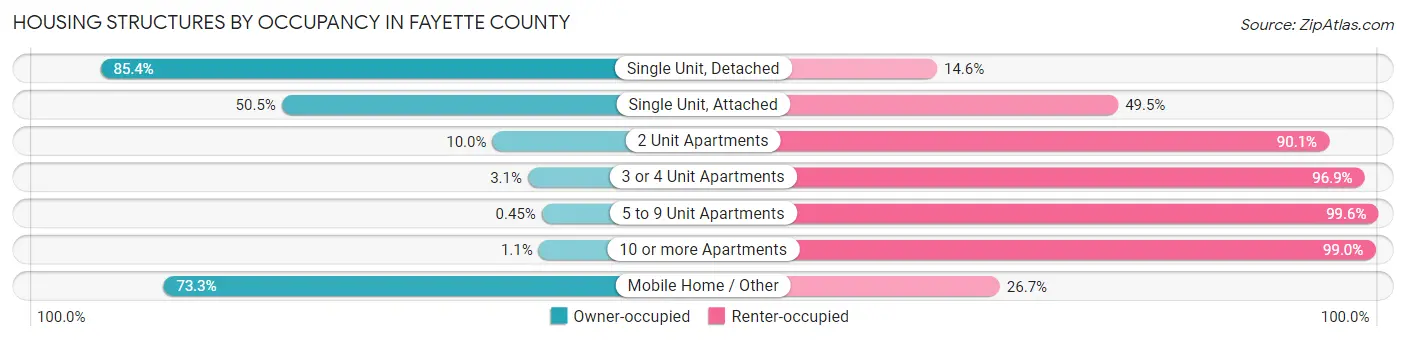
| Structure Type | Owner-occupied | Renter-occupied |
| Single Unit, Detached | 34,681 (85.4%) | 5,936 (14.6%) |
| Single Unit, Attached | 1,185 (50.5%) | 1,161 (49.5%) |
| 2 Unit Apartments | 185 (10.0%) | 1,674 (90.0%) |
| 3 or 4 Unit Apartments | 40 (3.1%) | 1,247 (96.9%) |
| 5 to 9 Unit Apartments | 5 (0.4%) | 1,109 (99.6%) |
| 10 or more Apartments | 20 (1.1%) | 1,890 (99.0%) |
| Mobile Home / Other | 4,254 (73.3%) | 1,550 (26.7%) |
| Total | 40,370 (73.5%) | 14,567 (26.5%) |
Housing Structures by Number of Rooms in Fayette County
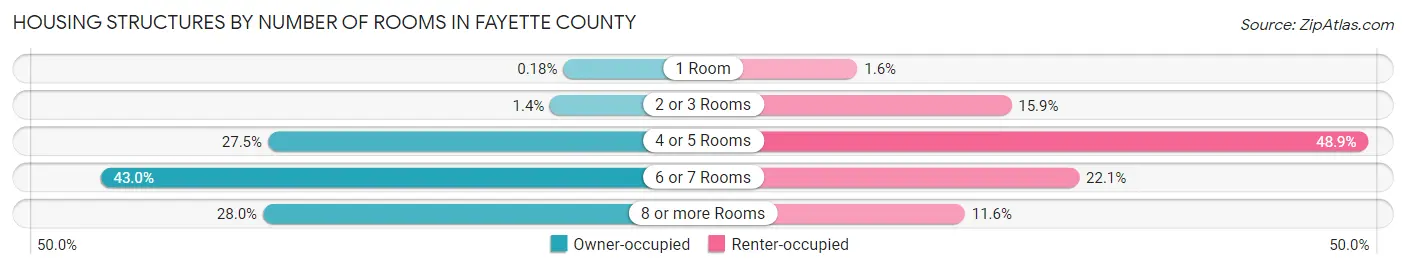
| Number of Rooms | Owner-occupied | Renter-occupied |
| 1 Room | 73 (0.2%) | 234 (1.6%) |
| 2 or 3 Rooms | 562 (1.4%) | 2,309 (15.9%) |
| 4 or 5 Rooms | 11,102 (27.5%) | 7,119 (48.9%) |
| 6 or 7 Rooms | 17,346 (43.0%) | 3,222 (22.1%) |
| 8 or more Rooms | 11,287 (28.0%) | 1,683 (11.6%) |
| Total | 40,370 (100.0%) | 14,567 (100.0%) |
Housing Structure by Heating Type in Fayette County
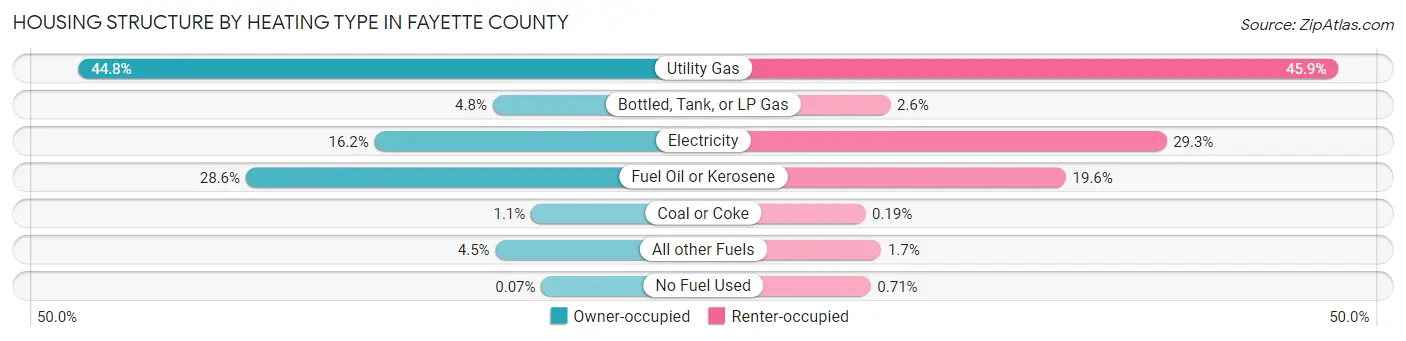
| Heating Type | Owner-occupied | Renter-occupied |
| Utility Gas | 18,085 (44.8%) | 6,687 (45.9%) |
| Bottled, Tank, or LP Gas | 1,924 (4.8%) | 379 (2.6%) |
| Electricity | 6,532 (16.2%) | 4,266 (29.3%) |
| Fuel Oil or Kerosene | 11,553 (28.6%) | 2,851 (19.6%) |
| Coal or Coke | 429 (1.1%) | 28 (0.2%) |
| All other Fuels | 1,820 (4.5%) | 252 (1.7%) |
| No Fuel Used | 27 (0.1%) | 104 (0.7%) |
| Total | 40,370 (100.0%) | 14,567 (100.0%) |
Household Vehicle Usage in Fayette County
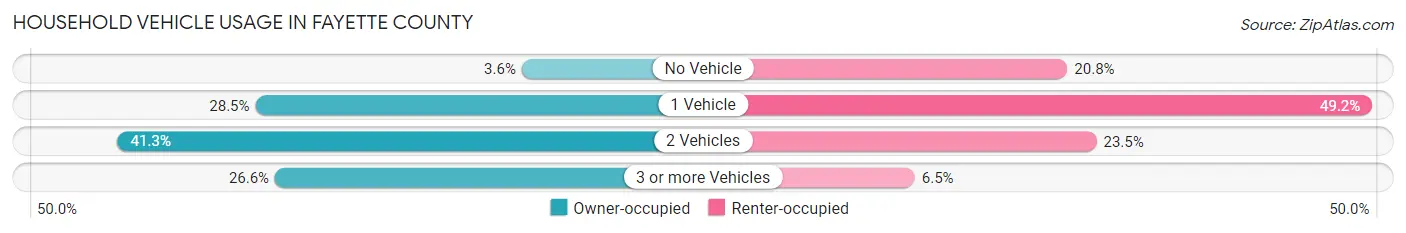
| Vehicles per Household | Owner-occupied | Renter-occupied |
| No Vehicle | 1,450 (3.6%) | 3,025 (20.8%) |
| 1 Vehicle | 11,488 (28.5%) | 7,169 (49.2%) |
| 2 Vehicles | 16,680 (41.3%) | 3,422 (23.5%) |
| 3 or more Vehicles | 10,752 (26.6%) | 951 (6.5%) |
| Total | 40,370 (100.0%) | 14,567 (100.0%) |
Real Estate & Mortgages in Fayette County
Real Estate and Mortgage Overview in Fayette County
| Characteristic | Without Mortgage | With Mortgage |
| Housing Units | 21,369 | 19,001 |
| Median Property Value | $102,700 | $151,400 |
| Median Household Income | $49,300 | $3,196 |
| Monthly Housing Costs | $478 | $565 |
| Real Estate Taxes | $1,348 | $367 |
Property Value by Mortgage Status in Fayette County
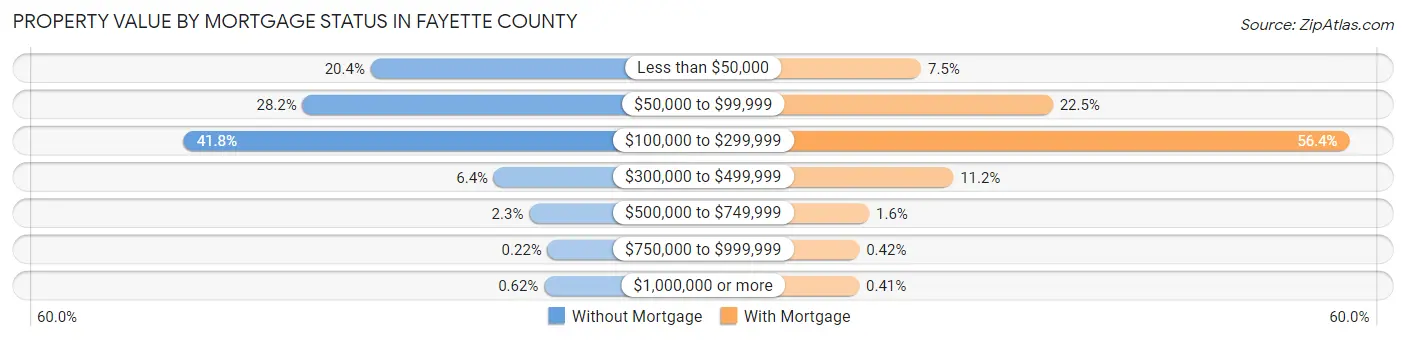
| Property Value | Without Mortgage | With Mortgage |
| Less than $50,000 | 4,367 (20.4%) | 1,424 (7.5%) |
| $50,000 to $99,999 | 6,032 (28.2%) | 4,281 (22.5%) |
| $100,000 to $299,999 | 8,935 (41.8%) | 10,725 (56.4%) |
| $300,000 to $499,999 | 1,358 (6.4%) | 2,120 (11.2%) |
| $500,000 to $749,999 | 498 (2.3%) | 295 (1.5%) |
| $750,000 to $999,999 | 46 (0.2%) | 79 (0.4%) |
| $1,000,000 or more | 133 (0.6%) | 77 (0.4%) |
| Total | 21,369 (100.0%) | 19,001 (100.0%) |
Household Income by Mortgage Status in Fayette County
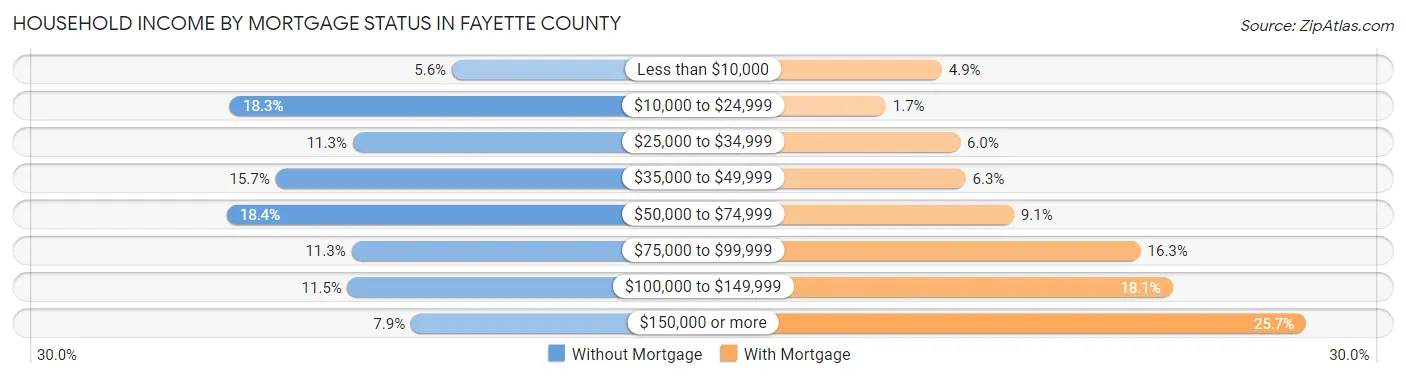
| Household Income | Without Mortgage | With Mortgage |
| Less than $10,000 | 1,193 (5.6%) | 936 (4.9%) |
| $10,000 to $24,999 | 3,903 (18.3%) | 329 (1.7%) |
| $25,000 to $34,999 | 2,405 (11.3%) | 1,134 (6.0%) |
| $35,000 to $49,999 | 3,347 (15.7%) | 1,195 (6.3%) |
| $50,000 to $74,999 | 3,941 (18.4%) | 1,719 (9.0%) |
| $75,000 to $99,999 | 2,420 (11.3%) | 3,095 (16.3%) |
| $100,000 to $149,999 | 2,467 (11.5%) | 3,443 (18.1%) |
| $150,000 or more | 1,693 (7.9%) | 4,890 (25.7%) |
| Total | 21,369 (100.0%) | 19,001 (100.0%) |
Property Value to Household Income Ratio in Fayette County
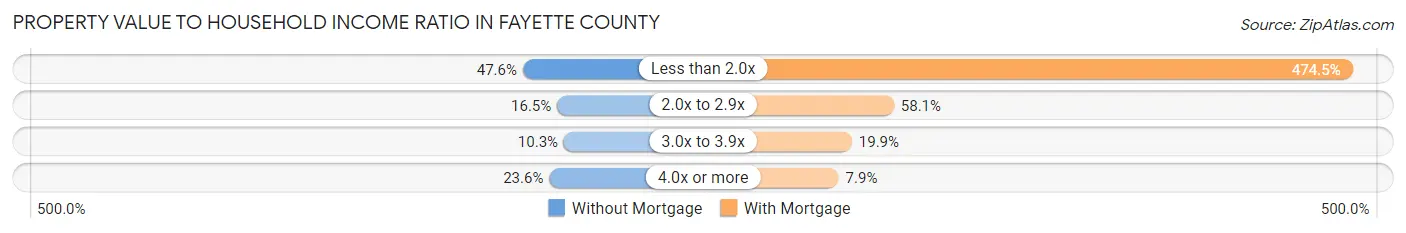
| Value-to-Income Ratio | Without Mortgage | With Mortgage |
| Less than 2.0x | 10,167 (47.6%) | 90,156 (474.5%) |
| 2.0x to 2.9x | 3,518 (16.5%) | 11,034 (58.1%) |
| 3.0x to 3.9x | 2,199 (10.3%) | 3,782 (19.9%) |
| 4.0x or more | 5,043 (23.6%) | 1,504 (7.9%) |
| Total | 21,369 (100.0%) | 19,001 (100.0%) |
Real Estate Taxes by Mortgage Status in Fayette County
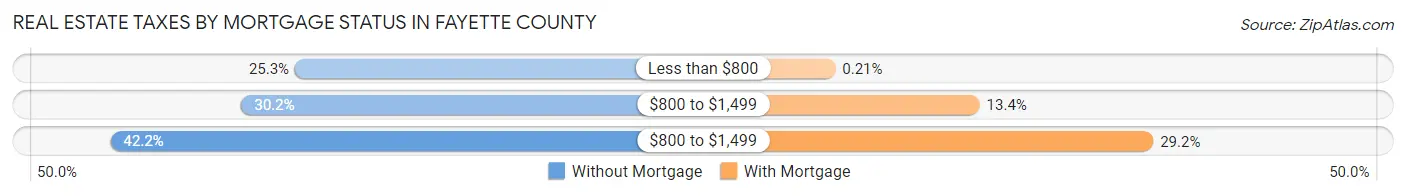
| Property Taxes | Without Mortgage | With Mortgage |
| Less than $800 | 5,409 (25.3%) | 40 (0.2%) |
| $800 to $1,499 | 6,455 (30.2%) | 2,544 (13.4%) |
| $800 to $1,499 | 9,009 (42.2%) | 5,555 (29.2%) |
| Total | 21,369 (100.0%) | 19,001 (100.0%) |
Health & Disability in Fayette County
Health Insurance Coverage by Age in Fayette County
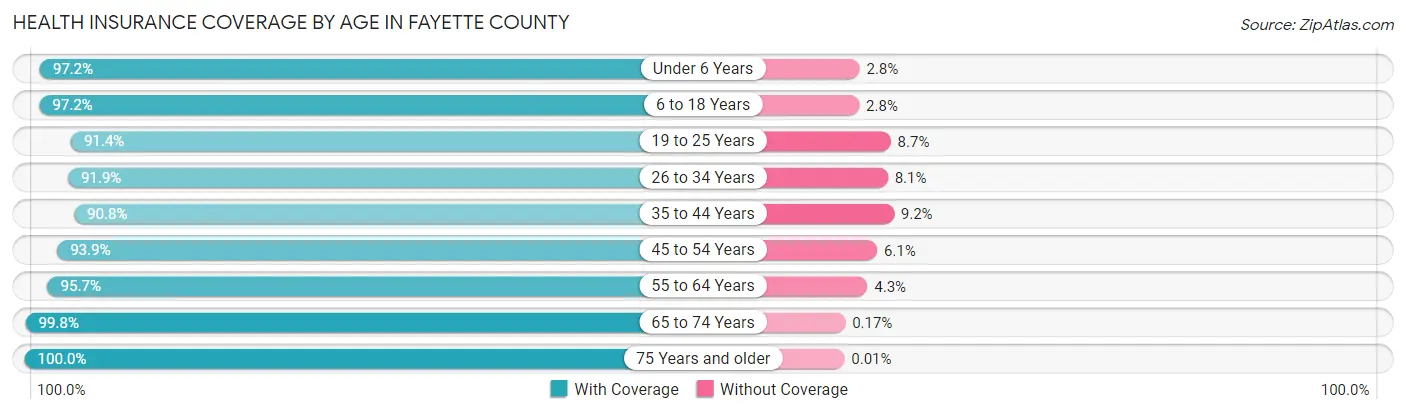
| Age Bracket | With Coverage | Without Coverage |
| Under 6 Years | 7,708 (97.2%) | 225 (2.8%) |
| 6 to 18 Years | 17,477 (97.2%) | 497 (2.8%) |
| 19 to 25 Years | 8,311 (91.3%) | 787 (8.6%) |
| 26 to 34 Years | 12,252 (91.9%) | 1,079 (8.1%) |
| 35 to 44 Years | 12,731 (90.8%) | 1,296 (9.2%) |
| 45 to 54 Years | 15,580 (93.9%) | 1,011 (6.1%) |
| 55 to 64 Years | 18,243 (95.7%) | 820 (4.3%) |
| 65 to 74 Years | 16,094 (99.8%) | 27 (0.2%) |
| 75 Years and older | 11,058 (100.0%) | 1 (0.0%) |
| Total | 119,454 (95.4%) | 5,743 (4.6%) |
Health Insurance Coverage by Citizenship Status in Fayette County
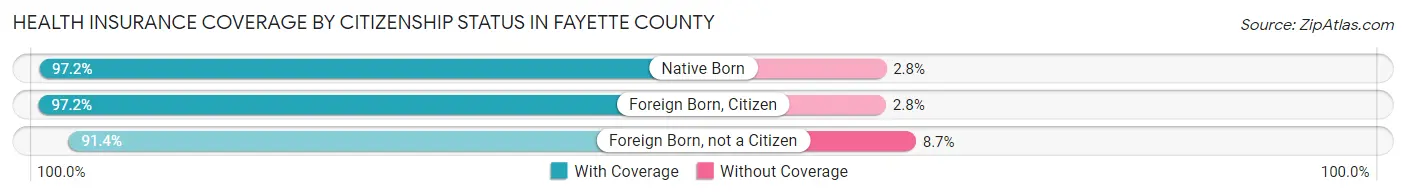
| Citizenship Status | With Coverage | Without Coverage |
| Native Born | 7,708 (97.2%) | 225 (2.8%) |
| Foreign Born, Citizen | 17,477 (97.2%) | 497 (2.8%) |
| Foreign Born, not a Citizen | 8,311 (91.3%) | 787 (8.6%) |
Health Insurance Coverage by Household Income in Fayette County
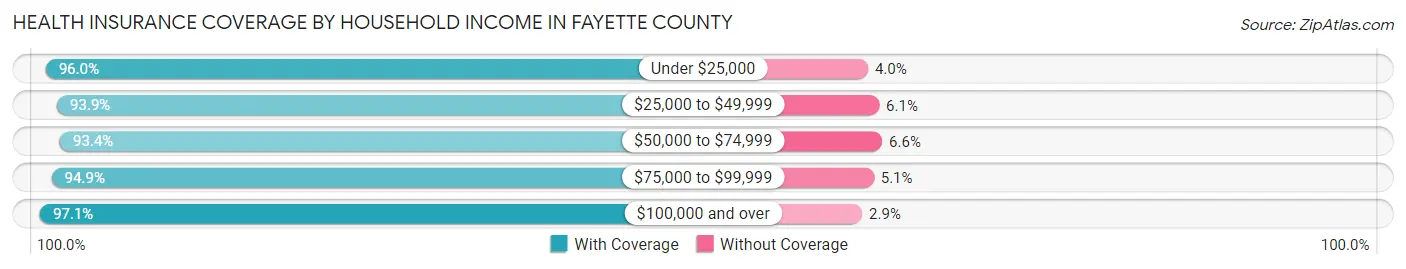
| Household Income | With Coverage | Without Coverage |
| Under $25,000 | 17,836 (96.0%) | 738 (4.0%) |
| $25,000 to $49,999 | 23,811 (93.9%) | 1,536 (6.1%) |
| $50,000 to $74,999 | 18,616 (93.4%) | 1,320 (6.6%) |
| $75,000 to $99,999 | 17,954 (94.9%) | 957 (5.1%) |
| $100,000 and over | 39,813 (97.1%) | 1,180 (2.9%) |
Public vs Private Health Insurance Coverage by Age in Fayette County
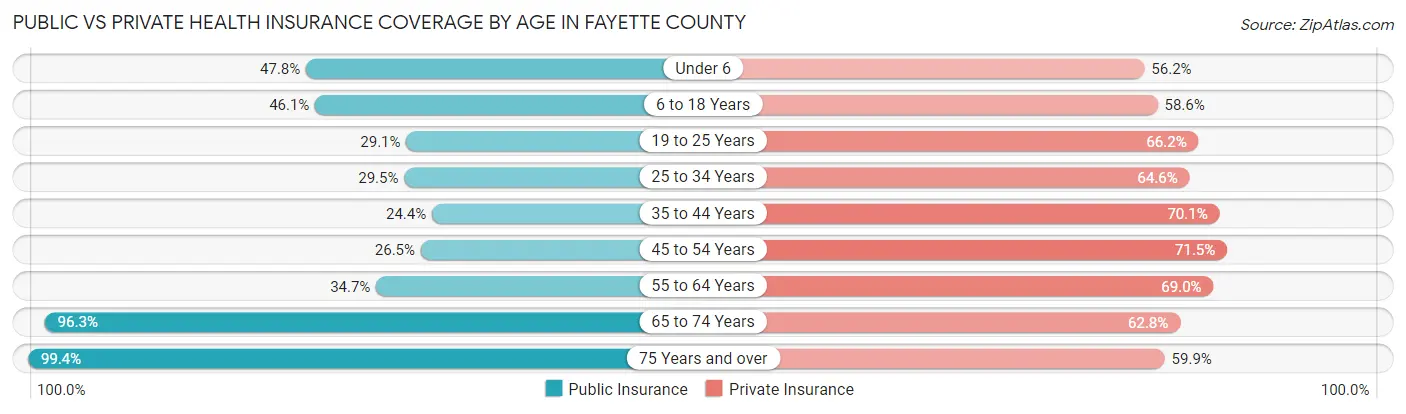
| Age Bracket | Public Insurance | Private Insurance |
| Under 6 | 3,788 (47.7%) | 4,456 (56.2%) |
| 6 to 18 Years | 8,278 (46.1%) | 10,535 (58.6%) |
| 19 to 25 Years | 2,651 (29.1%) | 6,023 (66.2%) |
| 25 to 34 Years | 3,937 (29.5%) | 8,605 (64.5%) |
| 35 to 44 Years | 3,420 (24.4%) | 9,833 (70.1%) |
| 45 to 54 Years | 4,389 (26.5%) | 11,864 (71.5%) |
| 55 to 64 Years | 6,622 (34.7%) | 13,147 (69.0%) |
| 65 to 74 Years | 15,520 (96.3%) | 10,122 (62.8%) |
| 75 Years and over | 10,991 (99.4%) | 6,628 (59.9%) |
| Total | 59,596 (47.6%) | 81,213 (64.9%) |
Disability Status by Sex by Age in Fayette County
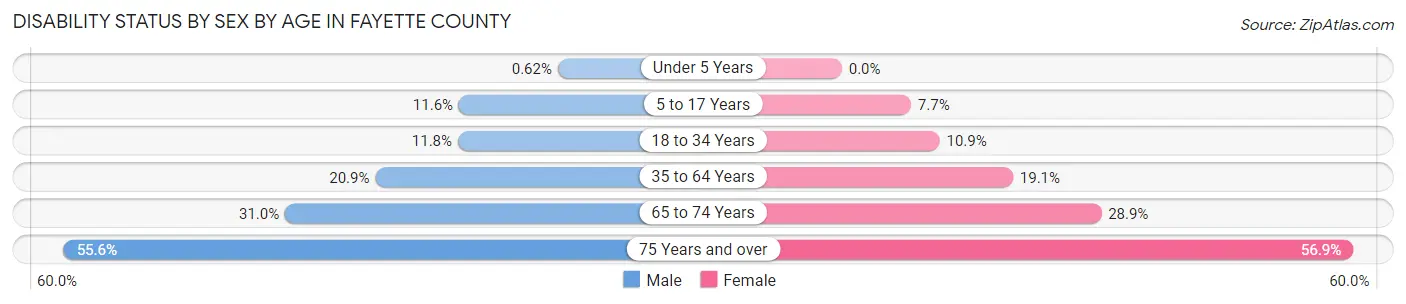
| Age Bracket | Male | Female |
| Under 5 Years | 21 (0.6%) | 0 (0.0%) |
| 5 to 17 Years | 1,091 (11.6%) | 680 (7.7%) |
| 18 to 34 Years | 1,432 (11.7%) | 1,254 (10.9%) |
| 35 to 64 Years | 5,138 (20.9%) | 4,792 (19.1%) |
| 65 to 74 Years | 2,416 (31.0%) | 2,405 (28.9%) |
| 75 Years and over | 2,476 (55.6%) | 3,763 (56.9%) |
Disability Class by Sex by Age in Fayette County
Disability Class: Hearing Difficulty
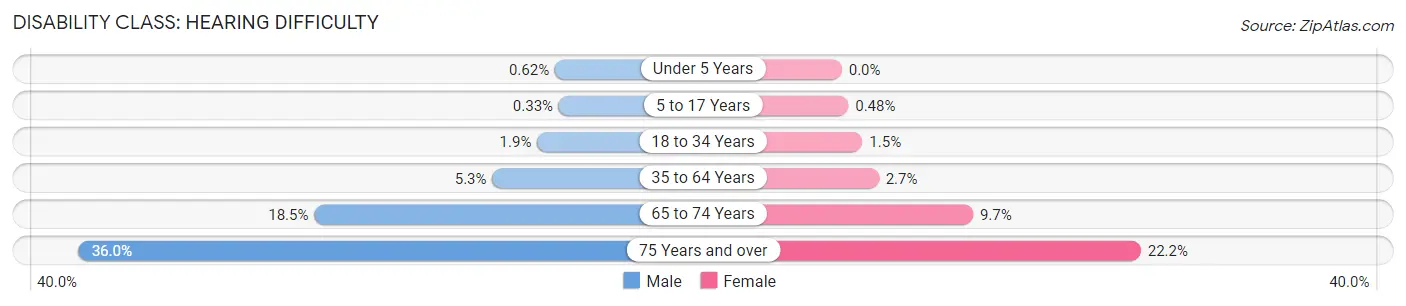
| Age Bracket | Male | Female |
| Under 5 Years | 21 (0.6%) | 0 (0.0%) |
| 5 to 17 Years | 31 (0.3%) | 42 (0.5%) |
| 18 to 34 Years | 236 (1.9%) | 176 (1.5%) |
| 35 to 64 Years | 1,294 (5.3%) | 690 (2.7%) |
| 65 to 74 Years | 1,441 (18.5%) | 811 (9.7%) |
| 75 Years and over | 1,601 (36.0%) | 1,467 (22.2%) |
Disability Class: Vision Difficulty
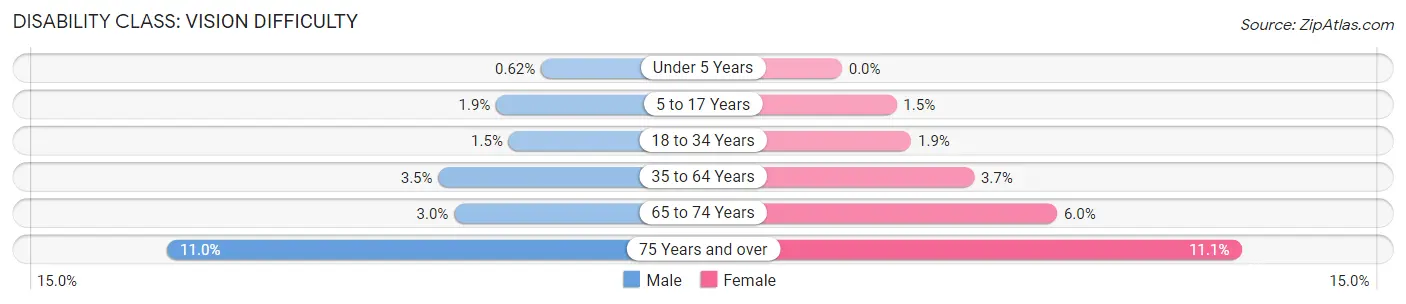
| Age Bracket | Male | Female |
| Under 5 Years | 21 (0.6%) | 0 (0.0%) |
| 5 to 17 Years | 175 (1.9%) | 134 (1.5%) |
| 18 to 34 Years | 185 (1.5%) | 222 (1.9%) |
| 35 to 64 Years | 853 (3.5%) | 926 (3.7%) |
| 65 to 74 Years | 237 (3.0%) | 499 (6.0%) |
| 75 Years and over | 491 (11.0%) | 735 (11.1%) |
Disability Class: Cognitive Difficulty
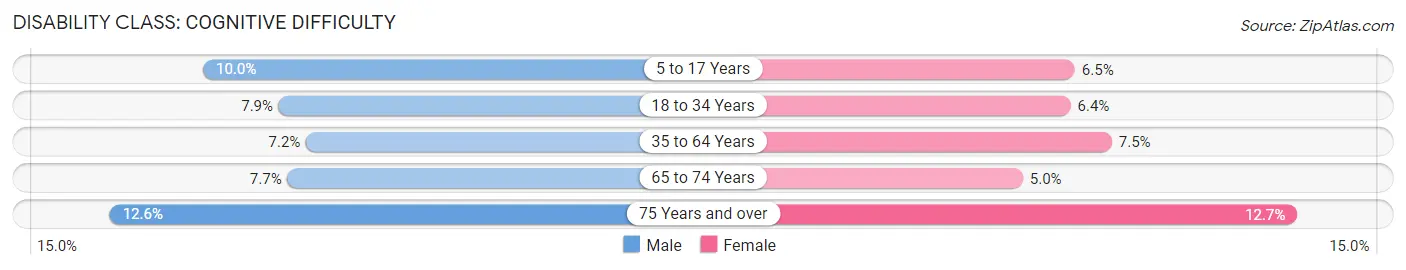
| Age Bracket | Male | Female |
| 5 to 17 Years | 941 (10.0%) | 573 (6.5%) |
| 18 to 34 Years | 965 (7.9%) | 734 (6.4%) |
| 35 to 64 Years | 1,756 (7.2%) | 1,892 (7.5%) |
| 65 to 74 Years | 599 (7.7%) | 420 (5.0%) |
| 75 Years and over | 562 (12.6%) | 838 (12.7%) |
Disability Class: Ambulatory Difficulty
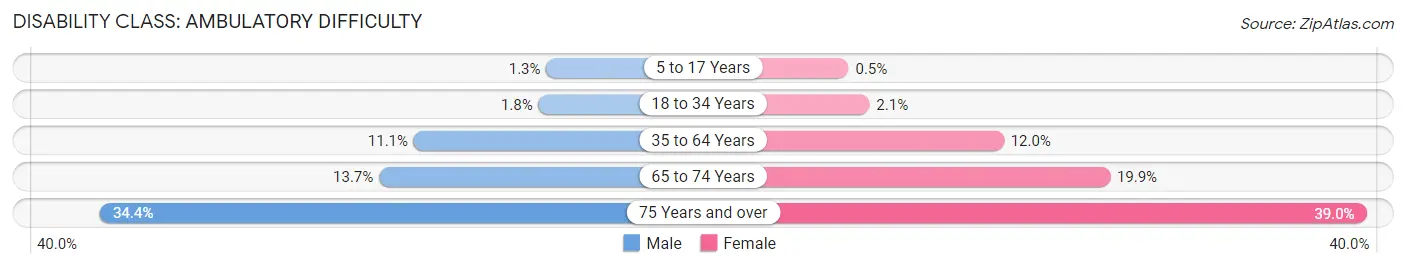
| Age Bracket | Male | Female |
| 5 to 17 Years | 118 (1.3%) | 44 (0.5%) |
| 18 to 34 Years | 224 (1.8%) | 236 (2.1%) |
| 35 to 64 Years | 2,723 (11.1%) | 3,022 (12.0%) |
| 65 to 74 Years | 1,066 (13.7%) | 1,658 (19.9%) |
| 75 Years and over | 1,531 (34.4%) | 2,574 (39.0%) |
Disability Class: Self-Care Difficulty
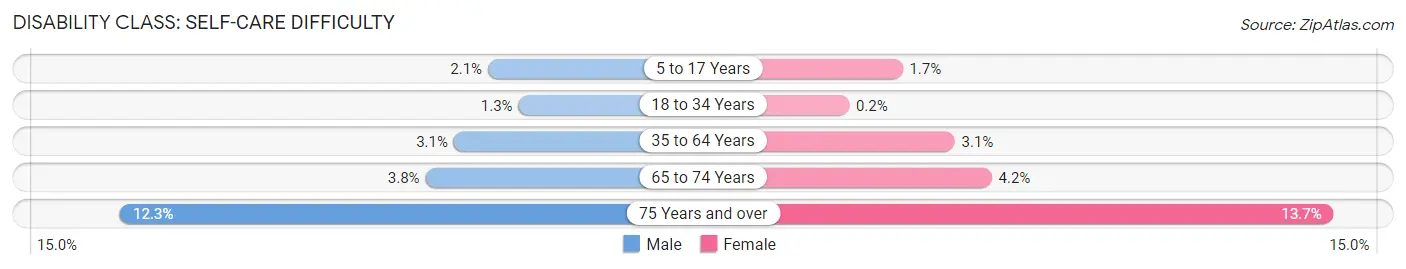
| Age Bracket | Male | Female |
| 5 to 17 Years | 197 (2.1%) | 149 (1.7%) |
| 18 to 34 Years | 152 (1.3%) | 23 (0.2%) |
| 35 to 64 Years | 749 (3.0%) | 790 (3.1%) |
| 65 to 74 Years | 299 (3.8%) | 347 (4.2%) |
| 75 Years and over | 549 (12.3%) | 905 (13.7%) |
Technology Access in Fayette County
Computing Device Access in Fayette County
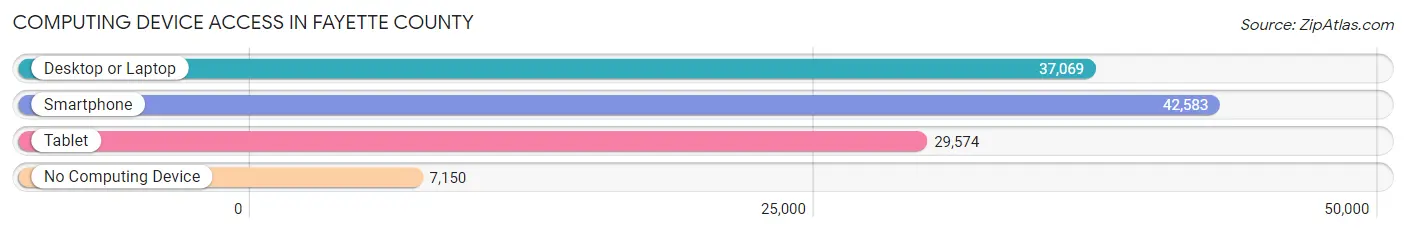
| Device Type | # Households | % Households |
| Desktop or Laptop | 37,069 | 67.5% |
| Smartphone | 42,583 | 77.5% |
| Tablet | 29,574 | 53.8% |
| No Computing Device | 7,150 | 13.0% |
| Total | 54,937 | 100.0% |
Internet Access in Fayette County
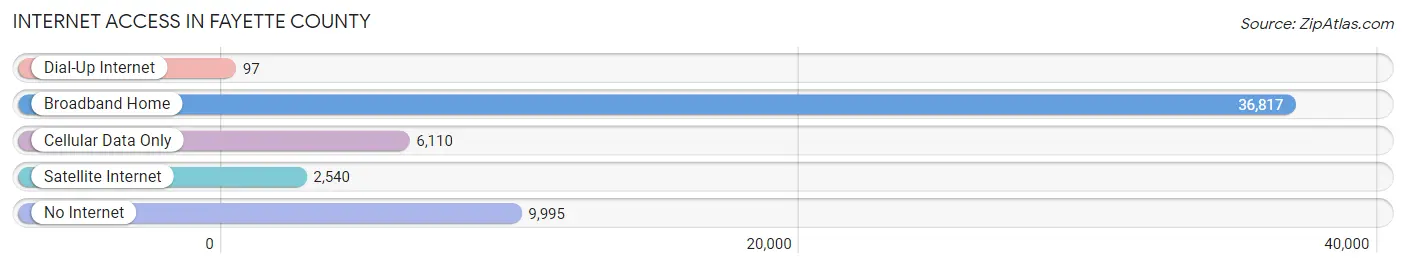
| Internet Type | # Households | % Households |
| Dial-Up Internet | 97 | 0.2% |
| Broadband Home | 36,817 | 67.0% |
| Cellular Data Only | 6,110 | 11.1% |
| Satellite Internet | 2,540 | 4.6% |
| No Internet | 9,995 | 18.2% |
| Total | 54,937 | 100.0% |
Fayette County Summary
Fayette County, Pennsylvania is located in the southwestern corner of the state and is part of the Pittsburgh metropolitan area. It is bordered by Westmoreland County to the north, Somerset County to the east, Maryland to the south, and West Virginia to the west. The county seat is Uniontown, and the county has a total area of 664 square miles.
History
Fayette County was created in 1783 from part of Westmoreland County. It was named after the Marquis de Lafayette, a French military hero who fought alongside George Washington during the American Revolution. The county was originally part of the vast territory claimed by the Iroquois Nation. The first European settlers arrived in the area in the late 1700s, and the county was officially established in 1783.
The county was an important center of the coal mining industry in the late 19th and early 20th centuries. The county was also home to several steel mills, which provided employment for many of the county’s residents. The steel industry declined in the late 20th century, and the county’s economy shifted to focus on tourism and other service industries.
Geography
Fayette County is located in the southwestern corner of Pennsylvania. It is bordered by Westmoreland County to the north, Somerset County to the east, Maryland to the south, and West Virginia to the west. The county has a total area of 664 square miles, and is part of the Appalachian Mountains. The terrain is mostly hilly, with some flat areas in the northern part of the county. The highest point in the county is Chestnut Ridge, which has an elevation of 2,890 feet.
The county is home to several rivers, including the Monongahela, Youghiogheny, and Cheat. The county also contains several state parks, including Ohiopyle State Park, which is located in the southwestern corner of the county.
Economy
Fayette County’s economy is largely based on tourism and service industries. The county is home to several tourist attractions, including Ohiopyle State Park, which attracts visitors from all over the country. The county is also home to several wineries, which attract visitors from the surrounding areas.
The county is also home to several manufacturing companies, including a steel mill in Uniontown. The county is also home to several coal mines, which provide employment for many of the county’s residents.
Demographics
As of the 2010 census, Fayette County had a population of 136,606. The population is largely white (93.3%), with small percentages of African Americans (3.7%), Asians (1.2%), and other races (1.8%). The median household income is $41,945, and the median age is 41.7 years.
Fayette County is home to several colleges and universities, including Penn State Fayette, The Eberly Campus, and the University of Pittsburgh at Greensburg. The county is also home to several hospitals, including Uniontown Hospital and Highlands Hospital.
Conclusion
Fayette County, Pennsylvania is located in the southwestern corner of the state and is part of the Pittsburgh metropolitan area. It is bordered by Westmoreland County to the north, Somerset County to the east, Maryland to the south, and West Virginia to the west. The county was created in 1783 and was named after the Marquis de Lafayette, a French military hero who fought alongside George Washington during the American Revolution. The county’s economy is largely based on tourism and service industries, and the population is largely white. The county is home to several colleges and universities, as well as several hospitals.
Common Questions
What is Per Capita Income in Fayette County?
Per Capita income in Fayette County is $31,498.
What is the Median Family Income in Fayette County?
Median Family Income in Fayette County is $73,849.
What is the Median Household income in Fayette County?
Median Household Income in Fayette County is $55,579.
What is Income or Wage Gap in Fayette County?
Income or Wage Gap in Fayette County is 35.6%.
Women in Fayette County earn 64.4 cents for every dollar earned by a man.
What is Family Income Deficit in Fayette County?
Family Income Deficit in Fayette County is $10,353.
Families that are below poverty line in Fayette County earn $10,353 less on average than the poverty threshold level.
What is Inequality or Gini Index in Fayette County?
Inequality or Gini Index in Fayette County is 0.45.
What is the Total Population of Fayette County?
Total Population of Fayette County is 128,417.
What is the Total Male Population of Fayette County?
Total Male Population of Fayette County is 64,341.
What is the Total Female Population of Fayette County?
Total Female Population of Fayette County is 64,076.
What is the Ratio of Males per 100 Females in Fayette County?
There are 100.41 Males per 100 Females in Fayette County.
What is the Ratio of Females per 100 Males in Fayette County?
There are 99.59 Females per 100 Males in Fayette County.
What is the Median Population Age in Fayette County?
Median Population Age in Fayette County is 45.2 Years.
What is the Average Family Size in Fayette County
Average Family Size in Fayette County is 2.8 People.
What is the Average Household Size in Fayette County
Average Household Size in Fayette County is 2.2 People.
How Large is the Labor Force in Fayette County?
There are 58,576 People in the Labor Forcein in Fayette County.
What is the Percentage of People in the Labor Force in Fayette County?
54.8% of People are in the Labor Force in Fayette County.
What is the Unemployment Rate in Fayette County?
Unemployment Rate in Fayette County is 7.2%.