Elk County, PA Map & Demographics
Elk County Map
Elk County Overview
$34,222
PER CAPITA INCOME
$81,017
AVG FAMILY INCOME
$61,672
AVG HOUSEHOLD INCOME
30.6%
WAGE / INCOME GAP [ % ]
69.4¢/ $1
WAGE / INCOME GAP [ $ ]
$10,759
FAMILY INCOME DEFICIT
0.42
INEQUALITY / GINI INDEX
30,886
TOTAL POPULATION
15,773
MALE POPULATION
15,113
FEMALE POPULATION
104.37
MALES / 100 FEMALES
95.82
FEMALES / 100 MALES
48.2
MEDIAN AGE
2.9
AVG FAMILY SIZE
2.3
AVG HOUSEHOLD SIZE
16,022
LABOR FORCE [ PEOPLE ]
62.3%
PERCENT IN LABOR FORCE
6.5%
UNEMPLOYMENT RATE
Elk County Area Codes
Income in Elk County
Income Overview in Elk County
Per Capita Income in Elk County is $34,222, while median incomes of families and households are $81,017 and $61,672 respectively.
| Characteristic | Number | Measure |
| Per Capita Income | 30,886 | $34,222 |
| Median Family Income | 8,129 | $81,017 |
| Mean Family Income | 8,129 | $96,467 |
| Median Household Income | 13,485 | $61,672 |
| Mean Household Income | 13,485 | $76,855 |
| Income Deficit | 8,129 | $10,759 |
| Wage / Income Gap (%) | 30,886 | 30.62% |
| Wage / Income Gap ($) | 30,886 | 69.38¢ per $1 |
| Gini / Inequality Index | 30,886 | 0.42 |
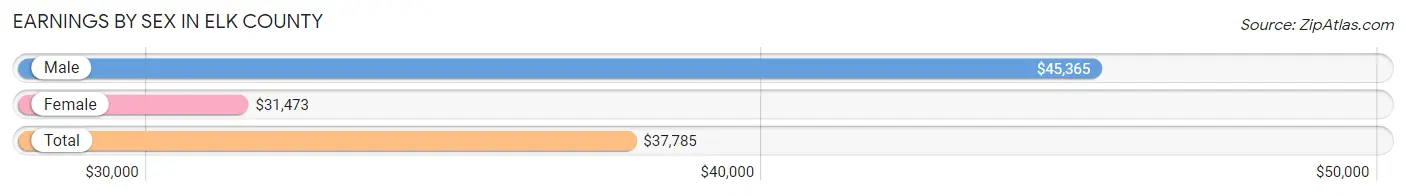
Earnings by Sex in Elk County
Average Earnings in Elk County are $37,785, $45,365 for men and $31,473 for women, a difference of 30.6%.
| Sex | Number | Average Earnings |
| Male | 8,898 (53.2%) | $45,365 |
| Female | 7,814 (46.8%) | $31,473 |
| Total | 16,712 (100.0%) | $37,785 |
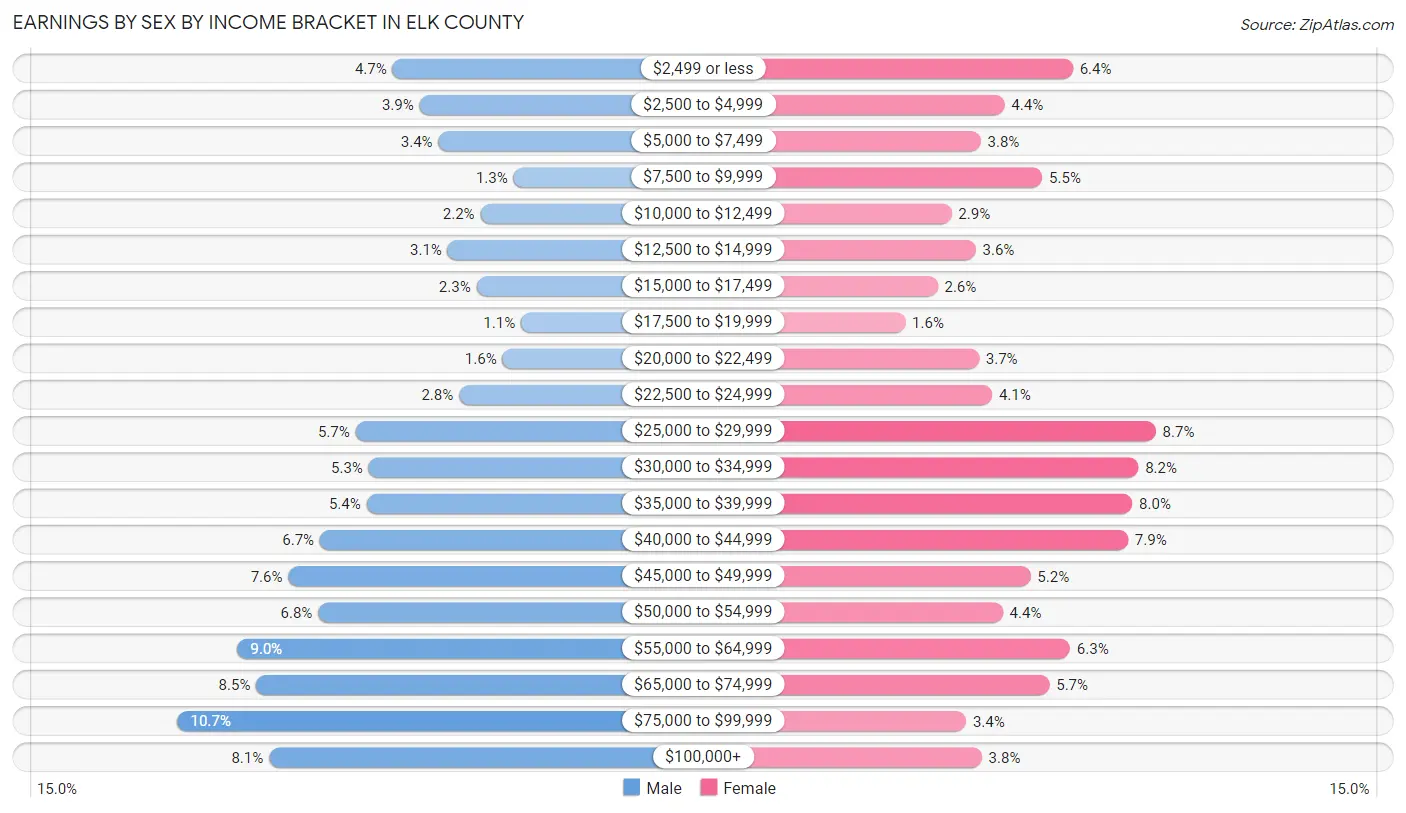
Earnings by Sex by Income Bracket in Elk County
The most common earnings brackets in Elk County are $75,000 to $99,999 for men (952 | 10.7%) and $25,000 to $29,999 for women (678 | 8.7%).
| Income | Male | Female |
| $2,499 or less | 415 (4.7%) | 496 (6.4%) |
| $2,500 to $4,999 | 347 (3.9%) | 346 (4.4%) |
| $5,000 to $7,499 | 300 (3.4%) | 294 (3.8%) |
| $7,500 to $9,999 | 112 (1.3%) | 429 (5.5%) |
| $10,000 to $12,499 | 195 (2.2%) | 230 (2.9%) |
| $12,500 to $14,999 | 277 (3.1%) | 283 (3.6%) |
| $15,000 to $17,499 | 205 (2.3%) | 199 (2.5%) |
| $17,500 to $19,999 | 93 (1.1%) | 128 (1.6%) |
| $20,000 to $22,499 | 140 (1.6%) | 290 (3.7%) |
| $22,500 to $24,999 | 248 (2.8%) | 319 (4.1%) |
| $25,000 to $29,999 | 507 (5.7%) | 678 (8.7%) |
| $30,000 to $34,999 | 474 (5.3%) | 640 (8.2%) |
| $35,000 to $39,999 | 480 (5.4%) | 627 (8.0%) |
| $40,000 to $44,999 | 596 (6.7%) | 617 (7.9%) |
| $45,000 to $49,999 | 675 (7.6%) | 403 (5.2%) |
| $50,000 to $54,999 | 601 (6.8%) | 342 (4.4%) |
| $55,000 to $64,999 | 803 (9.0%) | 490 (6.3%) |
| $65,000 to $74,999 | 755 (8.5%) | 445 (5.7%) |
| $75,000 to $99,999 | 952 (10.7%) | 262 (3.4%) |
| $100,000+ | 723 (8.1%) | 296 (3.8%) |
| Total | 8,898 (100.0%) | 7,814 (100.0%) |
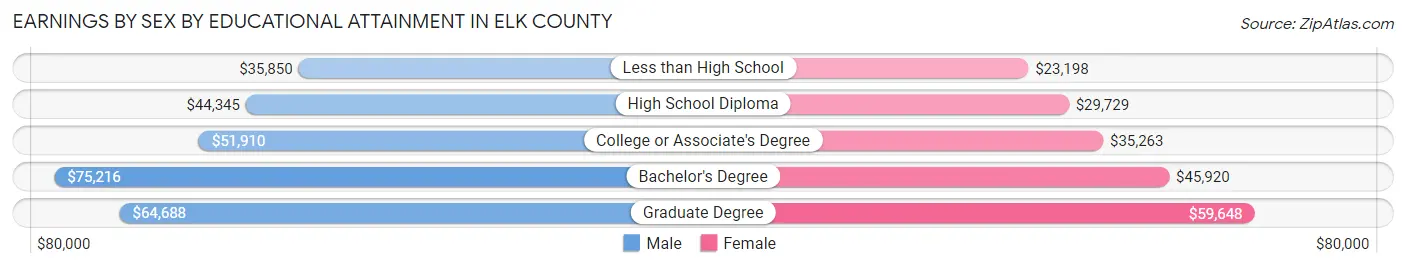
Earnings by Sex by Educational Attainment in Elk County
Average earnings in Elk County are $48,170 for men and $35,200 for women, a difference of 26.9%. Men with an educational attainment of bachelor's degree enjoy the highest average annual earnings of $75,216, while those with less than high school education earn the least with $35,850. Women with an educational attainment of graduate degree earn the most with the average annual earnings of $59,648, while those with less than high school education have the smallest earnings of $23,198.
| Educational Attainment | Male Income | Female Income |
| Less than High School | $35,850 | $23,198 |
| High School Diploma | $44,345 | $29,729 |
| College or Associate's Degree | $51,910 | $35,263 |
| Bachelor's Degree | $75,216 | $45,920 |
| Graduate Degree | $64,688 | $59,648 |
| Total | $48,170 | $35,200 |
Family Income in Elk County
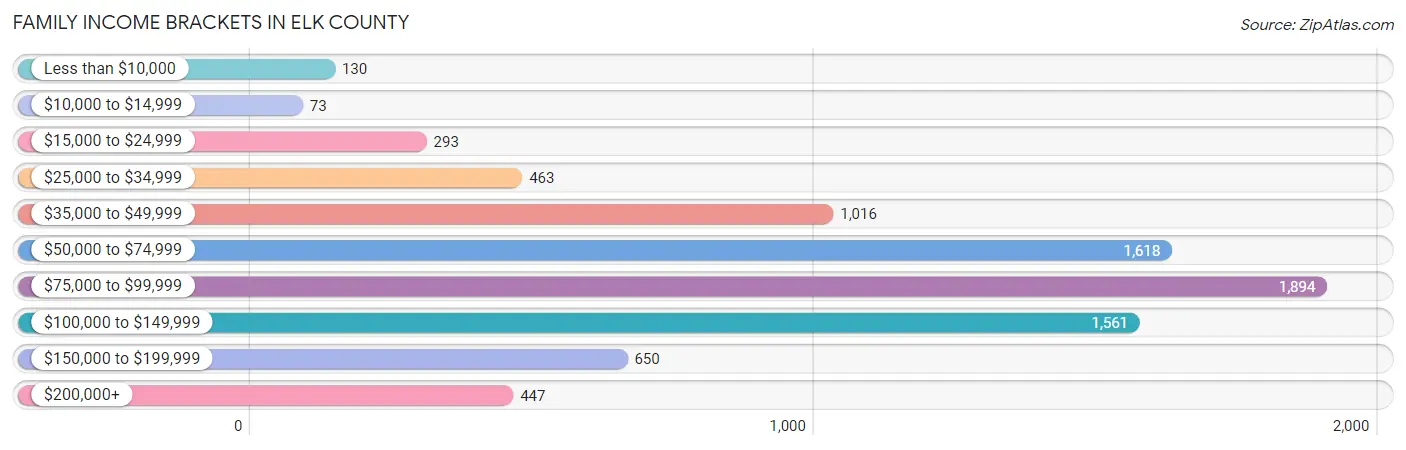
Family Income Brackets in Elk County
According to the Elk County family income data, there are 1,894 families falling into the $75,000 to $99,999 income range, which is the most common income bracket and makes up 23.3% of all families. Conversely, the $10,000 to $14,999 income bracket is the least frequent group with only 73 families (0.9%) belonging to this category.
| Income Bracket | # Families | % Families |
| Less than $10,000 | 130 | 1.6% |
| $10,000 to $14,999 | 73 | 0.9% |
| $15,000 to $24,999 | 293 | 3.6% |
| $25,000 to $34,999 | 463 | 5.7% |
| $35,000 to $49,999 | 1,016 | 12.5% |
| $50,000 to $74,999 | 1,618 | 19.9% |
| $75,000 to $99,999 | 1,894 | 23.3% |
| $100,000 to $149,999 | 1,561 | 19.2% |
| $150,000 to $199,999 | 650 | 8.0% |
| $200,000+ | 447 | 5.5% |
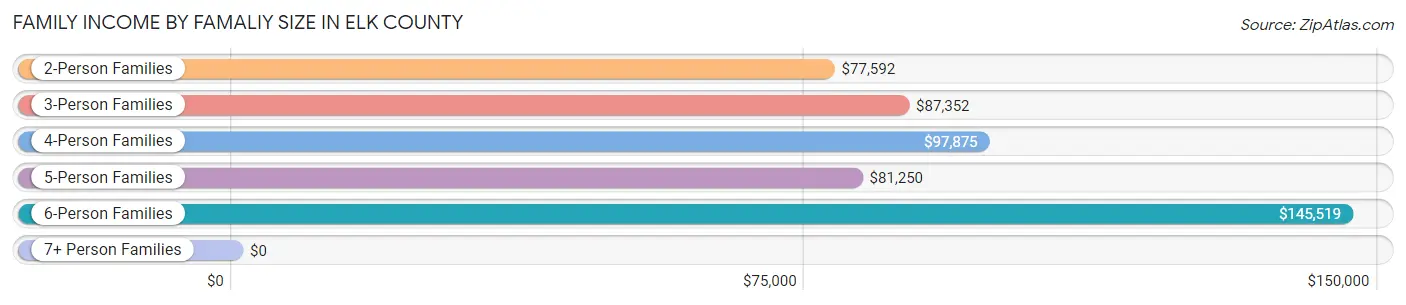
Family Income by Famaliy Size in Elk County
6-person families (176 | 2.2%) account for the highest median family income in Elk County with $145,519 per family, while 2-person families (4,664 | 57.4%) have the highest median income of $38,796 per family member.
| Income Bracket | # Families | Median Income |
| 2-Person Families | 4,664 (57.4%) | $77,592 |
| 3-Person Families | 1,663 (20.5%) | $87,352 |
| 4-Person Families | 1,237 (15.2%) | $97,875 |
| 5-Person Families | 386 (4.8%) | $81,250 |
| 6-Person Families | 176 (2.2%) | $145,519 |
| 7+ Person Families | 3 (0.0%) | $0 |
| Total | 8,129 (100.0%) | $81,017 |
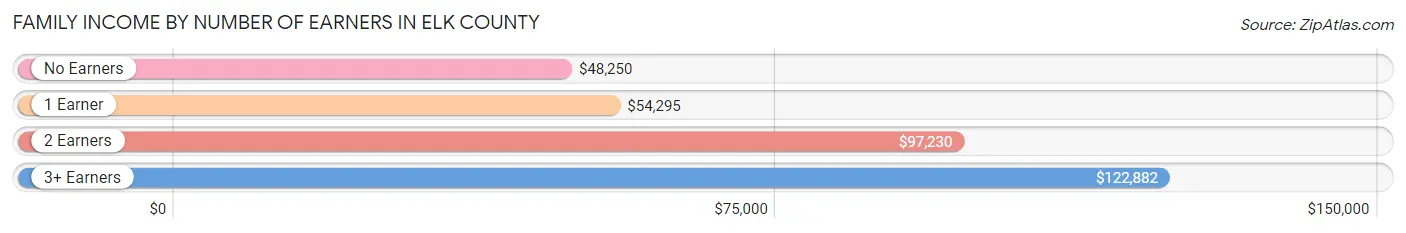
Family Income by Number of Earners in Elk County
The median family income in Elk County is $81,017, with families comprising 3+ earners (961) having the highest median family income of $122,882, while families with no earners (1,349) have the lowest median family income of $48,250, accounting for 11.8% and 16.6% of families, respectively.
| Number of Earners | # Families | Median Income |
| No Earners | 1,349 (16.6%) | $48,250 |
| 1 Earner | 2,380 (29.3%) | $54,295 |
| 2 Earners | 3,439 (42.3%) | $97,230 |
| 3+ Earners | 961 (11.8%) | $122,882 |
| Total | 8,129 (100.0%) | $81,017 |
Household Income in Elk County
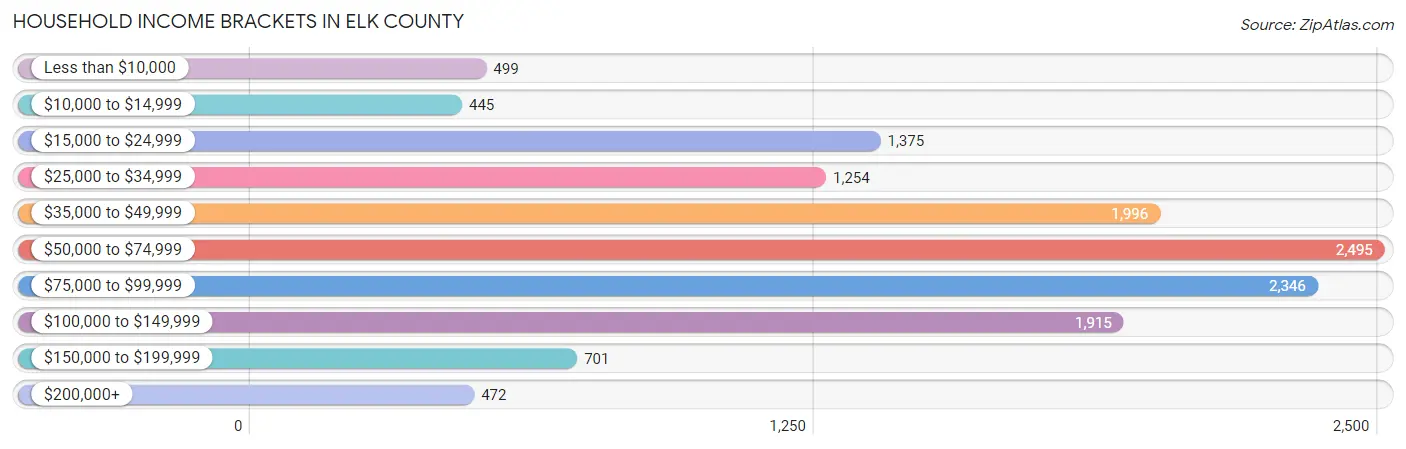
Household Income Brackets in Elk County
With 2,495 households falling in the category, the $50,000 to $74,999 income range is the most frequent in Elk County, accounting for 18.5% of all households. In contrast, only 445 households (3.3%) fall into the $10,000 to $14,999 income bracket, making it the least populous group.
| Income Bracket | # Households | % Households |
| Less than $10,000 | 499 | 3.7% |
| $10,000 to $14,999 | 445 | 3.3% |
| $15,000 to $24,999 | 1,375 | 10.2% |
| $25,000 to $34,999 | 1,254 | 9.3% |
| $35,000 to $49,999 | 1,996 | 14.8% |
| $50,000 to $74,999 | 2,495 | 18.5% |
| $75,000 to $99,999 | 2,346 | 17.4% |
| $100,000 to $149,999 | 1,915 | 14.2% |
| $150,000 to $199,999 | 701 | 5.2% |
| $200,000+ | 472 | 3.5% |
Household Income by Householder Age in Elk County
The median household income in Elk County is $61,672, with the highest median household income of $77,401 found in the 45 to 64 years age bracket for the primary householder. A total of 5,540 households (41.1%) fall into this category. Meanwhile, the 15 to 24 years age bracket for the primary householder has the lowest median household income of $34,688, with 239 households (1.8%) in this group.
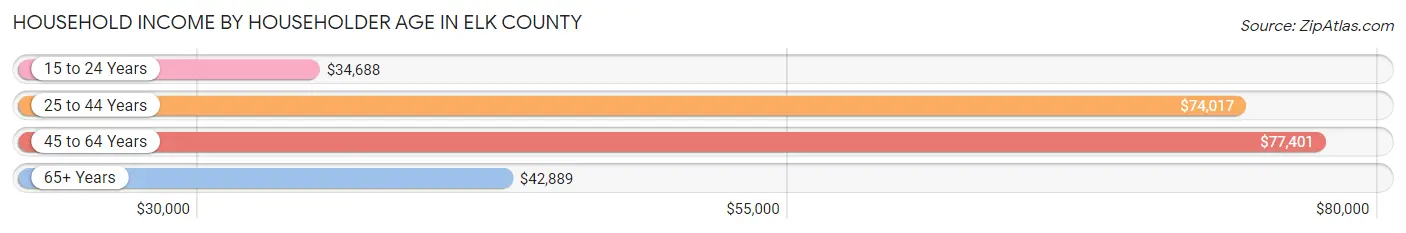
| Income Bracket | # Households | Median Income |
| 15 to 24 Years | 239 (1.8%) | $34,688 |
| 25 to 44 Years | 3,086 (22.9%) | $74,017 |
| 45 to 64 Years | 5,540 (41.1%) | $77,401 |
| 65+ Years | 4,620 (34.3%) | $42,889 |
| Total | 13,485 (100.0%) | $61,672 |
Poverty in Elk County
Income Below Poverty by Sex and Age in Elk County
With 8.0% poverty level for males and 10.0% for females among the residents of Elk County, under 5 year old males and 18 to 24 year old females are the most vulnerable to poverty, with 136 males (19.3%) and 212 females (20.1%) in their respective age groups living below the poverty level.
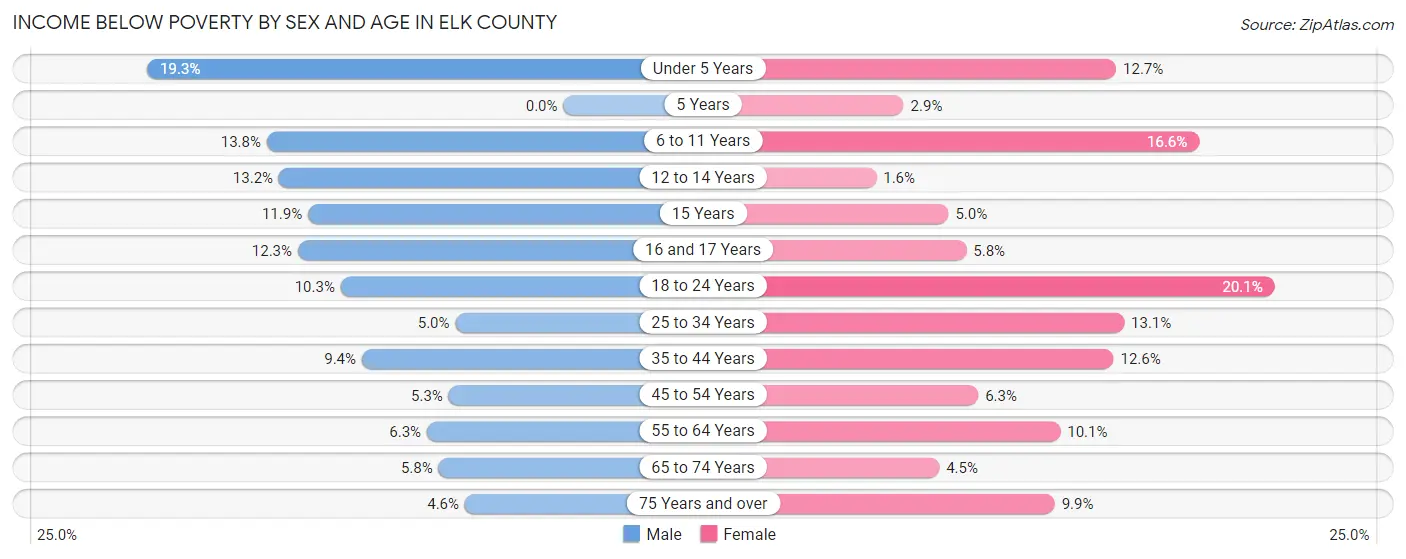
| Age Bracket | Male | Female |
| Under 5 Years | 136 (19.3%) | 91 (12.7%) |
| 5 Years | 0 (0.0%) | 7 (2.9%) |
| 6 to 11 Years | 141 (13.8%) | 129 (16.6%) |
| 12 to 14 Years | 85 (13.2%) | 9 (1.6%) |
| 15 Years | 16 (11.8%) | 9 (5.0%) |
| 16 and 17 Years | 51 (12.3%) | 20 (5.8%) |
| 18 to 24 Years | 121 (10.3%) | 212 (20.1%) |
| 25 to 34 Years | 80 (5.0%) | 182 (13.1%) |
| 35 to 44 Years | 155 (9.3%) | 199 (12.6%) |
| 45 to 54 Years | 115 (5.3%) | 129 (6.3%) |
| 55 to 64 Years | 174 (6.3%) | 247 (10.1%) |
| 65 to 74 Years | 113 (5.8%) | 87 (4.5%) |
| 75 Years and over | 57 (4.6%) | 168 (9.9%) |
| Total | 1,244 (8.0%) | 1,489 (10.0%) |
Income Above Poverty by Sex and Age in Elk County
According to the poverty statistics in Elk County, males aged 5 years and females aged 12 to 14 years are the age groups that are most secure financially, with 100.0% of males and 98.4% of females in these age groups living above the poverty line.
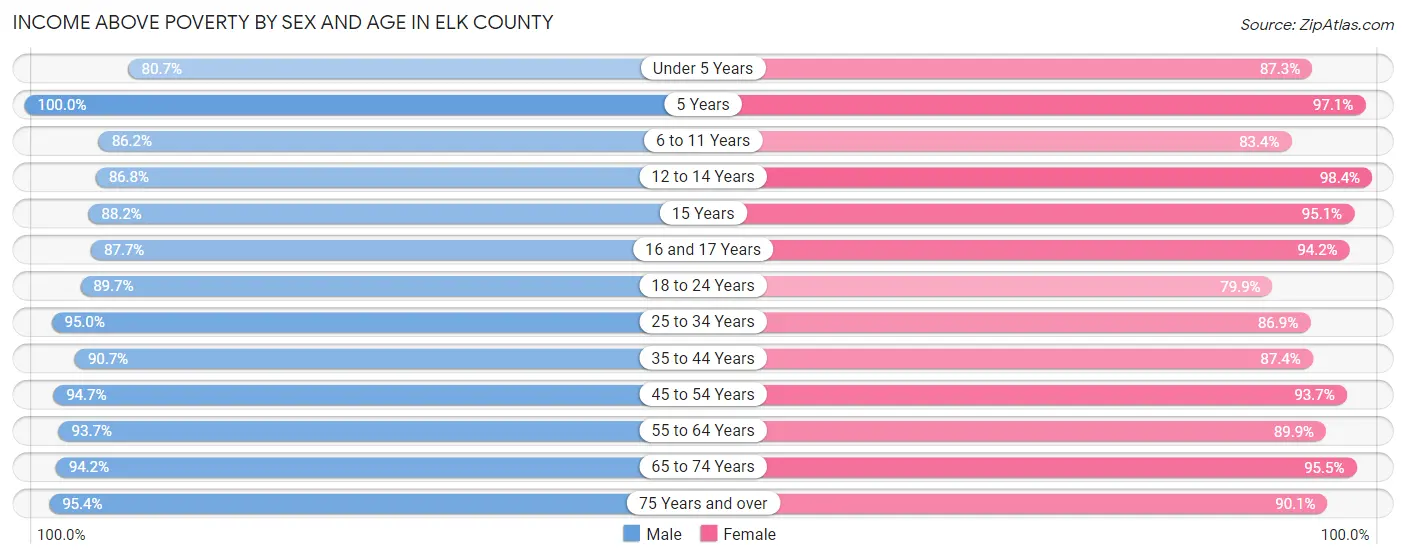
| Age Bracket | Male | Female |
| Under 5 Years | 568 (80.7%) | 624 (87.3%) |
| 5 Years | 91 (100.0%) | 237 (97.1%) |
| 6 to 11 Years | 884 (86.2%) | 649 (83.4%) |
| 12 to 14 Years | 559 (86.8%) | 554 (98.4%) |
| 15 Years | 119 (88.1%) | 173 (95.1%) |
| 16 and 17 Years | 363 (87.7%) | 326 (94.2%) |
| 18 to 24 Years | 1,050 (89.7%) | 844 (79.9%) |
| 25 to 34 Years | 1,516 (95.0%) | 1,207 (86.9%) |
| 35 to 44 Years | 1,502 (90.6%) | 1,379 (87.4%) |
| 45 to 54 Years | 2,046 (94.7%) | 1,910 (93.7%) |
| 55 to 64 Years | 2,573 (93.7%) | 2,188 (89.9%) |
| 65 to 74 Years | 1,840 (94.2%) | 1,837 (95.5%) |
| 75 Years and over | 1,189 (95.4%) | 1,533 (90.1%) |
| Total | 14,300 (92.0%) | 13,461 (90.0%) |
Income Below Poverty Among Married-Couple Families in Elk County
The poverty statistics for married-couple families in Elk County show that 1.9% or 123 of the total 6,338 families live below the poverty line. Families with 3 or 4 children have the highest poverty rate of 6.3%, comprising of 24 families. On the other hand, families with no children have the lowest poverty rate of 1.6%, which includes 77 families.
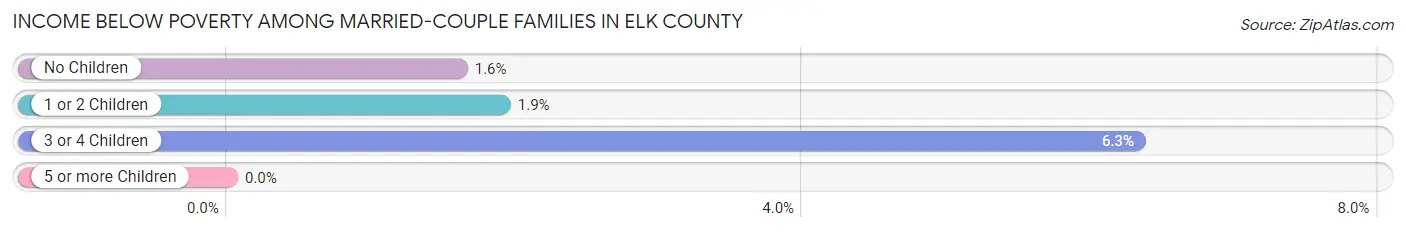
| Children | Above Poverty | Below Poverty |
| No Children | 4,725 (98.4%) | 77 (1.6%) |
| 1 or 2 Children | 1,134 (98.1%) | 22 (1.9%) |
| 3 or 4 Children | 356 (93.7%) | 24 (6.3%) |
| 5 or more Children | 0 (0.0%) | 0 (0.0%) |
| Total | 6,215 (98.1%) | 123 (1.9%) |
Income Below Poverty Among Single-Parent Households in Elk County
According to the poverty data in Elk County, 12.7% or 86 single-father households and 14.1% or 157 single-mother households are living below the poverty line. Among single-father households, those with 3 or 4 children have the highest poverty rate, with 52 households (81.2%) experiencing poverty. Likewise, among single-mother households, those with 3 or 4 children have the highest poverty rate, with 36 households (25.0%) falling below the poverty line.
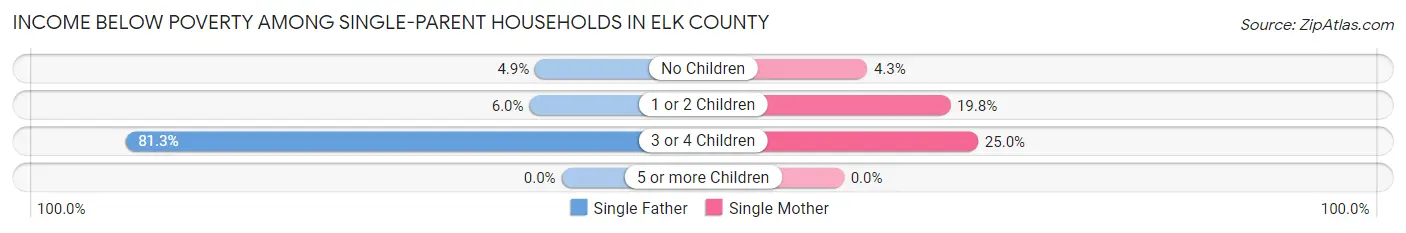
| Children | Single Father | Single Mother |
| No Children | 12 (4.9%) | 20 (4.3%) |
| 1 or 2 Children | 22 (6.0%) | 101 (19.8%) |
| 3 or 4 Children | 52 (81.2%) | 36 (25.0%) |
| 5 or more Children | 0 (0.0%) | 0 (0.0%) |
| Total | 86 (12.7%) | 157 (14.1%) |
Income Below Poverty Among Married-Couple vs Single-Parent Households in Elk County
The poverty data for Elk County shows that 123 of the married-couple family households (1.9%) and 243 of the single-parent households (13.6%) are living below the poverty level. Within the married-couple family households, those with 3 or 4 children have the highest poverty rate, with 24 households (6.3%) falling below the poverty line. Among the single-parent households, those with 3 or 4 children have the highest poverty rate, with 88 household (42.3%) living below poverty.
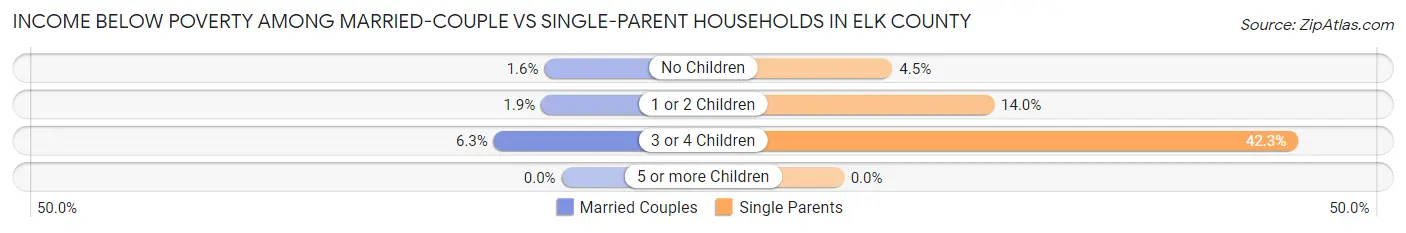
| Children | Married-Couple Families | Single-Parent Households |
| No Children | 77 (1.6%) | 32 (4.5%) |
| 1 or 2 Children | 22 (1.9%) | 123 (14.0%) |
| 3 or 4 Children | 24 (6.3%) | 88 (42.3%) |
| 5 or more Children | 0 (0.0%) | 0 (0.0%) |
| Total | 123 (1.9%) | 243 (13.6%) |
Race in Elk County
The most populous races in Elk County are White / Caucasian (29,653 | 96.0%), Two or more Races (826 | 2.7%), and Hispanic or Latino (259 | 0.8%).
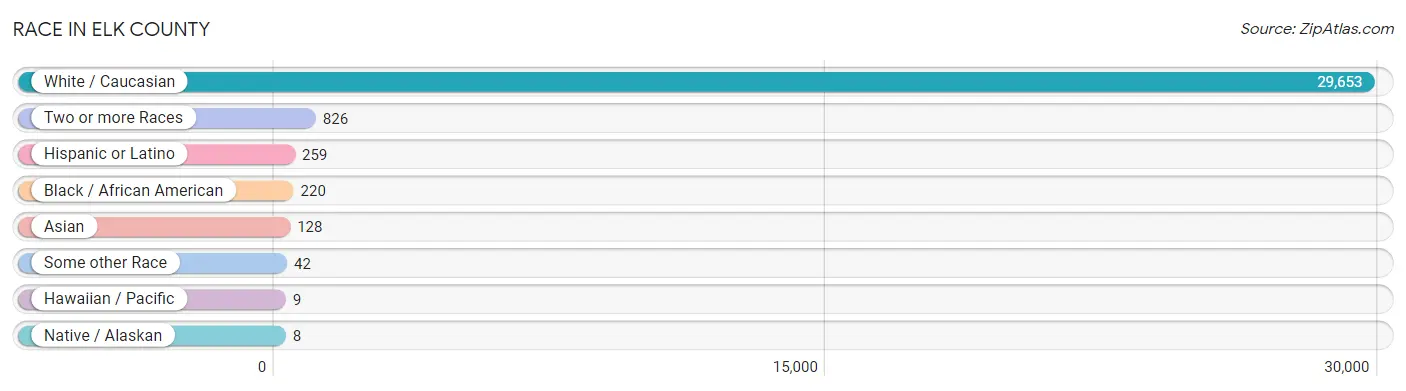
| Race | # Population | % Population |
| Asian | 128 | 0.4% |
| Black / African American | 220 | 0.7% |
| Hawaiian / Pacific | 9 | 0.0% |
| Hispanic or Latino | 259 | 0.8% |
| Native / Alaskan | 8 | 0.0% |
| White / Caucasian | 29,653 | 96.0% |
| Two or more Races | 826 | 2.7% |
| Some other Race | 42 | 0.1% |
| Total | 30,886 | 100.0% |
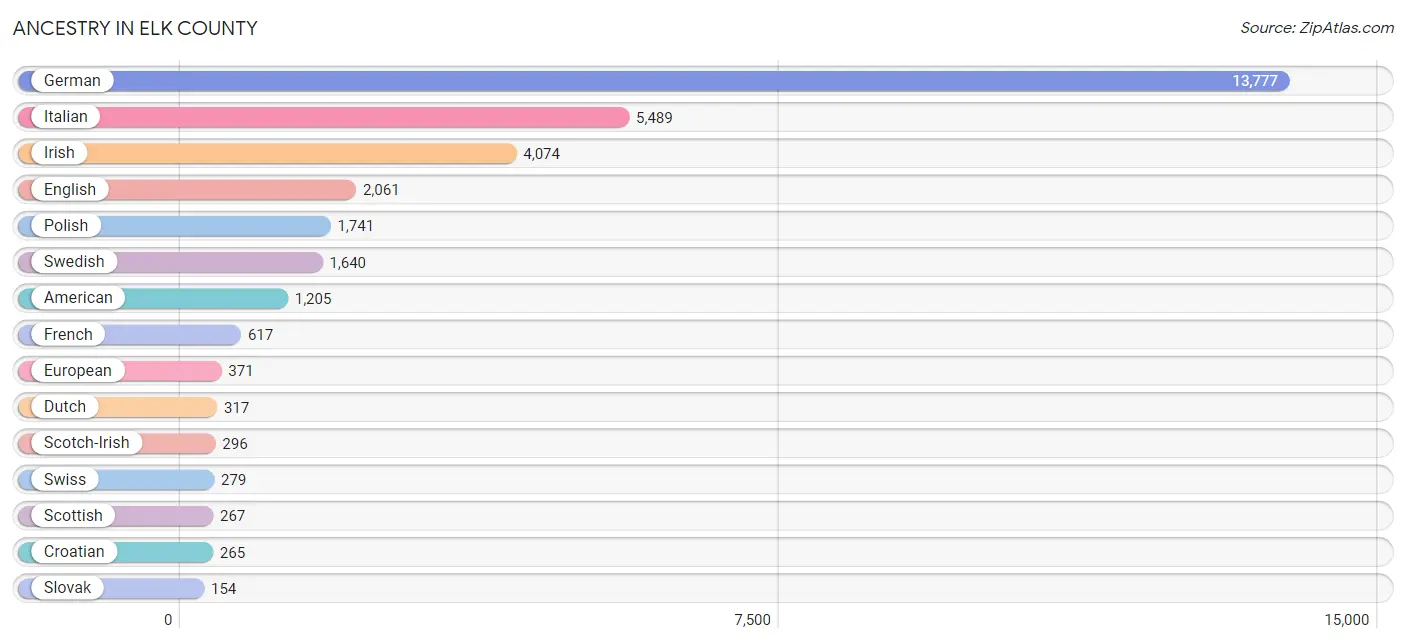
Ancestry in Elk County
The most populous ancestries reported in Elk County are German (13,777 | 44.6%), Italian (5,489 | 17.8%), Irish (4,074 | 13.2%), English (2,061 | 6.7%), and Polish (1,741 | 5.6%), together accounting for 87.9% of all Elk County residents.
| Ancestry | # Population | % Population |
| African | 7 | 0.0% |
| American | 1,205 | 3.9% |
| Arab | 43 | 0.1% |
| Australian | 13 | 0.0% |
| Austrian | 142 | 0.5% |
| Belgian | 87 | 0.3% |
| Bhutanese | 11 | 0.0% |
| Blackfeet | 35 | 0.1% |
| British | 52 | 0.2% |
| Bulgarian | 2 | 0.0% |
| Cajun | 8 | 0.0% |
| Canadian | 25 | 0.1% |
| Cherokee | 20 | 0.1% |
| Chickasaw | 14 | 0.1% |
| Croatian | 265 | 0.9% |
| Cuban | 35 | 0.1% |
| Czech | 128 | 0.4% |
| Czechoslovakian | 74 | 0.2% |
| Danish | 11 | 0.0% |
| Dominican | 3 | 0.0% |
| Dutch | 317 | 1.0% |
| Eastern European | 39 | 0.1% |
| English | 2,061 | 6.7% |
| European | 371 | 1.2% |
| French | 617 | 2.0% |
| French American Indian | 5 | 0.0% |
| French Canadian | 79 | 0.3% |
| German | 13,777 | 44.6% |
| Greek | 106 | 0.3% |
| Guamanian / Chamorro | 9 | 0.0% |
| Hungarian | 104 | 0.3% |
| Indian (Asian) | 64 | 0.2% |
| Irish | 4,074 | 13.2% |
| Israeli | 8 | 0.0% |
| Italian | 5,489 | 17.8% |
| Korean | 98 | 0.3% |
| Lebanese | 26 | 0.1% |
| Lithuanian | 17 | 0.1% |
| Macedonian | 15 | 0.1% |
| Mexican | 126 | 0.4% |
| Mexican American Indian | 5 | 0.0% |
| Northern European | 56 | 0.2% |
| Norwegian | 54 | 0.2% |
| Pakistani | 6 | 0.0% |
| Pennsylvania German | 75 | 0.2% |
| Polish | 1,741 | 5.6% |
| Portuguese | 6 | 0.0% |
| Puerto Rican | 72 | 0.2% |
| Russian | 37 | 0.1% |
| Scandinavian | 59 | 0.2% |
| Scotch-Irish | 296 | 1.0% |
| Scottish | 267 | 0.9% |
| Serbian | 21 | 0.1% |
| Slavic | 46 | 0.2% |
| Slovak | 154 | 0.5% |
| Slovene | 149 | 0.5% |
| Subsaharan African | 7 | 0.0% |
| Swedish | 1,640 | 5.3% |
| Swiss | 279 | 0.9% |
| Syrian | 17 | 0.1% |
| Turkish | 1 | 0.0% |
| Ukrainian | 93 | 0.3% |
| Welsh | 88 | 0.3% |
| Yugoslavian | 62 | 0.2% | View All 64 Rows |
Immigrants in Elk County
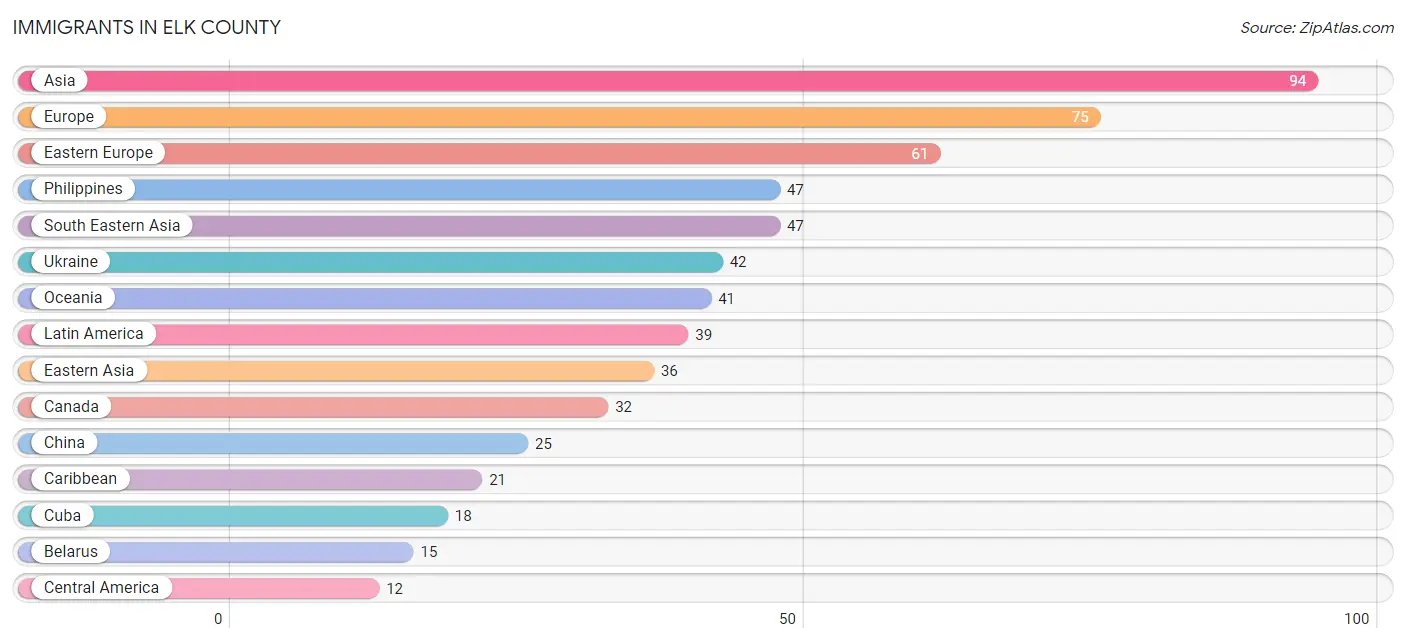
The most numerous immigrant groups reported in Elk County came from Asia (94 | 0.3%), Europe (75 | 0.2%), Eastern Europe (61 | 0.2%), Philippines (47 | 0.2%), and South Eastern Asia (47 | 0.2%), together accounting for 1.0% of all Elk County residents.
| Immigration Origin | # Population | % Population |
| Asia | 94 | 0.3% |
| Australia | 2 | 0.0% |
| Austria | 6 | 0.0% |
| Belarus | 15 | 0.1% |
| Canada | 32 | 0.1% |
| Caribbean | 21 | 0.1% |
| Central America | 12 | 0.0% |
| China | 25 | 0.1% |
| Colombia | 6 | 0.0% |
| Cuba | 18 | 0.1% |
| Eastern Asia | 36 | 0.1% |
| Eastern Europe | 61 | 0.2% |
| Europe | 75 | 0.2% |
| Germany | 4 | 0.0% |
| Israel | 8 | 0.0% |
| Italy | 4 | 0.0% |
| Japan | 11 | 0.0% |
| Latin America | 39 | 0.1% |
| Mexico | 12 | 0.0% |
| Oceania | 41 | 0.1% |
| Philippines | 47 | 0.2% |
| Poland | 4 | 0.0% |
| Saudi Arabia | 3 | 0.0% |
| South America | 6 | 0.0% |
| South Eastern Asia | 47 | 0.2% |
| Southern Europe | 4 | 0.0% |
| St. Vincent and the Grenadines | 3 | 0.0% |
| Ukraine | 42 | 0.1% |
| Western Asia | 11 | 0.0% |
| Western Europe | 10 | 0.0% | View All 30 Rows |
Sex and Age in Elk County
Sex and Age in Elk County
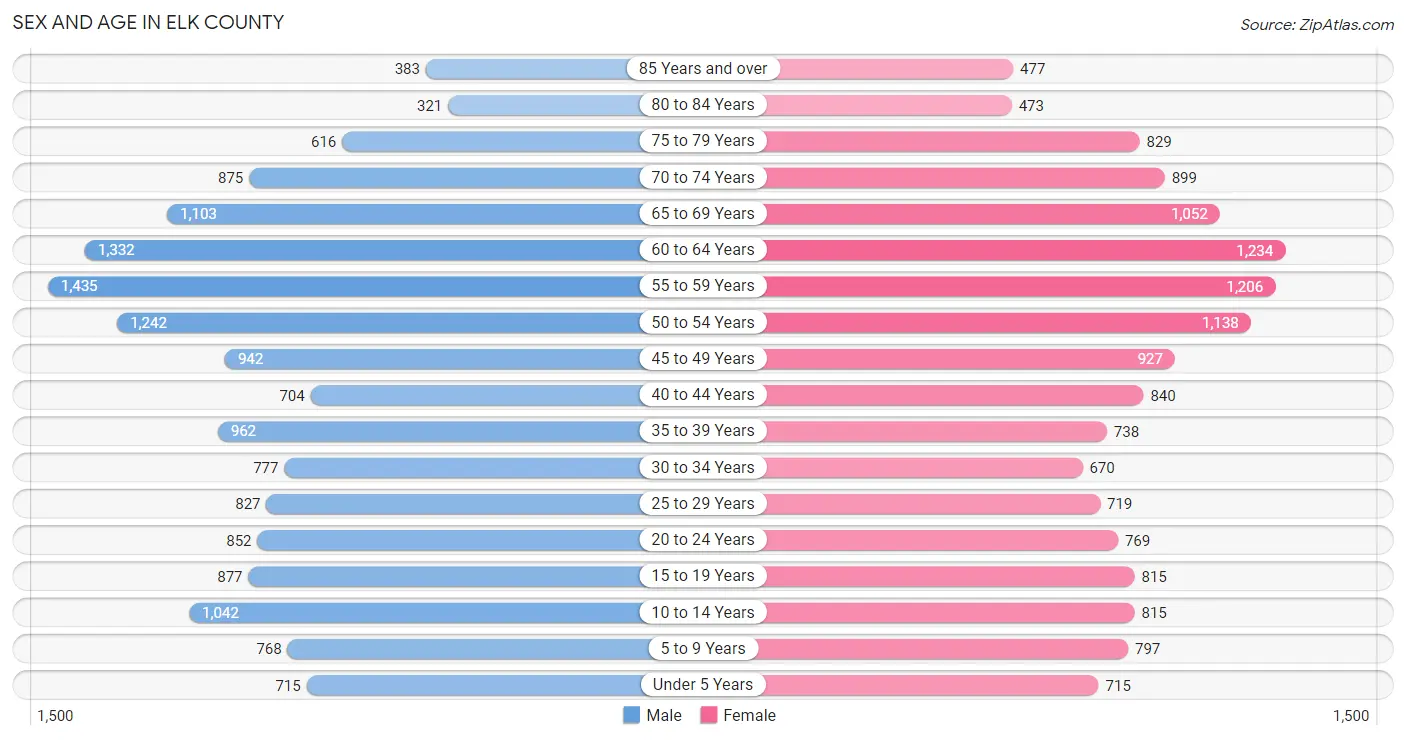
The most populous age groups in Elk County are 55 to 59 Years (1,435 | 9.1%) for men and 60 to 64 Years (1,234 | 8.2%) for women.
| Age Bracket | Male | Female |
| Under 5 Years | 715 (4.5%) | 715 (4.7%) |
| 5 to 9 Years | 768 (4.9%) | 797 (5.3%) |
| 10 to 14 Years | 1,042 (6.6%) | 815 (5.4%) |
| 15 to 19 Years | 877 (5.6%) | 815 (5.4%) |
| 20 to 24 Years | 852 (5.4%) | 769 (5.1%) |
| 25 to 29 Years | 827 (5.2%) | 719 (4.8%) |
| 30 to 34 Years | 777 (4.9%) | 670 (4.4%) |
| 35 to 39 Years | 962 (6.1%) | 738 (4.9%) |
| 40 to 44 Years | 704 (4.5%) | 840 (5.6%) |
| 45 to 49 Years | 942 (6.0%) | 927 (6.1%) |
| 50 to 54 Years | 1,242 (7.9%) | 1,138 (7.5%) |
| 55 to 59 Years | 1,435 (9.1%) | 1,206 (8.0%) |
| 60 to 64 Years | 1,332 (8.4%) | 1,234 (8.2%) |
| 65 to 69 Years | 1,103 (7.0%) | 1,052 (7.0%) |
| 70 to 74 Years | 875 (5.6%) | 899 (5.9%) |
| 75 to 79 Years | 616 (3.9%) | 829 (5.5%) |
| 80 to 84 Years | 321 (2.0%) | 473 (3.1%) |
| 85 Years and over | 383 (2.4%) | 477 (3.2%) |
| Total | 15,773 (100.0%) | 15,113 (100.0%) |
Families and Households in Elk County
Median Family Size in Elk County
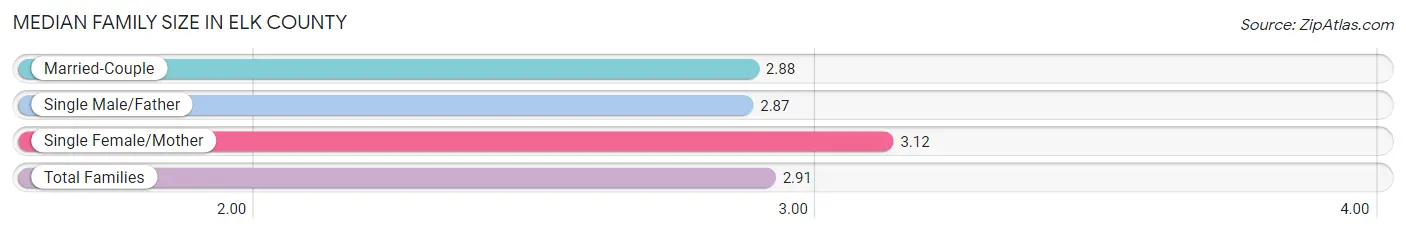
The median family size in Elk County is 2.91 persons per family, with single female/mother families (1,115 | 13.7%) accounting for the largest median family size of 3.12 persons per family. On the other hand, single male/father families (676 | 8.3%) represent the smallest median family size with 2.87 persons per family.
| Family Type | # Families | Family Size |
| Married-Couple | 6,338 (78.0%) | 2.88 |
| Single Male/Father | 676 (8.3%) | 2.87 |
| Single Female/Mother | 1,115 (13.7%) | 3.12 |
| Total Families | 8,129 (100.0%) | 2.91 |
Median Household Size in Elk County
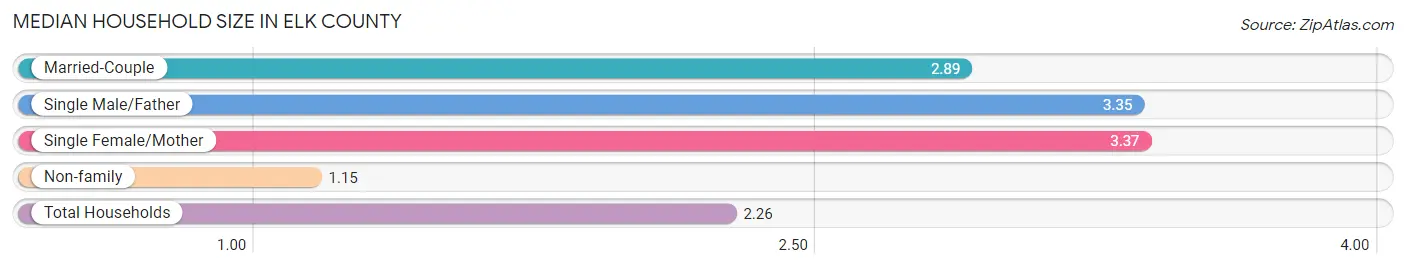
The median household size in Elk County is 2.26 persons per household, with single female/mother households (1,115 | 8.3%) accounting for the largest median household size of 3.37 persons per household. non-family households (5,356 | 39.7%) represent the smallest median household size with 1.15 persons per household.
| Household Type | # Households | Household Size |
| Married-Couple | 6,338 (47.0%) | 2.89 |
| Single Male/Father | 676 (5.0%) | 3.35 |
| Single Female/Mother | 1,115 (8.3%) | 3.37 |
| Non-family | 5,356 (39.7%) | 1.15 |
| Total Households | 13,485 (100.0%) | 2.26 |
Household Size by Marriage Status in Elk County
Out of a total of 13,485 households in Elk County, 8,129 (60.3%) are family households, while 5,356 (39.7%) are nonfamily households. The most numerous type of family households are 2-person households, comprising 4,433, and the most common type of nonfamily households are 1-person households, comprising 4,689.
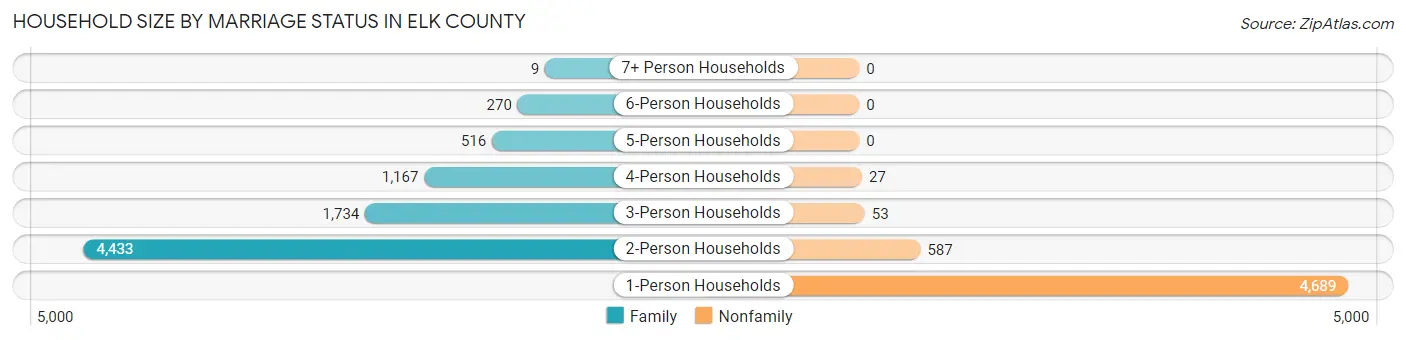
| Household Size | Family Households | Nonfamily Households |
| 1-Person Households | - | 4,689 (34.8%) |
| 2-Person Households | 4,433 (32.9%) | 587 (4.3%) |
| 3-Person Households | 1,734 (12.9%) | 53 (0.4%) |
| 4-Person Households | 1,167 (8.6%) | 27 (0.2%) |
| 5-Person Households | 516 (3.8%) | 0 (0.0%) |
| 6-Person Households | 270 (2.0%) | 0 (0.0%) |
| 7+ Person Households | 9 (0.1%) | 0 (0.0%) |
| Total | 8,129 (60.3%) | 5,356 (39.7%) |
Female Fertility in Elk County
Fertility by Age in Elk County
Average fertility rate in Elk County is 45.0 births per 1,000 women. Women in the age bracket of 20 to 34 years have the highest fertility rate with 83.0 births per 1,000 women. Women in the age bracket of 20 to 34 years acount for 69.9% of all women with births.
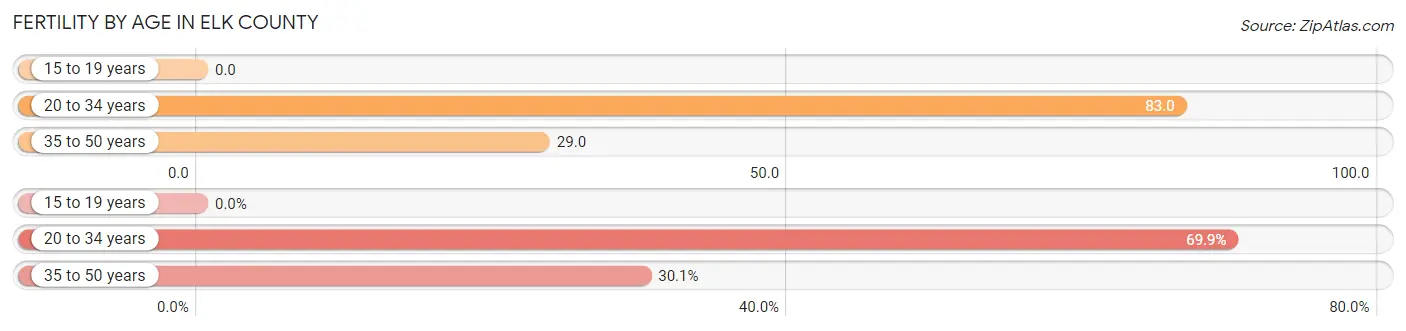
| Age Bracket | Women with Births | Births / 1,000 Women |
| 15 to 19 years | 0 (0.0%) | 0.0 |
| 20 to 34 years | 179 (69.9%) | 83.0 |
| 35 to 50 years | 77 (30.1%) | 29.0 |
| Total | 256 (100.0%) | 45.0 |
Fertility by Age by Marriage Status in Elk County
59.8% of women with births (256) in Elk County are married. The highest percentage of unmarried women with births falls into 20 to 34 years age bracket with 45.8% of them unmarried at the time of birth, while the lowest percentage of unmarried women with births belong to 35 to 50 years age bracket with 27.3% of them unmarried.
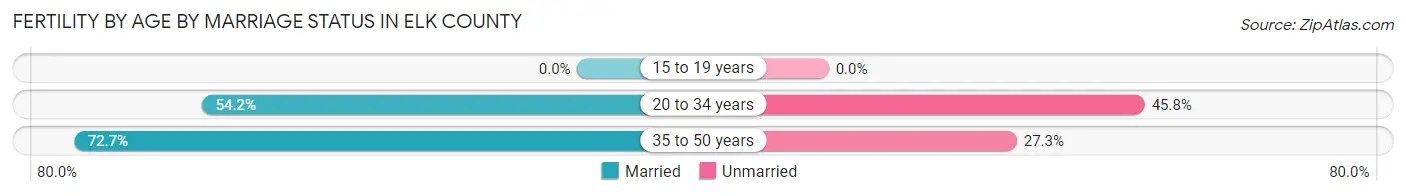
| Age Bracket | Married | Unmarried |
| 15 to 19 years | 0 (0.0%) | 0 (0.0%) |
| 20 to 34 years | 97 (54.2%) | 82 (45.8%) |
| 35 to 50 years | 56 (72.7%) | 21 (27.3%) |
| Total | 153 (59.8%) | 103 (40.2%) |
Fertility by Education in Elk County
Average fertility rate in Elk County is 45.0 births per 1,000 women. Women with the education attainment of bachelor's degree have the highest fertility rate of 106.0 births per 1,000 women, while women with the education attainment of less than high school have the lowest fertility at 2.0 births per 1,000 women. Women with the education attainment of bachelor's degree represent 40.2% of all women with births.
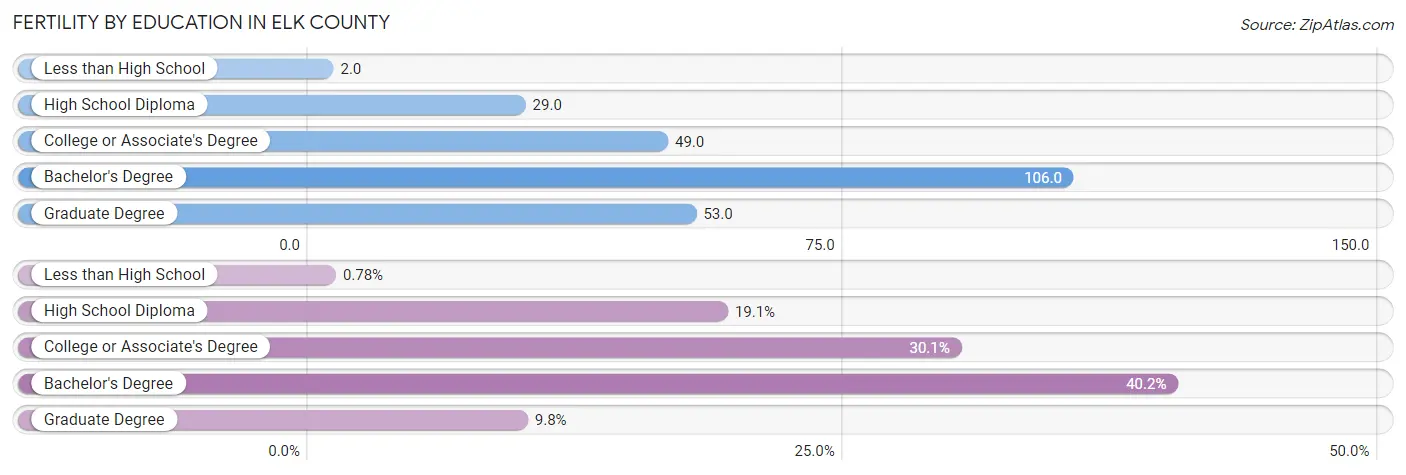
| Educational Attainment | Women with Births | Births / 1,000 Women |
| Less than High School | 2 (0.8%) | 2.0 |
| High School Diploma | 49 (19.1%) | 29.0 |
| College or Associate's Degree | 77 (30.1%) | 49.0 |
| Bachelor's Degree | 103 (40.2%) | 106.0 |
| Graduate Degree | 25 (9.8%) | 53.0 |
| Total | 256 (100.0%) | 45.0 |
Fertility by Education by Marriage Status in Elk County
40.2% of women with births in Elk County are unmarried. Women with the educational attainment of graduate degree are most likely to be married with 100.0% of them married at childbirth, while women with the educational attainment of less than high school are least likely to be married with 100.0% of them unmarried at childbirth.
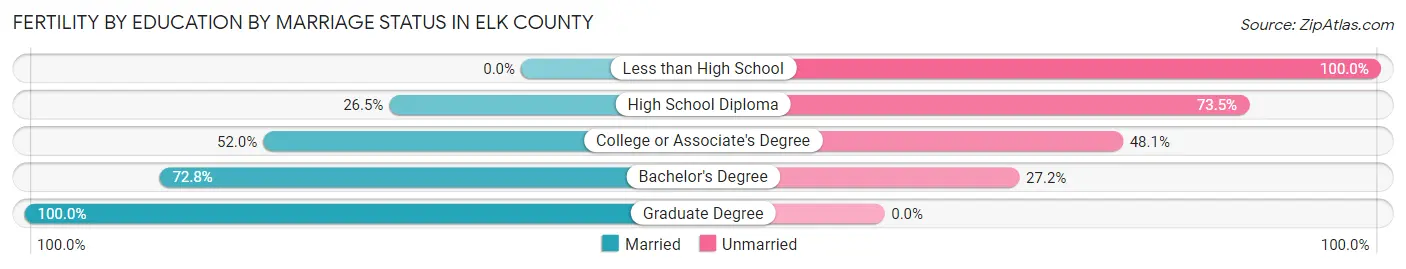
| Educational Attainment | Married | Unmarried |
| Less than High School | 0 (0.0%) | 2 (100.0%) |
| High School Diploma | 13 (26.5%) | 36 (73.5%) |
| College or Associate's Degree | 40 (51.9%) | 37 (48.0%) |
| Bachelor's Degree | 75 (72.8%) | 28 (27.2%) |
| Graduate Degree | 25 (100.0%) | 0 (0.0%) |
| Total | 153 (59.8%) | 103 (40.2%) |
Employment Characteristics in Elk County
Employment by Class of Employer in Elk County
Among the 14,790 employed individuals in Elk County, private company employees (11,073 | 74.9%), not-for-profit organizations (1,842 | 12.4%), and local government employees (581 | 3.9%) make up the most common classes of employment.
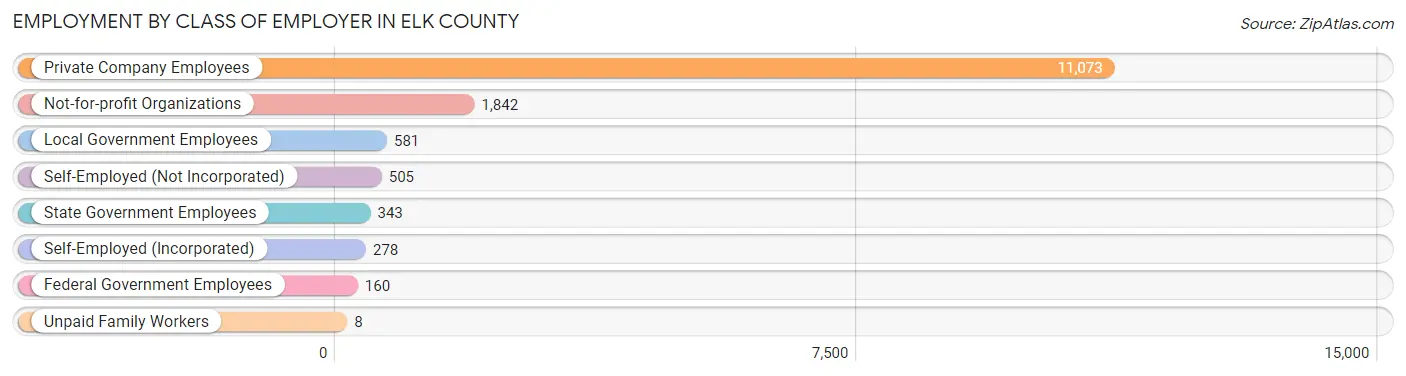
| Employer Class | # Employees | % Employees |
| Private Company Employees | 11,073 | 74.9% |
| Self-Employed (Incorporated) | 278 | 1.9% |
| Self-Employed (Not Incorporated) | 505 | 3.4% |
| Not-for-profit Organizations | 1,842 | 12.4% |
| Local Government Employees | 581 | 3.9% |
| State Government Employees | 343 | 2.3% |
| Federal Government Employees | 160 | 1.1% |
| Unpaid Family Workers | 8 | 0.1% |
| Total | 14,790 | 100.0% |
Employment Status by Age in Elk County
According to the labor force statistics for Elk County, out of the total population over 16 years of age (25,717), 62.3% or 16,022 individuals are in the labor force, with 6.5% or 1,041 of them unemployed. The age group with the highest labor force participation rate is 30 to 34 years, with 94.7% or 1,370 individuals in the labor force. Within the labor force, the 16 to 19 years age range has the highest percentage of unemployed individuals, with 19.2% or 139 of them being unemployed.
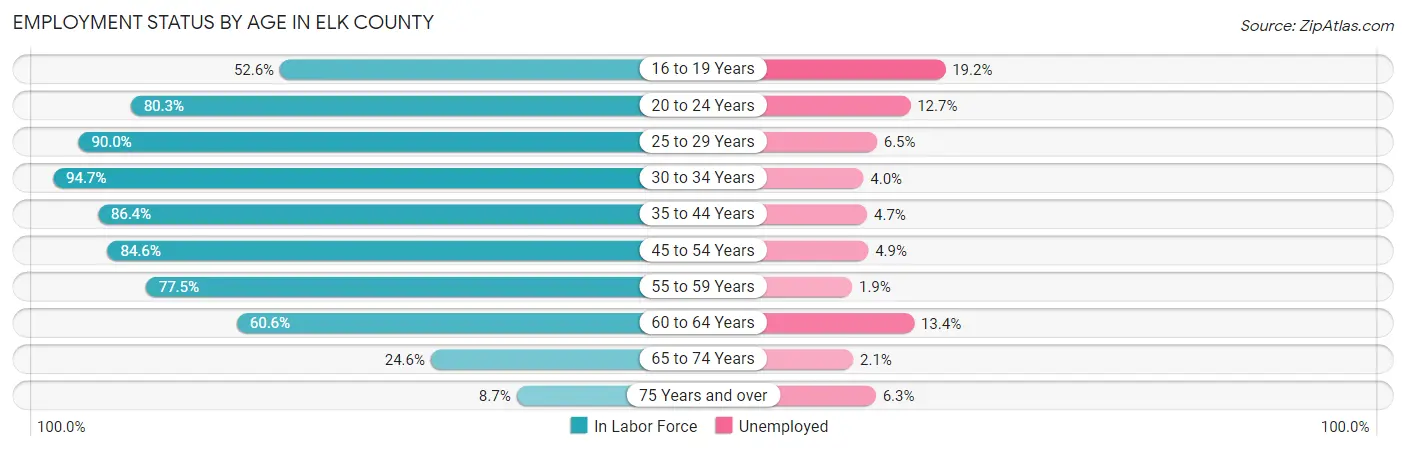
| Age Bracket | In Labor Force | Unemployed |
| 16 to 19 Years | 723 (52.6%) | 139 (19.2%) |
| 20 to 24 Years | 1,302 (80.3%) | 165 (12.7%) |
| 25 to 29 Years | 1,391 (90.0%) | 90 (6.5%) |
| 30 to 34 Years | 1,370 (94.7%) | 55 (4.0%) |
| 35 to 44 Years | 2,803 (86.4%) | 132 (4.7%) |
| 45 to 54 Years | 3,595 (84.6%) | 176 (4.9%) |
| 55 to 59 Years | 2,047 (77.5%) | 39 (1.9%) |
| 60 to 64 Years | 1,555 (60.6%) | 208 (13.4%) |
| 65 to 74 Years | 967 (24.6%) | 20 (2.1%) |
| 75 Years and over | 270 (8.7%) | 17 (6.3%) |
| Total | 16,022 (62.3%) | 1,041 (6.5%) |
Employment Status by Educational Attainment in Elk County
According to labor force statistics for Elk County, 81.3% of individuals (12,758) out of the total population between 25 and 64 years of age (15,693) are in the labor force, with 5.5% or 702 of them being unemployed. The group with the highest labor force participation rate are those with the educational attainment of bachelor's degree or higher, with 89.4% or 2,780 individuals in the labor force. Within the labor force, individuals with less than high school education have the highest percentage of unemployment, with 13.2% or 60 of them being unemployed.
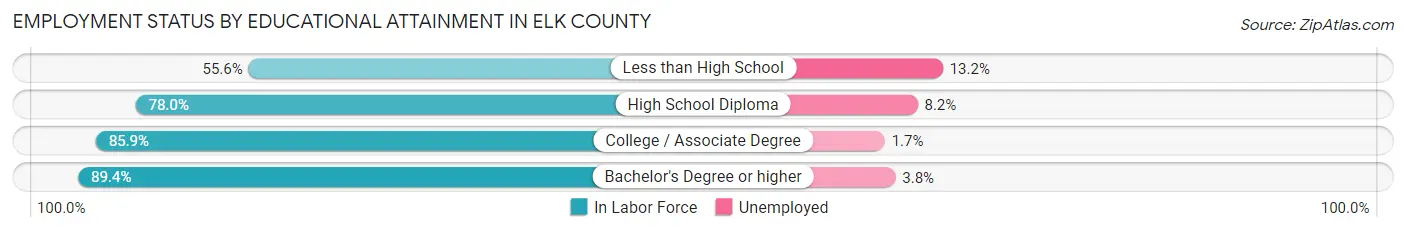
| Educational Attainment | In Labor Force | Unemployed |
| Less than High School | 455 (55.6%) | 108 (13.2%) |
| High School Diploma | 5,721 (78.0%) | 601 (8.2%) |
| College / Associate Degree | 3,806 (85.9%) | 75 (1.7%) |
| Bachelor's Degree or higher | 2,780 (89.4%) | 118 (3.8%) |
| Total | 12,758 (81.3%) | 863 (5.5%) |
Employment Occupations by Sex in Elk County
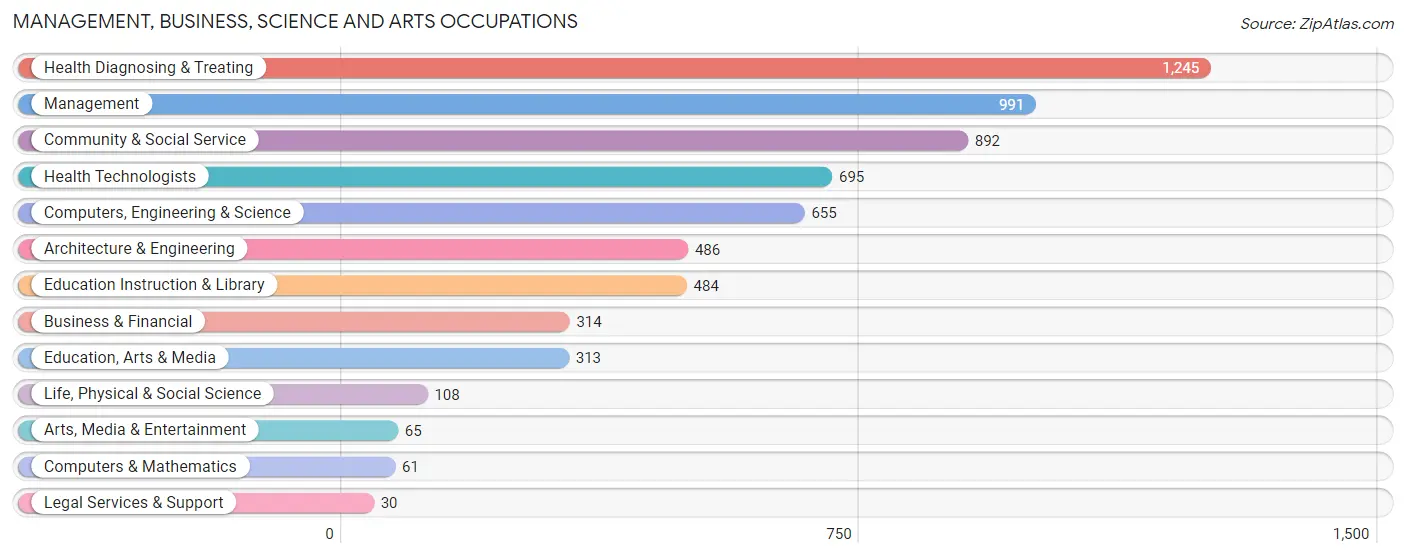
Management, Business, Science and Arts Occupations
The most common Management, Business, Science and Arts occupations in Elk County are Health Diagnosing & Treating (1,245 | 8.3%), Management (991 | 6.6%), Community & Social Service (892 | 6.0%), Health Technologists (695 | 4.6%), and Computers, Engineering & Science (655 | 4.4%).
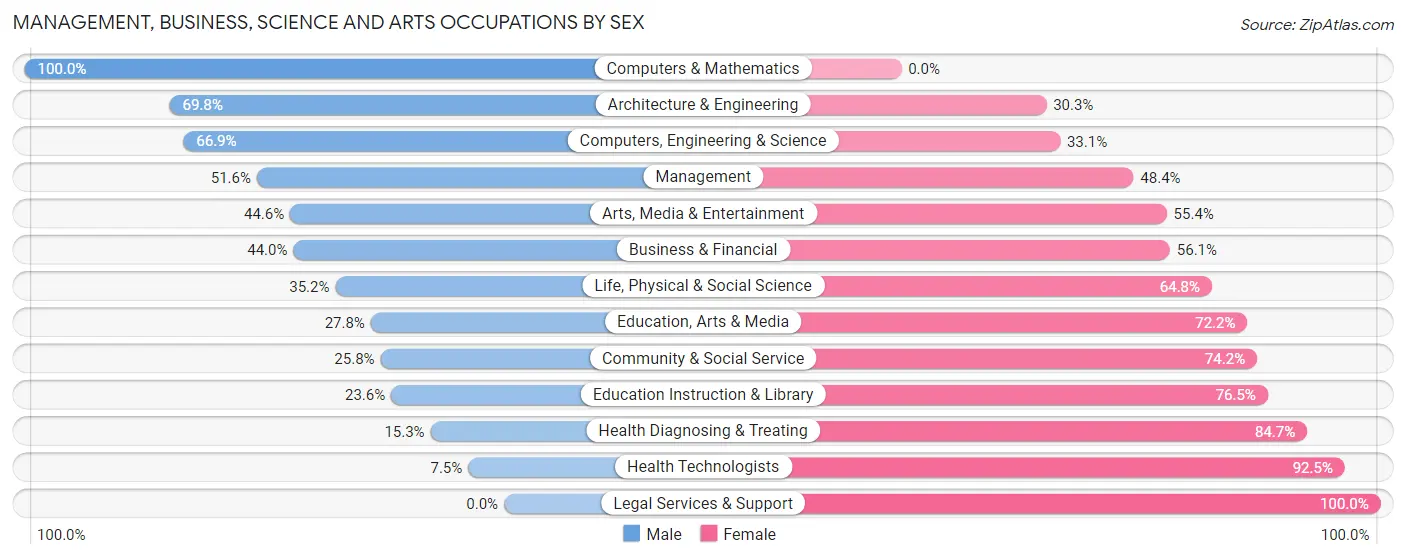
Management, Business, Science and Arts Occupations by Sex
Within the Management, Business, Science and Arts occupations in Elk County, the most male-oriented occupations are Computers & Mathematics (100.0%), Architecture & Engineering (69.8%), and Computers, Engineering & Science (66.9%), while the most female-oriented occupations are Legal Services & Support (100.0%), Health Technologists (92.5%), and Health Diagnosing & Treating (84.7%).
| Occupation | Male | Female |
| Management | 511 (51.6%) | 480 (48.4%) |
| Business & Financial | 138 (44.0%) | 176 (56.0%) |
| Computers, Engineering & Science | 438 (66.9%) | 217 (33.1%) |
| Computers & Mathematics | 61 (100.0%) | 0 (0.0%) |
| Architecture & Engineering | 339 (69.8%) | 147 (30.2%) |
| Life, Physical & Social Science | 38 (35.2%) | 70 (64.8%) |
| Community & Social Service | 230 (25.8%) | 662 (74.2%) |
| Education, Arts & Media | 87 (27.8%) | 226 (72.2%) |
| Legal Services & Support | 0 (0.0%) | 30 (100.0%) |
| Education Instruction & Library | 114 (23.5%) | 370 (76.4%) |
| Arts, Media & Entertainment | 29 (44.6%) | 36 (55.4%) |
| Health Diagnosing & Treating | 191 (15.3%) | 1,054 (84.7%) |
| Health Technologists | 52 (7.5%) | 643 (92.5%) |
| Total (Category) | 1,508 (36.8%) | 2,589 (63.2%) |
| Total (Overall) | 7,872 (52.6%) | 7,098 (47.4%) |
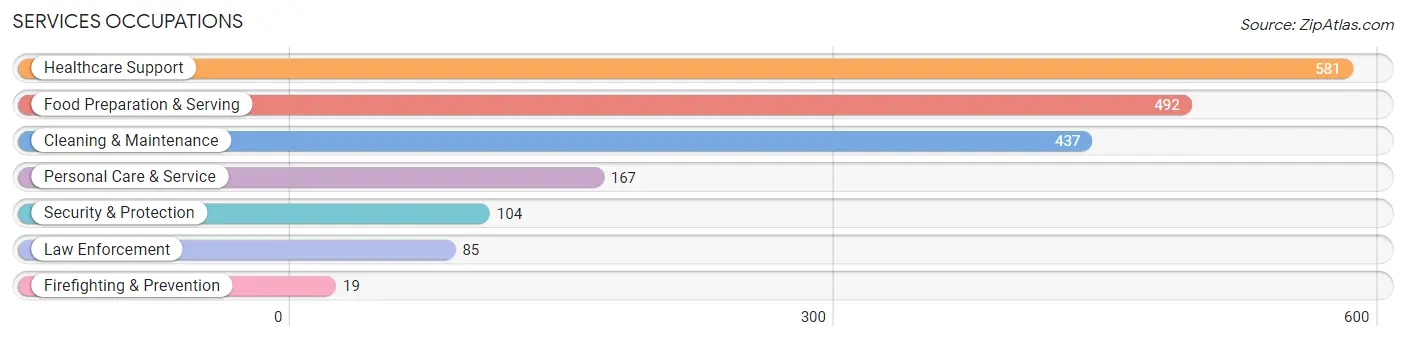
Services Occupations
The most common Services occupations in Elk County are Healthcare Support (581 | 3.9%), Food Preparation & Serving (492 | 3.3%), Cleaning & Maintenance (437 | 2.9%), Personal Care & Service (167 | 1.1%), and Security & Protection (104 | 0.7%).
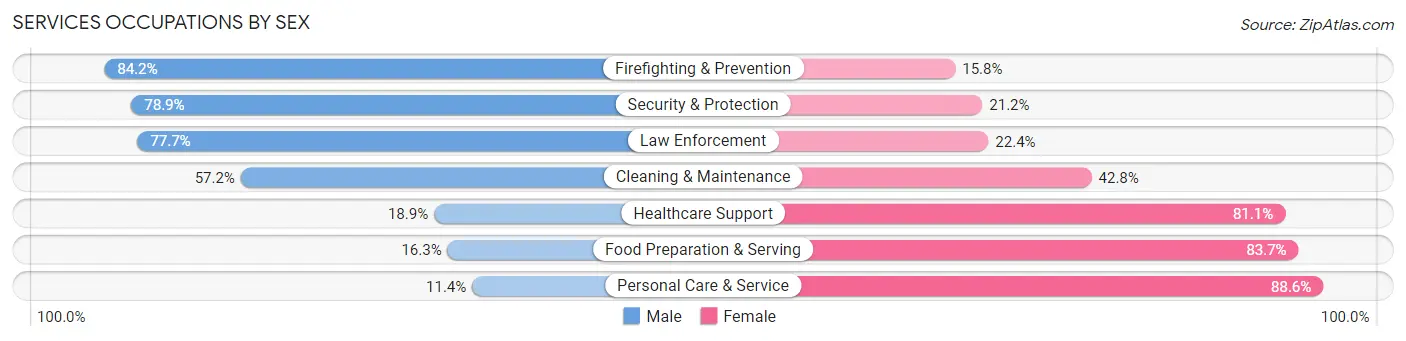
Services Occupations by Sex
Within the Services occupations in Elk County, the most male-oriented occupations are Firefighting & Prevention (84.2%), Security & Protection (78.8%), and Law Enforcement (77.6%), while the most female-oriented occupations are Personal Care & Service (88.6%), Food Preparation & Serving (83.7%), and Healthcare Support (81.1%).
| Occupation | Male | Female |
| Healthcare Support | 110 (18.9%) | 471 (81.1%) |
| Security & Protection | 82 (78.8%) | 22 (21.1%) |
| Firefighting & Prevention | 16 (84.2%) | 3 (15.8%) |
| Law Enforcement | 66 (77.6%) | 19 (22.4%) |
| Food Preparation & Serving | 80 (16.3%) | 412 (83.7%) |
| Cleaning & Maintenance | 250 (57.2%) | 187 (42.8%) |
| Personal Care & Service | 19 (11.4%) | 148 (88.6%) |
| Total (Category) | 541 (30.4%) | 1,240 (69.6%) |
| Total (Overall) | 7,872 (52.6%) | 7,098 (47.4%) |
Sales and Office Occupations
The most common Sales and Office occupations in Elk County are Sales & Related (1,543 | 10.3%), and Office & Administration (1,412 | 9.4%).

Sales and Office Occupations by Sex

| Occupation | Male | Female |
| Sales & Related | 832 (53.9%) | 711 (46.1%) |
| Office & Administration | 200 (14.2%) | 1,212 (85.8%) |
| Total (Category) | 1,032 (34.9%) | 1,923 (65.1%) |
| Total (Overall) | 7,872 (52.6%) | 7,098 (47.4%) |
Natural Resources, Construction and Maintenance Occupations
The most common Natural Resources, Construction and Maintenance occupations in Elk County are Construction & Extraction (676 | 4.5%), Installation, Maintenance & Repair (621 | 4.2%), and Farming, Fishing & Forestry (83 | 0.5%).

Natural Resources, Construction and Maintenance Occupations by Sex
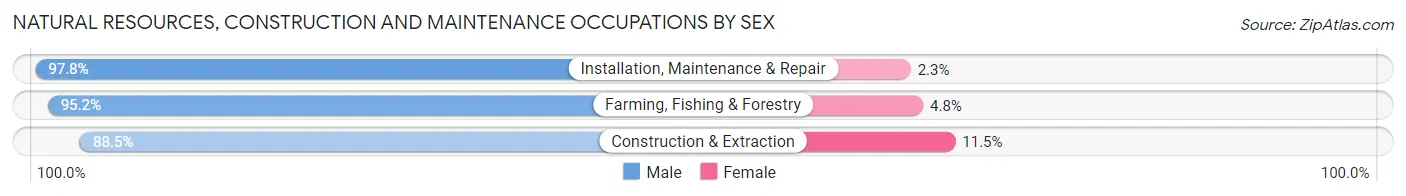
| Occupation | Male | Female |
| Farming, Fishing & Forestry | 79 (95.2%) | 4 (4.8%) |
| Construction & Extraction | 598 (88.5%) | 78 (11.5%) |
| Installation, Maintenance & Repair | 607 (97.8%) | 14 (2.2%) |
| Total (Category) | 1,284 (93.0%) | 96 (7.0%) |
| Total (Overall) | 7,872 (52.6%) | 7,098 (47.4%) |
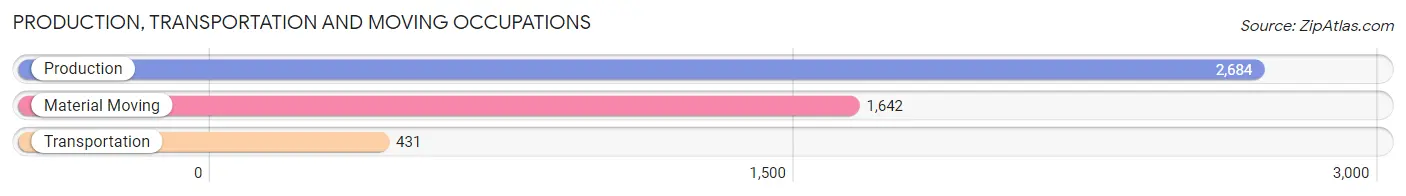
Production, Transportation and Moving Occupations
The most common Production, Transportation and Moving occupations in Elk County are Production (2,684 | 17.9%), Material Moving (1,642 | 11.0%), and Transportation (431 | 2.9%).
Production, Transportation and Moving Occupations by Sex
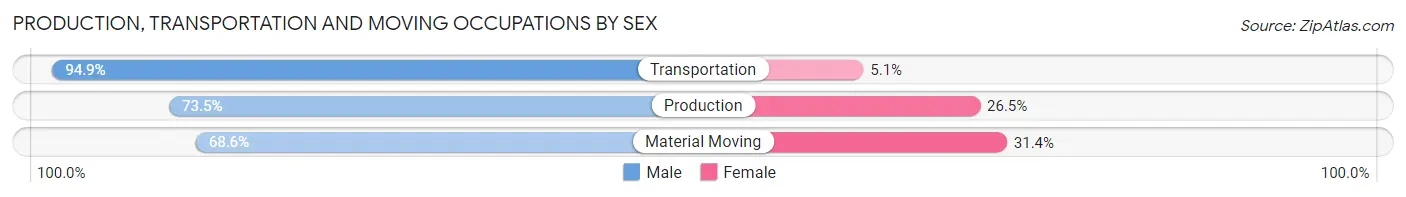
| Occupation | Male | Female |
| Production | 1,972 (73.5%) | 712 (26.5%) |
| Transportation | 409 (94.9%) | 22 (5.1%) |
| Material Moving | 1,126 (68.6%) | 516 (31.4%) |
| Total (Category) | 3,507 (73.7%) | 1,250 (26.3%) |
| Total (Overall) | 7,872 (52.6%) | 7,098 (47.4%) |
Employment Industries by Sex in Elk County
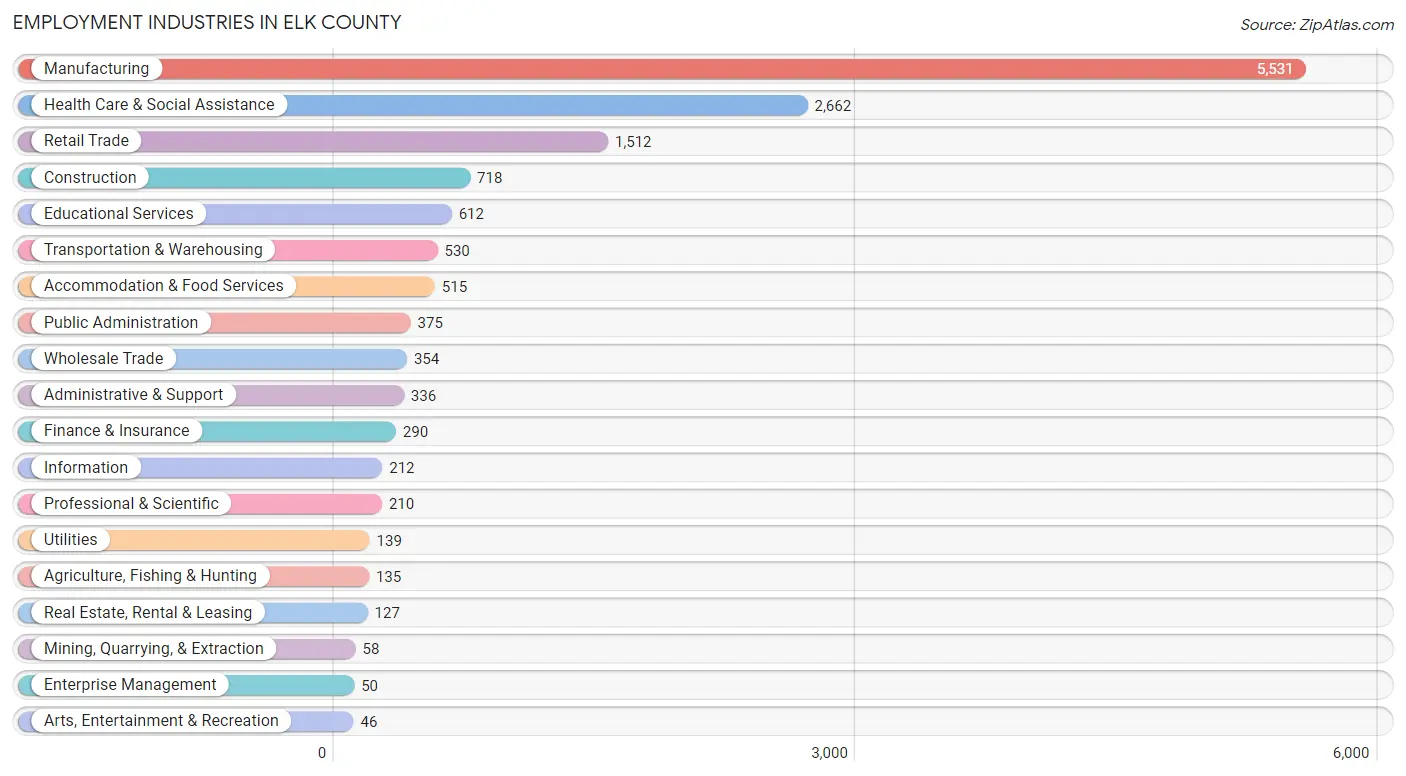
Employment Industries in Elk County
The major employment industries in Elk County include Manufacturing (5,531 | 36.9%), Health Care & Social Assistance (2,662 | 17.8%), Retail Trade (1,512 | 10.1%), Construction (718 | 4.8%), and Educational Services (612 | 4.1%).
Employment Industries by Sex in Elk County
The Elk County industries that see more men than women are Mining, Quarrying, & Extraction (100.0%), Construction (82.9%), and Wholesale Trade (80.5%), whereas the industries that tend to have a higher number of women are Health Care & Social Assistance (85.5%), Accommodation & Food Services (85.1%), and Enterprise Management (80.0%).
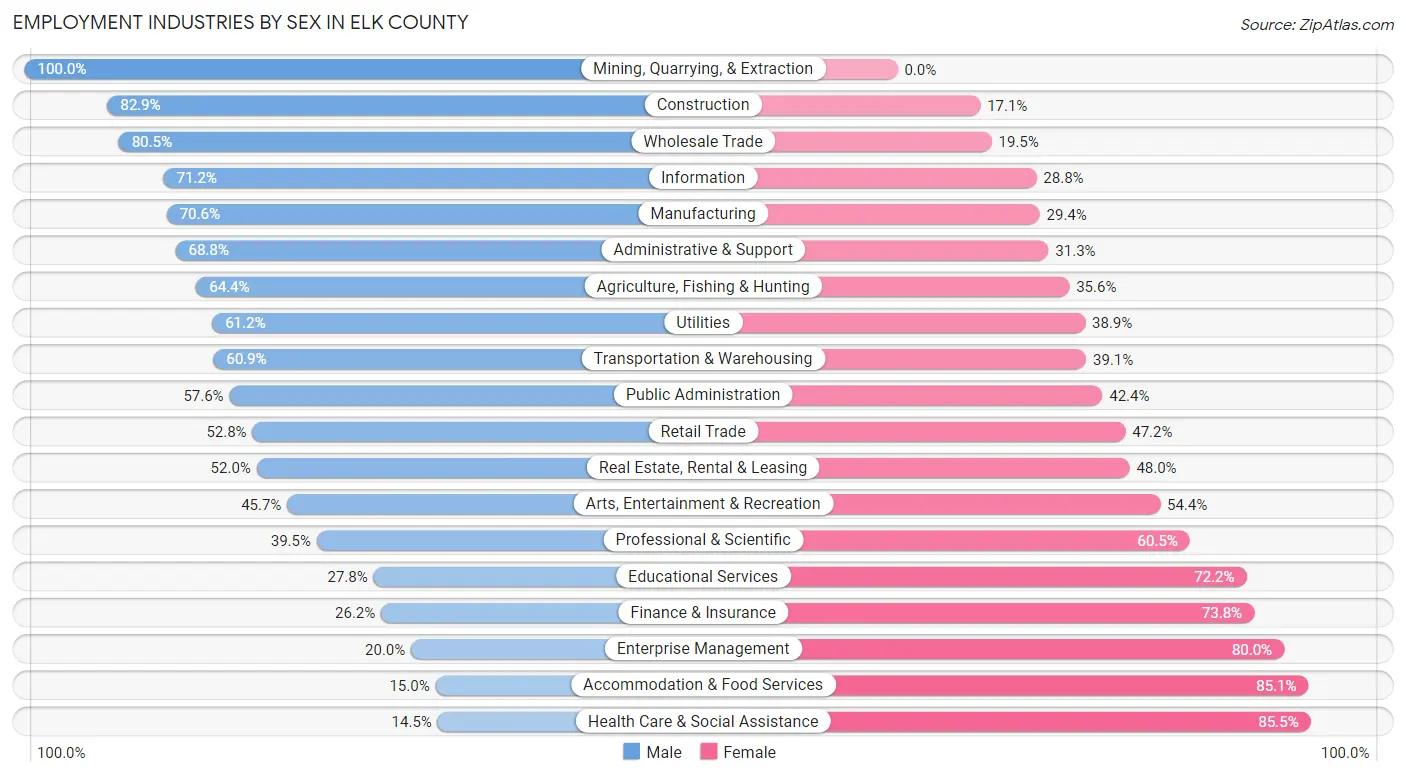
| Industry | Male | Female |
| Agriculture, Fishing & Hunting | 87 (64.4%) | 48 (35.6%) |
| Mining, Quarrying, & Extraction | 58 (100.0%) | 0 (0.0%) |
| Construction | 595 (82.9%) | 123 (17.1%) |
| Manufacturing | 3,903 (70.6%) | 1,628 (29.4%) |
| Wholesale Trade | 285 (80.5%) | 69 (19.5%) |
| Retail Trade | 799 (52.8%) | 713 (47.2%) |
| Transportation & Warehousing | 323 (60.9%) | 207 (39.1%) |
| Utilities | 85 (61.2%) | 54 (38.9%) |
| Information | 151 (71.2%) | 61 (28.8%) |
| Finance & Insurance | 76 (26.2%) | 214 (73.8%) |
| Real Estate, Rental & Leasing | 66 (52.0%) | 61 (48.0%) |
| Professional & Scientific | 83 (39.5%) | 127 (60.5%) |
| Enterprise Management | 10 (20.0%) | 40 (80.0%) |
| Administrative & Support | 231 (68.8%) | 105 (31.2%) |
| Educational Services | 170 (27.8%) | 442 (72.2%) |
| Health Care & Social Assistance | 386 (14.5%) | 2,276 (85.5%) |
| Arts, Entertainment & Recreation | 21 (45.7%) | 25 (54.3%) |
| Accommodation & Food Services | 77 (14.9%) | 438 (85.1%) |
| Public Administration | 216 (57.6%) | 159 (42.4%) |
| Total | 7,872 (52.6%) | 7,098 (47.4%) |
Education in Elk County
School Enrollment in Elk County
The most common levels of schooling among the 6,000 students in Elk County are high school (1,728 | 28.8%), middle school (1,401 | 23.4%), and elementary school (1,197 | 20.0%).
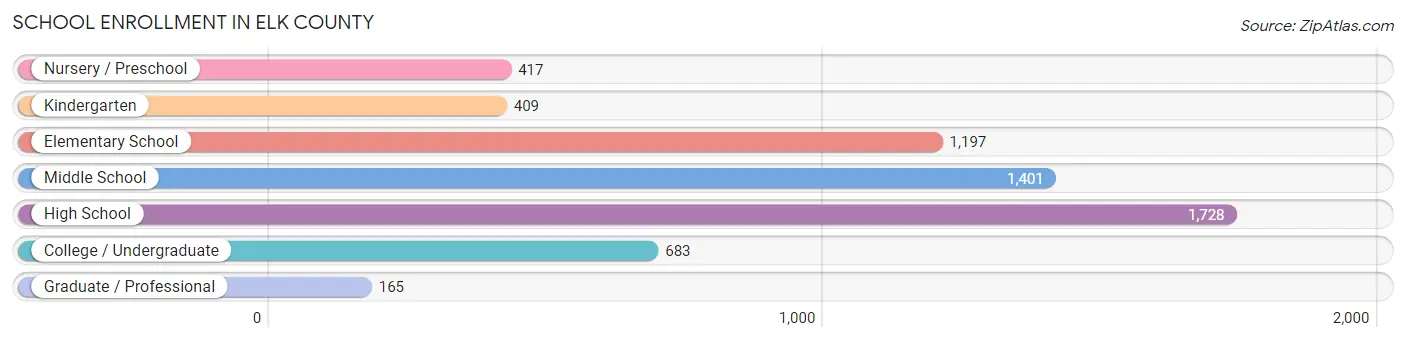
| School Level | # Students | % Students |
| Nursery / Preschool | 417 | 7.0% |
| Kindergarten | 409 | 6.8% |
| Elementary School | 1,197 | 20.0% |
| Middle School | 1,401 | 23.4% |
| High School | 1,728 | 28.8% |
| College / Undergraduate | 683 | 11.4% |
| Graduate / Professional | 165 | 2.8% |
| Total | 6,000 | 100.0% |
School Enrollment by Age by Funding Source in Elk County
Out of a total of 6,000 students who are enrolled in schools in Elk County, 792 (13.2%) attend a private institution, while the remaining 5,208 (86.8%) are enrolled in public schools. The age group of 35 years and over has the highest likelihood of being enrolled in private schools, with 43 (22.6% in the age bracket) enrolled. Conversely, the age group of 10 to 14 year olds has the lowest likelihood of being enrolled in a private school, with 1,697 (93.5% in the age bracket) attending a public institution.
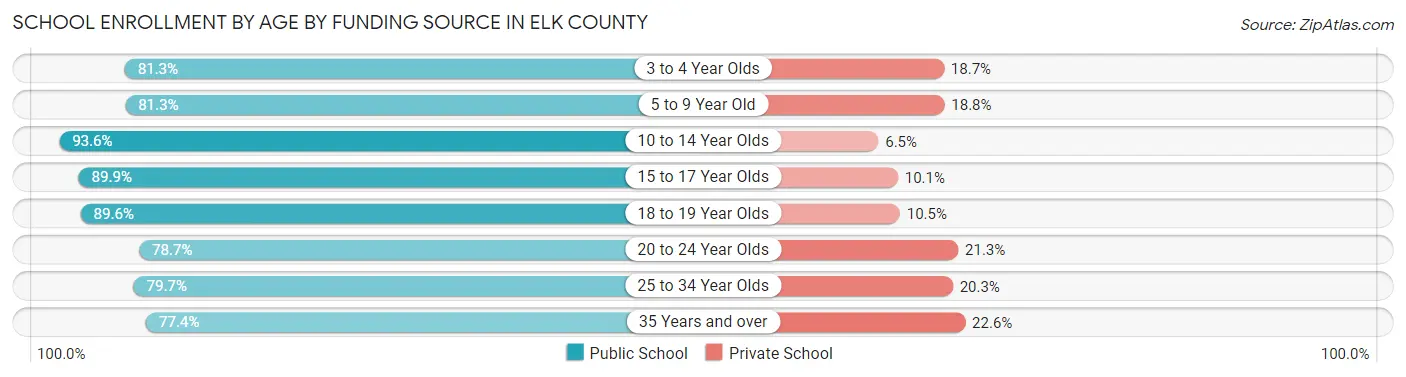
| Age Bracket | Public School | Private School |
| 3 to 4 Year Olds | 270 (81.3%) | 62 (18.7%) |
| 5 to 9 Year Old | 1,218 (81.2%) | 281 (18.8%) |
| 10 to 14 Year Olds | 1,697 (93.5%) | 117 (6.5%) |
| 15 to 17 Year Olds | 954 (89.9%) | 107 (10.1%) |
| 18 to 19 Year Olds | 454 (89.5%) | 53 (10.4%) |
| 20 to 24 Year Olds | 369 (78.7%) | 100 (21.3%) |
| 25 to 34 Year Olds | 102 (79.7%) | 26 (20.3%) |
| 35 Years and over | 147 (77.4%) | 43 (22.6%) |
| Total | 5,214 (86.9%) | 792 (13.2%) |
Educational Attainment by Field of Study in Elk County
Business (937 | 21.3%), education (848 | 19.3%), science & technology (768 | 17.5%), arts & humanities (324 | 7.4%), and engineering (281 | 6.4%) are the most common fields of study among 4,396 individuals in Elk County who have obtained a bachelor's degree or higher.
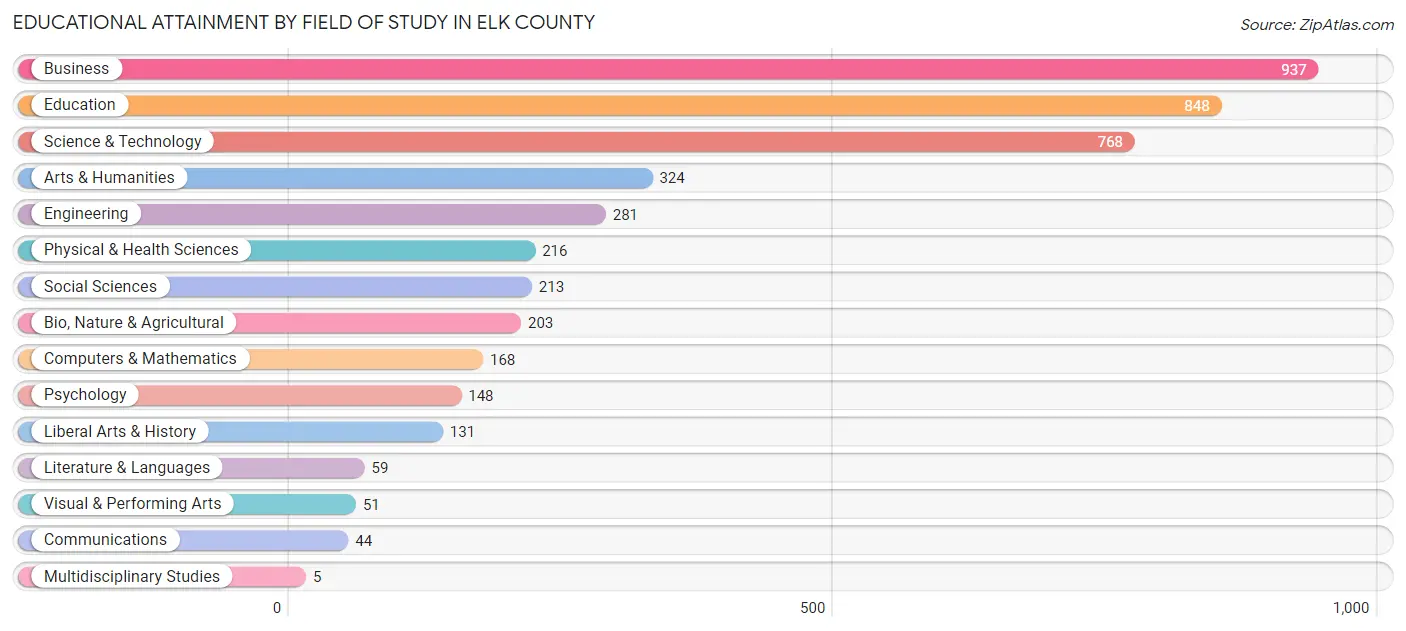
| Field of Study | # Graduates | % Graduates |
| Computers & Mathematics | 168 | 3.8% |
| Bio, Nature & Agricultural | 203 | 4.6% |
| Physical & Health Sciences | 216 | 4.9% |
| Psychology | 148 | 3.4% |
| Social Sciences | 213 | 4.9% |
| Engineering | 281 | 6.4% |
| Multidisciplinary Studies | 5 | 0.1% |
| Science & Technology | 768 | 17.5% |
| Business | 937 | 21.3% |
| Education | 848 | 19.3% |
| Literature & Languages | 59 | 1.3% |
| Liberal Arts & History | 131 | 3.0% |
| Visual & Performing Arts | 51 | 1.2% |
| Communications | 44 | 1.0% |
| Arts & Humanities | 324 | 7.4% |
| Total | 4,396 | 100.0% |
Transportation & Commute in Elk County
Vehicle Availability by Sex in Elk County
The most prevalent vehicle ownership categories in Elk County are males with 2 vehicles (3,510, accounting for 45.0%) and females with 2 vehicles (2,964, making up 50.3%).
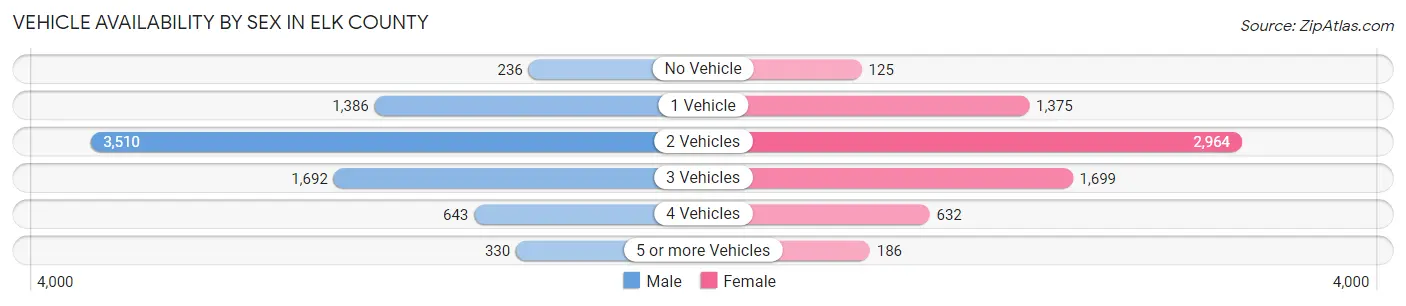
| Vehicles Available | Male | Female |
| No Vehicle | 236 (3.0%) | 125 (1.8%) |
| 1 Vehicle | 1,386 (17.8%) | 1,375 (19.7%) |
| 2 Vehicles | 3,510 (45.0%) | 2,964 (42.5%) |
| 3 Vehicles | 1,692 (21.7%) | 1,699 (24.3%) |
| 4 Vehicles | 643 (8.3%) | 632 (9.0%) |
| 5 or more Vehicles | 330 (4.2%) | 186 (2.7%) |
| Total | 7,797 (100.0%) | 6,981 (100.0%) |
Commute Time in Elk County
The most frequently occuring commute durations in Elk County are 5 to 9 minutes (3,562 commuters, 24.7%), 10 to 14 minutes (2,451 commuters, 17.0%), and 15 to 19 minutes (2,084 commuters, 14.5%).
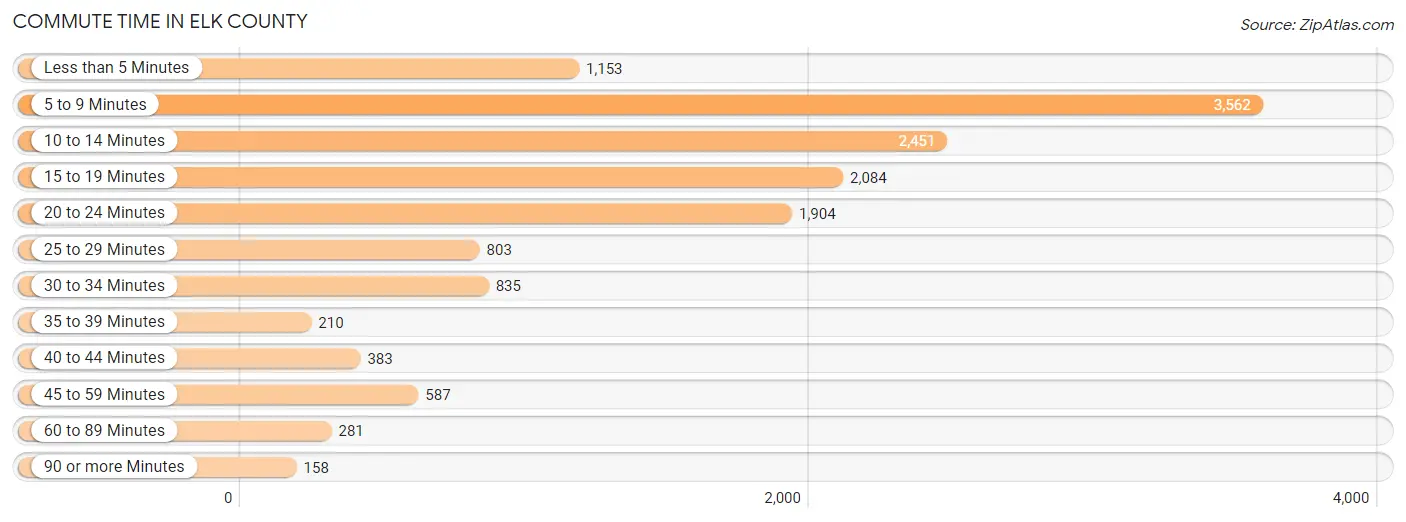
| Commute Time | # Commuters | % Commuters |
| Less than 5 Minutes | 1,153 | 8.0% |
| 5 to 9 Minutes | 3,562 | 24.7% |
| 10 to 14 Minutes | 2,451 | 17.0% |
| 15 to 19 Minutes | 2,084 | 14.5% |
| 20 to 24 Minutes | 1,904 | 13.2% |
| 25 to 29 Minutes | 803 | 5.6% |
| 30 to 34 Minutes | 835 | 5.8% |
| 35 to 39 Minutes | 210 | 1.5% |
| 40 to 44 Minutes | 383 | 2.7% |
| 45 to 59 Minutes | 587 | 4.1% |
| 60 to 89 Minutes | 281 | 1.9% |
| 90 or more Minutes | 158 | 1.1% |
Commute Time by Sex in Elk County
The most common commute times in Elk County are 5 to 9 minutes (1,894 commuters, 24.8%) for males and 5 to 9 minutes (1,668 commuters, 24.6%) for females.
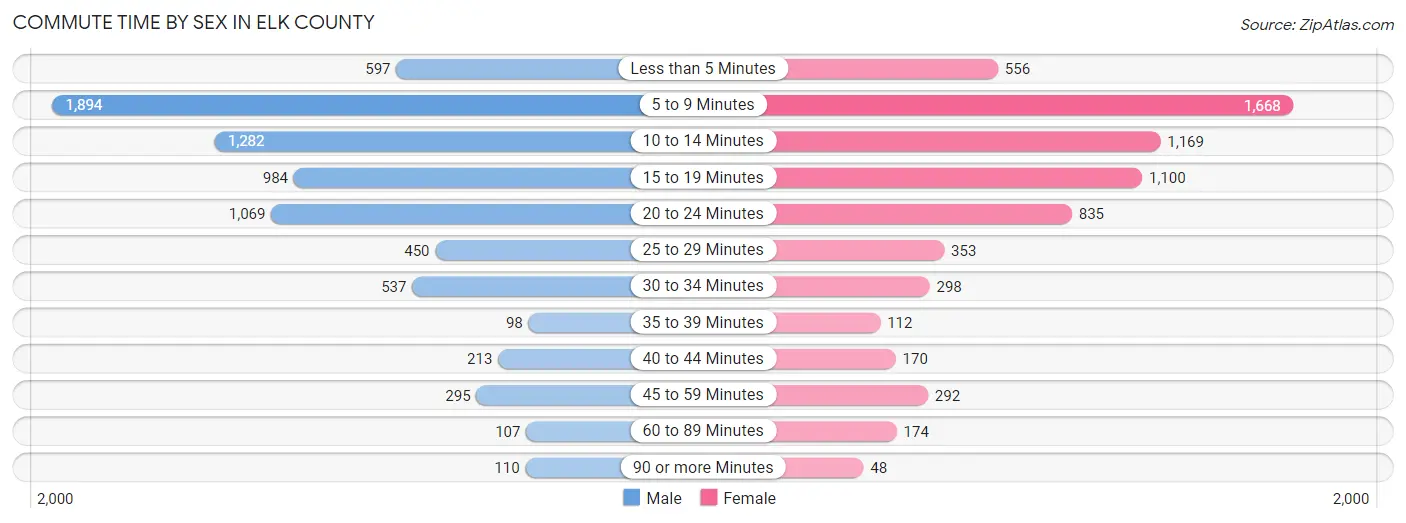
| Commute Time | Male | Female |
| Less than 5 Minutes | 597 (7.8%) | 556 (8.2%) |
| 5 to 9 Minutes | 1,894 (24.8%) | 1,668 (24.6%) |
| 10 to 14 Minutes | 1,282 (16.8%) | 1,169 (17.2%) |
| 15 to 19 Minutes | 984 (12.9%) | 1,100 (16.2%) |
| 20 to 24 Minutes | 1,069 (14.0%) | 835 (12.3%) |
| 25 to 29 Minutes | 450 (5.9%) | 353 (5.2%) |
| 30 to 34 Minutes | 537 (7.0%) | 298 (4.4%) |
| 35 to 39 Minutes | 98 (1.3%) | 112 (1.7%) |
| 40 to 44 Minutes | 213 (2.8%) | 170 (2.5%) |
| 45 to 59 Minutes | 295 (3.9%) | 292 (4.3%) |
| 60 to 89 Minutes | 107 (1.4%) | 174 (2.6%) |
| 90 or more Minutes | 110 (1.4%) | 48 (0.7%) |
Time of Departure to Work by Sex in Elk County
The most frequent times of departure to work in Elk County are 6:30 AM to 6:59 AM (1,414, 18.5%) for males and 7:00 AM to 7:29 AM (1,181, 17.4%) for females.
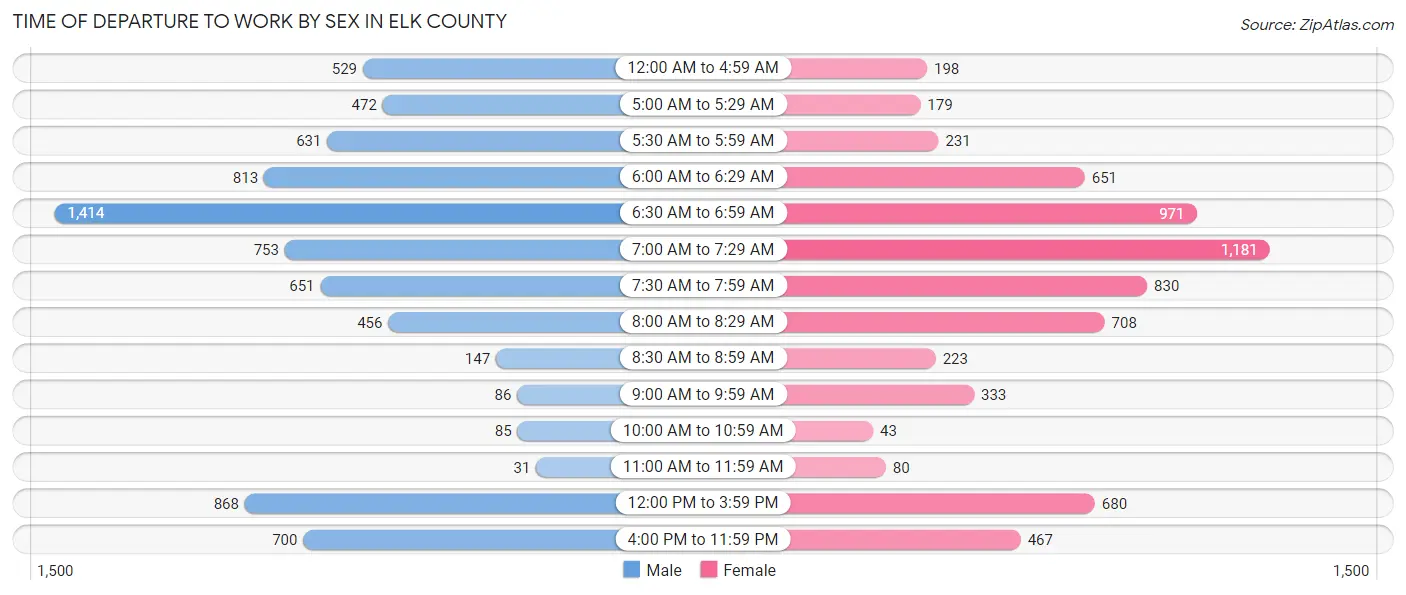
| Time of Departure | Male | Female |
| 12:00 AM to 4:59 AM | 529 (6.9%) | 198 (2.9%) |
| 5:00 AM to 5:29 AM | 472 (6.2%) | 179 (2.6%) |
| 5:30 AM to 5:59 AM | 631 (8.3%) | 231 (3.4%) |
| 6:00 AM to 6:29 AM | 813 (10.6%) | 651 (9.6%) |
| 6:30 AM to 6:59 AM | 1,414 (18.5%) | 971 (14.3%) |
| 7:00 AM to 7:29 AM | 753 (9.9%) | 1,181 (17.4%) |
| 7:30 AM to 7:59 AM | 651 (8.5%) | 830 (12.2%) |
| 8:00 AM to 8:29 AM | 456 (6.0%) | 708 (10.4%) |
| 8:30 AM to 8:59 AM | 147 (1.9%) | 223 (3.3%) |
| 9:00 AM to 9:59 AM | 86 (1.1%) | 333 (4.9%) |
| 10:00 AM to 10:59 AM | 85 (1.1%) | 43 (0.6%) |
| 11:00 AM to 11:59 AM | 31 (0.4%) | 80 (1.2%) |
| 12:00 PM to 3:59 PM | 868 (11.4%) | 680 (10.0%) |
| 4:00 PM to 11:59 PM | 700 (9.2%) | 467 (6.9%) |
| Total | 7,636 (100.0%) | 6,775 (100.0%) |
Housing Occupancy in Elk County
Occupancy by Ownership in Elk County
Of the total 13,485 dwellings in Elk County, owner-occupied units account for 10,666 (79.1%), while renter-occupied units make up 2,819 (20.9%).
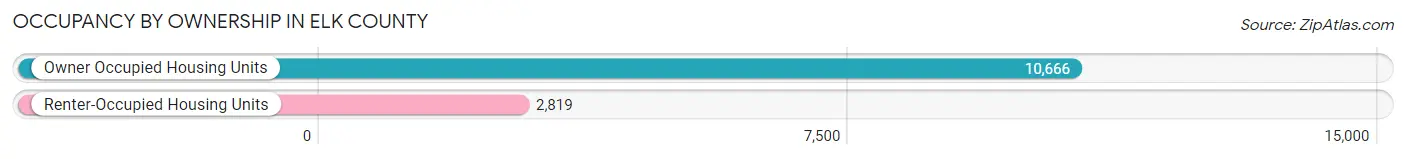
| Occupancy | # Housing Units | % Housing Units |
| Owner Occupied Housing Units | 10,666 | 79.1% |
| Renter-Occupied Housing Units | 2,819 | 20.9% |
| Total Occupied Housing Units | 13,485 | 100.0% |
Occupancy by Household Size in Elk County
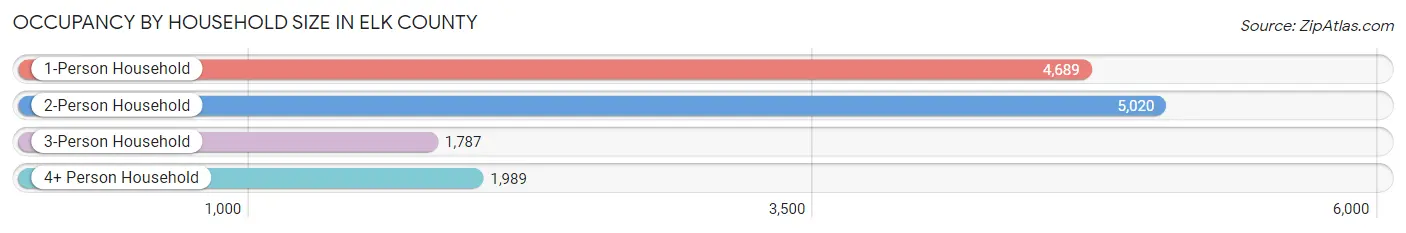
| Household Size | # Housing Units | % Housing Units |
| 1-Person Household | 4,689 | 34.8% |
| 2-Person Household | 5,020 | 37.2% |
| 3-Person Household | 1,787 | 13.3% |
| 4+ Person Household | 1,989 | 14.7% |
| Total Housing Units | 13,485 | 100.0% |
Occupancy by Ownership by Household Size in Elk County
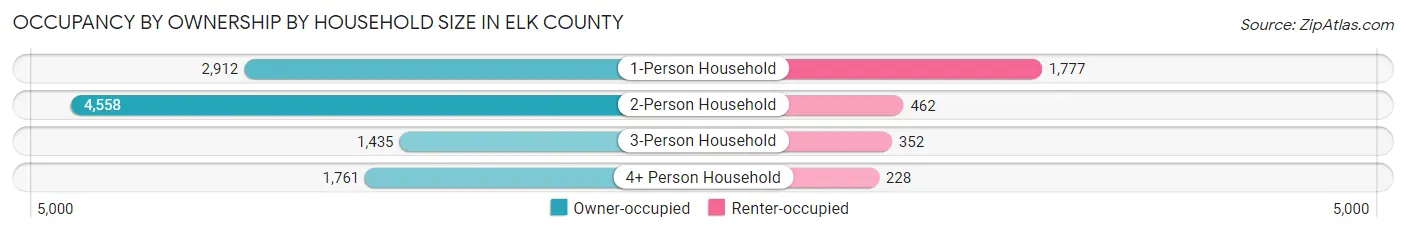
| Household Size | Owner-occupied | Renter-occupied |
| 1-Person Household | 2,912 (62.1%) | 1,777 (37.9%) |
| 2-Person Household | 4,558 (90.8%) | 462 (9.2%) |
| 3-Person Household | 1,435 (80.3%) | 352 (19.7%) |
| 4+ Person Household | 1,761 (88.5%) | 228 (11.5%) |
| Total Housing Units | 10,666 (79.1%) | 2,819 (20.9%) |
Occupancy by Educational Attainment in Elk County
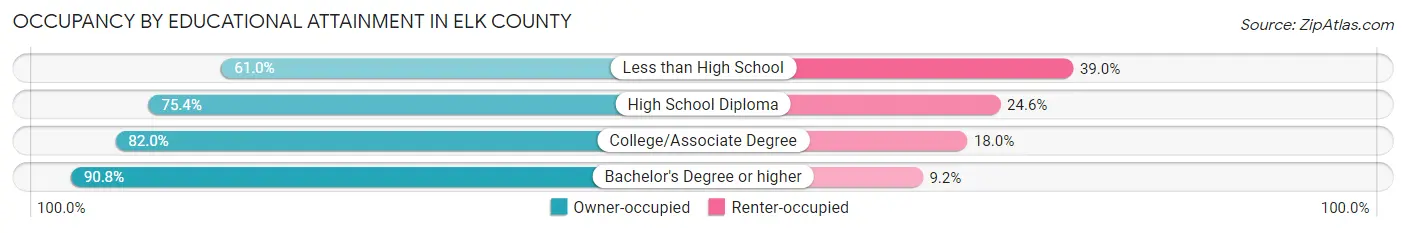
| Household Size | Owner-occupied | Renter-occupied |
| Less than High School | 572 (61.0%) | 366 (39.0%) |
| High School Diploma | 4,844 (75.4%) | 1,579 (24.6%) |
| College/Associate Degree | 2,896 (82.0%) | 636 (18.0%) |
| Bachelor's Degree or higher | 2,354 (90.8%) | 238 (9.2%) |
Occupancy by Age of Householder in Elk County
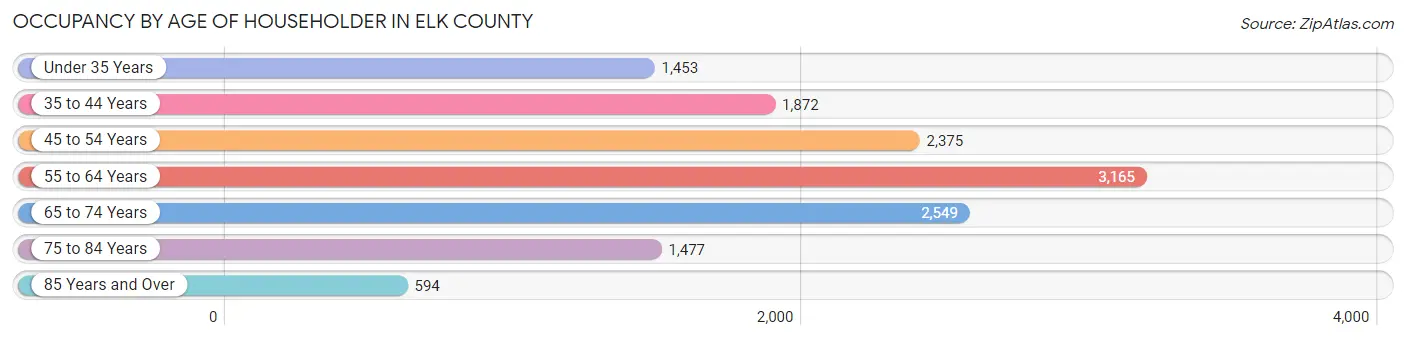
| Age Bracket | # Households | % Households |
| Under 35 Years | 1,453 | 10.8% |
| 35 to 44 Years | 1,872 | 13.9% |
| 45 to 54 Years | 2,375 | 17.6% |
| 55 to 64 Years | 3,165 | 23.5% |
| 65 to 74 Years | 2,549 | 18.9% |
| 75 to 84 Years | 1,477 | 11.0% |
| 85 Years and Over | 594 | 4.4% |
| Total | 13,485 | 100.0% |
Housing Finances in Elk County
Median Income by Occupancy in Elk County
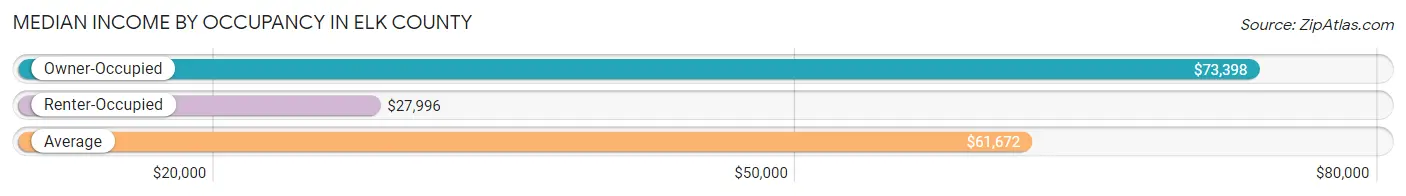
| Occupancy Type | # Households | Median Income |
| Owner-Occupied | 10,666 (79.1%) | $73,398 |
| Renter-Occupied | 2,819 (20.9%) | $27,996 |
| Average | 13,485 (100.0%) | $61,672 |
Occupancy by Householder Income Bracket in Elk County
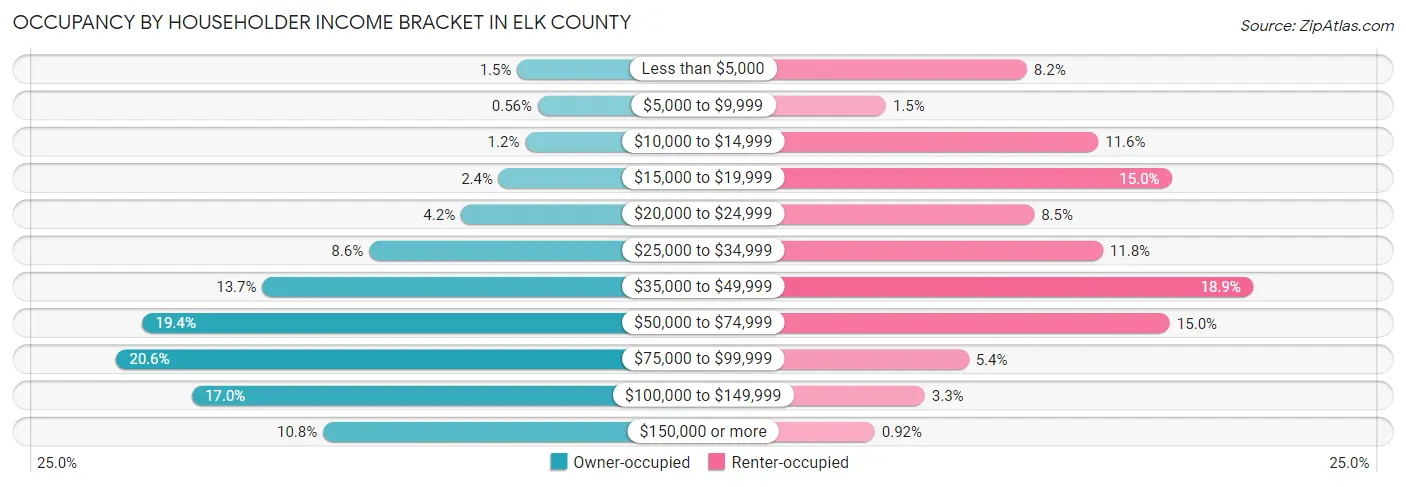
| Income Bracket | Owner-occupied | Renter-occupied |
| Less than $5,000 | 164 (1.5%) | 230 (8.2%) |
| $5,000 to $9,999 | 60 (0.6%) | 41 (1.5%) |
| $10,000 to $14,999 | 124 (1.2%) | 326 (11.6%) |
| $15,000 to $19,999 | 258 (2.4%) | 424 (15.0%) |
| $20,000 to $24,999 | 450 (4.2%) | 240 (8.5%) |
| $25,000 to $34,999 | 917 (8.6%) | 332 (11.8%) |
| $35,000 to $49,999 | 1,459 (13.7%) | 533 (18.9%) |
| $50,000 to $74,999 | 2,067 (19.4%) | 422 (15.0%) |
| $75,000 to $99,999 | 2,200 (20.6%) | 152 (5.4%) |
| $100,000 to $149,999 | 1,816 (17.0%) | 93 (3.3%) |
| $150,000 or more | 1,151 (10.8%) | 26 (0.9%) |
| Total | 10,666 (100.0%) | 2,819 (100.0%) |
Monthly Housing Cost Tiers in Elk County
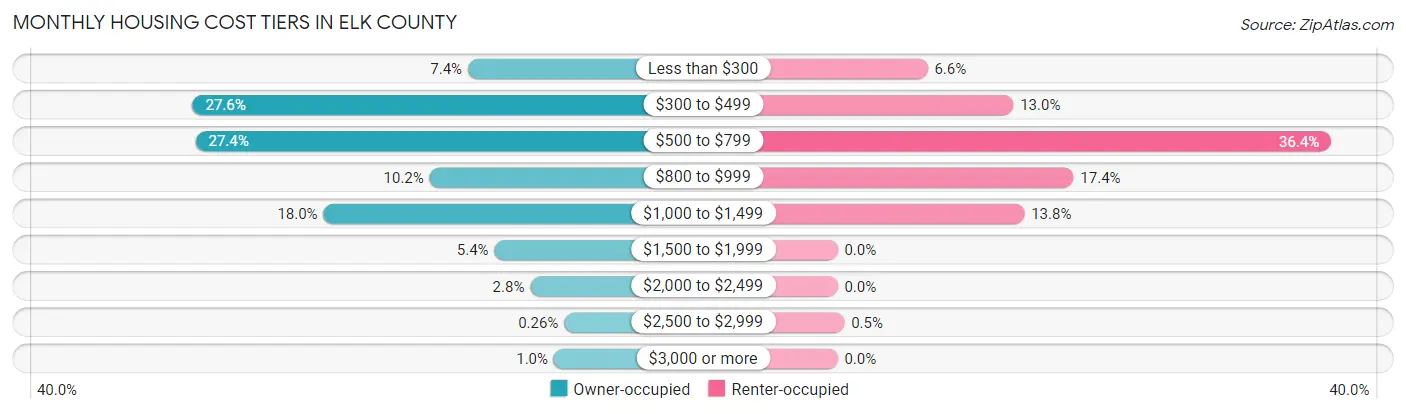
| Monthly Cost | Owner-occupied | Renter-occupied |
| Less than $300 | 784 (7.3%) | 187 (6.6%) |
| $300 to $499 | 2,947 (27.6%) | 365 (13.0%) |
| $500 to $799 | 2,924 (27.4%) | 1,025 (36.4%) |
| $800 to $999 | 1,085 (10.2%) | 490 (17.4%) |
| $1,000 to $1,499 | 1,919 (18.0%) | 388 (13.8%) |
| $1,500 to $1,999 | 576 (5.4%) | 0 (0.0%) |
| $2,000 to $2,499 | 294 (2.8%) | 0 (0.0%) |
| $2,500 to $2,999 | 28 (0.3%) | 14 (0.5%) |
| $3,000 or more | 109 (1.0%) | 0 (0.0%) |
| Total | 10,666 (100.0%) | 2,819 (100.0%) |
Physical Housing Characteristics in Elk County
Housing Structures in Elk County
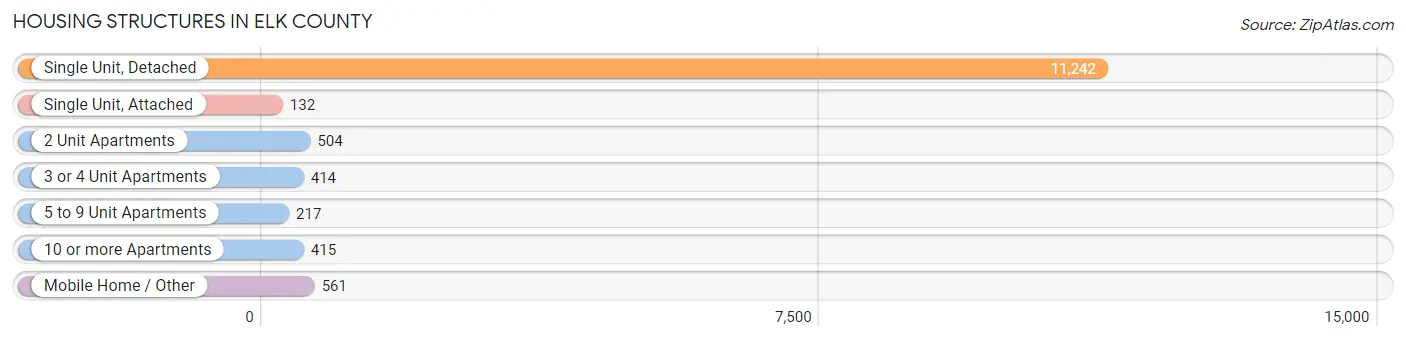
| Structure Type | # Housing Units | % Housing Units |
| Single Unit, Detached | 11,242 | 83.4% |
| Single Unit, Attached | 132 | 1.0% |
| 2 Unit Apartments | 504 | 3.7% |
| 3 or 4 Unit Apartments | 414 | 3.1% |
| 5 to 9 Unit Apartments | 217 | 1.6% |
| 10 or more Apartments | 415 | 3.1% |
| Mobile Home / Other | 561 | 4.2% |
| Total | 13,485 | 100.0% |
Housing Structures by Occupancy in Elk County
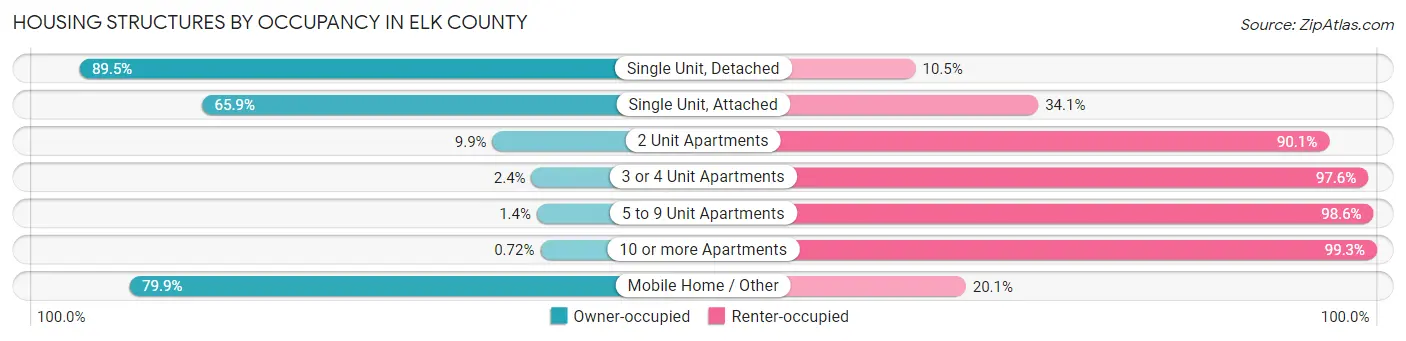
| Structure Type | Owner-occupied | Renter-occupied |
| Single Unit, Detached | 10,065 (89.5%) | 1,177 (10.5%) |
| Single Unit, Attached | 87 (65.9%) | 45 (34.1%) |
| 2 Unit Apartments | 50 (9.9%) | 454 (90.1%) |
| 3 or 4 Unit Apartments | 10 (2.4%) | 404 (97.6%) |
| 5 to 9 Unit Apartments | 3 (1.4%) | 214 (98.6%) |
| 10 or more Apartments | 3 (0.7%) | 412 (99.3%) |
| Mobile Home / Other | 448 (79.9%) | 113 (20.1%) |
| Total | 10,666 (79.1%) | 2,819 (20.9%) |
Housing Structures by Number of Rooms in Elk County
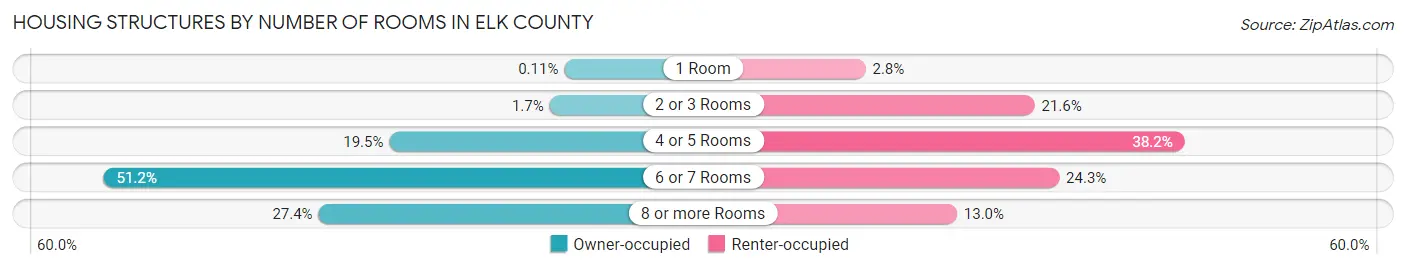
| Number of Rooms | Owner-occupied | Renter-occupied |
| 1 Room | 12 (0.1%) | 80 (2.8%) |
| 2 or 3 Rooms | 186 (1.7%) | 609 (21.6%) |
| 4 or 5 Rooms | 2,083 (19.5%) | 1,078 (38.2%) |
| 6 or 7 Rooms | 5,464 (51.2%) | 686 (24.3%) |
| 8 or more Rooms | 2,921 (27.4%) | 366 (13.0%) |
| Total | 10,666 (100.0%) | 2,819 (100.0%) |
Housing Structure by Heating Type in Elk County
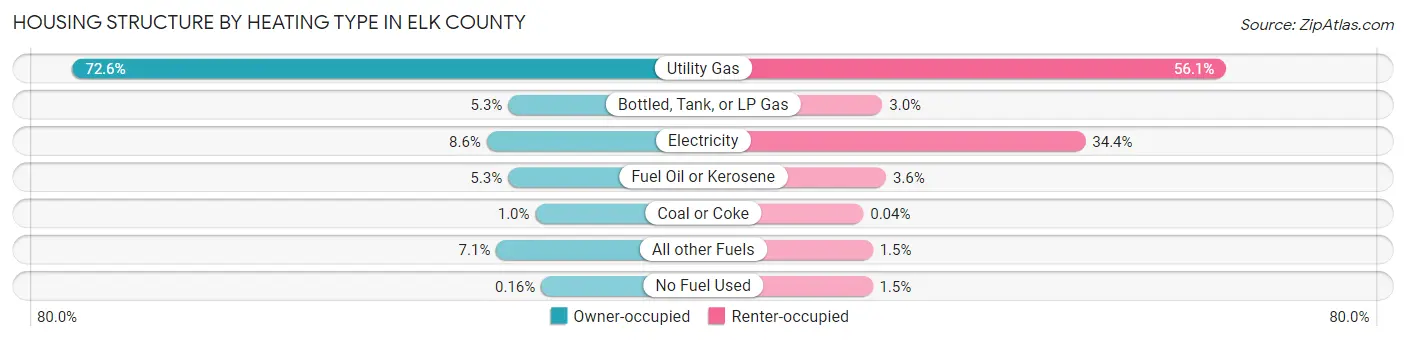
| Heating Type | Owner-occupied | Renter-occupied |
| Utility Gas | 7,746 (72.6%) | 1,582 (56.1%) |
| Bottled, Tank, or LP Gas | 560 (5.2%) | 84 (3.0%) |
| Electricity | 914 (8.6%) | 969 (34.4%) |
| Fuel Oil or Kerosene | 562 (5.3%) | 100 (3.5%) |
| Coal or Coke | 111 (1.0%) | 1 (0.0%) |
| All other Fuels | 756 (7.1%) | 42 (1.5%) |
| No Fuel Used | 17 (0.2%) | 41 (1.5%) |
| Total | 10,666 (100.0%) | 2,819 (100.0%) |
Household Vehicle Usage in Elk County
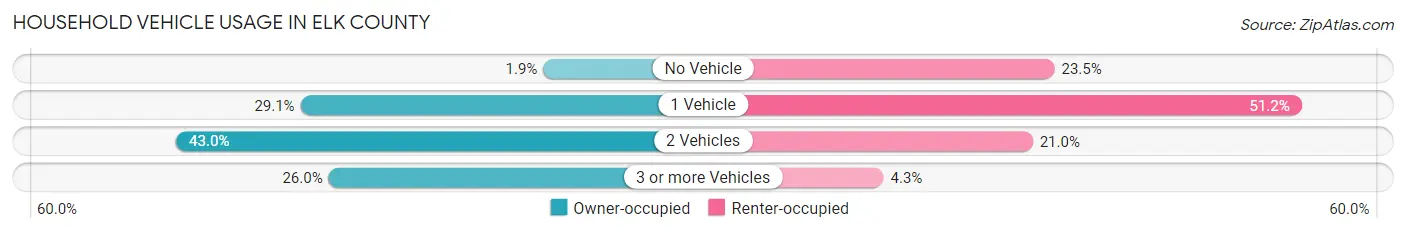
| Vehicles per Household | Owner-occupied | Renter-occupied |
| No Vehicle | 204 (1.9%) | 662 (23.5%) |
| 1 Vehicle | 3,104 (29.1%) | 1,442 (51.1%) |
| 2 Vehicles | 4,589 (43.0%) | 593 (21.0%) |
| 3 or more Vehicles | 2,769 (26.0%) | 122 (4.3%) |
| Total | 10,666 (100.0%) | 2,819 (100.0%) |
Real Estate & Mortgages in Elk County
Real Estate and Mortgage Overview in Elk County
| Characteristic | Without Mortgage | With Mortgage |
| Housing Units | 6,139 | 4,527 |
| Median Property Value | $123,600 | $119,800 |
| Median Household Income | $59,787 | $604 |
| Monthly Housing Costs | $459 | $83 |
| Real Estate Taxes | $1,587 | $70 |
Property Value by Mortgage Status in Elk County
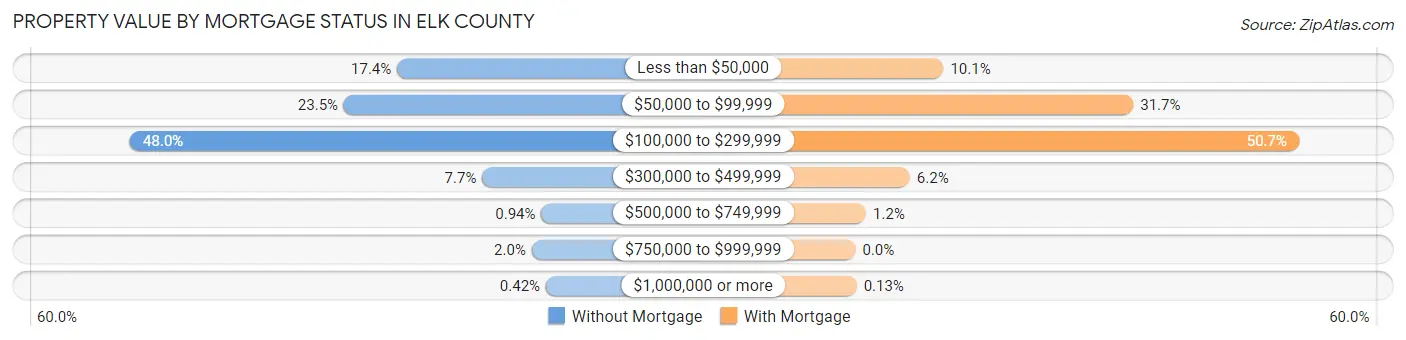
| Property Value | Without Mortgage | With Mortgage |
| Less than $50,000 | 1,070 (17.4%) | 455 (10.1%) |
| $50,000 to $99,999 | 1,443 (23.5%) | 1,437 (31.7%) |
| $100,000 to $299,999 | 2,944 (48.0%) | 2,293 (50.6%) |
| $300,000 to $499,999 | 473 (7.7%) | 281 (6.2%) |
| $500,000 to $749,999 | 58 (0.9%) | 55 (1.2%) |
| $750,000 to $999,999 | 125 (2.0%) | 0 (0.0%) |
| $1,000,000 or more | 26 (0.4%) | 6 (0.1%) |
| Total | 6,139 (100.0%) | 4,527 (100.0%) |
Household Income by Mortgage Status in Elk County
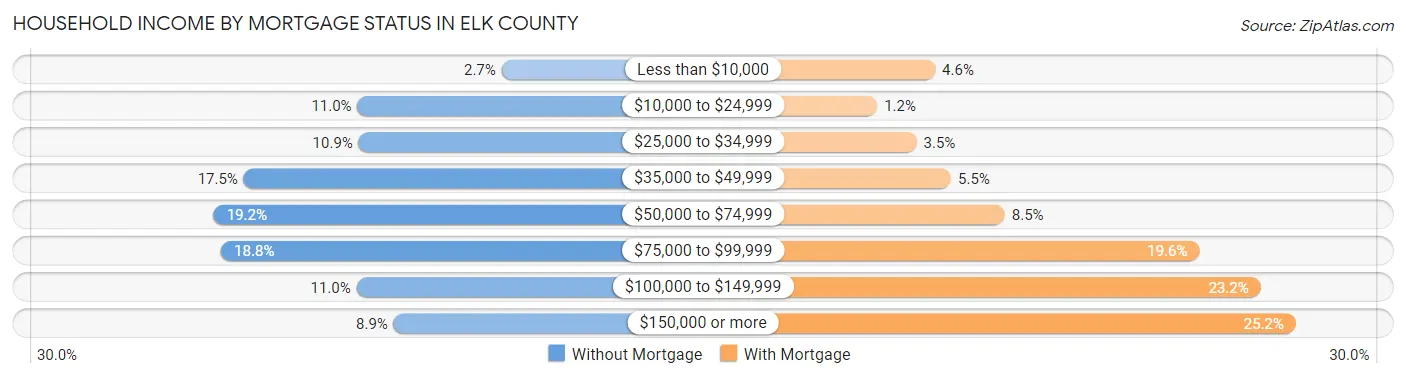
| Household Income | Without Mortgage | With Mortgage |
| Less than $10,000 | 168 (2.7%) | 206 (4.5%) |
| $10,000 to $24,999 | 674 (11.0%) | 56 (1.2%) |
| $25,000 to $34,999 | 670 (10.9%) | 158 (3.5%) |
| $35,000 to $49,999 | 1,073 (17.5%) | 247 (5.5%) |
| $50,000 to $74,999 | 1,178 (19.2%) | 386 (8.5%) |
| $75,000 to $99,999 | 1,152 (18.8%) | 889 (19.6%) |
| $100,000 to $149,999 | 677 (11.0%) | 1,048 (23.2%) |
| $150,000 or more | 547 (8.9%) | 1,139 (25.2%) |
| Total | 6,139 (100.0%) | 4,527 (100.0%) |
Property Value to Household Income Ratio in Elk County
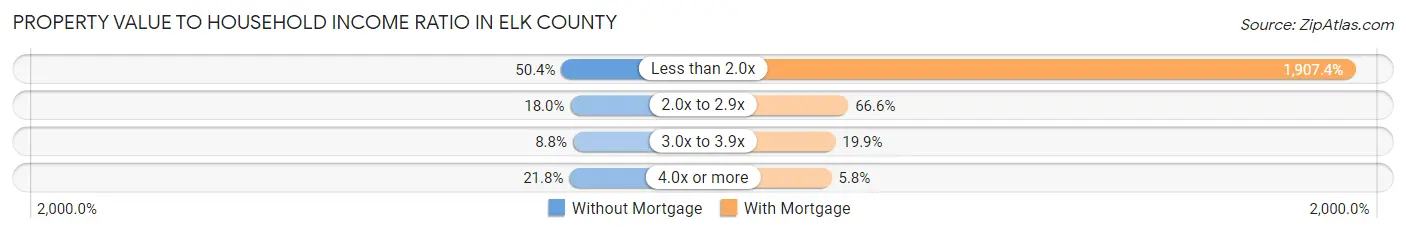
| Value-to-Income Ratio | Without Mortgage | With Mortgage |
| Less than 2.0x | 3,096 (50.4%) | 86,347 (1,907.4%) |
| 2.0x to 2.9x | 1,104 (18.0%) | 3,014 (66.6%) |
| 3.0x to 3.9x | 541 (8.8%) | 899 (19.9%) |
| 4.0x or more | 1,335 (21.7%) | 262 (5.8%) |
| Total | 6,139 (100.0%) | 4,527 (100.0%) |
Real Estate Taxes by Mortgage Status in Elk County

| Property Taxes | Without Mortgage | With Mortgage |
| Less than $800 | 944 (15.4%) | 12 (0.3%) |
| $800 to $1,499 | 1,900 (30.9%) | 477 (10.5%) |
| $800 to $1,499 | 3,236 (52.7%) | 1,384 (30.6%) |
| Total | 6,139 (100.0%) | 4,527 (100.0%) |
Health & Disability in Elk County
Health Insurance Coverage by Age in Elk County
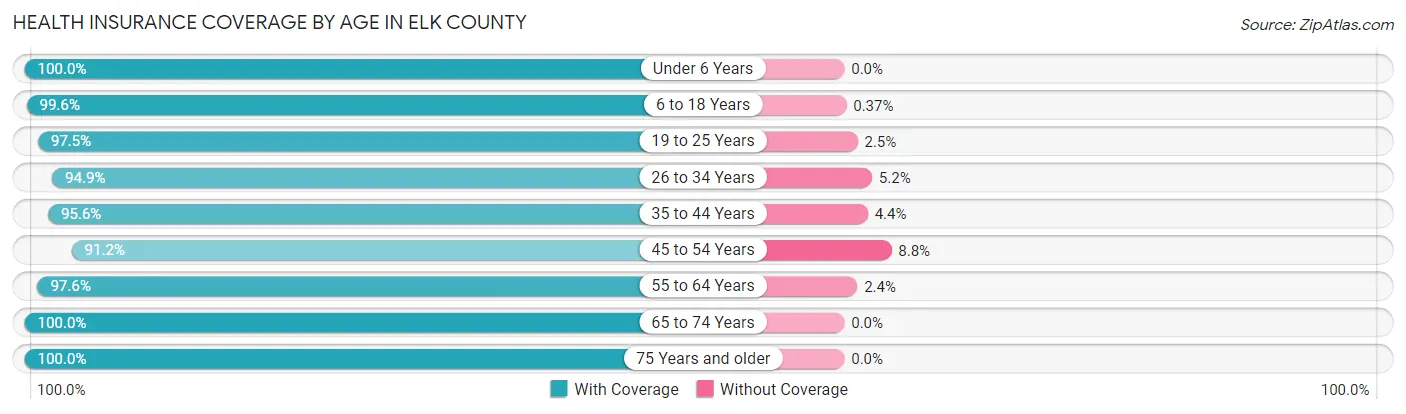
| Age Bracket | With Coverage | Without Coverage |
| Under 6 Years | 1,765 (100.0%) | 0 (0.0%) |
| 6 to 18 Years | 4,590 (99.6%) | 17 (0.4%) |
| 19 to 25 Years | 2,094 (97.5%) | 53 (2.5%) |
| 26 to 34 Years | 2,487 (94.9%) | 135 (5.1%) |
| 35 to 44 Years | 3,094 (95.6%) | 141 (4.4%) |
| 45 to 54 Years | 3,821 (91.2%) | 368 (8.8%) |
| 55 to 64 Years | 5,057 (97.6%) | 125 (2.4%) |
| 65 to 74 Years | 3,877 (100.0%) | 0 (0.0%) |
| 75 Years and older | 2,947 (100.0%) | 0 (0.0%) |
| Total | 29,732 (97.3%) | 839 (2.7%) |
Health Insurance Coverage by Citizenship Status in Elk County

| Citizenship Status | With Coverage | Without Coverage |
| Native Born | 1,765 (100.0%) | 0 (0.0%) |
| Foreign Born, Citizen | 4,590 (99.6%) | 17 (0.4%) |
| Foreign Born, not a Citizen | 2,094 (97.5%) | 53 (2.5%) |
Health Insurance Coverage by Household Income in Elk County

| Household Income | With Coverage | Without Coverage |
| Under $25,000 | 2,994 (96.9%) | 96 (3.1%) |
| $25,000 to $49,999 | 5,628 (96.1%) | 231 (3.9%) |
| $50,000 to $74,999 | 5,729 (97.6%) | 140 (2.4%) |
| $75,000 to $99,999 | 5,918 (97.2%) | 168 (2.8%) |
| $100,000 and over | 9,410 (98.0%) | 196 (2.0%) |
Public vs Private Health Insurance Coverage by Age in Elk County
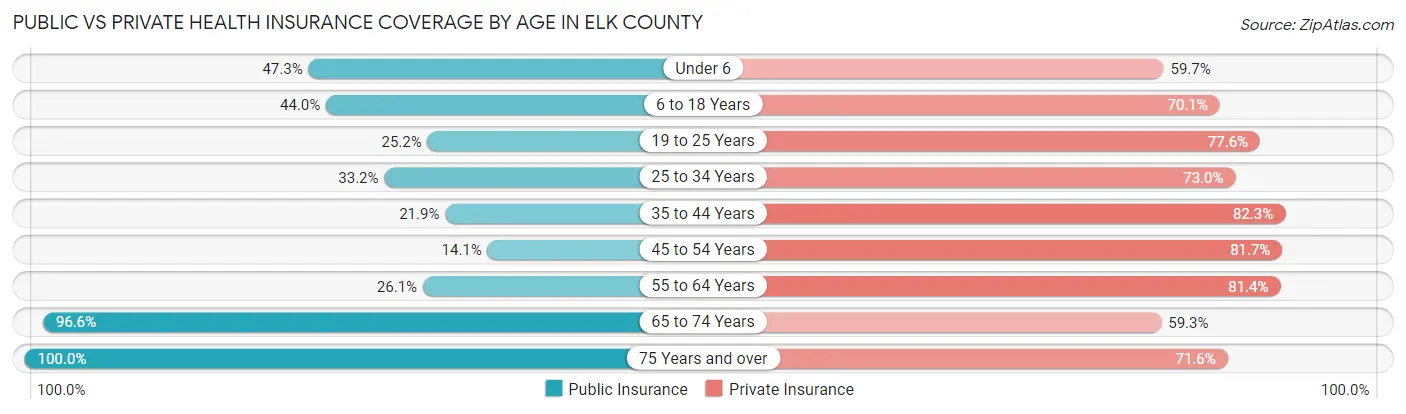
| Age Bracket | Public Insurance | Private Insurance |
| Under 6 | 835 (47.3%) | 1,054 (59.7%) |
| 6 to 18 Years | 2,029 (44.0%) | 3,231 (70.1%) |
| 19 to 25 Years | 541 (25.2%) | 1,666 (77.6%) |
| 25 to 34 Years | 871 (33.2%) | 1,915 (73.0%) |
| 35 to 44 Years | 709 (21.9%) | 2,661 (82.3%) |
| 45 to 54 Years | 589 (14.1%) | 3,424 (81.7%) |
| 55 to 64 Years | 1,351 (26.1%) | 4,217 (81.4%) |
| 65 to 74 Years | 3,746 (96.6%) | 2,299 (59.3%) |
| 75 Years and over | 2,947 (100.0%) | 2,110 (71.6%) |
| Total | 13,618 (44.6%) | 22,577 (73.9%) |
Disability Status by Sex by Age in Elk County
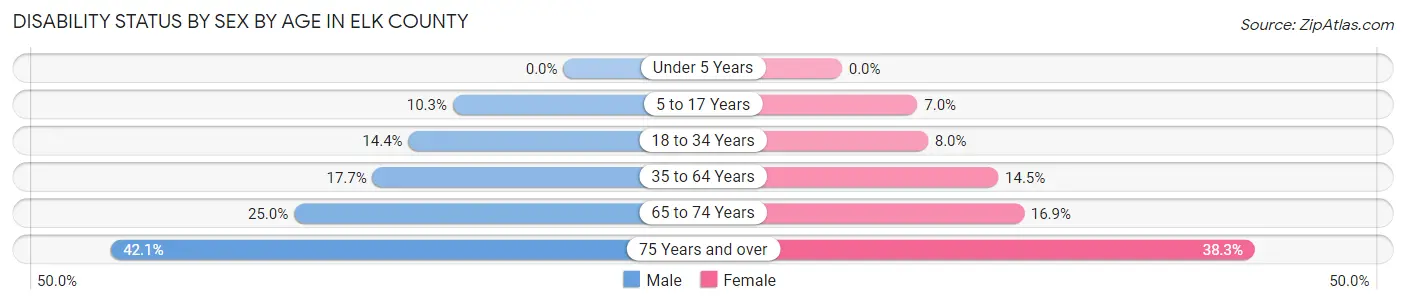
| Age Bracket | Male | Female |
| Under 5 Years | 0 (0.0%) | 0 (0.0%) |
| 5 to 17 Years | 242 (10.3%) | 150 (7.0%) |
| 18 to 34 Years | 398 (14.4%) | 195 (8.0%) |
| 35 to 64 Years | 1,161 (17.7%) | 878 (14.5%) |
| 65 to 74 Years | 488 (25.0%) | 325 (16.9%) |
| 75 Years and over | 524 (42.0%) | 652 (38.3%) |
Disability Class by Sex by Age in Elk County
Disability Class: Hearing Difficulty
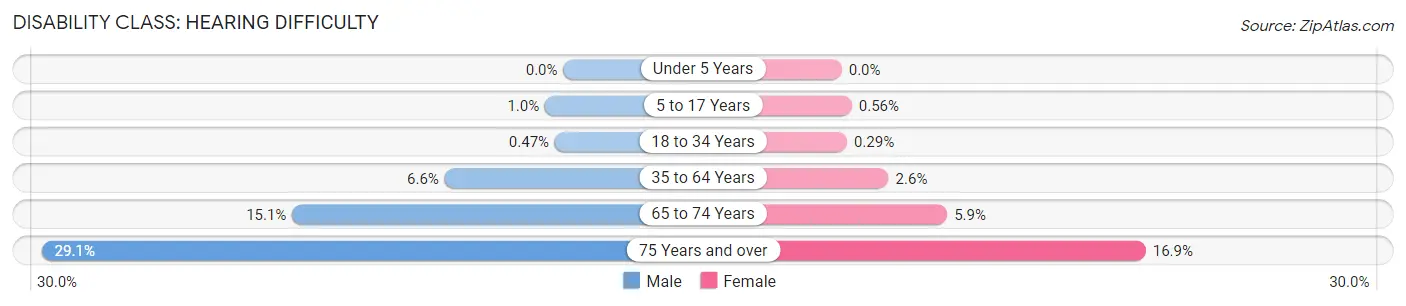
| Age Bracket | Male | Female |
| Under 5 Years | 0 (0.0%) | 0 (0.0%) |
| 5 to 17 Years | 24 (1.0%) | 12 (0.6%) |
| 18 to 34 Years | 13 (0.5%) | 7 (0.3%) |
| 35 to 64 Years | 433 (6.6%) | 158 (2.6%) |
| 65 to 74 Years | 295 (15.1%) | 113 (5.9%) |
| 75 Years and over | 362 (29.0%) | 288 (16.9%) |
Disability Class: Vision Difficulty
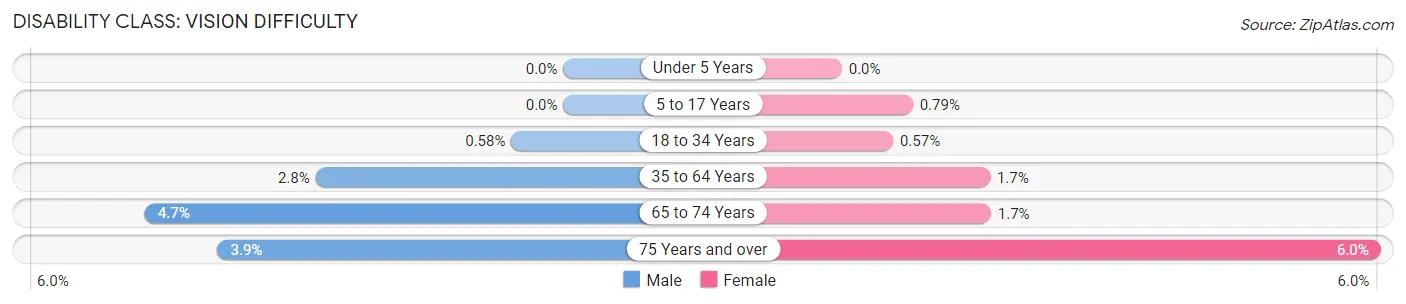
| Age Bracket | Male | Female |
| Under 5 Years | 0 (0.0%) | 0 (0.0%) |
| 5 to 17 Years | 0 (0.0%) | 17 (0.8%) |
| 18 to 34 Years | 16 (0.6%) | 14 (0.6%) |
| 35 to 64 Years | 181 (2.8%) | 100 (1.7%) |
| 65 to 74 Years | 91 (4.7%) | 32 (1.7%) |
| 75 Years and over | 48 (3.8%) | 102 (6.0%) |
Disability Class: Cognitive Difficulty
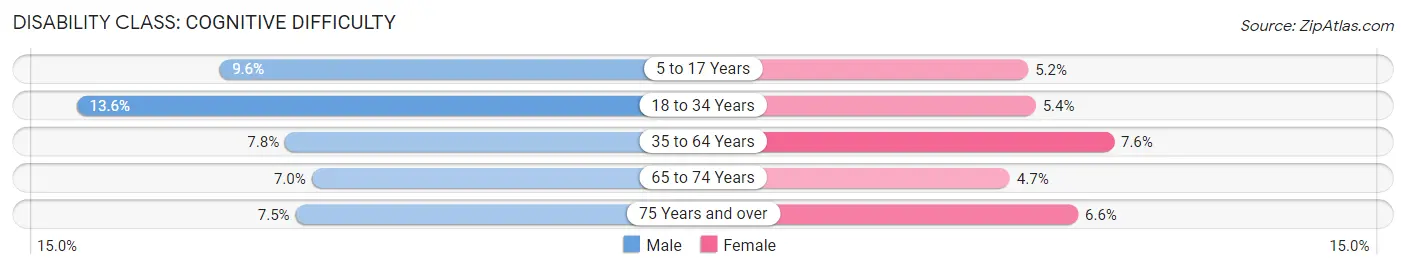
| Age Bracket | Male | Female |
| 5 to 17 Years | 226 (9.6%) | 111 (5.2%) |
| 18 to 34 Years | 375 (13.6%) | 132 (5.4%) |
| 35 to 64 Years | 508 (7.7%) | 459 (7.6%) |
| 65 to 74 Years | 137 (7.0%) | 90 (4.7%) |
| 75 Years and over | 93 (7.5%) | 112 (6.6%) |
Disability Class: Ambulatory Difficulty
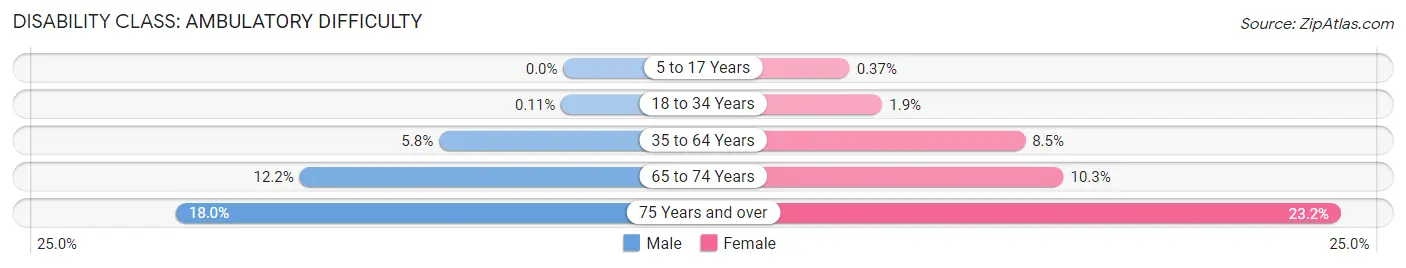
| Age Bracket | Male | Female |
| 5 to 17 Years | 0 (0.0%) | 8 (0.4%) |
| 18 to 34 Years | 3 (0.1%) | 46 (1.9%) |
| 35 to 64 Years | 378 (5.8%) | 515 (8.5%) |
| 65 to 74 Years | 239 (12.2%) | 198 (10.3%) |
| 75 Years and over | 224 (18.0%) | 394 (23.2%) |
Disability Class: Self-Care Difficulty
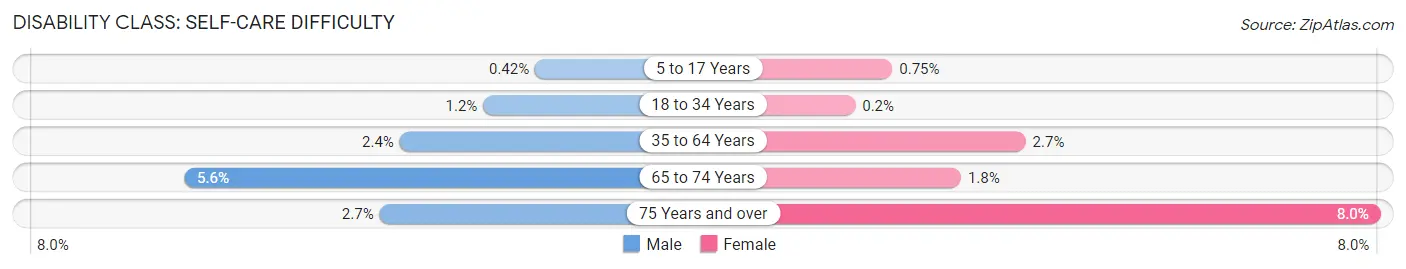
| Age Bracket | Male | Female |
| 5 to 17 Years | 10 (0.4%) | 16 (0.7%) |
| 18 to 34 Years | 33 (1.2%) | 5 (0.2%) |
| 35 to 64 Years | 159 (2.4%) | 165 (2.7%) |
| 65 to 74 Years | 110 (5.6%) | 34 (1.8%) |
| 75 Years and over | 34 (2.7%) | 136 (8.0%) |
Technology Access in Elk County
Computing Device Access in Elk County
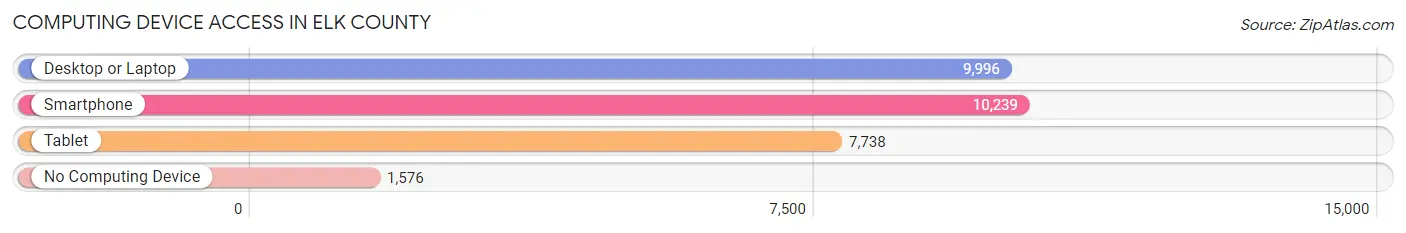
| Device Type | # Households | % Households |
| Desktop or Laptop | 9,996 | 74.1% |
| Smartphone | 10,239 | 75.9% |
| Tablet | 7,738 | 57.4% |
| No Computing Device | 1,576 | 11.7% |
| Total | 13,485 | 100.0% |
Internet Access in Elk County
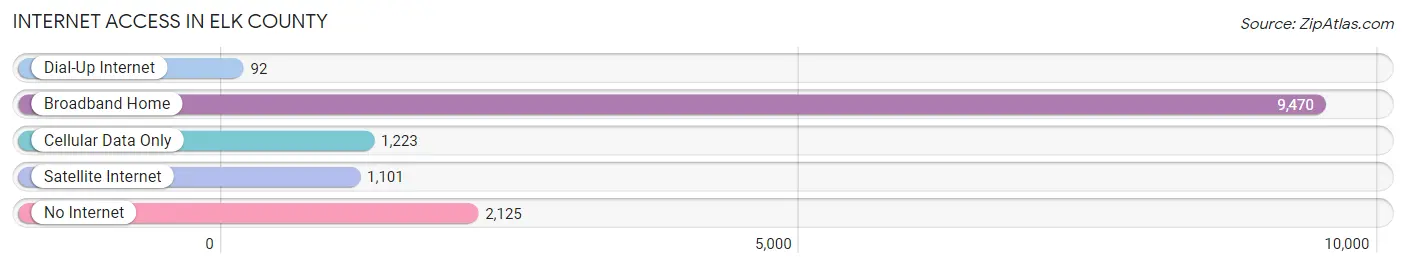
| Internet Type | # Households | % Households |
| Dial-Up Internet | 92 | 0.7% |
| Broadband Home | 9,470 | 70.2% |
| Cellular Data Only | 1,223 | 9.1% |
| Satellite Internet | 1,101 | 8.2% |
| No Internet | 2,125 | 15.8% |
| Total | 13,485 | 100.0% |
Elk County Summary
Elk County is a county located in the U.S. state of Pennsylvania. As of the 2010 census, the population was 31,946. Its county seat is Ridgway. The county was created on April 18, 1843, from parts of Jefferson and Clearfield counties.
History
Elk County was formed in 1843 from parts of Jefferson and Clearfield counties. It was named for the elk that once roamed the area. The first settlers in the county were of German and Irish descent. The first industry in the county was lumbering, which was followed by coal mining.
Geography
Elk County is located in the northwest corner of Pennsylvania. It is bordered by Jefferson County to the north, Clearfield County to the east, Cameron County to the south, and Forest County to the west. The county has a total area of 845 square miles, of which 837 square miles is land and 8.2 square miles is water.
The county is mostly mountainous, with the Allegheny Plateau running through the center. The highest point in the county is the summit of Little Toby Mountain, at 2,890 feet. The county is drained by the Clarion River and its tributaries.
Economy
The economy of Elk County is largely based on agriculture and natural resources. The county is home to several large dairy farms, as well as beef and poultry farms. The county also has a large timber industry, with several sawmills and lumber companies.
Coal mining is also an important part of the economy. The county is home to several large coal mines, including the Elk Run Mine, the largest underground coal mine in the state.
Demographics
As of the 2010 census, there were 31,946 people, 12,845 households, and 8,845 families living in the county. The population density was 38 people per square mile. There were 14,845 housing units at an average density of 18 per square mile.
The racial makeup of the county was 97.7% White, 0.5% Black or African American, 0.2% Native American, 0.2% Asian, 0.1% Pacific Islander, 0.3% from other races, and 1.1% from two or more races. 1.4% of the population were Hispanic or Latino of any race.
The largest ancestry groups in Elk County were German (37.2%), Irish (17.2%), English (13.2%), Italian (10.2%), and Polish (7.2%).
The median income for a household in the county was $35,945, and the median income for a family was $43,945. The per capita income for the county was $18,945. About 11.2% of families and 14.2% of the population were below the poverty line, including 19.2% of those under age 18 and 8.2% of those age 65 or over.
Common Questions
What is Per Capita Income in Elk County?
Per Capita income in Elk County is $34,222.
What is the Median Family Income in Elk County?
Median Family Income in Elk County is $81,017.
What is the Median Household income in Elk County?
Median Household Income in Elk County is $61,672.
What is Income or Wage Gap in Elk County?
Income or Wage Gap in Elk County is 30.6%.
Women in Elk County earn 69.4 cents for every dollar earned by a man.
What is Family Income Deficit in Elk County?
Family Income Deficit in Elk County is $10,759.
Families that are below poverty line in Elk County earn $10,759 less on average than the poverty threshold level.
What is Inequality or Gini Index in Elk County?
Inequality or Gini Index in Elk County is 0.42.
What is the Total Population of Elk County?
Total Population of Elk County is 30,886.
What is the Total Male Population of Elk County?
Total Male Population of Elk County is 15,773.
What is the Total Female Population of Elk County?
Total Female Population of Elk County is 15,113.
What is the Ratio of Males per 100 Females in Elk County?
There are 104.37 Males per 100 Females in Elk County.
What is the Ratio of Females per 100 Males in Elk County?
There are 95.82 Females per 100 Males in Elk County.
What is the Median Population Age in Elk County?
Median Population Age in Elk County is 48.2 Years.
What is the Average Family Size in Elk County
Average Family Size in Elk County is 2.9 People.
What is the Average Household Size in Elk County
Average Household Size in Elk County is 2.3 People.
How Large is the Labor Force in Elk County?
There are 16,022 People in the Labor Forcein in Elk County.
What is the Percentage of People in the Labor Force in Elk County?
62.3% of People are in the Labor Force in Elk County.
What is the Unemployment Rate in Elk County?
Unemployment Rate in Elk County is 6.5%.