Dauphin County, PA Map & Demographics
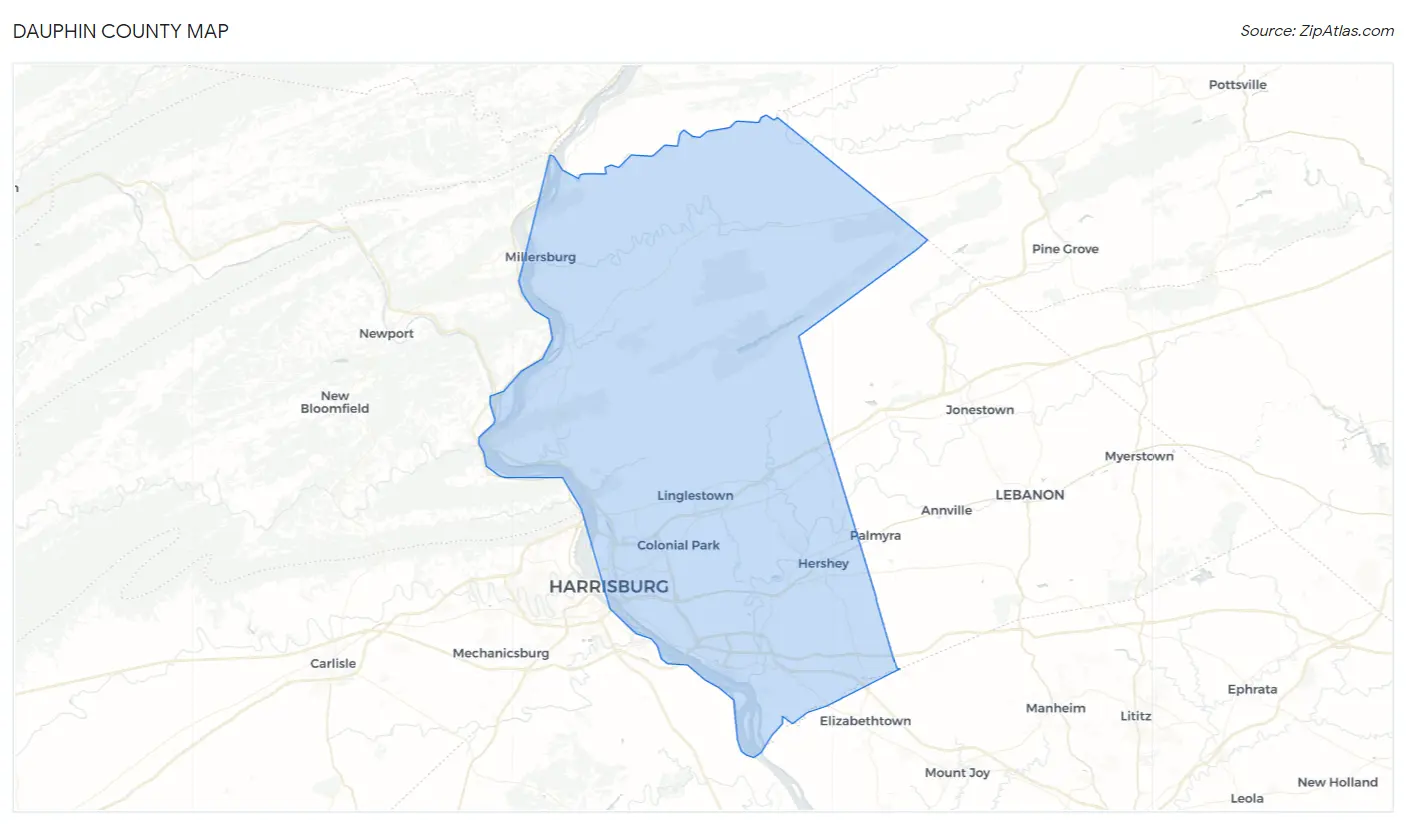
Dauphin County Map
Dauphin County Overview
$39,709
PER CAPITA INCOME
$91,006
AVG FAMILY INCOME
$71,046
AVG HOUSEHOLD INCOME
26.0%
WAGE / INCOME GAP [ % ]
74.0¢/ $1
WAGE / INCOME GAP [ $ ]
$11,526
FAMILY INCOME DEFICIT
0.46
INEQUALITY / GINI INDEX
286,108
TOTAL POPULATION
139,988
MALE POPULATION
146,120
FEMALE POPULATION
95.80
MALES / 100 FEMALES
104.38
FEMALES / 100 MALES
39.4
MEDIAN AGE
3.0
AVG FAMILY SIZE
2.4
AVG HOUSEHOLD SIZE
150,420
LABOR FORCE [ PEOPLE ]
65.5%
PERCENT IN LABOR FORCE
4.3%
UNEMPLOYMENT RATE
Dauphin County Area Codes
Income in Dauphin County
Income Overview in Dauphin County
Per Capita Income in Dauphin County is $39,709, while median incomes of families and households are $91,006 and $71,046 respectively.
| Characteristic | Number | Measure |
| Per Capita Income | 286,108 | $39,709 |
| Median Family Income | 72,307 | $91,006 |
| Mean Family Income | 72,307 | $115,532 |
| Median Household Income | 117,907 | $71,046 |
| Mean Household Income | 117,907 | $95,269 |
| Income Deficit | 72,307 | $11,526 |
| Wage / Income Gap (%) | 286,108 | 26.01% |
| Wage / Income Gap ($) | 286,108 | 73.99¢ per $1 |
| Gini / Inequality Index | 286,108 | 0.46 |
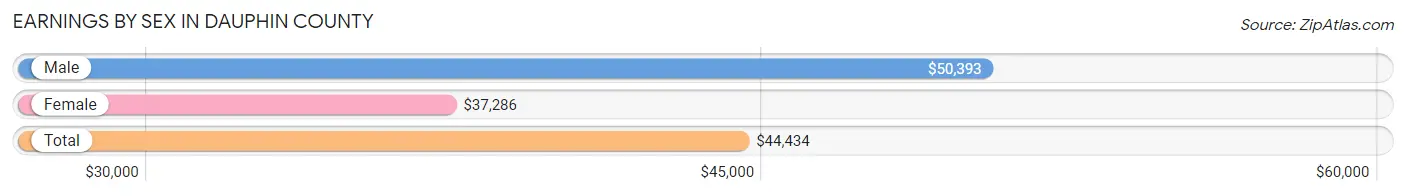
Earnings by Sex in Dauphin County
Average Earnings in Dauphin County are $44,434, $50,393 for men and $37,286 for women, a difference of 26.0%.
| Sex | Number | Average Earnings |
| Male | 80,305 (51.4%) | $50,393 |
| Female | 75,947 (48.6%) | $37,286 |
| Total | 156,252 (100.0%) | $44,434 |
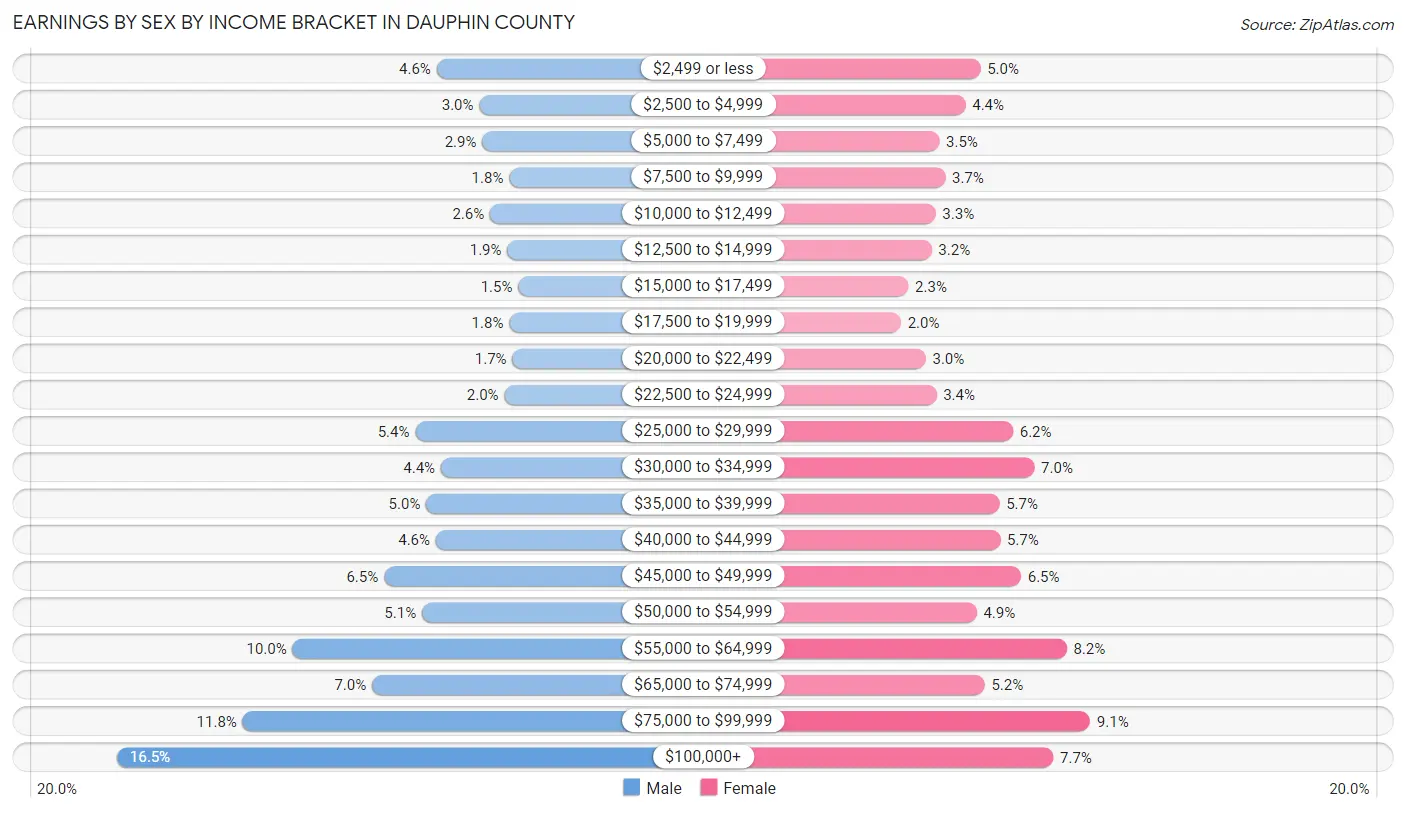
Earnings by Sex by Income Bracket in Dauphin County
The most common earnings brackets in Dauphin County are $100,000+ for men (13,279 | 16.5%) and $75,000 to $99,999 for women (6,920 | 9.1%).
| Income | Male | Female |
| $2,499 or less | 3,663 (4.6%) | 3,798 (5.0%) |
| $2,500 to $4,999 | 2,377 (3.0%) | 3,375 (4.4%) |
| $5,000 to $7,499 | 2,291 (2.9%) | 2,624 (3.5%) |
| $7,500 to $9,999 | 1,481 (1.8%) | 2,798 (3.7%) |
| $10,000 to $12,499 | 2,059 (2.6%) | 2,522 (3.3%) |
| $12,500 to $14,999 | 1,531 (1.9%) | 2,411 (3.2%) |
| $15,000 to $17,499 | 1,201 (1.5%) | 1,746 (2.3%) |
| $17,500 to $19,999 | 1,477 (1.8%) | 1,537 (2.0%) |
| $20,000 to $22,499 | 1,383 (1.7%) | 2,244 (2.9%) |
| $22,500 to $24,999 | 1,622 (2.0%) | 2,547 (3.4%) |
| $25,000 to $29,999 | 4,301 (5.4%) | 4,726 (6.2%) |
| $30,000 to $34,999 | 3,530 (4.4%) | 5,329 (7.0%) |
| $35,000 to $39,999 | 3,979 (5.0%) | 4,338 (5.7%) |
| $40,000 to $44,999 | 3,684 (4.6%) | 4,357 (5.7%) |
| $45,000 to $49,999 | 5,241 (6.5%) | 4,948 (6.5%) |
| $50,000 to $54,999 | 4,106 (5.1%) | 3,690 (4.9%) |
| $55,000 to $64,999 | 7,996 (10.0%) | 6,251 (8.2%) |
| $65,000 to $74,999 | 5,607 (7.0%) | 3,917 (5.2%) |
| $75,000 to $99,999 | 9,497 (11.8%) | 6,920 (9.1%) |
| $100,000+ | 13,279 (16.5%) | 5,869 (7.7%) |
| Total | 80,305 (100.0%) | 75,947 (100.0%) |
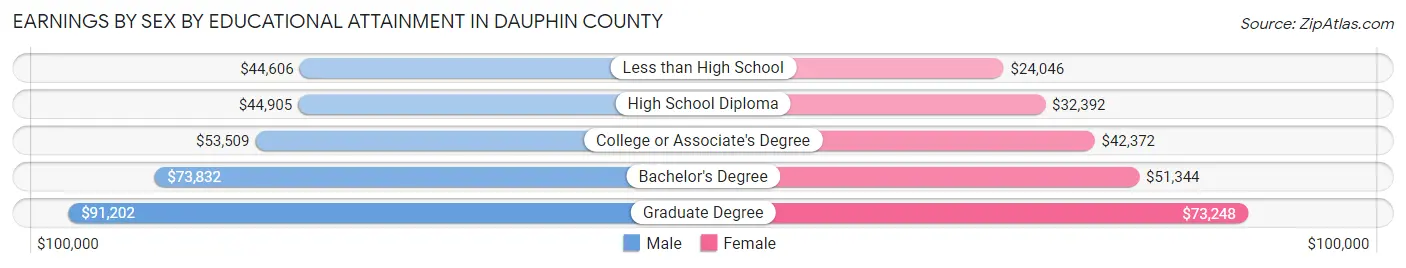
Earnings by Sex by Educational Attainment in Dauphin County
Average earnings in Dauphin County are $55,664 for men and $43,116 for women, a difference of 22.5%. Men with an educational attainment of graduate degree enjoy the highest average annual earnings of $91,202, while those with less than high school education earn the least with $44,606. Women with an educational attainment of graduate degree earn the most with the average annual earnings of $73,248, while those with less than high school education have the smallest earnings of $24,046.
| Educational Attainment | Male Income | Female Income |
| Less than High School | $44,606 | $24,046 |
| High School Diploma | $44,905 | $32,392 |
| College or Associate's Degree | $53,509 | $42,372 |
| Bachelor's Degree | $73,832 | $51,344 |
| Graduate Degree | $91,202 | $73,248 |
| Total | $55,664 | $43,116 |
Family Income in Dauphin County
Family Income Brackets in Dauphin County
According to the Dauphin County family income data, there are 15,474 families falling into the $100,000 to $149,999 income range, which is the most common income bracket and makes up 21.4% of all families. Conversely, the $10,000 to $14,999 income bracket is the least frequent group with only 795 families (1.1%) belonging to this category.
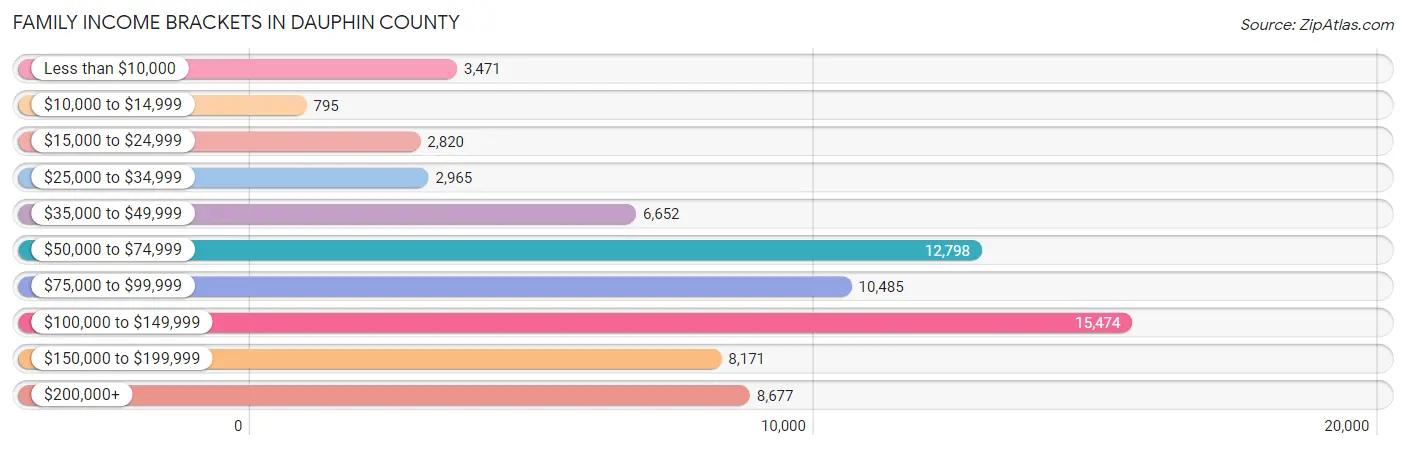
| Income Bracket | # Families | % Families |
| Less than $10,000 | 3,471 | 4.8% |
| $10,000 to $14,999 | 795 | 1.1% |
| $15,000 to $24,999 | 2,820 | 3.9% |
| $25,000 to $34,999 | 2,965 | 4.1% |
| $35,000 to $49,999 | 6,652 | 9.2% |
| $50,000 to $74,999 | 12,798 | 17.7% |
| $75,000 to $99,999 | 10,485 | 14.5% |
| $100,000 to $149,999 | 15,474 | 21.4% |
| $150,000 to $199,999 | 8,171 | 11.3% |
| $200,000+ | 8,677 | 12.0% |
Family Income by Famaliy Size in Dauphin County
7+ person families (1,579 | 2.2%) account for the highest median family income in Dauphin County with $114,375 per family, while 2-person families (37,266 | 51.5%) have the highest median income of $40,686 per family member.
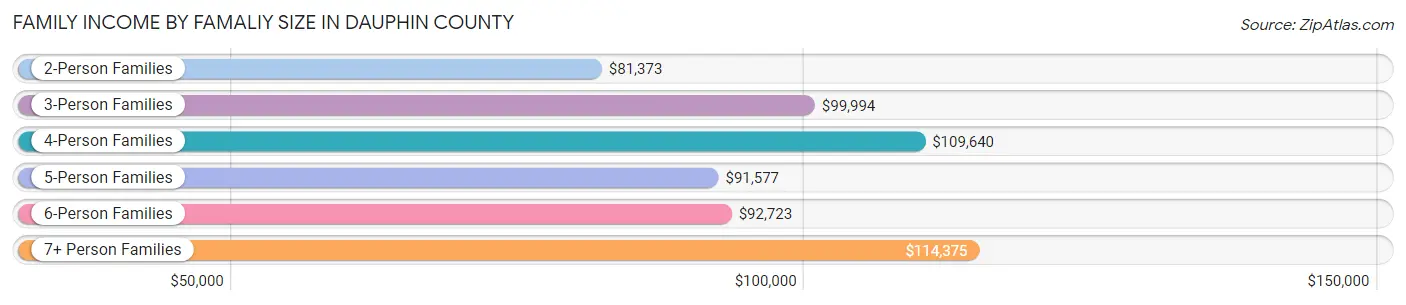
| Income Bracket | # Families | Median Income |
| 2-Person Families | 37,266 (51.5%) | $81,373 |
| 3-Person Families | 14,651 (20.3%) | $99,994 |
| 4-Person Families | 12,306 (17.0%) | $109,640 |
| 5-Person Families | 4,840 (6.7%) | $91,577 |
| 6-Person Families | 1,665 (2.3%) | $92,723 |
| 7+ Person Families | 1,579 (2.2%) | $114,375 |
| Total | 72,307 (100.0%) | $91,006 |
Family Income by Number of Earners in Dauphin County
The median family income in Dauphin County is $91,006, with families comprising 3+ earners (8,639) having the highest median family income of $144,838, while families with no earners (11,509) have the lowest median family income of $51,306, accounting for 11.9% and 15.9% of families, respectively.
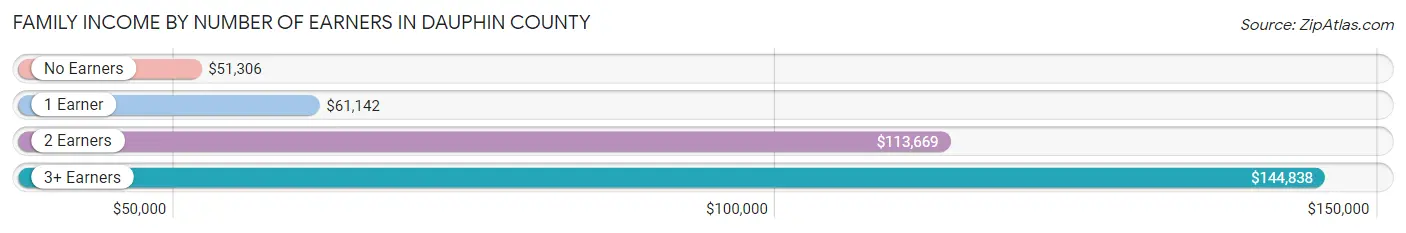
| Number of Earners | # Families | Median Income |
| No Earners | 11,509 (15.9%) | $51,306 |
| 1 Earner | 20,374 (28.2%) | $61,142 |
| 2 Earners | 31,785 (44.0%) | $113,669 |
| 3+ Earners | 8,639 (11.9%) | $144,838 |
| Total | 72,307 (100.0%) | $91,006 |
Household Income in Dauphin County
Household Income Brackets in Dauphin County
With 22,167 households falling in the category, the $50,000 to $74,999 income range is the most frequent in Dauphin County, accounting for 18.8% of all households. In contrast, only 3,183 households (2.7%) fall into the $10,000 to $14,999 income bracket, making it the least populous group.
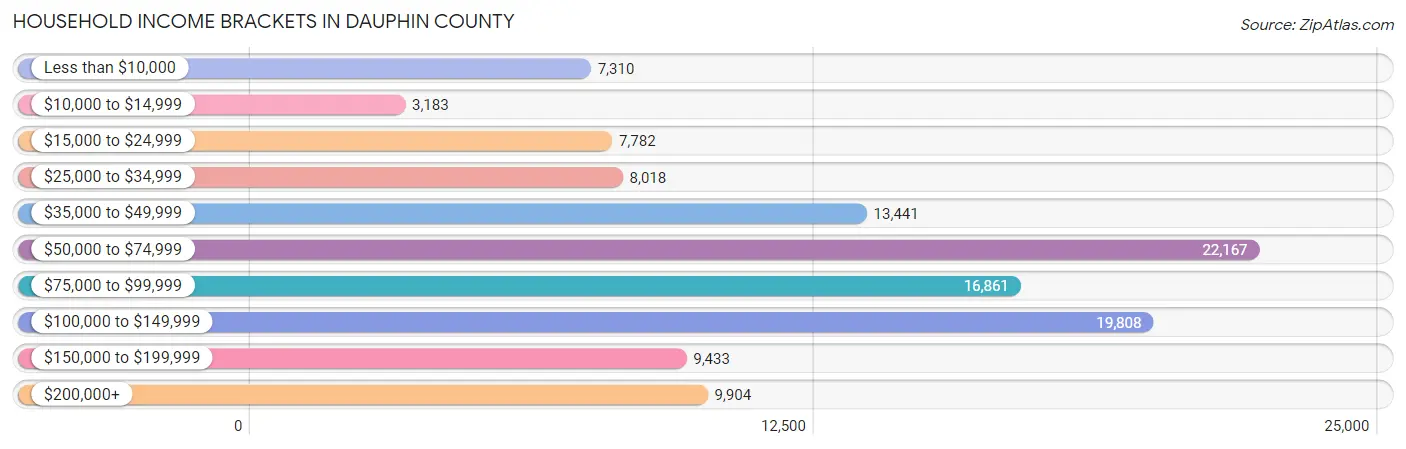
| Income Bracket | # Households | % Households |
| Less than $10,000 | 7,310 | 6.2% |
| $10,000 to $14,999 | 3,183 | 2.7% |
| $15,000 to $24,999 | 7,782 | 6.6% |
| $25,000 to $34,999 | 8,018 | 6.8% |
| $35,000 to $49,999 | 13,441 | 11.4% |
| $50,000 to $74,999 | 22,167 | 18.8% |
| $75,000 to $99,999 | 16,861 | 14.3% |
| $100,000 to $149,999 | 19,808 | 16.8% |
| $150,000 to $199,999 | 9,433 | 8.0% |
| $200,000+ | 9,904 | 8.4% |
Household Income by Householder Age in Dauphin County
The median household income in Dauphin County is $71,046, with the highest median household income of $84,463 found in the 45 to 64 years age bracket for the primary householder. A total of 43,200 households (36.6%) fall into this category. Meanwhile, the 15 to 24 years age bracket for the primary householder has the lowest median household income of $40,700, with 5,134 households (4.3%) in this group.
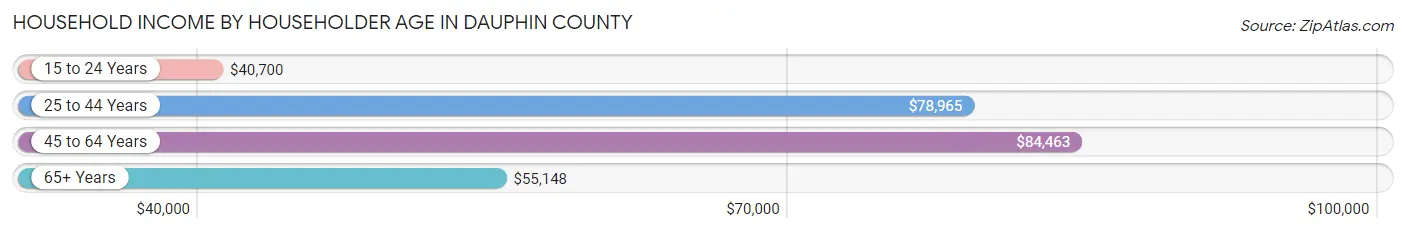
| Income Bracket | # Households | Median Income |
| 15 to 24 Years | 5,134 (4.3%) | $40,700 |
| 25 to 44 Years | 37,765 (32.0%) | $78,965 |
| 45 to 64 Years | 43,200 (36.6%) | $84,463 |
| 65+ Years | 31,808 (27.0%) | $55,148 |
| Total | 117,907 (100.0%) | $71,046 |
Poverty in Dauphin County
Income Below Poverty by Sex and Age in Dauphin County
With 11.0% poverty level for males and 13.3% for females among the residents of Dauphin County, 12 to 14 year old males and 18 to 24 year old females are the most vulnerable to poverty, with 1,300 males (23.1%) and 2,485 females (21.8%) in their respective age groups living below the poverty level.
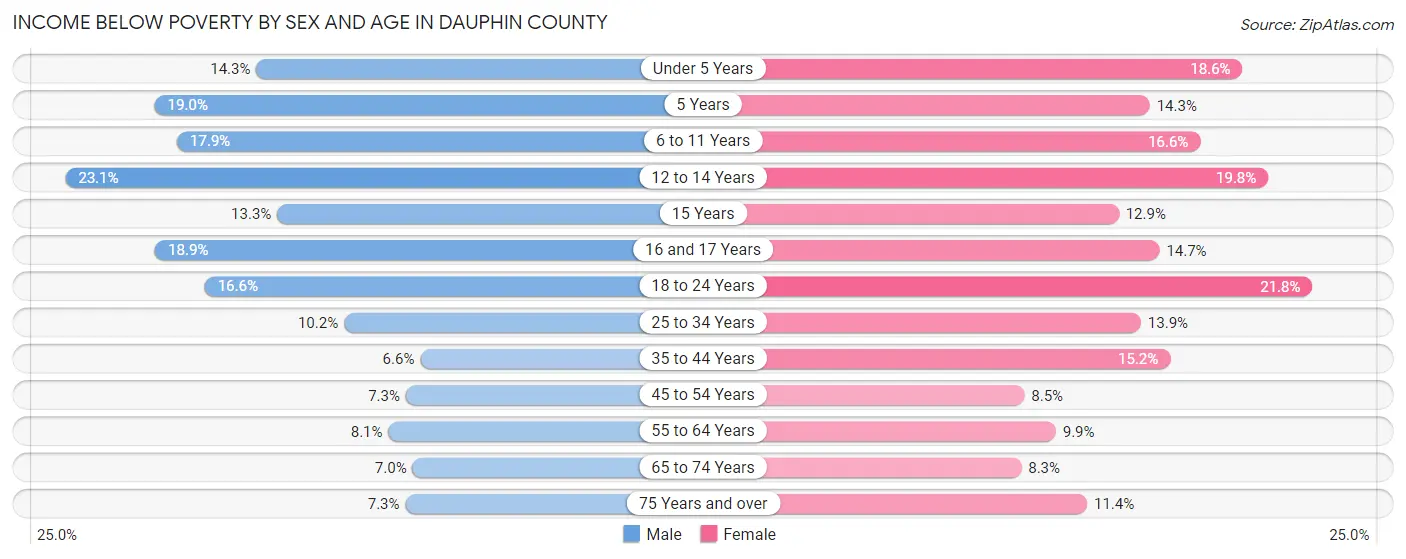
| Age Bracket | Male | Female |
| Under 5 Years | 1,250 (14.2%) | 1,540 (18.6%) |
| 5 Years | 331 (19.0%) | 228 (14.3%) |
| 6 to 11 Years | 1,900 (17.9%) | 1,744 (16.6%) |
| 12 to 14 Years | 1,300 (23.1%) | 962 (19.8%) |
| 15 Years | 204 (13.3%) | 266 (12.9%) |
| 16 and 17 Years | 725 (18.9%) | 482 (14.7%) |
| 18 to 24 Years | 1,923 (16.6%) | 2,485 (21.8%) |
| 25 to 34 Years | 1,958 (10.2%) | 2,747 (13.9%) |
| 35 to 44 Years | 1,096 (6.6%) | 2,683 (15.2%) |
| 45 to 54 Years | 1,307 (7.3%) | 1,486 (8.5%) |
| 55 to 64 Years | 1,498 (8.1%) | 1,991 (9.9%) |
| 65 to 74 Years | 970 (7.0%) | 1,316 (8.3%) |
| 75 Years and over | 558 (7.3%) | 1,306 (11.4%) |
| Total | 15,020 (11.0%) | 19,236 (13.3%) |
Income Above Poverty by Sex and Age in Dauphin County
According to the poverty statistics in Dauphin County, males aged 35 to 44 years and females aged 65 to 74 years are the age groups that are most secure financially, with 93.4% of males and 91.7% of females in these age groups living above the poverty line.
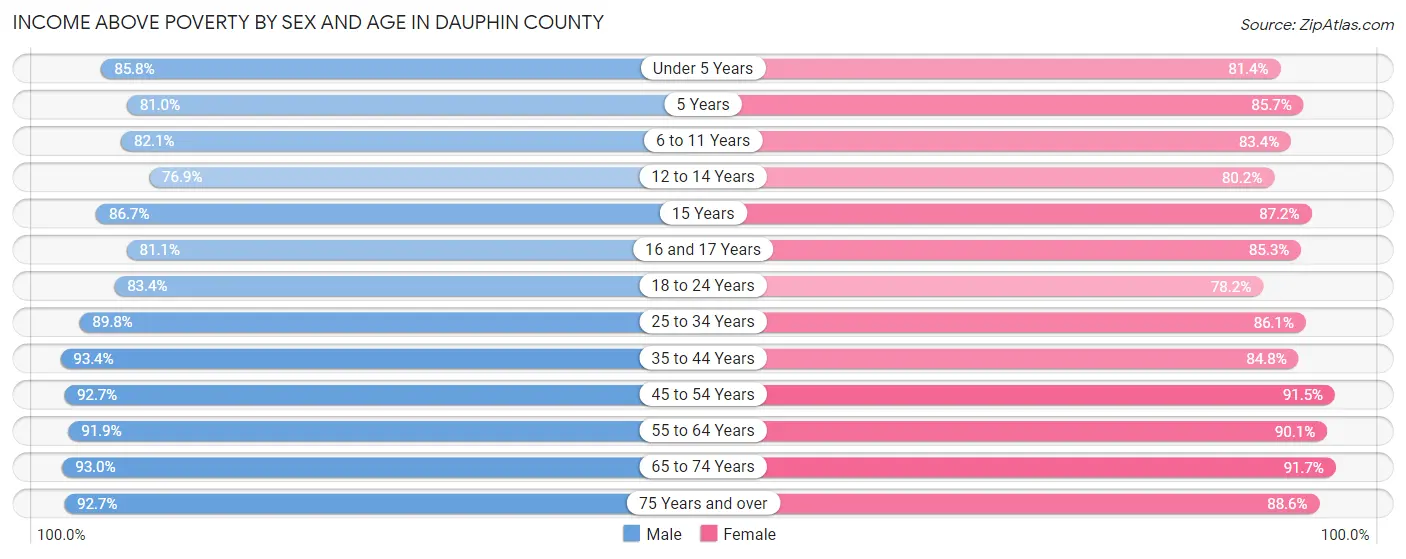
| Age Bracket | Male | Female |
| Under 5 Years | 7,524 (85.8%) | 6,742 (81.4%) |
| 5 Years | 1,414 (81.0%) | 1,367 (85.7%) |
| 6 to 11 Years | 8,694 (82.1%) | 8,742 (83.4%) |
| 12 to 14 Years | 4,325 (76.9%) | 3,902 (80.2%) |
| 15 Years | 1,332 (86.7%) | 1,804 (87.2%) |
| 16 and 17 Years | 3,102 (81.1%) | 2,789 (85.3%) |
| 18 to 24 Years | 9,631 (83.4%) | 8,900 (78.2%) |
| 25 to 34 Years | 17,272 (89.8%) | 17,049 (86.1%) |
| 35 to 44 Years | 15,403 (93.4%) | 14,938 (84.8%) |
| 45 to 54 Years | 16,571 (92.7%) | 16,059 (91.5%) |
| 55 to 64 Years | 16,940 (91.9%) | 18,062 (90.1%) |
| 65 to 74 Years | 12,896 (93.0%) | 14,477 (91.7%) |
| 75 Years and over | 7,053 (92.7%) | 10,170 (88.6%) |
| Total | 122,157 (89.0%) | 125,001 (86.7%) |
Income Below Poverty Among Married-Couple Families in Dauphin County
The poverty statistics for married-couple families in Dauphin County show that 2.9% or 1,496 of the total 51,878 families live below the poverty line. Families with 3 or 4 children have the highest poverty rate of 8.0%, comprising of 268 families. On the other hand, families with no children have the lowest poverty rate of 2.3%, which includes 743 families.
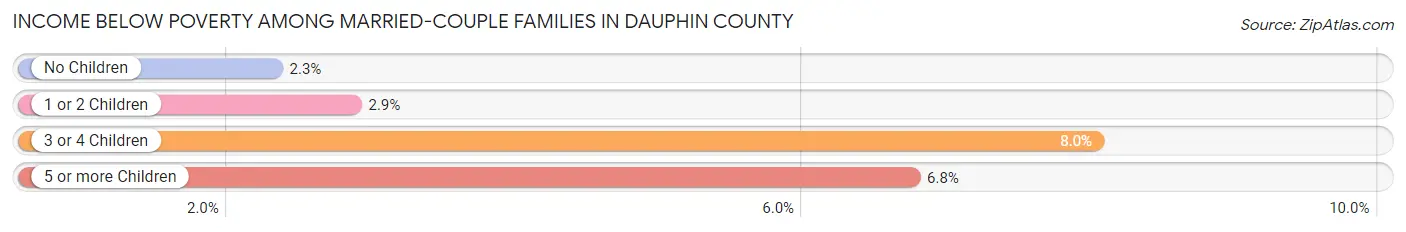
| Children | Above Poverty | Below Poverty |
| No Children | 31,475 (97.7%) | 743 (2.3%) |
| 1 or 2 Children | 15,396 (97.1%) | 453 (2.9%) |
| 3 or 4 Children | 3,069 (92.0%) | 268 (8.0%) |
| 5 or more Children | 442 (93.2%) | 32 (6.8%) |
| Total | 50,382 (97.1%) | 1,496 (2.9%) |
Income Below Poverty Among Single-Parent Households in Dauphin County
According to the poverty data in Dauphin County, 14.4% or 793 single-father households and 29.8% or 4,443 single-mother households are living below the poverty line. Among single-father households, those with 1 or 2 children have the highest poverty rate, with 540 households (20.3%) experiencing poverty. Likewise, among single-mother households, those with 3 or 4 children have the highest poverty rate, with 752 households (52.1%) falling below the poverty line.
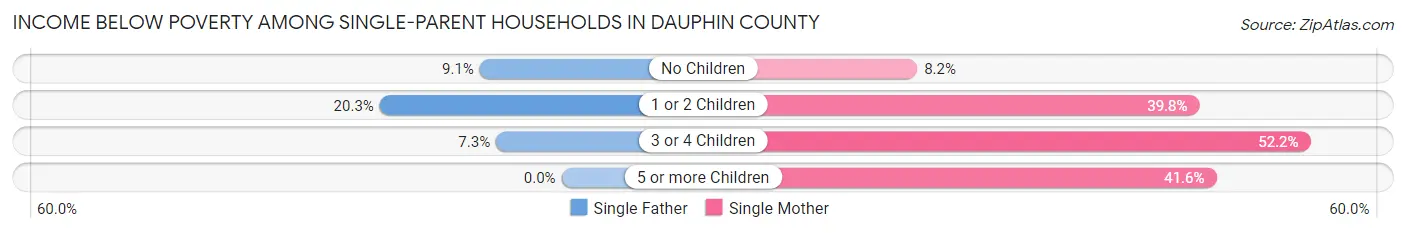
| Children | Single Father | Single Mother |
| No Children | 227 (9.1%) | 437 (8.2%) |
| 1 or 2 Children | 540 (20.3%) | 3,127 (39.8%) |
| 3 or 4 Children | 26 (7.3%) | 752 (52.1%) |
| 5 or more Children | 0 (0.0%) | 127 (41.6%) |
| Total | 793 (14.4%) | 4,443 (29.8%) |
Income Below Poverty Among Married-Couple vs Single-Parent Households in Dauphin County
The poverty data for Dauphin County shows that 1,496 of the married-couple family households (2.9%) and 5,236 of the single-parent households (25.6%) are living below the poverty level. Within the married-couple family households, those with 3 or 4 children have the highest poverty rate, with 268 households (8.0%) falling below the poverty line. Among the single-parent households, those with 3 or 4 children have the highest poverty rate, with 778 household (43.3%) living below poverty.
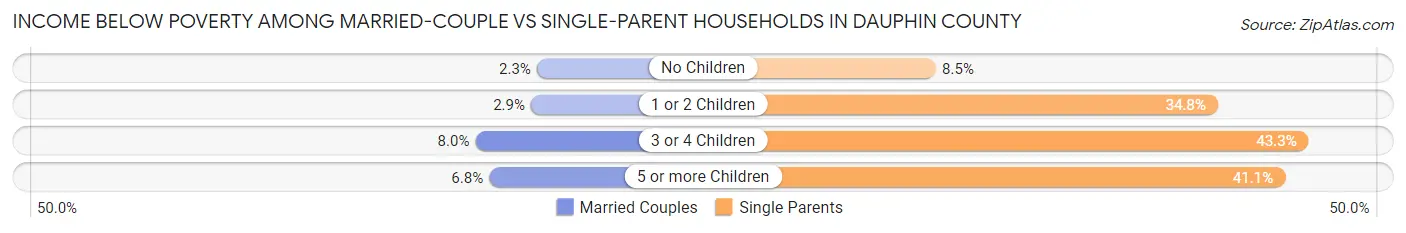
| Children | Married-Couple Families | Single-Parent Households |
| No Children | 743 (2.3%) | 664 (8.5%) |
| 1 or 2 Children | 453 (2.9%) | 3,667 (34.8%) |
| 3 or 4 Children | 268 (8.0%) | 778 (43.3%) |
| 5 or more Children | 32 (6.8%) | 127 (41.1%) |
| Total | 1,496 (2.9%) | 5,236 (25.6%) |
Race in Dauphin County
The most populous races in Dauphin County are White / Caucasian (190,327 | 66.5%), Black / African American (52,798 | 18.4%), and Hispanic or Latino (29,871 | 10.4%).
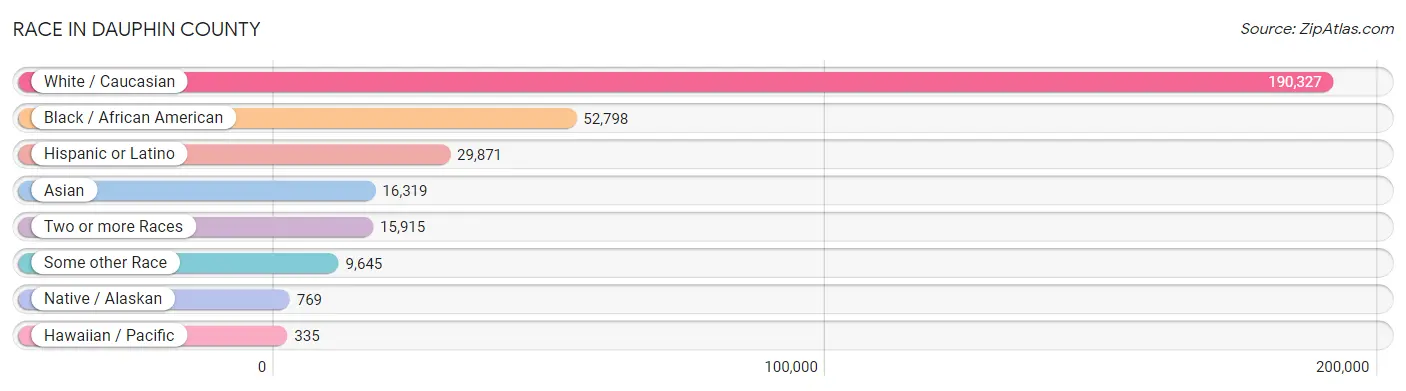
| Race | # Population | % Population |
| Asian | 16,319 | 5.7% |
| Black / African American | 52,798 | 18.4% |
| Hawaiian / Pacific | 335 | 0.1% |
| Hispanic or Latino | 29,871 | 10.4% |
| Native / Alaskan | 769 | 0.3% |
| White / Caucasian | 190,327 | 66.5% |
| Two or more Races | 15,915 | 5.6% |
| Some other Race | 9,645 | 3.4% |
| Total | 286,108 | 100.0% |
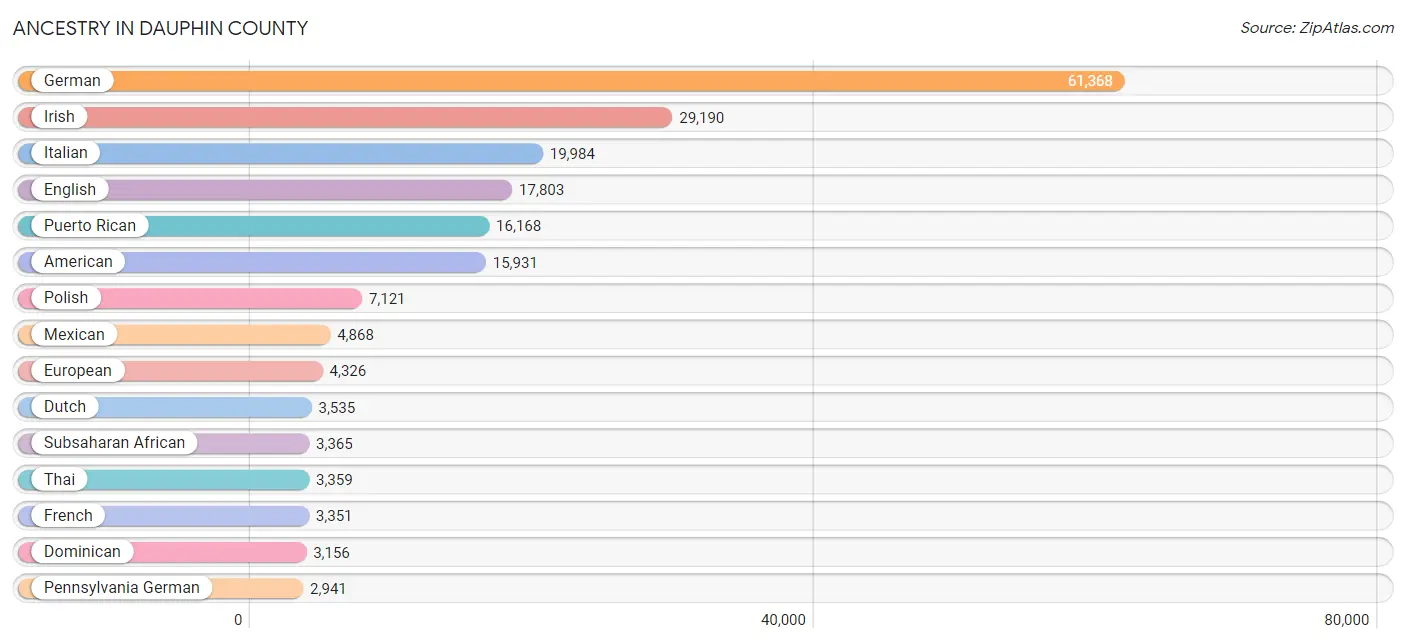
Ancestry in Dauphin County
The most populous ancestries reported in Dauphin County are German (61,368 | 21.4%), Irish (29,190 | 10.2%), Italian (19,984 | 7.0%), English (17,803 | 6.2%), and Puerto Rican (16,168 | 5.7%), together accounting for 50.5% of all Dauphin County residents.
| Ancestry | # Population | % Population |
| Afghan | 9 | 0.0% |
| African | 1,706 | 0.6% |
| Alaska Native | 22 | 0.0% |
| Albanian | 316 | 0.1% |
| American | 15,931 | 5.6% |
| Apache | 3 | 0.0% |
| Arab | 1,620 | 0.6% |
| Argentinean | 159 | 0.1% |
| Armenian | 114 | 0.0% |
| Australian | 104 | 0.0% |
| Austrian | 518 | 0.2% |
| Bangladeshi | 119 | 0.0% |
| Barbadian | 16 | 0.0% |
| Belgian | 66 | 0.0% |
| Bermudan | 213 | 0.1% |
| Bhutanese | 670 | 0.2% |
| Blackfeet | 127 | 0.0% |
| Bolivian | 62 | 0.0% |
| Brazilian | 139 | 0.1% |
| British | 1,104 | 0.4% |
| British West Indian | 15 | 0.0% |
| Bulgarian | 67 | 0.0% |
| Burmese | 414 | 0.1% |
| Cambodian | 5 | 0.0% |
| Canadian | 144 | 0.1% |
| Carpatho Rusyn | 64 | 0.0% |
| Celtic | 79 | 0.0% |
| Central American | 864 | 0.3% |
| Central American Indian | 176 | 0.1% |
| Cherokee | 720 | 0.3% |
| Chilean | 399 | 0.1% |
| Chippewa | 32 | 0.0% |
| Colombian | 752 | 0.3% |
| Creek | 1 | 0.0% |
| Croatian | 1,601 | 0.6% |
| Cuban | 787 | 0.3% |
| Czech | 384 | 0.1% |
| Czechoslovakian | 274 | 0.1% |
| Danish | 297 | 0.1% |
| Dominican | 3,156 | 1.1% |
| Dutch | 3,535 | 1.2% |
| Eastern European | 1,510 | 0.5% |
| Ecuadorian | 156 | 0.1% |
| Egyptian | 393 | 0.1% |
| English | 17,803 | 6.2% |
| Ethiopian | 100 | 0.0% |
| European | 4,326 | 1.5% |
| Filipino | 30 | 0.0% |
| Finnish | 86 | 0.0% |
| French | 3,351 | 1.2% |
| French American Indian | 5 | 0.0% |
| French Canadian | 263 | 0.1% |
| German | 61,368 | 21.4% |
| German Russian | 8 | 0.0% |
| Ghanaian | 18 | 0.0% |
| Greek | 770 | 0.3% |
| Guamanian / Chamorro | 152 | 0.1% |
| Guatemalan | 94 | 0.0% |
| Guyanese | 33 | 0.0% |
| Haitian | 311 | 0.1% |
| Honduran | 229 | 0.1% |
| Hungarian | 1,621 | 0.6% |
| Icelander | 17 | 0.0% |
| Indian (Asian) | 2,230 | 0.8% |
| Inupiat | 72 | 0.0% |
| Iranian | 68 | 0.0% |
| Iraqi | 19 | 0.0% |
| Irish | 29,190 | 10.2% |
| Iroquois | 22 | 0.0% |
| Israeli | 100 | 0.0% |
| Italian | 19,984 | 7.0% |
| Jamaican | 530 | 0.2% |
| Japanese | 405 | 0.1% |
| Kenyan | 70 | 0.0% |
| Korean | 1,231 | 0.4% |
| Laotian | 446 | 0.2% |
| Latvian | 36 | 0.0% |
| Lebanese | 359 | 0.1% |
| Liberian | 14 | 0.0% |
| Lithuanian | 733 | 0.3% |
| Lumbee | 202 | 0.1% |
| Macedonian | 272 | 0.1% |
| Malaysian | 23 | 0.0% |
| Mexican | 4,868 | 1.7% |
| Mexican American Indian | 351 | 0.1% |
| Mongolian | 71 | 0.0% |
| Moroccan | 59 | 0.0% |
| Native Hawaiian | 169 | 0.1% |
| Navajo | 8 | 0.0% |
| New Zealander | 34 | 0.0% |
| Nicaraguan | 71 | 0.0% |
| Nigerian | 645 | 0.2% |
| Northern European | 442 | 0.2% |
| Norwegian | 717 | 0.3% |
| Okinawan | 8 | 0.0% |
| Pakistani | 95 | 0.0% |
| Palestinian | 170 | 0.1% |
| Panamanian | 237 | 0.1% |
| Pennsylvania German | 2,941 | 1.0% |
| Peruvian | 561 | 0.2% |
| Polish | 7,121 | 2.5% |
| Portuguese | 298 | 0.1% |
| Puerto Rican | 16,168 | 5.7% |
| Romanian | 349 | 0.1% |
| Russian | 1,568 | 0.5% |
| Salvadoran | 233 | 0.1% |
| Scandinavian | 444 | 0.2% |
| Scotch-Irish | 2,471 | 0.9% |
| Scottish | 2,781 | 1.0% |
| Seminole | 33 | 0.0% |
| Serbian | 611 | 0.2% |
| Sioux | 8 | 0.0% |
| Slavic | 261 | 0.1% |
| Slovak | 1,733 | 0.6% |
| Slovene | 271 | 0.1% |
| South African | 193 | 0.1% |
| South American | 2,222 | 0.8% |
| South American Indian | 36 | 0.0% |
| Spaniard | 515 | 0.2% |
| Spanish | 108 | 0.0% |
| Spanish American | 19 | 0.0% |
| Spanish American Indian | 30 | 0.0% |
| Sri Lankan | 2,221 | 0.8% |
| Subsaharan African | 3,365 | 1.2% |
| Swedish | 2,276 | 0.8% |
| Swiss | 1,578 | 0.5% |
| Syrian | 239 | 0.1% |
| Thai | 3,359 | 1.2% |
| Trinidadian and Tobagonian | 151 | 0.1% |
| U.S. Virgin Islander | 62 | 0.0% |
| Ugandan | 15 | 0.0% |
| Ukrainian | 986 | 0.3% |
| Uruguayan | 20 | 0.0% |
| Venezuelan | 113 | 0.0% |
| Vietnamese | 68 | 0.0% |
| Welsh | 2,574 | 0.9% |
| West Indian | 118 | 0.0% |
| Yaqui | 8 | 0.0% |
| Yugoslavian | 257 | 0.1% | View All 139 Rows |
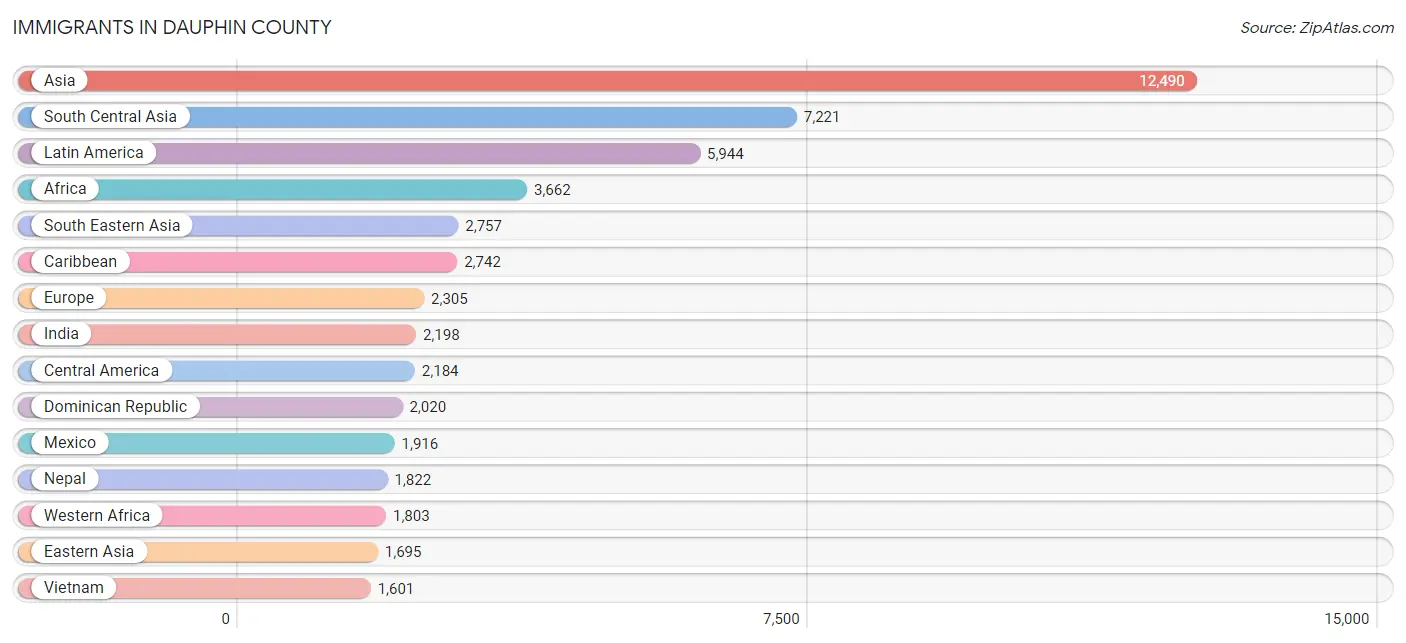
Immigrants in Dauphin County
The most numerous immigrant groups reported in Dauphin County came from Asia (12,490 | 4.4%), South Central Asia (7,221 | 2.5%), Latin America (5,944 | 2.1%), Africa (3,662 | 1.3%), and South Eastern Asia (2,757 | 1.0%), together accounting for 11.2% of all Dauphin County residents.
| Immigration Origin | # Population | % Population |
| Africa | 3,662 | 1.3% |
| Albania | 14 | 0.0% |
| Argentina | 35 | 0.0% |
| Asia | 12,490 | 4.4% |
| Australia | 21 | 0.0% |
| Austria | 11 | 0.0% |
| Bangladesh | 178 | 0.1% |
| Barbados | 16 | 0.0% |
| Belarus | 8 | 0.0% |
| Belgium | 25 | 0.0% |
| Bolivia | 37 | 0.0% |
| Bosnia and Herzegovina | 332 | 0.1% |
| Brazil | 112 | 0.0% |
| Cambodia | 237 | 0.1% |
| Cameroon | 117 | 0.0% |
| Canada | 148 | 0.1% |
| Caribbean | 2,742 | 1.0% |
| Central America | 2,184 | 0.8% |
| Chile | 192 | 0.1% |
| China | 1,490 | 0.5% |
| Colombia | 92 | 0.0% |
| Congo | 6 | 0.0% |
| Croatia | 35 | 0.0% |
| Cuba | 87 | 0.0% |
| Czechoslovakia | 8 | 0.0% |
| Denmark | 14 | 0.0% |
| Dominica | 92 | 0.0% |
| Dominican Republic | 2,020 | 0.7% |
| Eastern Africa | 629 | 0.2% |
| Eastern Asia | 1,695 | 0.6% |
| Eastern Europe | 1,016 | 0.4% |
| Ecuador | 93 | 0.0% |
| Egypt | 364 | 0.1% |
| El Salvador | 65 | 0.0% |
| England | 146 | 0.1% |
| Eritrea | 15 | 0.0% |
| Ethiopia | 73 | 0.0% |
| Europe | 2,305 | 0.8% |
| France | 35 | 0.0% |
| Germany | 349 | 0.1% |
| Ghana | 88 | 0.0% |
| Greece | 107 | 0.0% |
| Guatemala | 89 | 0.0% |
| Guyana | 124 | 0.0% |
| Haiti | 258 | 0.1% |
| Honduras | 65 | 0.0% |
| Hong Kong | 84 | 0.0% |
| Hungary | 11 | 0.0% |
| India | 2,198 | 0.8% |
| Indonesia | 219 | 0.1% |
| Iran | 28 | 0.0% |
| Iraq | 46 | 0.0% |
| Israel | 19 | 0.0% |
| Italy | 237 | 0.1% |
| Jamaica | 181 | 0.1% |
| Japan | 38 | 0.0% |
| Jordan | 20 | 0.0% |
| Kenya | 285 | 0.1% |
| Korea | 167 | 0.1% |
| Kuwait | 32 | 0.0% |
| Laos | 44 | 0.0% |
| Latin America | 5,944 | 2.1% |
| Latvia | 17 | 0.0% |
| Lebanon | 54 | 0.0% |
| Liberia | 59 | 0.0% |
| Malaysia | 92 | 0.0% |
| Mexico | 1,916 | 0.7% |
| Middle Africa | 241 | 0.1% |
| Moldova | 10 | 0.0% |
| Morocco | 62 | 0.0% |
| Nepal | 1,822 | 0.6% |
| Netherlands | 17 | 0.0% |
| Nigeria | 696 | 0.2% |
| Northern Africa | 501 | 0.2% |
| Northern Europe | 471 | 0.2% |
| Norway | 10 | 0.0% |
| Oceania | 76 | 0.0% |
| Pakistan | 508 | 0.2% |
| Panama | 49 | 0.0% |
| Peru | 206 | 0.1% |
| Philippines | 464 | 0.2% |
| Poland | 90 | 0.0% |
| Romania | 47 | 0.0% |
| Russia | 302 | 0.1% |
| Saudi Arabia | 26 | 0.0% |
| Scotland | 31 | 0.0% |
| Sierra Leone | 164 | 0.1% |
| Singapore | 8 | 0.0% |
| South Africa | 74 | 0.0% |
| South America | 1,018 | 0.4% |
| South Central Asia | 7,221 | 2.5% |
| South Eastern Asia | 2,757 | 1.0% |
| Southern Europe | 372 | 0.1% |
| Spain | 28 | 0.0% |
| Sri Lanka | 74 | 0.0% |
| Sweden | 5 | 0.0% |
| Switzerland | 9 | 0.0% |
| Syria | 111 | 0.0% |
| Taiwan | 232 | 0.1% |
| Thailand | 92 | 0.0% |
| Trinidad and Tobago | 67 | 0.0% |
| Uganda | 123 | 0.0% |
| Ukraine | 114 | 0.0% |
| Uruguay | 14 | 0.0% |
| Uzbekistan | 41 | 0.0% |
| Venezuela | 113 | 0.0% |
| Vietnam | 1,601 | 0.6% |
| Western Africa | 1,803 | 0.6% |
| Western Asia | 370 | 0.1% |
| Western Europe | 446 | 0.2% |
| Zaire | 50 | 0.0% |
| Zimbabwe | 24 | 0.0% | View All 112 Rows |
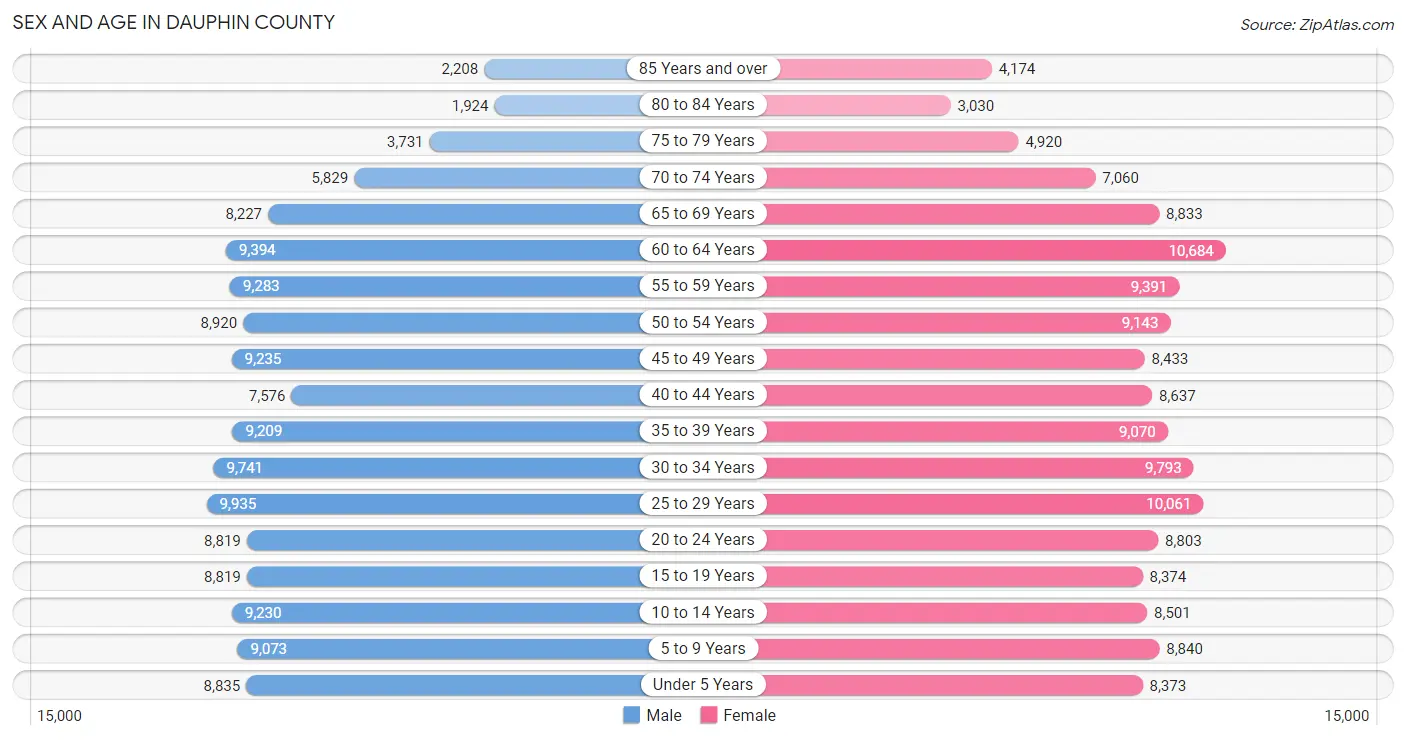
Sex and Age in Dauphin County
Sex and Age in Dauphin County
The most populous age groups in Dauphin County are 25 to 29 Years (9,935 | 7.1%) for men and 60 to 64 Years (10,684 | 7.3%) for women.
| Age Bracket | Male | Female |
| Under 5 Years | 8,835 (6.3%) | 8,373 (5.7%) |
| 5 to 9 Years | 9,073 (6.5%) | 8,840 (6.0%) |
| 10 to 14 Years | 9,230 (6.6%) | 8,501 (5.8%) |
| 15 to 19 Years | 8,819 (6.3%) | 8,374 (5.7%) |
| 20 to 24 Years | 8,819 (6.3%) | 8,803 (6.0%) |
| 25 to 29 Years | 9,935 (7.1%) | 10,061 (6.9%) |
| 30 to 34 Years | 9,741 (7.0%) | 9,793 (6.7%) |
| 35 to 39 Years | 9,209 (6.6%) | 9,070 (6.2%) |
| 40 to 44 Years | 7,576 (5.4%) | 8,637 (5.9%) |
| 45 to 49 Years | 9,235 (6.6%) | 8,433 (5.8%) |
| 50 to 54 Years | 8,920 (6.4%) | 9,143 (6.3%) |
| 55 to 59 Years | 9,283 (6.6%) | 9,391 (6.4%) |
| 60 to 64 Years | 9,394 (6.7%) | 10,684 (7.3%) |
| 65 to 69 Years | 8,227 (5.9%) | 8,833 (6.0%) |
| 70 to 74 Years | 5,829 (4.2%) | 7,060 (4.8%) |
| 75 to 79 Years | 3,731 (2.7%) | 4,920 (3.4%) |
| 80 to 84 Years | 1,924 (1.4%) | 3,030 (2.1%) |
| 85 Years and over | 2,208 (1.6%) | 4,174 (2.9%) |
| Total | 139,988 (100.0%) | 146,120 (100.0%) |
Families and Households in Dauphin County
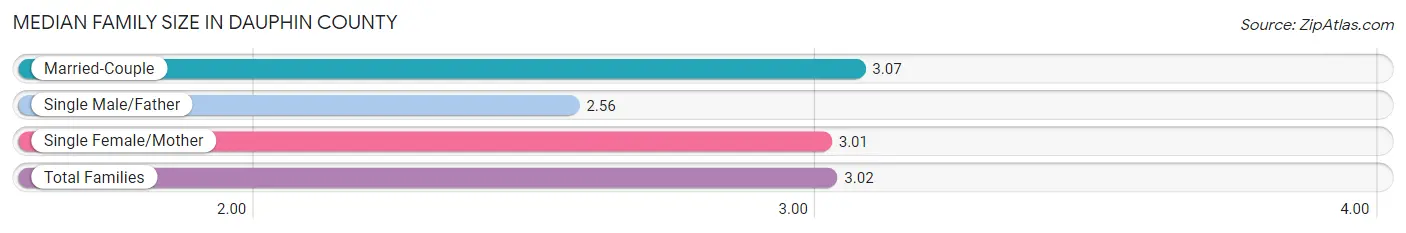
Median Family Size in Dauphin County
The median family size in Dauphin County is 3.02 persons per family, with married-couple families (51,878 | 71.8%) accounting for the largest median family size of 3.07 persons per family. On the other hand, single male/father families (5,501 | 7.6%) represent the smallest median family size with 2.56 persons per family.
| Family Type | # Families | Family Size |
| Married-Couple | 51,878 (71.8%) | 3.07 |
| Single Male/Father | 5,501 (7.6%) | 2.56 |
| Single Female/Mother | 14,928 (20.6%) | 3.01 |
| Total Families | 72,307 (100.0%) | 3.02 |
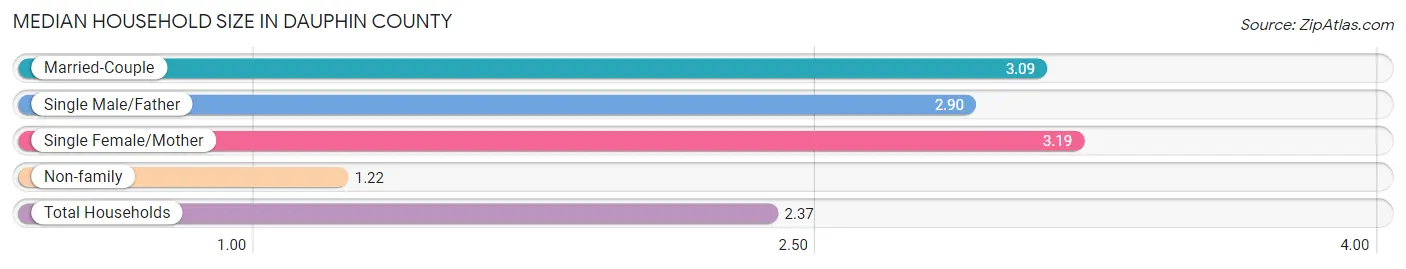
Median Household Size in Dauphin County
The median household size in Dauphin County is 2.37 persons per household, with single female/mother households (14,928 | 12.7%) accounting for the largest median household size of 3.19 persons per household. non-family households (45,600 | 38.7%) represent the smallest median household size with 1.22 persons per household.
| Household Type | # Households | Household Size |
| Married-Couple | 51,878 (44.0%) | 3.09 |
| Single Male/Father | 5,501 (4.7%) | 2.90 |
| Single Female/Mother | 14,928 (12.7%) | 3.19 |
| Non-family | 45,600 (38.7%) | 1.22 |
| Total Households | 117,907 (100.0%) | 2.37 |
Household Size by Marriage Status in Dauphin County
Out of a total of 117,907 households in Dauphin County, 72,307 (61.3%) are family households, while 45,600 (38.7%) are nonfamily households. The most numerous type of family households are 2-person households, comprising 34,708, and the most common type of nonfamily households are 1-person households, comprising 36,952.
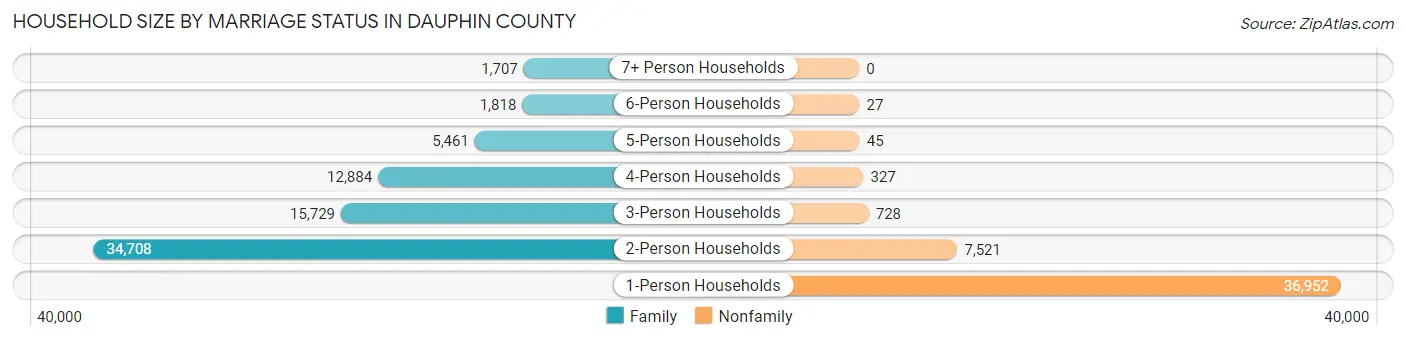
| Household Size | Family Households | Nonfamily Households |
| 1-Person Households | - | 36,952 (31.3%) |
| 2-Person Households | 34,708 (29.4%) | 7,521 (6.4%) |
| 3-Person Households | 15,729 (13.3%) | 728 (0.6%) |
| 4-Person Households | 12,884 (10.9%) | 327 (0.3%) |
| 5-Person Households | 5,461 (4.6%) | 45 (0.0%) |
| 6-Person Households | 1,818 (1.5%) | 27 (0.0%) |
| 7+ Person Households | 1,707 (1.5%) | 0 (0.0%) |
| Total | 72,307 (61.3%) | 45,600 (38.7%) |
Female Fertility in Dauphin County
Fertility by Age in Dauphin County
Average fertility rate in Dauphin County is 48.0 births per 1,000 women. Women in the age bracket of 20 to 34 years have the highest fertility rate with 83.0 births per 1,000 women. Women in the age bracket of 20 to 34 years acount for 76.7% of all women with births.
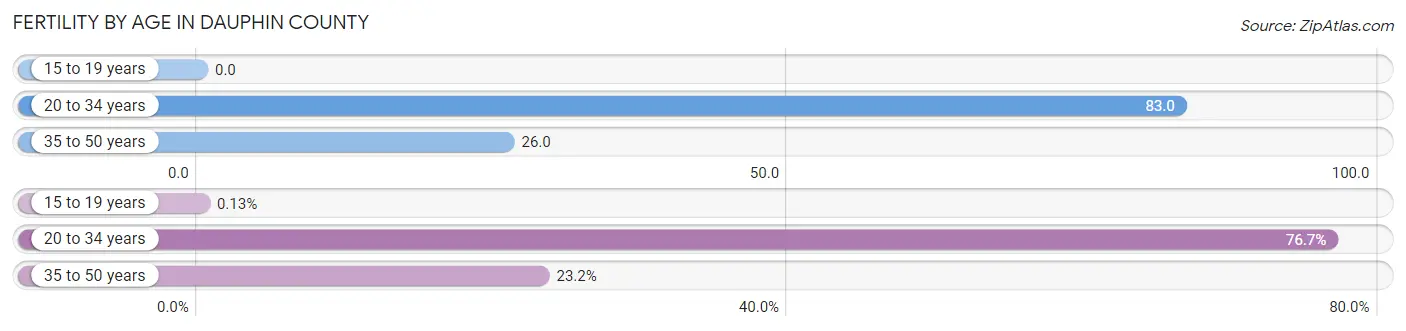
| Age Bracket | Women with Births | Births / 1,000 Women |
| 15 to 19 years | 4 (0.1%) | 0.0 |
| 20 to 34 years | 2,382 (76.7%) | 83.0 |
| 35 to 50 years | 720 (23.2%) | 26.0 |
| Total | 3,106 (100.0%) | 48.0 |
Fertility by Age by Marriage Status in Dauphin County
65.8% of women with births (3,106) in Dauphin County are married. The highest percentage of unmarried women with births falls into 15 to 19 years age bracket with 100.0% of them unmarried at the time of birth, while the lowest percentage of unmarried women with births belong to 20 to 34 years age bracket with 33.2% of them unmarried.
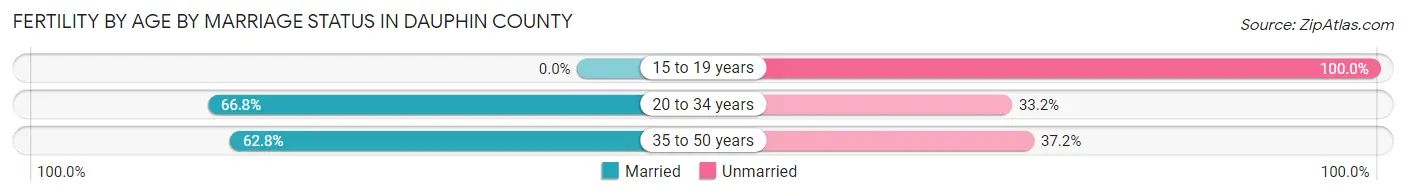
| Age Bracket | Married | Unmarried |
| 15 to 19 years | 0 (0.0%) | 4 (100.0%) |
| 20 to 34 years | 1,591 (66.8%) | 791 (33.2%) |
| 35 to 50 years | 452 (62.8%) | 268 (37.2%) |
| Total | 2,044 (65.8%) | 1,062 (34.2%) |
Fertility by Education in Dauphin County
Average fertility rate in Dauphin County is 48.0 births per 1,000 women. Women with the education attainment of graduate degree have the highest fertility rate of 74.0 births per 1,000 women, while women with the education attainment of less than high school have the lowest fertility at 20.0 births per 1,000 women. Women with the education attainment of college or associate's degree represent 29.9% of all women with births.
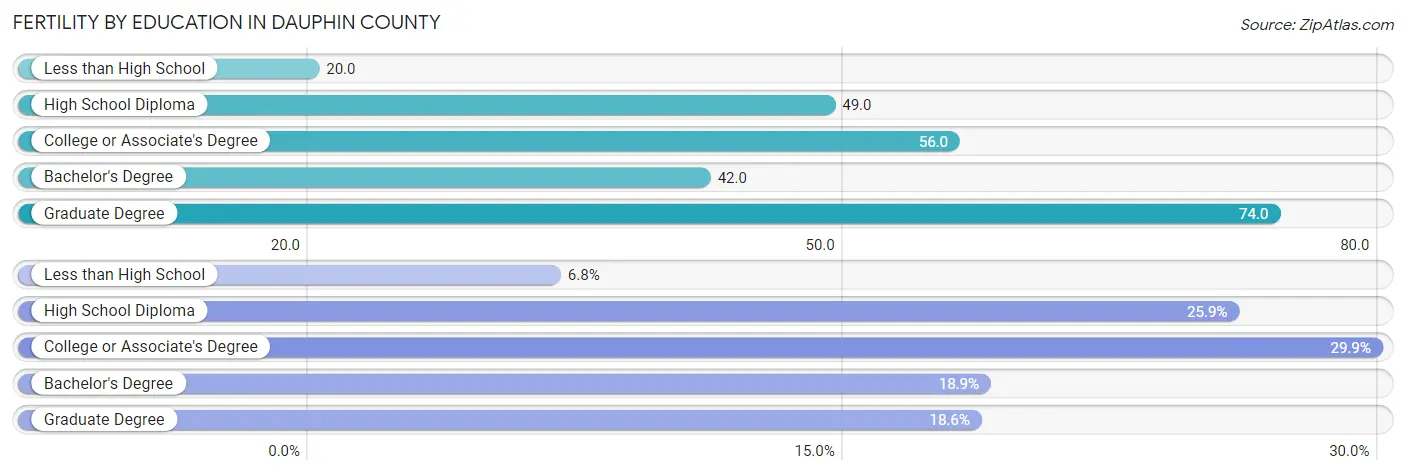
| Educational Attainment | Women with Births | Births / 1,000 Women |
| Less than High School | 211 (6.8%) | 20.0 |
| High School Diploma | 803 (25.9%) | 49.0 |
| College or Associate's Degree | 928 (29.9%) | 56.0 |
| Bachelor's Degree | 586 (18.9%) | 42.0 |
| Graduate Degree | 578 (18.6%) | 74.0 |
| Total | 3,106 (100.0%) | 48.0 |
Fertility by Education by Marriage Status in Dauphin County
34.2% of women with births in Dauphin County are unmarried. Women with the educational attainment of graduate degree are most likely to be married with 86.0% of them married at childbirth, while women with the educational attainment of high school diploma are least likely to be married with 50.2% of them unmarried at childbirth.
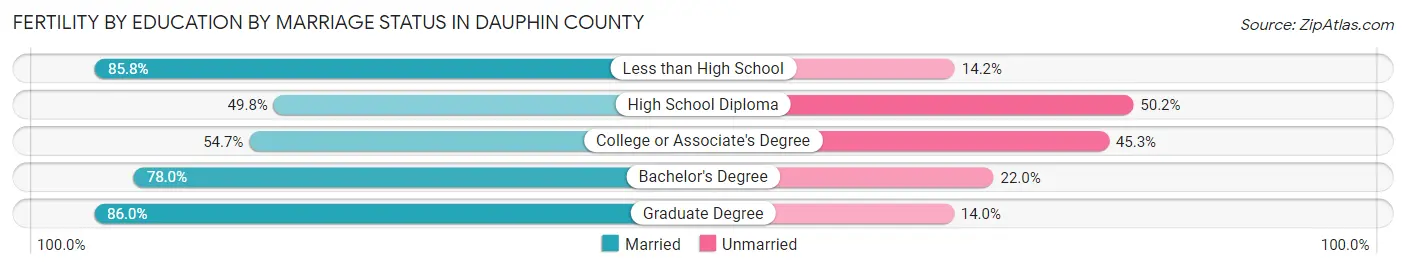
| Educational Attainment | Married | Unmarried |
| Less than High School | 181 (85.8%) | 30 (14.2%) |
| High School Diploma | 400 (49.8%) | 403 (50.2%) |
| College or Associate's Degree | 508 (54.7%) | 420 (45.3%) |
| Bachelor's Degree | 457 (78.0%) | 129 (22.0%) |
| Graduate Degree | 497 (86.0%) | 81 (14.0%) |
| Total | 2,044 (65.8%) | 1,062 (34.2%) |
Employment Characteristics in Dauphin County
Employment by Class of Employer in Dauphin County
Among the 142,055 employed individuals in Dauphin County, private company employees (90,902 | 64.0%), not-for-profit organizations (17,247 | 12.1%), and state government employees (11,465 | 8.1%) make up the most common classes of employment.
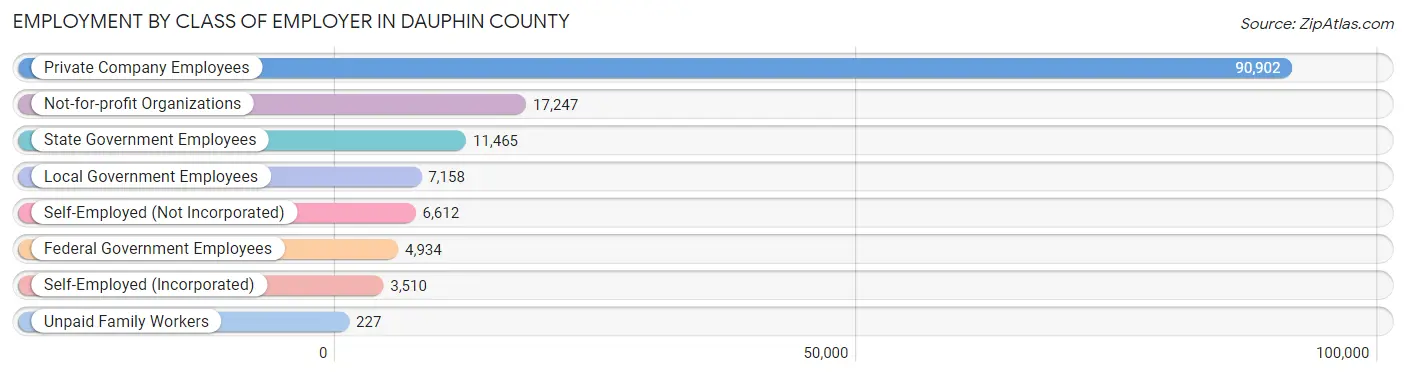
| Employer Class | # Employees | % Employees |
| Private Company Employees | 90,902 | 64.0% |
| Self-Employed (Incorporated) | 3,510 | 2.5% |
| Self-Employed (Not Incorporated) | 6,612 | 4.6% |
| Not-for-profit Organizations | 17,247 | 12.1% |
| Local Government Employees | 7,158 | 5.0% |
| State Government Employees | 11,465 | 8.1% |
| Federal Government Employees | 4,934 | 3.5% |
| Unpaid Family Workers | 227 | 0.2% |
| Total | 142,055 | 100.0% |
Employment Status by Age in Dauphin County
According to the labor force statistics for Dauphin County, out of the total population over 16 years of age (229,649), 65.5% or 150,420 individuals are in the labor force, with 4.3% or 6,468 of them unemployed. The age group with the highest labor force participation rate is 30 to 34 years, with 88.1% or 17,209 individuals in the labor force. Within the labor force, the 16 to 19 years age range has the highest percentage of unemployed individuals, with 9.8% or 588 of them being unemployed.
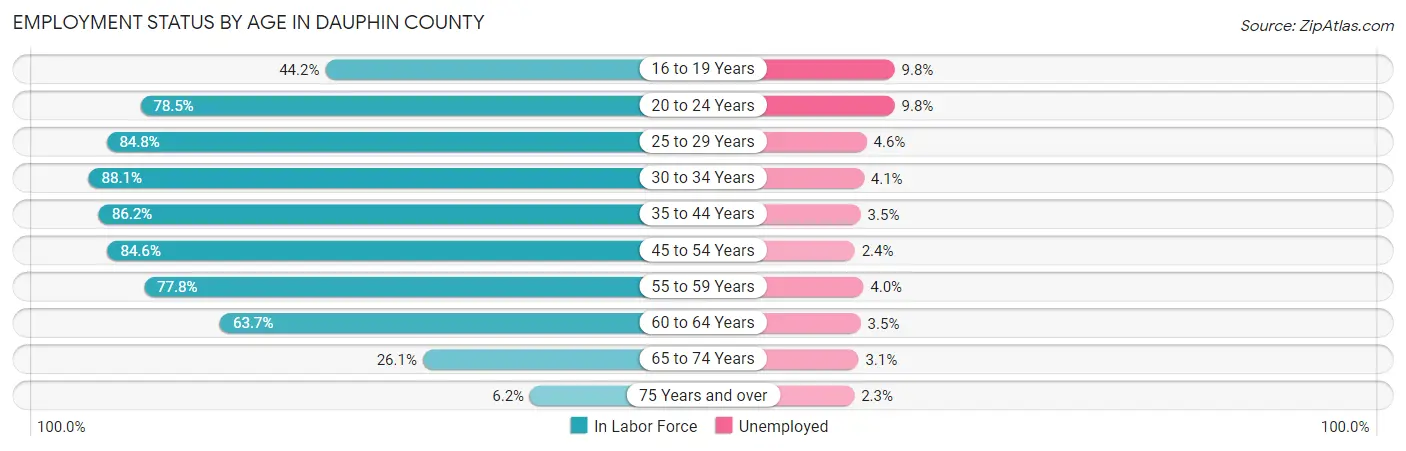
| Age Bracket | In Labor Force | Unemployed |
| 16 to 19 Years | 6,005 (44.2%) | 588 (9.8%) |
| 20 to 24 Years | 13,833 (78.5%) | 1,356 (9.8%) |
| 25 to 29 Years | 16,957 (84.8%) | 780 (4.6%) |
| 30 to 34 Years | 17,209 (88.1%) | 706 (4.1%) |
| 35 to 44 Years | 29,732 (86.2%) | 1,041 (3.5%) |
| 45 to 54 Years | 30,228 (84.6%) | 725 (2.4%) |
| 55 to 59 Years | 14,528 (77.8%) | 581 (4.0%) |
| 60 to 64 Years | 12,790 (63.7%) | 448 (3.5%) |
| 65 to 74 Years | 7,817 (26.1%) | 242 (3.1%) |
| 75 Years and over | 1,239 (6.2%) | 28 (2.3%) |
| Total | 150,420 (65.5%) | 6,468 (4.3%) |
Employment Status by Educational Attainment in Dauphin County
According to labor force statistics for Dauphin County, 81.8% of individuals (121,477) out of the total population between 25 and 64 years of age (148,505) are in the labor force, with 3.5% or 4,252 of them being unemployed. The group with the highest labor force participation rate are those with the educational attainment of bachelor's degree or higher, with 90.2% or 47,254 individuals in the labor force. Within the labor force, individuals with less than high school education have the highest percentage of unemployment, with 8.7% or 733 of them being unemployed.
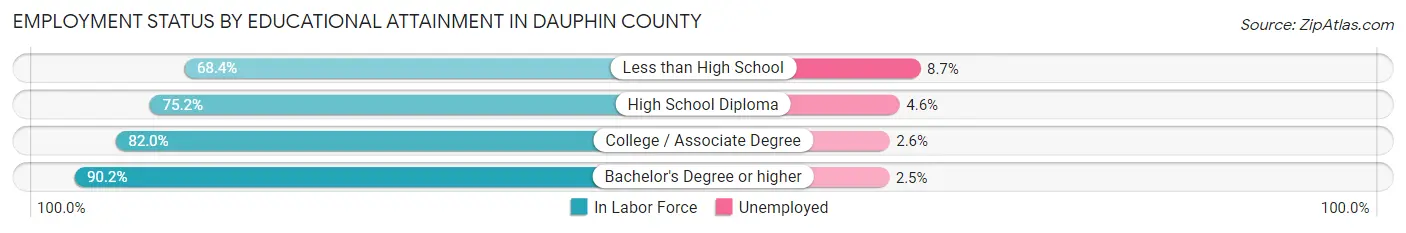
| Educational Attainment | In Labor Force | Unemployed |
| Less than High School | 8,424 (68.4%) | 1,071 (8.7%) |
| High School Diploma | 33,000 (75.2%) | 2,019 (4.6%) |
| College / Associate Degree | 32,733 (82.0%) | 1,038 (2.6%) |
| Bachelor's Degree or higher | 47,254 (90.2%) | 1,310 (2.5%) |
| Total | 121,477 (81.8%) | 5,198 (3.5%) |
Employment Occupations by Sex in Dauphin County
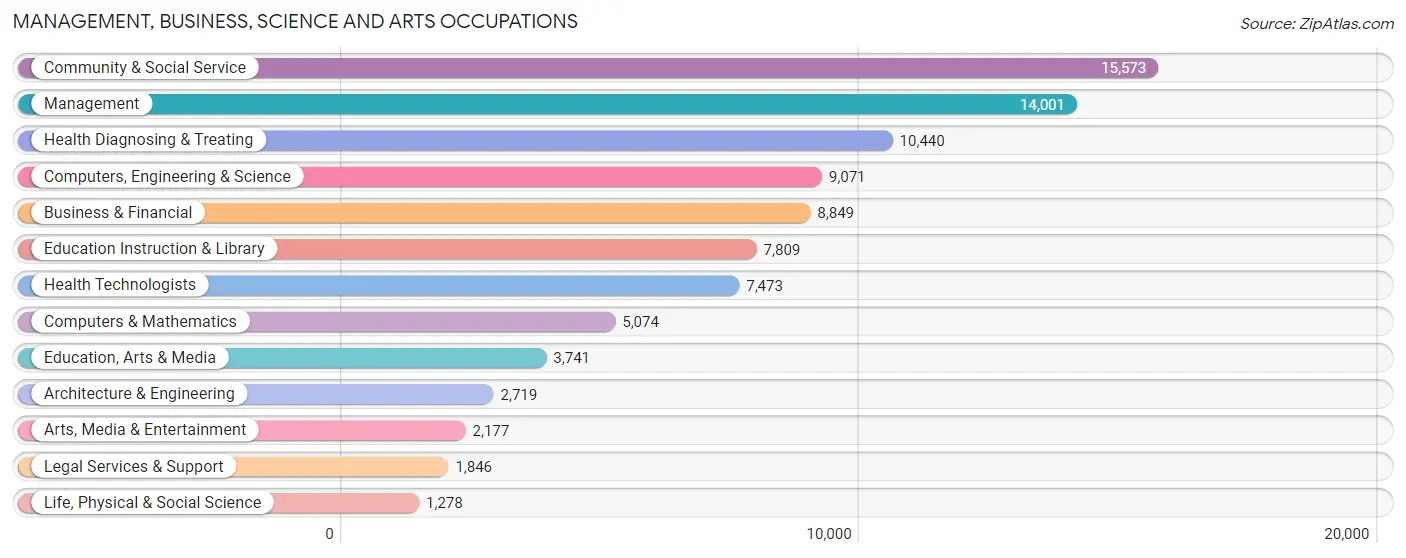
Management, Business, Science and Arts Occupations
The most common Management, Business, Science and Arts occupations in Dauphin County are Community & Social Service (15,573 | 10.9%), Management (14,001 | 9.8%), Health Diagnosing & Treating (10,440 | 7.3%), Computers, Engineering & Science (9,071 | 6.3%), and Business & Financial (8,849 | 6.2%).
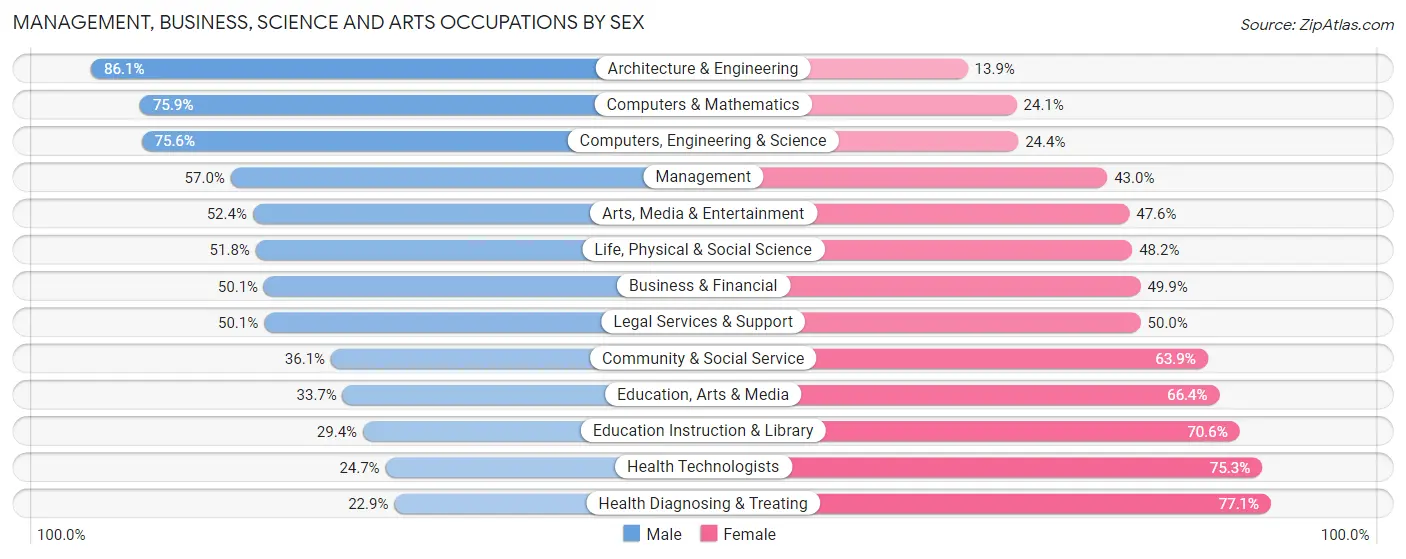
Management, Business, Science and Arts Occupations by Sex
Within the Management, Business, Science and Arts occupations in Dauphin County, the most male-oriented occupations are Architecture & Engineering (86.1%), Computers & Mathematics (75.9%), and Computers, Engineering & Science (75.6%), while the most female-oriented occupations are Health Diagnosing & Treating (77.1%), Health Technologists (75.3%), and Education Instruction & Library (70.6%).
| Occupation | Male | Female |
| Management | 7,984 (57.0%) | 6,017 (43.0%) |
| Business & Financial | 4,432 (50.1%) | 4,417 (49.9%) |
| Computers, Engineering & Science | 6,856 (75.6%) | 2,215 (24.4%) |
| Computers & Mathematics | 3,852 (75.9%) | 1,222 (24.1%) |
| Architecture & Engineering | 2,342 (86.1%) | 377 (13.9%) |
| Life, Physical & Social Science | 662 (51.8%) | 616 (48.2%) |
| Community & Social Service | 5,622 (36.1%) | 9,951 (63.9%) |
| Education, Arts & Media | 1,259 (33.7%) | 2,482 (66.3%) |
| Legal Services & Support | 924 (50.0%) | 922 (49.9%) |
| Education Instruction & Library | 2,298 (29.4%) | 5,511 (70.6%) |
| Arts, Media & Entertainment | 1,141 (52.4%) | 1,036 (47.6%) |
| Health Diagnosing & Treating | 2,390 (22.9%) | 8,050 (77.1%) |
| Health Technologists | 1,848 (24.7%) | 5,625 (75.3%) |
| Total (Category) | 27,284 (47.1%) | 30,650 (52.9%) |
| Total (Overall) | 73,363 (51.2%) | 70,031 (48.8%) |
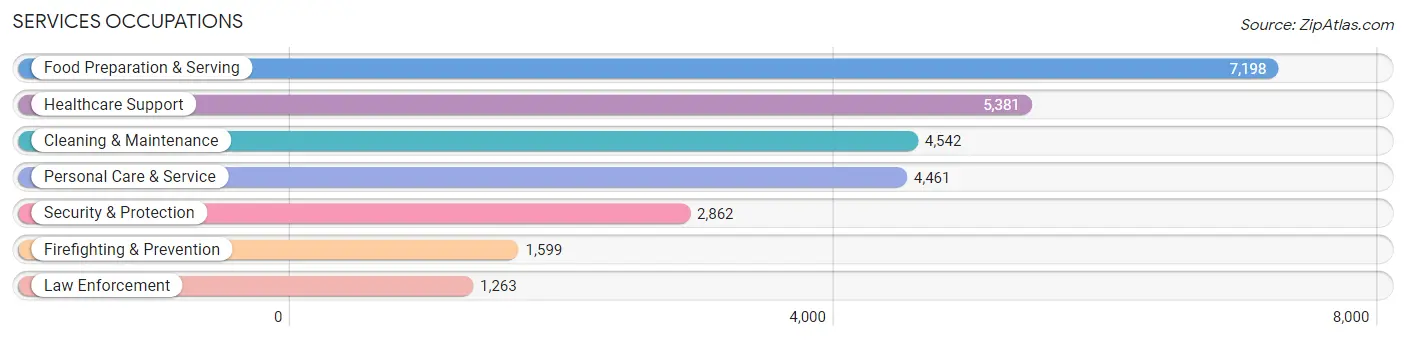
Services Occupations
The most common Services occupations in Dauphin County are Food Preparation & Serving (7,198 | 5.0%), Healthcare Support (5,381 | 3.7%), Cleaning & Maintenance (4,542 | 3.2%), Personal Care & Service (4,461 | 3.1%), and Security & Protection (2,862 | 2.0%).
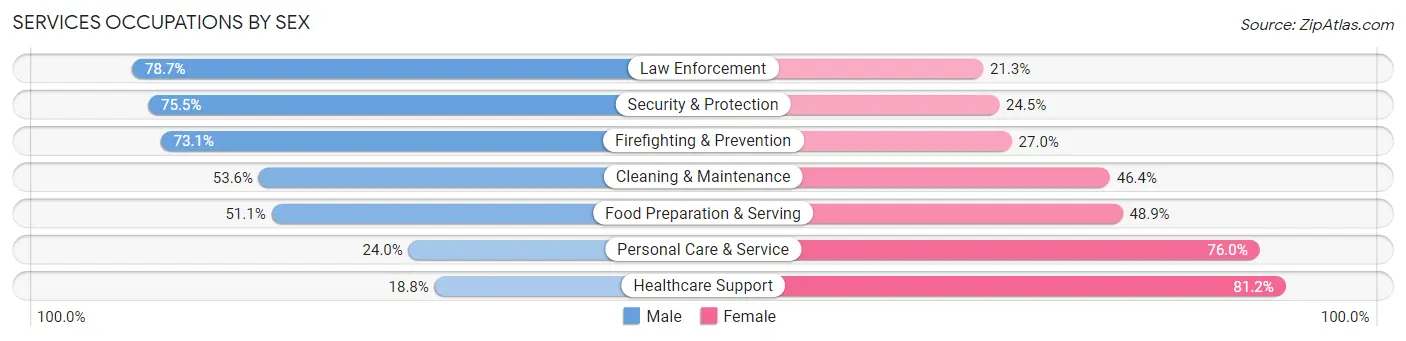
Services Occupations by Sex
Within the Services occupations in Dauphin County, the most male-oriented occupations are Law Enforcement (78.7%), Security & Protection (75.5%), and Firefighting & Prevention (73.1%), while the most female-oriented occupations are Healthcare Support (81.2%), Personal Care & Service (76.0%), and Food Preparation & Serving (48.9%).
| Occupation | Male | Female |
| Healthcare Support | 1,012 (18.8%) | 4,369 (81.2%) |
| Security & Protection | 2,162 (75.5%) | 700 (24.5%) |
| Firefighting & Prevention | 1,168 (73.1%) | 431 (27.0%) |
| Law Enforcement | 994 (78.7%) | 269 (21.3%) |
| Food Preparation & Serving | 3,679 (51.1%) | 3,519 (48.9%) |
| Cleaning & Maintenance | 2,435 (53.6%) | 2,107 (46.4%) |
| Personal Care & Service | 1,069 (24.0%) | 3,392 (76.0%) |
| Total (Category) | 10,357 (42.4%) | 14,087 (57.6%) |
| Total (Overall) | 73,363 (51.2%) | 70,031 (48.8%) |
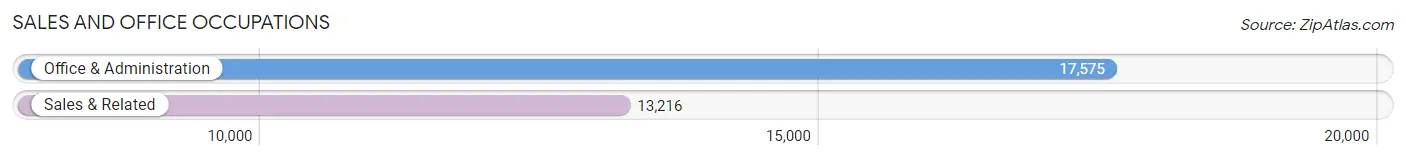
Sales and Office Occupations
The most common Sales and Office occupations in Dauphin County are Office & Administration (17,575 | 12.3%), and Sales & Related (13,216 | 9.2%).
Sales and Office Occupations by Sex
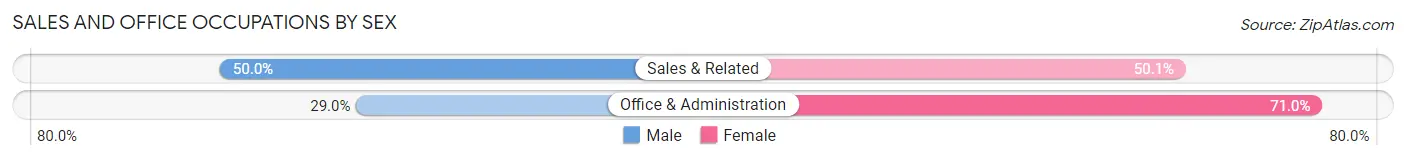
| Occupation | Male | Female |
| Sales & Related | 6,602 (49.9%) | 6,614 (50.0%) |
| Office & Administration | 5,091 (29.0%) | 12,484 (71.0%) |
| Total (Category) | 11,693 (38.0%) | 19,098 (62.0%) |
| Total (Overall) | 73,363 (51.2%) | 70,031 (48.8%) |
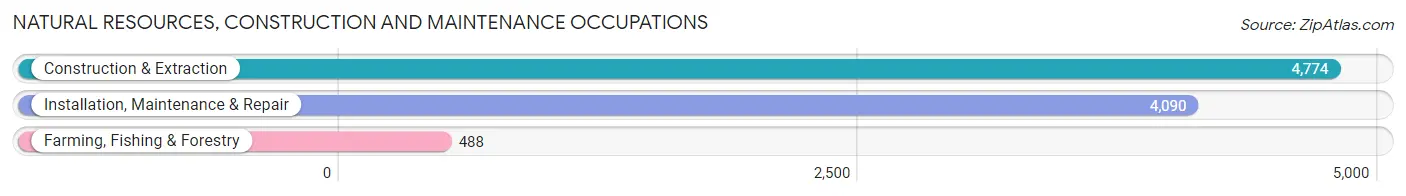
Natural Resources, Construction and Maintenance Occupations
The most common Natural Resources, Construction and Maintenance occupations in Dauphin County are Construction & Extraction (4,774 | 3.3%), Installation, Maintenance & Repair (4,090 | 2.9%), and Farming, Fishing & Forestry (488 | 0.3%).
Natural Resources, Construction and Maintenance Occupations by Sex
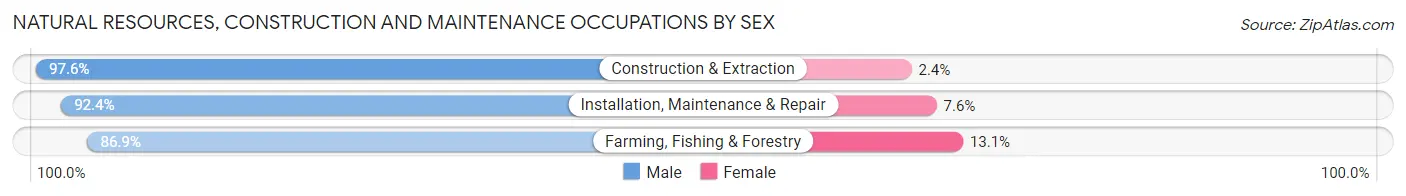
| Occupation | Male | Female |
| Farming, Fishing & Forestry | 424 (86.9%) | 64 (13.1%) |
| Construction & Extraction | 4,659 (97.6%) | 115 (2.4%) |
| Installation, Maintenance & Repair | 3,778 (92.4%) | 312 (7.6%) |
| Total (Category) | 8,861 (94.8%) | 491 (5.2%) |
| Total (Overall) | 73,363 (51.2%) | 70,031 (48.8%) |
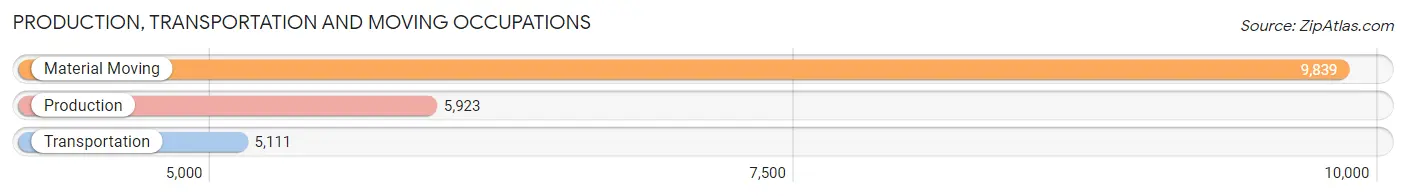
Production, Transportation and Moving Occupations
The most common Production, Transportation and Moving occupations in Dauphin County are Material Moving (9,839 | 6.9%), Production (5,923 | 4.1%), and Transportation (5,111 | 3.6%).
Production, Transportation and Moving Occupations by Sex
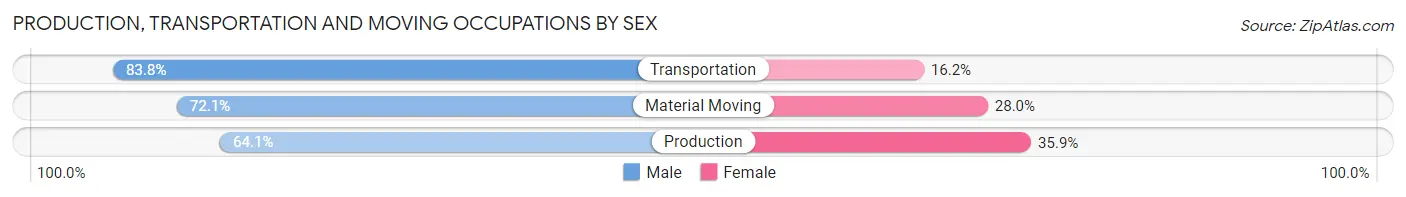
| Occupation | Male | Female |
| Production | 3,797 (64.1%) | 2,126 (35.9%) |
| Transportation | 4,282 (83.8%) | 829 (16.2%) |
| Material Moving | 7,089 (72.1%) | 2,750 (28.0%) |
| Total (Category) | 15,168 (72.7%) | 5,705 (27.3%) |
| Total (Overall) | 73,363 (51.2%) | 70,031 (48.8%) |
Employment Industries by Sex in Dauphin County
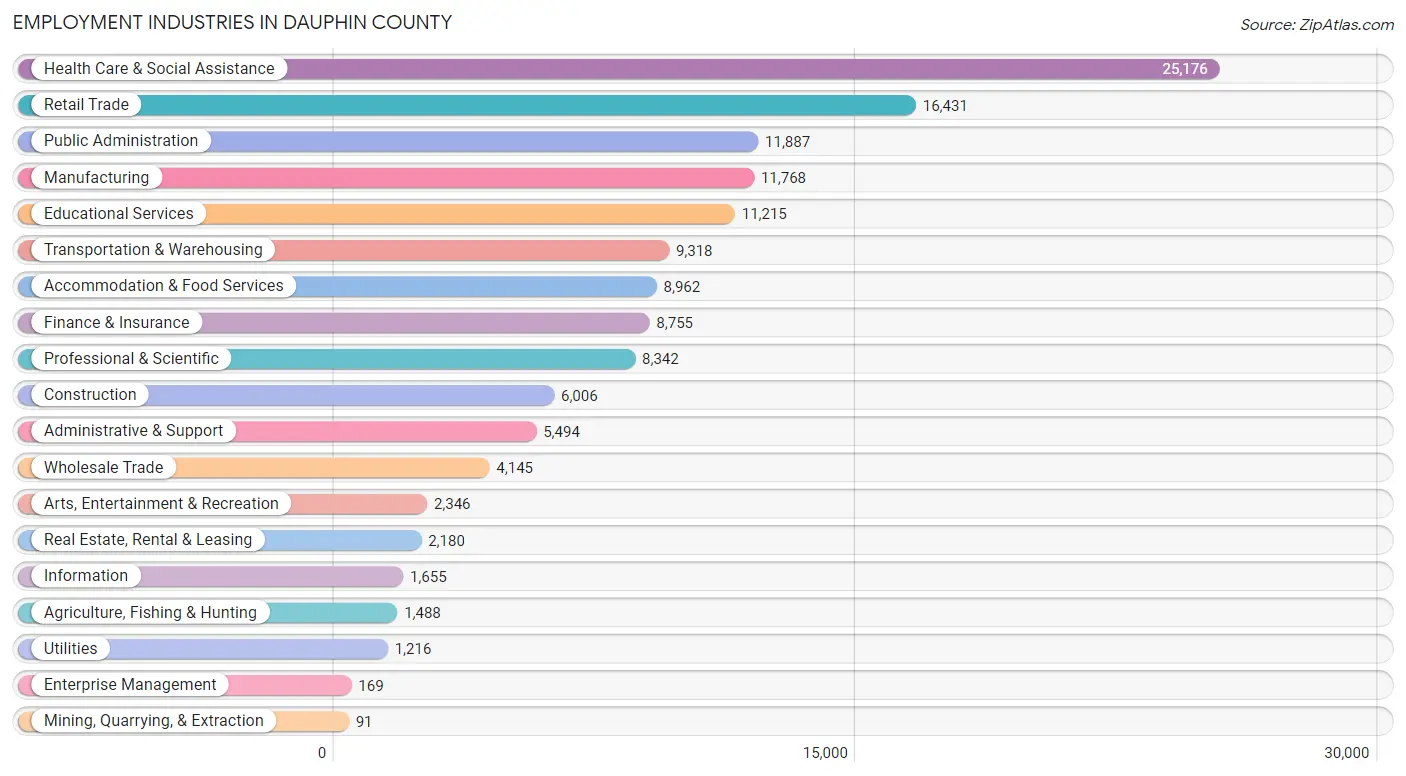
Employment Industries in Dauphin County
The major employment industries in Dauphin County include Health Care & Social Assistance (25,176 | 17.6%), Retail Trade (16,431 | 11.5%), Public Administration (11,887 | 8.3%), Manufacturing (11,768 | 8.2%), and Educational Services (11,215 | 7.8%).
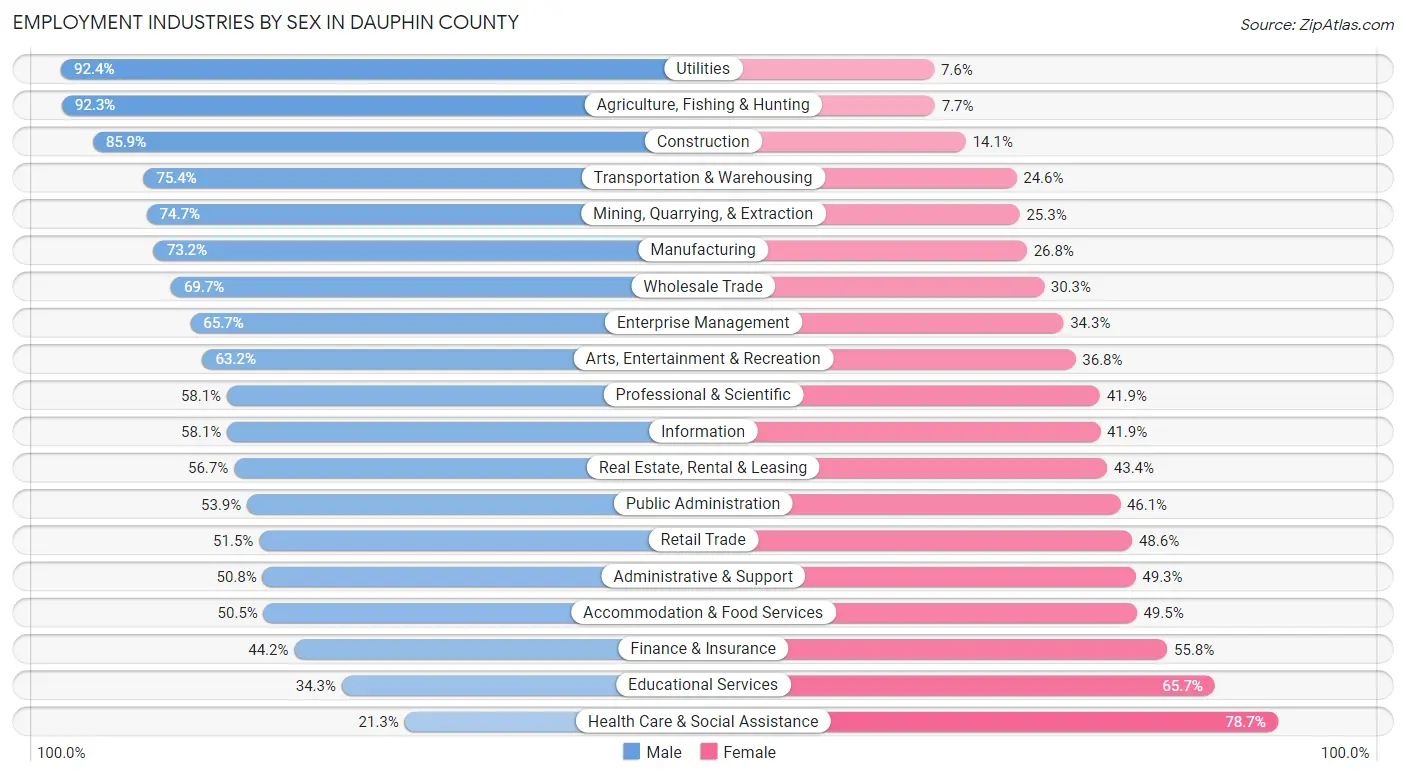
Employment Industries by Sex in Dauphin County
The Dauphin County industries that see more men than women are Utilities (92.4%), Agriculture, Fishing & Hunting (92.3%), and Construction (85.9%), whereas the industries that tend to have a higher number of women are Health Care & Social Assistance (78.7%), Educational Services (65.7%), and Finance & Insurance (55.8%).
| Industry | Male | Female |
| Agriculture, Fishing & Hunting | 1,373 (92.3%) | 115 (7.7%) |
| Mining, Quarrying, & Extraction | 68 (74.7%) | 23 (25.3%) |
| Construction | 5,157 (85.9%) | 849 (14.1%) |
| Manufacturing | 8,619 (73.2%) | 3,149 (26.8%) |
| Wholesale Trade | 2,889 (69.7%) | 1,256 (30.3%) |
| Retail Trade | 8,453 (51.4%) | 7,978 (48.5%) |
| Transportation & Warehousing | 7,026 (75.4%) | 2,292 (24.6%) |
| Utilities | 1,124 (92.4%) | 92 (7.6%) |
| Information | 961 (58.1%) | 694 (41.9%) |
| Finance & Insurance | 3,868 (44.2%) | 4,887 (55.8%) |
| Real Estate, Rental & Leasing | 1,235 (56.7%) | 945 (43.3%) |
| Professional & Scientific | 4,848 (58.1%) | 3,494 (41.9%) |
| Enterprise Management | 111 (65.7%) | 58 (34.3%) |
| Administrative & Support | 2,788 (50.7%) | 2,706 (49.2%) |
| Educational Services | 3,851 (34.3%) | 7,364 (65.7%) |
| Health Care & Social Assistance | 5,372 (21.3%) | 19,804 (78.7%) |
| Arts, Entertainment & Recreation | 1,482 (63.2%) | 864 (36.8%) |
| Accommodation & Food Services | 4,528 (50.5%) | 4,434 (49.5%) |
| Public Administration | 6,412 (53.9%) | 5,475 (46.1%) |
| Total | 73,363 (51.2%) | 70,031 (48.8%) |
Education in Dauphin County
School Enrollment in Dauphin County
The most common levels of schooling among the 65,192 students in Dauphin County are middle school (14,202 | 21.8%), high school (13,995 | 21.5%), and elementary school (13,598 | 20.9%).
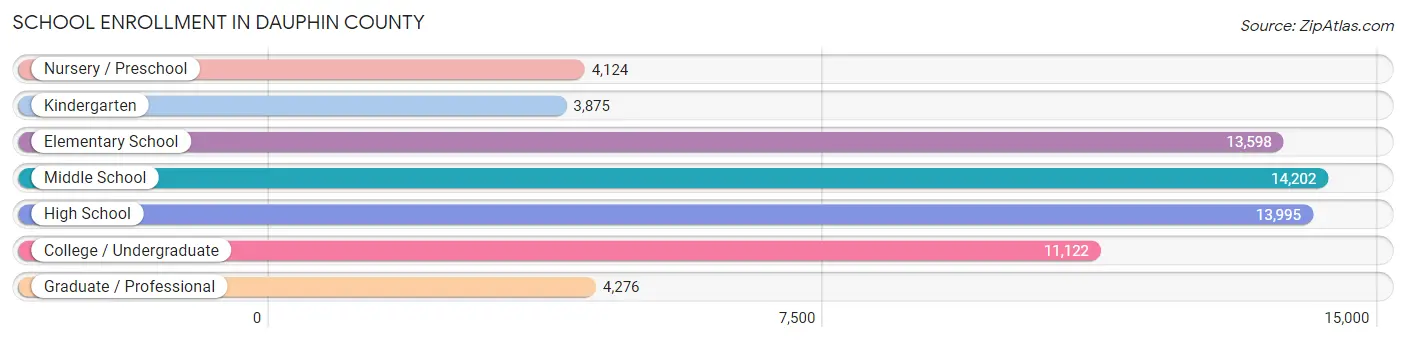
| School Level | # Students | % Students |
| Nursery / Preschool | 4,124 | 6.3% |
| Kindergarten | 3,875 | 5.9% |
| Elementary School | 13,598 | 20.9% |
| Middle School | 14,202 | 21.8% |
| High School | 13,995 | 21.5% |
| College / Undergraduate | 11,122 | 17.1% |
| Graduate / Professional | 4,276 | 6.6% |
| Total | 65,192 | 100.0% |
School Enrollment by Age by Funding Source in Dauphin County
Out of a total of 65,192 students who are enrolled in schools in Dauphin County, 13,038 (20.0%) attend a private institution, while the remaining 52,154 (80.0%) are enrolled in public schools. The age group of 3 to 4 year olds has the highest likelihood of being enrolled in private schools, with 1,158 (38.3% in the age bracket) enrolled. Conversely, the age group of 10 to 14 year olds has the lowest likelihood of being enrolled in a private school, with 14,816 (85.1% in the age bracket) attending a public institution.
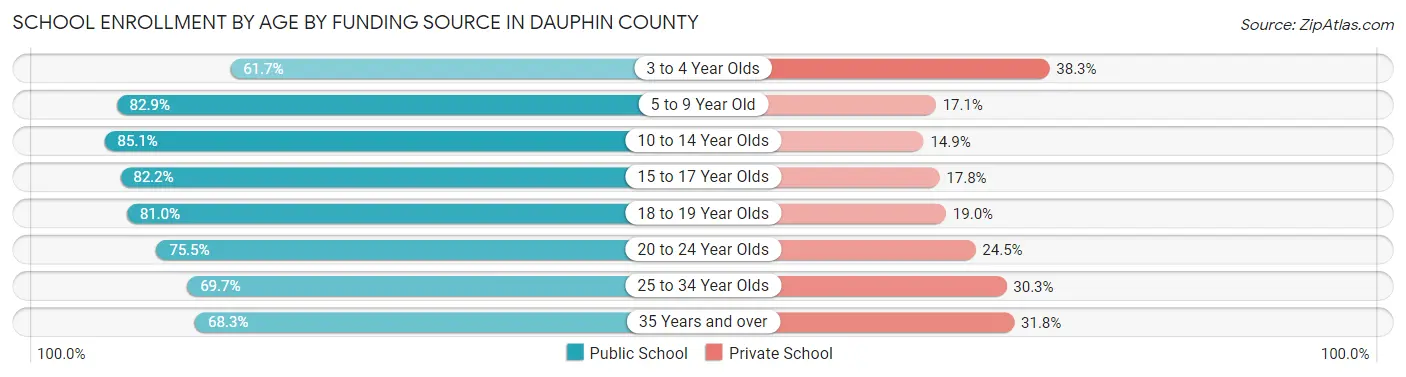
| Age Bracket | Public School | Private School |
| 3 to 4 Year Olds | 1,865 (61.7%) | 1,158 (38.3%) |
| 5 to 9 Year Old | 13,912 (82.9%) | 2,878 (17.1%) |
| 10 to 14 Year Olds | 14,816 (85.1%) | 2,587 (14.9%) |
| 15 to 17 Year Olds | 8,333 (82.2%) | 1,808 (17.8%) |
| 18 to 19 Year Olds | 3,811 (81.0%) | 896 (19.0%) |
| 20 to 24 Year Olds | 4,235 (75.5%) | 1,377 (24.5%) |
| 25 to 34 Year Olds | 2,657 (69.7%) | 1,155 (30.3%) |
| 35 Years and over | 2,528 (68.2%) | 1,176 (31.8%) |
| Total | 52,154 (80.0%) | 13,038 (20.0%) |
Educational Attainment by Field of Study in Dauphin County
Business (12,609 | 17.6%), education (8,862 | 12.3%), science & technology (7,614 | 10.6%), social sciences (5,732 | 8.0%), and arts & humanities (5,477 | 7.6%) are the most common fields of study among 71,755 individuals in Dauphin County who have obtained a bachelor's degree or higher.
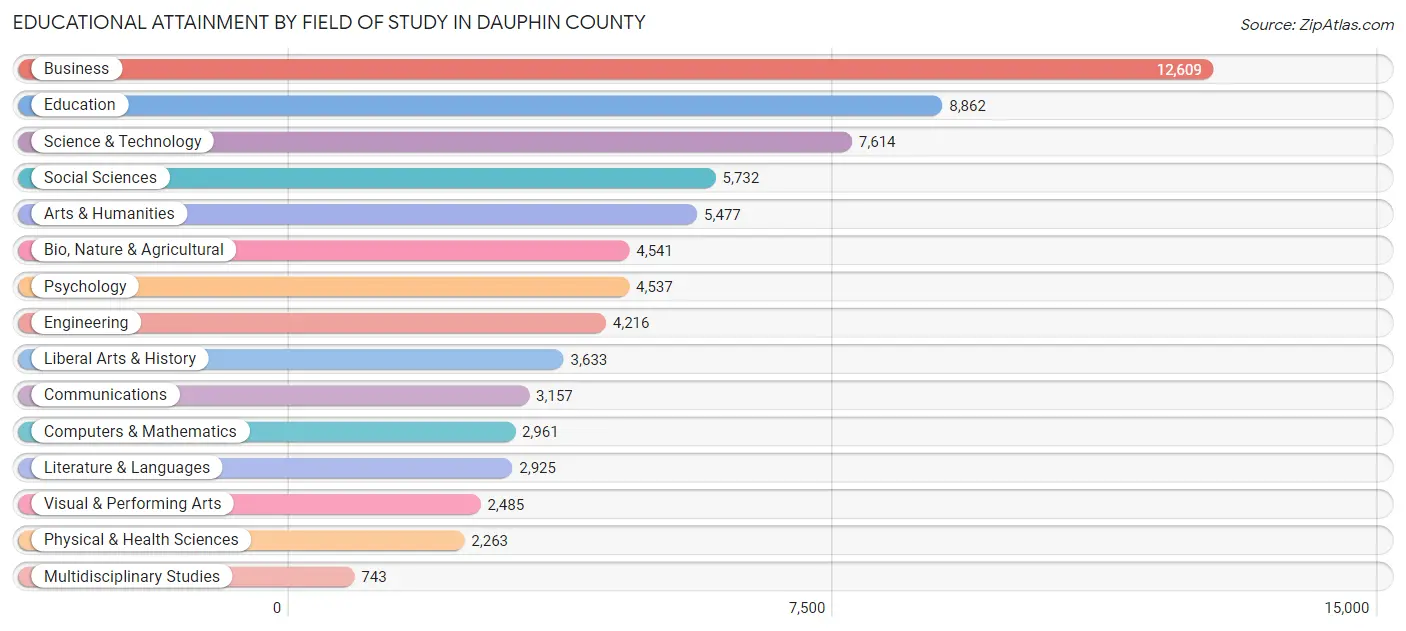
| Field of Study | # Graduates | % Graduates |
| Computers & Mathematics | 2,961 | 4.1% |
| Bio, Nature & Agricultural | 4,541 | 6.3% |
| Physical & Health Sciences | 2,263 | 3.2% |
| Psychology | 4,537 | 6.3% |
| Social Sciences | 5,732 | 8.0% |
| Engineering | 4,216 | 5.9% |
| Multidisciplinary Studies | 743 | 1.0% |
| Science & Technology | 7,614 | 10.6% |
| Business | 12,609 | 17.6% |
| Education | 8,862 | 12.3% |
| Literature & Languages | 2,925 | 4.1% |
| Liberal Arts & History | 3,633 | 5.1% |
| Visual & Performing Arts | 2,485 | 3.5% |
| Communications | 3,157 | 4.4% |
| Arts & Humanities | 5,477 | 7.6% |
| Total | 71,755 | 100.0% |
Transportation & Commute in Dauphin County
Vehicle Availability by Sex in Dauphin County
The most prevalent vehicle ownership categories in Dauphin County are males with 2 vehicles (30,863, accounting for 42.9%) and females with 2 vehicles (27,869, making up 45.5%).
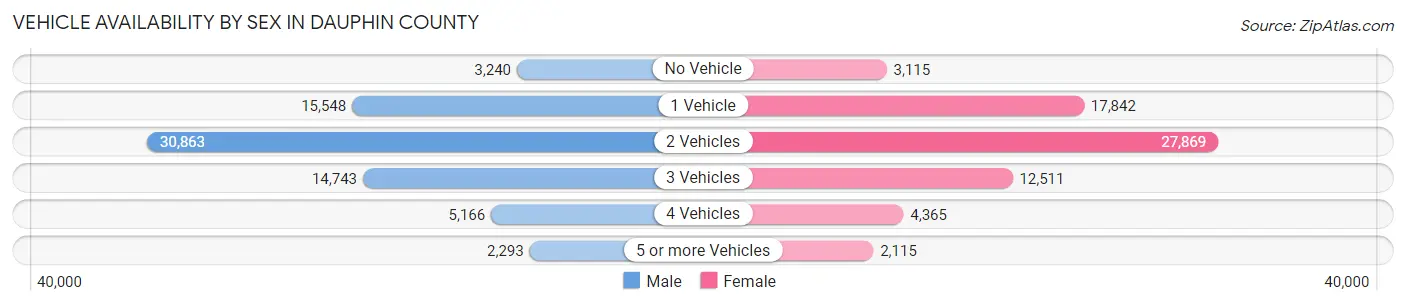
| Vehicles Available | Male | Female |
| No Vehicle | 3,240 (4.5%) | 3,115 (4.6%) |
| 1 Vehicle | 15,548 (21.6%) | 17,842 (26.3%) |
| 2 Vehicles | 30,863 (42.9%) | 27,869 (41.1%) |
| 3 Vehicles | 14,743 (20.5%) | 12,511 (18.4%) |
| 4 Vehicles | 5,166 (7.2%) | 4,365 (6.4%) |
| 5 or more Vehicles | 2,293 (3.2%) | 2,115 (3.1%) |
| Total | 71,853 (100.0%) | 67,817 (100.0%) |
Commute Time in Dauphin County
The most frequently occuring commute durations in Dauphin County are 15 to 19 minutes (24,741 commuters, 19.8%), 20 to 24 minutes (21,506 commuters, 17.2%), and 10 to 14 minutes (20,873 commuters, 16.7%).

| Commute Time | # Commuters | % Commuters |
| Less than 5 Minutes | 4,291 | 3.4% |
| 5 to 9 Minutes | 13,761 | 11.0% |
| 10 to 14 Minutes | 20,873 | 16.7% |
| 15 to 19 Minutes | 24,741 | 19.8% |
| 20 to 24 Minutes | 21,506 | 17.2% |
| 25 to 29 Minutes | 8,589 | 6.9% |
| 30 to 34 Minutes | 14,604 | 11.7% |
| 35 to 39 Minutes | 3,030 | 2.4% |
| 40 to 44 Minutes | 2,800 | 2.2% |
| 45 to 59 Minutes | 5,951 | 4.8% |
| 60 to 89 Minutes | 2,998 | 2.4% |
| 90 or more Minutes | 2,034 | 1.6% |
Commute Time by Sex in Dauphin County
The most common commute times in Dauphin County are 15 to 19 minutes (11,743 commuters, 18.1%) for males and 15 to 19 minutes (12,998 commuters, 21.5%) for females.
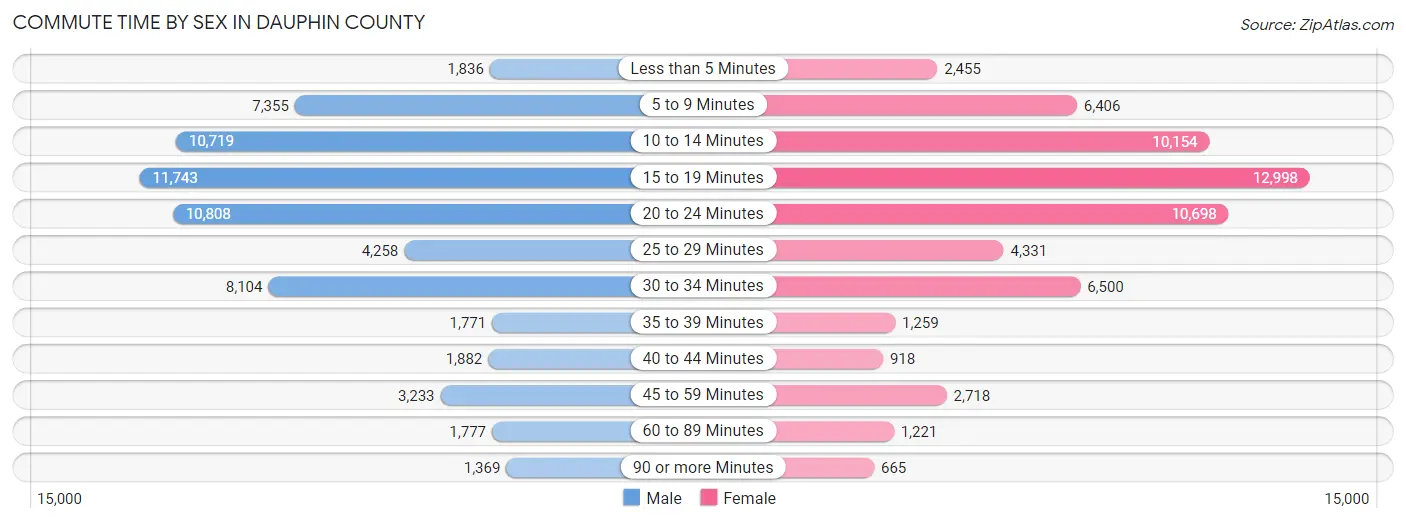
| Commute Time | Male | Female |
| Less than 5 Minutes | 1,836 (2.8%) | 2,455 (4.1%) |
| 5 to 9 Minutes | 7,355 (11.3%) | 6,406 (10.6%) |
| 10 to 14 Minutes | 10,719 (16.5%) | 10,154 (16.8%) |
| 15 to 19 Minutes | 11,743 (18.1%) | 12,998 (21.5%) |
| 20 to 24 Minutes | 10,808 (16.7%) | 10,698 (17.7%) |
| 25 to 29 Minutes | 4,258 (6.6%) | 4,331 (7.2%) |
| 30 to 34 Minutes | 8,104 (12.5%) | 6,500 (10.8%) |
| 35 to 39 Minutes | 1,771 (2.7%) | 1,259 (2.1%) |
| 40 to 44 Minutes | 1,882 (2.9%) | 918 (1.5%) |
| 45 to 59 Minutes | 3,233 (5.0%) | 2,718 (4.5%) |
| 60 to 89 Minutes | 1,777 (2.7%) | 1,221 (2.0%) |
| 90 or more Minutes | 1,369 (2.1%) | 665 (1.1%) |
Time of Departure to Work by Sex in Dauphin County
The most frequent times of departure to work in Dauphin County are 7:30 AM to 7:59 AM (7,585, 11.7%) for males and 7:00 AM to 7:29 AM (9,349, 15.5%) for females.
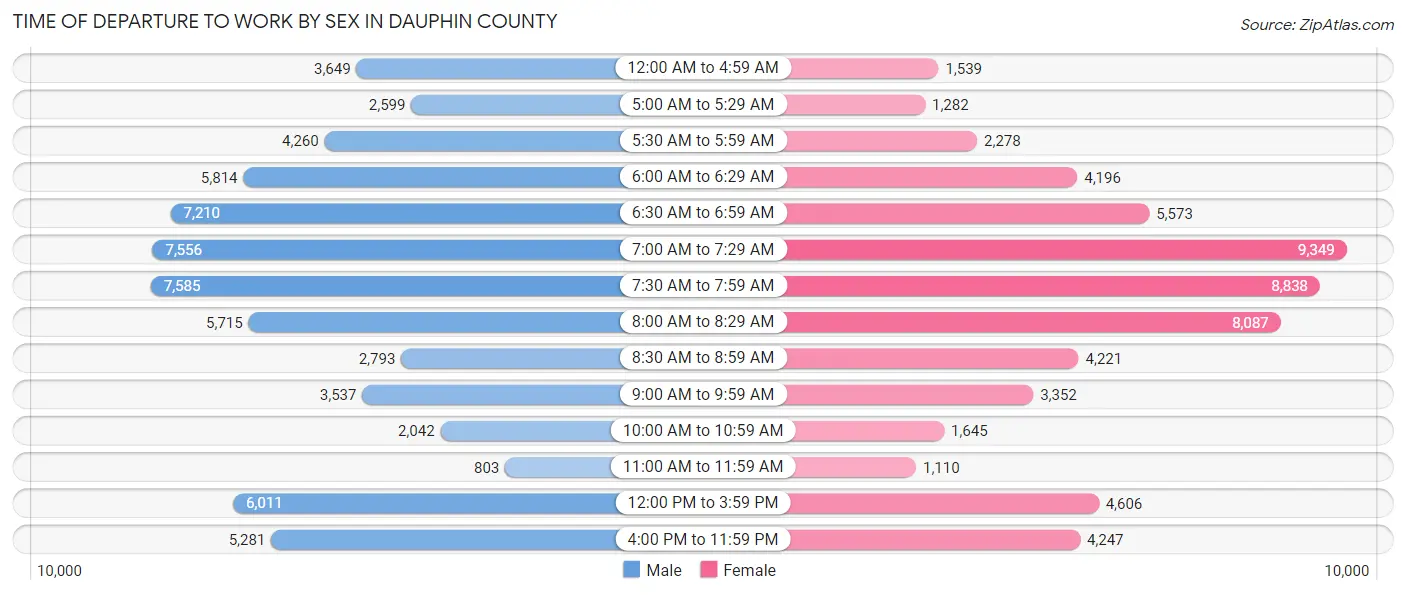
| Time of Departure | Male | Female |
| 12:00 AM to 4:59 AM | 3,649 (5.6%) | 1,539 (2.5%) |
| 5:00 AM to 5:29 AM | 2,599 (4.0%) | 1,282 (2.1%) |
| 5:30 AM to 5:59 AM | 4,260 (6.6%) | 2,278 (3.8%) |
| 6:00 AM to 6:29 AM | 5,814 (9.0%) | 4,196 (7.0%) |
| 6:30 AM to 6:59 AM | 7,210 (11.1%) | 5,573 (9.2%) |
| 7:00 AM to 7:29 AM | 7,556 (11.7%) | 9,349 (15.5%) |
| 7:30 AM to 7:59 AM | 7,585 (11.7%) | 8,838 (14.6%) |
| 8:00 AM to 8:29 AM | 5,715 (8.8%) | 8,087 (13.4%) |
| 8:30 AM to 8:59 AM | 2,793 (4.3%) | 4,221 (7.0%) |
| 9:00 AM to 9:59 AM | 3,537 (5.4%) | 3,352 (5.6%) |
| 10:00 AM to 10:59 AM | 2,042 (3.2%) | 1,645 (2.7%) |
| 11:00 AM to 11:59 AM | 803 (1.2%) | 1,110 (1.8%) |
| 12:00 PM to 3:59 PM | 6,011 (9.3%) | 4,606 (7.6%) |
| 4:00 PM to 11:59 PM | 5,281 (8.1%) | 4,247 (7.0%) |
| Total | 64,855 (100.0%) | 60,323 (100.0%) |
Housing Occupancy in Dauphin County
Occupancy by Ownership in Dauphin County
Of the total 117,907 dwellings in Dauphin County, owner-occupied units account for 74,682 (63.3%), while renter-occupied units make up 43,225 (36.7%).
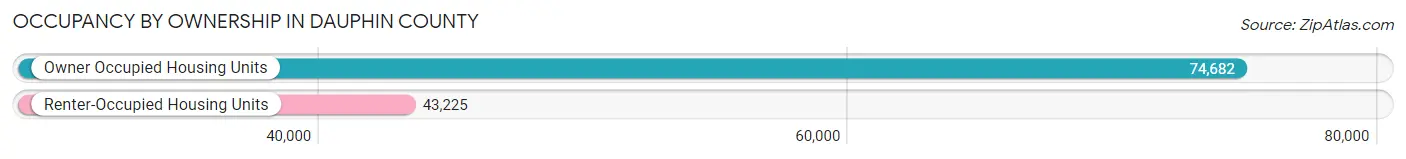
| Occupancy | # Housing Units | % Housing Units |
| Owner Occupied Housing Units | 74,682 | 63.3% |
| Renter-Occupied Housing Units | 43,225 | 36.7% |
| Total Occupied Housing Units | 117,907 | 100.0% |
Occupancy by Household Size in Dauphin County
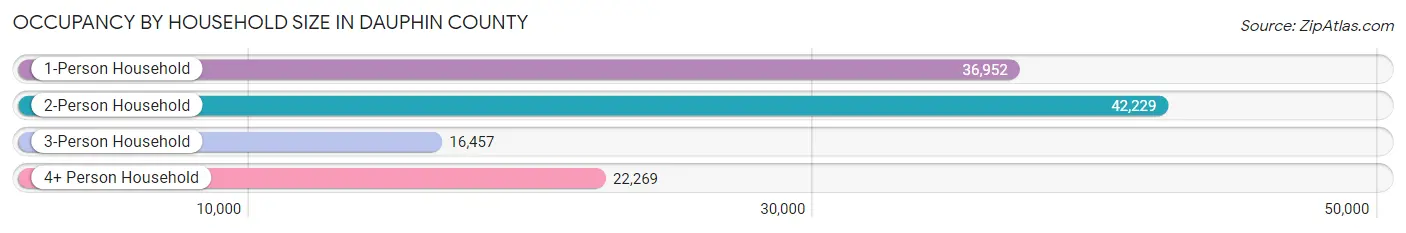
| Household Size | # Housing Units | % Housing Units |
| 1-Person Household | 36,952 | 31.3% |
| 2-Person Household | 42,229 | 35.8% |
| 3-Person Household | 16,457 | 14.0% |
| 4+ Person Household | 22,269 | 18.9% |
| Total Housing Units | 117,907 | 100.0% |
Occupancy by Ownership by Household Size in Dauphin County
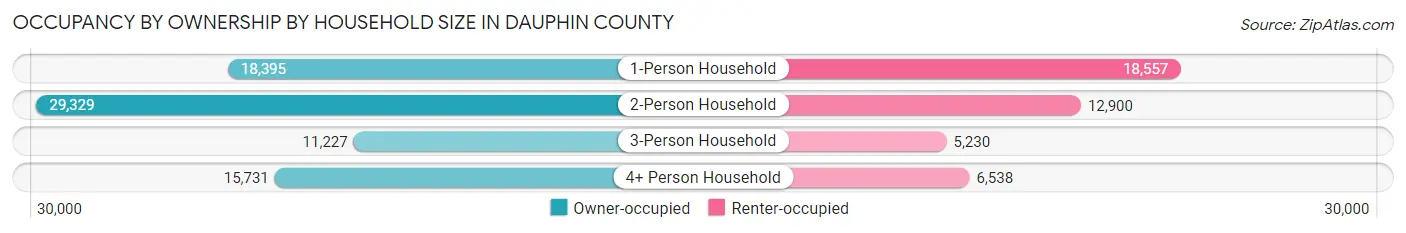
| Household Size | Owner-occupied | Renter-occupied |
| 1-Person Household | 18,395 (49.8%) | 18,557 (50.2%) |
| 2-Person Household | 29,329 (69.5%) | 12,900 (30.5%) |
| 3-Person Household | 11,227 (68.2%) | 5,230 (31.8%) |
| 4+ Person Household | 15,731 (70.6%) | 6,538 (29.4%) |
| Total Housing Units | 74,682 (63.3%) | 43,225 (36.7%) |
Occupancy by Educational Attainment in Dauphin County
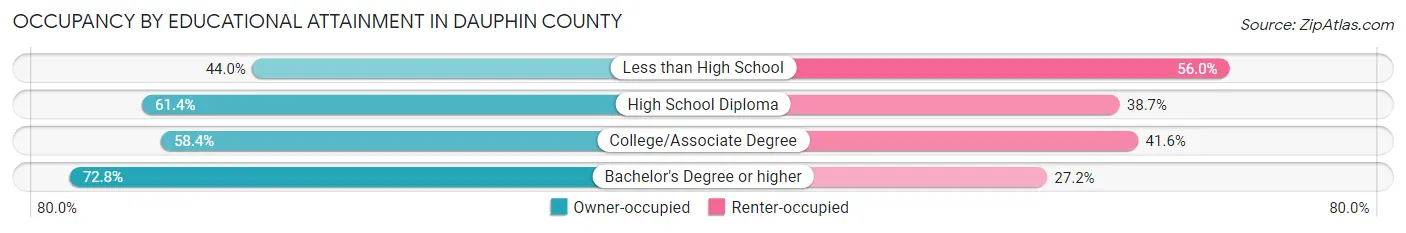
| Household Size | Owner-occupied | Renter-occupied |
| Less than High School | 3,961 (44.0%) | 5,046 (56.0%) |
| High School Diploma | 21,710 (61.4%) | 13,678 (38.7%) |
| College/Associate Degree | 18,297 (58.4%) | 13,049 (41.6%) |
| Bachelor's Degree or higher | 30,714 (72.8%) | 11,452 (27.2%) |
Occupancy by Age of Householder in Dauphin County
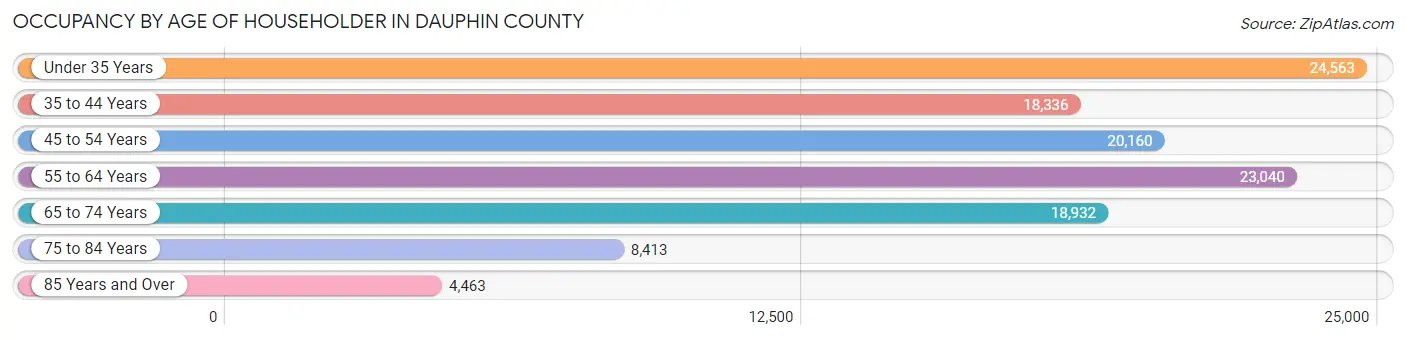
| Age Bracket | # Households | % Households |
| Under 35 Years | 24,563 | 20.8% |
| 35 to 44 Years | 18,336 | 15.5% |
| 45 to 54 Years | 20,160 | 17.1% |
| 55 to 64 Years | 23,040 | 19.5% |
| 65 to 74 Years | 18,932 | 16.1% |
| 75 to 84 Years | 8,413 | 7.1% |
| 85 Years and Over | 4,463 | 3.8% |
| Total | 117,907 | 100.0% |
Housing Finances in Dauphin County
Median Income by Occupancy in Dauphin County
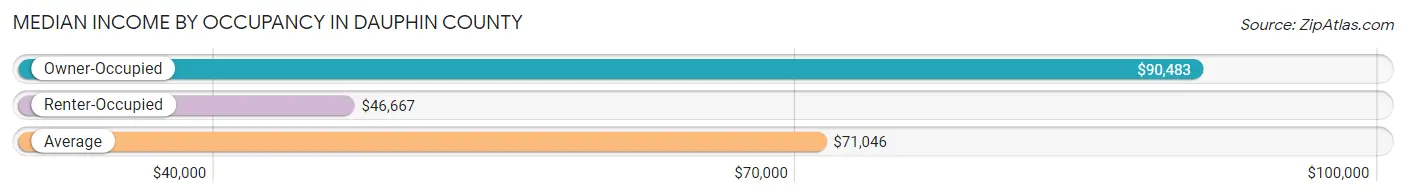
| Occupancy Type | # Households | Median Income |
| Owner-Occupied | 74,682 (63.3%) | $90,483 |
| Renter-Occupied | 43,225 (36.7%) | $46,667 |
| Average | 117,907 (100.0%) | $71,046 |
Occupancy by Householder Income Bracket in Dauphin County
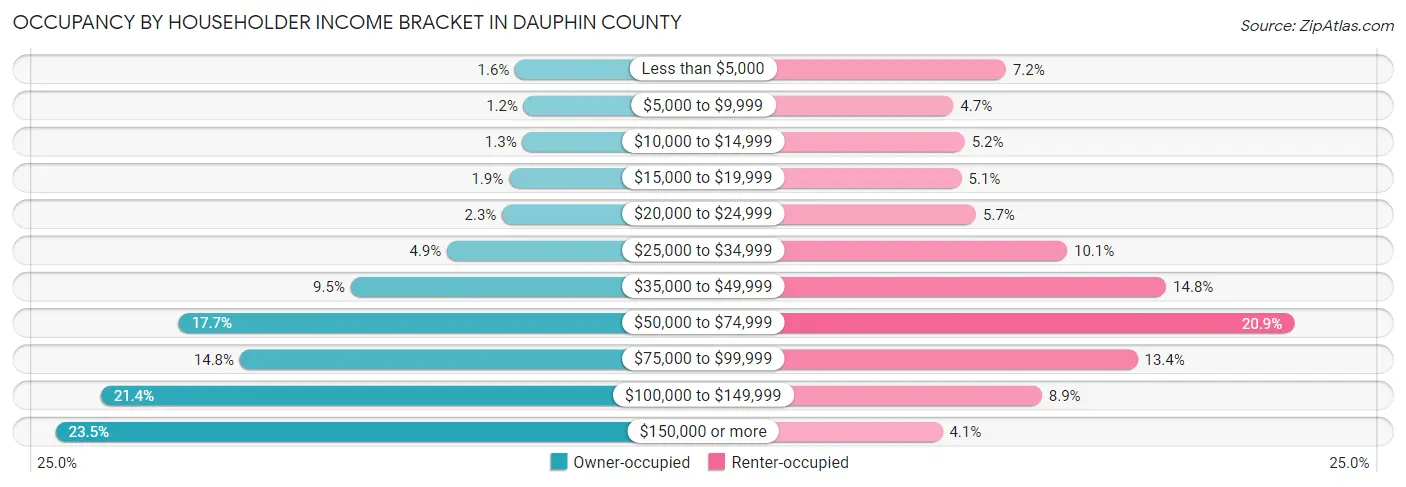
| Income Bracket | Owner-occupied | Renter-occupied |
| Less than $5,000 | 1,224 (1.6%) | 3,096 (7.2%) |
| $5,000 to $9,999 | 921 (1.2%) | 2,014 (4.7%) |
| $10,000 to $14,999 | 964 (1.3%) | 2,248 (5.2%) |
| $15,000 to $19,999 | 1,438 (1.9%) | 2,182 (5.1%) |
| $20,000 to $24,999 | 1,688 (2.3%) | 2,482 (5.7%) |
| $25,000 to $34,999 | 3,648 (4.9%) | 4,353 (10.1%) |
| $35,000 to $49,999 | 7,069 (9.5%) | 6,392 (14.8%) |
| $50,000 to $74,999 | 13,190 (17.7%) | 9,027 (20.9%) |
| $75,000 to $99,999 | 11,017 (14.7%) | 5,805 (13.4%) |
| $100,000 to $149,999 | 15,960 (21.4%) | 3,835 (8.9%) |
| $150,000 or more | 17,563 (23.5%) | 1,791 (4.1%) |
| Total | 74,682 (100.0%) | 43,225 (100.0%) |
Monthly Housing Cost Tiers in Dauphin County
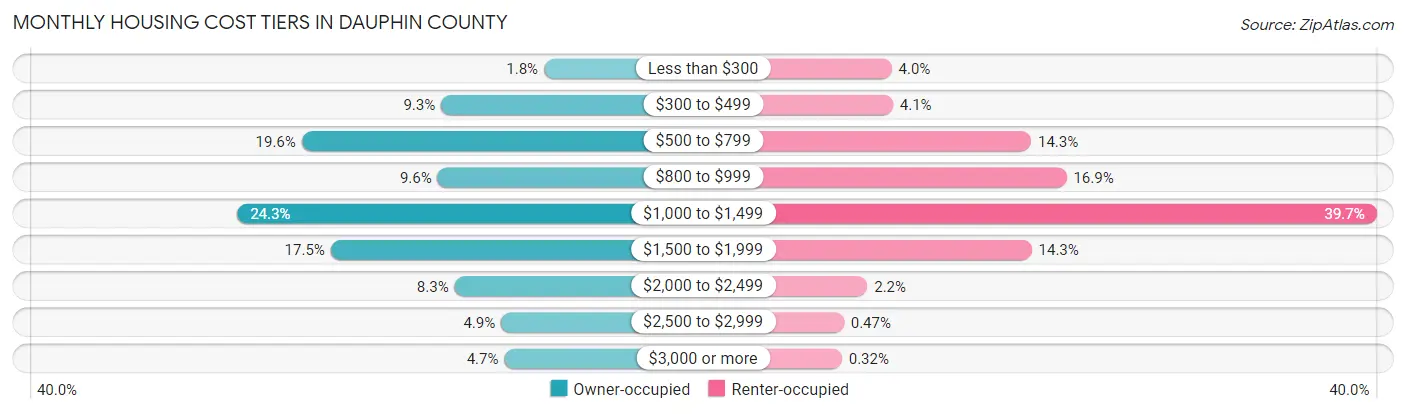
| Monthly Cost | Owner-occupied | Renter-occupied |
| Less than $300 | 1,306 (1.8%) | 1,726 (4.0%) |
| $300 to $499 | 6,970 (9.3%) | 1,765 (4.1%) |
| $500 to $799 | 14,639 (19.6%) | 6,164 (14.3%) |
| $800 to $999 | 7,163 (9.6%) | 7,291 (16.9%) |
| $1,000 to $1,499 | 18,176 (24.3%) | 17,160 (39.7%) |
| $1,500 to $1,999 | 13,041 (17.5%) | 6,183 (14.3%) |
| $2,000 to $2,499 | 6,229 (8.3%) | 951 (2.2%) |
| $2,500 to $2,999 | 3,668 (4.9%) | 201 (0.5%) |
| $3,000 or more | 3,490 (4.7%) | 137 (0.3%) |
| Total | 74,682 (100.0%) | 43,225 (100.0%) |
Physical Housing Characteristics in Dauphin County
Housing Structures in Dauphin County
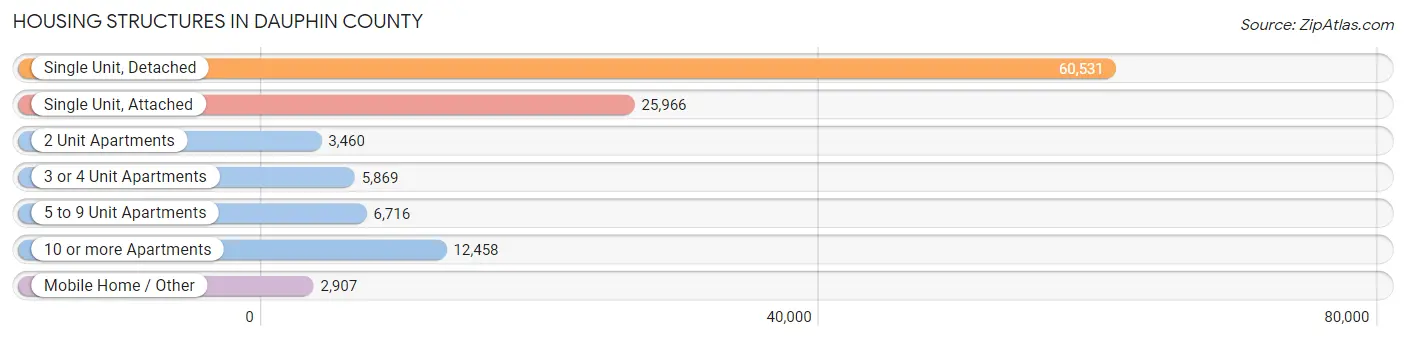
| Structure Type | # Housing Units | % Housing Units |
| Single Unit, Detached | 60,531 | 51.3% |
| Single Unit, Attached | 25,966 | 22.0% |
| 2 Unit Apartments | 3,460 | 2.9% |
| 3 or 4 Unit Apartments | 5,869 | 5.0% |
| 5 to 9 Unit Apartments | 6,716 | 5.7% |
| 10 or more Apartments | 12,458 | 10.6% |
| Mobile Home / Other | 2,907 | 2.5% |
| Total | 117,907 | 100.0% |
Housing Structures by Occupancy in Dauphin County
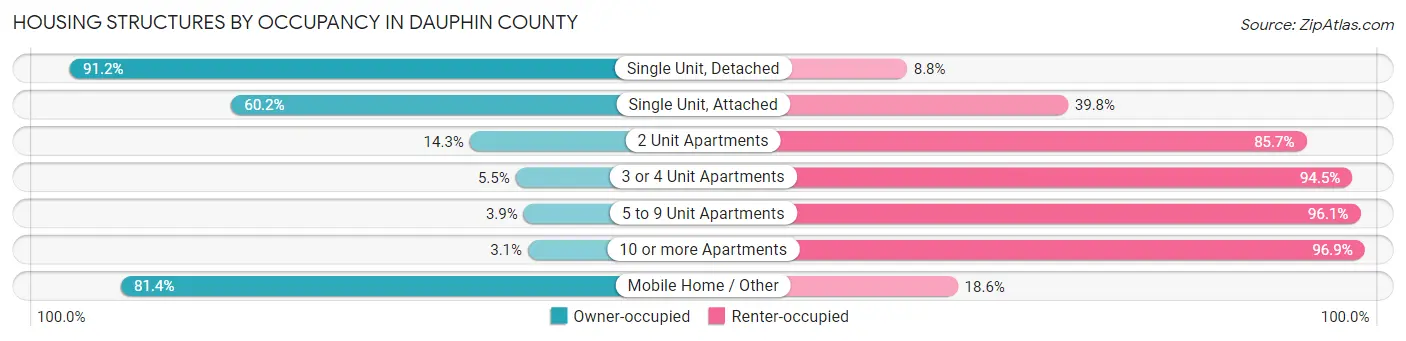
| Structure Type | Owner-occupied | Renter-occupied |
| Single Unit, Detached | 55,217 (91.2%) | 5,314 (8.8%) |
| Single Unit, Attached | 15,632 (60.2%) | 10,334 (39.8%) |
| 2 Unit Apartments | 495 (14.3%) | 2,965 (85.7%) |
| 3 or 4 Unit Apartments | 321 (5.5%) | 5,548 (94.5%) |
| 5 to 9 Unit Apartments | 264 (3.9%) | 6,452 (96.1%) |
| 10 or more Apartments | 386 (3.1%) | 12,072 (96.9%) |
| Mobile Home / Other | 2,367 (81.4%) | 540 (18.6%) |
| Total | 74,682 (63.3%) | 43,225 (36.7%) |
Housing Structures by Number of Rooms in Dauphin County
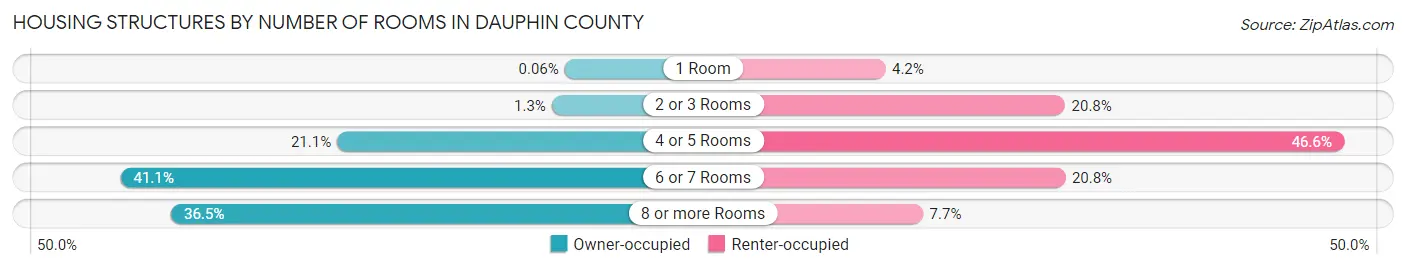
| Number of Rooms | Owner-occupied | Renter-occupied |
| 1 Room | 46 (0.1%) | 1,804 (4.2%) |
| 2 or 3 Rooms | 937 (1.3%) | 8,981 (20.8%) |
| 4 or 5 Rooms | 15,767 (21.1%) | 20,137 (46.6%) |
| 6 or 7 Rooms | 30,712 (41.1%) | 8,995 (20.8%) |
| 8 or more Rooms | 27,220 (36.4%) | 3,308 (7.6%) |
| Total | 74,682 (100.0%) | 43,225 (100.0%) |
Housing Structure by Heating Type in Dauphin County
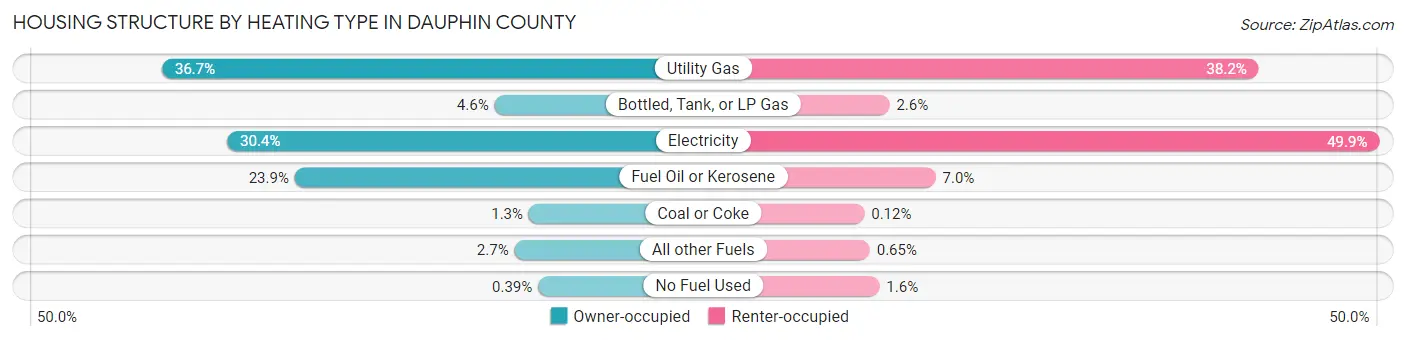
| Heating Type | Owner-occupied | Renter-occupied |
| Utility Gas | 27,436 (36.7%) | 16,522 (38.2%) |
| Bottled, Tank, or LP Gas | 3,433 (4.6%) | 1,102 (2.5%) |
| Electricity | 22,726 (30.4%) | 21,556 (49.9%) |
| Fuel Oil or Kerosene | 17,846 (23.9%) | 3,032 (7.0%) |
| Coal or Coke | 958 (1.3%) | 53 (0.1%) |
| All other Fuels | 1,993 (2.7%) | 279 (0.6%) |
| No Fuel Used | 290 (0.4%) | 681 (1.6%) |
| Total | 74,682 (100.0%) | 43,225 (100.0%) |
Household Vehicle Usage in Dauphin County
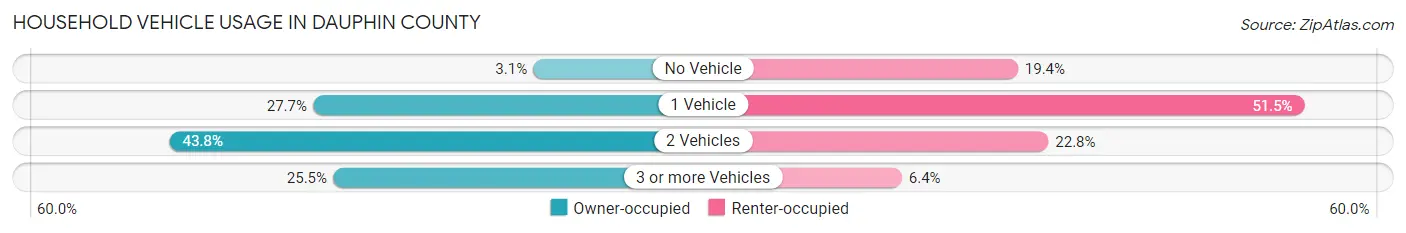
| Vehicles per Household | Owner-occupied | Renter-occupied |
| No Vehicle | 2,279 (3.0%) | 8,371 (19.4%) |
| 1 Vehicle | 20,700 (27.7%) | 22,246 (51.5%) |
| 2 Vehicles | 32,684 (43.8%) | 9,849 (22.8%) |
| 3 or more Vehicles | 19,019 (25.5%) | 2,759 (6.4%) |
| Total | 74,682 (100.0%) | 43,225 (100.0%) |
Real Estate & Mortgages in Dauphin County
Real Estate and Mortgage Overview in Dauphin County
| Characteristic | Without Mortgage | With Mortgage |
| Housing Units | 27,621 | 47,061 |
| Median Property Value | $198,400 | $213,200 |
| Median Household Income | $68,876 | $12,781 |
| Monthly Housing Costs | $620 | $3,376 |
| Real Estate Taxes | $2,929 | $518 |
Property Value by Mortgage Status in Dauphin County
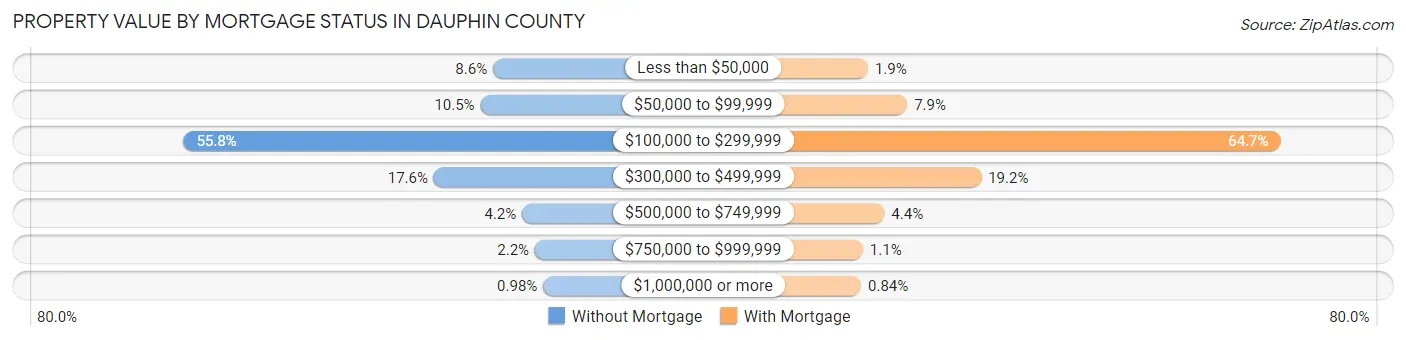
| Property Value | Without Mortgage | With Mortgage |
| Less than $50,000 | 2,384 (8.6%) | 889 (1.9%) |
| $50,000 to $99,999 | 2,911 (10.5%) | 3,708 (7.9%) |
| $100,000 to $299,999 | 15,409 (55.8%) | 30,456 (64.7%) |
| $300,000 to $499,999 | 4,871 (17.6%) | 9,014 (19.2%) |
| $500,000 to $749,999 | 1,156 (4.2%) | 2,073 (4.4%) |
| $750,000 to $999,999 | 619 (2.2%) | 528 (1.1%) |
| $1,000,000 or more | 271 (1.0%) | 393 (0.8%) |
| Total | 27,621 (100.0%) | 47,061 (100.0%) |
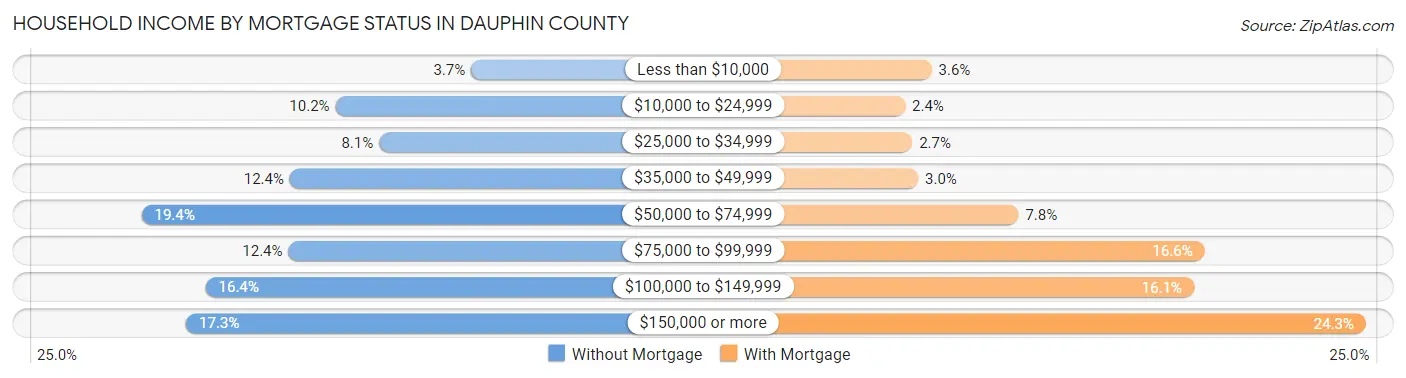
Household Income by Mortgage Status in Dauphin County
| Household Income | Without Mortgage | With Mortgage |
| Less than $10,000 | 1,034 (3.7%) | 1,702 (3.6%) |
| $10,000 to $24,999 | 2,817 (10.2%) | 1,111 (2.4%) |
| $25,000 to $34,999 | 2,244 (8.1%) | 1,273 (2.7%) |
| $35,000 to $49,999 | 3,416 (12.4%) | 1,404 (3.0%) |
| $50,000 to $74,999 | 5,368 (19.4%) | 3,653 (7.8%) |
| $75,000 to $99,999 | 3,436 (12.4%) | 7,822 (16.6%) |
| $100,000 to $149,999 | 4,524 (16.4%) | 7,581 (16.1%) |
| $150,000 or more | 4,782 (17.3%) | 11,436 (24.3%) |
| Total | 27,621 (100.0%) | 47,061 (100.0%) |
Property Value to Household Income Ratio in Dauphin County
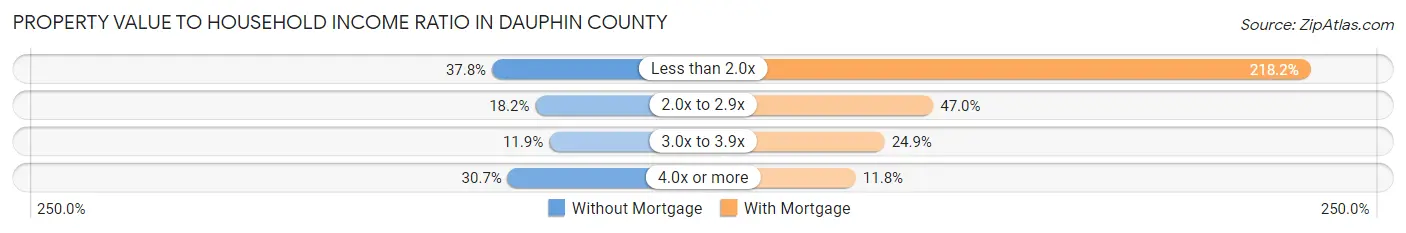
| Value-to-Income Ratio | Without Mortgage | With Mortgage |
| Less than 2.0x | 10,443 (37.8%) | 102,690 (218.2%) |
| 2.0x to 2.9x | 5,012 (18.1%) | 22,096 (46.9%) |
| 3.0x to 3.9x | 3,292 (11.9%) | 11,703 (24.9%) |
| 4.0x or more | 8,471 (30.7%) | 5,547 (11.8%) |
| Total | 27,621 (100.0%) | 47,061 (100.0%) |
Real Estate Taxes by Mortgage Status in Dauphin County
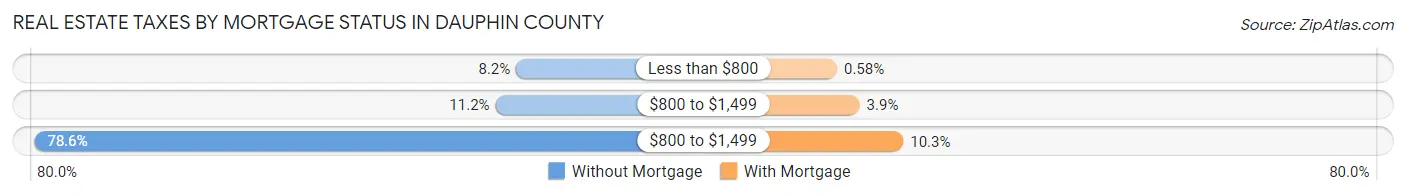
| Property Taxes | Without Mortgage | With Mortgage |
| Less than $800 | 2,259 (8.2%) | 275 (0.6%) |
| $800 to $1,499 | 3,097 (11.2%) | 1,833 (3.9%) |
| $800 to $1,499 | 21,704 (78.6%) | 4,830 (10.3%) |
| Total | 27,621 (100.0%) | 47,061 (100.0%) |
Health & Disability in Dauphin County
Health Insurance Coverage by Age in Dauphin County
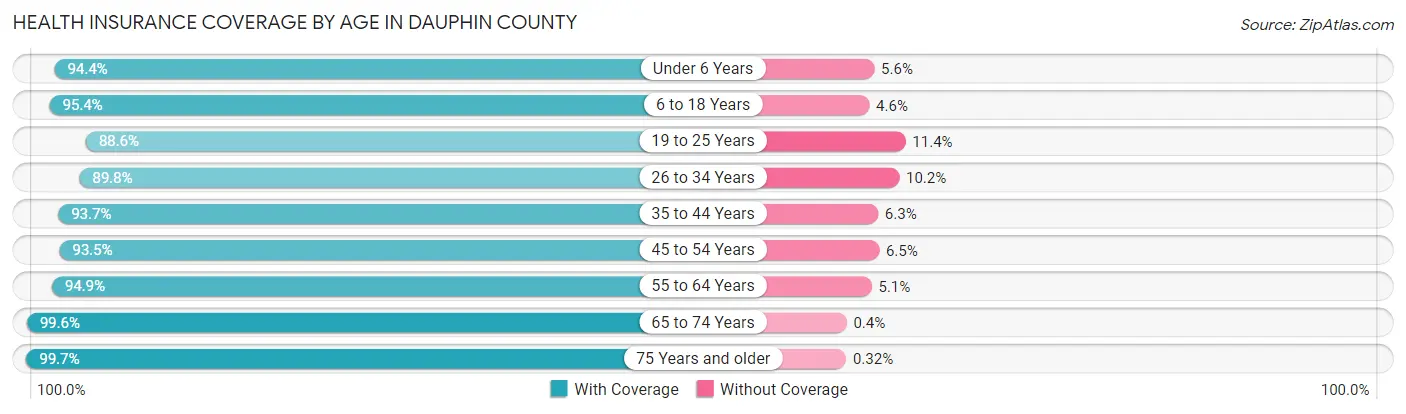
| Age Bracket | With Coverage | Without Coverage |
| Under 6 Years | 19,433 (94.4%) | 1,147 (5.6%) |
| 6 to 18 Years | 44,076 (95.4%) | 2,145 (4.6%) |
| 19 to 25 Years | 21,437 (88.6%) | 2,759 (11.4%) |
| 26 to 34 Years | 31,592 (89.8%) | 3,592 (10.2%) |
| 35 to 44 Years | 31,882 (93.7%) | 2,131 (6.3%) |
| 45 to 54 Years | 33,026 (93.5%) | 2,286 (6.5%) |
| 55 to 64 Years | 36,524 (94.9%) | 1,955 (5.1%) |
| 65 to 74 Years | 29,539 (99.6%) | 120 (0.4%) |
| 75 Years and older | 19,025 (99.7%) | 62 (0.3%) |
| Total | 266,534 (94.3%) | 16,197 (5.7%) |
Health Insurance Coverage by Citizenship Status in Dauphin County
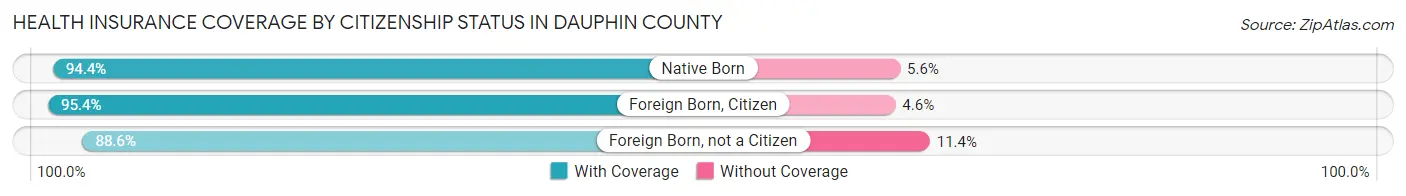
| Citizenship Status | With Coverage | Without Coverage |
| Native Born | 19,433 (94.4%) | 1,147 (5.6%) |
| Foreign Born, Citizen | 44,076 (95.4%) | 2,145 (4.6%) |
| Foreign Born, not a Citizen | 21,437 (88.6%) | 2,759 (11.4%) |
Health Insurance Coverage by Household Income in Dauphin County
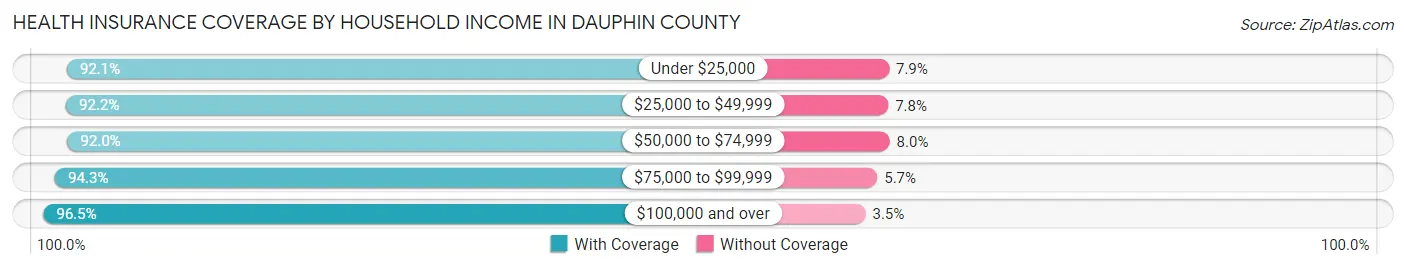
| Household Income | With Coverage | Without Coverage |
| Under $25,000 | 28,670 (92.1%) | 2,462 (7.9%) |
| $25,000 to $49,999 | 36,921 (92.2%) | 3,105 (7.8%) |
| $50,000 to $74,999 | 46,409 (92.0%) | 4,053 (8.0%) |
| $75,000 to $99,999 | 40,545 (94.3%) | 2,454 (5.7%) |
| $100,000 and over | 110,343 (96.5%) | 4,019 (3.5%) |
Public vs Private Health Insurance Coverage by Age in Dauphin County
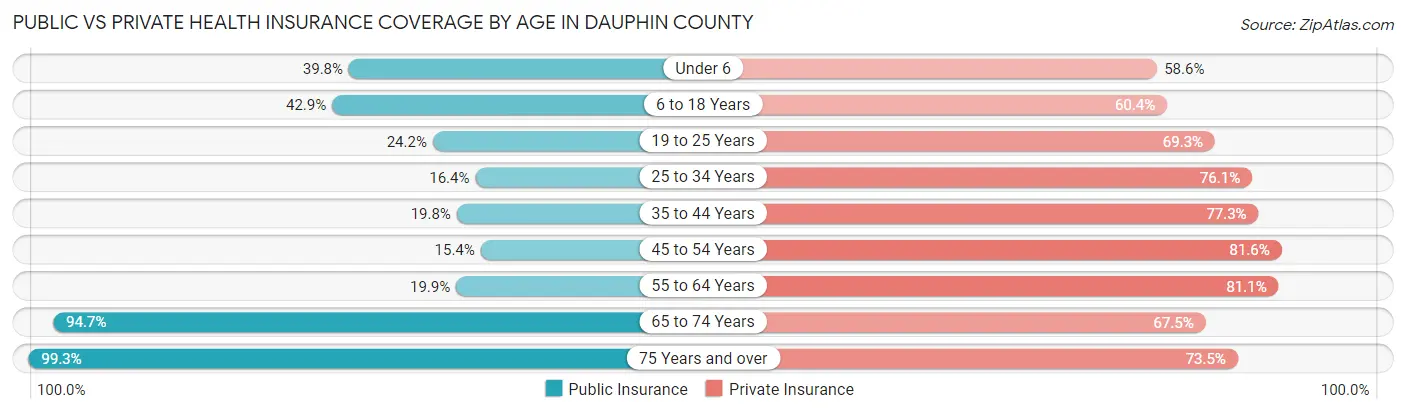
| Age Bracket | Public Insurance | Private Insurance |
| Under 6 | 8,193 (39.8%) | 12,050 (58.6%) |
| 6 to 18 Years | 19,843 (42.9%) | 27,899 (60.4%) |
| 19 to 25 Years | 5,865 (24.2%) | 16,756 (69.3%) |
| 25 to 34 Years | 5,751 (16.4%) | 26,786 (76.1%) |
| 35 to 44 Years | 6,735 (19.8%) | 26,301 (77.3%) |
| 45 to 54 Years | 5,425 (15.4%) | 28,825 (81.6%) |
| 55 to 64 Years | 7,664 (19.9%) | 31,189 (81.0%) |
| 65 to 74 Years | 28,094 (94.7%) | 20,027 (67.5%) |
| 75 Years and over | 18,952 (99.3%) | 14,026 (73.5%) |
| Total | 106,522 (37.7%) | 203,859 (72.1%) |
Disability Status by Sex by Age in Dauphin County
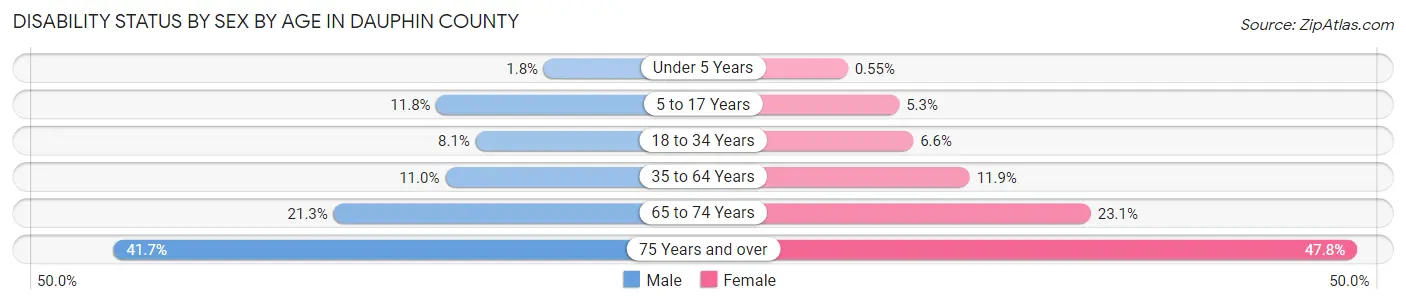
| Age Bracket | Male | Female |
| Under 5 Years | 159 (1.8%) | 46 (0.5%) |
| 5 to 17 Years | 2,786 (11.8%) | 1,209 (5.3%) |
| 18 to 34 Years | 2,531 (8.1%) | 2,090 (6.6%) |
| 35 to 64 Years | 5,767 (11.0%) | 6,550 (11.9%) |
| 65 to 74 Years | 2,956 (21.3%) | 3,650 (23.1%) |
| 75 Years and over | 3,177 (41.7%) | 5,487 (47.8%) |
Disability Class by Sex by Age in Dauphin County
Disability Class: Hearing Difficulty
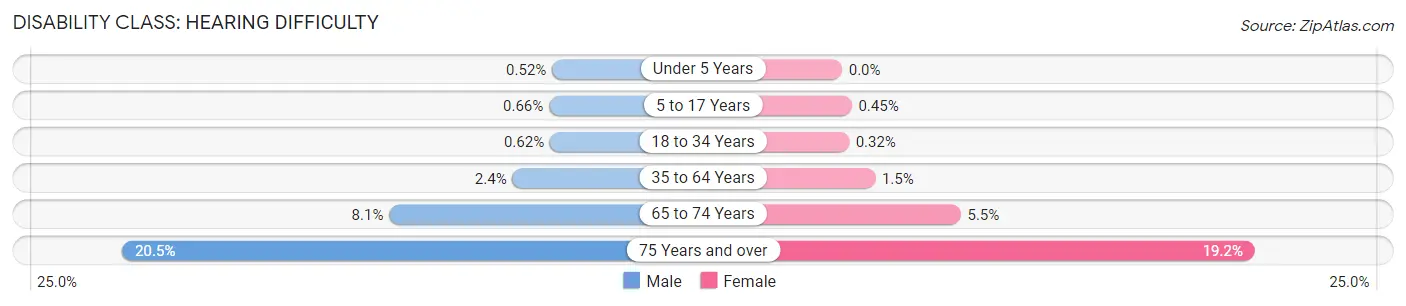
| Age Bracket | Male | Female |
| Under 5 Years | 46 (0.5%) | 0 (0.0%) |
| 5 to 17 Years | 155 (0.7%) | 101 (0.4%) |
| 18 to 34 Years | 193 (0.6%) | 102 (0.3%) |
| 35 to 64 Years | 1,242 (2.4%) | 849 (1.5%) |
| 65 to 74 Years | 1,120 (8.1%) | 870 (5.5%) |
| 75 Years and over | 1,559 (20.5%) | 2,199 (19.2%) |
Disability Class: Vision Difficulty
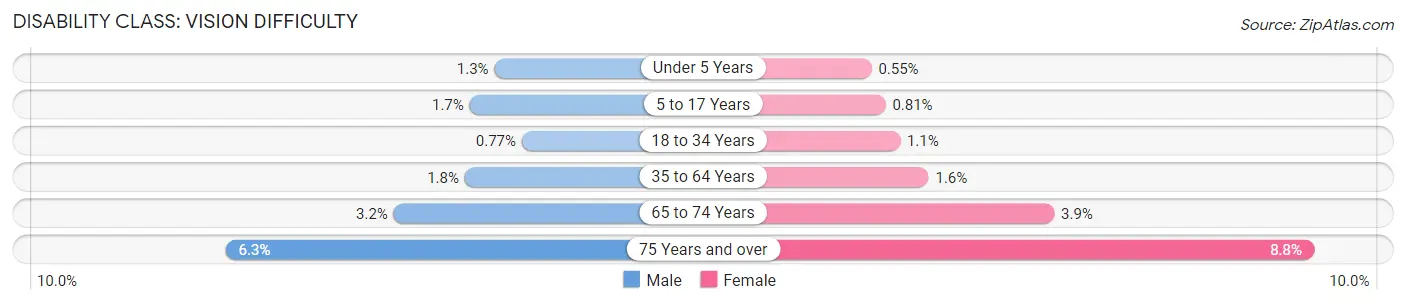
| Age Bracket | Male | Female |
| Under 5 Years | 113 (1.3%) | 46 (0.5%) |
| 5 to 17 Years | 411 (1.7%) | 184 (0.8%) |
| 18 to 34 Years | 241 (0.8%) | 341 (1.1%) |
| 35 to 64 Years | 962 (1.8%) | 889 (1.6%) |
| 65 to 74 Years | 437 (3.2%) | 623 (3.9%) |
| 75 Years and over | 477 (6.3%) | 1,005 (8.8%) |
Disability Class: Cognitive Difficulty
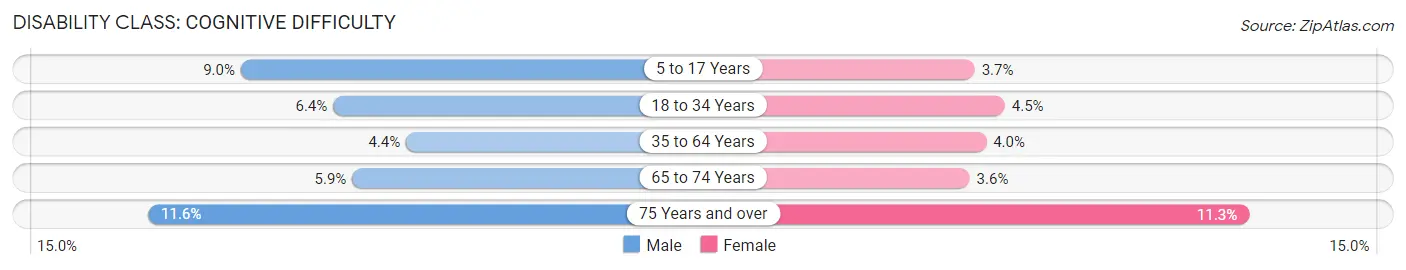
| Age Bracket | Male | Female |
| 5 to 17 Years | 2,123 (9.0%) | 840 (3.7%) |
| 18 to 34 Years | 1,995 (6.4%) | 1,432 (4.5%) |
| 35 to 64 Years | 2,302 (4.4%) | 2,221 (4.0%) |
| 65 to 74 Years | 816 (5.9%) | 563 (3.6%) |
| 75 Years and over | 880 (11.6%) | 1,301 (11.3%) |
Disability Class: Ambulatory Difficulty
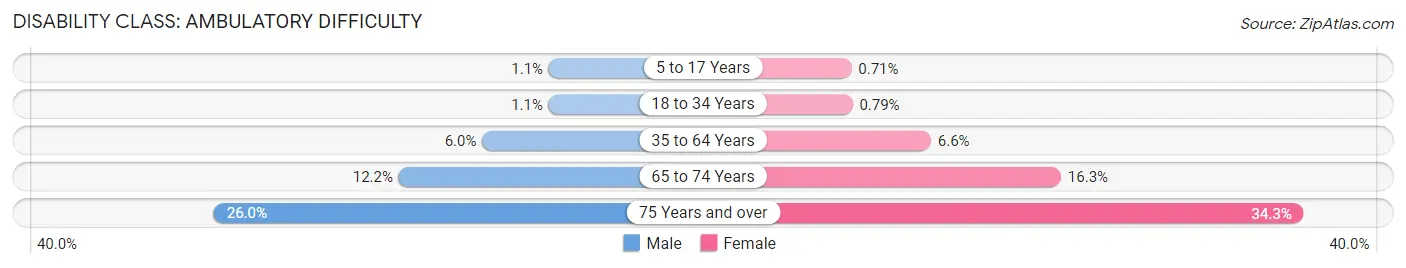
| Age Bracket | Male | Female |
| 5 to 17 Years | 253 (1.1%) | 161 (0.7%) |
| 18 to 34 Years | 335 (1.1%) | 249 (0.8%) |
| 35 to 64 Years | 3,165 (6.0%) | 3,646 (6.6%) |
| 65 to 74 Years | 1,694 (12.2%) | 2,569 (16.3%) |
| 75 Years and over | 1,975 (26.0%) | 3,935 (34.3%) |
Disability Class: Self-Care Difficulty
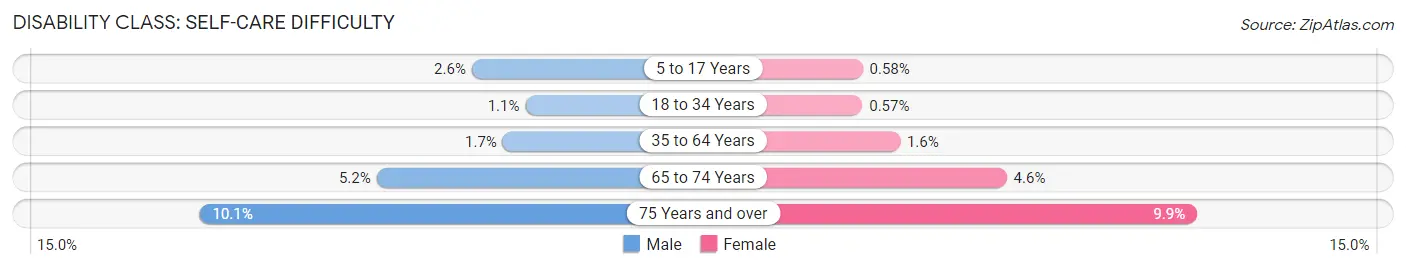
| Age Bracket | Male | Female |
| 5 to 17 Years | 602 (2.5%) | 132 (0.6%) |
| 18 to 34 Years | 329 (1.1%) | 179 (0.6%) |
| 35 to 64 Years | 890 (1.7%) | 893 (1.6%) |
| 65 to 74 Years | 721 (5.2%) | 725 (4.6%) |
| 75 Years and over | 771 (10.1%) | 1,135 (9.9%) |
Technology Access in Dauphin County
Computing Device Access in Dauphin County
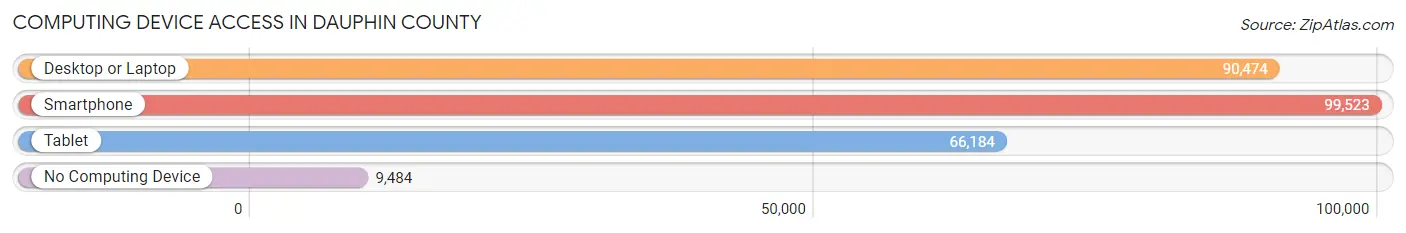
| Device Type | # Households | % Households |
| Desktop or Laptop | 90,474 | 76.7% |
| Smartphone | 99,523 | 84.4% |
| Tablet | 66,184 | 56.1% |
| No Computing Device | 9,484 | 8.0% |
| Total | 117,907 | 100.0% |
Internet Access in Dauphin County
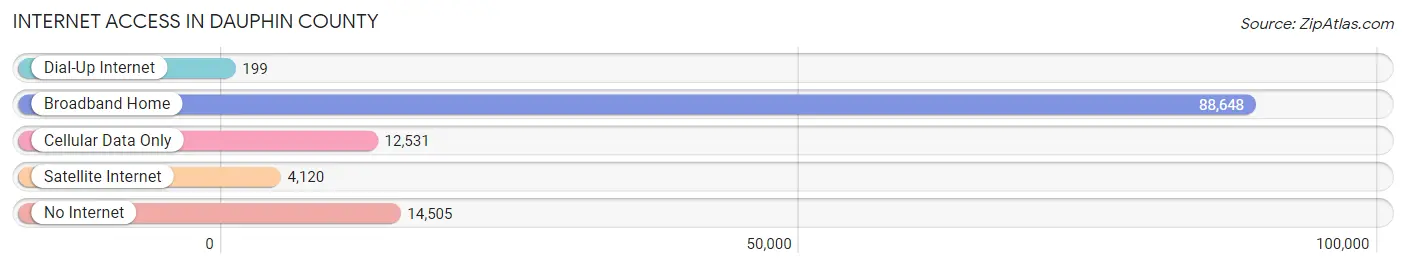
| Internet Type | # Households | % Households |
| Dial-Up Internet | 199 | 0.2% |
| Broadband Home | 88,648 | 75.2% |
| Cellular Data Only | 12,531 | 10.6% |
| Satellite Internet | 4,120 | 3.5% |
| No Internet | 14,505 | 12.3% |
| Total | 117,907 | 100.0% |
Dauphin County Summary
Dauphin County, Pennsylvania is located in the south-central region of the state and is part of the Harrisburg-Carlisle Metropolitan Statistical Area. The county was created in 1785 and is named after Louis-Joseph, Dauphin of France, the son of King Louis XVI. The county seat is Harrisburg, the state capital. As of the 2010 census, the population of Dauphin County was 268,100.
History
The area that is now Dauphin County was originally part of Lancaster County, one of the original three counties created by William Penn in 1682. In 1729, Lancaster County was divided into two parts, Lancaster County and Berks County. In 1785, Dauphin County was created from the northern part of Lancaster County. The county was named after Louis-Joseph, Dauphin of France, the son of King Louis XVI.
The county was initially divided into three townships: Derry, Paxton, and Mifflin. In 1791, the county was divided into five townships: Derry, Paxton, Mifflin, Lower Paxton, and Upper Paxton. In 1813, the county was divided into seven townships: Derry, Paxton, Mifflin, Lower Paxton, Upper Paxton, Susquehanna, and Swatara. In 1845, the county was divided into nine townships: Derry, Paxton, Mifflin, Lower Paxton, Upper Paxton, Susquehanna, Swatara, Halifax, and Lykens.
The county seat of Dauphin County is Harrisburg, the state capital. The city was founded in 1785 and was named after John Harris, Sr., an early settler. The city was incorporated in 1791 and became the state capital in 1812.
Geography
Dauphin County is located in the south-central region of Pennsylvania. It is bordered by Cumberland County to the north, Perry County to the east, Lebanon County to the southeast, Berks County to the south, and Lancaster County to the west. The county has a total area of 558 square miles, of which 554 square miles is land and 4.2 square miles is water.
The county is divided into nine townships: Derry, Paxton, Mifflin, Lower Paxton, Upper Paxton, Susquehanna, Swatara, Halifax, and Lykens. The county is also home to several unincorporated communities, including Hershey, Hummelstown, Middletown, and Steelton.
The county is located in the Appalachian Mountains and is home to several mountain ranges, including the Blue Mountains, the Kittatinny Mountains, and the South Mountain. The Susquehanna River flows through the county and is the largest river in the state.
Economy
The economy of Dauphin County is largely based on government, healthcare, and manufacturing. The county is home to several government agencies, including the Pennsylvania State Capitol, the Pennsylvania Department of Transportation, and the Pennsylvania State Police.
The county is also home to several healthcare facilities, including Penn State Milton S. Hershey Medical Center, PinnacleHealth System, and Geisinger Holy Spirit Hospital.
Manufacturing is also an important part of the county’s economy. The county is home to several manufacturing companies, including Hershey Foods Corporation, Armstrong World Industries, and Tyco Electronics.
Demographics
As of the 2010 census, the population of Dauphin County was 268,100. The population density was 482.2 people per square mile. The racial makeup of the county was 81.3% White, 11.2% African American, 0.4% Native American, 2.2% Asian, 0.1% Pacific Islander, 2.3% from other races, and 2.5% from two or more races. Hispanic or Latino of any race were 5.2% of the population.
The median income for a household in the county was $50,945 and the median income for a family was $63,945. The per capita income for the county was $25,945. About 8.2% of the population was below the poverty line.
Common Questions
What is Per Capita Income in Dauphin County?
Per Capita income in Dauphin County is $39,709.
What is the Median Family Income in Dauphin County?
Median Family Income in Dauphin County is $91,006.
What is the Median Household income in Dauphin County?
Median Household Income in Dauphin County is $71,046.
What is Income or Wage Gap in Dauphin County?
Income or Wage Gap in Dauphin County is 26.0%.
Women in Dauphin County earn 74.0 cents for every dollar earned by a man.
What is Family Income Deficit in Dauphin County?
Family Income Deficit in Dauphin County is $11,526.
Families that are below poverty line in Dauphin County earn $11,526 less on average than the poverty threshold level.
What is Inequality or Gini Index in Dauphin County?
Inequality or Gini Index in Dauphin County is 0.46.
What is the Total Population of Dauphin County?
Total Population of Dauphin County is 286,108.
What is the Total Male Population of Dauphin County?
Total Male Population of Dauphin County is 139,988.
What is the Total Female Population of Dauphin County?
Total Female Population of Dauphin County is 146,120.
What is the Ratio of Males per 100 Females in Dauphin County?
There are 95.80 Males per 100 Females in Dauphin County.
What is the Ratio of Females per 100 Males in Dauphin County?
There are 104.38 Females per 100 Males in Dauphin County.
What is the Median Population Age in Dauphin County?
Median Population Age in Dauphin County is 39.4 Years.
What is the Average Family Size in Dauphin County
Average Family Size in Dauphin County is 3.0 People.
What is the Average Household Size in Dauphin County
Average Household Size in Dauphin County is 2.4 People.
How Large is the Labor Force in Dauphin County?
There are 150,420 People in the Labor Forcein in Dauphin County.
What is the Percentage of People in the Labor Force in Dauphin County?
65.5% of People are in the Labor Force in Dauphin County.
What is the Unemployment Rate in Dauphin County?
Unemployment Rate in Dauphin County is 4.3%.