Crawford County, PA Map & Demographics
Crawford County Overview
$30,989
PER CAPITA INCOME
$71,507
AVG FAMILY INCOME
$58,734
AVG HOUSEHOLD INCOME
34.1%
WAGE / INCOME GAP [ % ]
65.9¢/ $1
WAGE / INCOME GAP [ $ ]
$9,766
FAMILY INCOME DEFICIT
0.43
INEQUALITY / GINI INDEX
83,876
TOTAL POPULATION
41,371
MALE POPULATION
42,505
FEMALE POPULATION
97.33
MALES / 100 FEMALES
102.74
FEMALES / 100 MALES
43.6
MEDIAN AGE
3.0
AVG FAMILY SIZE
2.4
AVG HOUSEHOLD SIZE
38,394
LABOR FORCE [ PEOPLE ]
55.8%
PERCENT IN LABOR FORCE
5.6%
UNEMPLOYMENT RATE
Income in Crawford County
Income Overview in Crawford County
Per Capita Income in Crawford County is $30,989, while median incomes of families and households are $71,507 and $58,734 respectively.
| Characteristic | Number | Measure |
| Per Capita Income | 83,876 | $30,989 |
| Median Family Income | 21,661 | $71,507 |
| Mean Family Income | 21,661 | $87,376 |
| Median Household Income | 33,191 | $58,734 |
| Mean Household Income | 33,191 | $75,673 |
| Income Deficit | 21,661 | $9,766 |
| Wage / Income Gap (%) | 83,876 | 34.11% |
| Wage / Income Gap ($) | 83,876 | 65.89¢ per $1 |
| Gini / Inequality Index | 83,876 | 0.43 |
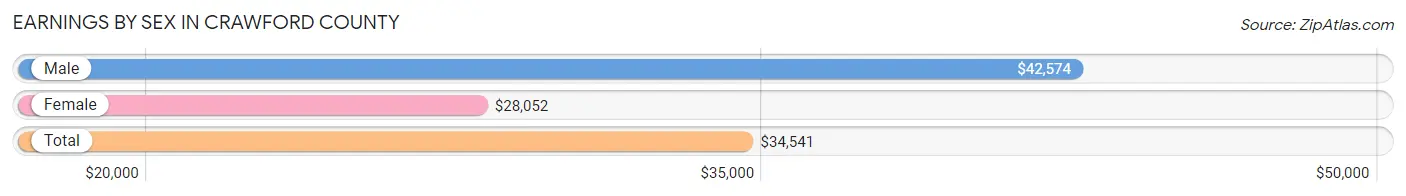
Earnings by Sex in Crawford County
Average Earnings in Crawford County are $34,541, $42,574 for men and $28,052 for women, a difference of 34.1%.
| Sex | Number | Average Earnings |
| Male | 21,842 (53.6%) | $42,574 |
| Female | 18,904 (46.4%) | $28,052 |
| Total | 40,746 (100.0%) | $34,541 |
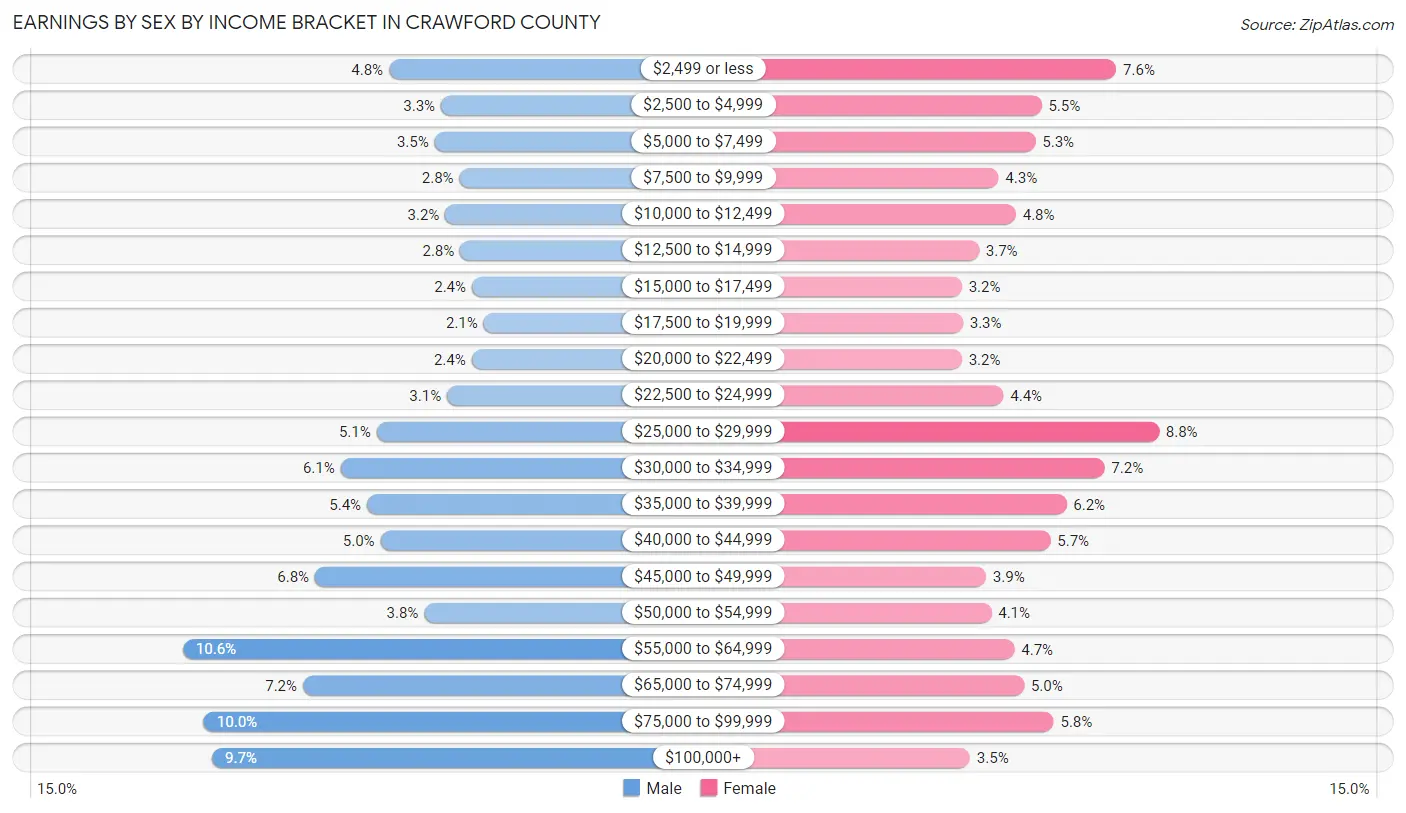
Earnings by Sex by Income Bracket in Crawford County
The most common earnings brackets in Crawford County are $55,000 to $64,999 for men (2,305 | 10.5%) and $25,000 to $29,999 for women (1,658 | 8.8%).
| Income | Male | Female |
| $2,499 or less | 1,039 (4.8%) | 1,431 (7.6%) |
| $2,500 to $4,999 | 721 (3.3%) | 1,034 (5.5%) |
| $5,000 to $7,499 | 761 (3.5%) | 1,001 (5.3%) |
| $7,500 to $9,999 | 608 (2.8%) | 806 (4.3%) |
| $10,000 to $12,499 | 694 (3.2%) | 898 (4.8%) |
| $12,500 to $14,999 | 602 (2.8%) | 701 (3.7%) |
| $15,000 to $17,499 | 530 (2.4%) | 610 (3.2%) |
| $17,500 to $19,999 | 458 (2.1%) | 617 (3.3%) |
| $20,000 to $22,499 | 533 (2.4%) | 610 (3.2%) |
| $22,500 to $24,999 | 683 (3.1%) | 831 (4.4%) |
| $25,000 to $29,999 | 1,117 (5.1%) | 1,658 (8.8%) |
| $30,000 to $34,999 | 1,336 (6.1%) | 1,368 (7.2%) |
| $35,000 to $39,999 | 1,176 (5.4%) | 1,167 (6.2%) |
| $40,000 to $44,999 | 1,092 (5.0%) | 1,081 (5.7%) |
| $45,000 to $49,999 | 1,493 (6.8%) | 739 (3.9%) |
| $50,000 to $54,999 | 823 (3.8%) | 767 (4.1%) |
| $55,000 to $64,999 | 2,305 (10.5%) | 890 (4.7%) |
| $65,000 to $74,999 | 1,569 (7.2%) | 942 (5.0%) |
| $75,000 to $99,999 | 2,176 (10.0%) | 1,098 (5.8%) |
| $100,000+ | 2,126 (9.7%) | 655 (3.5%) |
| Total | 21,842 (100.0%) | 18,904 (100.0%) |
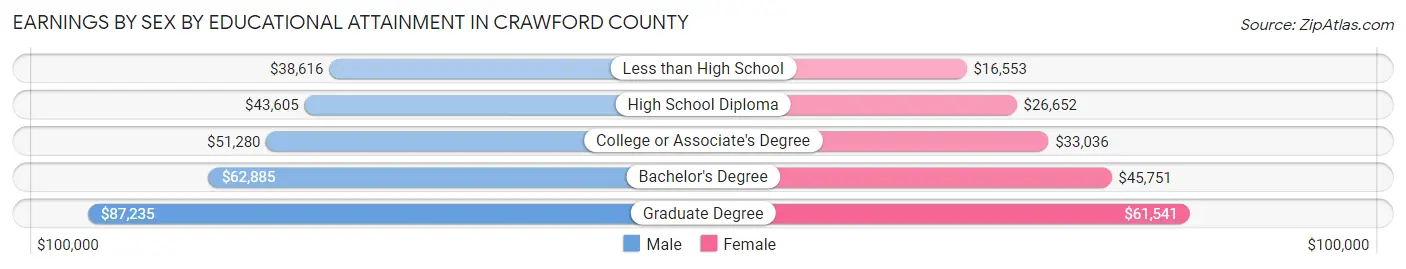
Earnings by Sex by Educational Attainment in Crawford County
Average earnings in Crawford County are $48,727 for men and $32,340 for women, a difference of 33.6%. Men with an educational attainment of graduate degree enjoy the highest average annual earnings of $87,235, while those with less than high school education earn the least with $38,616. Women with an educational attainment of graduate degree earn the most with the average annual earnings of $61,541, while those with less than high school education have the smallest earnings of $16,553.
| Educational Attainment | Male Income | Female Income |
| Less than High School | $38,616 | $16,553 |
| High School Diploma | $43,605 | $26,652 |
| College or Associate's Degree | $51,280 | $33,036 |
| Bachelor's Degree | $62,885 | $45,751 |
| Graduate Degree | $87,235 | $61,541 |
| Total | $48,727 | $32,340 |
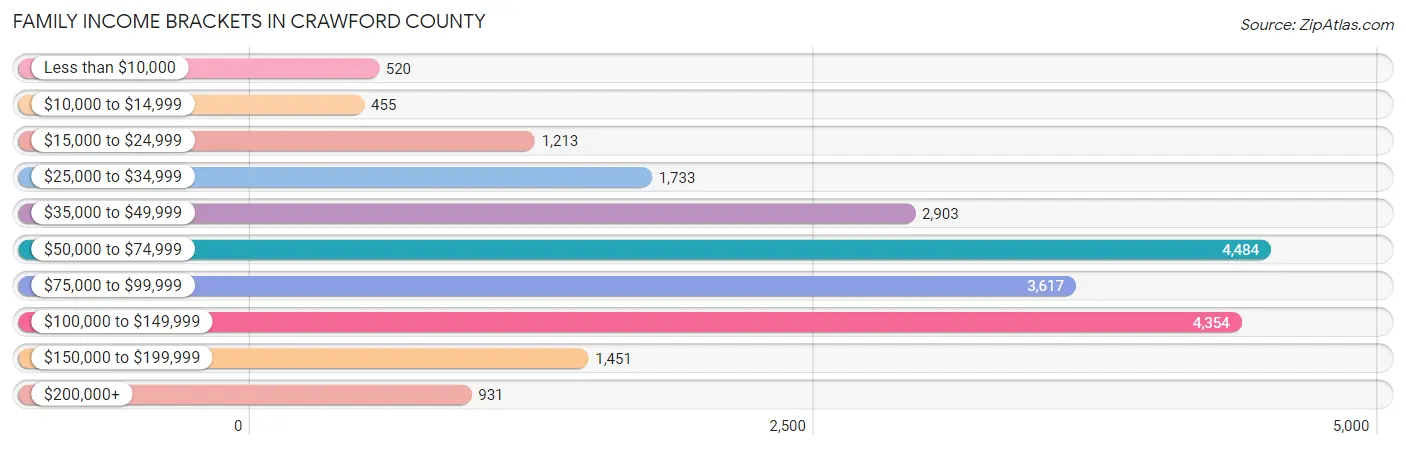
Family Income in Crawford County
Family Income Brackets in Crawford County
According to the Crawford County family income data, there are 4,484 families falling into the $50,000 to $74,999 income range, which is the most common income bracket and makes up 20.7% of all families. Conversely, the $10,000 to $14,999 income bracket is the least frequent group with only 455 families (2.1%) belonging to this category.
| Income Bracket | # Families | % Families |
| Less than $10,000 | 520 | 2.4% |
| $10,000 to $14,999 | 455 | 2.1% |
| $15,000 to $24,999 | 1,213 | 5.6% |
| $25,000 to $34,999 | 1,733 | 8.0% |
| $35,000 to $49,999 | 2,903 | 13.4% |
| $50,000 to $74,999 | 4,484 | 20.7% |
| $75,000 to $99,999 | 3,617 | 16.7% |
| $100,000 to $149,999 | 4,354 | 20.1% |
| $150,000 to $199,999 | 1,451 | 6.7% |
| $200,000+ | 931 | 4.3% |
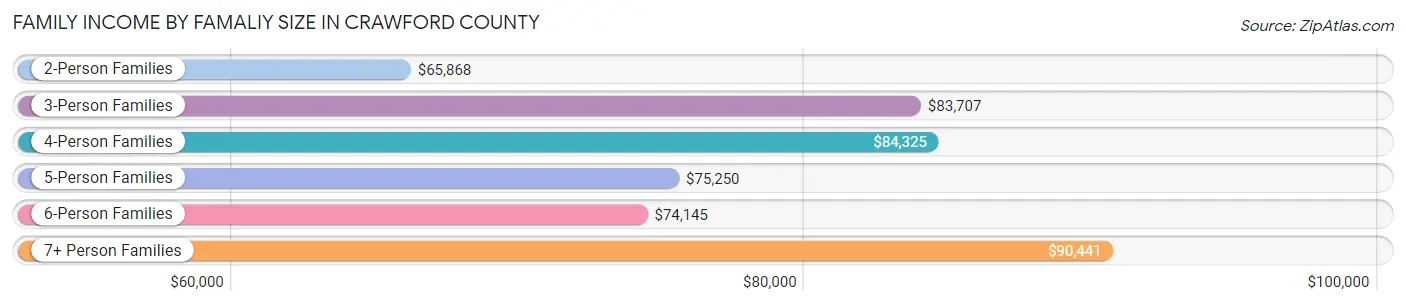
Family Income by Famaliy Size in Crawford County
7+ person families (508 | 2.4%) account for the highest median family income in Crawford County with $90,441 per family, while 2-person families (11,635 | 53.7%) have the highest median income of $32,934 per family member.
| Income Bracket | # Families | Median Income |
| 2-Person Families | 11,635 (53.7%) | $65,868 |
| 3-Person Families | 4,702 (21.7%) | $83,707 |
| 4-Person Families | 3,105 (14.3%) | $84,325 |
| 5-Person Families | 1,114 (5.1%) | $75,250 |
| 6-Person Families | 597 (2.8%) | $74,145 |
| 7+ Person Families | 508 (2.4%) | $90,441 |
| Total | 21,661 (100.0%) | $71,507 |
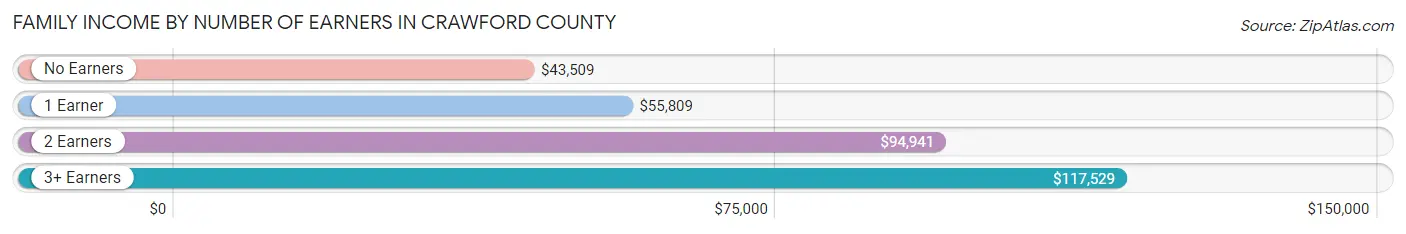
Family Income by Number of Earners in Crawford County
The median family income in Crawford County is $71,507, with families comprising 3+ earners (2,049) having the highest median family income of $117,529, while families with no earners (4,369) have the lowest median family income of $43,509, accounting for 9.5% and 20.2% of families, respectively.
| Number of Earners | # Families | Median Income |
| No Earners | 4,369 (20.2%) | $43,509 |
| 1 Earner | 7,289 (33.7%) | $55,809 |
| 2 Earners | 7,954 (36.7%) | $94,941 |
| 3+ Earners | 2,049 (9.5%) | $117,529 |
| Total | 21,661 (100.0%) | $71,507 |
Household Income in Crawford County
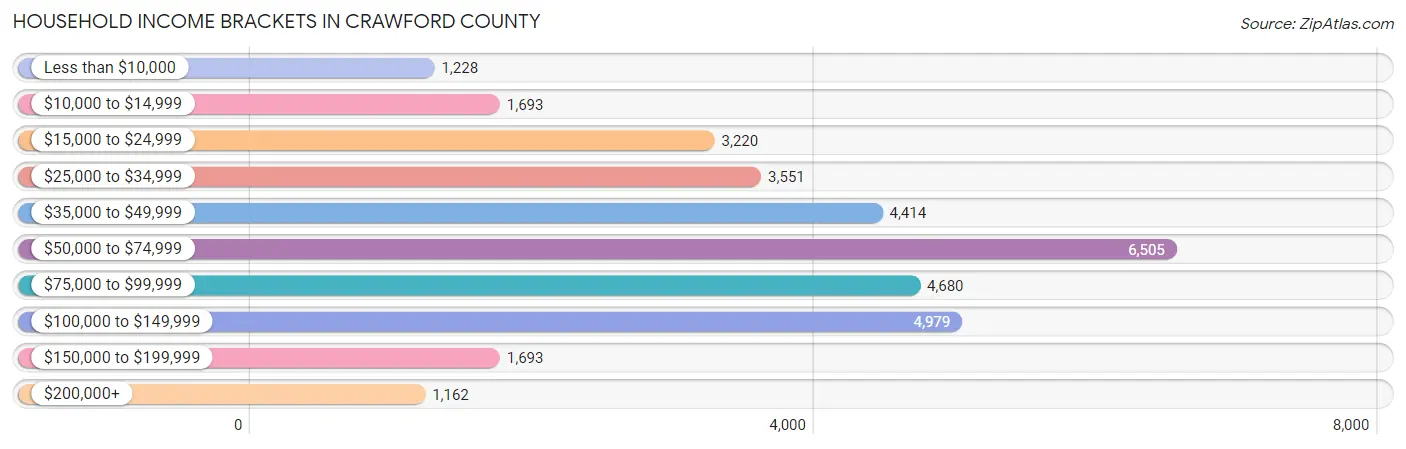
Household Income Brackets in Crawford County
With 6,505 households falling in the category, the $50,000 to $74,999 income range is the most frequent in Crawford County, accounting for 19.6% of all households. In contrast, only 1,162 households (3.5%) fall into the $200,000+ income bracket, making it the least populous group.
| Income Bracket | # Households | % Households |
| Less than $10,000 | 1,228 | 3.7% |
| $10,000 to $14,999 | 1,693 | 5.1% |
| $15,000 to $24,999 | 3,220 | 9.7% |
| $25,000 to $34,999 | 3,551 | 10.7% |
| $35,000 to $49,999 | 4,414 | 13.3% |
| $50,000 to $74,999 | 6,505 | 19.6% |
| $75,000 to $99,999 | 4,680 | 14.1% |
| $100,000 to $149,999 | 4,979 | 15.0% |
| $150,000 to $199,999 | 1,693 | 5.1% |
| $200,000+ | 1,162 | 3.5% |
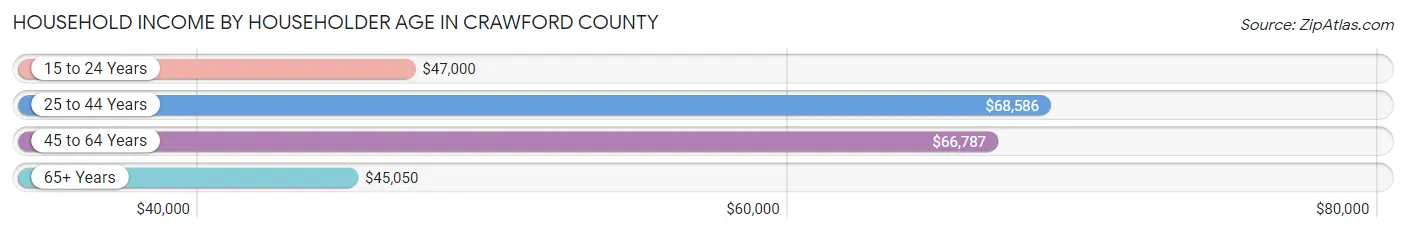
Household Income by Householder Age in Crawford County
The median household income in Crawford County is $58,734, with the highest median household income of $68,586 found in the 25 to 44 years age bracket for the primary householder. A total of 8,148 households (24.5%) fall into this category. Meanwhile, the 65+ years age bracket for the primary householder has the lowest median household income of $45,050, with 11,019 households (33.2%) in this group.
| Income Bracket | # Households | Median Income |
| 15 to 24 Years | 688 (2.1%) | $47,000 |
| 25 to 44 Years | 8,148 (24.5%) | $68,586 |
| 45 to 64 Years | 13,336 (40.2%) | $66,787 |
| 65+ Years | 11,019 (33.2%) | $45,050 |
| Total | 33,191 (100.0%) | $58,734 |
Poverty in Crawford County
Income Below Poverty by Sex and Age in Crawford County
With 11.2% poverty level for males and 14.3% for females among the residents of Crawford County, 5 year old males and 6 to 11 year old females are the most vulnerable to poverty, with 146 males (26.6%) and 603 females (22.6%) in their respective age groups living below the poverty level.
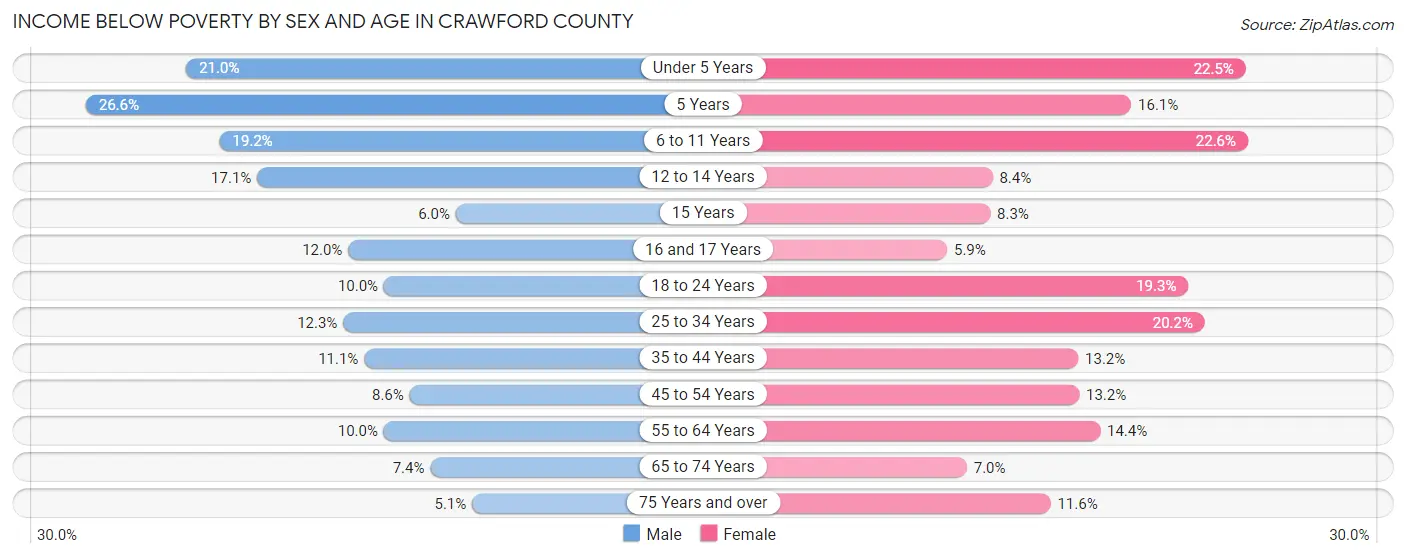
| Age Bracket | Male | Female |
| Under 5 Years | 451 (21.0%) | 500 (22.5%) |
| 5 Years | 146 (26.6%) | 67 (16.1%) |
| 6 to 11 Years | 576 (19.2%) | 603 (22.6%) |
| 12 to 14 Years | 221 (17.1%) | 119 (8.4%) |
| 15 Years | 38 (6.0%) | 37 (8.3%) |
| 16 and 17 Years | 120 (12.0%) | 63 (5.9%) |
| 18 to 24 Years | 291 (10.0%) | 544 (19.3%) |
| 25 to 34 Years | 533 (12.3%) | 850 (20.2%) |
| 35 to 44 Years | 487 (11.1%) | 580 (13.2%) |
| 45 to 54 Years | 440 (8.6%) | 671 (13.2%) |
| 55 to 64 Years | 614 (10.0%) | 880 (14.4%) |
| 65 to 74 Years | 387 (7.4%) | 372 (7.0%) |
| 75 Years and over | 162 (5.1%) | 452 (11.6%) |
| Total | 4,466 (11.2%) | 5,738 (14.3%) |
Income Above Poverty by Sex and Age in Crawford County
According to the poverty statistics in Crawford County, males aged 75 years and over and females aged 16 and 17 years are the age groups that are most secure financially, with 94.9% of males and 94.1% of females in these age groups living above the poverty line.
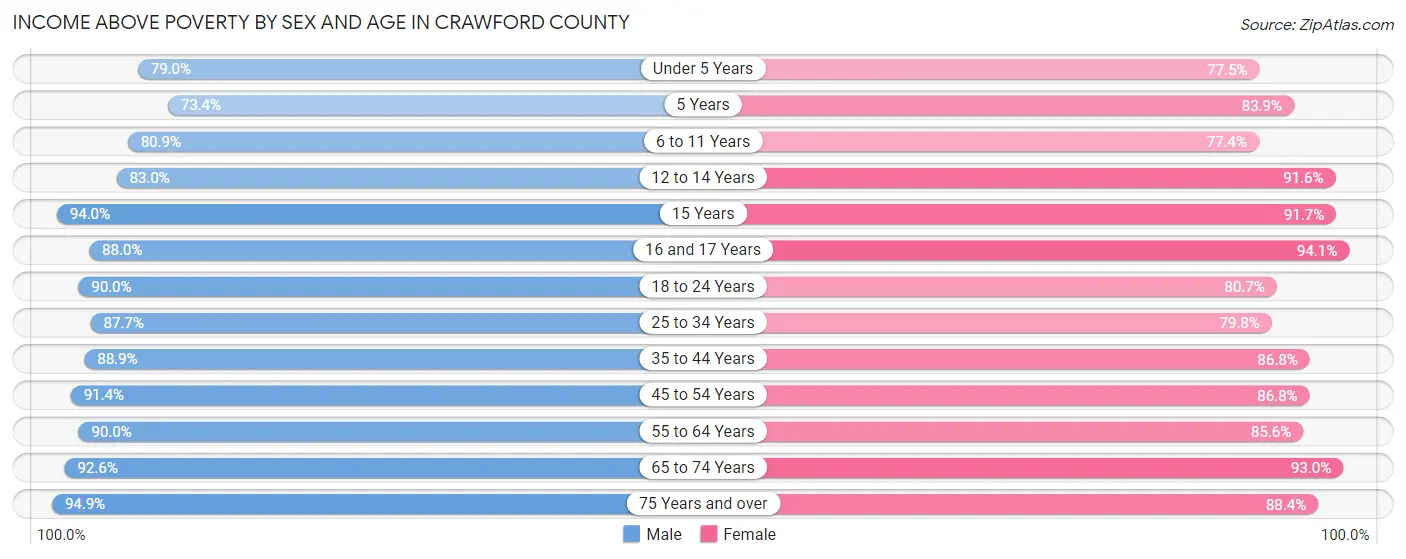
| Age Bracket | Male | Female |
| Under 5 Years | 1,696 (79.0%) | 1,723 (77.5%) |
| 5 Years | 403 (73.4%) | 349 (83.9%) |
| 6 to 11 Years | 2,432 (80.8%) | 2,064 (77.4%) |
| 12 to 14 Years | 1,075 (83.0%) | 1,299 (91.6%) |
| 15 Years | 596 (94.0%) | 411 (91.7%) |
| 16 and 17 Years | 882 (88.0%) | 1,013 (94.1%) |
| 18 to 24 Years | 2,621 (90.0%) | 2,276 (80.7%) |
| 25 to 34 Years | 3,815 (87.7%) | 3,356 (79.8%) |
| 35 to 44 Years | 3,903 (88.9%) | 3,827 (86.8%) |
| 45 to 54 Years | 4,699 (91.4%) | 4,409 (86.8%) |
| 55 to 64 Years | 5,526 (90.0%) | 5,241 (85.6%) |
| 65 to 74 Years | 4,833 (92.6%) | 4,969 (93.0%) |
| 75 Years and over | 3,027 (94.9%) | 3,438 (88.4%) |
| Total | 35,508 (88.8%) | 34,375 (85.7%) |
Income Below Poverty Among Married-Couple Families in Crawford County
The poverty statistics for married-couple families in Crawford County show that 4.2% or 676 of the total 16,262 families live below the poverty line. Families with 5 or more children have the highest poverty rate of 30.6%, comprising of 74 families. On the other hand, families with no children have the lowest poverty rate of 3.1%, which includes 340 families.
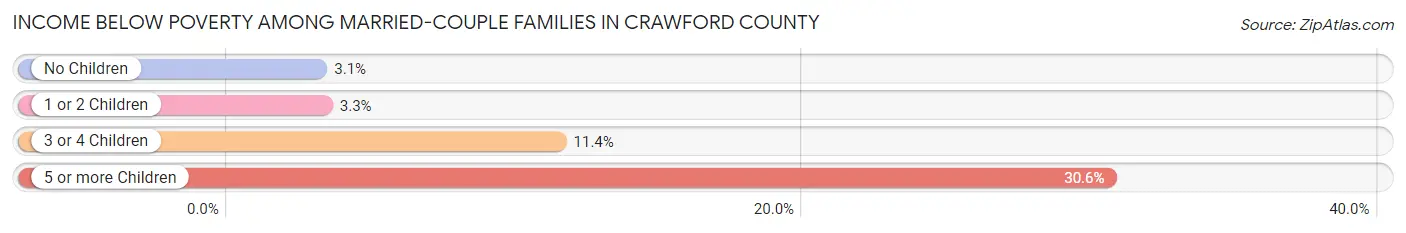
| Children | Above Poverty | Below Poverty |
| No Children | 10,609 (96.9%) | 340 (3.1%) |
| 1 or 2 Children | 3,779 (96.7%) | 129 (3.3%) |
| 3 or 4 Children | 1,030 (88.6%) | 133 (11.4%) |
| 5 or more Children | 168 (69.4%) | 74 (30.6%) |
| Total | 15,586 (95.8%) | 676 (4.2%) |
Income Below Poverty Among Single-Parent Households in Crawford County
According to the poverty data in Crawford County, 12.4% or 212 single-father households and 26.0% or 960 single-mother households are living below the poverty line. Among single-father households, those with 1 or 2 children have the highest poverty rate, with 160 households (18.5%) experiencing poverty. Likewise, among single-mother households, those with 3 or 4 children have the highest poverty rate, with 189 households (58.3%) falling below the poverty line.
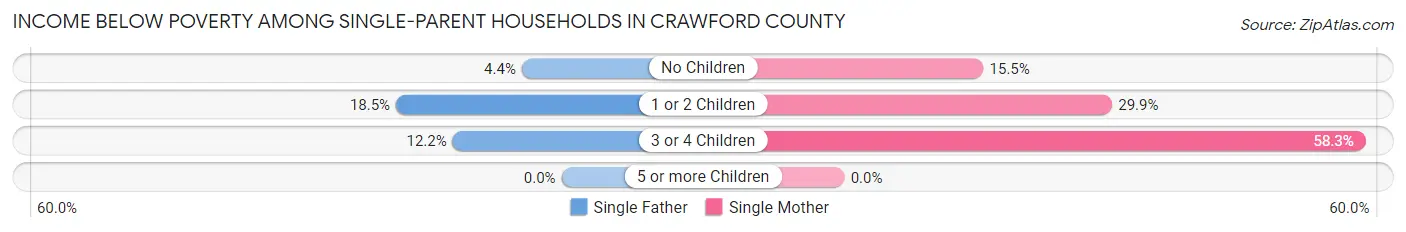
| Children | Single Father | Single Mother |
| No Children | 29 (4.4%) | 223 (15.5%) |
| 1 or 2 Children | 160 (18.5%) | 548 (29.9%) |
| 3 or 4 Children | 23 (12.2%) | 189 (58.3%) |
| 5 or more Children | 0 (0.0%) | 0 (0.0%) |
| Total | 212 (12.4%) | 960 (26.0%) |
Income Below Poverty Among Married-Couple vs Single-Parent Households in Crawford County
The poverty data for Crawford County shows that 676 of the married-couple family households (4.2%) and 1,172 of the single-parent households (21.7%) are living below the poverty level. Within the married-couple family households, those with 5 or more children have the highest poverty rate, with 74 households (30.6%) falling below the poverty line. Among the single-parent households, those with 3 or 4 children have the highest poverty rate, with 212 household (41.3%) living below poverty.
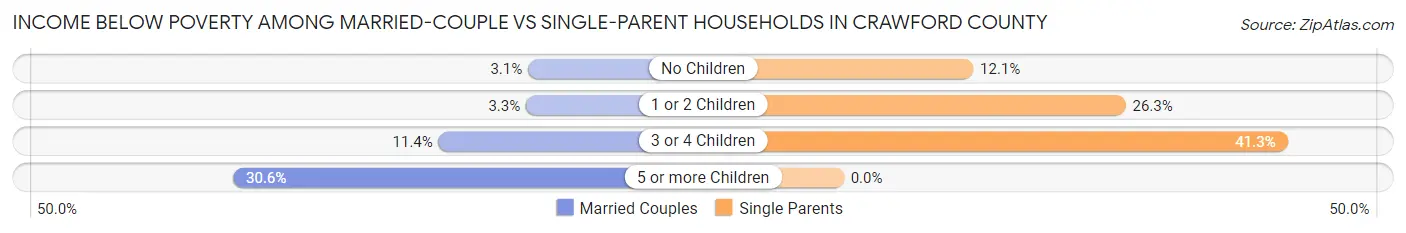
| Children | Married-Couple Families | Single-Parent Households |
| No Children | 340 (3.1%) | 252 (12.1%) |
| 1 or 2 Children | 129 (3.3%) | 708 (26.3%) |
| 3 or 4 Children | 133 (11.4%) | 212 (41.3%) |
| 5 or more Children | 74 (30.6%) | 0 (0.0%) |
| Total | 676 (4.2%) | 1,172 (21.7%) |
Race in Crawford County
The most populous races in Crawford County are White / Caucasian (78,993 | 94.2%), Two or more Races (2,498 | 3.0%), and Black / African American (1,281 | 1.5%).
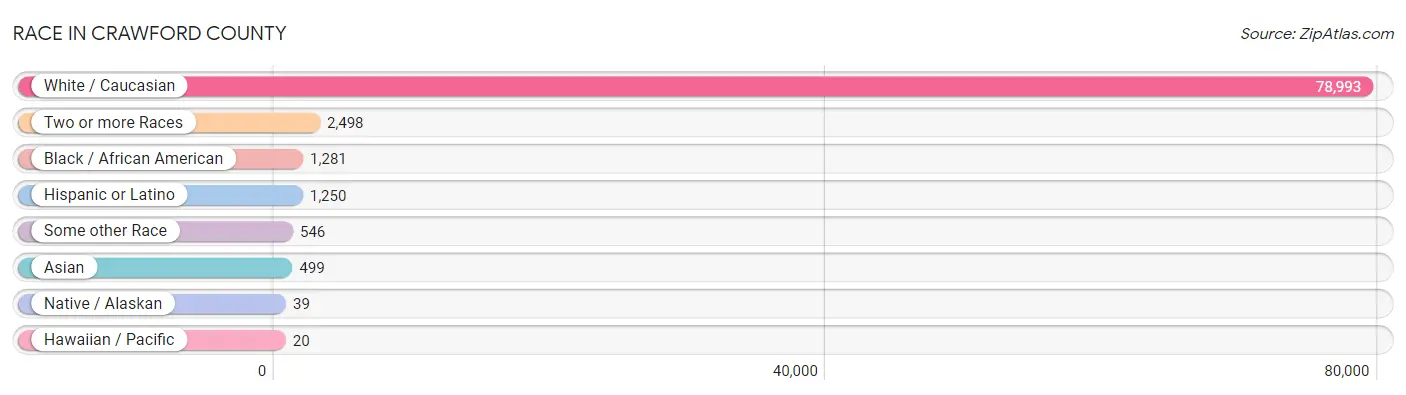
| Race | # Population | % Population |
| Asian | 499 | 0.6% |
| Black / African American | 1,281 | 1.5% |
| Hawaiian / Pacific | 20 | 0.0% |
| Hispanic or Latino | 1,250 | 1.5% |
| Native / Alaskan | 39 | 0.1% |
| White / Caucasian | 78,993 | 94.2% |
| Two or more Races | 2,498 | 3.0% |
| Some other Race | 546 | 0.6% |
| Total | 83,876 | 100.0% |
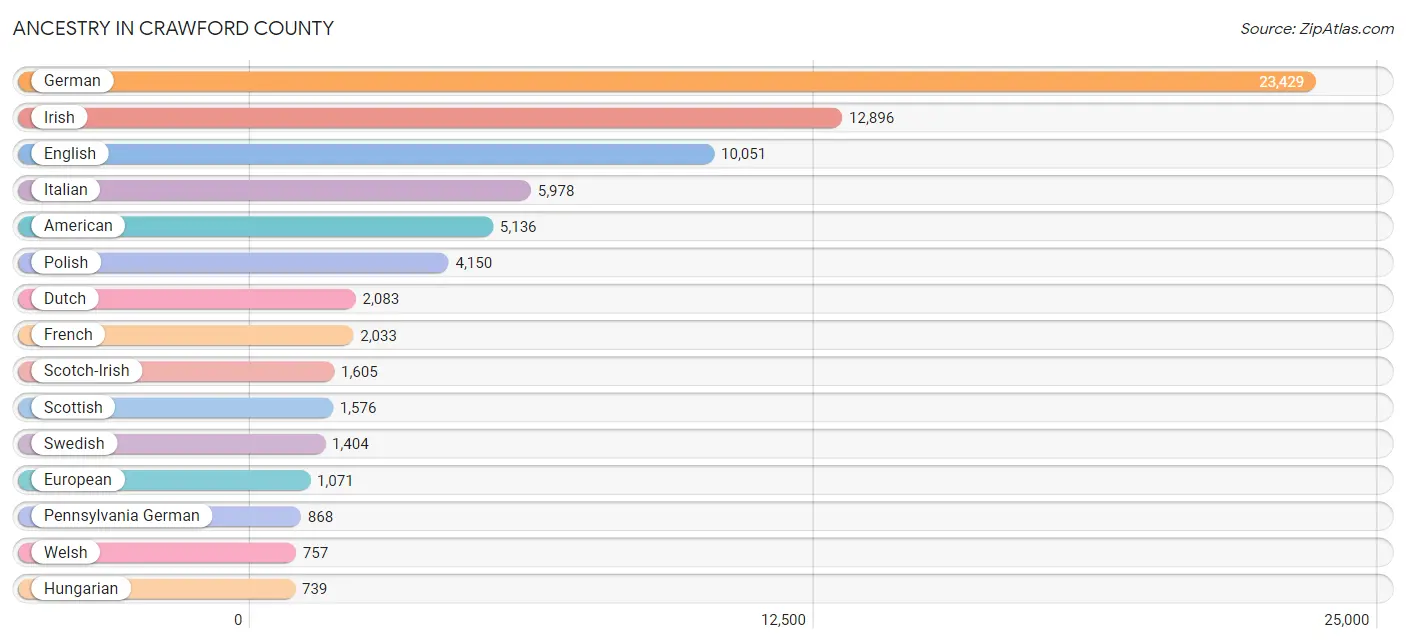
Ancestry in Crawford County
The most populous ancestries reported in Crawford County are German (23,429 | 27.9%), Irish (12,896 | 15.4%), English (10,051 | 12.0%), Italian (5,978 | 7.1%), and American (5,136 | 6.1%), together accounting for 68.5% of all Crawford County residents.
| Ancestry | # Population | % Population |
| African | 176 | 0.2% |
| Albanian | 9 | 0.0% |
| American | 5,136 | 6.1% |
| Arab | 205 | 0.2% |
| Argentinean | 6 | 0.0% |
| Australian | 29 | 0.0% |
| Austrian | 225 | 0.3% |
| Belgian | 21 | 0.0% |
| Belizean | 11 | 0.0% |
| Bhutanese | 55 | 0.1% |
| Blackfeet | 16 | 0.0% |
| Brazilian | 2 | 0.0% |
| British | 289 | 0.3% |
| Burmese | 131 | 0.2% |
| Cajun | 5 | 0.0% |
| Cambodian | 2 | 0.0% |
| Canadian | 58 | 0.1% |
| Carpatho Rusyn | 15 | 0.0% |
| Celtic | 13 | 0.0% |
| Central American | 77 | 0.1% |
| Central American Indian | 49 | 0.1% |
| Cherokee | 178 | 0.2% |
| Cheyenne | 7 | 0.0% |
| Chippewa | 2 | 0.0% |
| Choctaw | 5 | 0.0% |
| Colombian | 2 | 0.0% |
| Creek | 15 | 0.0% |
| Croatian | 149 | 0.2% |
| Crow | 5 | 0.0% |
| Cuban | 38 | 0.1% |
| Czech | 310 | 0.4% |
| Czechoslovakian | 142 | 0.2% |
| Danish | 104 | 0.1% |
| Delaware | 2 | 0.0% |
| Dominican | 15 | 0.0% |
| Dutch | 2,083 | 2.5% |
| Eastern European | 274 | 0.3% |
| Ecuadorian | 10 | 0.0% |
| Egyptian | 56 | 0.1% |
| English | 10,051 | 12.0% |
| Ethiopian | 1 | 0.0% |
| European | 1,071 | 1.3% |
| Fijian | 14 | 0.0% |
| Filipino | 5 | 0.0% |
| Finnish | 85 | 0.1% |
| French | 2,033 | 2.4% |
| French Canadian | 226 | 0.3% |
| German | 23,429 | 27.9% |
| Greek | 202 | 0.2% |
| Guatemalan | 53 | 0.1% |
| Guyanese | 51 | 0.1% |
| Haitian | 20 | 0.0% |
| Honduran | 16 | 0.0% |
| Hopi | 1 | 0.0% |
| Hungarian | 739 | 0.9% |
| Indian (Asian) | 192 | 0.2% |
| Irish | 12,896 | 15.4% |
| Iroquois | 96 | 0.1% |
| Italian | 5,978 | 7.1% |
| Jamaican | 17 | 0.0% |
| Japanese | 14 | 0.0% |
| Korean | 172 | 0.2% |
| Lebanese | 95 | 0.1% |
| Lithuanian | 206 | 0.3% |
| Lumbee | 1 | 0.0% |
| Macedonian | 2 | 0.0% |
| Malaysian | 6 | 0.0% |
| Mexican | 472 | 0.6% |
| Native Hawaiian | 60 | 0.1% |
| Navajo | 1 | 0.0% |
| New Zealander | 2 | 0.0% |
| Northern European | 83 | 0.1% |
| Norwegian | 214 | 0.3% |
| Palestinian | 39 | 0.1% |
| Pennsylvania German | 868 | 1.0% |
| Peruvian | 7 | 0.0% |
| Polish | 4,150 | 5.0% |
| Portuguese | 84 | 0.1% |
| Puerto Rican | 504 | 0.6% |
| Romanian | 51 | 0.1% |
| Russian | 212 | 0.3% |
| Salvadoran | 8 | 0.0% |
| Scandinavian | 96 | 0.1% |
| Scotch-Irish | 1,605 | 1.9% |
| Scottish | 1,576 | 1.9% |
| Seminole | 1 | 0.0% |
| Serbian | 67 | 0.1% |
| Sioux | 13 | 0.0% |
| Slavic | 202 | 0.2% |
| Slovak | 701 | 0.8% |
| Slovene | 84 | 0.1% |
| Somali | 18 | 0.0% |
| South American | 25 | 0.0% |
| Spaniard | 20 | 0.0% |
| Spanish | 9 | 0.0% |
| Sri Lankan | 104 | 0.1% |
| Subsaharan African | 202 | 0.2% |
| Swedish | 1,404 | 1.7% |
| Swiss | 726 | 0.9% |
| Syrian | 15 | 0.0% |
| Thai | 89 | 0.1% |
| Turkish | 14 | 0.0% |
| Ukrainian | 199 | 0.2% |
| Welsh | 757 | 0.9% |
| West Indian | 17 | 0.0% |
| Yugoslavian | 29 | 0.0% | View All 106 Rows |
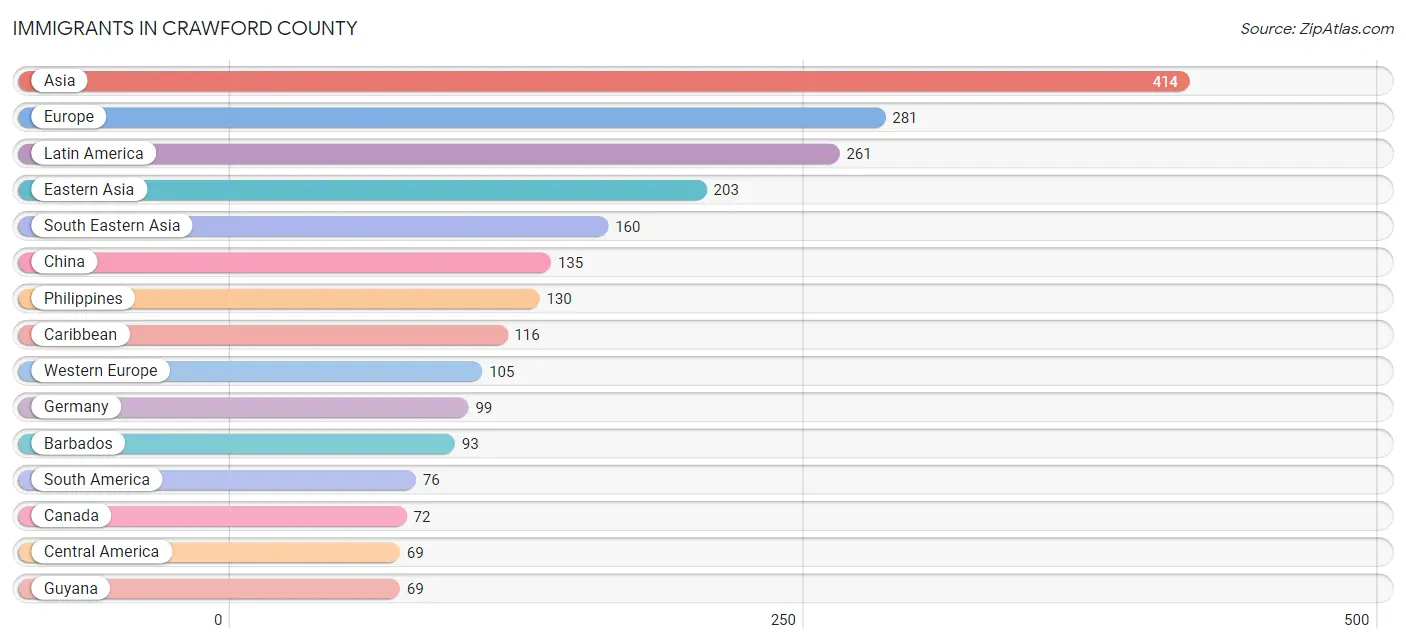
Immigrants in Crawford County
The most numerous immigrant groups reported in Crawford County came from Asia (414 | 0.5%), Europe (281 | 0.3%), Latin America (261 | 0.3%), Eastern Asia (203 | 0.2%), and South Eastern Asia (160 | 0.2%), together accounting for 1.6% of all Crawford County residents.
| Immigration Origin | # Population | % Population |
| Africa | 31 | 0.0% |
| Asia | 414 | 0.5% |
| Australia | 9 | 0.0% |
| Austria | 3 | 0.0% |
| Bangladesh | 12 | 0.0% |
| Barbados | 93 | 0.1% |
| Brazil | 2 | 0.0% |
| Cambodia | 2 | 0.0% |
| Cameroon | 4 | 0.0% |
| Canada | 72 | 0.1% |
| Caribbean | 116 | 0.1% |
| Central America | 69 | 0.1% |
| China | 135 | 0.2% |
| Cuba | 5 | 0.0% |
| Czechoslovakia | 10 | 0.0% |
| Dominican Republic | 3 | 0.0% |
| Eastern Africa | 19 | 0.0% |
| Eastern Asia | 203 | 0.2% |
| Eastern Europe | 67 | 0.1% |
| Ecuador | 1 | 0.0% |
| England | 42 | 0.1% |
| Europe | 281 | 0.3% |
| France | 3 | 0.0% |
| Germany | 99 | 0.1% |
| Greece | 8 | 0.0% |
| Guatemala | 25 | 0.0% |
| Guyana | 69 | 0.1% |
| Honduras | 7 | 0.0% |
| Hungary | 3 | 0.0% |
| India | 15 | 0.0% |
| Italy | 22 | 0.0% |
| Jamaica | 15 | 0.0% |
| Japan | 13 | 0.0% |
| Korea | 55 | 0.1% |
| Latin America | 261 | 0.3% |
| Mexico | 37 | 0.0% |
| Middle Africa | 4 | 0.0% |
| Morocco | 1 | 0.0% |
| Nigeria | 7 | 0.0% |
| Northern Africa | 1 | 0.0% |
| Northern Europe | 57 | 0.1% |
| Norway | 1 | 0.0% |
| Oceania | 9 | 0.0% |
| Peru | 4 | 0.0% |
| Philippines | 130 | 0.2% |
| Poland | 39 | 0.1% |
| Portugal | 14 | 0.0% |
| Russia | 10 | 0.0% |
| Scotland | 3 | 0.0% |
| Somalia | 19 | 0.0% |
| South America | 76 | 0.1% |
| South Central Asia | 37 | 0.0% |
| South Eastern Asia | 160 | 0.2% |
| Southern Europe | 52 | 0.1% |
| Spain | 8 | 0.0% |
| Taiwan | 6 | 0.0% |
| Thailand | 7 | 0.0% |
| Turkey | 14 | 0.0% |
| Ukraine | 3 | 0.0% |
| Uzbekistan | 10 | 0.0% |
| Vietnam | 21 | 0.0% |
| Western Africa | 7 | 0.0% |
| Western Asia | 14 | 0.0% |
| Western Europe | 105 | 0.1% | View All 64 Rows |
Sex and Age in Crawford County
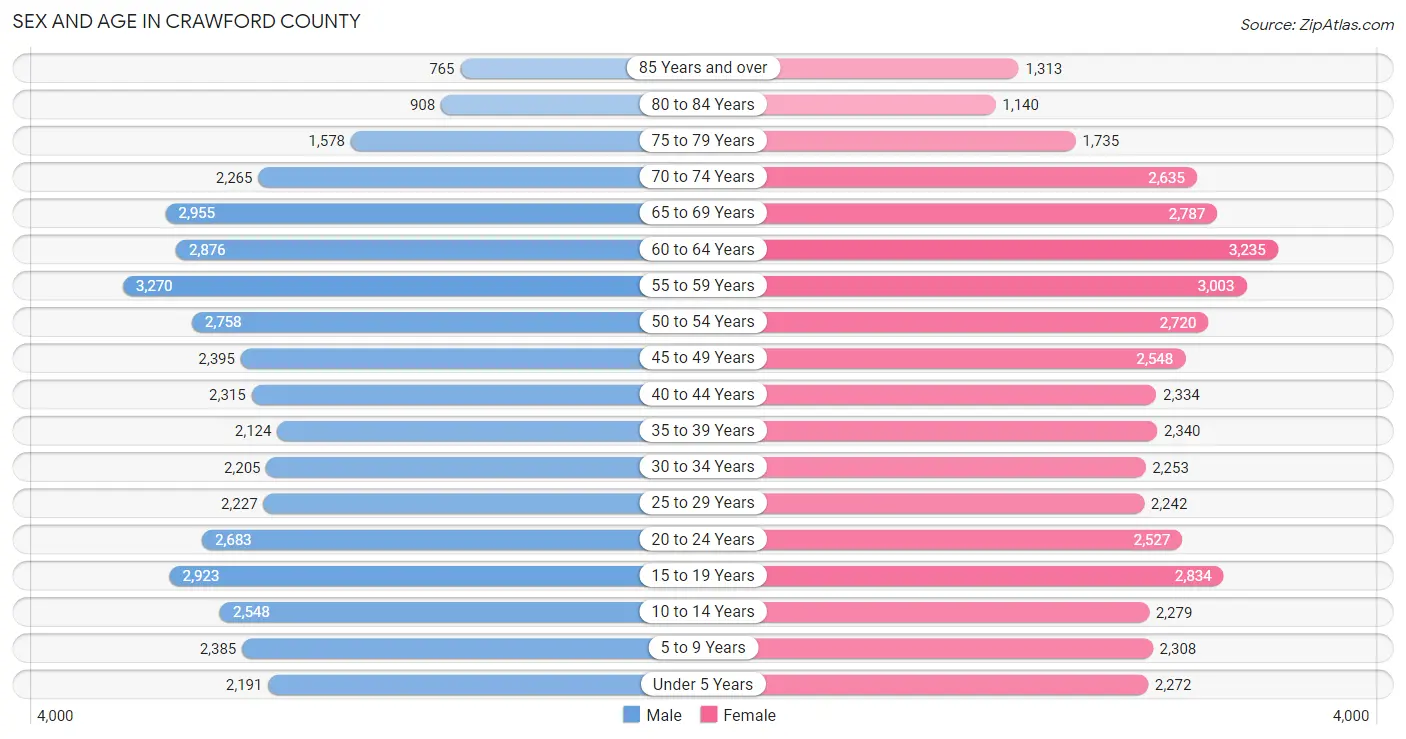
Sex and Age in Crawford County
The most populous age groups in Crawford County are 55 to 59 Years (3,270 | 7.9%) for men and 60 to 64 Years (3,235 | 7.6%) for women.
| Age Bracket | Male | Female |
| Under 5 Years | 2,191 (5.3%) | 2,272 (5.3%) |
| 5 to 9 Years | 2,385 (5.8%) | 2,308 (5.4%) |
| 10 to 14 Years | 2,548 (6.2%) | 2,279 (5.4%) |
| 15 to 19 Years | 2,923 (7.1%) | 2,834 (6.7%) |
| 20 to 24 Years | 2,683 (6.5%) | 2,527 (5.9%) |
| 25 to 29 Years | 2,227 (5.4%) | 2,242 (5.3%) |
| 30 to 34 Years | 2,205 (5.3%) | 2,253 (5.3%) |
| 35 to 39 Years | 2,124 (5.1%) | 2,340 (5.5%) |
| 40 to 44 Years | 2,315 (5.6%) | 2,334 (5.5%) |
| 45 to 49 Years | 2,395 (5.8%) | 2,548 (6.0%) |
| 50 to 54 Years | 2,758 (6.7%) | 2,720 (6.4%) |
| 55 to 59 Years | 3,270 (7.9%) | 3,003 (7.1%) |
| 60 to 64 Years | 2,876 (7.0%) | 3,235 (7.6%) |
| 65 to 69 Years | 2,955 (7.1%) | 2,787 (6.6%) |
| 70 to 74 Years | 2,265 (5.5%) | 2,635 (6.2%) |
| 75 to 79 Years | 1,578 (3.8%) | 1,735 (4.1%) |
| 80 to 84 Years | 908 (2.2%) | 1,140 (2.7%) |
| 85 Years and over | 765 (1.8%) | 1,313 (3.1%) |
| Total | 41,371 (100.0%) | 42,505 (100.0%) |
Families and Households in Crawford County
Median Family Size in Crawford County
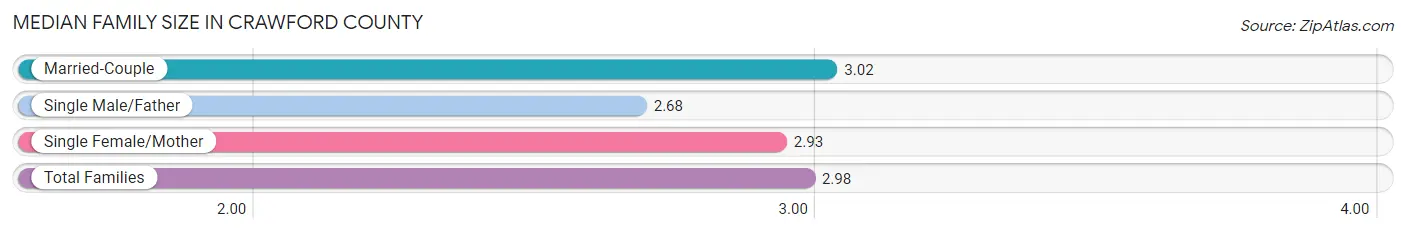
The median family size in Crawford County is 2.98 persons per family, with married-couple families (16,262 | 75.1%) accounting for the largest median family size of 3.02 persons per family. On the other hand, single male/father families (1,713 | 7.9%) represent the smallest median family size with 2.68 persons per family.
| Family Type | # Families | Family Size |
| Married-Couple | 16,262 (75.1%) | 3.02 |
| Single Male/Father | 1,713 (7.9%) | 2.68 |
| Single Female/Mother | 3,686 (17.0%) | 2.93 |
| Total Families | 21,661 (100.0%) | 2.98 |
Median Household Size in Crawford County
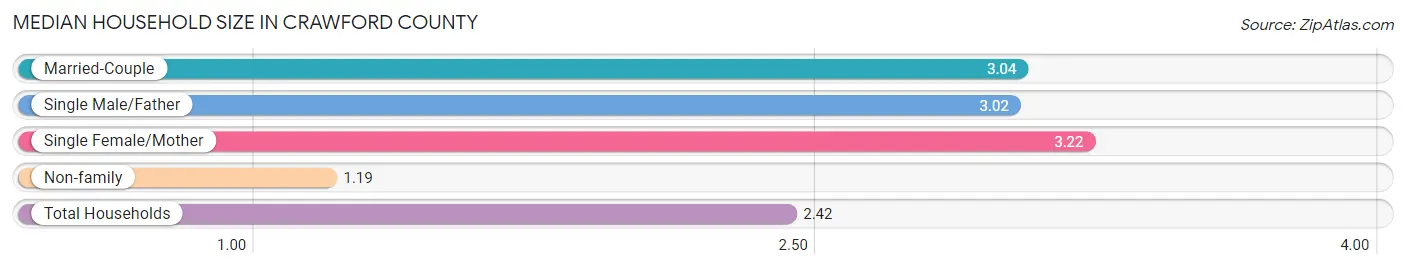
The median household size in Crawford County is 2.42 persons per household, with single female/mother households (3,686 | 11.1%) accounting for the largest median household size of 3.22 persons per household. non-family households (11,530 | 34.7%) represent the smallest median household size with 1.19 persons per household.
| Household Type | # Households | Household Size |
| Married-Couple | 16,262 (49.0%) | 3.04 |
| Single Male/Father | 1,713 (5.2%) | 3.02 |
| Single Female/Mother | 3,686 (11.1%) | 3.22 |
| Non-family | 11,530 (34.7%) | 1.19 |
| Total Households | 33,191 (100.0%) | 2.42 |
Household Size by Marriage Status in Crawford County
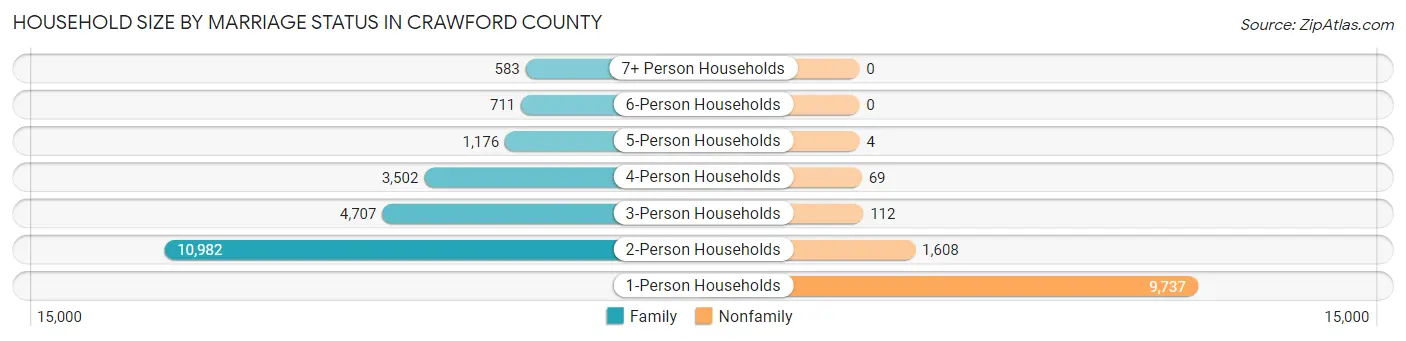
Out of a total of 33,191 households in Crawford County, 21,661 (65.3%) are family households, while 11,530 (34.7%) are nonfamily households. The most numerous type of family households are 2-person households, comprising 10,982, and the most common type of nonfamily households are 1-person households, comprising 9,737.
| Household Size | Family Households | Nonfamily Households |
| 1-Person Households | - | 9,737 (29.3%) |
| 2-Person Households | 10,982 (33.1%) | 1,608 (4.8%) |
| 3-Person Households | 4,707 (14.2%) | 112 (0.3%) |
| 4-Person Households | 3,502 (10.5%) | 69 (0.2%) |
| 5-Person Households | 1,176 (3.5%) | 4 (0.0%) |
| 6-Person Households | 711 (2.1%) | 0 (0.0%) |
| 7+ Person Households | 583 (1.8%) | 0 (0.0%) |
| Total | 21,661 (65.3%) | 11,530 (34.7%) |
Female Fertility in Crawford County
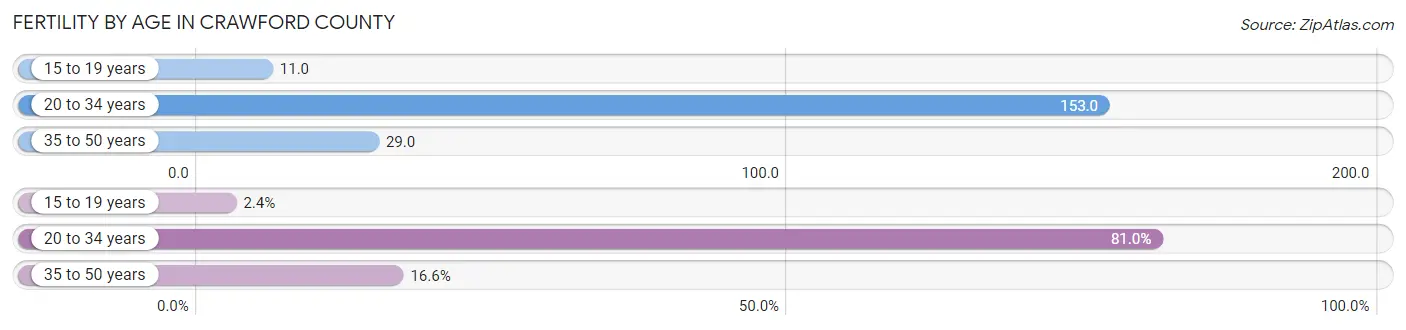
Fertility by Age in Crawford County
Average fertility rate in Crawford County is 76.0 births per 1,000 women. Women in the age bracket of 20 to 34 years have the highest fertility rate with 153.0 births per 1,000 women. Women in the age bracket of 20 to 34 years acount for 81.0% of all women with births.
| Age Bracket | Women with Births | Births / 1,000 Women |
| 15 to 19 years | 32 (2.4%) | 11.0 |
| 20 to 34 years | 1,075 (81.0%) | 153.0 |
| 35 to 50 years | 220 (16.6%) | 29.0 |
| Total | 1,327 (100.0%) | 76.0 |
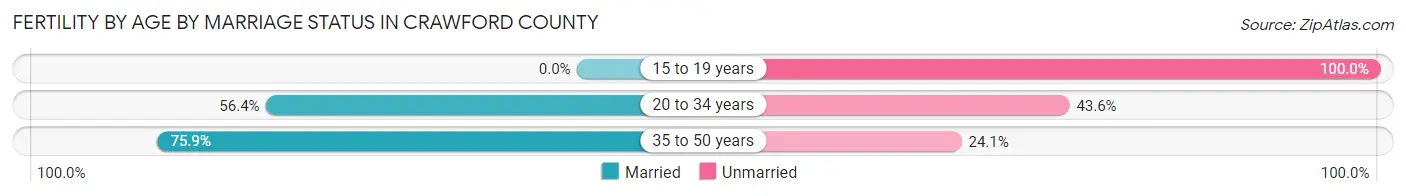
Fertility by Age by Marriage Status in Crawford County
58.3% of women with births (1,327) in Crawford County are married. The highest percentage of unmarried women with births falls into 15 to 19 years age bracket with 100.0% of them unmarried at the time of birth, while the lowest percentage of unmarried women with births belong to 35 to 50 years age bracket with 24.1% of them unmarried.
| Age Bracket | Married | Unmarried |
| 15 to 19 years | 0 (0.0%) | 32 (100.0%) |
| 20 to 34 years | 606 (56.4%) | 469 (43.6%) |
| 35 to 50 years | 167 (75.9%) | 53 (24.1%) |
| Total | 774 (58.3%) | 553 (41.7%) |
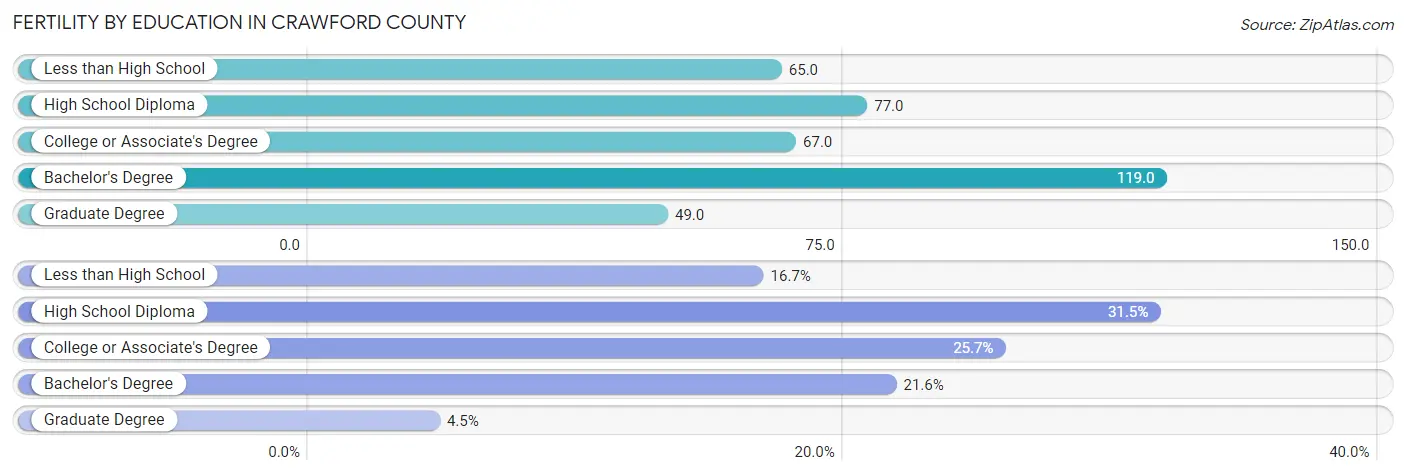
Fertility by Education in Crawford County
Average fertility rate in Crawford County is 76.0 births per 1,000 women. Women with the education attainment of bachelor's degree have the highest fertility rate of 119.0 births per 1,000 women, while women with the education attainment of graduate degree have the lowest fertility at 49.0 births per 1,000 women. Women with the education attainment of high school diploma represent 31.5% of all women with births.
| Educational Attainment | Women with Births | Births / 1,000 Women |
| Less than High School | 221 (16.7%) | 65.0 |
| High School Diploma | 418 (31.5%) | 77.0 |
| College or Associate's Degree | 341 (25.7%) | 67.0 |
| Bachelor's Degree | 287 (21.6%) | 119.0 |
| Graduate Degree | 60 (4.5%) | 49.0 |
| Total | 1,327 (100.0%) | 76.0 |
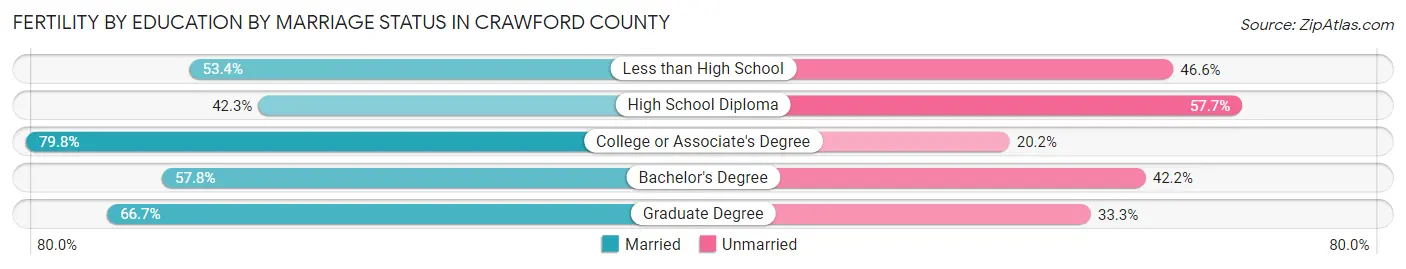
Fertility by Education by Marriage Status in Crawford County
41.7% of women with births in Crawford County are unmarried. Women with the educational attainment of college or associate's degree are most likely to be married with 79.8% of them married at childbirth, while women with the educational attainment of high school diploma are least likely to be married with 57.7% of them unmarried at childbirth.
| Educational Attainment | Married | Unmarried |
| Less than High School | 118 (53.4%) | 103 (46.6%) |
| High School Diploma | 177 (42.3%) | 241 (57.7%) |
| College or Associate's Degree | 272 (79.8%) | 69 (20.2%) |
| Bachelor's Degree | 166 (57.8%) | 121 (42.2%) |
| Graduate Degree | 40 (66.7%) | 20 (33.3%) |
| Total | 774 (58.3%) | 553 (41.7%) |
Employment Characteristics in Crawford County
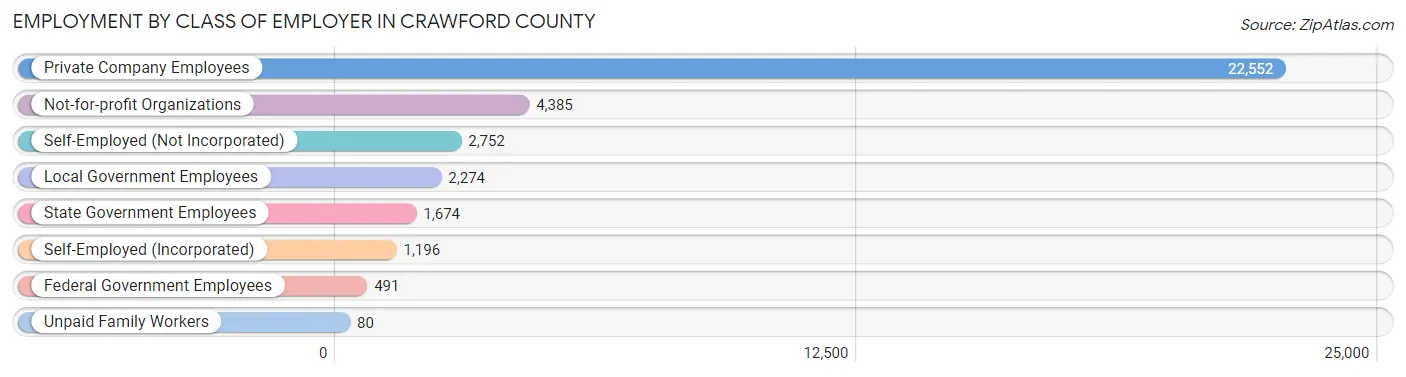
Employment by Class of Employer in Crawford County
Among the 35,404 employed individuals in Crawford County, private company employees (22,552 | 63.7%), not-for-profit organizations (4,385 | 12.4%), and self-employed (not incorporated) (2,752 | 7.8%) make up the most common classes of employment.
| Employer Class | # Employees | % Employees |
| Private Company Employees | 22,552 | 63.7% |
| Self-Employed (Incorporated) | 1,196 | 3.4% |
| Self-Employed (Not Incorporated) | 2,752 | 7.8% |
| Not-for-profit Organizations | 4,385 | 12.4% |
| Local Government Employees | 2,274 | 6.4% |
| State Government Employees | 1,674 | 4.7% |
| Federal Government Employees | 491 | 1.4% |
| Unpaid Family Workers | 80 | 0.2% |
| Total | 35,404 | 100.0% |
Employment Status by Age in Crawford County
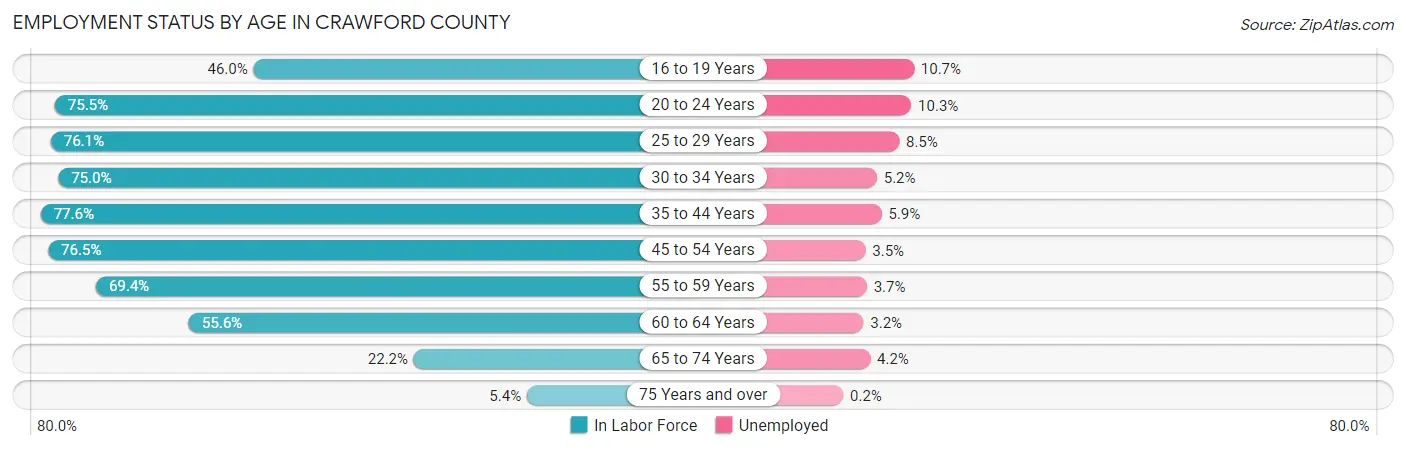
According to the labor force statistics for Crawford County, out of the total population over 16 years of age (68,806), 55.8% or 38,394 individuals are in the labor force, with 5.6% or 2,150 of them unemployed. The age group with the highest labor force participation rate is 35 to 44 years, with 77.6% or 7,072 individuals in the labor force. Within the labor force, the 16 to 19 years age range has the highest percentage of unemployed individuals, with 10.7% or 230 of them being unemployed.
| Age Bracket | In Labor Force | Unemployed |
| 16 to 19 Years | 2,148 (46.0%) | 230 (10.7%) |
| 20 to 24 Years | 3,934 (75.5%) | 405 (10.3%) |
| 25 to 29 Years | 3,401 (76.1%) | 289 (8.5%) |
| 30 to 34 Years | 3,344 (75.0%) | 174 (5.2%) |
| 35 to 44 Years | 7,072 (77.6%) | 417 (5.9%) |
| 45 to 54 Years | 7,972 (76.5%) | 279 (3.5%) |
| 55 to 59 Years | 4,353 (69.4%) | 161 (3.7%) |
| 60 to 64 Years | 3,398 (55.6%) | 109 (3.2%) |
| 65 to 74 Years | 2,363 (22.2%) | 99 (4.2%) |
| 75 Years and over | 402 (5.4%) | 1 (0.2%) |
| Total | 38,394 (55.8%) | 2,150 (5.6%) |
Employment Status by Educational Attainment in Crawford County
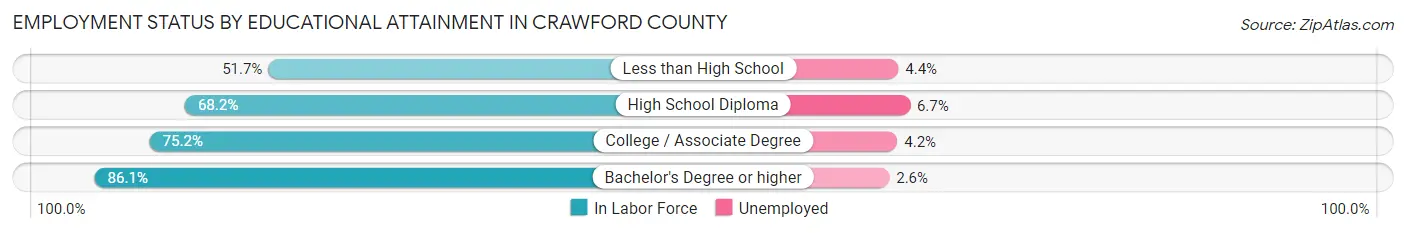
According to labor force statistics for Crawford County, 72.3% of individuals (29,531) out of the total population between 25 and 64 years of age (40,845) are in the labor force, with 4.8% or 1,417 of them being unemployed. The group with the highest labor force participation rate are those with the educational attainment of bachelor's degree or higher, with 86.1% or 7,561 individuals in the labor force. Within the labor force, individuals with high school diploma education have the highest percentage of unemployment, with 6.7% or 842 of them being unemployed.
| Educational Attainment | In Labor Force | Unemployed |
| Less than High School | 1,864 (51.7%) | 159 (4.4%) |
| High School Diploma | 12,566 (68.2%) | 1,234 (6.7%) |
| College / Associate Degree | 7,545 (75.2%) | 421 (4.2%) |
| Bachelor's Degree or higher | 7,561 (86.1%) | 228 (2.6%) |
| Total | 29,531 (72.3%) | 1,961 (4.8%) |
Employment Occupations by Sex in Crawford County
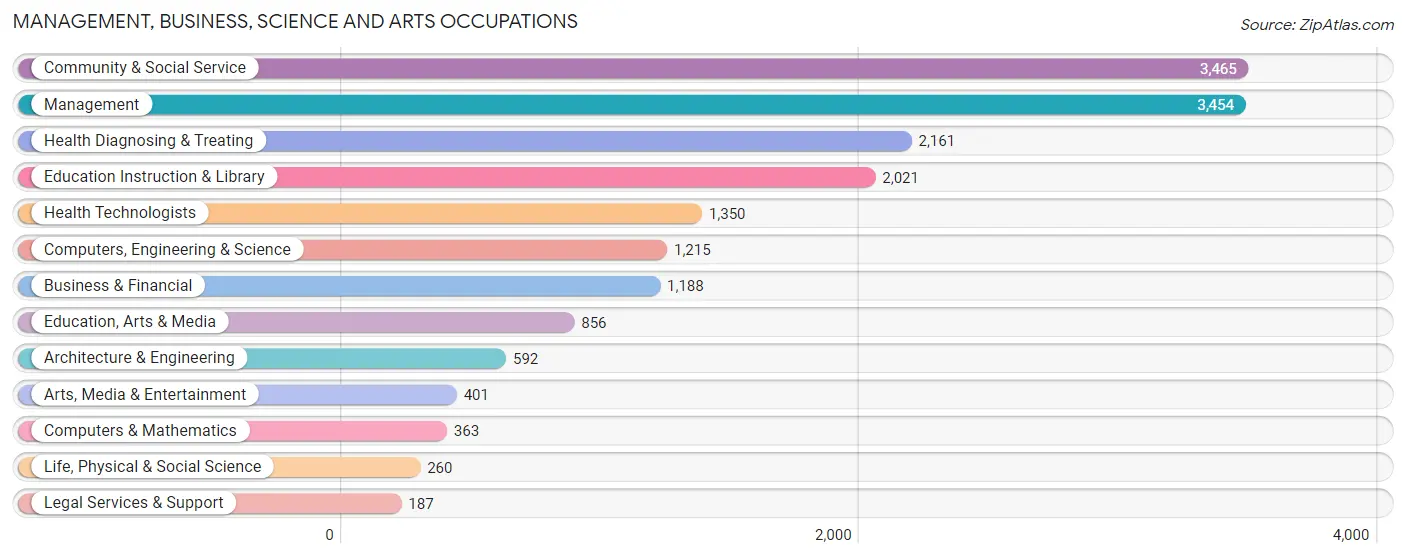
Management, Business, Science and Arts Occupations
The most common Management, Business, Science and Arts occupations in Crawford County are Community & Social Service (3,465 | 9.6%), Management (3,454 | 9.6%), Health Diagnosing & Treating (2,161 | 6.0%), Education Instruction & Library (2,021 | 5.6%), and Health Technologists (1,350 | 3.7%).
Management, Business, Science and Arts Occupations by Sex
Within the Management, Business, Science and Arts occupations in Crawford County, the most male-oriented occupations are Architecture & Engineering (93.2%), Computers, Engineering & Science (80.0%), and Computers & Mathematics (72.5%), while the most female-oriented occupations are Health Diagnosing & Treating (82.2%), Health Technologists (79.5%), and Education Instruction & Library (78.8%).
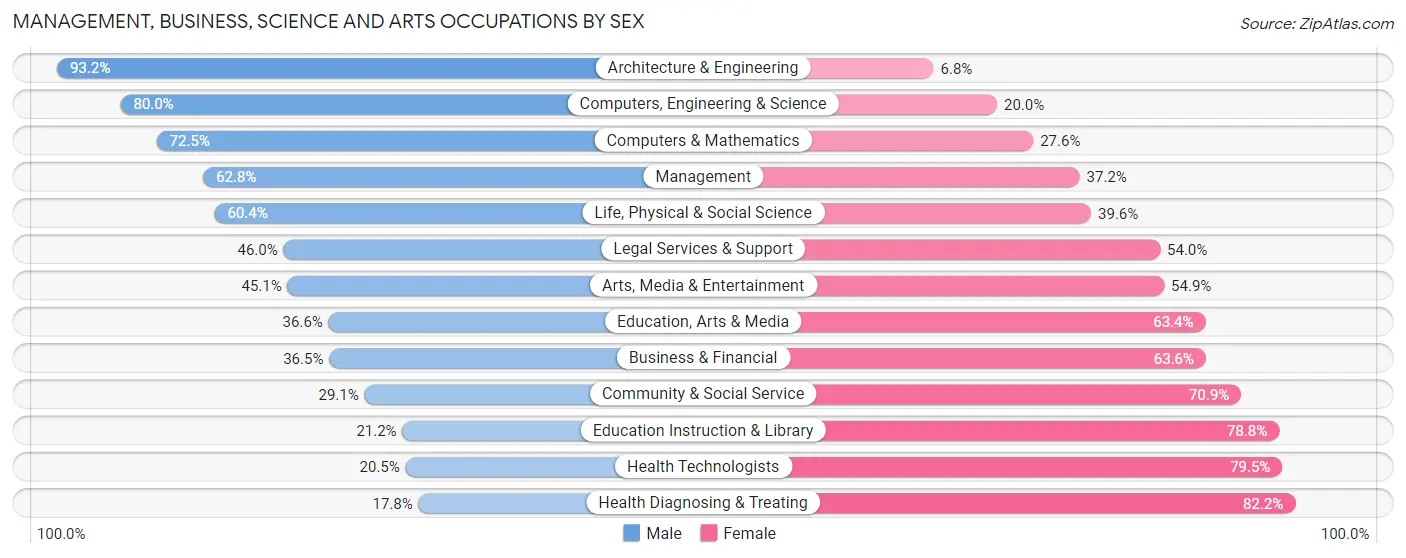
| Occupation | Male | Female |
| Management | 2,168 (62.8%) | 1,286 (37.2%) |
| Business & Financial | 433 (36.4%) | 755 (63.5%) |
| Computers, Engineering & Science | 972 (80.0%) | 243 (20.0%) |
| Computers & Mathematics | 263 (72.5%) | 100 (27.6%) |
| Architecture & Engineering | 552 (93.2%) | 40 (6.8%) |
| Life, Physical & Social Science | 157 (60.4%) | 103 (39.6%) |
| Community & Social Service | 1,008 (29.1%) | 2,457 (70.9%) |
| Education, Arts & Media | 313 (36.6%) | 543 (63.4%) |
| Legal Services & Support | 86 (46.0%) | 101 (54.0%) |
| Education Instruction & Library | 428 (21.2%) | 1,593 (78.8%) |
| Arts, Media & Entertainment | 181 (45.1%) | 220 (54.9%) |
| Health Diagnosing & Treating | 385 (17.8%) | 1,776 (82.2%) |
| Health Technologists | 277 (20.5%) | 1,073 (79.5%) |
| Total (Category) | 4,966 (43.2%) | 6,517 (56.8%) |
| Total (Overall) | 19,521 (54.0%) | 16,608 (46.0%) |
Services Occupations
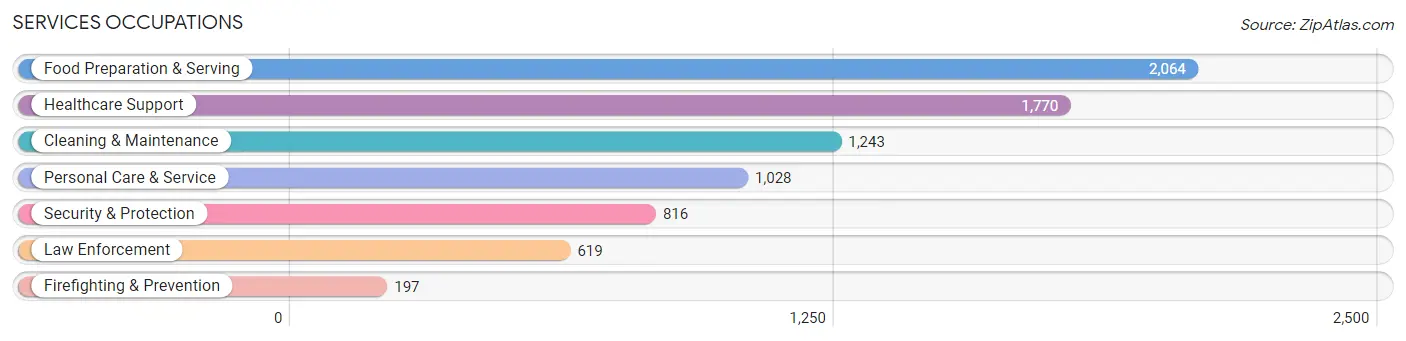
The most common Services occupations in Crawford County are Food Preparation & Serving (2,064 | 5.7%), Healthcare Support (1,770 | 4.9%), Cleaning & Maintenance (1,243 | 3.4%), Personal Care & Service (1,028 | 2.9%), and Security & Protection (816 | 2.3%).
Services Occupations by Sex
Within the Services occupations in Crawford County, the most male-oriented occupations are Law Enforcement (85.8%), Security & Protection (76.8%), and Cleaning & Maintenance (68.4%), while the most female-oriented occupations are Healthcare Support (85.1%), Personal Care & Service (72.4%), and Food Preparation & Serving (71.2%).
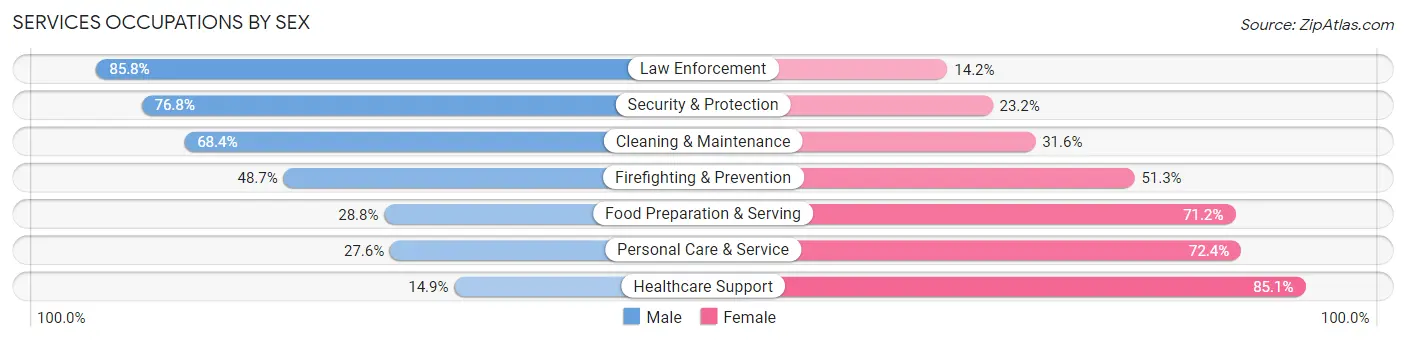
| Occupation | Male | Female |
| Healthcare Support | 264 (14.9%) | 1,506 (85.1%) |
| Security & Protection | 627 (76.8%) | 189 (23.2%) |
| Firefighting & Prevention | 96 (48.7%) | 101 (51.3%) |
| Law Enforcement | 531 (85.8%) | 88 (14.2%) |
| Food Preparation & Serving | 594 (28.8%) | 1,470 (71.2%) |
| Cleaning & Maintenance | 850 (68.4%) | 393 (31.6%) |
| Personal Care & Service | 284 (27.6%) | 744 (72.4%) |
| Total (Category) | 2,619 (37.8%) | 4,302 (62.2%) |
| Total (Overall) | 19,521 (54.0%) | 16,608 (46.0%) |
Sales and Office Occupations
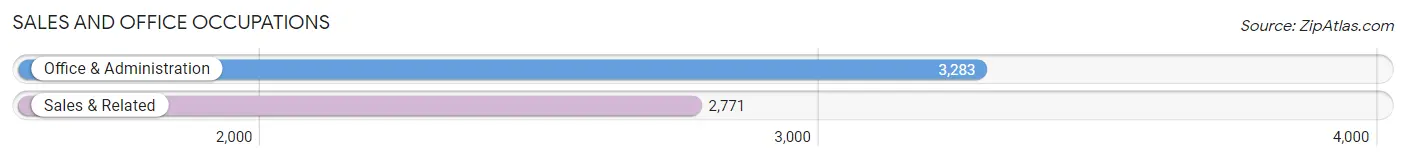
The most common Sales and Office occupations in Crawford County are Office & Administration (3,283 | 9.1%), and Sales & Related (2,771 | 7.7%).
Sales and Office Occupations by Sex
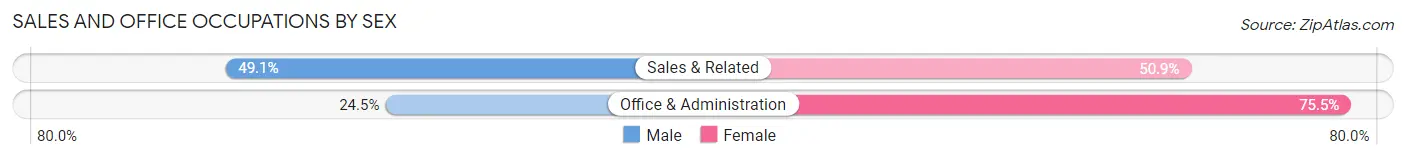
| Occupation | Male | Female |
| Sales & Related | 1,361 (49.1%) | 1,410 (50.9%) |
| Office & Administration | 805 (24.5%) | 2,478 (75.5%) |
| Total (Category) | 2,166 (35.8%) | 3,888 (64.2%) |
| Total (Overall) | 19,521 (54.0%) | 16,608 (46.0%) |
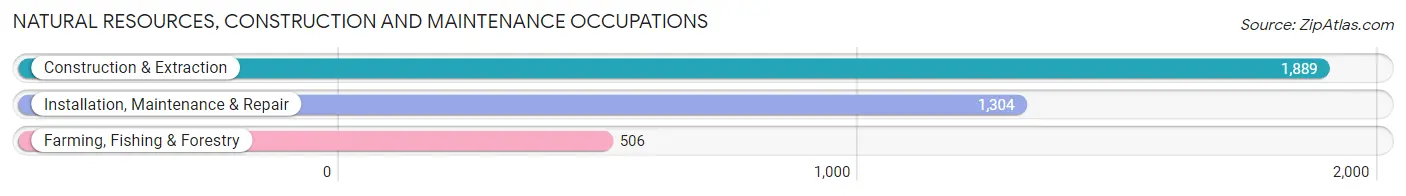
Natural Resources, Construction and Maintenance Occupations
The most common Natural Resources, Construction and Maintenance occupations in Crawford County are Construction & Extraction (1,889 | 5.2%), Installation, Maintenance & Repair (1,304 | 3.6%), and Farming, Fishing & Forestry (506 | 1.4%).
Natural Resources, Construction and Maintenance Occupations by Sex
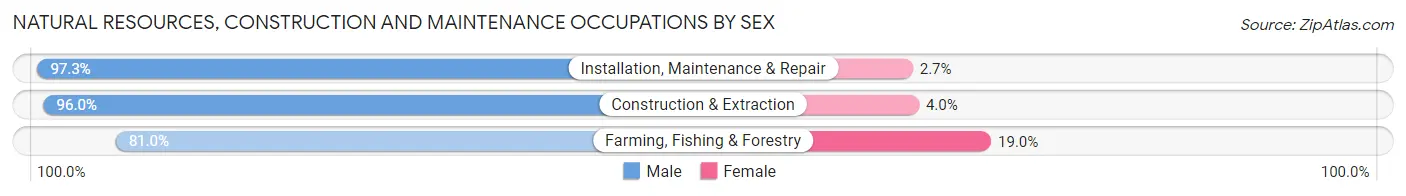
| Occupation | Male | Female |
| Farming, Fishing & Forestry | 410 (81.0%) | 96 (19.0%) |
| Construction & Extraction | 1,814 (96.0%) | 75 (4.0%) |
| Installation, Maintenance & Repair | 1,269 (97.3%) | 35 (2.7%) |
| Total (Category) | 3,493 (94.4%) | 206 (5.6%) |
| Total (Overall) | 19,521 (54.0%) | 16,608 (46.0%) |
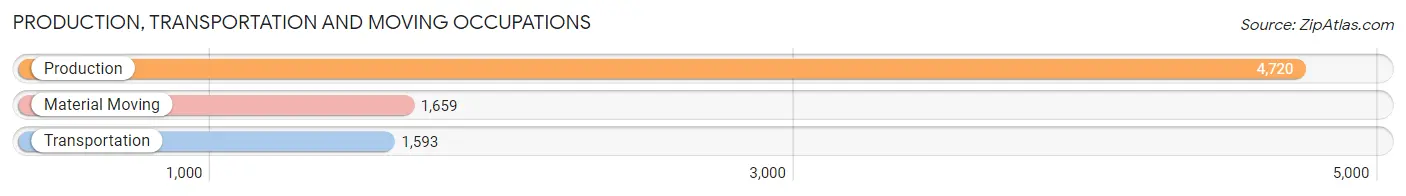
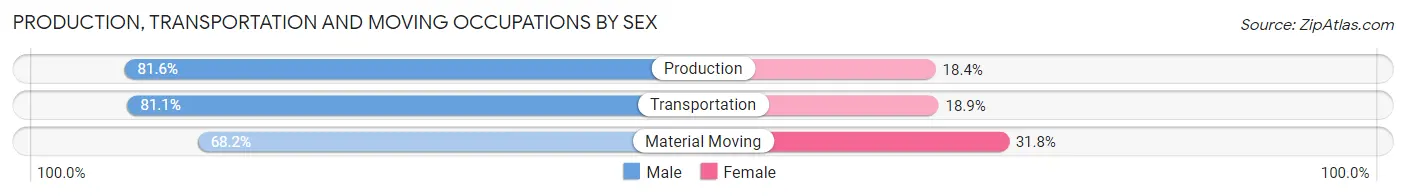
Production, Transportation and Moving Occupations
The most common Production, Transportation and Moving occupations in Crawford County are Production (4,720 | 13.1%), Material Moving (1,659 | 4.6%), and Transportation (1,593 | 4.4%).
Production, Transportation and Moving Occupations by Sex
| Occupation | Male | Female |
| Production | 3,853 (81.6%) | 867 (18.4%) |
| Transportation | 1,292 (81.1%) | 301 (18.9%) |
| Material Moving | 1,132 (68.2%) | 527 (31.8%) |
| Total (Category) | 6,277 (78.7%) | 1,695 (21.3%) |
| Total (Overall) | 19,521 (54.0%) | 16,608 (46.0%) |
Employment Industries by Sex in Crawford County
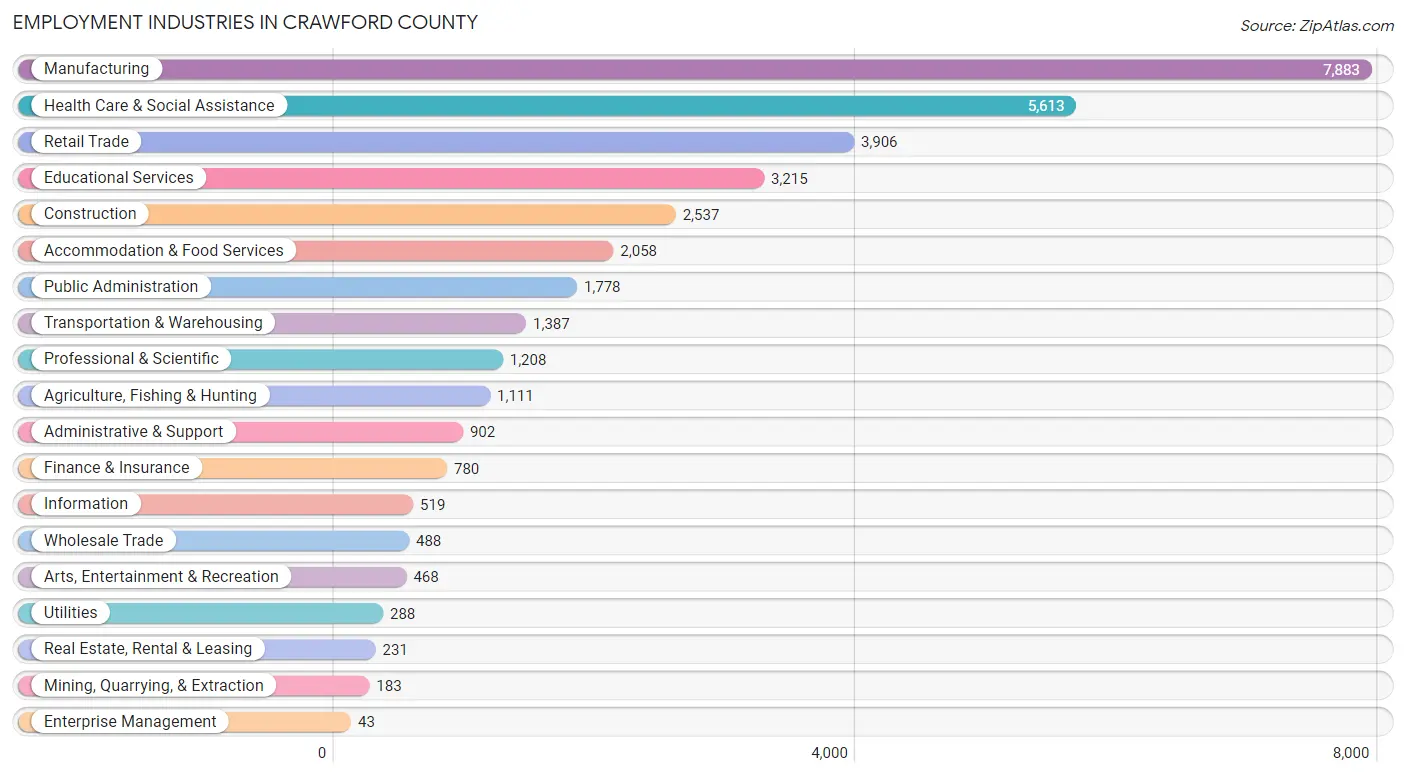
Employment Industries in Crawford County
The major employment industries in Crawford County include Manufacturing (7,883 | 21.8%), Health Care & Social Assistance (5,613 | 15.5%), Retail Trade (3,906 | 10.8%), Educational Services (3,215 | 8.9%), and Construction (2,537 | 7.0%).
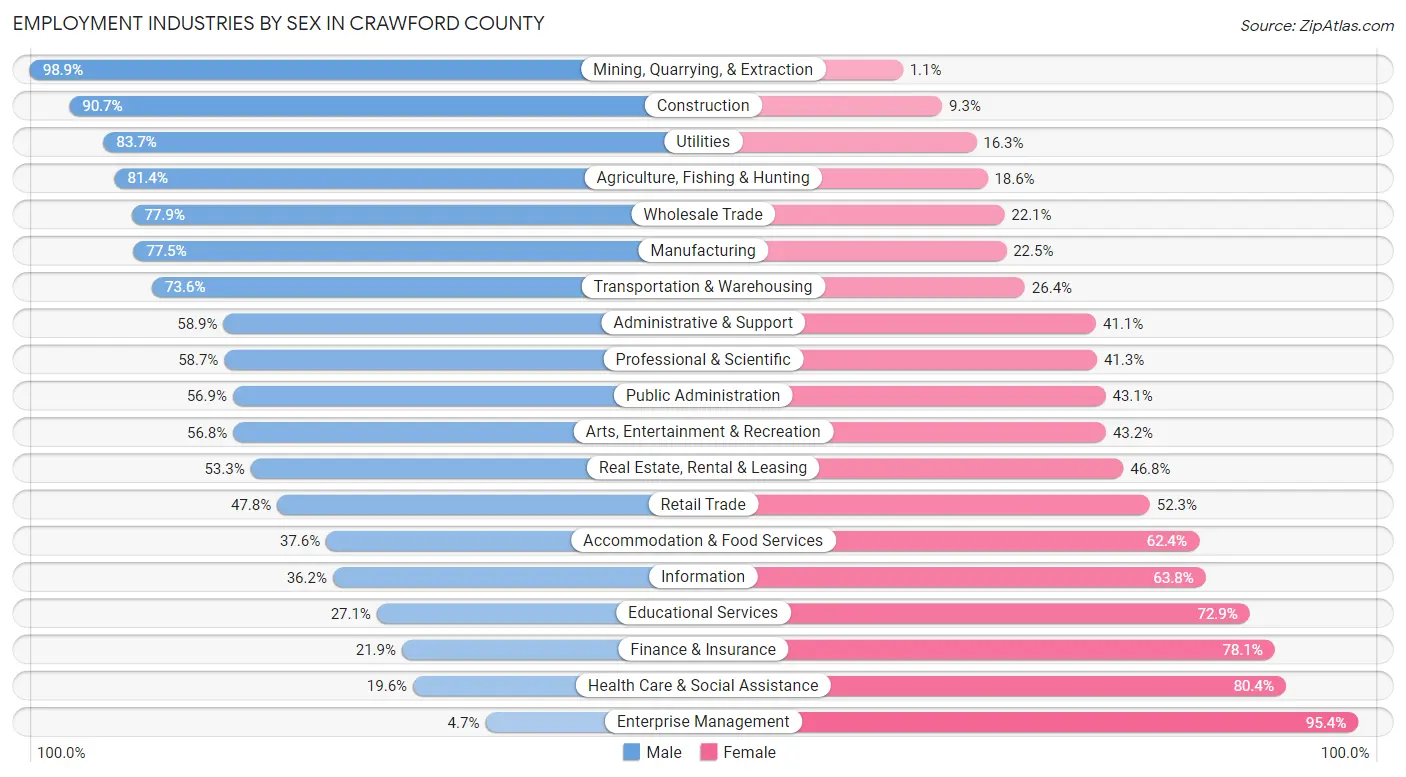
Employment Industries by Sex in Crawford County
The Crawford County industries that see more men than women are Mining, Quarrying, & Extraction (98.9%), Construction (90.7%), and Utilities (83.7%), whereas the industries that tend to have a higher number of women are Enterprise Management (95.4%), Health Care & Social Assistance (80.4%), and Finance & Insurance (78.1%).
| Industry | Male | Female |
| Agriculture, Fishing & Hunting | 904 (81.4%) | 207 (18.6%) |
| Mining, Quarrying, & Extraction | 181 (98.9%) | 2 (1.1%) |
| Construction | 2,302 (90.7%) | 235 (9.3%) |
| Manufacturing | 6,108 (77.5%) | 1,775 (22.5%) |
| Wholesale Trade | 380 (77.9%) | 108 (22.1%) |
| Retail Trade | 1,865 (47.7%) | 2,041 (52.2%) |
| Transportation & Warehousing | 1,021 (73.6%) | 366 (26.4%) |
| Utilities | 241 (83.7%) | 47 (16.3%) |
| Information | 188 (36.2%) | 331 (63.8%) |
| Finance & Insurance | 171 (21.9%) | 609 (78.1%) |
| Real Estate, Rental & Leasing | 123 (53.2%) | 108 (46.8%) |
| Professional & Scientific | 709 (58.7%) | 499 (41.3%) |
| Enterprise Management | 2 (4.6%) | 41 (95.4%) |
| Administrative & Support | 531 (58.9%) | 371 (41.1%) |
| Educational Services | 872 (27.1%) | 2,343 (72.9%) |
| Health Care & Social Assistance | 1,102 (19.6%) | 4,511 (80.4%) |
| Arts, Entertainment & Recreation | 266 (56.8%) | 202 (43.2%) |
| Accommodation & Food Services | 774 (37.6%) | 1,284 (62.4%) |
| Public Administration | 1,012 (56.9%) | 766 (43.1%) |
| Total | 19,521 (54.0%) | 16,608 (46.0%) |
Education in Crawford County
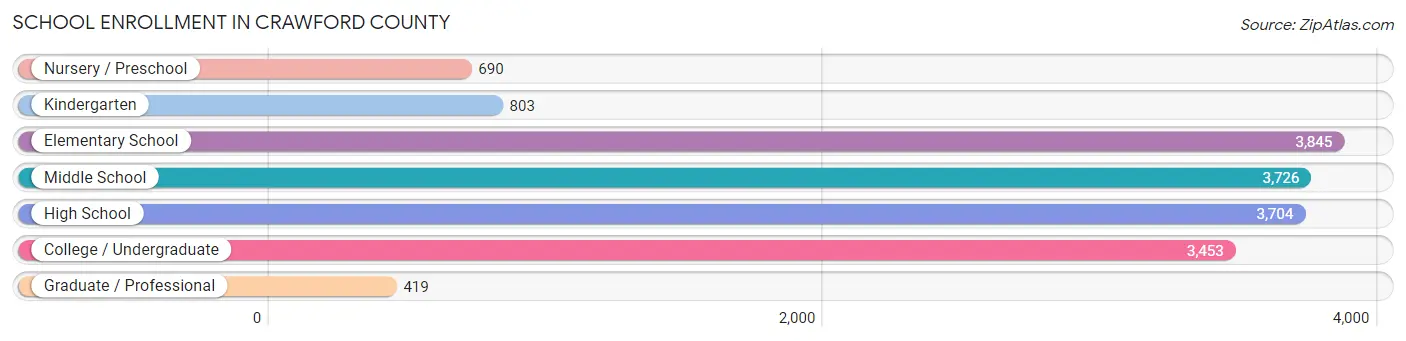
School Enrollment in Crawford County
The most common levels of schooling among the 16,640 students in Crawford County are elementary school (3,845 | 23.1%), middle school (3,726 | 22.4%), and high school (3,704 | 22.3%).
| School Level | # Students | % Students |
| Nursery / Preschool | 690 | 4.2% |
| Kindergarten | 803 | 4.8% |
| Elementary School | 3,845 | 23.1% |
| Middle School | 3,726 | 22.4% |
| High School | 3,704 | 22.3% |
| College / Undergraduate | 3,453 | 20.7% |
| Graduate / Professional | 419 | 2.5% |
| Total | 16,640 | 100.0% |
School Enrollment by Age by Funding Source in Crawford County
Out of a total of 16,640 students who are enrolled in schools in Crawford County, 4,643 (27.9%) attend a private institution, while the remaining 11,997 (72.1%) are enrolled in public schools. The age group of 20 to 24 year olds has the highest likelihood of being enrolled in private schools, with 1,165 (67.4% in the age bracket) enrolled. Conversely, the age group of 15 to 17 year olds has the lowest likelihood of being enrolled in a private school, with 2,478 (89.3% in the age bracket) attending a public institution.
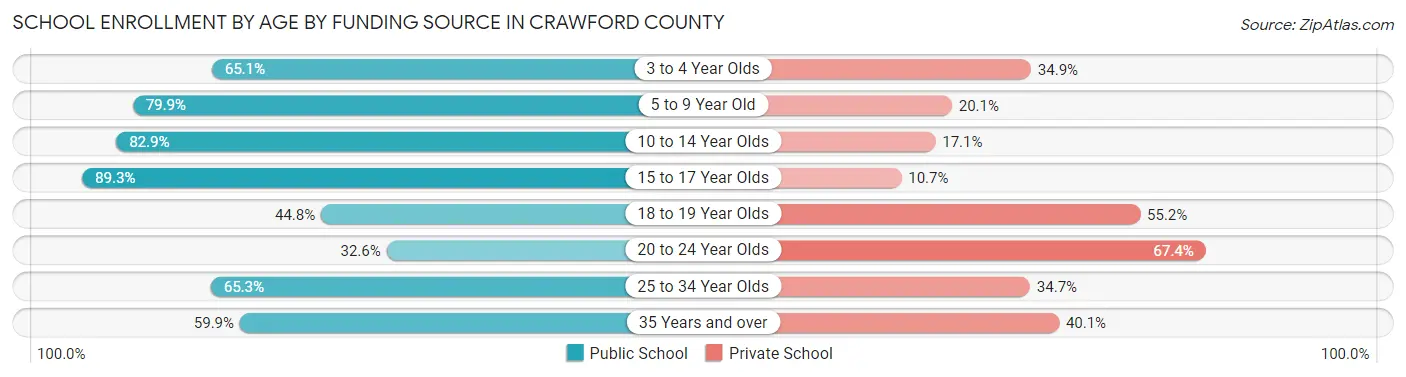
| Age Bracket | Public School | Private School |
| 3 to 4 Year Olds | 336 (65.1%) | 180 (34.9%) |
| 5 to 9 Year Old | 3,263 (79.9%) | 823 (20.1%) |
| 10 to 14 Year Olds | 3,955 (82.9%) | 814 (17.1%) |
| 15 to 17 Year Olds | 2,478 (89.3%) | 298 (10.7%) |
| 18 to 19 Year Olds | 820 (44.8%) | 1,011 (55.2%) |
| 20 to 24 Year Olds | 563 (32.6%) | 1,165 (67.4%) |
| 25 to 34 Year Olds | 224 (65.3%) | 119 (34.7%) |
| 35 Years and over | 354 (59.9%) | 237 (40.1%) |
| Total | 11,997 (72.1%) | 4,643 (27.9%) |
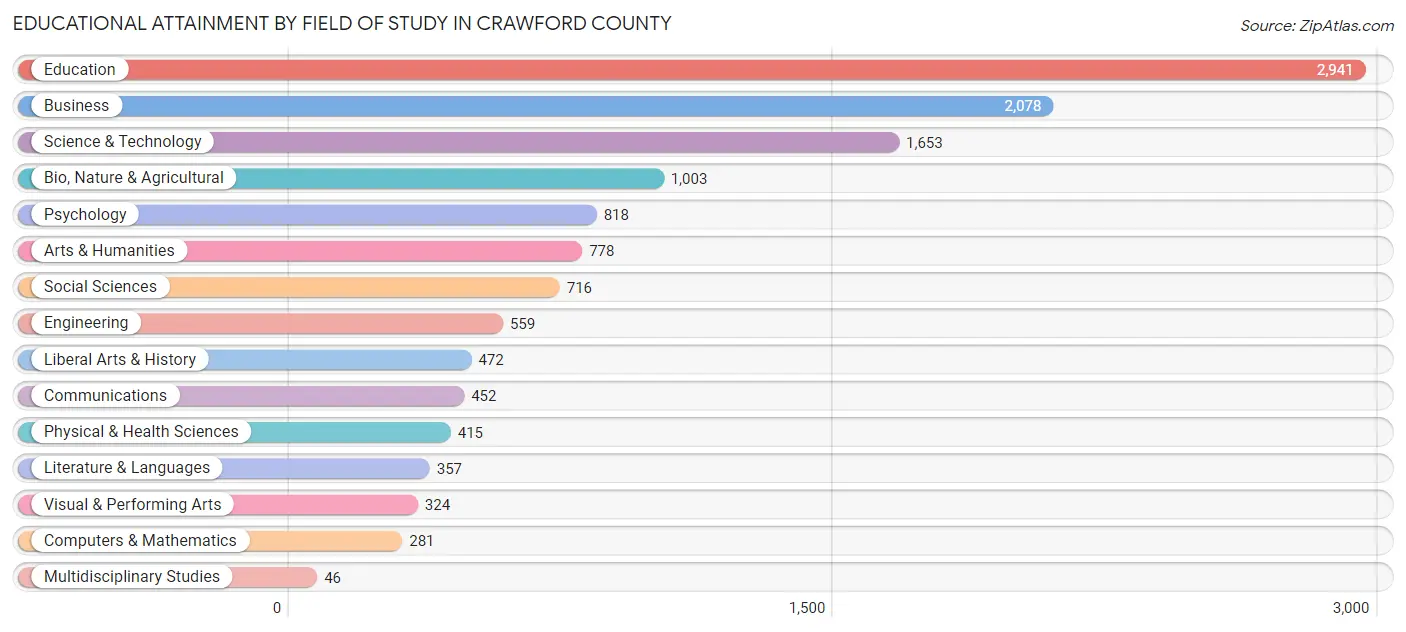
Educational Attainment by Field of Study in Crawford County
Education (2,941 | 22.8%), business (2,078 | 16.1%), science & technology (1,653 | 12.8%), bio, nature & agricultural (1,003 | 7.8%), and psychology (818 | 6.3%) are the most common fields of study among 12,893 individuals in Crawford County who have obtained a bachelor's degree or higher.
| Field of Study | # Graduates | % Graduates |
| Computers & Mathematics | 281 | 2.2% |
| Bio, Nature & Agricultural | 1,003 | 7.8% |
| Physical & Health Sciences | 415 | 3.2% |
| Psychology | 818 | 6.3% |
| Social Sciences | 716 | 5.6% |
| Engineering | 559 | 4.3% |
| Multidisciplinary Studies | 46 | 0.4% |
| Science & Technology | 1,653 | 12.8% |
| Business | 2,078 | 16.1% |
| Education | 2,941 | 22.8% |
| Literature & Languages | 357 | 2.8% |
| Liberal Arts & History | 472 | 3.7% |
| Visual & Performing Arts | 324 | 2.5% |
| Communications | 452 | 3.5% |
| Arts & Humanities | 778 | 6.0% |
| Total | 12,893 | 100.0% |
Transportation & Commute in Crawford County
Vehicle Availability by Sex in Crawford County
The most prevalent vehicle ownership categories in Crawford County are males with 2 vehicles (8,415, accounting for 44.2%) and females with 2 vehicles (7,213, making up 54.2%).
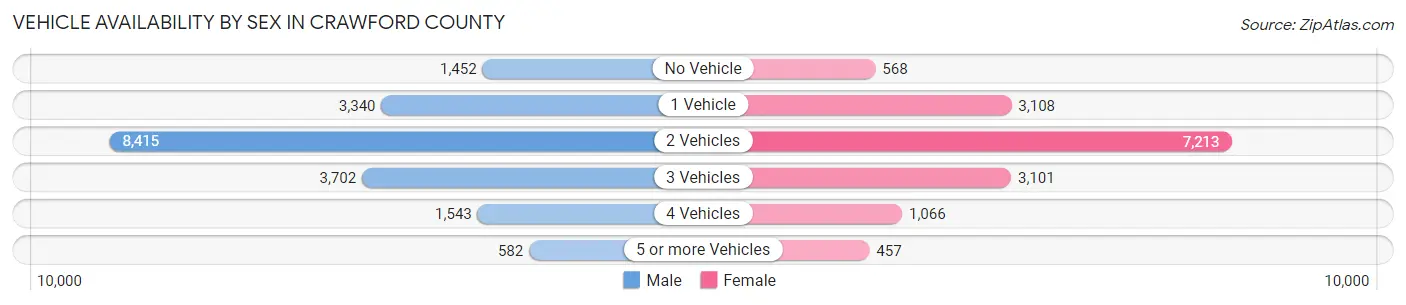
| Vehicles Available | Male | Female |
| No Vehicle | 1,452 (7.6%) | 568 (3.7%) |
| 1 Vehicle | 3,340 (17.5%) | 3,108 (20.0%) |
| 2 Vehicles | 8,415 (44.2%) | 7,213 (46.5%) |
| 3 Vehicles | 3,702 (19.5%) | 3,101 (20.0%) |
| 4 Vehicles | 1,543 (8.1%) | 1,066 (6.9%) |
| 5 or more Vehicles | 582 (3.1%) | 457 (2.9%) |
| Total | 19,034 (100.0%) | 15,513 (100.0%) |
Commute Time in Crawford County
The most frequently occuring commute durations in Crawford County are 5 to 9 minutes (5,614 commuters, 17.0%), 15 to 19 minutes (5,206 commuters, 15.7%), and 10 to 14 minutes (5,184 commuters, 15.7%).
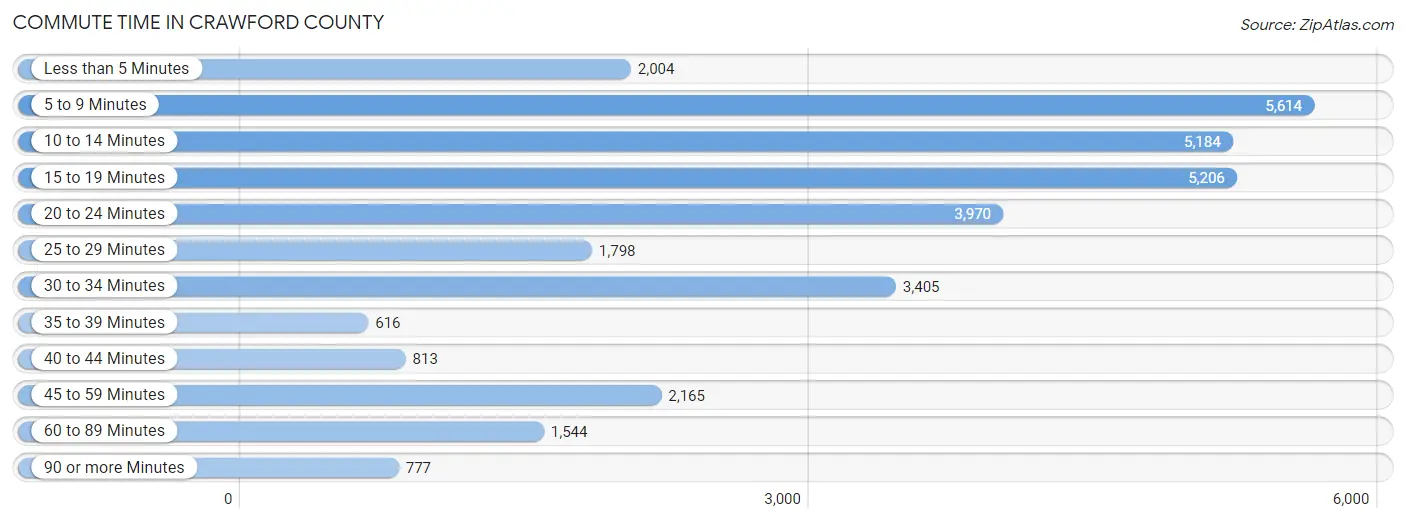
| Commute Time | # Commuters | % Commuters |
| Less than 5 Minutes | 2,004 | 6.1% |
| 5 to 9 Minutes | 5,614 | 17.0% |
| 10 to 14 Minutes | 5,184 | 15.7% |
| 15 to 19 Minutes | 5,206 | 15.7% |
| 20 to 24 Minutes | 3,970 | 12.0% |
| 25 to 29 Minutes | 1,798 | 5.4% |
| 30 to 34 Minutes | 3,405 | 10.3% |
| 35 to 39 Minutes | 616 | 1.9% |
| 40 to 44 Minutes | 813 | 2.5% |
| 45 to 59 Minutes | 2,165 | 6.5% |
| 60 to 89 Minutes | 1,544 | 4.7% |
| 90 or more Minutes | 777 | 2.4% |
Commute Time by Sex in Crawford County
The most common commute times in Crawford County are 5 to 9 minutes (3,122 commuters, 17.2%) for males and 10 to 14 minutes (2,751 commuters, 18.3%) for females.
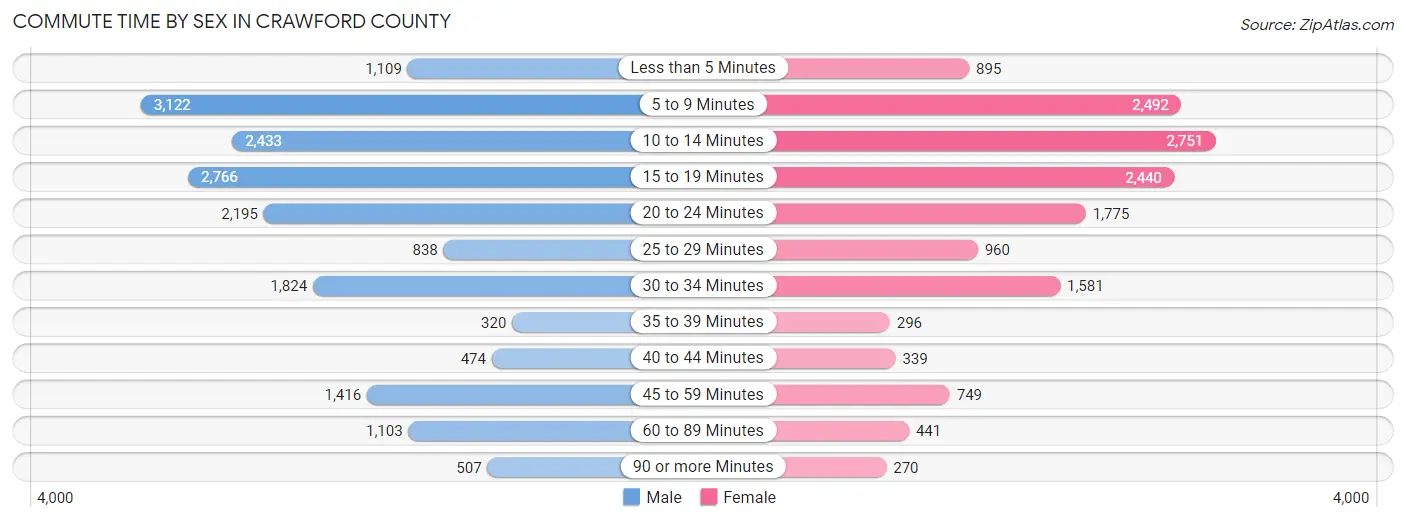
| Commute Time | Male | Female |
| Less than 5 Minutes | 1,109 (6.1%) | 895 (6.0%) |
| 5 to 9 Minutes | 3,122 (17.2%) | 2,492 (16.6%) |
| 10 to 14 Minutes | 2,433 (13.4%) | 2,751 (18.3%) |
| 15 to 19 Minutes | 2,766 (15.3%) | 2,440 (16.3%) |
| 20 to 24 Minutes | 2,195 (12.1%) | 1,775 (11.8%) |
| 25 to 29 Minutes | 838 (4.6%) | 960 (6.4%) |
| 30 to 34 Minutes | 1,824 (10.1%) | 1,581 (10.5%) |
| 35 to 39 Minutes | 320 (1.8%) | 296 (2.0%) |
| 40 to 44 Minutes | 474 (2.6%) | 339 (2.3%) |
| 45 to 59 Minutes | 1,416 (7.8%) | 749 (5.0%) |
| 60 to 89 Minutes | 1,103 (6.1%) | 441 (2.9%) |
| 90 or more Minutes | 507 (2.8%) | 270 (1.8%) |
Time of Departure to Work by Sex in Crawford County
The most frequent times of departure to work in Crawford County are 6:30 AM to 6:59 AM (2,297, 12.7%) for males and 7:00 AM to 7:29 AM (2,526, 16.9%) for females.
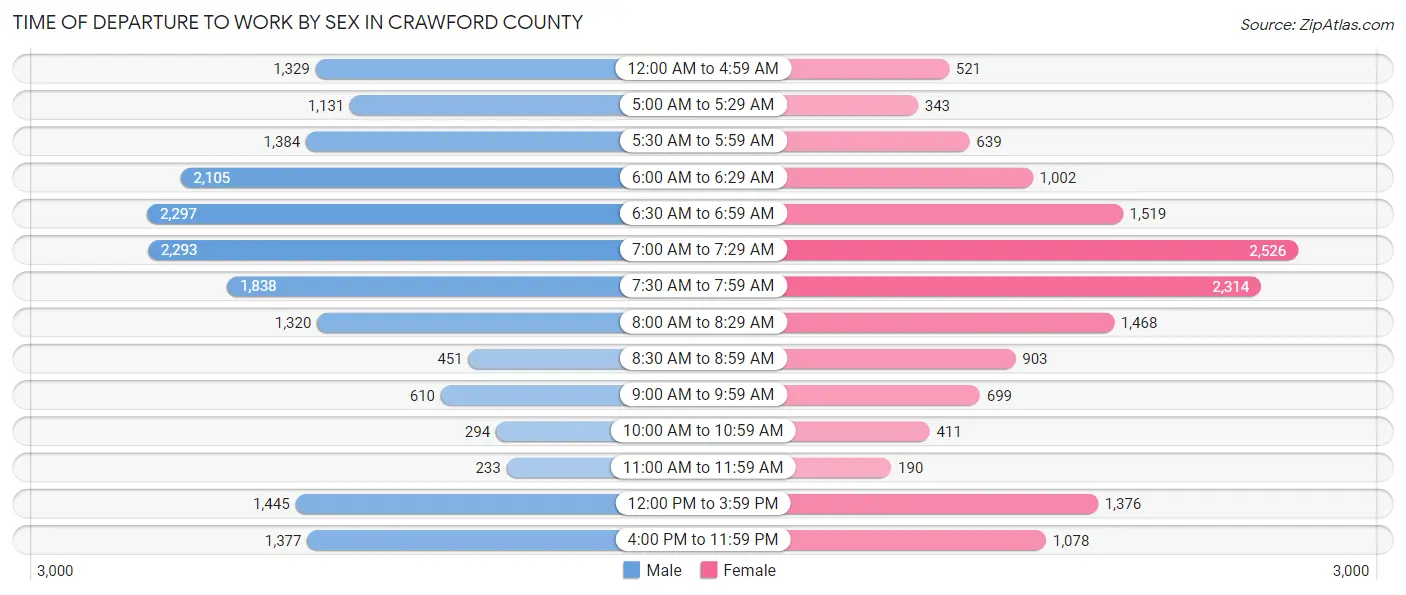
| Time of Departure | Male | Female |
| 12:00 AM to 4:59 AM | 1,329 (7.3%) | 521 (3.5%) |
| 5:00 AM to 5:29 AM | 1,131 (6.2%) | 343 (2.3%) |
| 5:30 AM to 5:59 AM | 1,384 (7.6%) | 639 (4.3%) |
| 6:00 AM to 6:29 AM | 2,105 (11.6%) | 1,002 (6.7%) |
| 6:30 AM to 6:59 AM | 2,297 (12.7%) | 1,519 (10.1%) |
| 7:00 AM to 7:29 AM | 2,293 (12.7%) | 2,526 (16.9%) |
| 7:30 AM to 7:59 AM | 1,838 (10.2%) | 2,314 (15.4%) |
| 8:00 AM to 8:29 AM | 1,320 (7.3%) | 1,468 (9.8%) |
| 8:30 AM to 8:59 AM | 451 (2.5%) | 903 (6.0%) |
| 9:00 AM to 9:59 AM | 610 (3.4%) | 699 (4.7%) |
| 10:00 AM to 10:59 AM | 294 (1.6%) | 411 (2.7%) |
| 11:00 AM to 11:59 AM | 233 (1.3%) | 190 (1.3%) |
| 12:00 PM to 3:59 PM | 1,445 (8.0%) | 1,376 (9.2%) |
| 4:00 PM to 11:59 PM | 1,377 (7.6%) | 1,078 (7.2%) |
| Total | 18,107 (100.0%) | 14,989 (100.0%) |
Housing Occupancy in Crawford County
Occupancy by Ownership in Crawford County
Of the total 33,191 dwellings in Crawford County, owner-occupied units account for 24,485 (73.8%), while renter-occupied units make up 8,706 (26.2%).
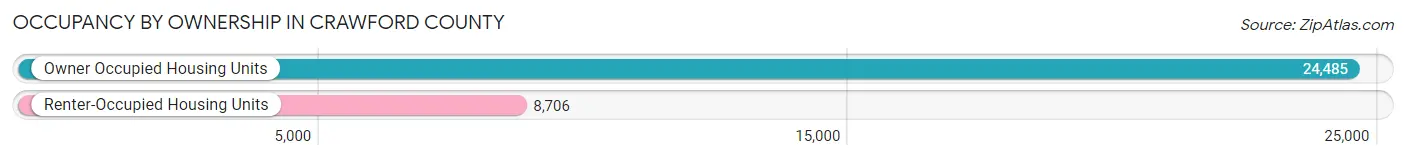
| Occupancy | # Housing Units | % Housing Units |
| Owner Occupied Housing Units | 24,485 | 73.8% |
| Renter-Occupied Housing Units | 8,706 | 26.2% |
| Total Occupied Housing Units | 33,191 | 100.0% |
Occupancy by Household Size in Crawford County
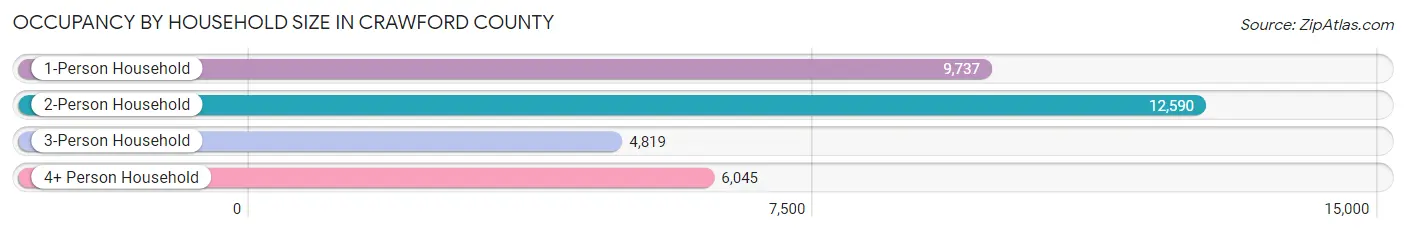
| Household Size | # Housing Units | % Housing Units |
| 1-Person Household | 9,737 | 29.3% |
| 2-Person Household | 12,590 | 37.9% |
| 3-Person Household | 4,819 | 14.5% |
| 4+ Person Household | 6,045 | 18.2% |
| Total Housing Units | 33,191 | 100.0% |
Occupancy by Ownership by Household Size in Crawford County
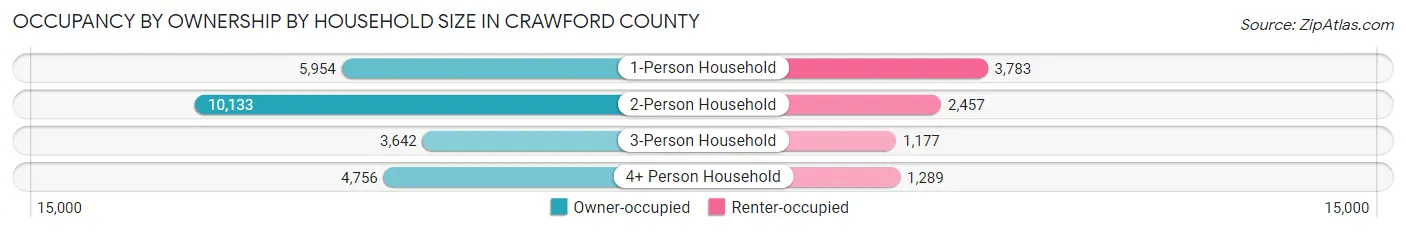
| Household Size | Owner-occupied | Renter-occupied |
| 1-Person Household | 5,954 (61.2%) | 3,783 (38.9%) |
| 2-Person Household | 10,133 (80.5%) | 2,457 (19.5%) |
| 3-Person Household | 3,642 (75.6%) | 1,177 (24.4%) |
| 4+ Person Household | 4,756 (78.7%) | 1,289 (21.3%) |
| Total Housing Units | 24,485 (73.8%) | 8,706 (26.2%) |
Occupancy by Educational Attainment in Crawford County
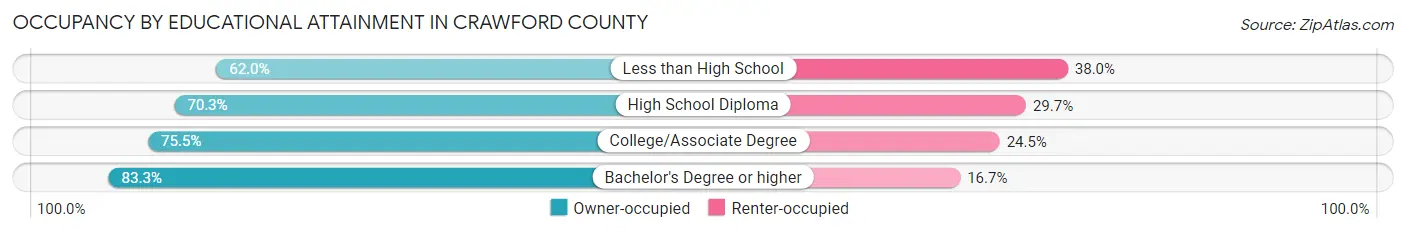
| Household Size | Owner-occupied | Renter-occupied |
| Less than High School | 1,732 (62.0%) | 1,062 (38.0%) |
| High School Diploma | 10,394 (70.3%) | 4,391 (29.7%) |
| College/Associate Degree | 6,276 (75.5%) | 2,036 (24.5%) |
| Bachelor's Degree or higher | 6,083 (83.3%) | 1,217 (16.7%) |
Occupancy by Age of Householder in Crawford County
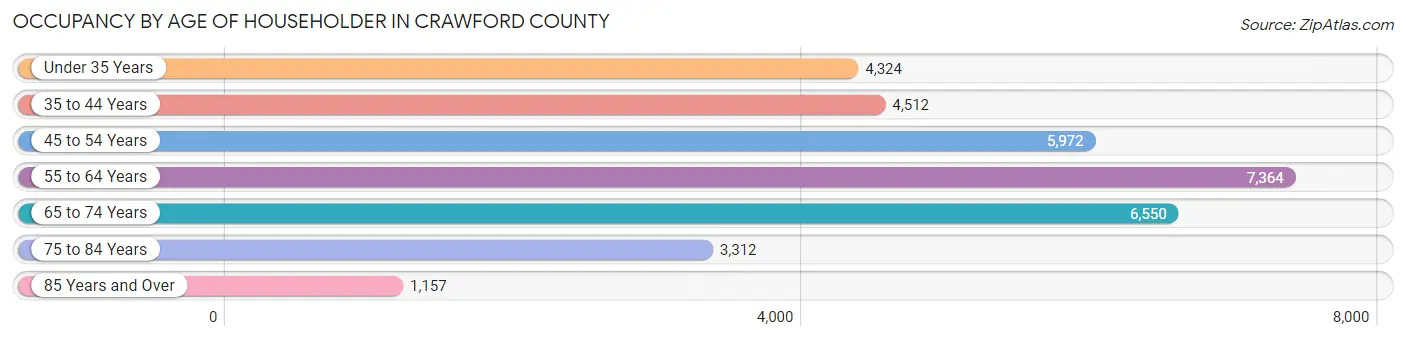
| Age Bracket | # Households | % Households |
| Under 35 Years | 4,324 | 13.0% |
| 35 to 44 Years | 4,512 | 13.6% |
| 45 to 54 Years | 5,972 | 18.0% |
| 55 to 64 Years | 7,364 | 22.2% |
| 65 to 74 Years | 6,550 | 19.7% |
| 75 to 84 Years | 3,312 | 10.0% |
| 85 Years and Over | 1,157 | 3.5% |
| Total | 33,191 | 100.0% |
Housing Finances in Crawford County
Median Income by Occupancy in Crawford County
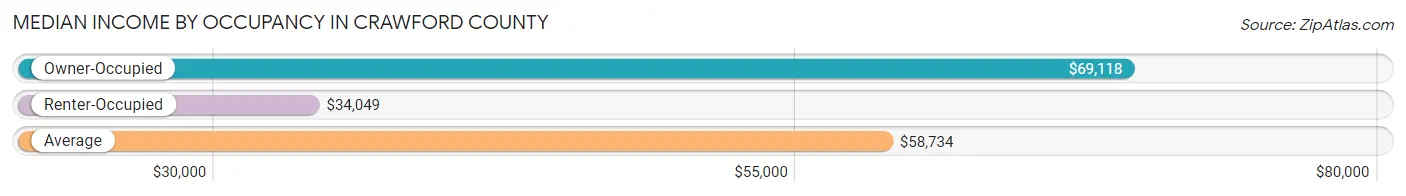
| Occupancy Type | # Households | Median Income |
| Owner-Occupied | 24,485 (73.8%) | $69,118 |
| Renter-Occupied | 8,706 (26.2%) | $34,049 |
| Average | 33,191 (100.0%) | $58,734 |
Occupancy by Householder Income Bracket in Crawford County
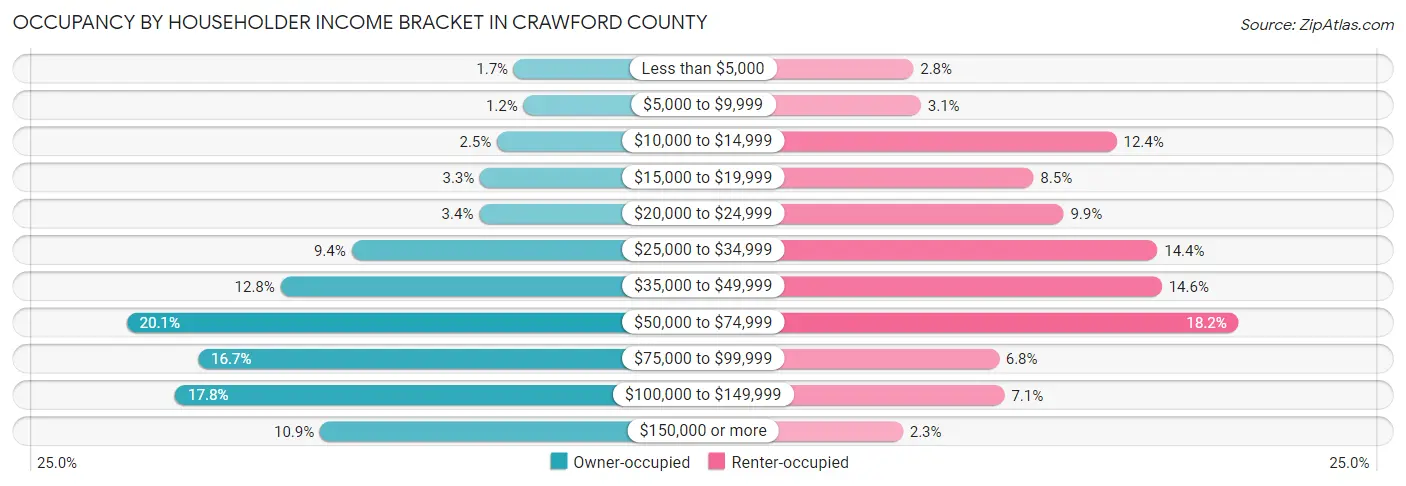
| Income Bracket | Owner-occupied | Renter-occupied |
| Less than $5,000 | 416 (1.7%) | 239 (2.8%) |
| $5,000 to $9,999 | 304 (1.2%) | 271 (3.1%) |
| $10,000 to $14,999 | 613 (2.5%) | 1,082 (12.4%) |
| $15,000 to $19,999 | 811 (3.3%) | 737 (8.5%) |
| $20,000 to $24,999 | 821 (3.4%) | 862 (9.9%) |
| $25,000 to $34,999 | 2,309 (9.4%) | 1,251 (14.4%) |
| $35,000 to $49,999 | 3,137 (12.8%) | 1,269 (14.6%) |
| $50,000 to $74,999 | 4,932 (20.1%) | 1,588 (18.2%) |
| $75,000 to $99,999 | 4,099 (16.7%) | 594 (6.8%) |
| $100,000 to $149,999 | 4,366 (17.8%) | 617 (7.1%) |
| $150,000 or more | 2,677 (10.9%) | 196 (2.2%) |
| Total | 24,485 (100.0%) | 8,706 (100.0%) |
Monthly Housing Cost Tiers in Crawford County
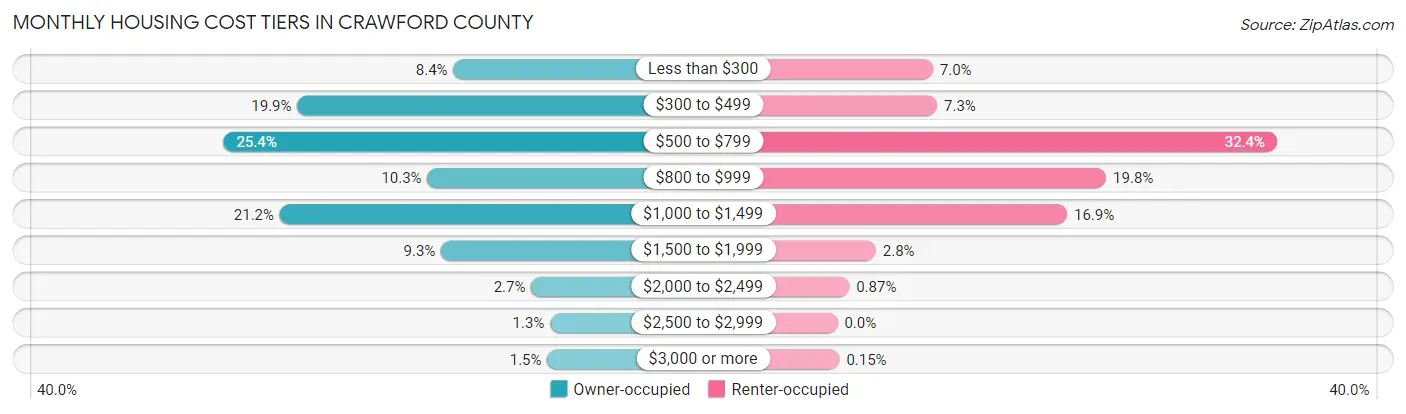
| Monthly Cost | Owner-occupied | Renter-occupied |
| Less than $300 | 2,061 (8.4%) | 612 (7.0%) |
| $300 to $499 | 4,875 (19.9%) | 639 (7.3%) |
| $500 to $799 | 6,206 (25.4%) | 2,817 (32.4%) |
| $800 to $999 | 2,529 (10.3%) | 1,723 (19.8%) |
| $1,000 to $1,499 | 5,192 (21.2%) | 1,472 (16.9%) |
| $1,500 to $1,999 | 2,283 (9.3%) | 246 (2.8%) |
| $2,000 to $2,499 | 657 (2.7%) | 76 (0.9%) |
| $2,500 to $2,999 | 315 (1.3%) | 0 (0.0%) |
| $3,000 or more | 367 (1.5%) | 13 (0.2%) |
| Total | 24,485 (100.0%) | 8,706 (100.0%) |
Physical Housing Characteristics in Crawford County
Housing Structures in Crawford County
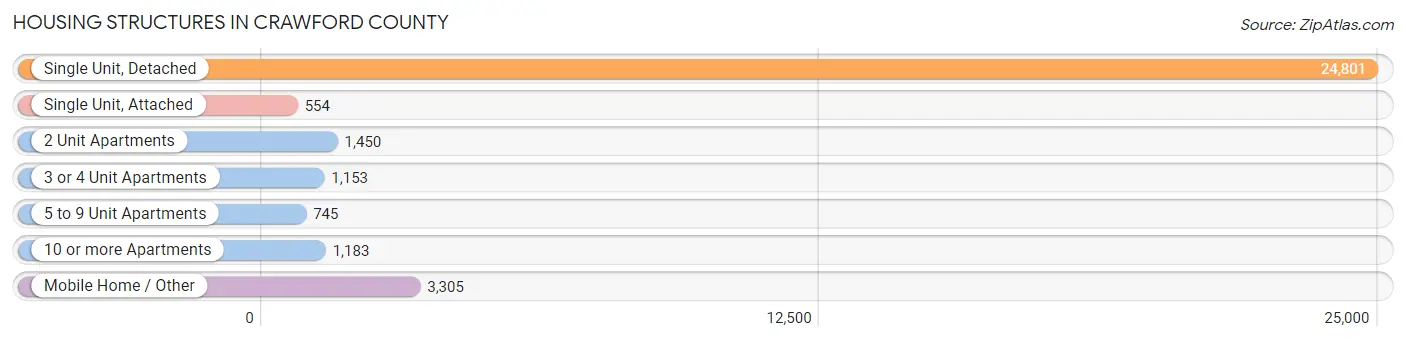
| Structure Type | # Housing Units | % Housing Units |
| Single Unit, Detached | 24,801 | 74.7% |
| Single Unit, Attached | 554 | 1.7% |
| 2 Unit Apartments | 1,450 | 4.4% |
| 3 or 4 Unit Apartments | 1,153 | 3.5% |
| 5 to 9 Unit Apartments | 745 | 2.2% |
| 10 or more Apartments | 1,183 | 3.6% |
| Mobile Home / Other | 3,305 | 10.0% |
| Total | 33,191 | 100.0% |
Housing Structures by Occupancy in Crawford County
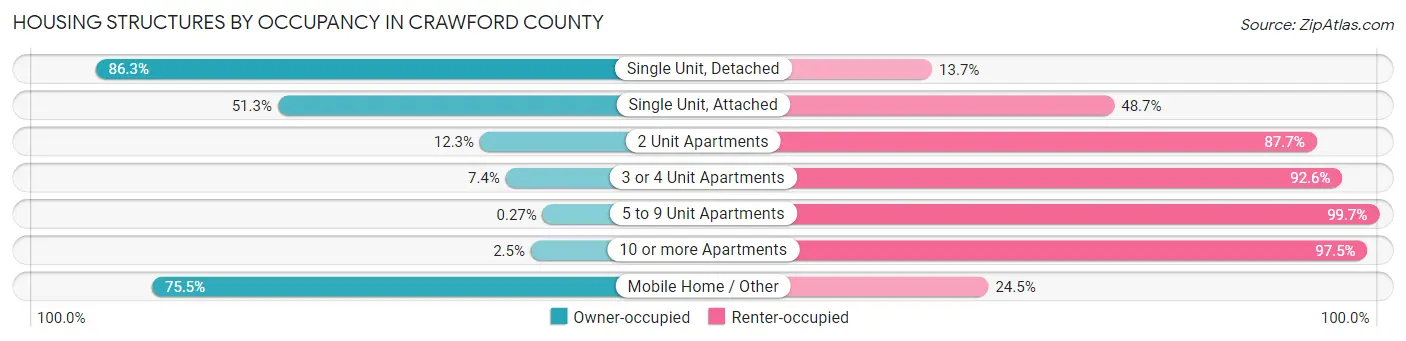
| Structure Type | Owner-occupied | Renter-occupied |
| Single Unit, Detached | 21,410 (86.3%) | 3,391 (13.7%) |
| Single Unit, Attached | 284 (51.3%) | 270 (48.7%) |
| 2 Unit Apartments | 179 (12.3%) | 1,271 (87.7%) |
| 3 or 4 Unit Apartments | 85 (7.4%) | 1,068 (92.6%) |
| 5 to 9 Unit Apartments | 2 (0.3%) | 743 (99.7%) |
| 10 or more Apartments | 30 (2.5%) | 1,153 (97.5%) |
| Mobile Home / Other | 2,495 (75.5%) | 810 (24.5%) |
| Total | 24,485 (73.8%) | 8,706 (26.2%) |
Housing Structures by Number of Rooms in Crawford County
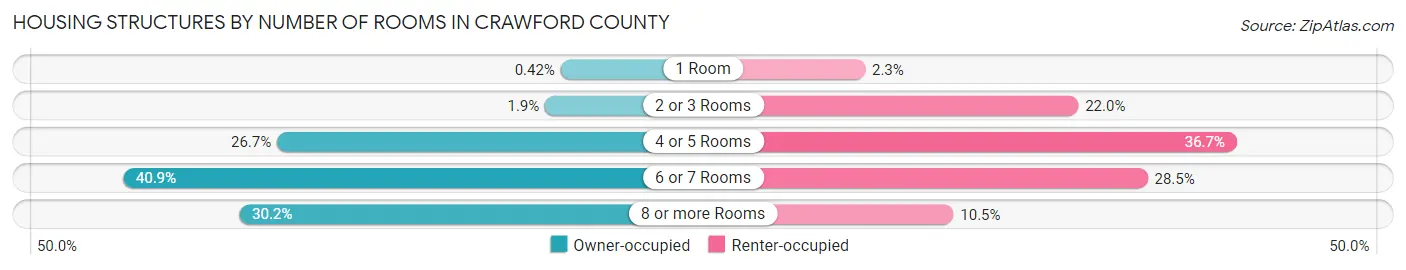
| Number of Rooms | Owner-occupied | Renter-occupied |
| 1 Room | 104 (0.4%) | 202 (2.3%) |
| 2 or 3 Rooms | 455 (1.9%) | 1,919 (22.0%) |
| 4 or 5 Rooms | 6,525 (26.7%) | 3,195 (36.7%) |
| 6 or 7 Rooms | 10,017 (40.9%) | 2,477 (28.4%) |
| 8 or more Rooms | 7,384 (30.2%) | 913 (10.5%) |
| Total | 24,485 (100.0%) | 8,706 (100.0%) |
Housing Structure by Heating Type in Crawford County
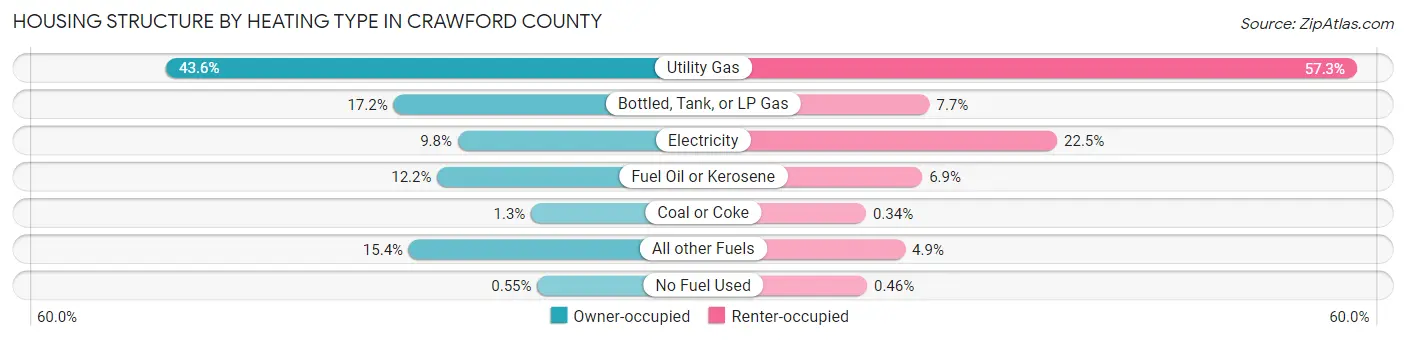
| Heating Type | Owner-occupied | Renter-occupied |
| Utility Gas | 10,673 (43.6%) | 4,984 (57.3%) |
| Bottled, Tank, or LP Gas | 4,219 (17.2%) | 671 (7.7%) |
| Electricity | 2,393 (9.8%) | 1,959 (22.5%) |
| Fuel Oil or Kerosene | 2,975 (12.1%) | 597 (6.9%) |
| Coal or Coke | 311 (1.3%) | 30 (0.3%) |
| All other Fuels | 3,780 (15.4%) | 425 (4.9%) |
| No Fuel Used | 134 (0.5%) | 40 (0.5%) |
| Total | 24,485 (100.0%) | 8,706 (100.0%) |
Household Vehicle Usage in Crawford County
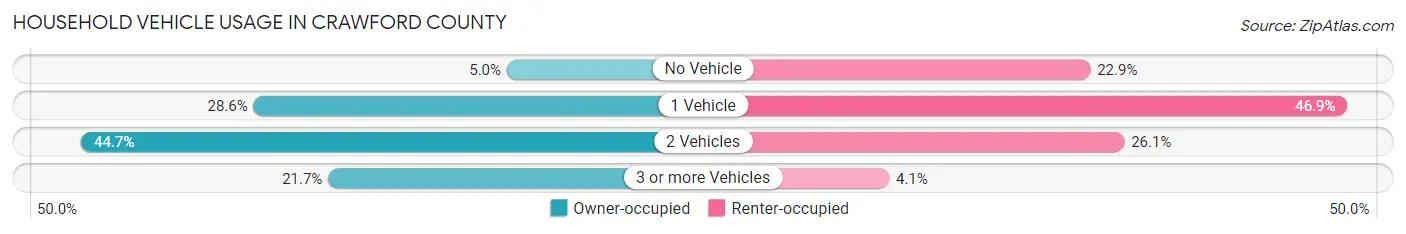
| Vehicles per Household | Owner-occupied | Renter-occupied |
| No Vehicle | 1,219 (5.0%) | 1,994 (22.9%) |
| 1 Vehicle | 7,010 (28.6%) | 4,083 (46.9%) |
| 2 Vehicles | 10,952 (44.7%) | 2,270 (26.1%) |
| 3 or more Vehicles | 5,304 (21.7%) | 359 (4.1%) |
| Total | 24,485 (100.0%) | 8,706 (100.0%) |
Real Estate & Mortgages in Crawford County
Real Estate and Mortgage Overview in Crawford County
| Characteristic | Without Mortgage | With Mortgage |
| Housing Units | 12,160 | 12,325 |
| Median Property Value | $120,200 | $147,000 |
| Median Household Income | $55,464 | $1,727 |
| Monthly Housing Costs | $480 | $352 |
| Real Estate Taxes | $1,828 | $161 |
Property Value by Mortgage Status in Crawford County
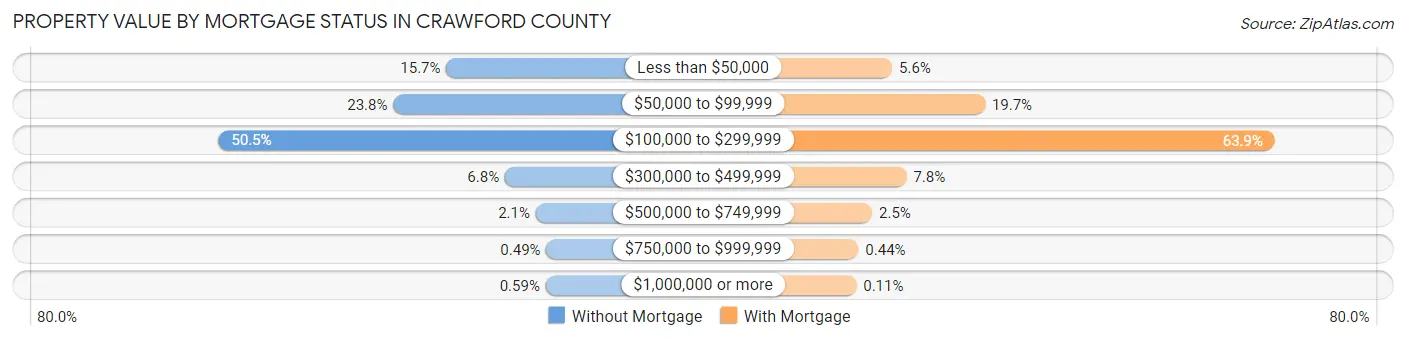
| Property Value | Without Mortgage | With Mortgage |
| Less than $50,000 | 1,913 (15.7%) | 687 (5.6%) |
| $50,000 to $99,999 | 2,896 (23.8%) | 2,430 (19.7%) |
| $100,000 to $299,999 | 6,137 (50.5%) | 7,873 (63.9%) |
| $300,000 to $499,999 | 827 (6.8%) | 957 (7.8%) |
| $500,000 to $749,999 | 255 (2.1%) | 310 (2.5%) |
| $750,000 to $999,999 | 60 (0.5%) | 54 (0.4%) |
| $1,000,000 or more | 72 (0.6%) | 14 (0.1%) |
| Total | 12,160 (100.0%) | 12,325 (100.0%) |
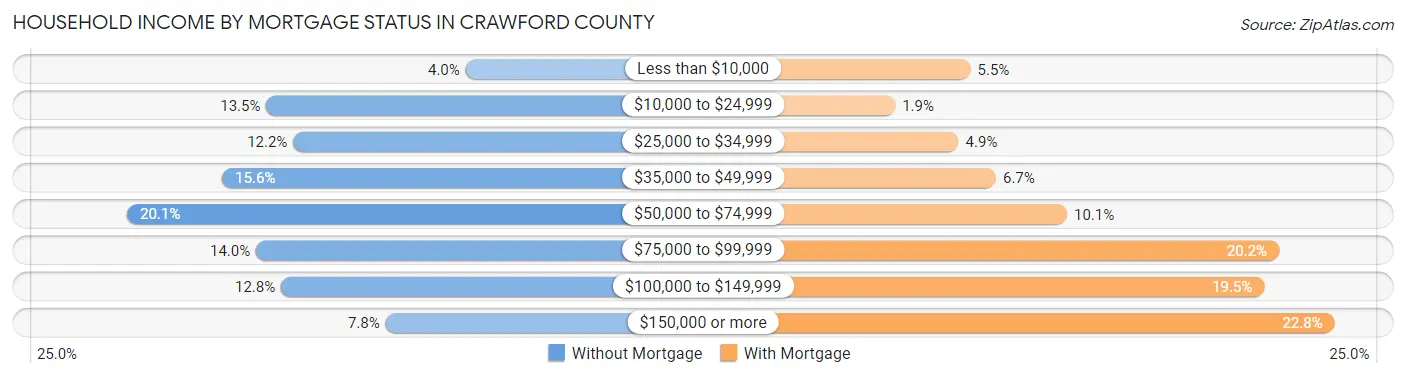
Household Income by Mortgage Status in Crawford County
| Household Income | Without Mortgage | With Mortgage |
| Less than $10,000 | 487 (4.0%) | 676 (5.5%) |
| $10,000 to $24,999 | 1,640 (13.5%) | 233 (1.9%) |
| $25,000 to $34,999 | 1,485 (12.2%) | 605 (4.9%) |
| $35,000 to $49,999 | 1,896 (15.6%) | 824 (6.7%) |
| $50,000 to $74,999 | 2,447 (20.1%) | 1,241 (10.1%) |
| $75,000 to $99,999 | 1,700 (14.0%) | 2,485 (20.2%) |
| $100,000 to $149,999 | 1,555 (12.8%) | 2,399 (19.5%) |
| $150,000 or more | 950 (7.8%) | 2,811 (22.8%) |
| Total | 12,160 (100.0%) | 12,325 (100.0%) |
Property Value to Household Income Ratio in Crawford County
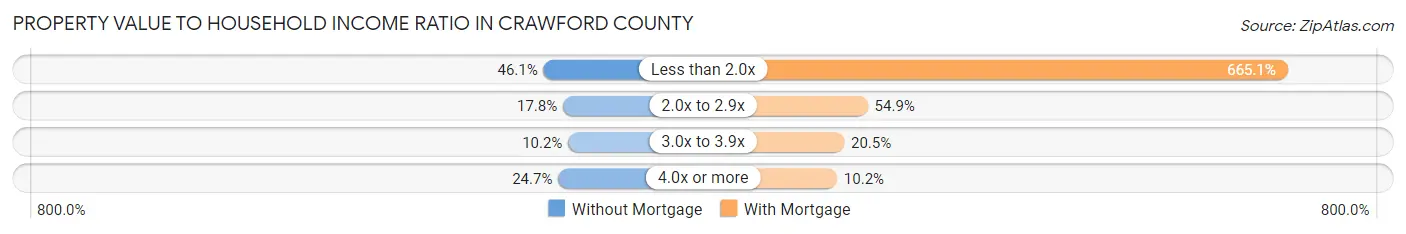
| Value-to-Income Ratio | Without Mortgage | With Mortgage |
| Less than 2.0x | 5,601 (46.1%) | 81,971 (665.1%) |
| 2.0x to 2.9x | 2,159 (17.7%) | 6,760 (54.8%) |
| 3.0x to 3.9x | 1,242 (10.2%) | 2,523 (20.5%) |
| 4.0x or more | 3,002 (24.7%) | 1,254 (10.2%) |
| Total | 12,160 (100.0%) | 12,325 (100.0%) |
Real Estate Taxes by Mortgage Status in Crawford County
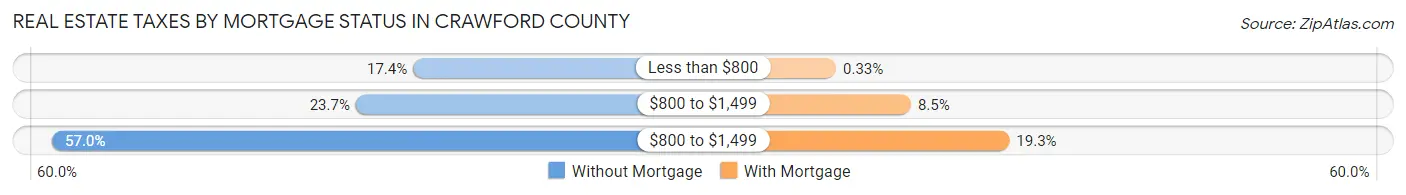
| Property Taxes | Without Mortgage | With Mortgage |
| Less than $800 | 2,120 (17.4%) | 41 (0.3%) |
| $800 to $1,499 | 2,883 (23.7%) | 1,053 (8.5%) |
| $800 to $1,499 | 6,929 (57.0%) | 2,382 (19.3%) |
| Total | 12,160 (100.0%) | 12,325 (100.0%) |
Health & Disability in Crawford County
Health Insurance Coverage by Age in Crawford County
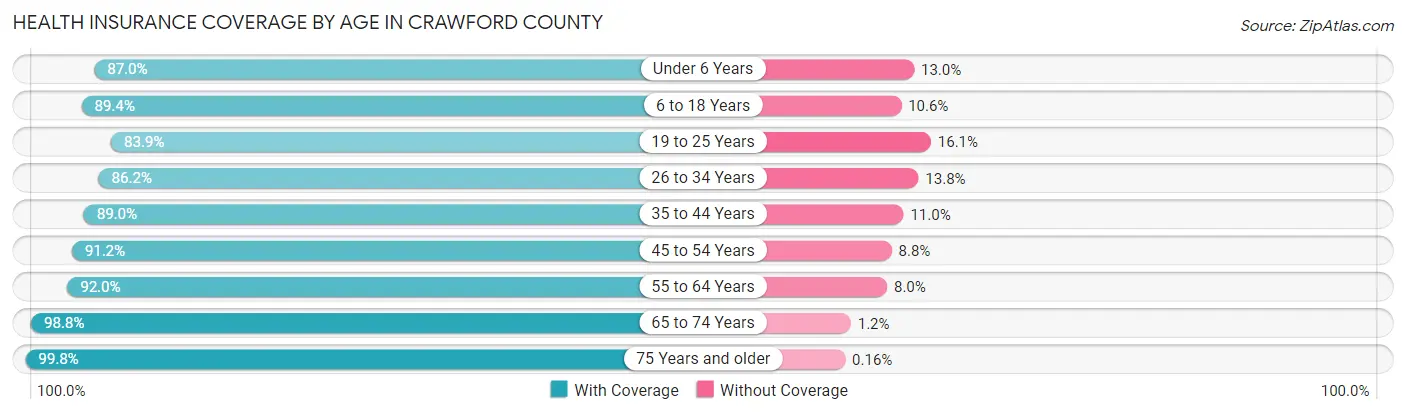
| Age Bracket | With Coverage | Without Coverage |
| Under 6 Years | 4,725 (87.0%) | 706 (13.0%) |
| 6 to 18 Years | 11,354 (89.4%) | 1,347 (10.6%) |
| 19 to 25 Years | 6,289 (83.9%) | 1,210 (16.1%) |
| 26 to 34 Years | 6,634 (86.2%) | 1,064 (13.8%) |
| 35 to 44 Years | 7,781 (89.0%) | 966 (11.0%) |
| 45 to 54 Years | 9,313 (91.2%) | 901 (8.8%) |
| 55 to 64 Years | 11,284 (92.0%) | 977 (8.0%) |
| 65 to 74 Years | 10,433 (98.8%) | 128 (1.2%) |
| 75 Years and older | 7,068 (99.8%) | 11 (0.2%) |
| Total | 74,881 (91.1%) | 7,310 (8.9%) |
Health Insurance Coverage by Citizenship Status in Crawford County
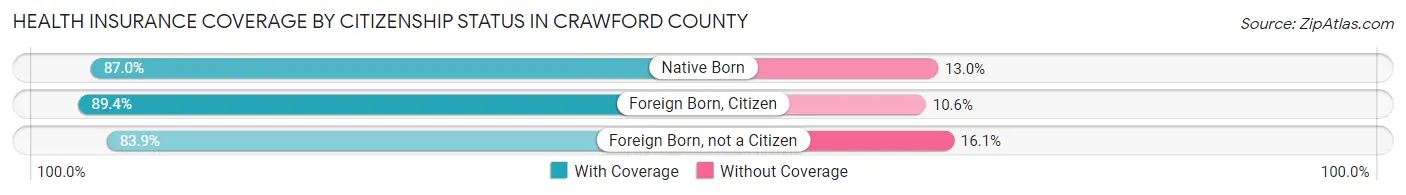
| Citizenship Status | With Coverage | Without Coverage |
| Native Born | 4,725 (87.0%) | 706 (13.0%) |
| Foreign Born, Citizen | 11,354 (89.4%) | 1,347 (10.6%) |
| Foreign Born, not a Citizen | 6,289 (83.9%) | 1,210 (16.1%) |
Health Insurance Coverage by Household Income in Crawford County
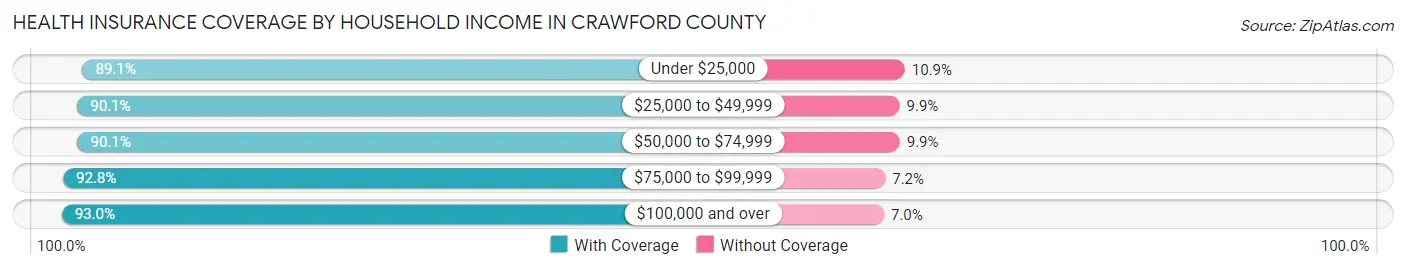
| Household Income | With Coverage | Without Coverage |
| Under $25,000 | 9,002 (89.1%) | 1,098 (10.9%) |
| $25,000 to $49,999 | 15,229 (90.1%) | 1,671 (9.9%) |
| $50,000 to $74,999 | 14,815 (90.1%) | 1,633 (9.9%) |
| $75,000 to $99,999 | 12,086 (92.8%) | 939 (7.2%) |
| $100,000 and over | 22,017 (93.0%) | 1,646 (7.0%) |
Public vs Private Health Insurance Coverage by Age in Crawford County
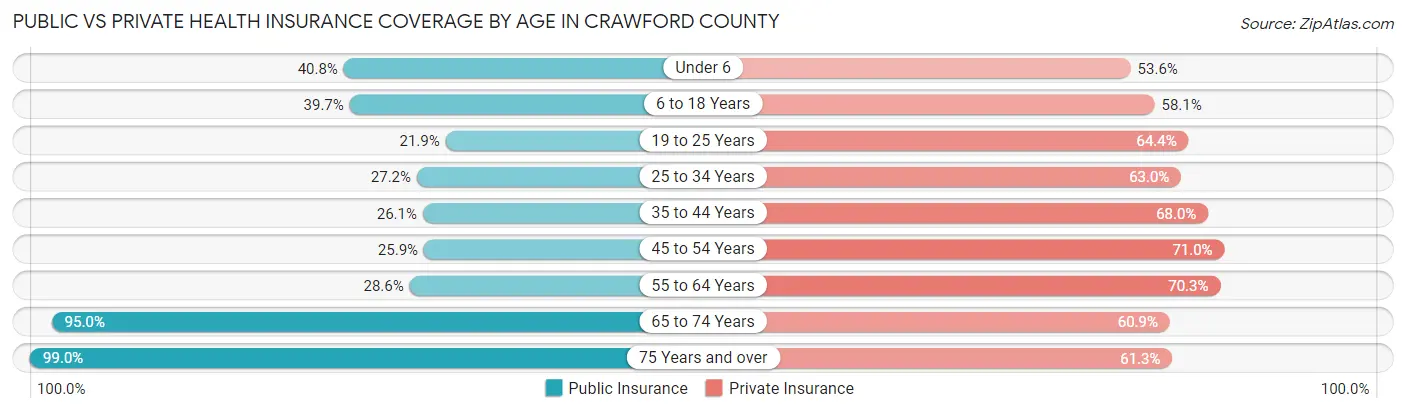
| Age Bracket | Public Insurance | Private Insurance |
| Under 6 | 2,214 (40.8%) | 2,912 (53.6%) |
| 6 to 18 Years | 5,039 (39.7%) | 7,373 (58.1%) |
| 19 to 25 Years | 1,640 (21.9%) | 4,826 (64.4%) |
| 25 to 34 Years | 2,093 (27.2%) | 4,849 (63.0%) |
| 35 to 44 Years | 2,282 (26.1%) | 5,948 (68.0%) |
| 45 to 54 Years | 2,643 (25.9%) | 7,254 (71.0%) |
| 55 to 64 Years | 3,500 (28.5%) | 8,613 (70.3%) |
| 65 to 74 Years | 10,031 (95.0%) | 6,430 (60.9%) |
| 75 Years and over | 7,009 (99.0%) | 4,342 (61.3%) |
| Total | 36,451 (44.4%) | 52,547 (63.9%) |
Disability Status by Sex by Age in Crawford County
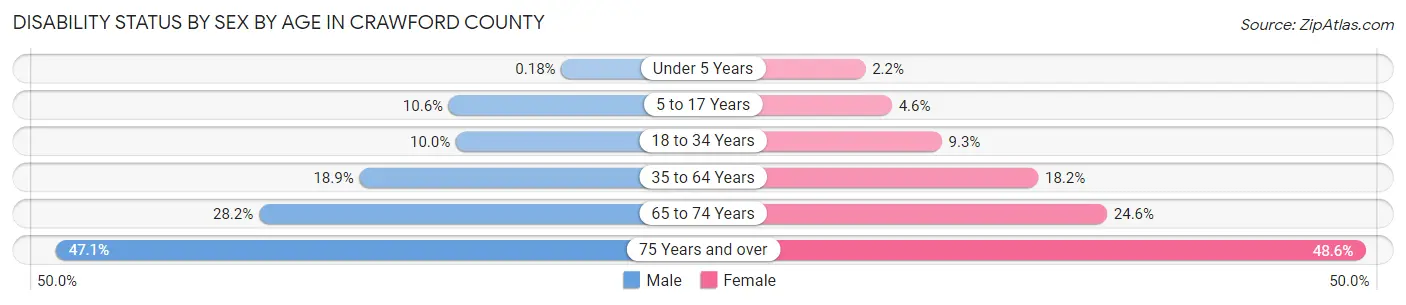
| Age Bracket | Male | Female |
| Under 5 Years | 4 (0.2%) | 49 (2.2%) |
| 5 to 17 Years | 697 (10.6%) | 283 (4.6%) |
| 18 to 34 Years | 821 (10.0%) | 738 (9.3%) |
| 35 to 64 Years | 2,956 (18.9%) | 2,840 (18.2%) |
| 65 to 74 Years | 1,474 (28.2%) | 1,314 (24.6%) |
| 75 Years and over | 1,502 (47.1%) | 1,889 (48.6%) |
Disability Class by Sex by Age in Crawford County
Disability Class: Hearing Difficulty
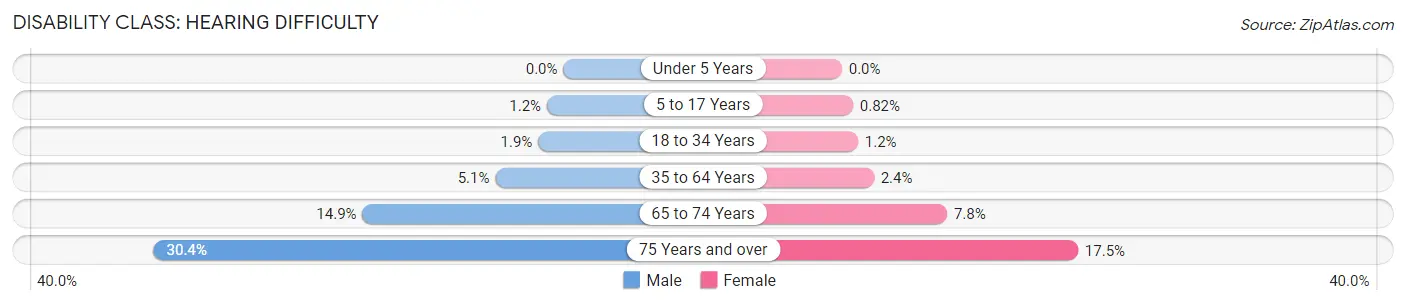
| Age Bracket | Male | Female |
| Under 5 Years | 0 (0.0%) | 0 (0.0%) |
| 5 to 17 Years | 80 (1.2%) | 50 (0.8%) |
| 18 to 34 Years | 154 (1.9%) | 95 (1.2%) |
| 35 to 64 Years | 789 (5.1%) | 369 (2.4%) |
| 65 to 74 Years | 779 (14.9%) | 417 (7.8%) |
| 75 Years and over | 970 (30.4%) | 682 (17.5%) |
Disability Class: Vision Difficulty
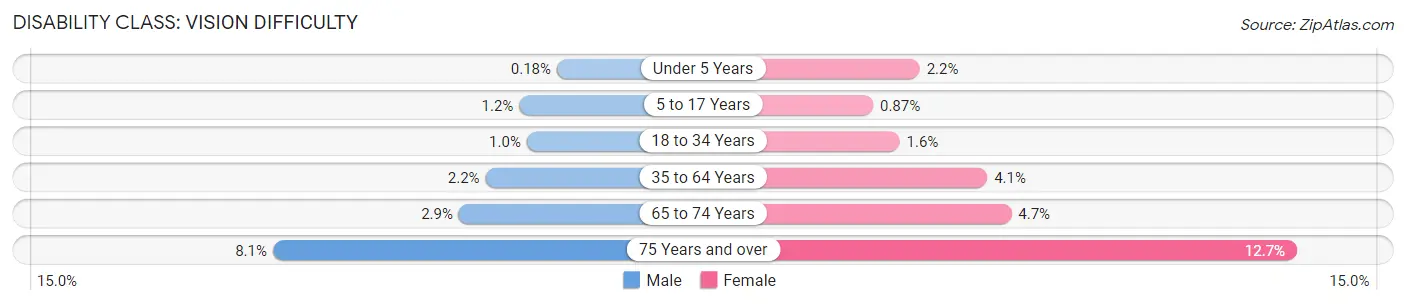
| Age Bracket | Male | Female |
| Under 5 Years | 4 (0.2%) | 49 (2.2%) |
| 5 to 17 Years | 81 (1.2%) | 53 (0.9%) |
| 18 to 34 Years | 84 (1.0%) | 128 (1.6%) |
| 35 to 64 Years | 339 (2.2%) | 632 (4.1%) |
| 65 to 74 Years | 152 (2.9%) | 252 (4.7%) |
| 75 Years and over | 258 (8.1%) | 493 (12.7%) |
Disability Class: Cognitive Difficulty
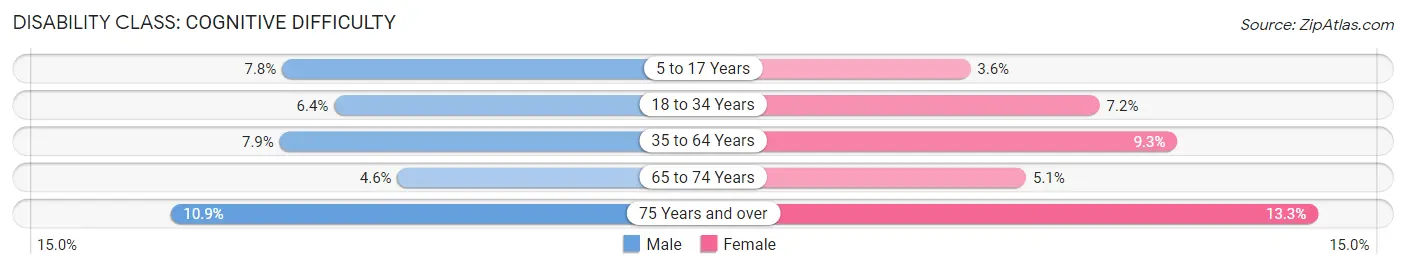
| Age Bracket | Male | Female |
| 5 to 17 Years | 514 (7.8%) | 219 (3.6%) |
| 18 to 34 Years | 526 (6.4%) | 572 (7.2%) |
| 35 to 64 Years | 1,234 (7.9%) | 1,457 (9.3%) |
| 65 to 74 Years | 241 (4.6%) | 274 (5.1%) |
| 75 Years and over | 349 (10.9%) | 516 (13.3%) |
Disability Class: Ambulatory Difficulty
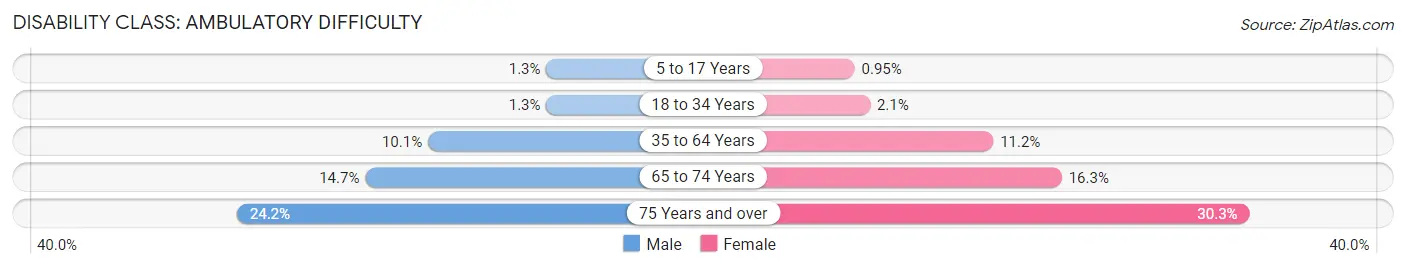
| Age Bracket | Male | Female |
| 5 to 17 Years | 83 (1.3%) | 58 (0.9%) |
| 18 to 34 Years | 104 (1.3%) | 167 (2.1%) |
| 35 to 64 Years | 1,570 (10.1%) | 1,753 (11.2%) |
| 65 to 74 Years | 768 (14.7%) | 872 (16.3%) |
| 75 Years and over | 773 (24.2%) | 1,177 (30.3%) |
Disability Class: Self-Care Difficulty
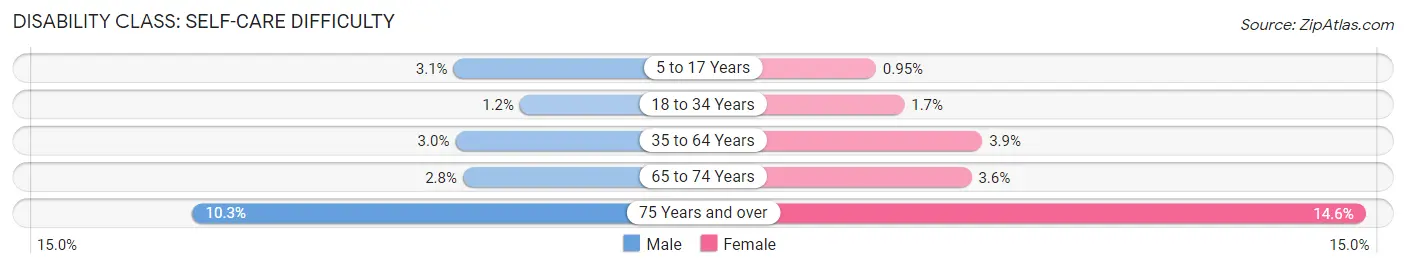
| Age Bracket | Male | Female |
| 5 to 17 Years | 201 (3.1%) | 58 (0.9%) |
| 18 to 34 Years | 100 (1.2%) | 139 (1.7%) |
| 35 to 64 Years | 471 (3.0%) | 610 (3.9%) |
| 65 to 74 Years | 146 (2.8%) | 193 (3.6%) |
| 75 Years and over | 329 (10.3%) | 567 (14.6%) |
Technology Access in Crawford County
Computing Device Access in Crawford County
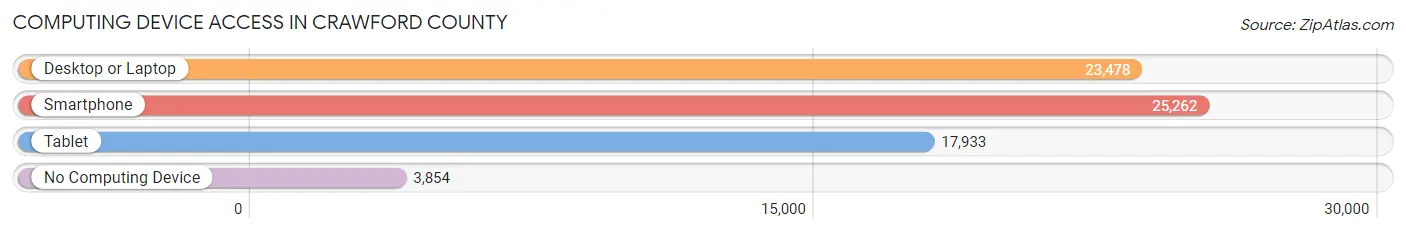
| Device Type | # Households | % Households |
| Desktop or Laptop | 23,478 | 70.7% |
| Smartphone | 25,262 | 76.1% |
| Tablet | 17,933 | 54.0% |
| No Computing Device | 3,854 | 11.6% |
| Total | 33,191 | 100.0% |
Internet Access in Crawford County
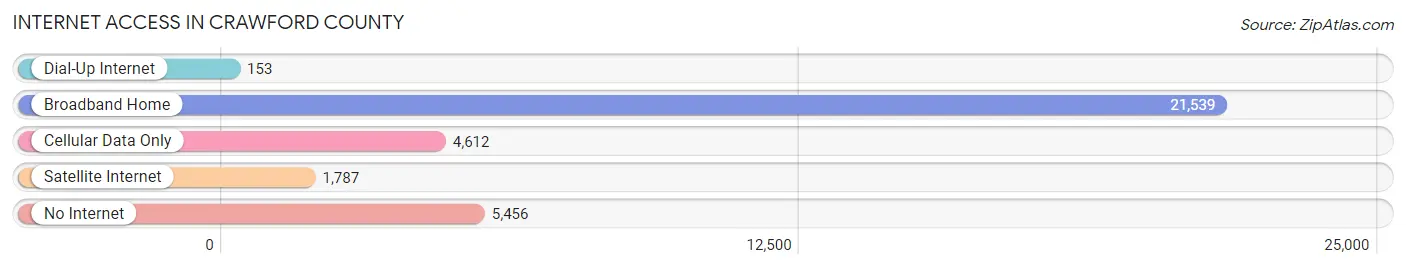
| Internet Type | # Households | % Households |
| Dial-Up Internet | 153 | 0.5% |
| Broadband Home | 21,539 | 64.9% |
| Cellular Data Only | 4,612 | 13.9% |
| Satellite Internet | 1,787 | 5.4% |
| No Internet | 5,456 | 16.4% |
| Total | 33,191 | 100.0% |
Crawford County Summary
Crawford County, Pennsylvania is located in the northwestern corner of the state and is part of the Erie Metropolitan Statistical Area. The county was created in 1800 and named after Colonel William Crawford, a Revolutionary War hero. The county seat is Meadville, which is also the largest city in the county.
Geography
Crawford County is located in the northwestern corner of Pennsylvania and is bordered by Erie County to the north, Warren County to the east, Venango County to the south, and Mercer County to the west. The county has a total area of 890 square miles, of which 877 square miles is land and 13 square miles is water. The terrain is mostly rolling hills and valleys, with the highest point being the summit of Mount Zion at 1,945 feet above sea level. The county is drained by French Creek, which flows through the center of the county and empties into the Allegheny River.
Economy
Crawford County’s economy is largely based on manufacturing and agriculture. The county is home to several large manufacturing companies, including the Meadville-based ConAgra Foods, which produces a variety of food products. Other major employers in the county include the Meadville Medical Center, the Meadville Area School District, and the Crawford County government. Agriculture is also an important part of the county’s economy, with dairy farming and crop production being the main agricultural activities.
Demographics
As of the 2010 census, Crawford County had a population of 88,765. The population was spread out with a median age of 41.7 years. The racial makeup of the county was 95.3% White, 1.7% African American, 0.3% Native American, 0.7% Asian, 0.1% Pacific Islander, 0.7% from other races, and 1.2% from two or more races. Hispanic or Latino of any race were 2.2% of the population.
The median income for a household in the county was $41,945 and the median income for a family was $51,945. The per capita income for the county was $20,945. About 11.2% of families and 15.2% of the population were below the poverty line, including 22.2% of those under age 18 and 8.2% of those age 65 or over.
Conclusion
Crawford County, Pennsylvania is a rural county located in the northwestern corner of the state. The county is home to a variety of industries, including manufacturing and agriculture, and has a population of 88,765 as of the 2010 census. The county has a median income of $41,945 and a poverty rate of 11.2%. The county is home to a variety of attractions, including the Allegheny National Forest and the Conneaut Lake Park.
Common Questions
What is Per Capita Income in Crawford County?
Per Capita income in Crawford County is $30,989.
What is the Median Family Income in Crawford County?
Median Family Income in Crawford County is $71,507.
What is the Median Household income in Crawford County?
Median Household Income in Crawford County is $58,734.
What is Income or Wage Gap in Crawford County?
Income or Wage Gap in Crawford County is 34.1%.
Women in Crawford County earn 65.9 cents for every dollar earned by a man.
What is Family Income Deficit in Crawford County?
Family Income Deficit in Crawford County is $9,766.
Families that are below poverty line in Crawford County earn $9,766 less on average than the poverty threshold level.
What is Inequality or Gini Index in Crawford County?
Inequality or Gini Index in Crawford County is 0.43.
What is the Total Population of Crawford County?
Total Population of Crawford County is 83,876.
What is the Total Male Population of Crawford County?
Total Male Population of Crawford County is 41,371.
What is the Total Female Population of Crawford County?
Total Female Population of Crawford County is 42,505.
What is the Ratio of Males per 100 Females in Crawford County?
There are 97.33 Males per 100 Females in Crawford County.
What is the Ratio of Females per 100 Males in Crawford County?
There are 102.74 Females per 100 Males in Crawford County.
What is the Median Population Age in Crawford County?
Median Population Age in Crawford County is 43.6 Years.
What is the Average Family Size in Crawford County
Average Family Size in Crawford County is 3.0 People.
What is the Average Household Size in Crawford County
Average Household Size in Crawford County is 2.4 People.
How Large is the Labor Force in Crawford County?
There are 38,394 People in the Labor Forcein in Crawford County.
What is the Percentage of People in the Labor Force in Crawford County?
55.8% of People are in the Labor Force in Crawford County.
What is the Unemployment Rate in Crawford County?
Unemployment Rate in Crawford County is 5.6%.