Columbia County, PA Map & Demographics
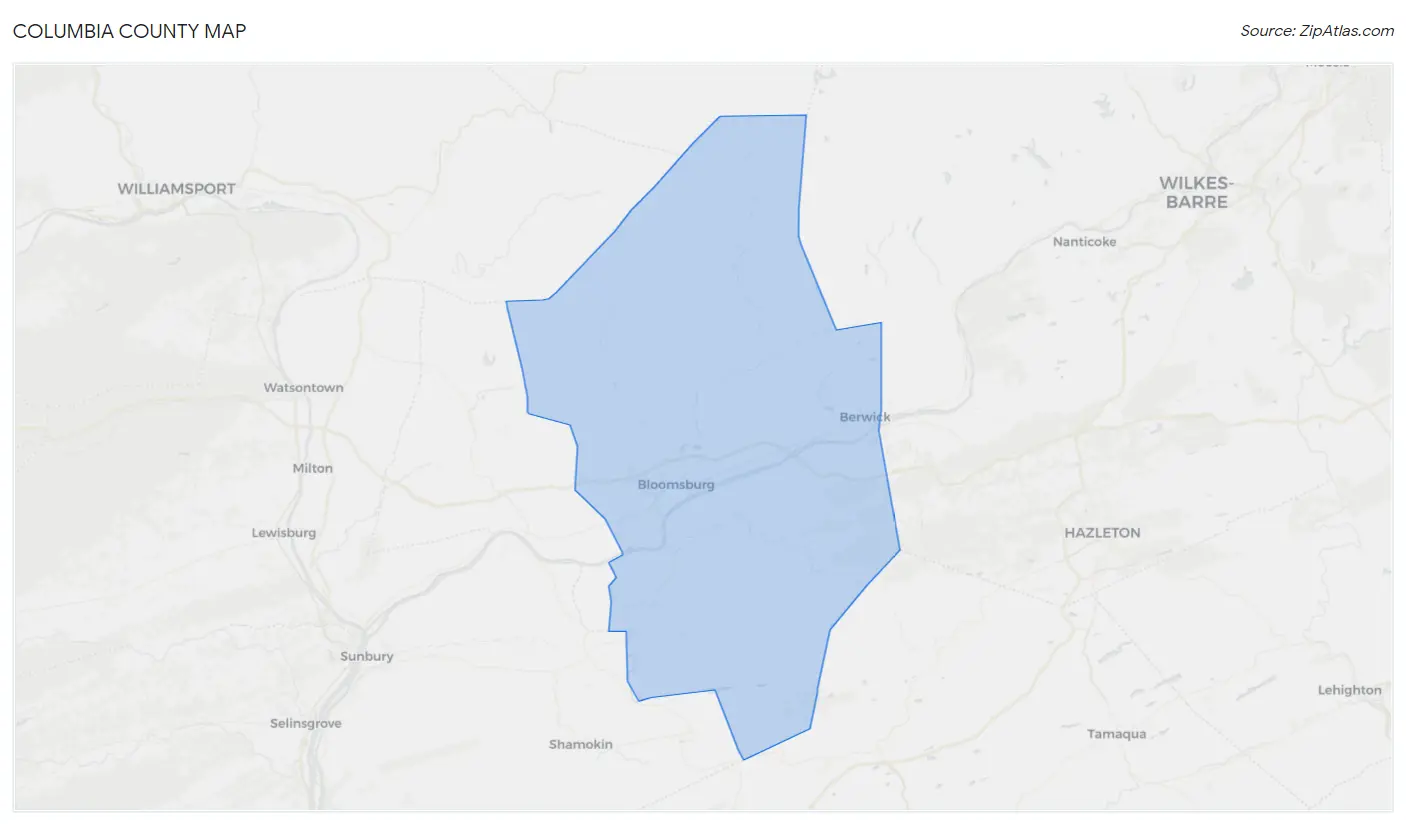
Columbia County Map
Columbia County Overview
$31,238
PER CAPITA INCOME
$76,519
AVG FAMILY INCOME
$59,457
AVG HOUSEHOLD INCOME
32.7%
WAGE / INCOME GAP [ % ]
67.3¢/ $1
WAGE / INCOME GAP [ $ ]
$9,800
FAMILY INCOME DEFICIT
0.44
INEQUALITY / GINI INDEX
64,924
TOTAL POPULATION
31,398
MALE POPULATION
33,526
FEMALE POPULATION
93.65
MALES / 100 FEMALES
106.78
FEMALES / 100 MALES
41.3
MEDIAN AGE
2.9
AVG FAMILY SIZE
2.4
AVG HOUSEHOLD SIZE
31,784
LABOR FORCE [ PEOPLE ]
57.8%
PERCENT IN LABOR FORCE
4.8%
UNEMPLOYMENT RATE
Columbia County Area Codes
Income in Columbia County
Income Overview in Columbia County
Per Capita Income in Columbia County is $31,238, while median incomes of families and households are $76,519 and $59,457 respectively.
| Characteristic | Number | Measure |
| Per Capita Income | 64,924 | $31,238 |
| Median Family Income | 15,850 | $76,519 |
| Mean Family Income | 15,850 | $93,418 |
| Median Household Income | 25,878 | $59,457 |
| Mean Household Income | 25,878 | $76,713 |
| Income Deficit | 15,850 | $9,800 |
| Wage / Income Gap (%) | 64,924 | 32.70% |
| Wage / Income Gap ($) | 64,924 | 67.30¢ per $1 |
| Gini / Inequality Index | 64,924 | 0.44 |
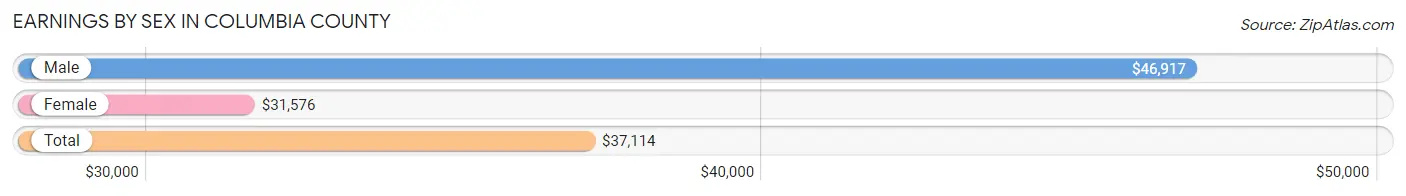
Earnings by Sex in Columbia County
Average Earnings in Columbia County are $37,114, $46,917 for men and $31,576 for women, a difference of 32.7%.
| Sex | Number | Average Earnings |
| Male | 16,052 (49.1%) | $46,917 |
| Female | 16,660 (50.9%) | $31,576 |
| Total | 32,712 (100.0%) | $37,114 |
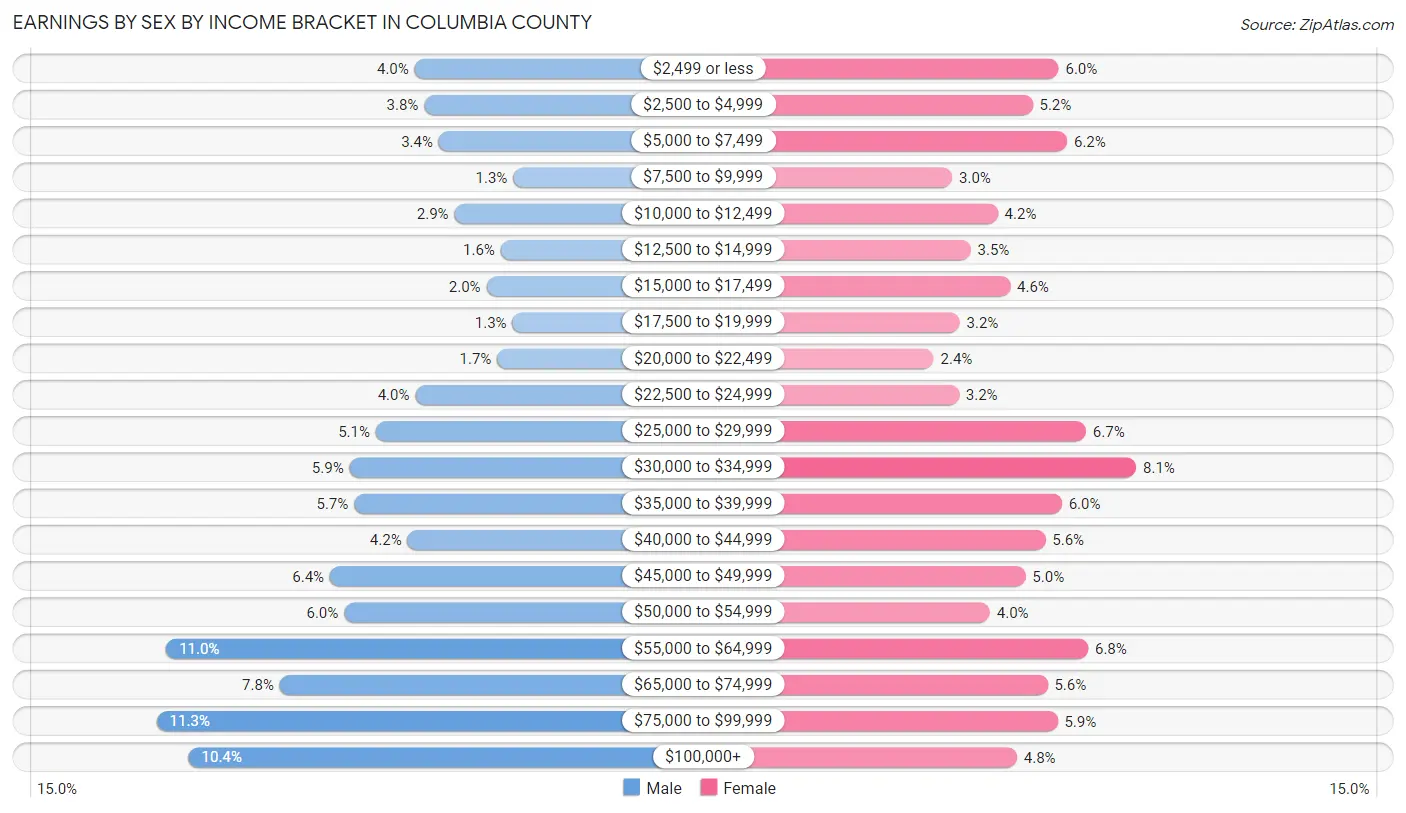
Earnings by Sex by Income Bracket in Columbia County
The most common earnings brackets in Columbia County are $75,000 to $99,999 for men (1,812 | 11.3%) and $30,000 to $34,999 for women (1,355 | 8.1%).
| Income | Male | Female |
| $2,499 or less | 649 (4.0%) | 991 (5.9%) |
| $2,500 to $4,999 | 605 (3.8%) | 870 (5.2%) |
| $5,000 to $7,499 | 540 (3.4%) | 1,032 (6.2%) |
| $7,500 to $9,999 | 204 (1.3%) | 493 (3.0%) |
| $10,000 to $12,499 | 468 (2.9%) | 706 (4.2%) |
| $12,500 to $14,999 | 260 (1.6%) | 579 (3.5%) |
| $15,000 to $17,499 | 325 (2.0%) | 764 (4.6%) |
| $17,500 to $19,999 | 207 (1.3%) | 528 (3.2%) |
| $20,000 to $22,499 | 276 (1.7%) | 406 (2.4%) |
| $22,500 to $24,999 | 646 (4.0%) | 525 (3.2%) |
| $25,000 to $29,999 | 823 (5.1%) | 1,119 (6.7%) |
| $30,000 to $34,999 | 943 (5.9%) | 1,355 (8.1%) |
| $35,000 to $39,999 | 922 (5.7%) | 1,006 (6.0%) |
| $40,000 to $44,999 | 681 (4.2%) | 930 (5.6%) |
| $45,000 to $49,999 | 1,031 (6.4%) | 836 (5.0%) |
| $50,000 to $54,999 | 966 (6.0%) | 669 (4.0%) |
| $55,000 to $64,999 | 1,769 (11.0%) | 1,129 (6.8%) |
| $65,000 to $74,999 | 1,257 (7.8%) | 939 (5.6%) |
| $75,000 to $99,999 | 1,812 (11.3%) | 987 (5.9%) |
| $100,000+ | 1,668 (10.4%) | 796 (4.8%) |
| Total | 16,052 (100.0%) | 16,660 (100.0%) |
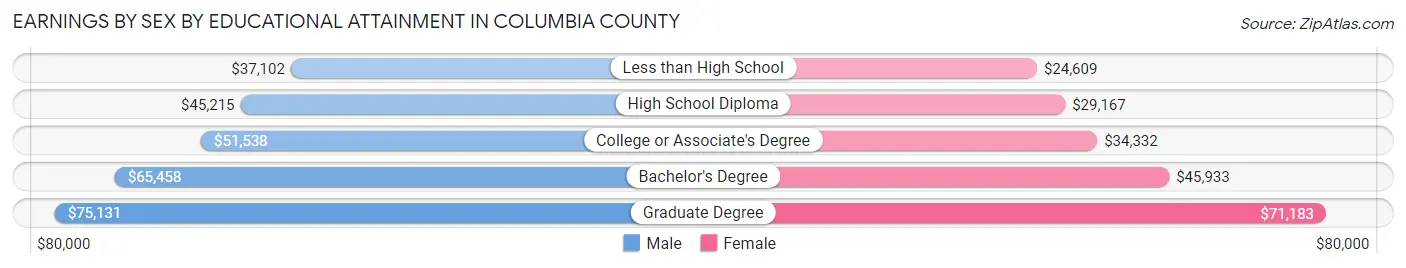
Earnings by Sex by Educational Attainment in Columbia County
Average earnings in Columbia County are $52,038 for men and $35,444 for women, a difference of 31.9%. Men with an educational attainment of graduate degree enjoy the highest average annual earnings of $75,131, while those with less than high school education earn the least with $37,102. Women with an educational attainment of graduate degree earn the most with the average annual earnings of $71,183, while those with less than high school education have the smallest earnings of $24,609.
| Educational Attainment | Male Income | Female Income |
| Less than High School | $37,102 | $24,609 |
| High School Diploma | $45,215 | $29,167 |
| College or Associate's Degree | $51,538 | $34,332 |
| Bachelor's Degree | $65,458 | $45,933 |
| Graduate Degree | $75,131 | $71,183 |
| Total | $52,038 | $35,444 |
Family Income in Columbia County
Family Income Brackets in Columbia County
According to the Columbia County family income data, there are 3,249 families falling into the $100,000 to $149,999 income range, which is the most common income bracket and makes up 20.5% of all families. Conversely, the $10,000 to $14,999 income bracket is the least frequent group with only 301 families (1.9%) belonging to this category.
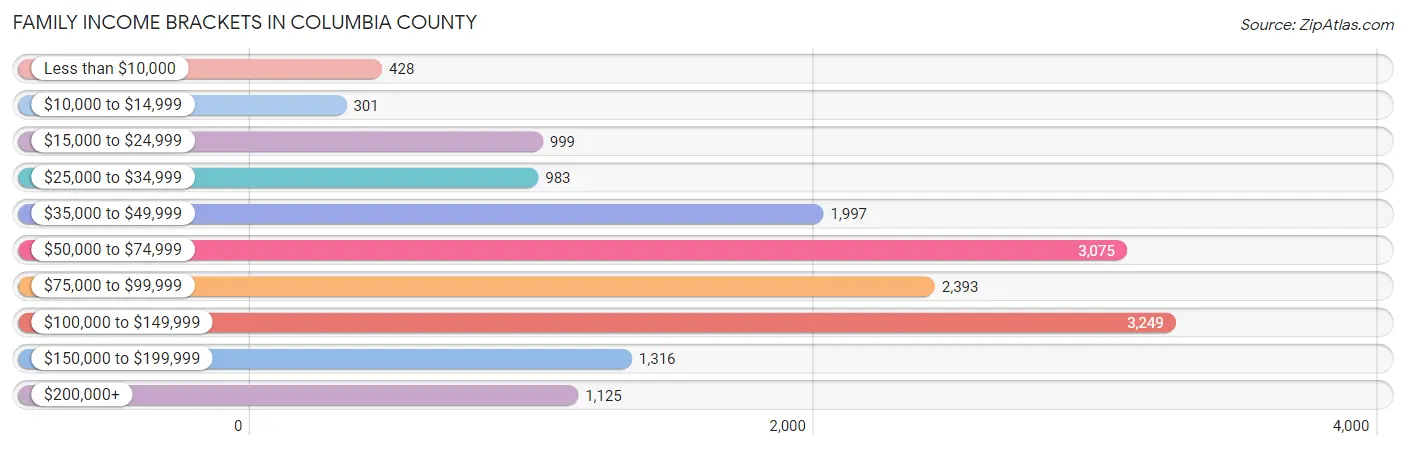
| Income Bracket | # Families | % Families |
| Less than $10,000 | 428 | 2.7% |
| $10,000 to $14,999 | 301 | 1.9% |
| $15,000 to $24,999 | 999 | 6.3% |
| $25,000 to $34,999 | 983 | 6.2% |
| $35,000 to $49,999 | 1,997 | 12.6% |
| $50,000 to $74,999 | 3,075 | 19.4% |
| $75,000 to $99,999 | 2,393 | 15.1% |
| $100,000 to $149,999 | 3,249 | 20.5% |
| $150,000 to $199,999 | 1,316 | 8.3% |
| $200,000+ | 1,125 | 7.1% |
Family Income by Famaliy Size in Columbia County
6-person families (254 | 1.6%) account for the highest median family income in Columbia County with $103,500 per family, while 2-person families (8,193 | 51.7%) have the highest median income of $33,544 per family member.
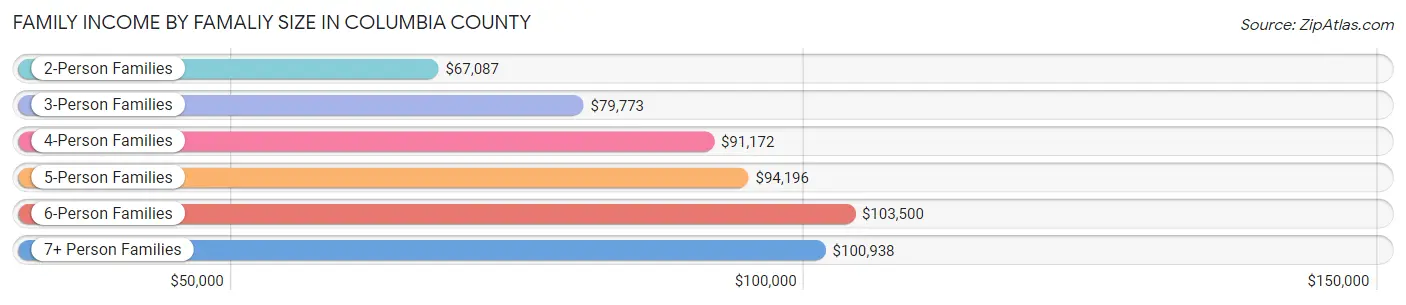
| Income Bracket | # Families | Median Income |
| 2-Person Families | 8,193 (51.7%) | $67,087 |
| 3-Person Families | 3,752 (23.7%) | $79,773 |
| 4-Person Families | 2,485 (15.7%) | $91,172 |
| 5-Person Families | 1,017 (6.4%) | $94,196 |
| 6-Person Families | 254 (1.6%) | $103,500 |
| 7+ Person Families | 149 (0.9%) | $100,938 |
| Total | 15,850 (100.0%) | $76,519 |
Family Income by Number of Earners in Columbia County
The median family income in Columbia County is $76,519, with families comprising 3+ earners (1,352) having the highest median family income of $134,403, while families with no earners (2,872) have the lowest median family income of $40,160, accounting for 8.5% and 18.1% of families, respectively.
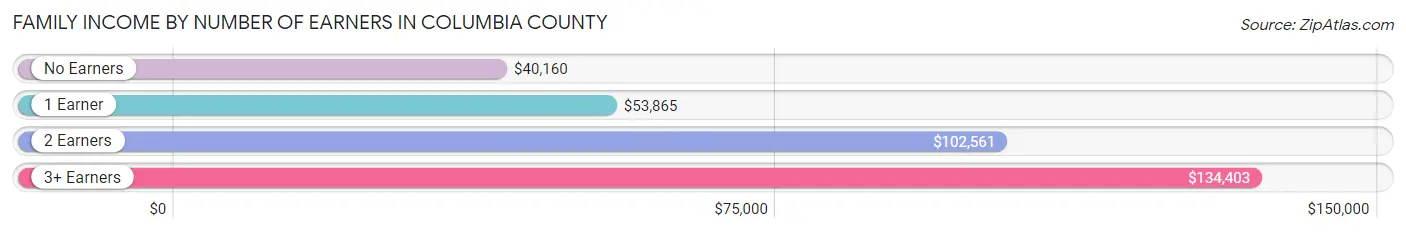
| Number of Earners | # Families | Median Income |
| No Earners | 2,872 (18.1%) | $40,160 |
| 1 Earner | 5,203 (32.8%) | $53,865 |
| 2 Earners | 6,423 (40.5%) | $102,561 |
| 3+ Earners | 1,352 (8.5%) | $134,403 |
| Total | 15,850 (100.0%) | $76,519 |
Household Income in Columbia County
Household Income Brackets in Columbia County
With 4,762 households falling in the category, the $50,000 to $74,999 income range is the most frequent in Columbia County, accounting for 18.4% of all households. In contrast, only 1,242 households (4.8%) fall into the $200,000+ income bracket, making it the least populous group.
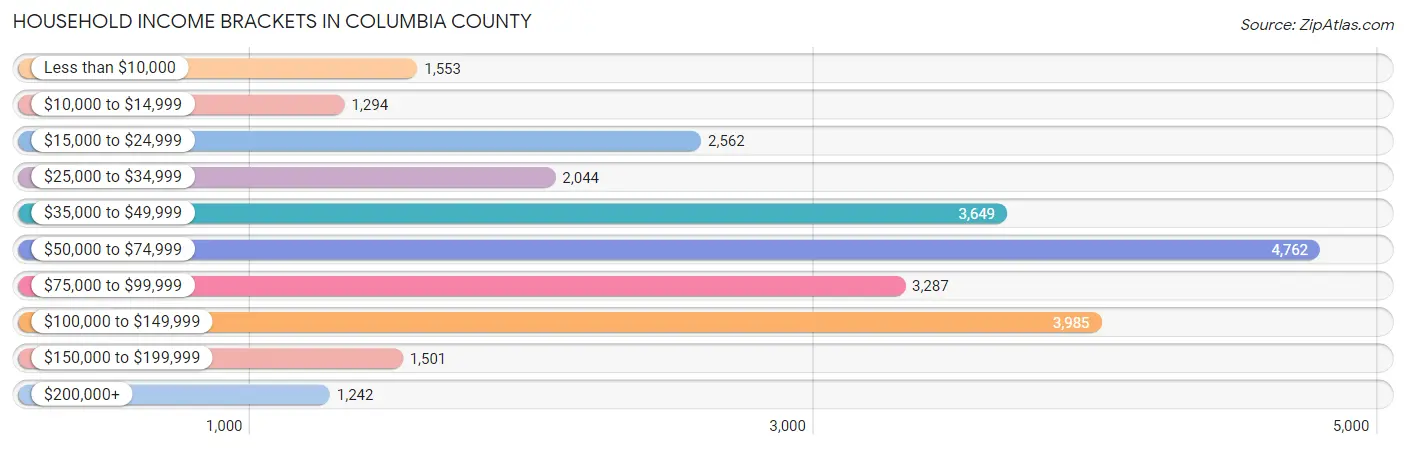
| Income Bracket | # Households | % Households |
| Less than $10,000 | 1,553 | 6.0% |
| $10,000 to $14,999 | 1,294 | 5.0% |
| $15,000 to $24,999 | 2,562 | 9.9% |
| $25,000 to $34,999 | 2,044 | 7.9% |
| $35,000 to $49,999 | 3,649 | 14.1% |
| $50,000 to $74,999 | 4,762 | 18.4% |
| $75,000 to $99,999 | 3,287 | 12.7% |
| $100,000 to $149,999 | 3,985 | 15.4% |
| $150,000 to $199,999 | 1,501 | 5.8% |
| $200,000+ | 1,242 | 4.8% |
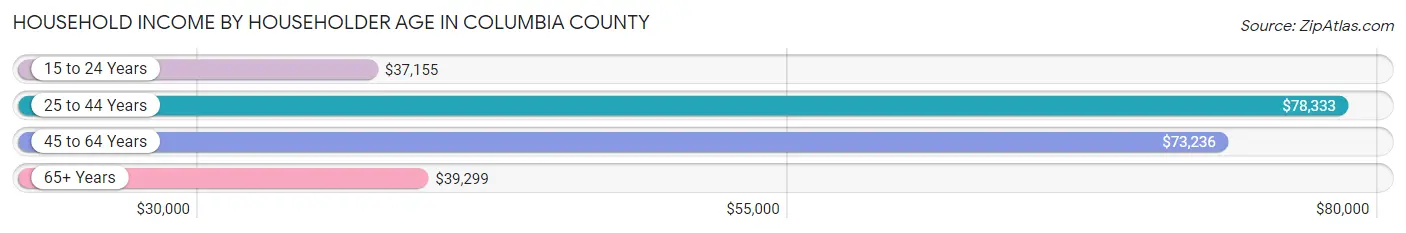
Household Income by Householder Age in Columbia County
The median household income in Columbia County is $59,457, with the highest median household income of $78,333 found in the 25 to 44 years age bracket for the primary householder. A total of 6,640 households (25.7%) fall into this category. Meanwhile, the 15 to 24 years age bracket for the primary householder has the lowest median household income of $37,155, with 1,570 households (6.1%) in this group.
| Income Bracket | # Households | Median Income |
| 15 to 24 Years | 1,570 (6.1%) | $37,155 |
| 25 to 44 Years | 6,640 (25.7%) | $78,333 |
| 45 to 64 Years | 9,665 (37.3%) | $73,236 |
| 65+ Years | 8,003 (30.9%) | $39,299 |
| Total | 25,878 (100.0%) | $59,457 |
Poverty in Columbia County
Income Below Poverty by Sex and Age in Columbia County
With 14.1% poverty level for males and 16.4% for females among the residents of Columbia County, 18 to 24 year old males and 18 to 24 year old females are the most vulnerable to poverty, with 1,173 males (38.7%) and 1,330 females (35.6%) in their respective age groups living below the poverty level.
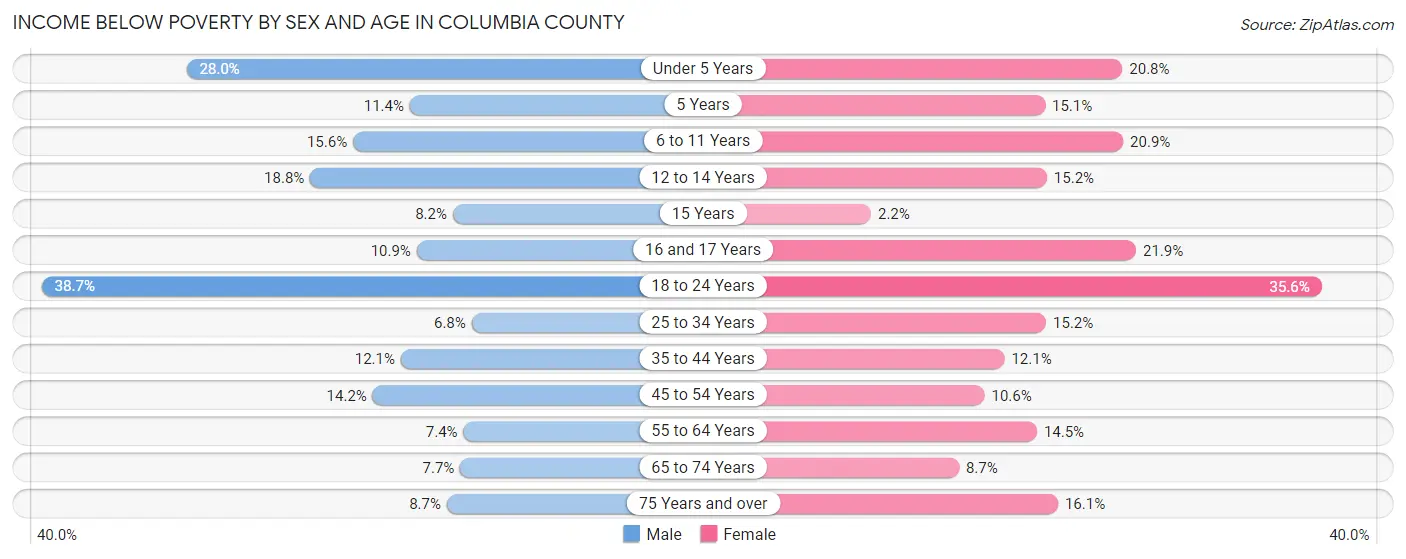
| Age Bracket | Male | Female |
| Under 5 Years | 390 (28.0%) | 290 (20.8%) |
| 5 Years | 39 (11.4%) | 32 (15.1%) |
| 6 to 11 Years | 288 (15.6%) | 349 (20.9%) |
| 12 to 14 Years | 197 (18.8%) | 182 (15.2%) |
| 15 Years | 23 (8.2%) | 8 (2.2%) |
| 16 and 17 Years | 88 (10.9%) | 144 (21.8%) |
| 18 to 24 Years | 1,173 (38.7%) | 1,330 (35.6%) |
| 25 to 34 Years | 246 (6.8%) | 498 (15.2%) |
| 35 to 44 Years | 425 (12.1%) | 408 (12.1%) |
| 45 to 54 Years | 550 (14.2%) | 414 (10.6%) |
| 55 to 64 Years | 319 (7.4%) | 649 (14.5%) |
| 65 to 74 Years | 267 (7.7%) | 343 (8.7%) |
| 75 Years and over | 177 (8.6%) | 484 (16.1%) |
| Total | 4,182 (14.1%) | 5,131 (16.4%) |
Income Above Poverty by Sex and Age in Columbia County
According to the poverty statistics in Columbia County, males aged 25 to 34 years and females aged 15 years are the age groups that are most secure financially, with 93.2% of males and 97.8% of females in these age groups living above the poverty line.
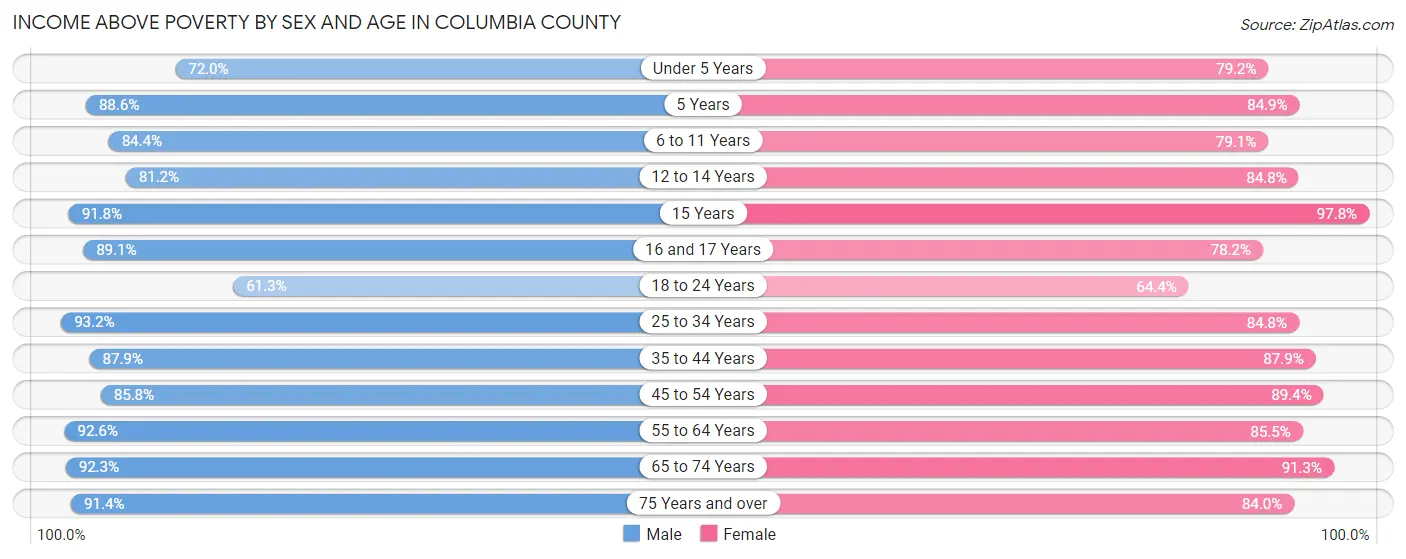
| Age Bracket | Male | Female |
| Under 5 Years | 1,004 (72.0%) | 1,102 (79.2%) |
| 5 Years | 303 (88.6%) | 180 (84.9%) |
| 6 to 11 Years | 1,556 (84.4%) | 1,322 (79.1%) |
| 12 to 14 Years | 851 (81.2%) | 1,013 (84.8%) |
| 15 Years | 257 (91.8%) | 360 (97.8%) |
| 16 and 17 Years | 720 (89.1%) | 515 (78.1%) |
| 18 to 24 Years | 1,856 (61.3%) | 2,404 (64.4%) |
| 25 to 34 Years | 3,364 (93.2%) | 2,784 (84.8%) |
| 35 to 44 Years | 3,097 (87.9%) | 2,970 (87.9%) |
| 45 to 54 Years | 3,335 (85.8%) | 3,490 (89.4%) |
| 55 to 64 Years | 3,978 (92.6%) | 3,829 (85.5%) |
| 65 to 74 Years | 3,220 (92.3%) | 3,599 (91.3%) |
| 75 Years and over | 1,870 (91.3%) | 2,532 (84.0%) |
| Total | 25,411 (85.9%) | 26,100 (83.6%) |
Income Below Poverty Among Married-Couple Families in Columbia County
The poverty statistics for married-couple families in Columbia County show that 3.9% or 466 of the total 11,953 families live below the poverty line. Families with 5 or more children have the highest poverty rate of 20.8%, comprising of 25 families. On the other hand, families with 1 or 2 children have the lowest poverty rate of 3.4%, which includes 108 families.
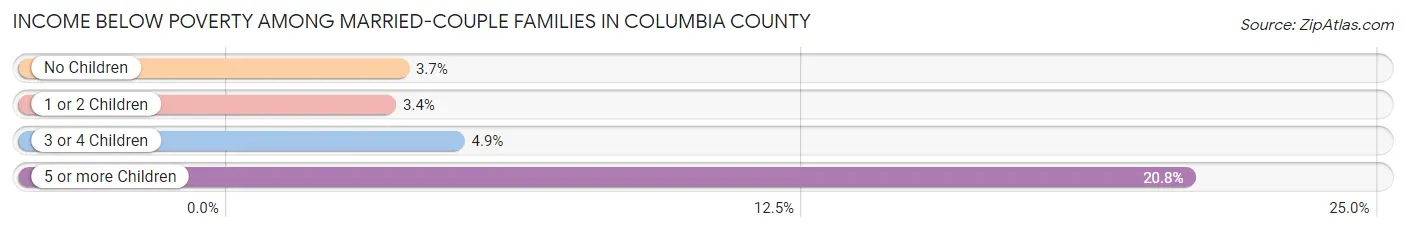
| Children | Above Poverty | Below Poverty |
| No Children | 7,627 (96.3%) | 295 (3.7%) |
| 1 or 2 Children | 3,032 (96.6%) | 108 (3.4%) |
| 3 or 4 Children | 733 (95.1%) | 38 (4.9%) |
| 5 or more Children | 95 (79.2%) | 25 (20.8%) |
| Total | 11,487 (96.1%) | 466 (3.9%) |
Income Below Poverty Among Single-Parent Households in Columbia County
According to the poverty data in Columbia County, 13.9% or 171 single-father households and 29.7% or 791 single-mother households are living below the poverty line. Among single-father households, those with 3 or 4 children have the highest poverty rate, with 43 households (28.5%) experiencing poverty. Likewise, among single-mother households, those with 3 or 4 children have the highest poverty rate, with 177 households (64.8%) falling below the poverty line.
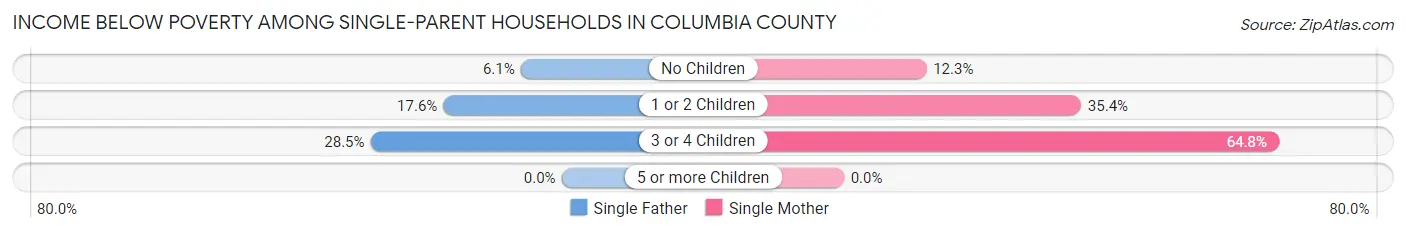
| Children | Single Father | Single Mother |
| No Children | 33 (6.1%) | 123 (12.3%) |
| 1 or 2 Children | 95 (17.6%) | 491 (35.3%) |
| 3 or 4 Children | 43 (28.5%) | 177 (64.8%) |
| 5 or more Children | 0 (0.0%) | 0 (0.0%) |
| Total | 171 (13.9%) | 791 (29.7%) |
Income Below Poverty Among Married-Couple vs Single-Parent Households in Columbia County
The poverty data for Columbia County shows that 466 of the married-couple family households (3.9%) and 962 of the single-parent households (24.7%) are living below the poverty level. Within the married-couple family households, those with 5 or more children have the highest poverty rate, with 25 households (20.8%) falling below the poverty line. Among the single-parent households, those with 3 or 4 children have the highest poverty rate, with 220 household (51.9%) living below poverty.
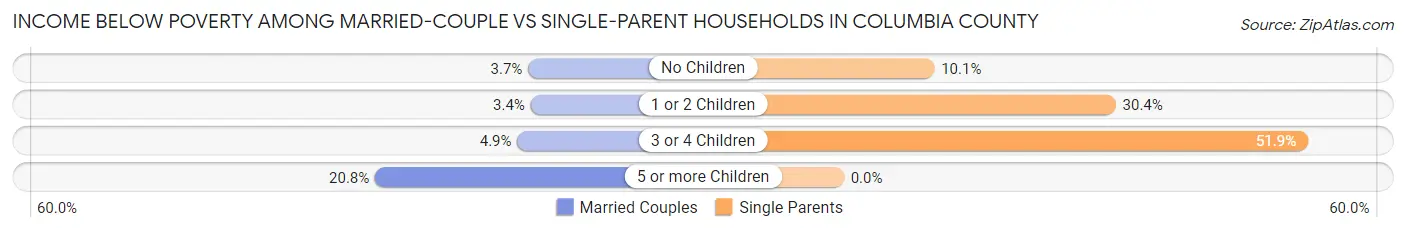
| Children | Married-Couple Families | Single-Parent Households |
| No Children | 295 (3.7%) | 156 (10.1%) |
| 1 or 2 Children | 108 (3.4%) | 586 (30.4%) |
| 3 or 4 Children | 38 (4.9%) | 220 (51.9%) |
| 5 or more Children | 25 (20.8%) | 0 (0.0%) |
| Total | 466 (3.9%) | 962 (24.7%) |
Race in Columbia County
The most populous races in Columbia County are White / Caucasian (60,451 | 93.1%), Hispanic or Latino (2,219 | 3.4%), and Two or more Races (1,889 | 2.9%).
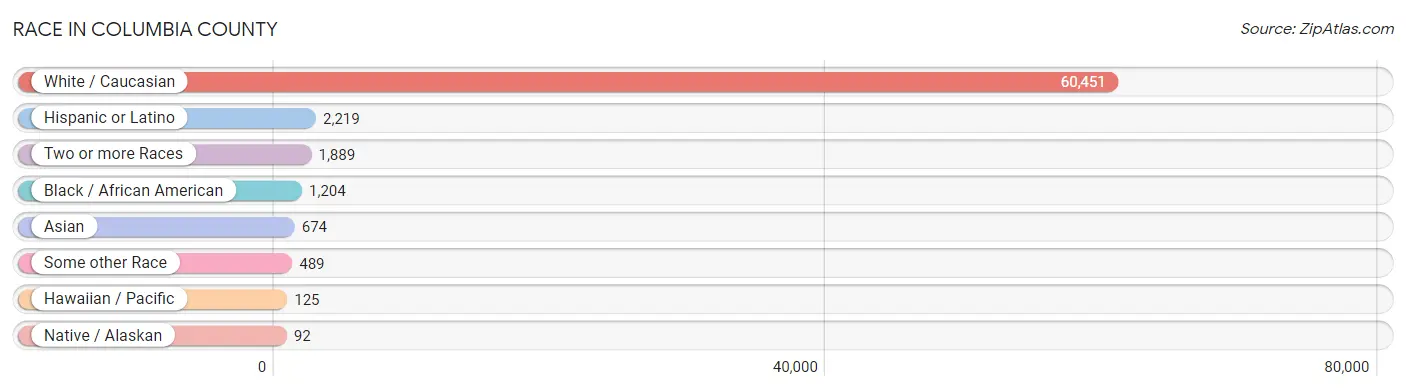
| Race | # Population | % Population |
| Asian | 674 | 1.0% |
| Black / African American | 1,204 | 1.8% |
| Hawaiian / Pacific | 125 | 0.2% |
| Hispanic or Latino | 2,219 | 3.4% |
| Native / Alaskan | 92 | 0.1% |
| White / Caucasian | 60,451 | 93.1% |
| Two or more Races | 1,889 | 2.9% |
| Some other Race | 489 | 0.7% |
| Total | 64,924 | 100.0% |
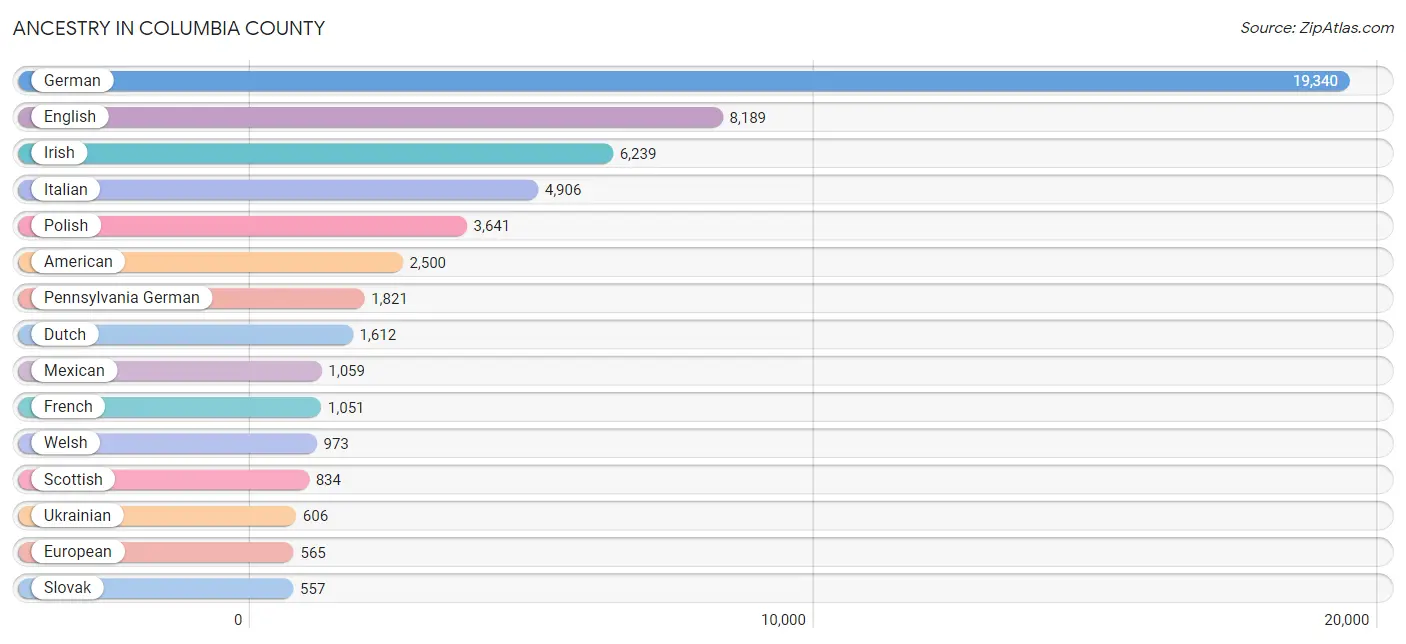
Ancestry in Columbia County
The most populous ancestries reported in Columbia County are German (19,340 | 29.8%), English (8,189 | 12.6%), Irish (6,239 | 9.6%), Italian (4,906 | 7.6%), and Polish (3,641 | 5.6%), together accounting for 65.2% of all Columbia County residents.
| Ancestry | # Population | % Population |
| African | 49 | 0.1% |
| Albanian | 5 | 0.0% |
| Alsatian | 10 | 0.0% |
| American | 2,500 | 3.8% |
| Arab | 178 | 0.3% |
| Argentinean | 16 | 0.0% |
| Armenian | 11 | 0.0% |
| Australian | 40 | 0.1% |
| Austrian | 148 | 0.2% |
| Belgian | 3 | 0.0% |
| Bhutanese | 78 | 0.1% |
| Blackfeet | 19 | 0.0% |
| Brazilian | 7 | 0.0% |
| British | 270 | 0.4% |
| British West Indian | 89 | 0.1% |
| Bulgarian | 18 | 0.0% |
| Burmese | 47 | 0.1% |
| Canadian | 21 | 0.0% |
| Carpatho Rusyn | 7 | 0.0% |
| Central American | 43 | 0.1% |
| Central American Indian | 3 | 0.0% |
| Cherokee | 124 | 0.2% |
| Chilean | 7 | 0.0% |
| Colombian | 89 | 0.1% |
| Costa Rican | 1 | 0.0% |
| Croatian | 18 | 0.0% |
| Crow | 1 | 0.0% |
| Cuban | 36 | 0.1% |
| Czech | 117 | 0.2% |
| Czechoslovakian | 78 | 0.1% |
| Danish | 9 | 0.0% |
| Delaware | 3 | 0.0% |
| Dominican | 76 | 0.1% |
| Dutch | 1,612 | 2.5% |
| Dutch West Indian | 1 | 0.0% |
| Eastern European | 135 | 0.2% |
| Ecuadorian | 120 | 0.2% |
| Egyptian | 66 | 0.1% |
| English | 8,189 | 12.6% |
| European | 565 | 0.9% |
| Filipino | 19 | 0.0% |
| Finnish | 28 | 0.0% |
| French | 1,051 | 1.6% |
| French Canadian | 51 | 0.1% |
| German | 19,340 | 29.8% |
| Greek | 81 | 0.1% |
| Guyanese | 9 | 0.0% |
| Haitian | 7 | 0.0% |
| Honduran | 32 | 0.1% |
| Hungarian | 317 | 0.5% |
| Indian (Asian) | 122 | 0.2% |
| Iranian | 36 | 0.1% |
| Irish | 6,239 | 9.6% |
| Iroquois | 11 | 0.0% |
| Italian | 4,906 | 7.6% |
| Jamaican | 34 | 0.1% |
| Korean | 146 | 0.2% |
| Laotian | 21 | 0.0% |
| Latvian | 12 | 0.0% |
| Lebanese | 103 | 0.2% |
| Lithuanian | 438 | 0.7% |
| Luxembourger | 2 | 0.0% |
| Maltese | 17 | 0.0% |
| Mexican | 1,059 | 1.6% |
| Mexican American Indian | 66 | 0.1% |
| Native Hawaiian | 36 | 0.1% |
| Northern European | 40 | 0.1% |
| Norwegian | 304 | 0.5% |
| Pakistani | 38 | 0.1% |
| Pennsylvania German | 1,821 | 2.8% |
| Peruvian | 138 | 0.2% |
| Polish | 3,641 | 5.6% |
| Portuguese | 61 | 0.1% |
| Puerto Rican | 392 | 0.6% |
| Romanian | 34 | 0.1% |
| Russian | 319 | 0.5% |
| Salvadoran | 10 | 0.0% |
| Scandinavian | 66 | 0.1% |
| Scotch-Irish | 378 | 0.6% |
| Scottish | 834 | 1.3% |
| Serbian | 8 | 0.0% |
| Sioux | 14 | 0.0% |
| Slavic | 38 | 0.1% |
| Slovak | 557 | 0.9% |
| Slovene | 31 | 0.1% |
| South American | 383 | 0.6% |
| South American Indian | 100 | 0.2% |
| Spaniard | 47 | 0.1% |
| Spanish | 19 | 0.0% |
| Sri Lankan | 96 | 0.2% |
| Subsaharan African | 58 | 0.1% |
| Swedish | 165 | 0.3% |
| Swiss | 189 | 0.3% |
| Thai | 166 | 0.3% |
| Trinidadian and Tobagonian | 92 | 0.1% |
| Turkish | 19 | 0.0% |
| Ukrainian | 606 | 0.9% |
| Venezuelan | 13 | 0.0% |
| Welsh | 973 | 1.5% |
| West Indian | 3 | 0.0% |
| Yugoslavian | 8 | 0.0% | View All 101 Rows |
Immigrants in Columbia County
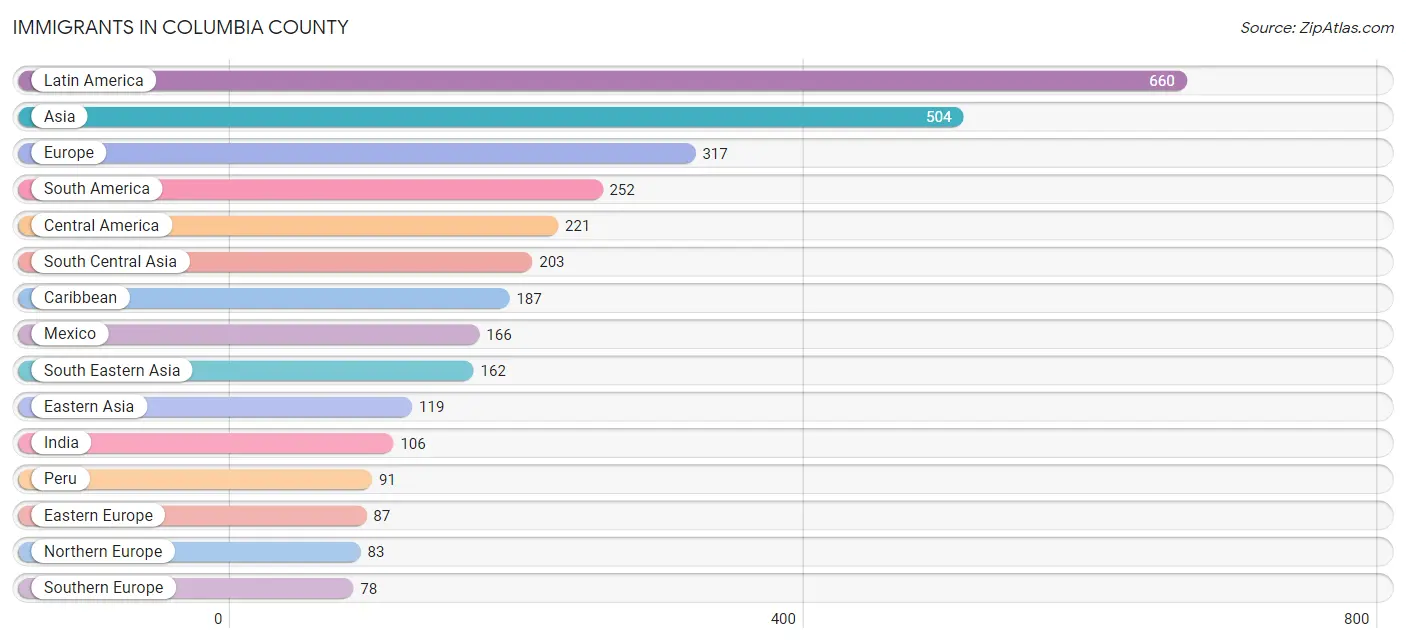
The most numerous immigrant groups reported in Columbia County came from Latin America (660 | 1.0%), Asia (504 | 0.8%), Europe (317 | 0.5%), South America (252 | 0.4%), and Central America (221 | 0.3%), together accounting for 3.0% of all Columbia County residents.
| Immigration Origin | # Population | % Population |
| Africa | 18 | 0.0% |
| Argentina | 16 | 0.0% |
| Asia | 504 | 0.8% |
| Bangladesh | 27 | 0.0% |
| Belgium | 2 | 0.0% |
| Brazil | 10 | 0.0% |
| Bulgaria | 18 | 0.0% |
| Canada | 19 | 0.0% |
| Caribbean | 187 | 0.3% |
| Central America | 221 | 0.3% |
| China | 69 | 0.1% |
| Colombia | 72 | 0.1% |
| Costa Rica | 26 | 0.0% |
| Cuba | 1 | 0.0% |
| Czechoslovakia | 4 | 0.0% |
| Dominican Republic | 55 | 0.1% |
| Eastern Asia | 119 | 0.2% |
| Eastern Europe | 87 | 0.1% |
| Ecuador | 53 | 0.1% |
| Egypt | 10 | 0.0% |
| El Salvador | 10 | 0.0% |
| England | 54 | 0.1% |
| Europe | 317 | 0.5% |
| France | 9 | 0.0% |
| Germany | 35 | 0.1% |
| Greece | 3 | 0.0% |
| Guatemala | 19 | 0.0% |
| Guyana | 3 | 0.0% |
| Haiti | 15 | 0.0% |
| India | 106 | 0.2% |
| Iran | 43 | 0.1% |
| Ireland | 3 | 0.0% |
| Italy | 75 | 0.1% |
| Jamaica | 6 | 0.0% |
| Japan | 40 | 0.1% |
| Korea | 10 | 0.0% |
| Latin America | 660 | 1.0% |
| Malaysia | 7 | 0.0% |
| Mexico | 166 | 0.3% |
| Middle Africa | 8 | 0.0% |
| Netherlands | 23 | 0.0% |
| Northern Africa | 10 | 0.0% |
| Northern Europe | 83 | 0.1% |
| Oceania | 6 | 0.0% |
| Pakistan | 27 | 0.0% |
| Peru | 91 | 0.1% |
| Philippines | 50 | 0.1% |
| Poland | 12 | 0.0% |
| Romania | 18 | 0.0% |
| Russia | 30 | 0.1% |
| South America | 252 | 0.4% |
| South Central Asia | 203 | 0.3% |
| South Eastern Asia | 162 | 0.3% |
| Southern Europe | 78 | 0.1% |
| Syria | 9 | 0.0% |
| Taiwan | 32 | 0.1% |
| Thailand | 38 | 0.1% |
| Trinidad and Tobago | 21 | 0.0% |
| Turkey | 8 | 0.0% |
| Ukraine | 5 | 0.0% |
| Venezuela | 7 | 0.0% |
| Vietnam | 67 | 0.1% |
| Western Asia | 17 | 0.0% |
| Western Europe | 69 | 0.1% |
| Zaire | 8 | 0.0% | View All 65 Rows |
Sex and Age in Columbia County
Sex and Age in Columbia County
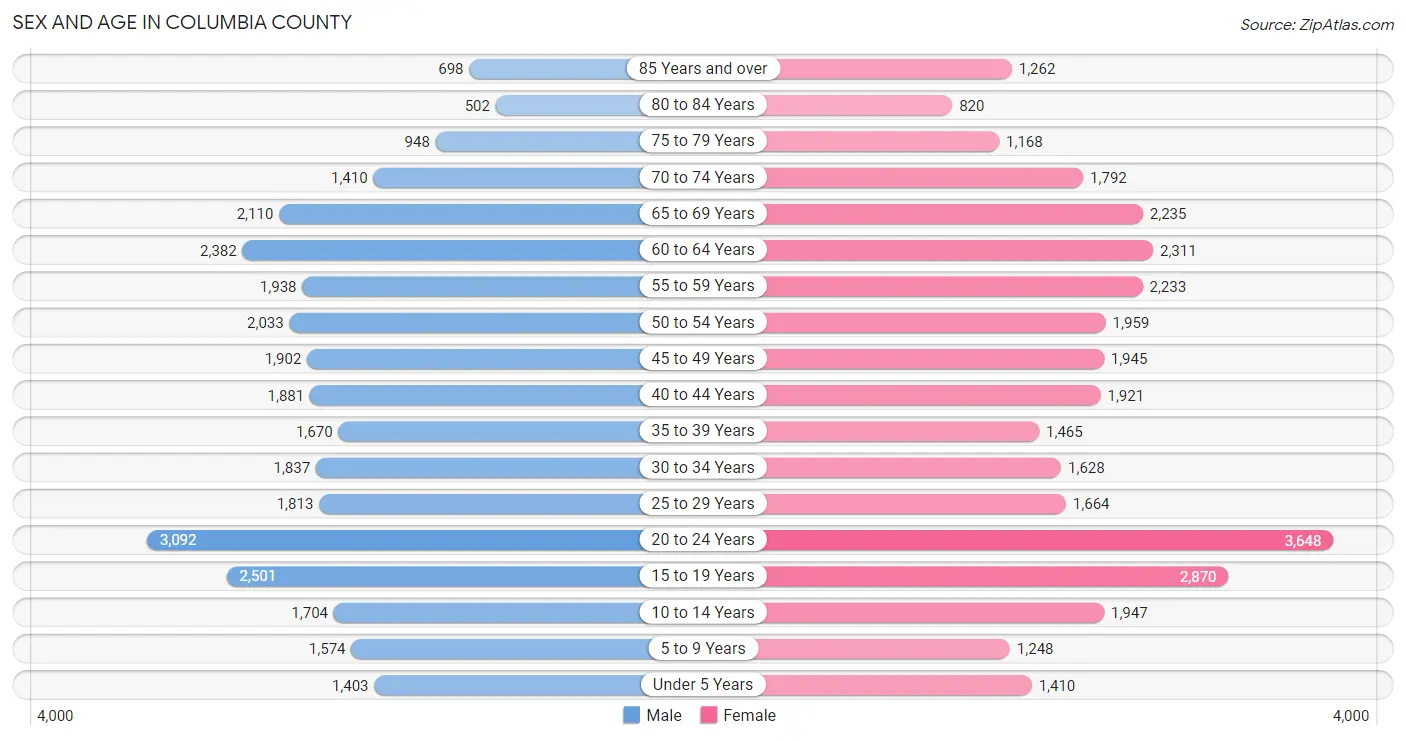
The most populous age groups in Columbia County are 20 to 24 Years (3,092 | 9.9%) for men and 20 to 24 Years (3,648 | 10.9%) for women.
| Age Bracket | Male | Female |
| Under 5 Years | 1,403 (4.5%) | 1,410 (4.2%) |
| 5 to 9 Years | 1,574 (5.0%) | 1,248 (3.7%) |
| 10 to 14 Years | 1,704 (5.4%) | 1,947 (5.8%) |
| 15 to 19 Years | 2,501 (8.0%) | 2,870 (8.6%) |
| 20 to 24 Years | 3,092 (9.9%) | 3,648 (10.9%) |
| 25 to 29 Years | 1,813 (5.8%) | 1,664 (5.0%) |
| 30 to 34 Years | 1,837 (5.9%) | 1,628 (4.9%) |
| 35 to 39 Years | 1,670 (5.3%) | 1,465 (4.4%) |
| 40 to 44 Years | 1,881 (6.0%) | 1,921 (5.7%) |
| 45 to 49 Years | 1,902 (6.1%) | 1,945 (5.8%) |
| 50 to 54 Years | 2,033 (6.5%) | 1,959 (5.8%) |
| 55 to 59 Years | 1,938 (6.2%) | 2,233 (6.7%) |
| 60 to 64 Years | 2,382 (7.6%) | 2,311 (6.9%) |
| 65 to 69 Years | 2,110 (6.7%) | 2,235 (6.7%) |
| 70 to 74 Years | 1,410 (4.5%) | 1,792 (5.3%) |
| 75 to 79 Years | 948 (3.0%) | 1,168 (3.5%) |
| 80 to 84 Years | 502 (1.6%) | 820 (2.5%) |
| 85 Years and over | 698 (2.2%) | 1,262 (3.8%) |
| Total | 31,398 (100.0%) | 33,526 (100.0%) |
Families and Households in Columbia County
Median Family Size in Columbia County
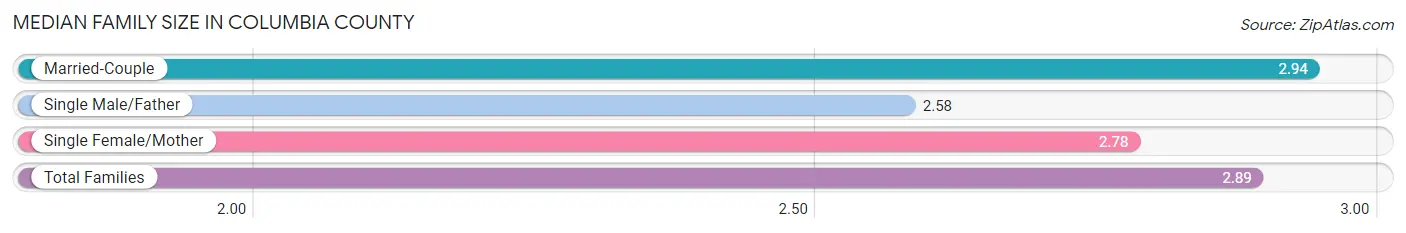
The median family size in Columbia County is 2.89 persons per family, with married-couple families (11,953 | 75.4%) accounting for the largest median family size of 2.94 persons per family. On the other hand, single male/father families (1,235 | 7.8%) represent the smallest median family size with 2.58 persons per family.
| Family Type | # Families | Family Size |
| Married-Couple | 11,953 (75.4%) | 2.94 |
| Single Male/Father | 1,235 (7.8%) | 2.58 |
| Single Female/Mother | 2,662 (16.8%) | 2.78 |
| Total Families | 15,850 (100.0%) | 2.89 |
Median Household Size in Columbia County
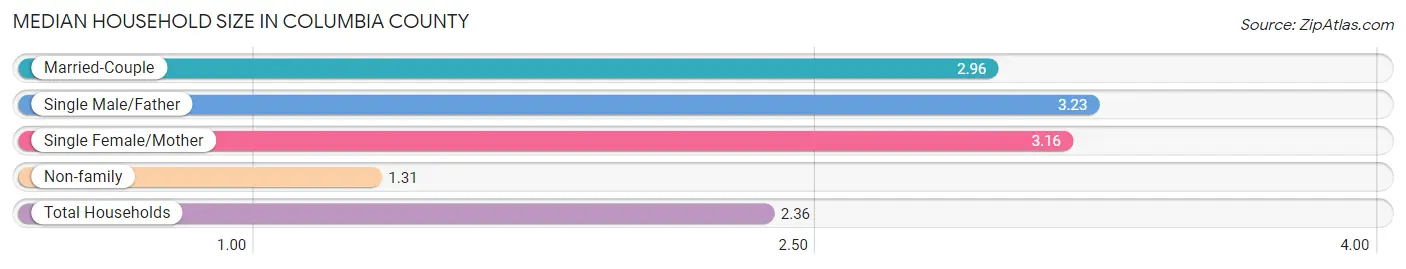
The median household size in Columbia County is 2.36 persons per household, with single male/father households (1,235 | 4.8%) accounting for the largest median household size of 3.23 persons per household. non-family households (10,028 | 38.8%) represent the smallest median household size with 1.31 persons per household.
| Household Type | # Households | Household Size |
| Married-Couple | 11,953 (46.2%) | 2.96 |
| Single Male/Father | 1,235 (4.8%) | 3.23 |
| Single Female/Mother | 2,662 (10.3%) | 3.16 |
| Non-family | 10,028 (38.8%) | 1.31 |
| Total Households | 25,878 (100.0%) | 2.36 |
Household Size by Marriage Status in Columbia County
Out of a total of 25,878 households in Columbia County, 15,850 (61.3%) are family households, while 10,028 (38.8%) are nonfamily households. The most numerous type of family households are 2-person households, comprising 7,454, and the most common type of nonfamily households are 1-person households, comprising 7,993.
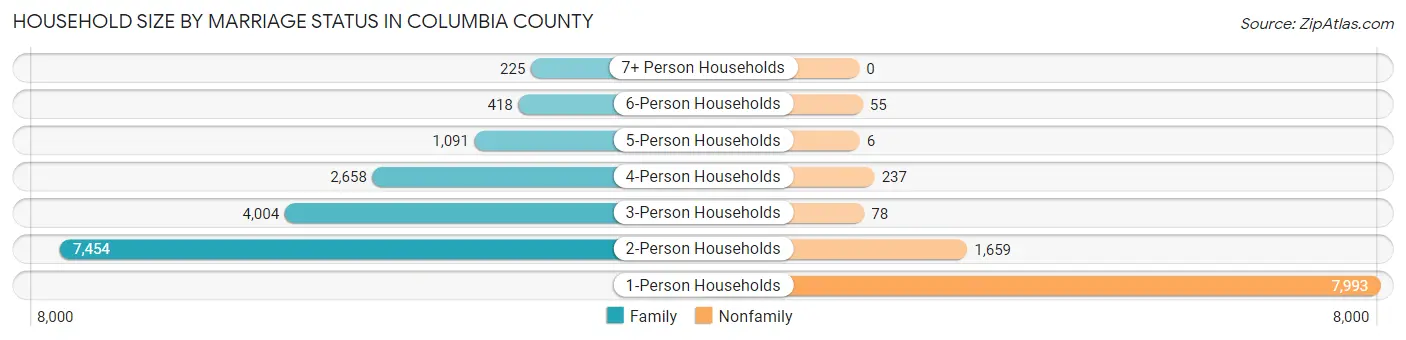
| Household Size | Family Households | Nonfamily Households |
| 1-Person Households | - | 7,993 (30.9%) |
| 2-Person Households | 7,454 (28.8%) | 1,659 (6.4%) |
| 3-Person Households | 4,004 (15.5%) | 78 (0.3%) |
| 4-Person Households | 2,658 (10.3%) | 237 (0.9%) |
| 5-Person Households | 1,091 (4.2%) | 6 (0.0%) |
| 6-Person Households | 418 (1.6%) | 55 (0.2%) |
| 7+ Person Households | 225 (0.9%) | 0 (0.0%) |
| Total | 15,850 (61.3%) | 10,028 (38.8%) |
Female Fertility in Columbia County
Fertility by Age in Columbia County
Average fertility rate in Columbia County is 47.0 births per 1,000 women. Women in the age bracket of 20 to 34 years have the highest fertility rate with 89.0 births per 1,000 women. Women in the age bracket of 20 to 34 years acount for 84.6% of all women with births.
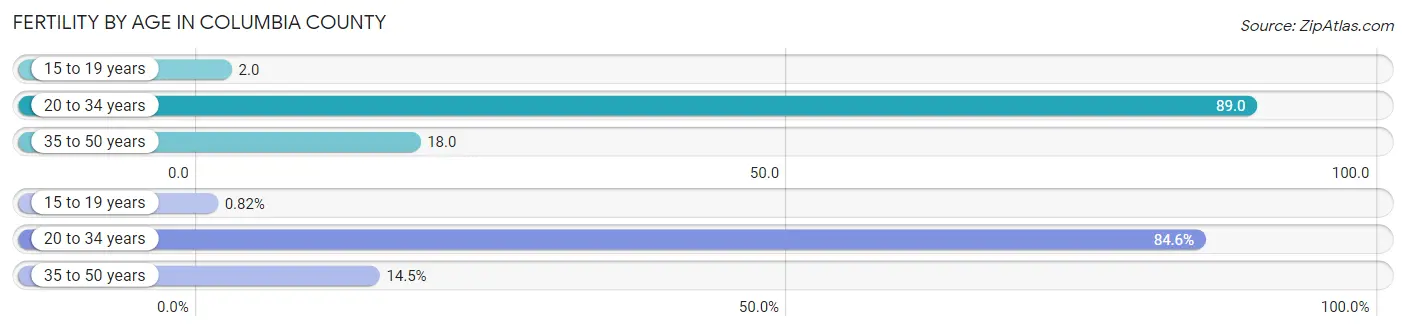
| Age Bracket | Women with Births | Births / 1,000 Women |
| 15 to 19 years | 6 (0.8%) | 2.0 |
| 20 to 34 years | 617 (84.6%) | 89.0 |
| 35 to 50 years | 106 (14.5%) | 18.0 |
| Total | 729 (100.0%) | 47.0 |
Fertility by Age by Marriage Status in Columbia County
46.6% of women with births (729) in Columbia County are married. The highest percentage of unmarried women with births falls into 15 to 19 years age bracket with 100.0% of them unmarried at the time of birth, while the lowest percentage of unmarried women with births belong to 35 to 50 years age bracket with 0.0% of them unmarried.
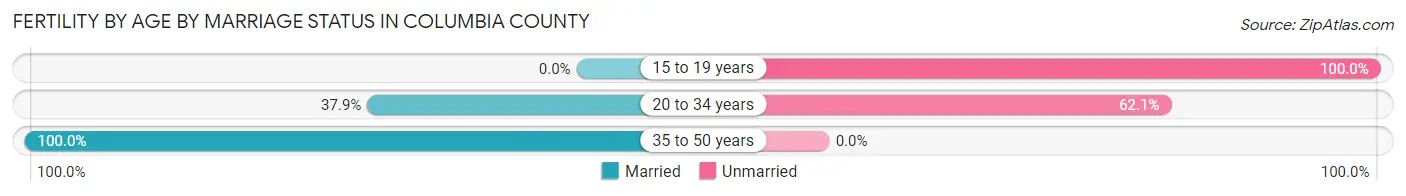
| Age Bracket | Married | Unmarried |
| 15 to 19 years | 0 (0.0%) | 6 (100.0%) |
| 20 to 34 years | 234 (37.9%) | 383 (62.1%) |
| 35 to 50 years | 106 (100.0%) | 0 (0.0%) |
| Total | 340 (46.6%) | 389 (53.4%) |
Fertility by Education in Columbia County
Average fertility rate in Columbia County is 47.0 births per 1,000 women. Women with the education attainment of high school diploma have the highest fertility rate of 73.0 births per 1,000 women, while women with the education attainment of bachelor's degree have the lowest fertility at 28.0 births per 1,000 women. Women with the education attainment of high school diploma represent 46.5% of all women with births.
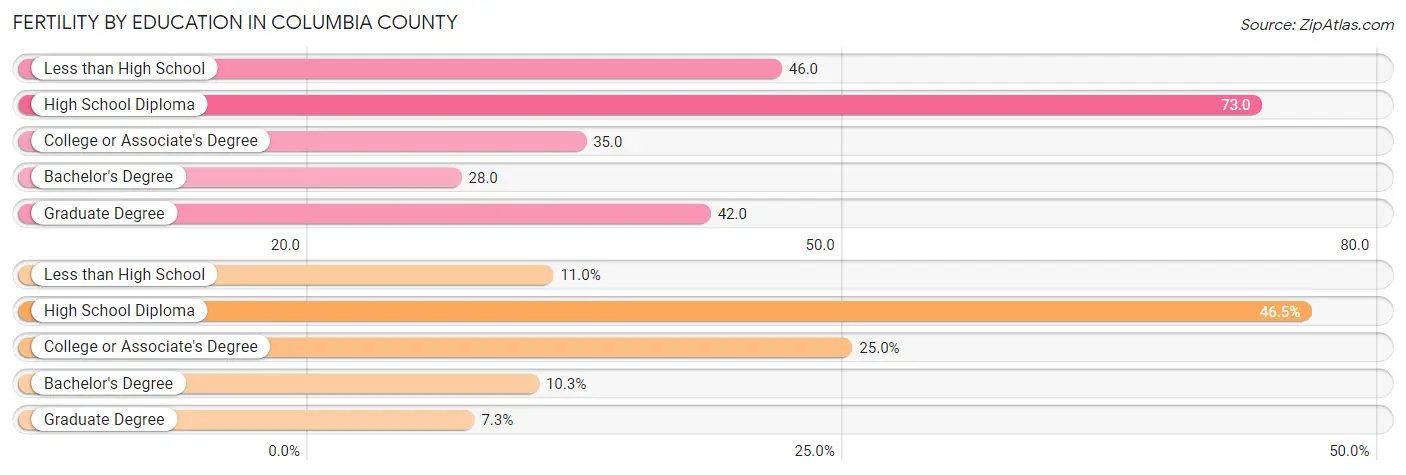
| Educational Attainment | Women with Births | Births / 1,000 Women |
| Less than High School | 80 (11.0%) | 46.0 |
| High School Diploma | 339 (46.5%) | 73.0 |
| College or Associate's Degree | 182 (25.0%) | 35.0 |
| Bachelor's Degree | 75 (10.3%) | 28.0 |
| Graduate Degree | 53 (7.3%) | 42.0 |
| Total | 729 (100.0%) | 47.0 |
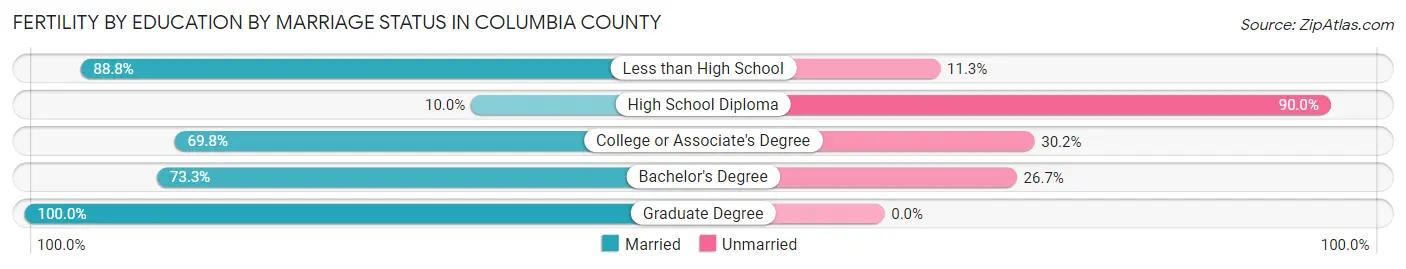
Fertility by Education by Marriage Status in Columbia County
53.4% of women with births in Columbia County are unmarried. Women with the educational attainment of graduate degree are most likely to be married with 100.0% of them married at childbirth, while women with the educational attainment of high school diploma are least likely to be married with 90.0% of them unmarried at childbirth.
| Educational Attainment | Married | Unmarried |
| Less than High School | 71 (88.7%) | 9 (11.3%) |
| High School Diploma | 34 (10.0%) | 305 (90.0%) |
| College or Associate's Degree | 127 (69.8%) | 55 (30.2%) |
| Bachelor's Degree | 55 (73.3%) | 20 (26.7%) |
| Graduate Degree | 53 (100.0%) | 0 (0.0%) |
| Total | 340 (46.6%) | 389 (53.4%) |
Employment Characteristics in Columbia County
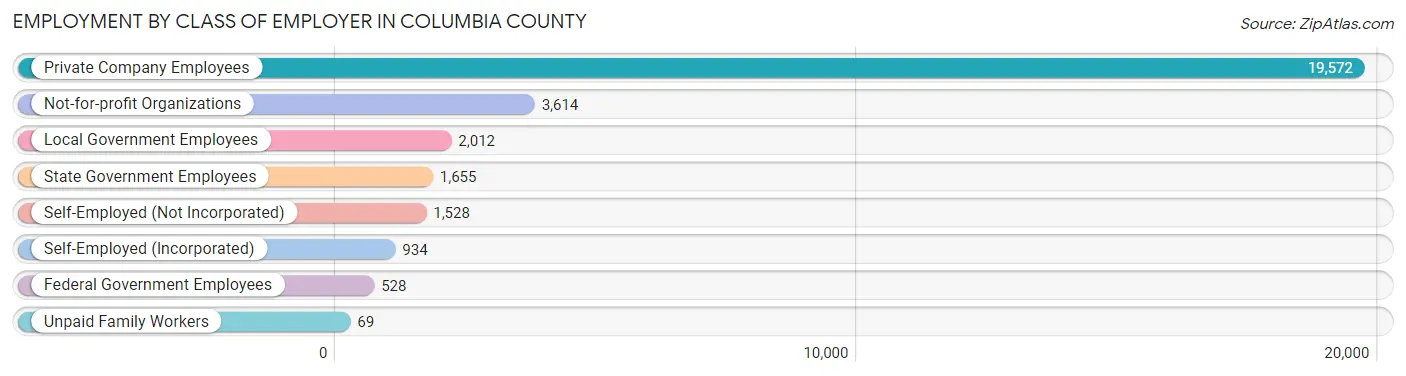
Employment by Class of Employer in Columbia County
Among the 29,912 employed individuals in Columbia County, private company employees (19,572 | 65.4%), not-for-profit organizations (3,614 | 12.1%), and local government employees (2,012 | 6.7%) make up the most common classes of employment.
| Employer Class | # Employees | % Employees |
| Private Company Employees | 19,572 | 65.4% |
| Self-Employed (Incorporated) | 934 | 3.1% |
| Self-Employed (Not Incorporated) | 1,528 | 5.1% |
| Not-for-profit Organizations | 3,614 | 12.1% |
| Local Government Employees | 2,012 | 6.7% |
| State Government Employees | 1,655 | 5.5% |
| Federal Government Employees | 528 | 1.8% |
| Unpaid Family Workers | 69 | 0.2% |
| Total | 29,912 | 100.0% |
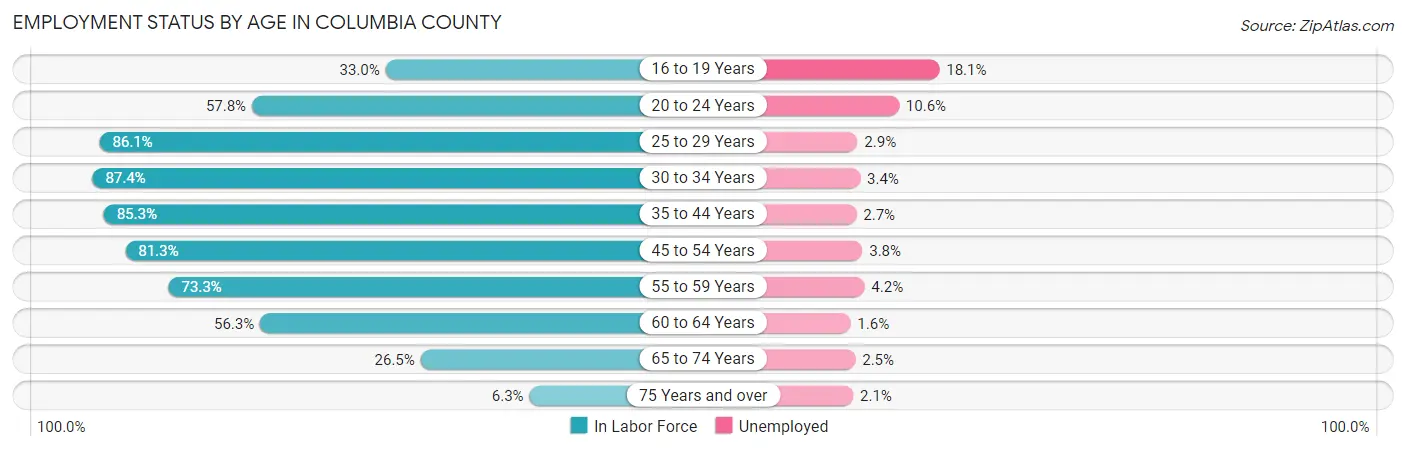
Employment Status by Age in Columbia County
According to the labor force statistics for Columbia County, out of the total population over 16 years of age (54,990), 57.8% or 31,784 individuals are in the labor force, with 4.8% or 1,526 of them unemployed. The age group with the highest labor force participation rate is 30 to 34 years, with 87.4% or 3,028 individuals in the labor force. Within the labor force, the 16 to 19 years age range has the highest percentage of unemployed individuals, with 18.1% or 282 of them being unemployed.
| Age Bracket | In Labor Force | Unemployed |
| 16 to 19 Years | 1,559 (33.0%) | 282 (18.1%) |
| 20 to 24 Years | 3,896 (57.8%) | 413 (10.6%) |
| 25 to 29 Years | 2,994 (86.1%) | 87 (2.9%) |
| 30 to 34 Years | 3,028 (87.4%) | 103 (3.4%) |
| 35 to 44 Years | 5,917 (85.3%) | 160 (2.7%) |
| 45 to 54 Years | 6,373 (81.3%) | 242 (3.8%) |
| 55 to 59 Years | 3,057 (73.3%) | 128 (4.2%) |
| 60 to 64 Years | 2,642 (56.3%) | 42 (1.6%) |
| 65 to 74 Years | 2,000 (26.5%) | 50 (2.5%) |
| 75 Years and over | 340 (6.3%) | 7 (2.1%) |
| Total | 31,784 (57.8%) | 1,526 (4.8%) |
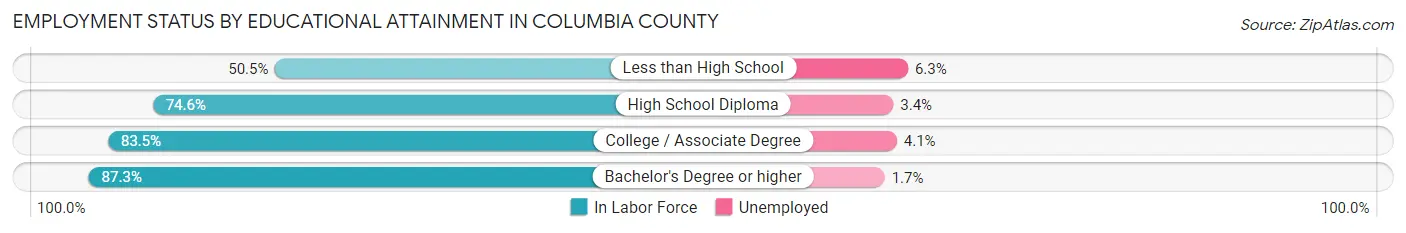
Employment Status by Educational Attainment in Columbia County
According to labor force statistics for Columbia County, 78.5% of individuals (24,007) out of the total population between 25 and 64 years of age (30,582) are in the labor force, with 3.2% or 768 of them being unemployed. The group with the highest labor force participation rate are those with the educational attainment of bachelor's degree or higher, with 87.3% or 7,468 individuals in the labor force. Within the labor force, individuals with less than high school education have the highest percentage of unemployment, with 6.3% or 69 of them being unemployed.
| Educational Attainment | In Labor Force | Unemployed |
| Less than High School | 1,103 (50.5%) | 138 (6.3%) |
| High School Diploma | 9,529 (74.6%) | 434 (3.4%) |
| College / Associate Degree | 5,904 (83.5%) | 290 (4.1%) |
| Bachelor's Degree or higher | 7,468 (87.3%) | 145 (1.7%) |
| Total | 24,007 (78.5%) | 979 (3.2%) |
Employment Occupations by Sex in Columbia County
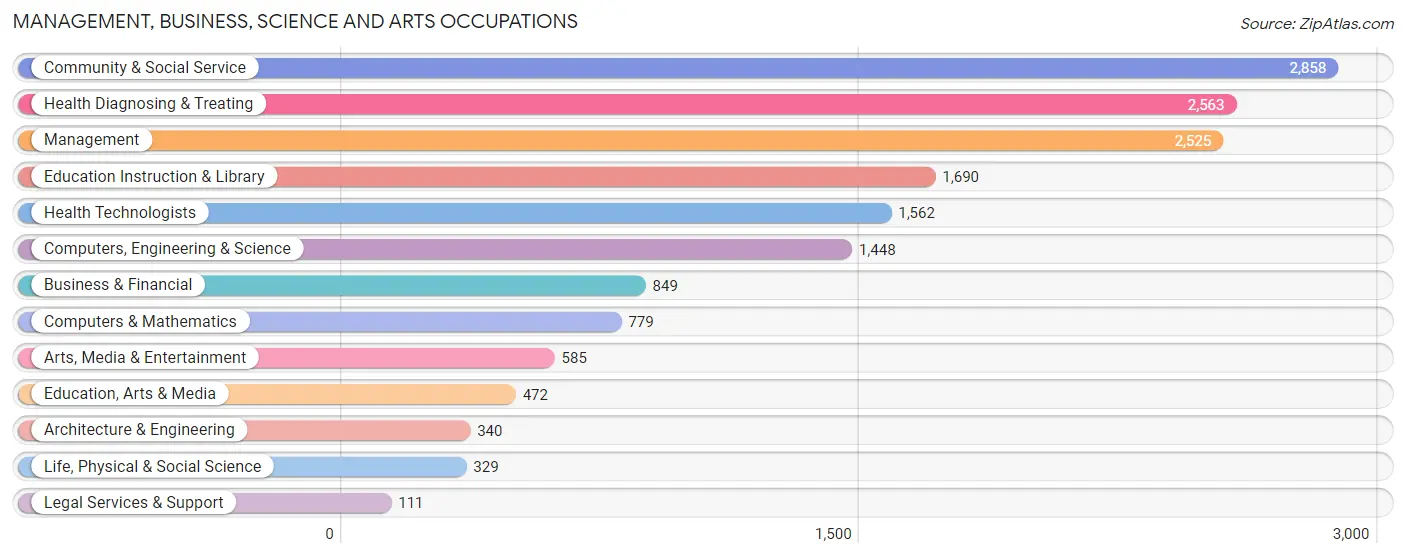
Management, Business, Science and Arts Occupations
The most common Management, Business, Science and Arts occupations in Columbia County are Community & Social Service (2,858 | 9.5%), Health Diagnosing & Treating (2,563 | 8.5%), Management (2,525 | 8.4%), Education Instruction & Library (1,690 | 5.6%), and Health Technologists (1,562 | 5.2%).
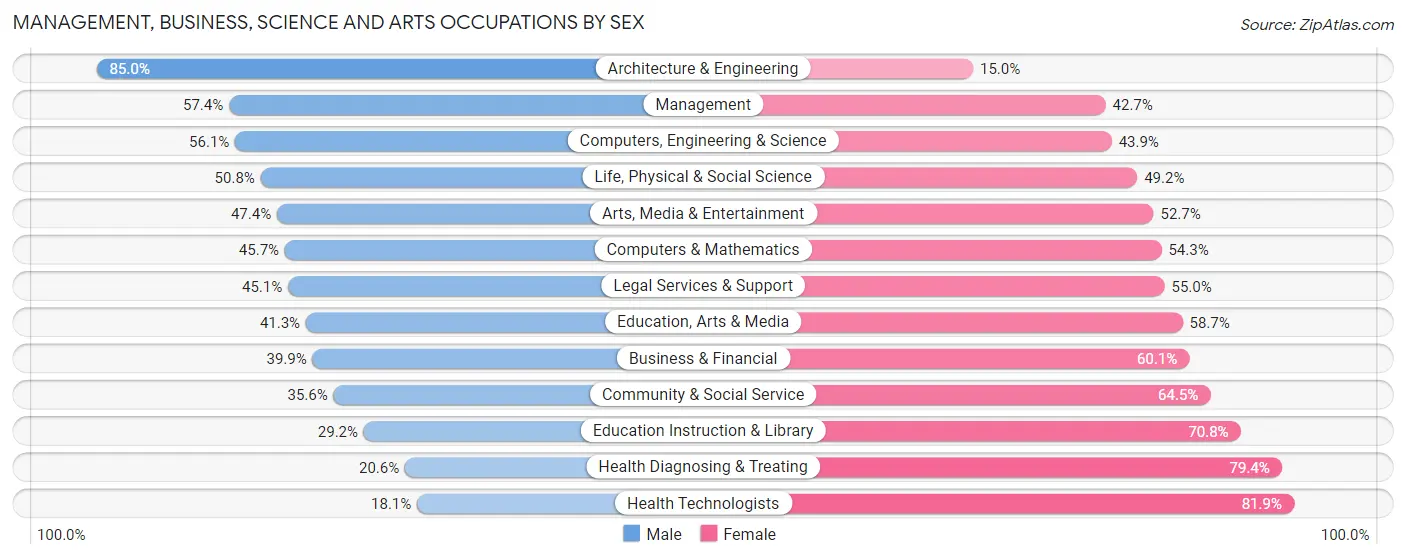
Management, Business, Science and Arts Occupations by Sex
Within the Management, Business, Science and Arts occupations in Columbia County, the most male-oriented occupations are Architecture & Engineering (85.0%), Management (57.4%), and Computers, Engineering & Science (56.1%), while the most female-oriented occupations are Health Technologists (81.9%), Health Diagnosing & Treating (79.4%), and Education Instruction & Library (70.8%).
| Occupation | Male | Female |
| Management | 1,448 (57.4%) | 1,077 (42.6%) |
| Business & Financial | 339 (39.9%) | 510 (60.1%) |
| Computers, Engineering & Science | 812 (56.1%) | 636 (43.9%) |
| Computers & Mathematics | 356 (45.7%) | 423 (54.3%) |
| Architecture & Engineering | 289 (85.0%) | 51 (15.0%) |
| Life, Physical & Social Science | 167 (50.8%) | 162 (49.2%) |
| Community & Social Service | 1,016 (35.5%) | 1,842 (64.4%) |
| Education, Arts & Media | 195 (41.3%) | 277 (58.7%) |
| Legal Services & Support | 50 (45.1%) | 61 (54.9%) |
| Education Instruction & Library | 494 (29.2%) | 1,196 (70.8%) |
| Arts, Media & Entertainment | 277 (47.3%) | 308 (52.6%) |
| Health Diagnosing & Treating | 529 (20.6%) | 2,034 (79.4%) |
| Health Technologists | 283 (18.1%) | 1,279 (81.9%) |
| Total (Category) | 4,144 (40.5%) | 6,099 (59.5%) |
| Total (Overall) | 14,659 (48.5%) | 15,581 (51.5%) |
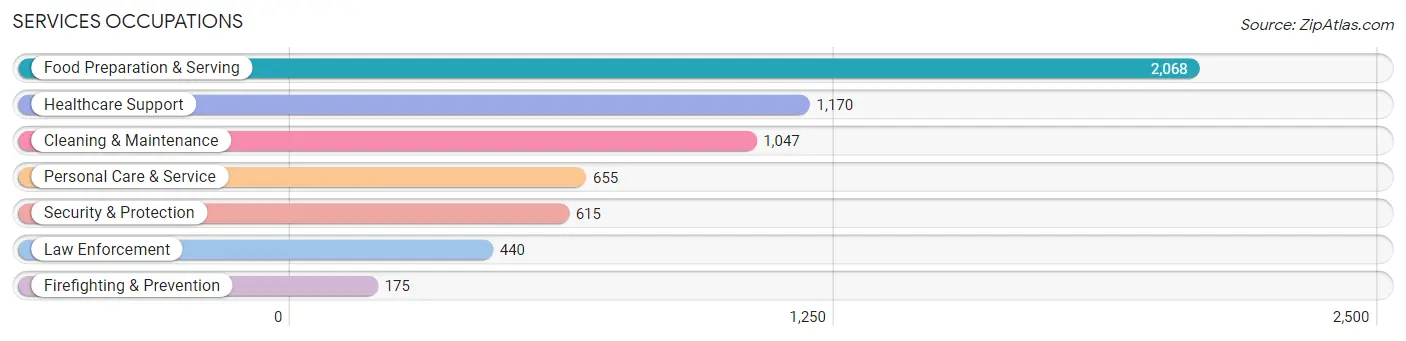
Services Occupations
The most common Services occupations in Columbia County are Food Preparation & Serving (2,068 | 6.8%), Healthcare Support (1,170 | 3.9%), Cleaning & Maintenance (1,047 | 3.5%), Personal Care & Service (655 | 2.2%), and Security & Protection (615 | 2.0%).
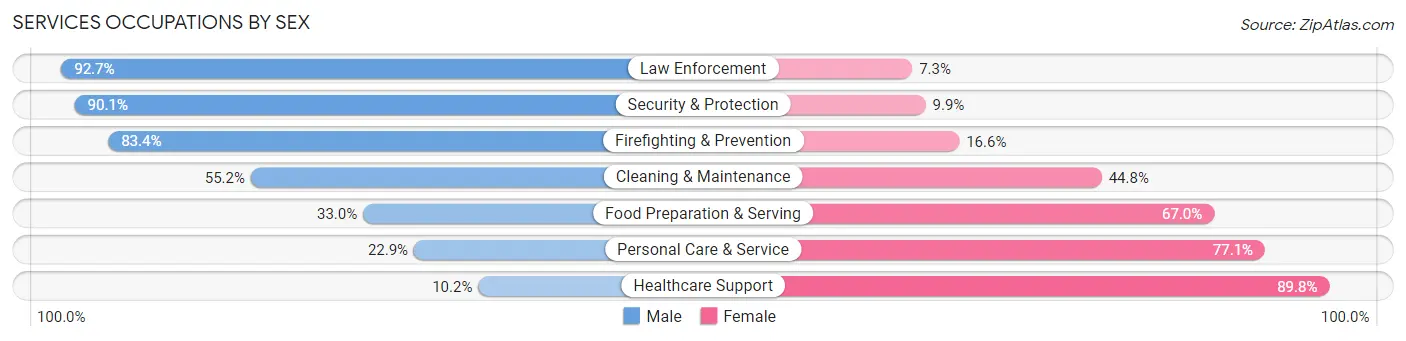
Services Occupations by Sex
Within the Services occupations in Columbia County, the most male-oriented occupations are Law Enforcement (92.7%), Security & Protection (90.1%), and Firefighting & Prevention (83.4%), while the most female-oriented occupations are Healthcare Support (89.8%), Personal Care & Service (77.1%), and Food Preparation & Serving (67.0%).
| Occupation | Male | Female |
| Healthcare Support | 119 (10.2%) | 1,051 (89.8%) |
| Security & Protection | 554 (90.1%) | 61 (9.9%) |
| Firefighting & Prevention | 146 (83.4%) | 29 (16.6%) |
| Law Enforcement | 408 (92.7%) | 32 (7.3%) |
| Food Preparation & Serving | 682 (33.0%) | 1,386 (67.0%) |
| Cleaning & Maintenance | 578 (55.2%) | 469 (44.8%) |
| Personal Care & Service | 150 (22.9%) | 505 (77.1%) |
| Total (Category) | 2,083 (37.5%) | 3,472 (62.5%) |
| Total (Overall) | 14,659 (48.5%) | 15,581 (51.5%) |
Sales and Office Occupations
The most common Sales and Office occupations in Columbia County are Office & Administration (3,589 | 11.9%), and Sales & Related (2,111 | 7.0%).

Sales and Office Occupations by Sex

| Occupation | Male | Female |
| Sales & Related | 871 (41.3%) | 1,240 (58.7%) |
| Office & Administration | 618 (17.2%) | 2,971 (82.8%) |
| Total (Category) | 1,489 (26.1%) | 4,211 (73.9%) |
| Total (Overall) | 14,659 (48.5%) | 15,581 (51.5%) |
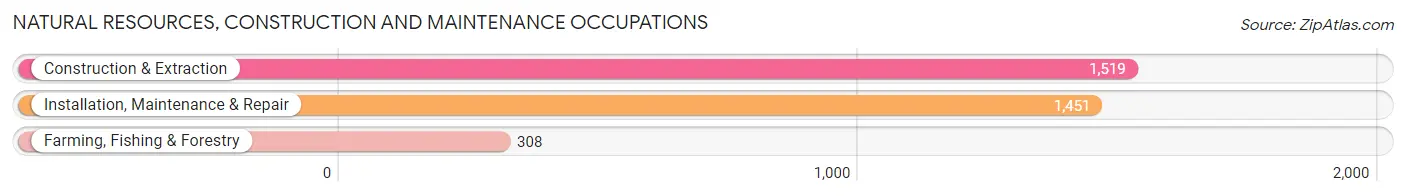
Natural Resources, Construction and Maintenance Occupations
The most common Natural Resources, Construction and Maintenance occupations in Columbia County are Construction & Extraction (1,519 | 5.0%), Installation, Maintenance & Repair (1,451 | 4.8%), and Farming, Fishing & Forestry (308 | 1.0%).
Natural Resources, Construction and Maintenance Occupations by Sex
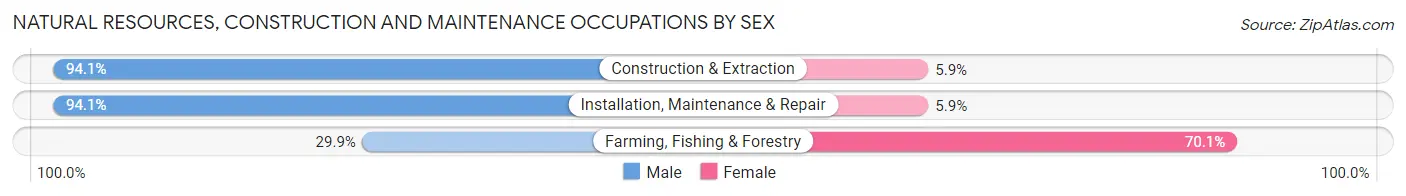
| Occupation | Male | Female |
| Farming, Fishing & Forestry | 92 (29.9%) | 216 (70.1%) |
| Construction & Extraction | 1,429 (94.1%) | 90 (5.9%) |
| Installation, Maintenance & Repair | 1,365 (94.1%) | 86 (5.9%) |
| Total (Category) | 2,886 (88.0%) | 392 (12.0%) |
| Total (Overall) | 14,659 (48.5%) | 15,581 (51.5%) |
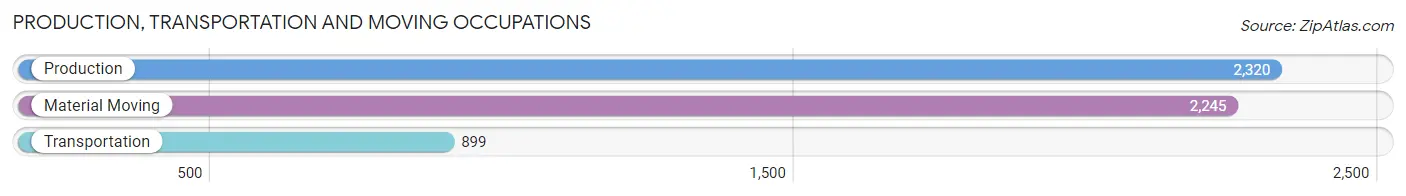
Production, Transportation and Moving Occupations
The most common Production, Transportation and Moving occupations in Columbia County are Production (2,320 | 7.7%), Material Moving (2,245 | 7.4%), and Transportation (899 | 3.0%).
Production, Transportation and Moving Occupations by Sex
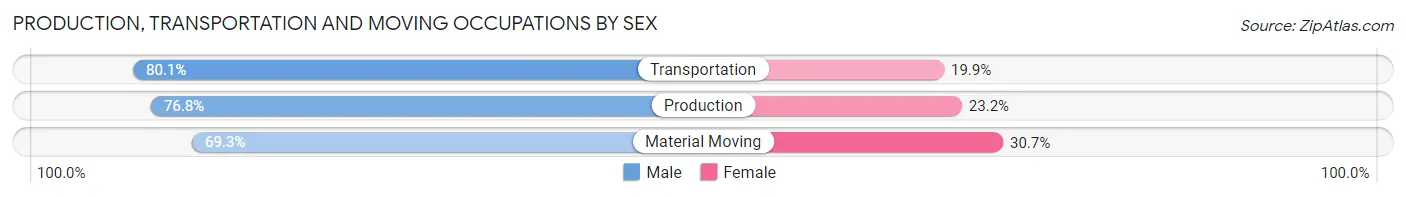
| Occupation | Male | Female |
| Production | 1,782 (76.8%) | 538 (23.2%) |
| Transportation | 720 (80.1%) | 179 (19.9%) |
| Material Moving | 1,555 (69.3%) | 690 (30.7%) |
| Total (Category) | 4,057 (74.3%) | 1,407 (25.8%) |
| Total (Overall) | 14,659 (48.5%) | 15,581 (51.5%) |
Employment Industries by Sex in Columbia County
Employment Industries in Columbia County
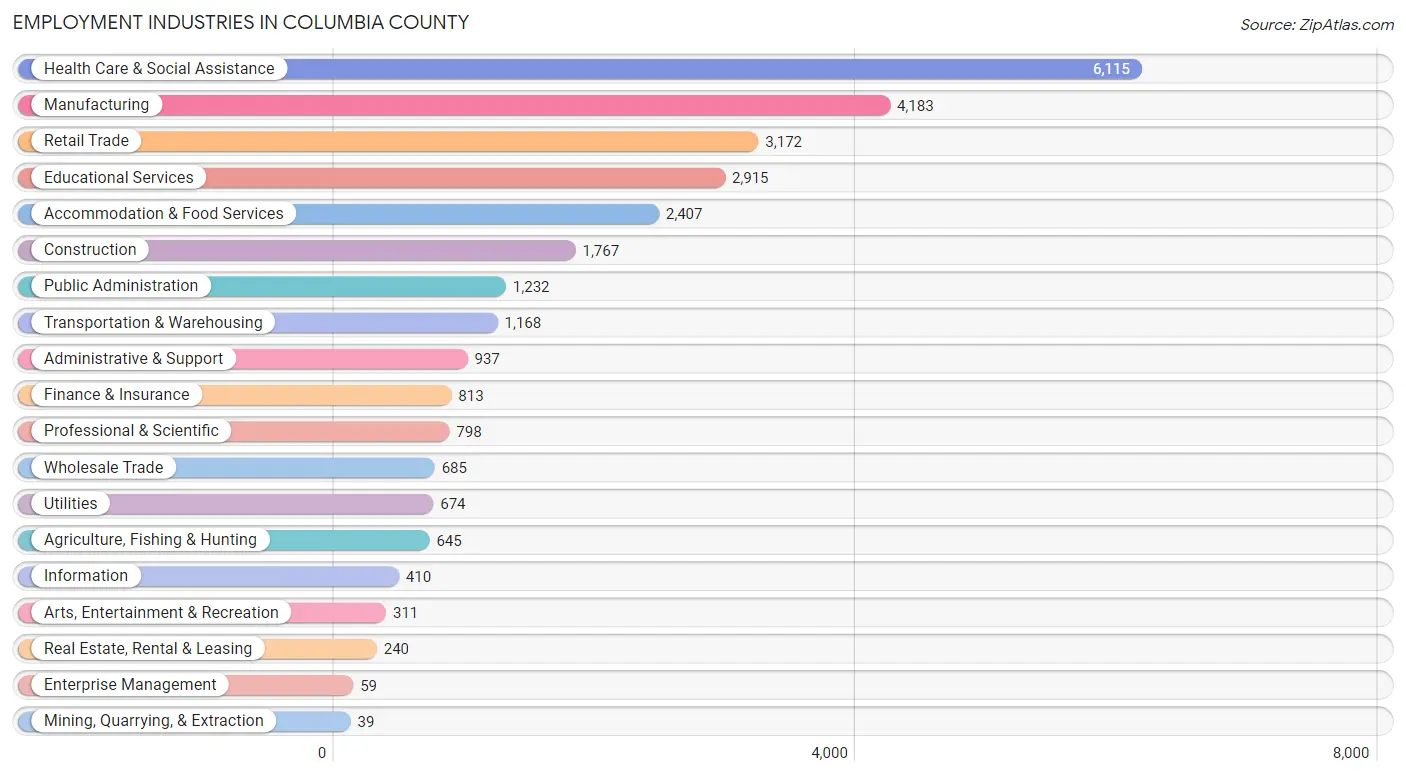
The major employment industries in Columbia County include Health Care & Social Assistance (6,115 | 20.2%), Manufacturing (4,183 | 13.8%), Retail Trade (3,172 | 10.5%), Educational Services (2,915 | 9.6%), and Accommodation & Food Services (2,407 | 8.0%).
Employment Industries by Sex in Columbia County
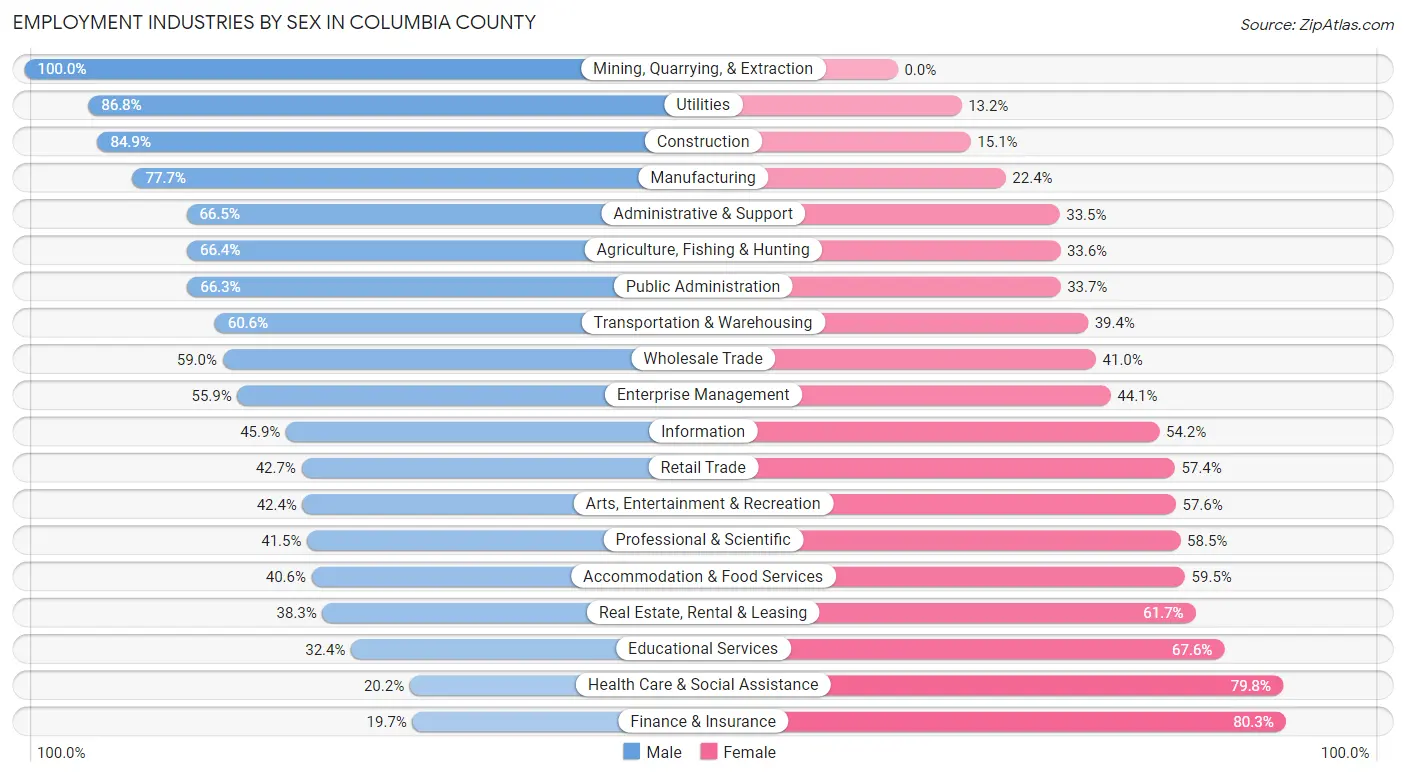
The Columbia County industries that see more men than women are Mining, Quarrying, & Extraction (100.0%), Utilities (86.8%), and Construction (84.9%), whereas the industries that tend to have a higher number of women are Finance & Insurance (80.3%), Health Care & Social Assistance (79.8%), and Educational Services (67.6%).
| Industry | Male | Female |
| Agriculture, Fishing & Hunting | 428 (66.4%) | 217 (33.6%) |
| Mining, Quarrying, & Extraction | 39 (100.0%) | 0 (0.0%) |
| Construction | 1,500 (84.9%) | 267 (15.1%) |
| Manufacturing | 3,248 (77.6%) | 935 (22.4%) |
| Wholesale Trade | 404 (59.0%) | 281 (41.0%) |
| Retail Trade | 1,353 (42.6%) | 1,819 (57.4%) |
| Transportation & Warehousing | 708 (60.6%) | 460 (39.4%) |
| Utilities | 585 (86.8%) | 89 (13.2%) |
| Information | 188 (45.9%) | 222 (54.1%) |
| Finance & Insurance | 160 (19.7%) | 653 (80.3%) |
| Real Estate, Rental & Leasing | 92 (38.3%) | 148 (61.7%) |
| Professional & Scientific | 331 (41.5%) | 467 (58.5%) |
| Enterprise Management | 33 (55.9%) | 26 (44.1%) |
| Administrative & Support | 623 (66.5%) | 314 (33.5%) |
| Educational Services | 944 (32.4%) | 1,971 (67.6%) |
| Health Care & Social Assistance | 1,237 (20.2%) | 4,878 (79.8%) |
| Arts, Entertainment & Recreation | 132 (42.4%) | 179 (57.6%) |
| Accommodation & Food Services | 976 (40.6%) | 1,431 (59.5%) |
| Public Administration | 817 (66.3%) | 415 (33.7%) |
| Total | 14,659 (48.5%) | 15,581 (51.5%) |
Education in Columbia County
School Enrollment in Columbia County
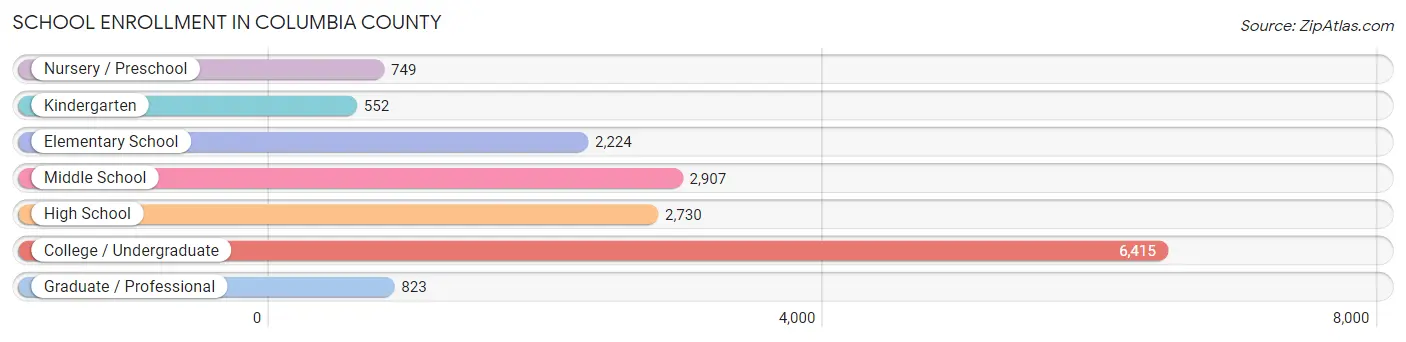
The most common levels of schooling among the 16,400 students in Columbia County are college / undergraduate (6,415 | 39.1%), middle school (2,907 | 17.7%), and high school (2,730 | 16.7%).
| School Level | # Students | % Students |
| Nursery / Preschool | 749 | 4.6% |
| Kindergarten | 552 | 3.4% |
| Elementary School | 2,224 | 13.6% |
| Middle School | 2,907 | 17.7% |
| High School | 2,730 | 16.7% |
| College / Undergraduate | 6,415 | 39.1% |
| Graduate / Professional | 823 | 5.0% |
| Total | 16,400 | 100.0% |
School Enrollment by Age by Funding Source in Columbia County
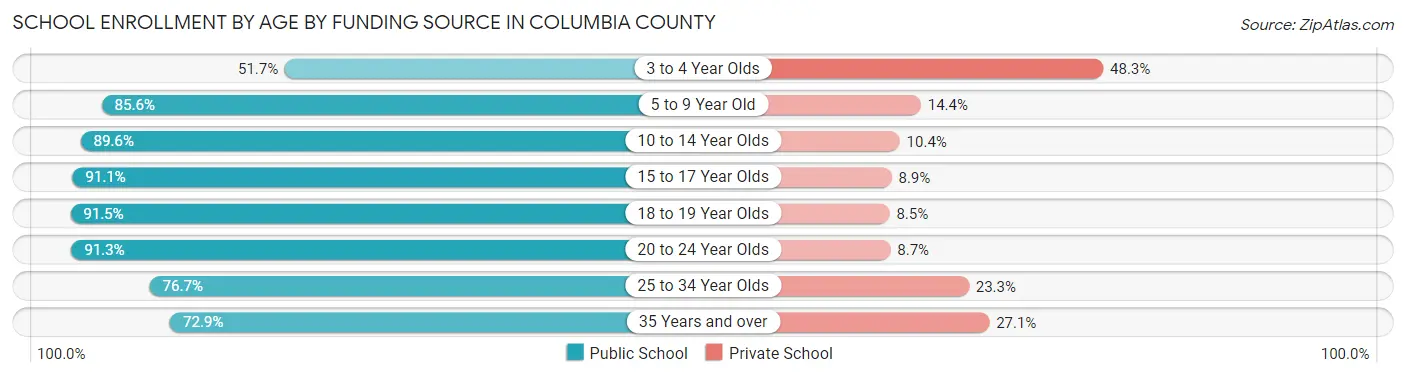
Out of a total of 16,400 students who are enrolled in schools in Columbia County, 2,083 (12.7%) attend a private institution, while the remaining 14,317 (87.3%) are enrolled in public schools. The age group of 3 to 4 year olds has the highest likelihood of being enrolled in private schools, with 318 (48.3% in the age bracket) enrolled. Conversely, the age group of 18 to 19 year olds has the lowest likelihood of being enrolled in a private school, with 2,476 (91.5% in the age bracket) attending a public institution.
| Age Bracket | Public School | Private School |
| 3 to 4 Year Olds | 340 (51.7%) | 318 (48.3%) |
| 5 to 9 Year Old | 2,224 (85.6%) | 373 (14.4%) |
| 10 to 14 Year Olds | 3,203 (89.6%) | 373 (10.4%) |
| 15 to 17 Year Olds | 1,830 (91.1%) | 179 (8.9%) |
| 18 to 19 Year Olds | 2,476 (91.5%) | 231 (8.5%) |
| 20 to 24 Year Olds | 3,423 (91.3%) | 326 (8.7%) |
| 25 to 34 Year Olds | 428 (76.7%) | 130 (23.3%) |
| 35 Years and over | 398 (72.9%) | 148 (27.1%) |
| Total | 14,317 (87.3%) | 2,083 (12.7%) |
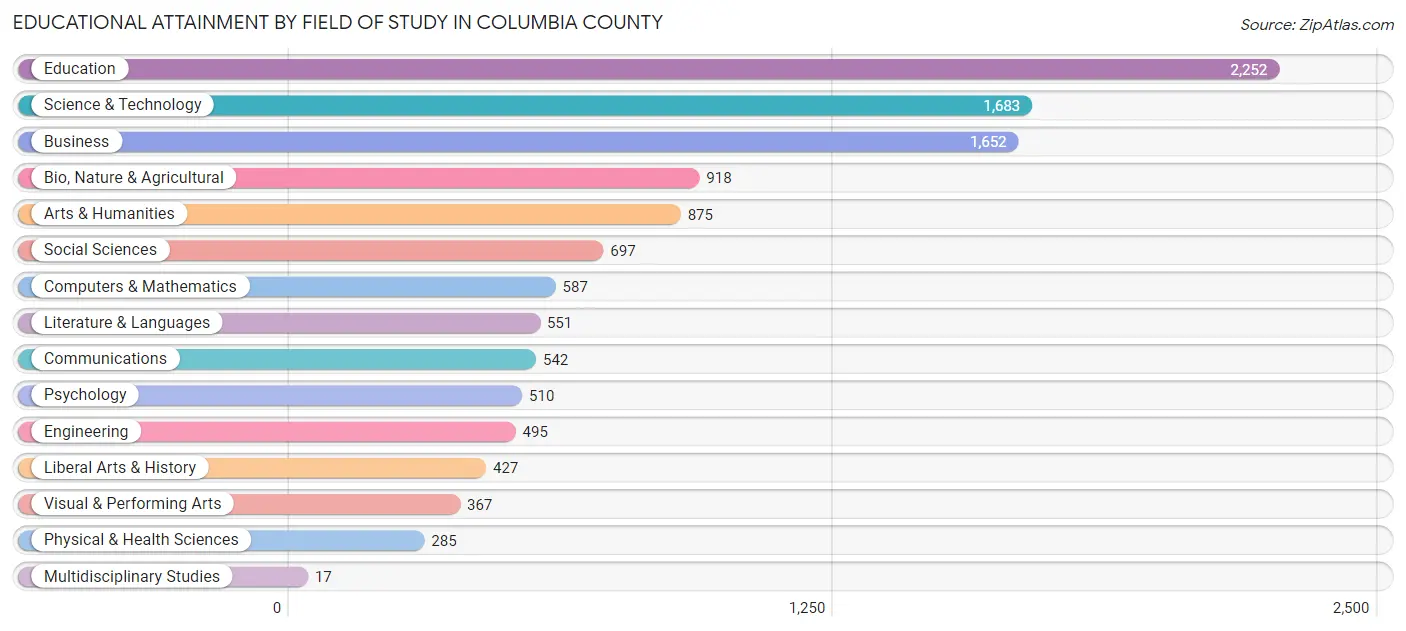
Educational Attainment by Field of Study in Columbia County
Education (2,252 | 19.0%), science & technology (1,683 | 14.2%), business (1,652 | 13.9%), bio, nature & agricultural (918 | 7.7%), and arts & humanities (875 | 7.4%) are the most common fields of study among 11,858 individuals in Columbia County who have obtained a bachelor's degree or higher.
| Field of Study | # Graduates | % Graduates |
| Computers & Mathematics | 587 | 5.0% |
| Bio, Nature & Agricultural | 918 | 7.7% |
| Physical & Health Sciences | 285 | 2.4% |
| Psychology | 510 | 4.3% |
| Social Sciences | 697 | 5.9% |
| Engineering | 495 | 4.2% |
| Multidisciplinary Studies | 17 | 0.1% |
| Science & Technology | 1,683 | 14.2% |
| Business | 1,652 | 13.9% |
| Education | 2,252 | 19.0% |
| Literature & Languages | 551 | 4.6% |
| Liberal Arts & History | 427 | 3.6% |
| Visual & Performing Arts | 367 | 3.1% |
| Communications | 542 | 4.6% |
| Arts & Humanities | 875 | 7.4% |
| Total | 11,858 | 100.0% |
Transportation & Commute in Columbia County
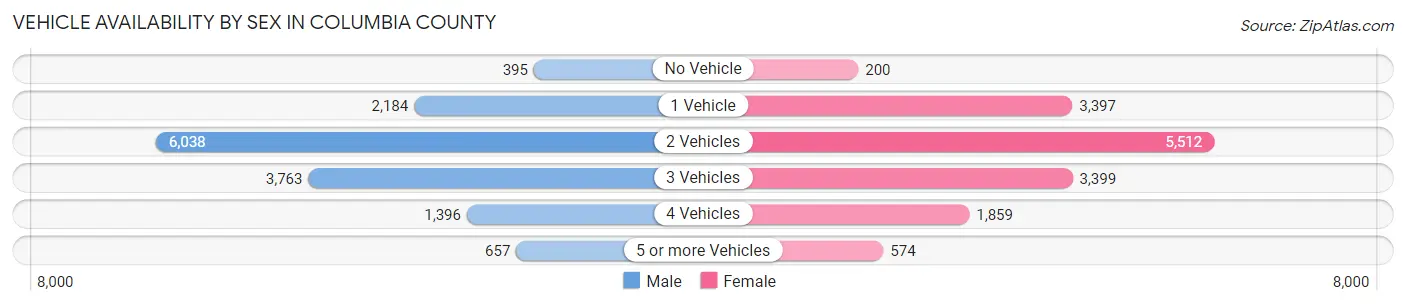
Vehicle Availability by Sex in Columbia County
The most prevalent vehicle ownership categories in Columbia County are males with 2 vehicles (6,038, accounting for 41.8%) and females with 2 vehicles (5,512, making up 40.4%).
| Vehicles Available | Male | Female |
| No Vehicle | 395 (2.7%) | 200 (1.3%) |
| 1 Vehicle | 2,184 (15.1%) | 3,397 (22.7%) |
| 2 Vehicles | 6,038 (41.8%) | 5,512 (36.9%) |
| 3 Vehicles | 3,763 (26.1%) | 3,399 (22.8%) |
| 4 Vehicles | 1,396 (9.7%) | 1,859 (12.4%) |
| 5 or more Vehicles | 657 (4.5%) | 574 (3.8%) |
| Total | 14,433 (100.0%) | 14,941 (100.0%) |
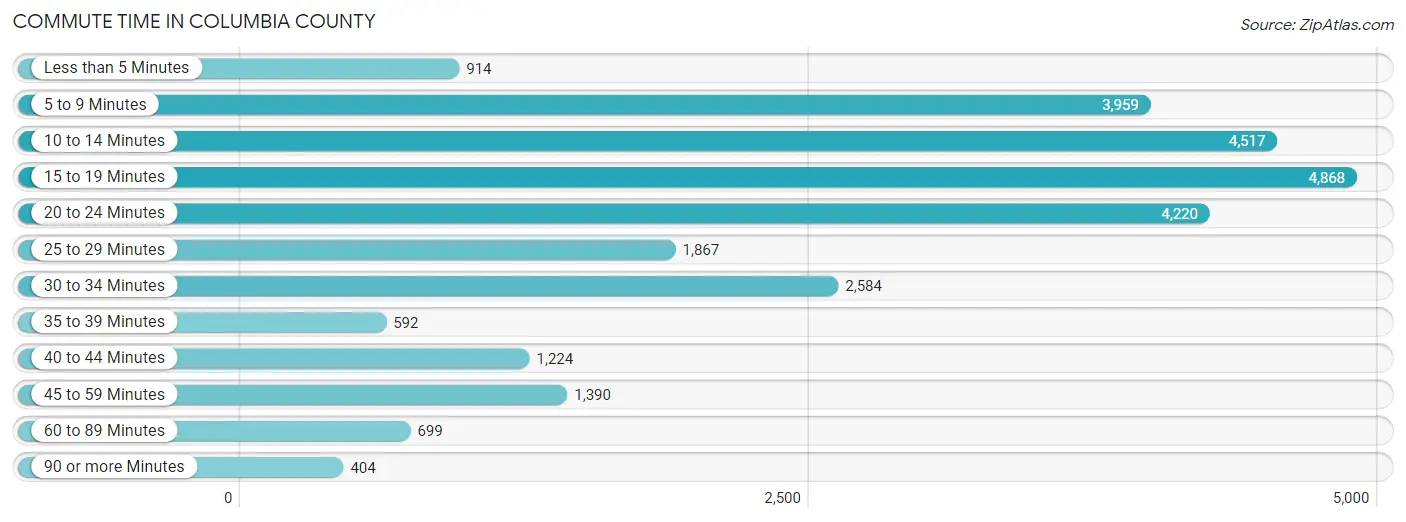
Commute Time in Columbia County
The most frequently occuring commute durations in Columbia County are 15 to 19 minutes (4,868 commuters, 17.9%), 10 to 14 minutes (4,517 commuters, 16.6%), and 20 to 24 minutes (4,220 commuters, 15.5%).
| Commute Time | # Commuters | % Commuters |
| Less than 5 Minutes | 914 | 3.4% |
| 5 to 9 Minutes | 3,959 | 14.5% |
| 10 to 14 Minutes | 4,517 | 16.6% |
| 15 to 19 Minutes | 4,868 | 17.9% |
| 20 to 24 Minutes | 4,220 | 15.5% |
| 25 to 29 Minutes | 1,867 | 6.9% |
| 30 to 34 Minutes | 2,584 | 9.5% |
| 35 to 39 Minutes | 592 | 2.2% |
| 40 to 44 Minutes | 1,224 | 4.5% |
| 45 to 59 Minutes | 1,390 | 5.1% |
| 60 to 89 Minutes | 699 | 2.6% |
| 90 or more Minutes | 404 | 1.5% |
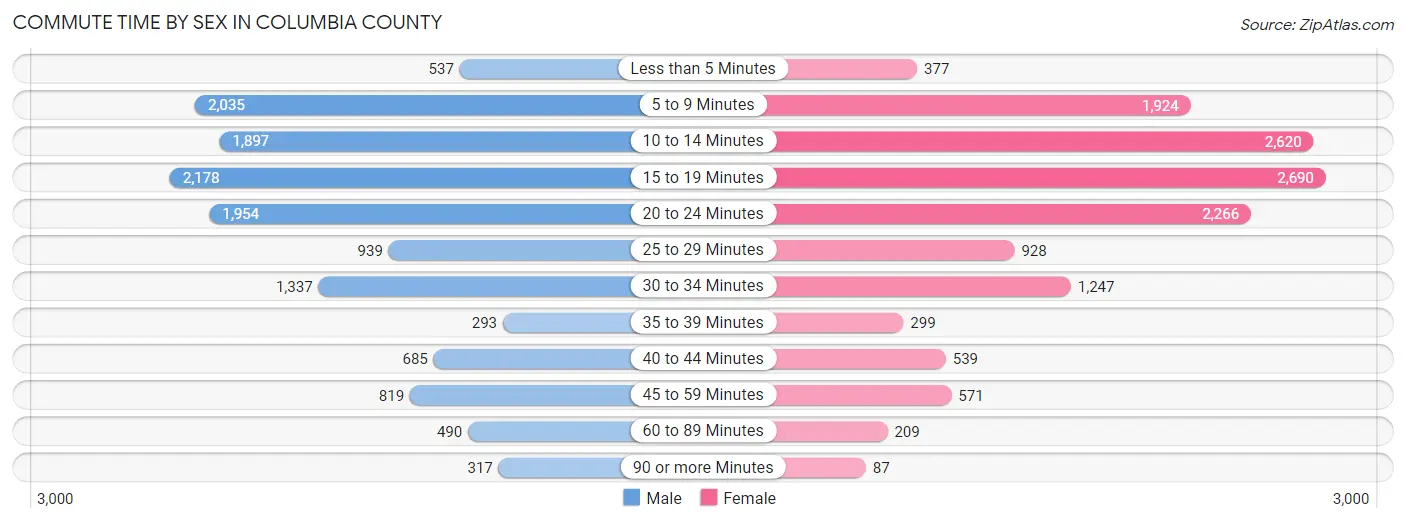
Commute Time by Sex in Columbia County
The most common commute times in Columbia County are 15 to 19 minutes (2,178 commuters, 16.2%) for males and 15 to 19 minutes (2,690 commuters, 19.6%) for females.
| Commute Time | Male | Female |
| Less than 5 Minutes | 537 (4.0%) | 377 (2.7%) |
| 5 to 9 Minutes | 2,035 (15.1%) | 1,924 (14.0%) |
| 10 to 14 Minutes | 1,897 (14.1%) | 2,620 (19.0%) |
| 15 to 19 Minutes | 2,178 (16.2%) | 2,690 (19.6%) |
| 20 to 24 Minutes | 1,954 (14.5%) | 2,266 (16.5%) |
| 25 to 29 Minutes | 939 (7.0%) | 928 (6.8%) |
| 30 to 34 Minutes | 1,337 (9.9%) | 1,247 (9.1%) |
| 35 to 39 Minutes | 293 (2.2%) | 299 (2.2%) |
| 40 to 44 Minutes | 685 (5.1%) | 539 (3.9%) |
| 45 to 59 Minutes | 819 (6.1%) | 571 (4.2%) |
| 60 to 89 Minutes | 490 (3.6%) | 209 (1.5%) |
| 90 or more Minutes | 317 (2.4%) | 87 (0.6%) |
Time of Departure to Work by Sex in Columbia County
The most frequent times of departure to work in Columbia County are 7:00 AM to 7:29 AM (2,908, 21.6%) for males and 7:00 AM to 7:29 AM (3,484, 25.3%) for females.
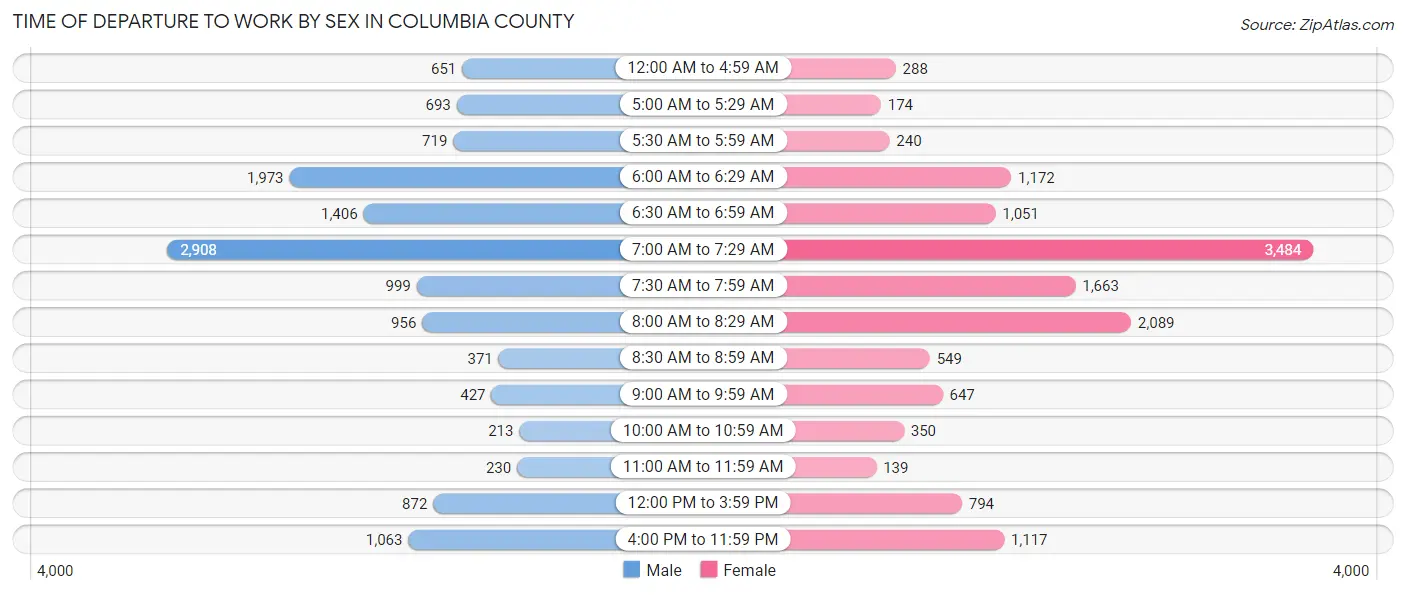
| Time of Departure | Male | Female |
| 12:00 AM to 4:59 AM | 651 (4.8%) | 288 (2.1%) |
| 5:00 AM to 5:29 AM | 693 (5.1%) | 174 (1.3%) |
| 5:30 AM to 5:59 AM | 719 (5.3%) | 240 (1.7%) |
| 6:00 AM to 6:29 AM | 1,973 (14.6%) | 1,172 (8.5%) |
| 6:30 AM to 6:59 AM | 1,406 (10.4%) | 1,051 (7.6%) |
| 7:00 AM to 7:29 AM | 2,908 (21.6%) | 3,484 (25.3%) |
| 7:30 AM to 7:59 AM | 999 (7.4%) | 1,663 (12.1%) |
| 8:00 AM to 8:29 AM | 956 (7.1%) | 2,089 (15.2%) |
| 8:30 AM to 8:59 AM | 371 (2.8%) | 549 (4.0%) |
| 9:00 AM to 9:59 AM | 427 (3.2%) | 647 (4.7%) |
| 10:00 AM to 10:59 AM | 213 (1.6%) | 350 (2.5%) |
| 11:00 AM to 11:59 AM | 230 (1.7%) | 139 (1.0%) |
| 12:00 PM to 3:59 PM | 872 (6.5%) | 794 (5.8%) |
| 4:00 PM to 11:59 PM | 1,063 (7.9%) | 1,117 (8.1%) |
| Total | 13,481 (100.0%) | 13,757 (100.0%) |
Housing Occupancy in Columbia County
Occupancy by Ownership in Columbia County
Of the total 25,878 dwellings in Columbia County, owner-occupied units account for 18,313 (70.8%), while renter-occupied units make up 7,565 (29.2%).
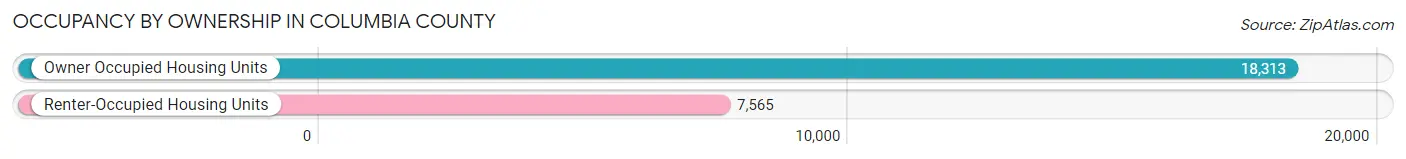
| Occupancy | # Housing Units | % Housing Units |
| Owner Occupied Housing Units | 18,313 | 70.8% |
| Renter-Occupied Housing Units | 7,565 | 29.2% |
| Total Occupied Housing Units | 25,878 | 100.0% |
Occupancy by Household Size in Columbia County
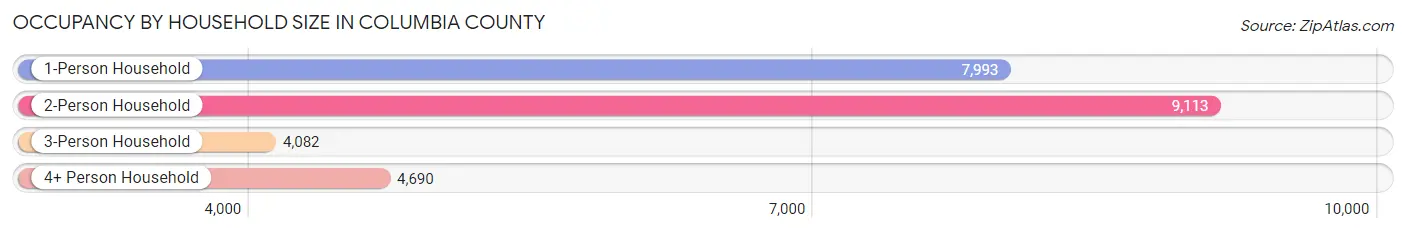
| Household Size | # Housing Units | % Housing Units |
| 1-Person Household | 7,993 | 30.9% |
| 2-Person Household | 9,113 | 35.2% |
| 3-Person Household | 4,082 | 15.8% |
| 4+ Person Household | 4,690 | 18.1% |
| Total Housing Units | 25,878 | 100.0% |
Occupancy by Ownership by Household Size in Columbia County
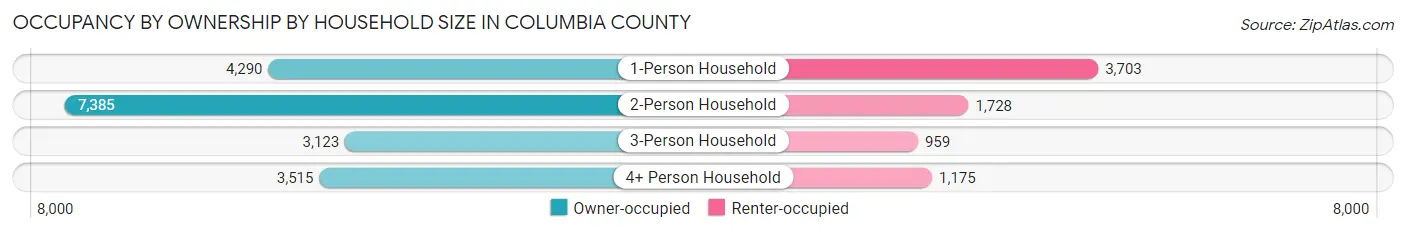
| Household Size | Owner-occupied | Renter-occupied |
| 1-Person Household | 4,290 (53.7%) | 3,703 (46.3%) |
| 2-Person Household | 7,385 (81.0%) | 1,728 (19.0%) |
| 3-Person Household | 3,123 (76.5%) | 959 (23.5%) |
| 4+ Person Household | 3,515 (75.0%) | 1,175 (25.1%) |
| Total Housing Units | 18,313 (70.8%) | 7,565 (29.2%) |
Occupancy by Educational Attainment in Columbia County
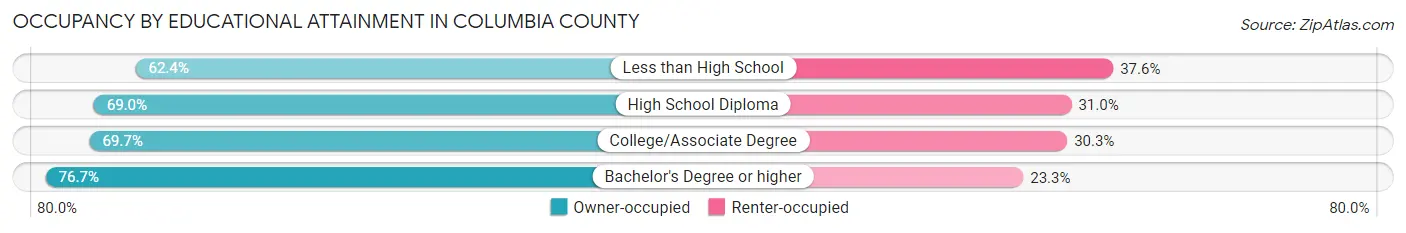
| Household Size | Owner-occupied | Renter-occupied |
| Less than High School | 1,180 (62.4%) | 711 (37.6%) |
| High School Diploma | 7,398 (69.0%) | 3,320 (31.0%) |
| College/Associate Degree | 4,378 (69.7%) | 1,903 (30.3%) |
| Bachelor's Degree or higher | 5,357 (76.7%) | 1,631 (23.3%) |
Occupancy by Age of Householder in Columbia County
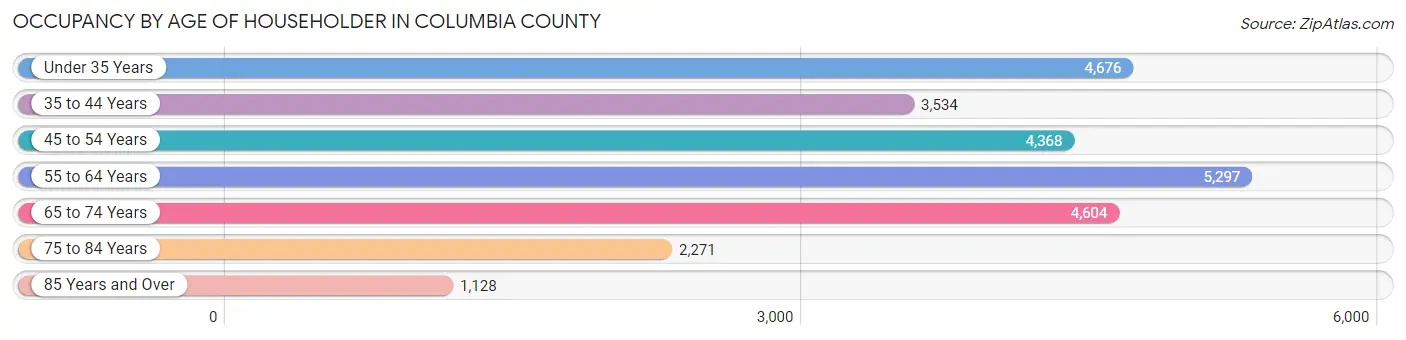
| Age Bracket | # Households | % Households |
| Under 35 Years | 4,676 | 18.1% |
| 35 to 44 Years | 3,534 | 13.7% |
| 45 to 54 Years | 4,368 | 16.9% |
| 55 to 64 Years | 5,297 | 20.5% |
| 65 to 74 Years | 4,604 | 17.8% |
| 75 to 84 Years | 2,271 | 8.8% |
| 85 Years and Over | 1,128 | 4.4% |
| Total | 25,878 | 100.0% |
Housing Finances in Columbia County
Median Income by Occupancy in Columbia County
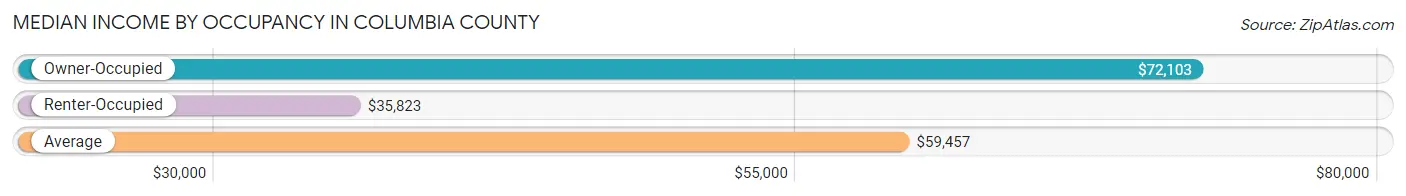
| Occupancy Type | # Households | Median Income |
| Owner-Occupied | 18,313 (70.8%) | $72,103 |
| Renter-Occupied | 7,565 (29.2%) | $35,823 |
| Average | 25,878 (100.0%) | $59,457 |
Occupancy by Householder Income Bracket in Columbia County
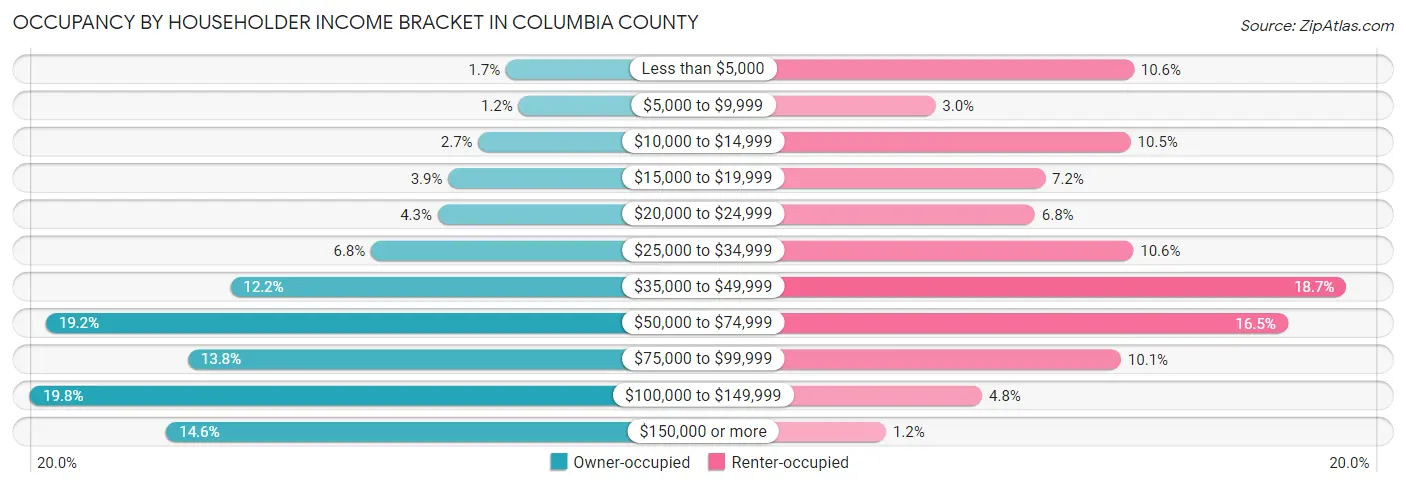
| Income Bracket | Owner-occupied | Renter-occupied |
| Less than $5,000 | 304 (1.7%) | 802 (10.6%) |
| $5,000 to $9,999 | 216 (1.2%) | 230 (3.0%) |
| $10,000 to $14,999 | 497 (2.7%) | 793 (10.5%) |
| $15,000 to $19,999 | 707 (3.9%) | 546 (7.2%) |
| $20,000 to $24,999 | 781 (4.3%) | 517 (6.8%) |
| $25,000 to $34,999 | 1,245 (6.8%) | 800 (10.6%) |
| $35,000 to $49,999 | 2,227 (12.2%) | 1,414 (18.7%) |
| $50,000 to $74,999 | 3,515 (19.2%) | 1,245 (16.5%) |
| $75,000 to $99,999 | 2,523 (13.8%) | 765 (10.1%) |
| $100,000 to $149,999 | 3,625 (19.8%) | 365 (4.8%) |
| $150,000 or more | 2,673 (14.6%) | 88 (1.2%) |
| Total | 18,313 (100.0%) | 7,565 (100.0%) |
Monthly Housing Cost Tiers in Columbia County
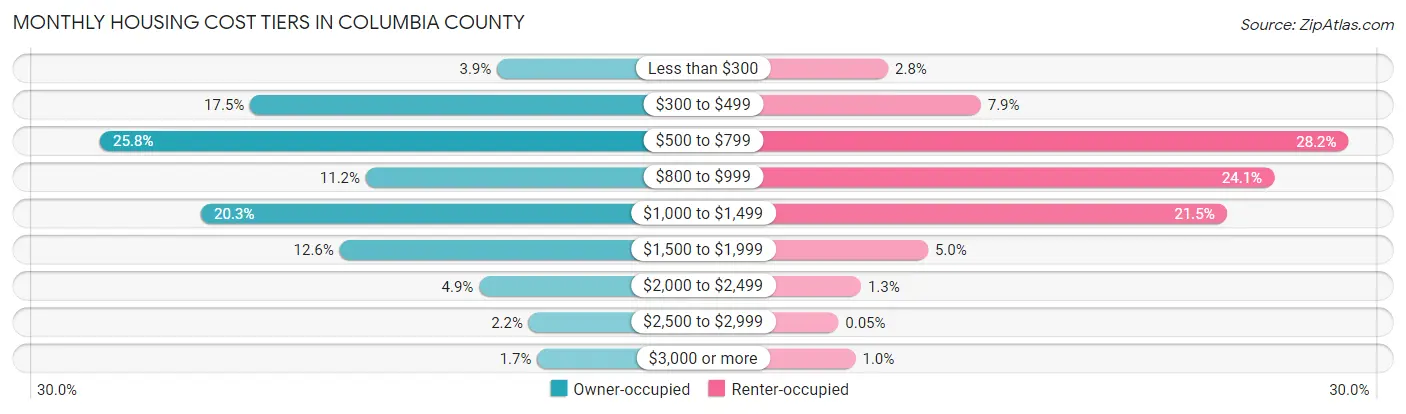
| Monthly Cost | Owner-occupied | Renter-occupied |
| Less than $300 | 715 (3.9%) | 212 (2.8%) |
| $300 to $499 | 3,212 (17.5%) | 599 (7.9%) |
| $500 to $799 | 4,731 (25.8%) | 2,135 (28.2%) |
| $800 to $999 | 2,042 (11.2%) | 1,824 (24.1%) |
| $1,000 to $1,499 | 3,708 (20.3%) | 1,626 (21.5%) |
| $1,500 to $1,999 | 2,308 (12.6%) | 378 (5.0%) |
| $2,000 to $2,499 | 896 (4.9%) | 98 (1.3%) |
| $2,500 to $2,999 | 394 (2.1%) | 4 (0.1%) |
| $3,000 or more | 307 (1.7%) | 76 (1.0%) |
| Total | 18,313 (100.0%) | 7,565 (100.0%) |
Physical Housing Characteristics in Columbia County
Housing Structures in Columbia County
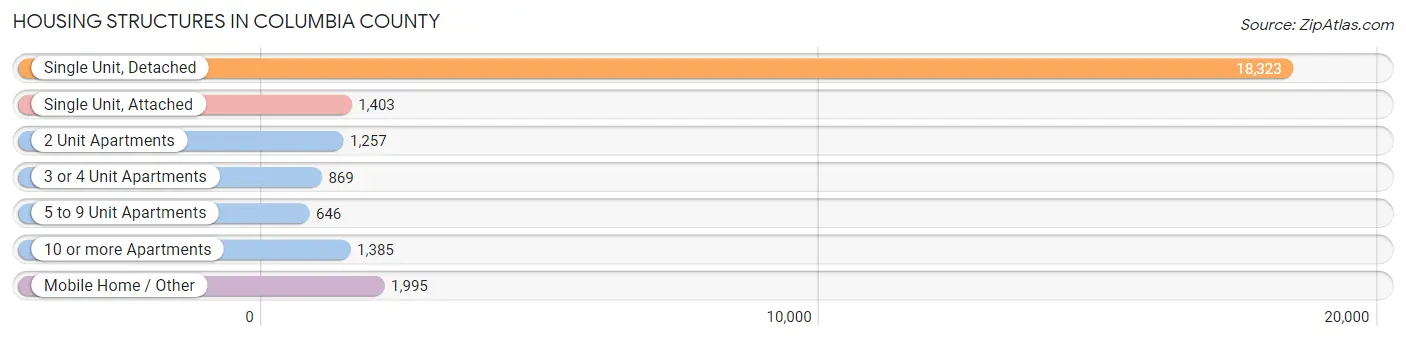
| Structure Type | # Housing Units | % Housing Units |
| Single Unit, Detached | 18,323 | 70.8% |
| Single Unit, Attached | 1,403 | 5.4% |
| 2 Unit Apartments | 1,257 | 4.9% |
| 3 or 4 Unit Apartments | 869 | 3.4% |
| 5 to 9 Unit Apartments | 646 | 2.5% |
| 10 or more Apartments | 1,385 | 5.3% |
| Mobile Home / Other | 1,995 | 7.7% |
| Total | 25,878 | 100.0% |
Housing Structures by Occupancy in Columbia County
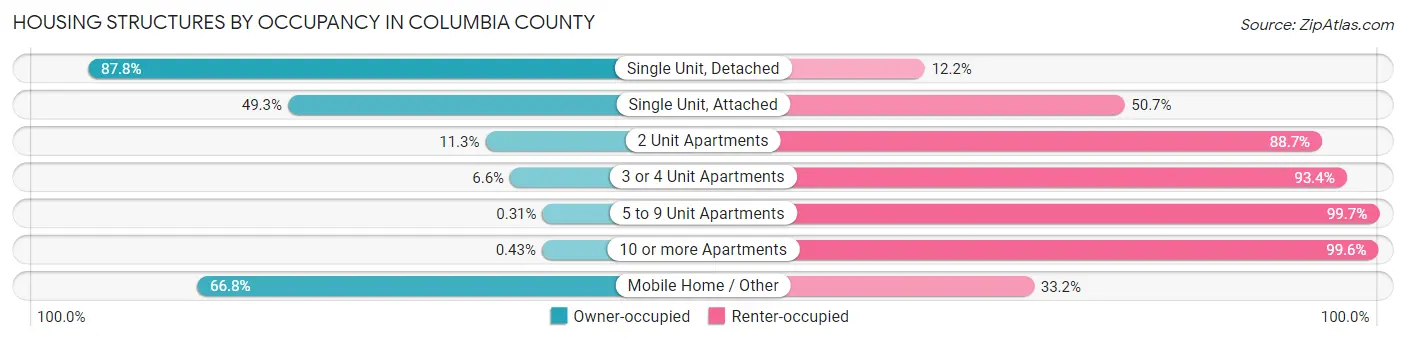
| Structure Type | Owner-occupied | Renter-occupied |
| Single Unit, Detached | 16,082 (87.8%) | 2,241 (12.2%) |
| Single Unit, Attached | 692 (49.3%) | 711 (50.7%) |
| 2 Unit Apartments | 142 (11.3%) | 1,115 (88.7%) |
| 3 or 4 Unit Apartments | 57 (6.6%) | 812 (93.4%) |
| 5 to 9 Unit Apartments | 2 (0.3%) | 644 (99.7%) |
| 10 or more Apartments | 6 (0.4%) | 1,379 (99.6%) |
| Mobile Home / Other | 1,332 (66.8%) | 663 (33.2%) |
| Total | 18,313 (70.8%) | 7,565 (29.2%) |
Housing Structures by Number of Rooms in Columbia County
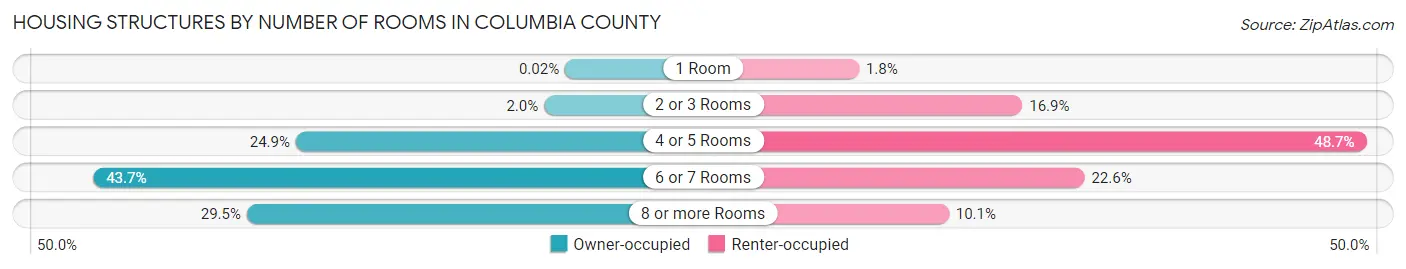
| Number of Rooms | Owner-occupied | Renter-occupied |
| 1 Room | 4 (0.0%) | 133 (1.8%) |
| 2 or 3 Rooms | 359 (2.0%) | 1,276 (16.9%) |
| 4 or 5 Rooms | 4,564 (24.9%) | 3,683 (48.7%) |
| 6 or 7 Rooms | 7,993 (43.6%) | 1,711 (22.6%) |
| 8 or more Rooms | 5,393 (29.4%) | 762 (10.1%) |
| Total | 18,313 (100.0%) | 7,565 (100.0%) |
Housing Structure by Heating Type in Columbia County
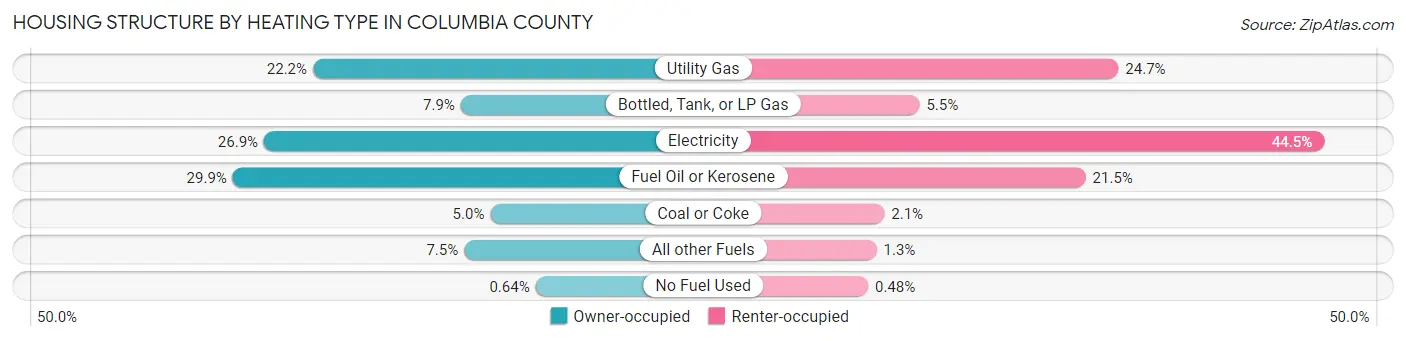
| Heating Type | Owner-occupied | Renter-occupied |
| Utility Gas | 4,057 (22.2%) | 1,866 (24.7%) |
| Bottled, Tank, or LP Gas | 1,442 (7.9%) | 412 (5.4%) |
| Electricity | 4,923 (26.9%) | 3,369 (44.5%) |
| Fuel Oil or Kerosene | 5,475 (29.9%) | 1,627 (21.5%) |
| Coal or Coke | 917 (5.0%) | 156 (2.1%) |
| All other Fuels | 1,381 (7.5%) | 99 (1.3%) |
| No Fuel Used | 118 (0.6%) | 36 (0.5%) |
| Total | 18,313 (100.0%) | 7,565 (100.0%) |
Household Vehicle Usage in Columbia County
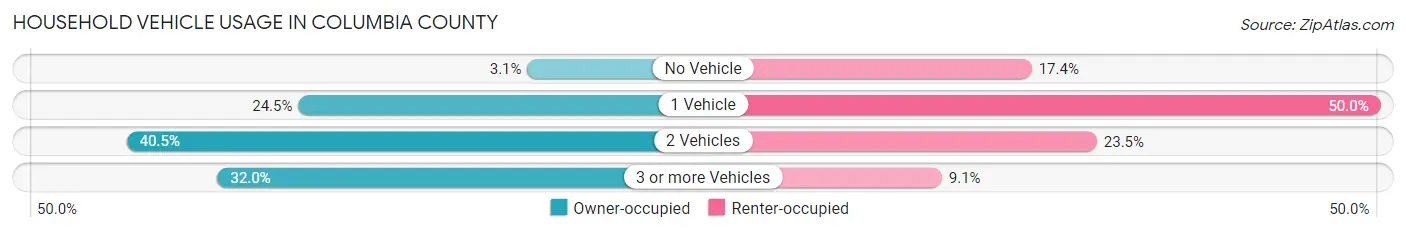
| Vehicles per Household | Owner-occupied | Renter-occupied |
| No Vehicle | 563 (3.1%) | 1,319 (17.4%) |
| 1 Vehicle | 4,477 (24.4%) | 3,782 (50.0%) |
| 2 Vehicles | 7,413 (40.5%) | 1,779 (23.5%) |
| 3 or more Vehicles | 5,860 (32.0%) | 685 (9.0%) |
| Total | 18,313 (100.0%) | 7,565 (100.0%) |
Real Estate & Mortgages in Columbia County
Real Estate and Mortgage Overview in Columbia County
| Characteristic | Without Mortgage | With Mortgage |
| Housing Units | 9,176 | 9,137 |
| Median Property Value | $170,300 | $190,700 |
| Median Household Income | $54,041 | $1,897 |
| Monthly Housing Costs | $538 | $300 |
| Real Estate Taxes | $2,165 | $107 |
Property Value by Mortgage Status in Columbia County
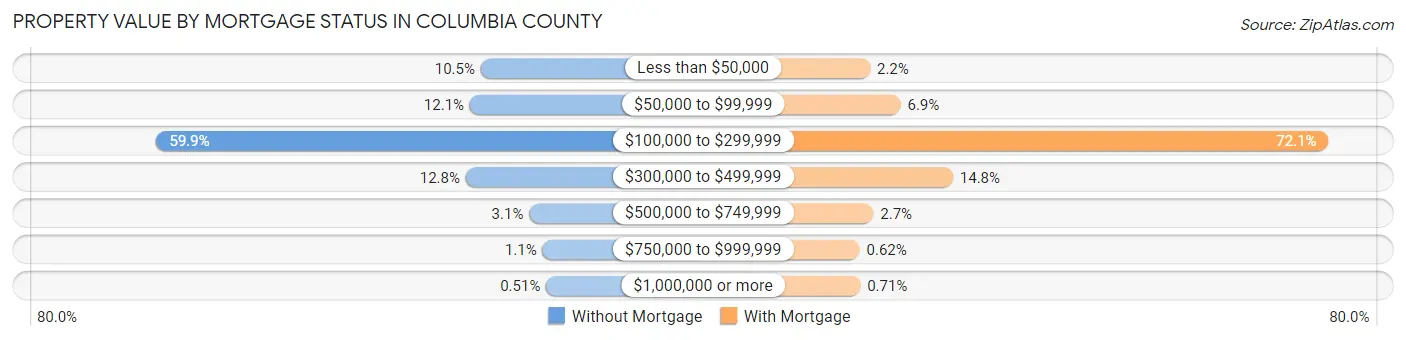
| Property Value | Without Mortgage | With Mortgage |
| Less than $50,000 | 963 (10.5%) | 202 (2.2%) |
| $50,000 to $99,999 | 1,114 (12.1%) | 627 (6.9%) |
| $100,000 to $299,999 | 5,498 (59.9%) | 6,583 (72.1%) |
| $300,000 to $499,999 | 1,172 (12.8%) | 1,355 (14.8%) |
| $500,000 to $749,999 | 284 (3.1%) | 248 (2.7%) |
| $750,000 to $999,999 | 98 (1.1%) | 57 (0.6%) |
| $1,000,000 or more | 47 (0.5%) | 65 (0.7%) |
| Total | 9,176 (100.0%) | 9,137 (100.0%) |
Household Income by Mortgage Status in Columbia County
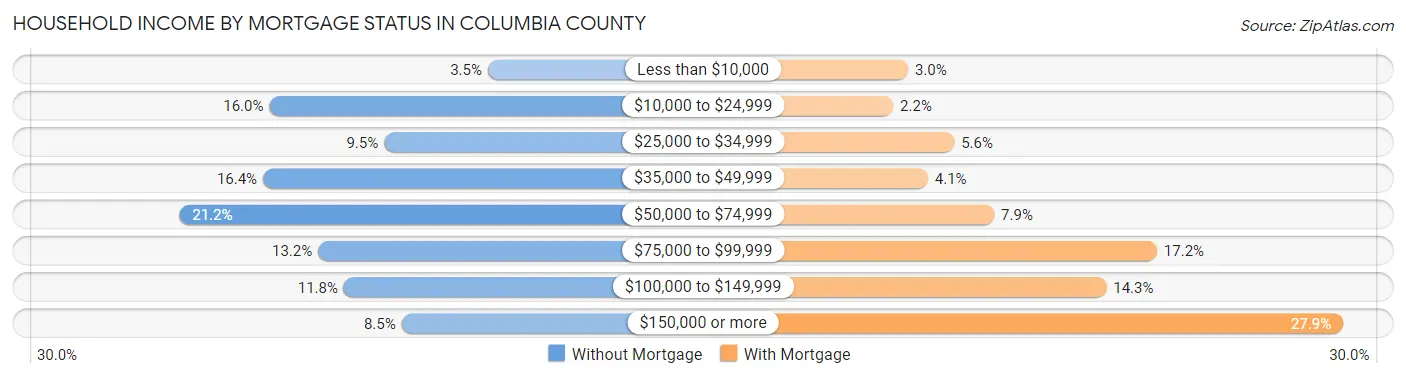
| Household Income | Without Mortgage | With Mortgage |
| Less than $10,000 | 324 (3.5%) | 274 (3.0%) |
| $10,000 to $24,999 | 1,470 (16.0%) | 196 (2.1%) |
| $25,000 to $34,999 | 868 (9.5%) | 515 (5.6%) |
| $35,000 to $49,999 | 1,503 (16.4%) | 377 (4.1%) |
| $50,000 to $74,999 | 1,942 (21.2%) | 724 (7.9%) |
| $75,000 to $99,999 | 1,214 (13.2%) | 1,573 (17.2%) |
| $100,000 to $149,999 | 1,079 (11.8%) | 1,309 (14.3%) |
| $150,000 or more | 776 (8.5%) | 2,546 (27.9%) |
| Total | 9,176 (100.0%) | 9,137 (100.0%) |
Property Value to Household Income Ratio in Columbia County
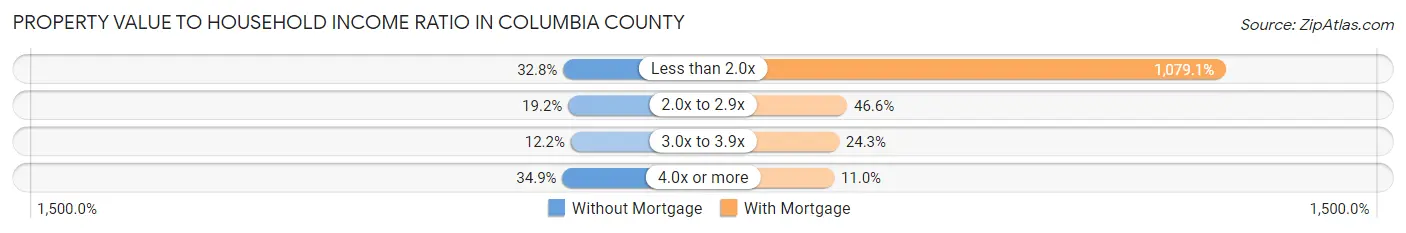
| Value-to-Income Ratio | Without Mortgage | With Mortgage |
| Less than 2.0x | 3,007 (32.8%) | 98,593 (1,079.0%) |
| 2.0x to 2.9x | 1,764 (19.2%) | 4,261 (46.6%) |
| 3.0x to 3.9x | 1,118 (12.2%) | 2,224 (24.3%) |
| 4.0x or more | 3,200 (34.9%) | 1,003 (11.0%) |
| Total | 9,176 (100.0%) | 9,137 (100.0%) |
Real Estate Taxes by Mortgage Status in Columbia County
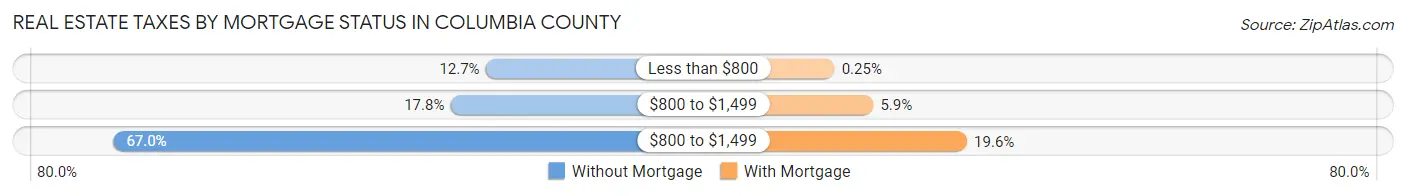
| Property Taxes | Without Mortgage | With Mortgage |
| Less than $800 | 1,162 (12.7%) | 23 (0.3%) |
| $800 to $1,499 | 1,634 (17.8%) | 540 (5.9%) |
| $800 to $1,499 | 6,149 (67.0%) | 1,791 (19.6%) |
| Total | 9,176 (100.0%) | 9,137 (100.0%) |
Health & Disability in Columbia County
Health Insurance Coverage by Age in Columbia County
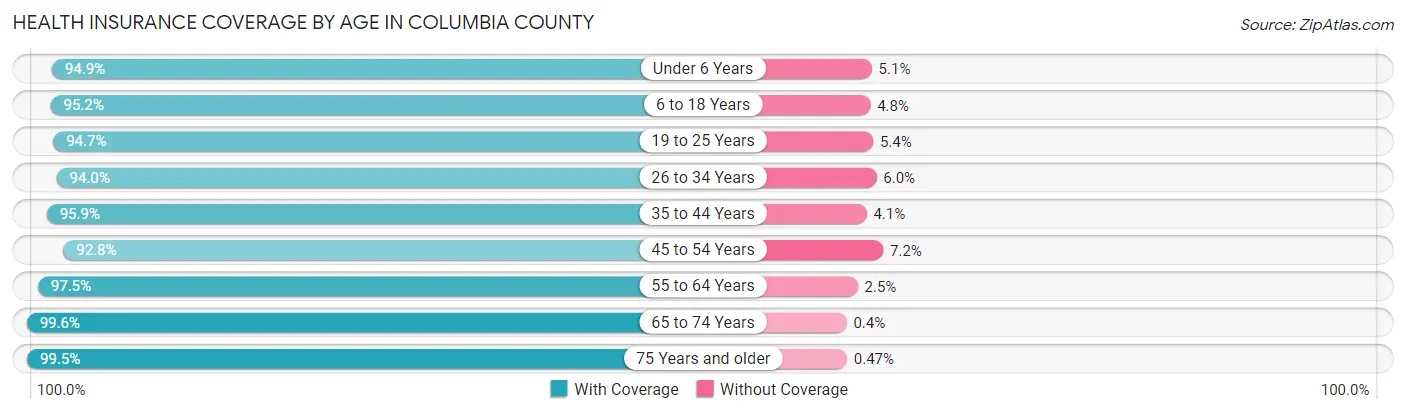
| Age Bracket | With Coverage | Without Coverage |
| Under 6 Years | 3,218 (94.9%) | 173 (5.1%) |
| 6 to 18 Years | 9,446 (95.2%) | 480 (4.8%) |
| 19 to 25 Years | 8,128 (94.7%) | 459 (5.3%) |
| 26 to 34 Years | 5,977 (94.0%) | 380 (6.0%) |
| 35 to 44 Years | 6,585 (95.9%) | 284 (4.1%) |
| 45 to 54 Years | 7,226 (92.8%) | 563 (7.2%) |
| 55 to 64 Years | 8,557 (97.5%) | 218 (2.5%) |
| 65 to 74 Years | 7,399 (99.6%) | 30 (0.4%) |
| 75 Years and older | 5,039 (99.5%) | 24 (0.5%) |
| Total | 61,575 (95.9%) | 2,611 (4.1%) |
Health Insurance Coverage by Citizenship Status in Columbia County
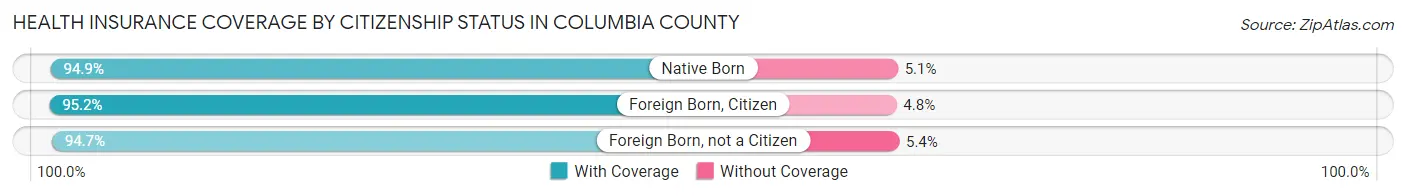
| Citizenship Status | With Coverage | Without Coverage |
| Native Born | 3,218 (94.9%) | 173 (5.1%) |
| Foreign Born, Citizen | 9,446 (95.2%) | 480 (4.8%) |
| Foreign Born, not a Citizen | 8,128 (94.7%) | 459 (5.3%) |
Health Insurance Coverage by Household Income in Columbia County
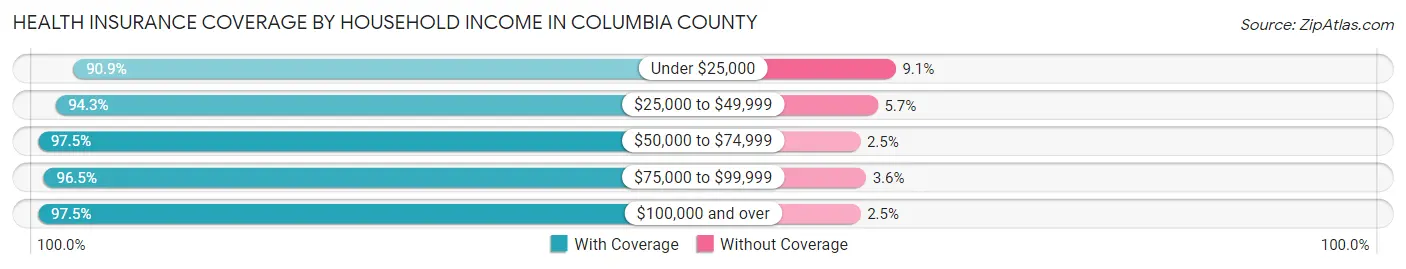
| Household Income | With Coverage | Without Coverage |
| Under $25,000 | 8,105 (90.9%) | 813 (9.1%) |
| $25,000 to $49,999 | 10,627 (94.3%) | 647 (5.7%) |
| $50,000 to $74,999 | 11,146 (97.5%) | 282 (2.5%) |
| $75,000 to $99,999 | 8,430 (96.5%) | 310 (3.5%) |
| $100,000 and over | 20,039 (97.5%) | 518 (2.5%) |
Public vs Private Health Insurance Coverage by Age in Columbia County
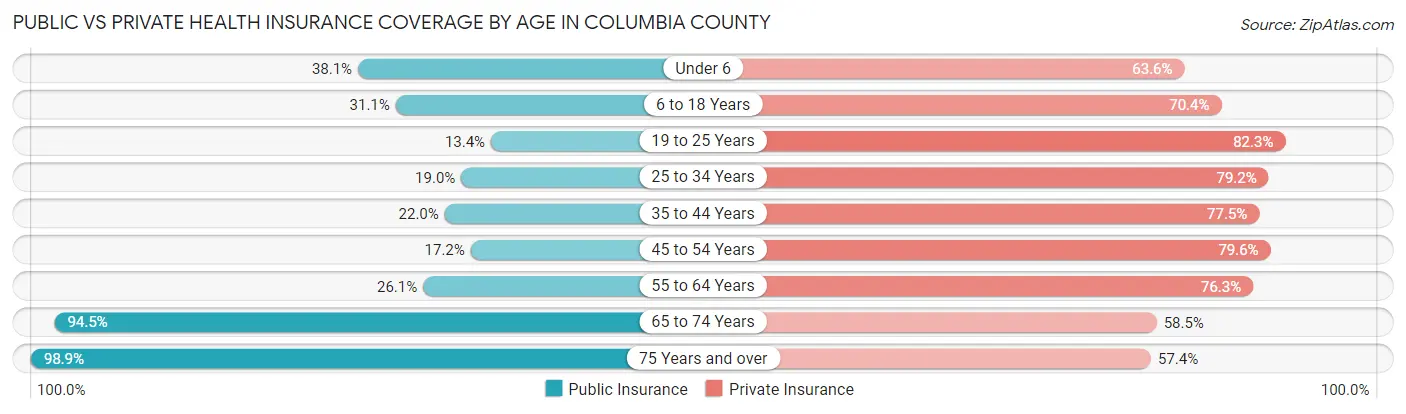
| Age Bracket | Public Insurance | Private Insurance |
| Under 6 | 1,293 (38.1%) | 2,156 (63.6%) |
| 6 to 18 Years | 3,091 (31.1%) | 6,991 (70.4%) |
| 19 to 25 Years | 1,154 (13.4%) | 7,067 (82.3%) |
| 25 to 34 Years | 1,206 (19.0%) | 5,035 (79.2%) |
| 35 to 44 Years | 1,514 (22.0%) | 5,321 (77.5%) |
| 45 to 54 Years | 1,341 (17.2%) | 6,197 (79.6%) |
| 55 to 64 Years | 2,286 (26.1%) | 6,698 (76.3%) |
| 65 to 74 Years | 7,017 (94.5%) | 4,342 (58.5%) |
| 75 Years and over | 5,005 (98.9%) | 2,906 (57.4%) |
| Total | 23,907 (37.2%) | 46,713 (72.8%) |
Disability Status by Sex by Age in Columbia County
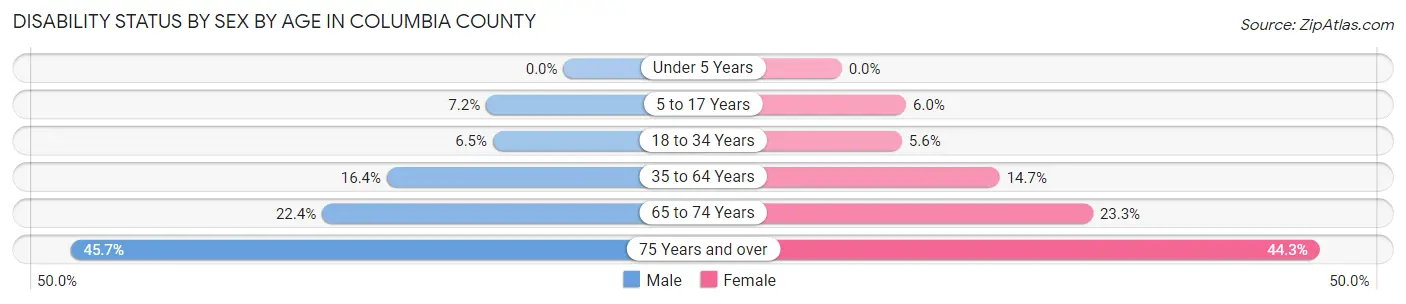
| Age Bracket | Male | Female |
| Under 5 Years | 0 (0.0%) | 0 (0.0%) |
| 5 to 17 Years | 314 (7.2%) | 252 (6.0%) |
| 18 to 34 Years | 528 (6.5%) | 490 (5.6%) |
| 35 to 64 Years | 1,912 (16.4%) | 1,724 (14.7%) |
| 65 to 74 Years | 781 (22.4%) | 919 (23.3%) |
| 75 Years and over | 936 (45.7%) | 1,337 (44.3%) |
Disability Class by Sex by Age in Columbia County
Disability Class: Hearing Difficulty
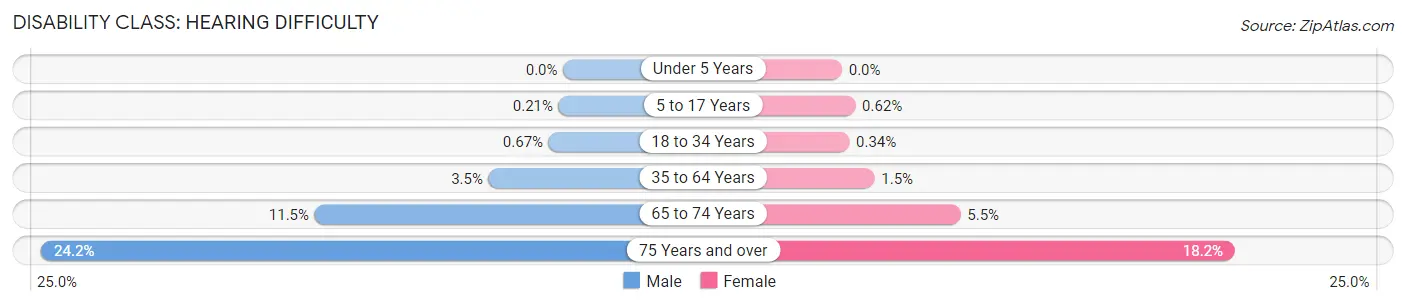
| Age Bracket | Male | Female |
| Under 5 Years | 0 (0.0%) | 0 (0.0%) |
| 5 to 17 Years | 9 (0.2%) | 26 (0.6%) |
| 18 to 34 Years | 54 (0.7%) | 30 (0.3%) |
| 35 to 64 Years | 404 (3.5%) | 177 (1.5%) |
| 65 to 74 Years | 402 (11.5%) | 217 (5.5%) |
| 75 Years and over | 496 (24.2%) | 550 (18.2%) |
Disability Class: Vision Difficulty
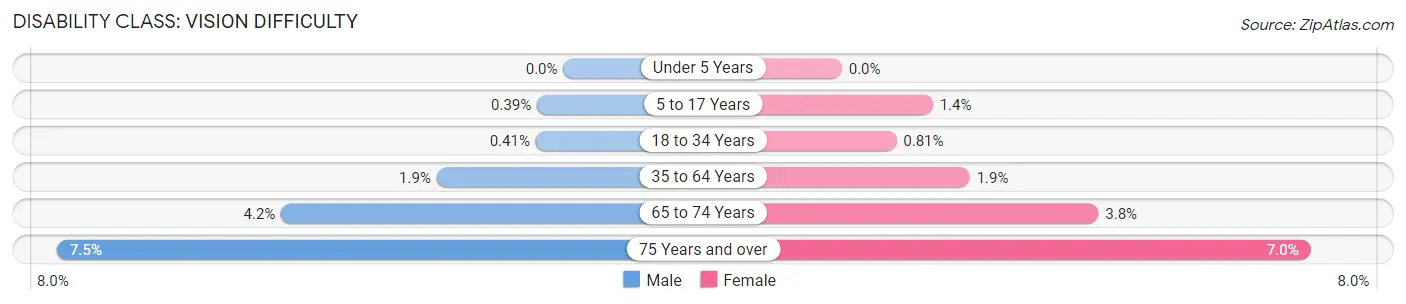
| Age Bracket | Male | Female |
| Under 5 Years | 0 (0.0%) | 0 (0.0%) |
| 5 to 17 Years | 17 (0.4%) | 57 (1.3%) |
| 18 to 34 Years | 33 (0.4%) | 71 (0.8%) |
| 35 to 64 Years | 220 (1.9%) | 224 (1.9%) |
| 65 to 74 Years | 146 (4.2%) | 150 (3.8%) |
| 75 Years and over | 154 (7.5%) | 210 (7.0%) |
Disability Class: Cognitive Difficulty
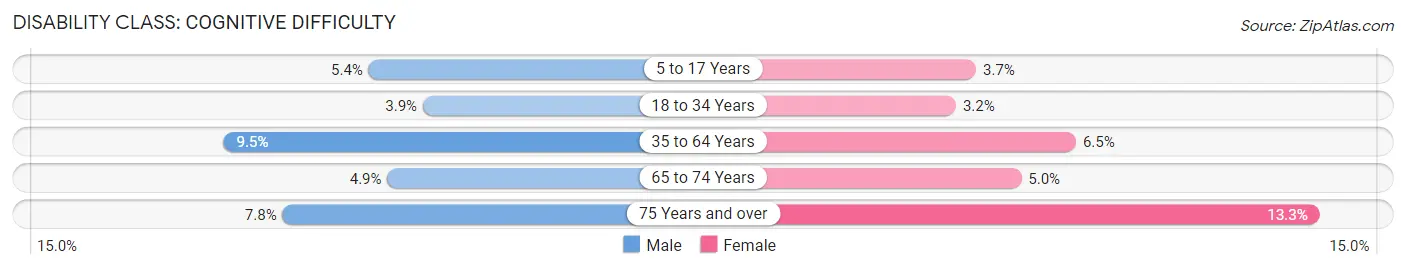
| Age Bracket | Male | Female |
| 5 to 17 Years | 237 (5.4%) | 158 (3.7%) |
| 18 to 34 Years | 316 (3.9%) | 279 (3.2%) |
| 35 to 64 Years | 1,104 (9.5%) | 767 (6.5%) |
| 65 to 74 Years | 171 (4.9%) | 197 (5.0%) |
| 75 Years and over | 160 (7.8%) | 401 (13.3%) |
Disability Class: Ambulatory Difficulty
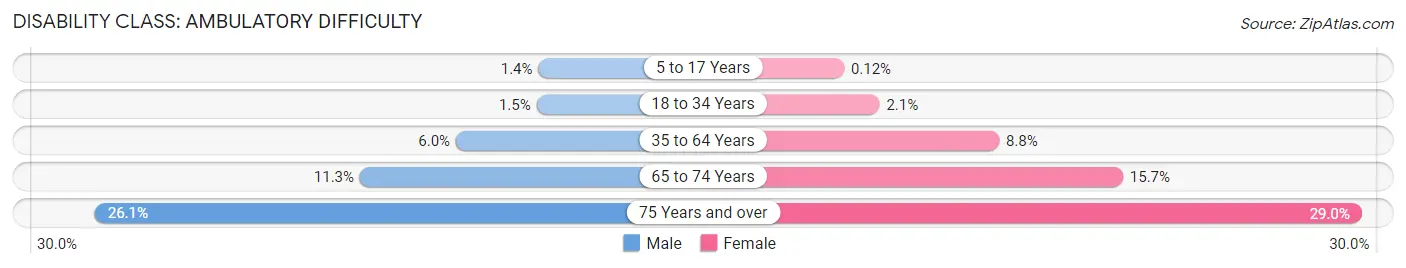
| Age Bracket | Male | Female |
| 5 to 17 Years | 61 (1.4%) | 5 (0.1%) |
| 18 to 34 Years | 120 (1.5%) | 184 (2.1%) |
| 35 to 64 Years | 698 (6.0%) | 1,029 (8.7%) |
| 65 to 74 Years | 395 (11.3%) | 617 (15.7%) |
| 75 Years and over | 534 (26.1%) | 873 (28.9%) |
Disability Class: Self-Care Difficulty
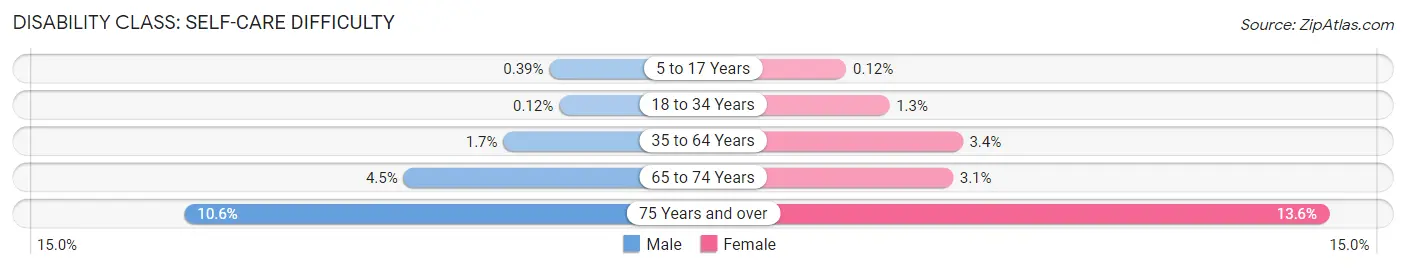
| Age Bracket | Male | Female |
| 5 to 17 Years | 17 (0.4%) | 5 (0.1%) |
| 18 to 34 Years | 10 (0.1%) | 116 (1.3%) |
| 35 to 64 Years | 195 (1.7%) | 395 (3.4%) |
| 65 to 74 Years | 155 (4.4%) | 122 (3.1%) |
| 75 Years and over | 216 (10.5%) | 409 (13.6%) |
Technology Access in Columbia County
Computing Device Access in Columbia County
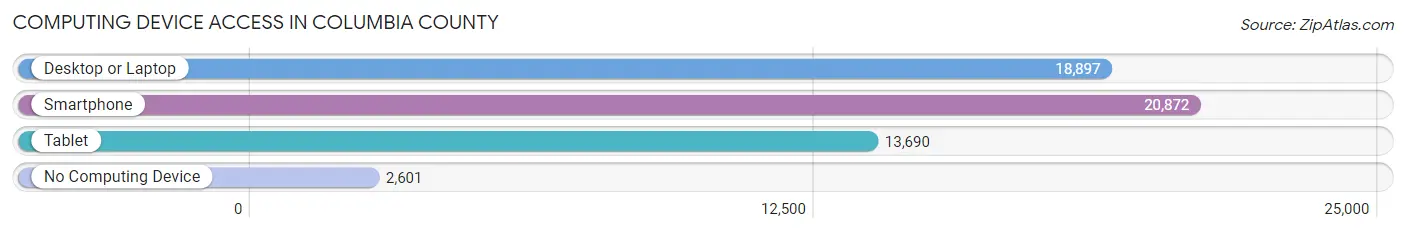
| Device Type | # Households | % Households |
| Desktop or Laptop | 18,897 | 73.0% |
| Smartphone | 20,872 | 80.7% |
| Tablet | 13,690 | 52.9% |
| No Computing Device | 2,601 | 10.1% |
| Total | 25,878 | 100.0% |
Internet Access in Columbia County
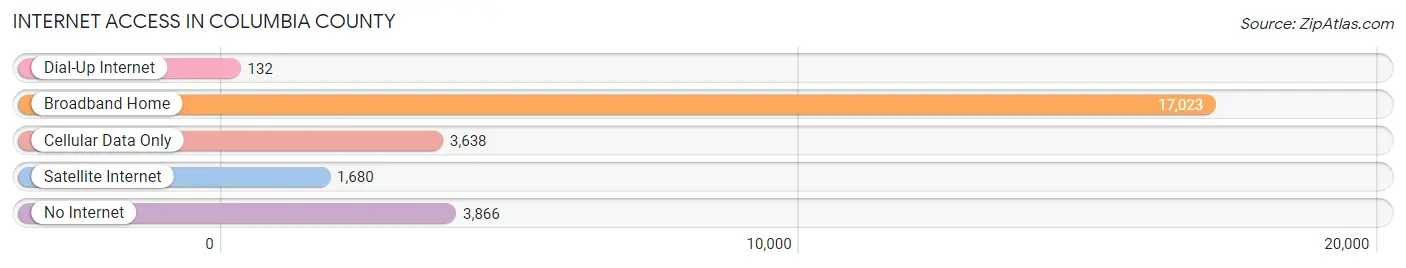
| Internet Type | # Households | % Households |
| Dial-Up Internet | 132 | 0.5% |
| Broadband Home | 17,023 | 65.8% |
| Cellular Data Only | 3,638 | 14.1% |
| Satellite Internet | 1,680 | 6.5% |
| No Internet | 3,866 | 14.9% |
| Total | 25,878 | 100.0% |
Columbia County Summary
Columbia County is located in the northeastern part of Pennsylvania, and is part of the Susquehanna Valley region. It is bordered by Luzerne County to the north, Schuylkill County to the west, Northumberland County to the east, and Montour County to the south. The county seat is Bloomsburg, and the county has a total area of 437 square miles.
History
Columbia County was formed in 1813 from part of Northumberland County. It was named after the Columbia River, which was named after Christopher Columbus. The county was originally part of the Iroquois Confederacy, and was inhabited by the Susquehannock and Lenape Native American tribes. The first European settlers arrived in the area in the late 17th century, and the county was officially established in 1813.
The county was an important part of the Pennsylvania Canal System, which was built in the early 19th century to connect the Susquehanna River with the Delaware River. The canal was used to transport coal, lumber, and other goods. The county was also an important part of the Pennsylvania Railroad, which was built in the mid-19th century to connect the eastern and western parts of the state.
Geography
Columbia County is located in the northeastern part of Pennsylvania, and is part of the Susquehanna Valley region. It is bordered by Luzerne County to the north, Schuylkill County to the west, Northumberland County to the east, and Montour County to the south. The county has a total area of 437 square miles, and is mostly rural and agricultural.
The terrain of the county is mostly rolling hills, with the highest point being the summit of Nescopeck Mountain at 1,890 feet. The county is drained by the Susquehanna River and its tributaries, including Fishing Creek, Catawissa Creek, and Briar Creek. The county is home to several state parks, including Ricketts Glen State Park, Locust Lake State Park, and Nescopeck State Park.
Economy
The economy of Columbia County is largely based on agriculture and manufacturing. The county is home to several large farms, which produce a variety of crops, including corn, soybeans, hay, and wheat. The county is also home to several manufacturing companies, which produce a variety of products, including paper, plastics, and metal products.
The county is also home to several colleges and universities, including Bloomsburg University of Pennsylvania, which is the largest employer in the county. The county is also home to several hospitals, including Geisinger Medical Center and Bloomsburg Hospital.
Demographics
As of the 2010 census, the population of Columbia County was 67,295, with a population density of 153 people per square mile. The racial makeup of the county was 94.3% White, 2.7% African American, 0.3% Native American, 0.9% Asian, 0.1% Pacific Islander, 0.7% from other races, and 1.1% from two or more races. The median household income was $45,945, and the median family income was $55,945.
The largest ancestry groups in the county are German (25.3%), Irish (17.2%), English (13.2%), Italian (7.2%), and Polish (6.2%). The county is also home to a large Amish population, with over 1,000 Amish living in the county. The county is served by several school districts, including Bloomsburg Area School District, Berwick Area School District, and Southern Columbia Area School District.
Common Questions
What is Per Capita Income in Columbia County?
Per Capita income in Columbia County is $31,238.
What is the Median Family Income in Columbia County?
Median Family Income in Columbia County is $76,519.
What is the Median Household income in Columbia County?
Median Household Income in Columbia County is $59,457.
What is Income or Wage Gap in Columbia County?
Income or Wage Gap in Columbia County is 32.7%.
Women in Columbia County earn 67.3 cents for every dollar earned by a man.
What is Family Income Deficit in Columbia County?
Family Income Deficit in Columbia County is $9,800.
Families that are below poverty line in Columbia County earn $9,800 less on average than the poverty threshold level.
What is Inequality or Gini Index in Columbia County?
Inequality or Gini Index in Columbia County is 0.44.
What is the Total Population of Columbia County?
Total Population of Columbia County is 64,924.
What is the Total Male Population of Columbia County?
Total Male Population of Columbia County is 31,398.
What is the Total Female Population of Columbia County?
Total Female Population of Columbia County is 33,526.
What is the Ratio of Males per 100 Females in Columbia County?
There are 93.65 Males per 100 Females in Columbia County.
What is the Ratio of Females per 100 Males in Columbia County?
There are 106.78 Females per 100 Males in Columbia County.
What is the Median Population Age in Columbia County?
Median Population Age in Columbia County is 41.3 Years.
What is the Average Family Size in Columbia County
Average Family Size in Columbia County is 2.9 People.
What is the Average Household Size in Columbia County
Average Household Size in Columbia County is 2.4 People.
How Large is the Labor Force in Columbia County?
There are 31,784 People in the Labor Forcein in Columbia County.
What is the Percentage of People in the Labor Force in Columbia County?
57.8% of People are in the Labor Force in Columbia County.
What is the Unemployment Rate in Columbia County?
Unemployment Rate in Columbia County is 4.8%.