Clinton County, PA Map & Demographics
Clinton County Map
Clinton County Overview
$30,723
PER CAPITA INCOME
$72,403
AVG FAMILY INCOME
$59,011
AVG HOUSEHOLD INCOME
32.6%
WAGE / INCOME GAP [ % ]
67.4¢/ $1
WAGE / INCOME GAP [ $ ]
$8,798
FAMILY INCOME DEFICIT
0.43
INEQUALITY / GINI INDEX
37,860
TOTAL POPULATION
18,916
MALE POPULATION
18,944
FEMALE POPULATION
99.85
MALES / 100 FEMALES
100.15
FEMALES / 100 MALES
39.8
MEDIAN AGE
3.0
AVG FAMILY SIZE
2.4
AVG HOUSEHOLD SIZE
18,615
LABOR FORCE [ PEOPLE ]
59.6%
PERCENT IN LABOR FORCE
5.3%
UNEMPLOYMENT RATE
Income in Clinton County
Income Overview in Clinton County
Per Capita Income in Clinton County is $30,723, while median incomes of families and households are $72,403 and $59,011 respectively.
| Characteristic | Number | Measure |
| Per Capita Income | 37,860 | $30,723 |
| Median Family Income | 9,555 | $72,403 |
| Mean Family Income | 9,555 | $90,102 |
| Median Household Income | 14,877 | $59,011 |
| Mean Household Income | 14,877 | $75,224 |
| Income Deficit | 9,555 | $8,798 |
| Wage / Income Gap (%) | 37,860 | 32.63% |
| Wage / Income Gap ($) | 37,860 | 67.37¢ per $1 |
| Gini / Inequality Index | 37,860 | 0.43 |
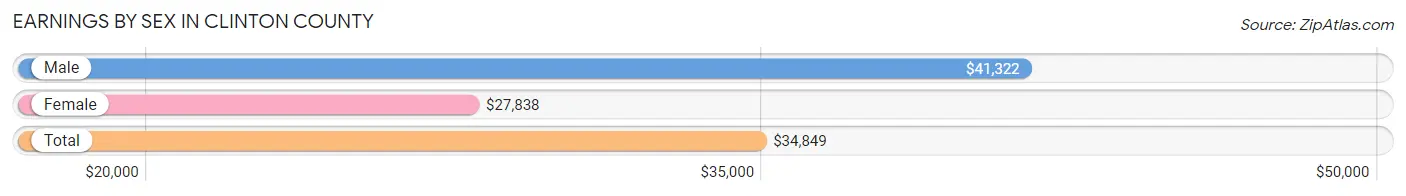
Earnings by Sex in Clinton County
Average Earnings in Clinton County are $34,849, $41,322 for men and $27,838 for women, a difference of 32.6%.
| Sex | Number | Average Earnings |
| Male | 10,639 (53.7%) | $41,322 |
| Female | 9,182 (46.3%) | $27,838 |
| Total | 19,821 (100.0%) | $34,849 |
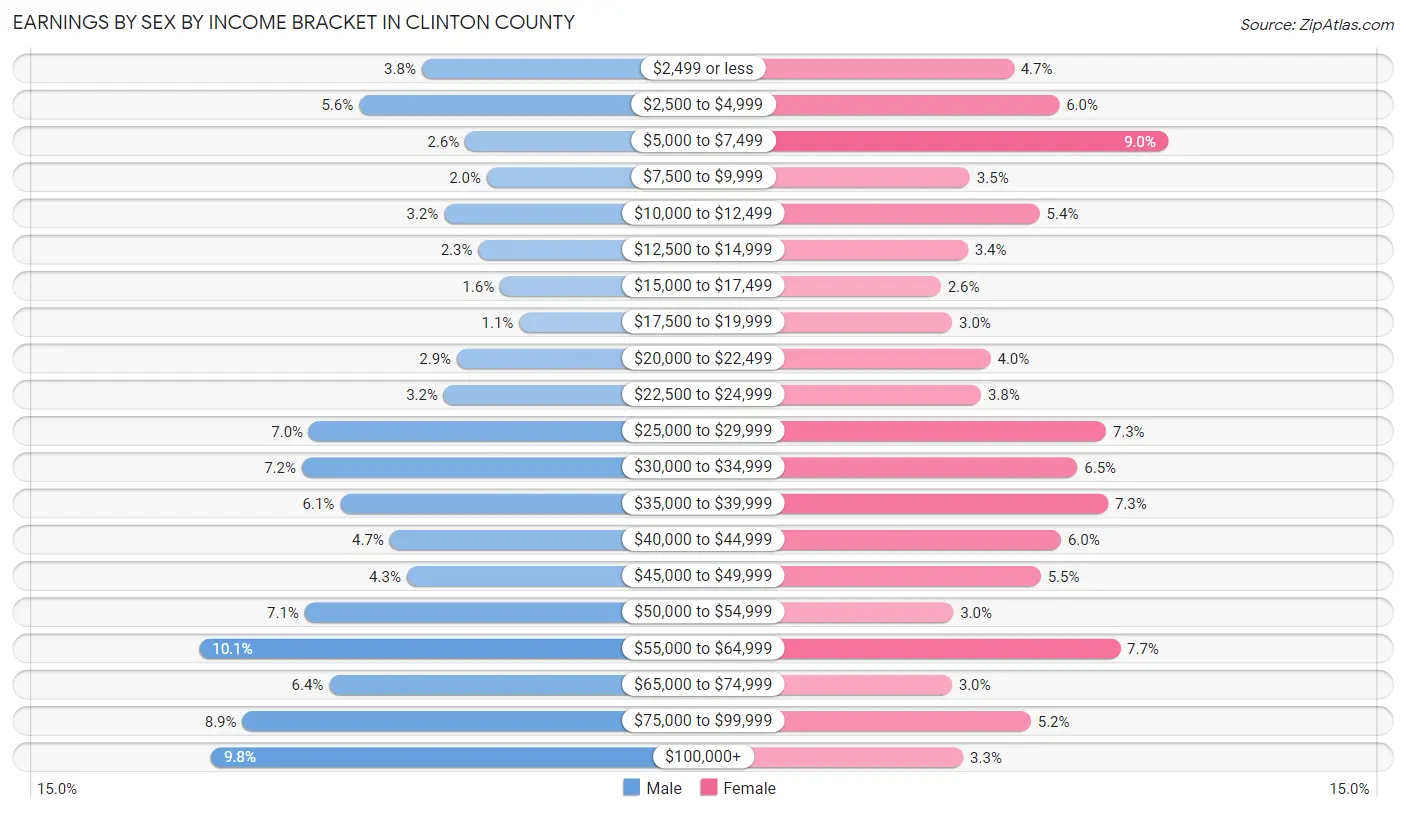
Earnings by Sex by Income Bracket in Clinton County
The most common earnings brackets in Clinton County are $55,000 to $64,999 for men (1,074 | 10.1%) and $5,000 to $7,499 for women (828 | 9.0%).
| Income | Male | Female |
| $2,499 or less | 409 (3.8%) | 431 (4.7%) |
| $2,500 to $4,999 | 596 (5.6%) | 548 (6.0%) |
| $5,000 to $7,499 | 279 (2.6%) | 828 (9.0%) |
| $7,500 to $9,999 | 214 (2.0%) | 318 (3.5%) |
| $10,000 to $12,499 | 341 (3.2%) | 498 (5.4%) |
| $12,500 to $14,999 | 239 (2.2%) | 312 (3.4%) |
| $15,000 to $17,499 | 175 (1.6%) | 242 (2.6%) |
| $17,500 to $19,999 | 117 (1.1%) | 272 (3.0%) |
| $20,000 to $22,499 | 303 (2.9%) | 371 (4.0%) |
| $22,500 to $24,999 | 343 (3.2%) | 346 (3.8%) |
| $25,000 to $29,999 | 746 (7.0%) | 668 (7.3%) |
| $30,000 to $34,999 | 767 (7.2%) | 595 (6.5%) |
| $35,000 to $39,999 | 652 (6.1%) | 674 (7.3%) |
| $40,000 to $44,999 | 504 (4.7%) | 553 (6.0%) |
| $45,000 to $49,999 | 453 (4.3%) | 500 (5.4%) |
| $50,000 to $54,999 | 759 (7.1%) | 275 (3.0%) |
| $55,000 to $64,999 | 1,074 (10.1%) | 705 (7.7%) |
| $65,000 to $74,999 | 685 (6.4%) | 271 (2.9%) |
| $75,000 to $99,999 | 945 (8.9%) | 475 (5.2%) |
| $100,000+ | 1,038 (9.8%) | 300 (3.3%) |
| Total | 10,639 (100.0%) | 9,182 (100.0%) |
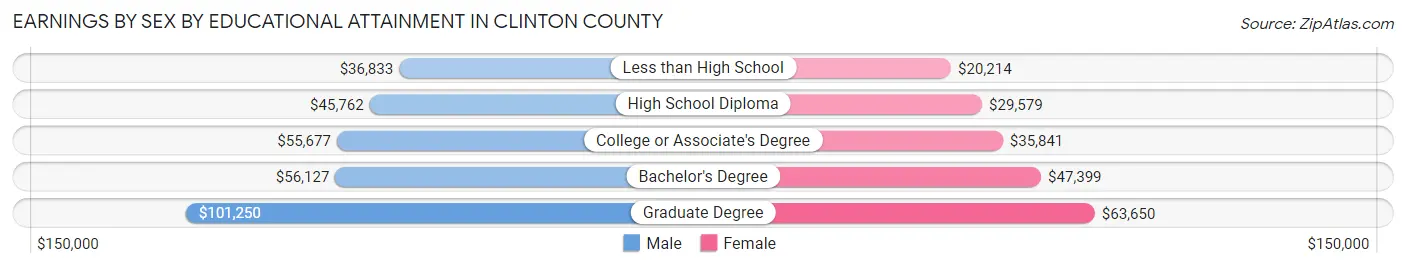
Earnings by Sex by Educational Attainment in Clinton County
Average earnings in Clinton County are $51,393 for men and $35,737 for women, a difference of 30.5%. Men with an educational attainment of graduate degree enjoy the highest average annual earnings of $101,250, while those with less than high school education earn the least with $36,833. Women with an educational attainment of graduate degree earn the most with the average annual earnings of $63,650, while those with less than high school education have the smallest earnings of $20,214.
| Educational Attainment | Male Income | Female Income |
| Less than High School | $36,833 | $20,214 |
| High School Diploma | $45,762 | $29,579 |
| College or Associate's Degree | $55,677 | $35,841 |
| Bachelor's Degree | $56,127 | $47,399 |
| Graduate Degree | $101,250 | $63,650 |
| Total | $51,393 | $35,737 |
Family Income in Clinton County
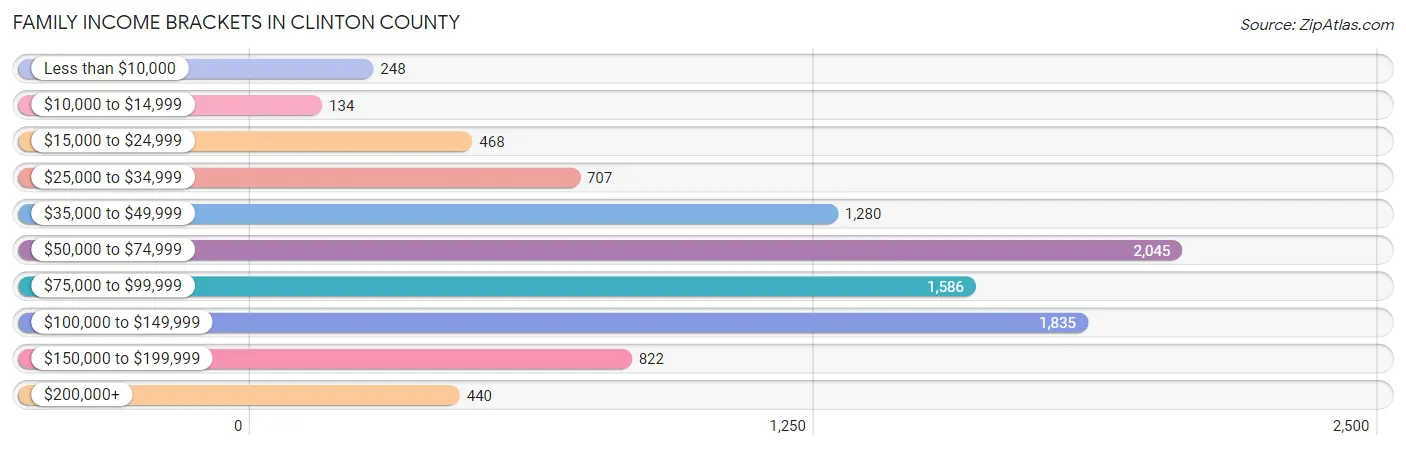
Family Income Brackets in Clinton County
According to the Clinton County family income data, there are 2,045 families falling into the $50,000 to $74,999 income range, which is the most common income bracket and makes up 21.4% of all families. Conversely, the $10,000 to $14,999 income bracket is the least frequent group with only 134 families (1.4%) belonging to this category.
| Income Bracket | # Families | % Families |
| Less than $10,000 | 248 | 2.6% |
| $10,000 to $14,999 | 134 | 1.4% |
| $15,000 to $24,999 | 468 | 4.9% |
| $25,000 to $34,999 | 707 | 7.4% |
| $35,000 to $49,999 | 1,280 | 13.4% |
| $50,000 to $74,999 | 2,045 | 21.4% |
| $75,000 to $99,999 | 1,586 | 16.6% |
| $100,000 to $149,999 | 1,835 | 19.2% |
| $150,000 to $199,999 | 822 | 8.6% |
| $200,000+ | 440 | 4.6% |
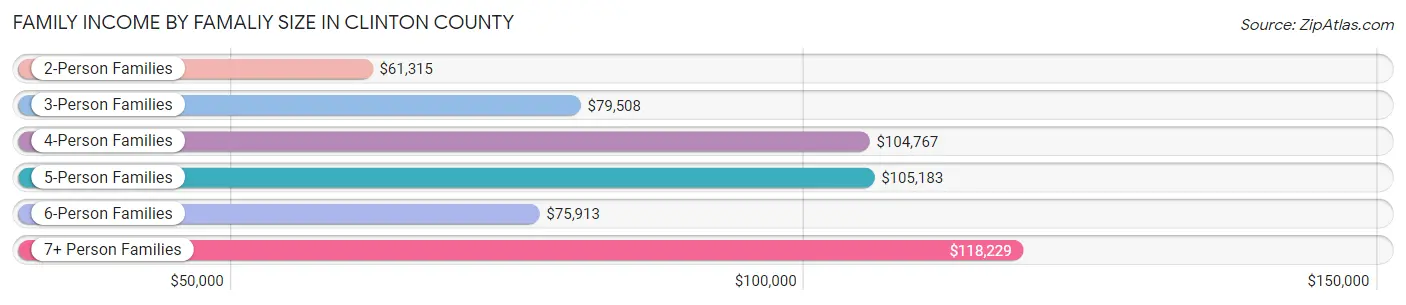
Family Income by Famaliy Size in Clinton County
7+ person families (183 | 1.9%) account for the highest median family income in Clinton County with $118,229 per family, while 2-person families (5,134 | 53.7%) have the highest median income of $30,658 per family member.
| Income Bracket | # Families | Median Income |
| 2-Person Families | 5,134 (53.7%) | $61,315 |
| 3-Person Families | 2,227 (23.3%) | $79,508 |
| 4-Person Families | 1,296 (13.6%) | $104,767 |
| 5-Person Families | 526 (5.5%) | $105,183 |
| 6-Person Families | 189 (2.0%) | $75,913 |
| 7+ Person Families | 183 (1.9%) | $118,229 |
| Total | 9,555 (100.0%) | $72,403 |
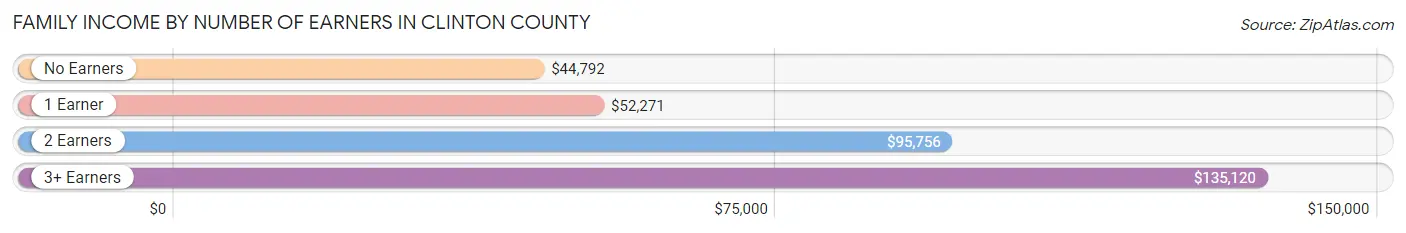
Family Income by Number of Earners in Clinton County
The median family income in Clinton County is $72,403, with families comprising 3+ earners (1,001) having the highest median family income of $135,120, while families with no earners (1,924) have the lowest median family income of $44,792, accounting for 10.5% and 20.1% of families, respectively.
| Number of Earners | # Families | Median Income |
| No Earners | 1,924 (20.1%) | $44,792 |
| 1 Earner | 2,866 (30.0%) | $52,271 |
| 2 Earners | 3,764 (39.4%) | $95,756 |
| 3+ Earners | 1,001 (10.5%) | $135,120 |
| Total | 9,555 (100.0%) | $72,403 |
Household Income in Clinton County
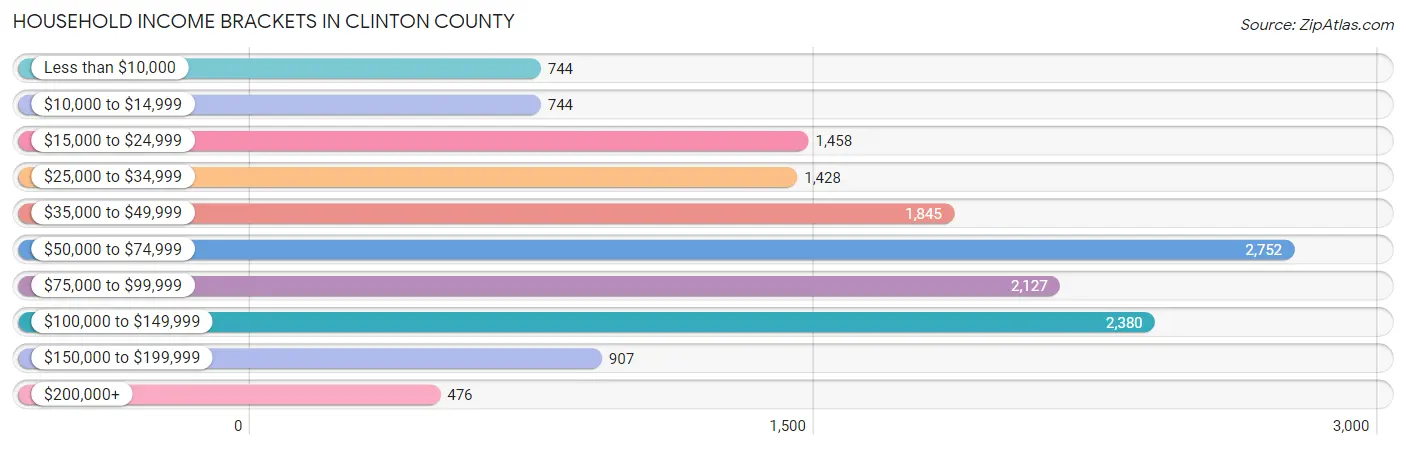
Household Income Brackets in Clinton County
With 2,752 households falling in the category, the $50,000 to $74,999 income range is the most frequent in Clinton County, accounting for 18.5% of all households. In contrast, only 476 households (3.2%) fall into the $200,000+ income bracket, making it the least populous group.
| Income Bracket | # Households | % Households |
| Less than $10,000 | 744 | 5.0% |
| $10,000 to $14,999 | 744 | 5.0% |
| $15,000 to $24,999 | 1,458 | 9.8% |
| $25,000 to $34,999 | 1,428 | 9.6% |
| $35,000 to $49,999 | 1,845 | 12.4% |
| $50,000 to $74,999 | 2,752 | 18.5% |
| $75,000 to $99,999 | 2,127 | 14.3% |
| $100,000 to $149,999 | 2,380 | 16.0% |
| $150,000 to $199,999 | 907 | 6.1% |
| $200,000+ | 476 | 3.2% |
Household Income by Householder Age in Clinton County
The median household income in Clinton County is $59,011, with the highest median household income of $76,987 found in the 25 to 44 years age bracket for the primary householder. A total of 4,009 households (27.0%) fall into this category. Meanwhile, the 15 to 24 years age bracket for the primary householder has the lowest median household income of $37,619, with 966 households (6.5%) in this group.
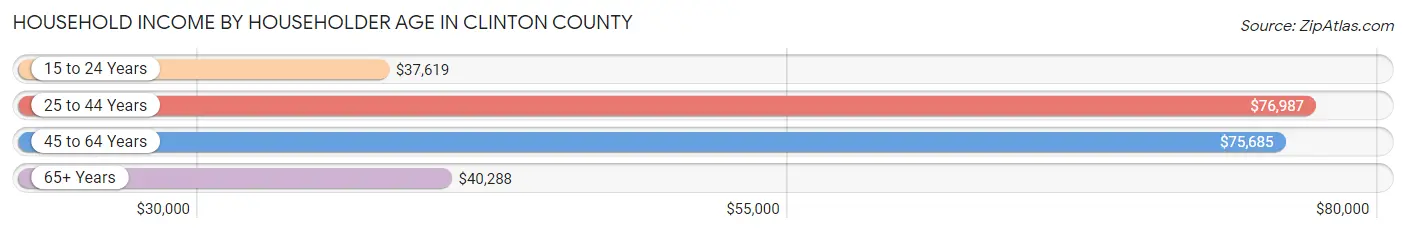
| Income Bracket | # Households | Median Income |
| 15 to 24 Years | 966 (6.5%) | $37,619 |
| 25 to 44 Years | 4,009 (27.0%) | $76,987 |
| 45 to 64 Years | 5,256 (35.3%) | $75,685 |
| 65+ Years | 4,646 (31.2%) | $40,288 |
| Total | 14,877 (100.0%) | $59,011 |
Poverty in Clinton County
Income Below Poverty by Sex and Age in Clinton County
With 12.0% poverty level for males and 14.2% for females among the residents of Clinton County, 18 to 24 year old males and 18 to 24 year old females are the most vulnerable to poverty, with 444 males (22.6%) and 558 females (25.0%) in their respective age groups living below the poverty level.
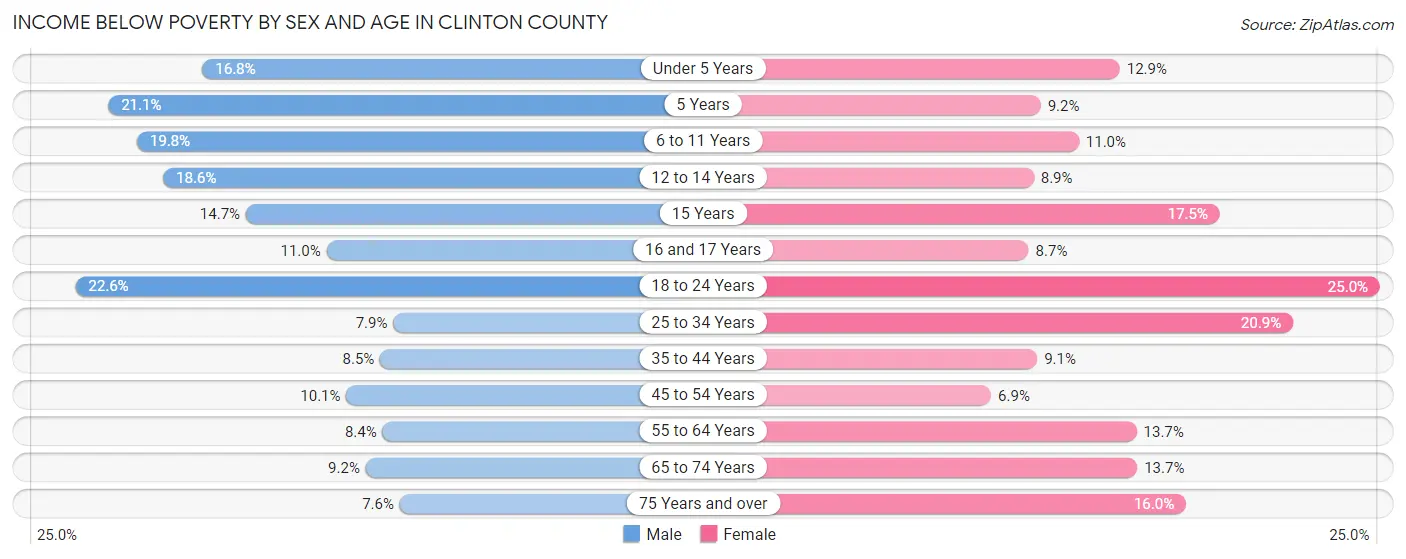
| Age Bracket | Male | Female |
| Under 5 Years | 168 (16.8%) | 130 (12.9%) |
| 5 Years | 64 (21.1%) | 12 (9.2%) |
| 6 to 11 Years | 241 (19.8%) | 137 (11.0%) |
| 12 to 14 Years | 122 (18.6%) | 53 (8.9%) |
| 15 Years | 19 (14.7%) | 37 (17.5%) |
| 16 and 17 Years | 59 (11.0%) | 43 (8.7%) |
| 18 to 24 Years | 444 (22.6%) | 558 (25.0%) |
| 25 to 34 Years | 183 (7.9%) | 392 (20.9%) |
| 35 to 44 Years | 172 (8.5%) | 175 (9.1%) |
| 45 to 54 Years | 218 (10.1%) | 146 (6.9%) |
| 55 to 64 Years | 213 (8.4%) | 342 (13.7%) |
| 65 to 74 Years | 180 (9.2%) | 295 (13.7%) |
| 75 Years and over | 100 (7.6%) | 268 (16.0%) |
| Total | 2,183 (12.0%) | 2,588 (14.2%) |
Income Above Poverty by Sex and Age in Clinton County
According to the poverty statistics in Clinton County, males aged 75 years and over and females aged 45 to 54 years are the age groups that are most secure financially, with 92.4% of males and 93.1% of females in these age groups living above the poverty line.
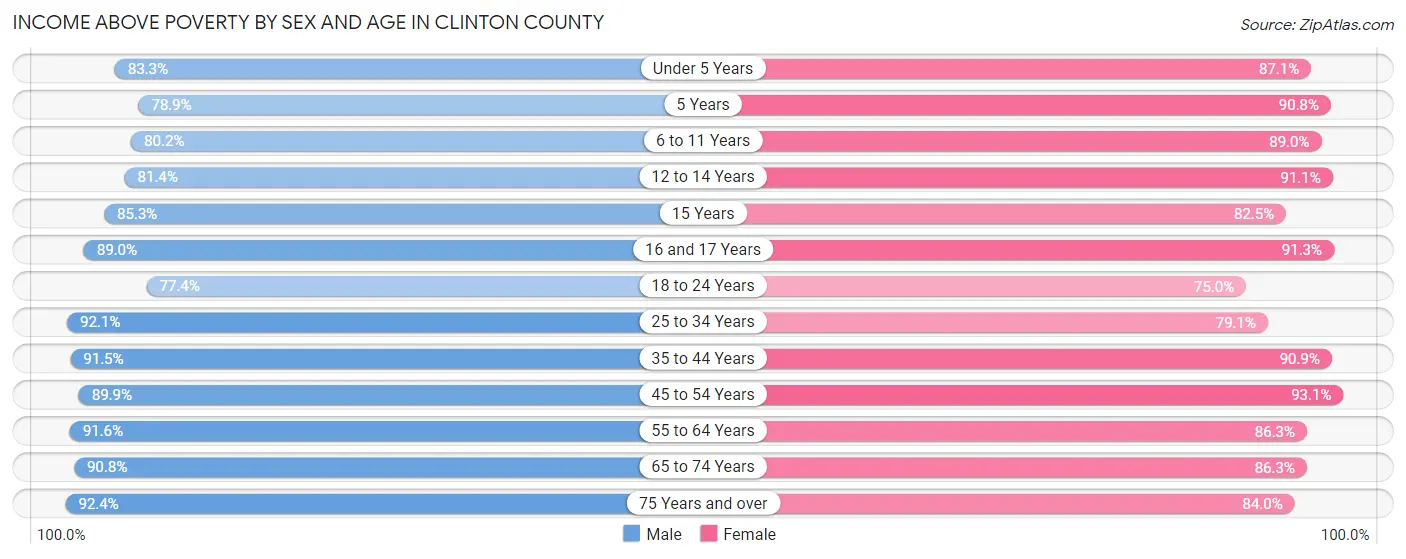
| Age Bracket | Male | Female |
| Under 5 Years | 835 (83.3%) | 878 (87.1%) |
| 5 Years | 239 (78.9%) | 118 (90.8%) |
| 6 to 11 Years | 977 (80.2%) | 1,108 (89.0%) |
| 12 to 14 Years | 535 (81.4%) | 542 (91.1%) |
| 15 Years | 110 (85.3%) | 174 (82.5%) |
| 16 and 17 Years | 478 (89.0%) | 453 (91.3%) |
| 18 to 24 Years | 1,517 (77.4%) | 1,677 (75.0%) |
| 25 to 34 Years | 2,136 (92.1%) | 1,480 (79.1%) |
| 35 to 44 Years | 1,851 (91.5%) | 1,754 (90.9%) |
| 45 to 54 Years | 1,947 (89.9%) | 1,962 (93.1%) |
| 55 to 64 Years | 2,327 (91.6%) | 2,158 (86.3%) |
| 65 to 74 Years | 1,783 (90.8%) | 1,856 (86.3%) |
| 75 Years and over | 1,217 (92.4%) | 1,410 (84.0%) |
| Total | 15,952 (88.0%) | 15,570 (85.8%) |
Income Below Poverty Among Married-Couple Families in Clinton County
The poverty statistics for married-couple families in Clinton County show that 4.2% or 306 of the total 7,309 families live below the poverty line. Families with 3 or 4 children have the highest poverty rate of 15.4%, comprising of 87 families. On the other hand, families with no children have the lowest poverty rate of 2.8%, which includes 134 families.
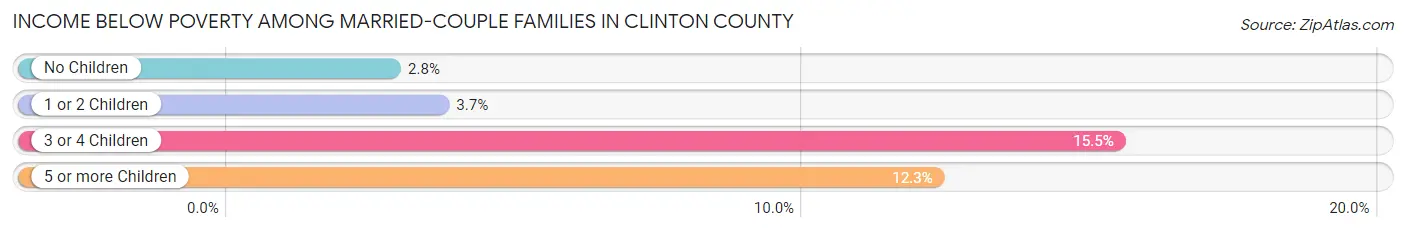
| Children | Above Poverty | Below Poverty |
| No Children | 4,589 (97.2%) | 134 (2.8%) |
| 1 or 2 Children | 1,831 (96.3%) | 70 (3.7%) |
| 3 or 4 Children | 476 (84.6%) | 87 (15.4%) |
| 5 or more Children | 107 (87.7%) | 15 (12.3%) |
| Total | 7,003 (95.8%) | 306 (4.2%) |
Income Below Poverty Among Single-Parent Households in Clinton County
According to the poverty data in Clinton County, 9.2% or 70 single-father households and 27.8% or 412 single-mother households are living below the poverty line. Among single-father households, those with 5 or more children have the highest poverty rate, with 8 households (100.0%) experiencing poverty. Likewise, among single-mother households, those with 1 or 2 children have the highest poverty rate, with 304 households (35.1%) falling below the poverty line.
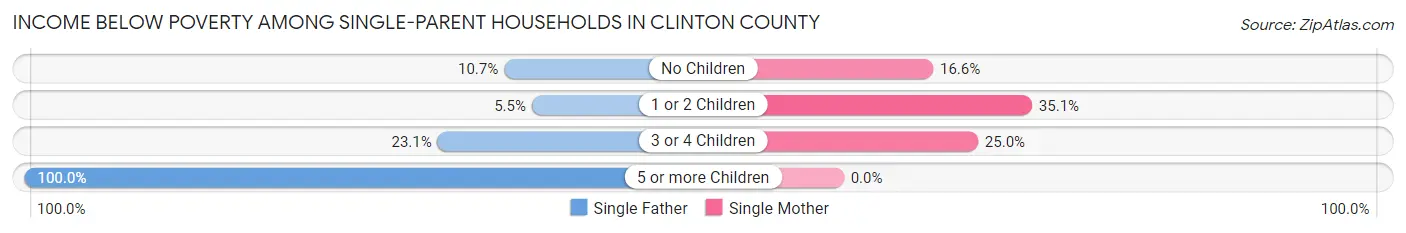
| Children | Single Father | Single Mother |
| No Children | 28 (10.7%) | 92 (16.6%) |
| 1 or 2 Children | 25 (5.5%) | 304 (35.1%) |
| 3 or 4 Children | 9 (23.1%) | 16 (25.0%) |
| 5 or more Children | 8 (100.0%) | 0 (0.0%) |
| Total | 70 (9.2%) | 412 (27.8%) |
Income Below Poverty Among Married-Couple vs Single-Parent Households in Clinton County
The poverty data for Clinton County shows that 306 of the married-couple family households (4.2%) and 482 of the single-parent households (21.5%) are living below the poverty level. Within the married-couple family households, those with 3 or 4 children have the highest poverty rate, with 87 households (15.4%) falling below the poverty line. Among the single-parent households, those with 5 or more children have the highest poverty rate, with 8 household (100.0%) living below poverty.
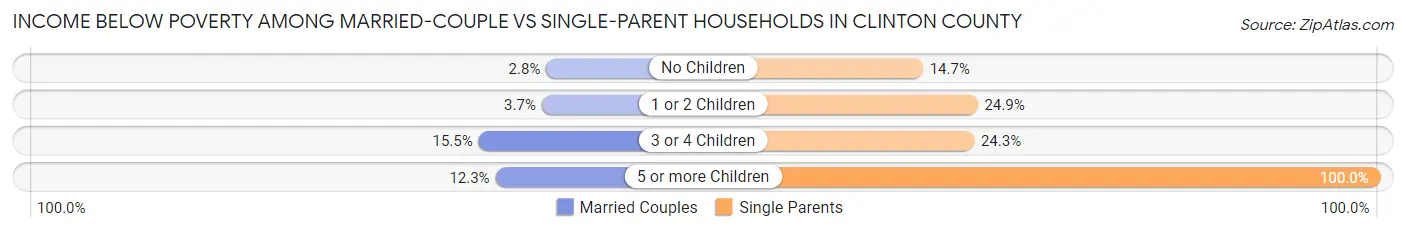
| Children | Married-Couple Families | Single-Parent Households |
| No Children | 134 (2.8%) | 120 (14.7%) |
| 1 or 2 Children | 70 (3.7%) | 329 (24.9%) |
| 3 or 4 Children | 87 (15.4%) | 25 (24.3%) |
| 5 or more Children | 15 (12.3%) | 8 (100.0%) |
| Total | 306 (4.2%) | 482 (21.5%) |
Race in Clinton County
The most populous races in Clinton County are White / Caucasian (35,945 | 94.9%), Two or more Races (909 | 2.4%), and Hispanic or Latino (654 | 1.7%).
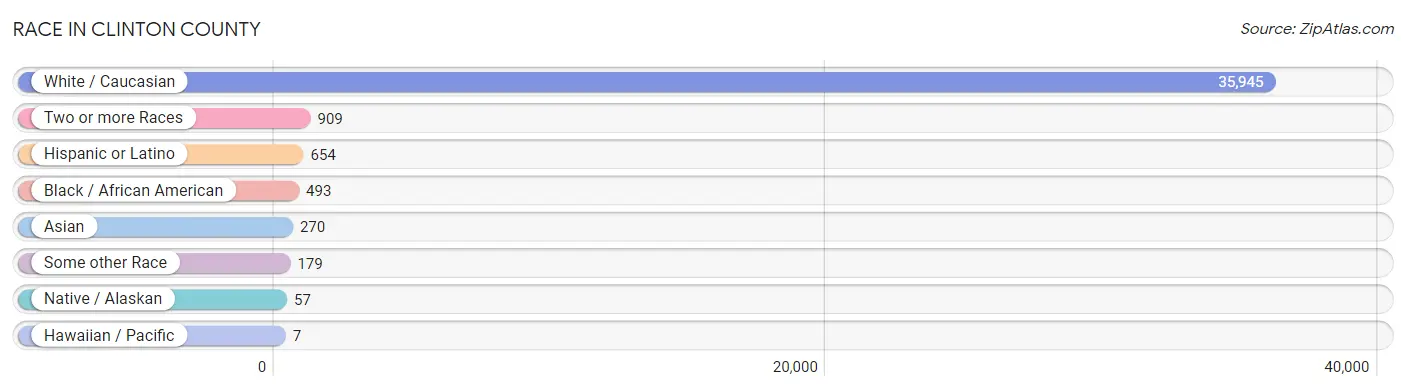
| Race | # Population | % Population |
| Asian | 270 | 0.7% |
| Black / African American | 493 | 1.3% |
| Hawaiian / Pacific | 7 | 0.0% |
| Hispanic or Latino | 654 | 1.7% |
| Native / Alaskan | 57 | 0.2% |
| White / Caucasian | 35,945 | 94.9% |
| Two or more Races | 909 | 2.4% |
| Some other Race | 179 | 0.5% |
| Total | 37,860 | 100.0% |
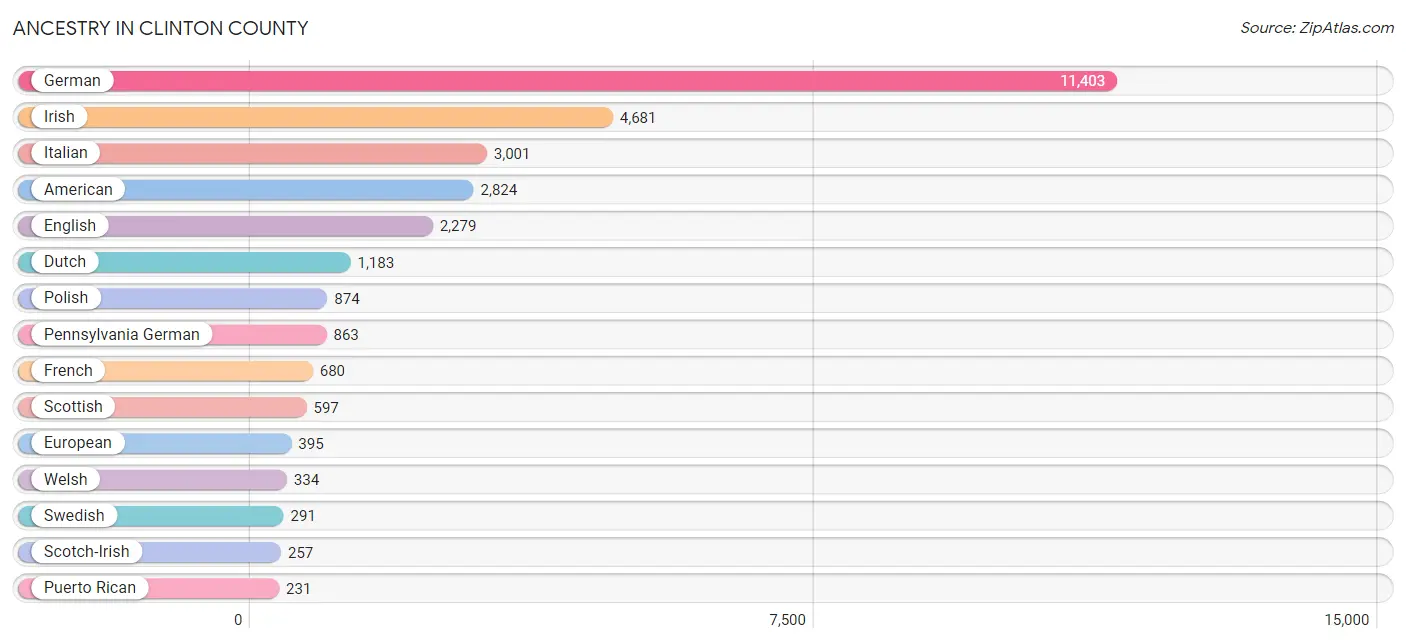
Ancestry in Clinton County
The most populous ancestries reported in Clinton County are German (11,403 | 30.1%), Irish (4,681 | 12.4%), Italian (3,001 | 7.9%), American (2,824 | 7.5%), and English (2,279 | 6.0%), together accounting for 63.9% of all Clinton County residents.
| Ancestry | # Population | % Population |
| African | 34 | 0.1% |
| Albanian | 3 | 0.0% |
| American | 2,824 | 7.5% |
| Arab | 21 | 0.1% |
| Argentinean | 12 | 0.0% |
| Armenian | 14 | 0.0% |
| Austrian | 54 | 0.1% |
| Bhutanese | 24 | 0.1% |
| Blackfeet | 1 | 0.0% |
| British | 190 | 0.5% |
| Bulgarian | 1 | 0.0% |
| Burmese | 63 | 0.2% |
| Canadian | 16 | 0.0% |
| Celtic | 5 | 0.0% |
| Central American | 128 | 0.3% |
| Central American Indian | 13 | 0.0% |
| Cherokee | 38 | 0.1% |
| Chickasaw | 33 | 0.1% |
| Croatian | 3 | 0.0% |
| Cuban | 8 | 0.0% |
| Czech | 13 | 0.0% |
| Czechoslovakian | 82 | 0.2% |
| Danish | 4 | 0.0% |
| Delaware | 1 | 0.0% |
| Dominican | 38 | 0.1% |
| Dutch | 1,183 | 3.1% |
| Eastern European | 60 | 0.2% |
| Egyptian | 4 | 0.0% |
| English | 2,279 | 6.0% |
| Estonian | 6 | 0.0% |
| European | 395 | 1.0% |
| Finnish | 25 | 0.1% |
| French | 680 | 1.8% |
| French Canadian | 61 | 0.2% |
| German | 11,403 | 30.1% |
| Greek | 33 | 0.1% |
| Guamanian / Chamorro | 7 | 0.0% |
| Guatemalan | 66 | 0.2% |
| Honduran | 62 | 0.2% |
| Hungarian | 77 | 0.2% |
| Icelander | 4 | 0.0% |
| Indian (Asian) | 65 | 0.2% |
| Indonesian | 21 | 0.1% |
| Irish | 4,681 | 12.4% |
| Iroquois | 2 | 0.0% |
| Italian | 3,001 | 7.9% |
| Jamaican | 44 | 0.1% |
| Korean | 77 | 0.2% |
| Laotian | 1 | 0.0% |
| Latvian | 5 | 0.0% |
| Lebanese | 13 | 0.0% |
| Lithuanian | 86 | 0.2% |
| Mexican | 183 | 0.5% |
| Native Hawaiian | 6 | 0.0% |
| Northern European | 14 | 0.0% |
| Norwegian | 45 | 0.1% |
| Pakistani | 16 | 0.0% |
| Pennsylvania German | 863 | 2.3% |
| Polish | 874 | 2.3% |
| Portuguese | 42 | 0.1% |
| Puerto Rican | 231 | 0.6% |
| Russian | 219 | 0.6% |
| Scandinavian | 46 | 0.1% |
| Scotch-Irish | 257 | 0.7% |
| Scottish | 597 | 1.6% |
| Slavic | 28 | 0.1% |
| Slovak | 153 | 0.4% |
| Slovene | 4 | 0.0% |
| South American | 12 | 0.0% |
| South American Indian | 1 | 0.0% |
| Spaniard | 20 | 0.1% |
| Sri Lankan | 33 | 0.1% |
| Subsaharan African | 34 | 0.1% |
| Swedish | 291 | 0.8% |
| Swiss | 178 | 0.5% |
| Thai | 33 | 0.1% |
| Trinidadian and Tobagonian | 41 | 0.1% |
| Ukrainian | 53 | 0.1% |
| Welsh | 334 | 0.9% |
| West Indian | 13 | 0.0% | View All 80 Rows |
Immigrants in Clinton County
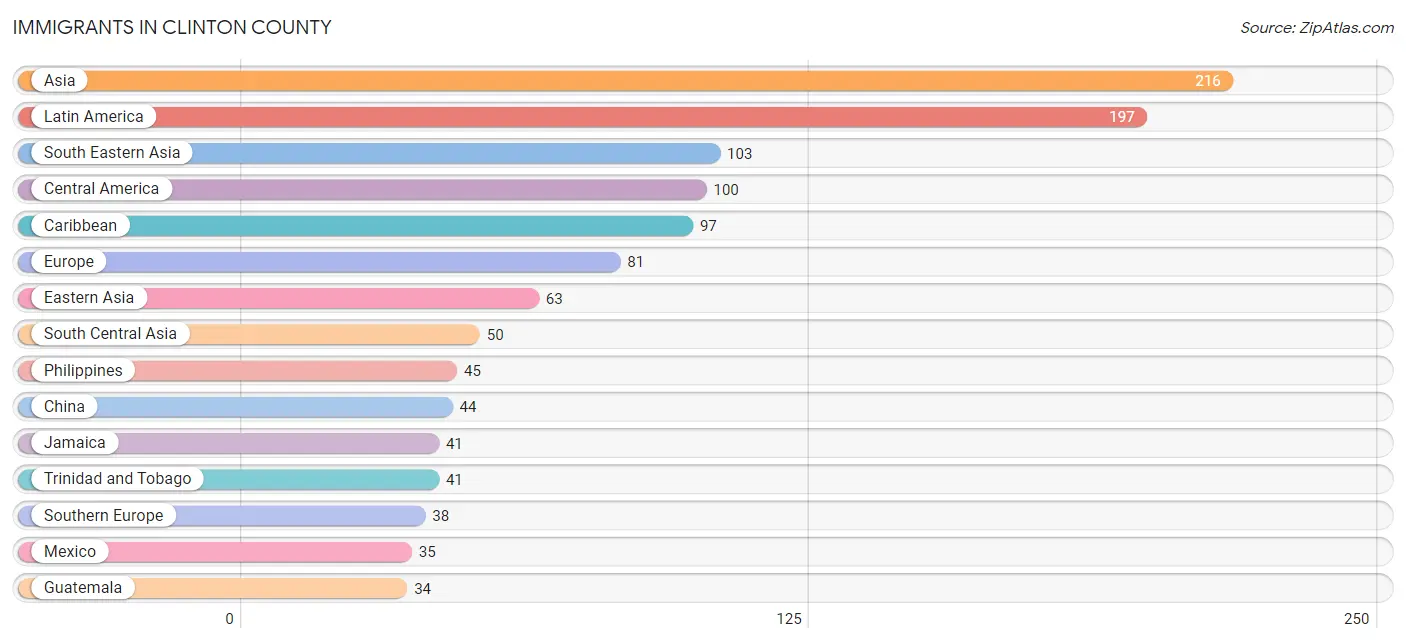
The most numerous immigrant groups reported in Clinton County came from Asia (216 | 0.6%), Latin America (197 | 0.5%), South Eastern Asia (103 | 0.3%), Central America (100 | 0.3%), and Caribbean (97 | 0.3%), together accounting for 1.9% of all Clinton County residents.
| Immigration Origin | # Population | % Population |
| Africa | 29 | 0.1% |
| Asia | 216 | 0.6% |
| Austria | 3 | 0.0% |
| Azores | 17 | 0.0% |
| Bulgaria | 1 | 0.0% |
| Canada | 17 | 0.0% |
| Caribbean | 97 | 0.3% |
| Central America | 100 | 0.3% |
| China | 44 | 0.1% |
| Dominica | 15 | 0.0% |
| Eastern Asia | 63 | 0.2% |
| Eastern Europe | 22 | 0.1% |
| England | 3 | 0.0% |
| Europe | 81 | 0.2% |
| Germany | 2 | 0.0% |
| Greece | 4 | 0.0% |
| Guatemala | 34 | 0.1% |
| Honduras | 31 | 0.1% |
| India | 29 | 0.1% |
| Indonesia | 5 | 0.0% |
| Iran | 9 | 0.0% |
| Jamaica | 41 | 0.1% |
| Japan | 2 | 0.0% |
| Korea | 17 | 0.0% |
| Latin America | 197 | 0.5% |
| Latvia | 5 | 0.0% |
| Mexico | 35 | 0.1% |
| Netherlands | 3 | 0.0% |
| Northern Europe | 13 | 0.0% |
| Oceania | 30 | 0.1% |
| Philippines | 45 | 0.1% |
| Poland | 12 | 0.0% |
| Portugal | 17 | 0.0% |
| Russia | 4 | 0.0% |
| South Africa | 29 | 0.1% |
| South Central Asia | 50 | 0.1% |
| South Eastern Asia | 103 | 0.3% |
| Southern Europe | 38 | 0.1% |
| Spain | 17 | 0.0% |
| Sri Lanka | 12 | 0.0% |
| Trinidad and Tobago | 41 | 0.1% |
| Vietnam | 32 | 0.1% |
| Western Europe | 8 | 0.0% | View All 43 Rows |
Sex and Age in Clinton County
Sex and Age in Clinton County
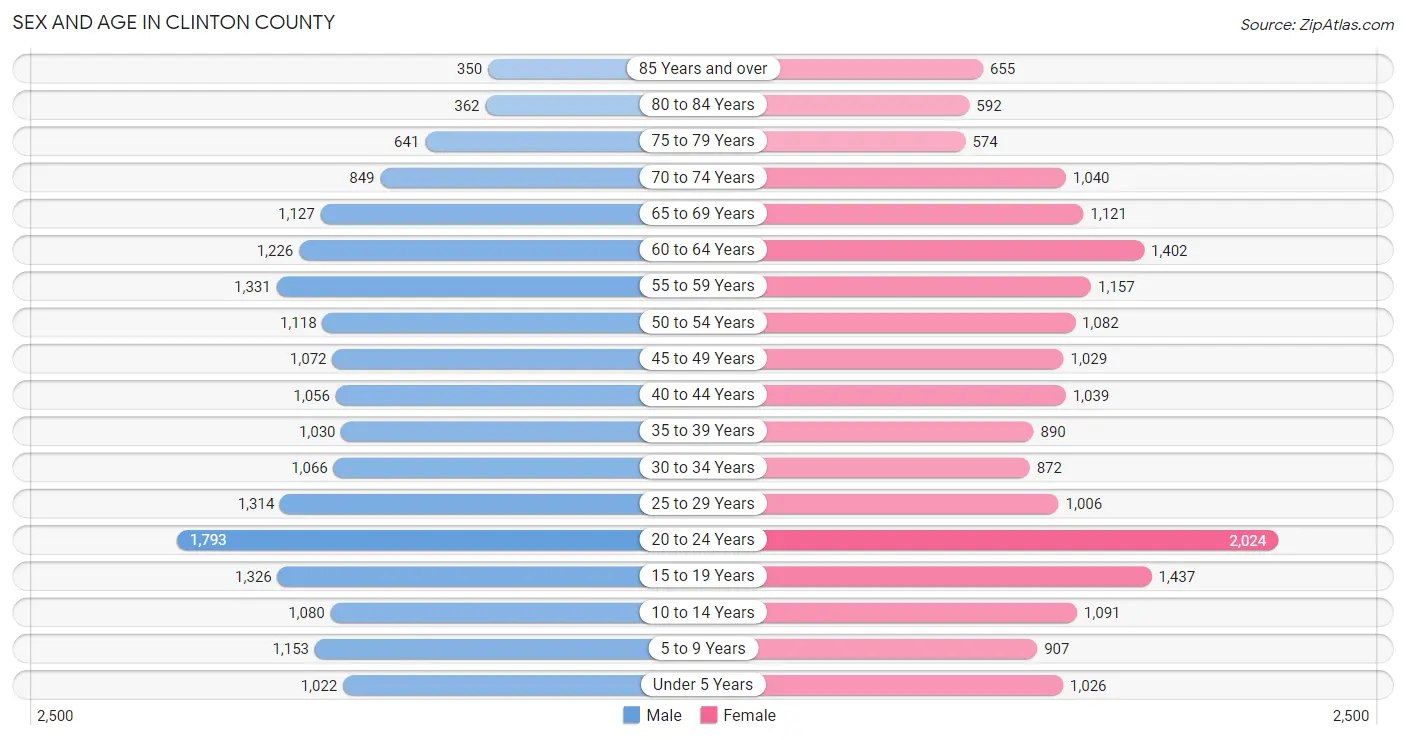
The most populous age groups in Clinton County are 20 to 24 Years (1,793 | 9.5%) for men and 20 to 24 Years (2,024 | 10.7%) for women.
| Age Bracket | Male | Female |
| Under 5 Years | 1,022 (5.4%) | 1,026 (5.4%) |
| 5 to 9 Years | 1,153 (6.1%) | 907 (4.8%) |
| 10 to 14 Years | 1,080 (5.7%) | 1,091 (5.8%) |
| 15 to 19 Years | 1,326 (7.0%) | 1,437 (7.6%) |
| 20 to 24 Years | 1,793 (9.5%) | 2,024 (10.7%) |
| 25 to 29 Years | 1,314 (7.0%) | 1,006 (5.3%) |
| 30 to 34 Years | 1,066 (5.6%) | 872 (4.6%) |
| 35 to 39 Years | 1,030 (5.4%) | 890 (4.7%) |
| 40 to 44 Years | 1,056 (5.6%) | 1,039 (5.5%) |
| 45 to 49 Years | 1,072 (5.7%) | 1,029 (5.4%) |
| 50 to 54 Years | 1,118 (5.9%) | 1,082 (5.7%) |
| 55 to 59 Years | 1,331 (7.0%) | 1,157 (6.1%) |
| 60 to 64 Years | 1,226 (6.5%) | 1,402 (7.4%) |
| 65 to 69 Years | 1,127 (6.0%) | 1,121 (5.9%) |
| 70 to 74 Years | 849 (4.5%) | 1,040 (5.5%) |
| 75 to 79 Years | 641 (3.4%) | 574 (3.0%) |
| 80 to 84 Years | 362 (1.9%) | 592 (3.1%) |
| 85 Years and over | 350 (1.8%) | 655 (3.5%) |
| Total | 18,916 (100.0%) | 18,944 (100.0%) |
Families and Households in Clinton County
Median Family Size in Clinton County
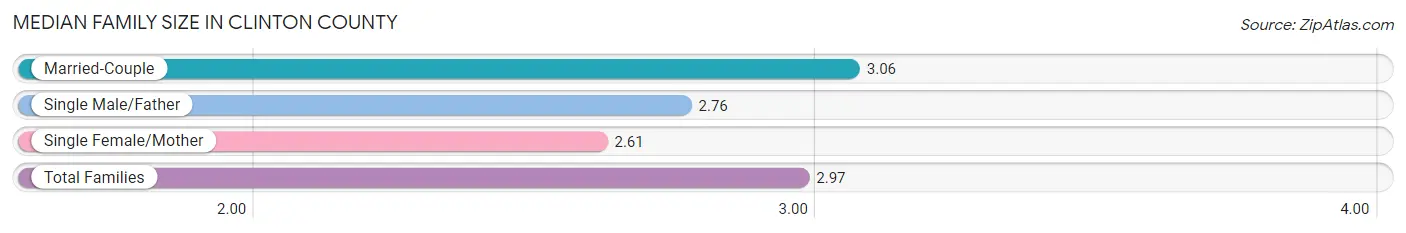
The median family size in Clinton County is 2.97 persons per family, with married-couple families (7,309 | 76.5%) accounting for the largest median family size of 3.06 persons per family. On the other hand, single female/mother families (1,484 | 15.5%) represent the smallest median family size with 2.61 persons per family.
| Family Type | # Families | Family Size |
| Married-Couple | 7,309 (76.5%) | 3.06 |
| Single Male/Father | 762 (8.0%) | 2.76 |
| Single Female/Mother | 1,484 (15.5%) | 2.61 |
| Total Families | 9,555 (100.0%) | 2.97 |
Median Household Size in Clinton County
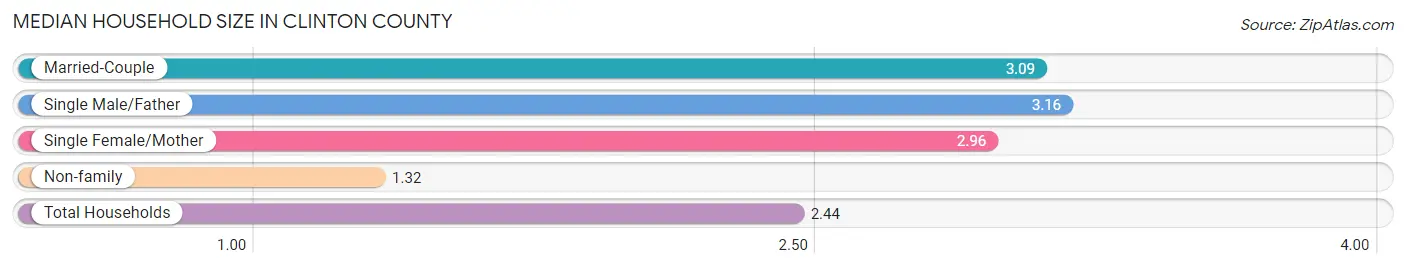
The median household size in Clinton County is 2.44 persons per household, with single male/father households (762 | 5.1%) accounting for the largest median household size of 3.16 persons per household. non-family households (5,322 | 35.8%) represent the smallest median household size with 1.32 persons per household.
| Household Type | # Households | Household Size |
| Married-Couple | 7,309 (49.1%) | 3.09 |
| Single Male/Father | 762 (5.1%) | 3.16 |
| Single Female/Mother | 1,484 (10.0%) | 2.96 |
| Non-family | 5,322 (35.8%) | 1.32 |
| Total Households | 14,877 (100.0%) | 2.44 |
Household Size by Marriage Status in Clinton County
Out of a total of 14,877 households in Clinton County, 9,555 (64.2%) are family households, while 5,322 (35.8%) are nonfamily households. The most numerous type of family households are 2-person households, comprising 4,686, and the most common type of nonfamily households are 1-person households, comprising 3,929.
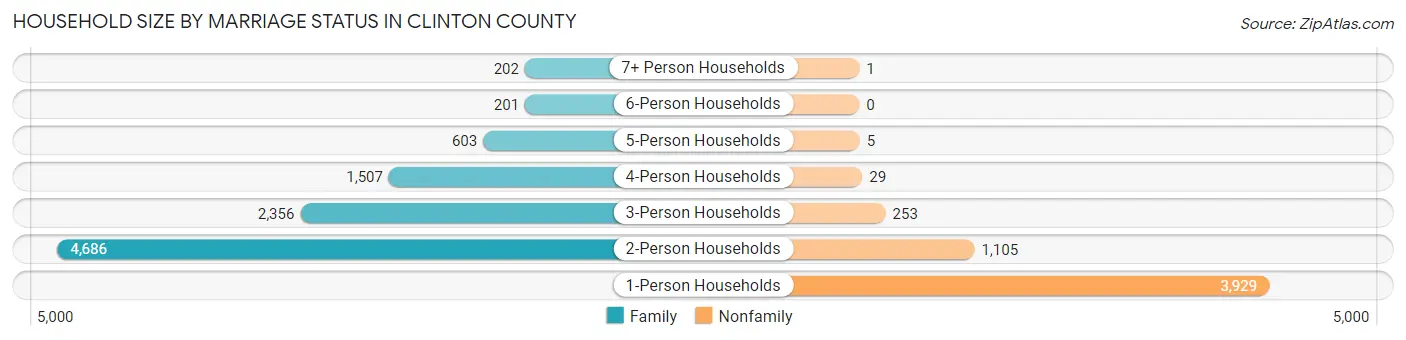
| Household Size | Family Households | Nonfamily Households |
| 1-Person Households | - | 3,929 (26.4%) |
| 2-Person Households | 4,686 (31.5%) | 1,105 (7.4%) |
| 3-Person Households | 2,356 (15.8%) | 253 (1.7%) |
| 4-Person Households | 1,507 (10.1%) | 29 (0.2%) |
| 5-Person Households | 603 (4.1%) | 5 (0.0%) |
| 6-Person Households | 201 (1.3%) | 0 (0.0%) |
| 7+ Person Households | 202 (1.4%) | 1 (0.0%) |
| Total | 9,555 (64.2%) | 5,322 (35.8%) |
Female Fertility in Clinton County
Fertility by Age in Clinton County
Average fertility rate in Clinton County is 72.0 births per 1,000 women. Women in the age bracket of 20 to 34 years have the highest fertility rate with 130.0 births per 1,000 women. Women in the age bracket of 20 to 34 years acount for 82.4% of all women with births.
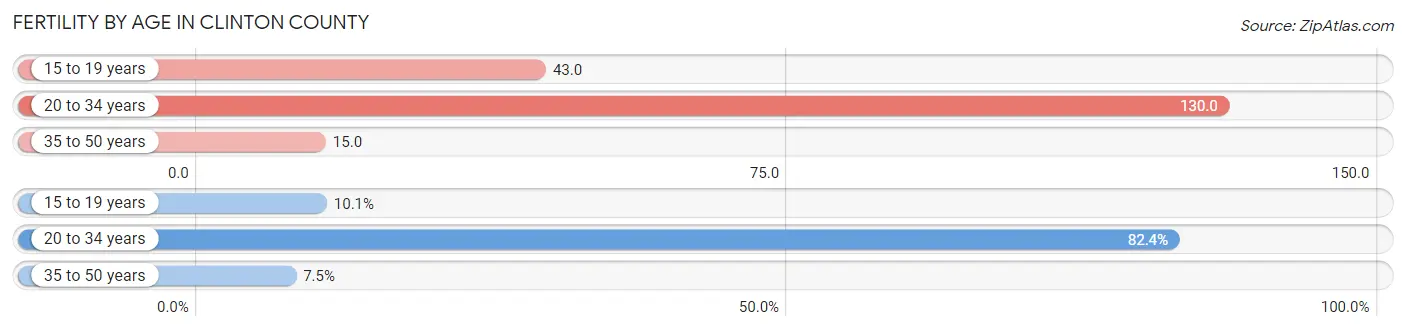
| Age Bracket | Women with Births | Births / 1,000 Women |
| 15 to 19 years | 62 (10.1%) | 43.0 |
| 20 to 34 years | 507 (82.4%) | 130.0 |
| 35 to 50 years | 46 (7.5%) | 15.0 |
| Total | 615 (100.0%) | 72.0 |
Fertility by Age by Marriage Status in Clinton County
58.9% of women with births (615) in Clinton County are married. The highest percentage of unmarried women with births falls into 15 to 19 years age bracket with 100.0% of them unmarried at the time of birth, while the lowest percentage of unmarried women with births belong to 35 to 50 years age bracket with 0.0% of them unmarried.
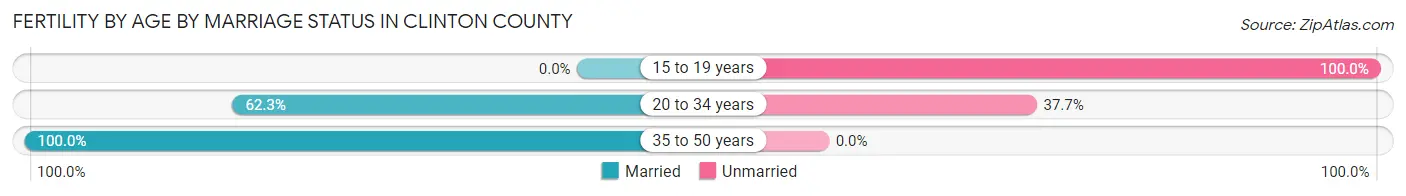
| Age Bracket | Married | Unmarried |
| 15 to 19 years | 0 (0.0%) | 62 (100.0%) |
| 20 to 34 years | 316 (62.3%) | 191 (37.7%) |
| 35 to 50 years | 46 (100.0%) | 0 (0.0%) |
| Total | 362 (58.9%) | 253 (41.1%) |
Fertility by Education in Clinton County
Average fertility rate in Clinton County is 72.0 births per 1,000 women. Women with the education attainment of high school diploma have the highest fertility rate of 114.0 births per 1,000 women, while women with the education attainment of college or associate's degree have the lowest fertility at 20.0 births per 1,000 women. Women with the education attainment of high school diploma represent 46.3% of all women with births.
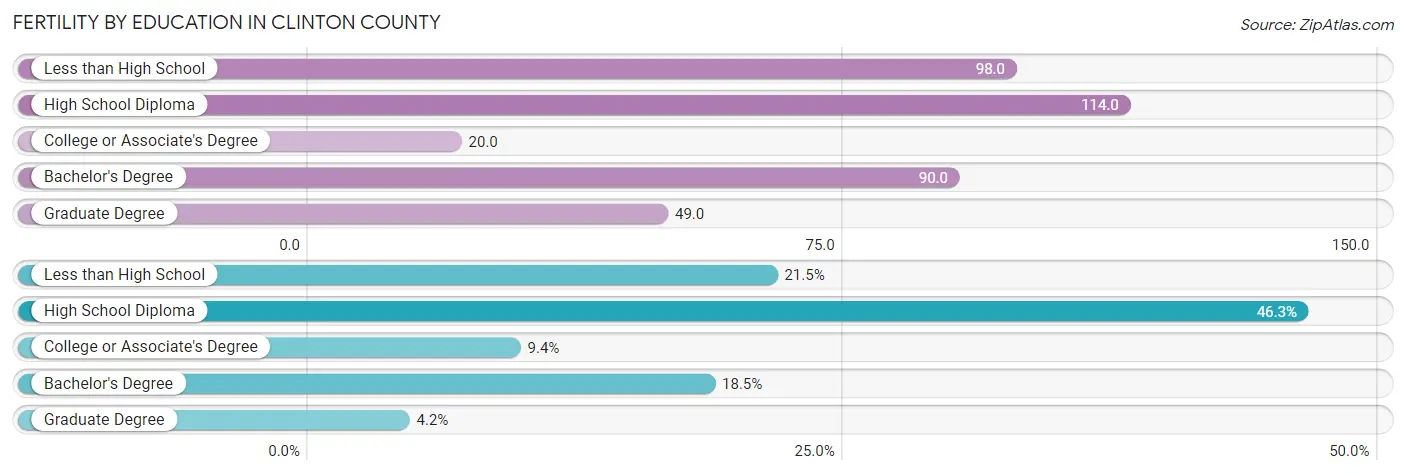
| Educational Attainment | Women with Births | Births / 1,000 Women |
| Less than High School | 132 (21.5%) | 98.0 |
| High School Diploma | 285 (46.3%) | 114.0 |
| College or Associate's Degree | 58 (9.4%) | 20.0 |
| Bachelor's Degree | 114 (18.5%) | 90.0 |
| Graduate Degree | 26 (4.2%) | 49.0 |
| Total | 615 (100.0%) | 72.0 |
Fertility by Education by Marriage Status in Clinton County
41.1% of women with births in Clinton County are unmarried. Women with the educational attainment of graduate degree are most likely to be married with 84.6% of them married at childbirth, while women with the educational attainment of less than high school are least likely to be married with 53.0% of them unmarried at childbirth.
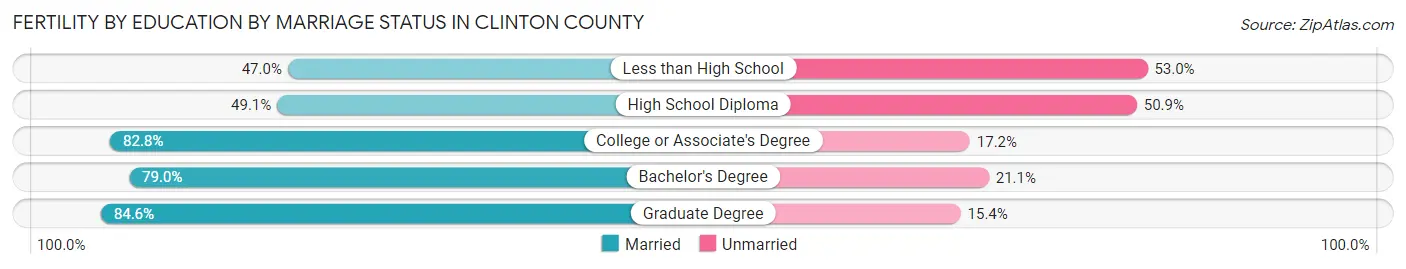
| Educational Attainment | Married | Unmarried |
| Less than High School | 62 (47.0%) | 70 (53.0%) |
| High School Diploma | 140 (49.1%) | 145 (50.9%) |
| College or Associate's Degree | 48 (82.8%) | 10 (17.2%) |
| Bachelor's Degree | 90 (78.9%) | 24 (21.0%) |
| Graduate Degree | 22 (84.6%) | 4 (15.4%) |
| Total | 362 (58.9%) | 253 (41.1%) |
Employment Characteristics in Clinton County
Employment by Class of Employer in Clinton County
Among the 17,268 employed individuals in Clinton County, private company employees (11,653 | 67.5%), not-for-profit organizations (1,689 | 9.8%), and state government employees (1,155 | 6.7%) make up the most common classes of employment.
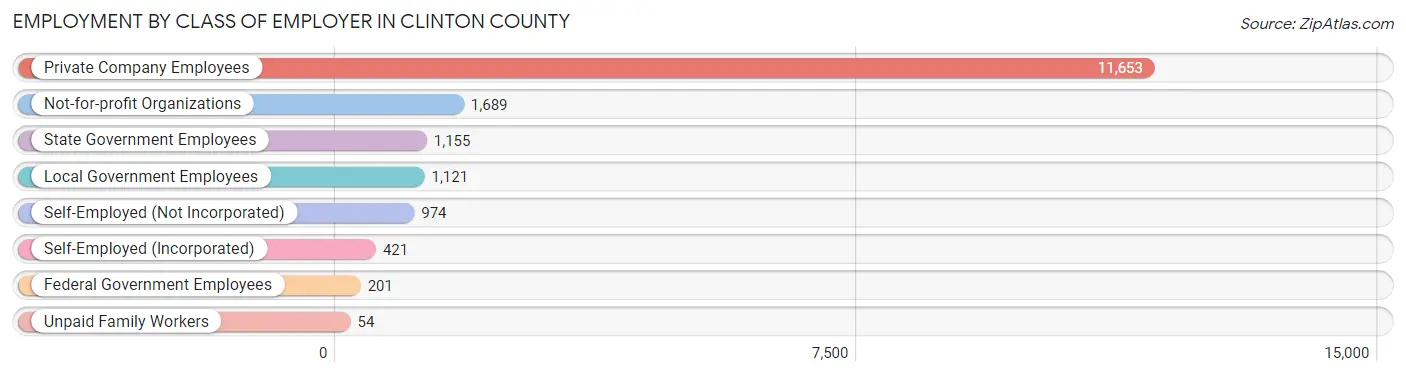
| Employer Class | # Employees | % Employees |
| Private Company Employees | 11,653 | 67.5% |
| Self-Employed (Incorporated) | 421 | 2.4% |
| Self-Employed (Not Incorporated) | 974 | 5.6% |
| Not-for-profit Organizations | 1,689 | 9.8% |
| Local Government Employees | 1,121 | 6.5% |
| State Government Employees | 1,155 | 6.7% |
| Federal Government Employees | 201 | 1.2% |
| Unpaid Family Workers | 54 | 0.3% |
| Total | 17,268 | 100.0% |
Employment Status by Age in Clinton County
According to the labor force statistics for Clinton County, out of the total population over 16 years of age (31,233), 59.6% or 18,615 individuals are in the labor force, with 5.3% or 987 of them unemployed. The age group with the highest labor force participation rate is 25 to 29 years, with 86.5% or 2,007 individuals in the labor force. Within the labor force, the 45 to 54 years age range has the highest percentage of unemployed individuals, with 6.8% or 248 of them being unemployed.
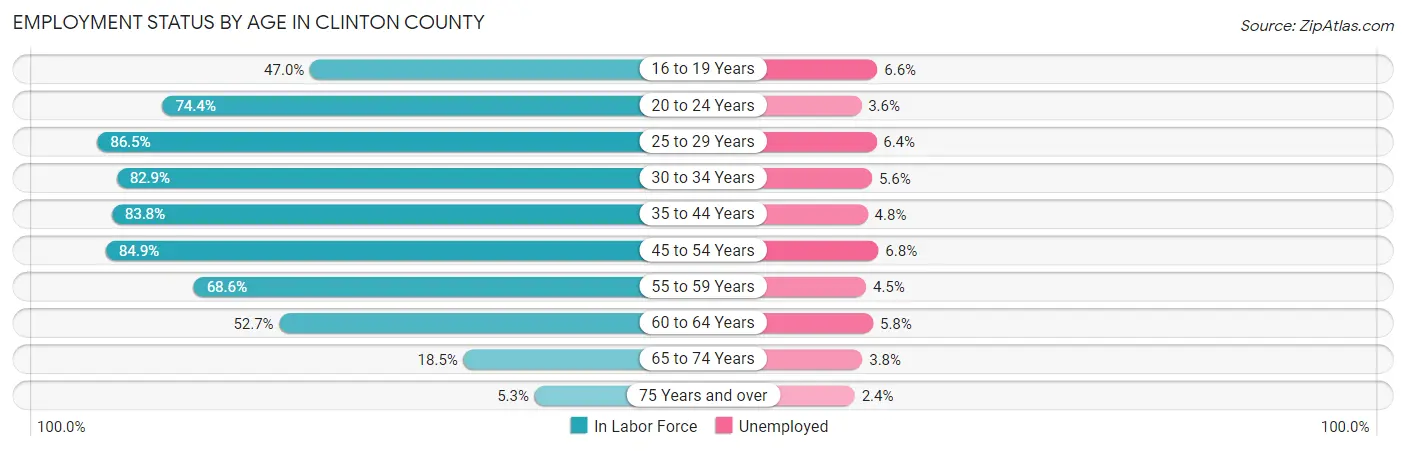
| Age Bracket | In Labor Force | Unemployed |
| 16 to 19 Years | 1,135 (47.0%) | 75 (6.6%) |
| 20 to 24 Years | 2,840 (74.4%) | 102 (3.6%) |
| 25 to 29 Years | 2,007 (86.5%) | 128 (6.4%) |
| 30 to 34 Years | 1,607 (82.9%) | 90 (5.6%) |
| 35 to 44 Years | 3,365 (83.8%) | 162 (4.8%) |
| 45 to 54 Years | 3,652 (84.9%) | 248 (6.8%) |
| 55 to 59 Years | 1,707 (68.6%) | 77 (4.5%) |
| 60 to 64 Years | 1,385 (52.7%) | 80 (5.8%) |
| 65 to 74 Years | 765 (18.5%) | 29 (3.8%) |
| 75 Years and over | 168 (5.3%) | 4 (2.4%) |
| Total | 18,615 (59.6%) | 987 (5.3%) |
Employment Status by Educational Attainment in Clinton County
According to labor force statistics for Clinton County, 77.6% of individuals (13,727) out of the total population between 25 and 64 years of age (17,690) are in the labor force, with 5.7% or 782 of them being unemployed. The group with the highest labor force participation rate are those with the educational attainment of bachelor's degree or higher, with 87.3% or 3,438 individuals in the labor force. Within the labor force, individuals with less than high school education have the highest percentage of unemployment, with 8.8% or 84 of them being unemployed.
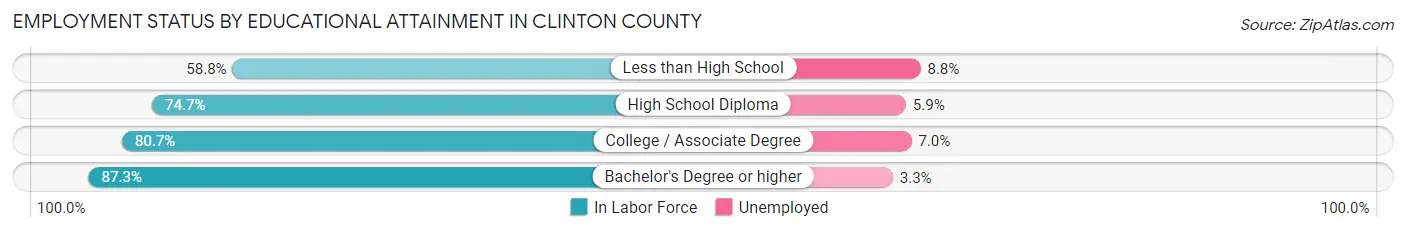
| Educational Attainment | In Labor Force | Unemployed |
| Less than High School | 958 (58.8%) | 143 (8.8%) |
| High School Diploma | 5,675 (74.7%) | 448 (5.9%) |
| College / Associate Degree | 3,652 (80.7%) | 317 (7.0%) |
| Bachelor's Degree or higher | 3,438 (87.3%) | 130 (3.3%) |
| Total | 13,727 (77.6%) | 1,008 (5.7%) |
Employment Occupations by Sex in Clinton County
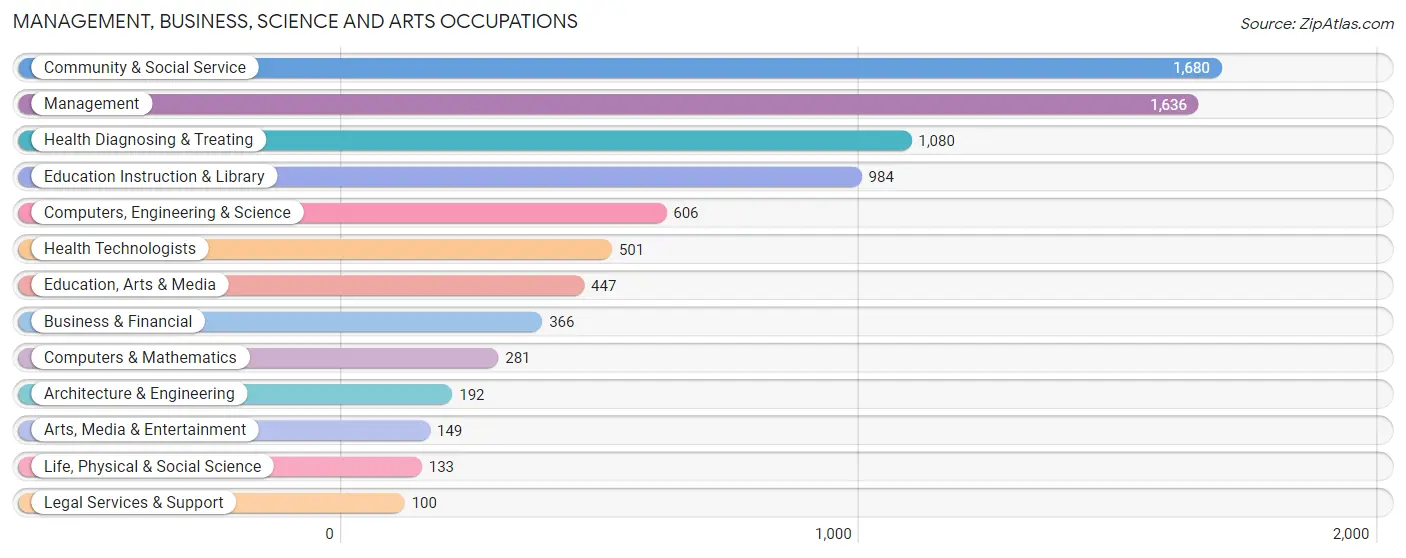
Management, Business, Science and Arts Occupations
The most common Management, Business, Science and Arts occupations in Clinton County are Community & Social Service (1,680 | 9.5%), Management (1,636 | 9.3%), Health Diagnosing & Treating (1,080 | 6.1%), Education Instruction & Library (984 | 5.6%), and Computers, Engineering & Science (606 | 3.4%).
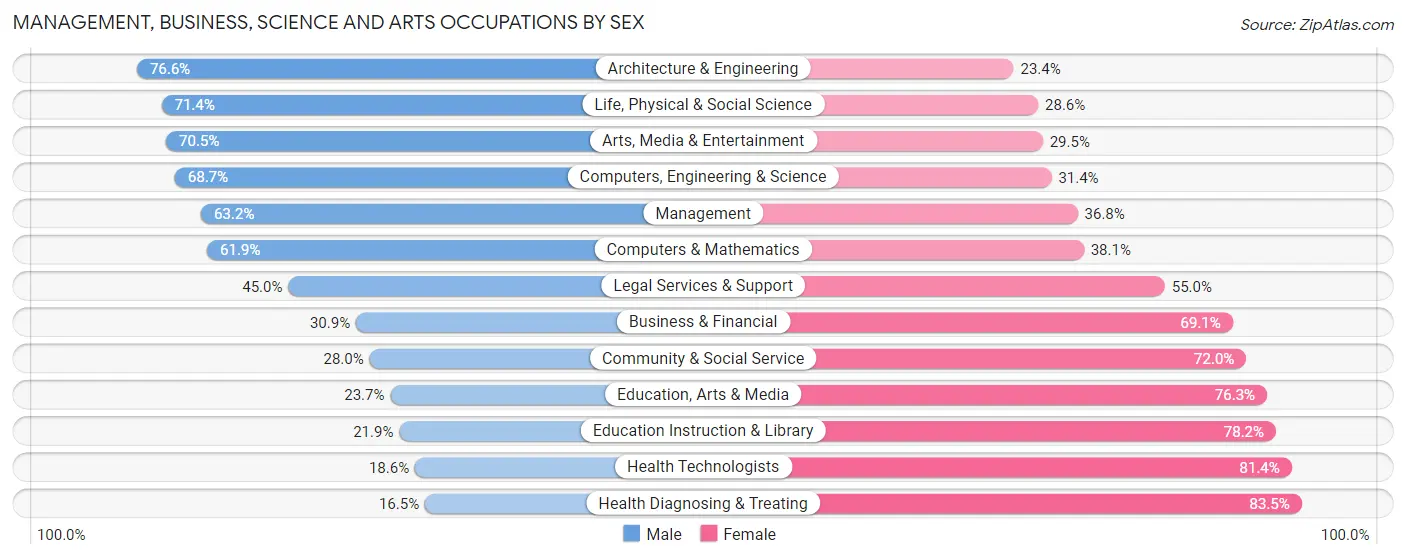
Management, Business, Science and Arts Occupations by Sex
Within the Management, Business, Science and Arts occupations in Clinton County, the most male-oriented occupations are Architecture & Engineering (76.6%), Life, Physical & Social Science (71.4%), and Arts, Media & Entertainment (70.5%), while the most female-oriented occupations are Health Diagnosing & Treating (83.5%), Health Technologists (81.4%), and Education Instruction & Library (78.1%).
| Occupation | Male | Female |
| Management | 1,034 (63.2%) | 602 (36.8%) |
| Business & Financial | 113 (30.9%) | 253 (69.1%) |
| Computers, Engineering & Science | 416 (68.6%) | 190 (31.4%) |
| Computers & Mathematics | 174 (61.9%) | 107 (38.1%) |
| Architecture & Engineering | 147 (76.6%) | 45 (23.4%) |
| Life, Physical & Social Science | 95 (71.4%) | 38 (28.6%) |
| Community & Social Service | 471 (28.0%) | 1,209 (72.0%) |
| Education, Arts & Media | 106 (23.7%) | 341 (76.3%) |
| Legal Services & Support | 45 (45.0%) | 55 (55.0%) |
| Education Instruction & Library | 215 (21.8%) | 769 (78.1%) |
| Arts, Media & Entertainment | 105 (70.5%) | 44 (29.5%) |
| Health Diagnosing & Treating | 178 (16.5%) | 902 (83.5%) |
| Health Technologists | 93 (18.6%) | 408 (81.4%) |
| Total (Category) | 2,212 (41.2%) | 3,156 (58.8%) |
| Total (Overall) | 9,334 (53.0%) | 8,287 (47.0%) |
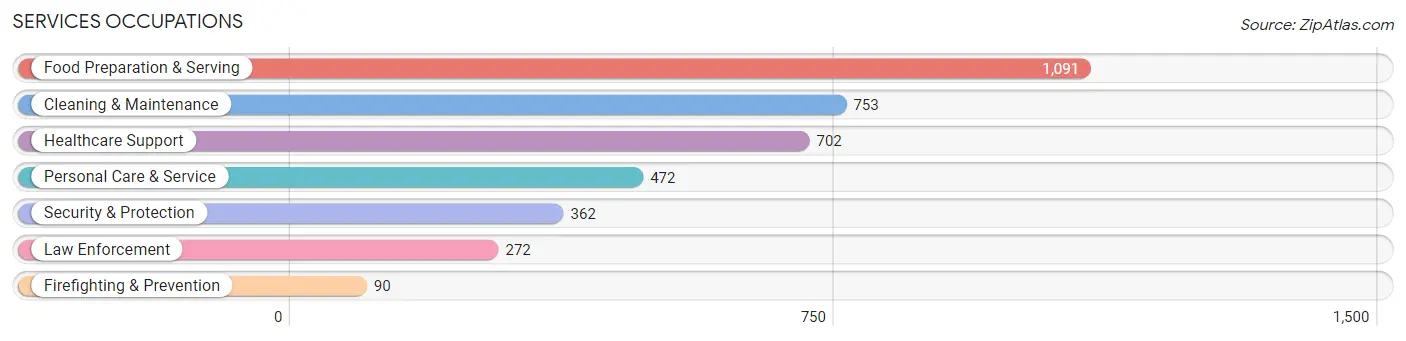
Services Occupations
The most common Services occupations in Clinton County are Food Preparation & Serving (1,091 | 6.2%), Cleaning & Maintenance (753 | 4.3%), Healthcare Support (702 | 4.0%), Personal Care & Service (472 | 2.7%), and Security & Protection (362 | 2.1%).
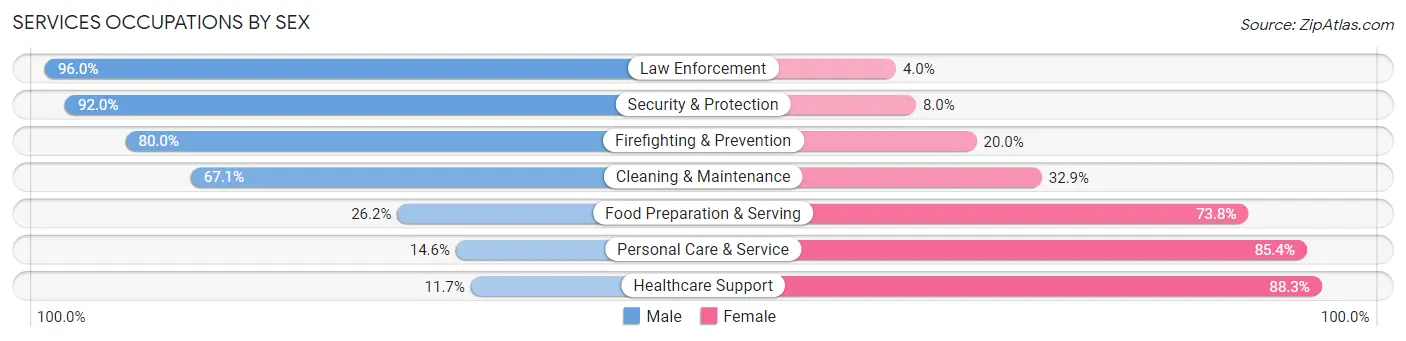
Services Occupations by Sex
Within the Services occupations in Clinton County, the most male-oriented occupations are Law Enforcement (96.0%), Security & Protection (92.0%), and Firefighting & Prevention (80.0%), while the most female-oriented occupations are Healthcare Support (88.3%), Personal Care & Service (85.4%), and Food Preparation & Serving (73.8%).
| Occupation | Male | Female |
| Healthcare Support | 82 (11.7%) | 620 (88.3%) |
| Security & Protection | 333 (92.0%) | 29 (8.0%) |
| Firefighting & Prevention | 72 (80.0%) | 18 (20.0%) |
| Law Enforcement | 261 (96.0%) | 11 (4.0%) |
| Food Preparation & Serving | 286 (26.2%) | 805 (73.8%) |
| Cleaning & Maintenance | 505 (67.1%) | 248 (32.9%) |
| Personal Care & Service | 69 (14.6%) | 403 (85.4%) |
| Total (Category) | 1,275 (37.7%) | 2,105 (62.3%) |
| Total (Overall) | 9,334 (53.0%) | 8,287 (47.0%) |
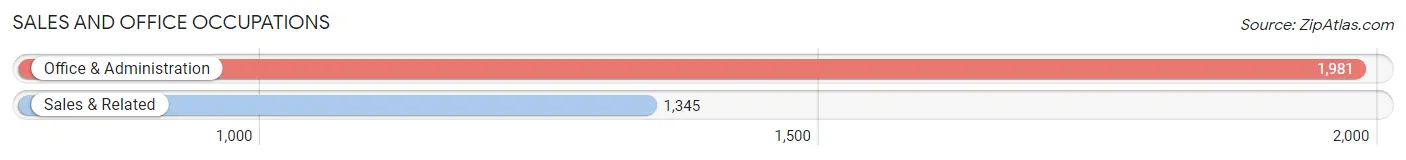
Sales and Office Occupations
The most common Sales and Office occupations in Clinton County are Office & Administration (1,981 | 11.2%), and Sales & Related (1,345 | 7.6%).
Sales and Office Occupations by Sex
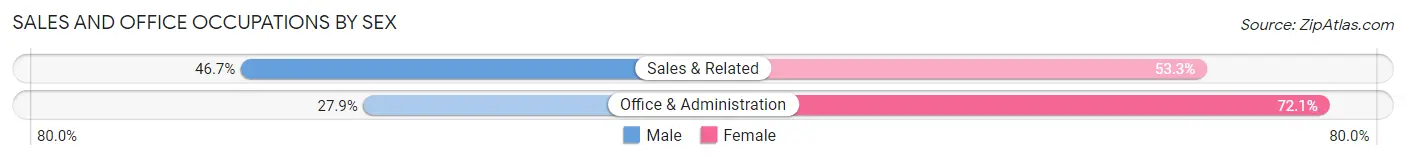
| Occupation | Male | Female |
| Sales & Related | 628 (46.7%) | 717 (53.3%) |
| Office & Administration | 552 (27.9%) | 1,429 (72.1%) |
| Total (Category) | 1,180 (35.5%) | 2,146 (64.5%) |
| Total (Overall) | 9,334 (53.0%) | 8,287 (47.0%) |
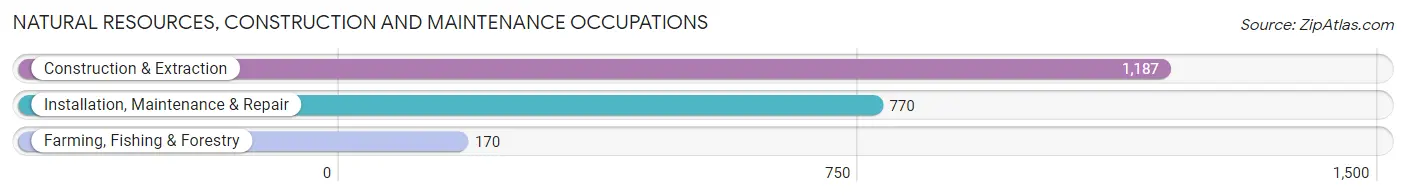
Natural Resources, Construction and Maintenance Occupations
The most common Natural Resources, Construction and Maintenance occupations in Clinton County are Construction & Extraction (1,187 | 6.7%), Installation, Maintenance & Repair (770 | 4.4%), and Farming, Fishing & Forestry (170 | 1.0%).
Natural Resources, Construction and Maintenance Occupations by Sex
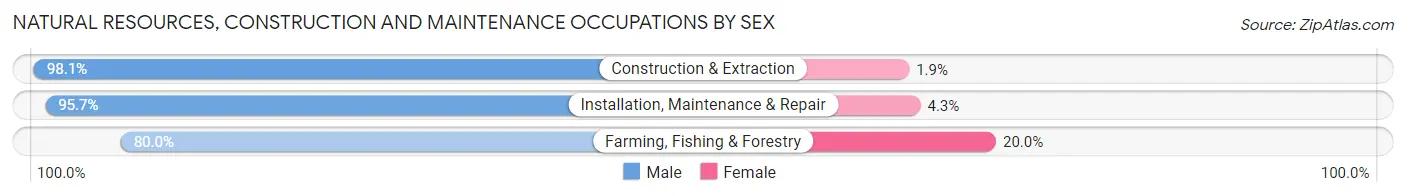
| Occupation | Male | Female |
| Farming, Fishing & Forestry | 136 (80.0%) | 34 (20.0%) |
| Construction & Extraction | 1,164 (98.1%) | 23 (1.9%) |
| Installation, Maintenance & Repair | 737 (95.7%) | 33 (4.3%) |
| Total (Category) | 2,037 (95.8%) | 90 (4.2%) |
| Total (Overall) | 9,334 (53.0%) | 8,287 (47.0%) |
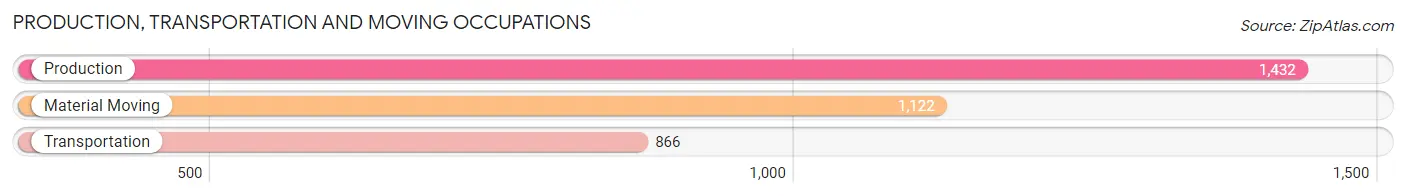
Production, Transportation and Moving Occupations
The most common Production, Transportation and Moving occupations in Clinton County are Production (1,432 | 8.1%), Material Moving (1,122 | 6.4%), and Transportation (866 | 4.9%).
Production, Transportation and Moving Occupations by Sex
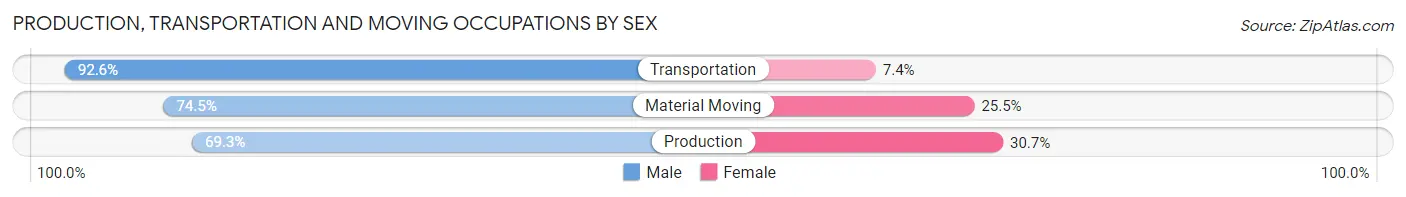
| Occupation | Male | Female |
| Production | 992 (69.3%) | 440 (30.7%) |
| Transportation | 802 (92.6%) | 64 (7.4%) |
| Material Moving | 836 (74.5%) | 286 (25.5%) |
| Total (Category) | 2,630 (76.9%) | 790 (23.1%) |
| Total (Overall) | 9,334 (53.0%) | 8,287 (47.0%) |
Employment Industries by Sex in Clinton County
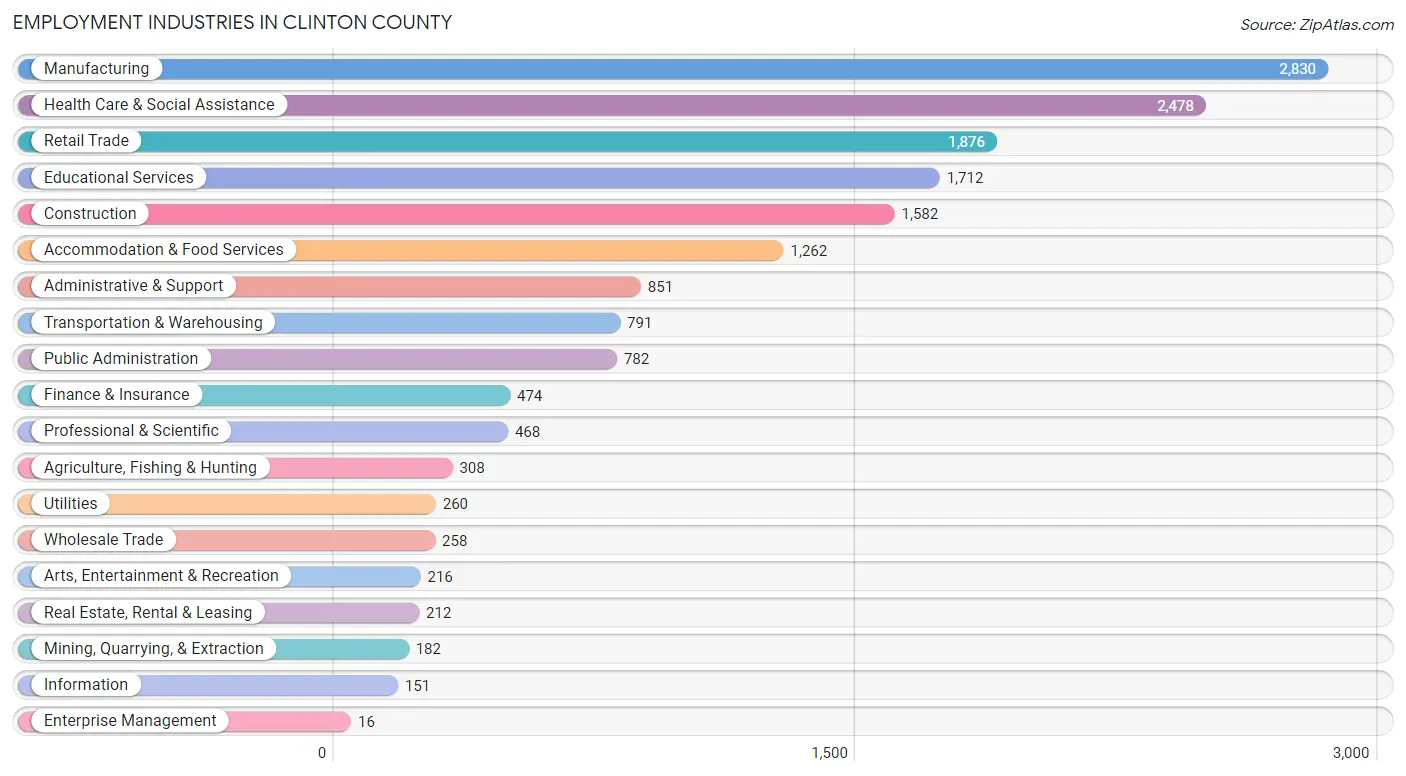
Employment Industries in Clinton County
The major employment industries in Clinton County include Manufacturing (2,830 | 16.1%), Health Care & Social Assistance (2,478 | 14.1%), Retail Trade (1,876 | 10.6%), Educational Services (1,712 | 9.7%), and Construction (1,582 | 9.0%).
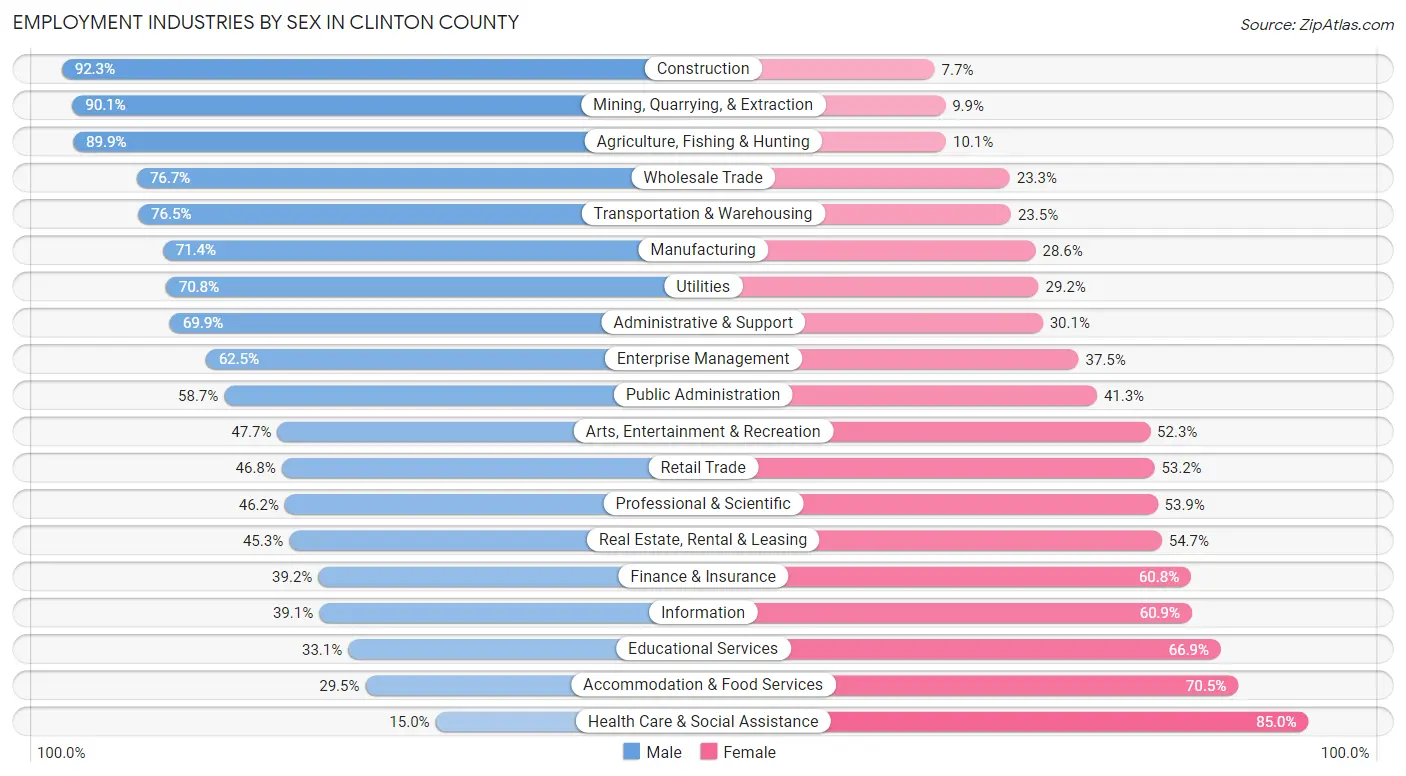
Employment Industries by Sex in Clinton County
The Clinton County industries that see more men than women are Construction (92.3%), Mining, Quarrying, & Extraction (90.1%), and Agriculture, Fishing & Hunting (89.9%), whereas the industries that tend to have a higher number of women are Health Care & Social Assistance (85.0%), Accommodation & Food Services (70.5%), and Educational Services (66.9%).
| Industry | Male | Female |
| Agriculture, Fishing & Hunting | 277 (89.9%) | 31 (10.1%) |
| Mining, Quarrying, & Extraction | 164 (90.1%) | 18 (9.9%) |
| Construction | 1,460 (92.3%) | 122 (7.7%) |
| Manufacturing | 2,021 (71.4%) | 809 (28.6%) |
| Wholesale Trade | 198 (76.7%) | 60 (23.3%) |
| Retail Trade | 878 (46.8%) | 998 (53.2%) |
| Transportation & Warehousing | 605 (76.5%) | 186 (23.5%) |
| Utilities | 184 (70.8%) | 76 (29.2%) |
| Information | 59 (39.1%) | 92 (60.9%) |
| Finance & Insurance | 186 (39.2%) | 288 (60.8%) |
| Real Estate, Rental & Leasing | 96 (45.3%) | 116 (54.7%) |
| Professional & Scientific | 216 (46.2%) | 252 (53.8%) |
| Enterprise Management | 10 (62.5%) | 6 (37.5%) |
| Administrative & Support | 595 (69.9%) | 256 (30.1%) |
| Educational Services | 566 (33.1%) | 1,146 (66.9%) |
| Health Care & Social Assistance | 371 (15.0%) | 2,107 (85.0%) |
| Arts, Entertainment & Recreation | 103 (47.7%) | 113 (52.3%) |
| Accommodation & Food Services | 372 (29.5%) | 890 (70.5%) |
| Public Administration | 459 (58.7%) | 323 (41.3%) |
| Total | 9,334 (53.0%) | 8,287 (47.0%) |
Education in Clinton County
School Enrollment in Clinton County
The most common levels of schooling among the 8,290 students in Clinton County are college / undergraduate (2,407 | 29.0%), middle school (1,898 | 22.9%), and elementary school (1,516 | 18.3%).
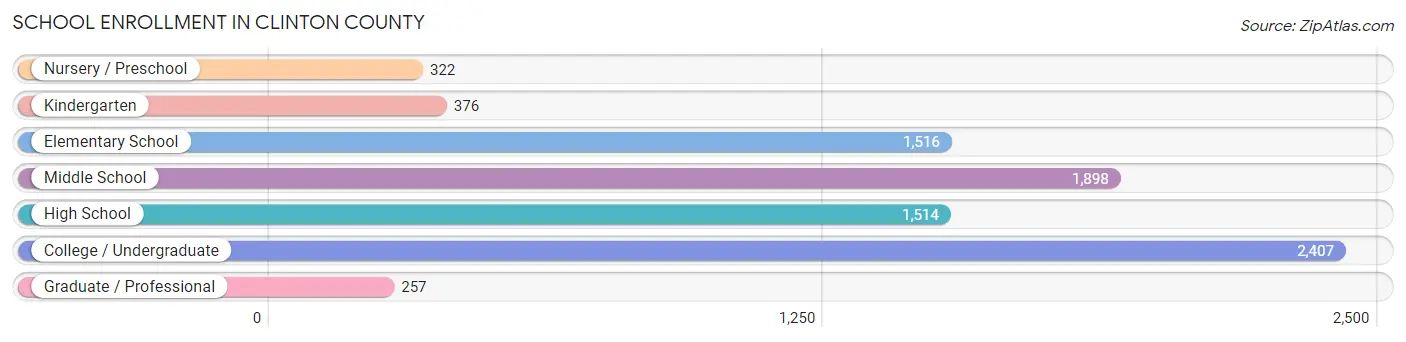
| School Level | # Students | % Students |
| Nursery / Preschool | 322 | 3.9% |
| Kindergarten | 376 | 4.5% |
| Elementary School | 1,516 | 18.3% |
| Middle School | 1,898 | 22.9% |
| High School | 1,514 | 18.3% |
| College / Undergraduate | 2,407 | 29.0% |
| Graduate / Professional | 257 | 3.1% |
| Total | 8,290 | 100.0% |
School Enrollment by Age by Funding Source in Clinton County
Out of a total of 8,290 students who are enrolled in schools in Clinton County, 1,268 (15.3%) attend a private institution, while the remaining 7,022 (84.7%) are enrolled in public schools. The age group of 3 to 4 year olds has the highest likelihood of being enrolled in private schools, with 65 (28.9% in the age bracket) enrolled. Conversely, the age group of 20 to 24 year olds has the lowest likelihood of being enrolled in a private school, with 1,207 (94.3% in the age bracket) attending a public institution.
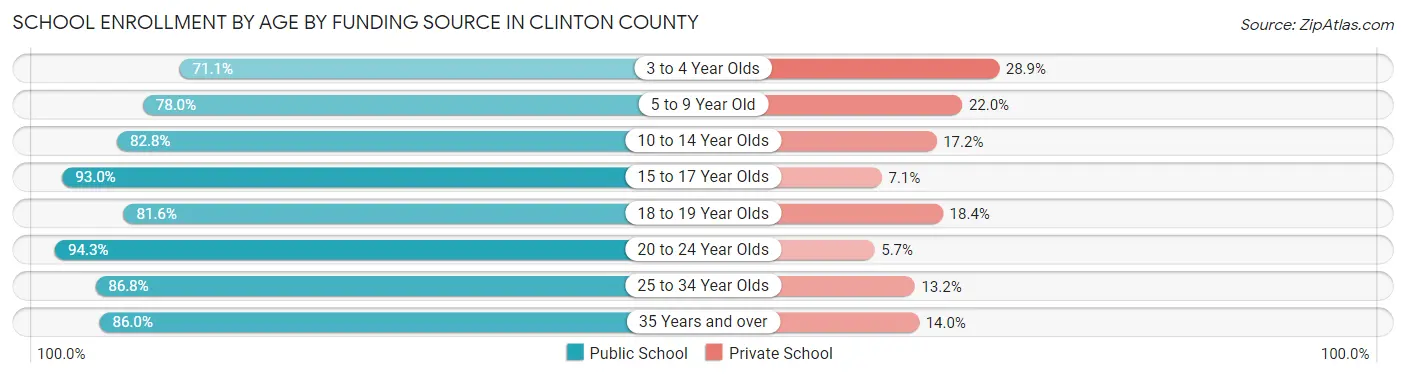
| Age Bracket | Public School | Private School |
| 3 to 4 Year Olds | 160 (71.1%) | 65 (28.9%) |
| 5 to 9 Year Old | 1,451 (78.0%) | 410 (22.0%) |
| 10 to 14 Year Olds | 1,742 (82.8%) | 363 (17.2%) |
| 15 to 17 Year Olds | 1,120 (92.9%) | 85 (7.0%) |
| 18 to 19 Year Olds | 827 (81.6%) | 187 (18.4%) |
| 20 to 24 Year Olds | 1,207 (94.3%) | 73 (5.7%) |
| 25 to 34 Year Olds | 204 (86.8%) | 31 (13.2%) |
| 35 Years and over | 314 (86.0%) | 51 (14.0%) |
| Total | 7,022 (84.7%) | 1,268 (15.3%) |
Educational Attainment by Field of Study in Clinton County
Education (1,452 | 25.6%), arts & humanities (713 | 12.6%), business (693 | 12.2%), science & technology (593 | 10.5%), and bio, nature & agricultural (465 | 8.2%) are the most common fields of study among 5,667 individuals in Clinton County who have obtained a bachelor's degree or higher.
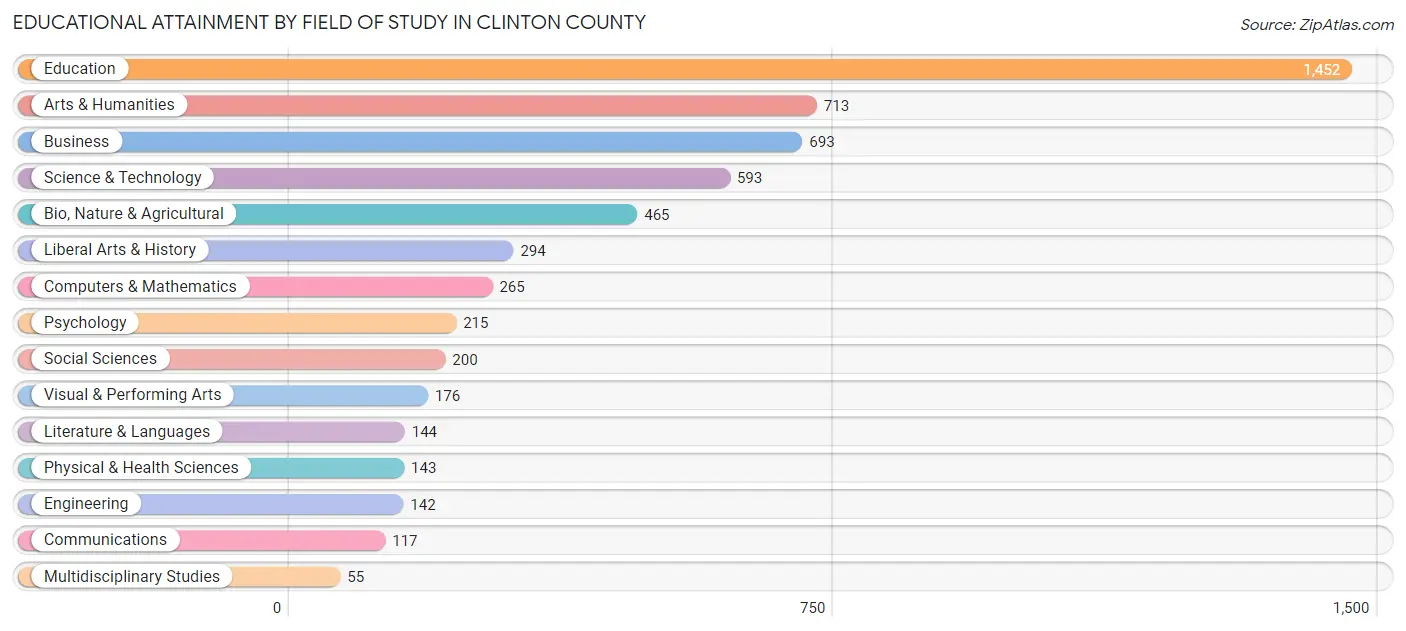
| Field of Study | # Graduates | % Graduates |
| Computers & Mathematics | 265 | 4.7% |
| Bio, Nature & Agricultural | 465 | 8.2% |
| Physical & Health Sciences | 143 | 2.5% |
| Psychology | 215 | 3.8% |
| Social Sciences | 200 | 3.5% |
| Engineering | 142 | 2.5% |
| Multidisciplinary Studies | 55 | 1.0% |
| Science & Technology | 593 | 10.5% |
| Business | 693 | 12.2% |
| Education | 1,452 | 25.6% |
| Literature & Languages | 144 | 2.5% |
| Liberal Arts & History | 294 | 5.2% |
| Visual & Performing Arts | 176 | 3.1% |
| Communications | 117 | 2.1% |
| Arts & Humanities | 713 | 12.6% |
| Total | 5,667 | 100.0% |
Transportation & Commute in Clinton County
Vehicle Availability by Sex in Clinton County
The most prevalent vehicle ownership categories in Clinton County are males with 2 vehicles (3,381, accounting for 37.4%) and females with 2 vehicles (2,905, making up 43.6%).
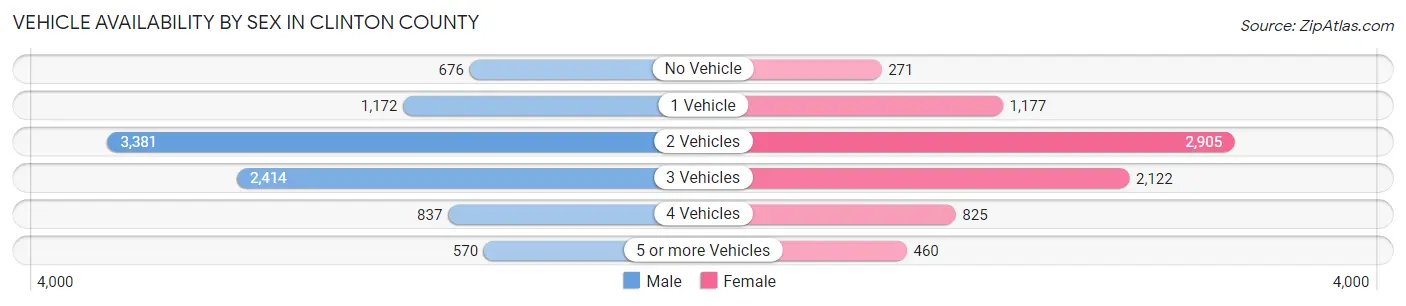
| Vehicles Available | Male | Female |
| No Vehicle | 676 (7.5%) | 271 (3.5%) |
| 1 Vehicle | 1,172 (13.0%) | 1,177 (15.2%) |
| 2 Vehicles | 3,381 (37.4%) | 2,905 (37.4%) |
| 3 Vehicles | 2,414 (26.7%) | 2,122 (27.4%) |
| 4 Vehicles | 837 (9.2%) | 825 (10.6%) |
| 5 or more Vehicles | 570 (6.3%) | 460 (5.9%) |
| Total | 9,050 (100.0%) | 7,760 (100.0%) |
Commute Time in Clinton County
The most frequently occuring commute durations in Clinton County are 5 to 9 minutes (2,741 commuters, 17.1%), 10 to 14 minutes (2,716 commuters, 17.0%), and 15 to 19 minutes (2,056 commuters, 12.8%).
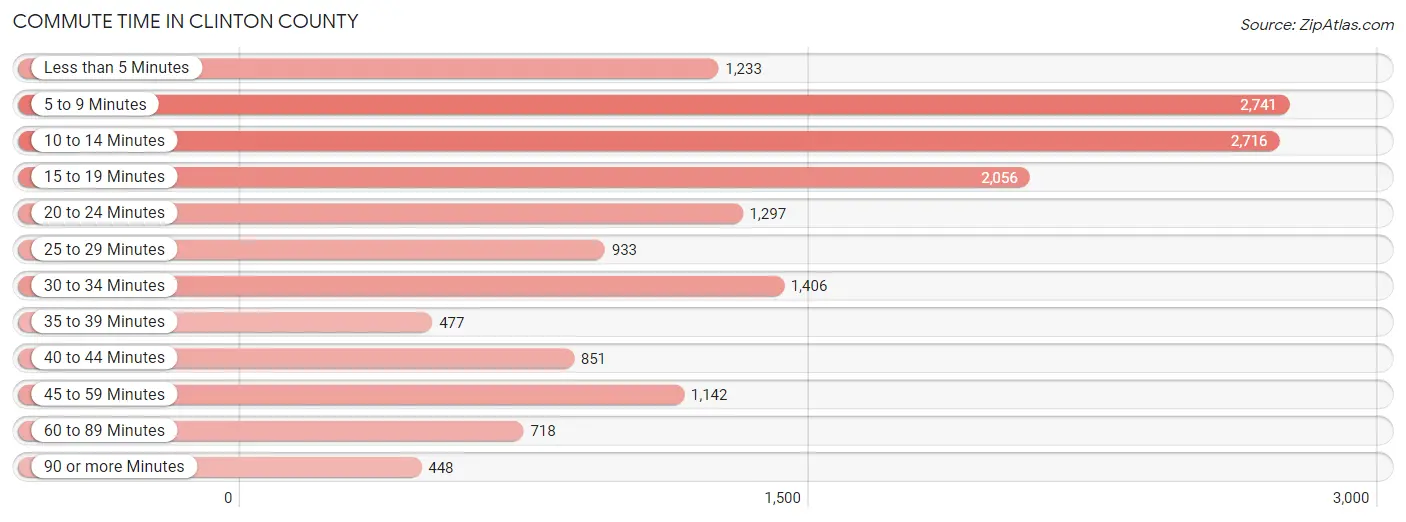
| Commute Time | # Commuters | % Commuters |
| Less than 5 Minutes | 1,233 | 7.7% |
| 5 to 9 Minutes | 2,741 | 17.1% |
| 10 to 14 Minutes | 2,716 | 17.0% |
| 15 to 19 Minutes | 2,056 | 12.8% |
| 20 to 24 Minutes | 1,297 | 8.1% |
| 25 to 29 Minutes | 933 | 5.8% |
| 30 to 34 Minutes | 1,406 | 8.8% |
| 35 to 39 Minutes | 477 | 3.0% |
| 40 to 44 Minutes | 851 | 5.3% |
| 45 to 59 Minutes | 1,142 | 7.1% |
| 60 to 89 Minutes | 718 | 4.5% |
| 90 or more Minutes | 448 | 2.8% |
Commute Time by Sex in Clinton County
The most common commute times in Clinton County are 5 to 9 minutes (1,570 commuters, 18.2%) for males and 10 to 14 minutes (1,546 commuters, 20.9%) for females.
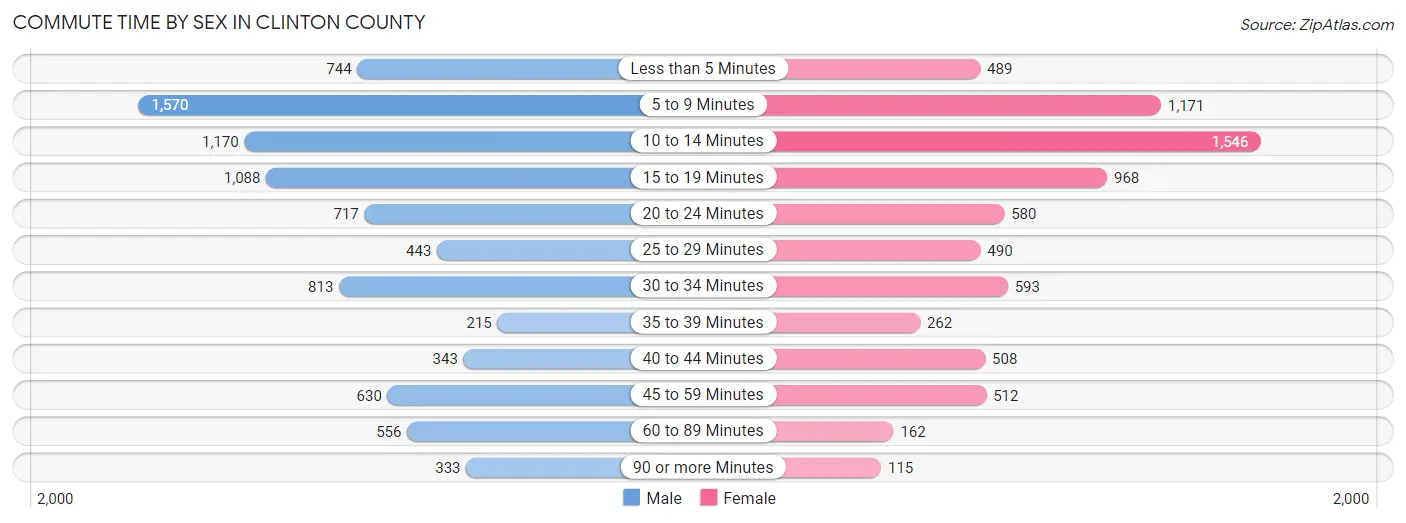
| Commute Time | Male | Female |
| Less than 5 Minutes | 744 (8.6%) | 489 (6.6%) |
| 5 to 9 Minutes | 1,570 (18.2%) | 1,171 (15.8%) |
| 10 to 14 Minutes | 1,170 (13.6%) | 1,546 (20.9%) |
| 15 to 19 Minutes | 1,088 (12.6%) | 968 (13.1%) |
| 20 to 24 Minutes | 717 (8.3%) | 580 (7.8%) |
| 25 to 29 Minutes | 443 (5.1%) | 490 (6.6%) |
| 30 to 34 Minutes | 813 (9.4%) | 593 (8.0%) |
| 35 to 39 Minutes | 215 (2.5%) | 262 (3.5%) |
| 40 to 44 Minutes | 343 (4.0%) | 508 (6.9%) |
| 45 to 59 Minutes | 630 (7.3%) | 512 (6.9%) |
| 60 to 89 Minutes | 556 (6.5%) | 162 (2.2%) |
| 90 or more Minutes | 333 (3.9%) | 115 (1.5%) |
Time of Departure to Work by Sex in Clinton County
The most frequent times of departure to work in Clinton County are 6:30 AM to 6:59 AM (1,240, 14.4%) for males and 7:30 AM to 7:59 AM (1,206, 16.3%) for females.
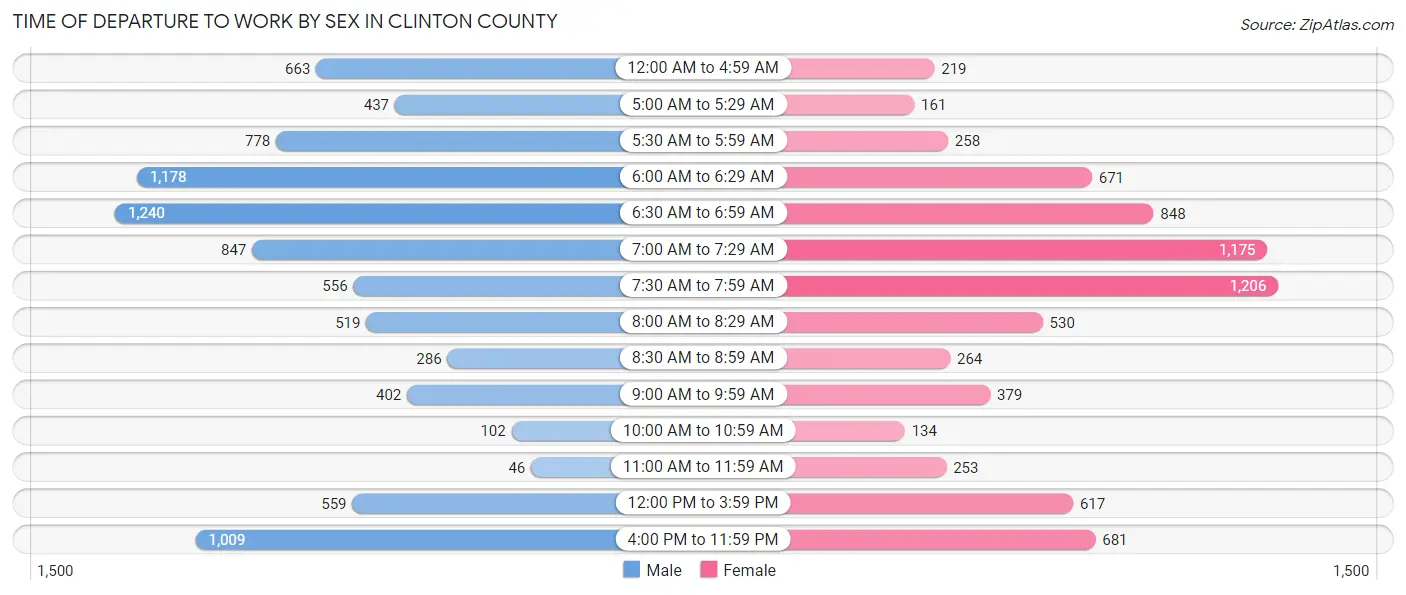
| Time of Departure | Male | Female |
| 12:00 AM to 4:59 AM | 663 (7.7%) | 219 (3.0%) |
| 5:00 AM to 5:29 AM | 437 (5.1%) | 161 (2.2%) |
| 5:30 AM to 5:59 AM | 778 (9.0%) | 258 (3.5%) |
| 6:00 AM to 6:29 AM | 1,178 (13.7%) | 671 (9.1%) |
| 6:30 AM to 6:59 AM | 1,240 (14.4%) | 848 (11.5%) |
| 7:00 AM to 7:29 AM | 847 (9.8%) | 1,175 (15.9%) |
| 7:30 AM to 7:59 AM | 556 (6.5%) | 1,206 (16.3%) |
| 8:00 AM to 8:29 AM | 519 (6.0%) | 530 (7.2%) |
| 8:30 AM to 8:59 AM | 286 (3.3%) | 264 (3.6%) |
| 9:00 AM to 9:59 AM | 402 (4.7%) | 379 (5.1%) |
| 10:00 AM to 10:59 AM | 102 (1.2%) | 134 (1.8%) |
| 11:00 AM to 11:59 AM | 46 (0.5%) | 253 (3.4%) |
| 12:00 PM to 3:59 PM | 559 (6.5%) | 617 (8.3%) |
| 4:00 PM to 11:59 PM | 1,009 (11.7%) | 681 (9.2%) |
| Total | 8,622 (100.0%) | 7,396 (100.0%) |
Housing Occupancy in Clinton County
Occupancy by Ownership in Clinton County
Of the total 14,877 dwellings in Clinton County, owner-occupied units account for 10,622 (71.4%), while renter-occupied units make up 4,255 (28.6%).
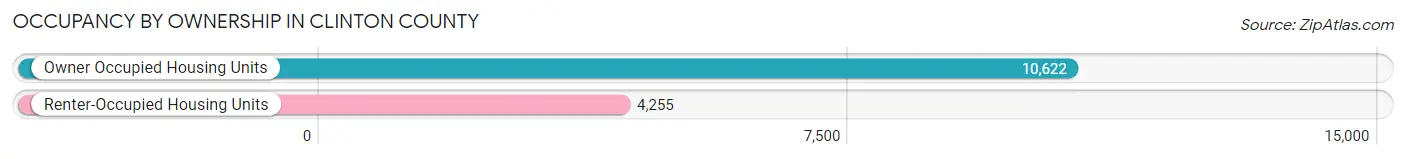
| Occupancy | # Housing Units | % Housing Units |
| Owner Occupied Housing Units | 10,622 | 71.4% |
| Renter-Occupied Housing Units | 4,255 | 28.6% |
| Total Occupied Housing Units | 14,877 | 100.0% |
Occupancy by Household Size in Clinton County
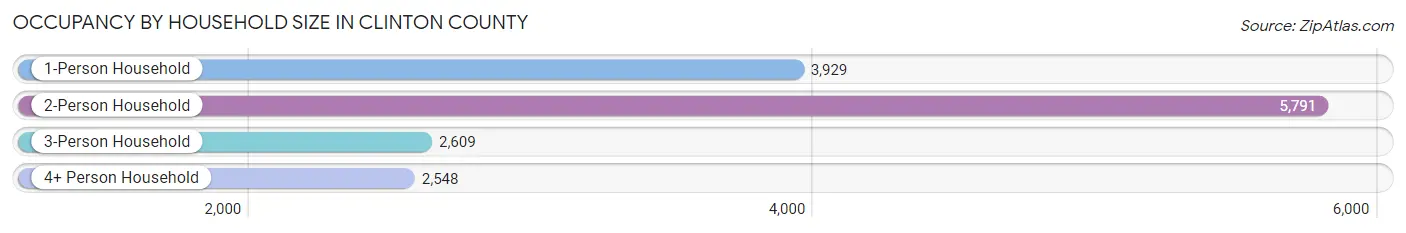
| Household Size | # Housing Units | % Housing Units |
| 1-Person Household | 3,929 | 26.4% |
| 2-Person Household | 5,791 | 38.9% |
| 3-Person Household | 2,609 | 17.5% |
| 4+ Person Household | 2,548 | 17.1% |
| Total Housing Units | 14,877 | 100.0% |
Occupancy by Ownership by Household Size in Clinton County
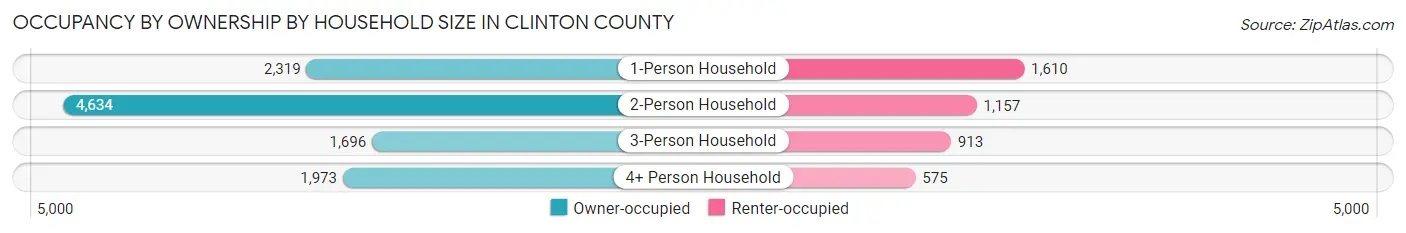
| Household Size | Owner-occupied | Renter-occupied |
| 1-Person Household | 2,319 (59.0%) | 1,610 (41.0%) |
| 2-Person Household | 4,634 (80.0%) | 1,157 (20.0%) |
| 3-Person Household | 1,696 (65.0%) | 913 (35.0%) |
| 4+ Person Household | 1,973 (77.4%) | 575 (22.6%) |
| Total Housing Units | 10,622 (71.4%) | 4,255 (28.6%) |
Occupancy by Educational Attainment in Clinton County
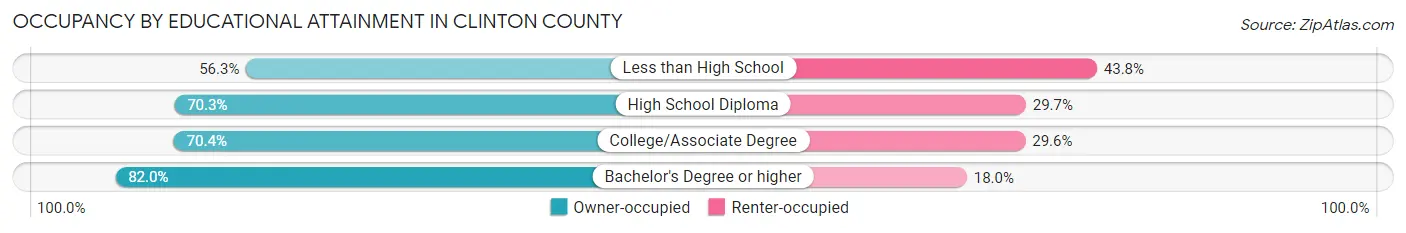
| Household Size | Owner-occupied | Renter-occupied |
| Less than High School | 824 (56.2%) | 641 (43.8%) |
| High School Diploma | 4,721 (70.3%) | 1,992 (29.7%) |
| College/Associate Degree | 2,543 (70.4%) | 1,067 (29.6%) |
| Bachelor's Degree or higher | 2,534 (82.0%) | 555 (18.0%) |
Occupancy by Age of Householder in Clinton County
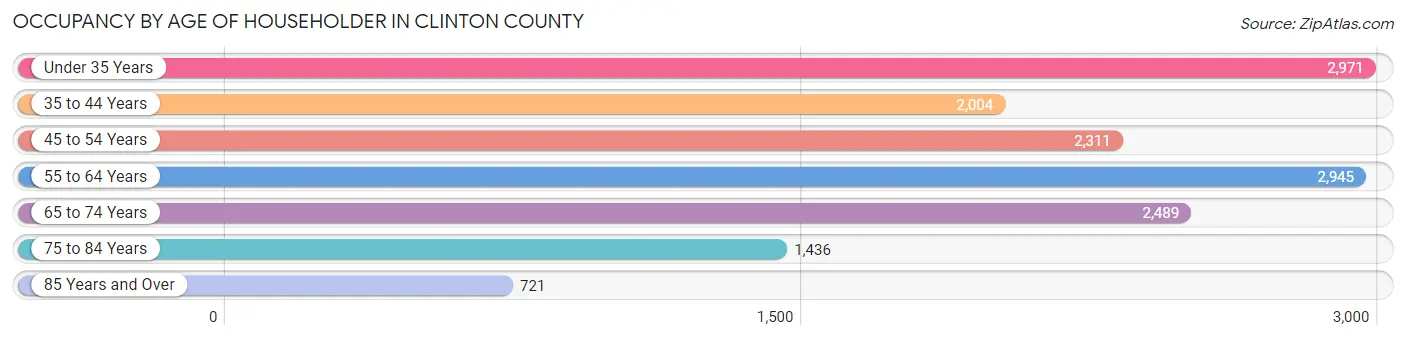
| Age Bracket | # Households | % Households |
| Under 35 Years | 2,971 | 20.0% |
| 35 to 44 Years | 2,004 | 13.5% |
| 45 to 54 Years | 2,311 | 15.5% |
| 55 to 64 Years | 2,945 | 19.8% |
| 65 to 74 Years | 2,489 | 16.7% |
| 75 to 84 Years | 1,436 | 9.7% |
| 85 Years and Over | 721 | 4.9% |
| Total | 14,877 | 100.0% |
Housing Finances in Clinton County
Median Income by Occupancy in Clinton County
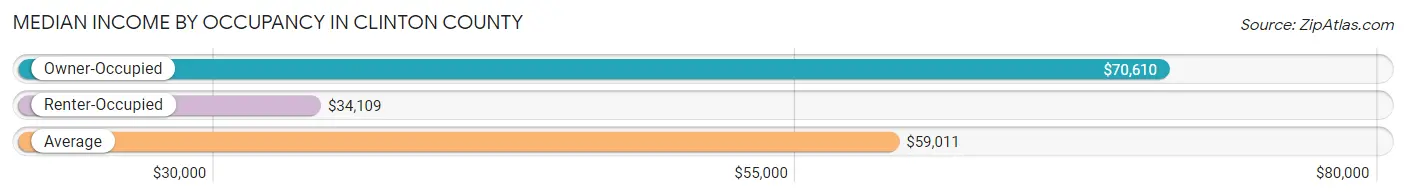
| Occupancy Type | # Households | Median Income |
| Owner-Occupied | 10,622 (71.4%) | $70,610 |
| Renter-Occupied | 4,255 (28.6%) | $34,109 |
| Average | 14,877 (100.0%) | $59,011 |
Occupancy by Householder Income Bracket in Clinton County
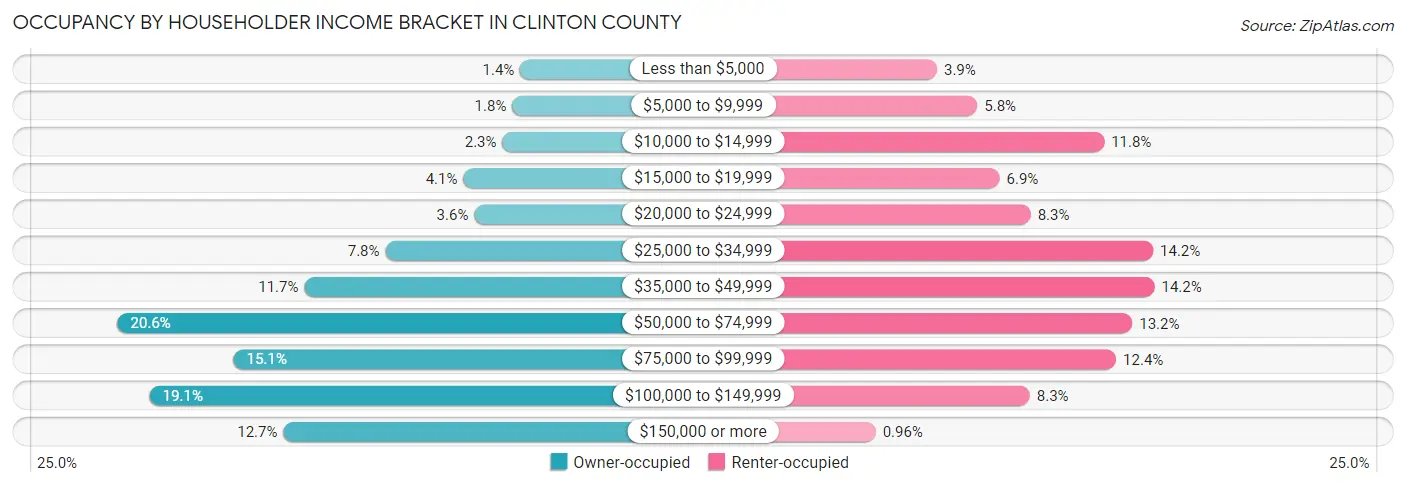
| Income Bracket | Owner-occupied | Renter-occupied |
| Less than $5,000 | 149 (1.4%) | 165 (3.9%) |
| $5,000 to $9,999 | 189 (1.8%) | 247 (5.8%) |
| $10,000 to $14,999 | 239 (2.2%) | 504 (11.8%) |
| $15,000 to $19,999 | 437 (4.1%) | 292 (6.9%) |
| $20,000 to $24,999 | 381 (3.6%) | 355 (8.3%) |
| $25,000 to $34,999 | 831 (7.8%) | 603 (14.2%) |
| $35,000 to $49,999 | 1,241 (11.7%) | 606 (14.2%) |
| $50,000 to $74,999 | 2,186 (20.6%) | 561 (13.2%) |
| $75,000 to $99,999 | 1,599 (15.0%) | 528 (12.4%) |
| $100,000 to $149,999 | 2,023 (19.1%) | 353 (8.3%) |
| $150,000 or more | 1,347 (12.7%) | 41 (1.0%) |
| Total | 10,622 (100.0%) | 4,255 (100.0%) |
Monthly Housing Cost Tiers in Clinton County
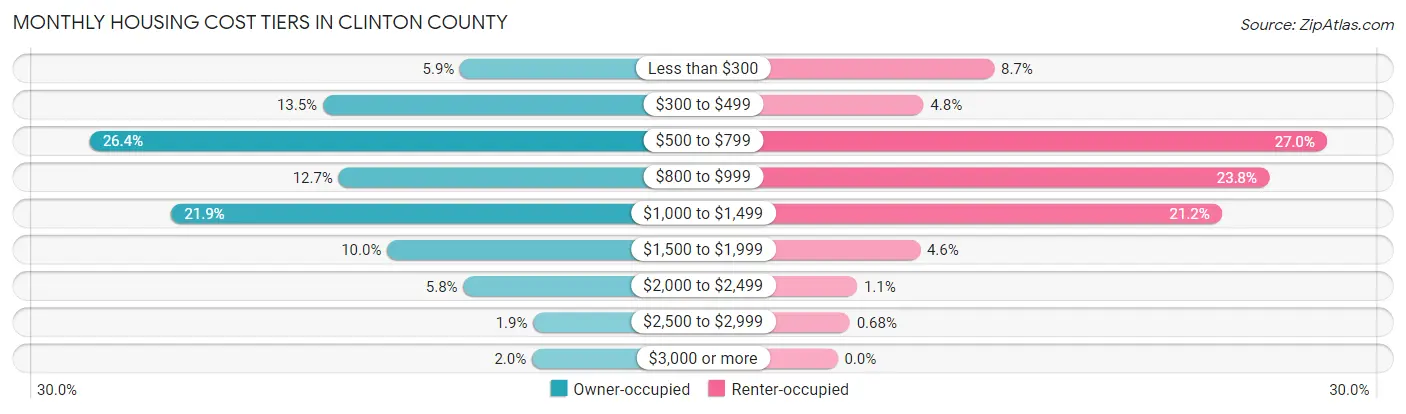
| Monthly Cost | Owner-occupied | Renter-occupied |
| Less than $300 | 631 (5.9%) | 368 (8.6%) |
| $300 to $499 | 1,436 (13.5%) | 202 (4.8%) |
| $500 to $799 | 2,804 (26.4%) | 1,150 (27.0%) |
| $800 to $999 | 1,344 (12.7%) | 1,014 (23.8%) |
| $1,000 to $1,499 | 2,325 (21.9%) | 903 (21.2%) |
| $1,500 to $1,999 | 1,059 (10.0%) | 194 (4.6%) |
| $2,000 to $2,499 | 612 (5.8%) | 46 (1.1%) |
| $2,500 to $2,999 | 202 (1.9%) | 29 (0.7%) |
| $3,000 or more | 209 (2.0%) | 0 (0.0%) |
| Total | 10,622 (100.0%) | 4,255 (100.0%) |
Physical Housing Characteristics in Clinton County
Housing Structures in Clinton County
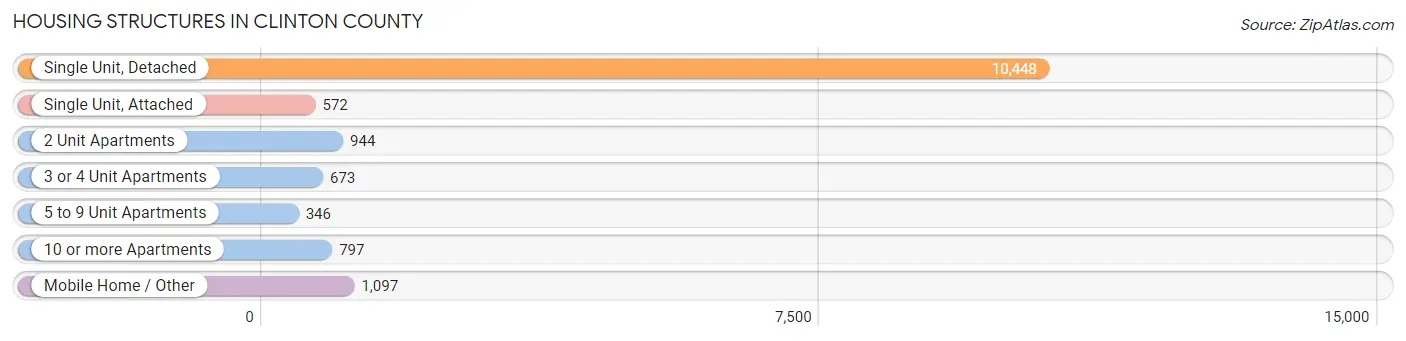
| Structure Type | # Housing Units | % Housing Units |
| Single Unit, Detached | 10,448 | 70.2% |
| Single Unit, Attached | 572 | 3.8% |
| 2 Unit Apartments | 944 | 6.4% |
| 3 or 4 Unit Apartments | 673 | 4.5% |
| 5 to 9 Unit Apartments | 346 | 2.3% |
| 10 or more Apartments | 797 | 5.4% |
| Mobile Home / Other | 1,097 | 7.4% |
| Total | 14,877 | 100.0% |
Housing Structures by Occupancy in Clinton County
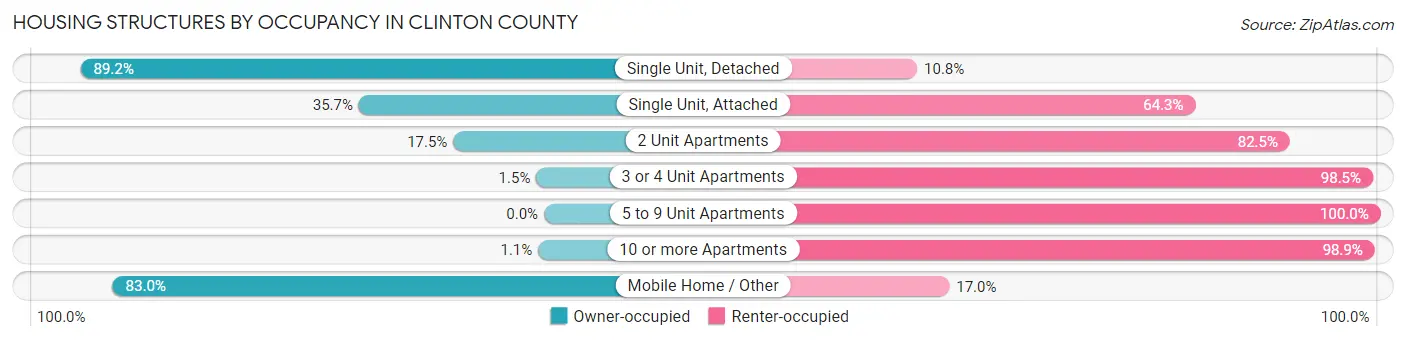
| Structure Type | Owner-occupied | Renter-occupied |
| Single Unit, Detached | 9,323 (89.2%) | 1,125 (10.8%) |
| Single Unit, Attached | 204 (35.7%) | 368 (64.3%) |
| 2 Unit Apartments | 165 (17.5%) | 779 (82.5%) |
| 3 or 4 Unit Apartments | 10 (1.5%) | 663 (98.5%) |
| 5 to 9 Unit Apartments | 0 (0.0%) | 346 (100.0%) |
| 10 or more Apartments | 9 (1.1%) | 788 (98.9%) |
| Mobile Home / Other | 911 (83.0%) | 186 (17.0%) |
| Total | 10,622 (71.4%) | 4,255 (28.6%) |
Housing Structures by Number of Rooms in Clinton County
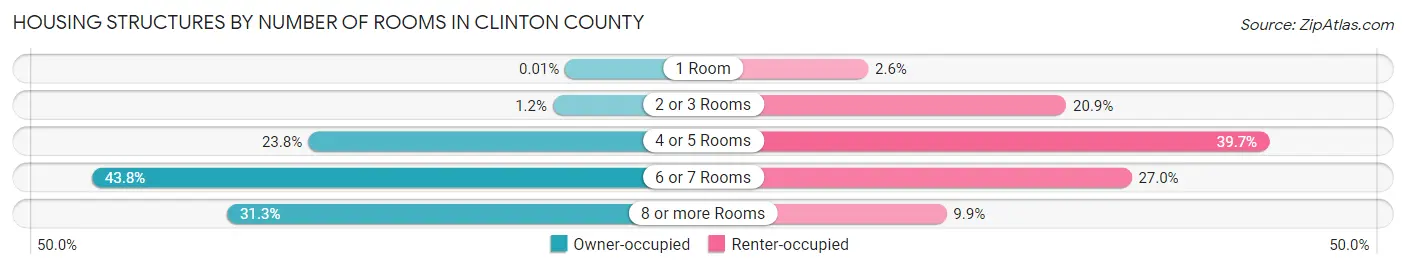
| Number of Rooms | Owner-occupied | Renter-occupied |
| 1 Room | 1 (0.0%) | 111 (2.6%) |
| 2 or 3 Rooms | 122 (1.1%) | 890 (20.9%) |
| 4 or 5 Rooms | 2,527 (23.8%) | 1,688 (39.7%) |
| 6 or 7 Rooms | 4,649 (43.8%) | 1,147 (27.0%) |
| 8 or more Rooms | 3,323 (31.3%) | 419 (9.9%) |
| Total | 10,622 (100.0%) | 4,255 (100.0%) |
Housing Structure by Heating Type in Clinton County
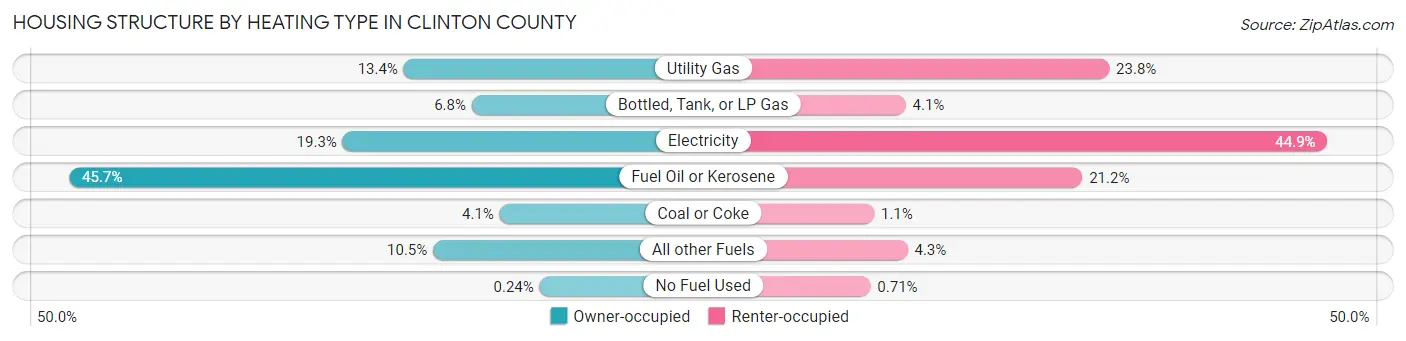
| Heating Type | Owner-occupied | Renter-occupied |
| Utility Gas | 1,420 (13.4%) | 1,012 (23.8%) |
| Bottled, Tank, or LP Gas | 721 (6.8%) | 175 (4.1%) |
| Electricity | 2,047 (19.3%) | 1,909 (44.9%) |
| Fuel Oil or Kerosene | 4,855 (45.7%) | 901 (21.2%) |
| Coal or Coke | 435 (4.1%) | 45 (1.1%) |
| All other Fuels | 1,118 (10.5%) | 183 (4.3%) |
| No Fuel Used | 26 (0.2%) | 30 (0.7%) |
| Total | 10,622 (100.0%) | 4,255 (100.0%) |
Household Vehicle Usage in Clinton County
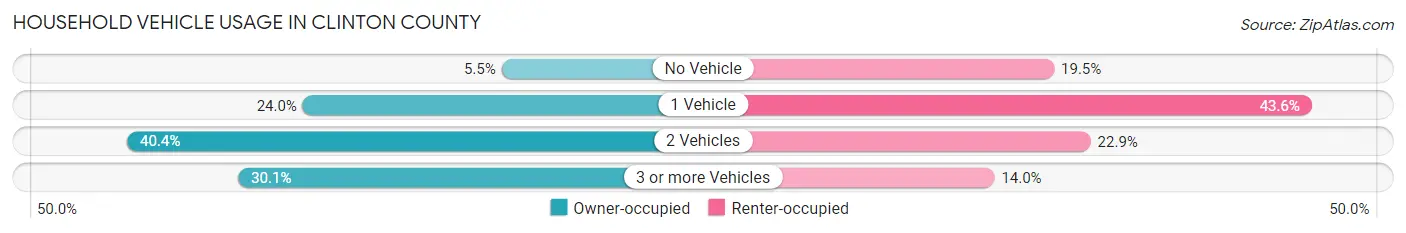
| Vehicles per Household | Owner-occupied | Renter-occupied |
| No Vehicle | 582 (5.5%) | 831 (19.5%) |
| 1 Vehicle | 2,553 (24.0%) | 1,854 (43.6%) |
| 2 Vehicles | 4,294 (40.4%) | 976 (22.9%) |
| 3 or more Vehicles | 3,193 (30.1%) | 594 (14.0%) |
| Total | 10,622 (100.0%) | 4,255 (100.0%) |
Real Estate & Mortgages in Clinton County
Real Estate and Mortgage Overview in Clinton County
| Characteristic | Without Mortgage | With Mortgage |
| Housing Units | 4,704 | 5,918 |
| Median Property Value | $143,400 | $177,700 |
| Median Household Income | $51,218 | $992 |
| Monthly Housing Costs | $536 | $206 |
| Real Estate Taxes | $1,867 | $37 |
Property Value by Mortgage Status in Clinton County
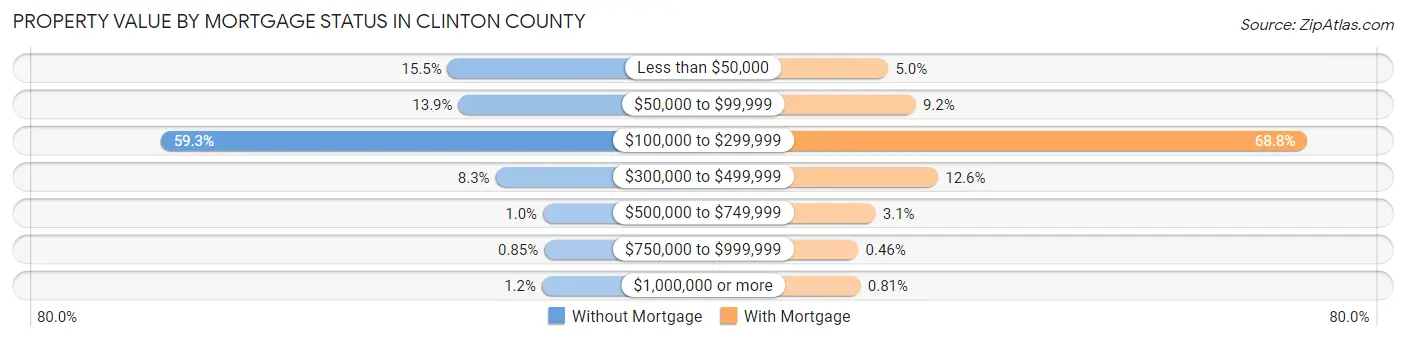
| Property Value | Without Mortgage | With Mortgage |
| Less than $50,000 | 731 (15.5%) | 297 (5.0%) |
| $50,000 to $99,999 | 654 (13.9%) | 545 (9.2%) |
| $100,000 to $299,999 | 2,787 (59.3%) | 4,072 (68.8%) |
| $300,000 to $499,999 | 388 (8.3%) | 746 (12.6%) |
| $500,000 to $749,999 | 48 (1.0%) | 183 (3.1%) |
| $750,000 to $999,999 | 40 (0.9%) | 27 (0.5%) |
| $1,000,000 or more | 56 (1.2%) | 48 (0.8%) |
| Total | 4,704 (100.0%) | 5,918 (100.0%) |
Household Income by Mortgage Status in Clinton County
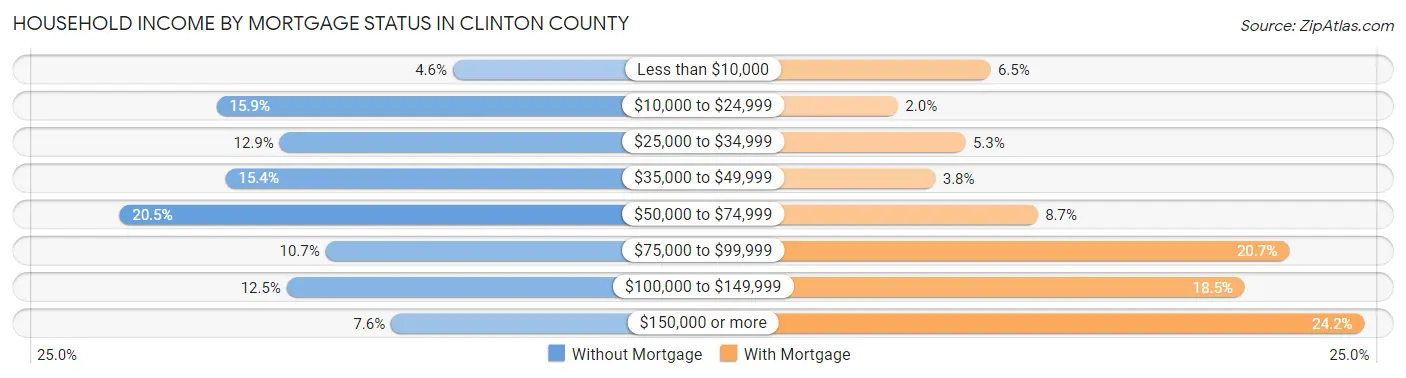
| Household Income | Without Mortgage | With Mortgage |
| Less than $10,000 | 217 (4.6%) | 382 (6.5%) |
| $10,000 to $24,999 | 746 (15.9%) | 121 (2.0%) |
| $25,000 to $34,999 | 605 (12.9%) | 311 (5.3%) |
| $35,000 to $49,999 | 726 (15.4%) | 226 (3.8%) |
| $50,000 to $74,999 | 964 (20.5%) | 515 (8.7%) |
| $75,000 to $99,999 | 502 (10.7%) | 1,222 (20.6%) |
| $100,000 to $149,999 | 589 (12.5%) | 1,097 (18.5%) |
| $150,000 or more | 355 (7.5%) | 1,434 (24.2%) |
| Total | 4,704 (100.0%) | 5,918 (100.0%) |
Property Value to Household Income Ratio in Clinton County
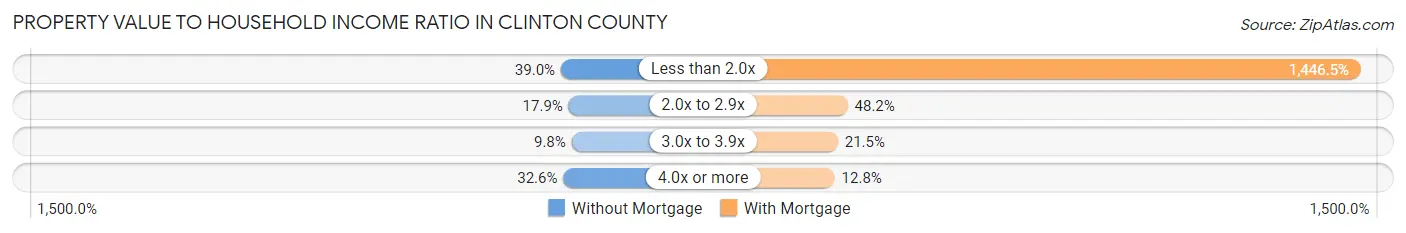
| Value-to-Income Ratio | Without Mortgage | With Mortgage |
| Less than 2.0x | 1,835 (39.0%) | 85,602 (1,446.5%) |
| 2.0x to 2.9x | 842 (17.9%) | 2,851 (48.2%) |
| 3.0x to 3.9x | 463 (9.8%) | 1,274 (21.5%) |
| 4.0x or more | 1,532 (32.6%) | 760 (12.8%) |
| Total | 4,704 (100.0%) | 5,918 (100.0%) |
Real Estate Taxes by Mortgage Status in Clinton County
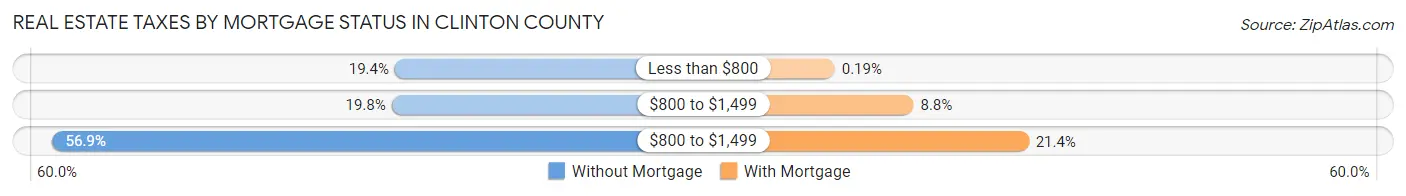
| Property Taxes | Without Mortgage | With Mortgage |
| Less than $800 | 914 (19.4%) | 11 (0.2%) |
| $800 to $1,499 | 931 (19.8%) | 522 (8.8%) |
| $800 to $1,499 | 2,678 (56.9%) | 1,269 (21.4%) |
| Total | 4,704 (100.0%) | 5,918 (100.0%) |
Health & Disability in Clinton County
Health Insurance Coverage by Age in Clinton County
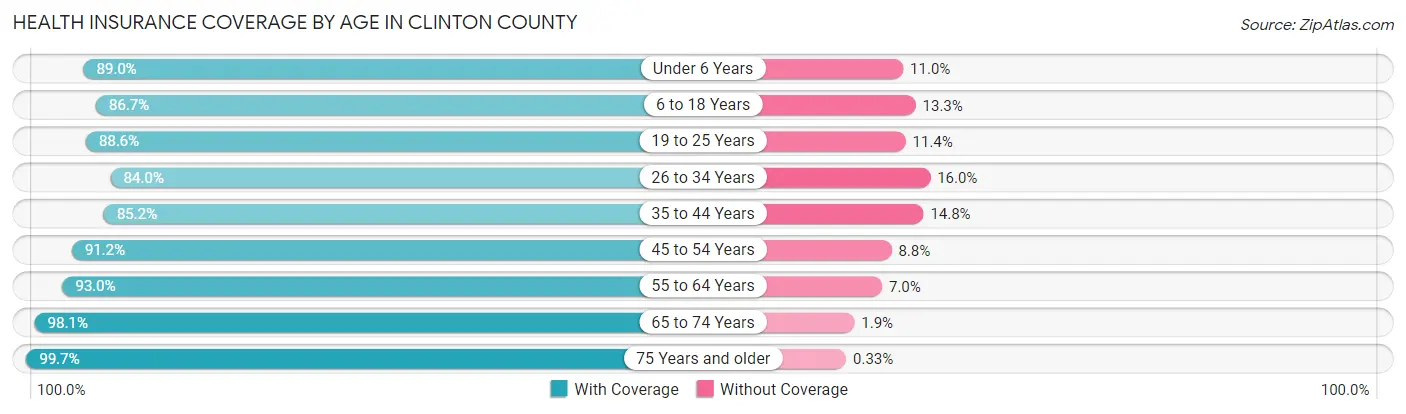
| Age Bracket | With Coverage | Without Coverage |
| Under 6 Years | 2,221 (89.0%) | 274 (11.0%) |
| 6 to 18 Years | 5,156 (86.7%) | 791 (13.3%) |
| 19 to 25 Years | 4,217 (88.6%) | 544 (11.4%) |
| 26 to 34 Years | 3,203 (84.0%) | 611 (16.0%) |
| 35 to 44 Years | 3,360 (85.2%) | 582 (14.8%) |
| 45 to 54 Years | 3,897 (91.2%) | 376 (8.8%) |
| 55 to 64 Years | 4,685 (93.0%) | 355 (7.0%) |
| 65 to 74 Years | 4,037 (98.1%) | 77 (1.9%) |
| 75 Years and older | 2,985 (99.7%) | 10 (0.3%) |
| Total | 33,761 (90.3%) | 3,620 (9.7%) |
Health Insurance Coverage by Citizenship Status in Clinton County
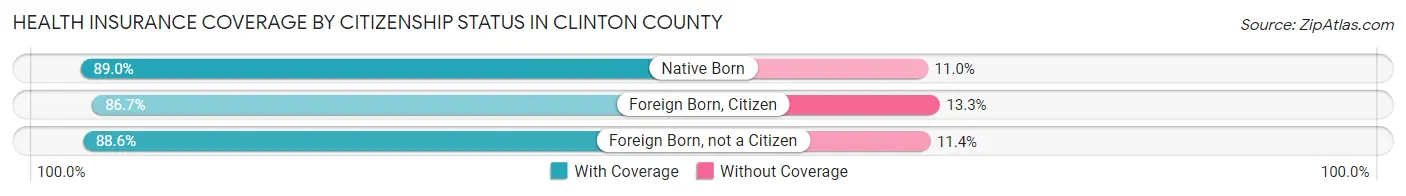
| Citizenship Status | With Coverage | Without Coverage |
| Native Born | 2,221 (89.0%) | 274 (11.0%) |
| Foreign Born, Citizen | 5,156 (86.7%) | 791 (13.3%) |
| Foreign Born, not a Citizen | 4,217 (88.6%) | 544 (11.4%) |
Health Insurance Coverage by Household Income in Clinton County
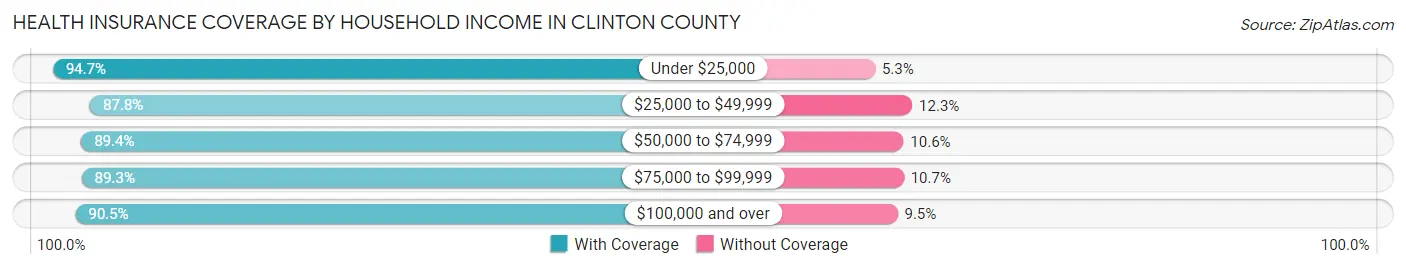
| Household Income | With Coverage | Without Coverage |
| Under $25,000 | 4,317 (94.7%) | 240 (5.3%) |
| $25,000 to $49,999 | 5,962 (87.7%) | 832 (12.2%) |
| $50,000 to $74,999 | 5,840 (89.4%) | 693 (10.6%) |
| $75,000 to $99,999 | 5,426 (89.3%) | 648 (10.7%) |
| $100,000 and over | 11,216 (90.5%) | 1,179 (9.5%) |
Public vs Private Health Insurance Coverage by Age in Clinton County
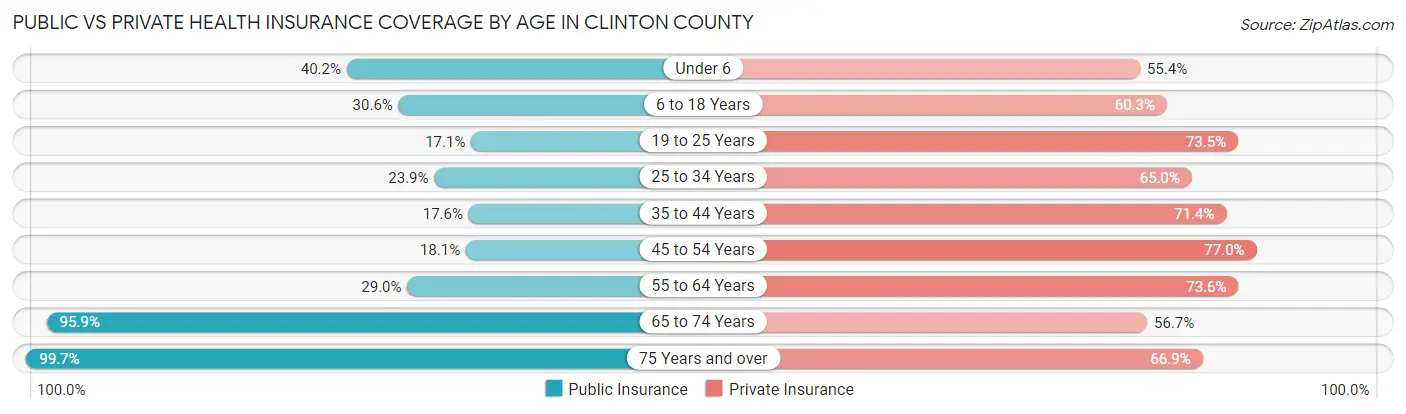
| Age Bracket | Public Insurance | Private Insurance |
| Under 6 | 1,003 (40.2%) | 1,381 (55.3%) |
| 6 to 18 Years | 1,818 (30.6%) | 3,587 (60.3%) |
| 19 to 25 Years | 814 (17.1%) | 3,501 (73.5%) |
| 25 to 34 Years | 913 (23.9%) | 2,478 (65.0%) |
| 35 to 44 Years | 692 (17.5%) | 2,813 (71.4%) |
| 45 to 54 Years | 772 (18.1%) | 3,288 (76.9%) |
| 55 to 64 Years | 1,459 (28.9%) | 3,709 (73.6%) |
| 65 to 74 Years | 3,946 (95.9%) | 2,331 (56.7%) |
| 75 Years and over | 2,985 (99.7%) | 2,005 (66.9%) |
| Total | 14,402 (38.5%) | 25,093 (67.1%) |
Disability Status by Sex by Age in Clinton County
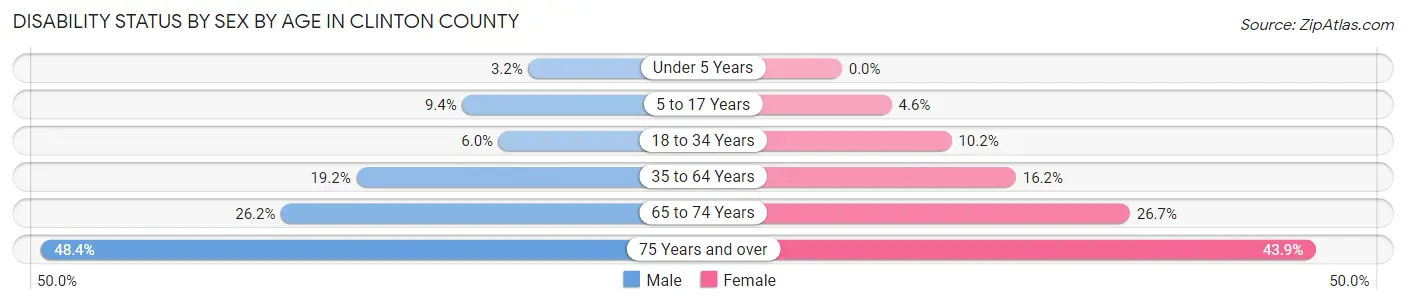
| Age Bracket | Male | Female |
| Under 5 Years | 33 (3.2%) | 0 (0.0%) |
| 5 to 17 Years | 270 (9.3%) | 125 (4.6%) |
| 18 to 34 Years | 284 (6.0%) | 471 (10.2%) |
| 35 to 64 Years | 1,290 (19.2%) | 1,056 (16.2%) |
| 65 to 74 Years | 514 (26.2%) | 575 (26.7%) |
| 75 Years and over | 638 (48.4%) | 737 (43.9%) |
Disability Class by Sex by Age in Clinton County
Disability Class: Hearing Difficulty
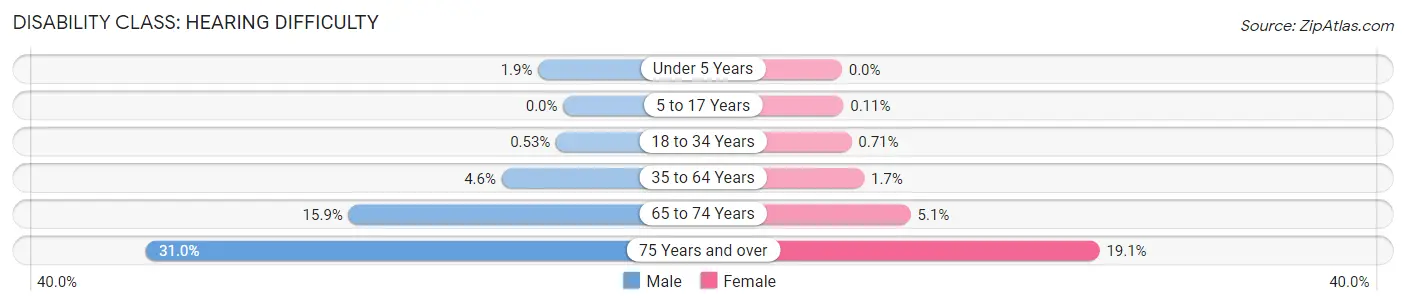
| Age Bracket | Male | Female |
| Under 5 Years | 19 (1.9%) | 0 (0.0%) |
| 5 to 17 Years | 0 (0.0%) | 3 (0.1%) |
| 18 to 34 Years | 25 (0.5%) | 33 (0.7%) |
| 35 to 64 Years | 307 (4.6%) | 108 (1.7%) |
| 65 to 74 Years | 313 (15.9%) | 110 (5.1%) |
| 75 Years and over | 408 (31.0%) | 321 (19.1%) |
Disability Class: Vision Difficulty
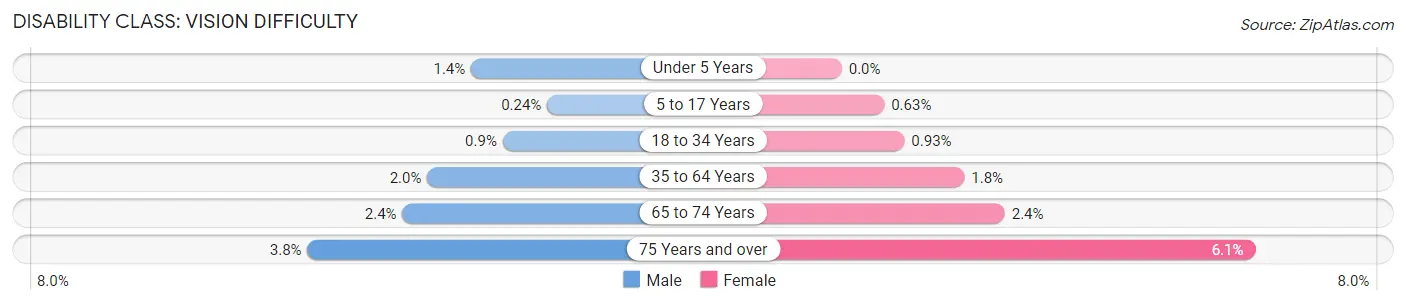
| Age Bracket | Male | Female |
| Under 5 Years | 14 (1.4%) | 0 (0.0%) |
| 5 to 17 Years | 7 (0.2%) | 17 (0.6%) |
| 18 to 34 Years | 43 (0.9%) | 43 (0.9%) |
| 35 to 64 Years | 136 (2.0%) | 119 (1.8%) |
| 65 to 74 Years | 47 (2.4%) | 52 (2.4%) |
| 75 Years and over | 50 (3.8%) | 103 (6.1%) |
Disability Class: Cognitive Difficulty
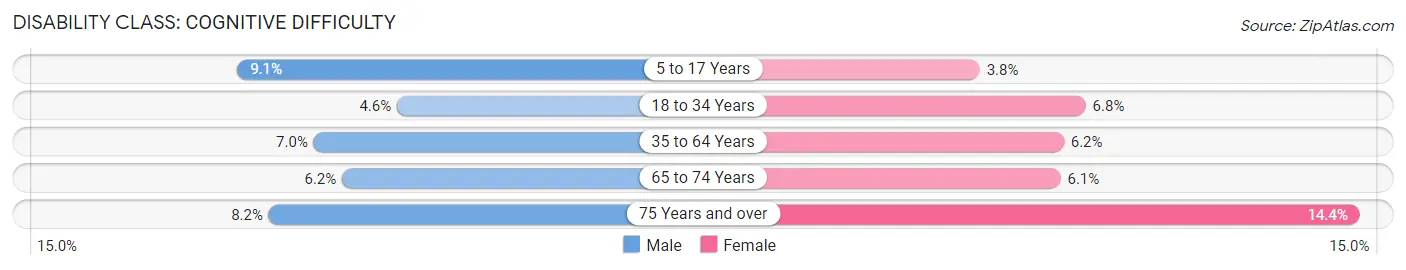
| Age Bracket | Male | Female |
| 5 to 17 Years | 262 (9.1%) | 104 (3.8%) |
| 18 to 34 Years | 220 (4.6%) | 314 (6.8%) |
| 35 to 64 Years | 467 (7.0%) | 404 (6.2%) |
| 65 to 74 Years | 121 (6.2%) | 131 (6.1%) |
| 75 Years and over | 108 (8.2%) | 242 (14.4%) |
Disability Class: Ambulatory Difficulty
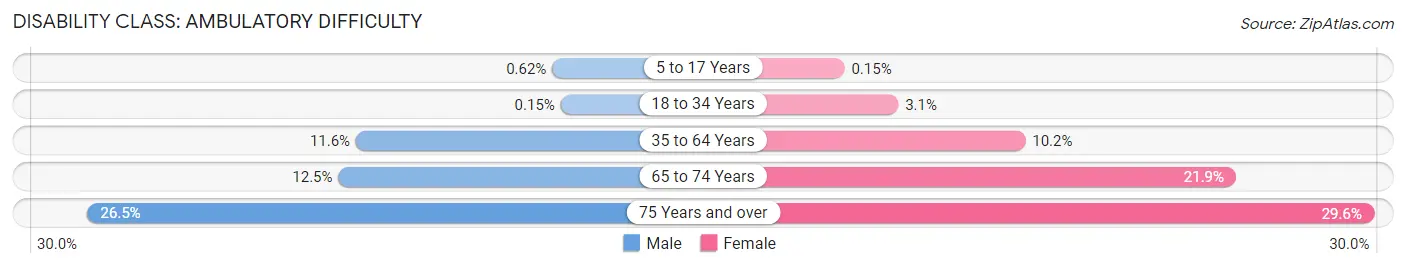
| Age Bracket | Male | Female |
| 5 to 17 Years | 18 (0.6%) | 4 (0.2%) |
| 18 to 34 Years | 7 (0.2%) | 145 (3.1%) |
| 35 to 64 Years | 776 (11.6%) | 668 (10.2%) |
| 65 to 74 Years | 246 (12.5%) | 472 (21.9%) |
| 75 Years and over | 349 (26.5%) | 497 (29.6%) |
Disability Class: Self-Care Difficulty
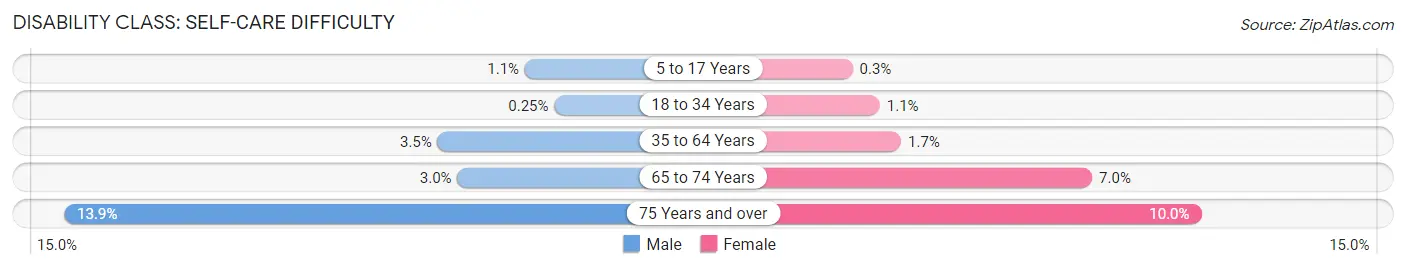
| Age Bracket | Male | Female |
| 5 to 17 Years | 31 (1.1%) | 8 (0.3%) |
| 18 to 34 Years | 12 (0.3%) | 49 (1.1%) |
| 35 to 64 Years | 235 (3.5%) | 108 (1.7%) |
| 65 to 74 Years | 58 (2.9%) | 150 (7.0%) |
| 75 Years and over | 183 (13.9%) | 168 (10.0%) |
Technology Access in Clinton County
Computing Device Access in Clinton County
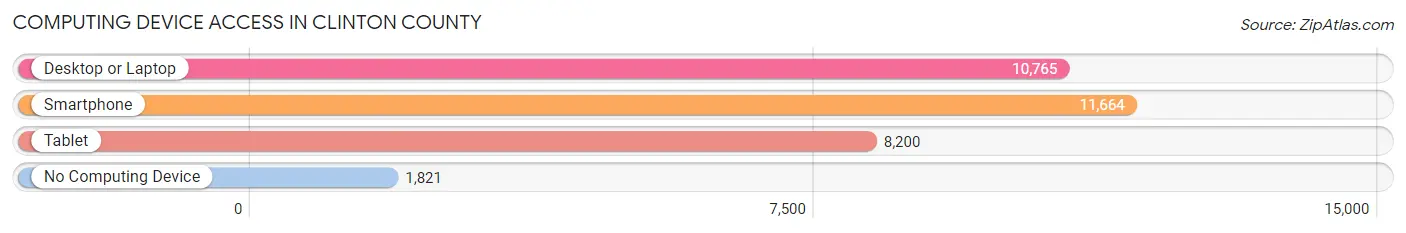
| Device Type | # Households | % Households |
| Desktop or Laptop | 10,765 | 72.4% |
| Smartphone | 11,664 | 78.4% |
| Tablet | 8,200 | 55.1% |
| No Computing Device | 1,821 | 12.2% |
| Total | 14,877 | 100.0% |
Internet Access in Clinton County
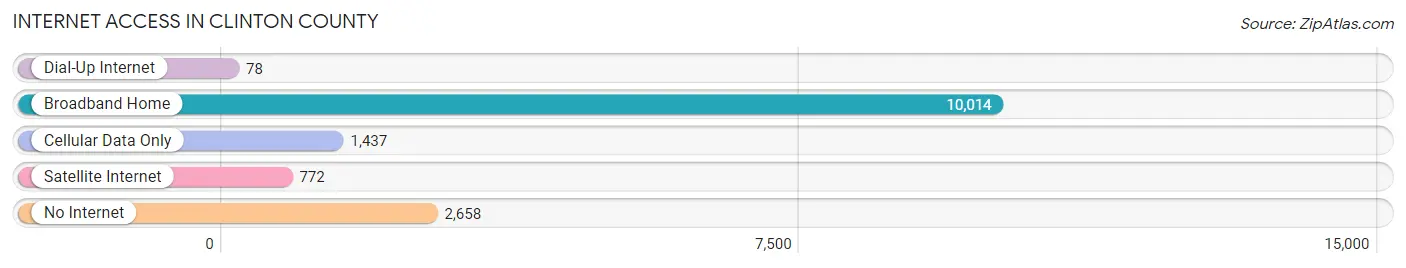
| Internet Type | # Households | % Households |
| Dial-Up Internet | 78 | 0.5% |
| Broadband Home | 10,014 | 67.3% |
| Cellular Data Only | 1,437 | 9.7% |
| Satellite Internet | 772 | 5.2% |
| No Internet | 2,658 | 17.9% |
| Total | 14,877 | 100.0% |
Clinton County Summary
County History
Clinton County is located in the north-central region of Pennsylvania and is part of the Susquehanna Valley. The county was created in 1839 from parts of Lycoming and Centre counties and was named after DeWitt Clinton, the seventh Governor of New York. The county seat is Lock Haven, which was established in 1833.
The first settlers in the area were Native Americans, including the Iroquois, Susquehannock, and Shawnee tribes. The first European settlers arrived in the late 1700s, and the county was officially established in 1839.
The county was largely agricultural in the 19th century, with the main crops being wheat, oats, and corn. The lumber industry was also important, with the county’s forests providing timber for the construction of homes and other buildings.
In the early 20th century, the county’s economy shifted to manufacturing, with the establishment of several factories in the area. The most notable of these was the Woolrich Woolen Mills, which was founded in 1830 and is still in operation today.
Geography
Clinton County is located in the north-central region of Pennsylvania and is part of the Susquehanna Valley. The county is bordered by Lycoming County to the north, Centre County to the east, Union County to the south, and Potter County to the west.
The county has a total area of 517 square miles, of which 514 square miles is land and 3 square miles is water. The county is mostly hilly, with the highest point being Bald Eagle Mountain at 2,039 feet. The county is drained by the West Branch Susquehanna River and its tributaries.
Economy
Clinton County’s economy is largely based on manufacturing and agriculture. The county’s largest employers are the Woolrich Woolen Mills, which employs over 1,000 people, and the Clinton County Correctional Facility, which employs over 500 people.
Agriculture is also important to the county’s economy, with the main crops being corn, wheat, and oats. Dairy farming is also common in the area, with the county’s dairy farms producing over 1 million gallons of milk each year.
The county is also home to several small businesses, including restaurants, retail stores, and professional services. Tourism is also an important part of the county’s economy, with the county’s many parks and outdoor recreation areas attracting visitors from all over the state.
Demographics
As of the 2010 census, the population of Clinton County was 39,238, with a population density of 76 people per square mile. The median age of the population is 43.7 years, and the median household income is $45,837.
The racial makeup of the county is 95.3% White, 1.7% African American, 0.4% Native American, 0.7% Asian, 0.1% Pacific Islander, 0.7% from other races, and 1.1% from two or more races. The largest ancestry groups in the county are German (25.3%), Irish (17.2%), English (14.2%), and Italian (7.2%).
The county is served by two school districts, the Keystone Central School District and the Central Mountain School District. The county is also home to Lock Haven University, a public university with an enrollment of over 4,000 students.
Conclusion
Clinton County is a rural county located in the north-central region of Pennsylvania. The county was established in 1839 and is named after DeWitt Clinton, the seventh Governor of New York. The county’s economy is largely based on manufacturing and agriculture, with the largest employers being the Woolrich Woolen Mills and the Clinton County Correctional Facility. The county’s population is 39,238, with a median age of 43.7 years and a median household income of $45,837. The county is served by two school districts and is home to Lock Haven University.
Common Questions
What is Per Capita Income in Clinton County?
Per Capita income in Clinton County is $30,723.
What is the Median Family Income in Clinton County?
Median Family Income in Clinton County is $72,403.
What is the Median Household income in Clinton County?
Median Household Income in Clinton County is $59,011.
What is Income or Wage Gap in Clinton County?
Income or Wage Gap in Clinton County is 32.6%.
Women in Clinton County earn 67.4 cents for every dollar earned by a man.
What is Family Income Deficit in Clinton County?
Family Income Deficit in Clinton County is $8,798.
Families that are below poverty line in Clinton County earn $8,798 less on average than the poverty threshold level.
What is Inequality or Gini Index in Clinton County?
Inequality or Gini Index in Clinton County is 0.43.
What is the Total Population of Clinton County?
Total Population of Clinton County is 37,860.
What is the Total Male Population of Clinton County?
Total Male Population of Clinton County is 18,916.
What is the Total Female Population of Clinton County?
Total Female Population of Clinton County is 18,944.
What is the Ratio of Males per 100 Females in Clinton County?
There are 99.85 Males per 100 Females in Clinton County.
What is the Ratio of Females per 100 Males in Clinton County?
There are 100.15 Females per 100 Males in Clinton County.
What is the Median Population Age in Clinton County?
Median Population Age in Clinton County is 39.8 Years.
What is the Average Family Size in Clinton County
Average Family Size in Clinton County is 3.0 People.
What is the Average Household Size in Clinton County
Average Household Size in Clinton County is 2.4 People.
How Large is the Labor Force in Clinton County?
There are 18,615 People in the Labor Forcein in Clinton County.
What is the Percentage of People in the Labor Force in Clinton County?
59.6% of People are in the Labor Force in Clinton County.
What is the Unemployment Rate in Clinton County?
Unemployment Rate in Clinton County is 5.3%.