Clearfield County, PA Map & Demographics
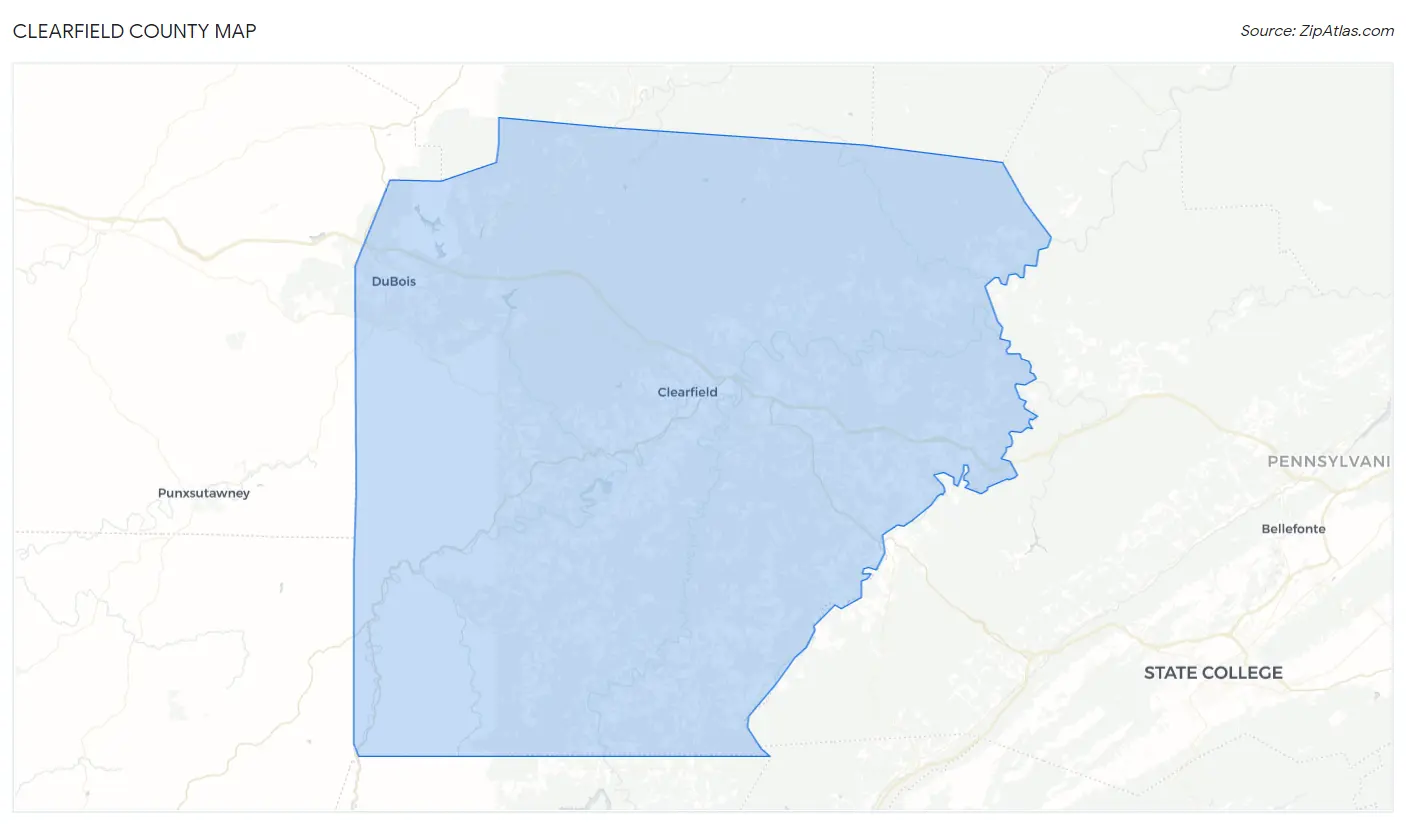
Clearfield County Map
Clearfield County Overview
$29,950
PER CAPITA INCOME
$70,156
AVG FAMILY INCOME
$56,982
AVG HOUSEHOLD INCOME
32.6%
WAGE / INCOME GAP [ % ]
67.4¢/ $1
WAGE / INCOME GAP [ $ ]
$9,016
FAMILY INCOME DEFICIT
0.43
INEQUALITY / GINI INDEX
79,707
TOTAL POPULATION
42,095
MALE POPULATION
37,612
FEMALE POPULATION
111.92
MALES / 100 FEMALES
89.35
FEMALES / 100 MALES
45.2
MEDIAN AGE
2.9
AVG FAMILY SIZE
2.4
AVG HOUSEHOLD SIZE
37,114
LABOR FORCE [ PEOPLE ]
55.4%
PERCENT IN LABOR FORCE
6.0%
UNEMPLOYMENT RATE
Income in Clearfield County
Income Overview in Clearfield County
Per Capita Income in Clearfield County is $29,950, while median incomes of families and households are $70,156 and $56,982 respectively.
| Characteristic | Number | Measure |
| Per Capita Income | 79,707 | $29,950 |
| Median Family Income | 20,562 | $70,156 |
| Mean Family Income | 20,562 | $84,834 |
| Median Household Income | 31,741 | $56,982 |
| Mean Household Income | 31,741 | $72,463 |
| Income Deficit | 20,562 | $9,016 |
| Wage / Income Gap (%) | 79,707 | 32.65% |
| Wage / Income Gap ($) | 79,707 | 67.35¢ per $1 |
| Gini / Inequality Index | 79,707 | 0.43 |
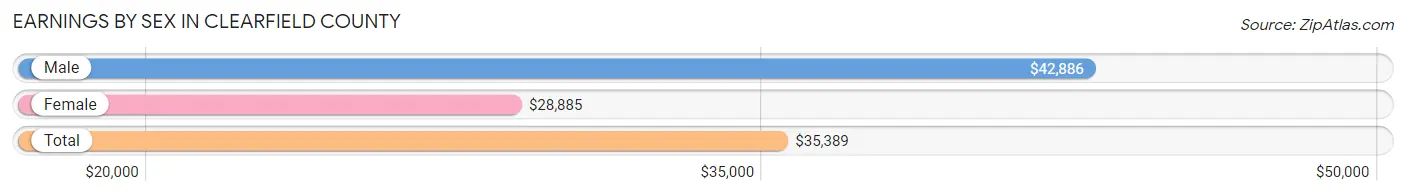
Earnings by Sex in Clearfield County
Average Earnings in Clearfield County are $35,389, $42,886 for men and $28,885 for women, a difference of 32.7%.
| Sex | Number | Average Earnings |
| Male | 21,725 (55.6%) | $42,886 |
| Female | 17,328 (44.4%) | $28,885 |
| Total | 39,053 (100.0%) | $35,389 |
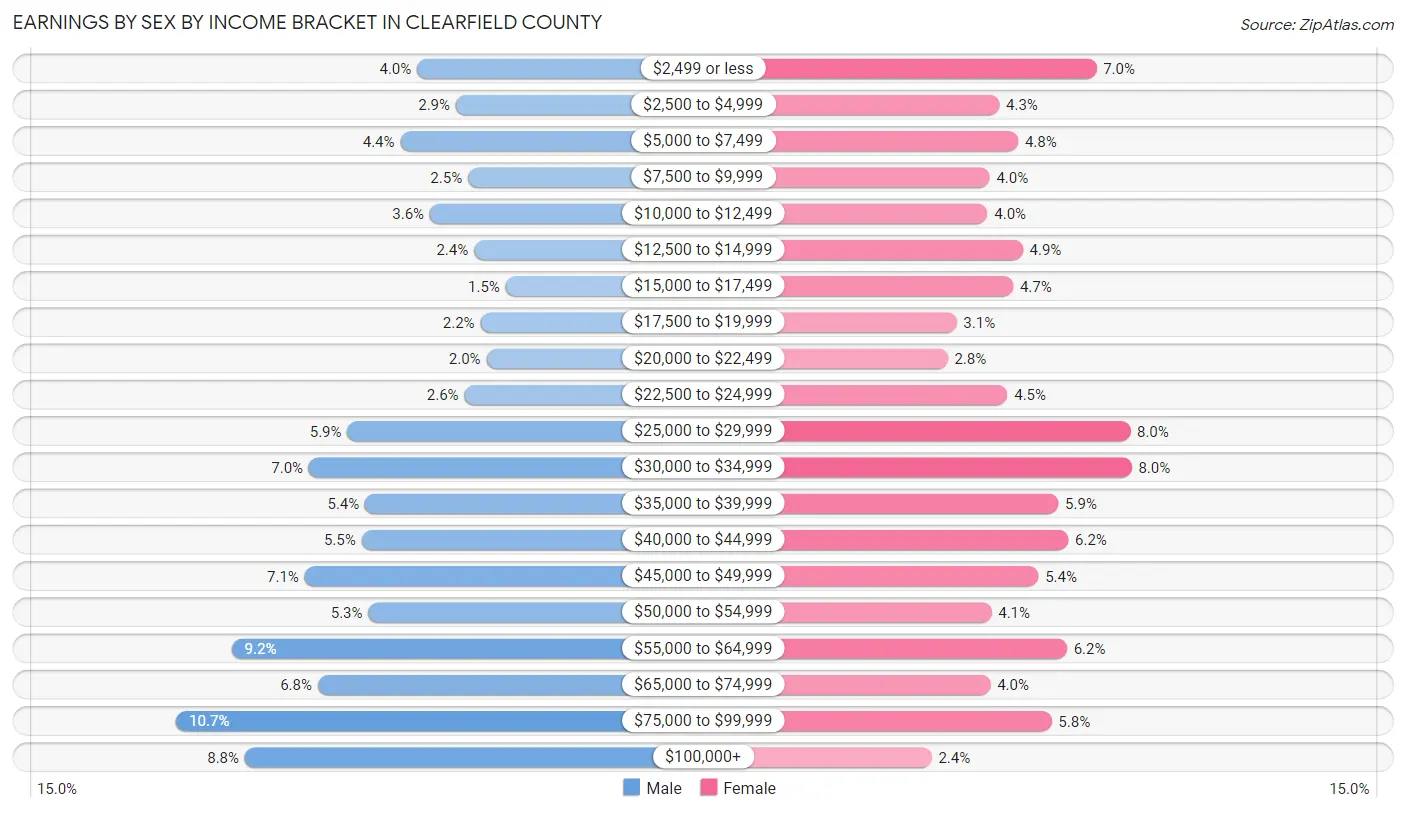
Earnings by Sex by Income Bracket in Clearfield County
The most common earnings brackets in Clearfield County are $75,000 to $99,999 for men (2,333 | 10.7%) and $30,000 to $34,999 for women (1,386 | 8.0%).
| Income | Male | Female |
| $2,499 or less | 862 (4.0%) | 1,215 (7.0%) |
| $2,500 to $4,999 | 625 (2.9%) | 742 (4.3%) |
| $5,000 to $7,499 | 965 (4.4%) | 834 (4.8%) |
| $7,500 to $9,999 | 552 (2.5%) | 695 (4.0%) |
| $10,000 to $12,499 | 785 (3.6%) | 684 (4.0%) |
| $12,500 to $14,999 | 514 (2.4%) | 856 (4.9%) |
| $15,000 to $17,499 | 321 (1.5%) | 809 (4.7%) |
| $17,500 to $19,999 | 476 (2.2%) | 534 (3.1%) |
| $20,000 to $22,499 | 439 (2.0%) | 490 (2.8%) |
| $22,500 to $24,999 | 573 (2.6%) | 781 (4.5%) |
| $25,000 to $29,999 | 1,288 (5.9%) | 1,380 (8.0%) |
| $30,000 to $34,999 | 1,523 (7.0%) | 1,386 (8.0%) |
| $35,000 to $39,999 | 1,179 (5.4%) | 1,030 (5.9%) |
| $40,000 to $44,999 | 1,202 (5.5%) | 1,078 (6.2%) |
| $45,000 to $49,999 | 1,550 (7.1%) | 932 (5.4%) |
| $50,000 to $54,999 | 1,161 (5.3%) | 703 (4.1%) |
| $55,000 to $64,999 | 1,995 (9.2%) | 1,071 (6.2%) |
| $65,000 to $74,999 | 1,468 (6.8%) | 698 (4.0%) |
| $75,000 to $99,999 | 2,333 (10.7%) | 997 (5.8%) |
| $100,000+ | 1,914 (8.8%) | 413 (2.4%) |
| Total | 21,725 (100.0%) | 17,328 (100.0%) |
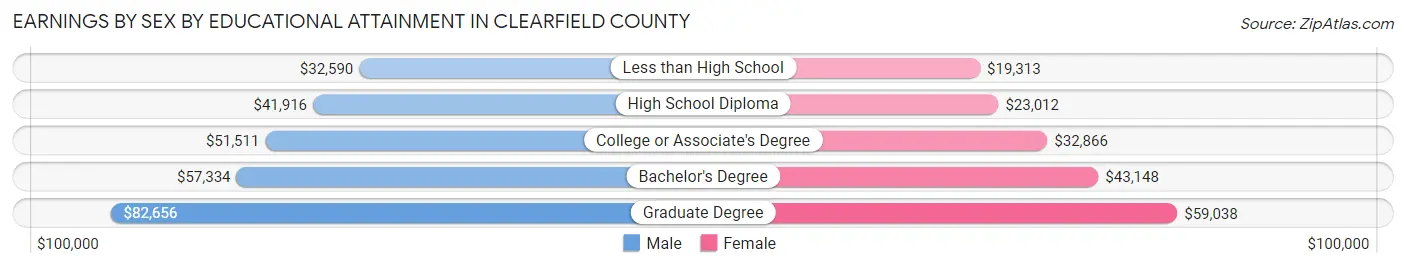
Earnings by Sex by Educational Attainment in Clearfield County
Average earnings in Clearfield County are $46,738 for men and $31,954 for women, a difference of 31.6%. Men with an educational attainment of graduate degree enjoy the highest average annual earnings of $82,656, while those with less than high school education earn the least with $32,590. Women with an educational attainment of graduate degree earn the most with the average annual earnings of $59,038, while those with less than high school education have the smallest earnings of $19,313.
| Educational Attainment | Male Income | Female Income |
| Less than High School | $32,590 | $19,313 |
| High School Diploma | $41,916 | $23,012 |
| College or Associate's Degree | $51,511 | $32,866 |
| Bachelor's Degree | $57,334 | $43,148 |
| Graduate Degree | $82,656 | $59,038 |
| Total | $46,738 | $31,954 |
Family Income in Clearfield County
Family Income Brackets in Clearfield County
According to the Clearfield County family income data, there are 4,729 families falling into the $50,000 to $74,999 income range, which is the most common income bracket and makes up 23.0% of all families. Conversely, the less than $10,000 income bracket is the least frequent group with only 535 families (2.6%) belonging to this category.
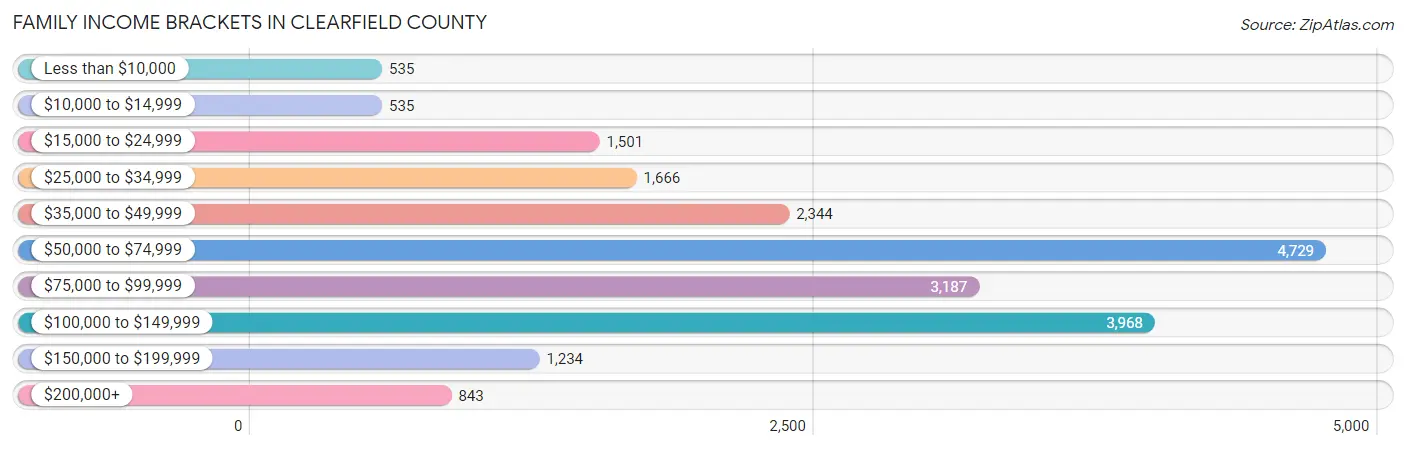
| Income Bracket | # Families | % Families |
| Less than $10,000 | 535 | 2.6% |
| $10,000 to $14,999 | 535 | 2.6% |
| $15,000 to $24,999 | 1,501 | 7.3% |
| $25,000 to $34,999 | 1,666 | 8.1% |
| $35,000 to $49,999 | 2,344 | 11.4% |
| $50,000 to $74,999 | 4,729 | 23.0% |
| $75,000 to $99,999 | 3,187 | 15.5% |
| $100,000 to $149,999 | 3,968 | 19.3% |
| $150,000 to $199,999 | 1,234 | 6.0% |
| $200,000+ | 843 | 4.1% |
Family Income by Famaliy Size in Clearfield County
5-person families (1,088 | 5.3%) account for the highest median family income in Clearfield County with $97,917 per family, while 2-person families (10,726 | 52.2%) have the highest median income of $30,821 per family member.
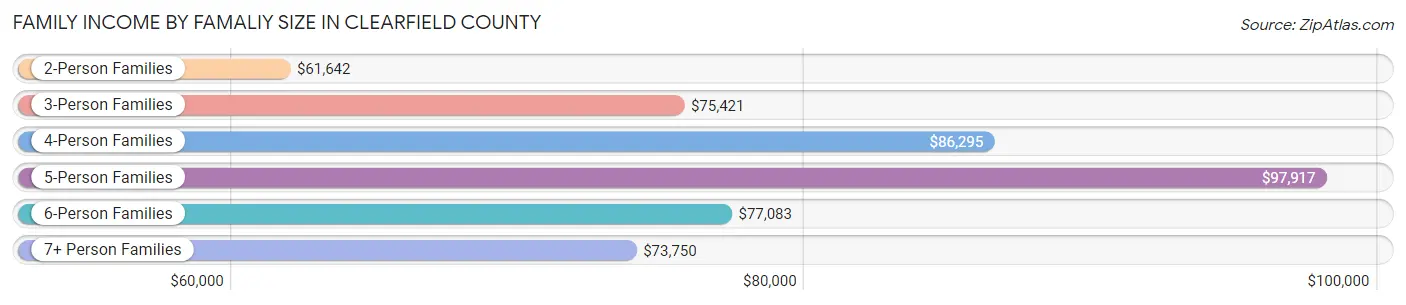
| Income Bracket | # Families | Median Income |
| 2-Person Families | 10,726 (52.2%) | $61,642 |
| 3-Person Families | 4,802 (23.4%) | $75,421 |
| 4-Person Families | 3,447 (16.8%) | $86,295 |
| 5-Person Families | 1,088 (5.3%) | $97,917 |
| 6-Person Families | 311 (1.5%) | $77,083 |
| 7+ Person Families | 188 (0.9%) | $73,750 |
| Total | 20,562 (100.0%) | $70,156 |
Family Income by Number of Earners in Clearfield County
The median family income in Clearfield County is $70,156, with families comprising 3+ earners (2,568) having the highest median family income of $111,025, while families with no earners (4,307) have the lowest median family income of $39,935, accounting for 12.5% and 20.9% of families, respectively.
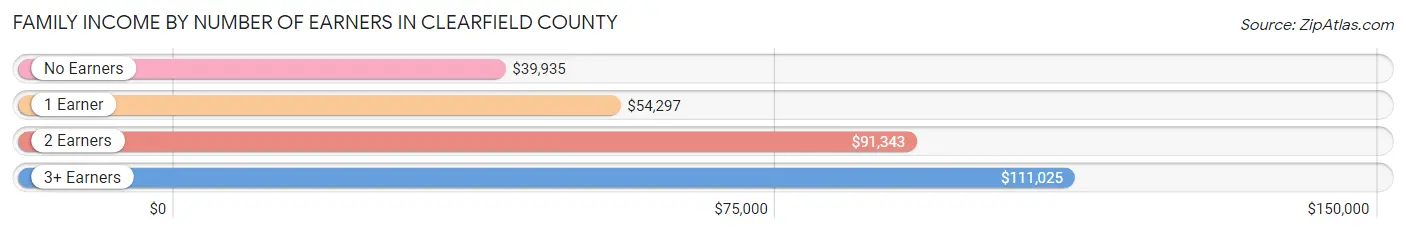
| Number of Earners | # Families | Median Income |
| No Earners | 4,307 (20.9%) | $39,935 |
| 1 Earner | 6,327 (30.8%) | $54,297 |
| 2 Earners | 7,360 (35.8%) | $91,343 |
| 3+ Earners | 2,568 (12.5%) | $111,025 |
| Total | 20,562 (100.0%) | $70,156 |
Household Income in Clearfield County
Household Income Brackets in Clearfield County
With 6,729 households falling in the category, the $50,000 to $74,999 income range is the most frequent in Clearfield County, accounting for 21.2% of all households. In contrast, only 984 households (3.1%) fall into the $200,000+ income bracket, making it the least populous group.
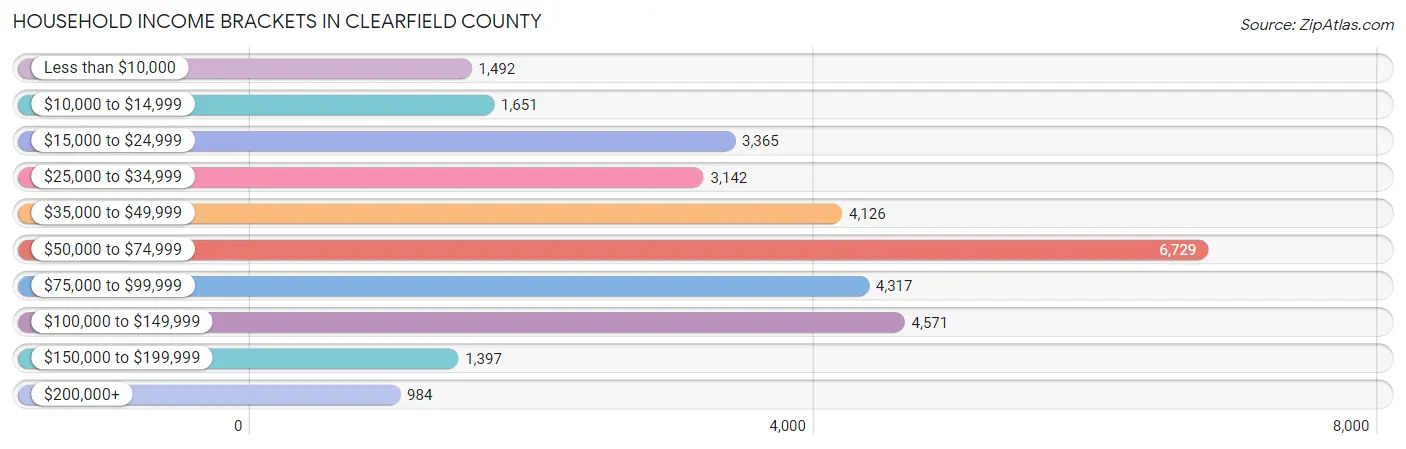
| Income Bracket | # Households | % Households |
| Less than $10,000 | 1,492 | 4.7% |
| $10,000 to $14,999 | 1,651 | 5.2% |
| $15,000 to $24,999 | 3,365 | 10.6% |
| $25,000 to $34,999 | 3,142 | 9.9% |
| $35,000 to $49,999 | 4,126 | 13.0% |
| $50,000 to $74,999 | 6,729 | 21.2% |
| $75,000 to $99,999 | 4,317 | 13.6% |
| $100,000 to $149,999 | 4,571 | 14.4% |
| $150,000 to $199,999 | 1,397 | 4.4% |
| $200,000+ | 984 | 3.1% |
Household Income by Householder Age in Clearfield County
The median household income in Clearfield County is $56,982, with the highest median household income of $70,674 found in the 45 to 64 years age bracket for the primary householder. A total of 12,803 households (40.3%) fall into this category. Meanwhile, the 65+ years age bracket for the primary householder has the lowest median household income of $41,296, with 10,373 households (32.7%) in this group.
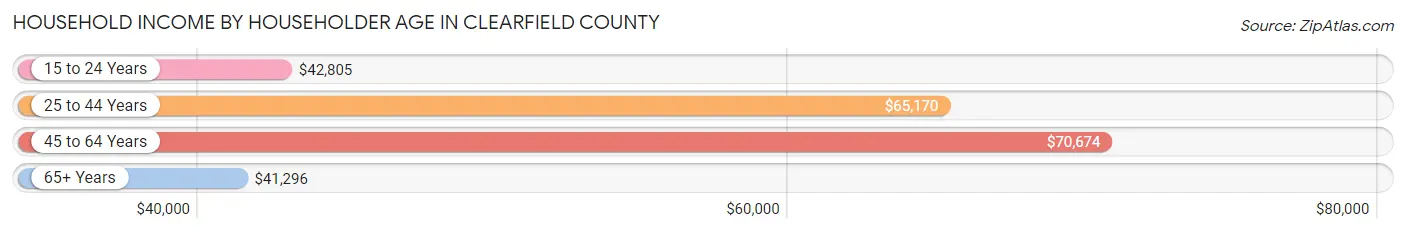
| Income Bracket | # Households | Median Income |
| 15 to 24 Years | 698 (2.2%) | $42,805 |
| 25 to 44 Years | 7,867 (24.8%) | $65,170 |
| 45 to 64 Years | 12,803 (40.3%) | $70,674 |
| 65+ Years | 10,373 (32.7%) | $41,296 |
| Total | 31,741 (100.0%) | $56,982 |
Poverty in Clearfield County
Income Below Poverty by Sex and Age in Clearfield County
With 13.1% poverty level for males and 14.4% for females among the residents of Clearfield County, 12 to 14 year old males and 5 year old females are the most vulnerable to poverty, with 376 males (27.1%) and 121 females (34.1%) in their respective age groups living below the poverty level.
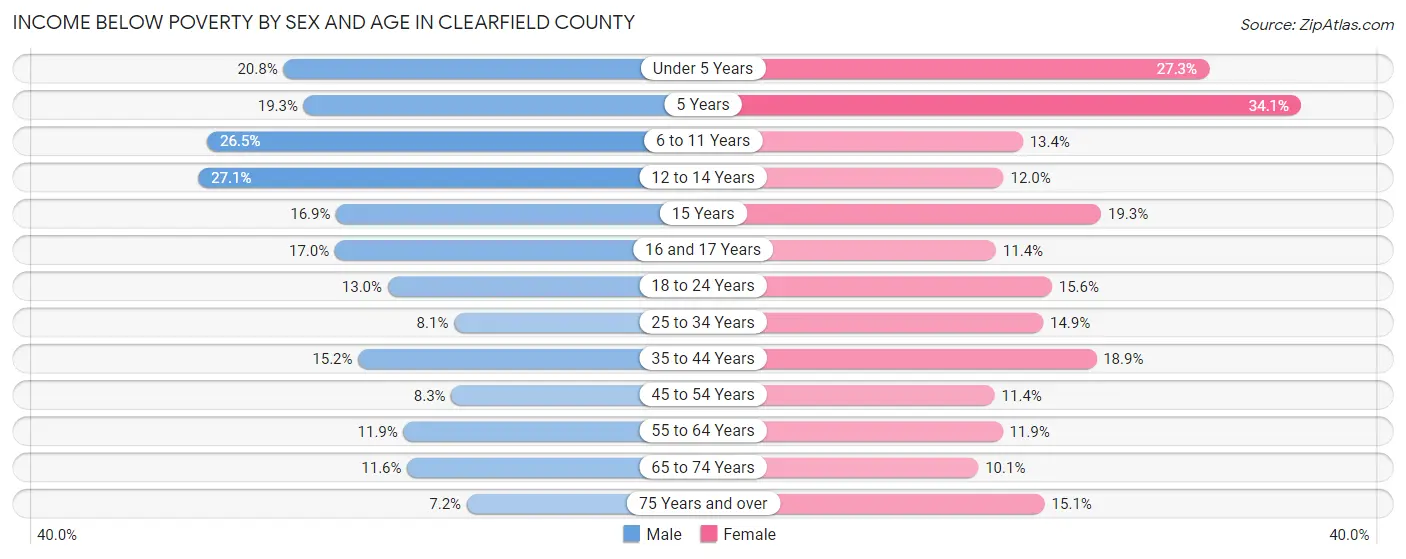
| Age Bracket | Male | Female |
| Under 5 Years | 376 (20.8%) | 487 (27.3%) |
| 5 Years | 85 (19.3%) | 121 (34.1%) |
| 6 to 11 Years | 593 (26.5%) | 313 (13.4%) |
| 12 to 14 Years | 376 (27.1%) | 137 (12.0%) |
| 15 Years | 89 (16.9%) | 82 (19.3%) |
| 16 and 17 Years | 151 (17.0%) | 101 (11.4%) |
| 18 to 24 Years | 392 (13.0%) | 383 (15.6%) |
| 25 to 34 Years | 390 (8.1%) | 592 (14.9%) |
| 35 to 44 Years | 640 (15.2%) | 779 (18.9%) |
| 45 to 54 Years | 440 (8.3%) | 564 (11.4%) |
| 55 to 64 Years | 698 (11.9%) | 690 (11.9%) |
| 65 to 74 Years | 533 (11.6%) | 488 (10.1%) |
| 75 Years and over | 197 (7.2%) | 577 (15.1%) |
| Total | 4,960 (13.1%) | 5,314 (14.4%) |
Income Above Poverty by Sex and Age in Clearfield County
According to the poverty statistics in Clearfield County, males aged 75 years and over and females aged 65 to 74 years are the age groups that are most secure financially, with 92.8% of males and 89.9% of females in these age groups living above the poverty line.
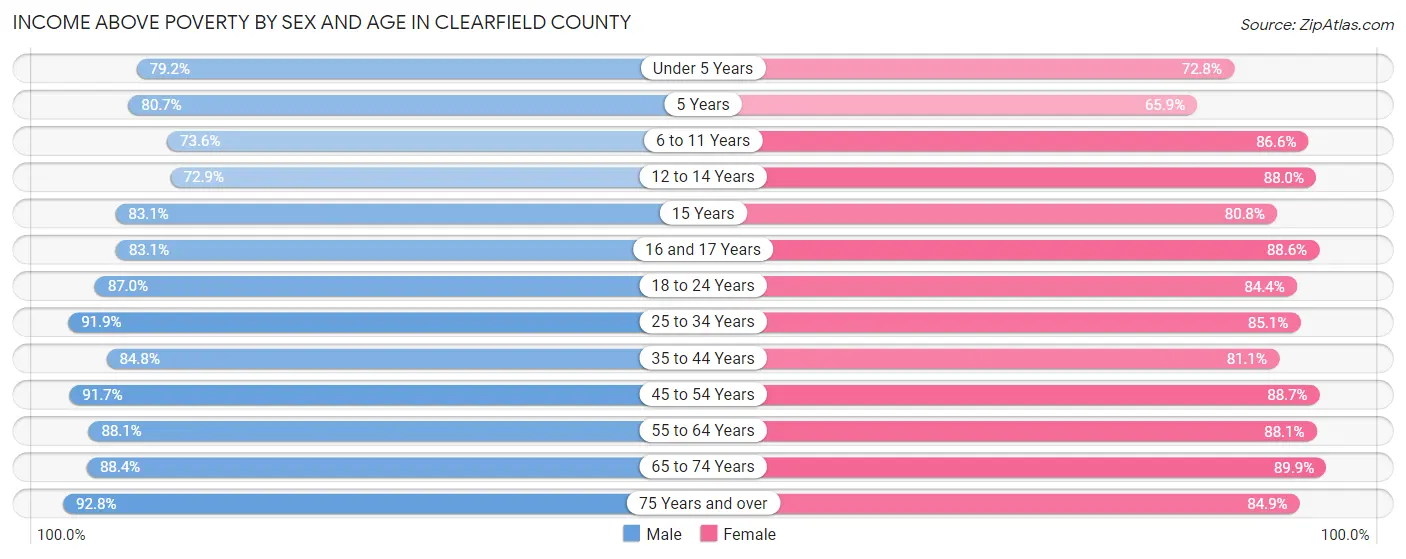
| Age Bracket | Male | Female |
| Under 5 Years | 1,433 (79.2%) | 1,300 (72.8%) |
| 5 Years | 356 (80.7%) | 234 (65.9%) |
| 6 to 11 Years | 1,649 (73.6%) | 2,018 (86.6%) |
| 12 to 14 Years | 1,011 (72.9%) | 1,004 (88.0%) |
| 15 Years | 439 (83.1%) | 344 (80.7%) |
| 16 and 17 Years | 740 (83.1%) | 782 (88.6%) |
| 18 to 24 Years | 2,617 (87.0%) | 2,073 (84.4%) |
| 25 to 34 Years | 4,422 (91.9%) | 3,370 (85.1%) |
| 35 to 44 Years | 3,565 (84.8%) | 3,345 (81.1%) |
| 45 to 54 Years | 4,857 (91.7%) | 4,404 (88.6%) |
| 55 to 64 Years | 5,187 (88.1%) | 5,095 (88.1%) |
| 65 to 74 Years | 4,071 (88.4%) | 4,331 (89.9%) |
| 75 Years and over | 2,553 (92.8%) | 3,254 (84.9%) |
| Total | 32,900 (86.9%) | 31,554 (85.6%) |
Income Below Poverty Among Married-Couple Families in Clearfield County
The poverty statistics for married-couple families in Clearfield County show that 5.4% or 832 of the total 15,506 families live below the poverty line. Families with 5 or more children have the highest poverty rate of 23.9%, comprising of 27 families. On the other hand, families with no children have the lowest poverty rate of 3.8%, which includes 389 families.
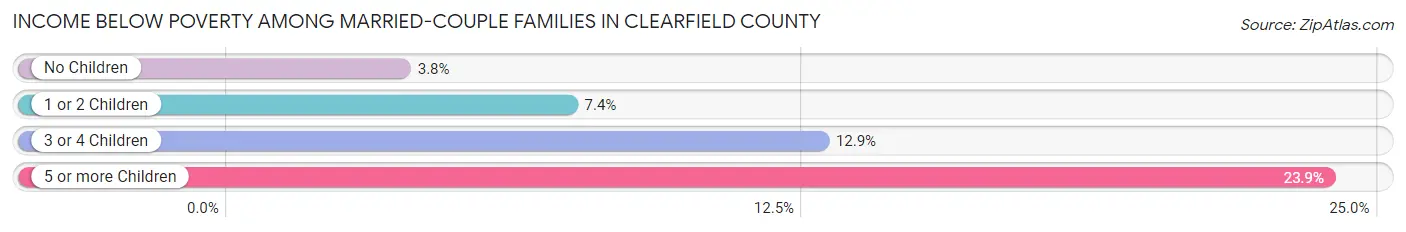
| Children | Above Poverty | Below Poverty |
| No Children | 9,945 (96.2%) | 389 (3.8%) |
| 1 or 2 Children | 3,972 (92.6%) | 317 (7.4%) |
| 3 or 4 Children | 671 (87.1%) | 99 (12.9%) |
| 5 or more Children | 86 (76.1%) | 27 (23.9%) |
| Total | 14,674 (94.6%) | 832 (5.4%) |
Income Below Poverty Among Single-Parent Households in Clearfield County
According to the poverty data in Clearfield County, 22.5% or 384 single-father households and 27.8% or 931 single-mother households are living below the poverty line. Among single-father households, those with 3 or 4 children have the highest poverty rate, with 76 households (71.7%) experiencing poverty. Likewise, among single-mother households, those with 5 or more children have the highest poverty rate, with 14 households (100.0%) falling below the poverty line.
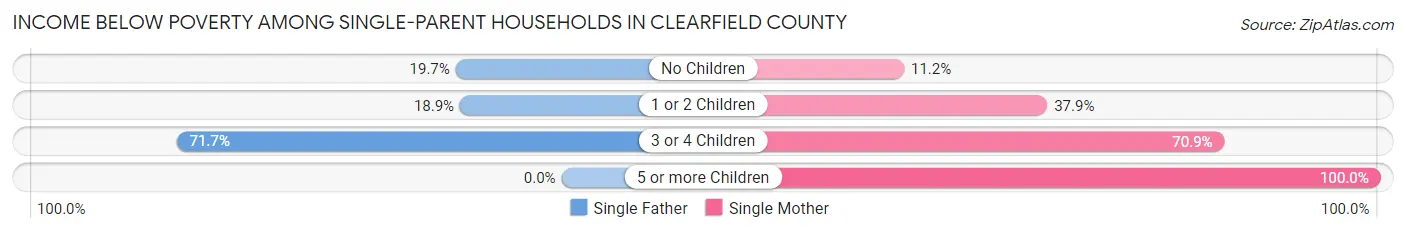
| Children | Single Father | Single Mother |
| No Children | 127 (19.7%) | 177 (11.2%) |
| 1 or 2 Children | 181 (18.9%) | 584 (37.9%) |
| 3 or 4 Children | 76 (71.7%) | 156 (70.9%) |
| 5 or more Children | 0 (0.0%) | 14 (100.0%) |
| Total | 384 (22.5%) | 931 (27.8%) |
Income Below Poverty Among Married-Couple vs Single-Parent Households in Clearfield County
The poverty data for Clearfield County shows that 832 of the married-couple family households (5.4%) and 1,315 of the single-parent households (26.0%) are living below the poverty level. Within the married-couple family households, those with 5 or more children have the highest poverty rate, with 27 households (23.9%) falling below the poverty line. Among the single-parent households, those with 5 or more children have the highest poverty rate, with 14 household (100.0%) living below poverty.
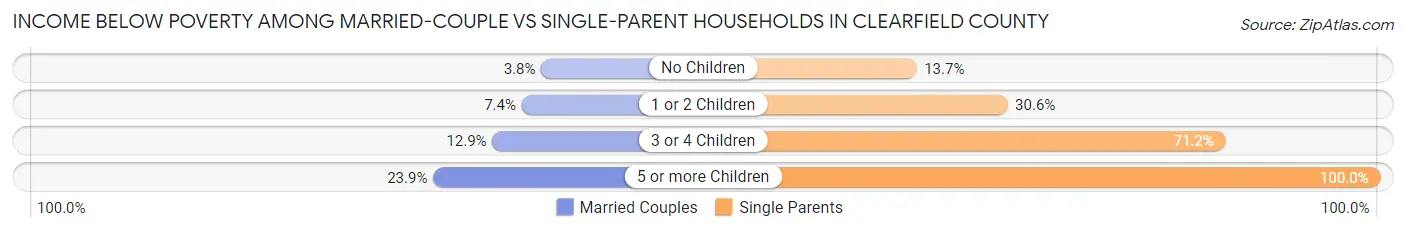
| Children | Married-Couple Families | Single-Parent Households |
| No Children | 389 (3.8%) | 304 (13.7%) |
| 1 or 2 Children | 317 (7.4%) | 765 (30.6%) |
| 3 or 4 Children | 99 (12.9%) | 232 (71.2%) |
| 5 or more Children | 27 (23.9%) | 14 (100.0%) |
| Total | 832 (5.4%) | 1,315 (26.0%) |
Race in Clearfield County
The most populous races in Clearfield County are White / Caucasian (74,333 | 93.3%), Two or more Races (2,559 | 3.2%), and Hispanic or Latino (2,314 | 2.9%).
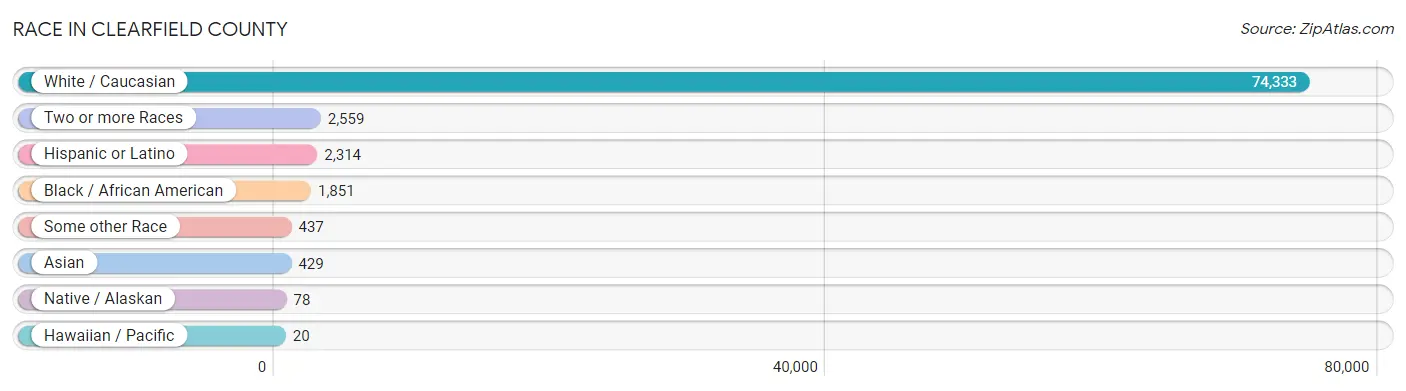
| Race | # Population | % Population |
| Asian | 429 | 0.5% |
| Black / African American | 1,851 | 2.3% |
| Hawaiian / Pacific | 20 | 0.0% |
| Hispanic or Latino | 2,314 | 2.9% |
| Native / Alaskan | 78 | 0.1% |
| White / Caucasian | 74,333 | 93.3% |
| Two or more Races | 2,559 | 3.2% |
| Some other Race | 437 | 0.5% |
| Total | 79,707 | 100.0% |
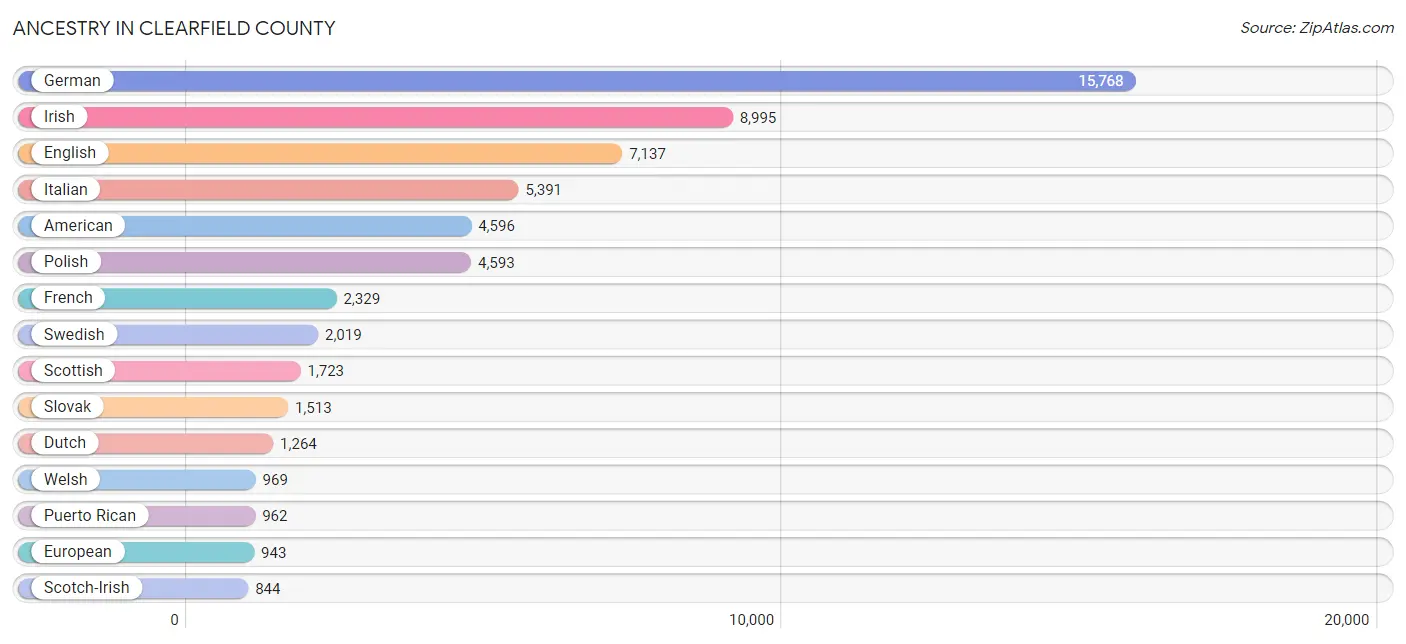
Ancestry in Clearfield County
The most populous ancestries reported in Clearfield County are German (15,768 | 19.8%), Irish (8,995 | 11.3%), English (7,137 | 8.9%), Italian (5,391 | 6.8%), and American (4,596 | 5.8%), together accounting for 52.5% of all Clearfield County residents.
| Ancestry | # Population | % Population |
| African | 152 | 0.2% |
| Aleut | 9 | 0.0% |
| American | 4,596 | 5.8% |
| Apache | 3 | 0.0% |
| Arab | 139 | 0.2% |
| Argentinean | 12 | 0.0% |
| Australian | 4 | 0.0% |
| Austrian | 322 | 0.4% |
| Bangladeshi | 13 | 0.0% |
| Belgian | 111 | 0.1% |
| Bhutanese | 12 | 0.0% |
| Blackfeet | 26 | 0.0% |
| Brazilian | 9 | 0.0% |
| British | 308 | 0.4% |
| Bulgarian | 5 | 0.0% |
| Burmese | 106 | 0.1% |
| Cajun | 2 | 0.0% |
| Canadian | 70 | 0.1% |
| Carpatho Rusyn | 3 | 0.0% |
| Central American | 155 | 0.2% |
| Central American Indian | 30 | 0.0% |
| Cherokee | 108 | 0.1% |
| Chilean | 8 | 0.0% |
| Colombian | 27 | 0.0% |
| Croatian | 74 | 0.1% |
| Cuban | 99 | 0.1% |
| Czech | 270 | 0.3% |
| Czechoslovakian | 125 | 0.2% |
| Danish | 14 | 0.0% |
| Delaware | 35 | 0.0% |
| Dominican | 237 | 0.3% |
| Dutch | 1,264 | 1.6% |
| Eastern European | 129 | 0.2% |
| Ecuadorian | 1 | 0.0% |
| English | 7,137 | 8.9% |
| European | 943 | 1.2% |
| Finnish | 49 | 0.1% |
| French | 2,329 | 2.9% |
| French American Indian | 75 | 0.1% |
| French Canadian | 153 | 0.2% |
| German | 15,768 | 19.8% |
| Ghanaian | 9 | 0.0% |
| Greek | 119 | 0.2% |
| Guamanian / Chamorro | 19 | 0.0% |
| Guatemalan | 125 | 0.2% |
| Haitian | 18 | 0.0% |
| Honduran | 7 | 0.0% |
| Hungarian | 519 | 0.6% |
| Indian (Asian) | 172 | 0.2% |
| Iranian | 13 | 0.0% |
| Irish | 8,995 | 11.3% |
| Iroquois | 60 | 0.1% |
| Italian | 5,391 | 6.8% |
| Jamaican | 46 | 0.1% |
| Korean | 136 | 0.2% |
| Latvian | 4 | 0.0% |
| Lebanese | 72 | 0.1% |
| Lithuanian | 198 | 0.3% |
| Luxembourger | 3 | 0.0% |
| Malaysian | 5 | 0.0% |
| Mexican | 526 | 0.7% |
| Native Hawaiian | 16 | 0.0% |
| Navajo | 2 | 0.0% |
| Nicaraguan | 6 | 0.0% |
| Nigerian | 25 | 0.0% |
| Northern European | 15 | 0.0% |
| Norwegian | 153 | 0.2% |
| Pakistani | 79 | 0.1% |
| Panamanian | 10 | 0.0% |
| Pennsylvania German | 664 | 0.8% |
| Polish | 4,593 | 5.8% |
| Puerto Rican | 962 | 1.2% |
| Romanian | 16 | 0.0% |
| Russian | 426 | 0.5% |
| Salvadoran | 7 | 0.0% |
| Samoan | 14 | 0.0% |
| Scandinavian | 132 | 0.2% |
| Scotch-Irish | 844 | 1.1% |
| Scottish | 1,723 | 2.2% |
| Seminole | 1 | 0.0% |
| Serbian | 32 | 0.0% |
| Sioux | 4 | 0.0% |
| Slavic | 124 | 0.2% |
| Slovak | 1,513 | 1.9% |
| Slovene | 33 | 0.0% |
| South African | 5 | 0.0% |
| South American | 59 | 0.1% |
| Spaniard | 52 | 0.1% |
| Spanish | 139 | 0.2% |
| Sri Lankan | 50 | 0.1% |
| Subsaharan African | 202 | 0.3% |
| Swedish | 2,019 | 2.5% |
| Swiss | 155 | 0.2% |
| Syrian | 62 | 0.1% |
| Thai | 60 | 0.1% |
| Tongan | 9 | 0.0% |
| Trinidadian and Tobagonian | 6 | 0.0% |
| Ukrainian | 613 | 0.8% |
| Ute | 1 | 0.0% |
| Venezuelan | 11 | 0.0% |
| Vietnamese | 5 | 0.0% |
| Welsh | 969 | 1.2% |
| West Indian | 14 | 0.0% |
| Yugoslavian | 5 | 0.0% | View All 104 Rows |
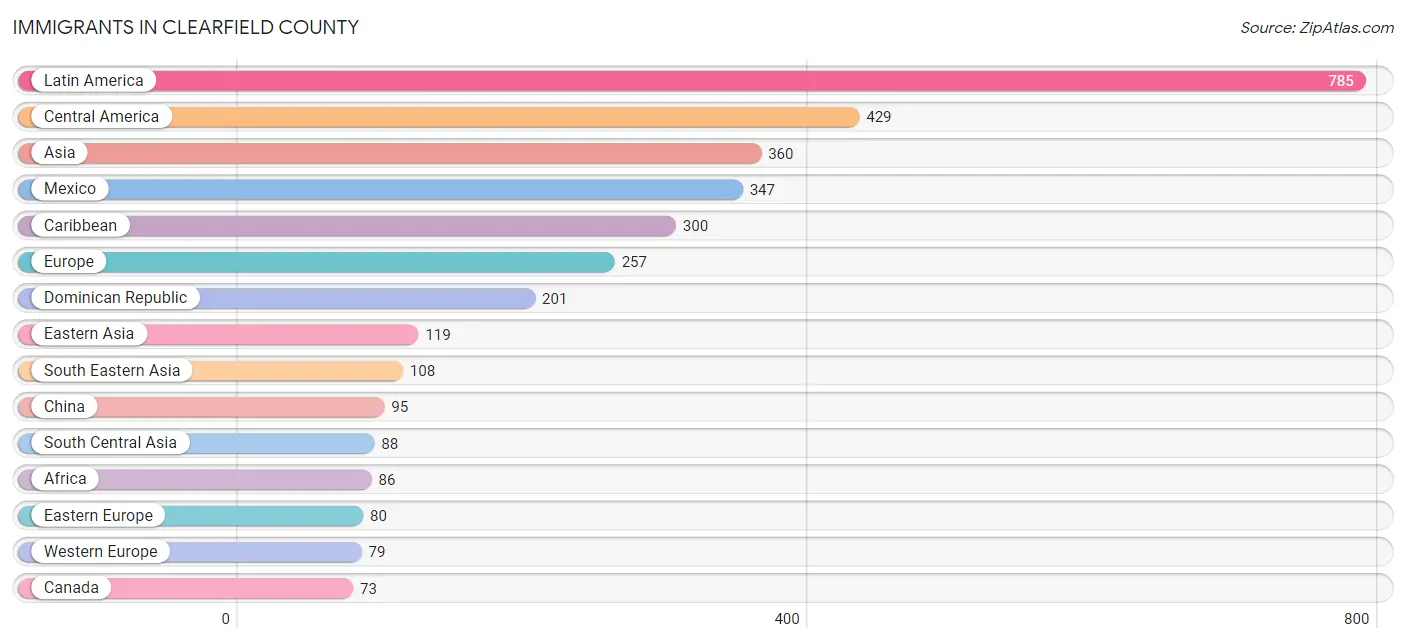
Immigrants in Clearfield County
The most numerous immigrant groups reported in Clearfield County came from Latin America (785 | 1.0%), Central America (429 | 0.5%), Asia (360 | 0.4%), Mexico (347 | 0.4%), and Caribbean (300 | 0.4%), together accounting for 2.8% of all Clearfield County residents.
| Immigration Origin | # Population | % Population |
| Afghanistan | 9 | 0.0% |
| Africa | 86 | 0.1% |
| Argentina | 12 | 0.0% |
| Asia | 360 | 0.4% |
| Australia | 8 | 0.0% |
| Austria | 8 | 0.0% |
| Bulgaria | 5 | 0.0% |
| Cameroon | 15 | 0.0% |
| Canada | 73 | 0.1% |
| Caribbean | 300 | 0.4% |
| Central America | 429 | 0.5% |
| Chile | 16 | 0.0% |
| China | 95 | 0.1% |
| Colombia | 19 | 0.0% |
| Cuba | 28 | 0.0% |
| Czechoslovakia | 10 | 0.0% |
| Dominican Republic | 201 | 0.3% |
| Eastern Africa | 7 | 0.0% |
| Eastern Asia | 119 | 0.2% |
| Eastern Europe | 80 | 0.1% |
| El Salvador | 7 | 0.0% |
| England | 16 | 0.0% |
| Europe | 257 | 0.3% |
| France | 2 | 0.0% |
| Germany | 69 | 0.1% |
| Ghana | 16 | 0.0% |
| Guatemala | 58 | 0.1% |
| Haiti | 10 | 0.0% |
| Honduras | 7 | 0.0% |
| Hong Kong | 39 | 0.1% |
| India | 55 | 0.1% |
| Iraq | 7 | 0.0% |
| Ireland | 10 | 0.0% |
| Italy | 41 | 0.1% |
| Jamaica | 55 | 0.1% |
| Jordan | 23 | 0.0% |
| Kazakhstan | 8 | 0.0% |
| Korea | 24 | 0.0% |
| Latin America | 785 | 1.0% |
| Mexico | 347 | 0.4% |
| Middle Africa | 15 | 0.0% |
| Nigeria | 25 | 0.0% |
| Northern Europe | 57 | 0.1% |
| Norway | 5 | 0.0% |
| Oceania | 8 | 0.0% |
| Pakistan | 16 | 0.0% |
| Panama | 10 | 0.0% |
| Philippines | 48 | 0.1% |
| Poland | 21 | 0.0% |
| Romania | 9 | 0.0% |
| Singapore | 1 | 0.0% |
| South Africa | 23 | 0.0% |
| South America | 56 | 0.1% |
| South Central Asia | 88 | 0.1% |
| South Eastern Asia | 108 | 0.1% |
| Southern Europe | 41 | 0.1% |
| Thailand | 27 | 0.0% |
| Trinidad and Tobago | 6 | 0.0% |
| Turkey | 15 | 0.0% |
| Ukraine | 35 | 0.0% |
| Venezuela | 9 | 0.0% |
| Vietnam | 32 | 0.0% |
| Western Africa | 41 | 0.1% |
| Western Asia | 45 | 0.1% |
| Western Europe | 79 | 0.1% | View All 65 Rows |
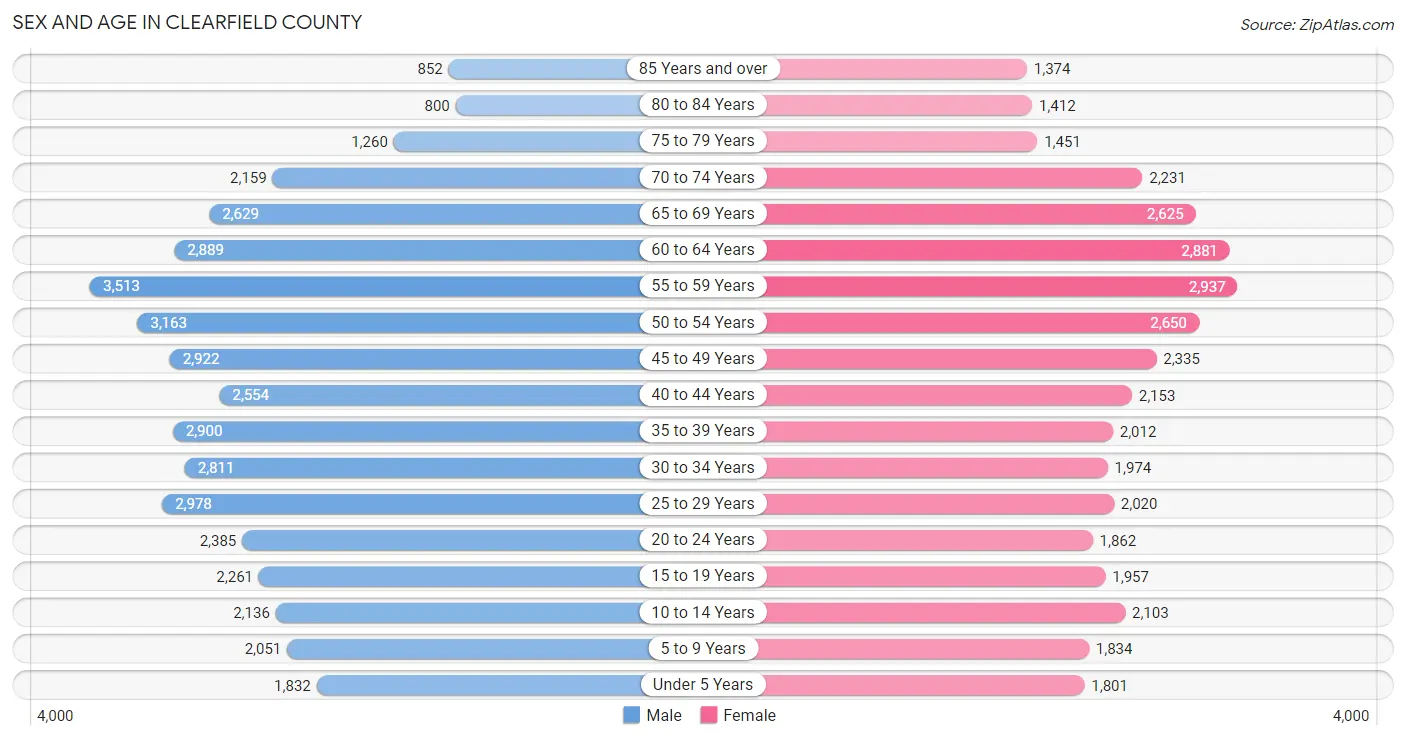
Sex and Age in Clearfield County
Sex and Age in Clearfield County
The most populous age groups in Clearfield County are 55 to 59 Years (3,513 | 8.4%) for men and 55 to 59 Years (2,937 | 7.8%) for women.
| Age Bracket | Male | Female |
| Under 5 Years | 1,832 (4.3%) | 1,801 (4.8%) |
| 5 to 9 Years | 2,051 (4.9%) | 1,834 (4.9%) |
| 10 to 14 Years | 2,136 (5.1%) | 2,103 (5.6%) |
| 15 to 19 Years | 2,261 (5.4%) | 1,957 (5.2%) |
| 20 to 24 Years | 2,385 (5.7%) | 1,862 (5.0%) |
| 25 to 29 Years | 2,978 (7.1%) | 2,020 (5.4%) |
| 30 to 34 Years | 2,811 (6.7%) | 1,974 (5.2%) |
| 35 to 39 Years | 2,900 (6.9%) | 2,012 (5.3%) |
| 40 to 44 Years | 2,554 (6.1%) | 2,153 (5.7%) |
| 45 to 49 Years | 2,922 (6.9%) | 2,335 (6.2%) |
| 50 to 54 Years | 3,163 (7.5%) | 2,650 (7.0%) |
| 55 to 59 Years | 3,513 (8.4%) | 2,937 (7.8%) |
| 60 to 64 Years | 2,889 (6.9%) | 2,881 (7.7%) |
| 65 to 69 Years | 2,629 (6.2%) | 2,625 (7.0%) |
| 70 to 74 Years | 2,159 (5.1%) | 2,231 (5.9%) |
| 75 to 79 Years | 1,260 (3.0%) | 1,451 (3.9%) |
| 80 to 84 Years | 800 (1.9%) | 1,412 (3.7%) |
| 85 Years and over | 852 (2.0%) | 1,374 (3.6%) |
| Total | 42,095 (100.0%) | 37,612 (100.0%) |
Families and Households in Clearfield County
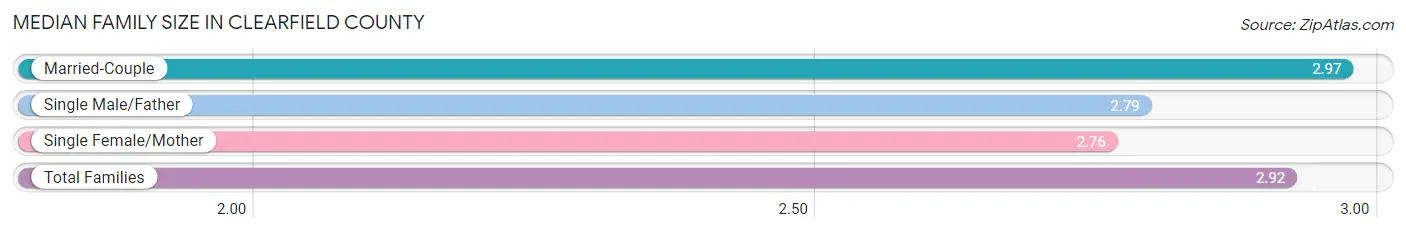
Median Family Size in Clearfield County
The median family size in Clearfield County is 2.92 persons per family, with married-couple families (15,506 | 75.4%) accounting for the largest median family size of 2.97 persons per family. On the other hand, single female/mother families (3,349 | 16.3%) represent the smallest median family size with 2.76 persons per family.
| Family Type | # Families | Family Size |
| Married-Couple | 15,506 (75.4%) | 2.97 |
| Single Male/Father | 1,707 (8.3%) | 2.79 |
| Single Female/Mother | 3,349 (16.3%) | 2.76 |
| Total Families | 20,562 (100.0%) | 2.92 |
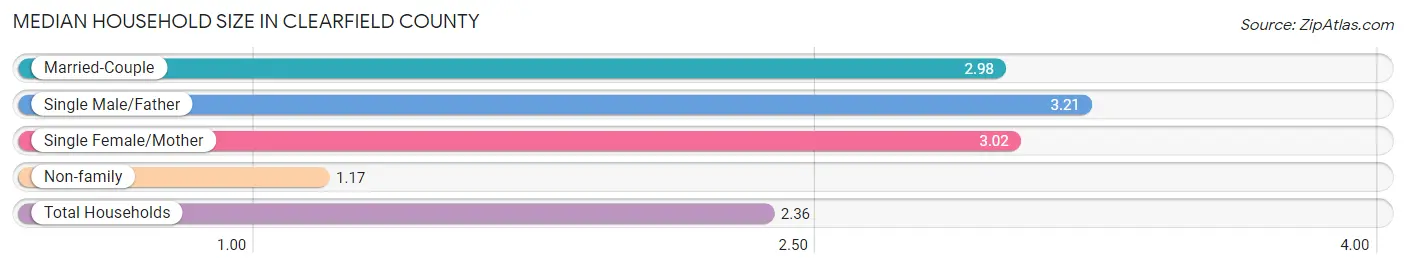
Median Household Size in Clearfield County
The median household size in Clearfield County is 2.36 persons per household, with single male/father households (1,707 | 5.4%) accounting for the largest median household size of 3.21 persons per household. non-family households (11,179 | 35.2%) represent the smallest median household size with 1.17 persons per household.
| Household Type | # Households | Household Size |
| Married-Couple | 15,506 (48.8%) | 2.98 |
| Single Male/Father | 1,707 (5.4%) | 3.21 |
| Single Female/Mother | 3,349 (10.5%) | 3.02 |
| Non-family | 11,179 (35.2%) | 1.17 |
| Total Households | 31,741 (100.0%) | 2.36 |
Household Size by Marriage Status in Clearfield County
Out of a total of 31,741 households in Clearfield County, 20,562 (64.8%) are family households, while 11,179 (35.2%) are nonfamily households. The most numerous type of family households are 2-person households, comprising 9,914, and the most common type of nonfamily households are 1-person households, comprising 9,650.
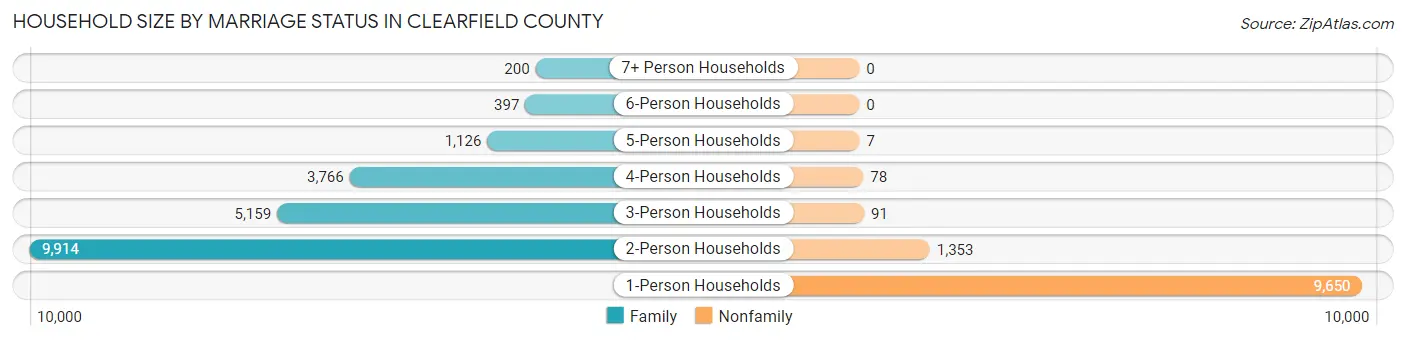
| Household Size | Family Households | Nonfamily Households |
| 1-Person Households | - | 9,650 (30.4%) |
| 2-Person Households | 9,914 (31.2%) | 1,353 (4.3%) |
| 3-Person Households | 5,159 (16.3%) | 91 (0.3%) |
| 4-Person Households | 3,766 (11.9%) | 78 (0.3%) |
| 5-Person Households | 1,126 (3.5%) | 7 (0.0%) |
| 6-Person Households | 397 (1.3%) | 0 (0.0%) |
| 7+ Person Households | 200 (0.6%) | 0 (0.0%) |
| Total | 20,562 (64.8%) | 11,179 (35.2%) |
Female Fertility in Clearfield County
Fertility by Age in Clearfield County
Average fertility rate in Clearfield County is 61.0 births per 1,000 women. Women in the age bracket of 20 to 34 years have the highest fertility rate with 127.0 births per 1,000 women. Women in the age bracket of 20 to 34 years acount for 81.9% of all women with births.
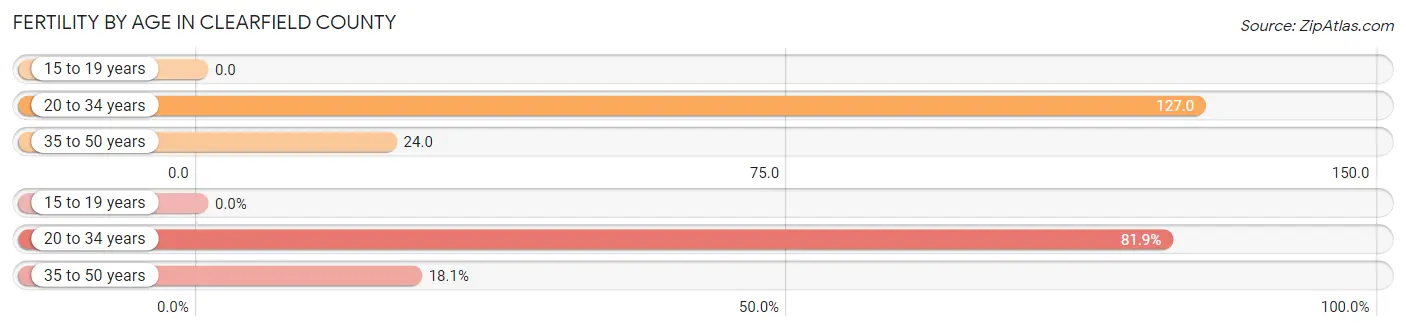
| Age Bracket | Women with Births | Births / 1,000 Women |
| 15 to 19 years | 0 (0.0%) | 0.0 |
| 20 to 34 years | 745 (81.9%) | 127.0 |
| 35 to 50 years | 165 (18.1%) | 24.0 |
| Total | 910 (100.0%) | 61.0 |
Fertility by Age by Marriage Status in Clearfield County
55.1% of women with births (910) in Clearfield County are married. The highest percentage of unmarried women with births falls into 20 to 34 years age bracket with 48.2% of them unmarried at the time of birth, while the lowest percentage of unmarried women with births belong to 35 to 50 years age bracket with 30.3% of them unmarried.
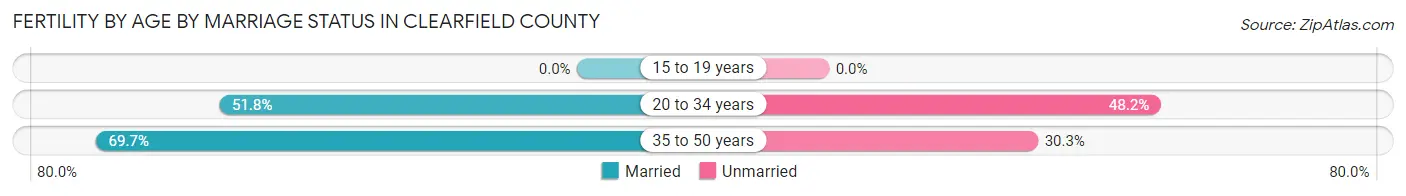
| Age Bracket | Married | Unmarried |
| 15 to 19 years | 0 (0.0%) | 0 (0.0%) |
| 20 to 34 years | 386 (51.8%) | 359 (48.2%) |
| 35 to 50 years | 115 (69.7%) | 50 (30.3%) |
| Total | 501 (55.0%) | 409 (45.0%) |
Fertility by Education in Clearfield County
Average fertility rate in Clearfield County is 61.0 births per 1,000 women. Women with the education attainment of graduate degree have the highest fertility rate of 122.0 births per 1,000 women, while women with the education attainment of less than high school have the lowest fertility at 32.0 births per 1,000 women. Women with the education attainment of high school diploma represent 30.5% of all women with births.
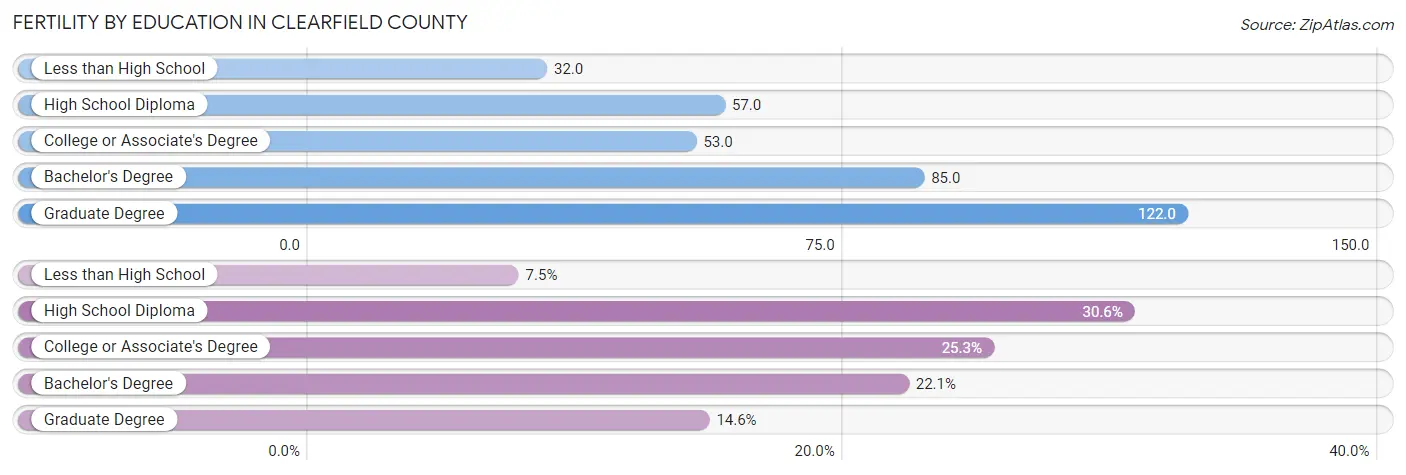
| Educational Attainment | Women with Births | Births / 1,000 Women |
| Less than High School | 68 (7.5%) | 32.0 |
| High School Diploma | 278 (30.5%) | 57.0 |
| College or Associate's Degree | 230 (25.3%) | 53.0 |
| Bachelor's Degree | 201 (22.1%) | 85.0 |
| Graduate Degree | 133 (14.6%) | 122.0 |
| Total | 910 (100.0%) | 61.0 |
Fertility by Education by Marriage Status in Clearfield County
45.0% of women with births in Clearfield County are unmarried. Women with the educational attainment of graduate degree are most likely to be married with 95.5% of them married at childbirth, while women with the educational attainment of college or associate's degree are least likely to be married with 63.5% of them unmarried at childbirth.
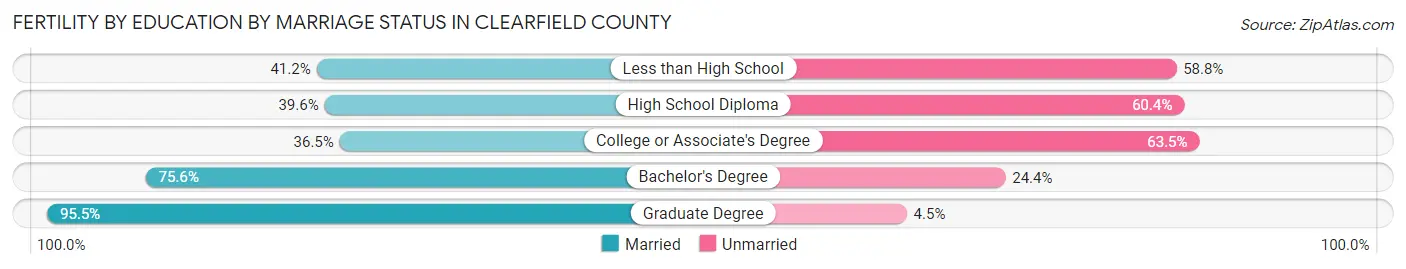
| Educational Attainment | Married | Unmarried |
| Less than High School | 28 (41.2%) | 40 (58.8%) |
| High School Diploma | 110 (39.6%) | 168 (60.4%) |
| College or Associate's Degree | 84 (36.5%) | 146 (63.5%) |
| Bachelor's Degree | 152 (75.6%) | 49 (24.4%) |
| Graduate Degree | 127 (95.5%) | 6 (4.5%) |
| Total | 501 (55.0%) | 409 (45.0%) |
Employment Characteristics in Clearfield County
Employment by Class of Employer in Clearfield County
Among the 34,235 employed individuals in Clearfield County, private company employees (21,920 | 64.0%), not-for-profit organizations (4,094 | 12.0%), and state government employees (2,923 | 8.5%) make up the most common classes of employment.
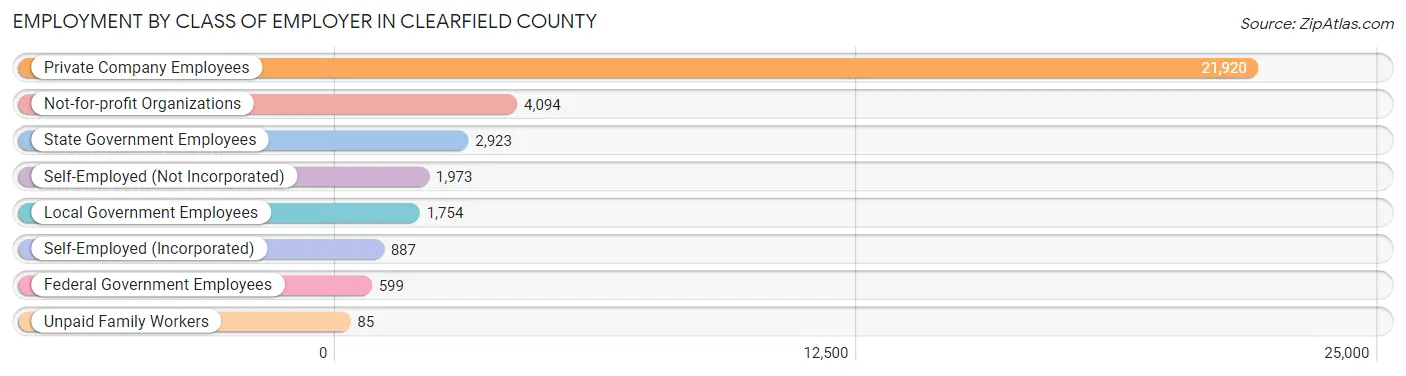
| Employer Class | # Employees | % Employees |
| Private Company Employees | 21,920 | 64.0% |
| Self-Employed (Incorporated) | 887 | 2.6% |
| Self-Employed (Not Incorporated) | 1,973 | 5.8% |
| Not-for-profit Organizations | 4,094 | 12.0% |
| Local Government Employees | 1,754 | 5.1% |
| State Government Employees | 2,923 | 8.5% |
| Federal Government Employees | 599 | 1.8% |
| Unpaid Family Workers | 85 | 0.3% |
| Total | 34,235 | 100.0% |
Employment Status by Age in Clearfield County
According to the labor force statistics for Clearfield County, out of the total population over 16 years of age (66,993), 55.4% or 37,114 individuals are in the labor force, with 6.0% or 2,227 of them unemployed. The age group with the highest labor force participation rate is 25 to 29 years, with 79.9% or 3,993 individuals in the labor force. Within the labor force, the 16 to 19 years age range has the highest percentage of unemployed individuals, with 15.1% or 262 of them being unemployed.
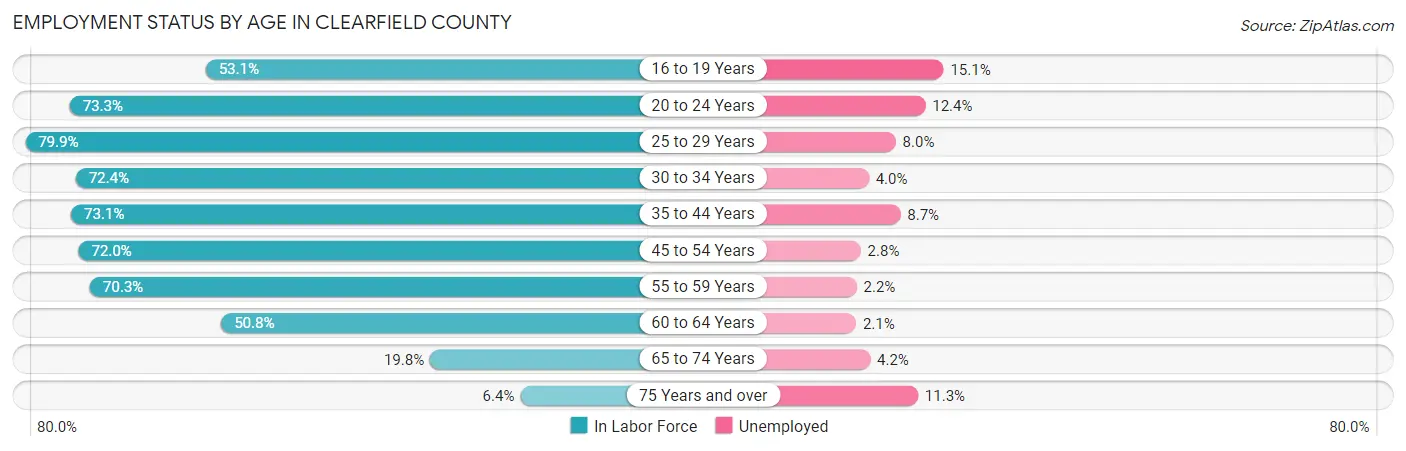
| Age Bracket | In Labor Force | Unemployed |
| 16 to 19 Years | 1,732 (53.1%) | 262 (15.1%) |
| 20 to 24 Years | 3,113 (73.3%) | 386 (12.4%) |
| 25 to 29 Years | 3,993 (79.9%) | 319 (8.0%) |
| 30 to 34 Years | 3,464 (72.4%) | 139 (4.0%) |
| 35 to 44 Years | 7,031 (73.1%) | 612 (8.7%) |
| 45 to 54 Years | 7,970 (72.0%) | 223 (2.8%) |
| 55 to 59 Years | 4,534 (70.3%) | 100 (2.2%) |
| 60 to 64 Years | 2,931 (50.8%) | 62 (2.1%) |
| 65 to 74 Years | 1,910 (19.8%) | 80 (4.2%) |
| 75 Years and over | 458 (6.4%) | 52 (11.3%) |
| Total | 37,114 (55.4%) | 2,227 (6.0%) |
Employment Status by Educational Attainment in Clearfield County
According to labor force statistics for Clearfield County, 70.1% of individuals (29,927) out of the total population between 25 and 64 years of age (42,692) are in the labor force, with 4.9% or 1,466 of them being unemployed. The group with the highest labor force participation rate are those with the educational attainment of bachelor's degree or higher, with 85.3% or 7,606 individuals in the labor force. Within the labor force, individuals with less than high school education have the highest percentage of unemployment, with 8.6% or 130 of them being unemployed.
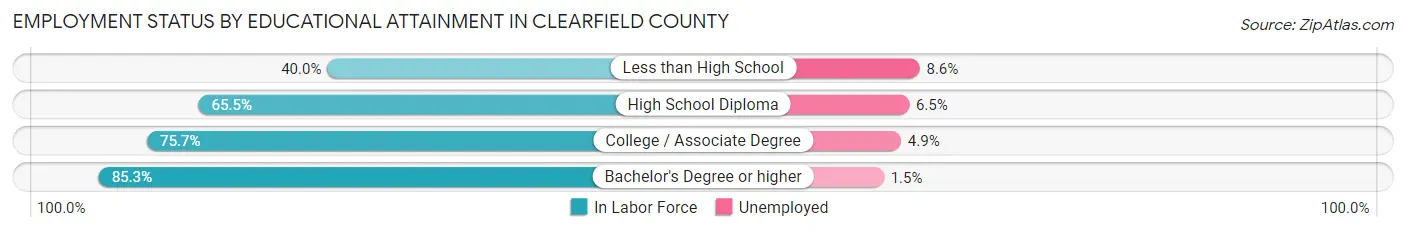
| Educational Attainment | In Labor Force | Unemployed |
| Less than High School | 1,506 (40.0%) | 324 (8.6%) |
| High School Diploma | 12,227 (65.5%) | 1,213 (6.5%) |
| College / Associate Degree | 8,586 (75.7%) | 556 (4.9%) |
| Bachelor's Degree or higher | 7,606 (85.3%) | 134 (1.5%) |
| Total | 29,927 (70.1%) | 2,092 (4.9%) |
Employment Occupations by Sex in Clearfield County
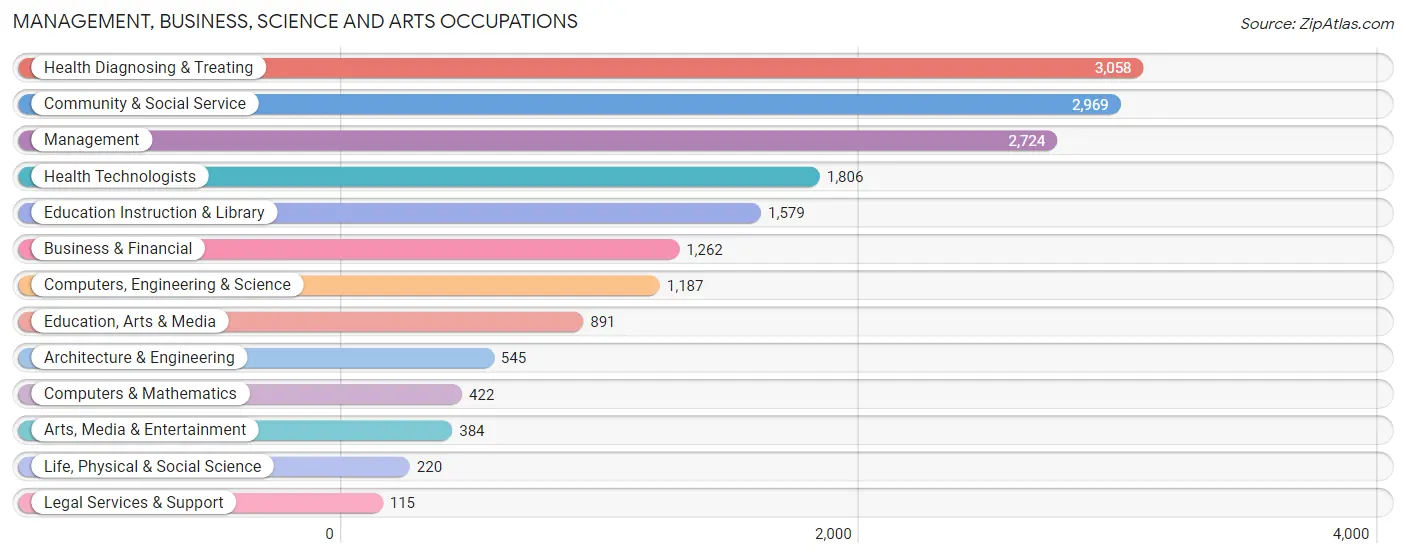
Management, Business, Science and Arts Occupations
The most common Management, Business, Science and Arts occupations in Clearfield County are Health Diagnosing & Treating (3,058 | 8.8%), Community & Social Service (2,969 | 8.5%), Management (2,724 | 7.8%), Health Technologists (1,806 | 5.2%), and Education Instruction & Library (1,579 | 4.5%).
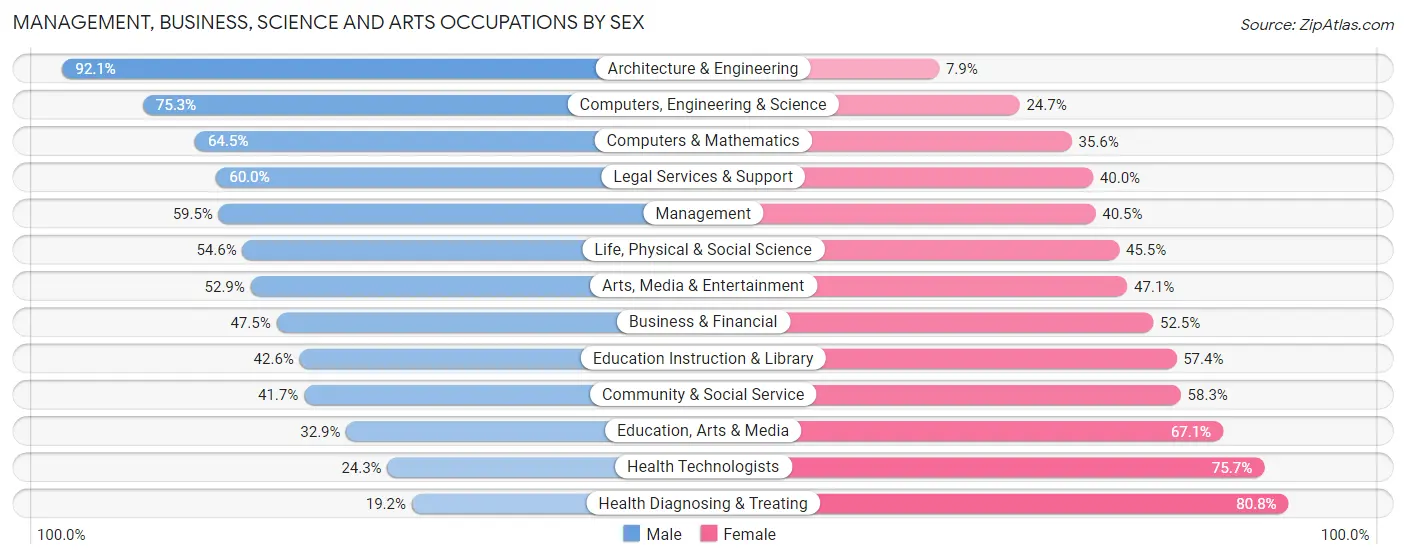
Management, Business, Science and Arts Occupations by Sex
Within the Management, Business, Science and Arts occupations in Clearfield County, the most male-oriented occupations are Architecture & Engineering (92.1%), Computers, Engineering & Science (75.3%), and Computers & Mathematics (64.4%), while the most female-oriented occupations are Health Diagnosing & Treating (80.8%), Health Technologists (75.7%), and Education, Arts & Media (67.1%).
| Occupation | Male | Female |
| Management | 1,621 (59.5%) | 1,103 (40.5%) |
| Business & Financial | 599 (47.5%) | 663 (52.5%) |
| Computers, Engineering & Science | 894 (75.3%) | 293 (24.7%) |
| Computers & Mathematics | 272 (64.4%) | 150 (35.5%) |
| Architecture & Engineering | 502 (92.1%) | 43 (7.9%) |
| Life, Physical & Social Science | 120 (54.5%) | 100 (45.5%) |
| Community & Social Service | 1,238 (41.7%) | 1,731 (58.3%) |
| Education, Arts & Media | 293 (32.9%) | 598 (67.1%) |
| Legal Services & Support | 69 (60.0%) | 46 (40.0%) |
| Education Instruction & Library | 673 (42.6%) | 906 (57.4%) |
| Arts, Media & Entertainment | 203 (52.9%) | 181 (47.1%) |
| Health Diagnosing & Treating | 588 (19.2%) | 2,470 (80.8%) |
| Health Technologists | 439 (24.3%) | 1,367 (75.7%) |
| Total (Category) | 4,940 (44.1%) | 6,260 (55.9%) |
| Total (Overall) | 19,267 (55.3%) | 15,594 (44.7%) |
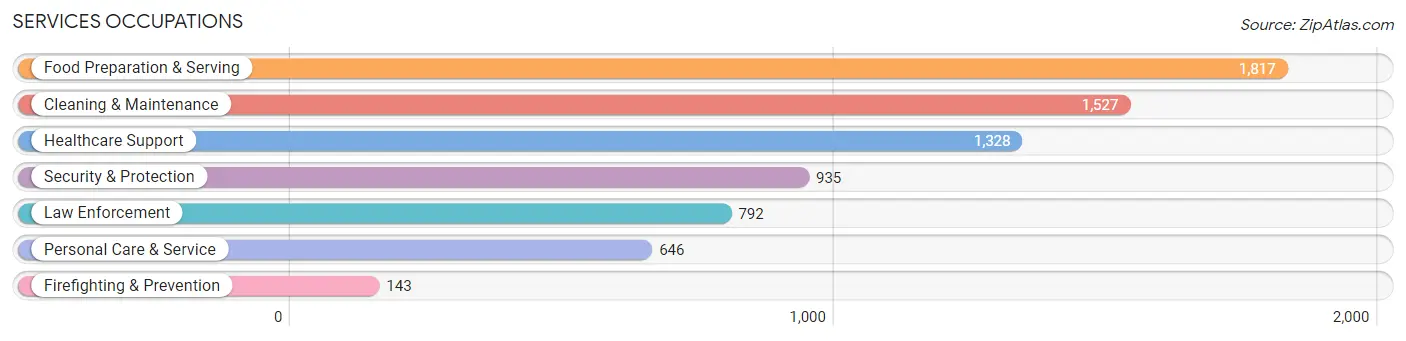
Services Occupations
The most common Services occupations in Clearfield County are Food Preparation & Serving (1,817 | 5.2%), Cleaning & Maintenance (1,527 | 4.4%), Healthcare Support (1,328 | 3.8%), Security & Protection (935 | 2.7%), and Law Enforcement (792 | 2.3%).
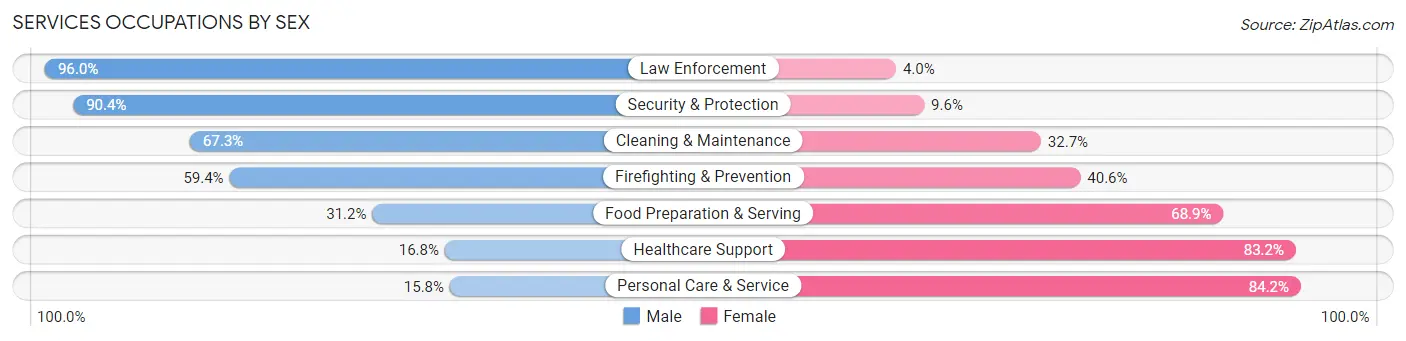
Services Occupations by Sex
Within the Services occupations in Clearfield County, the most male-oriented occupations are Law Enforcement (96.0%), Security & Protection (90.4%), and Cleaning & Maintenance (67.3%), while the most female-oriented occupations are Personal Care & Service (84.2%), Healthcare Support (83.2%), and Food Preparation & Serving (68.9%).
| Occupation | Male | Female |
| Healthcare Support | 223 (16.8%) | 1,105 (83.2%) |
| Security & Protection | 845 (90.4%) | 90 (9.6%) |
| Firefighting & Prevention | 85 (59.4%) | 58 (40.6%) |
| Law Enforcement | 760 (96.0%) | 32 (4.0%) |
| Food Preparation & Serving | 566 (31.1%) | 1,251 (68.9%) |
| Cleaning & Maintenance | 1,027 (67.3%) | 500 (32.7%) |
| Personal Care & Service | 102 (15.8%) | 544 (84.2%) |
| Total (Category) | 2,763 (44.2%) | 3,490 (55.8%) |
| Total (Overall) | 19,267 (55.3%) | 15,594 (44.7%) |
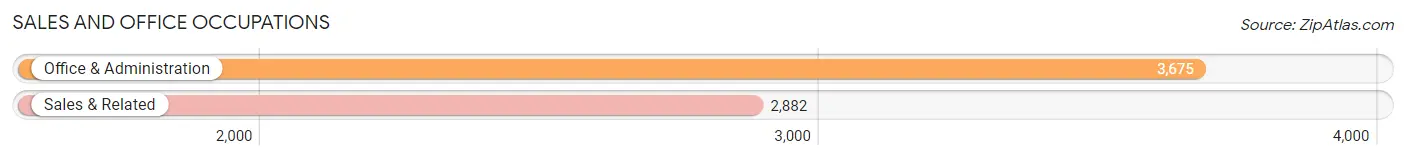
Sales and Office Occupations
The most common Sales and Office occupations in Clearfield County are Office & Administration (3,675 | 10.5%), and Sales & Related (2,882 | 8.3%).
Sales and Office Occupations by Sex
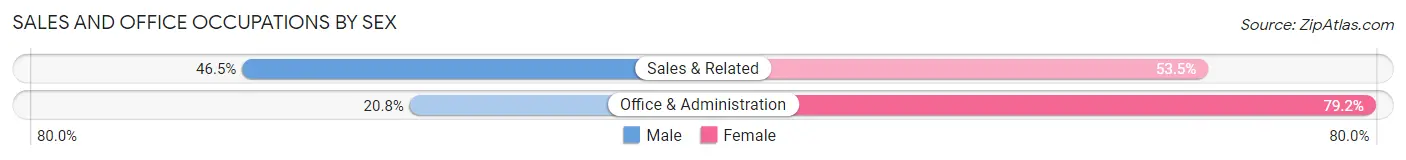
| Occupation | Male | Female |
| Sales & Related | 1,341 (46.5%) | 1,541 (53.5%) |
| Office & Administration | 763 (20.8%) | 2,912 (79.2%) |
| Total (Category) | 2,104 (32.1%) | 4,453 (67.9%) |
| Total (Overall) | 19,267 (55.3%) | 15,594 (44.7%) |
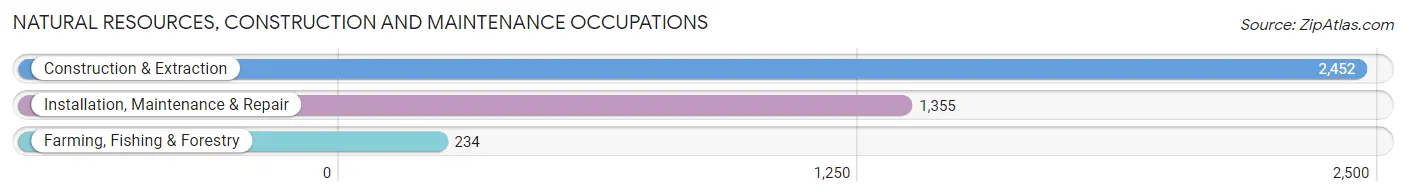
Natural Resources, Construction and Maintenance Occupations
The most common Natural Resources, Construction and Maintenance occupations in Clearfield County are Construction & Extraction (2,452 | 7.0%), Installation, Maintenance & Repair (1,355 | 3.9%), and Farming, Fishing & Forestry (234 | 0.7%).
Natural Resources, Construction and Maintenance Occupations by Sex
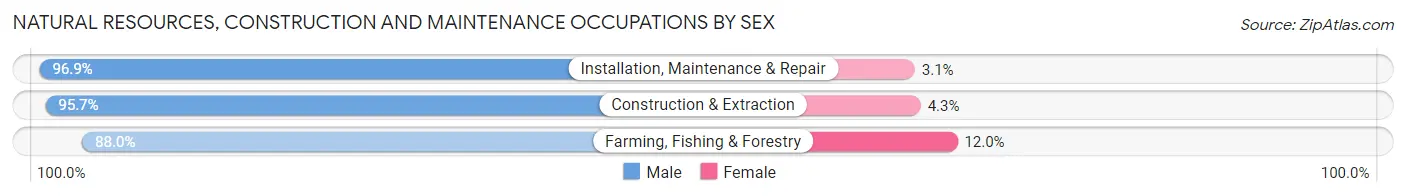
| Occupation | Male | Female |
| Farming, Fishing & Forestry | 206 (88.0%) | 28 (12.0%) |
| Construction & Extraction | 2,346 (95.7%) | 106 (4.3%) |
| Installation, Maintenance & Repair | 1,313 (96.9%) | 42 (3.1%) |
| Total (Category) | 3,865 (95.6%) | 176 (4.4%) |
| Total (Overall) | 19,267 (55.3%) | 15,594 (44.7%) |
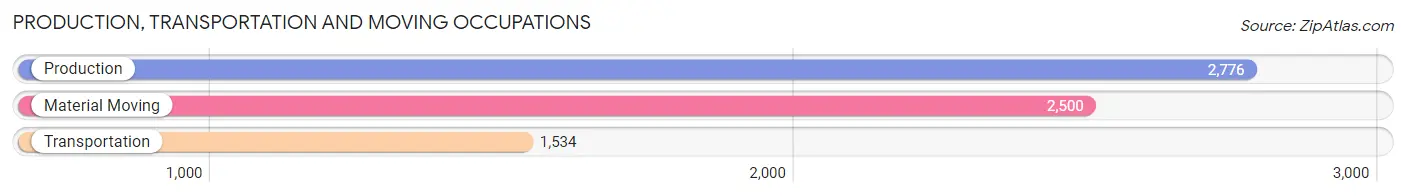
Production, Transportation and Moving Occupations
The most common Production, Transportation and Moving occupations in Clearfield County are Production (2,776 | 8.0%), Material Moving (2,500 | 7.2%), and Transportation (1,534 | 4.4%).
Production, Transportation and Moving Occupations by Sex
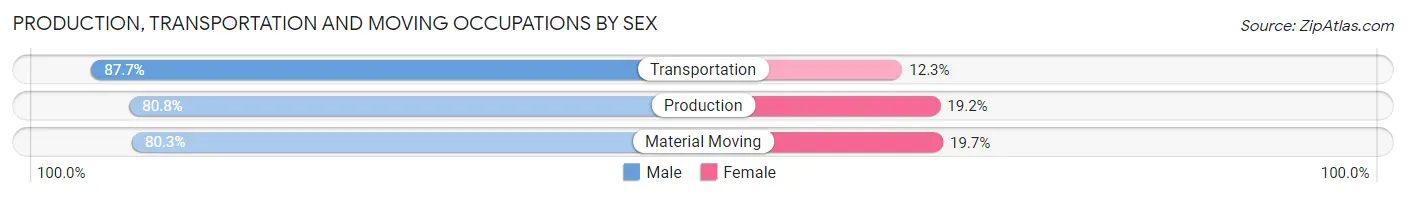
| Occupation | Male | Female |
| Production | 2,242 (80.8%) | 534 (19.2%) |
| Transportation | 1,346 (87.7%) | 188 (12.3%) |
| Material Moving | 2,007 (80.3%) | 493 (19.7%) |
| Total (Category) | 5,595 (82.2%) | 1,215 (17.8%) |
| Total (Overall) | 19,267 (55.3%) | 15,594 (44.7%) |
Employment Industries by Sex in Clearfield County
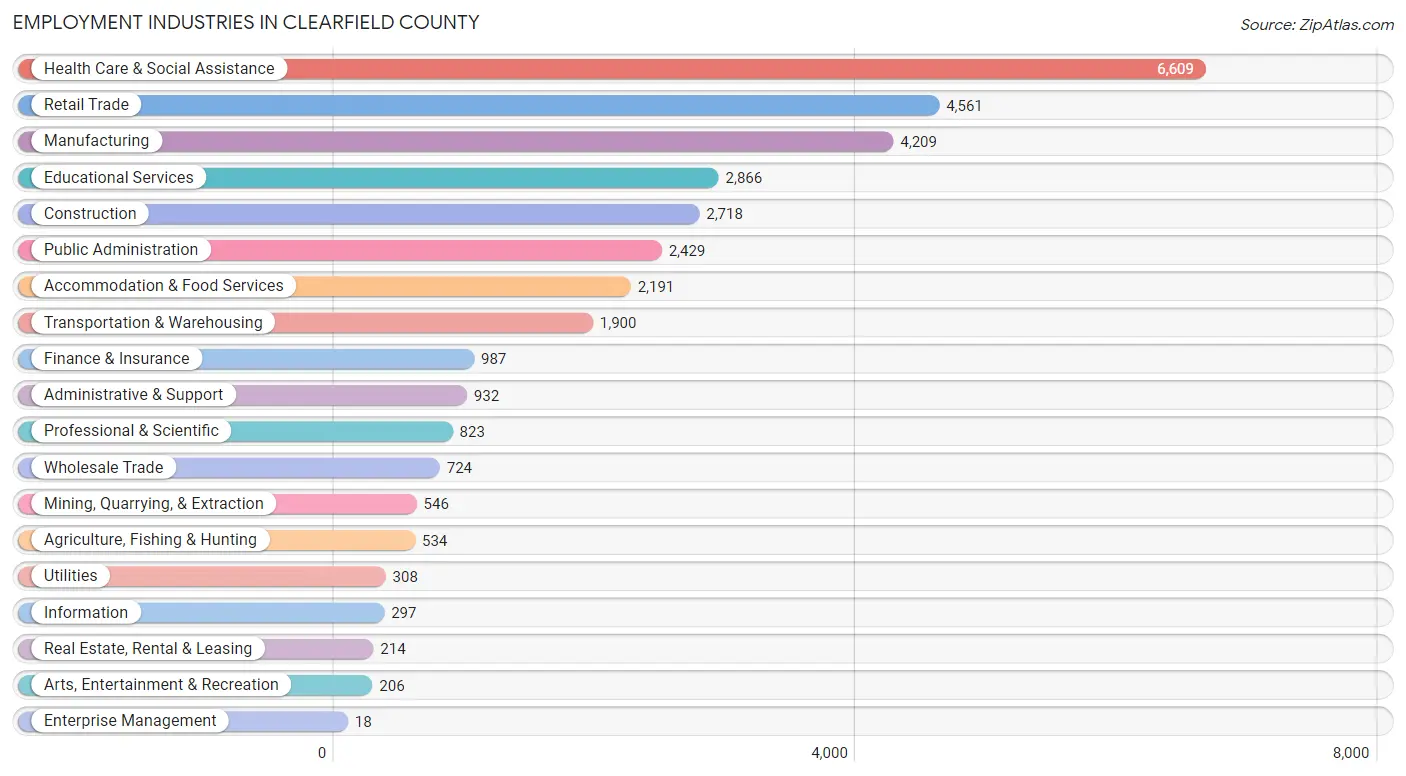
Employment Industries in Clearfield County
The major employment industries in Clearfield County include Health Care & Social Assistance (6,609 | 19.0%), Retail Trade (4,561 | 13.1%), Manufacturing (4,209 | 12.1%), Educational Services (2,866 | 8.2%), and Construction (2,718 | 7.8%).
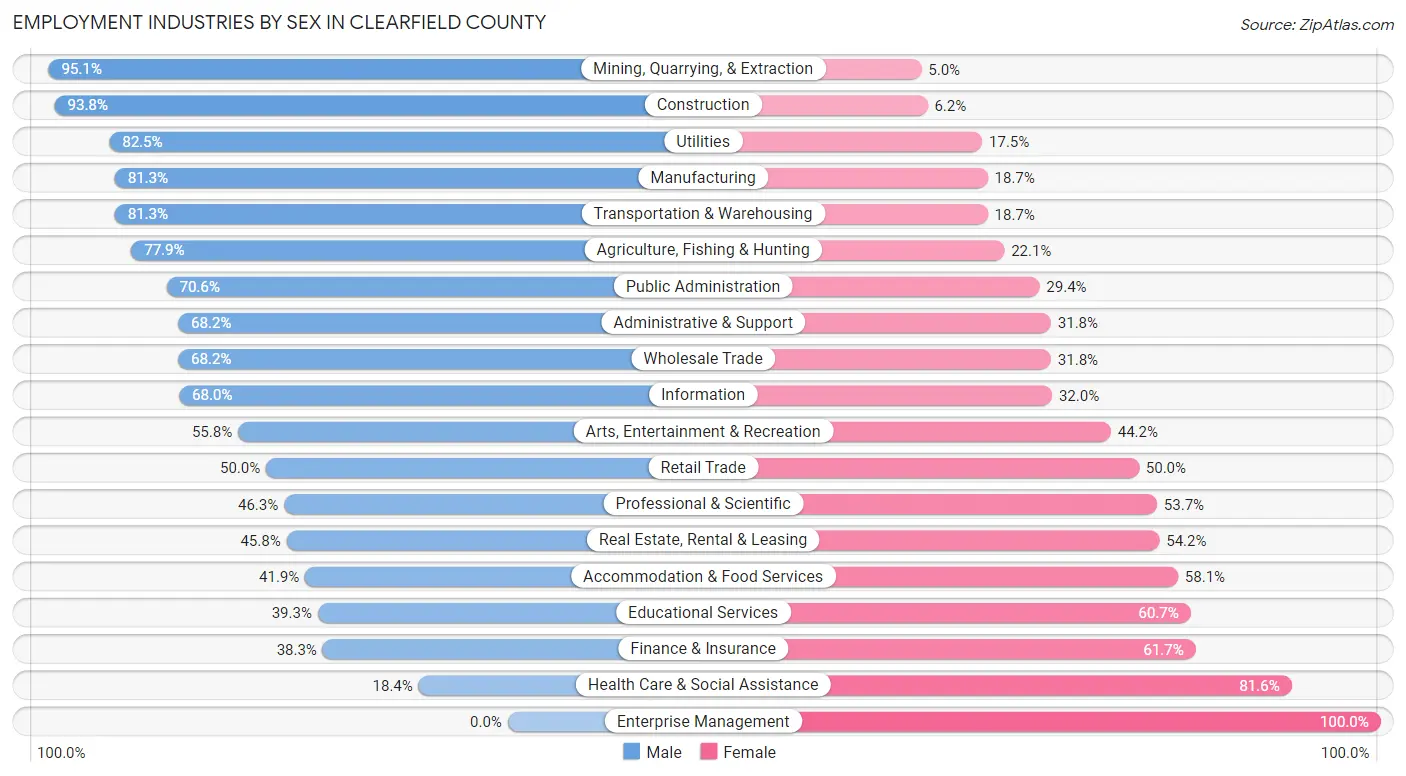
Employment Industries by Sex in Clearfield County
The Clearfield County industries that see more men than women are Mining, Quarrying, & Extraction (95.1%), Construction (93.8%), and Utilities (82.5%), whereas the industries that tend to have a higher number of women are Enterprise Management (100.0%), Health Care & Social Assistance (81.6%), and Finance & Insurance (61.7%).
| Industry | Male | Female |
| Agriculture, Fishing & Hunting | 416 (77.9%) | 118 (22.1%) |
| Mining, Quarrying, & Extraction | 519 (95.1%) | 27 (5.0%) |
| Construction | 2,549 (93.8%) | 169 (6.2%) |
| Manufacturing | 3,423 (81.3%) | 786 (18.7%) |
| Wholesale Trade | 494 (68.2%) | 230 (31.8%) |
| Retail Trade | 2,282 (50.0%) | 2,279 (50.0%) |
| Transportation & Warehousing | 1,545 (81.3%) | 355 (18.7%) |
| Utilities | 254 (82.5%) | 54 (17.5%) |
| Information | 202 (68.0%) | 95 (32.0%) |
| Finance & Insurance | 378 (38.3%) | 609 (61.7%) |
| Real Estate, Rental & Leasing | 98 (45.8%) | 116 (54.2%) |
| Professional & Scientific | 381 (46.3%) | 442 (53.7%) |
| Enterprise Management | 0 (0.0%) | 18 (100.0%) |
| Administrative & Support | 636 (68.2%) | 296 (31.8%) |
| Educational Services | 1,127 (39.3%) | 1,739 (60.7%) |
| Health Care & Social Assistance | 1,219 (18.4%) | 5,390 (81.6%) |
| Arts, Entertainment & Recreation | 115 (55.8%) | 91 (44.2%) |
| Accommodation & Food Services | 919 (41.9%) | 1,272 (58.1%) |
| Public Administration | 1,715 (70.6%) | 714 (29.4%) |
| Total | 19,267 (55.3%) | 15,594 (44.7%) |
Education in Clearfield County
School Enrollment in Clearfield County
The most common levels of schooling among the 13,935 students in Clearfield County are high school (3,541 | 25.4%), middle school (3,074 | 22.1%), and elementary school (2,867 | 20.6%).
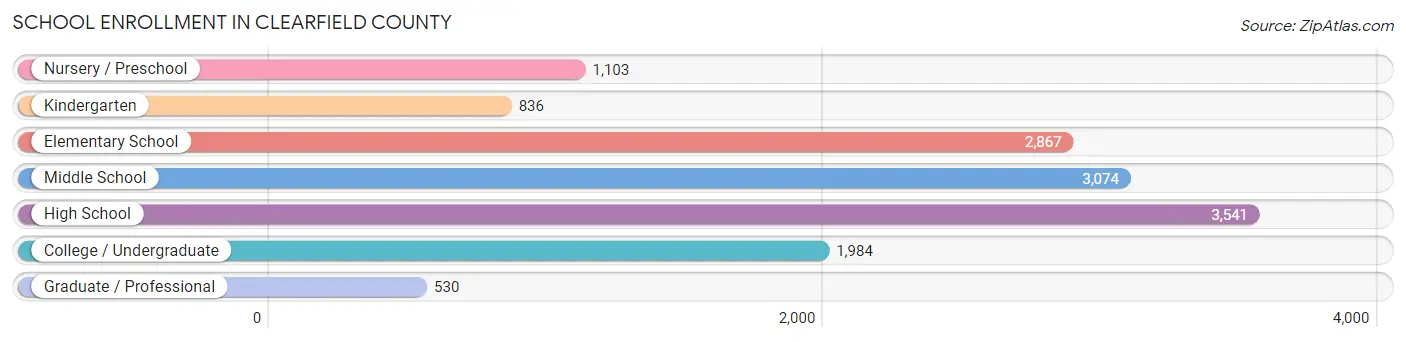
| School Level | # Students | % Students |
| Nursery / Preschool | 1,103 | 7.9% |
| Kindergarten | 836 | 6.0% |
| Elementary School | 2,867 | 20.6% |
| Middle School | 3,074 | 22.1% |
| High School | 3,541 | 25.4% |
| College / Undergraduate | 1,984 | 14.2% |
| Graduate / Professional | 530 | 3.8% |
| Total | 13,935 | 100.0% |
School Enrollment by Age by Funding Source in Clearfield County
Out of a total of 13,935 students who are enrolled in schools in Clearfield County, 2,104 (15.1%) attend a private institution, while the remaining 11,831 (84.9%) are enrolled in public schools. The age group of 3 to 4 year olds has the highest likelihood of being enrolled in private schools, with 291 (43.8% in the age bracket) enrolled. Conversely, the age group of 20 to 24 year olds has the lowest likelihood of being enrolled in a private school, with 968 (91.1% in the age bracket) attending a public institution.
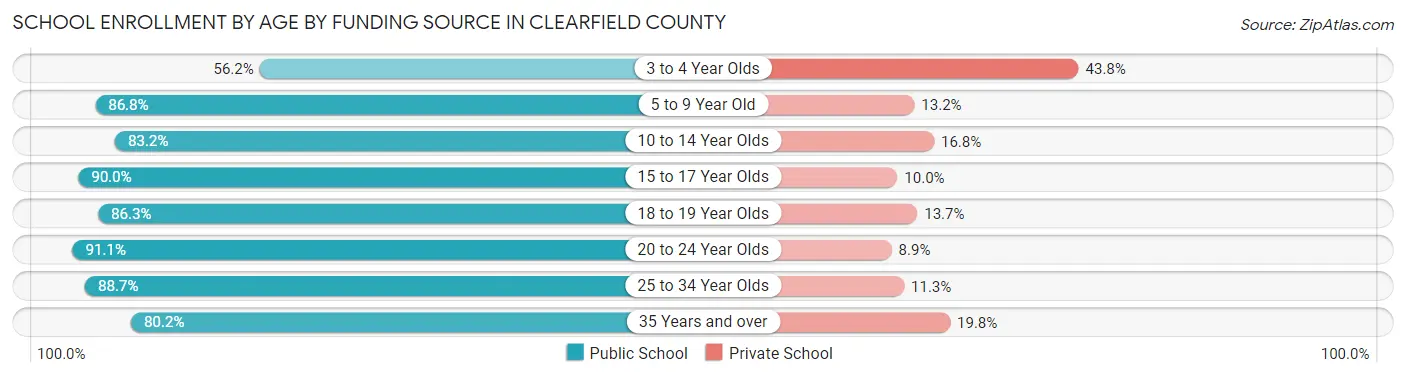
| Age Bracket | Public School | Private School |
| 3 to 4 Year Olds | 374 (56.2%) | 291 (43.8%) |
| 5 to 9 Year Old | 3,143 (86.8%) | 477 (13.2%) |
| 10 to 14 Year Olds | 3,324 (83.2%) | 673 (16.8%) |
| 15 to 17 Year Olds | 2,328 (90.0%) | 259 (10.0%) |
| 18 to 19 Year Olds | 787 (86.3%) | 125 (13.7%) |
| 20 to 24 Year Olds | 968 (91.1%) | 95 (8.9%) |
| 25 to 34 Year Olds | 386 (88.7%) | 49 (11.3%) |
| 35 Years and over | 526 (80.2%) | 130 (19.8%) |
| Total | 11,831 (84.9%) | 2,104 (15.1%) |
Educational Attainment by Field of Study in Clearfield County
Education (2,583 | 21.2%), business (1,699 | 14.0%), science & technology (1,498 | 12.3%), engineering (1,000 | 8.2%), and arts & humanities (997 | 8.2%) are the most common fields of study among 12,161 individuals in Clearfield County who have obtained a bachelor's degree or higher.
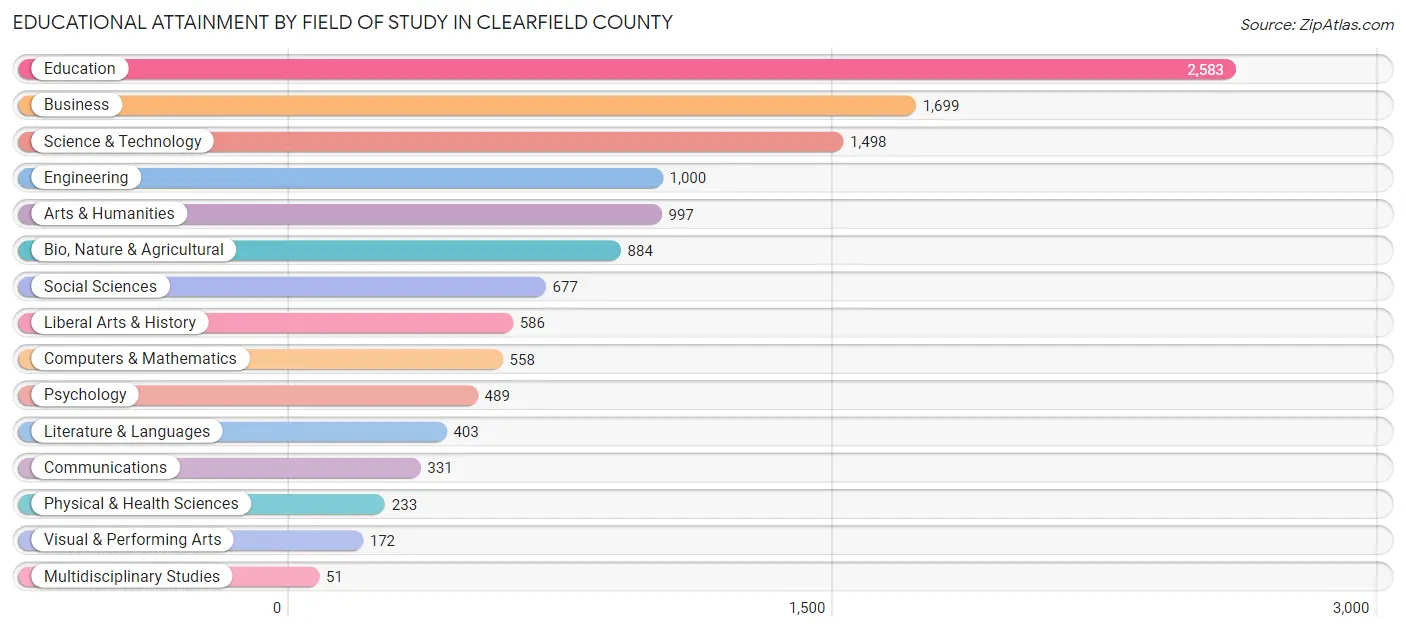
| Field of Study | # Graduates | % Graduates |
| Computers & Mathematics | 558 | 4.6% |
| Bio, Nature & Agricultural | 884 | 7.3% |
| Physical & Health Sciences | 233 | 1.9% |
| Psychology | 489 | 4.0% |
| Social Sciences | 677 | 5.6% |
| Engineering | 1,000 | 8.2% |
| Multidisciplinary Studies | 51 | 0.4% |
| Science & Technology | 1,498 | 12.3% |
| Business | 1,699 | 14.0% |
| Education | 2,583 | 21.2% |
| Literature & Languages | 403 | 3.3% |
| Liberal Arts & History | 586 | 4.8% |
| Visual & Performing Arts | 172 | 1.4% |
| Communications | 331 | 2.7% |
| Arts & Humanities | 997 | 8.2% |
| Total | 12,161 | 100.0% |
Transportation & Commute in Clearfield County
Vehicle Availability by Sex in Clearfield County
The most prevalent vehicle ownership categories in Clearfield County are males with 2 vehicles (7,809, accounting for 41.3%) and females with 2 vehicles (6,114, making up 51.1%).
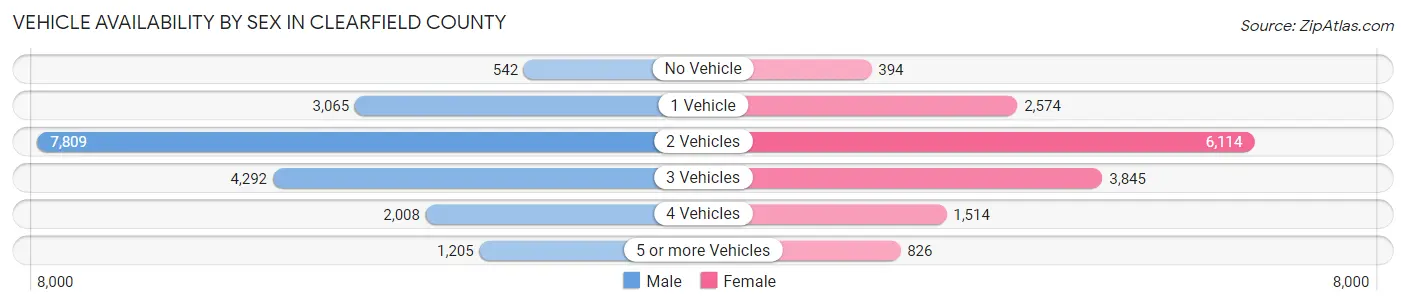
| Vehicles Available | Male | Female |
| No Vehicle | 542 (2.9%) | 394 (2.6%) |
| 1 Vehicle | 3,065 (16.2%) | 2,574 (16.9%) |
| 2 Vehicles | 7,809 (41.3%) | 6,114 (40.1%) |
| 3 Vehicles | 4,292 (22.7%) | 3,845 (25.2%) |
| 4 Vehicles | 2,008 (10.6%) | 1,514 (9.9%) |
| 5 or more Vehicles | 1,205 (6.4%) | 826 (5.4%) |
| Total | 18,921 (100.0%) | 15,267 (100.0%) |
Commute Time in Clearfield County
The most frequently occuring commute durations in Clearfield County are 5 to 9 minutes (5,122 commuters, 16.0%), 15 to 19 minutes (4,712 commuters, 14.7%), and 10 to 14 minutes (4,580 commuters, 14.3%).
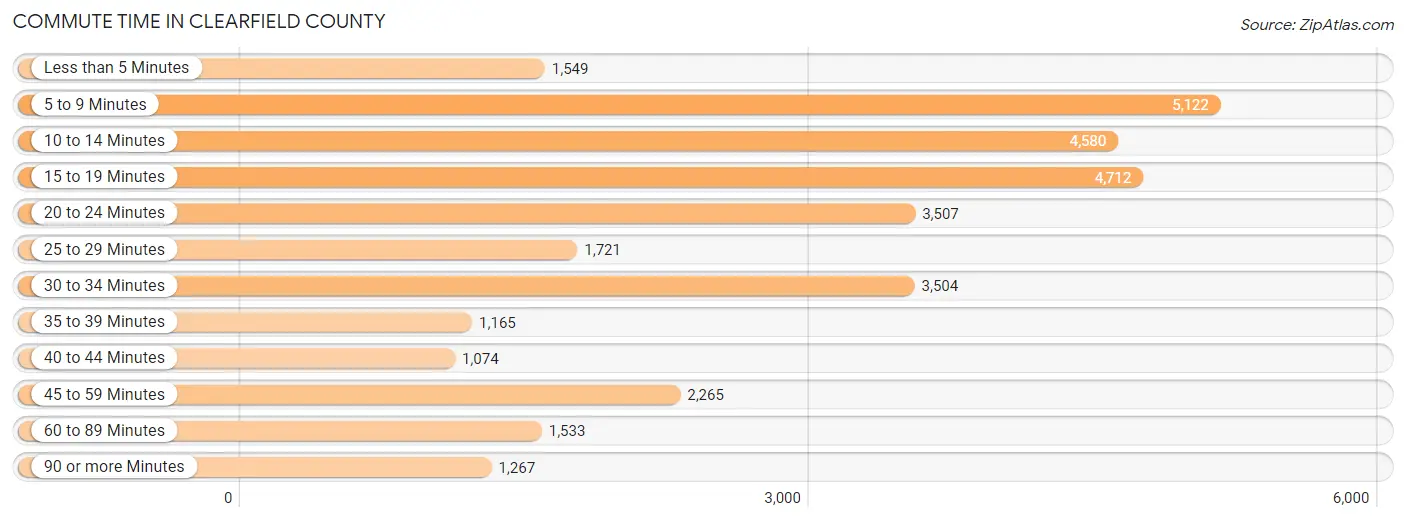
| Commute Time | # Commuters | % Commuters |
| Less than 5 Minutes | 1,549 | 4.8% |
| 5 to 9 Minutes | 5,122 | 16.0% |
| 10 to 14 Minutes | 4,580 | 14.3% |
| 15 to 19 Minutes | 4,712 | 14.7% |
| 20 to 24 Minutes | 3,507 | 11.0% |
| 25 to 29 Minutes | 1,721 | 5.4% |
| 30 to 34 Minutes | 3,504 | 11.0% |
| 35 to 39 Minutes | 1,165 | 3.6% |
| 40 to 44 Minutes | 1,074 | 3.4% |
| 45 to 59 Minutes | 2,265 | 7.1% |
| 60 to 89 Minutes | 1,533 | 4.8% |
| 90 or more Minutes | 1,267 | 4.0% |
Commute Time by Sex in Clearfield County
The most common commute times in Clearfield County are 15 to 19 minutes (2,822 commuters, 15.7%) for males and 5 to 9 minutes (2,777 commuters, 19.8%) for females.
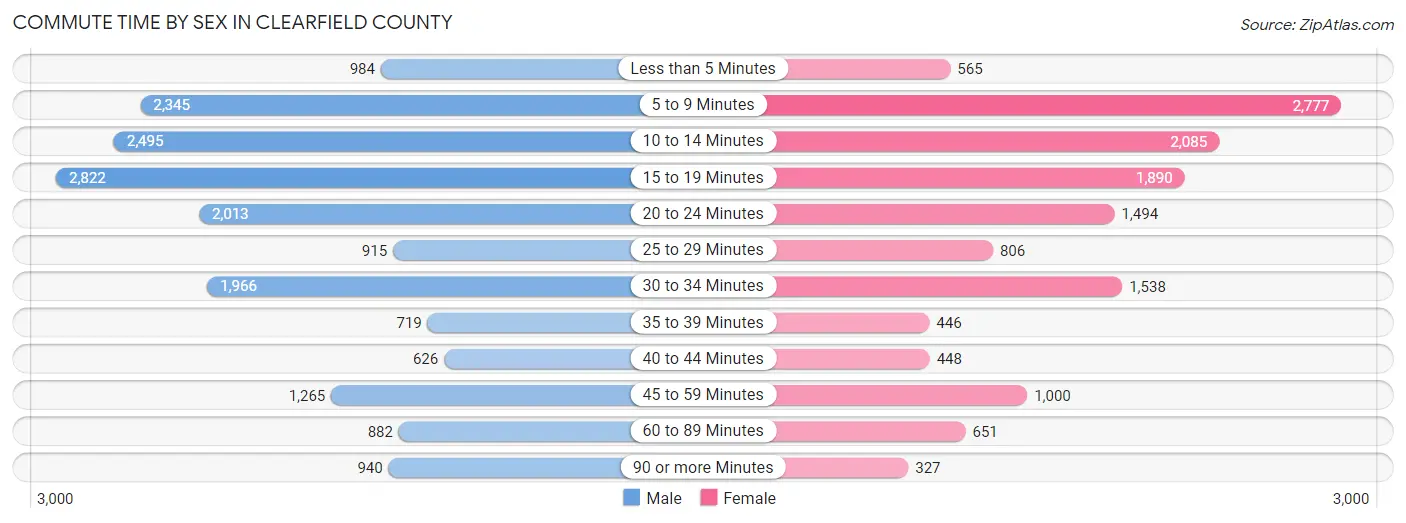
| Commute Time | Male | Female |
| Less than 5 Minutes | 984 (5.5%) | 565 (4.0%) |
| 5 to 9 Minutes | 2,345 (13.1%) | 2,777 (19.8%) |
| 10 to 14 Minutes | 2,495 (13.9%) | 2,085 (14.9%) |
| 15 to 19 Minutes | 2,822 (15.7%) | 1,890 (13.5%) |
| 20 to 24 Minutes | 2,013 (11.2%) | 1,494 (10.6%) |
| 25 to 29 Minutes | 915 (5.1%) | 806 (5.8%) |
| 30 to 34 Minutes | 1,966 (10.9%) | 1,538 (11.0%) |
| 35 to 39 Minutes | 719 (4.0%) | 446 (3.2%) |
| 40 to 44 Minutes | 626 (3.5%) | 448 (3.2%) |
| 45 to 59 Minutes | 1,265 (7.0%) | 1,000 (7.1%) |
| 60 to 89 Minutes | 882 (4.9%) | 651 (4.6%) |
| 90 or more Minutes | 940 (5.2%) | 327 (2.3%) |
Time of Departure to Work by Sex in Clearfield County
The most frequent times of departure to work in Clearfield County are 12:00 AM to 4:59 AM (2,153, 12.0%) for males and 7:30 AM to 7:59 AM (2,148, 15.3%) for females.
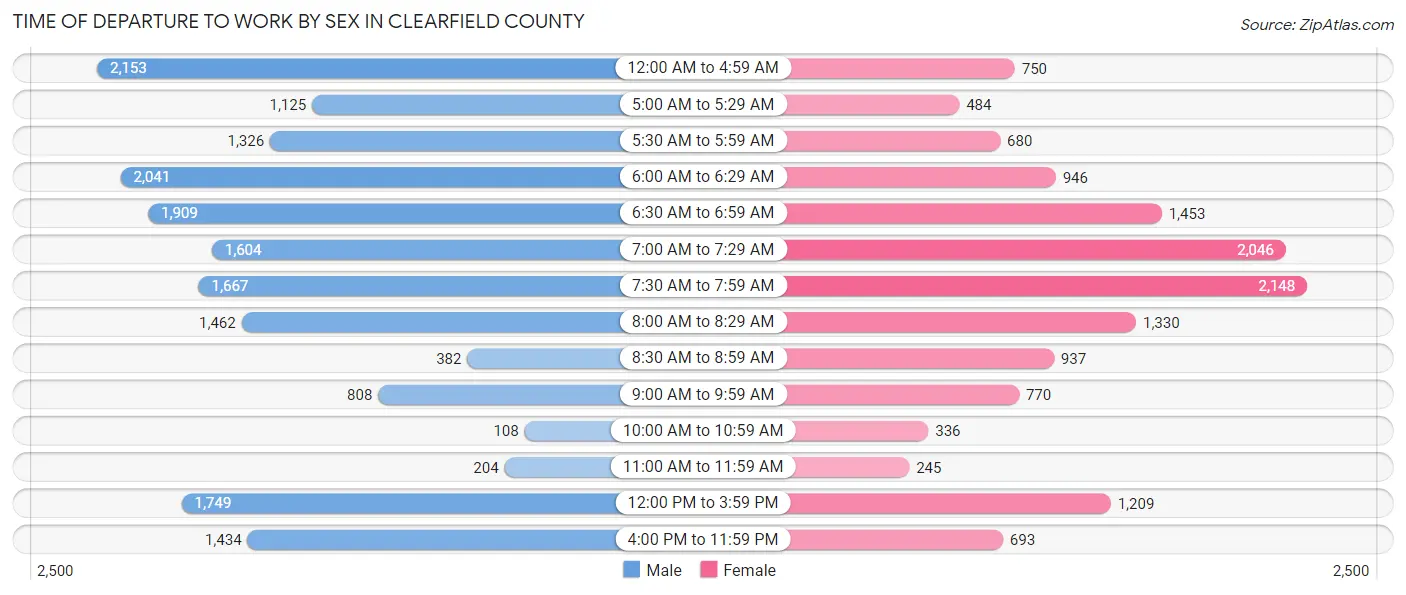
| Time of Departure | Male | Female |
| 12:00 AM to 4:59 AM | 2,153 (12.0%) | 750 (5.3%) |
| 5:00 AM to 5:29 AM | 1,125 (6.3%) | 484 (3.5%) |
| 5:30 AM to 5:59 AM | 1,326 (7.4%) | 680 (4.9%) |
| 6:00 AM to 6:29 AM | 2,041 (11.4%) | 946 (6.7%) |
| 6:30 AM to 6:59 AM | 1,909 (10.6%) | 1,453 (10.4%) |
| 7:00 AM to 7:29 AM | 1,604 (8.9%) | 2,046 (14.6%) |
| 7:30 AM to 7:59 AM | 1,667 (9.3%) | 2,148 (15.3%) |
| 8:00 AM to 8:29 AM | 1,462 (8.1%) | 1,330 (9.5%) |
| 8:30 AM to 8:59 AM | 382 (2.1%) | 937 (6.7%) |
| 9:00 AM to 9:59 AM | 808 (4.5%) | 770 (5.5%) |
| 10:00 AM to 10:59 AM | 108 (0.6%) | 336 (2.4%) |
| 11:00 AM to 11:59 AM | 204 (1.1%) | 245 (1.8%) |
| 12:00 PM to 3:59 PM | 1,749 (9.7%) | 1,209 (8.6%) |
| 4:00 PM to 11:59 PM | 1,434 (8.0%) | 693 (4.9%) |
| Total | 17,972 (100.0%) | 14,027 (100.0%) |
Housing Occupancy in Clearfield County
Occupancy by Ownership in Clearfield County
Of the total 31,741 dwellings in Clearfield County, owner-occupied units account for 24,695 (77.8%), while renter-occupied units make up 7,046 (22.2%).
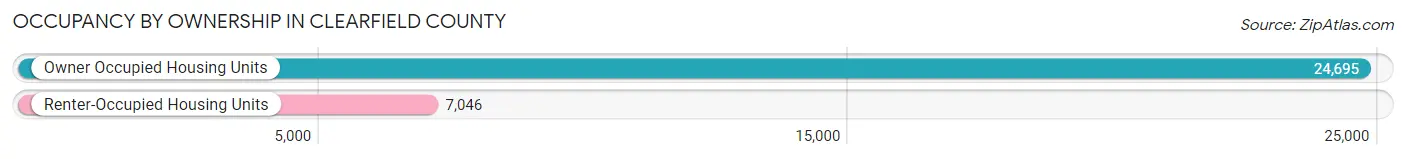
| Occupancy | # Housing Units | % Housing Units |
| Owner Occupied Housing Units | 24,695 | 77.8% |
| Renter-Occupied Housing Units | 7,046 | 22.2% |
| Total Occupied Housing Units | 31,741 | 100.0% |
Occupancy by Household Size in Clearfield County
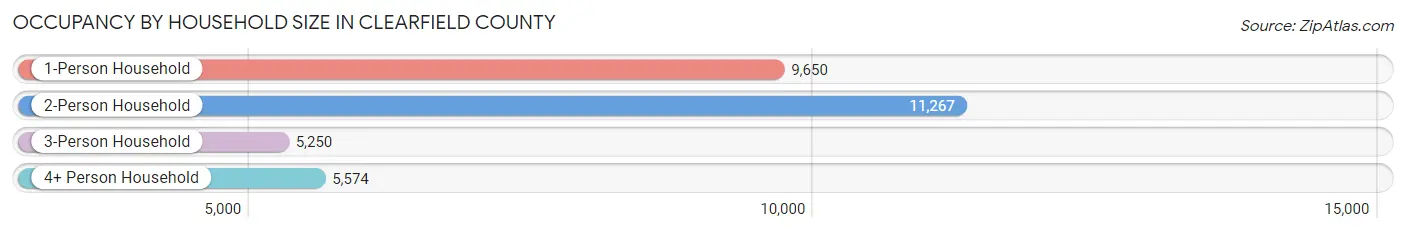
| Household Size | # Housing Units | % Housing Units |
| 1-Person Household | 9,650 | 30.4% |
| 2-Person Household | 11,267 | 35.5% |
| 3-Person Household | 5,250 | 16.5% |
| 4+ Person Household | 5,574 | 17.6% |
| Total Housing Units | 31,741 | 100.0% |
Occupancy by Ownership by Household Size in Clearfield County
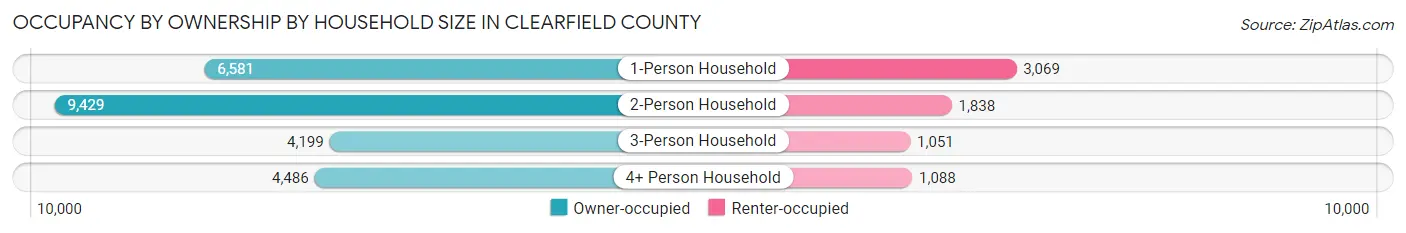
| Household Size | Owner-occupied | Renter-occupied |
| 1-Person Household | 6,581 (68.2%) | 3,069 (31.8%) |
| 2-Person Household | 9,429 (83.7%) | 1,838 (16.3%) |
| 3-Person Household | 4,199 (80.0%) | 1,051 (20.0%) |
| 4+ Person Household | 4,486 (80.5%) | 1,088 (19.5%) |
| Total Housing Units | 24,695 (77.8%) | 7,046 (22.2%) |
Occupancy by Educational Attainment in Clearfield County
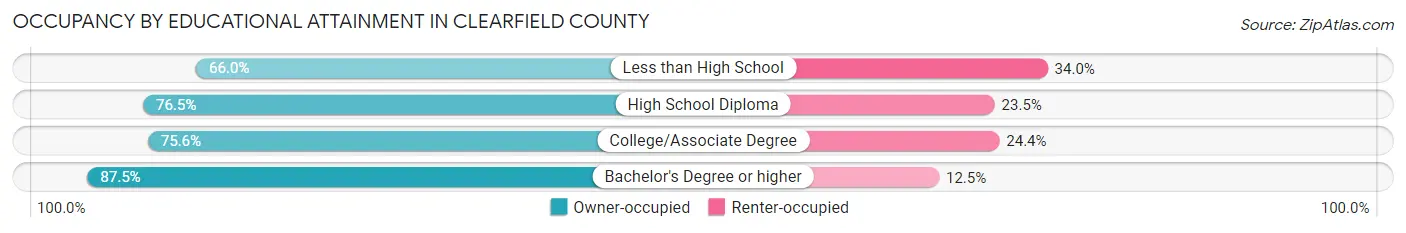
| Household Size | Owner-occupied | Renter-occupied |
| Less than High School | 1,594 (66.0%) | 821 (34.0%) |
| High School Diploma | 11,338 (76.5%) | 3,481 (23.5%) |
| College/Associate Degree | 5,910 (75.6%) | 1,911 (24.4%) |
| Bachelor's Degree or higher | 5,853 (87.5%) | 833 (12.5%) |
Occupancy by Age of Householder in Clearfield County
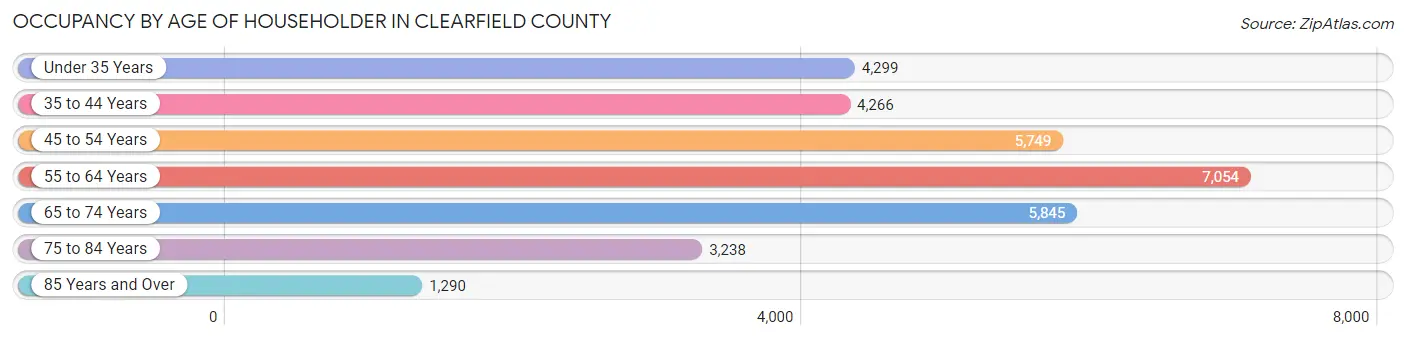
| Age Bracket | # Households | % Households |
| Under 35 Years | 4,299 | 13.5% |
| 35 to 44 Years | 4,266 | 13.4% |
| 45 to 54 Years | 5,749 | 18.1% |
| 55 to 64 Years | 7,054 | 22.2% |
| 65 to 74 Years | 5,845 | 18.4% |
| 75 to 84 Years | 3,238 | 10.2% |
| 85 Years and Over | 1,290 | 4.1% |
| Total | 31,741 | 100.0% |
Housing Finances in Clearfield County
Median Income by Occupancy in Clearfield County
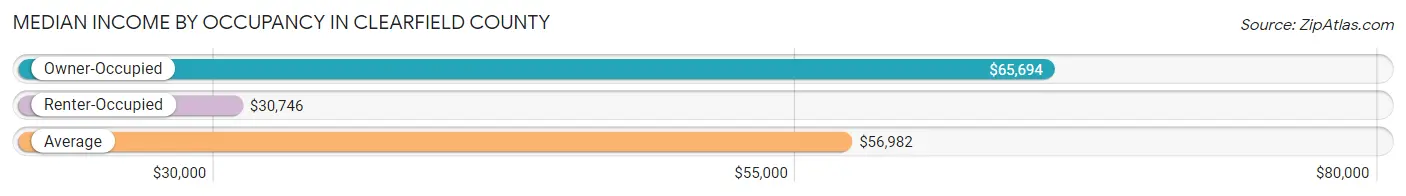
| Occupancy Type | # Households | Median Income |
| Owner-Occupied | 24,695 (77.8%) | $65,694 |
| Renter-Occupied | 7,046 (22.2%) | $30,746 |
| Average | 31,741 (100.0%) | $56,982 |
Occupancy by Householder Income Bracket in Clearfield County
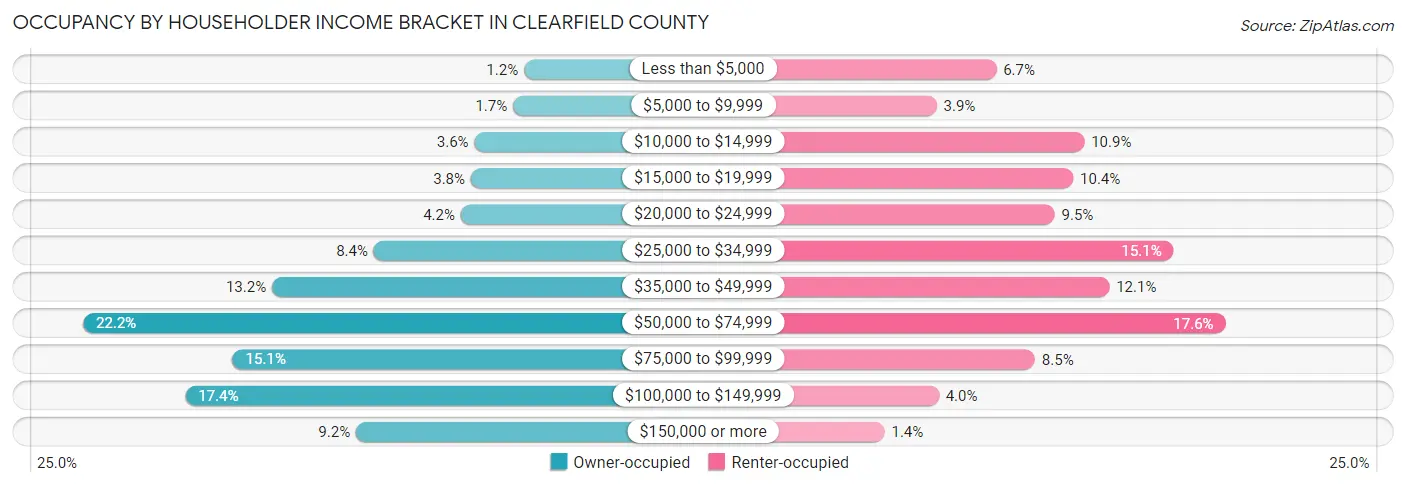
| Income Bracket | Owner-occupied | Renter-occupied |
| Less than $5,000 | 302 (1.2%) | 472 (6.7%) |
| $5,000 to $9,999 | 430 (1.7%) | 272 (3.9%) |
| $10,000 to $14,999 | 884 (3.6%) | 767 (10.9%) |
| $15,000 to $19,999 | 925 (3.7%) | 730 (10.4%) |
| $20,000 to $24,999 | 1,044 (4.2%) | 668 (9.5%) |
| $25,000 to $34,999 | 2,066 (8.4%) | 1,067 (15.1%) |
| $35,000 to $49,999 | 3,265 (13.2%) | 851 (12.1%) |
| $50,000 to $74,999 | 5,487 (22.2%) | 1,241 (17.6%) |
| $75,000 to $99,999 | 3,730 (15.1%) | 602 (8.5%) |
| $100,000 to $149,999 | 4,284 (17.3%) | 279 (4.0%) |
| $150,000 or more | 2,278 (9.2%) | 97 (1.4%) |
| Total | 24,695 (100.0%) | 7,046 (100.0%) |
Monthly Housing Cost Tiers in Clearfield County
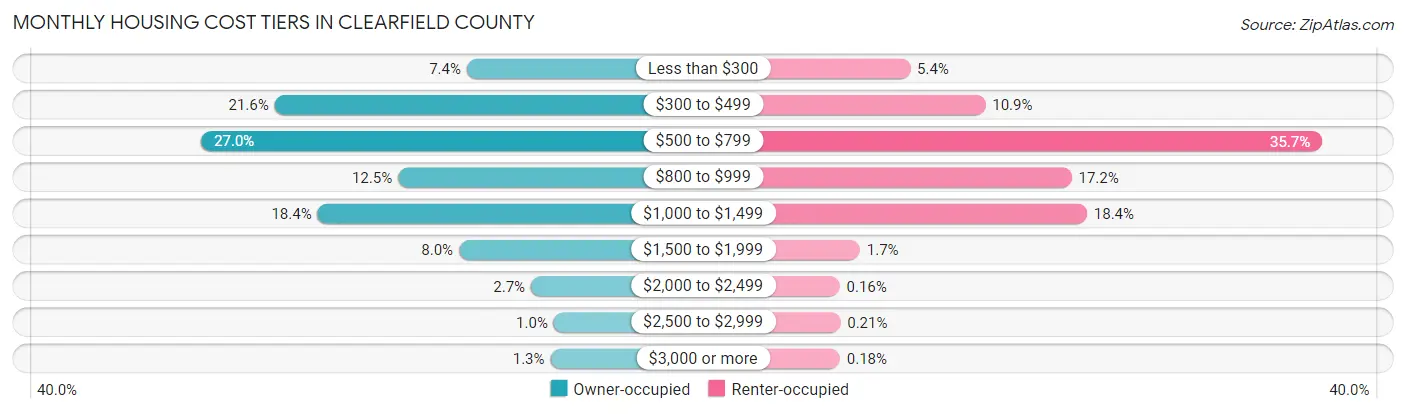
| Monthly Cost | Owner-occupied | Renter-occupied |
| Less than $300 | 1,835 (7.4%) | 377 (5.3%) |
| $300 to $499 | 5,332 (21.6%) | 767 (10.9%) |
| $500 to $799 | 6,671 (27.0%) | 2,515 (35.7%) |
| $800 to $999 | 3,088 (12.5%) | 1,215 (17.2%) |
| $1,000 to $1,499 | 4,552 (18.4%) | 1,294 (18.4%) |
| $1,500 to $1,999 | 1,978 (8.0%) | 116 (1.7%) |
| $2,000 to $2,499 | 669 (2.7%) | 11 (0.2%) |
| $2,500 to $2,999 | 255 (1.0%) | 15 (0.2%) |
| $3,000 or more | 315 (1.3%) | 13 (0.2%) |
| Total | 24,695 (100.0%) | 7,046 (100.0%) |
Physical Housing Characteristics in Clearfield County
Housing Structures in Clearfield County
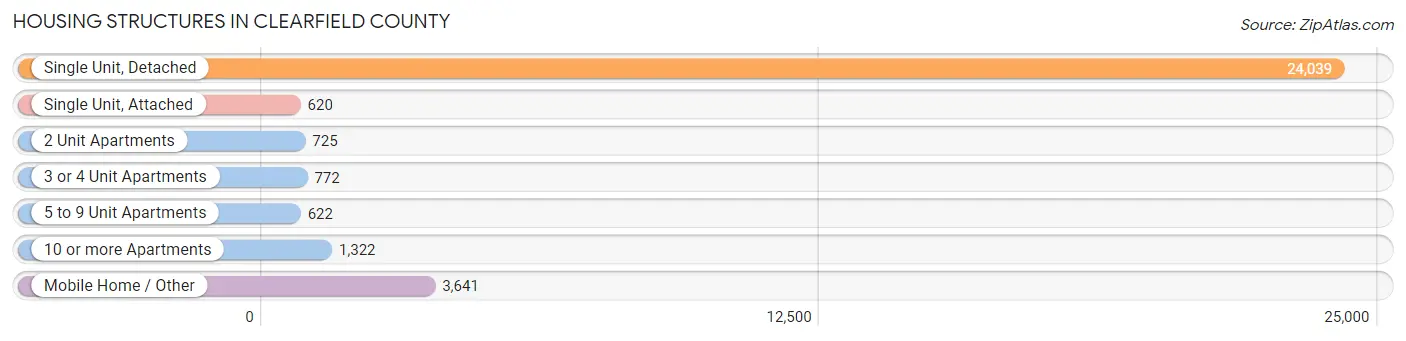
| Structure Type | # Housing Units | % Housing Units |
| Single Unit, Detached | 24,039 | 75.7% |
| Single Unit, Attached | 620 | 1.9% |
| 2 Unit Apartments | 725 | 2.3% |
| 3 or 4 Unit Apartments | 772 | 2.4% |
| 5 to 9 Unit Apartments | 622 | 2.0% |
| 10 or more Apartments | 1,322 | 4.2% |
| Mobile Home / Other | 3,641 | 11.5% |
| Total | 31,741 | 100.0% |
Housing Structures by Occupancy in Clearfield County
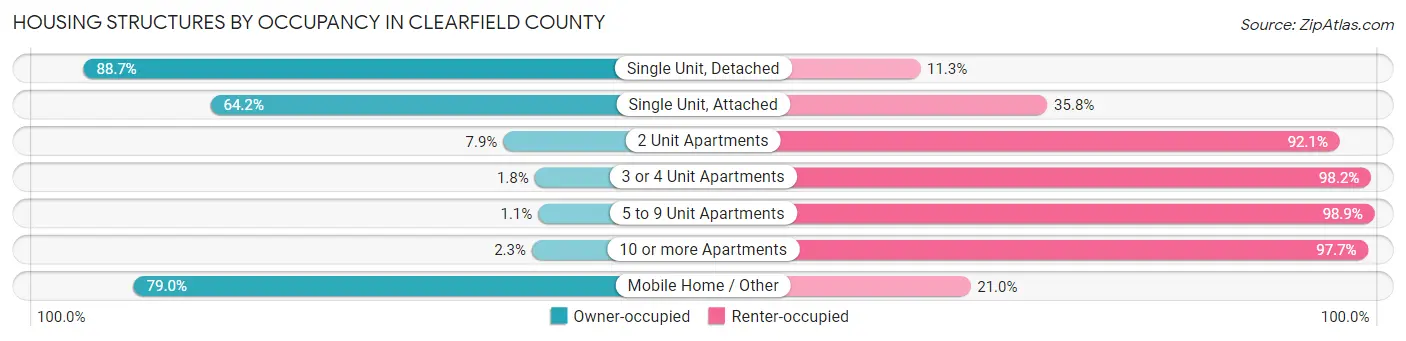
| Structure Type | Owner-occupied | Renter-occupied |
| Single Unit, Detached | 21,312 (88.7%) | 2,727 (11.3%) |
| Single Unit, Attached | 398 (64.2%) | 222 (35.8%) |
| 2 Unit Apartments | 57 (7.9%) | 668 (92.1%) |
| 3 or 4 Unit Apartments | 14 (1.8%) | 758 (98.2%) |
| 5 to 9 Unit Apartments | 7 (1.1%) | 615 (98.9%) |
| 10 or more Apartments | 31 (2.3%) | 1,291 (97.7%) |
| Mobile Home / Other | 2,876 (79.0%) | 765 (21.0%) |
| Total | 24,695 (77.8%) | 7,046 (22.2%) |
Housing Structures by Number of Rooms in Clearfield County
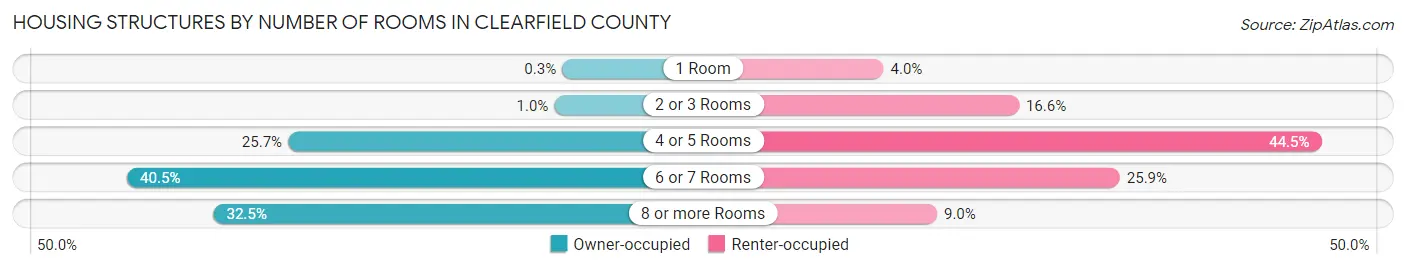
| Number of Rooms | Owner-occupied | Renter-occupied |
| 1 Room | 73 (0.3%) | 285 (4.0%) |
| 2 or 3 Rooms | 253 (1.0%) | 1,167 (16.6%) |
| 4 or 5 Rooms | 6,335 (25.7%) | 3,137 (44.5%) |
| 6 or 7 Rooms | 10,004 (40.5%) | 1,824 (25.9%) |
| 8 or more Rooms | 8,030 (32.5%) | 633 (9.0%) |
| Total | 24,695 (100.0%) | 7,046 (100.0%) |
Housing Structure by Heating Type in Clearfield County
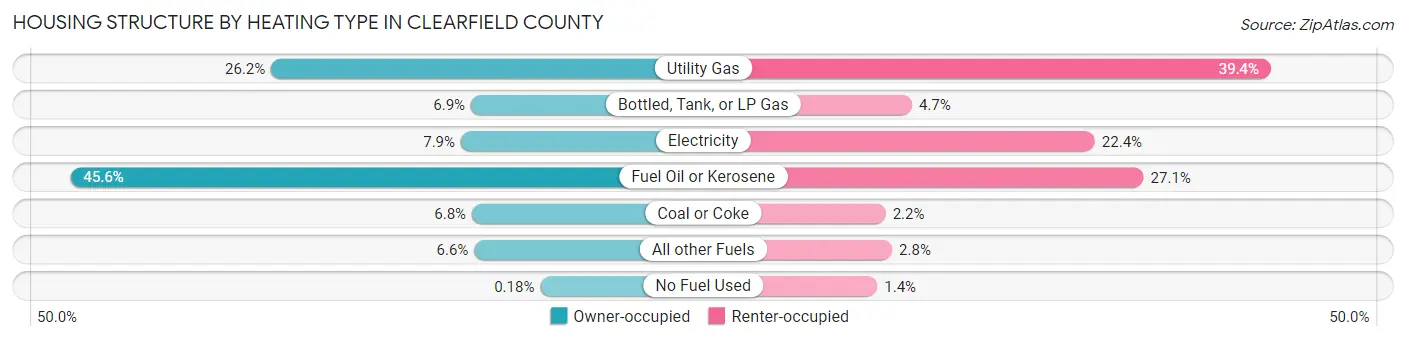
| Heating Type | Owner-occupied | Renter-occupied |
| Utility Gas | 6,465 (26.2%) | 2,776 (39.4%) |
| Bottled, Tank, or LP Gas | 1,699 (6.9%) | 333 (4.7%) |
| Electricity | 1,939 (7.9%) | 1,578 (22.4%) |
| Fuel Oil or Kerosene | 11,253 (45.6%) | 1,910 (27.1%) |
| Coal or Coke | 1,674 (6.8%) | 154 (2.2%) |
| All other Fuels | 1,621 (6.6%) | 198 (2.8%) |
| No Fuel Used | 44 (0.2%) | 97 (1.4%) |
| Total | 24,695 (100.0%) | 7,046 (100.0%) |
Household Vehicle Usage in Clearfield County
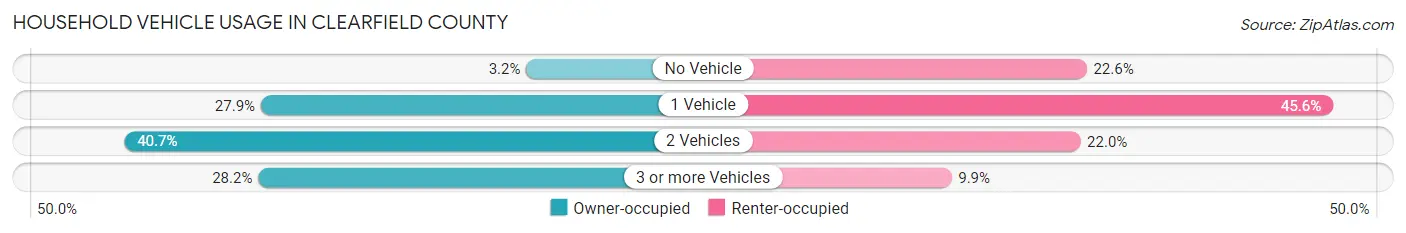
| Vehicles per Household | Owner-occupied | Renter-occupied |
| No Vehicle | 783 (3.2%) | 1,589 (22.6%) |
| 1 Vehicle | 6,900 (27.9%) | 3,210 (45.6%) |
| 2 Vehicles | 10,050 (40.7%) | 1,547 (22.0%) |
| 3 or more Vehicles | 6,962 (28.2%) | 700 (9.9%) |
| Total | 24,695 (100.0%) | 7,046 (100.0%) |
Real Estate & Mortgages in Clearfield County
Real Estate and Mortgage Overview in Clearfield County
| Characteristic | Without Mortgage | With Mortgage |
| Housing Units | 13,065 | 11,630 |
| Median Property Value | $109,500 | $128,500 |
| Median Household Income | $53,067 | $1,442 |
| Monthly Housing Costs | $488 | $296 |
| Real Estate Taxes | $1,316 | $144 |
Property Value by Mortgage Status in Clearfield County
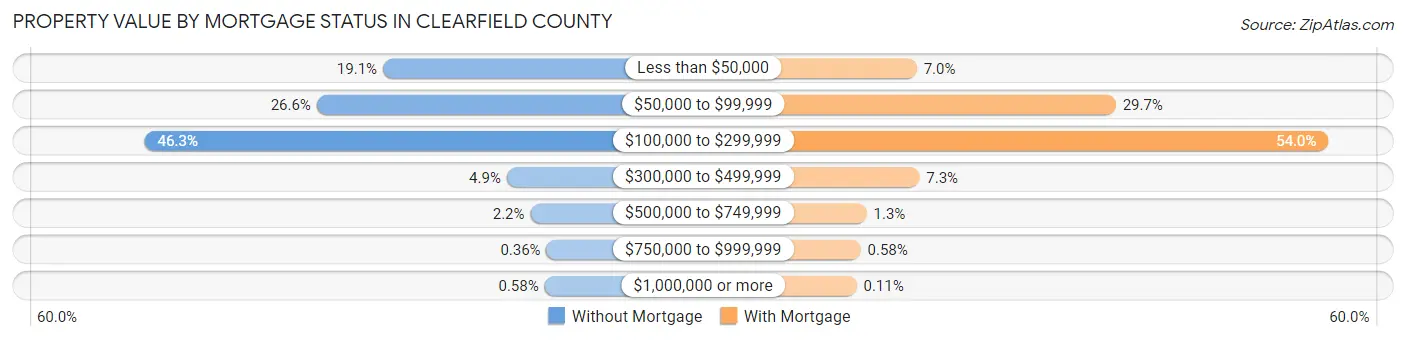
| Property Value | Without Mortgage | With Mortgage |
| Less than $50,000 | 2,489 (19.1%) | 813 (7.0%) |
| $50,000 to $99,999 | 3,478 (26.6%) | 3,458 (29.7%) |
| $100,000 to $299,999 | 6,048 (46.3%) | 6,284 (54.0%) |
| $300,000 to $499,999 | 640 (4.9%) | 848 (7.3%) |
| $500,000 to $749,999 | 287 (2.2%) | 146 (1.3%) |
| $750,000 to $999,999 | 47 (0.4%) | 68 (0.6%) |
| $1,000,000 or more | 76 (0.6%) | 13 (0.1%) |
| Total | 13,065 (100.0%) | 11,630 (100.0%) |
Household Income by Mortgage Status in Clearfield County
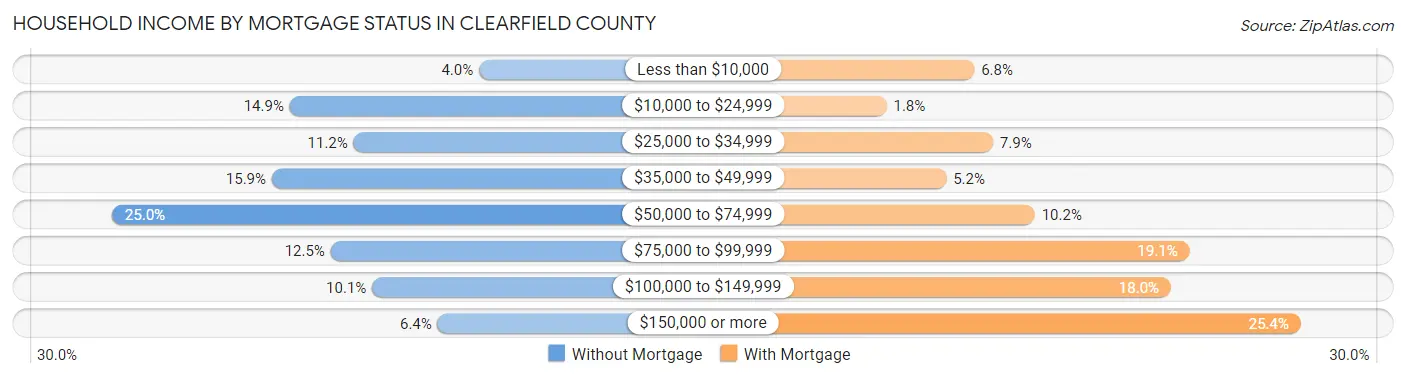
| Household Income | Without Mortgage | With Mortgage |
| Less than $10,000 | 526 (4.0%) | 789 (6.8%) |
| $10,000 to $24,999 | 1,940 (14.8%) | 206 (1.8%) |
| $25,000 to $34,999 | 1,463 (11.2%) | 913 (7.9%) |
| $35,000 to $49,999 | 2,074 (15.9%) | 603 (5.2%) |
| $50,000 to $74,999 | 3,267 (25.0%) | 1,191 (10.2%) |
| $75,000 to $99,999 | 1,634 (12.5%) | 2,220 (19.1%) |
| $100,000 to $149,999 | 1,325 (10.1%) | 2,096 (18.0%) |
| $150,000 or more | 836 (6.4%) | 2,959 (25.4%) |
| Total | 13,065 (100.0%) | 11,630 (100.0%) |
Property Value to Household Income Ratio in Clearfield County
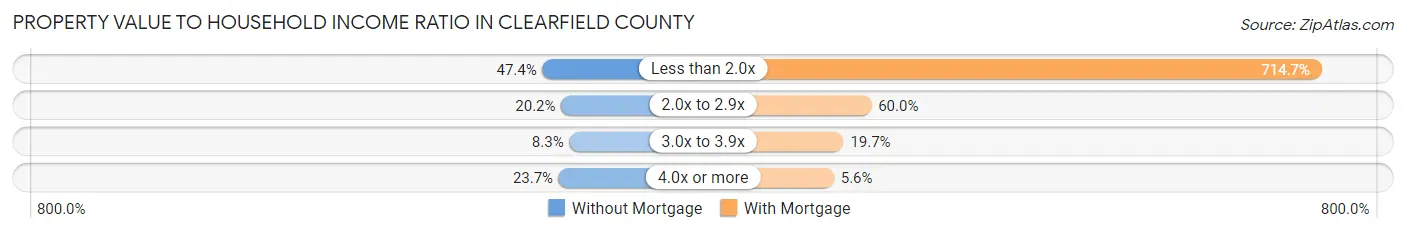
| Value-to-Income Ratio | Without Mortgage | With Mortgage |
| Less than 2.0x | 6,197 (47.4%) | 83,117 (714.7%) |
| 2.0x to 2.9x | 2,634 (20.2%) | 6,977 (60.0%) |
| 3.0x to 3.9x | 1,089 (8.3%) | 2,286 (19.7%) |
| 4.0x or more | 3,090 (23.6%) | 656 (5.6%) |
| Total | 13,065 (100.0%) | 11,630 (100.0%) |
Real Estate Taxes by Mortgage Status in Clearfield County
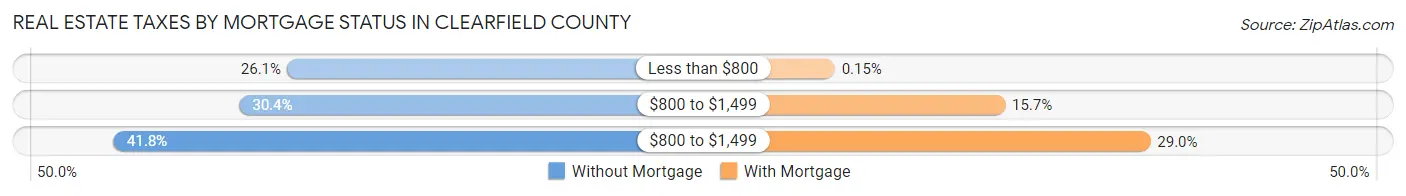
| Property Taxes | Without Mortgage | With Mortgage |
| Less than $800 | 3,403 (26.1%) | 17 (0.2%) |
| $800 to $1,499 | 3,971 (30.4%) | 1,827 (15.7%) |
| $800 to $1,499 | 5,467 (41.8%) | 3,370 (29.0%) |
| Total | 13,065 (100.0%) | 11,630 (100.0%) |
Health & Disability in Clearfield County
Health Insurance Coverage by Age in Clearfield County
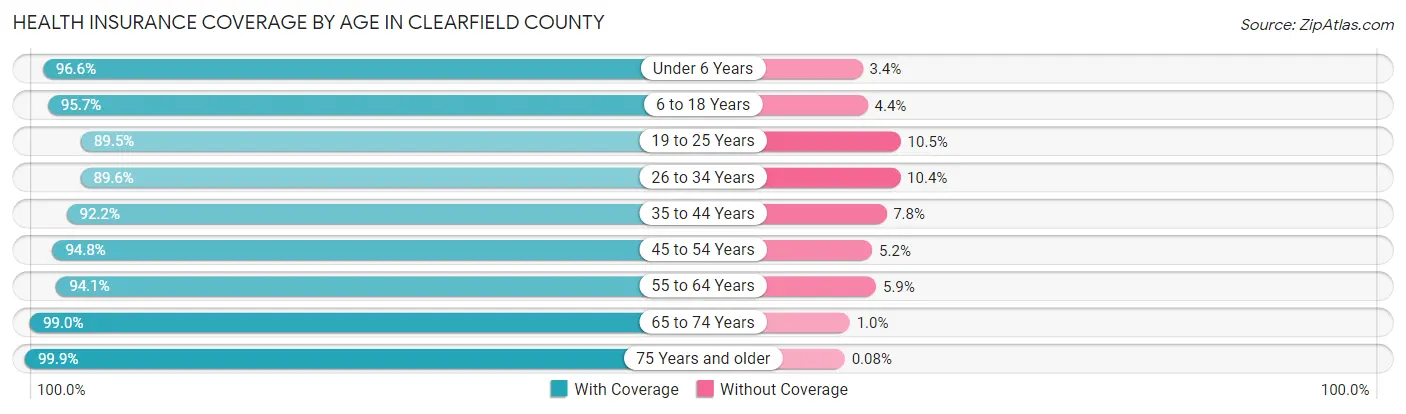
| Age Bracket | With Coverage | Without Coverage |
| Under 6 Years | 4,289 (96.6%) | 151 (3.4%) |
| 6 to 18 Years | 10,397 (95.7%) | 473 (4.3%) |
| 19 to 25 Years | 4,955 (89.5%) | 582 (10.5%) |
| 26 to 34 Years | 7,091 (89.6%) | 825 (10.4%) |
| 35 to 44 Years | 7,659 (92.2%) | 650 (7.8%) |
| 45 to 54 Years | 9,730 (94.8%) | 534 (5.2%) |
| 55 to 64 Years | 10,979 (94.1%) | 691 (5.9%) |
| 65 to 74 Years | 9,328 (99.0%) | 95 (1.0%) |
| 75 Years and older | 6,576 (99.9%) | 5 (0.1%) |
| Total | 71,004 (94.7%) | 4,006 (5.3%) |
Health Insurance Coverage by Citizenship Status in Clearfield County
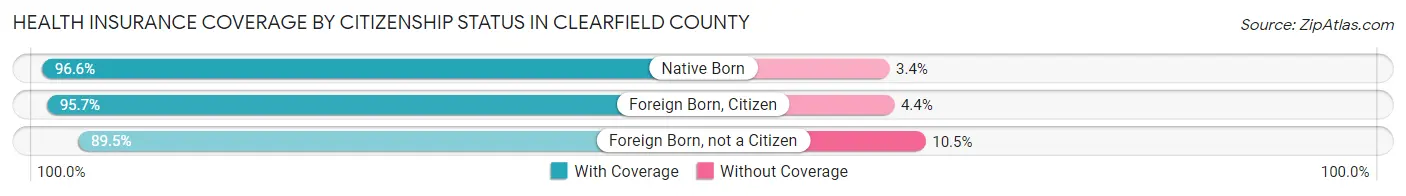
| Citizenship Status | With Coverage | Without Coverage |
| Native Born | 4,289 (96.6%) | 151 (3.4%) |
| Foreign Born, Citizen | 10,397 (95.7%) | 473 (4.3%) |
| Foreign Born, not a Citizen | 4,955 (89.5%) | 582 (10.5%) |
Health Insurance Coverage by Household Income in Clearfield County
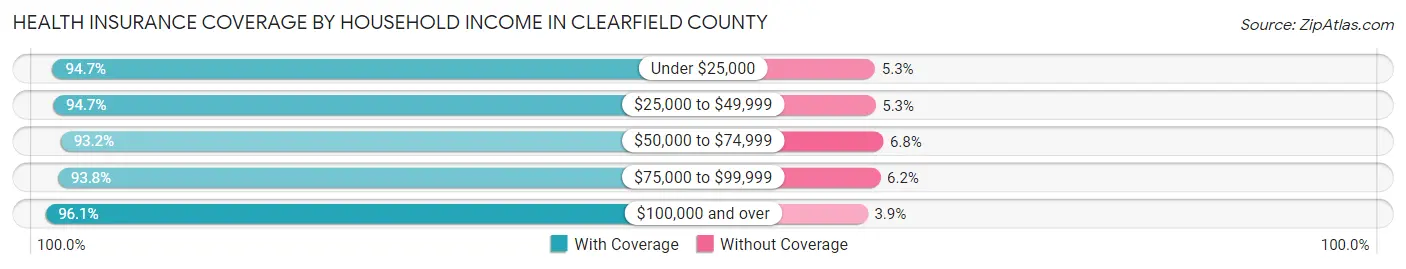
| Household Income | With Coverage | Without Coverage |
| Under $25,000 | 10,417 (94.7%) | 578 (5.3%) |
| $25,000 to $49,999 | 13,147 (94.7%) | 741 (5.3%) |
| $50,000 to $74,999 | 15,560 (93.2%) | 1,131 (6.8%) |
| $75,000 to $99,999 | 10,512 (93.8%) | 700 (6.2%) |
| $100,000 and over | 21,217 (96.1%) | 855 (3.9%) |
Public vs Private Health Insurance Coverage by Age in Clearfield County
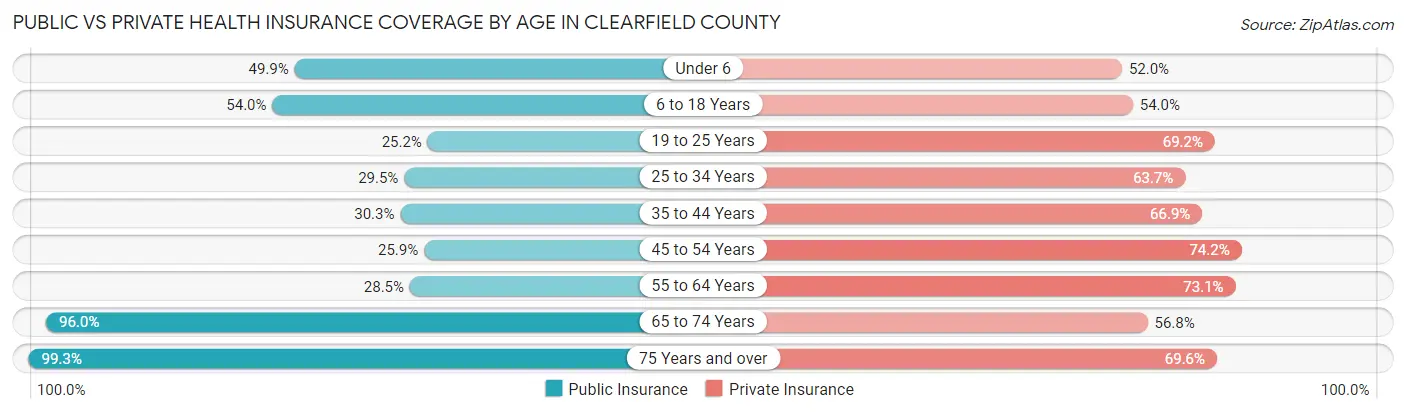
| Age Bracket | Public Insurance | Private Insurance |
| Under 6 | 2,215 (49.9%) | 2,309 (52.0%) |
| 6 to 18 Years | 5,871 (54.0%) | 5,871 (54.0%) |
| 19 to 25 Years | 1,394 (25.2%) | 3,833 (69.2%) |
| 25 to 34 Years | 2,338 (29.5%) | 5,045 (63.7%) |
| 35 to 44 Years | 2,514 (30.3%) | 5,557 (66.9%) |
| 45 to 54 Years | 2,654 (25.9%) | 7,614 (74.2%) |
| 55 to 64 Years | 3,325 (28.5%) | 8,525 (73.1%) |
| 65 to 74 Years | 9,047 (96.0%) | 5,348 (56.8%) |
| 75 Years and over | 6,532 (99.3%) | 4,581 (69.6%) |
| Total | 35,890 (47.8%) | 48,683 (64.9%) |
Disability Status by Sex by Age in Clearfield County
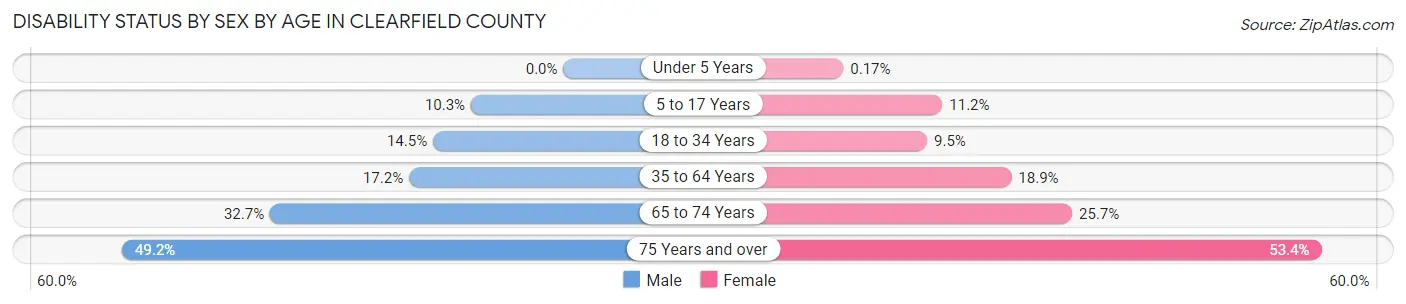
| Age Bracket | Male | Female |
| Under 5 Years | 0 (0.0%) | 3 (0.2%) |
| 5 to 17 Years | 577 (10.3%) | 587 (11.2%) |
| 18 to 34 Years | 1,136 (14.5%) | 614 (9.5%) |
| 35 to 64 Years | 2,641 (17.2%) | 2,811 (18.9%) |
| 65 to 74 Years | 1,504 (32.7%) | 1,236 (25.7%) |
| 75 Years and over | 1,352 (49.2%) | 2,046 (53.4%) |
Disability Class by Sex by Age in Clearfield County
Disability Class: Hearing Difficulty
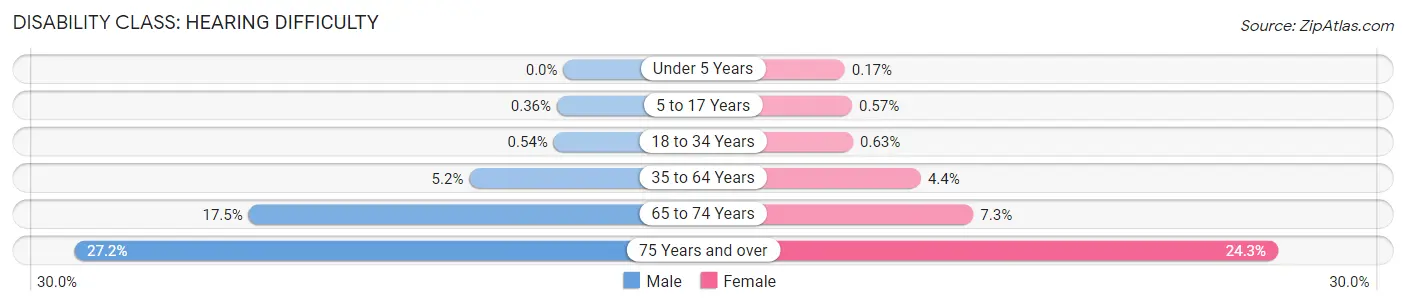
| Age Bracket | Male | Female |
| Under 5 Years | 0 (0.0%) | 3 (0.2%) |
| 5 to 17 Years | 20 (0.4%) | 30 (0.6%) |
| 18 to 34 Years | 42 (0.5%) | 41 (0.6%) |
| 35 to 64 Years | 805 (5.2%) | 656 (4.4%) |
| 65 to 74 Years | 807 (17.5%) | 353 (7.3%) |
| 75 Years and over | 749 (27.2%) | 930 (24.3%) |
Disability Class: Vision Difficulty
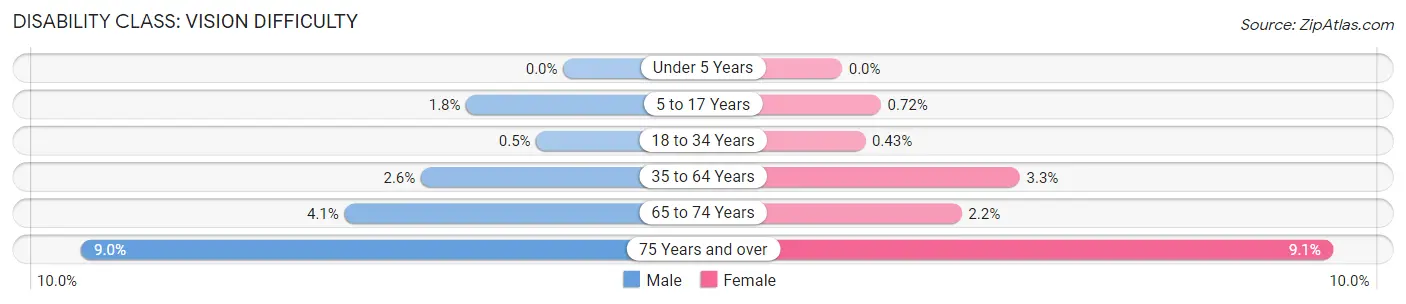
| Age Bracket | Male | Female |
| Under 5 Years | 0 (0.0%) | 0 (0.0%) |
| 5 to 17 Years | 101 (1.8%) | 38 (0.7%) |
| 18 to 34 Years | 39 (0.5%) | 28 (0.4%) |
| 35 to 64 Years | 406 (2.6%) | 491 (3.3%) |
| 65 to 74 Years | 187 (4.1%) | 107 (2.2%) |
| 75 Years and over | 246 (8.9%) | 349 (9.1%) |
Disability Class: Cognitive Difficulty
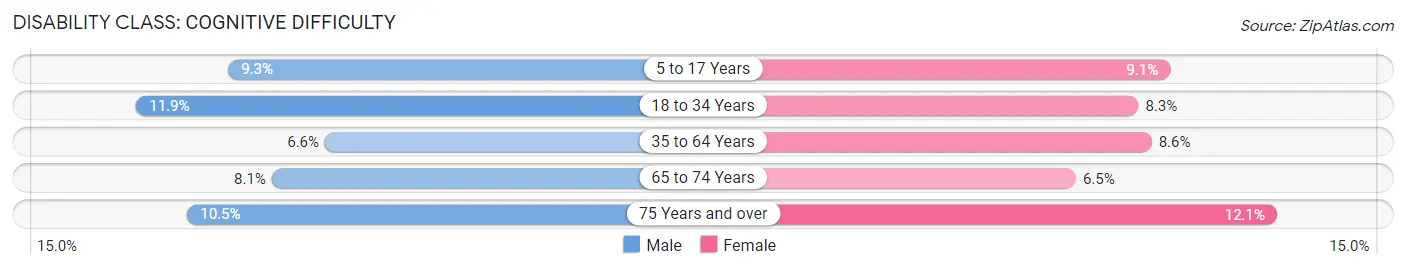
| Age Bracket | Male | Female |
| 5 to 17 Years | 523 (9.3%) | 479 (9.1%) |
| 18 to 34 Years | 930 (11.9%) | 534 (8.3%) |
| 35 to 64 Years | 1,020 (6.6%) | 1,284 (8.6%) |
| 65 to 74 Years | 374 (8.1%) | 314 (6.5%) |
| 75 Years and over | 288 (10.5%) | 464 (12.1%) |
Disability Class: Ambulatory Difficulty
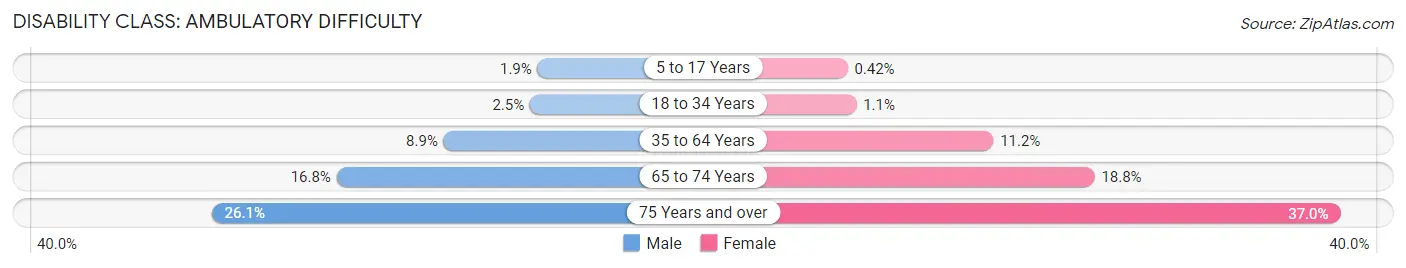
| Age Bracket | Male | Female |
| 5 to 17 Years | 107 (1.9%) | 22 (0.4%) |
| 18 to 34 Years | 193 (2.5%) | 69 (1.1%) |
| 35 to 64 Years | 1,365 (8.9%) | 1,672 (11.2%) |
| 65 to 74 Years | 775 (16.8%) | 904 (18.8%) |
| 75 Years and over | 718 (26.1%) | 1,418 (37.0%) |
Disability Class: Self-Care Difficulty
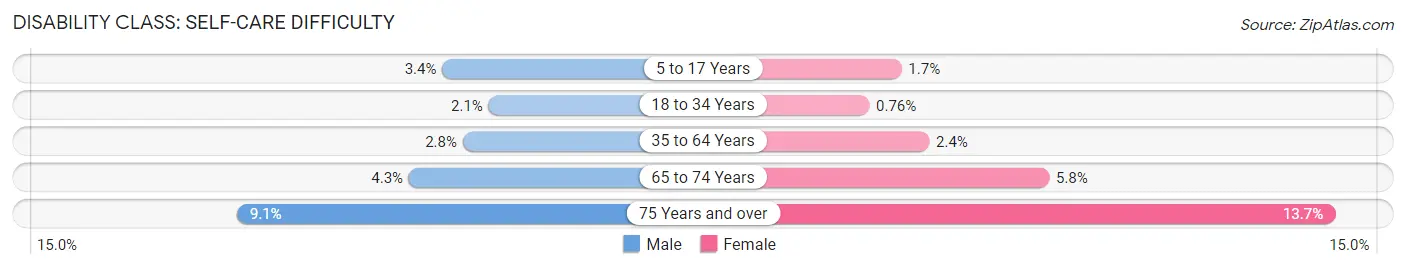
| Age Bracket | Male | Female |
| 5 to 17 Years | 189 (3.4%) | 87 (1.7%) |
| 18 to 34 Years | 163 (2.1%) | 49 (0.8%) |
| 35 to 64 Years | 431 (2.8%) | 361 (2.4%) |
| 65 to 74 Years | 198 (4.3%) | 278 (5.8%) |
| 75 Years and over | 250 (9.1%) | 526 (13.7%) |
Technology Access in Clearfield County
Computing Device Access in Clearfield County
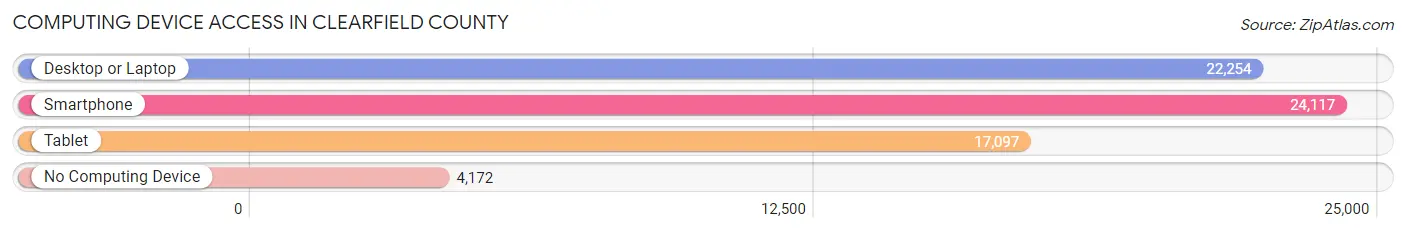
| Device Type | # Households | % Households |
| Desktop or Laptop | 22,254 | 70.1% |
| Smartphone | 24,117 | 76.0% |
| Tablet | 17,097 | 53.9% |
| No Computing Device | 4,172 | 13.1% |
| Total | 31,741 | 100.0% |
Internet Access in Clearfield County
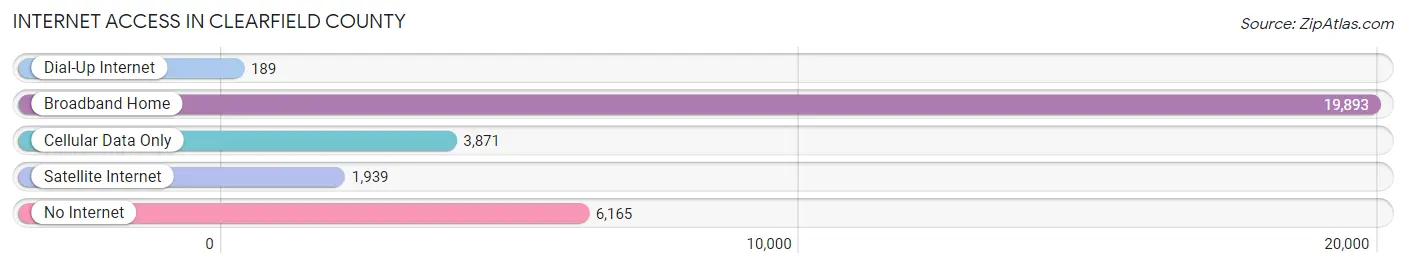
| Internet Type | # Households | % Households |
| Dial-Up Internet | 189 | 0.6% |
| Broadband Home | 19,893 | 62.7% |
| Cellular Data Only | 3,871 | 12.2% |
| Satellite Internet | 1,939 | 6.1% |
| No Internet | 6,165 | 19.4% |
| Total | 31,741 | 100.0% |
Clearfield County Summary
Clearfield County, Pennsylvania is located in the north-central part of the state and is part of the Allegheny Plateau region. It is bordered by Centre, Jefferson, Elk, Cameron, and Clinton counties. The county seat is Clearfield, and the largest city is DuBois. The county was created in 1804 from parts of Huntingdon and Lycoming counties and was named for Clearfield Creek.
Geography
Clearfield County is located in the Allegheny Plateau region of Pennsylvania. The terrain is mostly rolling hills and valleys, with the highest point being Bald Eagle Mountain at 2,890 feet. The county is drained by the Susquehanna River and its tributaries, including the West Branch Susquehanna River, Clearfield Creek, and Moshannon Creek. The county is home to several state parks, including Parker Dam State Park, S. B. Elliott State Park, and Clearfield County State Park.
Demographics
As of the 2010 census, the population of Clearfield County was 81,642. The population density was 79.3 people per square mile. The racial makeup of the county was 97.3% White, 0.9% African American, 0.2% Native American, 0.4% Asian, 0.1% Pacific Islander, 0.3% from other races, and 0.8% from two or more races. Hispanic or Latino of any race were 1.2% of the population.
The median income for a household in the county was $37,845, and the median income for a family was $45,945. The per capita income for the county was $18,845. About 11.2% of families and 14.7% of the population were below the poverty line, including 19.2% of those under age 18 and 8.7% of those age 65 or over.
Economy
Clearfield County’s economy is largely based on agriculture and natural resources. The county is home to several large farms, as well as several small family farms. The county is also home to several coal mines, which provide jobs for many of the county’s residents. The county is also home to several manufacturing companies, including a paper mill, a plastics plant, and a steel mill.
The county is also home to several tourist attractions, including the Clearfield County Fair, the Clearfield County Historical Society, and the Clearfield County Arts Council. The county is also home to several state parks, which provide recreational opportunities for visitors.
Conclusion
Clearfield County, Pennsylvania is a rural county located in the Allegheny Plateau region of the state. The county is home to several large and small farms, coal mines, and manufacturing companies. The county is also home to several tourist attractions and state parks, which provide recreational opportunities for visitors. The population of the county is largely white, with a median household income of $37,845. The county’s economy is largely based on agriculture and natural resources.
Common Questions
What is Per Capita Income in Clearfield County?
Per Capita income in Clearfield County is $29,950.
What is the Median Family Income in Clearfield County?
Median Family Income in Clearfield County is $70,156.
What is the Median Household income in Clearfield County?
Median Household Income in Clearfield County is $56,982.
What is Income or Wage Gap in Clearfield County?
Income or Wage Gap in Clearfield County is 32.6%.
Women in Clearfield County earn 67.4 cents for every dollar earned by a man.
What is Family Income Deficit in Clearfield County?
Family Income Deficit in Clearfield County is $9,016.
Families that are below poverty line in Clearfield County earn $9,016 less on average than the poverty threshold level.
What is Inequality or Gini Index in Clearfield County?
Inequality or Gini Index in Clearfield County is 0.43.
What is the Total Population of Clearfield County?
Total Population of Clearfield County is 79,707.
What is the Total Male Population of Clearfield County?
Total Male Population of Clearfield County is 42,095.
What is the Total Female Population of Clearfield County?
Total Female Population of Clearfield County is 37,612.
What is the Ratio of Males per 100 Females in Clearfield County?
There are 111.92 Males per 100 Females in Clearfield County.
What is the Ratio of Females per 100 Males in Clearfield County?
There are 89.35 Females per 100 Males in Clearfield County.
What is the Median Population Age in Clearfield County?
Median Population Age in Clearfield County is 45.2 Years.
What is the Average Family Size in Clearfield County
Average Family Size in Clearfield County is 2.9 People.
What is the Average Household Size in Clearfield County
Average Household Size in Clearfield County is 2.4 People.
How Large is the Labor Force in Clearfield County?
There are 37,114 People in the Labor Forcein in Clearfield County.
What is the Percentage of People in the Labor Force in Clearfield County?
55.4% of People are in the Labor Force in Clearfield County.
What is the Unemployment Rate in Clearfield County?
Unemployment Rate in Clearfield County is 6.0%.