Clarion County, PA Map & Demographics
Clarion County Map
Clarion County Overview
$30,444
PER CAPITA INCOME
$76,457
AVG FAMILY INCOME
$58,690
AVG HOUSEHOLD INCOME
42.8%
WAGE / INCOME GAP [ % ]
57.2¢/ $1
WAGE / INCOME GAP [ $ ]
$10,273
FAMILY INCOME DEFICIT
0.43
INEQUALITY / GINI INDEX
37,489
TOTAL POPULATION
18,539
MALE POPULATION
18,950
FEMALE POPULATION
97.83
MALES / 100 FEMALES
102.22
FEMALES / 100 MALES
41.5
MEDIAN AGE
2.9
AVG FAMILY SIZE
2.4
AVG HOUSEHOLD SIZE
18,432
LABOR FORCE [ PEOPLE ]
58.9%
PERCENT IN LABOR FORCE
5.5%
UNEMPLOYMENT RATE
Income in Clarion County
Income Overview in Clarion County
Per Capita Income in Clarion County is $30,444, while median incomes of families and households are $76,457 and $58,690 respectively.
| Characteristic | Number | Measure |
| Per Capita Income | 37,489 | $30,444 |
| Median Family Income | 9,628 | $76,457 |
| Mean Family Income | 9,628 | $90,779 |
| Median Household Income | 14,808 | $58,690 |
| Mean Household Income | 14,808 | $74,681 |
| Income Deficit | 9,628 | $10,273 |
| Wage / Income Gap (%) | 37,489 | 42.77% |
| Wage / Income Gap ($) | 37,489 | 57.23¢ per $1 |
| Gini / Inequality Index | 37,489 | 0.43 |
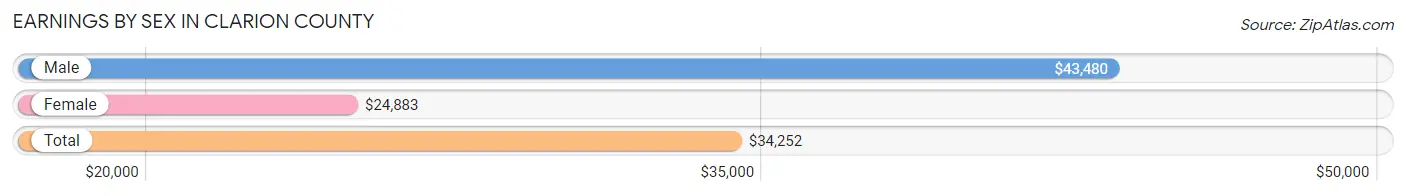
Earnings by Sex in Clarion County
Average Earnings in Clarion County are $34,252, $43,480 for men and $24,883 for women, a difference of 42.8%.
| Sex | Number | Average Earnings |
| Male | 10,493 (53.1%) | $43,480 |
| Female | 9,264 (46.9%) | $24,883 |
| Total | 19,757 (100.0%) | $34,252 |
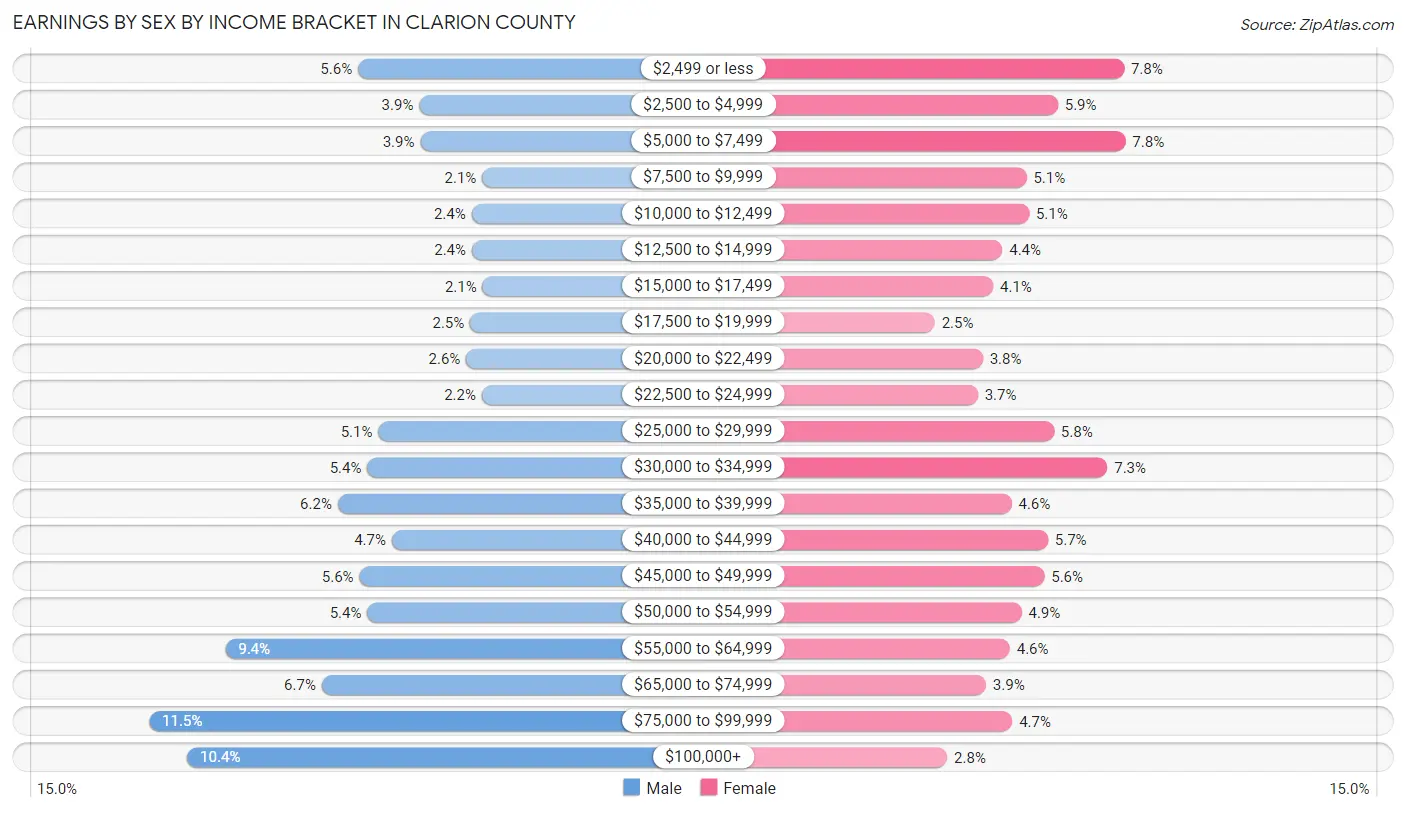
Earnings by Sex by Income Bracket in Clarion County
The most common earnings brackets in Clarion County are $75,000 to $99,999 for men (1,207 | 11.5%) and $5,000 to $7,499 for women (725 | 7.8%).
| Income | Male | Female |
| $2,499 or less | 591 (5.6%) | 722 (7.8%) |
| $2,500 to $4,999 | 410 (3.9%) | 549 (5.9%) |
| $5,000 to $7,499 | 407 (3.9%) | 725 (7.8%) |
| $7,500 to $9,999 | 225 (2.1%) | 468 (5.1%) |
| $10,000 to $12,499 | 256 (2.4%) | 474 (5.1%) |
| $12,500 to $14,999 | 255 (2.4%) | 405 (4.4%) |
| $15,000 to $17,499 | 224 (2.1%) | 381 (4.1%) |
| $17,500 to $19,999 | 260 (2.5%) | 229 (2.5%) |
| $20,000 to $22,499 | 272 (2.6%) | 354 (3.8%) |
| $22,500 to $24,999 | 226 (2.1%) | 341 (3.7%) |
| $25,000 to $29,999 | 531 (5.1%) | 539 (5.8%) |
| $30,000 to $34,999 | 563 (5.4%) | 678 (7.3%) |
| $35,000 to $39,999 | 651 (6.2%) | 429 (4.6%) |
| $40,000 to $44,999 | 491 (4.7%) | 523 (5.7%) |
| $45,000 to $49,999 | 587 (5.6%) | 514 (5.6%) |
| $50,000 to $54,999 | 563 (5.4%) | 455 (4.9%) |
| $55,000 to $64,999 | 982 (9.4%) | 424 (4.6%) |
| $65,000 to $74,999 | 698 (6.7%) | 362 (3.9%) |
| $75,000 to $99,999 | 1,207 (11.5%) | 431 (4.6%) |
| $100,000+ | 1,094 (10.4%) | 261 (2.8%) |
| Total | 10,493 (100.0%) | 9,264 (100.0%) |
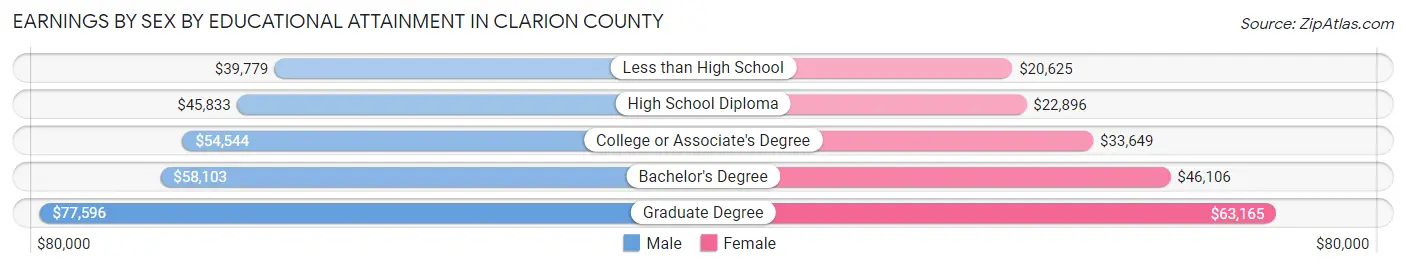
Earnings by Sex by Educational Attainment in Clarion County
Average earnings in Clarion County are $51,279 for men and $32,811 for women, a difference of 36.0%. Men with an educational attainment of graduate degree enjoy the highest average annual earnings of $77,596, while those with less than high school education earn the least with $39,779. Women with an educational attainment of graduate degree earn the most with the average annual earnings of $63,165, while those with less than high school education have the smallest earnings of $20,625.
| Educational Attainment | Male Income | Female Income |
| Less than High School | $39,779 | $20,625 |
| High School Diploma | $45,833 | $22,896 |
| College or Associate's Degree | $54,544 | $33,649 |
| Bachelor's Degree | $58,103 | $46,106 |
| Graduate Degree | $77,596 | $63,165 |
| Total | $51,279 | $32,811 |
Family Income in Clarion County
Family Income Brackets in Clarion County
According to the Clarion County family income data, there are 2,070 families falling into the $100,000 to $149,999 income range, which is the most common income bracket and makes up 21.5% of all families. Conversely, the $10,000 to $14,999 income bracket is the least frequent group with only 173 families (1.8%) belonging to this category.
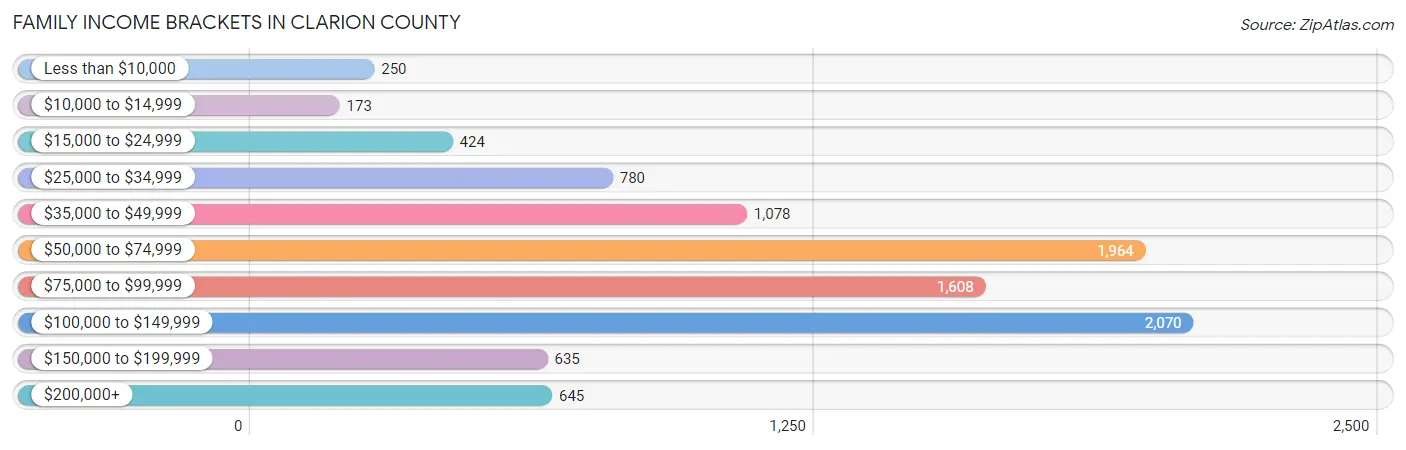
| Income Bracket | # Families | % Families |
| Less than $10,000 | 250 | 2.6% |
| $10,000 to $14,999 | 173 | 1.8% |
| $15,000 to $24,999 | 424 | 4.4% |
| $25,000 to $34,999 | 780 | 8.1% |
| $35,000 to $49,999 | 1,078 | 11.2% |
| $50,000 to $74,999 | 1,964 | 20.4% |
| $75,000 to $99,999 | 1,608 | 16.7% |
| $100,000 to $149,999 | 2,070 | 21.5% |
| $150,000 to $199,999 | 635 | 6.6% |
| $200,000+ | 645 | 6.7% |
Family Income by Famaliy Size in Clarion County
4-person families (1,504 | 15.6%) account for the highest median family income in Clarion County with $110,266 per family, while 2-person families (5,133 | 53.3%) have the highest median income of $31,776 per family member.
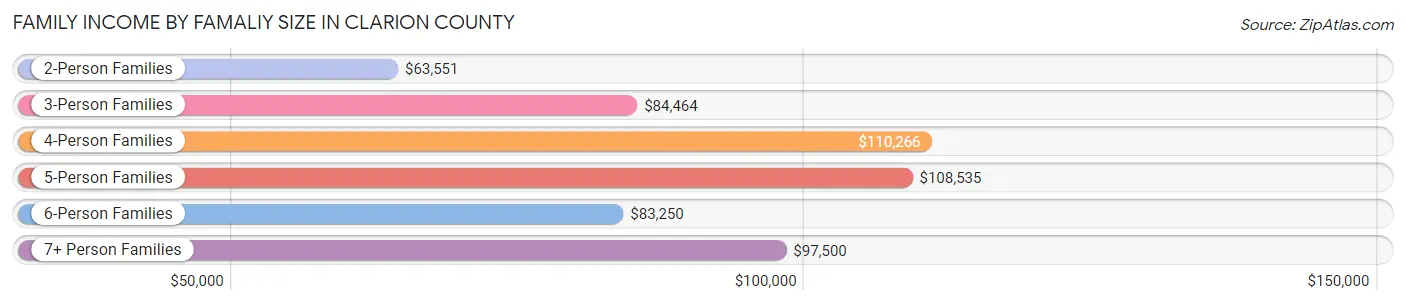
| Income Bracket | # Families | Median Income |
| 2-Person Families | 5,133 (53.3%) | $63,551 |
| 3-Person Families | 1,870 (19.4%) | $84,464 |
| 4-Person Families | 1,504 (15.6%) | $110,266 |
| 5-Person Families | 737 (7.6%) | $108,535 |
| 6-Person Families | 234 (2.4%) | $83,250 |
| 7+ Person Families | 150 (1.6%) | $97,500 |
| Total | 9,628 (100.0%) | $76,457 |
Family Income by Number of Earners in Clarion County
The median family income in Clarion County is $76,457, with families comprising 3+ earners (1,105) having the highest median family income of $121,319, while families with no earners (1,859) have the lowest median family income of $40,783, accounting for 11.5% and 19.3% of families, respectively.
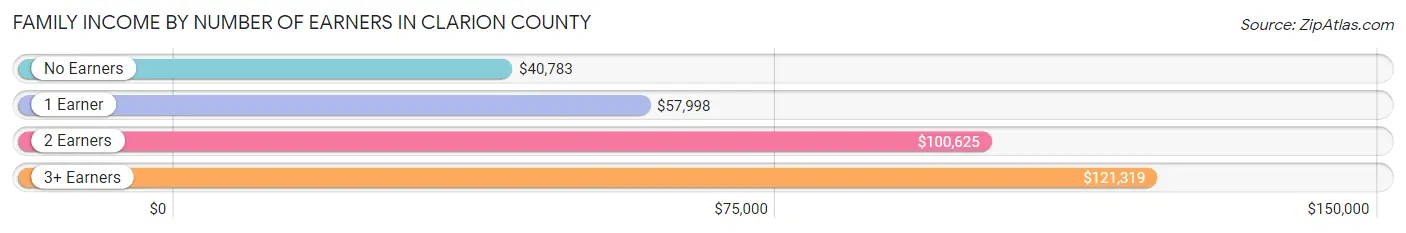
| Number of Earners | # Families | Median Income |
| No Earners | 1,859 (19.3%) | $40,783 |
| 1 Earner | 2,775 (28.8%) | $57,998 |
| 2 Earners | 3,889 (40.4%) | $100,625 |
| 3+ Earners | 1,105 (11.5%) | $121,319 |
| Total | 9,628 (100.0%) | $76,457 |
Household Income in Clarion County
Household Income Brackets in Clarion County
With 2,710 households falling in the category, the $50,000 to $74,999 income range is the most frequent in Clarion County, accounting for 18.3% of all households. In contrast, only 681 households (4.6%) fall into the less than $10,000 income bracket, making it the least populous group.
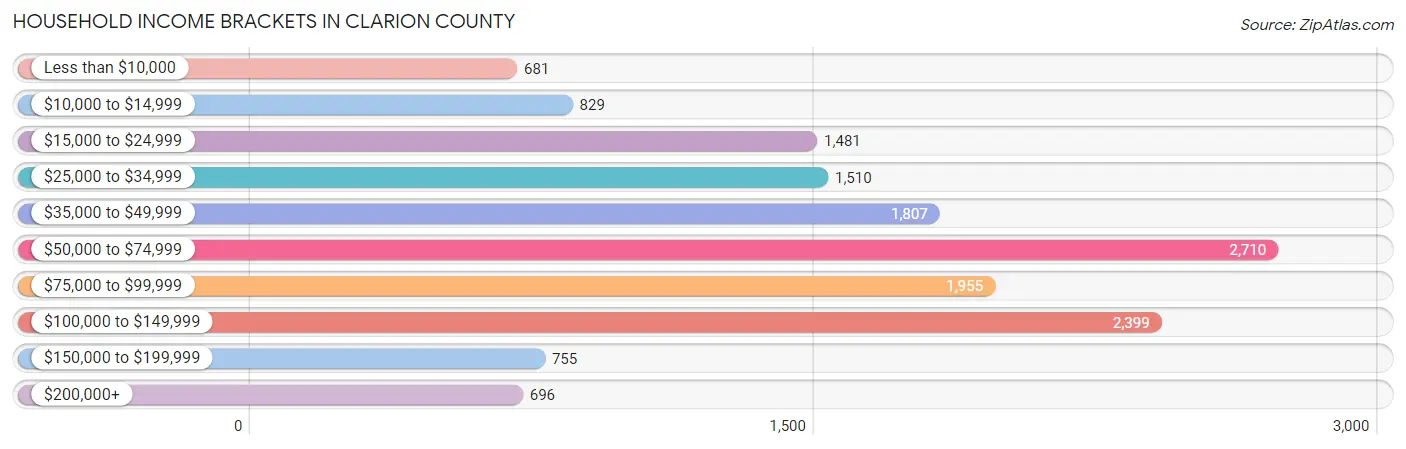
| Income Bracket | # Households | % Households |
| Less than $10,000 | 681 | 4.6% |
| $10,000 to $14,999 | 829 | 5.6% |
| $15,000 to $24,999 | 1,481 | 10.0% |
| $25,000 to $34,999 | 1,510 | 10.2% |
| $35,000 to $49,999 | 1,807 | 12.2% |
| $50,000 to $74,999 | 2,710 | 18.3% |
| $75,000 to $99,999 | 1,955 | 13.2% |
| $100,000 to $149,999 | 2,399 | 16.2% |
| $150,000 to $199,999 | 755 | 5.1% |
| $200,000+ | 696 | 4.7% |
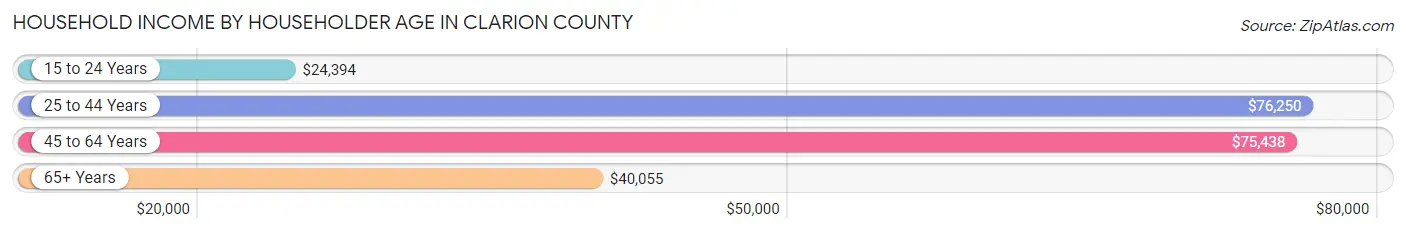
Household Income by Householder Age in Clarion County
The median household income in Clarion County is $58,690, with the highest median household income of $76,250 found in the 25 to 44 years age bracket for the primary householder. A total of 4,059 households (27.4%) fall into this category. Meanwhile, the 15 to 24 years age bracket for the primary householder has the lowest median household income of $24,394, with 766 households (5.2%) in this group.
| Income Bracket | # Households | Median Income |
| 15 to 24 Years | 766 (5.2%) | $24,394 |
| 25 to 44 Years | 4,059 (27.4%) | $76,250 |
| 45 to 64 Years | 5,190 (35.0%) | $75,438 |
| 65+ Years | 4,793 (32.4%) | $40,055 |
| Total | 14,808 (100.0%) | $58,690 |
Poverty in Clarion County
Income Below Poverty by Sex and Age in Clarion County
With 10.6% poverty level for males and 16.8% for females among the residents of Clarion County, 18 to 24 year old males and 18 to 24 year old females are the most vulnerable to poverty, with 519 males (24.5%) and 791 females (41.0%) in their respective age groups living below the poverty level.
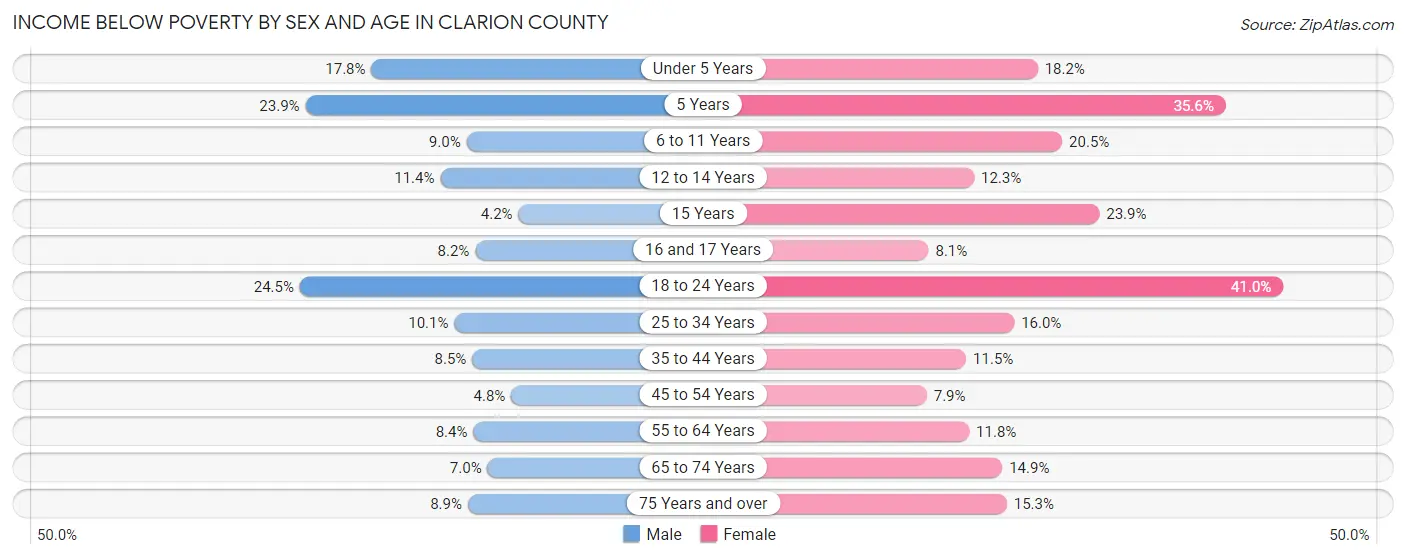
| Age Bracket | Male | Female |
| Under 5 Years | 168 (17.8%) | 160 (18.2%) |
| 5 Years | 34 (23.9%) | 62 (35.6%) |
| 6 to 11 Years | 110 (9.0%) | 228 (20.4%) |
| 12 to 14 Years | 69 (11.4%) | 72 (12.3%) |
| 15 Years | 8 (4.2%) | 49 (23.9%) |
| 16 and 17 Years | 35 (8.2%) | 33 (8.1%) |
| 18 to 24 Years | 519 (24.5%) | 791 (41.0%) |
| 25 to 34 Years | 222 (10.1%) | 346 (16.0%) |
| 35 to 44 Years | 167 (8.5%) | 211 (11.5%) |
| 45 to 54 Years | 107 (4.8%) | 175 (7.9%) |
| 55 to 64 Years | 219 (8.4%) | 311 (11.8%) |
| 65 to 74 Years | 148 (7.0%) | 319 (14.9%) |
| 75 Years and over | 116 (8.9%) | 263 (15.3%) |
| Total | 1,922 (10.6%) | 3,020 (16.8%) |
Income Above Poverty by Sex and Age in Clarion County
According to the poverty statistics in Clarion County, males aged 15 years and females aged 45 to 54 years are the age groups that are most secure financially, with 95.8% of males and 92.1% of females in these age groups living above the poverty line.
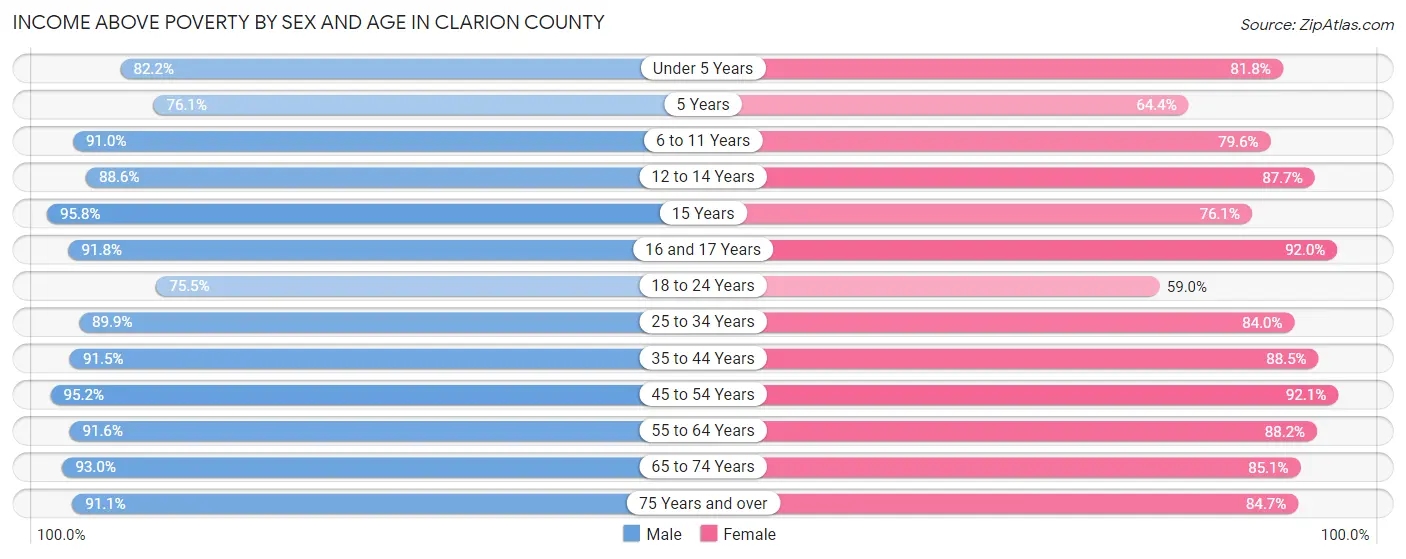
| Age Bracket | Male | Female |
| Under 5 Years | 775 (82.2%) | 720 (81.8%) |
| 5 Years | 108 (76.1%) | 112 (64.4%) |
| 6 to 11 Years | 1,114 (91.0%) | 887 (79.5%) |
| 12 to 14 Years | 535 (88.6%) | 515 (87.7%) |
| 15 Years | 184 (95.8%) | 156 (76.1%) |
| 16 and 17 Years | 393 (91.8%) | 377 (91.9%) |
| 18 to 24 Years | 1,603 (75.5%) | 1,140 (59.0%) |
| 25 to 34 Years | 1,971 (89.9%) | 1,816 (84.0%) |
| 35 to 44 Years | 1,808 (91.5%) | 1,618 (88.5%) |
| 45 to 54 Years | 2,103 (95.2%) | 2,042 (92.1%) |
| 55 to 64 Years | 2,400 (91.6%) | 2,321 (88.2%) |
| 65 to 74 Years | 1,953 (93.0%) | 1,824 (85.1%) |
| 75 Years and over | 1,192 (91.1%) | 1,455 (84.7%) |
| Total | 16,139 (89.4%) | 14,983 (83.2%) |
Income Below Poverty Among Married-Couple Families in Clarion County
The poverty statistics for married-couple families in Clarion County show that 4.3% or 322 of the total 7,562 families live below the poverty line. Families with 3 or 4 children have the highest poverty rate of 17.8%, comprising of 108 families. On the other hand, families with 1 or 2 children have the lowest poverty rate of 2.1%, which includes 42 families.
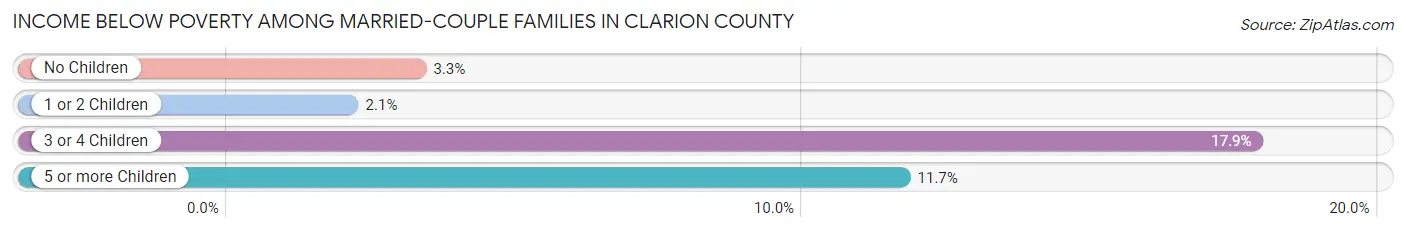
| Children | Above Poverty | Below Poverty |
| No Children | 4,688 (96.7%) | 159 (3.3%) |
| 1 or 2 Children | 1,957 (97.9%) | 42 (2.1%) |
| 3 or 4 Children | 497 (82.2%) | 108 (17.8%) |
| 5 or more Children | 98 (88.3%) | 13 (11.7%) |
| Total | 7,240 (95.7%) | 322 (4.3%) |
Income Below Poverty Among Single-Parent Households in Clarion County
According to the poverty data in Clarion County, 9.1% or 70 single-father households and 27.2% or 351 single-mother households are living below the poverty line. Among single-father households, those with 3 or 4 children have the highest poverty rate, with 28 households (35.0%) experiencing poverty. Likewise, among single-mother households, those with 3 or 4 children have the highest poverty rate, with 87 households (68.5%) falling below the poverty line.
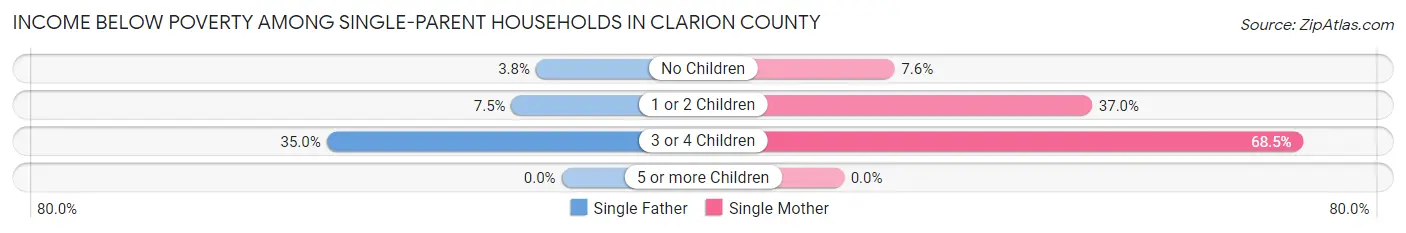
| Children | Single Father | Single Mother |
| No Children | 10 (3.8%) | 41 (7.6%) |
| 1 or 2 Children | 32 (7.5%) | 223 (37.0%) |
| 3 or 4 Children | 28 (35.0%) | 87 (68.5%) |
| 5 or more Children | 0 (0.0%) | 0 (0.0%) |
| Total | 70 (9.1%) | 351 (27.2%) |
Income Below Poverty Among Married-Couple vs Single-Parent Households in Clarion County
The poverty data for Clarion County shows that 322 of the married-couple family households (4.3%) and 421 of the single-parent households (20.4%) are living below the poverty level. Within the married-couple family households, those with 3 or 4 children have the highest poverty rate, with 108 households (17.8%) falling below the poverty line. Among the single-parent households, those with 3 or 4 children have the highest poverty rate, with 115 household (55.6%) living below poverty.
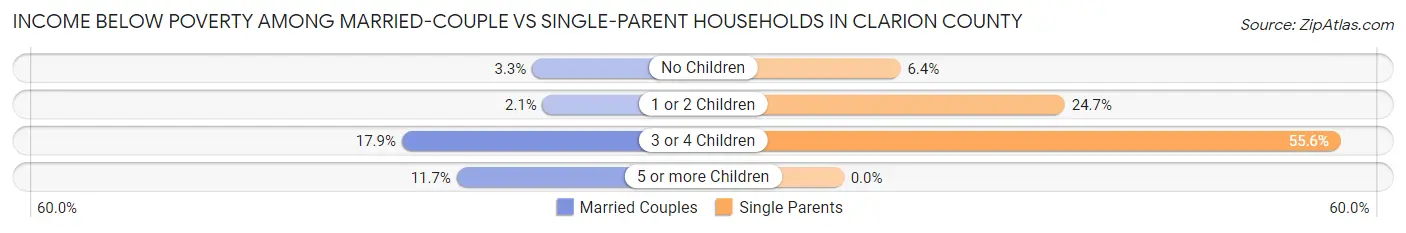
| Children | Married-Couple Families | Single-Parent Households |
| No Children | 159 (3.3%) | 51 (6.4%) |
| 1 or 2 Children | 42 (2.1%) | 255 (24.7%) |
| 3 or 4 Children | 108 (17.8%) | 115 (55.6%) |
| 5 or more Children | 13 (11.7%) | 0 (0.0%) |
| Total | 322 (4.3%) | 421 (20.4%) |
Race in Clarion County
The most populous races in Clarion County are White / Caucasian (35,716 | 95.3%), Two or more Races (870 | 2.3%), and Black / African American (607 | 1.6%).
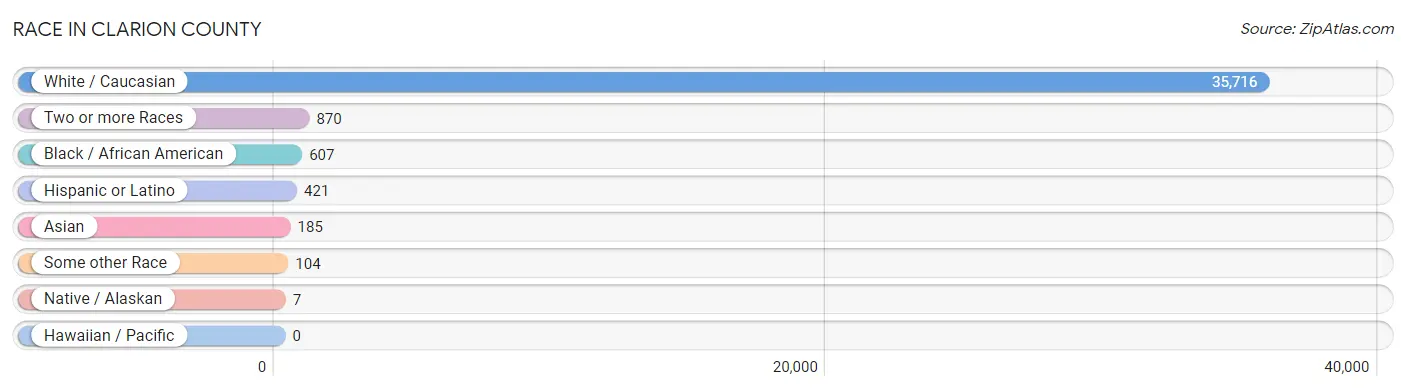
| Race | # Population | % Population |
| Asian | 185 | 0.5% |
| Black / African American | 607 | 1.6% |
| Hawaiian / Pacific | 0 | 0.0% |
| Hispanic or Latino | 421 | 1.1% |
| Native / Alaskan | 7 | 0.0% |
| White / Caucasian | 35,716 | 95.3% |
| Two or more Races | 870 | 2.3% |
| Some other Race | 104 | 0.3% |
| Total | 37,489 | 100.0% |
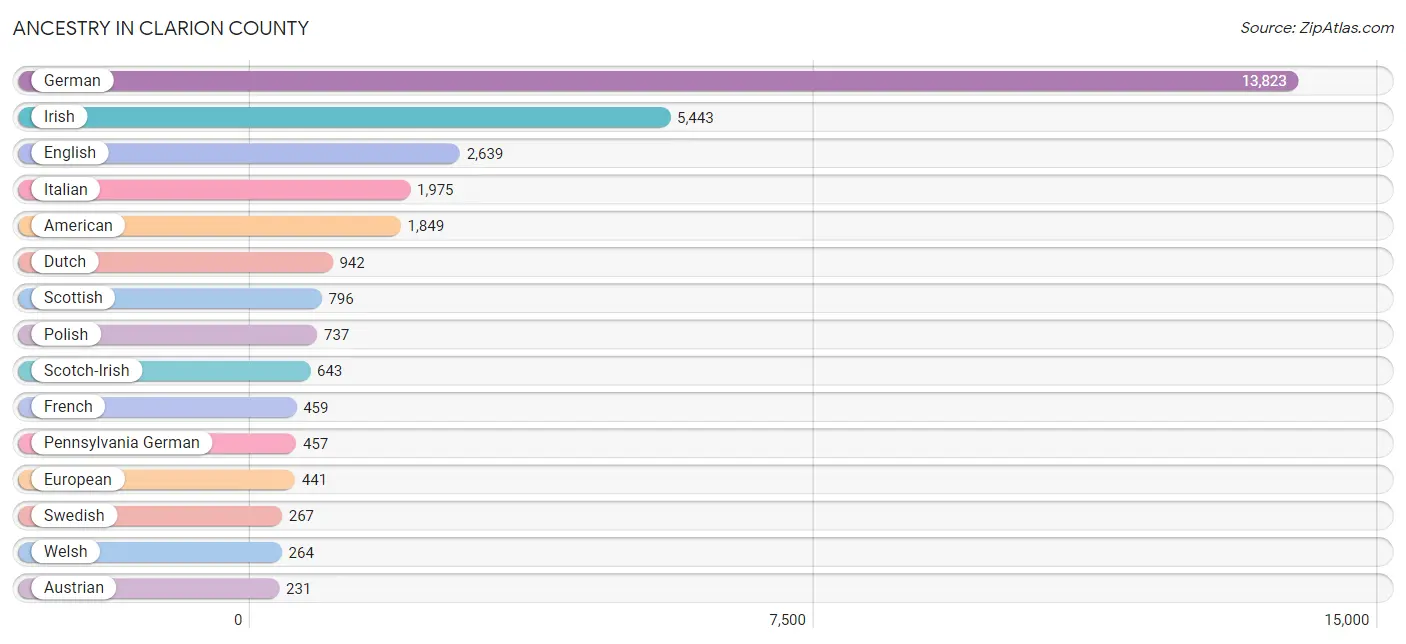
Ancestry in Clarion County
The most populous ancestries reported in Clarion County are German (13,823 | 36.9%), Irish (5,443 | 14.5%), English (2,639 | 7.0%), Italian (1,975 | 5.3%), and American (1,849 | 4.9%), together accounting for 68.6% of all Clarion County residents.
| Ancestry | # Population | % Population |
| African | 10 | 0.0% |
| Albanian | 18 | 0.1% |
| American | 1,849 | 4.9% |
| Apache | 1 | 0.0% |
| Arab | 8 | 0.0% |
| Armenian | 3 | 0.0% |
| Austrian | 231 | 0.6% |
| Basque | 63 | 0.2% |
| Belgian | 10 | 0.0% |
| Bhutanese | 16 | 0.0% |
| Blackfeet | 5 | 0.0% |
| British | 154 | 0.4% |
| Burmese | 16 | 0.0% |
| Canadian | 8 | 0.0% |
| Carpatho Rusyn | 2 | 0.0% |
| Celtic | 4 | 0.0% |
| Central American | 8 | 0.0% |
| Central American Indian | 1 | 0.0% |
| Cherokee | 24 | 0.1% |
| Chilean | 46 | 0.1% |
| Chippewa | 1 | 0.0% |
| Choctaw | 4 | 0.0% |
| Colombian | 12 | 0.0% |
| Croatian | 114 | 0.3% |
| Cuban | 1 | 0.0% |
| Czech | 88 | 0.2% |
| Czechoslovakian | 30 | 0.1% |
| Danish | 21 | 0.1% |
| Dutch | 942 | 2.5% |
| Dutch West Indian | 4 | 0.0% |
| Eastern European | 23 | 0.1% |
| English | 2,639 | 7.0% |
| European | 441 | 1.2% |
| French | 459 | 1.2% |
| French Canadian | 30 | 0.1% |
| German | 13,823 | 36.9% |
| Greek | 14 | 0.0% |
| Guamanian / Chamorro | 3 | 0.0% |
| Guatemalan | 4 | 0.0% |
| Haitian | 4 | 0.0% |
| Hungarian | 193 | 0.5% |
| Icelander | 1 | 0.0% |
| Indian (Asian) | 72 | 0.2% |
| Irish | 5,443 | 14.5% |
| Iroquois | 15 | 0.0% |
| Italian | 1,975 | 5.3% |
| Jamaican | 3 | 0.0% |
| Korean | 140 | 0.4% |
| Lebanese | 8 | 0.0% |
| Lithuanian | 74 | 0.2% |
| Luxembourger | 2 | 0.0% |
| Macedonian | 3 | 0.0% |
| Maltese | 2 | 0.0% |
| Mexican | 145 | 0.4% |
| Native Hawaiian | 3 | 0.0% |
| Navajo | 3 | 0.0% |
| Nigerian | 24 | 0.1% |
| Northern European | 2 | 0.0% |
| Norwegian | 52 | 0.1% |
| Pakistani | 108 | 0.3% |
| Pennsylvania German | 457 | 1.2% |
| Polish | 737 | 2.0% |
| Portuguese | 27 | 0.1% |
| Puerto Rican | 104 | 0.3% |
| Russian | 143 | 0.4% |
| Salvadoran | 4 | 0.0% |
| Scandinavian | 33 | 0.1% |
| Scotch-Irish | 643 | 1.7% |
| Scottish | 796 | 2.1% |
| Serbian | 8 | 0.0% |
| Shoshone | 1 | 0.0% |
| Slavic | 24 | 0.1% |
| Slovak | 169 | 0.4% |
| Slovene | 25 | 0.1% |
| South American | 121 | 0.3% |
| Spaniard | 6 | 0.0% |
| Spanish | 6 | 0.0% |
| Sri Lankan | 9 | 0.0% |
| Subsaharan African | 34 | 0.1% |
| Swedish | 267 | 0.7% |
| Swiss | 228 | 0.6% |
| Turkish | 109 | 0.3% |
| Ukrainian | 80 | 0.2% |
| Venezuelan | 63 | 0.2% |
| Welsh | 264 | 0.7% |
| West Indian | 1 | 0.0% |
| Yugoslavian | 2 | 0.0% | View All 87 Rows |
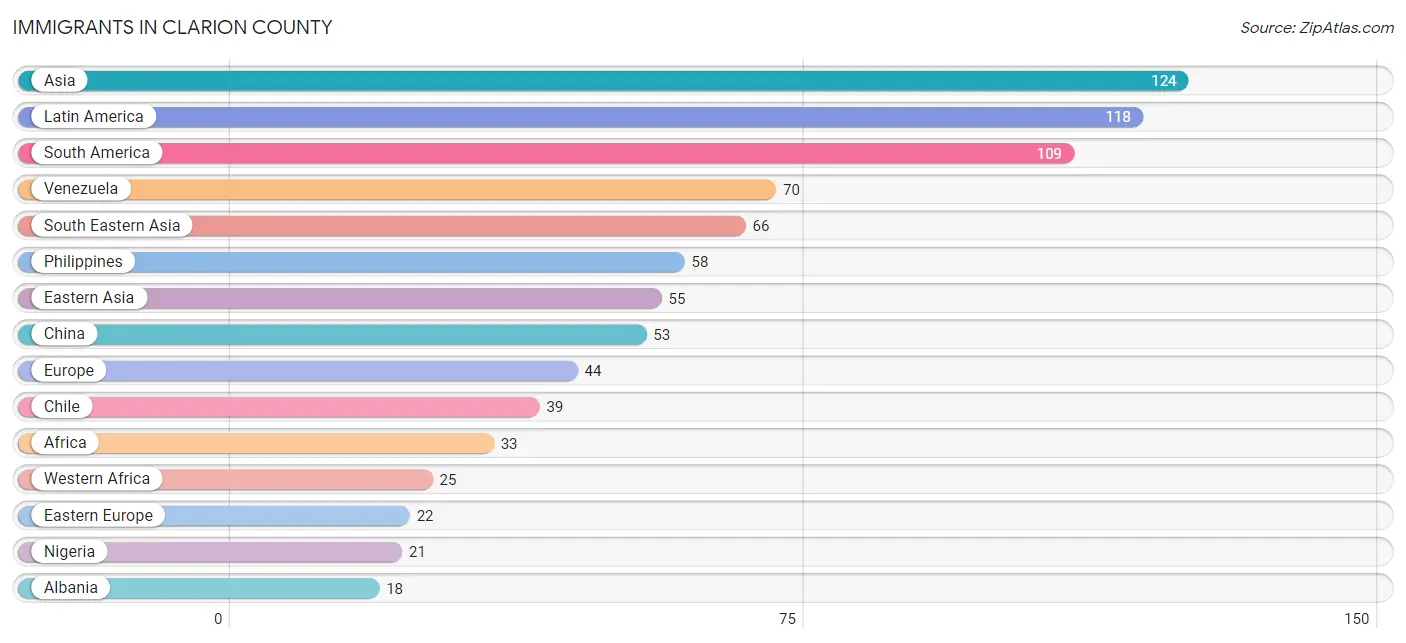
Immigrants in Clarion County
The most numerous immigrant groups reported in Clarion County came from Asia (124 | 0.3%), Latin America (118 | 0.3%), South America (109 | 0.3%), Venezuela (70 | 0.2%), and South Eastern Asia (66 | 0.2%), together accounting for 1.3% of all Clarion County residents.
| Immigration Origin | # Population | % Population |
| Africa | 33 | 0.1% |
| Albania | 18 | 0.1% |
| Asia | 124 | 0.3% |
| Belize | 1 | 0.0% |
| Canada | 4 | 0.0% |
| Caribbean | 2 | 0.0% |
| Central America | 7 | 0.0% |
| Chile | 39 | 0.1% |
| China | 53 | 0.1% |
| Eastern Asia | 55 | 0.2% |
| Eastern Europe | 22 | 0.1% |
| El Salvador | 4 | 0.0% |
| Europe | 44 | 0.1% |
| Germany | 12 | 0.0% |
| Ghana | 4 | 0.0% |
| Guatemala | 2 | 0.0% |
| Haiti | 2 | 0.0% |
| Ireland | 4 | 0.0% |
| Italy | 1 | 0.0% |
| Korea | 2 | 0.0% |
| Latin America | 118 | 0.3% |
| Netherlands | 3 | 0.0% |
| Nigeria | 21 | 0.1% |
| Northern Europe | 5 | 0.0% |
| Philippines | 58 | 0.2% |
| Poland | 2 | 0.0% |
| Russia | 2 | 0.0% |
| South Africa | 8 | 0.0% |
| South America | 109 | 0.3% |
| South Eastern Asia | 66 | 0.2% |
| Southern Europe | 2 | 0.0% |
| Spain | 1 | 0.0% |
| Thailand | 8 | 0.0% |
| Venezuela | 70 | 0.2% |
| Western Africa | 25 | 0.1% |
| Western Asia | 3 | 0.0% |
| Western Europe | 15 | 0.0% | View All 37 Rows |
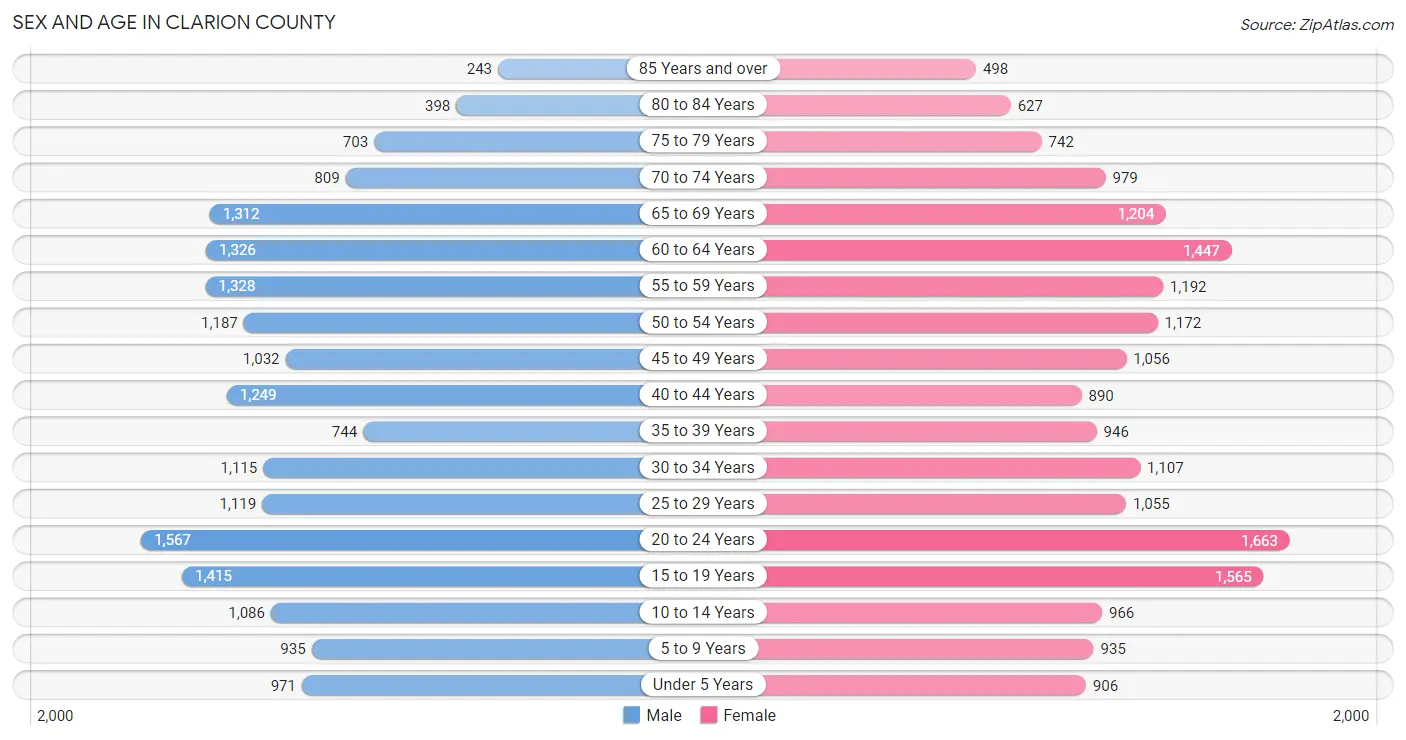
Sex and Age in Clarion County
Sex and Age in Clarion County
The most populous age groups in Clarion County are 20 to 24 Years (1,567 | 8.5%) for men and 20 to 24 Years (1,663 | 8.8%) for women.
| Age Bracket | Male | Female |
| Under 5 Years | 971 (5.2%) | 906 (4.8%) |
| 5 to 9 Years | 935 (5.0%) | 935 (4.9%) |
| 10 to 14 Years | 1,086 (5.9%) | 966 (5.1%) |
| 15 to 19 Years | 1,415 (7.6%) | 1,565 (8.3%) |
| 20 to 24 Years | 1,567 (8.5%) | 1,663 (8.8%) |
| 25 to 29 Years | 1,119 (6.0%) | 1,055 (5.6%) |
| 30 to 34 Years | 1,115 (6.0%) | 1,107 (5.8%) |
| 35 to 39 Years | 744 (4.0%) | 946 (5.0%) |
| 40 to 44 Years | 1,249 (6.7%) | 890 (4.7%) |
| 45 to 49 Years | 1,032 (5.6%) | 1,056 (5.6%) |
| 50 to 54 Years | 1,187 (6.4%) | 1,172 (6.2%) |
| 55 to 59 Years | 1,328 (7.2%) | 1,192 (6.3%) |
| 60 to 64 Years | 1,326 (7.1%) | 1,447 (7.6%) |
| 65 to 69 Years | 1,312 (7.1%) | 1,204 (6.4%) |
| 70 to 74 Years | 809 (4.4%) | 979 (5.2%) |
| 75 to 79 Years | 703 (3.8%) | 742 (3.9%) |
| 80 to 84 Years | 398 (2.1%) | 627 (3.3%) |
| 85 Years and over | 243 (1.3%) | 498 (2.6%) |
| Total | 18,539 (100.0%) | 18,950 (100.0%) |
Families and Households in Clarion County
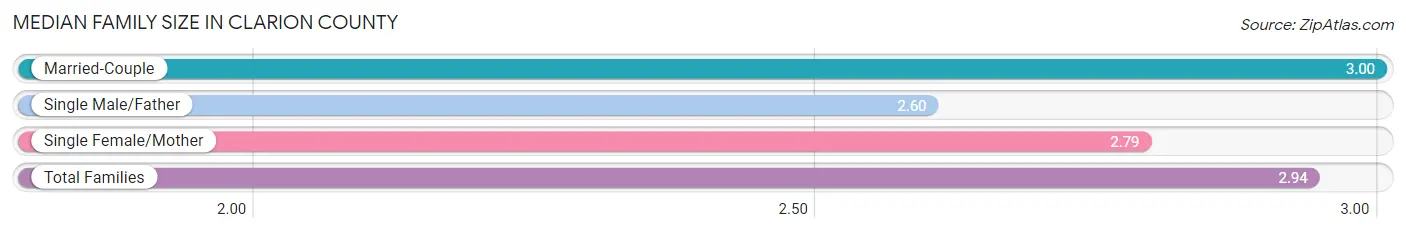
Median Family Size in Clarion County
The median family size in Clarion County is 2.94 persons per family, with married-couple families (7,562 | 78.5%) accounting for the largest median family size of 3 persons per family. On the other hand, single male/father families (773 | 8.0%) represent the smallest median family size with 2.60 persons per family.
| Family Type | # Families | Family Size |
| Married-Couple | 7,562 (78.5%) | 3.00 |
| Single Male/Father | 773 (8.0%) | 2.60 |
| Single Female/Mother | 1,293 (13.4%) | 2.79 |
| Total Families | 9,628 (100.0%) | 2.94 |
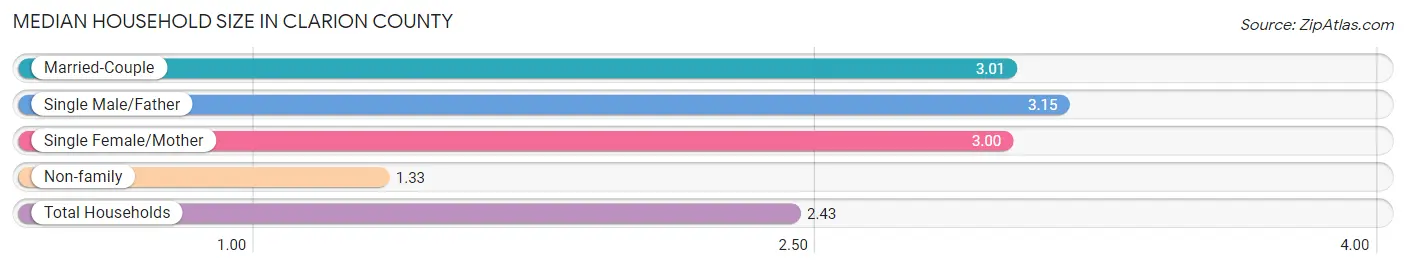
Median Household Size in Clarion County
The median household size in Clarion County is 2.43 persons per household, with single male/father households (773 | 5.2%) accounting for the largest median household size of 3.15 persons per household. non-family households (5,180 | 35.0%) represent the smallest median household size with 1.33 persons per household.
| Household Type | # Households | Household Size |
| Married-Couple | 7,562 (51.1%) | 3.01 |
| Single Male/Father | 773 (5.2%) | 3.15 |
| Single Female/Mother | 1,293 (8.7%) | 3.00 |
| Non-family | 5,180 (35.0%) | 1.33 |
| Total Households | 14,808 (100.0%) | 2.43 |
Household Size by Marriage Status in Clarion County
Out of a total of 14,808 households in Clarion County, 9,628 (65.0%) are family households, while 5,180 (35.0%) are nonfamily households. The most numerous type of family households are 2-person households, comprising 4,793, and the most common type of nonfamily households are 1-person households, comprising 4,007.
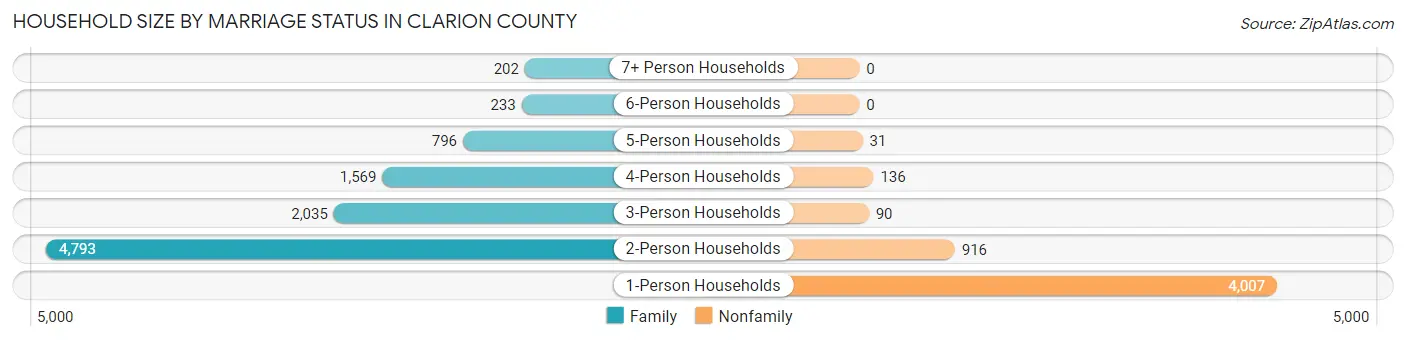
| Household Size | Family Households | Nonfamily Households |
| 1-Person Households | - | 4,007 (27.1%) |
| 2-Person Households | 4,793 (32.4%) | 916 (6.2%) |
| 3-Person Households | 2,035 (13.7%) | 90 (0.6%) |
| 4-Person Households | 1,569 (10.6%) | 136 (0.9%) |
| 5-Person Households | 796 (5.4%) | 31 (0.2%) |
| 6-Person Households | 233 (1.6%) | 0 (0.0%) |
| 7+ Person Households | 202 (1.4%) | 0 (0.0%) |
| Total | 9,628 (65.0%) | 5,180 (35.0%) |
Female Fertility in Clarion County
Fertility by Age in Clarion County
Average fertility rate in Clarion County is 47.0 births per 1,000 women. Women in the age bracket of 20 to 34 years have the highest fertility rate with 85.0 births per 1,000 women. Women in the age bracket of 20 to 34 years acount for 81.0% of all women with births.
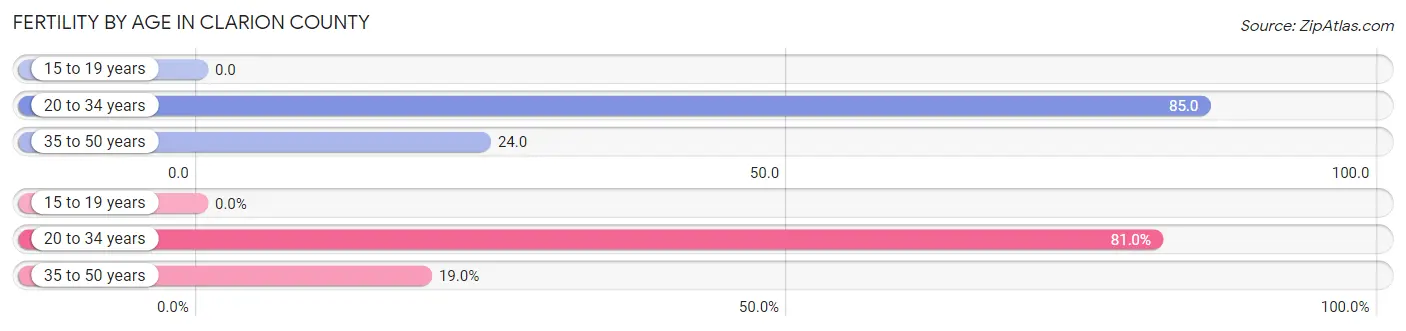
| Age Bracket | Women with Births | Births / 1,000 Women |
| 15 to 19 years | 0 (0.0%) | 0.0 |
| 20 to 34 years | 324 (81.0%) | 85.0 |
| 35 to 50 years | 76 (19.0%) | 24.0 |
| Total | 400 (100.0%) | 47.0 |
Fertility by Age by Marriage Status in Clarion County
75.0% of women with births (400) in Clarion County are married. The highest percentage of unmarried women with births falls into 20 to 34 years age bracket with 27.8% of them unmarried at the time of birth, while the lowest percentage of unmarried women with births belong to 35 to 50 years age bracket with 13.2% of them unmarried.
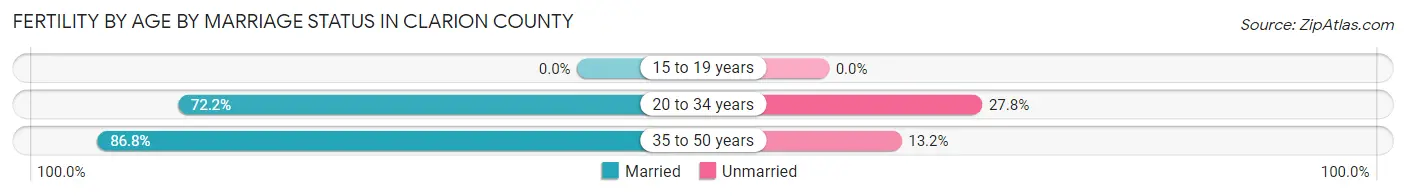
| Age Bracket | Married | Unmarried |
| 15 to 19 years | 0 (0.0%) | 0 (0.0%) |
| 20 to 34 years | 234 (72.2%) | 90 (27.8%) |
| 35 to 50 years | 66 (86.8%) | 10 (13.2%) |
| Total | 300 (75.0%) | 100 (25.0%) |
Fertility by Education in Clarion County
Average fertility rate in Clarion County is 47.0 births per 1,000 women. Women with the education attainment of high school diploma have the highest fertility rate of 61.0 births per 1,000 women, while women with the education attainment of graduate degree have the lowest fertility at 28.0 births per 1,000 women. Women with the education attainment of high school diploma represent 38.8% of all women with births.
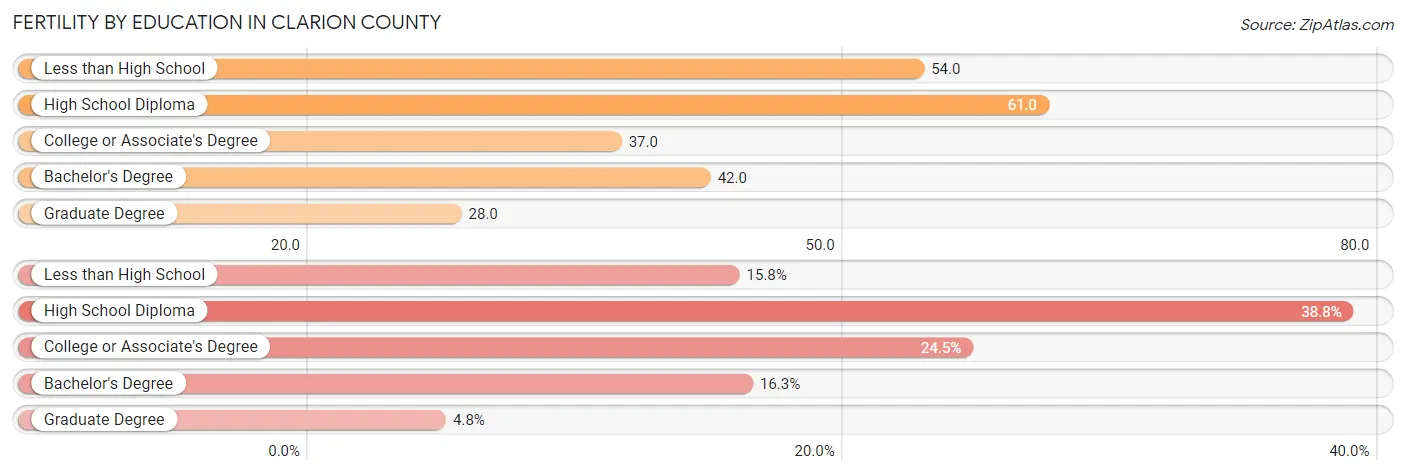
| Educational Attainment | Women with Births | Births / 1,000 Women |
| Less than High School | 63 (15.8%) | 54.0 |
| High School Diploma | 155 (38.8%) | 61.0 |
| College or Associate's Degree | 98 (24.5%) | 37.0 |
| Bachelor's Degree | 65 (16.3%) | 42.0 |
| Graduate Degree | 19 (4.8%) | 28.0 |
| Total | 400 (100.0%) | 47.0 |
Fertility by Education by Marriage Status in Clarion County
25.0% of women with births in Clarion County are unmarried. Women with the educational attainment of less than high school are most likely to be married with 100.0% of them married at childbirth, while women with the educational attainment of high school diploma are least likely to be married with 43.9% of them unmarried at childbirth.
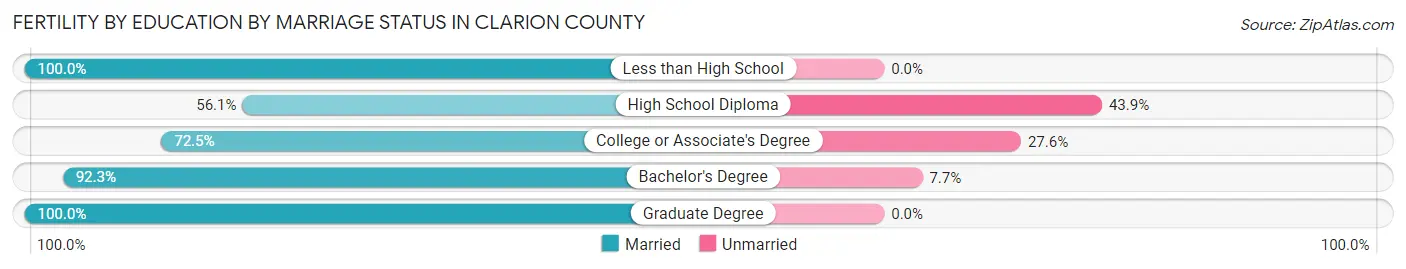
| Educational Attainment | Married | Unmarried |
| Less than High School | 63 (100.0%) | 0 (0.0%) |
| High School Diploma | 87 (56.1%) | 68 (43.9%) |
| College or Associate's Degree | 71 (72.5%) | 27 (27.6%) |
| Bachelor's Degree | 60 (92.3%) | 5 (7.7%) |
| Graduate Degree | 19 (100.0%) | 0 (0.0%) |
| Total | 300 (75.0%) | 100 (25.0%) |
Employment Characteristics in Clarion County
Employment by Class of Employer in Clarion County
Among the 17,008 employed individuals in Clarion County, private company employees (11,232 | 66.0%), not-for-profit organizations (1,560 | 9.2%), and state government employees (1,319 | 7.8%) make up the most common classes of employment.
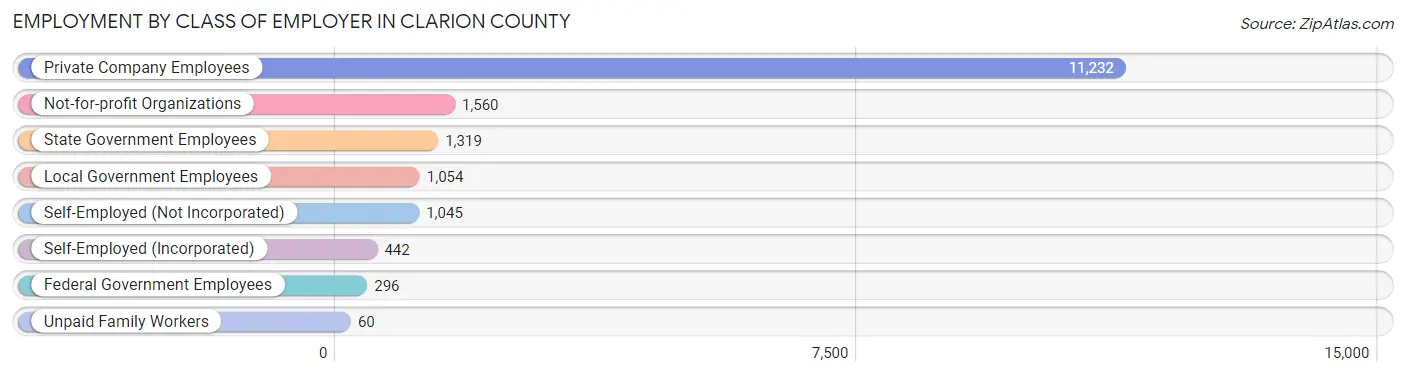
| Employer Class | # Employees | % Employees |
| Private Company Employees | 11,232 | 66.0% |
| Self-Employed (Incorporated) | 442 | 2.6% |
| Self-Employed (Not Incorporated) | 1,045 | 6.1% |
| Not-for-profit Organizations | 1,560 | 9.2% |
| Local Government Employees | 1,054 | 6.2% |
| State Government Employees | 1,319 | 7.8% |
| Federal Government Employees | 296 | 1.7% |
| Unpaid Family Workers | 60 | 0.4% |
| Total | 17,008 | 100.0% |
Employment Status by Age in Clarion County
According to the labor force statistics for Clarion County, out of the total population over 16 years of age (31,293), 58.9% or 18,432 individuals are in the labor force, with 5.5% or 1,014 of them unemployed. The age group with the highest labor force participation rate is 35 to 44 years, with 84.8% or 3,247 individuals in the labor force. Within the labor force, the 16 to 19 years age range has the highest percentage of unemployed individuals, with 21.6% or 311 of them being unemployed.
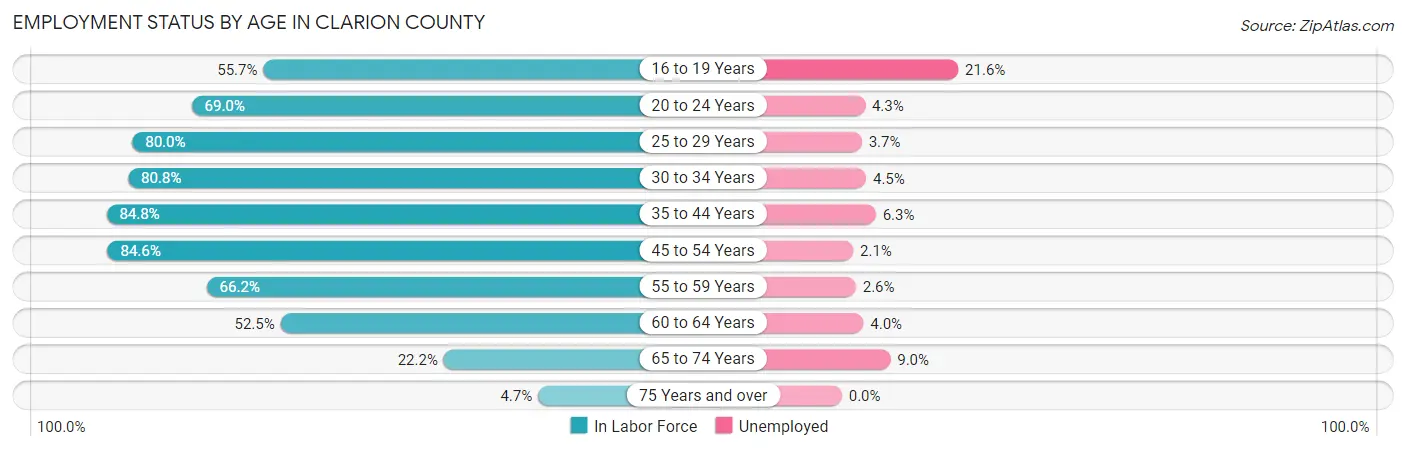
| Age Bracket | In Labor Force | Unemployed |
| 16 to 19 Years | 1,439 (55.7%) | 311 (21.6%) |
| 20 to 24 Years | 2,229 (69.0%) | 96 (4.3%) |
| 25 to 29 Years | 1,739 (80.0%) | 64 (3.7%) |
| 30 to 34 Years | 1,795 (80.8%) | 81 (4.5%) |
| 35 to 44 Years | 3,247 (84.8%) | 205 (6.3%) |
| 45 to 54 Years | 3,762 (84.6%) | 79 (2.1%) |
| 55 to 59 Years | 1,668 (66.2%) | 43 (2.6%) |
| 60 to 64 Years | 1,456 (52.5%) | 58 (4.0%) |
| 65 to 74 Years | 955 (22.2%) | 86 (9.0%) |
| 75 Years and over | 151 (4.7%) | 0 (0.0%) |
| Total | 18,432 (58.9%) | 1,014 (5.5%) |
Employment Status by Educational Attainment in Clarion County
According to labor force statistics for Clarion County, 76.1% of individuals (13,671) out of the total population between 25 and 64 years of age (17,965) are in the labor force, with 3.9% or 533 of them being unemployed. The group with the highest labor force participation rate are those with the educational attainment of bachelor's degree or higher, with 87.8% or 4,030 individuals in the labor force. Within the labor force, individuals with less than high school education have the highest percentage of unemployment, with 16.3% or 114 of them being unemployed.
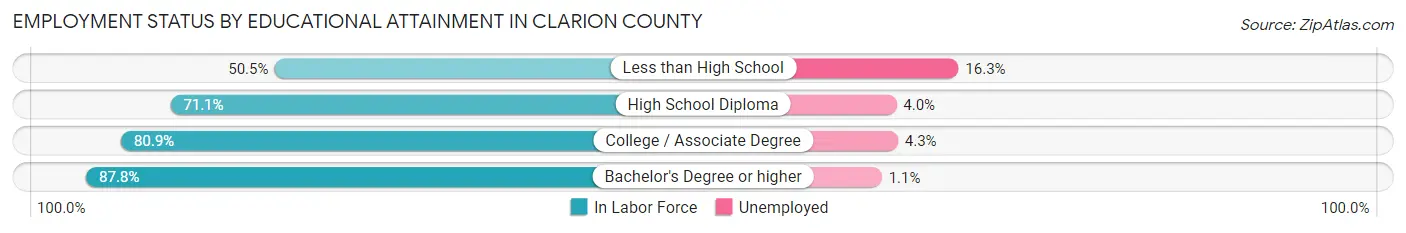
| Educational Attainment | In Labor Force | Unemployed |
| Less than High School | 701 (50.5%) | 226 (16.3%) |
| High School Diploma | 5,487 (71.1%) | 309 (4.0%) |
| College / Associate Degree | 3,454 (80.9%) | 184 (4.3%) |
| Bachelor's Degree or higher | 4,030 (87.8%) | 50 (1.1%) |
| Total | 13,671 (76.1%) | 701 (3.9%) |
Employment Occupations by Sex in Clarion County
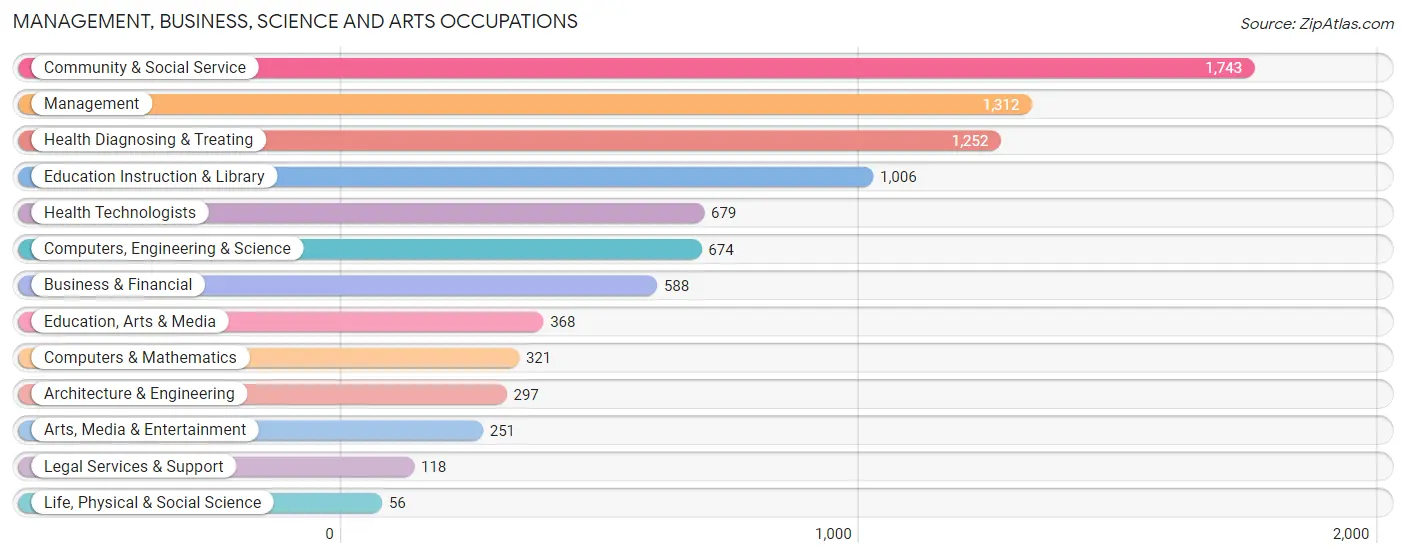
Management, Business, Science and Arts Occupations
The most common Management, Business, Science and Arts occupations in Clarion County are Community & Social Service (1,743 | 10.0%), Management (1,312 | 7.5%), Health Diagnosing & Treating (1,252 | 7.2%), Education Instruction & Library (1,006 | 5.8%), and Health Technologists (679 | 3.9%).
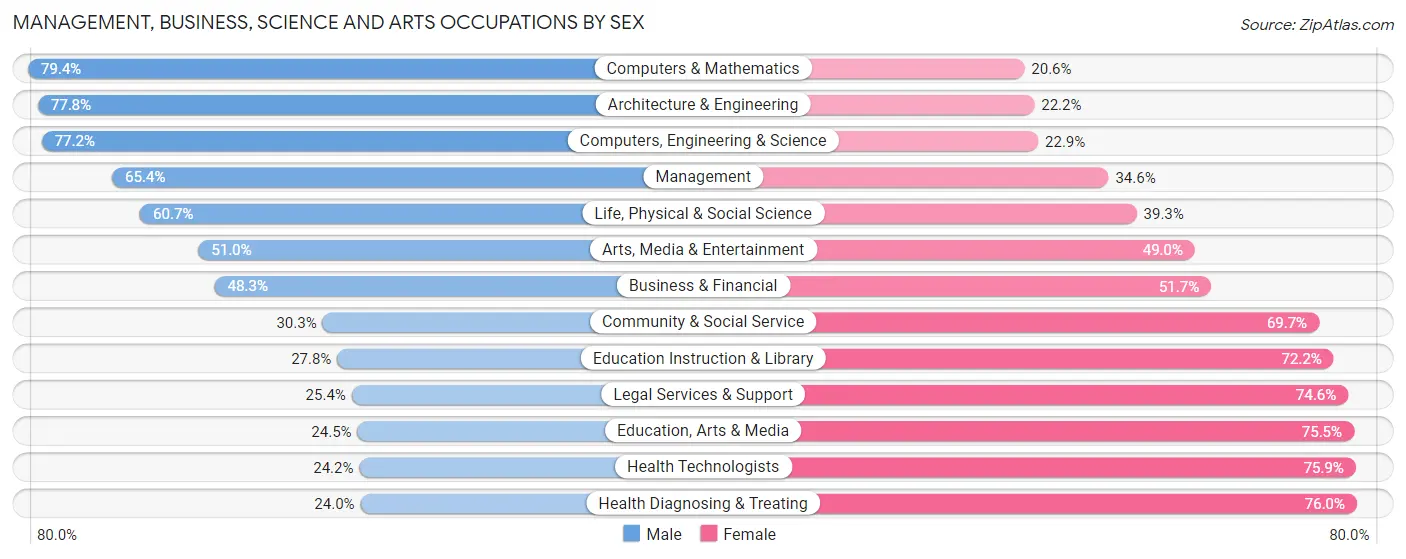
Management, Business, Science and Arts Occupations by Sex
Within the Management, Business, Science and Arts occupations in Clarion County, the most male-oriented occupations are Computers & Mathematics (79.4%), Architecture & Engineering (77.8%), and Computers, Engineering & Science (77.1%), while the most female-oriented occupations are Health Diagnosing & Treating (76.0%), Health Technologists (75.8%), and Education, Arts & Media (75.5%).
| Occupation | Male | Female |
| Management | 858 (65.4%) | 454 (34.6%) |
| Business & Financial | 284 (48.3%) | 304 (51.7%) |
| Computers, Engineering & Science | 520 (77.1%) | 154 (22.9%) |
| Computers & Mathematics | 255 (79.4%) | 66 (20.6%) |
| Architecture & Engineering | 231 (77.8%) | 66 (22.2%) |
| Life, Physical & Social Science | 34 (60.7%) | 22 (39.3%) |
| Community & Social Service | 528 (30.3%) | 1,215 (69.7%) |
| Education, Arts & Media | 90 (24.5%) | 278 (75.5%) |
| Legal Services & Support | 30 (25.4%) | 88 (74.6%) |
| Education Instruction & Library | 280 (27.8%) | 726 (72.2%) |
| Arts, Media & Entertainment | 128 (51.0%) | 123 (49.0%) |
| Health Diagnosing & Treating | 300 (24.0%) | 952 (76.0%) |
| Health Technologists | 164 (24.1%) | 515 (75.8%) |
| Total (Category) | 2,490 (44.7%) | 3,079 (55.3%) |
| Total (Overall) | 9,366 (53.9%) | 8,010 (46.1%) |
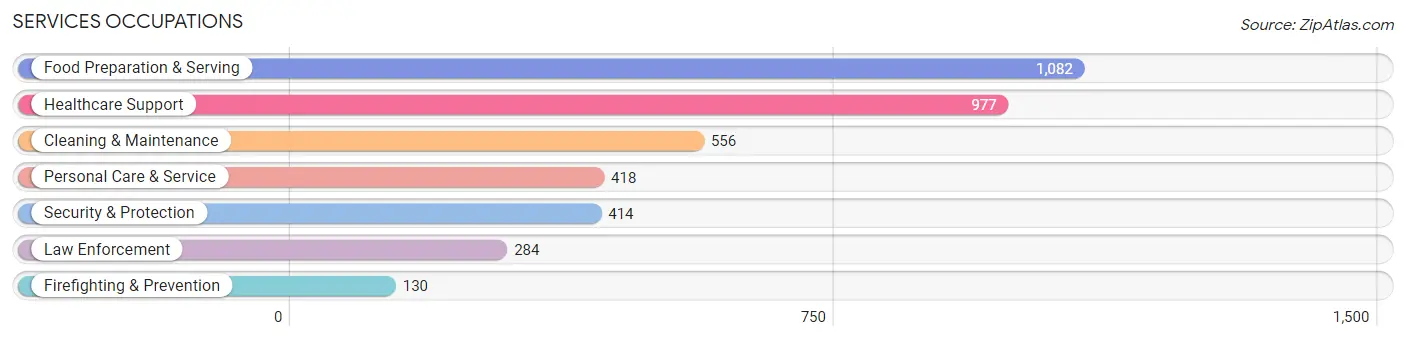
Services Occupations
The most common Services occupations in Clarion County are Food Preparation & Serving (1,082 | 6.2%), Healthcare Support (977 | 5.6%), Cleaning & Maintenance (556 | 3.2%), Personal Care & Service (418 | 2.4%), and Security & Protection (414 | 2.4%).
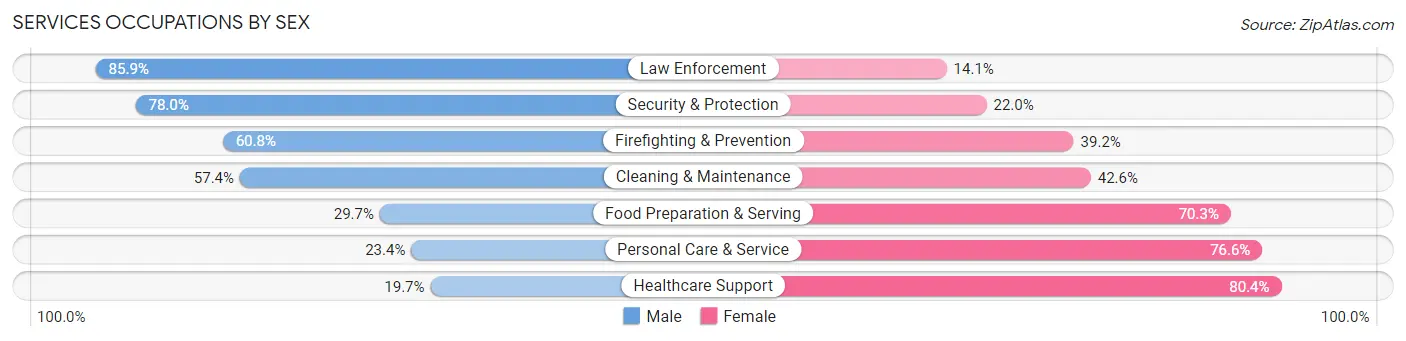
Services Occupations by Sex
Within the Services occupations in Clarion County, the most male-oriented occupations are Law Enforcement (85.9%), Security & Protection (78.0%), and Firefighting & Prevention (60.8%), while the most female-oriented occupations are Healthcare Support (80.3%), Personal Care & Service (76.6%), and Food Preparation & Serving (70.3%).
| Occupation | Male | Female |
| Healthcare Support | 192 (19.7%) | 785 (80.3%) |
| Security & Protection | 323 (78.0%) | 91 (22.0%) |
| Firefighting & Prevention | 79 (60.8%) | 51 (39.2%) |
| Law Enforcement | 244 (85.9%) | 40 (14.1%) |
| Food Preparation & Serving | 321 (29.7%) | 761 (70.3%) |
| Cleaning & Maintenance | 319 (57.4%) | 237 (42.6%) |
| Personal Care & Service | 98 (23.4%) | 320 (76.6%) |
| Total (Category) | 1,253 (36.3%) | 2,194 (63.6%) |
| Total (Overall) | 9,366 (53.9%) | 8,010 (46.1%) |
Sales and Office Occupations
The most common Sales and Office occupations in Clarion County are Office & Administration (1,712 | 9.9%), and Sales & Related (1,645 | 9.5%).
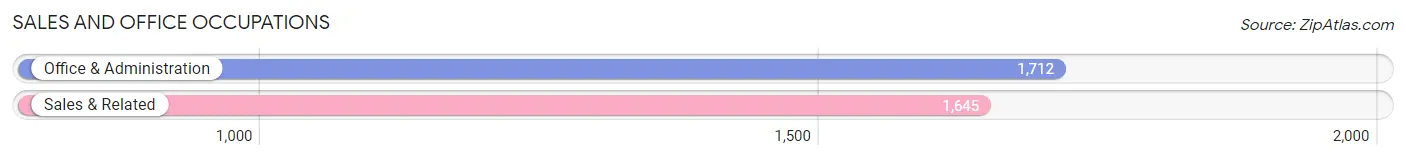
Sales and Office Occupations by Sex

| Occupation | Male | Female |
| Sales & Related | 898 (54.6%) | 747 (45.4%) |
| Office & Administration | 240 (14.0%) | 1,472 (86.0%) |
| Total (Category) | 1,138 (33.9%) | 2,219 (66.1%) |
| Total (Overall) | 9,366 (53.9%) | 8,010 (46.1%) |
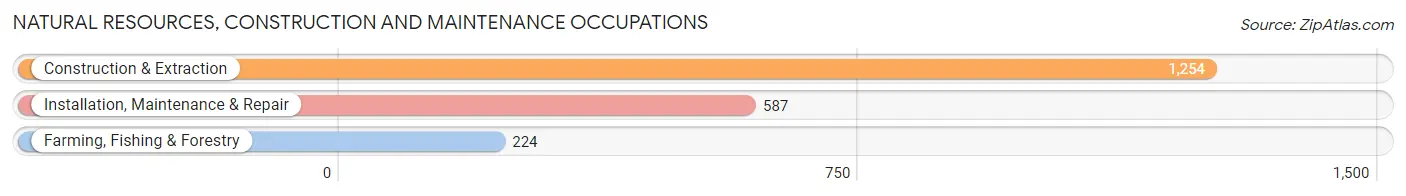
Natural Resources, Construction and Maintenance Occupations
The most common Natural Resources, Construction and Maintenance occupations in Clarion County are Construction & Extraction (1,254 | 7.2%), Installation, Maintenance & Repair (587 | 3.4%), and Farming, Fishing & Forestry (224 | 1.3%).
Natural Resources, Construction and Maintenance Occupations by Sex
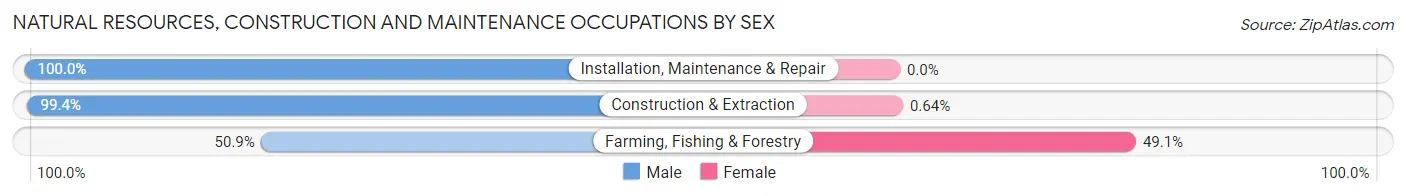
| Occupation | Male | Female |
| Farming, Fishing & Forestry | 114 (50.9%) | 110 (49.1%) |
| Construction & Extraction | 1,246 (99.4%) | 8 (0.6%) |
| Installation, Maintenance & Repair | 587 (100.0%) | 0 (0.0%) |
| Total (Category) | 1,947 (94.3%) | 118 (5.7%) |
| Total (Overall) | 9,366 (53.9%) | 8,010 (46.1%) |
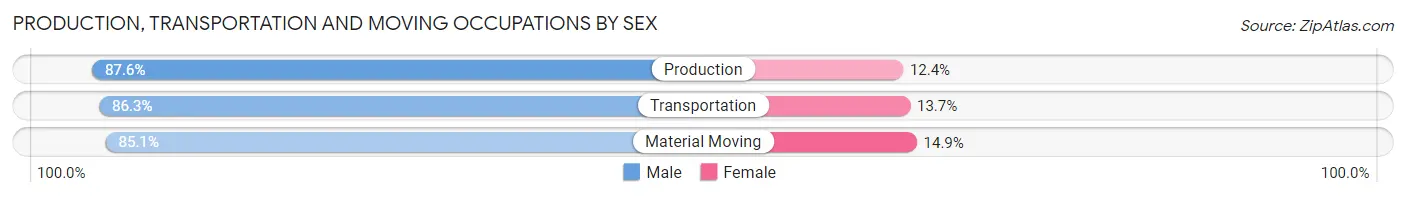
Production, Transportation and Moving Occupations
The most common Production, Transportation and Moving occupations in Clarion County are Production (1,116 | 6.4%), Material Moving (1,083 | 6.2%), and Transportation (739 | 4.3%).
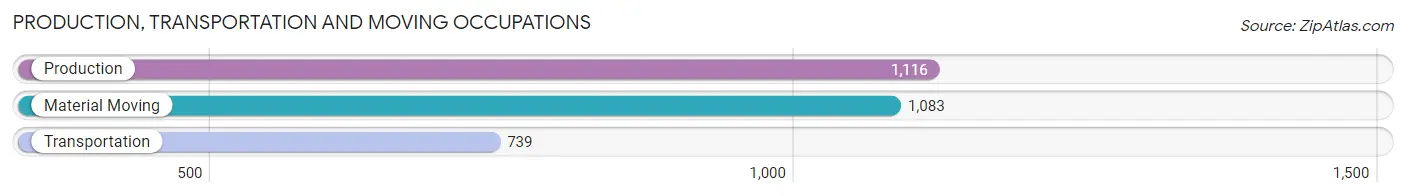
Production, Transportation and Moving Occupations by Sex
| Occupation | Male | Female |
| Production | 978 (87.6%) | 138 (12.4%) |
| Transportation | 638 (86.3%) | 101 (13.7%) |
| Material Moving | 922 (85.1%) | 161 (14.9%) |
| Total (Category) | 2,538 (86.4%) | 400 (13.6%) |
| Total (Overall) | 9,366 (53.9%) | 8,010 (46.1%) |
Employment Industries by Sex in Clarion County
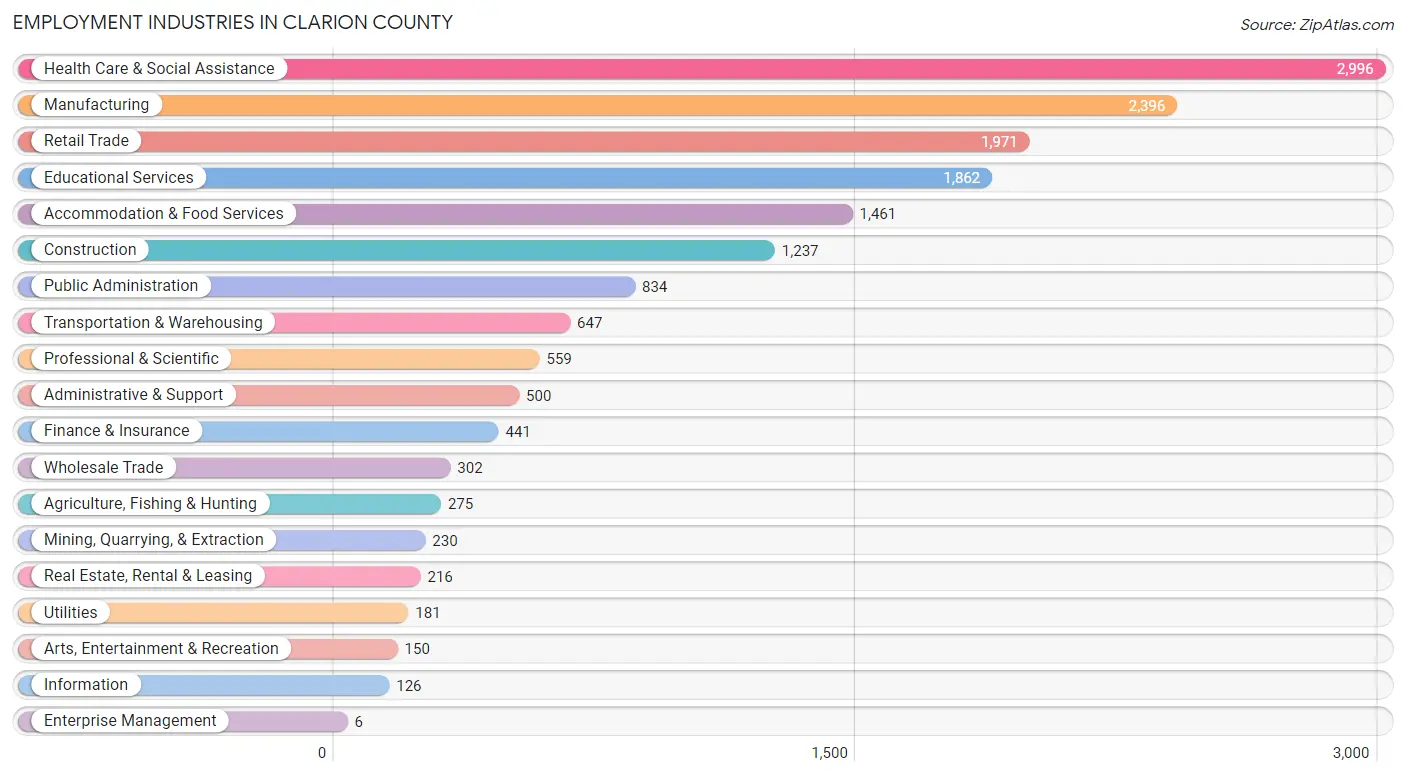
Employment Industries in Clarion County
The major employment industries in Clarion County include Health Care & Social Assistance (2,996 | 17.2%), Manufacturing (2,396 | 13.8%), Retail Trade (1,971 | 11.3%), Educational Services (1,862 | 10.7%), and Accommodation & Food Services (1,461 | 8.4%).
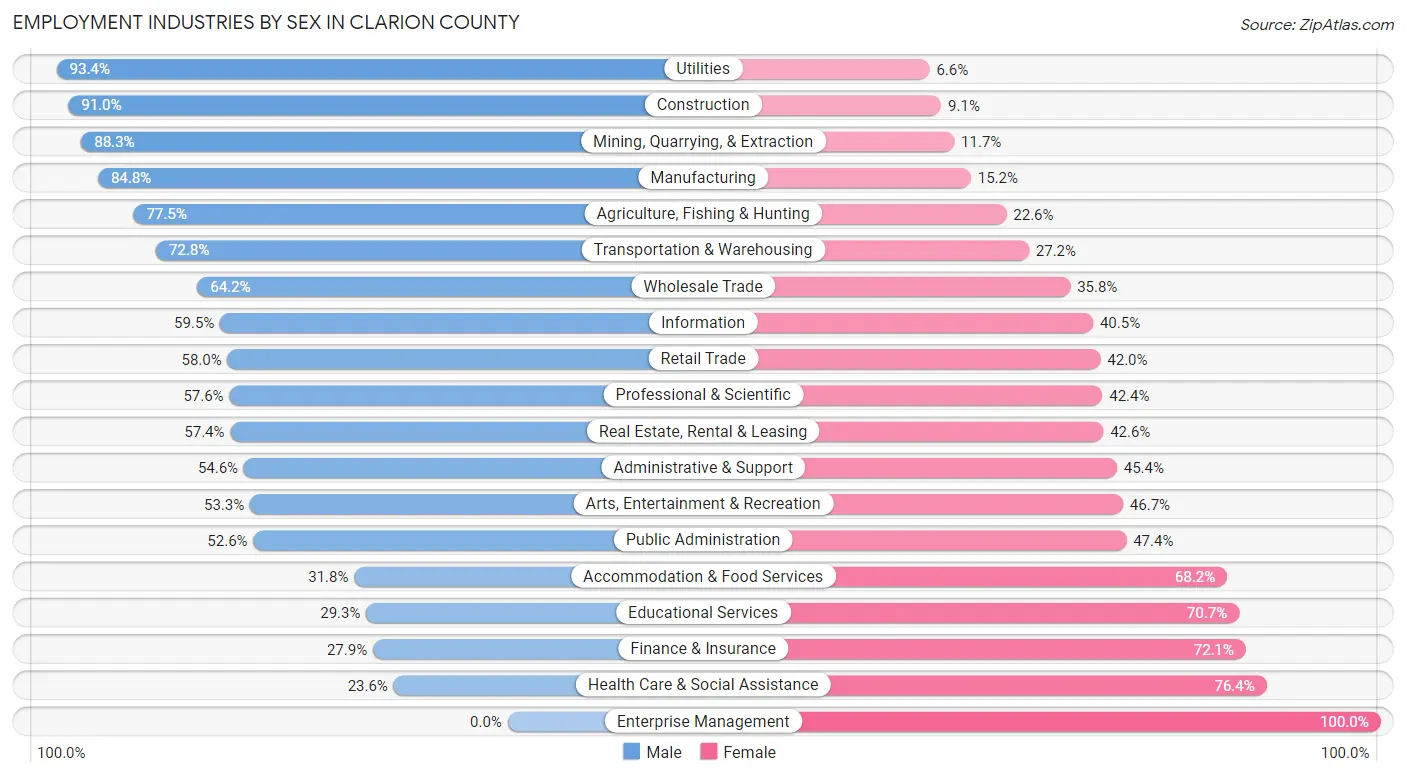
Employment Industries by Sex in Clarion County
The Clarion County industries that see more men than women are Utilities (93.4%), Construction (90.9%), and Mining, Quarrying, & Extraction (88.3%), whereas the industries that tend to have a higher number of women are Enterprise Management (100.0%), Health Care & Social Assistance (76.4%), and Finance & Insurance (72.1%).
| Industry | Male | Female |
| Agriculture, Fishing & Hunting | 213 (77.4%) | 62 (22.6%) |
| Mining, Quarrying, & Extraction | 203 (88.3%) | 27 (11.7%) |
| Construction | 1,125 (90.9%) | 112 (9.0%) |
| Manufacturing | 2,032 (84.8%) | 364 (15.2%) |
| Wholesale Trade | 194 (64.2%) | 108 (35.8%) |
| Retail Trade | 1,143 (58.0%) | 828 (42.0%) |
| Transportation & Warehousing | 471 (72.8%) | 176 (27.2%) |
| Utilities | 169 (93.4%) | 12 (6.6%) |
| Information | 75 (59.5%) | 51 (40.5%) |
| Finance & Insurance | 123 (27.9%) | 318 (72.1%) |
| Real Estate, Rental & Leasing | 124 (57.4%) | 92 (42.6%) |
| Professional & Scientific | 322 (57.6%) | 237 (42.4%) |
| Enterprise Management | 0 (0.0%) | 6 (100.0%) |
| Administrative & Support | 273 (54.6%) | 227 (45.4%) |
| Educational Services | 545 (29.3%) | 1,317 (70.7%) |
| Health Care & Social Assistance | 707 (23.6%) | 2,289 (76.4%) |
| Arts, Entertainment & Recreation | 80 (53.3%) | 70 (46.7%) |
| Accommodation & Food Services | 464 (31.8%) | 997 (68.2%) |
| Public Administration | 439 (52.6%) | 395 (47.4%) |
| Total | 9,366 (53.9%) | 8,010 (46.1%) |
Education in Clarion County
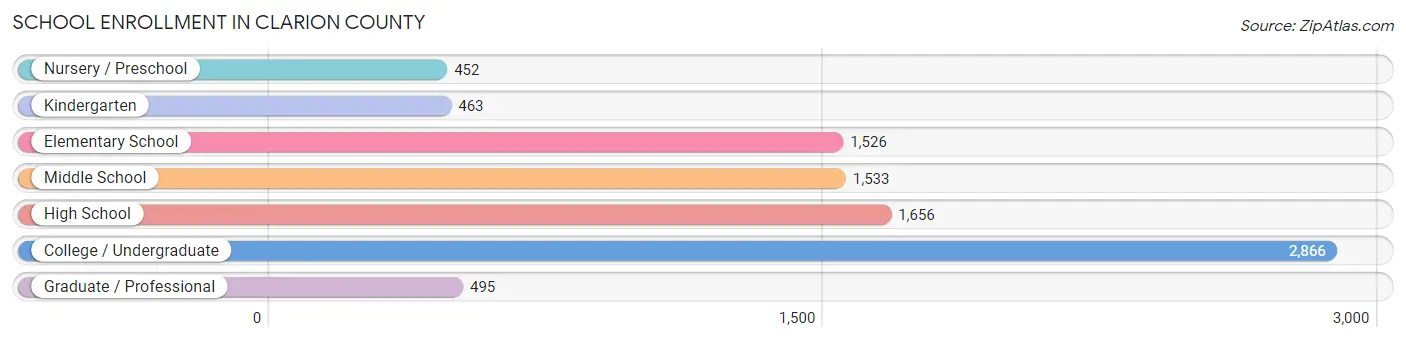
School Enrollment in Clarion County
The most common levels of schooling among the 8,991 students in Clarion County are college / undergraduate (2,866 | 31.9%), high school (1,656 | 18.4%), and middle school (1,533 | 17.1%).
| School Level | # Students | % Students |
| Nursery / Preschool | 452 | 5.0% |
| Kindergarten | 463 | 5.1% |
| Elementary School | 1,526 | 17.0% |
| Middle School | 1,533 | 17.1% |
| High School | 1,656 | 18.4% |
| College / Undergraduate | 2,866 | 31.9% |
| Graduate / Professional | 495 | 5.5% |
| Total | 8,991 | 100.0% |
School Enrollment by Age by Funding Source in Clarion County
Out of a total of 8,991 students who are enrolled in schools in Clarion County, 1,340 (14.9%) attend a private institution, while the remaining 7,651 (85.1%) are enrolled in public schools. The age group of 25 to 34 year olds has the highest likelihood of being enrolled in private schools, with 86 (25.0% in the age bracket) enrolled. Conversely, the age group of 15 to 17 year olds has the lowest likelihood of being enrolled in a private school, with 1,046 (93.6% in the age bracket) attending a public institution.
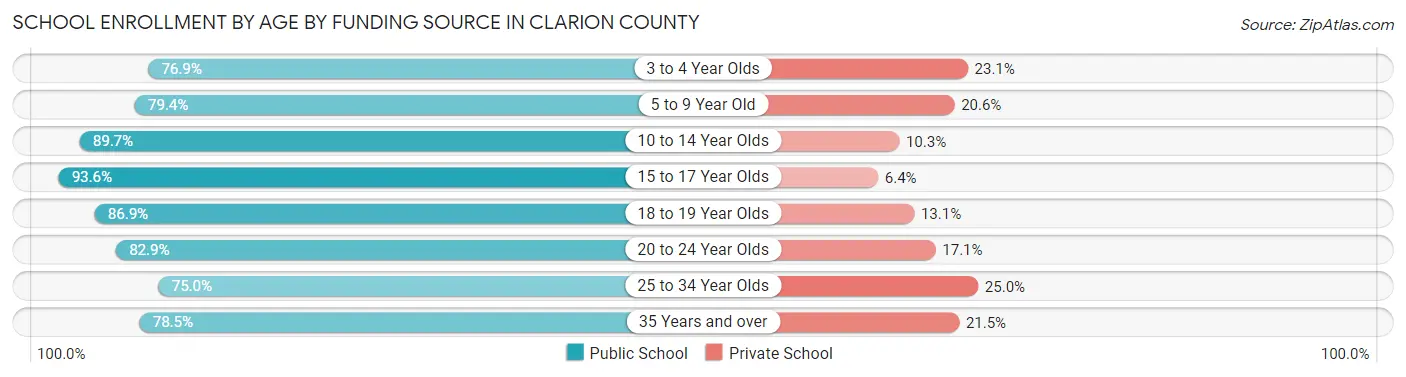
| Age Bracket | Public School | Private School |
| 3 to 4 Year Olds | 280 (76.9%) | 84 (23.1%) |
| 5 to 9 Year Old | 1,396 (79.4%) | 362 (20.6%) |
| 10 to 14 Year Olds | 1,777 (89.7%) | 204 (10.3%) |
| 15 to 17 Year Olds | 1,046 (93.6%) | 71 (6.4%) |
| 18 to 19 Year Olds | 1,260 (86.9%) | 190 (13.1%) |
| 20 to 24 Year Olds | 1,481 (82.9%) | 305 (17.1%) |
| 25 to 34 Year Olds | 258 (75.0%) | 86 (25.0%) |
| 35 Years and over | 150 (78.5%) | 41 (21.5%) |
| Total | 7,651 (85.1%) | 1,340 (14.9%) |
Educational Attainment by Field of Study in Clarion County
Education (1,528 | 24.7%), business (1,082 | 17.5%), science & technology (760 | 12.3%), arts & humanities (373 | 6.0%), and bio, nature & agricultural (372 | 6.0%) are the most common fields of study among 6,195 individuals in Clarion County who have obtained a bachelor's degree or higher.
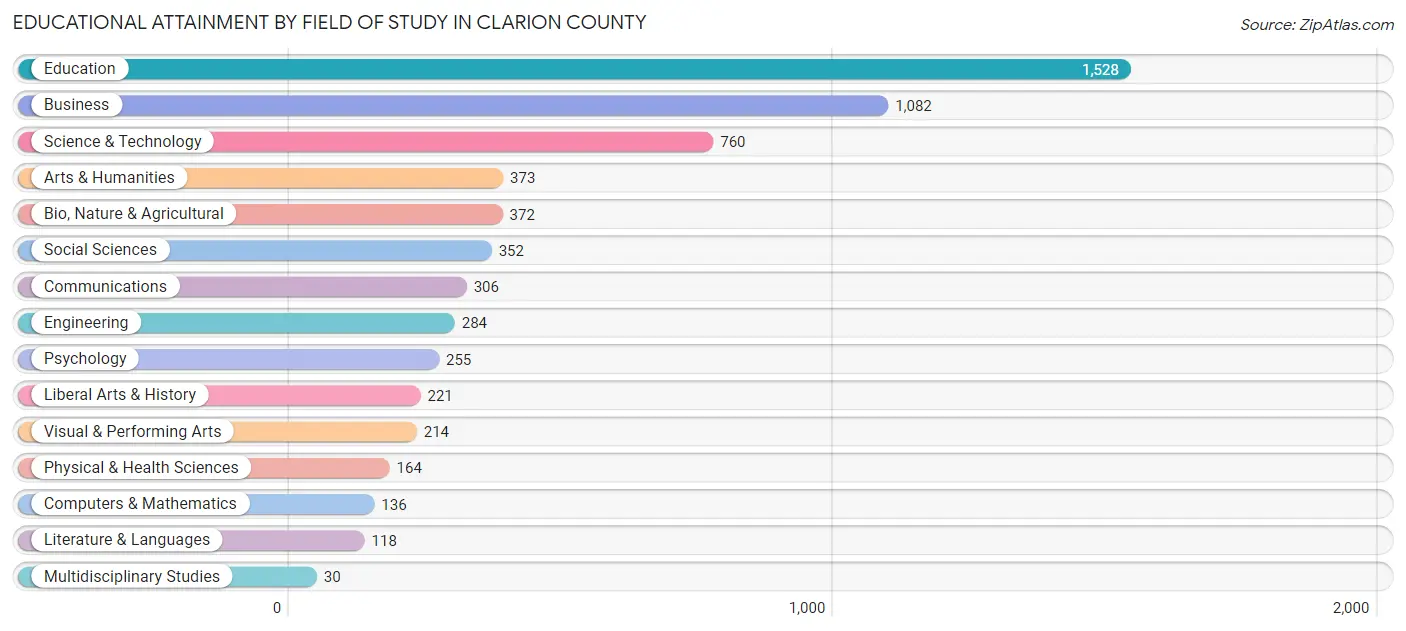
| Field of Study | # Graduates | % Graduates |
| Computers & Mathematics | 136 | 2.2% |
| Bio, Nature & Agricultural | 372 | 6.0% |
| Physical & Health Sciences | 164 | 2.6% |
| Psychology | 255 | 4.1% |
| Social Sciences | 352 | 5.7% |
| Engineering | 284 | 4.6% |
| Multidisciplinary Studies | 30 | 0.5% |
| Science & Technology | 760 | 12.3% |
| Business | 1,082 | 17.5% |
| Education | 1,528 | 24.7% |
| Literature & Languages | 118 | 1.9% |
| Liberal Arts & History | 221 | 3.6% |
| Visual & Performing Arts | 214 | 3.5% |
| Communications | 306 | 4.9% |
| Arts & Humanities | 373 | 6.0% |
| Total | 6,195 | 100.0% |
Transportation & Commute in Clarion County
Vehicle Availability by Sex in Clarion County
The most prevalent vehicle ownership categories in Clarion County are males with 2 vehicles (3,916, accounting for 43.2%) and females with 2 vehicles (3,219, making up 52.4%).
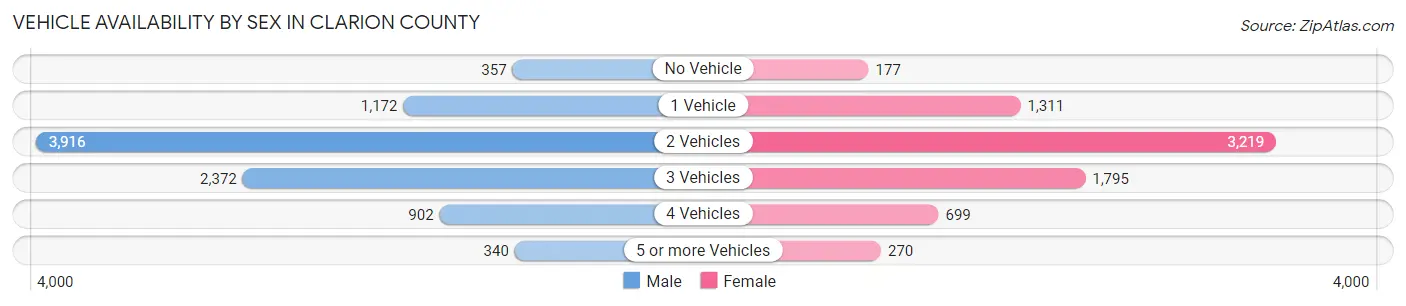
| Vehicles Available | Male | Female |
| No Vehicle | 357 (3.9%) | 177 (2.4%) |
| 1 Vehicle | 1,172 (12.9%) | 1,311 (17.5%) |
| 2 Vehicles | 3,916 (43.2%) | 3,219 (43.1%) |
| 3 Vehicles | 2,372 (26.2%) | 1,795 (24.0%) |
| 4 Vehicles | 902 (10.0%) | 699 (9.4%) |
| 5 or more Vehicles | 340 (3.7%) | 270 (3.6%) |
| Total | 9,059 (100.0%) | 7,471 (100.0%) |
Commute Time in Clarion County
The most frequently occuring commute durations in Clarion County are 5 to 9 minutes (2,703 commuters, 17.2%), 20 to 24 minutes (2,232 commuters, 14.2%), and 10 to 14 minutes (2,150 commuters, 13.7%).
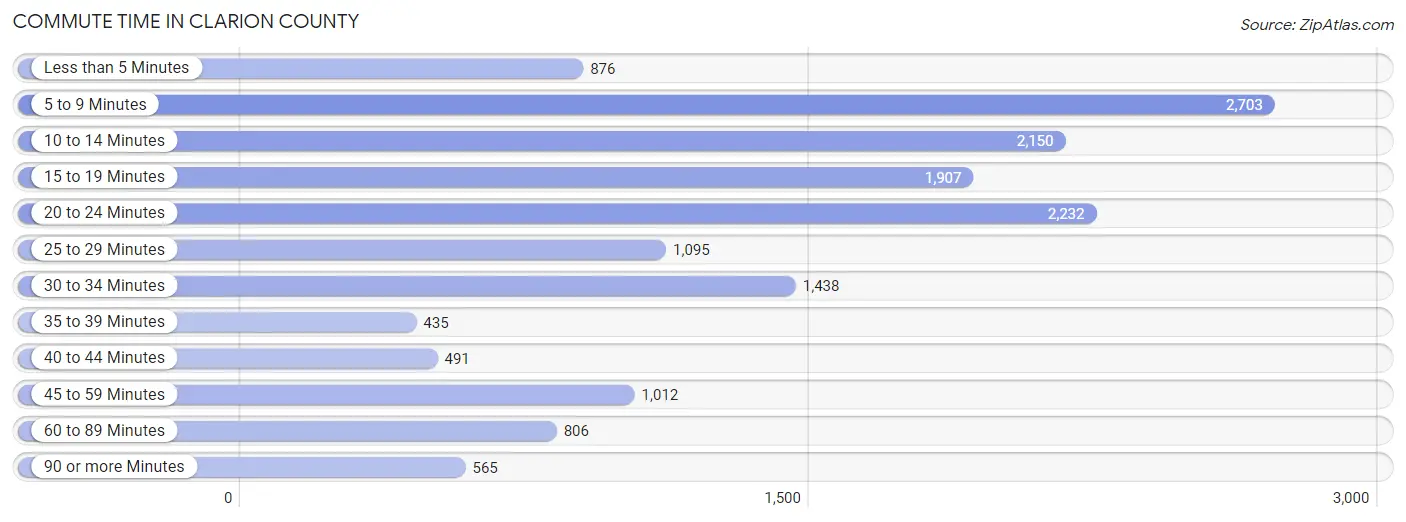
| Commute Time | # Commuters | % Commuters |
| Less than 5 Minutes | 876 | 5.6% |
| 5 to 9 Minutes | 2,703 | 17.2% |
| 10 to 14 Minutes | 2,150 | 13.7% |
| 15 to 19 Minutes | 1,907 | 12.1% |
| 20 to 24 Minutes | 2,232 | 14.2% |
| 25 to 29 Minutes | 1,095 | 7.0% |
| 30 to 34 Minutes | 1,438 | 9.1% |
| 35 to 39 Minutes | 435 | 2.8% |
| 40 to 44 Minutes | 491 | 3.1% |
| 45 to 59 Minutes | 1,012 | 6.4% |
| 60 to 89 Minutes | 806 | 5.1% |
| 90 or more Minutes | 565 | 3.6% |
Commute Time by Sex in Clarion County
The most common commute times in Clarion County are 5 to 9 minutes (1,346 commuters, 15.6%) for males and 5 to 9 minutes (1,357 commuters, 19.1%) for females.
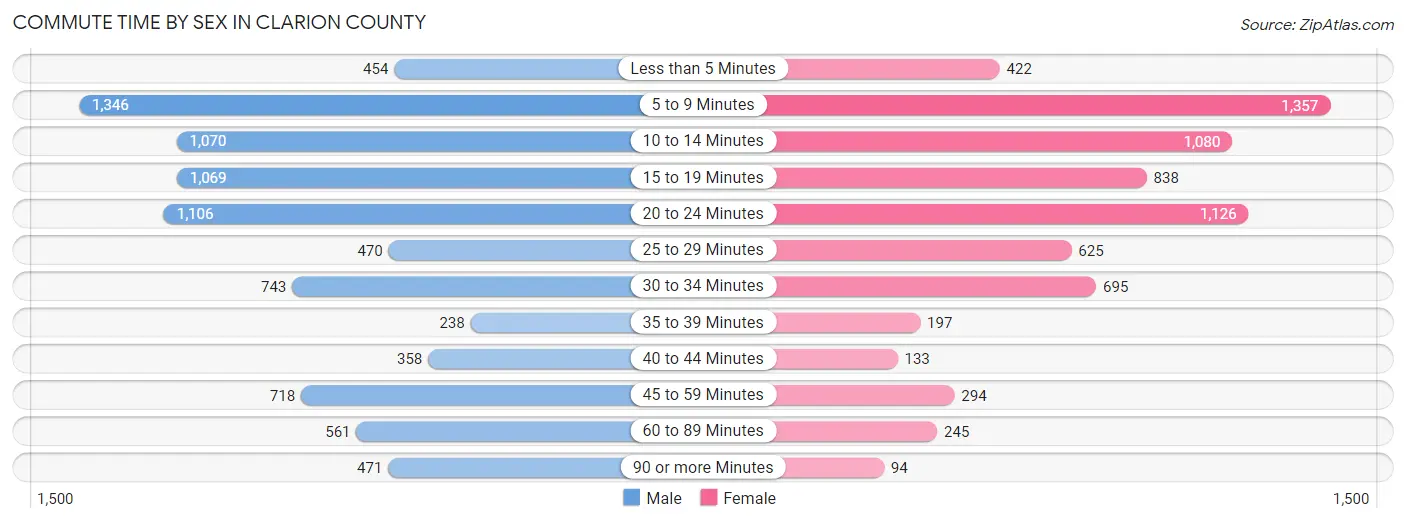
| Commute Time | Male | Female |
| Less than 5 Minutes | 454 (5.3%) | 422 (5.9%) |
| 5 to 9 Minutes | 1,346 (15.6%) | 1,357 (19.1%) |
| 10 to 14 Minutes | 1,070 (12.4%) | 1,080 (15.2%) |
| 15 to 19 Minutes | 1,069 (12.4%) | 838 (11.8%) |
| 20 to 24 Minutes | 1,106 (12.9%) | 1,126 (15.9%) |
| 25 to 29 Minutes | 470 (5.5%) | 625 (8.8%) |
| 30 to 34 Minutes | 743 (8.6%) | 695 (9.8%) |
| 35 to 39 Minutes | 238 (2.8%) | 197 (2.8%) |
| 40 to 44 Minutes | 358 (4.2%) | 133 (1.9%) |
| 45 to 59 Minutes | 718 (8.3%) | 294 (4.1%) |
| 60 to 89 Minutes | 561 (6.5%) | 245 (3.5%) |
| 90 or more Minutes | 471 (5.5%) | 94 (1.3%) |
Time of Departure to Work by Sex in Clarion County
The most frequent times of departure to work in Clarion County are 6:00 AM to 6:29 AM (1,089, 12.7%) for males and 7:30 AM to 7:59 AM (1,019, 14.3%) for females.
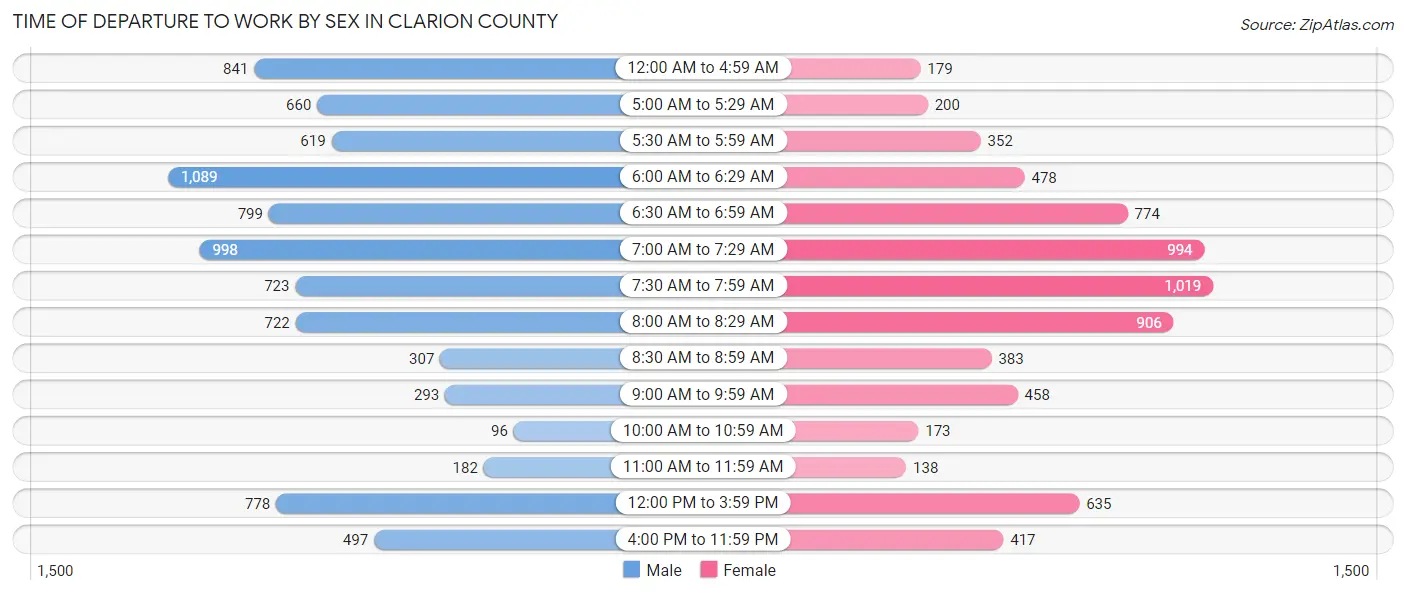
| Time of Departure | Male | Female |
| 12:00 AM to 4:59 AM | 841 (9.8%) | 179 (2.5%) |
| 5:00 AM to 5:29 AM | 660 (7.7%) | 200 (2.8%) |
| 5:30 AM to 5:59 AM | 619 (7.2%) | 352 (5.0%) |
| 6:00 AM to 6:29 AM | 1,089 (12.7%) | 478 (6.7%) |
| 6:30 AM to 6:59 AM | 799 (9.3%) | 774 (10.9%) |
| 7:00 AM to 7:29 AM | 998 (11.6%) | 994 (14.0%) |
| 7:30 AM to 7:59 AM | 723 (8.4%) | 1,019 (14.3%) |
| 8:00 AM to 8:29 AM | 722 (8.4%) | 906 (12.8%) |
| 8:30 AM to 8:59 AM | 307 (3.6%) | 383 (5.4%) |
| 9:00 AM to 9:59 AM | 293 (3.4%) | 458 (6.5%) |
| 10:00 AM to 10:59 AM | 96 (1.1%) | 173 (2.4%) |
| 11:00 AM to 11:59 AM | 182 (2.1%) | 138 (1.9%) |
| 12:00 PM to 3:59 PM | 778 (9.0%) | 635 (8.9%) |
| 4:00 PM to 11:59 PM | 497 (5.8%) | 417 (5.9%) |
| Total | 8,604 (100.0%) | 7,106 (100.0%) |
Housing Occupancy in Clarion County
Occupancy by Ownership in Clarion County
Of the total 14,808 dwellings in Clarion County, owner-occupied units account for 10,584 (71.5%), while renter-occupied units make up 4,224 (28.5%).
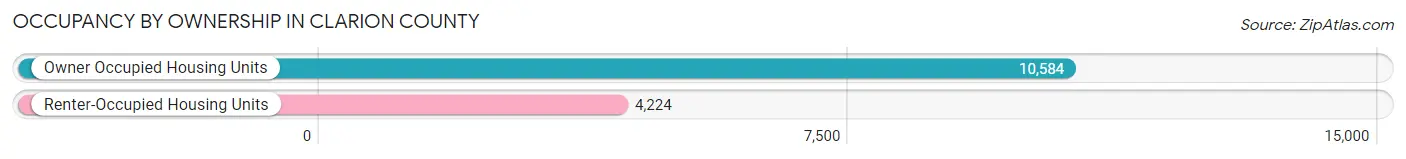
| Occupancy | # Housing Units | % Housing Units |
| Owner Occupied Housing Units | 10,584 | 71.5% |
| Renter-Occupied Housing Units | 4,224 | 28.5% |
| Total Occupied Housing Units | 14,808 | 100.0% |
Occupancy by Household Size in Clarion County
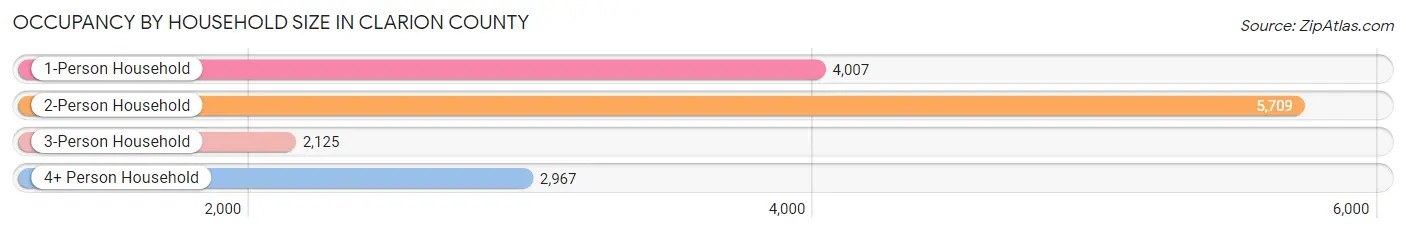
| Household Size | # Housing Units | % Housing Units |
| 1-Person Household | 4,007 | 27.1% |
| 2-Person Household | 5,709 | 38.6% |
| 3-Person Household | 2,125 | 14.3% |
| 4+ Person Household | 2,967 | 20.0% |
| Total Housing Units | 14,808 | 100.0% |
Occupancy by Ownership by Household Size in Clarion County
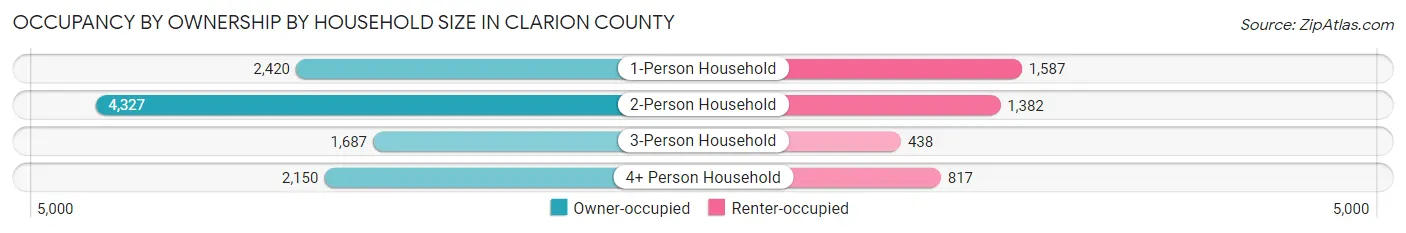
| Household Size | Owner-occupied | Renter-occupied |
| 1-Person Household | 2,420 (60.4%) | 1,587 (39.6%) |
| 2-Person Household | 4,327 (75.8%) | 1,382 (24.2%) |
| 3-Person Household | 1,687 (79.4%) | 438 (20.6%) |
| 4+ Person Household | 2,150 (72.5%) | 817 (27.5%) |
| Total Housing Units | 10,584 (71.5%) | 4,224 (28.5%) |
Occupancy by Educational Attainment in Clarion County
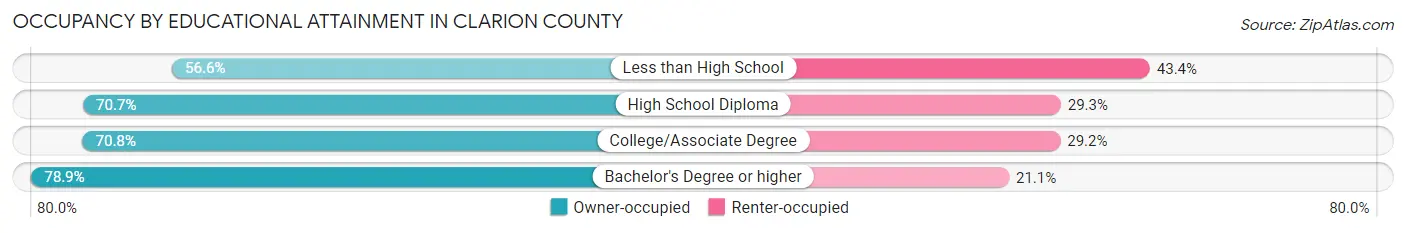
| Household Size | Owner-occupied | Renter-occupied |
| Less than High School | 730 (56.6%) | 560 (43.4%) |
| High School Diploma | 4,597 (70.7%) | 1,904 (29.3%) |
| College/Associate Degree | 2,445 (70.8%) | 1,009 (29.2%) |
| Bachelor's Degree or higher | 2,812 (78.9%) | 751 (21.1%) |
Occupancy by Age of Householder in Clarion County
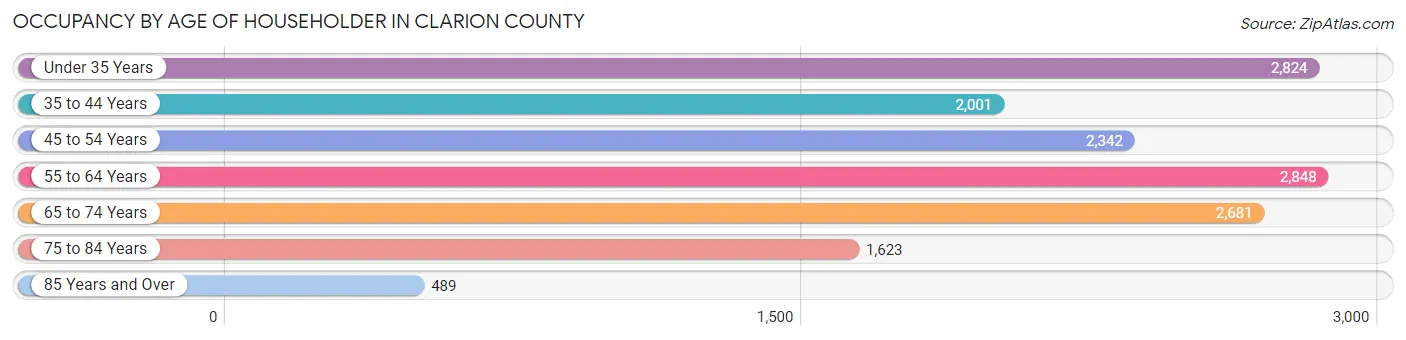
| Age Bracket | # Households | % Households |
| Under 35 Years | 2,824 | 19.1% |
| 35 to 44 Years | 2,001 | 13.5% |
| 45 to 54 Years | 2,342 | 15.8% |
| 55 to 64 Years | 2,848 | 19.2% |
| 65 to 74 Years | 2,681 | 18.1% |
| 75 to 84 Years | 1,623 | 11.0% |
| 85 Years and Over | 489 | 3.3% |
| Total | 14,808 | 100.0% |
Housing Finances in Clarion County
Median Income by Occupancy in Clarion County
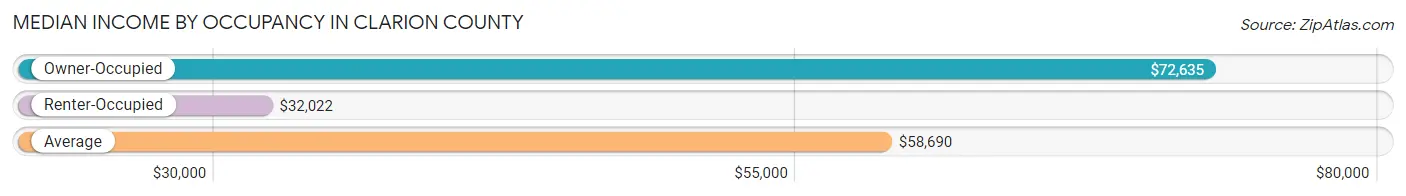
| Occupancy Type | # Households | Median Income |
| Owner-Occupied | 10,584 (71.5%) | $72,635 |
| Renter-Occupied | 4,224 (28.5%) | $32,022 |
| Average | 14,808 (100.0%) | $58,690 |
Occupancy by Householder Income Bracket in Clarion County
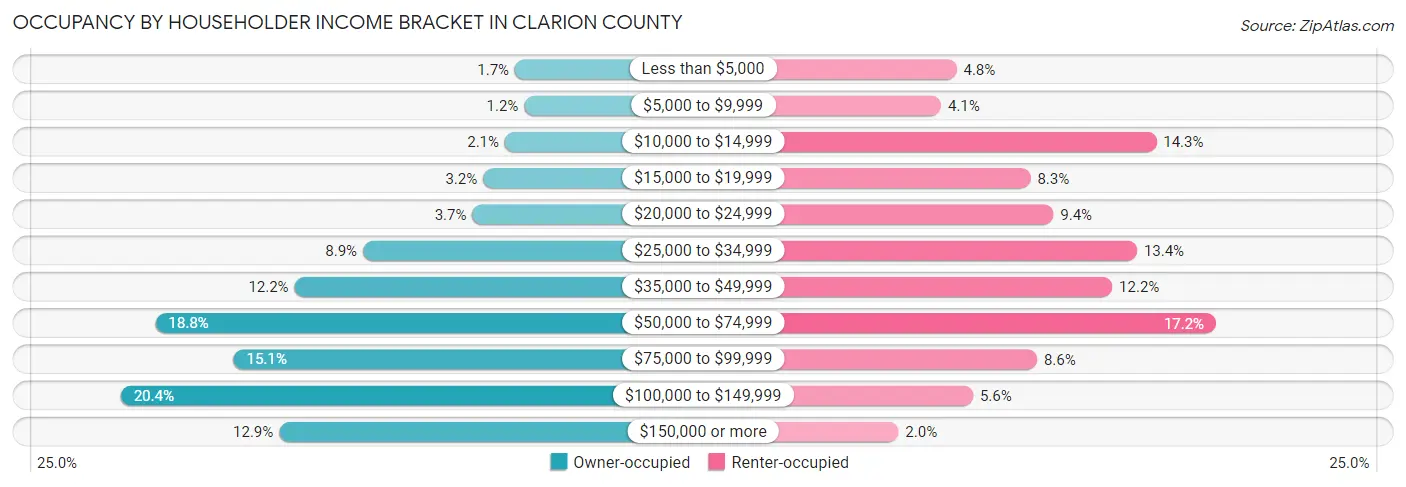
| Income Bracket | Owner-occupied | Renter-occupied |
| Less than $5,000 | 175 (1.7%) | 203 (4.8%) |
| $5,000 to $9,999 | 128 (1.2%) | 172 (4.1%) |
| $10,000 to $14,999 | 225 (2.1%) | 605 (14.3%) |
| $15,000 to $19,999 | 335 (3.2%) | 352 (8.3%) |
| $20,000 to $24,999 | 390 (3.7%) | 398 (9.4%) |
| $25,000 to $34,999 | 941 (8.9%) | 566 (13.4%) |
| $35,000 to $49,999 | 1,286 (12.1%) | 516 (12.2%) |
| $50,000 to $74,999 | 1,987 (18.8%) | 725 (17.2%) |
| $75,000 to $99,999 | 1,593 (15.0%) | 365 (8.6%) |
| $100,000 to $149,999 | 2,161 (20.4%) | 236 (5.6%) |
| $150,000 or more | 1,363 (12.9%) | 86 (2.0%) |
| Total | 10,584 (100.0%) | 4,224 (100.0%) |
Monthly Housing Cost Tiers in Clarion County
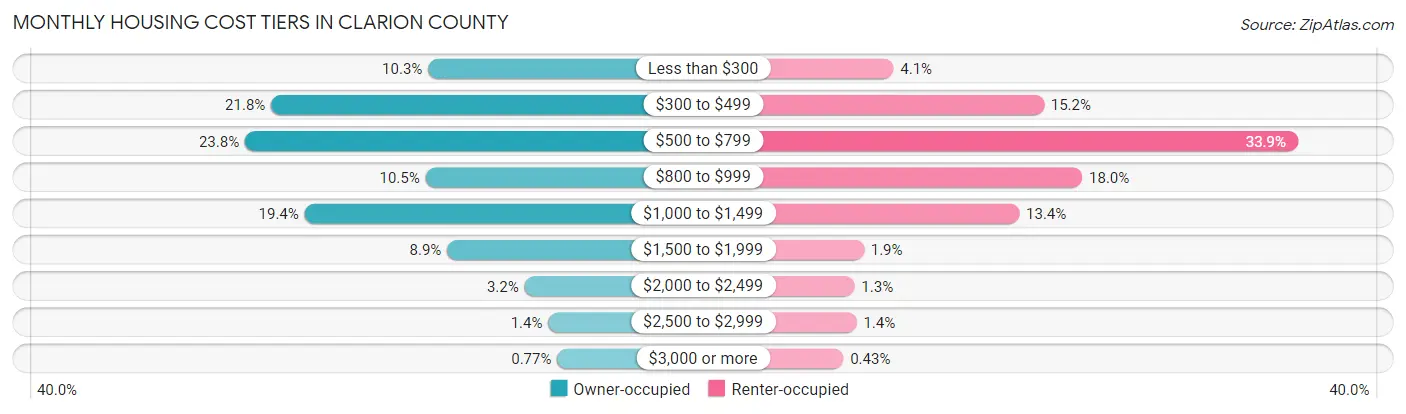
| Monthly Cost | Owner-occupied | Renter-occupied |
| Less than $300 | 1,088 (10.3%) | 174 (4.1%) |
| $300 to $499 | 2,312 (21.8%) | 642 (15.2%) |
| $500 to $799 | 2,516 (23.8%) | 1,432 (33.9%) |
| $800 to $999 | 1,108 (10.5%) | 761 (18.0%) |
| $1,000 to $1,499 | 2,051 (19.4%) | 565 (13.4%) |
| $1,500 to $1,999 | 940 (8.9%) | 82 (1.9%) |
| $2,000 to $2,499 | 337 (3.2%) | 53 (1.3%) |
| $2,500 to $2,999 | 151 (1.4%) | 59 (1.4%) |
| $3,000 or more | 81 (0.8%) | 18 (0.4%) |
| Total | 10,584 (100.0%) | 4,224 (100.0%) |
Physical Housing Characteristics in Clarion County
Housing Structures in Clarion County
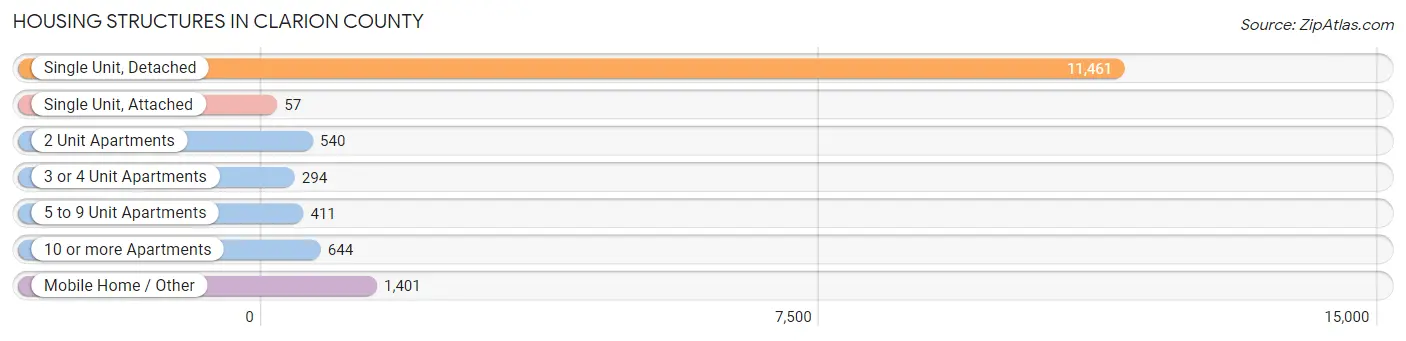
| Structure Type | # Housing Units | % Housing Units |
| Single Unit, Detached | 11,461 | 77.4% |
| Single Unit, Attached | 57 | 0.4% |
| 2 Unit Apartments | 540 | 3.6% |
| 3 or 4 Unit Apartments | 294 | 2.0% |
| 5 to 9 Unit Apartments | 411 | 2.8% |
| 10 or more Apartments | 644 | 4.3% |
| Mobile Home / Other | 1,401 | 9.5% |
| Total | 14,808 | 100.0% |
Housing Structures by Occupancy in Clarion County
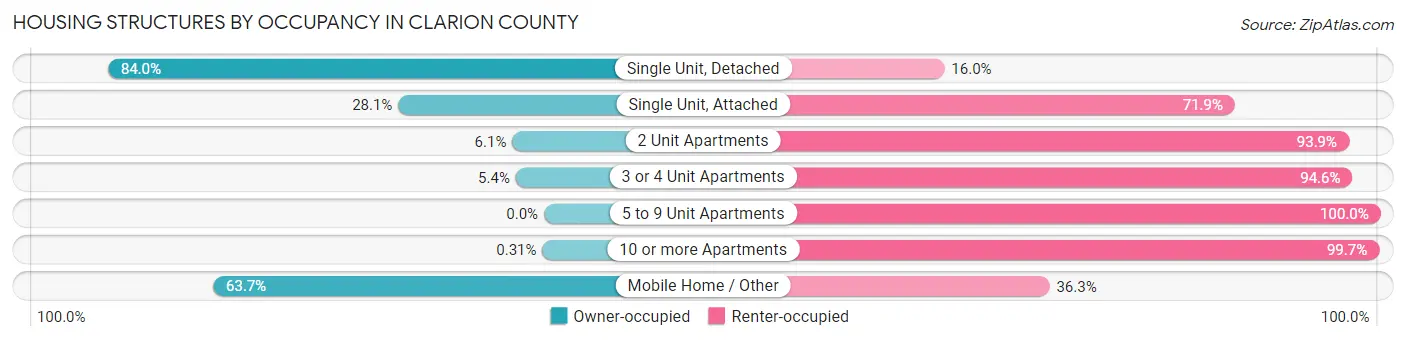
| Structure Type | Owner-occupied | Renter-occupied |
| Single Unit, Detached | 9,624 (84.0%) | 1,837 (16.0%) |
| Single Unit, Attached | 16 (28.1%) | 41 (71.9%) |
| 2 Unit Apartments | 33 (6.1%) | 507 (93.9%) |
| 3 or 4 Unit Apartments | 16 (5.4%) | 278 (94.6%) |
| 5 to 9 Unit Apartments | 0 (0.0%) | 411 (100.0%) |
| 10 or more Apartments | 2 (0.3%) | 642 (99.7%) |
| Mobile Home / Other | 893 (63.7%) | 508 (36.3%) |
| Total | 10,584 (71.5%) | 4,224 (28.5%) |
Housing Structures by Number of Rooms in Clarion County
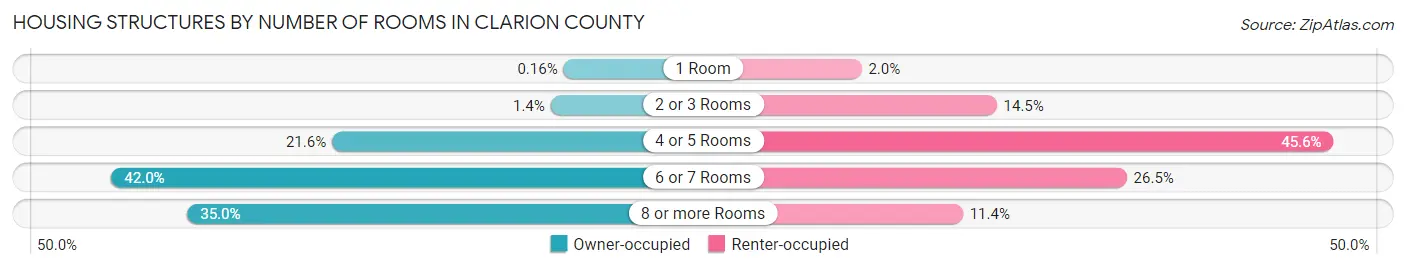
| Number of Rooms | Owner-occupied | Renter-occupied |
| 1 Room | 17 (0.2%) | 84 (2.0%) |
| 2 or 3 Rooms | 143 (1.3%) | 612 (14.5%) |
| 4 or 5 Rooms | 2,283 (21.6%) | 1,928 (45.6%) |
| 6 or 7 Rooms | 4,442 (42.0%) | 1,120 (26.5%) |
| 8 or more Rooms | 3,699 (34.9%) | 480 (11.4%) |
| Total | 10,584 (100.0%) | 4,224 (100.0%) |
Housing Structure by Heating Type in Clarion County
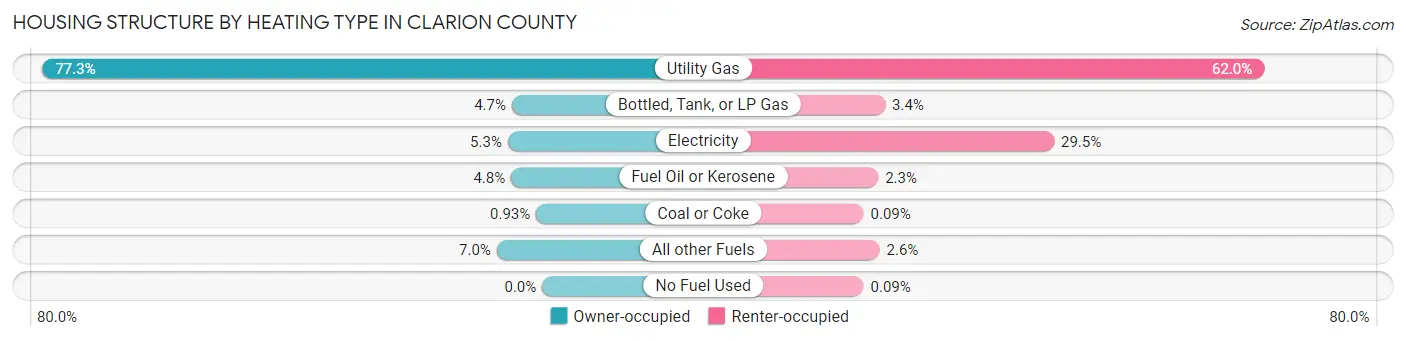
| Heating Type | Owner-occupied | Renter-occupied |
| Utility Gas | 8,178 (77.3%) | 2,618 (62.0%) |
| Bottled, Tank, or LP Gas | 495 (4.7%) | 144 (3.4%) |
| Electricity | 562 (5.3%) | 1,247 (29.5%) |
| Fuel Oil or Kerosene | 508 (4.8%) | 99 (2.3%) |
| Coal or Coke | 98 (0.9%) | 4 (0.1%) |
| All other Fuels | 743 (7.0%) | 108 (2.6%) |
| No Fuel Used | 0 (0.0%) | 4 (0.1%) |
| Total | 10,584 (100.0%) | 4,224 (100.0%) |
Household Vehicle Usage in Clarion County
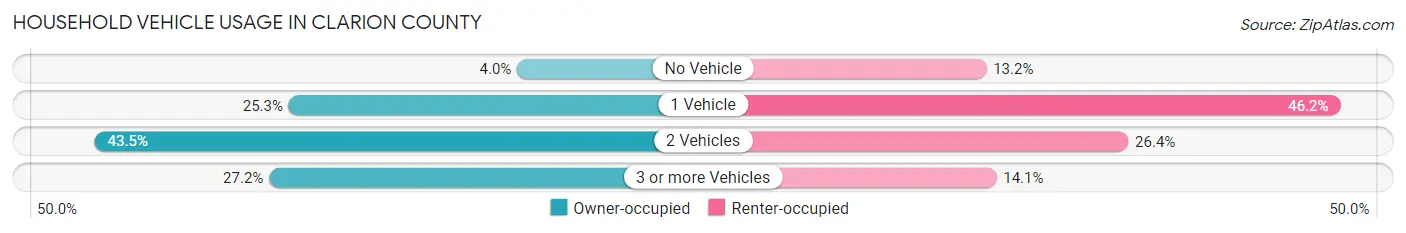
| Vehicles per Household | Owner-occupied | Renter-occupied |
| No Vehicle | 426 (4.0%) | 557 (13.2%) |
| 1 Vehicle | 2,682 (25.3%) | 1,953 (46.2%) |
| 2 Vehicles | 4,600 (43.5%) | 1,117 (26.4%) |
| 3 or more Vehicles | 2,876 (27.2%) | 597 (14.1%) |
| Total | 10,584 (100.0%) | 4,224 (100.0%) |
Real Estate & Mortgages in Clarion County
Real Estate and Mortgage Overview in Clarion County
| Characteristic | Without Mortgage | With Mortgage |
| Housing Units | 5,377 | 5,207 |
| Median Property Value | $123,800 | $159,900 |
| Median Household Income | $55,067 | $914 |
| Monthly Housing Costs | $442 | $72 |
| Real Estate Taxes | $1,358 | $60 |
Property Value by Mortgage Status in Clarion County
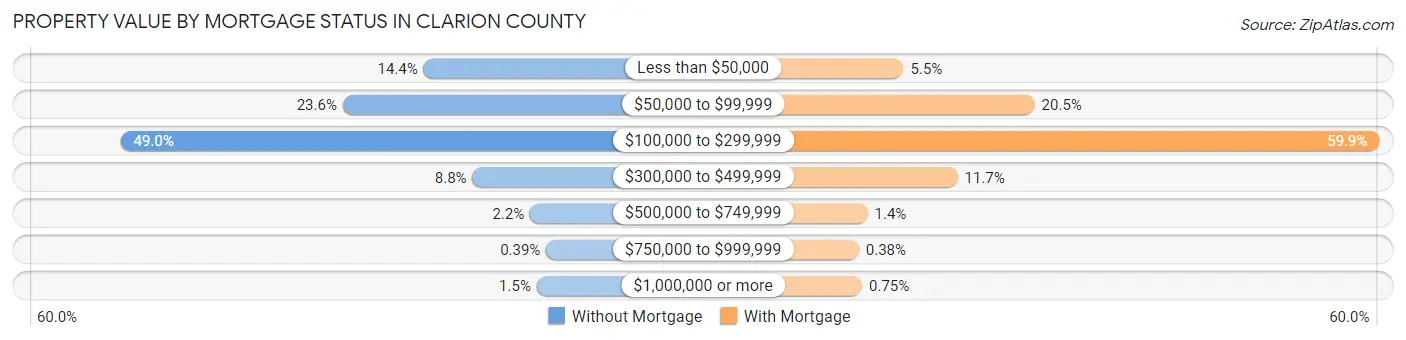
| Property Value | Without Mortgage | With Mortgage |
| Less than $50,000 | 775 (14.4%) | 286 (5.5%) |
| $50,000 to $99,999 | 1,271 (23.6%) | 1,066 (20.5%) |
| $100,000 to $299,999 | 2,637 (49.0%) | 3,117 (59.9%) |
| $300,000 to $499,999 | 474 (8.8%) | 607 (11.7%) |
| $500,000 to $749,999 | 120 (2.2%) | 72 (1.4%) |
| $750,000 to $999,999 | 21 (0.4%) | 20 (0.4%) |
| $1,000,000 or more | 79 (1.5%) | 39 (0.7%) |
| Total | 5,377 (100.0%) | 5,207 (100.0%) |
Household Income by Mortgage Status in Clarion County
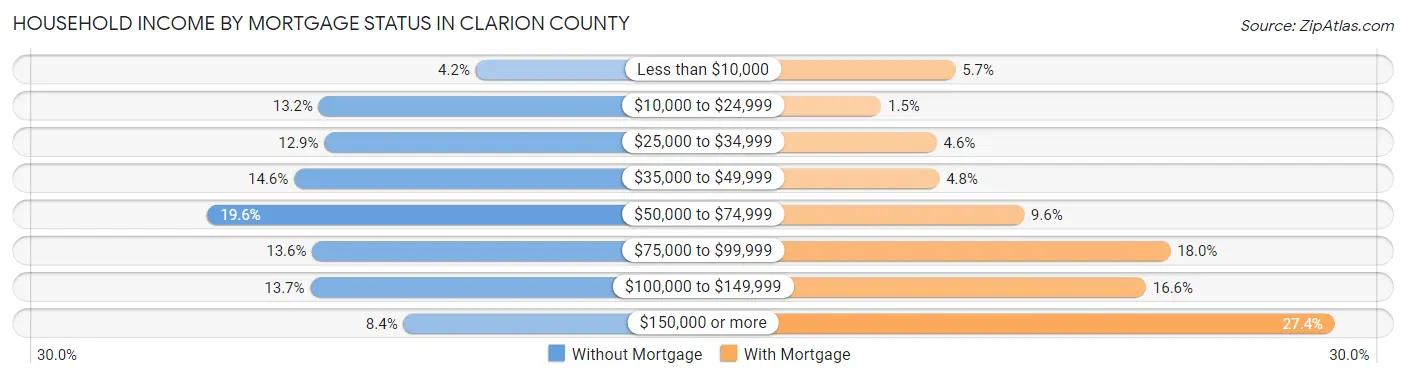
| Household Income | Without Mortgage | With Mortgage |
| Less than $10,000 | 227 (4.2%) | 297 (5.7%) |
| $10,000 to $24,999 | 709 (13.2%) | 76 (1.5%) |
| $25,000 to $34,999 | 692 (12.9%) | 241 (4.6%) |
| $35,000 to $49,999 | 785 (14.6%) | 249 (4.8%) |
| $50,000 to $74,999 | 1,051 (19.6%) | 501 (9.6%) |
| $75,000 to $99,999 | 729 (13.6%) | 936 (18.0%) |
| $100,000 to $149,999 | 735 (13.7%) | 864 (16.6%) |
| $150,000 or more | 449 (8.4%) | 1,426 (27.4%) |
| Total | 5,377 (100.0%) | 5,207 (100.0%) |
Property Value to Household Income Ratio in Clarion County
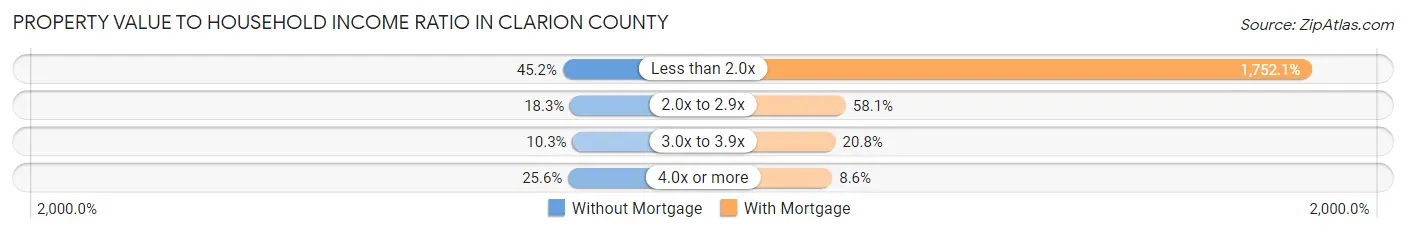
| Value-to-Income Ratio | Without Mortgage | With Mortgage |
| Less than 2.0x | 2,432 (45.2%) | 91,232 (1,752.1%) |
| 2.0x to 2.9x | 982 (18.3%) | 3,026 (58.1%) |
| 3.0x to 3.9x | 551 (10.2%) | 1,084 (20.8%) |
| 4.0x or more | 1,375 (25.6%) | 445 (8.6%) |
| Total | 5,377 (100.0%) | 5,207 (100.0%) |
Real Estate Taxes by Mortgage Status in Clarion County
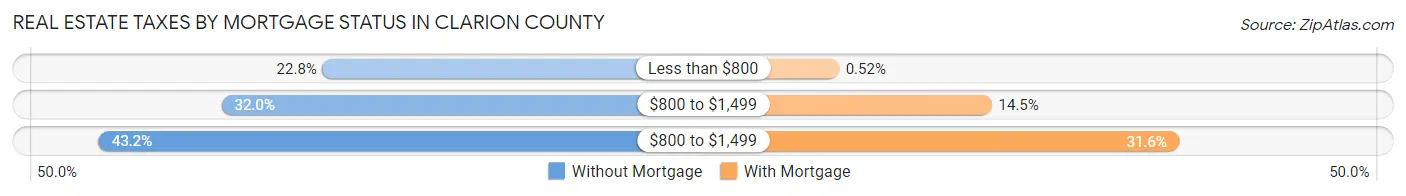
| Property Taxes | Without Mortgage | With Mortgage |
| Less than $800 | 1,225 (22.8%) | 27 (0.5%) |
| $800 to $1,499 | 1,721 (32.0%) | 754 (14.5%) |
| $800 to $1,499 | 2,324 (43.2%) | 1,644 (31.6%) |
| Total | 5,377 (100.0%) | 5,207 (100.0%) |
Health & Disability in Clarion County
Health Insurance Coverage by Age in Clarion County
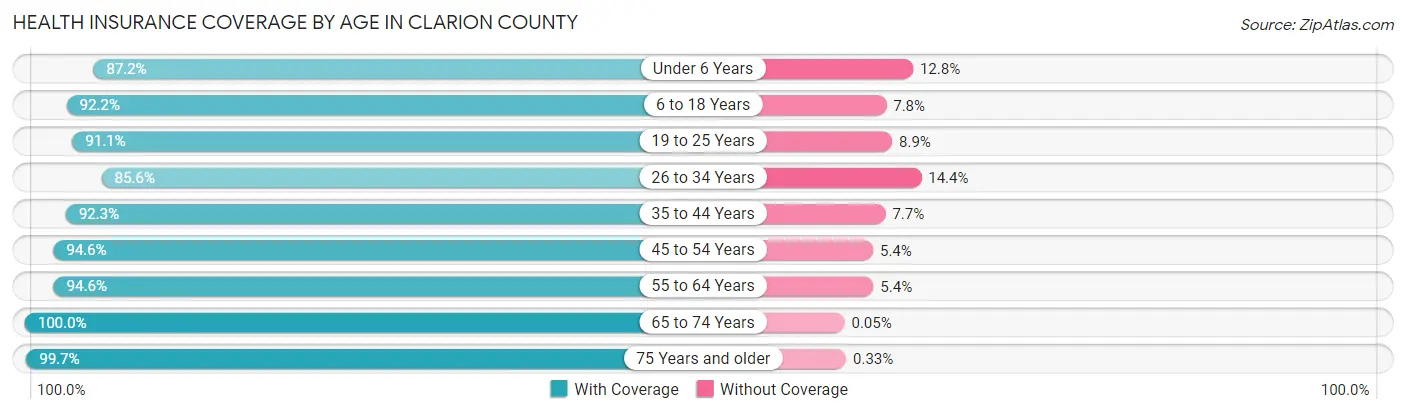
| Age Bracket | With Coverage | Without Coverage |
| Under 6 Years | 1,920 (87.2%) | 282 (12.8%) |
| 6 to 18 Years | 5,282 (92.2%) | 449 (7.8%) |
| 19 to 25 Years | 4,006 (91.1%) | 392 (8.9%) |
| 26 to 34 Years | 3,429 (85.6%) | 575 (14.4%) |
| 35 to 44 Years | 3,512 (92.3%) | 292 (7.7%) |
| 45 to 54 Years | 4,168 (94.6%) | 236 (5.4%) |
| 55 to 64 Years | 4,966 (94.6%) | 285 (5.4%) |
| 65 to 74 Years | 4,242 (100.0%) | 2 (0.1%) |
| 75 Years and older | 3,016 (99.7%) | 10 (0.3%) |
| Total | 34,541 (93.2%) | 2,523 (6.8%) |
Health Insurance Coverage by Citizenship Status in Clarion County
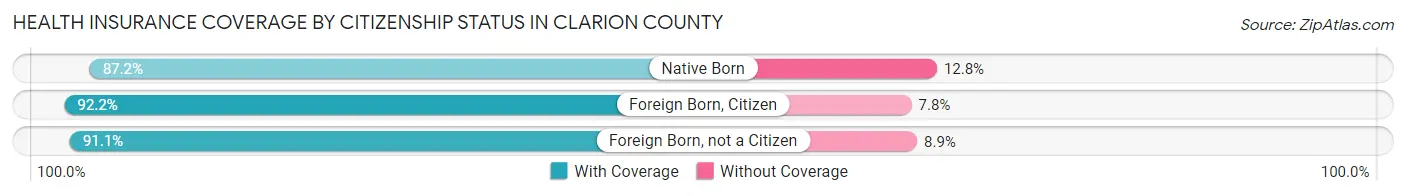
| Citizenship Status | With Coverage | Without Coverage |
| Native Born | 1,920 (87.2%) | 282 (12.8%) |
| Foreign Born, Citizen | 5,282 (92.2%) | 449 (7.8%) |
| Foreign Born, not a Citizen | 4,006 (91.1%) | 392 (8.9%) |
Health Insurance Coverage by Household Income in Clarion County

| Household Income | With Coverage | Without Coverage |
| Under $25,000 | 4,467 (93.3%) | 320 (6.7%) |
| $25,000 to $49,999 | 6,210 (92.3%) | 515 (7.7%) |
| $50,000 to $74,999 | 6,127 (91.6%) | 559 (8.4%) |
| $75,000 to $99,999 | 5,124 (94.4%) | 302 (5.6%) |
| $100,000 and over | 11,520 (93.6%) | 793 (6.4%) |
Public vs Private Health Insurance Coverage by Age in Clarion County
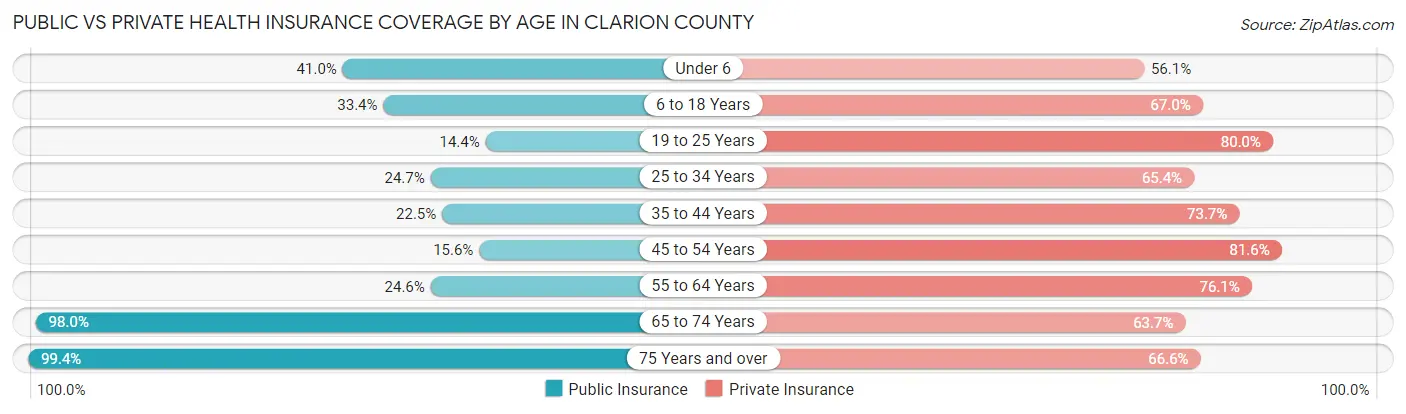
| Age Bracket | Public Insurance | Private Insurance |
| Under 6 | 902 (41.0%) | 1,235 (56.1%) |
| 6 to 18 Years | 1,915 (33.4%) | 3,838 (67.0%) |
| 19 to 25 Years | 635 (14.4%) | 3,519 (80.0%) |
| 25 to 34 Years | 987 (24.6%) | 2,617 (65.4%) |
| 35 to 44 Years | 856 (22.5%) | 2,805 (73.7%) |
| 45 to 54 Years | 688 (15.6%) | 3,594 (81.6%) |
| 55 to 64 Years | 1,294 (24.6%) | 3,994 (76.1%) |
| 65 to 74 Years | 4,158 (98.0%) | 2,705 (63.7%) |
| 75 Years and over | 3,007 (99.4%) | 2,014 (66.6%) |
| Total | 14,442 (39.0%) | 26,321 (71.0%) |
Disability Status by Sex by Age in Clarion County
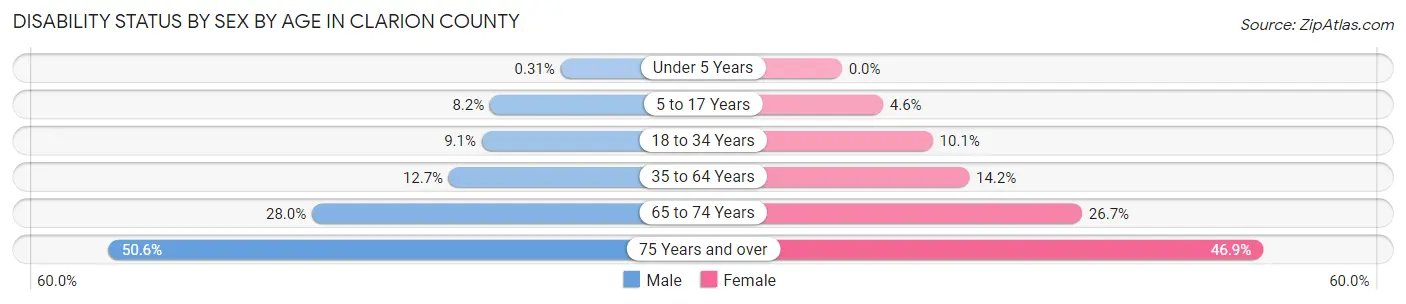
| Age Bracket | Male | Female |
| Under 5 Years | 3 (0.3%) | 0 (0.0%) |
| 5 to 17 Years | 215 (8.2%) | 115 (4.6%) |
| 18 to 34 Years | 413 (9.1%) | 482 (10.1%) |
| 35 to 64 Years | 864 (12.7%) | 946 (14.2%) |
| 65 to 74 Years | 588 (28.0%) | 573 (26.7%) |
| 75 Years and over | 662 (50.6%) | 806 (46.9%) |
Disability Class by Sex by Age in Clarion County
Disability Class: Hearing Difficulty
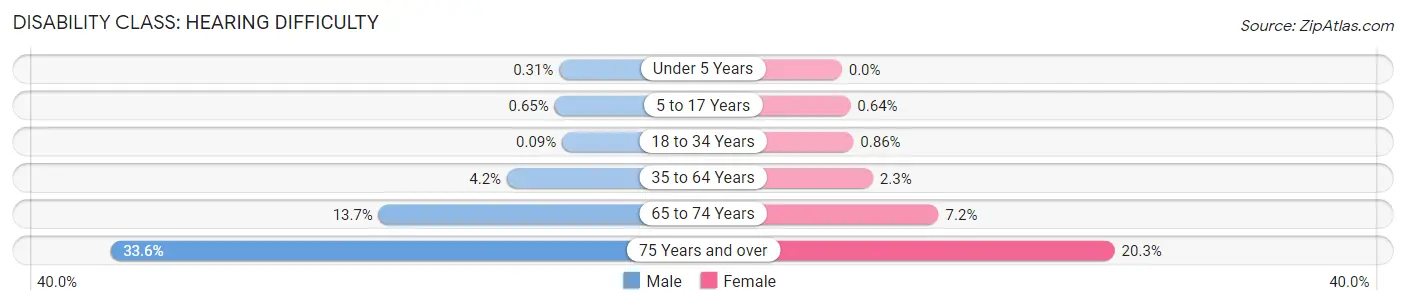
| Age Bracket | Male | Female |
| Under 5 Years | 3 (0.3%) | 0 (0.0%) |
| 5 to 17 Years | 17 (0.6%) | 16 (0.6%) |
| 18 to 34 Years | 4 (0.1%) | 41 (0.9%) |
| 35 to 64 Years | 284 (4.2%) | 154 (2.3%) |
| 65 to 74 Years | 288 (13.7%) | 154 (7.2%) |
| 75 Years and over | 440 (33.6%) | 348 (20.3%) |
Disability Class: Vision Difficulty
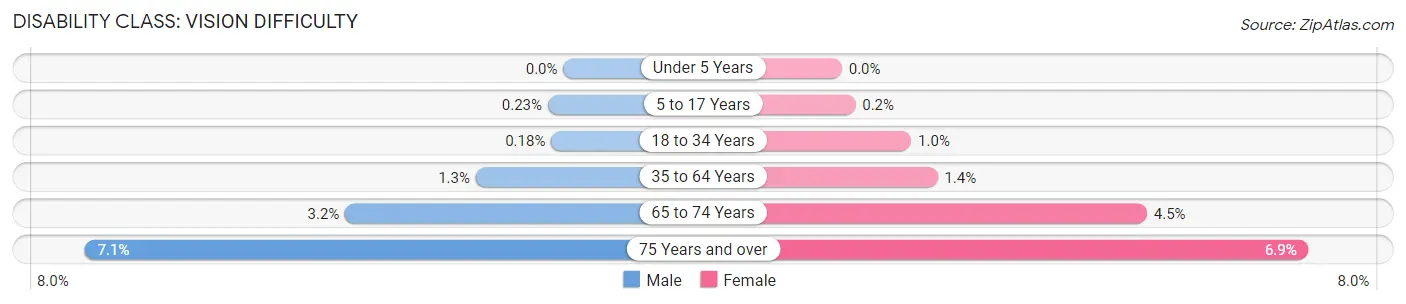
| Age Bracket | Male | Female |
| Under 5 Years | 0 (0.0%) | 0 (0.0%) |
| 5 to 17 Years | 6 (0.2%) | 5 (0.2%) |
| 18 to 34 Years | 8 (0.2%) | 49 (1.0%) |
| 35 to 64 Years | 88 (1.3%) | 95 (1.4%) |
| 65 to 74 Years | 68 (3.2%) | 97 (4.5%) |
| 75 Years and over | 93 (7.1%) | 119 (6.9%) |
Disability Class: Cognitive Difficulty
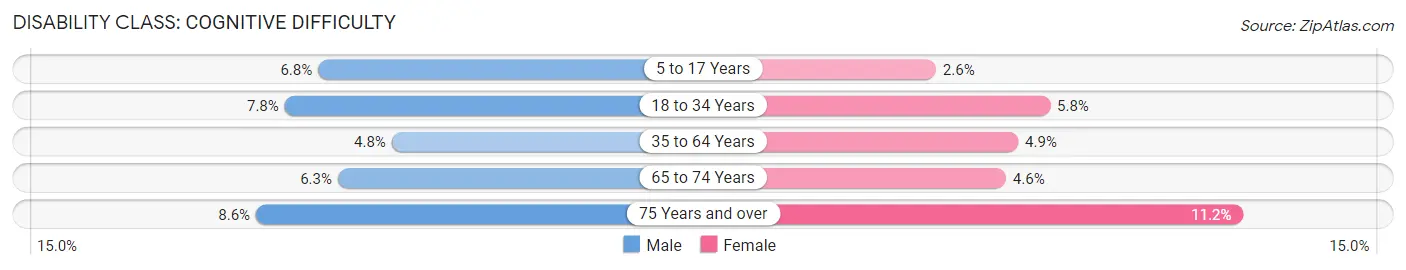
| Age Bracket | Male | Female |
| 5 to 17 Years | 180 (6.8%) | 66 (2.6%) |
| 18 to 34 Years | 353 (7.8%) | 276 (5.8%) |
| 35 to 64 Years | 324 (4.8%) | 328 (4.9%) |
| 65 to 74 Years | 132 (6.3%) | 98 (4.6%) |
| 75 Years and over | 112 (8.6%) | 192 (11.2%) |
Disability Class: Ambulatory Difficulty
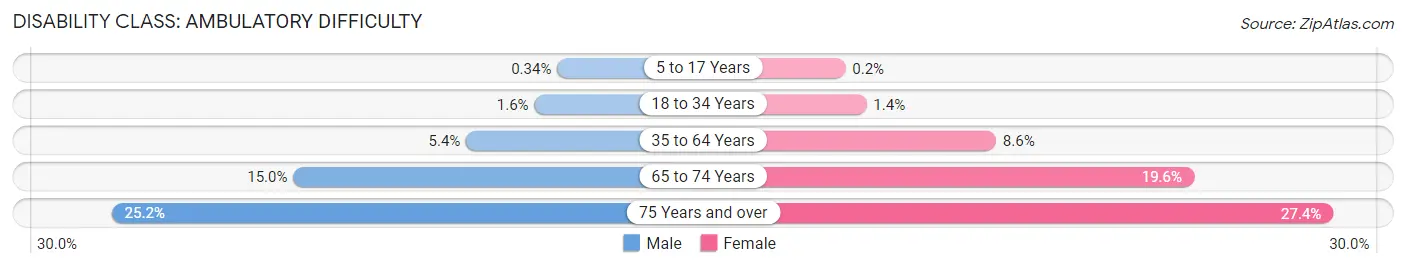
| Age Bracket | Male | Female |
| 5 to 17 Years | 9 (0.3%) | 5 (0.2%) |
| 18 to 34 Years | 73 (1.6%) | 65 (1.4%) |
| 35 to 64 Years | 367 (5.4%) | 573 (8.6%) |
| 65 to 74 Years | 316 (15.0%) | 420 (19.6%) |
| 75 Years and over | 329 (25.2%) | 470 (27.4%) |
Disability Class: Self-Care Difficulty
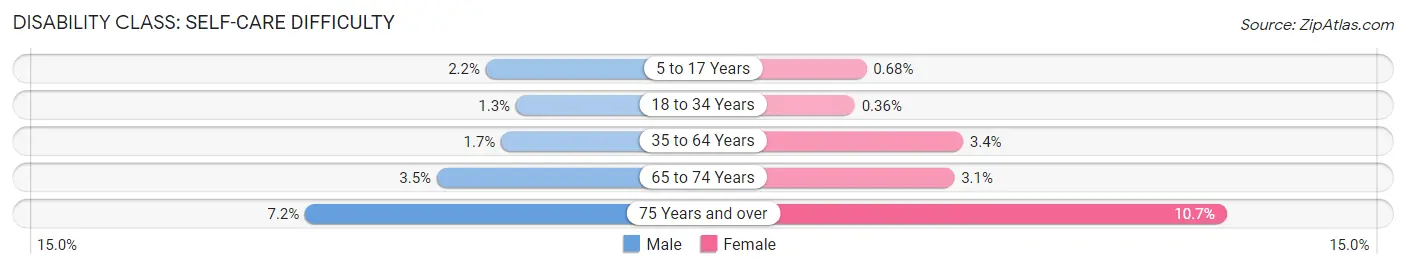
| Age Bracket | Male | Female |
| 5 to 17 Years | 57 (2.2%) | 17 (0.7%) |
| 18 to 34 Years | 60 (1.3%) | 17 (0.4%) |
| 35 to 64 Years | 117 (1.7%) | 225 (3.4%) |
| 65 to 74 Years | 74 (3.5%) | 67 (3.1%) |
| 75 Years and over | 94 (7.2%) | 184 (10.7%) |
Technology Access in Clarion County
Computing Device Access in Clarion County
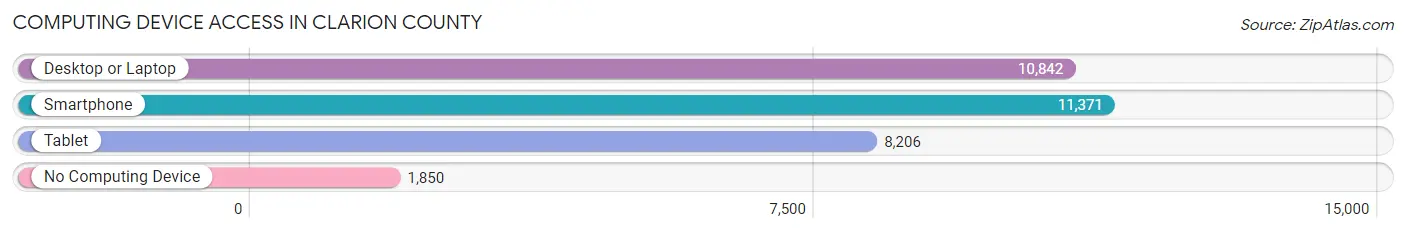
| Device Type | # Households | % Households |
| Desktop or Laptop | 10,842 | 73.2% |
| Smartphone | 11,371 | 76.8% |
| Tablet | 8,206 | 55.4% |
| No Computing Device | 1,850 | 12.5% |
| Total | 14,808 | 100.0% |
Internet Access in Clarion County
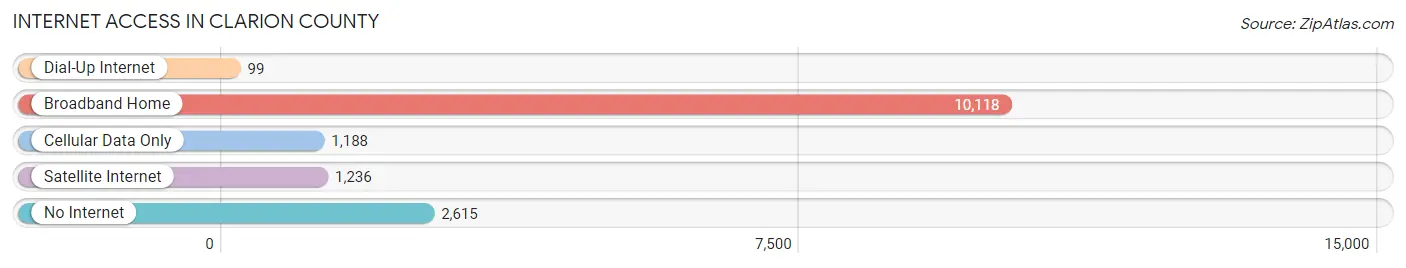
| Internet Type | # Households | % Households |
| Dial-Up Internet | 99 | 0.7% |
| Broadband Home | 10,118 | 68.3% |
| Cellular Data Only | 1,188 | 8.0% |
| Satellite Internet | 1,236 | 8.4% |
| No Internet | 2,615 | 17.7% |
| Total | 14,808 | 100.0% |
Clarion County Summary
Clarion County is a county located in the Commonwealth of Pennsylvania. It is located in the northwestern part of the state and is part of the Pittsburgh metropolitan area. The county seat is Clarion. As of the 2010 census, the population was 39,988. The county was created on March 11, 1839, from parts of Venango and Armstrong counties.
Geography
Clarion County is located in the northwestern part of Pennsylvania. It is bordered by Forest County to the north, Jefferson County to the east, Armstrong County to the south, and Venango County to the west. The Clarion River flows through the county from east to west. The county has a total area of 576 square miles, of which 573 square miles is land and 3.2 square miles is water.
The county is mostly hilly and heavily forested. The highest point is 2,890 feet above sea level on the summit of Blue Knob Mountain in the northern part of the county. The lowest point is 1,000 feet above sea level along the Clarion River in the southwestern part of the county.
Economy
Clarion County’s economy is largely based on agriculture and natural resources. The county is home to several large farms, as well as several small family farms. The county is also home to several large timber companies, which harvest timber from the county’s forests.
The county is also home to several manufacturing companies, including Clarion Manufacturing, which produces automotive parts, and Clarion Plastics, which produces plastic products. The county is also home to several oil and gas companies, which extract natural gas from the Marcellus Shale formation.
Demographics
As of the 2010 census, there were 39,988 people, 15,945 households, and 11,072 families living in the county. The population density was 69.5 people per square mile. The racial makeup of the county was 97.7% White, 0.7% African American, 0.2% Native American, 0.3% Asian, 0.1% Pacific Islander, 0.2% from other races, and 0.9% from two or more races. Hispanic or Latino of any race were 0.7% of the population.
The median income for a household in the county was $37,945, and the median income for a family was $45,945. The per capita income for the county was $18,945. About 11.2% of families and 14.3% of the population were below the poverty line, including 19.2% of those under age 18 and 8.7% of those age 65 or over.
Conclusion
Clarion County is a rural county located in the northwestern part of Pennsylvania. It is home to several large farms, timber companies, and manufacturing companies. The county’s economy is largely based on agriculture and natural resources. The population of the county is largely white, with a small percentage of African Americans, Native Americans, Asians, and Pacific Islanders. The median income for a household in the county is slightly below the state average, and the poverty rate is slightly higher than the state average.
Common Questions
What is Per Capita Income in Clarion County?
Per Capita income in Clarion County is $30,444.
What is the Median Family Income in Clarion County?
Median Family Income in Clarion County is $76,457.
What is the Median Household income in Clarion County?
Median Household Income in Clarion County is $58,690.
What is Income or Wage Gap in Clarion County?
Income or Wage Gap in Clarion County is 42.8%.
Women in Clarion County earn 57.2 cents for every dollar earned by a man.
What is Family Income Deficit in Clarion County?
Family Income Deficit in Clarion County is $10,273.
Families that are below poverty line in Clarion County earn $10,273 less on average than the poverty threshold level.
What is Inequality or Gini Index in Clarion County?
Inequality or Gini Index in Clarion County is 0.43.
What is the Total Population of Clarion County?
Total Population of Clarion County is 37,489.
What is the Total Male Population of Clarion County?
Total Male Population of Clarion County is 18,539.
What is the Total Female Population of Clarion County?
Total Female Population of Clarion County is 18,950.
What is the Ratio of Males per 100 Females in Clarion County?
There are 97.83 Males per 100 Females in Clarion County.
What is the Ratio of Females per 100 Males in Clarion County?
There are 102.22 Females per 100 Males in Clarion County.
What is the Median Population Age in Clarion County?
Median Population Age in Clarion County is 41.5 Years.
What is the Average Family Size in Clarion County
Average Family Size in Clarion County is 2.9 People.
What is the Average Household Size in Clarion County
Average Household Size in Clarion County is 2.4 People.
How Large is the Labor Force in Clarion County?
There are 18,432 People in the Labor Forcein in Clarion County.
What is the Percentage of People in the Labor Force in Clarion County?
58.9% of People are in the Labor Force in Clarion County.
What is the Unemployment Rate in Clarion County?
Unemployment Rate in Clarion County is 5.5%.